Water Futures Working together For a secure Water Future WATER FUTURES PARTNERSHIP: WORKING TOGETHER FOR A SECURE WATER FUTURE WATER FUTURES – Working together for a secure water future

Welcome message from author
This document is posted to help you gain knowledge. Please leave a comment to let me know what you think about it! Share it to your friends and learn new things together.
Transcript
Water FuturesWorking together For a secure Water Future
Water Futures PartnershiP: Working together For a secure Water Future
Front cover: Synevir Lake, Ukraine Photography by Igor Koltun.
This report is printed on Revive Pure White Offset which is 100% recycled content from post-consumer waste, by an FSC and ISO 14001 accredited printer.
Design & production: JohnstonWorkswww.johnstonworks.com
SABMiller plcSABMiller HouseChurch Street WestWoking Surrey GU21 6HS England
+44 (0)1483 264 000www.sabmiller.com
WWF–UKPanda House Weyside ParkGodalmingSurrey GU7 1XR England
+44 (0)1483 426 444www.wwf.org.uk
WA
TE
R F
UT
UR
ES
– Work
ing
togeth
er for a secure w
ater futu
re
About SABMiller plc: One of the world’s largest brewers, SABMiller has brewing interests and distribution agreements across six continents. Our wide portfolio of brands includes premium international beers such as Pilsner Urquell, Peroni Nastro Azzurro, Miller Genuine Draft and Grolsch along with leading local brands such as Aguila, Castle, Miller Lite, Snow and Tyskie. We are also one of the world’s largest bottlers of Coca-Cola products. In 2010 our group revenue was US$26,350 million with lager production of 213 million hectolitres.
About WWF-UK: We’re the world’s leading independent conservation organisation. We’re creating solutions to the most serious conservation challenges facing the planet, building a future where people and nature thrive together. The sustainable use of fresh water is one such challenge – so we develop concepts, tools and approaches for the private sector that address business risk through better stewardship of water resources.
Deutsche Gesellschaft für Technische Zusammenarbeit (GTZ) GmbH: The federally owned GTZ, an international co-operation enterprise for sustainable development with worldwide operations, supports the German government in achieving its development objectives. GTZ provides viable, forward-looking solutions for political, economic, ecological and social development in a globalised world. Sometimes working under difficult conditions, GTZ promotes complex reforms and change processes. Its corporate objective is to improve people’s living conditions on a sustainable basis.
About this report: While this document has been co-authored and jointly released by SABMiller plc, WWF-UK and GTZ, this does not imply that the organisations approve of, or support, the activities and/or views that the others may have on other issues outside the scope of this report.
Note on data: Data included within this report relates to 2008/09, with the exception of ‘key facts’ information for each country case study, which presents current operations and estimates of market size.
CoNTeNTS
exeCUTive SUMMAry 01
1.0 PreFACe: WorKiNG ToGeTHer For A SeCUre WATer FUTUre 02
1.1 Water is a valuable resource 021.2 A global problem which needs local solutions 02 1.3 Taking an innovative partnership approach 02 1.4 Using a holistic and robust methodology 03 1.5 A shared commitment and vision 03
2.0 WATer: SHAreD riSKS iN THe 21ST CeNTUry 04
2.1 Understanding the issues 042.2 Recognising the shared risks 042.3 SABMiller’s approach to water management 052.4 WWF’s strategy to conserve and protect water resources 06 2.5 GTZ: meeting policy and development goals 06
3.0 ColleCTive SolUTioNS: THe WATer FUTUreS PArTNerSHiP 08
3.1 A history of collaboration on water issues 08 3.2 Water Futures: a 21st century partnership 083.3 What is the Partnership doing? 09
4.0 AN evolviNG MeTHoDoloGy 10
4.1 Recap: what is water footprinting? 104.2 An evolving and transparent methodology 12 4.3 Translating theory into action: the risks
of water footprints 13
5.0 CASe STUDieS 15
5.1 Peru 165.2 Tanzania 205.3 Ukraine 245.4 South Africa 28
6.0 leSSoNS AND iMPliCATioNS 32
6.1 How do the footprints compare? 326.2 What does this mean? 34
7.0 SeCUriNG oUr WATer FUTUre 36
7.1 Realising the value of partnership 367.2 The future of Water Futures 36
01ExEcutivE summary
Executive summary
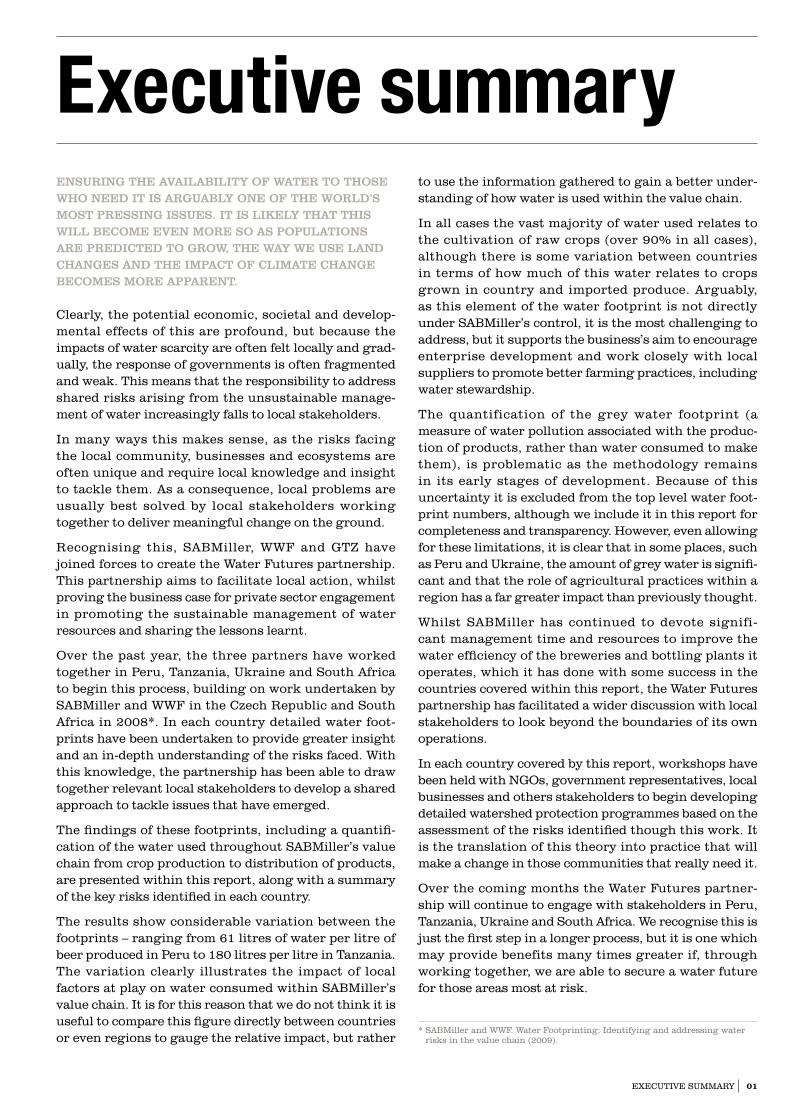
clearly, the potential economic, societal and develop-mental effects of this are profound, but because the impacts of water scarcity are often felt locally and grad-ually, the response of governments is often fragmented and weak. this means that the responsibility to address shared risks arising from the unsustainable manage-ment of water increasingly falls to local stakeholders.
in many ways this makes sense, as the risks facing the local community, businesses and ecosystems are often unique and require local knowledge and insight to tackle them. as a consequence, local problems are usually best solved by local stakeholders working together to deliver meaningful change on the ground.
recognising this, saBmiller, WWF and GtZ have joined forces to create the Water Futures partnership. this partnership aims to facilitate local action, whilst proving the business case for private sector engagement in promoting the sustainable management of water resources and sharing the lessons learnt.
Over the past year, the three partners have worked together in Peru, tanzania, ukraine and south africa to begin this process, building on work undertaken by saBmiller and WWF in the czech republic and south africa in 2008*. in each country detailed water foot-prints have been undertaken to provide greater insight and an in-depth understanding of the risks faced. With this knowledge, the partnership has been able to draw together relevant local stakeholders to develop a shared approach to tackle issues that have emerged.
the findings of these footprints, including a quantifi-cation of the water used throughout saBmiller’s value chain from crop production to distribution of products, are presented within this report, along with a summary of the key risks identified in each country.
the results show considerable variation between the footprints – ranging from 61 litres of water per litre of beer produced in Peru to 180 litres per litre in tanzania. the variation clearly illustrates the impact of local factors at play on water consumed within saBmiller’s value chain. it is for this reason that we do not think it is useful to compare this figure directly between countries or even regions to gauge the relative impact, but rather
Ensuring thE availability of watEr to thosE who nEEd it is arguably onE of thE world’s most prEssing issuEs. it is likEly that this will bEcomE EvEn morE so as populations arE prEdictEd to grow, thE way wE usE land changEs and thE impact of climatE changE bEcomEs morE apparEnt.
to use the information gathered to gain a better under-standing of how water is used within the value chain.
in all cases the vast majority of water used relates to the cultivation of raw crops (over 90% in all cases), although there is some variation between countries in terms of how much of this water relates to crops grown in country and imported produce. arguably, as this element of the water footprint is not directly under saBmiller’s control, it is the most challenging to address, but it supports the business’s aim to encourage enterprise development and work closely with local suppliers to promote better farming practices, including water stewardship.
the quantification of the grey water footprint (a measure of water pollution associated with the produc-tion of products, rather than water consumed to make them), is problematic as the methodology remains in its early stages of development. Because of this uncertainty it is excluded from the top level water foot-print numbers, although we include it in this report for completeness and transparency. However, even allowing for these limitations, it is clear that in some places, such as Peru and ukraine, the amount of grey water is signifi-cant and that the role of agricultural practices within a region has a far greater impact than previously thought.
Whilst saBmiller has continued to devote signifi-cant management time and resources to improve the water efficiency of the breweries and bottling plants it operates, which it has done with some success in the countries covered within this report, the Water Futures partnership has facilitated a wider discussion with local stakeholders to look beyond the boundaries of its own operations.
in each country covered by this report, workshops have been held with NGOs, government representatives, local businesses and others stakeholders to begin developing detailed watershed protection programmes based on the assessment of the risks identified though this work. it is the translation of this theory into practice that will make a change in those communities that really need it.
Over the coming months the Water Futures partner-ship will continue to engage with stakeholders in Peru, tanzania, ukraine and south africa. We recognise this is just the first step in a longer process, but it is one which may provide benefits many times greater if, through working together, we are able to secure a water future for those areas most at risk.
* saBmiller and WWF. Water Footprinting: identifying and addressing water risks in the value chain (2009).
02
1.0 Preface: working together for a secure water future
1.1 Water is a valuable resourceEconomic development combined with population growth means that we are consuming more water than ever before. in areas where water is plentiful this may not be a pressing issue but there are parts of the world where this is not the case and its availability is a significant issue for the people, business and ecosys-tems. Water is a valuable resource, but in many cases it is poorly managed.
a recent study undertaken by the 2030 Water resources Group1, of which saBmiller is a member and which was advised by WWF, found that there could be a potential shortfall of 40%, in water resources available across the world by 2030. according to the united Nations2, water scarcity affects every continent and almost one fifth of the world’s population live in areas of physical scarcity. WWF’s Living Planet report3 has shown that freshwater biodiversity is in rapid decline across the world.
1.2 A global problem which needs local solutionsthis, and other research, suggests that water is truly a global problem. However, the factors that contribute to the issue, such as local climate and geography, are often unique to a specific region or country. to tackle this issue therefore requires an approach that can
harness the scale and expertise of global organisa-tions, whilst enabling specific local water issues to be identified and for local stakeholders to be drawn together to address them. We believe that local water challenges are usually best solved in partnership with NGOs, local governments, communities and other local businesses.
1.3 Taking an innovative partnership approachrecognising this, in November 2009 the Water Futures Partnership was launched between saBmiller, WWF and GtZ (acting on behalf of the Federal German ministry of Economic co-operation and Development).
Water Futures aims to prove the business case for private sector engagement in promoting the sustainable management of water resources. this case will be built on an assessment of water risks throughout saBmiller’s value chain and an appreciation of how to mitigate these risks. the partnership seeks to share the lessons learnt throughout the business’s global operations with other stakeholders to promote better water stewardship. the fundamental concept underpinning the partnership is that a lack of water security presents risks that are shared by the business, other water users, ecosystems and governments.
WWF and saBmiller have previously worked together to address water issues in countries such as colombia, Honduras and south africa. the creation of this global partnership, and the welcome inclusion of GtZ, stems from an understanding that even though our motiva-tions may be different, each of our organisations is able to bring unique skills and competencies required to address these issues.
almost a year on, the three partners are collaborating in Peru, tanzania, south africa and ukraine. this report provides a summary of what we have achieved, how the partnership is using techniques, such as water
watEr futurEs is a partnErship bEtwEEn sabmillEr, wwf and gtZ which aims to protEct watErshEds critical to sabmillEr’s opErations and supply chains, and to strEngthEn thE rolE of thE privatE sEctor in promoting thE sustainablE managEmEnt of watEr rEsourcEs and sharing thE lEssons lEarnt.
1. 2030 Water resources Group. charting Our Water Future: Economic frameworks to inform decision-making (2009).
2. www.un.org/waterforlifedecade/scarcity
3. WWF. Living Planet report 2008 (2008).

03PrEFacE: WOrkiNG tOGEtHEr FOr a sEcurE WatEr FuturE
footprinting, to identify the significant water issues in these countries, and the work we are doing with local stakeholders to develop a shared approach to tackling them.
1.4 Using a holistic and robust methodologythe Water Futures partnership relies on a clear under-standing of the issues and challenges faced by each set of stakeholders potentially at risk.
in the report‘Water footprinting: identifying and addressing water risks in the value chain’ published in 2009, saBmiller and WWF showed how this technique had highlighted key issues for two of the company’s operations in south africa and czech republic. Over the past twelve months we have refined and extended our thinking in this area.
Water footprinting looks at each element of saBmiller’s value chain, from crop production to product distribu-tion, to help understand the water dependencies and vulnerabilities and identify the key water risks for the business, surrounding communities and the environ-ment. crucially, starting from the ground up enables us to develop a much more in-depth understanding of the issues and consequently take the first step in addressing them.
But addressing shared water risks won’t be solved simply by producing a number of water footprint studies. Other activities to date, or planned, include workshops to engage key local stakeholders in order to ensure that we have full understanding of the local issues around water scarcity. We are under-taking more detailed watershed assessments to delve into the risks in local river basins. and we are building business cases for saBmiller subsidiaries to consider investing in better water management within those basins. at a global level, we are able to inform the evolving debate on water by providing clear examples
of the work we are doing (hence the publication of this report), which in turn may help to inform policy or inspire action from our peers and other stakeholders.
1.5 A shared commitment and visionit is early days in the development of this partner-ship, but progress so far has been positive. through our work we hope to make a contribution to the devel-opment of the water footprinting methodology and demonstrate its practical application in helping to understand water-related risks. moreover, the Water Futures partnership aims to promote private sector water stewardship, which goes beyond simple water efficiency measures and addresses risks throughout the value chain and promotes better water resource management at the river basin scale.
Besides influencing the water debate, change will also be driven within the three partners. WWF will make use of the lessons learnt for its work on private sector water stewardship, including other partnerships; GtZ will disseminate the information amongst its water management projects in developing countries; and saBmiller will use what it has learnt from Peru, tanzania, south africa and ukraine within its subsid-iaries in other countries.
We are proud to be working together and hope that the insight provided in this report will encourage others to take action to reduce the potential of water scarcity in the regions and countries most at risk. Where there are shared opportunities in the same watersheds, we will be looking to collaborate with other partners to help protect this shared resource.
“ Water is neither consistently well managed nor appropriately valued globally. this has led to a crucial shared resource becoming a shared risk for governments, businesses and populations across many areas of the world. if this situation doesn’t change then conflicts over water rights are inevitable. We believe that collaboration between business, governments and NGOs is the only way to tackle this.”
Graham mackay, chief Executive of saBmiller
“ the notion of shared risk is increasingly seen as a critical element underpinning responses to the global water crisis. it suggests that businesses, motivated by enlightened self-interest, can contribute to, and benefit from, collective efforts to better manage water resources and safeguard the freshwater ecosystems upon which we all depend.”
David Nussbaum, chief Executive of WWF – uk
“ Our partnership follows an innovative and participatory approach to sustainably manage water resources. this should equally benefit the entire population, the environment and production processes. moreover, we strive for an improved responsiveness to adapt to climate change. We see our role in facilitating this dynamic dialogue among all stakeholders concerned.”
andreas kanzler, Head of Water section GtZ – Gesellschaft für technische Zusammenarbeit GmbH
04
2.0 Water: shared risks in the 21st century
2.1 Understanding the issuesunlike fossil fuels, water has no substitutes or alter-natives. the way that water is currently managed in many countries around the world is simply unsustain-able, based on current projections and research.
Global population growth is set to rise from 6.7 billion today to over 9 billion in 20504. this expansion in population will place a higher demand on resources available, particularly for agriculture and the provi-sion of food. currently, it is estimated that over 70% of global fresh-water withdrawals are used for this purpose. in some countries this can reach 90%5.
a further complication is that freshwater is not distrib-uted evenly across the globe – nine countries6 account for 60% of global freshwater – while within countries there are often significant variations in regional rain-fall levels.7 if anything, the impact of climate change is likely to increase both variability and unpredictability. more than one-sixth of the world’s population live in glacier or snowmelt-fed river basins and will be affected by the seasonal shift in streamflow, an increase in the ratio of winter to annual flows, and possibly the reduc-tion in low flows caused by decreased glacier extent or snow water storage. at the same time, sea-level rises attributable to climate change will extend areas of salinisation of groundwater and estuaries, resulting in a decrease in freshwater availability for humans and
ecosystems in coastal areas. semi-arid and arid areas – for example, around the mediterranean, western usa and southern africa – are particularly exposed to the impacts of climate change on freshwater.8 according to the uN’s World Water Development report9, almost half the world’s population will live in areas of high water stress by 2030 as a result of climate change. Of course, a shortage of water will also have a significant impact on the local ecology and biodiversity of an area.
the 2030 Water resources Group, formed to contribute new insights into the issue of water scarcity, advised by WWF and with members including saBmiller, mckinsey, the international Finance corporation and a consortium of business partners, concluded that competing demands for scarce water resources may lead to a global 40% shortage by 203010.
this research points to a significant issue in the coming years. However, whilst the potential economic, social and developmental effects are profound, the political impacts of water scarcity are both gradual and local, so governmental responses are often weak and fragmented. WWF often describes water scarcity as an ‘invisible event’.
the potential water crisis ultimately comes down to the unsustainable management of water resources in a rapidly changing world, where demand is increasing, supply is decreasing and land use is changing. it is down to individual consumers and companies to take responsibility to use water more sustainably, and for governments to manage water resources appropriately within river basins. then, and only then, will shared water risks be significantly decreased.
2.2 Recognising the shared risksFor many businesses, particularly those such as saBmiller who have operations across the world, issues of water scarcity are becoming increasingly relevant to their activities, especially as water use touches almost all parts of the value chain, albeit with varying degrees of intensity.
watEr is a fundamEntal sharEd rEsourcE for communitiEs, agriculturE, businEss and govErnmEnt. damagE to EcosystEms from thE ovEr abstraction and pollution of watEr rEsourcEs has far-rEaching consEquEncEs, thE EffEcts of which arE difficult to rEvErsE. thE situation posEs sharEd risks to businEss, govErnmEnt and civil sociEty and collEctivE solutions will bE nEEdEd to managE thEm.
4. uN. World Population Prospects: the 2008 revision (2009).
5. World Economic Forum Water initiative. the bubble is close to bursting (2009).
6. Brazil, russia, china, canada, indonesia, usa, india, colombia and the Democratic republic of congo.
7. WBcsD. Facts and trends: Water (version 2) (2009).
8. contribution of Working Group ii to the Fourth assesment report of intergovernment Panel on climate change (2009).
9. uN. 3rd uN World Water Development report (2009).
10. 2030 Water resources Group. charting our Water Future (2009).
WatEr: sHarED risks iN tHE 21st cENtury
as water scarcity becomes more visible then so does the level of risk faced by these businesses. risks may relate to physical shortages limiting production; competition for resources, which may lead to increased costs or difficulties obtaining water as stakeholders compete for rights; and issues around water quality in areas that are subject to physical change (for example, increased run off from growing agricultural areas). increasingly, legislation is playing a more important role too as some governments seek to address this issue through legis-lative means, such as by imposing water allocations, greater taxation and various pricing mechanisms.
importantly, there is a significant social dimension to the use of water. communities require water to fulfil their everyday needs whether this is for domestic purposes or, for example, growing crops. in some cases, failure to address perceptions that water scarcity is the result of business activity can damage corporate reputation and relationships with the local community on which it may depend, for example, for their workers or for raw materials.
Businesses, particularly those with a high dependence on water, have a significant role to play in addressing the water scarcity challenge. they can use their appreciation of risk, their leverage and their existing relationships with government to mobilise partner-ships within the public sector and civil society to make water management more sustainable for the benefit of all. Being aware of and understanding the water challenges they face allows businesses to make better management decisions and provides the platform to engage with a broader set of stakeholders to address issues outside their direct sphere of influence.
recent debates have focused on the potential role of the private sector as water stewards. this notion of water stewardship implies that companies, out of enlightened self-interest, need to build on improve-ments to in-house water efficiency and start to engage external stakeholders in order to reduce business risk from water scarcity and pollution. in particular, the water stewardship paradigm implies that companies should engage with suppliers (e.g. of agricultural commodities such as barley, maize or sugar cane) to support increased water efficiency at the farm level. it also suggests that companies should engage a broader range of stakeholders, including government, to promote improved water efficiency at the river basin scale as a means of ensuring that any water savings within the business or the supply chain contribute to aquifer and river recharge (and hence to reductions in shared water scarcity risks).
2.3 SABMiller’s approach to water managementWater scarcity represents a potentially significant risk to parts of saBmiller’s business, as well as to some of the communities in which it operates.
as these issues cross community and national bound-aries and involve interdependent factors that can vary from country to country and region to region, it follows that they cannot simply be managed within the confines of saBmiller’s own operations. as a result, the business has invested significant management time at both local and group level to understand the challenges of water scarcity and quality and what they might mean for the business.
‘making more beer but using less water’ is one of saBmiller’s global focus areas for sustainable devel-opment, and one of its ten sustainable development priorities11. saBmiller’s approach to water manage-ment includes a strong target not only to improve its own water efficiency, but also to protect the watersheds on which the business, farmers and local communities depend.
saBmiller is a founding signatory of the uN cEO Water mandate, an initiative to help companies in the development, implementation and disclosure of water sustainability policies and practices. it is also a member of the World Economic Forum Water Project and the Water Footprinting Network.
saBmiller has developed a water strategy based on the 5rs (protect, reduce, reuse, recycle and redistribute), a comprehensive, risk-based approach to managing water in its business and in the value chain. this model provides a consistent approach, regardless of the local issues and circumstances facing their busi-nesses around the world.
in 2009/10, saBmiller used 72,200 million litres of water in its own production processes to produce beer. the business has set a demanding target to reduce water use per litre of beer by 25% between 2008 and 2015. this equates to an average water consumption of 3.5 litres per litre of beer and the latest figures for the last financial year showed that the average figure was 4.3 litres, a 4% improvement on the previous 12 months.
the business utilises a watershed mapping tool which uses quantitative global data to evaluate the long-term water availability for each of its operations. From this data, the business can assess the risks associated with specific operations to focus on the areas of greatest need, and develop local, tailored strategies to deal with
Over the last twelve months saBmiller has improved its own water efficiency by 4% per litre of beer produced.
11. For more information see www.sabmiller.com/sustainabledevelopment
05
06
any issues identified. since its introduction in 2007, saBmiller has evaluated all of its operations in this way.
Following this analysis, detailed water footprints have been undertaken in south africa, the czech republic, Peru, tanzania and ukraine to get a better under-standing of the key water issues each operation faces. the development of the Water Futures Partnership with WWF and GtZ has been a major enabling factor in allowing this to happen.
Other saBmiller subsidiaries and joint ventures around the world have extensive watershed programmes in addition to those presented in this report. these include aquifer recharge projects in india and working with barley farmers to improve irrigation efficiency in the united states. For further information on these wider activities see www.sabmiller.com.
2.4 WWF’s strategy to conserve and protect water resourcesWater presents real and prevalent obstacles for compa-nies now and in the near future, and company risk at a river basin level implies that other users are likely to be at risk too – namely ecosystems, other busi-nesses, communities and governments. this is the concept of shared water risk. identifying government and company shared risk enables these parties to find common ground in the urgent need to manage water effectively, equitably and sustainably.
WWF’s Water stewardship vision is of a private sector fully engaged in efforts to secure water for people and nature. the focus is on getting companies to recognise and take responsibility for their role in managing fresh-water within the wider water cycle, and integrating the principles of good stewardship into their core business activities. they will achieve this by taking responsi-bility for reducing the impacts of their own water use, taking voluntary action to conserve freshwater ecosys-tems, and participating in constructive public policy dialogue to improve water resource management.
Water stewardship is about guiding key companies, both water users and investors, on a journey toward better river basin governance, where water is allocated appropriately taking all stakeholders into account. companies must first focus on how the water footprints of their operations and supply chains can improve and identify those that are vulnerable to risk but crucially also understand the context of where they directly and indirectly operate. understanding impacts will be important; along with reducing costs and some direct water risk; this will help insure their social licence to operate and give them credibility to begin to approach other water users. But only by linking water depen-dency in social and environmental contexts will WWF be able to positively align corporate agendas with protecting river basins. it is through multi-stakeholder
actions and engaging with governing bodies that WWF can help improve policy and institutional capacity, and ultimately, reduce shared water risks.
the Water Futures Partnership is taking an innovative approach to try to better understand the water-related risks facing saBmiller subsidiaries, and then make the business case for an appropriate water steward-ship response to mitigate these risks at the local level. WWF brings to the partnership its thought leadership on shared water risk, a wealth of experience in river Basin management and local capacity to help deliver the partnership benefits in each of the four countries.
2.5 GTZ: meeting policy and development goalstackling issues of water scarcity, as well as access to water and sanitation, is a key part of the Federal German Government’s development agenda. as such, Germany plays a leading role in promoting water for peace through its support of trans-boundary co-oper-ation, particularly in south-East Europe, africa and central asia. Germany also strongly promotes the recognition of access to water and sanitation through its engagement with the uN Human rights council. Germany is one of the world’s largest donors in water and sanitation and the largest donor in africa.
GtZ works as the implementing organisation for tech-nical co-operation on behalf of the Federal German ministry of Economic co-operation and Development. in the water sector, GtZ provides advice to govern-ments in designing their water policy and governance framework to support water sector reforms, including regulation. GtZ also provides advice on sustain-able water supply and sanitation, the development of effective tools and processes for water resources management, as well as adaptation of and mitigation to climate change and its impacts.
GtZ has broad experience in working with private sector companies, particularly those working directly in the water sector but increasingly those outside the sector, such as saBmiller.
through the Water Futures Partnership, GtZ aims to showcase the importance of sustainable water management for businesses and to communicate this learning and insight to support further thinking and development in this field. through participation in this innovative partnership, GtZ supports the promotion of the water footprinting methodology and its growing significance in the context of sustainable water usage. Furthermore, the partnership highlights the impor-tance of local partnerships for improved sustainable watershed management approaches, especially in water stressed regions. in this context, GtZ acts as technical advisor and facilitator for multi-stakeholder dialogues that enable collective action for sustainable water management at local level.
07
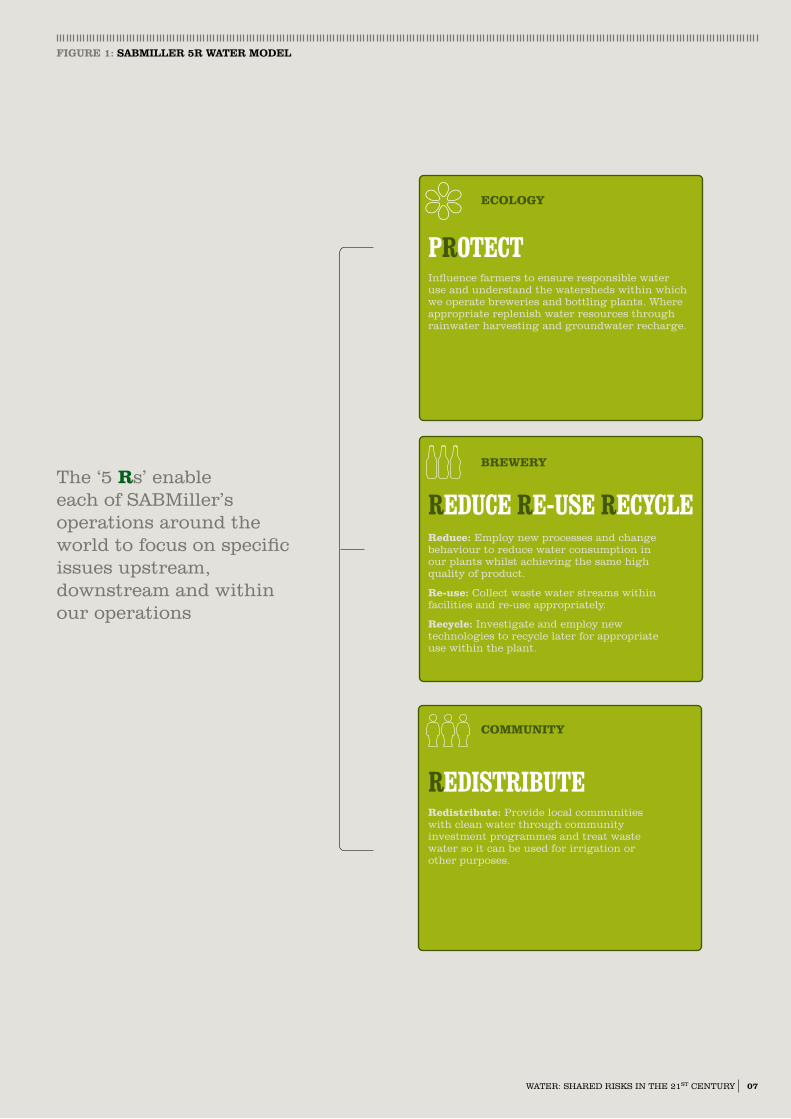
the ‘5 Rs’ enable each of saBmiller’s operations around the world to focus on specific issues upstream, downstream and within our operations
WatEr: sHarED risks iN tHE 21st cENtury
ECOLOGY
PROTECTinfluence farmers to ensure responsible water use and understand the watersheds within which we operate breweries and bottling plants. Where appropriate replenish water resources through rainwater harvesting and groundwater recharge.
BREWERY
REDUCE RE-USE RECYCLEReduce: Employ new processes and change behaviour to reduce water consumption in our plants whilst achieving the same high quality of product.
Re-use: collect waste water streams within facilities and re-use appropriately.
Recycle: investigate and employ new technologies to recycle later for appropriate use within the plant.
COMMUNITY
Redistribute: Provide local communities with clean water through community investment programmes and treat waste water so it can be used for irrigation or other purposes.
REDISTRIBUTE
FiGURe 1: SABMiLLeR 5R WATeR MODeL
08
3.0Collective solutions: the Water Futures Partnershipthis partnErship will succEEd if it is ablE to assEss and rEducE sharEd watEr risks by strEngthEning watEr stEwardship and govErnancE in spEcific watErshEds in thE four focus countriEs: south africa, tanZania, ukrainE and pEru.
3.1 A history of collaboration on water issues Efforts at managing water resources to counter the pressures of water scarcity and reconcile conflicting demands have met with relatively little success. For many governments, there remains a reluctance to elevate water management to a priority either because the issues appear too intractable, because there is a belief that, somehow, sufficient quantities of water will always be available, and/or because water management does not rank as highly as other development goals.
However, a number of international governmental organisations, NGOs and businesses – either indi-vidually or collectively – have begun to highlight the importance of identifying these challenges and how they might be addressed. For example, the uN Global compact’s cEO Water mandate and the World Economic Forum have helped to catalyse debate while organisations such as the Water Footprint Network (WFN) and the alliance for Water stewardship (aWs) have been established to assess the scale of the prob-lems and set standards around water use. saBmiller, WWF and GtZ are all actively involved in most, if not all, of these initiatives.
international initiatives have played an important role in establishing a momentum to encourage organisa-tions, particularly companies, to address their water risks. However, there are few initiatives underway to understand these issues at a local level in areas of high risk and to put in place effective plans to address them.
Over recent years, saBmiller, WWF and others have worked together to try and fill this gap. the two
organisations conducted detailed projects in colombia, Honduras and El salvador, trying to address unsustain-able agricultural practices of upstream farmers causing water quality problems, and detailed water footprinting studies in south africa and czech republic.
the latter work resulted in the publication of a report12
launched at World Water Week in september 2009, which showed how an understanding of the specific and local water issues facing an area can be translated – through working in partnerships with local stake-holders – into tangible actions on the ground.
3.2 Water Futures: a 21st century partnershipBuilding on the success of this collaboration and recognising a shared vision of the benefits that could be achieved by formalising this collaboration, the Water Futures global partnership was established in November 2009 together with GtZ.
the Partnership aims to utilise innovative water management to:
• Examine all aspects of the saBmiller supply chain, based on insights into both business and conserva-tion risks, and identifying risk hotspots
• Deliver measurable conservation impacts through improved policy for, and management of, freshwater ecosystems
• share best practice between saBmiller operations around the world to provide technical support on common issues and enable knowledge exchange
• share lessons with other stakeholders at the global level with a view to promoting better management of water across the world
For saBmiller, water is a vital resource for the brewing process. Water scarcity presents a series of risks to
12. Water footprinting: identifying and addressing water risks in the value chain (2009).
09cOLLEctivE sOLutiONs: tHE WatEr FuturEs PartNErsHiP
the business, to local communities and to ecosystems. Working in partnership allows access to the knowl-edge and insight of partners working on the ground in areas most at risk. the partners can also facilitate saBmiller’s engagement with local community-based and government stakeholders. in turn this will provide a much deeper understanding of the business risks arising from the increasing demands placed on this vital natural resource – and, crucially, how they might be addressed. specifically, saBmiller will gain a much clearer appreciation of the long-term avail-ability, quality and cost of water in its operations and supply chains.
WWF wants to ensure that water resources and ecosys-tems attached to them are protected and conserved, and to find ways in which companies can benefit in moving from business models that are environmentally unsound to approaches that actively promote sustain-ability. saBmiller is already on this journey with ambitious targets in place to improve its water effi-ciency. WWF is able to harness the scale and resources of the partnership to make a tangible contribution to meeting its conservation aims, whilst using the voice of the Partnership to inform the water debate and inform public policy.
GtZ recognises the contribution water makes in devel-oping local economies and communities. in working in partnership with saBmiller and WWF it is meeting its public-policy objectives as the development agency of the German government.
through this arrangement each partner is able to harness the scale and expertise of all parties to deliver a much greater difference than if each party worked alone to achieve a secure water future.
3.3 What is the Partnership doing?since its inception, the Partnership has focused on water resources in four countries: south africa, tanzania, ukraine and Peru. Each of these countries is facing different issues, with different levels of economic development, different land use and different climates.
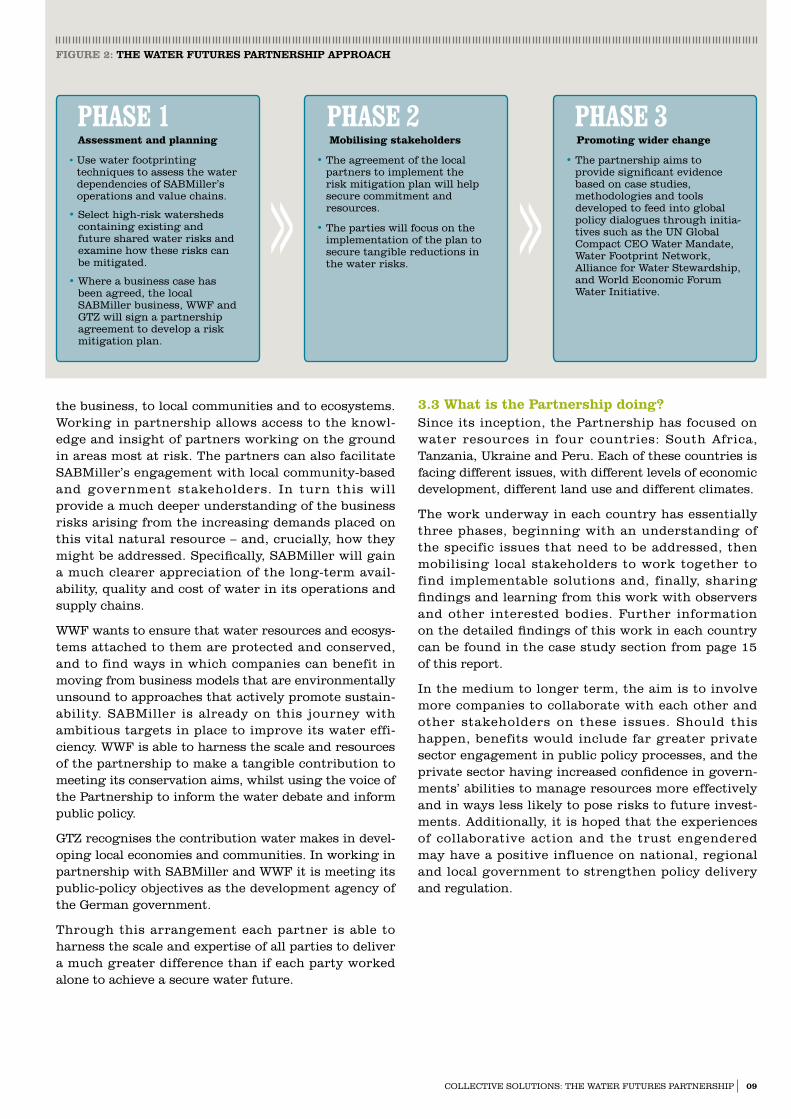
the work underway in each country has essentially three phases, beginning with an understanding of the specific issues that need to be addressed, then mobilising local stakeholders to work together to find implementable solutions and, finally, sharing findings and learning from this work with observers and other interested bodies. Further information on the detailed findings of this work in each country can be found in the case study section from page 15 of this report.
in the medium to longer term, the aim is to involve more companies to collaborate with each other and other stakeholders on these issues. should this happen, benefits would include far greater private sector engagement in public policy processes, and the private sector having increased confidence in govern-ments’ abilities to manage resources more effectively and in ways less likely to pose risks to future invest-ments. additionally, it is hoped that the experiences of collaborative action and the trust engendered may have a positive influence on national, regional and local government to strengthen policy delivery and regulation.
PhaSE 1• use water footprinting
techniques to assess the water dependencies of saBmiller’s operations and value chains.
• select high-risk watersheds containing existing and future shared water risks and examine how these risks can be mitigated.
• Where a business case has been agreed, the local saBmiller business, WWF and GtZ will sign a partnership agreement to develop a risk mitigation plan.
Assessment and planning
PhaSE 2• the agreement of the local
partners to implement the risk mitigation plan will help secure commitment and resources.
• the parties will focus on the implementation of the plan to secure tangible reductions in the water risks.
Mobilising stakeholders
PhaSE 3• the partnership aims to
provide significant evidence based on case studies, methodologies and tools developed to feed into global policy dialogues through initia-tives such as the uN Global compact cEO Water mandate, Water Footprint Network, alliance for Water stewardship, and World Economic Forum Water initiative.
Promoting wider change
FiGURe 2: The WATeR FUTUReS PARTneRShiP APPROAch
10
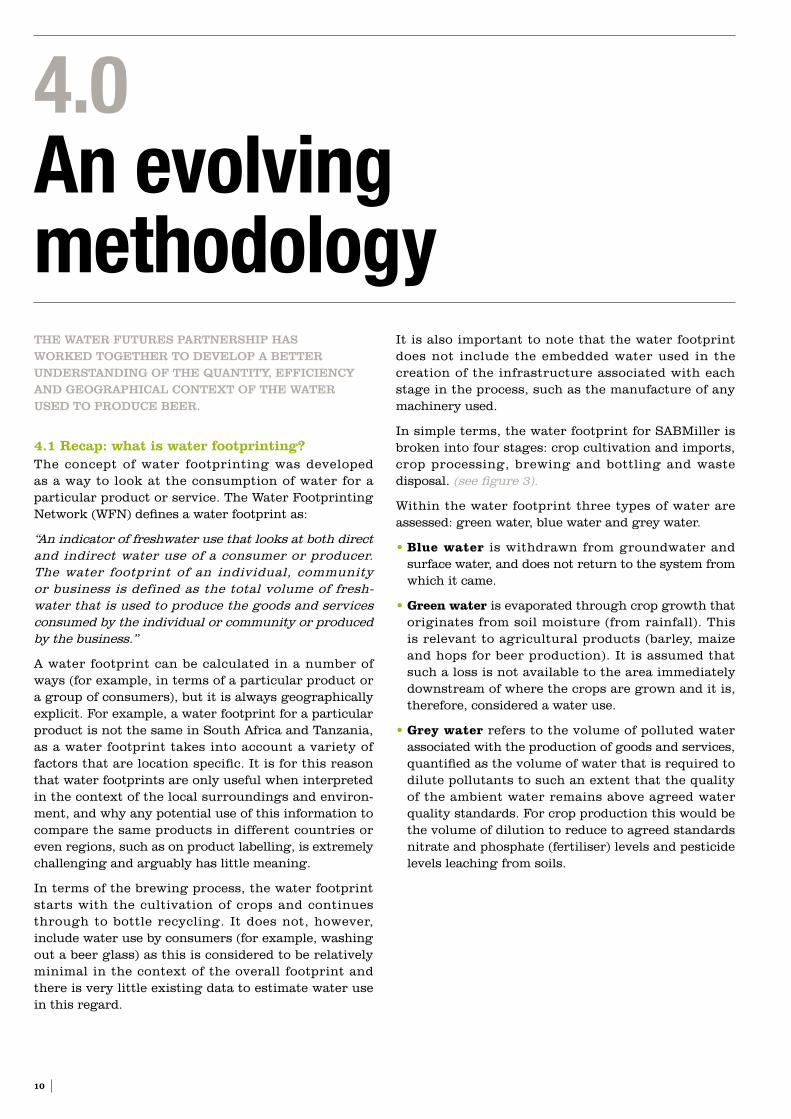
it is also important to note that the water footprint does not include the embedded water used in the creation of the infrastructure associated with each stage in the process, such as the manufacture of any machinery used.
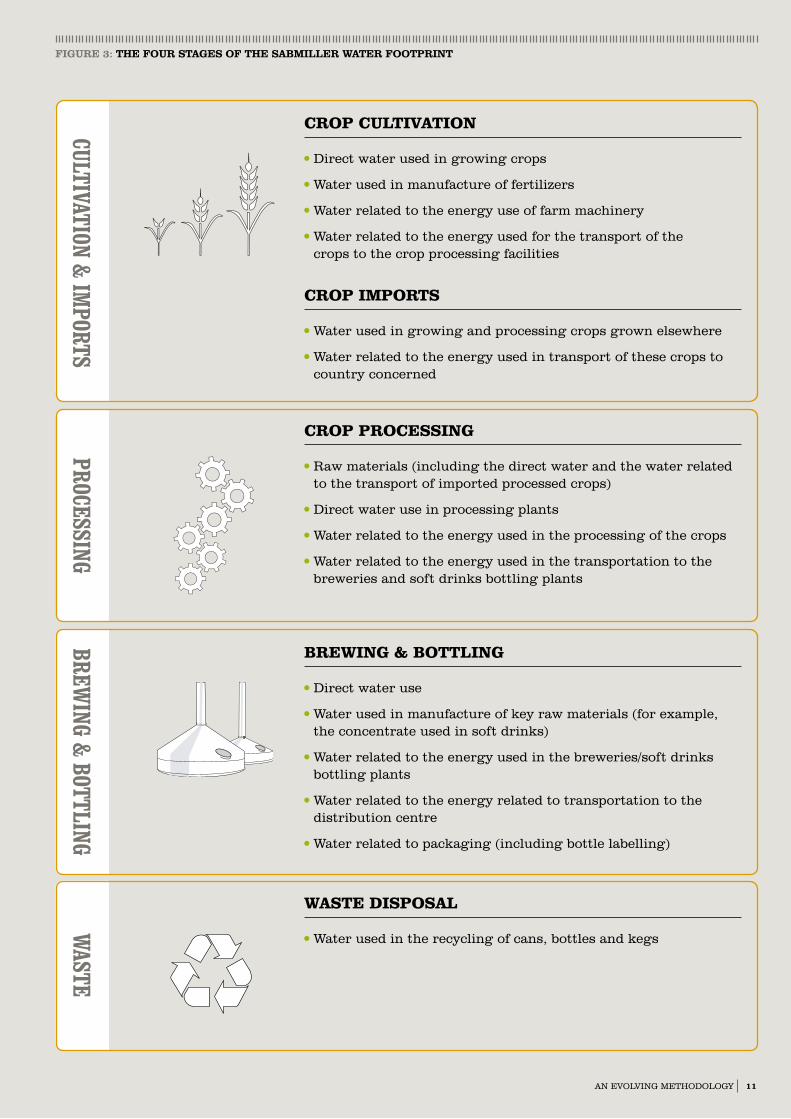
in simple terms, the water footprint for saBmiller is broken into four stages: crop cultivation and imports, crop processing, brewing and bottling and waste disposal. (see figure 3).
Within the water footprint three types of water are assessed: green water, blue water and grey water.
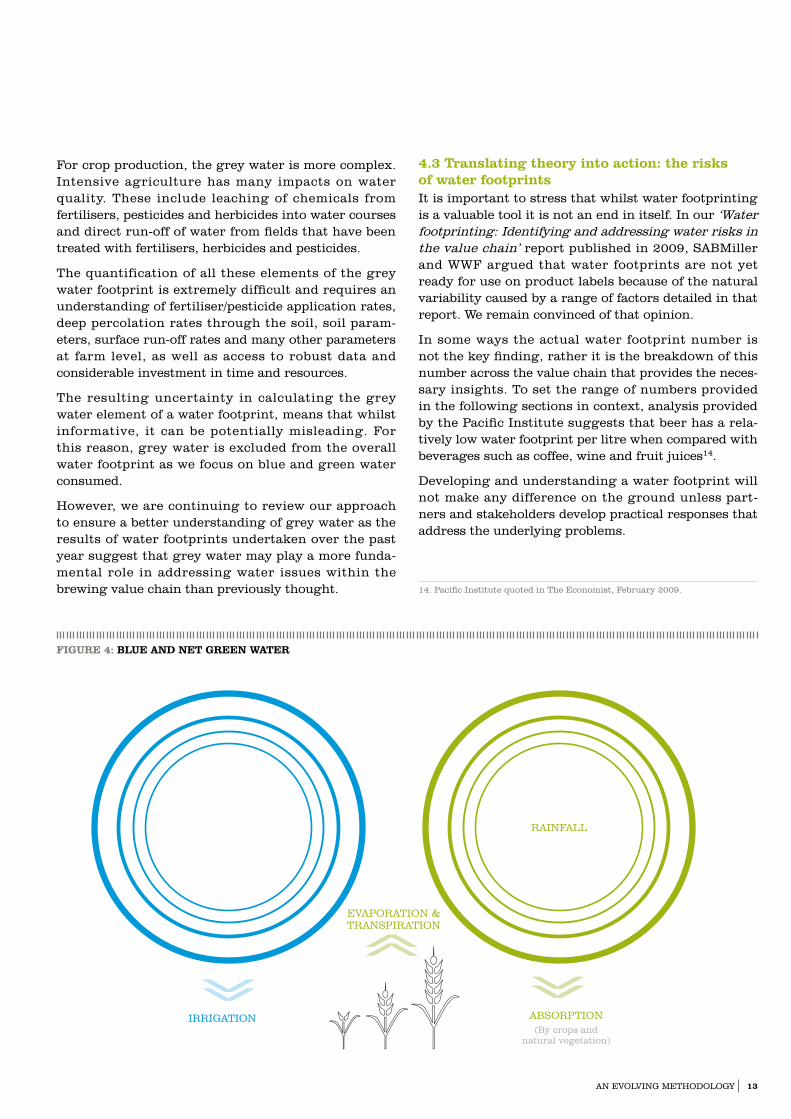
• Blue water is withdrawn from groundwater and surface water, and does not return to the system from which it came.
• Green water is evaporated through crop growth that originates from soil moisture (from rainfall). this is relevant to agricultural products (barley, maize and hops for beer production). it is assumed that such a loss is not available to the area immediately downstream of where the crops are grown and it is, therefore, considered a water use.
• Grey water refers to the volume of polluted water associated with the production of goods and services, quantified as the volume of water that is required to dilute pollutants to such an extent that the quality of the ambient water remains above agreed water quality standards. For crop production this would be the volume of dilution to reduce to agreed standards nitrate and phosphate (fertiliser) levels and pesticide levels leaching from soils.
4.0An evolving methodology thE watEr futurEs partnErship has workEd togEthEr to dEvElop a bEttEr undErstanding of thE quantity, EfficiEncy and gEographical contExt of thE watEr usEd to producE bEEr.
4.1 Recap: what is water footprinting?the concept of water footprinting was developed as a way to look at the consumption of water for a particular product or service. the Water Footprinting Network (WFN) defines a water footprint as:
“an indicator of freshwater use that looks at both direct and indirect water use of a consumer or producer. the water footprint of an individual, community or business is defined as the total volume of fresh-water that is used to produce the goods and services consumed by the individual or community or produced by the business.”
a water footprint can be calculated in a number of ways (for example, in terms of a particular product or a group of consumers), but it is always geographically explicit. For example, a water footprint for a particular product is not the same in south africa and tanzania, as a water footprint takes into account a variety of factors that are location specific. it is for this reason that water footprints are only useful when interpreted in the context of the local surroundings and environ-ment, and why any potential use of this information to compare the same products in different countries or even regions, such as on product labelling, is extremely challenging and arguably has little meaning.
in terms of the brewing process, the water footprint starts with the cultivation of crops and continues through to bottle recycling. it does not, however, include water use by consumers (for example, washing out a beer glass) as this is considered to be relatively minimal in the context of the overall footprint and there is very little existing data to estimate water use in this regard.
11aN EvOLviNG mEtHODOLOGy
CROP CULTIvATION
Direct water used in growing crops
Water used in manufacture of fertilizers
Water related to the energy use of farm machinery
Water related to the energy used for the transport of the crops to the crop processing facilities
CROP IMPORTs
Water used in growing and processing crops grown elsewhere
Water related to the energy used in transport of these crops to country concerned
CULTIvaTIOn & Im
PORTS
CROP PROCEssING
raw materials (including the direct water and the water related to the transport of imported processed crops)
Direct water use in processing plants
Water related to the energy used in the processing of the crops
Water related to the energy used in the transportation to the breweries and soft drinks bottling plants
PROCESSIng
BREWING & BOTTLING
Direct water use
Water used in manufacture of key raw materials (for example, the concentrate used in soft drinks)
Water related to the energy used in the breweries/soft drinks bottling plants
Water related to the energy related to transportation to the distribution centre
Water related to packaging (including bottle labelling)
BREwIng &
BOTTLIng
WAsTE dIsPOsAL
Water used in the recycling of cans, bottles and kegs
waSTE
FiGURe 3: The FOUR STAGeS OF The SABMiLLeR WATeR FOOTPRinT
100%RECYCLED
12
in simple terms, green and blue water can be thought of as water that is consumed during a process, whereas grey water is a measure of water pollution – or an impact. also, the distinction between blue and green water is very important in terms of crop production given the increasing amount of irrigation used, as the water for this tends to come from ground or surface water sources.
the water footprint for brewing beer contains all three types of water. However, it would be infeasible to attempt to calculate all components for all activities, so, for some of the components in the production process (e.g. transportation, energy consumption, smaller quantities of raw materials), a virtual water foot-print has been developed from literature and internet sources. this virtual (or “embedded”) water footprint is effectively the total of green and blue and does not include grey water.
4.2 An evolving and transparent methodology Whilst the broad principles of water footprinting are well established, the precise details of the methodology are under continual review as a result of new research. Organisations, such as the Water Footprinting Network (WFN), collate this emerging thinking in order to stan-dardise the approach taken by different companies, but there is inevitably some variation between methodolo-gies used.
the Water Futures Partnership has adopted an approach based on the business water footprint accounting methodology, developed by Gerbens-Leenes and Hoekstra (2008)13, which has been successfully applied to water footprints in south africa, czech republic, tanzania, Peru and ukraine. in the interests of transparency, there are two aspects of this method-ology which require clarification:
• Net Green Water: as described previously, green water is effectively the evaporative loss of rainwater taken into crop roots through soil moisture. However, although the growth of crops increases evaporation, there would still be a substantial evaporative demand from the land even if the crops were not cultivated, through naturally occurring vegetation.
• consequently, saBmiller has refined the footprinting methodology to provide a “net” green water foot-print – in other words, the difference between crop evaporation and natural evaporation. this approach provides, we believe, a more meaningful measure of how our operations impact directly and indirectly on water resources. the water footprints included within this report are consequently reported on a net basis.
• Grey Water: the aim of including grey water is to account for the impact of the pollution of water. However, this approach ignores the fact that natural processes can clean up polluted water in some circumstances with relatively low levels of environ-mental and social impact.
• For the direct production of malt and beer, the grey water component is the dilution required to reduce water discharged from each malting or brewery to appropriate national standards, or often more stringent standards set by saBmiller. the effluent is usually treated prior to discharge or treated at a municipal facility and, therefore, the grey water component may be zero.
Developing and understanding a water footprint will not make any difference on the ground unless it is translated into practical applications that address the underlying problems.
13. Gerbens-Leenes, P.W. and Hoekstra, a.y. Business water footprint accounting (2008).
13aN EvOLviNG mEtHODOLOGy
For crop production, the grey water is more complex. intensive agriculture has many impacts on water quality. these include leaching of chemicals from fertilisers, pesticides and herbicides into water courses and direct run-off of water from fields that have been treated with fertilisers, herbicides and pesticides.
the quantification of all these elements of the grey water footprint is extremely difficult and requires an understanding of fertiliser/pesticide application rates, deep percolation rates through the soil, soil param-eters, surface run-off rates and many other parameters at farm level, as well as access to robust data and considerable investment in time and resources.
the resulting uncertainty in calculating the grey water element of a water footprint, means that whilst informative, it can be potentially misleading. For this reason, grey water is excluded from the overall water footprint as we focus on blue and green water consumed.
However, we are continuing to review our approach to ensure a better understanding of grey water as the results of water footprints undertaken over the past year suggest that grey water may play a more funda-mental role in addressing water issues within the brewing value chain than previously thought.
4.3 Translating theory into action: the risks of water footprintsit is important to stress that whilst water footprinting is a valuable tool it is not an end in itself. in our ‘Water footprinting: identifying and addressing water risks in the value chain’ report published in 2009, saBmiller and WWF argued that water footprints are not yet ready for use on product labels because of the natural variability caused by a range of factors detailed in that report. We remain convinced of that opinion.
in some ways the actual water footprint number is not the key finding, rather it is the breakdown of this number across the value chain that provides the neces-sary insights. to set the range of numbers provided in the following sections in context, analysis provided by the Pacific institute suggests that beer has a rela-tively low water footprint per litre when compared with beverages such as coffee, wine and fruit juices14.
Developing and understanding a water footprint will not make any difference on the ground unless part-ners and stakeholders develop practical responses that address the underlying problems.
raiNFaLL
FiGURe 4: BLUe AnD neT GReen WATeR
aBsOrPtiON(By crops and
natural vegetation)
EvaPOratiON & traNsPiratiON
irriGatiON
14. Pacific institute quoted in the Economist, February 2009.
14
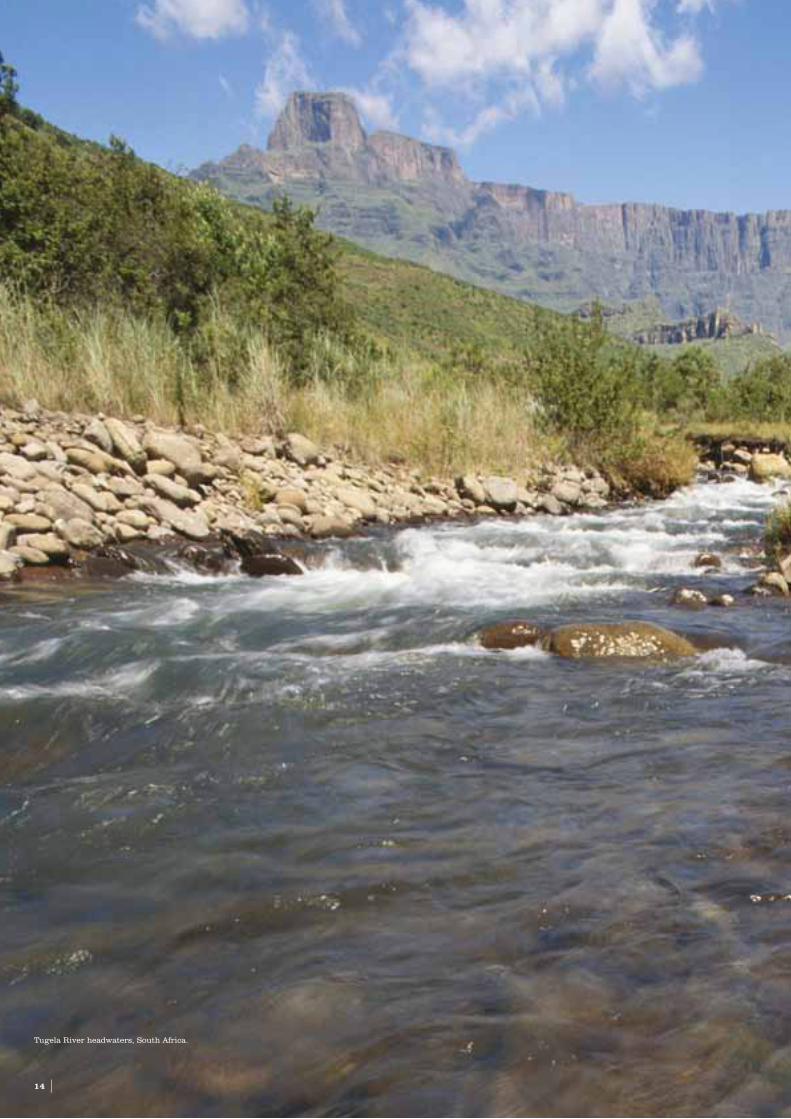
tugela river headwaters, south africa.
15
Each of these countries are facing different water related issues, are at different levels of economic development, use land in different ways and are experiencing different climatic challenges.
5.0 Case studies
casE stuDiEs
16
5.1 Peru
FiGURe 5: GeOGRAPhic OveRvieW OF OPeRATiOnSinSeT MAP: AnnUAL ReneWABLe WATeR SUPPLY PeR PeRSOn (PROJecTiOn FOR 2025)
BOLivia
BraZiL
cOLOmBia
EcuaDOr
arEquiPa
cuZcO
Lima
PucaLLPa
mOtuPE
saN matEO
Extremely scarce
scarce
stress
sufficient
abundant
No data
Brewery
Bottling plant
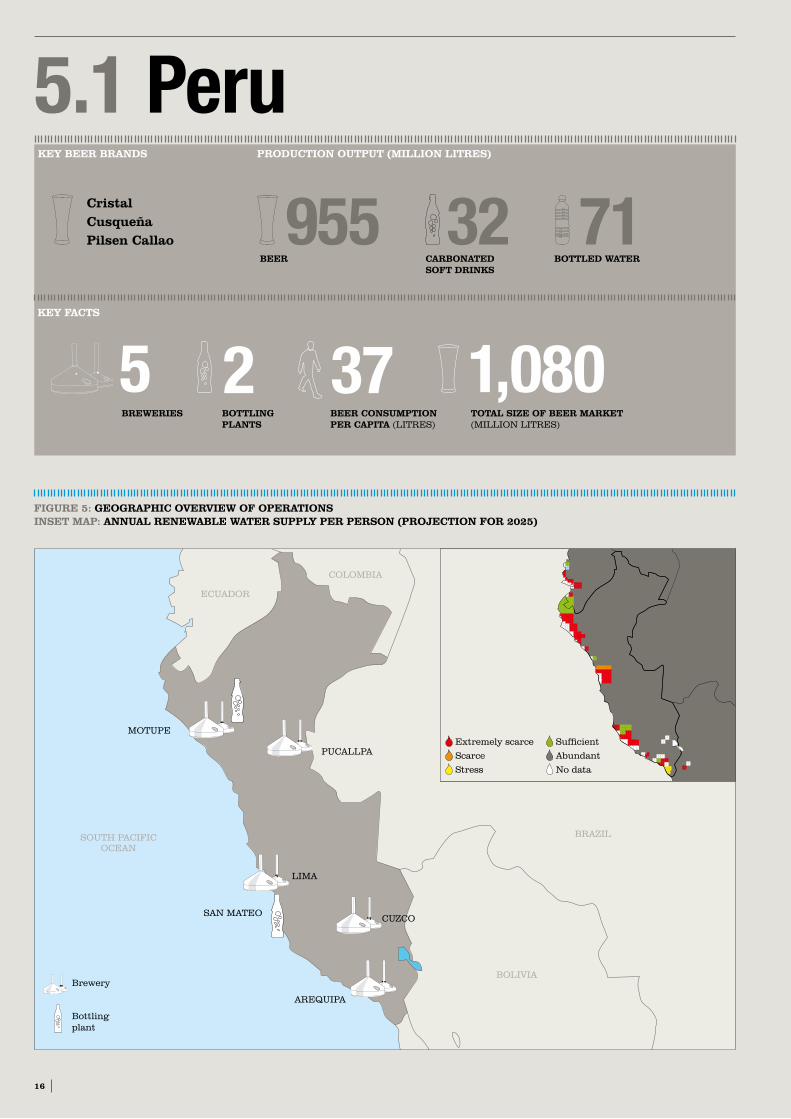
KeY BeeR BRAnDS
KeY FAcTS
BReWeRieS
5BOTTLinG PLAnTS
2TOTAL SiZe OF BeeR MARKeT (miLLiON LitrEs)
1,080BeeR cOnSUMPTiOn PeR cAPiTA (LitrEs)
37
PRODUcTiOn OUTPUT (MiLLiOn LiTReS)
955 32 71cristalcusqueñaPilsen callao
BeeR cARBOnATeD SOFT DRinKS
BOTTLeD WATeR
sOutH PaciFic OcEaN
17casE stuDiEs – PEru
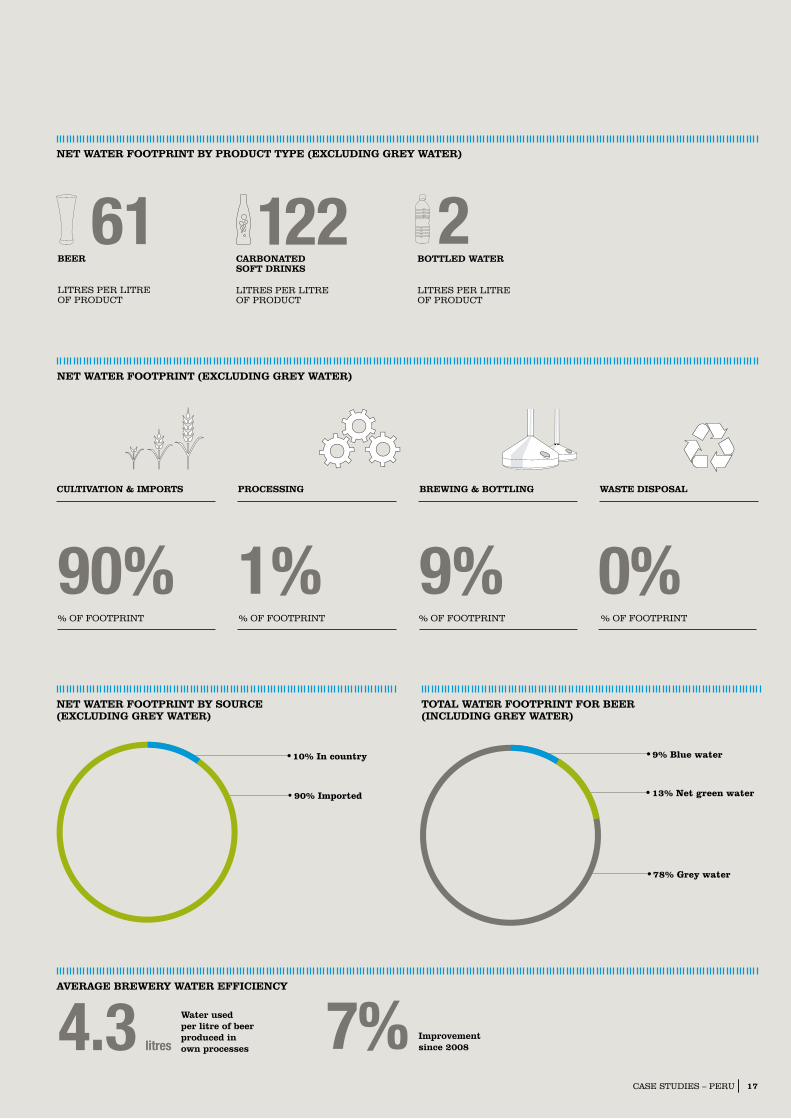
AveRAGe BReWeRY WATeR eFFiciencY
4.3 litres
Water used per litre of beer produced in own processes 7% improvement
since 2008
neT WATeR FOOTPRinT BY SOURce (excLUDinG GReY WATeR)
90% Imported
10% In country
TOTAL WATeR FOOTPRinT FOR BeeR (incLUDinG GReY WATeR)
9% Blue water
13% Net green water
78% Grey water
neT WATeR FOOTPRinT (excLUDinG GReY WATeR)
WASTe DiSPOSALBReWinG & BOTTLinGcULTivATiOn & iMPORTS PROceSSinG
% OF FOOtPriNt
90%% OF FOOtPriNt
1%% OF FOOtPriNt
9%% OF FOOtPriNt
0%
neT WATeR FOOTPRinT BY PRODUcT TYPe (excLUDinG GReY WATeR)
BeeR
LitrEs PEr LitrE OF PrODuct
61cARBOnATeD SOFT DRinKS
LitrEs PEr LitrE OF PrODuct
122BOTTLeD WATeR
LitrEs PEr LitrE OF PrODuct
2
100%RECYCLED
1818
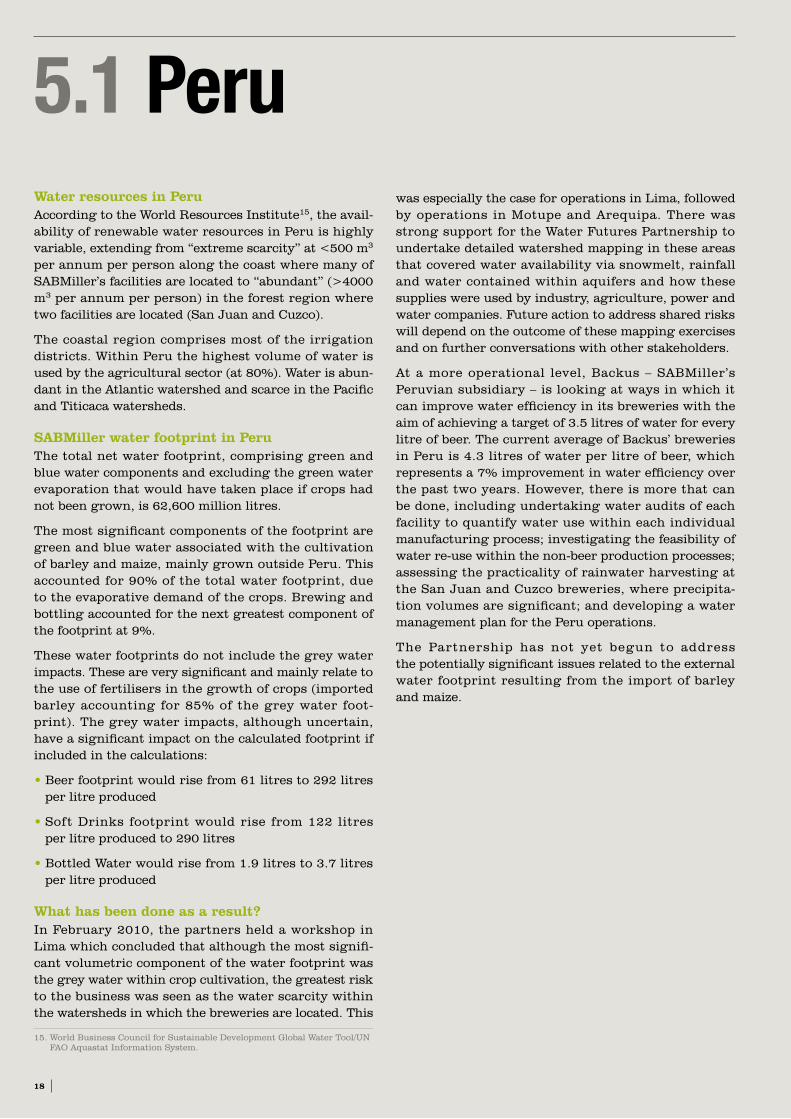
Water resources in Peruaccording to the World resources institute15, the avail-ability of renewable water resources in Peru is highly variable, extending from “extreme scarcity” at <500 m3 per annum per person along the coast where many of saBmiller’s facilities are located to “abundant” (>4000 m3 per annum per person) in the forest region where two facilities are located (san Juan and cuzco).
the coastal region comprises most of the irrigation districts. Within Peru the highest volume of water is used by the agricultural sector (at 80%). Water is abun-dant in the atlantic watershed and scarce in the Pacific and titicaca watersheds.
SABMiller water footprint in Peruthe total net water footprint, comprising green and blue water components and excluding the green water evaporation that would have taken place if crops had not been grown, is 62,600 million litres.
the most significant components of the footprint are green and blue water associated with the cultivation of barley and maize, mainly grown outside Peru. this accounted for 90% of the total water footprint, due to the evaporative demand of the crops. Brewing and bottling accounted for the next greatest component of the footprint at 9%.
these water footprints do not include the grey water impacts. these are very significant and mainly relate to the use of fertilisers in the growth of crops (imported barley accounting for 85% of the grey water foot-print). the grey water impacts, although uncertain, have a significant impact on the calculated footprint if included in the calculations:
• Beer footprint would rise from 61 litres to 292 litres per litre produced
• soft Drinks footprint would rise from 122 litres per litre produced to 290 litres
• Bottled Water would rise from 1.9 litres to 3.7 litres per litre produced
What has been done as a result?in February 2010, the partners held a workshop in Lima which concluded that although the most signifi-cant volumetric component of the water footprint was the grey water within crop cultivation, the greatest risk to the business was seen as the water scarcity within the watersheds in which the breweries are located. this
was especially the case for operations in Lima, followed by operations in motupe and arequipa. there was strong support for the Water Futures Partnership to undertake detailed watershed mapping in these areas that covered water availability via snowmelt, rainfall and water contained within aquifers and how these supplies were used by industry, agriculture, power and water companies. Future action to address shared risks will depend on the outcome of these mapping exercises and on further conversations with other stakeholders.
at a more operational level, Backus – saBmiller’s Peruvian subsidiary – is looking at ways in which it can improve water efficiency in its breweries with the aim of achieving a target of 3.5 litres of water for every litre of beer. the current average of Backus’ breweries in Peru is 4.3 litres of water per litre of beer, which represents a 7% improvement in water efficiency over the past two years. However, there is more that can be done, including undertaking water audits of each facility to quantify water use within each individual manufacturing process; investigating the feasibility of water re-use within the non-beer production processes; assessing the practicality of rainwater harvesting at the san Juan and cuzco breweries, where precipita-tion volumes are significant; and developing a water management plan for the Peru operations.
the Partnership has not yet begun to address the potentially significant issues related to the external water footprint resulting from the import of barley and maize.
5.1 Peru
15. World Business council for sustainable Development Global Water tool/uN FaO aquastat information system.
19casE stuDiEs – PEru
STRATeGic RiSKS iDenTiFieD
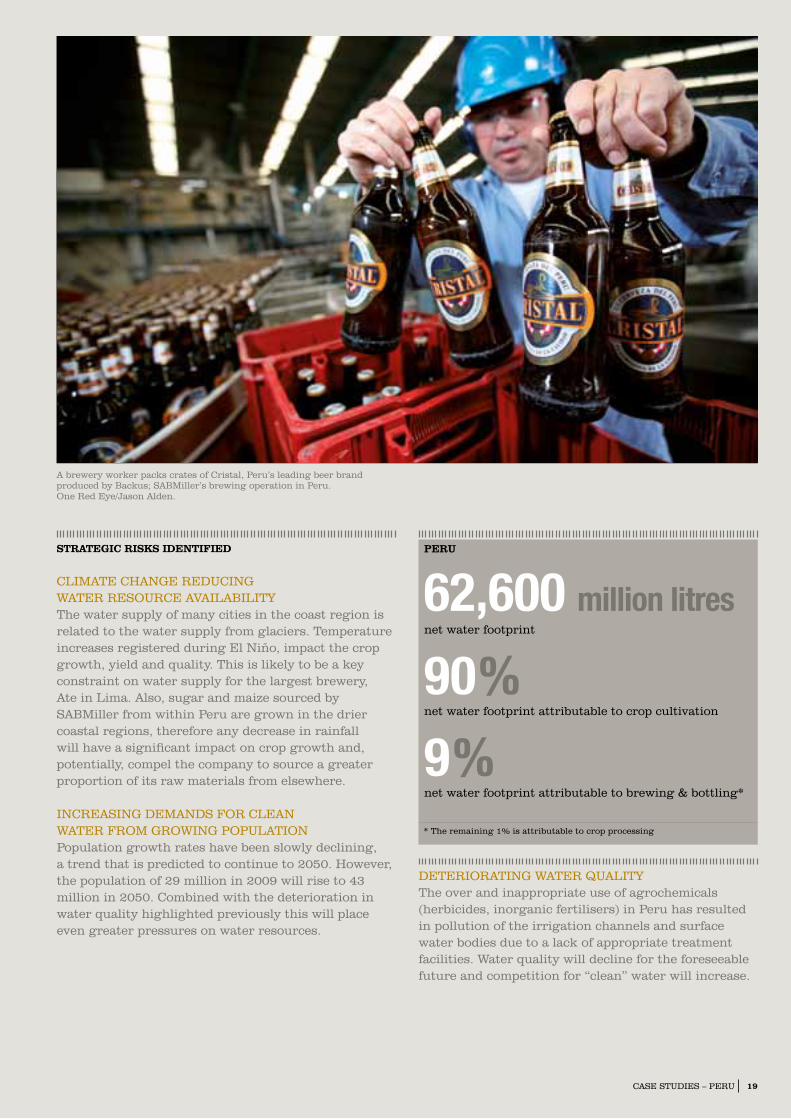
cLimatE cHaNGE rEDuciNG WatEr rEsOurcE avaiLaBiLitythe water supply of many cities in the coast region is related to the water supply from glaciers. temperature increases registered during El Niño, impact the crop growth, yield and quality. this is likely to be a key constraint on water supply for the largest brewery, ate in Lima. also, sugar and maize sourced by saBmiller from within Peru are grown in the drier coastal regions, therefore any decrease in rainfall will have a significant impact on crop growth and, potentially, compel the company to source a greater proportion of its raw materials from elsewhere. iNcrEasiNG DEmaNDs FOr cLEaN WatEr FrOm GrOWiNG POPuLatiONPopulation growth rates have been slowly declining, a trend that is predicted to continue to 2050. However, the population of 29 million in 2009 will rise to 43 million in 2050. combined with the deterioration in water quality highlighted previously this will place even greater pressures on water resources.
a brewery worker packs crates of cristal, Peru’s leading beer brand produced by Backus; saBmiller’s brewing operation in Peru. One red Eye/Jason alden.
DEtEriOratiNG WatEr quaLitythe over and inappropriate use of agrochemicals (herbicides, inorganic fertilisers) in Peru has resulted in pollution of the irrigation channels and surface water bodies due to a lack of appropriate treatment facilities. Water quality will decline for the foreseeable future and competition for “clean” water will increase.
* the remaining 1% is attributable to crop processing
PeRU
62,600 million litresnet water footprint
90 %net water footprint attributable to crop cultivation
9 %net water footprint attributable to brewing & bottling*
20
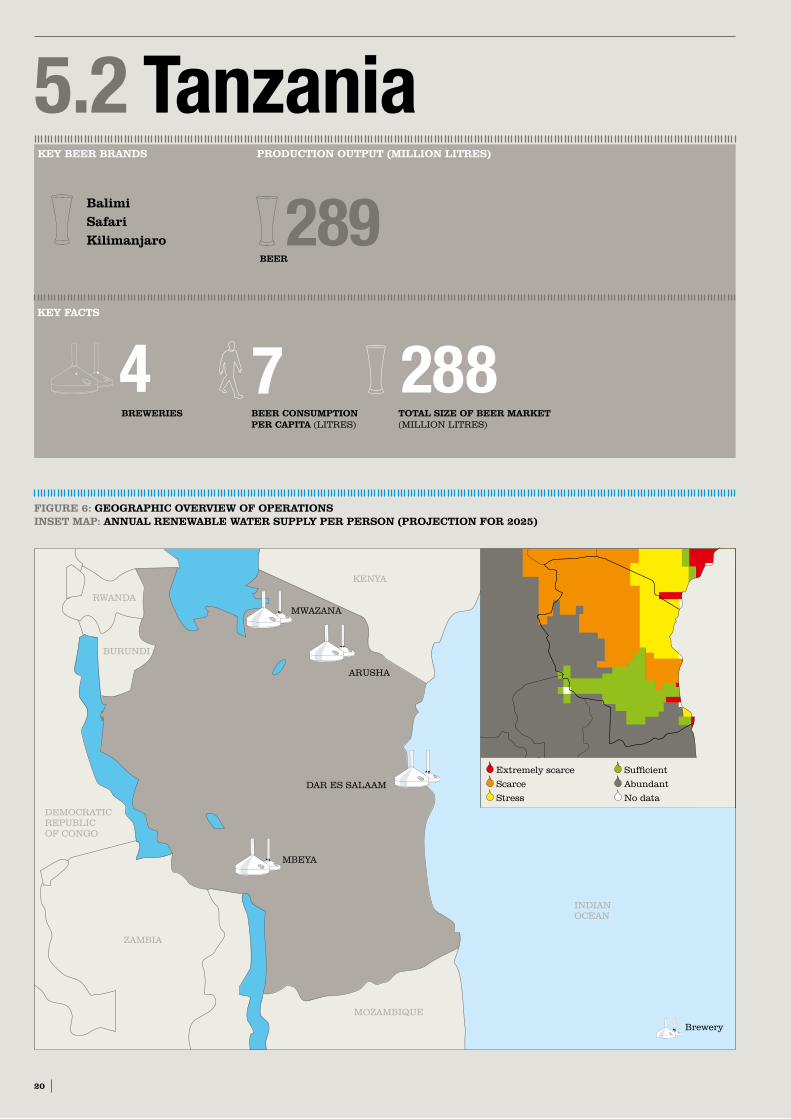
5.2 Tanzania KeY BeeR BRAnDS
KeY FAcTS
BReWeRieS
4TOTAL SiZe OF BeeR MARKeT (miLLiON LitrEs)
288BeeR cOnSUMPTiOn PeR cAPiTA (LitrEs)
7
PRODUcTiOn OUTPUT (MiLLiOn LiTReS)
289BalimiSafariKilimanjaro
FiGURe 6: GeOGRAPhic OveRvieW OF OPeRATiOnSinSeT MAP: AnnUAL ReneWABLe WATeR SUPPLY PeR PeRSOn (PROJecTiOn FOR 2025)
maLaWi
kENya
DEmOcratic rEPuBLic OF cONGO
BuruNDi
rWaNDa
ZamBia
mOZamBiquE
iNDiaN OcEaN
mWaZaNa
arusHa
Dar Es saLaam
mBEya
Extremely scarce
scarce
stress
sufficient
abundant
No data
Brewery
BeeR
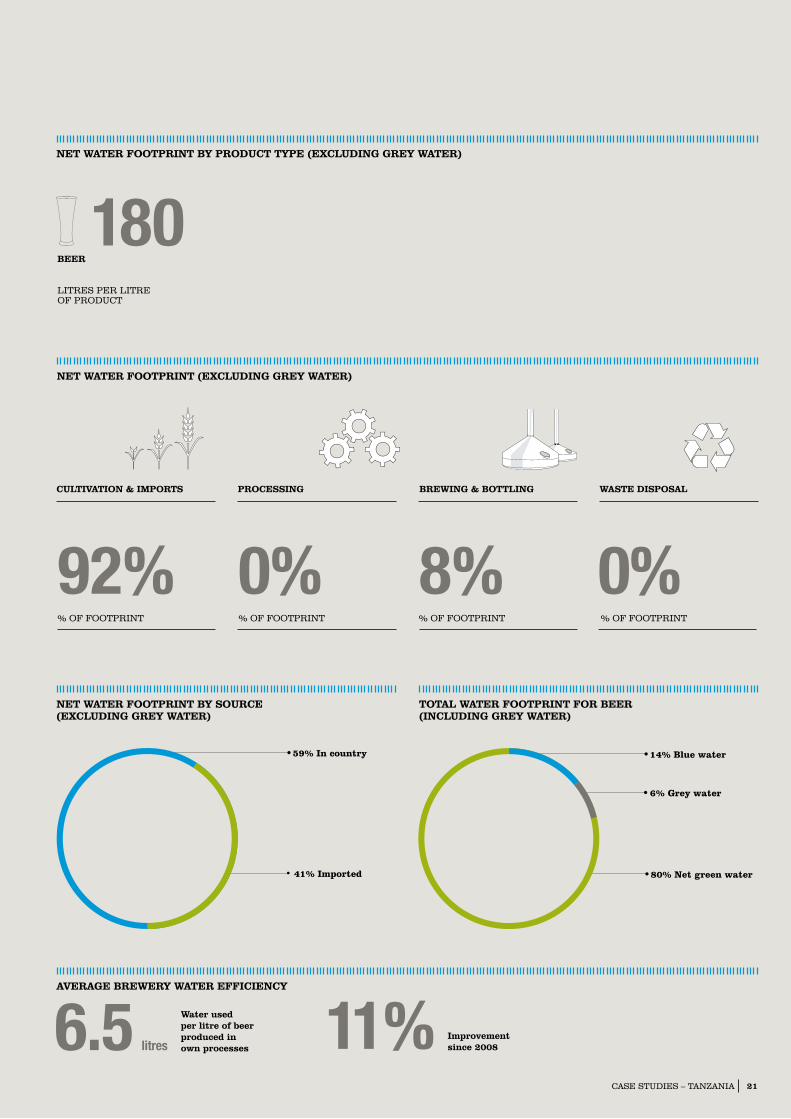
AveRAGe BReWeRY WATeR eFFiciencY
6.5 litres
Water used per litre of beer produced in own processes 11% improvement
since 2008
21casE stuDiEs – taNZaNia
TOTAL WATeR FOOTPRinT FOR BeeR (incLUDinG GReY WATeR)
14% Blue water
6% Grey water
80% Net green water
neT WATeR FOOTPRinT BY SOURce (excLUDinG GReY WATeR)
41% Imported
59% In country
neT WATeR FOOTPRinT BY PRODUcT TYPe (excLUDinG GReY WATeR)
BeeR
LitrEs PEr LitrE OF PrODuct
180
neT WATeR FOOTPRinT (excLUDinG GReY WATeR)
% OF FOOtPriNt
92%% OF FOOtPriNt
0%% OF FOOtPriNt
8%% OF FOOtPriNt
0%
100%RECYCLED
WASTe DiSPOSALBReWinG & BOTTLinGcULTivATiOn & iMPORTS PROceSSinG
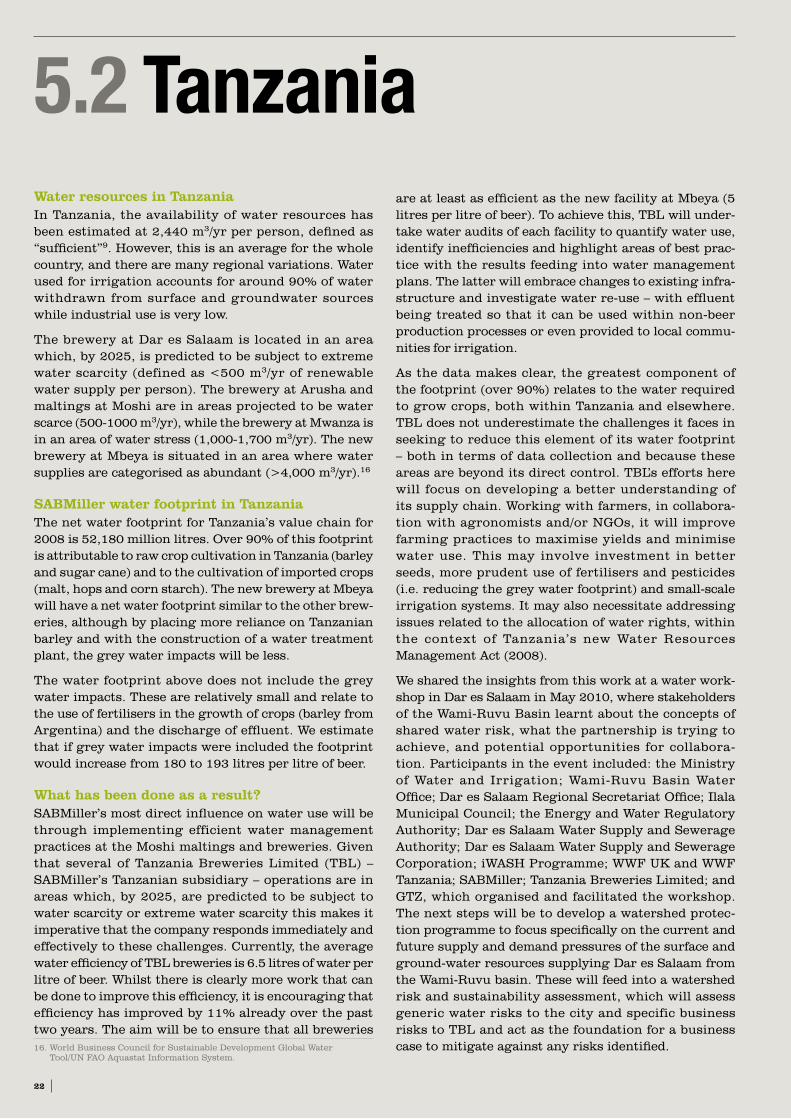
5.2 TanzaniaWater resources in Tanzaniain tanzania, the availability of water resources has been estimated at 2,440 m3/yr per person, defined as “sufficient”9. However, this is an average for the whole country, and there are many regional variations. Water used for irrigation accounts for around 90% of water withdrawn from surface and groundwater sources while industrial use is very low.
the brewery at Dar es salaam is located in an area which, by 2025, is predicted to be subject to extreme water scarcity (defined as <500 m3/yr of renewable water supply per person). the brewery at arusha and maltings at moshi are in areas projected to be water scarce (500-1000 m3/yr), while the brewery at mwanza is in an area of water stress (1,000-1,700 m3/yr). the new brewery at mbeya is situated in an area where water supplies are categorised as abundant (>4,000 m3/yr).16
SABMiller water footprint in Tanzaniathe net water footprint for tanzania’s value chain for 2008 is 52,180 million litres. Over 90% of this footprint is attributable to raw crop cultivation in tanzania (barley and sugar cane) and to the cultivation of imported crops (malt, hops and corn starch). the new brewery at mbeya will have a net water footprint similar to the other brew-eries, although by placing more reliance on tanzanian barley and with the construction of a water treatment plant, the grey water impacts will be less.
the water footprint above does not include the grey water impacts. these are relatively small and relate to the use of fertilisers in the growth of crops (barley from argentina) and the discharge of effluent. We estimate that if grey water impacts were included the footprint would increase from 180 to 193 litres per litre of beer.
What has been done as a result?saBmiller’s most direct influence on water use will be through implementing efficient water management practices at the moshi maltings and breweries. Given that several of tanzania Breweries Limited (tBL) – saBmiller’s tanzanian subsidiary – operations are in areas which, by 2025, are predicted to be subject to water scarcity or extreme water scarcity this makes it imperative that the company responds immediately and effectively to these challenges. currently, the average water efficiency of tBL breweries is 6.5 litres of water per litre of beer. Whilst there is clearly more work that can be done to improve this efficiency, it is encouraging that efficiency has improved by 11% already over the past two years. the aim will be to ensure that all breweries
are at least as efficient as the new facility at mbeya (5 litres per litre of beer). to achieve this, tBL will under-take water audits of each facility to quantify water use, identify inefficiencies and highlight areas of best prac-tice with the results feeding into water management plans. the latter will embrace changes to existing infra-structure and investigate water re-use – with effluent being treated so that it can be used within non-beer production processes or even provided to local commu-nities for irrigation.
as the data makes clear, the greatest component of the footprint (over 90%) relates to the water required to grow crops, both within tanzania and elsewhere. tBL does not underestimate the challenges it faces in seeking to reduce this element of its water footprint – both in terms of data collection and because these areas are beyond its direct control. tBL’s efforts here will focus on developing a better understanding of its supply chain. Working with farmers, in collabora-tion with agronomists and/or NGOs, it will improve farming practices to maximise yields and minimise water use. this may involve investment in better seeds, more prudent use of fertilisers and pesticides (i.e. reducing the grey water footprint) and small-scale irrigation systems. it may also necessitate addressing issues related to the allocation of water rights, within the context of tanzania’s new Water resources management act (2008).
We shared the insights from this work at a water work-shop in Dar es salaam in may 2010, where stakeholders of the Wami-ruvu Basin learnt about the concepts of shared water risk, what the partnership is trying to achieve, and potential opportunities for collabora-tion. Participants in the event included: the ministry of Water and irrigation; Wami-ruvu Basin Water Office; Dar es salaam regional secretariat Office; ilala municipal council; the Energy and Water regulatory authority; Dar es salaam Water supply and sewerage authority; Dar es salaam Water supply and sewerage corporation; iWasH Programme; WWF uk and WWF tanzania; saBmiller; tanzania Breweries Limited; and GtZ, which organised and facilitated the workshop. the next steps will be to develop a watershed protec-tion programme to focus specifically on the current and future supply and demand pressures of the surface and ground-water resources supplying Dar es salaam from the Wami-ruvu basin. these will feed into a watershed risk and sustainability assessment, which will assess generic water risks to the city and specific business risks to tBL and act as the foundation for a business case to mitigate against any risks identified.16. World Business council for sustainable Development Global Water
tool/uN FaO aquastat information system.
22
23casE stuDiEs – taNZaNia
STRATeGic RiSKS iDenTiFieD
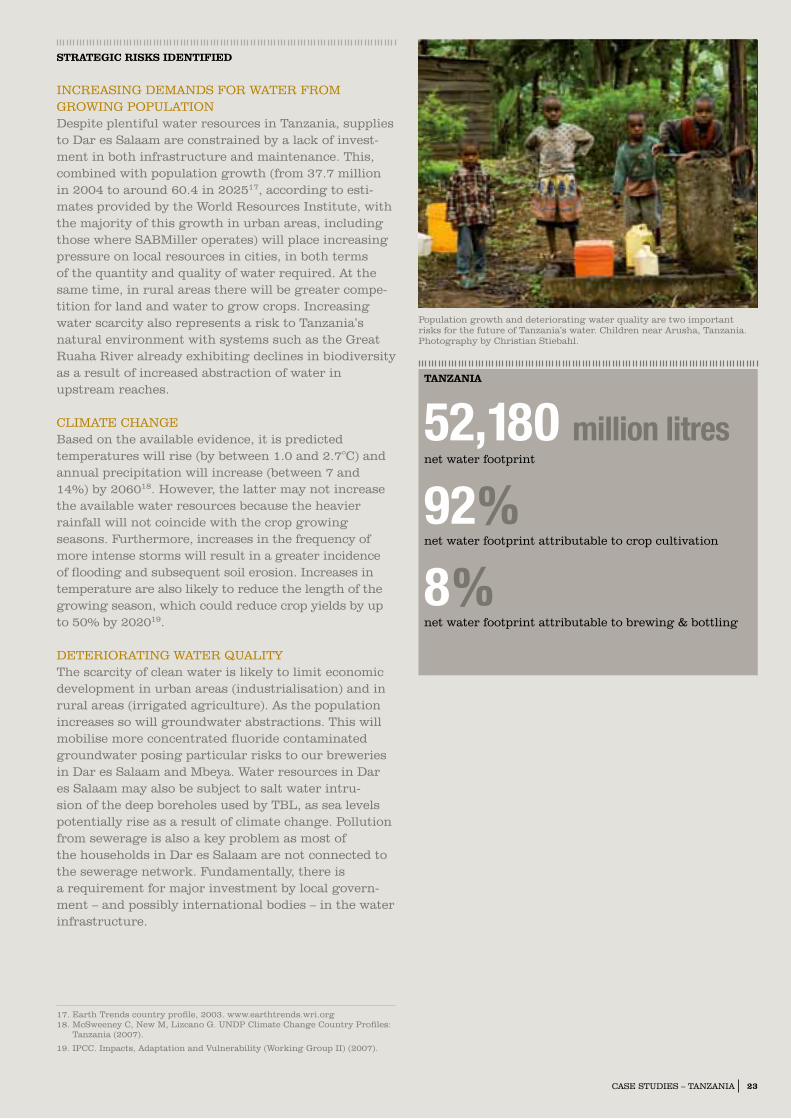
iNcrEasiNG DEmaNDs FOr WatEr FrOm GrOWiNG POPuLatiONDespite plentiful water resources in tanzania, supplies to Dar es salaam are constrained by a lack of invest-ment in both infrastructure and maintenance. this, combined with population growth (from 37.7 million in 2004 to around 60.4 in 202517, according to esti-mates provided by the World resources institute, with the majority of this growth in urban areas, including those where saBmiller operates) will place increasing pressure on local resources in cities, in both terms of the quantity and quality of water required. at the same time, in rural areas there will be greater compe-tition for land and water to grow crops. increasing water scarcity also represents a risk to tanzania’s natural environment with systems such as the Great ruaha river already exhibiting declines in biodiversity as a result of increased abstraction of water in upstream reaches.
cLimatE cHaNGEBased on the available evidence, it is predicted temperatures will rise (by between 1.0 and 2.7°c) and annual precipitation will increase (between 7 and 14%) by 206018. However, the latter may not increase the available water resources because the heavier rainfall will not coincide with the crop growing seasons. Furthermore, increases in the frequency of more intense storms will result in a greater incidence of flooding and subsequent soil erosion. increases in temperature are also likely to reduce the length of the growing season, which could reduce crop yields by up to 50% by 202019.
DEtEriOratiNG WatEr quaLitythe scarcity of clean water is likely to limit economic development in urban areas (industrialisation) and in rural areas (irrigated agriculture). as the population increases so will groundwater abstractions. this will mobilise more concentrated fluoride contaminated groundwater posing particular risks to our breweries in Dar es salaam and mbeya. Water resources in Dar es salaam may also be subject to salt water intru-sion of the deep boreholes used by tBL, as sea levels potentially rise as a result of climate change. Pollution from sewerage is also a key problem as most of the households in Dar es salaam are not connected to the sewerage network. Fundamentally, there is a requirement for major investment by local govern-ment – and possibly international bodies – in the water infrastructure.
Population growth and deteriorating water quality are two important risks for the future of tanzania’s water. children near arusha, tanzania.Photography by christian stiebahl.
17. Earth trends country profile, 2003. www.earthtrends.wri.org 18. mcsweeney c, New m, Lizcano G. uNDP climate change country Profiles:
tanzania (2007).
19. iPcc. impacts, adaptation and vulnerability (Working Group ii) (2007).
TAnZAniA
52,180 million litresnet water footprint
92 %net water footprint attributable to crop cultivation
8 %net water footprint attributable to brewing & bottling
24
5.3 Ukraine
rOmaNia
mOLDOva
BLack sEa
Extremely scarce
scarce
stress
sufficient
abundant
No data
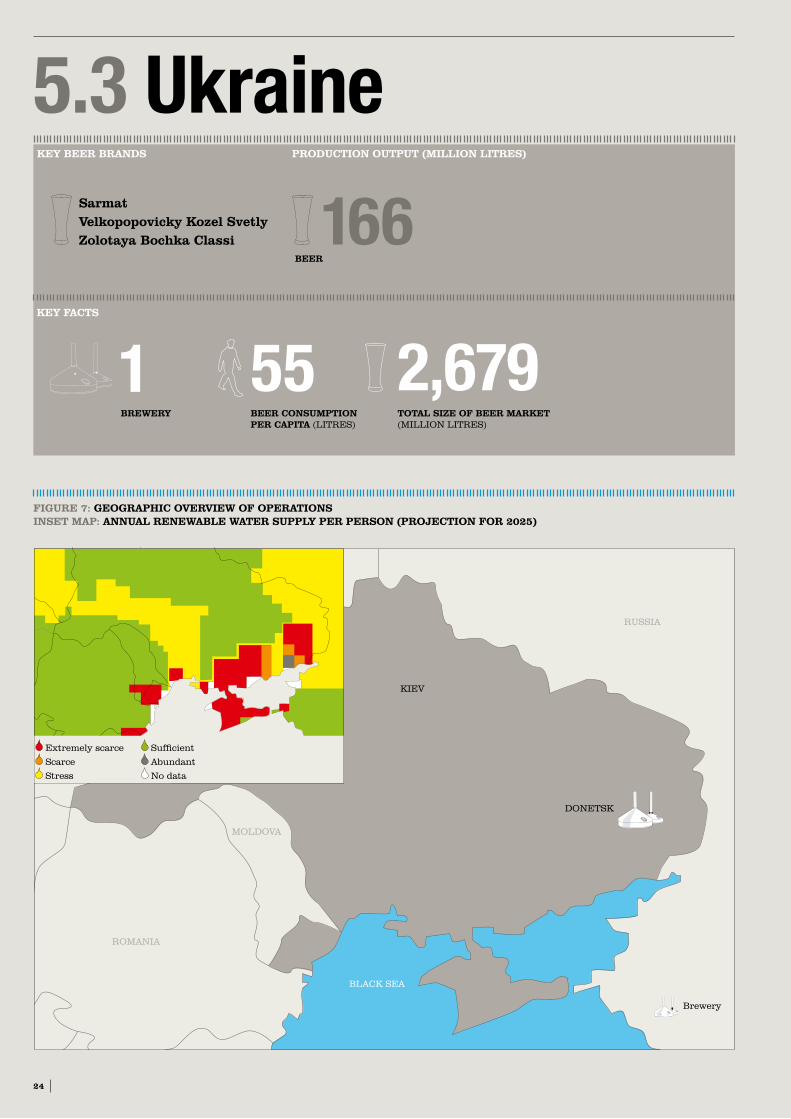
FiGURe 7: GeOGRAPhic OveRvieW OF OPeRATiOnSinSeT MAP: AnnUAL ReneWABLe WATeR SUPPLY PeR PeRSOn (PROJecTiOn FOR 2025)
Brewery
kiEv
rOmaNia
mOLDOva
russia
KeY BeeR BRAnDS
KeY FAcTS
BReWeRY
1TOTAL SiZe OF BeeR MARKeT (miLLiON LitrEs)
2,679BeeR cOnSUMPTiOn PeR cAPiTA (LitrEs)
55
PRODUcTiOn OUTPUT (MiLLiOn LiTReS)
166 Sarmat velkopopovicky Kozel SvetlyZolotaya Bochka classi
BeeR
DONEtsk
AveRAGe BReWeRY WATeR eFFiciencY
6.9 litres
Water used per litre of beer produced in own processes
neT WATeR FOOTPRinT BY SOURce (excLUDinG GReY WATeR)
1% Imported
99% In country
TOTAL WATeR FOOTPRinT FOR BeeR (incLUDinG GReY WATeR)
14% Net green water
2% Blue water
84% Grey water
neT WATeR FOOTPRinT BY PRODUcT TYPe (excLUDinG GReY WATeR)
BeeR
LitrEs PEr LitrE OF PrODuct
62
neT WATeR FOOTPRinT (excLUDinG GReY WATeR)
% OF FOOtPriNt
92%% OF FOOtPriNt
1%% OF FOOtPriNt
7%% OF FOOtPriNt)
0%
100%RECYCLED
WASTe DiSPOSALBReWinG & BOTTLinGcULTivATiOn & iMPORTS PROceSSinG
25casE stuDiEs – ukraiNE
26
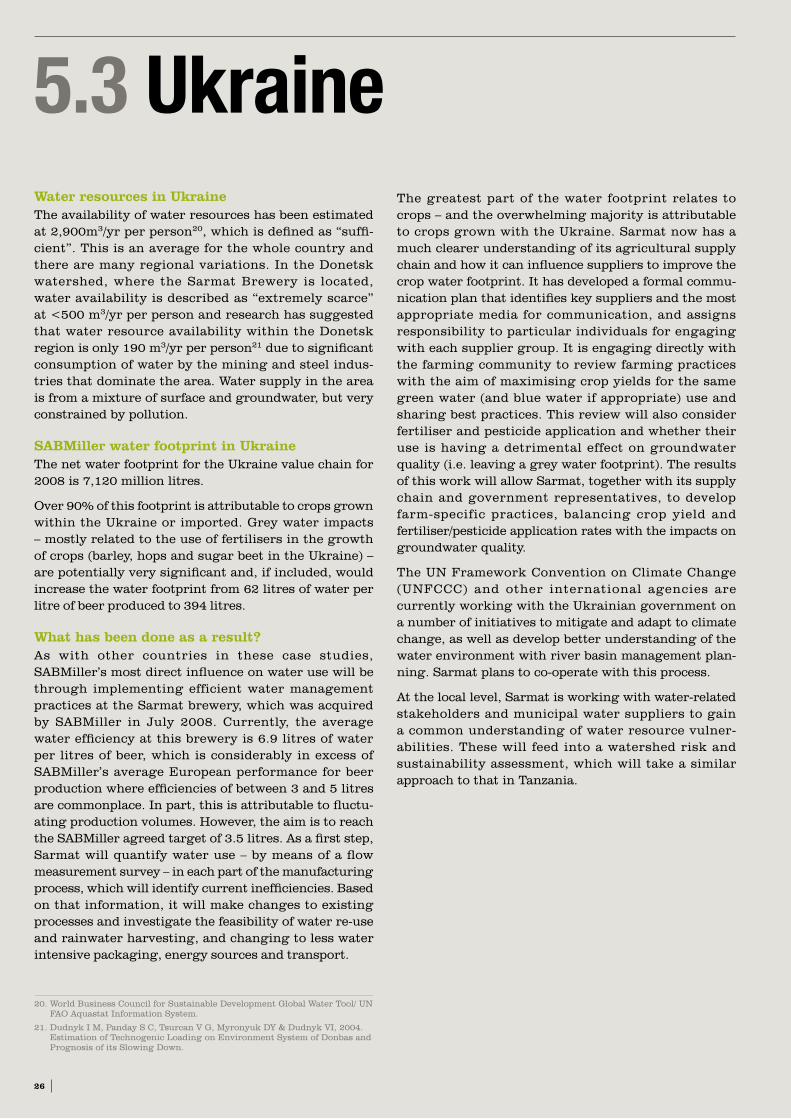
Water resources in Ukrainethe availability of water resources has been estimated at 2,900m3/yr per person20, which is defined as “suffi-cient”. this is an average for the whole country and there are many regional variations. in the Donetsk watershed, where the sarmat Brewery is located, water availability is described as “extremely scarce” at <500 m3/yr per person and research has suggested that water resource availability within the Donetsk region is only 190 m3/yr per person21 due to significant consumption of water by the mining and steel indus-tries that dominate the area. Water supply in the area is from a mixture of surface and groundwater, but very constrained by pollution.
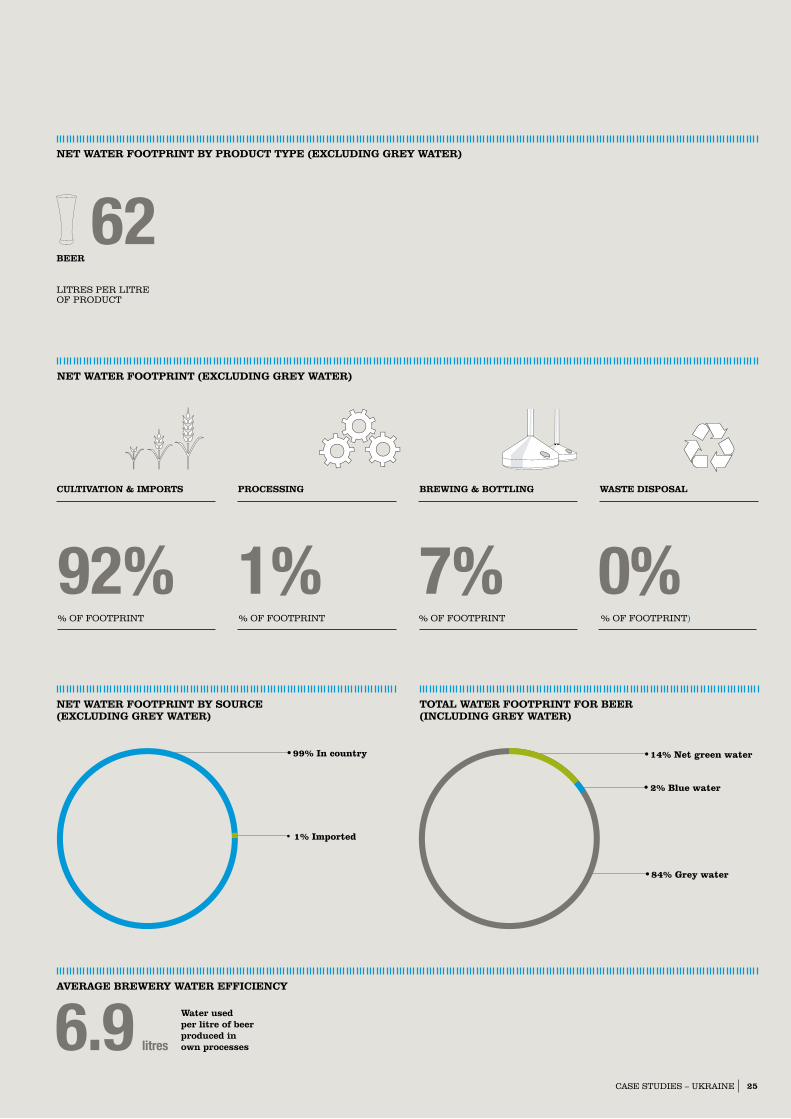
SABMiller water footprint in Ukrainethe net water footprint for the ukraine value chain for 2008 is 7,120 million litres.
Over 90% of this footprint is attributable to crops grown within the ukraine or imported. Grey water impacts – mostly related to the use of fertilisers in the growth of crops (barley, hops and sugar beet in the ukraine) – are potentially very significant and, if included, would increase the water footprint from 62 litres of water per litre of beer produced to 394 litres.
What has been done as a result?as with other countries in these case studies, saBmiller’s most direct influence on water use will be through implementing efficient water management practices at the sarmat brewery, which was acquired by saBmiller in July 2008. currently, the average water efficiency at this brewery is 6.9 litres of water per litres of beer, which is considerably in excess of saBmiller’s average European performance for beer production where efficiencies of between 3 and 5 litres are commonplace. in part, this is attributable to fluctu-ating production volumes. However, the aim is to reach the saBmiller agreed target of 3.5 litres. as a first step, sarmat will quantify water use – by means of a flow measurement survey – in each part of the manufacturing process, which will identify current inefficiencies. Based on that information, it will make changes to existing processes and investigate the feasibility of water re-use and rainwater harvesting, and changing to less water intensive packaging, energy sources and transport.
the greatest part of the water footprint relates to crops – and the overwhelming majority is attributable to crops grown with the ukraine. sarmat now has a much clearer understanding of its agricultural supply chain and how it can influence suppliers to improve the crop water footprint. it has developed a formal commu-nication plan that identifies key suppliers and the most appropriate media for communication, and assigns responsibility to particular individuals for engaging with each supplier group. it is engaging directly with the farming community to review farming practices with the aim of maximising crop yields for the same green water (and blue water if appropriate) use and sharing best practices. this review will also consider fertiliser and pesticide application and whether their use is having a detrimental effect on groundwater quality (i.e. leaving a grey water footprint). the results of this work will allow sarmat, together with its supply chain and government representatives, to develop farm-specific practices, balancing crop yield and fertiliser/pesticide application rates with the impacts on groundwater quality.
the uN Framework convention on climate change (uNFccc) and other international agencies are currently working with the ukrainian government on a number of initiatives to mitigate and adapt to climate change, as well as develop better understanding of the water environment with river basin management plan-ning. sarmat plans to co-operate with this process.
at the local level, sarmat is working with water-related stakeholders and municipal water suppliers to gain a common understanding of water resource vulner-abilities. these will feed into a watershed risk and sustainability assessment, which will take a similar approach to that in tanzania.
20. World Business council for sustainable Development Global Water tool/ uN FaO aquastat information system.
21. Dudnyk i m, Panday s c, tsurcan v G, myronyuk Dy & Dudnyk vi, 2004. Estimation of technogenic Loading on Environment system of Donbas and Prognosis of its slowing Down.
5.3 Ukraine
27casE stuDiEs – ukraiNE
STRATeGic RiSKS iDenTiFieD
WatEr suPPLy aND WastEWatEr trEatmENt iNFrastructurEsignificant investment is required throughout ukraine. around 40% of water supply capacity is lost through leaking pipes and water supply is limited to 18 hours per day on average. around 9.6 million m3/day of sewage is treated at municipal treatment works but a further 4.6 million m3/day is untreated, mainly as a result of infrastructure limitations22. although an investment programme has been agreed and some projects have been implemented, the risks of intermittent water supply to saBmiller’s breweries and poor water quality are high and in the summer of 2009 the brewery experienced a number of supply interruptions.
DEtEriOratiNG WatEr quaLityWater quality issues are serious in ukraine. surface water and groundwater are polluted to varying degrees from previous industrial and agricultural practices and because treatment facilities are either inappropriate or in some cases non-existent. in the Donetsk region, as well as having little water avail-ability, mining and steel manufacture have resulted in wide-scale pollution of rivers and aquifers. in summer, most of the water in the rivers is the effluent, largely untreated, from mines and industries, water unfit for human consumption, or for irrigation use.
UKRAine
7,120 million litresnet water footprint
91%net water footprint attributable to crop cultivation
7 %net water footprint attributable to brewing & bottling*
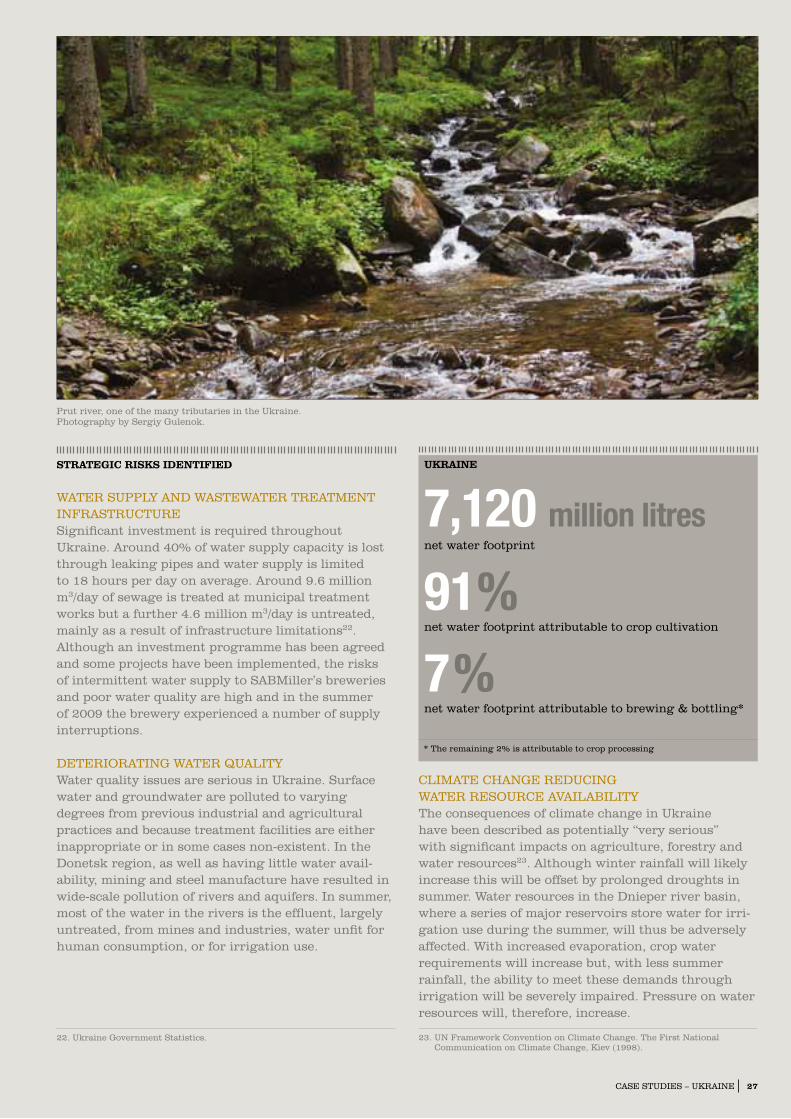
Prut river, one of the many tributaries in the ukraine. Photography by sergiy Gulenok.
cLimatE cHaNGE rEDuciNG WatEr rEsOurcE avaiLaBiLitythe consequences of climate change in ukraine have been described as potentially “very serious” with significant impacts on agriculture, forestry and water resources23. although winter rainfall will likely increase this will be offset by prolonged droughts in summer. Water resources in the Dnieper river basin, where a series of major reservoirs store water for irri-gation use during the summer, will thus be adversely affected. With increased evaporation, crop water requirements will increase but, with less summer rainfall, the ability to meet these demands through irrigation will be severely impaired. Pressure on water resources will, therefore, increase.
22. ukraine Government statistics. 23. uN Framework convention on climate change. the First National communication on climate change, kiev (1998).
* the remaining 2% is attributable to crop processing
28
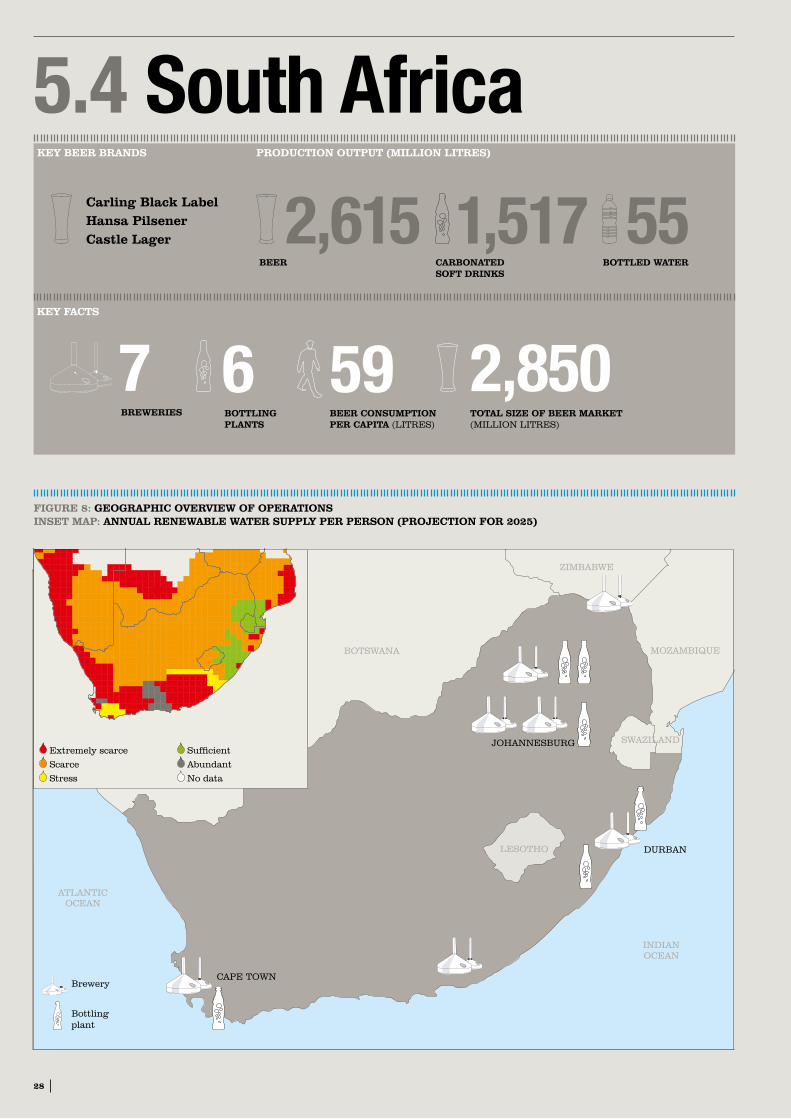
5.4 South Africa
NamiBia
BOtsWaNa
ZimBaBWE
mOZamBiquE
sWaZiLaND
LEsOtHO
FiGURe 8: GeOGRAPhic OveRvieW OF OPeRATiOnSinSeT MAP: AnnUAL ReneWABLe WATeR SUPPLY PeR PeRSOn (PROJecTiOn FOR 2025)
Extremely scarce
scarce
stress
sufficient
abundant
No data
DurBaN
caPE tOWN
JOHaNNEsBurG
Brewery
Bottling plant
KeY BeeR BRAnDS
KeY FAcTS
BReWeRieS
7BOTTLinG PLAnTS
6TOTAL SiZe OF BeeR MARKeT (miLLiON LitrEs)
2,850BeeR cOnSUMPTiOn PeR cAPiTA (LitrEs)
59
PRODUcTiOn OUTPUT (MiLLiOn LiTReS)
2,615 1,517 55carling Black Labelhansa Pilsenercastle Lager
BeeR cARBOnATeD SOFT DRinKS
BOTTLeD WATeR
iNDiaN OcEaN
atLaNtic OcEaN
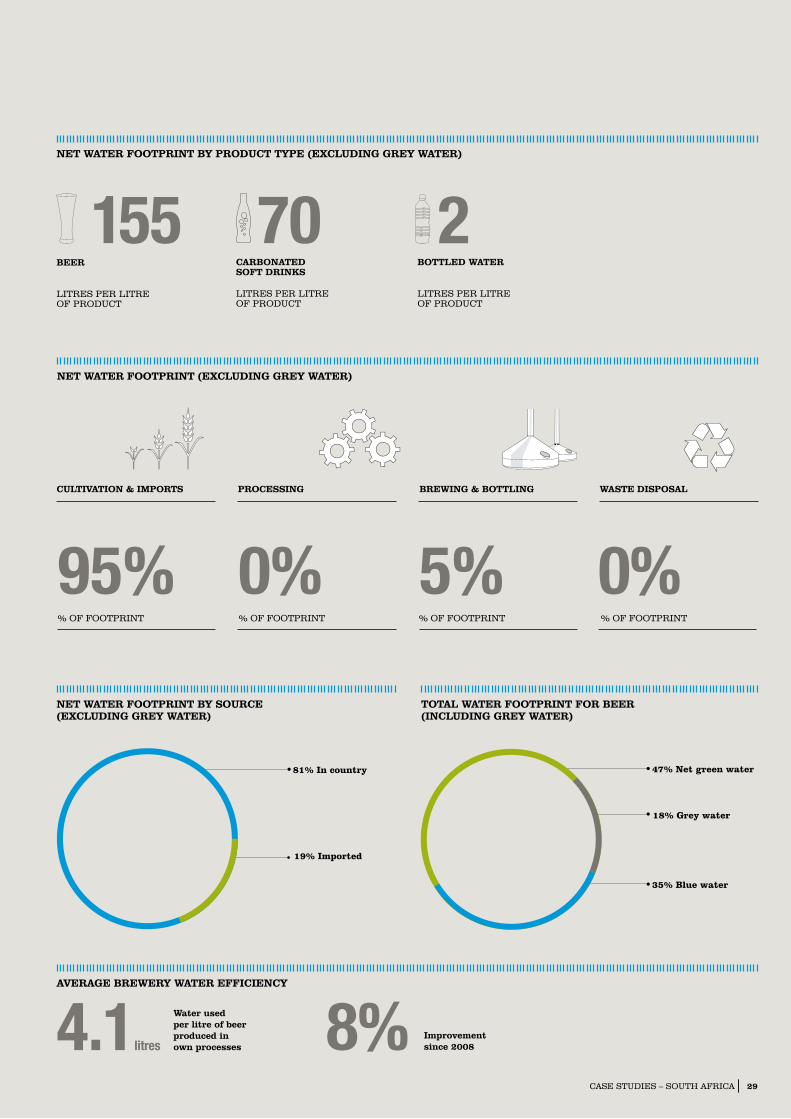
AveRAGe BReWeRY WATeR eFFiciencY
4.1litres
Water used per litre of beer produced in own processes 8% improvement
since 2008
TOTAL WATeR FOOTPRinT FOR BeeR (incLUDinG GReY WATeR)
47% Net green water
18% Grey water
35% Blue water
neT WATeR FOOTPRinT BY SOURce (excLUDinG GReY WATeR)
81% In country
19% Imported
neT WATeR FOOTPRinT (excLUDinG GReY WATeR)
% OF FOOtPriNt
95%% OF FOOtPriNt
0%% OF FOOtPriNt
5%% OF FOOtPriNt
0%
100%RECYCLED
neT WATeR FOOTPRinT BY PRODUcT TYPe (excLUDinG GReY WATeR)
BeeR
LitrEs PEr LitrE OF PrODuct
155cARBOnATeD SOFT DRinKS
LitrEs PEr LitrE OF PrODuct
70BOTTLeD WATeR
LitrEs PEr LitrE OF PrODuct
2
WASTe DiSPOSALBReWinG & BOTTLinGcULTivATiOn & iMPORTS PROceSSinG
29casE stuDiEs – sOutH aFrica
30
Why an update?in 2009, saBmiller and WWF published their first report on water footprinting. this included a detailed case study on water use in south africa. since then, there have been some minor changes to the method-ology and to the underlying data. With the formation of the Water Futures Partnership, saBmiller and WWF have taken the opportunity to update this footprint to ensure its consistency with others undertaken.
Water resources in South Africathere are significant regional differences in terms of water scarcity across south africa. some regions will become extremely water scarce by 2025 whereas a small number will remain abundant or sufficient. the parts of saBmiller’s supply chain exposed to the highest risk are sugar cane cultivation and processing, along with the Durban and Phoenix bottling plants in Natal where there is a significant deficit in water resource availability (which will also impact on the Prospecton brewery in the same area); the Polokwane brewery where there have been incidences of water supply loss; and the Newlands brewery where there exist significant water supply constraints in cape town.
the next level of risk is associated with the barley and hop farms at caledon respectively, where there are water resource deficits, and rosslyn brewery and midrand bottling plants which are in areas of low and declining resource availability.
SABMiller water footprint in South Africathe net water footprint for the south african value chain for 2008 is 511,100 million litres. this is very similar to the previous footprint undertaken per litre of beer produced (155 litres), indicating no substantial changes between 2007 and 2008.
the most significant components of the water footprint are green and blue water arising from the cultivation of raw crops from south africa and barley imported from the usa, France, australia and argentina and imported processed malt, hops and maize. together this accounted for 95% of the total water footprint. the next most significant element was water use in the brewing and bottling plants, accounting for 5% of the total.
the majority of the grey water footprint for beer arises from the cultivation of barley and yellow maize. if grey water were included, the water footprint would increase significantly:
• Beer footprint would rise from 155 litres to 171 litres per litre produced
• soft drinks footprint would rise from 70 litres to 109 litres per litre produced
• Bottled water, no change from 2 litres per litre produced
What has been done as a result?With increased focus on water issues by the south african government (see page 31), it is clear that the cost of water will rise as there is greater emphasis on demand management and the use of alternative, more expensive sources (e.g. desalinated water) becomes more prevalent. consequently, saB Ltd – saB miller’s south african subsidiary – will need to invest in its own infrastructure to limit water needs, through loss management and recycling. it has already made good progress as its water efficiency has improved by 8% over the past two years to an average water efficiency of 4.1 litres of water per litre of beer produced.
also, there will be pressure from other industries to reallocate irrigation water – currently used to cultivate raw materials for brewing – for industrial development. thus, saB Ltd will need to review the supply chain to reduce water use, such as through promoting better farm and irrigation practices to increase yield per unit of water.
saB Ltd is already working with WWF and the south african government’s Working for Water programme to pilot the ‘water neutral’ concept at water scarce breweries. the scheme allows saB Ltd to monitor and reduce its operational water consumption and then offset the residual by investing in projects that clear invasive vegetation to allow native species to flourish (which ultimately releases water back to the environ-ment). through the project 230 hectares of invasive trees have been cleared, saving an estimated 450 million litres of water and creating 24 jobs.
in addition, saB Ltd has revised its guidelines to farmers providing grains for brewing – in collabora-tion with WWF – to promote better farm management practice with regard to water use, and a pilot has been undertaken on drylands. a similar exercise is planned for irrigated farms. Once this has been completed this guidance will be rolled out to all the commercial farms as a sustainable grain farming framework.
5.4 South Africa
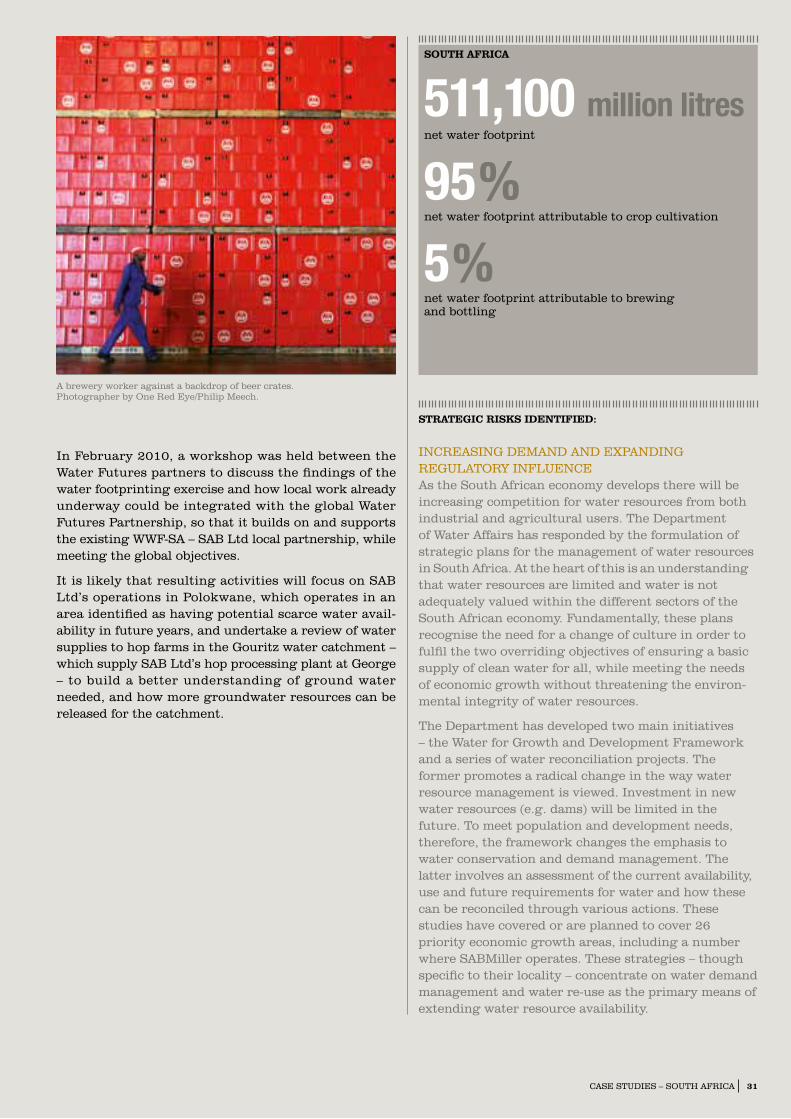
31casE stuDiEs – sOutH aFrica
in February 2010, a workshop was held between the Water Futures partners to discuss the findings of the water footprinting exercise and how local work already underway could be integrated with the global Water Futures Partnership, so that it builds on and supports the existing WWF-sa – saB Ltd local partnership, while meeting the global objectives.
it is likely that resulting activities will focus on saB Ltd’s operations in Polokwane, which operates in an area identified as having potential scarce water avail-ability in future years, and undertake a review of water supplies to hop farms in the Gouritz water catchment – which supply saB Ltd’s hop processing plant at George – to build a better understanding of ground water needed, and how more groundwater resources can be released for the catchment.
STRATeGic RiSKS iDenTiFieD:
iNcrEasiNG DEmaND aND ExPaNDiNG rEGuLatOry iNFLuENcEas the south african economy develops there will be increasing competition for water resources from both industrial and agricultural users. the Department of Water affairs has responded by the formulation of strategic plans for the management of water resources in south africa. at the heart of this is an understanding that water resources are limited and water is not adequately valued within the different sectors of the south african economy. Fundamentally, these plans recognise the need for a change of culture in order to fulfil the two overriding objectives of ensuring a basic supply of clean water for all, while meeting the needs of economic growth without threatening the environ-mental integrity of water resources.
the Department has developed two main initiatives – the Water for Growth and Development Framework and a series of water reconciliation projects. the former promotes a radical change in the way water resource management is viewed. investment in new water resources (e.g. dams) will be limited in the future. to meet population and development needs, therefore, the framework changes the emphasis to water conservation and demand management. the latter involves an assessment of the current availability, use and future requirements for water and how these can be reconciled through various actions. these studies have covered or are planned to cover 26 priority economic growth areas, including a number where saBmiller operates. these strategies – though specific to their locality – concentrate on water demand management and water re-use as the primary means of extending water resource availability.
a brewery worker against a backdrop of beer crates. Photographer by One red Eye/Philip meech.
SOUTh AFRicA
511,100 million litresnet water footprint
95 %net water footprint attributable to crop cultivation
5 %net water footprint attributable to brewing and bottling
6.0Lessons and implicationsthE siZE of a watEr footprint must bE rElatEd to watEr availability, Ecological sustainability and social issuEs in thE locality bEforE any mEaningful assEssmEnt of impact can bE madE. consEquEntly, simplE comparisons of thE siZE of a watEr footprint in onE country comparEd to anothEr may bE mislEading. howEvEr, thErE arE somE gEnEral lEssons that can bE rEachEd by rEviEwing and comparing thE findings from Each of thE four countriEs.
6.1 how do the footprints compare?the net water (excluding grey water) footprints for beer in the four countries range from 61 litres of water/litres of beer in Peru to 180 litre/litre in tanzania.
However, whilst there is little that can be concluded from the size of each water footprint, there are some observations that can be made:
• in all cases, the vast majority (over 90%) of water use relates to the cultivation of raw crops. However, there was some variation between countries in terms of how much of this water related to crops grown in-country and imported produce: for example, in Peru the bulk of the water footprint related to imported crops whereas in ukraine all the water used was attributable to crops grown there. there is an opportunity here for saBmiller to consider water risks in relation to strategic global procurement of agricultural commodities. the Partnership may address this in a future phase.
• the net crop cultivation water footprint (including crops grown in-country and imports) ranges from 164 litres of water in tanzania to 55 litres of water in Peru, despite almost all the crops used in beer production in Peru being imported. these differences are largely the result of the variation in crop water requirements caused by the different climatic conditions.
• in tanzania and ukraine, where crops are predom-inately rain fed, the green water footprint represents over 85% of the net water footprint (i.e. excluding grey water). However, for south africa and Peru the green water accounts for only 53% and 57% of the net water footprint respectively.
• the results of these water footprinting exercises show there is considerable difference in the contribu-tion that grey water makes to the overall footprint in each country. the level of grey water impact, which is particularly dependent upon fertiliser use and stan-dards adopted, has a considerable impact on the total water footprint in Peru (79%) and ukraine (84%).
32
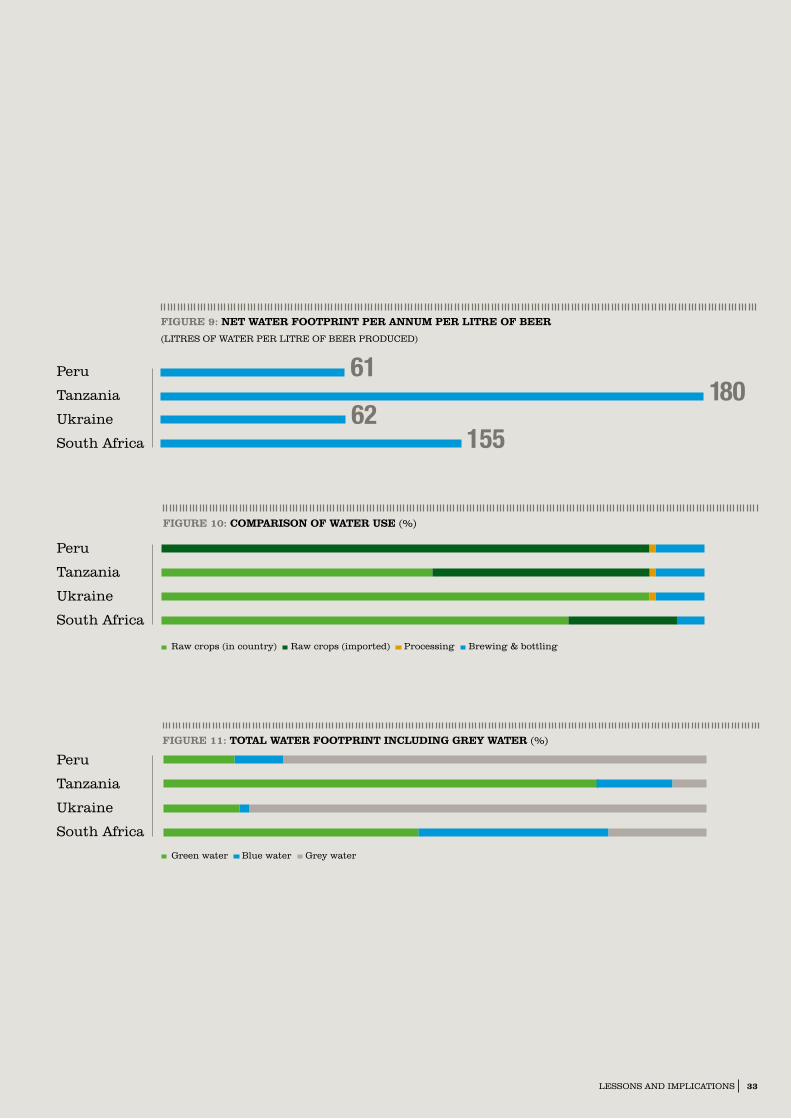
33LEssONs aND imPLicatiONs
FiGURe 9: neT WATeR FOOTPRinT PeR AnnUM PeR LiTRe OF BeeR
(LitrEs OF WatEr PEr LitrE OF BEEr PrODucED)
FiGURe 10: cOMPARiSOn OF WATeR USe (%)
raw crops (in country) raw crops (imported) Processing Brewing & bottling
Peru
tanzania
ukraine
south africa
FiGURe 11: TOTAL WATeR FOOTPRinT incLUDinG GReY WATeR (%)
Green water Blue water Grey water
Peru
tanzania
ukraine
south africa
Peru
tanzania
ukraine
south africa
61
62155
180
34
6.2 What does this mean?there are three major implications arising from the results of this research:
• First, this confirms that the largest part of our water footprint derives from crop cultivation – whether in the countries concerned or in those countries from which the crops are imported. Given that saBmiller only has a limited amount of control over how these crops are grown, attempts to reduce the size of the footprint (where it makes sense to do so based on an identification of the risks faced), will have to focus on influencing suppliers to adopt farming methods that are more water efficient and working with local and national governments and regulators to ensure that water resources are managed productively, equitably and – most crucially – sustainably.
• a further challenge is that in some countries – for example, tanzania – our supply chain comprises large numbers of small farmers who will require a much greater degree of support than larger-scale commercial producers. However, saBmiller has already identified the benefits of encouraging enter-prise development within its value chain for reasons over and above water. For example, sourcing raw materials locally can help to reduce costs – through lower import duties and having a shorter distribution chain – whilst contributing to the incomes of these smallholders and their communities to help alleviate poverty and encourage agricultural development.
• in tanzania, saBmiller has undertaken a project to evaluate the commercial viability of the local produc-tion of substantial quantities of barley crops grown by local farmers. currently, these farmers are only able to produce 10% of the breweries’ requirements and the business aims to increase the figure to 50% by 2011 through a partnership of commercial farmers and 700 smallholders converting from subsistence farming. this includes offering a number of exten-sion services to ensure adequate yields and good quality grains and advice on efficient water use and crop cultivation.
• secondly, the quantification of the grey water footprint remains problematic partly because the methodology remains in the early stages of devel-opment but also because access to robust data is difficult and requires considerable investment in time and resources.
• However, even allowing for these limitations it is clear that, in some places (in this case Peru and ukraine), grey water constitutes the overwhelming percentage of a ‘total’ footprint and places a very considerable burden on existing infrastructure and local ecosystems. this variation is something that had not been observed during previous water footprinting exercises undertaken in south africa and the czech republic in 2008 by saBmiller and WWF. this insight suggests that agricultural prac-tices within a region have a potentially far greater impact than previously thought, particularly in relation to the degradation of existing good quality water supplies. We will continue to develop our understanding of grey water and, more importantly, identify ways in which its impacts can be mitigated more effectively than they are currently. there are relevant lessons which we can learn from other initiatives such as those by WWF and other part-ners to introduce ‘Better management Practices’ for the cultivation of cotton and sugar cane in india and Pakistan.
• thirdly, in a number of locations – such as Lima (Peru), Dar es salaam (tanzania) and Donetsk (ukraine) – the water risks saBmiller and local communities face are immediate and significant. One of the themes running through this report is that the impacts of water availability – or scarcity – are most acutely felt at a local level but often the solutions require national or even international responses. Faced by a combination of climate change, poorly managed infrastructure and popu-lation growth, no business – of whatever scale – can successfully respond to this challenge alone. instead, these issues have to be addressed collab-oratively and in ways that attract the support of all relevant stakeholders. there may be an important role for the Water Futures partners in stimulating this process.
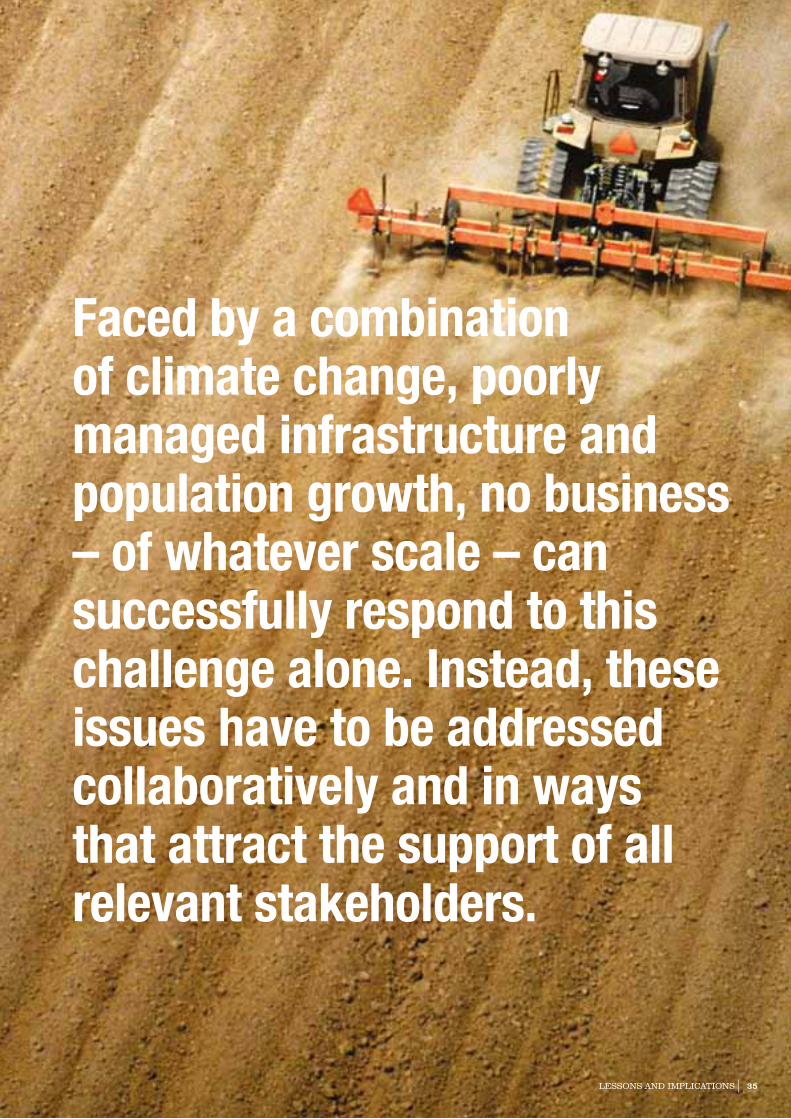
35LEssONs aND imPLicatiONs
Faced by a combination of climate change, poorly managed infrastructure and population growth, no business – of whatever scale – can successfully respond to this challenge alone. Instead, these issues have to be addressed collaboratively and in ways that attract the support of all relevant stakeholders.
36
7.0Securing our water futuredEtErmining a watEr footprint is only onE of thE Early stEps in addrEssing watEr risks and impacts. it is a stEpping stonE for prioritisation and action.
7.1 Realising the value of partnershipthe work that has been undertaken by the Water Futures partnership since its inception has provided a valuable insight into the water-related risks facing a number of saBmiller operations. it is clear that unlike, for example, carbon footprinting, where the size of the footprint is in direct proportion to the impact on climate change, it is impossible to infer anything about the water impact based simply on the size of the water footprint itself.
the most important aspect of this approach is the ability to unlock the significant issues that are facing an area using a robust and quantitative technique that shows where effort should be focused. a water footprint is a tool – a step in a long term campaign to understand and address significant water issues in areas at risk. it is this campaign that we, as a partnership, are now embarking on.
it is also an awareness raising tool, but only within a model of engagement that includes a variety of stake-holders in the area of concern. through the Water Futures partnership, we have been able to begin to convene these groups and the process of working together to learn what is already ongoing in the watershed and address the issues highlighted through footprinting work. it is this process of translating theory into practice that will make a change in those communities that really need it.
However, we recognise that many of the issues that are faced by the communities in which we work cannot be resolved quickly or easily. Water is highly political: it crosses boundaries and regions and, whilst the impacts of water scarcity may be felt at a very local level, they often require national (or even regional) solutions. through the Water Futures Partnership we hope to influence thinking where we can and engage with
policy and decision makers at a senior level and create the right arguments, incentives and awareness around critical water issues to improve its management for all.
7.2 The future of Water Futuresthrough the Water Futures Partnership we are aiming to push the boundaries of what has previously been achieved in corporate water stewardship. through our work to identify and understand the water risks – and challenges – faced by saBmiller and its surrounding communities, we aim to demonstrate how a global company can utilise innovative partnerships to reduce shared water risks, by promoting better watershed management and the conservation of freshwater eco-systems.
the Water Futures partnership is making good prog-ress in achieving this aim. However, we also recognise that whilst each of the partners shares this goal, each has a differing perspective and motives for addressing water issues in this way. it is arguably in these differ-ences in approach and philosophy that the strength of this alliance lies as the partners work together to share skills, expertise and points of view to address chal-lenges that arise. all partners agree that the only way we can mitigate the current and future challenges we all face is by working collaboratively.
Over the coming months the partnership will continue to engage with local stakeholders in Peru, tanzania, ukraine and south africa and work with them to iden-tify solutions to the issues identified through the water footprints presented in this report. We recognise that this is but a next step in a long term process, but it is one which may provide benefits many times greater, if through working together, we are able to secure a water future for those areas most at risk.

About SABMiller plc: One of the world’s largest brewers, SABMiller has brewing interests and distribution agreements across six continents. Our wide portfolio of brands includes premium international beers such as Pilsner Urquell, Peroni Nastro Azzurro, Miller Genuine Draft and Grolsch along with leading local brands such as Aguila, Castle, Miller Lite, Snow and Tyskie. We are also one of the world’s largest bottlers of Coca-Cola products. In 2010 our group revenue was US$26,350 million with lager production of 213 million hectolitres.
About WWF-UK: We’re the world’s leading independent conservation organisation. We’re creating solutions to the most serious conservation challenges facing the planet, building a future where people and nature thrive together. The sustainable use of fresh water is one such challenge – so we develop concepts, tools and approaches for the private sector that address business risk through better stewardship of water resources.
Deutsche Gesellschaft für Technische Zusammenarbeit (GTZ) GmbH: The federally owned GTZ, an international co-operation enterprise for sustainable development with worldwide operations, supports the German government in achieving its development objectives. GTZ provides viable, forward-looking solutions for political, economic, ecological and social development in a globalised world. Sometimes working under difficult conditions, GTZ promotes complex reforms and change processes. Its corporate objective is to improve people’s living conditions on a sustainable basis.
About this report: While this document has been co-authored and jointly released by SABMiller plc, WWF-UK and GTZ, this does not imply that the organisations approve of, or support, the activities and/or views that the others may have on other issues outside the scope of this report.
Note on data: Data included within this report relates to 2008/09, with the exception of ‘key facts’ information for each country case study, which presents current operations and estimates of market size.
CoNTeNTS
exeCUTive SUMMAry 01
1.0 PreFACe: WorKiNG ToGeTHer For A SeCUre WATer FUTUre 02
1.1 Water is a valuable resource 021.2 A global problem which needs local solutions 02 1.3 Taking an innovative partnership approach 02 1.4 Using a holistic and robust methodology 03 1.5 A shared commitment and vision 03
2.0 WATer: SHAreD riSKS iN THe 21ST CeNTUry 04
2.1 Understanding the issues 042.2 Recognising the shared risks 042.3 SABMiller’s approach to water management 052.4 WWF’s strategy to conserve and protect water resources 06 2.5 GTZ: meeting policy and development goals 06
3.0 ColleCTive SolUTioNS: THe WATer FUTUreS PArTNerSHiP 08
3.1 A history of collaboration on water issues 08 3.2 Water Futures: a 21st century partnership 083.3 What is the Partnership doing? 09
4.0 AN evolviNG MeTHoDoloGy 10
4.1 Recap: what is water footprinting? 104.2 An evolving and transparent methodology 12 4.3 Translating theory into action: the risks
of water footprints 13
5.0 CASe STUDieS 15
5.1 Peru 165.2 Tanzania 205.3 Ukraine 245.4 South Africa 28
6.0 leSSoNS AND iMPliCATioNS 32
6.1 How do the footprints compare? 326.2 What does this mean? 34
7.0 SeCUriNG oUr WATer FUTUre 36
7.1 Realising the value of partnership 367.2 The future of Water Futures 36

Water FuturesWorking together For a secure Water Future
Water Futures PartnershiP: Working together For a secure Water Future
Front cover: Synevir Lake, Ukraine Photography by Igor Koltun.
This report is printed on Revive Pure White Offset which is 100% recycled content from post-consumer waste, by an FSC and ISO 14001 accredited printer.
Design & production: JohnstonWorkswww.johnstonworks.com
SABMiller plcSABMiller HouseChurch Street WestWoking Surrey GU21 6HS England
+44 (0)1483 264 000www.sabmiller.com
WWF–UKPanda House Weyside ParkGodalmingSurrey GU7 1XR England
+44 (0)1483 426 444www.wwf.org.uk
WA
TE
R F
UT
UR
ES
– Work
ing
togeth
er for a secure w
ater futu
re
Related Documents