WATER FOOTPRINT OF COASTAL TOURISM FACILITIES IN SMALL ISLAND DEVELOPING STATES: A CASE-STUDY OF A BEACH RESORT IN THE MALDIVES by Miguel Orellana Lazo A THESIS SUBMITTED IN PARTIAL FULFILLMENT OF THE REQUIREMENTS FOR THE DEGREE OF MASTER OF ADVANCED STUDIES IN LANDSCAPE ARCHITECTURE in The Faculty of Graduate Studies (Landscape Architecture) THE UNIVERSITY OF BRITISH COLUMBIA (Vancouver) August 2013 © Miguel Orellana Lazo, 2013

Welcome message from author
This document is posted to help you gain knowledge. Please leave a comment to let me know what you think about it! Share it to your friends and learn new things together.
Transcript

WATER FOOTPRINT OF COASTAL TOURISM FACILITIESIN SMALL ISLAND DEVELOPING STATES:
A CASE-STUDY OF A BEACH RESORT IN THE MALDIVES
by
Miguel Orellana Lazo
A THESIS SUBMITTED IN PARTIAL FULFILLMENT OFTHE REQUIREMENTS FOR THE DEGREE OF
MASTER OF ADVANCED STUDIES IN LANDSCAPE ARCHITECTURE
in
The Faculty of Graduate Studies
(Landscape Architecture)
THE UNIVERSITY OF BRITISH COLUMBIA
(Vancouver)
August 2013
© Miguel Orellana Lazo, 2013

ii
Abstract
Research on climate change indicates that the risk of water scarcity at many remote tourist destinations
will increase in the next few decades. Tourism development puts strong pressure on freshwater resources,
the availability of which is especially limited in remote areas. At locations with no access to conventional
water sources, tourism facilities require supply alternatives, such as desalinated or imported water, which
implies elevated energy demands and carbon emissions. In this context, a shift in the way freshwater use
is assessed is crucial for moving toward a more sustainable model of water management for tourism
development. This research adapts the Water Footprint framework to the design of tourism facilities and
explains how and why this is a promising model for water accounting in isolated locations. Defined as 'an
indicator of freshwater resources appropriation', the Water Footprint concept was introduced by Hoekstra
in 2002. This methodology goes beyond the conventional direct water use assessment model, upon
which most common benchmarking systems in sustainable tourism are based. Measuring the water
footprint of a tourism facility allows operators and design teams to understand the environmental and
socio-economic impacts associated with its direct and indirect water uses. Furthermore, this methodology
enables a holistic consideration of all the water system components: supply, demand, and wastewater.
Based on this framework, this thesis presents a Water Footprint Design Tool (Tool) for designers to use in
the early stages of design. This Tool enables design teams to run various scenarios and understand how
different water system designs can impact the footprint of a project. A case-study of a beach resort in the
Maldives illustrates the application of the Tool in a specific context. The results showed that significant
desalinated water footprint reductions (75.5%, 80.6% and 95.5%, depending on the precipitation year)
could be achieved through the application of a series of water-saving strategies. Finally, this research
introduces a three-scale process to be applied in new tourism development operations. This framework
allows designers to easily identify which areas need improvement in order to achieve more ambitious
water goals that would help make tourism development more sustainable in the future.

iii
Preface
This thesis is an original intellectual product of the author, M. Orellana. The case-study reported in Chapter
5 was covered by UBC Behavioral Ethics Certificate number H12-01373.

iv
Abstract ........................................................................................................................................................ ii
Preface ........................................................................................................................................................ iii
Table of Contents ........................................................................................................................................ iv
List of Tables ................................................................................................................................................vii
List of Figures .............................................................................................................................................viii
Acknowledgements .....................................................................................................................................xii
1 INTRODUCTION
WATER AND TOURISM DEVELOPMENT IN SMALL ISLAND DEVELOPING STATES ................................1
1.1 Problem Statement ...............................................................................................................................2
1.2 Research Questions ............................................................................................................................10
1.3 Goal and Scope of the Study ..............................................................................................................10
1.4 Methodology Overview .......................................................................................................................11
2 REDEFINING WATER GOALS
CORPORATE WATER ACCOUNTING AND THE WATER FOOTPRINT METHODOLOGY ........................13
2.1 Literature Review .................................................................................................................................14
2.2 Application to Tourism in SIDS ............................................................................................................16
2.2.1 Water Footprint Types Redefinition .............................................................................................16
2.2.2 Risks and Impacts Overview ......................................................................................................20
2.3 Net-Zero Water Scenario Definition .....................................................................................................24
3 WATER-RELATED DESIGN STRATEGIES
TAKING WATER STRATEGIES TO THE NEXT LEVEL ................................................................................27
3.1 Freshwater Supply Alternatives ...........................................................................................................28
3.1.1 Rainwater Harvesting ...................................................................................................................28
3.2 Demand Reduction .............................................................................................................................33
3.2.1 Wastewater Recycling ..................................................................................................................33
3.2.2 Improved Efficiency .....................................................................................................................36
3.2.3 Improved Behaviour .....................................................................................................................40
3.3 Precedent Study. CIRS Building ..........................................................................................................43
Table of Contents

v
4 WATER FOOTPRINT DESIGN TOOL
CALCULATING THE WATER FOOTPRINT OF A BEACH RESORT ...........................................................48
4.1 Water Footprint Design Tool Components ..........................................................................................49
4.2 Methodology .......................................................................................................................................53
4.2.1 Rainwater Harvesting ..................................................................................................................53
4.2.2 Wastewater Recycling .................................................................................................................56
4.2.3 Efficient Devices and User Behaviour Improvement ..................................................................57
4.3 Scenario Definition ..............................................................................................................................57
4.4 Tool Transferability ...............................................................................................................................59
5 CASE-STUDY
DESTINATION: MALDIVES .........................................................................................................................61
5.1.1 Selection Criteria .........................................................................................................................62
5.1.2 Case-Study Selection .................................................................................................................62
5.2 Maldives Context Definition .................................................................................................................63
5.3 Soneva Resort .....................................................................................................................................67
5.3.1 General Information ....................................................................................................................67
5.3.2 Resort Description ......................................................................................................................68
5.3.3 Water-Use Pattern .......................................................................................................................70
5.3.4 Results ........................................................................................................................................72
5.4 Achievability of the Net-Zero Water Scenario .......................................................................................75
6 DESIGNING A NET-ZERO WATER RESORT
ACHIEVING AMBITIOUS WATER GOALS AT NEW RESORT DEVELOPMENTS .......................................79
6.1 Net-Zero Water Goal Review ................................................................................................................80
6.2 Design Process for Achieving the Net-Zero Water Goal at New Resort Developments .....................82
6.2.1 Geographical Scale ....................................................................................................................83
6.2.2 System Scale ..............................................................................................................................86
6.2.3 Device Scale ...............................................................................................................................88
6.3 Design Process Summary ..................................................................................................................98

vi
7 CONCLUSIONS
7.1 Thesis Overview ................................................................................................................................101
7.2 Overall Significance ...........................................................................................................................102
7.3 Limitations .........................................................................................................................................103
7.4 Future Research Opportunities .........................................................................................................105
References ...............................................................................................................................................107
Appendix A: Precipitation data for Malé, Maldives ..................................................................................117
Appendix B: Water Footprint Design Tool Results for Case-study ..........................................................119

vii
List of Tables
Table 1.1. Tourism as part of exports of goods and services in 2000 by country group .............................3
Table. 2.1. Summary of impacts associated with the different water footprint types of a beach resort. ...21
Table. 2.2. Summary of risks associated with the different water footprint types of a beach resort. ........22
Table. 3.1. Runoff coefficient for the most common roofing materials ......................................................30
Table. 3.2. Wastewater reuse potential observed in different studies ........................................................34
Table. 3.3. Water saving potential through improved efficiency observed in different studies .................37
Table. 3.4. UPC and IPC standards for plumbing fixture water use ..........................................................38
Table 4.1. Scenario summary. ....................................................................................................................59
Table 5.1. Room water-use distribution for 5 hotels in Perth, Australia ......................................................71
Table 5.2. Summary of the results obtained for the case-study ................................................................72
Table 5.3. Volumetric reliability for scenarios #2A, #2B and #2C ............................................................75
Table 6.1. List of indicators for the assessment of different potential water supply sources ....................85
Table 6.2. Design variables affecting the rainwater harvesting system .....................................................90
Table. 6.3. Runoff coefficient for the most common roofing materials ......................................................92
Table. 6.4. Design variables affecting the wastewater recycling system.. .................................................94
Table A.1. Daily precipitation for Hulhule (Malé) in Maldives between 2001 and 2010 ...........................117
Table A.2. Monthly average, maximum and minimum precipitation values for Hulhule (Malé) in Maldives between 2001 and 2010 .......................................................................................................118
Table A.3. Average number of days with different minimum precipitation values for Hulhule (Malé) in Maldives and Vancouver, BC ....................................................................................................118
Table B.1. Monthly water footprint components for scenario #0 ............................................................119
Table B.2. Monthly water footprint components for scenario #1A ..........................................................120
Table B.3. Monthly water footprint components for scenario #1B ..........................................................121
Table B.4. Monthly water footprint components for scenario #1C ..........................................................122
Table B.5. Monthly water footprint components for scenario #2A ..........................................................123
Table B.6. Monthly water footprint components for scenario #2B ..........................................................124
Table B.7. Monthly water footprint components for scenario #2C ..........................................................125

viii
List of Figures
Fig. 1.1. Travel and tourism contribution to GDP. .........................................................................................2
Fig. 1.2. International tourist arrivals by region ............................................................................................2
Fig. 1.3. Small island developing states map ..............................................................................................3
Fig. 1.4. Environmental Vulnerability Index for 33 SIDS ...............................................................................4
Fig. 1.5. International tourism receipts as percentage of total exports and GDP (2007). ...........................5
Fig. 1.6. Renewable internal freshwater resource ........................................................................................5
Fig. 1.7. Average water consumption by use in guest houses and hotels in Zanzibar ...............................6
Fig. 1.8. GreenGlobe logo ...........................................................................................................................9
Fig. 1.9. Thesis methodology diagram ......................................................................................................11
Fig. 2.1. Water footprint components ........................................................................................................15
Fig. 2.2. Total water footprint of an average tourist in the Liming Valley, China .........................................17
Fig. 2.3. Water footprint types for an agricultural product .........................................................................18
Fig. 2.4. Proposed water footprint types for a building..............................................................................19
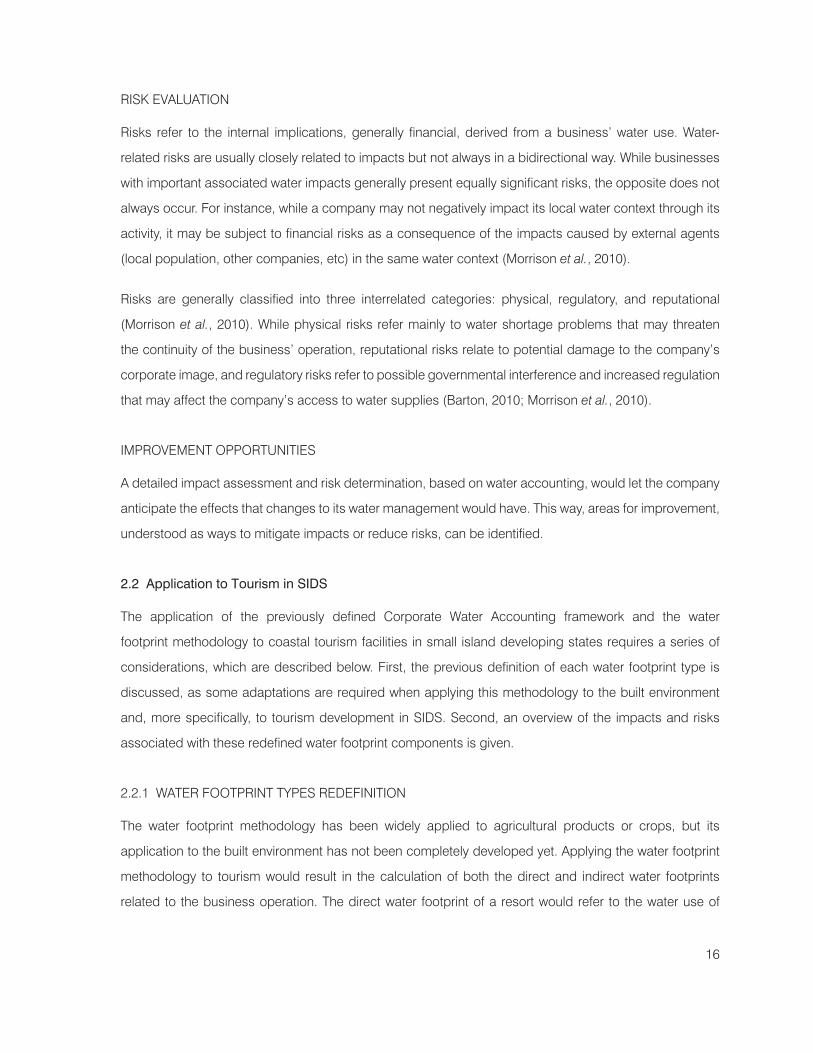
Fig. 2.5. Proposed water footprint types for a beach resort. .....................................................................20
Fig. 3.1. Rainwater harvesting system. Grand Canyon National Park. ......................................................28
Fig. 3.2. Average monthly rainfall (mm) in Vancouver, BC. ........................................................................29
Fig. 3.3. Average monthly rainfall (mm) in Malé, Maldives. .......................................................................29
Fig. 3.4. Thatched roof in Hungary, detail ..................................................................................................32
Fig. 3.5. Norðragøta, Faroe Islands ...........................................................................................................32
Fig. 3.6. Lakota MS PV array ......................................................................................................................32
Fig. 3.7. Red tile roof repair ........................................................................................................................32
Fig. 3.8. Wastewater ...................................................................................................................................33
Fig. 3.9. Irrigation dripper ...........................................................................................................................39
Fig. 3.10. A picture of a sprinkler watering a lawn .....................................................................................39
Fig. 3.11. Daily towel-changing card .........................................................................................................41
Fig. 3.12. Shower use instructions. Hotsprings Valley Retreat. Yukon, Canada........................................41
Fig. 3.13. The structure of a trigger ............................................................................................................42
Fig. 3.14. CIRS Building, UBC ...................................................................................................................43
Fig. 3.15. Green roof. CIRS Building, UBC ................................................................................................44
Fig. 3.16. Rainwater harvesting system. CIRS Building, UBC ...................................................................45
Fig. 3.17. Aerobic tanks. Solar Aquatics SystemTM. CIRS Building, UBC ..................................................46
Fig. 3.18. Gravity clarifiers. Solar Aquatics SystemTM. CIRS Building, UBC ..............................................46
Fig. 3.19. Building entrance. CIRS Building, UBC Vancouver campus, Canada. .....................................47

ix
Fig. 4.1. Water Footprint Design Tool. Page 1: Set of columns for water-use data ...................................49
Fig. 4.2. Water Footprint Design Tool. Page 1: Set of columns for rainwater harvesting ..........................50
Fig. 4.3. Water Footprint Design Tool. Page 1: Set of columns for water conservation ............................50
Fig. 4.4. Water Footprint Design Tool. Page 1: Set of columns for water conservation ............................50
Fig. 4.5. Water Footprint Design Tool. Page 1: Set of columns for wastewater recycling .........................50
Fig. 4.6. Water Footprint Design Tool. Page 1: Set of columns for water footprints ..................................51
Fig. 4.7. Water Footprint Design Tool. Page 2: Control panel ....................................................................52
Fig. 4.8. Water Footprint Design Tool. Page 2: Graphic result representation ..........................................53
Fig. 4.9. Illustration of the behavioural analysis method for the rainwater harvesting system ..................54
Fig. 4.10. Illustration of the calculation method for wastewater recycling .................................................56
Fig. 4.11. Scenario #0. Current state ........................................................................................................57
Fig. 4.12. Scenario #1. Conventional strategies .......................................................................................58
Fig. 4.13. Scenario #2. All strategies .........................................................................................................58
Fig. 5.1. Maldives location .........................................................................................................................63
Fig. 5.2. Maldives map ...............................................................................................................................63
Fig. 5.3. Aerial view of Malé... ....................................................................................................................63
Fig. 5.4. Aerial view of Thinadhoo island ...................................................................................................63
Fig. 5.5. Monthly average maximum and minimum temperatures for Malé, Maldives .............................64
Fig. 5.6. Monthly average precipitation for Malé, Maldives .......................................................................64
Fig. 5.7. Bed distribution per accommodation type in 2010 .....................................................................65
Fig. 5.8. Villingili Resort & Spa in Maldives ................................................................................................65
Fig. 5.9. Nolhivaram Kulhi (lake), H.Dh. Nolhivaram, Maldives .................................................................66
Fig. 5.10. Countries with largest population shares in the low elevation coastal zone .............................66
Fig. 5.11. Soneva resort, Kunfunadhoo island aerial view .........................................................................67
Fig. 5.12. Soneva resort map .....................................................................................................................68
Fig. 5.13. Soneva resort, aerial view ..........................................................................................................68
Fig. 5.14. Soneva resort villa, outdoor view ...............................................................................................68
Fig. 5.15. Soneva resort villa, outdoor view ...............................................................................................68
Fig. 5.16. Soneva resort, photovoltaic plant ..............................................................................................69
Fig. 5.17. Soneva resort, deep sea water cooling system .........................................................................69
Fig. 5.18. Water-use distribution at Soneva resort in 2010 ........................................................................70
Fig. 5.19. Water-use distribution at Soneva resort in 2010 after applying distribution coefficients. ..........72
Fig. 5.20. Water Footprint Design Tool results for scenarios #1A and #1C .............................................73
Fig. 5.21. Water Footprint Design Tool results for scenario #1B ...............................................................73
Fig. 5.22. Water Footprint Design Tool results for scenario #2A. ..............................................................74

x
Fig. 5.23. Water Footprint Design Tool results for scenario #2B ...............................................................74
Fig. 5.24. Water Footprint Design Tool results for scenario #2C...............................................................74
Fig. 5.25. Net-zero water achievability study with no additional demand reduction .................................76
Fig. 5.26. Net-zero water achievability study with 20% additional demand reduction ..............................77
Fig. 5.27. Net-zero water achievability study with 40% additional demand reduction ..............................77
Fig. 6.1. Adaptability diagram ....................................................................................................................81
Fig. 6.2. Three-step design process diagram............................................................................................82
Fig. 6.3. Three-scale process. Units of analysis ........................................................................................83
Fig. 6.4. Soneva resort, Kunfunadhoo island aerial view ...........................................................................83
Fig. 6.5. Manu Island, Fiji ...........................................................................................................................83
Fig. 6.6. English Bay, Vancouver, BC .........................................................................................................83
Fig. 6.7. Adams River watershed map .......................................................................................................83
Fig. 6.8. Program definition diagram .........................................................................................................86
Fig. 6.9. Soneva resort, Kunfunadhoo island aerial view ...........................................................................87
Fig. 6.10. Bahia Principe Resort in Jamaica ..............................................................................................87
Fig. 6.11. Bellagio in Las Vegas .................................................................................................................87
Fig. 6.12. From conventional to closed-loop water systems .....................................................................88
Fig. 6.13. Water strategies. Optimization diagram ....................................................................................89
Fig. 6.14. Water Footprint Design Tool. Page 2: Control panel ..................................................................90
Fig. 6.15. Surface types for catchment areas of rainwater harvesting systems ........................................91
Fig. 6.16. Catchment area variations for rainwater harvesting systems ....................................................91
Fig. 6.17. Roof geometry variations for rainwater harvesting systems ......................................................92
Fig. 6.18. Types of storage tanks for rainwater harvesting systems ..........................................................93
Fig. 6.19. Storage volume variations for rainwater harvesting systems ....................................................93
Fig. 6.20. Storage tank location variations for rainwater harvesting systems ...........................................94
Fig. 6.21. On-site vs. off-site wastewater recycling systems .....................................................................95
Fig. 6.22. Extensive vs. intensive wastewater treatment. ...........................................................................95
Fig. 6.23. Independent vs. reclaiming wastewater recycling systems ......................................................95
Fig. 6.24. Design variables affecting the transparency of the different water-related strategies ..............96
Fig. 6.25. James I Swenson Civil Engineering Building, Duluth. Ross Barney Architects ........................97
Fig. 6.26. James I Swenson Civil Engineering Building, Duluth. Ross Barney Architects ........................97
Fig. 6.27. Omega Center for Sustainable Living in Rhinebeck, New York .................................................97
Fig. 6.28. Omega Center Eco Machine in Rhinebeck, New York ..............................................................98
Fig. 6.29. Adam Joseph Lewis Center at Oberlin College in Ohio ............................................................98
Fig. 6.30. Real-time water consumption monitoring device ......................................................................98

xi
Fig. 6.31. Multidisciplinary process diagram .............................................................................................99
Fig. 6.32. Multi-stakeholder process diagram .........................................................................................100
Fig. A.1. Comparison of annual number of days with different minimum precipitation values between Hulhule (Malé) in Maldives and Vancouver, BC .......................................................................................118
Fig. A.2. Comparison of monthly number of days with precipitation between Hulhule (Malé) in Maldives and Vancouver, BC ...................................................................................................................118
Fig. B.1. Control panel configuration for scenario #0 .............................................................................119
Fig. B.2. Monthly water footprint components for scenario #0 ...............................................................119
Fig. B.3. Control panel configuration for scenario #1A ...........................................................................120
Fig. B.4. Monthly water footprint components for scenario #1A ............................................................120
Fig. B.5. Control panel configuration for scenario #1B ...........................................................................121
Fig. B.6. Monthly water footprint components for scenario #1B ............................................................121
Fig. B.7. Control panel configuration for scenario #1C ...........................................................................122
Fig. B.8. Monthly water footprint components for scenario #1C ............................................................122
Fig. B.9. Control panel configuration for scenario #2A ...........................................................................123
Fig. B.10. Monthly water footprint components for scenario #2A ..........................................................123
Fig. B.11. Control panel configuration for scenario #2B .........................................................................124
Fig. B.12. Monthly water footprint components for scenario #2B ..........................................................124
Fig. B.13. Control panel configuration for scenario #2C .........................................................................125
Fig. B.14. Monthly water footprint components for scenario #2C ..........................................................125

xii
Acknowledgements
I would like to thank my thesis advisor, Cynthia Girling, for her continuous guidance and help in taking
this research to its final result. Her warm welcome when I first arrived at UBC, the opportunity to assist her
in teaching and her continuous feedback on my thesis made of these two years a more than enjoyable
learning experience.
I also want to thank Hans Schreier and Peter Williams for being part of my thesis committee. This work
would have not been possible without their contributions.
Special thanks to UBC SALA faculty members Ray Cole, Ron Kellett, Daniel Millette and Daniel Roehr for
their interest in my project and their feedback on it.
Thanks as well to Lara Kesterton from Soneva for accepting to participate in this study and provide all the
required information.
I want to thank Obra Social La Caixa for their economic support during these two years.
I would also like to thank those friends who made life at the office in Ponderosa much easier. I will always
remember morning coffees and puzzle times with Bufalo, multi-language conversations and swimming
times with Jurek, Paula’s feedback for every presentation I gave, and brainstorming sessions with Pepa.
Finally, thanks to my friends and family for their support in the distance, especially to my admirable sister,
Lupe, for asking me constantly about my thesis, and also to my wonderful niece, Carmen, for unwittingly
making me laugh every Sunday.

1
1 INTRODUCTION
WATER AND TOURISM DEVELOPMENT IN SMALL ISLAND DEVELOPING STATES
The expected growth in tourist arrivals (UNWTO, 2000) and research on climate change indicate that the
risk of water scarcity at many destinations will increase in the next decades (IPCC, 2007). The problem
becomes extreme in very small islands, whose surface area impedes the existence of surface water
streams (Kerr, 2005) and makes groundwater bodies vulnerable to seawater intrusion (Kim et al., 2003).
In addition, beach resorts, typical of these locations, offer numerous water-intense services making their
water demand higher when compared with other tourism segments (Pigram, 2001). These conditions make
of desalination the only alternative of water supply for these tourism facilities, which results in increased
energy demands and carbon emissions (Anderson, 2009). In this context, a shift in the role that water
management plays into the design of resorts in very small island destinations is crucial for moving toward
more sustainable forms of tourism development. At these destinations, the most challenging water-related
goals need to be incorporated into the design of tourism facilities. This chapter explains this problem in
detail and proposes the research questions that are addressed in this thesis. The goal and scope of the
study are also defined. Finally, the methodology applied in the following chapters is described.

2
1.1 Problem Statement
Tourism has rapidly grown in the last decades and has become one of the largest businesses in the world
(Perera, Hirsch, & Fries, 2003) (Fig. 1.1). Today, it is one of the top five export categories for more than
83% of countries worldwide and the main source of foreign exchange earnings for more than 38% of them
(UNEP cited in Dodds & Kuehnel, 2010). The number of tourist arrivals is estimated to keep increasing in
the following years (Fig. 1.2). According to United Nations World Tourism Organization (UNWTO) Tourism
Vision 2020, international arrivals will be 1561 million in 2020, compared to 565 million in 1995, with an
average growth rate of 4.1% between these two years (UNWTO, 2012b). Despite the potential of this industry
for generating economic prosperity and employment worldwide, this rapid growth has also produced a
heavy burden on local environments, uncontrolled tourism being a threaten for many of the most sensitive
areas of the planet (Perera et al., 2003). Also, due to the intensity of the tourism activity, which often takes
place in a limited geographical area, its environmental consequences are more immediately evident (Miller,
2003 cited in Williams & Ponsford, 2009). But the tourism industry, if developed responsibly, can also bring
benefits to the communities where it takes place, such as employment opportunities, infrastructure or
help to preserve the local environment (Dodds & Kuehnel, 2010). In order to avoid the negative effects of
tourism activity and maximize its benefits, a more responsible planning and development is necessary.
TOURISM IN DEVELOPING COUNTRIES
Developing countries present a higher economic dependence on the hospitality industry than developed
states (Table. 1.1). An excessive dependence on the income generated by tourism activity can lead
to prioritizing profit maximization over social and environmental concerns (Carbone, 2005). In order to
attract foreign investors, regulations are not always enforced and environmental protection becomes a
secondary priority and just a voluntary option for owners and operators (Gössling, 2000), whose role
becomes fundamental in reducing the negative impacts of tourism development (Mowforth & Munt, 2008).
Regulation is nevertheless necessary due to the lack of capacity of individual companies to induce change
by themselves (Forsyth, 1997) and local authorities appear as the best placed agents to manage tourism
Fig. 1.1. Travel and tourism contribution to GDP. Source: WTTC, 2012. Fig. 1.2. International tourist arrivals by region. ©UNWTO 9284403613 .

3
Country grouping Travel as % of total exports in services Travel as % of total exports in goods & services
OECD 28.1% 5.9%
EU 28.6% 6.3%
Developing countries 43.3% 6.5%
Least Developed Countries 70.6% 15.3%
at a destination and contribute to a more responsible development (UNEP & ICLEI, 2003 cited in Dodds
& Butler, 2010).
But a lack of regulation is not the only problem that developing countries present for protecting the
environment from tourism development. The very few destinations that have established policies aimed
at preventing overdevelopment have generally found it difficult to implement them due to the problems
associated with the hospitality business, such as the “often unreliable tourism growth predictions and
the short-term view of operators within the tourism industry” (Dodds & Butler, 2010, p. 37). Moreover,
developing regions do not always have the necessary expertise and/or commitment to applying either
incentives or sanctions that promote resource conservation (Pigram, 2001). Furthermore, measures that
aim to protect the environment are generally too expensive or require such long consultation processes
that they lead to a substantial loss of revenue (Carbone, 2005). However, this point of view is focused
only on the economic benefit that businesses and governments can extract from tourism activity, without
considering the benefits that a healthy environment offers to the human population, directly or indirectly,
both at the local and global levels (Bolund & Hunhammar, 1999). A wider approach that does not focus
only on income generation is thus necessary to encourage governments and operators to move toward
less damaging forms of tourism development.
Table 1.1. Tourism as part of exports of goods and services in 2000 by country group. Source: UNWTO, 2004.
Fig. 1.3. SIDS (Small island developing states) map. By Osiris (Own work). CC-BY-SA-3.0 (http://creativecommons.org/licenses/by-sa/3.0), via Wikimedia Commons.

4
SMALL ISLAND DEVELOPING STATES
Small Island Developing States (SIDS) (Fig. 1.3) were first formally recognized as a group sharing unique
challenges associated with sustainable development at the United Nations Conference on Environment
and Development that took place in Rio de Janeiro in 1992 (United Nations Department of Economic and
Social Affairs, 2010). Among these challenges are these islands’ limited resources as a consequence
of their small size, and their reduced economic competitiveness because of their isolation from major
markets (SIDSnet, 2013). Furthermore, SIDS are especially vulnerable to global issues (Fig. 1.4), such
as sea-level rise as a consequence of climate change, whose long-term effects may even lead to the
disappearance of some of these countries (SIDSnet, 2013).
As far as tourism is concerned, SIDS are also especially vulnerable to overdevelopment for several
reasons. On the one hand, small islands combine the attributes of mainland coastal areas with the special
qualities associated with their geography (Tourtellot, 2007 cited in Smith et al., 2011). These unique features
increase tourist demand, which, in turn, raises concerns about the island states’ environments and cultures
(Smith, Henderson, Chong, Tay, & Jingwen, 2011). On the other hand, the previously mentioned economic
dependence of some countries on the hospitality industry reaches its highest levels in SIDS (Fig. 1.5),
whose economies present the highest rates of tourism contribution to gross domestic product (GDP).
WATER
This research focuses on this type of destination for the previous reasons and also for the additional
challenges they face in order to provide the required conditions for a more responsible tourism
development. Water management is especially important in the context of sustainable tourism in SIDS
for several reasons. First, freshwater supply suffers from the limited availability of this resource in SIDS.
Second, the water demand of tourism facilities at this type of destination places intense pressure on this
Fig. 1.4. Environmental Vulnerability Index for 33 SIDS. Difference between Least Developed Countries (LDC) and non-LDC. Source: UN DESA, 2010, based on UNEP/SOCAP methodology.

5
scarce resource. Finally, the lack of facilities for treating the often excessive generation of wastewater from
tourism can lead to its discharge into the sea, which can significantly damage the fragile surrounding
marine environment (Pigram, 2001).
While the limited availability of freshwater resources is a major issue of SIDS (Peters, 2006) (Fig. 1.6),the
alternatives to solve it can increase the environmental damage caused by tourism development. Water
source security and supply is a problem that most small islands suffer from, as the small extent of land
area, combined in some cases with geological factors, makes runoff flow directly into the sea instead of
being stored on the surface (Han & Ki, 2010; Kerr, 2005). Groundwater is in some cases an alternative
source to surface freshwater. However, many small islands do not have subsurface water bodies (Han
& Ki, 2010; Sazakli, Alexopoulos, & Leotsinidis, 2007) and, when they do, their vulnerability is higher
than for mainland aquifers, since excessive extraction causes seawater penetration and therefore high
salinity of groundwater (Kim et al., 2003). In low-latitude small islands, the problem is accentuated by
high evapotranspiration rates and severe weather events, such as hurricanes, which can damage the
infrastructure (Pigram, 2001). Freshwater supply thus becomes a key factor in the context of sustainable
tourism development in SIDS (King, 1997 cited in Pigram, 2001).
Fig. 1.6. Renewable internal freshwater resource. Source: World Bank, 2009 cited in UN DESA, 2010.
Fig. 1.5. International tourism receipts as percentage of total exports and GDP (2007). Source: World Bank 2010

6
Despite the scarce availability of freshwater supply sources in SIDS, tourism facilities at these locations are
generally characterized by a significant demand for this resource. As a consequence, islands with intense
tourism activity are more likely to present water-related problems and conflicts, which become more
obvious when comparing tourist water consumption to the relatively lower domestic demand (Anderson,
2009). In some islands there is a significant competition for water that can become accentuated when
tourism demand for water appears, which makes sustainable use of this resource even more necessary
(Pigram, 2001). The problem is accentuated by the seasonal character of tourism, since the higher demand
generally occurs during the dry season, when the tourist population is multiplied and water supply is more
limited (Kelly & Williams, 2007; Sazakli et al., 2007). Tourism water use is also higher when compared
with water consumption by tourists at their places of origin. The average estimated water consumption
for international tourists is 300 L/P/Day, almost doubling the average consumption at home, 160 L/P/Day
(Gössling et al., 2012).
Several factors contribute to this higher water demand of tourism facilities, which is expected to keep
growing in upcoming years due to increased tourist arrivals, higher hotel standards, and water-intensity
of tourism activities (UNWTO, 2008 cited in Gössling et al., 2012). On the one hand, many of the services
offered by coastal tourism facilities, such as swimming pools, spas, laundry or irrigated gardens, require
substantial allocations of freshwater (Pigram, 2001). Water use is also directly associated with the quality
level of the accommodation (Anderson, 2009), and luxury beach resorts, a frequent type of facility on
small tropical islands, generally require not only higher direct water use associated with the previous
services, but also an increased indirect water demand associated with higher quality food products. On
the other hand, the recreational character of the tourism experience may also contribute to greater water
consumption, since “holiday makers have a pleasure approach to the shower or bath and generally use
more water than they would normally” (Eurostat cited in Gössling et al., 2012).
A literature review by Gössling et al. (2012) shows that water consumption, per tourist per day, goes from
84 to 2000 litres. This large variation is due to geographical factors, especially climate, hotel structure, and
comfort standard (Gössling et al., 2012). A study in Zanzibar (Gössling, 2001) can be used to illustrate the
water footprint of tourism in a tropical destination:
direct useswimming poolscleaningrestaurantslaundryirrigation
186L 20 %140L 15 %47L 5 %47L 5 %47L 5 %465L 50 %
50%
5%5%
5%
15%
20%
direct use swimming poolscleaning restaurantslaundry irrigation
direct useswimming poolscleaningrestaurantslaundryirrigation
136L 55 %0L 0 %12L 5 %37L 15 %25L 10 %37L 15 %
15%
10%
15%
5%
55%
direct use swimming poolscleaning restaurantslaundry irrigation
direct useswimming poolscleaningrestaurantslaundryirrigation
186L 20 %140L 15 %47L 5 %47L 5 %47L 5 %465L 50 %
50%
5%5%
5%
15%
20%
direct use swimming poolscleaning restaurantslaundry irrigation
direct useswimming poolscleaningrestaurantslaundryirrigation
136L 55 %0L 0 %12L 5 %37L 15 %25L 10 %37L 15 %
15%
10%
15%
5%
55%
direct use swimming poolscleaning restaurantslaundry irrigation
Fig. 1.7. Average water consumption by use in guesthouses (left) and hotels (right) in Zanzibar. Source: Gössling, 2001.

7
DESALINATION
The previously described lack of freshwater supply sources makes it necessary to find alternative ways
for satisfying the high water demand of tourism facilities. In many cases, expensive and high-energy-
demanding technologies, such as desalination, are used (Anderson, 2009; Gössling et al., 2012).
For instance, in countries like the Maldives, all the beach resorts and a significant fraction of the local
population rely on desalination as the main form of freshwater supply (AQUASTAT, 2012). But it has to be
considered that the access to energy sources in SIDS is also challenging, as they mainly rely on imported
fossil fuels to provide the required energy supply (United Nations Department of Economic and Social
Affairs, 2010). Energy and water management are closely related to each other at tourism facilities in SIDS
and technologies like desalination directly contribute to increased greenhouse gas emissions (Gude,
Nirmalakhandan, & Deng, 2010).
Desalination is an energy-intensive and expensive technology. As such, it is generally considered
appropriate in water scarce regions where the cost of energy is significantly low, such as oil rich countries
in the Middle East (Gude et al., 2010). The required energy per cubic meter of desalinated water goes from
3 to 12.5 kWh, depending on factors such as the type of technology used (Gude et al., 2010; Sadhwani
& Veza, 2008 cited in Gössling, 2012). Reverse-osmosis, a non-phase changing process, is the fastest
growing technology for desalination today (Semiat, 2008). These plants allow the incorporation of energy
recovery pumps, which reuse the pressure of the rejected brine in order to save energy (Keeper, Hembree,
& Schrack, 1985 cited in Gude et al., 2010). In combination with these energy recovery devices, reverse-
osmosis is currently the least energy consuming desalination technique (Semiat, 2008). However, the cost
of desalinated water today is still higher than water from most other sources (Wichelns & Nakao, 2007).
For example, a case-study in Grenada (Peters, 2006) showed that the cost of desalinated water from the
plants built in the last decade was up to nine times higher than the cost of harvested rainwater.
Moreover, the high cost and energy demands of desalination are not the only problems associated with
the use of this technology. Local environmental concerns also appear as a consequence of using a
desalination plant to produce freshwater. On the one hand, when taking water from the ocean, marine fish
and other living organisms can be damaged or even killed. On the other hand, the discharged brine is
usually warmer, has a higher salinity and sometimes contains chemicals used in the desalination process,
so it can significantly impact the marine ecosystems surrounding the discharge area (Wichelns & Nakao,
2007). While both these problems can be mitigated in different ways, the cost of the devices required to
reduce them increases the cost of the desalination process (Wichelns & Nakao, 2007).

8
SUSTAINABLE TOURISM
In our search, therefore, for more sustainable forms of tourism development, we must find different ways
for solving the problem of freshwater supply at remote tourism destinations such as SIDS. The sustainable
tourism framework embraces not only environmental issues like these, but also economic or social
problems derived from tourism development.
In the context of tourism, then, sustainability refers to “tourism which is developed and maintained in an area
in such a manner and at such scale that it remains viable over an indefinite period and does not degrade
or alter the environment in which it exists” (Nelson, Butler, & Wall, 1993 cited in Nepal, 1999). Sustainable
tourism is thus necessary in order to avoid the so-called “boom and bust” cycles of development in such
destinations, leading to a rapid overdevelopment and decline (Forsyth, 1997). The United Nations World
Tourism Organization (UNWTO) claims that tourism is “one of the environment’s best friends” (UNWTO
cited in Gössling, 2000) and defines “sustainable tourism” as follows:
Tourism that takes full account of its current and future economic, social and
environmental impacts, addressing the needs of visitors, the industry, the environment
and host communities.
Sustainable tourism should:
1) Make optimal use of environmental resources that constitute a key element in tourism
development, maintaining essential ecological processes and helping to conserve
natural heritage and biodiversity.
2) Respect the socio-cultural authenticity of host communities, conserve their built and
living cultural heritage and traditional values, and contribute to inter-cultural understanding
and tolerance.
3) Ensure viable, long-term economic operations, providing socio-economic benefits
to all stakeholders that are fairly distributed, including stable employment and income-
earning opportunities and social services to host communities, and contributing to
poverty alleviation. (UNWTO, 2012a)
Under the ‘sustainable tourism’ framework, many destinations have increasingly adopted measures to
make their projects and operations more sustainable. However, despite the large numbers of hotels and
resorts that purport to be eco-friendly or green, realistic sustainable policies are rarely implemented and

9
many questions arise about the real goal of sustainable tourism. Some authors question whether those
who claim to provide sustainable tourism actually pursue the alleviation of the problems associated
with conventional tourism or is it just “a clever marketing campaign to provide corporations ethically
more appealing wrapping paper for the same old toy”? (Lansing & De Vries, 2007, p. 77). Some studies
demonstrate that global concerns about environmental issues, such as climate change, have increased
dramatically during the last decade and are affecting the way consumers behave (Bergin-Seers & Mair,
2009). This growing consumer awareness about global concerns is one of the main reasons some private
sector businesses claim to offer more environmentally friendly products, and while this might be slowly
contributing to a more sustainable future (Williams & Ponsford, 2009), their final purposes may be limited
to attracting a larger number of environmentally concerned guests. In any case, a higher public demand
for environmentally-friendly products may persuade operators to offer more responsible services and
consume fewer natural resources (Forsyth, 1997).
ASSESSMENT TOOLS
Tourism owners and operators use sustainability assessment tools as instruments to measure the
environmental, social and economic commitment through third-party verification. The availability of these
tools for making sustainability concepts and goals more accessible is increasing (Williams & Ponsford, 2009)
and their role is very important since, as stated above, the lack of regulation in many tourist destinations
leaves the responsibility for promoting sustainable development up to the owners and operators. While
many of these benchmarking systems measure the performance of the facilities at different levels, such
as resource management and, more specifically, water use, most of these tools assess each level
independently, without promoting a holistic approach to sustainability. For instance, energy supply and
water supply are assessed separately, even though these two variables, especially in SIDS, as explained
above, are closely related to each other, since water is required for energy production and energy is
required for water production (UNESCO, 2009 cited in Gössling et al., 2012). Public awareness about
issues like climate change or global warming have contributed to the emphasis these benchmarking
systems have put on energy supply and carbon emission reduction, while water management is not
receiving the attention it should receive in most cases.
Fig. 1.8. GreenGlobe logo. One of the most common benchmarking systems in green building and sustainable tourism.

10
In this context, a shift in the role of water management in the design of hotels and resorts is crucial for
moving toward more sustainable forms of tourism development. This research brings to the table the need
to incorporate more ambitious water goals in sustainable tourism development, especially at destinations
that lack access to conventional freshwater sources. In order to make tourism more sustainable in the
future, design teams and developers need to take a realistic approach to sustainability in small island
developing states, one that considers water usage at the outset of the planning and design processes.
1.2 Research Questions
Q1: Is it possible to achieve ambitious water-related design goals, such as net-zero water scenarios, given
the isolated conditions of these destinations?
Q2: Which design strategies can be used to reduce the growing water demands of coastal tourism
developments at destinations with no access to conventional freshwater sources?
Q3: How must new coastal tourism facilities in small island developing states be designed in order to
minimize the impacts associated with their use of water?
Q4: What forms of water supply, other than desalination, can be used at beach resorts in small island
developing states within the context of sustainable development?
1.3 Goal and Scope of the Study
The goal of this research is to bring to the table the need to improve water management at tourism
facilities of small island developing states, along with tools that could provide solutions. In a water-
scarcity situation, the high water-use of beach resorts at these destinations points out the need for new
desalination technologies, the current use of which makes it harder to achieve ambitious sustainability-
related goals. Water supply and demand need to receive more attention in the context of sustainable
tourism development, and for this purpose, the way water-use is assessed in the tourism industry needs
to be rethought.
This thesis applies the Corporate Water Accounting framework and the Water Footprint methodology to
coastal tourism facilities at small island destinations. This application includes an analysis of possible
solutions to the ever more challenging water-related goals of the tourism industry, so that these goals―and
the problems associated with the water-use of coastal facilities―become clearer and more comprehensive
for all stakeholders. Furthermore, a proposed water accounting method aims to demonstrate that very high

11
reductions in the dependence on desalination can be achieved through the holistic application of a series
of water-related design strategies. The results obtained from a case-study in an extreme geographical
context such as the Maldives are extrapolated to formulate a new development scenario. This study finally
proposes a three-scale (geographical, system, and device scales) process, to be used by design teams at
early stages of the design process of new resorts. This process emphasized the need for participation and
involvement from all stakeholders, including owners, operators, design teams, governments and tourists,
in order to achieve the most ambitious water usage goals.
1.4 Methodology Overview
This thesis applies both the ‘Corporate Water Accounting framework’ and the ‘water footprint methodology’
to beach resorts in small island developing states and explains how and why this combination is a
promising model for water-use assessment in this context. Based on a literature review on different water
strategies, using a spreadsheet-based calculator, this research developed the Water Footprint Design Tool
and applied it to a case-study in the Maldives. Based on the results from this case-study, this study defines
and proposes a three-scale process to be applied by design teams at early stages of design. The thesis
is organized into seven chapters, which include the following contents:
Fig. 1.9. Thesis methodology diagram.
supply alternatives
demand reduction
precedent studyCIRS building
CASE STUDY
CONCLUSIONS
LITERATUREREVIEW
TOURISM tourismdevelopment
SIDS
sustainable tourismand water
corporate wateraccounting
water footprintmethodology
water-relateddesign strategies
PROBLEMSTATEMENT
RESEARCHQUESTIONS
GOALDEFINITION
>
>
>
>
>
>
>
>
> >
water footprinttype redefinition
WATER FOOTPRINTDESIGN TOOL
impact and riskdetermination
contextdefinition
achievability
transferability
APPLICATION
EXISTINGresorts
NEWdevelopments
THREE-SCALEDESIGN PROCESS
WATER
RESULTS

12
Chapter 1, Introduction: The first chapter presents a literature review on sustainable tourism development
and water use in small island developing states (SIDS). Based on this literature review, the research
questions and goals of the study are defined.
Chapter 2, Redefining Water Goals: The second chapter starts with a review of the Corporate Water
Accounting framework defined by the United Nations Environment Programme and explains in detail the
Water Footprint methodology. The second part of the chapter discusses the adaptation of this methodology
to the built environment and, more specifically, to beach resorts in SIDS. Based on this adaptation, the
net-zero water goal is redefined.
Chapter 3, Water-related Design Strategies: This chapter is divided into two sections. The first one contains
a literature review on the most common water-related design strategies applied in the context of green
building. The second section uses the Centre for Interactive Research on Sustainability at the University of
British Columbia in Canada as an exemplary precedent building that illustrates how the most recent and
ambitious water strategies can be incorporated into the design of any tourism project.
Chapter 4, Water Footprint Design Tool: Based on the study of the previous strategies, and using a
spreadsheet-based calculator, this chapter introduces the Water Footprint Design Tool (the Tool), which
calculates the different water footprints of a beach resort and allows us to foresee changes in the water
balance of the facility through the application of the previous strategies. A deeper explanation on the
methodology used for developing the Tool is provided in chapter 4.
Chapter 5, Case-study: the previous Tool is then applied to a case-study in the Maldives. A general
description of the selected beach resort is given and the results obtained through the application of the
Tool are provided, both numerically and graphically.
Chapter 6, Designing a Net-Zero Water Resort: Chapter 6 is presented as a concluding chapter, which
summarizes the findings presented in all the previous sections of the thesis. This summary is articulated
as a three-scale process to be followed by designers in order to achieve the goals defined in chapter 2.
Based on the learning from the case-study in chapter 5 and including the Tool and strategies from chapters
3 and 4, this section shows how the process is applicable to other beach resorts in similar geographical
contexts and discusses its transferability to other destinations and tourism segments.
Chapter 7, Conclusions: The final chapter includes an overview of the whole thesis, a summary of the
conclusions and significance of the project, a discussion on the main limitations found during the research
process, and a description of identified further research opportunities.
.

13
CORPORATE WATER ACCOUNTING AND THE WATER FOOTPRINT METHODOLOGY
Corporate Water Accounting is a framework that helps companies evaluate the impacts and risks
associated with the direct and indirect water use of their businesses. The Water Footprint concept, which
was introduced by Hoekstra in 2001, is one of the proposed accounting methods within this framework.
Neither the Corporate Water Accounting framework nor the water footprint methodology have previously
been applied to a coastal tourism facility on a water scarce location. This chapter explains both concepts
and discusses their application in the context of this study. The different water footprint types (green,
blue and grey), widely applied to agricultural products in the last decade, get expanded for covering
other potential water supply sources at these destinations, such as desalination and harvested rainwater.
Moreover, the impacts and risks associated with each of them are summarized. Based on the water
accounting framework and the water footprint methodology, the last section of this chapter redefines the
net-zero water goal introduced in the Living Building Challenge. The potential for achieving this goal is
tested in the following chapters of this thesis.
2 REDEFINING WATER GOALS

14
2.1 Literature Review
Corporate Water Accounting, as defined by the United Nations Environment Programme (UNEP), is a
process that
allows companies to determine the impacts of their direct and indirect water use and
discharges on communities and ecosystems, evaluate material water-related risks, track
the effect of changes in their water management practices, and credibly report their
trends and impacts to key stakeholders. (Morrison, Schulte, & Schenck, 2010, p. 11)
The process includes a series of steps: accounting, impact determination, risk evaluation, identification of
improvement opportunities, and reporting.
ACCOUNTING
The two most relevant methods for water accounting are water footprinting and Life Cycle Assessment
(Morrison et al., 2010). This thesis focuses on the water footprint methodology.
The Water Footprint concept introduced by Hoekstra in 2002 (Hoekstra, Chapagain, Aldaya, & Mekonnen,
2009) is defined as a “comprehensive indicator of freshwater resources appropriation” (Hoekstra et al.,
2009, p. 8) that goes beyond the classical measure of water withdrawal by including indirect water use.
It can be calculated for any individual or community, and also for any product, activity or business. The
water footprint of a business, which would be the case of a tourism facility, includes the direct water use
necessary for supporting the activity as well as the water used in the business’ supply-chain (Hoekstra,
2008). The importance of specifying the geographical and temporal contexts of each component of the
water footprint is emphasized, as the potential environmental impacts of each footprint are directly related
to the vulnerability of the local water system (Hoekstra et al., 2009).
A water footprint includes three components: blue, green and grey water footprints:
The blue water footprint refers to the volume of ‘blue water’ (surface or ground water) that
has been evaporated as a result of its appropriation for human purposes. It excludes the
part of the water withdrawn from the ground or surface water system that returns to that
system directly after use or through leakage before it was used.
The green water footprint refers to the volume of ‘green water’ (rainwater stored in the
soil) that has been evaporated as a result of its appropriation for human purposes.

15
The grey water footprint is the volume of polluted water that associates with the production
of goods and services. It is calculated as the volume of water that is required to dilute
pollutants to such an extent that the quality of the water remains above agreed water
quality standards. (Hoekstra, 2008, p. 11)
The distinction between these three types of water footprints is very important because each of them
presents substantially different risks and impacts for the surrounding context (Morrison et al., 2010).
IMPACT DETERMINATION
Impacts can be defined as the external implications of water use and discharge from a company for the
local context, i.e., both communities and ecosystems, which appear when either the availability or the
quality of the water are affected (Morrison et al., 2010). Water-related impacts are highly dependent on the
local context the company and its suppliers. Therefore, a volumetric measurement of the company’s water
use is not sufficient, if not accompanied by local water-related indicators. These indicators should not be
restricted to physical water availability but also include factors such as environmental flow needs, local
governance, related policy, or access to water from nearby communities (Barton, 2010; Morrison et al.,
2010). Impacts can be categorized in different ways. For the purpose of this study, they are classified as
environmental or socio-economic. As far as water-related impacts are concerned, an appropriate scope
and methodology for assessing them has not been completely developed yet (Morrison et al., 2010).
DIRECT WATERFOOTPRINT
GREEN WATERFOOTPRINT
GREEN WATERFOOTPRINT
BLUE WATERFOOTPRINT
RETURNFLOW
BLUE WATERFOOTPRINT + _
GREY WATERFOOTPRINT
GREY WATERFOOTPRINT
INDIRECT WATERFOOTPRINT
(SUPPLY-CHAIN)
Fig. 2.1. Water footprint components. Adapted from Hoekstra et al., 2009.
16
RISK EVALUATION
Risks refer to the internal implications, generally financial, derived from a business’ water use. Water-
related risks are usually closely related to impacts but not always in a bidirectional way. While businesses
with important associated water impacts generally present equally significant risks, the opposite does not
always occur. For instance, while a company may not negatively impact its local water context through its
activity, it may be subject to financial risks as a consequence of the impacts caused by external agents
(local population, other companies, etc) in the same water context (Morrison et al., 2010).
Risks are generally classified into three interrelated categories: physical, regulatory, and reputational
(Morrison et al., 2010). While physical risks refer mainly to water shortage problems that may threaten
the continuity of the business’ operation, reputational risks relate to potential damage to the company’s
corporate image, and regulatory risks refer to possible governmental interference and increased regulation
that may affect the company’s access to water supplies (Barton, 2010; Morrison et al., 2010).
IMPROVEMENT OPPORTUNITIES
A detailed impact assessment and risk determination, based on water accounting, would let the company
anticipate the effects that changes to its water management would have. This way, areas for improvement,
understood as ways to mitigate impacts or reduce risks, can be identified.
2.2 Application to Tourism in SIDS
The application of the previously defined Corporate Water Accounting framework and the water
footprint methodology to coastal tourism facilities in small island developing states requires a series of
considerations, which are described below. First, the previous definition of each water footprint type is
discussed, as some adaptations are required when applying this methodology to the built environment
and, more specifically, to tourism development in SIDS. Second, an overview of the impacts and risks
associated with these redefined water footprint components is given.
2.2.1 WATER FOOTPRINT TYPES REDEFINITION
The water footprint methodology has been widely applied to agricultural products or crops, but its
application to the built environment has not been completely developed yet. Applying the water footprint
methodology to tourism would result in the calculation of both the direct and indirect water footprints
related to the business operation. The direct water footprint of a resort would refer to the water use of

17
the facilities, including the water required for drinking, showers, toilet flushing, sinks, kitchens, swimming
pools, laundry and irrigation. The indirect water footprint would be calculated as the water footprint of
each product in the supply-chain that is required for that resort to function, such as food, energy, furniture,
towels, etc. Transportation also plays a crucial role in tourism development and its related water footprint (if
considered) would also be included in the indirect component. However, Hoekstra et al.do not recommend
including the water footprint associated with transportation in the accounting, unless biofuels, or electricity
from biomass combustion, or hydropower are used as the main sources of energy, since other forms of
fuel do not entail a significant water footprint per unit of energy (2009).
Previous studies have calculated the water footprint of different services and communities. For instance,
maintaining a North American diet requires more than 5000 litres per day (Schreier & Pang, 2012). Yang et
al. (2011) applied the water footprint methodology to a mountain tourism destination in Northwest Yunnan,
China. In their study, they differentiated direct water use and indirect water use, the latter focusing only on
food supply. The grey water footprint component is also included in the accounting. The results showed
that the total water footprint of an average tourist in the Liming Valley was 5207,6 L/tourist/day (Fig. 2.2),
from which 144.1 L (2.8%) corresponded to direct water use, 3587.3 L (68.9%) to water required for food
production and 1476.6 L (28.3%) to wastewater dilution (Yang et al., 2011). The water footprint associated
with the direct water use of this destination is significantly low if compared with the supply-chain or grey
water footprints. But it must be remembered that the risks and impacts associated with each type of
footprint are different and need to be assessed separately. Moreover, this study did not specify which
fractions of the water footprints from direct use or food production corresponded to green or blue water.
The direct (operational) water footprint of tourism in this type of destination (SIDS) is very high, as it is
required for multiple services and processes, such as bathrooms and toilets, kitchens, spas, swimming
pools, and garden irrigation and maintenance. The indirect water footprint is also very important, as water
is necessary as an embodied resource in infrastructure development or food production (Chapagain &
Fig. 2.2. Total water footprint of an average tourist in the Liming Valley, China. Yang et al., 2011.
FOOD3587.3 L/tourist/day
DIRECT144.1 L/tourist/day
DILUTE1476.2 L/tourist/day

18
Hoekstra, 2003; Chapagain & Hoekstra, 2008; Gössling, 2001). In SIDS, it has to be considered that
many of the products offered to tourists come from the mainland. Therefore, this fraction of the total water
footprint should be regarded as external or imported virtual water (Hoekstra et al., 2009), the negative
impacts of which mainly affect the local area from where it was obtained. For most businesses, the indirect
water footprint is larger than the direct water footprint, as the previously cited study in China reveals, but
reducing it may be more difficult for business operators due to the lack of direct control over it (Hoekstra
et al., 2009). In addition, in most cases, design teams (i.e. architects, landscape architects, engineers)
do not have the ability to impact the indirect water footprint of the tourist-related projects they design.
Subsequently, this research focuses only on the direct water footprint of beach resorts in SIDS.
Green, blue, and grey water footprint differentiation:
Since the water footprint methodology has largely been used only for agricultural products, some
adaptations and clarifications are necessary before it can be applied to a tourism facility on a small island.
These adaptations are explained through a sequence of three scenarios (agriculture, built environment
and small island resort):
Scenario #1: Agriculture:
Up until recently, researchers have only been applying the water footprint methodology to agricultural
products. This scenario allows us to easily understand the difference between the three water footprint
types. A specific land area used for crop production that relied only on the rainfall stored in the soil
would only present a green water footprint. If, however, this area required irrigation, a blue water footprint
component would appear. Finally, if pesticides were used, part of the runoff generated by the rain or
irrigation would be polluted, and a grey water footprint would also be considered (Fig. 2.3).
Fig. 2.3. Water footprint types for an agricultural product. Adapted from Sarni, 2011. Wheat icon, by The Noun Project. CC BY 3.0 (http://creativecommons.org/licenses/by/3.0/) via www.iconspedia.com.
BLUE WATER FOOTPRINT
GREY WATER FOOTPRINT
GREEN WATER FOOTPRINT

19
Scenario #2: Built environment:
Applying these concepts to any building located in an urban area would require certain adaptations. All
the water provided by the municipal supply, which generally comes from surface or groundwater bodies,
would represent the blue water footprint of that building. All the wastewater generated by the building
would have a grey water footprint associated with the water required for the dilution of its pollutants.
However, no green water footprint would appear, at least not related to indoor water use, as buildings
do not use rainwater stored in the soil, as crops do. Nevertheless, many buildings worldwide harvest
and use rainwater from their rooftops or surrounding areas. How to classify this form of water supply
is the main question, as it does not entirely fit any of the previous definitions. On the one hand, it could
be considered blue water, as it is water that runs off before being harvested. However, its use does not
contribute to the depletion of blue water bodies. On the other hand, it also partially falls into the definition
of green water, understood as “the precipitation on land that does not run off or recharge the groundwater”
(Hoekstra et al., 2009, p. 21), but it does not get stored as soil moisture either, unless it is used for outdoor
purposes. Seen within the Corporate Water Accounting framework, the impacts, risks, and improvement
opportunities associated with harvested rainwater are significantly different from those related to either
blue or green water use. Applying the water footprint methodology to the built environment therefore
requires considering harvested rainwater, when applicable, as an additional water footprint component
(Fig. 2.4).
Fig. 2.4. Proposed water footprint types for a building.
BLUE WATER FOOTPRINT
municipalsupply
wastewater
GREY WATER FOOTPRINT
RAINWATER FOOTPRINT
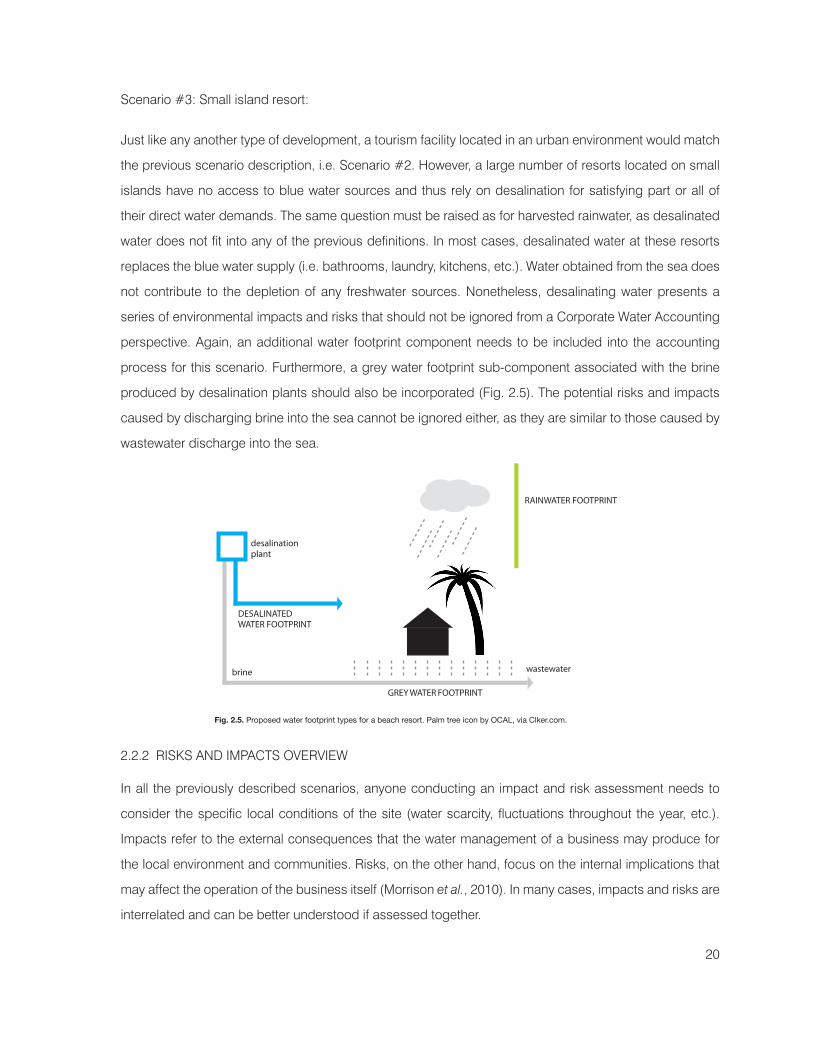
20
Scenario #3: Small island resort:
Just like any another type of development, a tourism facility located in an urban environment would match
the previous scenario description, i.e. Scenario #2. However, a large number of resorts located on small
islands have no access to blue water sources and thus rely on desalination for satisfying part or all of
their direct water demands. The same question must be raised as for harvested rainwater, as desalinated
water does not fit into any of the previous definitions. In most cases, desalinated water at these resorts
replaces the blue water supply (i.e. bathrooms, laundry, kitchens, etc.). Water obtained from the sea does
not contribute to the depletion of any freshwater sources. Nonetheless, desalinating water presents a
series of environmental impacts and risks that should not be ignored from a Corporate Water Accounting
perspective. Again, an additional water footprint component needs to be included into the accounting
process for this scenario. Furthermore, a grey water footprint sub-component associated with the brine
produced by desalination plants should also be incorporated (Fig. 2.5). The potential risks and impacts
caused by discharging brine into the sea cannot be ignored either, as they are similar to those caused by
wastewater discharge into the sea.
2.2.2 RISKS AND IMPACTS OVERVIEW
In all the previously described scenarios, anyone conducting an impact and risk assessment needs to
consider the specific local conditions of the site (water scarcity, fluctuations throughout the year, etc.).
Impacts refer to the external consequences that the water management of a business may produce for
the local environment and communities. Risks, on the other hand, focus on the internal implications that
may affect the operation of the business itself (Morrison et al., 2010). In many cases, impacts and risks are
interrelated and can be better understood if assessed together.
Fig. 2.5. Proposed water footprint types for a beach resort. Palm tree icon by OCAL, via Clker.com.
DESALINATEDWATER FOOTPRINT
desalinationplant
brine wastewater
GREY WATER FOOTPRINT
RAINWATER FOOTPRINT
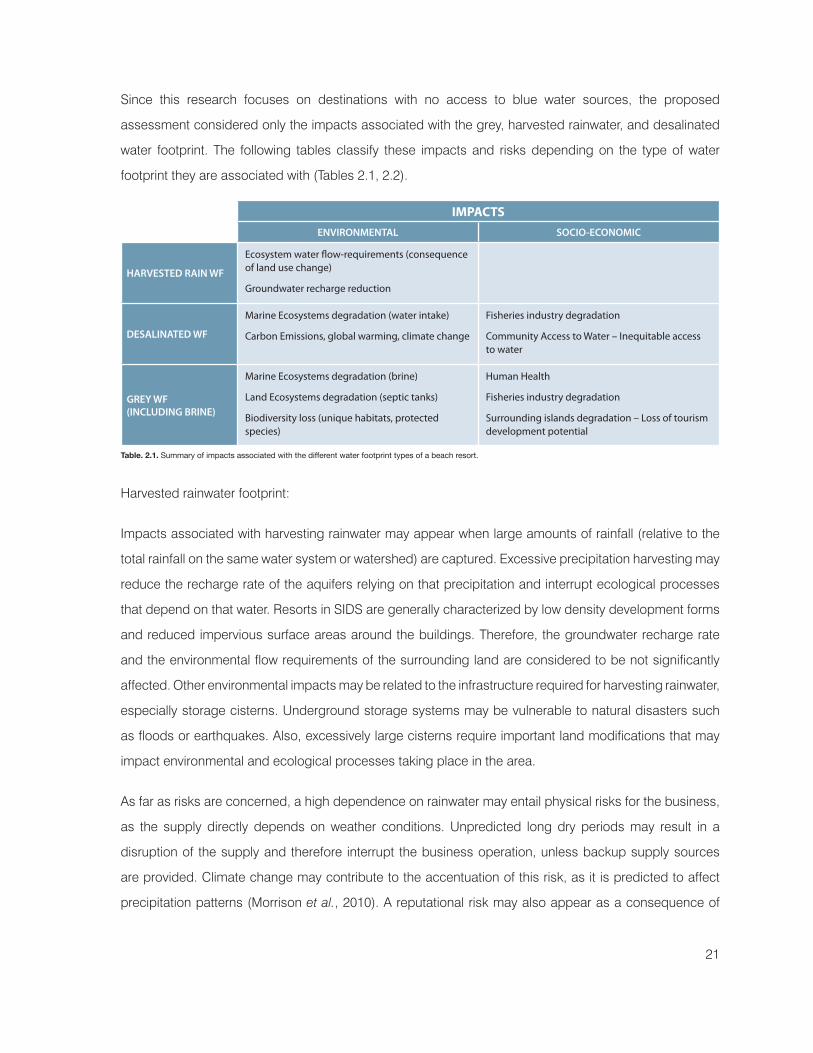
21
Since this research focuses on destinations with no access to blue water sources, the proposed
assessment considered only the impacts associated with the grey, harvested rainwater, and desalinated
water footprint. The following tables classify these impacts and risks depending on the type of water
footprint they are associated with (Tables 2.1, 2.2).
IMPACTS IMPACTSENVIRONMENTAL SOCIO-ECONOMIC
HARVESTED RAIN WF
Ecosystem water flow-requirements (consequence of land use change)
Groundwater recharge reduction
DESALINATED WF
Marine Ecosystems degradation (water intake)
Carbon Emissions, global warming, climate change
Fisheries industry degradation
Community Access to Water – Inequitable access to water
GREY WF(INCLUDING BRINE)
Marine Ecosystems degradation (brine)
Land Ecosystems degradation (septic tanks)
Biodiversity loss (unique habitats, protected species)
Human Health
Fisheries industry degradation
Surrounding islands degradation – Loss of tourism development potential
Harvested rainwater footprint:
Impacts associated with harvesting rainwater may appear when large amounts of rainfall (relative to the
total rainfall on the same water system or watershed) are captured. Excessive precipitation harvesting may
reduce the recharge rate of the aquifers relying on that precipitation and interrupt ecological processes
that depend on that water. Resorts in SIDS are generally characterized by low density development forms
and reduced impervious surface areas around the buildings. Therefore, the groundwater recharge rate
and the environmental flow requirements of the surrounding land are considered to be not significantly
affected. Other environmental impacts may be related to the infrastructure required for harvesting rainwater,
especially storage cisterns. Underground storage systems may be vulnerable to natural disasters such
as floods or earthquakes. Also, excessively large cisterns require important land modifications that may
impact environmental and ecological processes taking place in the area.
As far as risks are concerned, a high dependence on rainwater may entail physical risks for the business,
as the supply directly depends on weather conditions. Unpredicted long dry periods may result in a
disruption of the supply and therefore interrupt the business operation, unless backup supply sources
are provided. Climate change may contribute to the accentuation of this risk, as it is predicted to affect
precipitation patterns (Morrison et al., 2010). A reputational risk may also appear as a consequence of
Table. 2.1. Summary of impacts associated with the different water footprint types of a beach resort.

22
this physical risk, as other resorts not relying on a rainwater supply may be seen as more competitive by
potential guests traveling to the destination during the dry season. This research has found no significant
regulatory risks or socio-economic impacts for local communities related to the harvested rainwater
footprint of a beach resort.
RISKSPHYSICAL REPUTATIONAL REGULATORY
HARVESTED RAIN WF
Operational Efficiency for unreliable long-term water supply
Climate Change rainfall pattern variations
Competitiveness loss
DESALINATED WF
Increased energy demand
Dependence on fossil fuel market price fluctuations
Sea-level Rise threat
Increased carbon footprint
Consumer’s perception
Corporate Social Responsibility
Country’s carbon neutrality goal interactions
Inequitable water use compared to local population
GREY WF(INCLUDING BRINE)
Groundwater pollution
Increased treatment costs
Consumer’s perception
Decreased brand value
Loss of destination attractiveness
Increased wastewater discharge regulations
Loss of license to operate
Further development restrictions
Desalinated water footprint:
Blue water related impacts and risks are generally associated with the depletion of surface and ground water
bodies. The over-exploitation of a blue water source by a business may affect the freshwater availability for
local communities, especially in developing and water scarce regions. However, impacts and risks for a
resort in a SIDS that relies on desalinated seawater to satisfy its water demands are significantly different.
Seawater availability is unlimited and therefore depletion problems do not occur. Environmental impacts
associated with desalinated water include damage to marine ecosystems during the water intake process
or increased carbon emissions derived from a higher energy demand for producing freshwater. Negative
socio-economic impacts may also appear if fishing communities on which the local fisheries industry
depends are seriously damaged.
Different types of risks are derived from these impacts. Desalination plants require high amounts of energy
to operate. The energy supply at resorts located in SIDS is mainly based on diesel generators. Therefore,
an interruption of the diesel supply would directly affect freshwater production. Also, price fluctuations
for fossil fuels directly affect the cost of desalinated water. Reputational risks associated with the larger
Table. 2.2. Summary of risks associated with the different water footprint types of a beach resort.

23
carbon footprint of the company derived from its intensive use of these fossil fuels might also appear,
affecting the consumer's perception of the business and its Corporate Social Responsibility policies. The
reputation of a business may also be affected by the inequitable use of water at the destination. While
resorts' water demands are covered by their own desalination plants, allowing them to offer such services
as swimming pools or spas to their guests, part of the local population may not have access to safe
freshwater sources. Climate change also entails risks associated with the desalinated water footprint, as
any rise in sea-levels could damage the associated infrastructure on the shoreline. In addition, further
measures affecting energy use and carbon emissions may entail a regulatory risk, given the high-energy-
demanding technologies required for desalinating water.
Grey water footprint:
The grey water footprint refers to the polluted water generated by the assessed product or business. In
the case of a resort, the grey water footprint would be associated with the wastewater discharged by
the resort. The impacts derived from this fraction of the direct water footprint depends on how well the
infrastructure of the facility manages wastewater. Brine from desalination plants or wastewater discharged
into the sea would threaten marine habitats and could also damage shoreline ecosystems. Wastewater
filtrations from septic tanks may also affect the natural processes occurring around them. In addition to
these environmental impacts, local communities can also suffer the consequences of the grey water
footprint of a resort in different ways. Damaged marine ecosystems may harm the fisheries industry, which
is an important economic sector in SIDS. Moreover, polluted groundwater may threaten the health of the
local population, if they rely on this supply source for domestic water use. Also, polluted beaches would
lose their attractiveness for tourists and affect the resort industry and subsequently the country's economy.
Financial risks of all three types, i.e., physical, reputational, and regulatory, associated with these impacts
also appear for resort businesses. Physical risks would refer to the loss of access to certain types of water
sources that may be used by the business, such as groundwater. Also, an increased grey water footprint
would imply higher wastewater treatment costs. A typical reputational risk related to grey water appears
when pollution generated upstream is not compensated for to downstream communities (Hoekstra et
al., 2009). In addition, the impacts derived from water pollution could harm public perception and, in the
process, degrade the company's brand and social license to operate (Williams, Gill, Marcoux, & Xu, 2012).
Regulatory risks are more evident for this type of water footprint too, as increased governmental policy
and regulations are likely to appear to counteract the negative impacts that, in more extreme cases, would
result in the loss of a license to operate, if pollution is not controlled.

24
2.3 Net-Zero Water Scenario Definition
Applying the Corporate Water Accounting framework and the water footprint methodology to the built
environment and, more specifically, to beach resorts, goes beyond the classical approach to water
assessment in green building, which mainly focuses on demand reduction. For instance, LEED™ water-
related credits can be obtained if indoor water use is reduced by at least 20% from baselines based on
the International Plumbing Code (IPC) and Uniform Plumbing Code (UPC) standards; by reducing potable
water use for irrigation by 50% or by treating more than 50% of the generated wastewater on-site (USGBC,
2009). Moreover, EarthCheck™, a tourism-specific benchmarking system, assesses water use based on
total water consumption, the amount of captured rain or wastewater, and the use of water saving devices
(Earthcheck, 2010). However, these systems do not pay attention to the nature of the supply sources and
the impacts and risks associated with each of them and the established baselines do not always respond
to different geographical conditions.
This research emphasizes the need for a shift in the way water use is assessed in the context of sustainable
development. Benchmarking systems should not only focus on demand reduction opportunities but also
include the problems associated with different supply sources in the assessment process. Because the
impacts associated with desalinated water use are not the same as those associated with blue water
use, reducing the demand on each of them does not have the same consequences. The water footprint
methodology allows assessors to incorporate this differentiation, as it separates water-use into the
previously described water footprint types. The Corporate Water Accounting framework goes further and
emphasizes the need to pay attention to the many different impacts and risks associated with each water
footprint type. The local character of these impacts and risks requires that water-use assessment is made
in accordance to the conditions of the water context in which the assessed projects are located.
The Corporate Water Accounting framework and the water footprint methodology allow design teams
to incorporate more ambitious water-related goals into sustainable design and tourism development.
Benchmarks should be based on the previous states of the sites where tourism facilities are developed
and not on conventional projects.
New concepts, such as water neutrality or net-zero water, have appeared in the last years as a response to
the need for more ambitious water-related goals in sustainable development. The water footprint network
introduces the concept of water neutrality, although the authors recognize that this concept still needs
further development (Hoekstra, 2008):

25
One can say that a good, service, individual consumer, community or business is water
neutral when the negative externalities (...) have been reduced and offset. [In order to
achieve water neutrality] all that is reasonably possible should have been done to reduce
the existing water footprint [and the remaining footprint should be offset] by making a
reasonable investment in establishing or supporting projects that aim at the sustainable
and equitable use of the water. (Hoekstra, 2008, p. 18)
The water neutrality concept acknowledges the impossibility of reducing the water footprint of a business
to zero. A zero water footprint system would be one in which all the used water is recycled without any
evaporation occurring, which is an impossible situation. ‘Water neutral’ can then be defined as the maximum
level of reduction (not nullification) of the negative externalities (not the footprint itself) for a specific system
(Hoekstra, 2008). However, this maximum level of reduction is not clearly specified. Neither is the idea of
offsetting easily applicable because impacts related to water footprint occur in the catchment area, where
the business is located. Thus, offsetting measures aiming to mitigate the associated impacts should take
place in the same catchment area, which is not always possible (Hoekstra, 2008; Morrison et al., 2010).
The Living Building Challenge, a new certification system embracing some of the most ambitious
sustainability-related goals in green building, includes the net-zero water concept as part of the water-
related requirement for achieving certification:
One hundred percent of the project’s water needs must be supplied by captured
precipitation or other natural closed loop water systems that account for downstream
ecosystem impacts, or by re-cycling used project water. Water must be appropriately
purified without the use of chemicals. (International Living Future Institute, 2012, p. 19)
The net-zero water goal not only assumes that the whole water supply must come from locally renewable
sources, such as rainfall or natural closed loop systems, but it also acknowledges the importance of
considering the environmental impacts associated with this water use at the local scale. Additionally, the
Living Building Challenge requires all the stormwater and water used at the site to be treated and either
recycled for internal building use or returned to the environment in an appropriate way. This thesis combines
the water footprint methodology, in association with the Corporate Water Accounting framework, and the
net-zero water goal, due to its higher clarity and applicability to the built environment when compared with

26
the water neutral concept. The achievability of this goal for a beach resort in a small island developing
state is tested and discussed in the following chapters.
Achieving the net-zero water goal, understood from a water footprint perspective, implies that all the
following criteria are met:
1. All the water supply sources used at the resort development site need to be low-impact sources.
Impacts, both environmental and socio-economic, need to be assessed at the local water system scale
(i.e. Island or watershed). This criterion implies that:
A. The desalinated water footprint, considered as a high-impact supply source, needs to be equal to zero.
B. A blue water footprint could only appear if the local analysis shows that no impacts associated with it
exist (e.g. groundwater use without exceeding recharge rates).
C. Supply must therefore depend totally or mainly on rainwater harvested onsite, which means that the
entire or, eventually, most of the water footprint of resort developments needs to be a harvested rainwater
footprint. Potential impacts associated with the rainwater footprint need to be considered, as well as any
limitations associated with rainwater use that may exist.
D. As rainwater supply is limited, either by the impacts discussed above or by climatic conditions, demand
reduction strategies, including wastewater recycling or water-conservation measures, need to assure that
the entire water demand of the resort can be satisfied by rainfall.
E. The rainwater supply must be able to meet the whole demand during the whole year, including potential
dry periods that may occur, depending on local climatic conditions. How seasonal variability affects
demand needs to be taken into account.
2. There can be no impacts on the local environment or communities associated with the discharge of
water used at the resort. This criterion implies that:
A. The grey water footprint of the resort needs to be equal to zero.
B. All the wastewater produced at the facilities needs to be treated on site and be either reused for demand
reduction purposes or be released into the environment without producing any additional impacts.
C. All the processes used to achieve the previous points need to be natural and/or not entail any negative
impact on the environment or local communities.
.

27
3 WATER-RELATED DESIGN STRATEGIES
TAKING WATER STRATEGIES TO THE NEXT LEVEL
Green strategies for improving water supply and management are currently widely applied worldwide.
Rainwater harvesting (RWH) systems, for instance, have been implemented in many areas around
the world for thousands of years (Pinfold, Horan, Wirojanagud, & Mara, 1993; Simmons, Hope, Lewis,
Whitmore, & Gao, 2001), especially in remote or arid environments where there is no water supply through
piped networks (Sazakli et al., 2007). But RWH systems are optimal when implemented as part of a wider
water approach that includes other demand management strategies (Handia, Tembo, & Mwiindwa, 2003).
Wastewater recycling or efficient water use are some other examples. This chapter describes the most
common water-related strategies, which are classified into two different categories: freshwater supply
alternatives and demand reduction options. The application of such strategies has allowed design teams
to achieve diverse water saving goals, generally in accordance with local standards, regulations, or green
building-related benchmarking systems. However, more challenging goals such as achieving a net-zero
water level (Living Building Challenge) require further improvements in these two categories. A series
of strategies from the Centre for Interactive Research on Sustainability (CIRS) at the University of British
Columbia in Canada is presented as an example to illustrate how water-related design strategies can be
taken to the next level.

28
3.1 Freshwater Supply Alternatives
3.1.1 RAINWATER HARVESTING
Rainwater harvesting (RWH) systems are devices that allow people to collect water from rainfall, store it and
distribute it for further utilization. Every system is usually conformed by three subsystems depending on
their function: harvesting, storage, and distribution (Farreny, Gabarrell, & Rieradevall, 2011). The harvesting
subsystem refers to the catchment area, roofs being the most common type of catchment surface used
for rainfall harvesting (Farreny, Gabarrell, et al., 2011). Storage systems are commonly called tanks, if
located aboveground, or cisterns if underground (Herrmann & Schmida, 2000), and there are different
types depending on the material they are made of. Distribution refers to the pumping (if applicable) and
piping system that will conduct water from the storage tank to the devices using that water. The following
graphic illustrates a typical rainwater harvesting system.
RWH has been practised for thousands of years in many regions and is essential in arid or remote areas
where the provision of water through piped networks does not exist (Peters, 2006; Sazakli et al., 2007).
This kind of supply is seen by many authors as an alternative water source in small island developing
states, where groundwater resources are increasingly threatened by seawater intrusion as a consequence
of climate change (Peters, 2012). In addition, many of these small islands have no surface freshwater
systems, such as rivers or lakes, and rainwater thus becomes the main freshwater supply option for a
population without access to alternative sources such as desalination (Peters, 2012). But RWH systems
are also applied in areas with access to municipal supply or conventional water sources because of their
associated economic and environmental benefits (Jones & Hunt, 2010). Design teams play an important
role in the implementation of these systems in the context of green building and sustainable development.
Fig. 3.1. Rainwater harvesting system. Grand Canyon National Park, South Rim visitor center. Arizona, USA.

29
In order to optimize a water supply based on RWH and its related benefits, the system needs to be
properly designed. While the inaccurate design approach of a single building may not entail significant
environmental or economic losses, the cumulative effect may become important as the implementation of
these systems increases (Guo & Baetz, 2007).
There are two main groups of considerations when implementing rainwater harvesting systems: first, the
amount of water to be collected and used; and second, the quality of that water.
A.QUANTITATIVE ASPECTS
The efficiency of rainwater harvesting systems in terms of quantity of collected water mainly depends on
four variables: rainfall intensity and pattern, catchment area, water demand, and storage capacity (Fewkes,
2000; Han & Ki, 2010; Imteaz, Shanableh, Rahman, & Ahsan, 2011). Other factors, such as spillage or
leakage are generally included in a runoff coefficient, which represents the amount of rainfall that runs off
the surface. This coefficient varies depending on the nature of the catchment surface (Imteaz et al., 2011)
and the climatic conditions. The relation between all these parameters is crucial to understanding the
potential for rainwater harvesting in a specific location.
A.1. RAINFALL PATTERN
The precipitation regime is considered the key factor influencing the performance of RWH systems (Palla,
Gnecco, Lanza, & La Barbera, 2012; Su, Lin, Chang, Kang, & Lin, 2009). The local precipitation characteristics
that affect the performance of RWH systems are the magnitude of rainfall events, their frequency, and the
length of the dry periods between events (Guo & Baetz, 2007). It is therefore not sufficient to consider only
the mean annual precipitation of a site when designing a RWH system (Kahinda, Lillie, Taigbenu, Taute,
& Boroto, 2008). A case-study in Guja-do island in Korea (Han & Ki, 2010) concluded that the rainfall
pattern of the location was unfavourable for effective rainwater harvesting systems because of the uneven
distribution of rainfall. Other parameters, such as the length of drought periods, can significantly affect
the performance of RWH systems. Excessively high storage volumes may be required to provide water
vancouver maldives
janfebmaraprmayjunjulaugsepoctnovdecyear
153.6 70.94123.1 50.62114.3 54.93
84 138.1867.9 168.6654.8 175.0739.6 223.3139.1 208.9953.5 265.02
112.6 215181 255.89
175.7 246.251199 2072.86 0
50
100
150
200
250
300
jan feb mar apr may jun jul aug sep oct nov dec
Malé, Maldives. Average Monthly Rainfall (mm)
vancouver maldives
janfebmaraprmayjunjulaugsepoctnovdecyear
153.6 70.94123.1 50.62114.3 54.93
84 138.1867.9 168.6654.8 175.0739.6 223.3139.1 208.9953.5 265.02
112.6 215181 255.89
175.7 246.251199 2072.86 0
50
100
150
200
250
300
jan feb mar apr may jun jul aug sep oct nov dec
Vancouver, BC. Average Monthly Rainfall (mm)
vancouver maldives
janfebmaraprmayjunjulaugsepoctnovdecyear
153.6 70.94123.1 50.62114.3 54.93
84 138.1867.9 168.6654.8 175.0739.6 223.3139.1 208.9953.5 265.02
112.6 215181 255.89
175.7 246.251199 2072.86 0
50
100
150
200
250
300
jan feb mar apr may jun jul aug sep oct nov dec
Malé, Maldives. Average Monthly Rainfall (mm)
vancouver maldives
janfebmaraprmayjunjulaugsepoctnovdecyear
153.6 70.94123.1 50.62114.3 54.93
84 138.1867.9 168.6654.8 175.0739.6 223.3139.1 208.9953.5 265.02
112.6 215181 255.89
175.7 246.251199 2072.86 0
50
100
150
200
250
300
jan feb mar apr may jun jul aug sep oct nov dec
Vancouver, BC. Average Monthly Rainfall (mm)
Fig. 3.2. Average monthly rainfall (mm) in Vancouver, BC. Fig. 3.3. Average monthly rainfall (mm) in Malé, Maldives.

30
during the entire dry season. In addition, long dry periods may result in equally long detention times for the
stored rainwater, during which some level of degradation is expected to occur (Palla, Gnecco, & Lanza,
2011). However, the precise duration of these dry periods is hard to predict (Smet & Moriarty, 2001, cited
in Peters, 2012). Detailed rainfall data is thus necessary to size these systems appropriately.
A.2. CATCHMENT AREA
The most typical rainwater harvesting systems applied in buildings are those that use roofs as catchment
areas (Farreny, Gabarrell, et al., 2011). Other surface types, such as hardscapes, can also be included
in some cases. Besides the total plan catchment area, other factors, such as the surface geometry and
slope may affect the system’s efficiency and cost as well. The roof material can also have implications for
the runoff coefficient, since, depending on its nature, there may be temporary depression storage points
where water is contained and evaporates before reaching the tank. The following table created by Farrany
et al. (2011) summarizes the runoff coefficient for the most common roofing materials based on previous
articles.
SLOPING ROOFSRunoff Coefficient Reference
Concrete – Asphalt 0.9 Lancaster (2006)
Metal0.95 Lancaster (2006)
0.81-0.84 Liaw & Tsai (2004)
Aluminium 0.7 Ward et al. (2010)
FLAT ROOFS
Bituminous 0.7 Ward et al. (2010)
Gravel 0.8-0.85 Lancaster (2006)
Level Cement 0.81 Liaw & Tsai (2004)
A combination of both an appropriate roof material and geometry is therefore necessary for optimizing the
harvesting potential of these systems. Farreny et al. (2011) estimate that sloping smooth roofs can harvest
as much as 50% more rainwater than rough flat roofs.
Table. 3.1. Runoff coefficient for the most common roofing materials. Source: Farrany et al. 2011.

31
A.3. WATER DEMAND
Demand patterns can also directly affect the performance of these systems (Su et al., 2009). Harvested
rainwater is generally not used to cover the whole water demand of a project. On the contrary, it is generally
used to supply freshwater for a fraction of the water-use, mainly for services not requiring potable water
quality, such as irrigation, laundry or toilet flushing. It is the mission of design teams to decide which
fraction of the total water demand is to be provided by harvested rainwater. The nature of this demand can
influence the performance of the system, especially if this demand is not constant throughout the year. This
demand variability clearly appears in the context of tourism, the higher demand periods corresponding
to the high season, which generally coincide with drier periods especially at coastal destinations (Essex,
Kent, & Newnham, 2004; Ioannides, Apostolopoulos, & Gayle, 2002 cited in Gill, Williams, & Thompson,
2010). A rainwater harvesting system works if this fraction of the water demand can be satisfied by the
collected rainfall throughout the whole year. Therefore, knowing the anticipated demand and its variability
is crucial to ensuring the optimization of the system (Jones & Hunt, 2010).
A.4. STORAGE VOLUME
As the most common design parameter of RWH systems (Palla et al., 2011), storage capacity is usually
determined based on an analysis of the previous variables. As far as the rainfall pattern is concerned, the
frequency of rainfall events is significant for sizing the storage tanks, since long dry periods would need to
be managed with stored rainwater. For this reason, extremely long periods without precipitation may result
in excessively high storage volumes, which could make the system economically unviable. Concerning the
water demand, its relation to the storage size is relevant but not direct. Palla et al. (2011) concluded that
high demand fractions limit the performance of RWH systems without being significantly influenced by the
storage volume. Similarly, low demand fractions guarantee a high efficiency of the system, irrespective of
its storage capacity. “Only when the demand fraction is close to unity, can the quantitative performance
of rainwater harvesting system[s] be maximized through suitable sizing of the storage tank” (Palla et al.,
2011, p. 69). In any case, the performance of a tank is not strictly proportional to its size. A smaller tank
would be filled and emptied often while a large tank would be cycled rarely (Helmreich & Horn, 2009).
This is an important consideration because, in many cases, the storage tank size will also depend on the
available space and affordability by individual households (Aladenola & Adeboye, 2009), and oversizing
the tanks does not necessarily imply further advantages. Similarly, an excessively small tank will result in
high overflow rates, lowering the potential for a specific area.
32
B. QUALITATIVE ASPECTS
In addition to these quantitative aspects, qualitative considerations also need to be part of the design of
a RWH system. In most cases, RWH systems include quality control mechanisms that vary, depending
on the future use of the collected water (Shaffer & Leggett, 2002). Rainwater is considered to be relatively
unpolluted water, so the required treatment for non-drinking purposes is generally only limited to filtration
(Zhang, Gersberg, Wilhelm, & Voigt, 2009). However, if used for drinking purposes, rainwater needs to
be treated and disinfected in order to eliminate all the pollutants and meet the applicable potable water
standards (Central City Concern, 2009). While there are different types of treatments available to achieve
potable water quality, in many countries it is still not permitted to use harvested rainwater for drinking.
In these cases, regulatory changes become necessary for achieving water independence (Central City
Concern, 2009). The design of the system may impact the quality of the harvested water and therefore
the cost of the future treatment. Since the catchment surface material itself is often the main source
of pollutants (Shaffer & Leggett, 2002), its selection is also important for qualitative reasons. Organic
roofs (Fig. 3.4), such as reed and palm, are not recommended because they produce a dirty runoff
(Ersson, 2006). Similarly, roofs tied with bamboo gutters can generate health hazards (Helmreich & Horn,
2009). Green roofs (Fig. 3.5) are considered a good option since they can even improve the quality of
the harvested water through a filtration process. Metal roofs (Fig. 3.6) made of treated steel or aluminium
are also viable options, as they have the advantage of being relatively smooth and less prone to dust,
leaves, or bird-dropping contamination than other types of roofs. They can also reach high temperatures
by solar radiation which could automatically sterilize them (Ersson, 2006). However, zinc and copper roofs,
or roofs with metallic paint or coatings, should not be considered because they can lead to high heavy
metal concentrations (Helmreich & Horn, 2009). Other than metal roofs, low or non-polluted rainwater
can generally be harvested from roofs constructed with clay, ceramic, and/or concrete tiles or slates
(Helmreich & Horn, 2009) (Fig. 3.7). Finally, plastic roofs are not recommended because they are neither
inexpensive nor durable and roof paints that include bitumen should also be avoided (Ersson, 2006).
Fig. 3.4. Thatched roof in Hungary, detail. By Zyance (Own work). CC-BY-3.0 (http://creativecommons.org/licenses/by/3.0), via Wikimedia Commons.
Fig. 3.5. Norðragøta, Faroe Islands. By Erik Christensen, Porkeri (Contact at the Danish Wikipedia). CC-BY-SA-3.0 (http://creativecommons.org/licenses/by-sa/3.0/), via Wikimedia Commons.
Fig. 3.6. Lakota MS PV array 1. By Architectsea (Own work). CC-BY-SA-3.0 (http://creativecommons.org/licenses/by-sa/3.0), via Wikimedia Commons.
Fig. 3.7. Red tile roof repair. By Downtowngal (Own work). CC-BY-SA-3.0 (http://creativecommons.org/licenses/by-sa/3.0), via Wikimedia Commons.

33
3.2 Demand Reduction
3.2.1 WASTEWATER RECYCLING
Wastewater recycling is a strategy for water demand management that allows for significant reductions in
potable water use. Reusing the greywater and/or the blackwater generated in buildings keeps the water
required for their functioning in a closed loop, thereby reducing their dependence on external freshwater
sources (Jefferson, Laine, Parsons, Stephenson, & Judd, 2000). Moreover, this strategy reduces the
pressure on wastewater treatment infrastructure (Mandal et al., 2011). Seen from a water footprint
perspective, greywater recycling can help reduce both the operational blue and grey water footprints of a
project at the same time. Moreover, demand variability due to tourism demand fluctuations throughout the
year does not affect this strategy either, since higher demand periods will also result in a higher greywater
availability.
Even though wastewater recycling in the last decades has mainly focused on greywater, new technologies
have recently allowed several buildings to treat and reuse blackwater as well. The International Plumbing
Code defines greywater as “waste discharged from lavatories, bathtubs, showers, clothes washers, and
laundry trays” (International Code Consortium, 2012, p. 12). On the other hand, blackwater is characterized
by higher concentrations of organic material, nutrients and pathogens than greywater (Gallagher &
Sharvelle, 2009). Blackwater definitions vary, but it always includes wastewater discharged by urinals and
toilets. For this research, wastewater from kitchen sinks and dishwashers is also considered as blackwater.
As for RWH systems, both quantitative and qualitative aspects are analyzed and presented here.
Fig. 3.8. WasteWater. By Palintest Ltd (Own work). CC-BY-SA-3.0 (http://creativecommons.org/licenses/by-sa/3.0), via Wikimedia Commons.
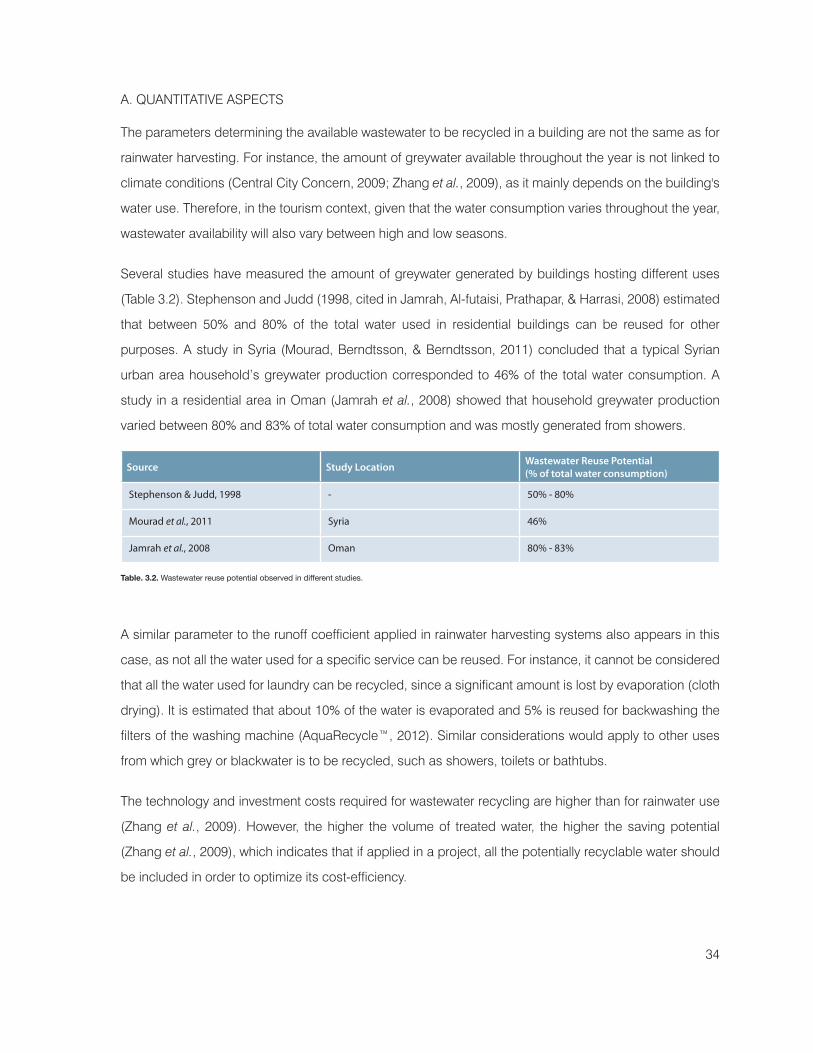
34
A. QUANTITATIVE ASPECTS
The parameters determining the available wastewater to be recycled in a building are not the same as for
rainwater harvesting. For instance, the amount of greywater available throughout the year is not linked to
climate conditions (Central City Concern, 2009; Zhang et al., 2009), as it mainly depends on the building's
water use. Therefore, in the tourism context, given that the water consumption varies throughout the year,
wastewater availability will also vary between high and low seasons.
Several studies have measured the amount of greywater generated by buildings hosting different uses
(Table 3.2). Stephenson and Judd (1998, cited in Jamrah, Al-futaisi, Prathapar, & Harrasi, 2008) estimated
that between 50% and 80% of the total water used in residential buildings can be reused for other
purposes. A study in Syria (Mourad, Berndtsson, & Berndtsson, 2011) concluded that a typical Syrian
urban area household’s greywater production corresponded to 46% of the total water consumption. A
study in a residential area in Oman (Jamrah et al., 2008) showed that household greywater production
varied between 80% and 83% of total water consumption and was mostly generated from showers.
Source Study Location Wastewater Reuse Potential(% of total water consumption)
Stephenson & Judd, 1998 - 50% - 80%
Mourad et al., 2011 Syria 46%
Jamrah et al., 2008 Oman 80% - 83%
A similar parameter to the runoff coefficient applied in rainwater harvesting systems also appears in this
case, as not all the water used for a specific service can be reused. For instance, it cannot be considered
that all the water used for laundry can be recycled, since a significant amount is lost by evaporation (cloth
drying). It is estimated that about 10% of the water is evaporated and 5% is reused for backwashing the
filters of the washing machine (AquaRecycle™, 2012). Similar considerations would apply to other uses
from which grey or blackwater is to be recycled, such as showers, toilets or bathtubs.
The technology and investment costs required for wastewater recycling are higher than for rainwater use
(Zhang et al., 2009). However, the higher the volume of treated water, the higher the saving potential
(Zhang et al., 2009), which indicates that if applied in a project, all the potentially recyclable water should
be included in order to optimize its cost-efficiency.
Table. 3.2. Wastewater reuse potential observed in different studies.

35
B. QUALITATIVE ASPECTS
Different treatment options achieve varying water quality levels for recycled wastewater. The choice of the
treatment type and also the level of the treatment depend on several factors, including the end use of the
recycled water, the grey and blackwater sources, the properties of the pollutants to be removed or the cost
and energy demand corresponding to each treatment alternative (Cheremisinoff, 2002).
Similar to harvested rainwater, the level of treatment that wastewater should receive before being reused
depends on its end uses (Mourad et al., 2011). As an example, for toilet flushing, water needs to be treated
to avoid smell and transport of bacteria and viruses (Mourad et al., 2011), since the presence of organic
compounds increases the risk of microbial growth in the distribution system and cisterns (Windward et al.,
2008 cited in Mourad et al., 2011).
The treatment type also depends on the nature of the harvested water, as each type of wastewater has
different characteristics. Compared to blackwater, greywater contains lower levels of organic contaminants,
nutrients and pathogens (Gallagher & Sharvelle, 2009), but some sort of biological treatment is usually
necessary to guarantee the absence of risks associated with its reuse (Nolde, 2000, Winward et al., 2007
cited in Zhang et al., 2009). The composition of each type of wastewater depends on several factors, such
as the water source, the plumbing system, or the living habits (e.g. laundry or bathing habits, chemical
composition of the cleaning products, etc.) (Al-Jayyousi, 2003; Badadoost, 1998; Jamrah et al., 2004 cited
in Jamrah et al., 2008). For instance, laundry greywater is characterized as containing less nitrogen and
phosphorus and a higher pH than other greywater types (Eriksson et al., 2002 cited in Mourad et al., 2011).
Wastewater purification requires the removal of a series of pollutants in order to meet the established
water quality standards. Wastewater can be contaminated by heavy metals, turbidity, organic compounds
and pathogens, such as bacteria and viruses (Cheremisinoff, 2002). There are multiple technologies and
processes involved in the most modern wastewater treatment schemes (Cheremisinoff, 2002), each of them
generally focusing on one or several types of pollutants. The most common methods include biological
processes, such as aeration, in some cases using active sludge (Haandel & Lubbe, 2012); physical
processes such as filtration, in some cases enhanced by chemical additives; or combined technologies,
such as membrane bio-reactors. Plant-based systems, which have been used more frequently in recent
years, imitate natural processes for water purification, such as the ones that occur at wetlands.
Treatment types can be classified in different ways, such as conventional vs. more recent technologies or
mechanical vs. natural processes. Depending on where the wastewater is treated with respect to its source,

36
it can be classified into either on-site or off-site treatment. Off-site wastewater treatment, also known as
centralized wastewater treatment, generally happens at a municipal treatment plant. The capacity of these
plants depends on the volume of water to be treated, according to the size of the city or neighbourhood to
be served. Remote tourism destinations, on which this thesis is focused, typically do not have access to
municipal wastewater treatment plants, and therefore need to treat the wastewater they produce on-site.
But on-site treatment is not exclusive to urban development taking place on isolated environments such as
small islands. Small or remote urban areas located on the mainland, and also in some rural areas, may not
have access to centralized treatment either. Moreover, on-site or decentralized treatments are nowadays
being incorporated into buildings that have access to municipal treatment plants, as a means of reducing
their own potable water demand, by reusing their own wastewater, as well as for reducing the pressure on
the municipal infrastructure.
The cost and energy demands of the treatment process need special attention too, particularly at
remote tourism destinations that rely on fossil fuels for their energy supply. Treating grey and blackwater
separately generally reduces the cost of the process (Kreysig, 1996 cited in Jamrah et al., 2008), since
each type of treatment is selected according to the nature of the water source and the minimum quality
requirements for its end use. Therefore, in order to optimize treatment costs, it is recommended to reuse
the wastewater containing the higher levels of contaminants for usages requiring lower water quality, such
as toilet flushing or irrigation (Central City Concern, 2009; Thomas, 2012). However, while this separation is
easily achievable in new buildings, it can be difficult to apply in existing buildings using a centralized water
distribution system (Eriksson et al., 2003 cited in Jamrah et al., 2008). Furthermore, newer technologies
can also reduce the energy and carbon emissions associated with the recycling process, in some cases
achieving an energy positive treatment (Lazarova, Choo, & Cornel, 2012).
3.2.2 IMPROVED EFFICIENCY
Another strategy for reducing the water demand of a project is the incorporation of efficient water devices.
Efficient devices include plumbing fixtures, such as toilets or shower heads, efficient appliances, like
washing machines or dishwashers, and irrigation systems. The objective of this strategy is to reduce the
water needed for each service without interrupting its appropriate functioning, which means using the
water in a more efficient way.
The potential for water conservation by replacing old devices with more efficient ones has been tested in
several buildings in the past (Table 3.3). A case-study in Teheran (Bidhendi, Nasrabadi, Vaghefi, Hoveidi,
& Jafari, 2008) showed a 19% total water use reduction for an apartment complex after retrofitting. A study

37
in Sicily (Roccaro, Falciglia, & Vagliasindi, 2011), Italy, analyzed the water savings for two houses (A and B)
after applying efficient plumbing products coupled with educational measures (brochures showing water
saving tips), and obtained a 9% average reduction for house A and 19% for house B. The results of a test
in Tampa, Florida, USA (Mayer, DeOreo, Towler, Martien, & Lewis, 2004 cited in Willis et al., 2011), showed
a reduction potential of almost 50%. Based on similar studies in Australia and the USA, Inman and Jeffrey
(2006) concluded that between 35% and 50% indoor water use reduction can be achieved through the
application of highly efficient devices.
Source Study Location Water saving potential based on efficiency improvement strategies
Bidhendi et al., 2008 Teheran (Iran) 19% for an apartment complex
Roccaro et al., 2011 Sicily (Italy) 9% and 19% for two different houses (includes educational measures)
Mayer et al., 2004 Tampa (USA) 50%
Inman & Jeffrey, 2006 Australia and USA between 35 and 50%
Other studies focus on users' acceptance of these kinds of appliances, showing that the most significant
barrier to applying them is the high cost of these devices (Dolnicar & Hurlimann, 2010). Their willingness
to apply them is therefore dependent on their capacity to acquire and apply them. However, this is not
applicable to the context of tourism, since tourists do not have decision-capacity over the application
of these fixtures at the hotels where they stay. It is, on the contrary, the accommodation management's
responsibility to implement them.
The different options for water conservation through improved efficiency are classified into the following
categories: efficient plumbing fixtures, efficient appliances and efficient landscaping.
EFFICIENT PLUMBING FIXTURES
Efficient plumbing fixtures refer to water-related devices connected to the plumbing system which
consume less water than conventional devices offering the same services. These fixtures include toilets,
shower heads, aerators for kitchen and lavatory faucets and urinals. WaterSense®, a partnership program
sponsored by the United States Environmental Protection Agency (USGBC, 2003), offers an overview of
reduced water use levels that can be achieved through the application of these plumbing fixtures. LEED
Reference Guide for New Construction (USGBC, 2003) measures the performance to be achieved in water
Table. 3.3. Water saving potential through improved efficiency observed in different studies.

38
conservation by the use of efficient fixtures through a comparison between WaterSense Standards and the
UPC (Uniform Plumbing Code) and IPC (International Plumbing Code) Standards (Table 3.4).
Fixture UPC and IPC Standards EPA WaterSense Standards
Water closets (gallons per flush, gpf ) 1.60 1.28
Urinals (gpf ) 1.00 0.5
Shower Heads (gallons per minute, gpm) 2.50 1.5 - 2.0
Public lavatory faucets and aerators (gpm) 0.5 -
Private lavatory faucets and aerators (gpm) 2.2 1.5
Kitchen and janitor sink faucets 2.20 -
In the context of tourism, special attention needs to be given to the use of low-flow shower heads, as
contrary to other efficient fixtures, such as dual-flush toilets, their use can impact the amenity’s performance
and therefore produce a negative reaction by tourists. In some cases, standards for new shower heads
include comfort ratings in order to guarantee a minimum comfort level for users (Stone, 1996).
EFFICIENT APPLIANCES
In addition to the use of the previously described plumbing fixtures, a significant indoor water use
reduction can be obtained by the incorporation of water efficient appliances, such as clothes washers
and dishwashers. In tourism, laundry and restaurants consume large amounts of water, therefore the
incorporation of these appliances can significantly impact the total water use of the facility.
ENERGY STAR™, an international standard for efficient products, certifies clothes washers that consume
35% less water than conventional ones, 15 gallons per load compared to the 23 gallons used by standard
washing machines (ENERGY STAR, 2013a). Similarly, dishwashers using less than 4.25 gallons of water
per cycle are also certified (ENERGY STAR, 2013b). The use of efficient appliances like these helps reduce
not only water but also energy demands in buildings, which, in the case of remote destinations, is another
common goal in the context of sustainable development.
Table. 3.4. UPC and IPC standards for plumbing fixture water use. Source: USGBC, 2009.

39
EFFICIENT LANDSCAPING
The presence of gardens at coastal resorts is frequent and in some cases the amount of freshwater
required to maintain them is very high. A study of several tourism facilities' water use in Zanzibar (Gössling,
2001) showed that hotels with extensive gardens require an average of up to 50% of the total freshwater
consumption. Different landscape design strategies aim to reduce the need for garden irrigation, which
can greatly contribute to reducing the whole water demand of resorts.
The previously described strategies, rainwater harvesting and wastewater recycling, present an opportunity
to significantly reduce outdoor potable water use. Water reuse for irrigation has been widely applied
worldwide in recent decades, as the lower quality requirements when compared with indoor water reuse
do not imply complex or expensive treatment processes (Dixon, Butler, & Fewkes, 1999). However, some
considerations are always necessary. If wastewater is reused for irrigation, special attention should be
given to the presence of sodium because of its environmental damage potential (Misra and Sivongxay,
2009 cited in Mourad et al., 2011). While other metals, microorganisms and complex organic compounds
may entail additional environmental risks (Finley, Barrington, & Lyew, 2009), on the contrary, the presence
of nutrients can in some cases have a positive impact, both organically and financially, as the need for
fertilizers is reduced (Friedler, 2004; WHO, 2006 cited in Mandal et al., 2011). Edible food gardens also
require special attention, as the presence of heavy metals or pathogenic microorganisms can generate
health risks.
The use of smart irrigation systems is another strategy for reducing outdoor water use. Drip irrigation (Fig.
3.9), providing small amounts of water directly to the root systems of plants, offers an increased yield
when compared with other methods, such as sprinkler irrigation (Fig. 3.10) (Bernstein & Francois, 1973).
Appropriate irrigation timing is also crucial for increasing the efficiency of the water used for this purpose.
Fig. 3.9. Irrigation dripper. By Fir0002/Flagstaffotos. CC-BY-NC-3.0 (http://creativecommons.org/licenses/by-nc/3.0), via Wikimedia Commons.
Fig. 3.10. A picture of a sprinkler watering a lawn. By Fir0002. CC-BY-SA-3.0 (http://creativecommons.org/licenses/by-sa/3.0), via Wikimedia Commons.

40
Timing strategies include watering gardens at an adequate time and frequency, generally avoiding high
evaporation rates in the middle of the day, and for the optimum duration (United States Environmental
Protection Agency, 2013b). New technologies such as soil moisture sensors or rain sensors, combined
with shutoff systems, allow for an automatic interruption of the irrigation process when it is not required
(United States Environmental Protection Agency, 2013c).
However, the most efficient way to reduce outdoor water use is an appropriate landscape design. Plant
selection, i.e., prioritizing the use of native and drought tolerant plants, limits the need for irrigation in
extreme weather condition situations (United States Environmental Protection Agency, 2013a). Furthermore,
an adequate landscape design eliminates the need for additional strategies, such as the previous
ones (outdoor water reuse or smart irrigation systems), as their saving potential is drastically reduced
(Muthukumaran, Baskaran, & Sexton, 2011). This way, harvested rainwater or recycled wastewater can be
reused for other indoor purposes, the demand reduction of which cannot be achieved by other strategies,
contributing to an improved performance of the whole water system.
3.2.3 IMPROVED BEHAVIOUR
In order to achieve the most ambitious water goals, all the previous strategies need to be incorporated
into the design of coastal tourism facilities. However, in many cases, the anticipated performance during
the design process of these strategies does not correspond to the actual building use during its operation
(Cole, 2010). Since tourists are directly responsible for much of the total water use in tourism facilities, their
commitment to sustainability goals is necessary to assure their achievement. Conventional assumptions
about tourists, who are generally considered as passive users of the accommodation facilities, need to
evolve and embrace recent trends in green building design, in which a new series of responsibilities and
commitments are being required of building users (Brown, O’shea, Cole, & Robinson, 2008).
Outside the context of tourism, several studies have analyzed the potential for water conservation based
on different measurements that focus on the building user. A study in Sicily (Italy) by Roccaro et al. (2011)
monitored and compared the effectiveness of structural and non-structural strategies in a series of
projects with different uses. All the previous strategies (as described in Section 3.2.2) would correspond
to structural measures as their level of performance does not depend on the user’s behaviour. Non-
structural measures include economic incentives or educational programs. The results showed that the
consumption reduction obtained through non-structural strategies were negligible when compared with
that obtained by structural measures (Roccaro et al., 2011). This study also showed that the application
of structural measures reduces the amount of water wasted by users, which minimizes the potential for

41
further water saving through educational programs (Roccaro et al., 2011). Moreover, other studies have
demonstrated that only non-structural measures, i.e., not involving personal sacrifice or comfort reduction,
such as water pricing and economic incentives, have the potential to change the behaviour of water users
(Gilg & Barr, 2006).
In the tourism context, non-structural measures to reduce guest water consumption have been applied at
many hotels worldwide. For instance, it has become common practice to let guests choose whether or not
to have their bath towels washed everyday (Fig. 3.11). More recently, some hotels are linking energy and
water saving opportunities with economic incentives for guests by rewarding them with a daily small credit
to be used at the hotel if they opt out of housekeeping services (Nassauer, 2010). However, the high water
consumption by guests observed at some destinations when compared to local residents suggests that
more commitment from the individual tourist is necessary to further reduce demand (Yang et al., 2011).
Different strategies for guest behaviour improvement are therefore necessary in order to increase their
commitment to resource conservation. In their analysis of the relationship between lifestyle, environmental
awareness, and water saving in Spanish housing, Mondéjar-Jiménez et al. (2011) concluded that a higher
awareness leads to an increased disposition to save water. Increased awareness about the water problem
is therefore one of the keys to improving behaviour. The design of the tourism facilities is crucial in this
Fig. 3.11. Daily towel-changing card. Source: www.apir.com
Fig. 3.12. Shower use instructions. Hotsprings Valley Retreat. Yukon, Canada.

42
sense. The benefits of the water-related strategies could be greater if these technologies and strategies
are made more transparent. ’Transparency’ is here understood as allowing “something that was previously
latent to become visible” (Ockman & Lasansky, 2004, p. 235 cited in Owen, 2007b).
Accordingly, Mitchell (2005) identifies a series of actively instructional green building strategies (interpretive
signage, exposed building systems, real-time monitoring, and green building tours) and defines ‘triggers’
as design solutions that stand out in some way to cause an occupant to pause and reflect on their purpose
(Fig. 3.13). In order to be effective, these triggers must be easily noticed, linked to an environmental
message, and interact with the occupants of the building (A. Mitchell, 2005).
But awareness is not the only component leading to improved behaviour. Guests also need to understand
the impact that their actions may have on the building’s performance. Design strategies need to direct
tourists’ attention to the problems they resolve, and, through inviting them to participate, help them acquire
knowledge, discipline and useful skills that cannot be acquired other than by taking the appropriate action
(Orr, 1993).
Also, their involvement must not entail a loss of comfort or harm the recreational experience. It has been
observed in some studies that attitudes become actions only when it is easy and not inconvenient for the
user to do so (Dolnicar & Hurlimann, 2010). In this sense, providing guests with tools and easy ways of
participating should enhance their experience, in accordance to some studies that show that the level
of satisfaction at the accommodation is “linked to awareness and involvement in the environmental
management practices” (Lee & Moscardo, 2005, p. 563). Through this interaction process, guests would
receive a “first-hand experience” of living in a more sustainable way and would be able to verify whether
(or not) this new lifestyle implies a major change (Anderson, 2009).
In accordance with these principles, Beyer et al. (2005) define a “best practice model for tourism facilities
in remote areas” in which “interpretation leading to education” is one of the key “product assessment
criteria” leading to the development of low impact facilities. According to this model, sustainable design
INTERACTION
placement in buildings &occupant’s behaviour circuits
noveltyunconventionalresponsive
understandingenvironmental iconlinks to pro-E constructs
PAUSE REFLECTCONSTRUCT
UPDATEAFFECT RESPONSE
Fig. 3.13. The structure of a trigger. Mitchell, 2005.

43
“must be evident”, and contribute to a “heightened consumer awareness, appreciation and understanding
of environmental processes” arguing that “the more personal interpretation leads to a better experience”
(Beyer et al., 2005, p. 7). Also, some existing benchmarking systems related to sustainable tourism, such
as Green Globe Design and Construct Standard already include this principle implicitly, by identifying
the design as one of the key strategies to achieve the goal of enhancing the visitor’s understanding and
integration with the environment (Hyde et al., 2004 cited in Owen, 2007b).
As far as the aesthetics are concerned, some anthropologists assume that ecotourists are generally
more concerned than other types of tourists about “the physical and aesthetic properties of locations
in which they will spend their leisure time” (Peace, 2005 cited in Owen, 2007a). The construction of new
facilities should be understood as a contemporary interpretation rather than a reproduction of traditional
architecture, in which the integration of rainwater guttering and tanks or other systems would express the
self-sufficiency aspirations of the resorts (Howard, Hes, & Owen, 2008). As a consequence, the exposure
to these technologies could help to accelerate the process of accepting a new design style (Anderson,
2009). After all, the real objective of sustainable tourism is to mitigate its negative impact, and “the most
important thing about an ecolodge is that the ecolodge is not the most important thing” (Ceballos-
Lascurain, 1996 cited in Owen, 2007b).
3.3 Precedent Study. CIRS Building
While most of the previously described strategies have already been widely applied in the context of
green building and sustainable tourism, some projects have taken some of these ways for improving
water management to the next level. The Centre for Interactive Research on Sustainability (CIRS), at the
University of British Columbia in Vancouver, is one example (Fig. 3.14). Ten years after conceiving the idea
of creating “the greenest building in North America”, CIRS, designed by Perkins+Will, started operating in
September 2011 (University of British Columbia, 2013).
Fig. 3.14. CIRS Building, UBC Vancouver campus, Canada. By James Kruk (Own work) [CC0], via Wikimedia Commons.

44
CIRS not only offers space for multidisciplinary education and research, but also embraces some of
the most challenging sustainability goals, aiming to be energy net-positive, water self-sufficient, and net-
zero in structural and operational carbon emissions. Moreover, the building has been described as a
“living laboratory” that allows research, not only into sustainable building technology but also on the
impacts of its inhabitants’ actions. User participation and behavioural improvement are also part of the
goals of the building. Real-time monitoring of continuous measures of the performance of the building
allows researchers to identify areas for optimization. Performance levels in different categories (i.e. energy,
carbon, water) are displayed in the atrium in a comprehensive way for users to understand how the
building works (University of British Columbia, 2013).
On the energy side, photovoltaic cells located on part of the roof provide electricity. Solar tubes and a
heat recovery system are used to pre-heat domestic hot water. Passive design strategies, together with a
high-performance envelope, minimize energy loads. And, in order to become energy-positive, the excess
heat generated by heat-pumps at CIRS is transferred to the adjacent Earth and Ocean Science building,
reducing energy demand on the campus steam system. Additionally, control over personal spaces is
provided for building users (University of British Columbia, 2013).
As far as water is concerned, CIRS is 100% dependent on rainwater and all the wastewater generated in
the building is treated and recycled for several uses. Two main systems allow these two objectives to be
achieved.
Fig. 3.15. Green roof. CIRS Building, UBC Vancouver campus, Canada. Photo: Martin Tessler. Courtesy: Perkins+Will.

45
RAINWATER HARVESTING SYSTEM
The CIRS harvests rainwater from the rooftops of the two main wings of the building, which make available
a 1000 square meter catchment area. Rainwater falling on the living roof over the lecture hall (Fig. 3.15)
is not harvested, as the presence of particulate matter from the green roof could damage the treatment
system. Located on a site with an average annual rainfall of 1226mm, such a catchment area could provide
1226000 litres per year, enough to cover the building’s estimated demand of 2000 litres per day. However,
the rainfall pattern in Vancouver presents a drier period between June and September, so enough water
needs to be collected throughout the rest of the year to satisfy the water demand during the summer. For
that purpose, a 100 cubic meter (100 000 litres) cistern underneath the building serves as water storage,
from which 57000 litres need to be continually available for the fire suppression system. It has to be
considered, though, that the building water demand is also lower during the summer period, due to a
lower presence of students and staff at this time of the year (NovaTec Consultants Inc., 2012). Contrary
to the case of tourism, in this case, rainwater availability and demand throughout the year present similar
evolution patterns.
As described above, the rainwater harvesting system is similar to any other rainwater harvesting system.
What makes this system special is that the harvested water is not used for non-potable uses but for
potable ones. The services using this water include showers, bathroom and kitchen sinks, and drinking
water for the cafe located on the main floor. Treating harvested rainwater for potable use is required for
achieving a net-zero water scenario, as otherwise potable water would need to be obtained from the
municipal supply. The treatment process is the following:
Fig. 3.16. Rainwater harvesting system. CIRS Building, UBC Vancouver campus, Canada. Photo: Perkins+Will.

46
The collected rainwater is first stored in a water tank before being treated. From this tank, harvested
rainwater undergoes a treatment process of several steps, including a slow sand filter, a cartridge filter,
and a granular activated carbon filter. At the end of this process, water is disinfected by an ultraviolet unit
and chlorination, and pH is adjusted by adding either sodium bicarbonate or sodium hypochlorite, before
flowing into the treated rainwater storage tank. A backup municipal supply provides water in case of
insufficient rainfall (NovaTec Consultants Inc., 2012).
WASTEWATER RECYCLING SYSTEM
A Solar Aquatics System™ located on the main floor treats all the wastewater generated by the building,
including blackwater. In addition, water from the campus sewer system is also incorporated into the
treatment process and reused in the building. The Solar Aquatics System was designed by Eco-Tek,
Ecological Technology Inc. This system mimics natural processes to produce clean water, which is reused
for toilet flushing and irrigation.
Sewage flows by gravity from the building and from the campus sewer into a collection buffer tank, which
is the only component of the whole system located underground. From this tank, water flows into an
aerated blending tank. Then water overflows by gravity into two aerobic tanks, in which bacteria from the
water gets attached to the roots of a group of aquatic and terrestrial plants (Fig. 3.17). Through a conical
bottom gravity clarifier, where bacteria is settled, water is then conducted to a sand filter, where particulate
matter is removed before water is discharged into the constructed wetland. In this wetland, a number of
plants extract the phosphorus and nitrogen from the effluent. Water is then pumped through a series of
filters, in which turbidity is controlled. Finally, water passes through an ultraviolet disinfection unit and is
stored in the treated-water tanks (EcoTek. Ecological Technologies Inc., 2012).
Fig. 3.18. Gravity clarifiers. Solar Aquatics SystemTM. CIRS Building, UBC Vancouver campus, Canada.
Fig. 3.17. Aerobic tanks. Solar Aquatics SystemTM. CIRS Building, UBC Vancouver campus, Canada.
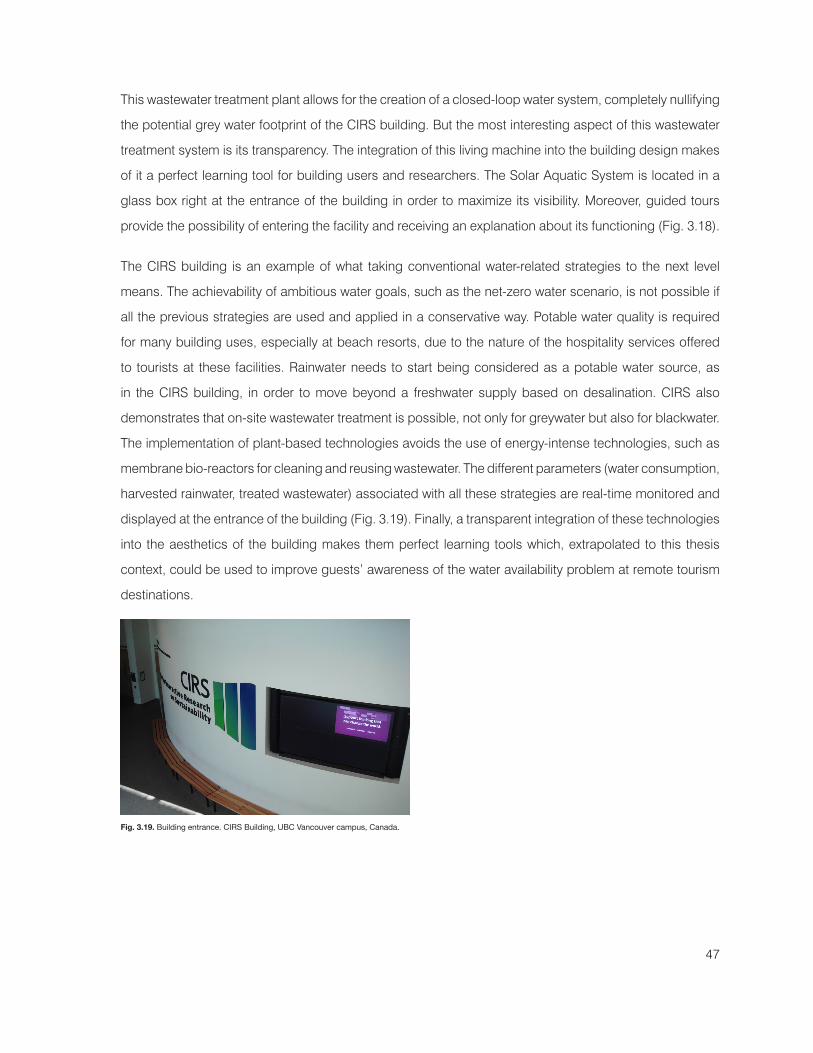
47
This wastewater treatment plant allows for the creation of a closed-loop water system, completely nullifying
the potential grey water footprint of the CIRS building. But the most interesting aspect of this wastewater
treatment system is its transparency. The integration of this living machine into the building design makes
of it a perfect learning tool for building users and researchers. The Solar Aquatic System is located in a
glass box right at the entrance of the building in order to maximize its visibility. Moreover, guided tours
provide the possibility of entering the facility and receiving an explanation about its functioning (Fig. 3.18).
The CIRS building is an example of what taking conventional water-related strategies to the next level
means. The achievability of ambitious water goals, such as the net-zero water scenario, is not possible if
all the previous strategies are used and applied in a conservative way. Potable water quality is required
for many building uses, especially at beach resorts, due to the nature of the hospitality services offered
to tourists at these facilities. Rainwater needs to start being considered as a potable water source, as
in the CIRS building, in order to move beyond a freshwater supply based on desalination. CIRS also
demonstrates that on-site wastewater treatment is possible, not only for greywater but also for blackwater.
The implementation of plant-based technologies avoids the use of energy-intense technologies, such as
membrane bio-reactors for cleaning and reusing wastewater. The different parameters (water consumption,
harvested rainwater, treated wastewater) associated with all these strategies are real-time monitored and
displayed at the entrance of the building (Fig. 3.19). Finally, a transparent integration of these technologies
into the aesthetics of the building makes them perfect learning tools which, extrapolated to this thesis
context, could be used to improve guests’ awareness of the water availability problem at remote tourism
destinations.
.
Fig. 3.19. Building entrance. CIRS Building, UBC Vancouver campus, Canada.

48
4 WATER FOOTPRINT DESIGN TOOL
CALCULATING THE WATER FOOTPRINT OF A BEACH RESORT
Based on the previously described water strategies, this section assesses the potential for achieving
the net-zero water scenario defined in chapter 2, for a case-study in the Maldives. In order to do that,
a spreadsheet-based calculator, the “Water Footprint Design Tool” (Tool) is proposed. This Tool allows
us to estimate the direct water footprint and all its sub-components for the case-study, in this case, an
existing beach resort. This quantitative analysis is based on daily metered water-use data provided by
the resort and daily rainfall data obtained from the Maldivian Meteorological Agency. In the first stage, the
Tool calculates the annual direct water footprint of the assessed project under its current conditions and
then allows the designer to foresee the potential impact on the different footprint components of a number
of water-related strategies. All the strategies described in chapter 3 are included: rainwater harvesting,
wastewater recycling and water conservation. Even though the application of the Tool is illustrated in this
thesis through an existing project, the Water Footprint Design Tool is conceived as applicable also to new
projects. In these cases, due to the absence of metered water data for the designed project, the water-use
pattern introduced in the Tool needs to be based on measurements from projects which are similar in size
and program.

49
4.1 Water Footprint Design Tool Components
The Water Footprint Design Tool (the Tool) developed for this research is a spreadsheet-based calculator
that allows design teams to foresee the impacts of a series of water strategies on the different water
footprints of a building and its site. The Tool is composed of 2 spreadsheet pages linked to each other.
The first page contains all the data and formulas associated with each water strategy and the second page
includes the Tool control panel and results.
The first page of the tool is composed of a series of groups of columns differentiated by colour. The
first group of columns, "water-use data" (Fig. 4.1), includes the demand pattern of the project, which is
introduced by the Tool user. Four additional groups of columns contain the formulas corresponding to
each water strategy (see section 4.2 Methodology): "rainwater harvesting" (Fig. 4.2), wastewater recycling
("greywater recycling" and "blackwater recycling") (Fig. 4.5), "efficient fixtures" (Fig. 4.4) and "education"
(Fig. 4.3). Finally, a last set of columns, entitled "water footprints", shows the different water footprint
components that result from the calculations (Fig. 4.6). This last set of columns is the data source for the
graphics, illustrating the results on the second page. All these groups of columns are divided into two sets
of rows (Fig. 4.6). The Tool calculates the annual water footprint using a daily time step. On the first row-
group, each cell corresponds to one day of the year, for a total of one whole year. The second row-group
summarizes the results on a monthly basis. All the cells on this second-row group automatically calculate
monthly values based on the daily-step calculations.
Fig. 4.1. Water Footprint Design Tool. Page 1: Set of columns for water-use data. The Tool user introduces in these cells the high-resolution demand pattern for the designed project. This set of columns includes all the different water uses included in the program of the building. The estimated daily consumption is introduced in litres for every day of the year.
Hoja1
Página 29
TIME WATER-USE DATAWATER-USE DATAWATER-USE DATAWATER-USE DATAWATER-USE DATAWATER-USE DATAWATER-USE DATAWATER-USE DATAWATER-USE DATAWATER-USE DATAWATER-USE DATAWATER-USE DATAWATER-USE DATAWATER-USE DATA
Guest rooms
Employees facilities Other
TOTAL (original
data)Showers+Sinks Toliets Swimming
Pools
TOTAL (original
data)Showers+Sinks Toliets Laundry Restaura
nts (1) Spa Process Water
Food Garden
sLandscaping Drinking
Q1 / GW Q3 / BW Q2 / - Q1 / GW Q3 / BW Q2 / GW Q1 / BW Q1 / GW Q2 / - Q2 / - Q3 / - Q1 / -jan 2823000 2258400 451680 112920 577000 461600 115400 607106 780000 96000 363000 193000 0 41000feb 2747000 2197600 439520 109880 404000 323200 80800 521783 702000 91000 376000 184000 0 38000mar 2861000 2288800 457760 114440 468000 374400 93600 585049 840000 114000 400000 250000 0 47000apr 2769000 2215200 443040 110760 440000 352000 88000 581001 857000 97000 318000 147000 0 48000may 2509000 2007200 401440 100360 442000 353600 88400 497424 815000 97000 314000 75000 0 42000jun 2012000 1609600 321920 80480 406000 324800 81200 394456 796000 70000 358000 36000 0 36000jul 2354000 1883200 376640 94160 448000 358400 89600 483983 822000 79000 461000 23000 0 40000aug 2538000 2030400 406080 101520 549000 439200 109800 586246 845000 90000 457000 131000 0 40000sep 2305000 1844000 368800 92200 464000 371200 92800 556565 755000 84000 432000 109000 0 39000oct 3055000 2444000 488800 122200 672000 537600 134400 641826 889000 112000 446000 206000 0 53000nov 3142000 2513600 502720 125680 607000 485600 121400 685495 868000 93000 426000 70000 0 45000dec 3573000 2858400 571680 142920 580000 464000 116000 691355 983000 106000 509000 28000 0 44000TOTAL 32688000 26150400 5230080 1307520 6057000 4845600 1211400 6832289 9952000 1129000 4860000 1452000 0 513000average 2724000 2179200 435840 108960 504750 403800 100950 569357 829333 94083 405000 121000 0 42750
jan1 97000 77600 15520 3880 15000 12000 3000 16390 26000 2000 11000 0 0 10002 96000 76800 15360 3840 16000 12800 3200 32173 34000 4000 17000 1000 0 10003 97000 77600 15520 3880 15000 12000 3000 26132 25000 3000 16000 2000 0 20004 84000 67200 13440 3360 16000 12800 3200 20401 27000 3000 14000 3000 0 10005 106000 84800 16960 4240 17000 13600 3400 23046 27000 3000 14000 4000 0 20006 93000 74400 14880 3720 18000 14400 3600 21536 27000 3000 11000 5000 0 10007 100000 80000 16000 4000 22000 17600 4400 21386 26000 4000 13000 6000 0 20008 125000 100000 20000 5000 20000 16000 4000 21000 25000 4000 14000 5000 0 1000

50
Fig. 4.2. Water Footprint Design Tool. Page 1: Set of columns for rainwater harvesting. The only data to be introduced by the user in this set of cells is the daily precipitation (mm) for the site location throughout a complete year (“rainfall” column). Based on the behavioural model described in section 4.2, the rest of the cells are filled automatically according to the RWH parameters established by the user on the control panel.
Fig. 4.3. Water Footprint Design Tool. Page 1: Set of columns for water conservation through education. The user does not introduce any data in this set of columns. All the cells are filled automatically according to the educational saving parameters established by the user on the control panel.
Fig. 4.4. Water Footprint Design Tool. Page 1: Set of columns for water conservation through efficient fixtures. The user does not introduce any data in this set of columns. All the cells are filled automatically according to the efficiency-related saving parameters established by the user on the control panel.
Fig. 4.5. Water Footprint Design Tool. Page 1: Set of columns for wastewater recycling. The user does not introduce any data in this set of columns. All the cells are filled automatically according to the wastewater recycling parameters established by the user on the control panel.
Hoja1
Página 57
TIME GRAYWATER RECYCLINGGRAYWATER RECYCLINGGRAYWATER RECYCLING BLACKWATER RECYCLINGBLACKWATER RECYCLINGBLACKWATER RECYCLING
SOURCE DEMAND overflow SOURCE DEMAND overflow
source - demand
source - demand
jan 0 475920 -475920 530400 538726 -8326feb 0 485880 -485880 477360 494304 -16944mar 0 514440 -514440 571200 523792 47408apr 0 428760 -428760 582760 504488 78272may 0 414360 -414360 554200 465348 88852jun 0 438480 -438480 541280 382964 158316jul 0 555160 -555160 558960 442928 116032aug 0 558520 -558520 574600 490086 84514sep 0 524200 -524200 513400 438520 74880oct 0 568200 -568200 604520 592040 12480nov 0 551680 -551680 590240 592914 -2674dec 0 651920 -651920 668440 653296 15144TOTAL 0 6167520 -6167520 6767360 6119406 647954average 0 513960 -513960 563947 509951 53996
jan1 0 14880 -14880 17680 17594 862 0 20840 -20840 23120 17632 54883 0 19880 -19880 17000 17594 -5944 0 17360 -17360 18360 15808 25525 0 18240 -18240 18360 19342 -9826 0 14720 -14720 18360 17556 8047 0 17000 -17000 17680 19380 -17008 0 19000 -19000 17000 22800 -5800
Hoja1
Página 71
TIME EFFICIENT FIXTURESEFFICIENT FIXTURESEFFICIENT FIXTURESEFFICIENT FIXTURESEFFICIENT FIXTURESEFFICIENT FIXTURESEFFICIENT FIXTURES
Saved waterSaved waterSaved waterSaved waterSaved waterSaved waterSaved water
Landscaping Laundry Kitchens Showers sinks Toilets Food
Gardens TOTAL
jan 0 91066 117000 408000 0 0 616066feb 0 78267 105300 378120 0 0 561687mar 0 87757 126000 399480 0 0 613237apr 0 87150 128550 385080 0 0 600780may 0 74614 122250 354120 0 0 550984jun 0 59168 119400 290160 0 0 468728jul 0 72597 123300 336240 0 0 532137aug 0 87937 126750 370440 0 0 585127sep 0 83485 113250 332280 0 0 529015oct 0 96274 133350 447240 0 0 676864nov 0 102824 130200 449880 0 0 682904dec 0 103703 147450 498360 0 0 749513TOTAL 0 1024843 1492800 4649400 0 0 7167043average 0 85404 124400 387450 0 0 597254
jan1 0 2459 3900 13440 0 0 197992 0 4826 5100 13440 0 0 233663 0 3920 3750 13440 0 0 211104 0 3060 4050 12000 0 0 191105 0 3457 4050 14760 0 0 222676 0 3230 4050 13320 0 0 206007 0 3208 3900 14640 0 0 217488 0 3150 3750 17400 0 0 24300
Hoja1
Página 85
TIME EDUCATIONEDUCATIONEDUCATIONEDUCATION
Saved waterSaved waterSaved waterSaved water
Guests + EmployeesGuests + EmployeesGuests + Employees
Laundry Showers Sinks
Toilets TOTALjan 25802 115600 28354 169756feb 22176 107134 26016 155326mar 24865 113186 27568 165619apr 24693 109106 26552 160351may 21141 100334 24492 145967jun 16764 82212 20156 119132jul 20569 95268 23312 139149aug 24915 104958 25794 155667sep 23654 94146 23080 140880oct 27278 126718 31160 185156nov 29134 127466 31206 187806dec 29383 141202 34384 204969TOTAL 290372 1317330 322074 1929776average 24198 109778 26840 160815
jan1 697 3808 926 54312 1367 3808 928 61033 1111 3808 926 58454 867 3400 832 50995 979 4182 1018 61796 915 3774 924 56137 909 4148 1020 60778 893 4930 1200 7023
Hoja1
Página 15
TIME RAINFALL RAINWATER HARVESTING YAS (Yield After Spillage)RAINWATER HARVESTING YAS (Yield After Spillage)RAINWATER HARVESTING YAS (Yield After Spillage)RAINWATER HARVESTING YAS (Yield After Spillage)RAINWATER HARVESTING YAS (Yield After Spillage)RAINWATER HARVESTING YAS (Yield After Spillage)
inflow demand stored volume outflow main
supply overflow
Qt Dt Vt Yt Mt Ot
2010 0jan 8 97200 2955400 2999514 916505 2038895 0feb 93 1127520 2723246 4556926 1127520 1595726 0mar 22 272160 2978534 151456 272160 2706374 0apr 88 1072845 2898464 1582794 1072845 1825619 0may 277 3364335 2696096 23420211 2173489 522607 0jun 236 2868615 2308628 31933119 2308628 0 0jul 222 2698515 2587792 12236967 2388757 199035 0aug 178 2157840 2802452 11376645 2454104 348348 0sep 341 4141935 2514524 21133370 1394561 1119963 0oct 69 841995 3275292 54506641 3275292 0 0nov 128 1557630 3252654 3009761 1758403 1494251 0dec 355 4316895 3624388 37918315 3624388 0 0TOTAL 2018 24517485 34617470 22766652 11850818 0average 168 2043124 2884789 17068810 1897221 987568 0
jan1 0 0 96452 722853 96452 0 02 0 0 105252 617601 105252 0 03 0 0 96602 520999 96602 0 04 0 0 90550 430449 90550 0 05 0 0 105408 325041 105408 0 06 0 0 97656 227385 97656 0 07 0 0 104912 122473 104912 0 08 2.4 29160 118920 32713 118920 0 0

51
On this first page, the Tool user needs to introduce two different sets of data, which are mandatory for
the Tool to be applicable: one for the precipitation pattern and the other, the project water demand. The
precipitation data is introduced into the rainwater harvesting column group (Fig. 4.2). It must be rainfall
data, in mm, metered on a daily basis, and it must come from a reliable source (for this case-study, it was
the Maldives Meteorological Agency, Appendix A). The Tool allows us to show the precipitation data for a
complete year. However, since precipitation patterns vary inter-annually, the obtained data should cover
a number of years, i.e., enough to include long-term precipitation variations from which to estimate best-
case, worst-case, and average scenarios (see 4.3 Scenario Definition below).
Second, a high-resolution water-use data package is required for the project in question. This second data
package has its own set of columns and refers to the demand pattern of the project (Fig. 4.1). This Tool is
proposed to be used by design teams at early stages of the design process of new projects. Consumption
data from the assessed project is therefore not available, and this demand pattern needs to be obtained
from projects hosting similar programs and therefore similar water demand patterns. The information
obtained from these similar projects needs to have been measured on a daily basis for at least one year.
If more than one year of data is provided, it is recommended that the Tool user employ the most recent
consumption data. If the Tool is applied to an existing project, as for the case-study presented in this thesis,
this data should come from the project under assessment. This sub-metered consumption data-set must
Fig. 4.6. Water Footprint Design Tool. Page 1: Set of columns for water footprints. The user does not introduce any data in this set of columns. All the cells are filled automatically according to the parameters established by the user on the control panel. The obtained monthly values are used to build the charts on Page 2.
MONTHLY SUMMARY
DAILY VALUES
(continues untilDecember 31st)
Hoja1
Página 43
TIME WATER FOOTPRINTSWATER FOOTPRINTSWATER FOOTPRINTSWATER FOOTPRINTSWATER FOOTPRINTS
ORIGINAL DESALINATED
WF
ORIGINAL GREY WF
DESALINATED WF RAIN WF GREY WF
jan 5480106 3816149 3274055 916505 2657091feb 5063783 3484722 2762120 1127520 2433752mar 5565049 3802887 3998085 272160 2608602apr 5257001 3706593 2921061 1072845 2514928may 4791424 3408051 1458301 2173489 2296291jun 4108456 2878381 829003 2308628 1866812jul 4710983 3274258 1209107 2388757 2178269aug 5236246 3605381 1553788 2454104 2438145sep 4744565 3257892 2246185 1394561 2208576oct 6074826 4198101 1384940 3275292 2903965nov 5936495 4215852 2738740 1758403 2929044dec 6514355 4632348 1314295 3624388 3200323TOTAL 63483289 44280615 25689681 22766652 30235799average 5290274 3690051 2140807 1897221 2519650
jan1 168390 122008 29115 96452 841452 201173 142666 48820 105252 959713 186132 129802 45576 96602 912384 168401 117633 37834 90550 799055 196046 137445 43832 105408 963286 179536 127053 38110 97656 877227 194386 135509 43969 104912 955698 215000 152000 47758 118920 109942

52
include a minimum separation between different uses (i.e., laundry, kitchens, toilets, showers, swimming
pools, etc.) in order to be able to contemplate the different types of wastewater (greywater, blackwater or
none) generated by each service and the required water quality (potable, non-potable) for each service.
Based on this separation, the provided demand data is introduced in Litres into the corresponding water-
use column for every day of the assessed year. In case the provided data does not include a differentiation
between all the different uses, the Tool allows its users to incorporate use percentages for some of these
services. For instance, if the sub-metered data for guest rooms does not include a separation between the
water required for toilet flushing and showers, the designer can introduce the estimated percentage for
each service on the control panel of the Tool, as this separation is necessary for the calculation process of
all the strategies. These percentages, if not provided by the operators, must be based on measurements
from projects with a similar program.
The second page of the Tool includes the control panel and the results obtained through the formulas on
page one. The control panel is again divided into several groups of cells, each of them linked to a water
strategy column group on page one. For the rainwater harvesting system, the Tool user must introduce the
catchment area (sqm), the runoff coefficient, storage tank size (L), and the services at the site for which the
harvested water is to be used. For grey and blackwater recycling, the user selects the wastewater sources
to be considered, including an evaporation coefficient for each of them, and specifies their future uses.
For efficient devices and improved behaviour, the user introduces the estimated saving percentage for a
series of services (Fig. 4.7).
Fig. 4.7. Water Footprint Design Tool. Page 2: Control panel. In this set of cells, the user establishes the conditions for the calculations made by the Tool on page 1.
original DESALINATE
D WF
original GREY WF
DESALINATED WF
RAIN WF GREY WF remaining grey + black
waterjanfebmaraprmayjunjulaugsepoctnovdecTOTALaverage
5480106 3816149 0 3274055 916505 2657091 -4842465063783 3484722 0 2762120 1127520 2433752 -5028245565049 3802887 0 3998085 272160 2608602 -4670325257001 3706593 0 2921061 1072845 2514928 -3504884791424 3408051 0 1458301 2173489 2296291 -3255084108456 2878381 0 829003 2308628 1866812 -2801644710983 3274258 0 1209107 2388757 2178269 -4391285236246 3605381 0 1553788 2454104 2438145 -4740064744565 3257892 0 2246185 1394561 2208576 -4493206074826 4198101 0 1384940 3275292 2903965 -5557205936495 4215852 0 2738740 1758403 2929044 -5543546514355 4632348 0 1314295 3624388 3200323 -636776
63483289 44280615 0 25689681 22766652 30235799 -55195665290274 3690051 0 2140807 1897221 2519650 -459964
0
1000000
2000000
3000000
4000000
5000000
6000000
7000000
jan feb mar apr may jun jul aug sep oct nov dec
original DESALINATED WF original GREY WF DESALINATED WF RAIN WF GREY WF
RAINWATER HARVESTINGRAINWATER HARVESTING GRAYWATERGRAYWATERGRAYWATER GUEST ROOMS distribGUEST ROOMS distribRecycled from: Evap. coeff Toilets 16%
roof area (m2) 13500 Laundry 0.80 Showers + Sinks 80%runoff coef 0.90 Showers/bathroom sinks 0.80 Swimming pools 4%S=tank volume (l) 4000000 Spa 0.80
Greywater used for:Rainwater used for: Q2 EMPLOYEES distribQ1 Food Garden Irrigation Toilets 20%Sinks + Showers Swimming Pools Showers + Sinks 80%Spa Laundry EFFICIENT FIXTURESEFFICIENT FIXTURESKitchens Process Water Irrigation 0%Drinking Q3 Laundry 15%Q2 Landscaping Kitchens 15%Food Garden Irrigation Toilet Flushing Showers + Sinks 15%Swimming Pools BLACKWATERBLACKWATERBLACKWATER Toilets 0%Laundry Recycled from: Evap. coeff Food Gardens Irrigation 0%Process Water Kitchens 0.80 EDUCATIONEDUCATIONQ3 Toilets 0.80 Laundry 5%Landscaping Blackwater reused for: Guests Showers 5%Toilet Flushing Q3 Guests Toilets 5%
Landscaping Employees Showers 5%Toilet Flushing Employees Toilets 5%
DESALINATED WF REDUCTION
59.5%
REMAINING DESALINATED WF
25.69 M litres
GREY WF REDUCTION
31.7%
REMAINING GREY WF
30.236 M litres

53
The results are displayed both in a numeric and a graphic way and vary depending on the parameters for
each water strategy selected on the control panel. The estimated annual desalinated, grey and rainwater
footprints are given in litres. The chart shows the monthly distribution of these three components throughout
the year, compared to the original (before applying any water strategy) footprints of the project (Fig. 4.8).
Combining the control panel and the results on the same page allows the designer to immediately see the
impact associated with the application or variation of every water strategy considered in the model.
4.2 Methodology
The Tool calculates the potential water footprint reduction through the application of several water
conservation strategies. The calculation methodology used for each water strategy is the following:
4.2.1 RAINWATER HARVESTING
There are different methodologies for designing rainwater harvesting (RWH) systems: from simplified
approaches depending on user-defined relationships (Ward, Memon, & Butler, 2010 cited in Palla et al.,
2011) to non-parametric ones, which use probability methods (Basinger, Montalto, & Lall, 2010 cited in
Palla et al., 2011), the most common one being the behavioural analysis based on continuous simulation
(Palla et al., 2011). Coombes and Barry (2007) concluded that the selection of the length of the time step
could have significant influence on the accuracy of the results, the more reliable ones corresponding to the
shorter time steps. This study therefore uses a behavioural analysis method with a daily time step, similar
to the one used by Palla et al. (2011) (Fig. 4.9).
Fig. 4.8. Water Footprint Design Tool. Page 2: Graphic result representation. Monthly water footprint components for the assessed year.
original DESALINATE
D WF
original GREY WF
DESALINATED WF
RAIN WF GREY WF remaining grey + black
waterjanfebmaraprmayjunjulaugsepoctnovdecTOTALaverage
5480106 3816149 0 3274055 916505 2657091 -4842465063783 3484722 0 2762120 1127520 2433752 -5028245565049 3802887 0 3998085 272160 2608602 -4670325257001 3706593 0 2921061 1072845 2514928 -3504884791424 3408051 0 1458301 2173489 2296291 -3255084108456 2878381 0 829003 2308628 1866812 -2801644710983 3274258 0 1209107 2388757 2178269 -4391285236246 3605381 0 1553788 2454104 2438145 -4740064744565 3257892 0 2246185 1394561 2208576 -4493206074826 4198101 0 1384940 3275292 2903965 -5557205936495 4215852 0 2738740 1758403 2929044 -5543546514355 4632348 0 1314295 3624388 3200323 -636776
63483289 44280615 0 25689681 22766652 30235799 -55195665290274 3690051 0 2140807 1897221 2519650 -459964
0
1000000
2000000
3000000
4000000
5000000
6000000
7000000
jan feb mar apr may jun jul aug sep oct nov dec
original DESALINATED WF original GREY WF DESALINATED WF RAIN WF GREY WF
RAINWATER HARVESTINGRAINWATER HARVESTING GRAYWATERGRAYWATERGRAYWATER GUEST ROOMS distribGUEST ROOMS distribRecycled from: Evap. coeff Toilets 16%
roof area (m2) 13500 Laundry 0.80 Showers + Sinks 80%runoff coef 0.90 Showers/bathroom sinks 0.80 Swimming pools 4%S=tank volume (l) 4000000 Spa 0.80
Greywater used for:Rainwater used for: Q2 EMPLOYEES distribQ1 Food Garden Irrigation Toilets 20%Sinks + Showers Swimming Pools Showers + Sinks 80%Spa Laundry EFFICIENT FIXTURESEFFICIENT FIXTURESKitchens Process Water Irrigation 0%Drinking Q3 Laundry 15%Q2 Landscaping Kitchens 15%Food Garden Irrigation Toilet Flushing Showers + Sinks 15%Swimming Pools BLACKWATERBLACKWATERBLACKWATER Toilets 0%Laundry Recycled from: Evap. coeff Food Gardens Irrigation 0%Process Water Kitchens 0.80 EDUCATIONEDUCATIONQ3 Toilets 0.80 Laundry 5%Landscaping Blackwater reused for: Guests Showers 5%Toilet Flushing Q3 Guests Toilets 5%
Landscaping Employees Showers 5%Toilet Flushing Employees Toilets 5%
DESALINATED WF REDUCTION
59.5%
REMAINING DESALINATED WF
25.69 M litres
GREY WF REDUCTION
31.7%
REMAINING GREY WF
30.236 M litres

54
This behavioural model is based on the following equation:
Vt = Qt + Vt-1 – Yt – Ot
where
Vt = stored volume Vt-1 = stored volume on the previous day
Qt = inflow; Qt = Rt · A · φ Rt = rainfall
A = catchment area φ = runoff coefficient
Yt = outflow Ot = overflow
Dt = rainwater demand Yt = rainwater supply
Mt = municipal supply S = tank capacity
There are two different algorithms that can be used for this model depending on the order of the operations:
Yield After Spillage (YAS) and Yield Before Spillage (YBS). In YAS, “the order of operations is: determine
yield, inflow, overflow and extract yield” (Roebuck, 2007, p. 386). In YBS, “the order of operations: is inflow,
determine yield, extract yield and overflow” (Roebuck, 2007, p. 386). The different operating rules for both
approaches are as follows (V. G. Mitchell, 2007):
S
Rt
QtOt
Vt
Yt
Dt
Mt
Fig. 4.9. Illustration of the behavioural analysis method for the rainwater harvesting system. Adapted from Palla et al., 2011.

55
YAS: Yt = min (Dt; Vt-1) Vt = min (Vt-1 + Qt – Yt; S – Yt)
YBS: Yt = min (Dt; Vt-1) Vt = min (Vt-1 + Qt – Yt; S)
While some authors have demonstrated improved effectiveness from the YBS under specific circumstances
(Liaw & Tsai, 2004 cited in Palla et al., 2011), the YAS approach is generally recommended for being
more conservative (Fewkes, 2000 cited in Palla et al., 2011) and for demonstrating a lower sensitivity to
variations in the storage volume or water demand (V. G. Mitchell, 2007 cited in Palla et al., 2011), The
proposed tool therefore uses the YAS approach. Also, the model considers an initially empty storage as
recommended by Mitchell (2007).
The RWH behavioural model used for this tool considers an initially empty storage. A first series of
measurements for the whole year, starting on January 1st, showed very small variations in performance
results for increased tank volumes. This is due to the accumulation of the driest months at the beginning of
the year, in January, February, and March. Higher storage volumes generally increase the performance of
the system, as they allow for the storage of water during the wetter months, which can then be used during
the dry season. However, starting the calculations on January 1st with an empty storage did not allow for
this phenomenon to be reflected in the results. Therefore, in order to obtain more realistic results, the initial
day for the calculation period was set to July 1st.
The performance of these RWH systems can be expressed in different ways, based either on volumetric
reliability or time-based reliability (Palla et al., 2011). Time-based reliability refers to the fraction of time
during which the RWH system meets the total demand (Palla et al., 2011). Volumetric reliability “is defined
as the total volume of rainwater supplied, divided by the total demand during the simulation period” (Palla
et al., 2011, p. 65) and this one is usually preferred because it is “less restrictive than the time-based one”
(Fewkes, 2000; Liaw & Tsai, 2004; V. G. Mitchell, 2007; Zhang et al., 2009 cited in Palla et al., 2011 p.66).
The performance is thus assessed based on volumetric reliability, using the following formula:
EDY
Tt
t 1
T
tt 1
T
==
=
||
where
ET = volumetric reliability
Dt = rainwater demand
Yt = rainwater supply

56
4.2.2 WASTEWATER RECYCLING
The Tool also calculates the potential water footprint reduction after implementing wastewater recycling
strategies. The Tool calculates the potential for water-saving after recycling greywater and blackwater
separately, due to water quality differences that affect its potential future reuse. The designer selects the
source from which wastewater is to be recycled (e.g. laundry, showers, and bathroom sinks and/or spas
for greywater and kitchens and/or toilets for blackwater). Also, the future uses for both recycled greywater
and blackwater are selected. The end uses available in this case do not include those requiring potable
water quality. The calculation method goes as follows:
WWt = Dt · K
where
WWt = wastewater (to be recycled)
Dt = water consumed by the service
K = evaporation coefficient
An evaporation coefficient was introduced for greywater and blackwater recycling. This evaporation
coefficient acknowledges that not all the water consumed by a service can be recycled because part of
this water is evaporated while being used and therefore cannot be reclaimed. For instance, part of the
water used by laundry machines, about 10% (AquaRecycle™, 2012), stays on the clothes and evaporates
during the drying period. An additional fraction of the water also gets evaporated during the recycling
process. A 0.8 coefficient (meaning that 20% of the water is evaporated) was applied for all the services
from which grey and blackwater was recycled (Fig. 4.10). In all the scenarios, the considered wastewater
sources generated a higher water volume than that required for its end uses. Therefore, a reduction of this
coefficient would not have affected the performance of the water system.
Dt
(K)
(K)
treatment WWt
Fig. 4.10. Illustration of the calculation method for wastewater recycling.
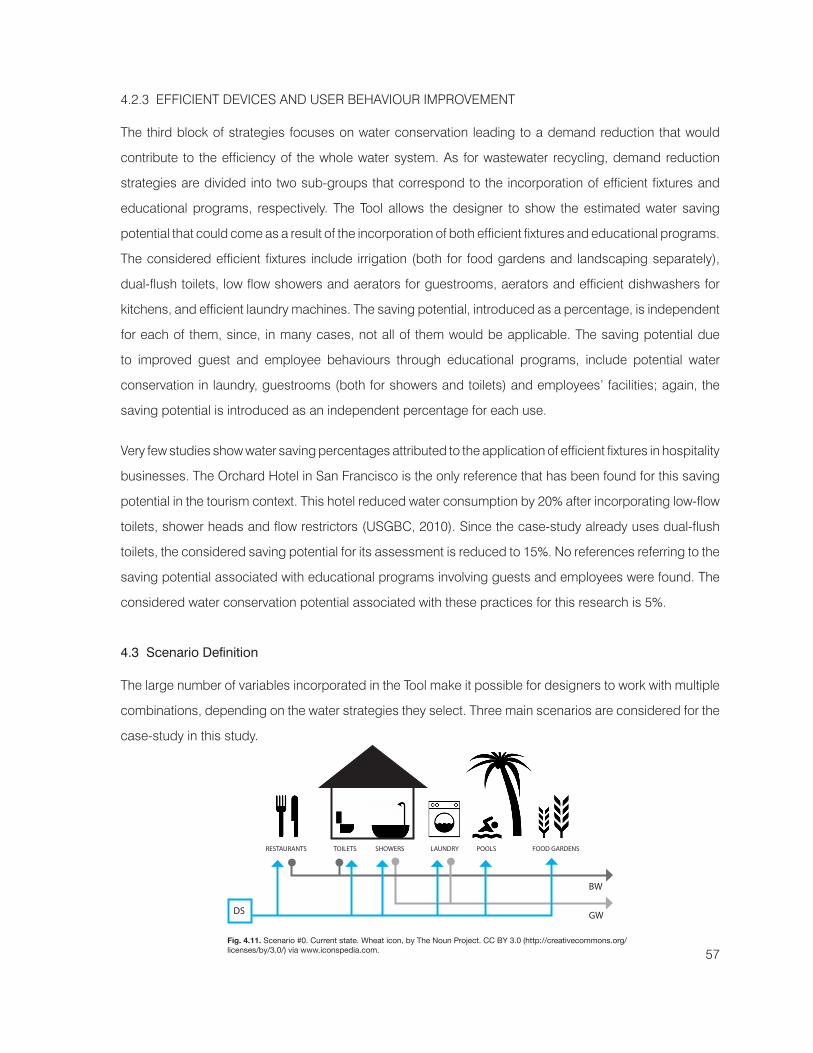
57
4.2.3 EFFICIENT DEVICES AND USER BEHAVIOUR IMPROVEMENT
The third block of strategies focuses on water conservation leading to a demand reduction that would
contribute to the efficiency of the whole water system. As for wastewater recycling, demand reduction
strategies are divided into two sub-groups that correspond to the incorporation of efficient fixtures and
educational programs, respectively. The Tool allows the designer to show the estimated water saving
potential that could come as a result of the incorporation of both efficient fixtures and educational programs.
The considered efficient fixtures include irrigation (both for food gardens and landscaping separately),
dual-flush toilets, low flow showers and aerators for guestrooms, aerators and efficient dishwashers for
kitchens, and efficient laundry machines. The saving potential, introduced as a percentage, is independent
for each of them, since, in many cases, not all of them would be applicable. The saving potential due
to improved guest and employee behaviours through educational programs, include potential water
conservation in laundry, guestrooms (both for showers and toilets) and employees’ facilities; again, the
saving potential is introduced as an independent percentage for each use.
Very few studies show water saving percentages attributed to the application of efficient fixtures in hospitality
businesses. The Orchard Hotel in San Francisco is the only reference that has been found for this saving
potential in the tourism context. This hotel reduced water consumption by 20% after incorporating low-flow
toilets, shower heads and flow restrictors (USGBC, 2010). Since the case-study already uses dual-flush
toilets, the considered saving potential for its assessment is reduced to 15%. No references referring to the
saving potential associated with educational programs involving guests and employees were found. The
considered water conservation potential associated with these practices for this research is 5%.
4.3 Scenario Definition
The large number of variables incorporated in the Tool make it possible for designers to work with multiple
combinations, depending on the water strategies they select. Three main scenarios are considered for the
case-study in this study.
RESTAURANTS TOILETS SHOWERS LAUNDRY POOLS FOOD GARDENS
BW
GWDS
Fig. 4.11. Scenario #0. Current state. Wheat icon, by The Noun Project. CC BY 3.0 (http://creativecommons.org/licenses/by/3.0/) via www.iconspedia.com.

58
Scenario #0: Current State (Fig. 4.11). The current situation of the case-study project corresponds to
‘scenario #0’, in which no new water strategies are applied yet. The results obtained for all the remaining
scenarios are compared to this scenario in order to assess the water footprint reduction and potential
improvement for each situation.
Scenario #1: Conventional Strategies (Fig. 4.12). This scenario is the one in which a number of water
strategies defined as conventional in chapter 3 are applied. These conventional strategies are those which
have been widely applied in green building in recent years, including rainwater harvesting for non-potable
use, greywater recycling, and water conservation through the use of efficient fixtures.
Scenario #2: All Strategies (Fig. 4.13). This scenario corresponds to the one in which all the considered
water strategies in the Tool are applied. These additional strategies include treating harvested rainwater
until it reaches potable quality, blackwater recycling, and additional conservation measures through guest
and employee education.
RESTAURANTS TOILETS SHOWERS LAUNDRY POOLS FOOD GARDENS
BW
GW
RW
DS
RESTAURANTS TOILETS SHOWERS LAUNDRY POOLS FOOD GARDENS
GWBW
RW
DS
Fig. 4.12. Scenario #1. Conventional strategies. Wheat icon, by The Noun Project. CC BY 3.0 (http://creativecommons.org/licenses/by/3.0/) via www.iconspedia.com.
Fig. 4.13. Scenario #2. All strategies. Wheat icon, by The Noun Project. CC BY 3.0 (http://creativecommons.org/licenses/by/3.0/) via www.iconspedia.com.

59
Additionally, based on the rainfall data obtained from the Maldives Meteorological Agency, which gives
daily rainfall information from 2001 to 2010 in the capital city of Malé, three sub-groups of scenarios are
analyzed: (A) best case, (B) worst case and (C) average scenarios. The best and worst cases scenario
subgroups correspond to the years with the highest (2006) and lowest (2005) total annual rainfall,
respectively. The average scenario corresponds to the year whose total annual rainfall is closer to the
yearly average rainfall in the 10 year period, in this case, 2010. There are no sub-scenarios for scenario
#0 as rainfall only affects performance of rainwater harvesting systems and the analyzed resort does not
harvest rainwater at this time.
SCENARIO SUMMARYHigh precipitation (2006) Low precipitation (2005) Average precipitation (2010)
Current State Scenario #0
Conventional Strategies Scenario #1A Scenario #1B Scenario #1C
All Strategies Scenario #2A Scenario #2B Scenario #2C
For these scenarios, rainwater harvesting system parameters are kept optimum, as follows: runoff coefficient
= 0.90; catchment area = current resort's roof area; storage tank volume = 8M litres (total overflow = 0).
In the second stage, the volumetric reliability of the rainwater system is assessed for different catchment
area vs. storage tank volume relations. Considering that the ultimate goal of this research is to assess
whether a net-zero water scenario is achievable for this case-study, this optimization analysis of the RWH
system is restricted to scenarios #2A, #2B and #2C, in which all the potential strategies are applied.
4.4 Tool Transferability
This Water Footprint Design Tool has been specifically developed for application in this study's research.
Some components of the Tool are directly related to some particularities of the site context. For instance,
the major freshwater source at the resort at this moment is desalination. As a consequence, all the current
water consumption is identified as part of the so called “desalinated water footprint”. As in the case of many
similar tourism facilities, a distinction is made between the water consumed for guests and employees,
even though this differentiation is not strictly necessary for the calculations associated with each water
strategy. Using this Tool for a different beach resort, that also depends on desalination, would be possible
only by introducing new precipitation and demand pattern data-sets.
Table 4.1. Scenario summary.

60
But the Tool, in its currently state, is only applicable to this very specific context. However, all projects, no
matter what their location or program, can be assessed based on the Corporate Water Accounting and
water footprint frameworks defined in chapter 2. Similar analyses based on the particularities of each
of them are possible and the Tool has thus been made flexible to allow its adaptation to different water
supply or demand scenarios, if necessary. New column sets can be added on the first spreadsheet page
if new water strategies, both on the supply or demand sides, are to be incorporated. As an example,
water sources other than desalination or harvested rainwater, such as groundwater, could be available
at other locations. Its incorporation into the Tool would be possible by adding the columns and formulas
associated with this new water source, and also adjusting the cells on the control panel to allow for the
measurement of its availability and use parameters. An additional blue water footprint component would
be added, which should also be included in the graphic and numeric results. Similarly, desalination as a
potential source could be eliminated for the cases in which it is not to be considered.
Moreover, in this research the Tool is only applied to one existing beach resort. However, it can also be
applied to new projects at early stages of design. By introducing water-use data based on measurements
from similar tourism facilities, design teams can incorporate challenging water goals at the beginning of
the planning and design processes and use the Tool to foresee the potential achievability of these goals.
.

61
5 CASE-STUDY
DESTINATION: MALDIVES
In this chapter, the previously defined Water Footprint Design Tool is applied to an existing resort located
in a small island developing state (SIDS). The Maldives is a country located in the Indian Ocean right
above the equator. Due to its tropical climate, which offers high temperatures throughout the year, and
the astonishing beaches located on almost every small island, this country is a perfect destination for
coastal tourism. Luxury beach resorts are the most predominant form of accommodation. However, the
geographical conditions of the Maldives make freshwater a scarce resource, as it has no surface water
streams and any groundwater bodies are vulnerable to seawater intrusion. Thus, desalination has been
the only water supply alternative for the major cities and all resort islands. Moreover, the Maldives are one
of the countries most threatened by rising sea-levels because of its low elevation (only 2.3 meters above
normal sea level). As a consequence, the former President of the Maldives has embraced the objective
of becoming the first carbon neutral country in the world by 2019, a goal that seems hardly achievable
under the high energy demand circumstances associated with desalination technologies. In this chapter,
the potential achievability of the net-zero water goal defined in chapter 2, in which the desalination water
footprint is nullified, is tested for the Soneva Resort.

62
5.1 Recruitment Process
5.1.1 SELECTION CRITERIA
The selection of this case-study was based on the following criteria:
A. The analyzed project needed to be located in a small island developing state.
B. The desired type of tourism accommodation was a beach resort. Beach resorts are one of the most
predominant forms of accommodation in SIDS, upon which this research focuses. Additionally, these
destinations generally offer a large number of services requiring large amounts of water to operate, such
as swimming pools and spas (see chapter 1).
C. A resort with no access to municipal freshwater supply sources was preferred. This disconnection
from the grid makes resorts generally dependent on alternative water sources, such as desalination. This
circumstance provides the perfect scenario for testing the achievability of the net-zero water goal.
D. The resort should have shown some sort of commitment to sustainable development.
E. The selected resort needed to be able to provide high-resolution water-use data (sub-metered daily
water consumption for at least 1 year).
5.1.2 CASE-STUDY SELECTION
Based on the previous criteria, 34 beach resorts located on different small island destinations were identified
as potential case-studies for having shown some sort of commitment to environmental sustainability. This
commitment was demonstrated by several means: third-party verification programs (e.g. Earthcheck,
Green Globe), detailed environmental policy descriptions available on their websites, or sustainability-
related online publications. After a first approach via email, 11 of these resorts (32%) gave an answer. 9 of
them expressed their commitment to sustainability-related academic research as well as their willingness
to participate in the study. On a second approach, these 9 resorts were asked about their ability to meet
the last criterion on the previous list by providing high-resolution water-use data packages. Only 2 resorts
located in the Maldives were willing to provide the requested information. The remaining 7 resorts were
unable to provide the requested data for different reasons (i.e. lack of sub-metered water data, lack of time
to gather the requested data, confidentiality, no response). The Soneva Resort in the Maldives’ short delay
in sending the requested data-package and willingness to answer all the questions associated with this
research were the final reasons for its selection as the case-study project for this thesis.

63
5.2 Maldives Context Definition
GEOGRAPHY
The Maldives is a small island developing state located in the Indian Ocean (Fig. 5.1) composed of about
1200 islands grouped in 26 natural coral atolls that spread out on a north-south axis over 1000 km on both
sides of the equator (Fig. 5.2). The total land area of the country is 300 km2 (AQUASTAT, 2012). Most of
the islands are very small (less than 1 km2) and have very low elevations, the average elevation above
sea-level being 1.5 meters (US Department of State, 2012). The highest natural ground level in the country
is only 2.3 meters (Henley, 2008), which makes the Maldives one of the countries most threatened by sea-
level rise.
Fig. 5.1. Maldives location. ©2013 SK planet, ZENRIN, Google, mapIT, Tele Atlas.
Fig. 5.3. Aerial view of Malé. Source: By Shahee Ilyas. CC-BY-SA-3.0 (http://creativecommons.org/licenses/by-sa/3.0/), via Wikimedia Commons.
Fig. 5.4. Aerial view of Thinadhoo island. ©2013 Microsoft Corporation ©2012 Digital Globe ©2012 Nokia.
Fig. 5.2. Maldives map. Source: US Central Intelligence Agency. Public domain, via Wikimedia Commons.

64
The population in 2009 was 312,000 inhabitants (AQUASTAT, 2012), of which almost one third is
concentrated in Malé (Fig. 5.3), the capital city (GeoNames.org, 2012). Only 198 islands are inhabited,
almost 100 are occupied by resorts and some of the remaining ones are used for agriculture.
CLIMATE
The Maldives’ islands have a tropical climate characterized by two monsoons. The southwest monsoon
corresponds to the rainy season and appears from May to September. The northeast monsoon brings the
dry season, from November to March (AQUASTAT, 2012).
The annual average precipitation is 1972mm, and it is distributed uniformly throughout the year, with the
exception of a drier interval from January to April, when dry periods of up to two months are frequent
(Ibrahim, Bari, & Miles, 2002) (Fig. 5.6). The annual average temperature is 28°C, with very little variation
throughout the year (AQUASTAT, 2012; US Department of State, 2012) (Fig. 5.5). The average relative
humidity is 80% and evapotranspiration of open water from vegetation is very high (Ibrahim et al., 2002).
TOURISM
Beach resorts (Fig. 5.8) are the main form of tourist accommodation offered in the Maldives. In 2010, 98
resorts offered more than 21000 beds (83% of the total number of beds available for tourists) (Fig. 5.7). The
first resort opened in the Maldives in 1972 and, since then, the country’s economy has been increasingly
dependent on tourism. In 2010, tourism contributed to 35.7% of the total Gross Domestic Product (GDP).
The Government of the Maldives selects the uninhabited islands suitable for tourism development. These
areas are publicly tendered for the creation of new tourism facilities and supporting infrastructure. Out of
the 98 resorts (2010), 43 are managed by local operators, 37 by foreign operators and 18 by a combination
of both. In 2010, the average annual occupancy rate, including both resorts and hotels was 74.2%, with an
average stay of 7.6 days. (Maldives Ministry of Tourism, Arts and Culture, 2011).
MALDIVES CONTEXT
CLIMATE
0℃
5℃
10℃
15℃
20℃
25℃
30℃
35℃
jan feb mar apr may jun jul aug sep oct nov dec
min Average Temperature max Average Temperature
0 mm
50 mm
100 mm
150 mm
200 mm
250 mm
jan feb mar apr may jun jul aug sep oct nov dec
Average Precipitation
Data for Malé. Source: www.weather.com.
Maldives’ Annual Average Precipitation = 1925mm
Vancouver’s Annual Average Precipitation = 1199mm
Fig. 5.5. Monthly average maximum and minimum temperatures for Malé, Maldives. Data source: www.weather.com
Fig. 5.6. Monthly average precipitation for Malé, Maldives. Data source: www.weather.com

65
WATER SYSTEMS
Freshwater sources in the Maldives are very scarce, mainly because permanent surface water streams do
not exist on any of the islands, although small brackish water ponds can be found on some of them (Fig.
5.9). Groundwater is considered the only renewable water resource in the country, with an annual recharge
rate of 0.03 km3/year. But many groundwater bodies, especially those located on inhabited islands, have
suffered seawater intrusion after heavy extraction or have been contaminated when recharged by polluted
rainfall percolating through the soil (AQUASTAT, 2012).
With the exception of the capital city, Male, and Kadholhudhoo, the most densely populated islands,
Maldivians rely mainly on rainwater for drinking purposes and groundwater for other household needs
(Ibrahim et al., 2002). Rainwater is usually harvested from rooftops and collected in different types of
tanks (AQUASTAT, 2012). Today, all the islands have both community and individual rainwater tanks, and
the government has recently invested in developing a consistent rainwater supply for all inhabited islands
(Ibrahim et al., 2002).
Nevertheless, Male and Kadholhudhoo depend on desalination as the main freshwater source. High
population density in both cities has resulted in groundwater pollution and over-extraction, as well as
insufficient space for rainwater storage tanks (Ibrahim et al., 2002). The lack of freshwater supply alternatives
has made desalination the only option for providing a safe water supply in these cities. The first desalination
plant in Male was built in 1988 and today the capital city has a desalination capacity of 5800 m3/day, giving
everyone access to desalinated water for domestic use through a piped network (AQUASTAT, 2012).
MALDIVES CONTEXT
TOURISM
Source: Maldives Ministry of Tourism
_21 342 beds (83% of total number of beds)
_98 resorts in 2010
1.9%9.5%
5.6%
83.0%
resorts hotelssafari vessels guesthouses
Fig. 5.7. Bed distribution per accommodation type in 2010. Source: Maldives Ministry of Tourism.
Fig. 5.8. Villingili Resort & Spa in Maldives. Source: Shangri-La

66
Desalination is, however, an expensive supply alternative in the Maldives. The estimated monthly cost of
desalinated water per household in Male ranges between US$40 and US$60 (Ibrahim et al., 2002).
Resorts started using desalinated water in the 1970s and today each resort island has its own desalination
plant. Many of these resorts recommend that guests buy bottled water for drinking and desalinated water is
thus mainly used for cooking and bathing (AQUASTAT, 2012; Ibrahim et al., 2002). The cost of desalinated
water for resorts is not as significant as for the local population, since it is relatively low when compared
with the revenue generated by tourism (Ibrahim et al., 2002). A few resorts harvest rainwater and use it for
staff to drink. Other resorts reuse wastewater for irrigation, yet it is not a common practice (Ibrahim et al.,
2002).
CLIMATE CHANGE
The Intergovernmental Panel on Climate Change (IPCC) projected an average sea-level rise between
19 and 58cm at the end of the 21st century (IPCC, 2007 cited in Becken, Hay, & Espiner, 2011). The
low elevation of Maldives makes this country one of the most threatened states from climate change
(Fig. 5.10). The potential consequences of the projected sea-level rise include “accelerated shoreline
and beach erosion, temporarily reduced water availability, interrupted supply chains, physical damage to
property and warmer sea temperatures” (Becken et al., 2011, p. 74). Moreover, the already vulnerable and
limited groundwater resources are expected to suffer the consequences of this issue, as the chances of
seawater intrusion occurring will increase as well (Ibrahim et al., 2002). This global threat prompted the
former President of the Maldives, Mohamed Nasheed, elected in 2008, to announce that part of the tourist
revenue would be used to buy a new homeland (Becken et al., 2011). In addition, Nasheed introduced
the objective of making the Maldives the first carbon-neutral country in the world by 2019 (Becken et al.,
Fig. 5.10. Countries with largest population shares in the low elevation coastal zone. Source: McGranahan, 2006 cited in UN DESA, 2010.
Fig. 5.9. ©Ilyas Shujau (Ishu). Nolhivaram Kulhi (lake), H.Dh. Nolhivaram, Maldives. Source: http://www.ugo.cn/photo/MV/en/808.htm.

67
2011). Nonetheless, access to clean energy sources is not abundant in the Maldives, and high-energy
demanding technologies, such as desalination, not only increase the country’s dependence on fossil
fuels, but also produce carbon emissions that contribute to global warming. The use of desalination as
the main technology for providing water supply in the Maldives thus seems to stand in contradiction to the
country’s ability to achieve its carbon neutrality goal in the next decade.
5.3 Soneva Resort
5.3.1 GENERAL INFORMATION
Resort location: Kunfunadhoo Island, Baa Atoll, Maldives
Year of Construction: 1995
Year of Last Major Renovation: 2007
Capacity: 150 guests + 400 employees
Price range (per double room per night): 810 to 13 440 US$
Average Annual Occupancy Rate: 70%
Roof area: 13 500 sqm
Roof type/types (material): Tin 73% + Thatch 27%
Property (island) area: 450 000 sqm
Design author (architect): Soneva
Fig. 5.11. Soneva resort, Kunfunadhoo island aerial view. Source: Soneva

68
5.3.2 RESORT DESCRIPTION
Sustainability plays a very significant role in the company’s policy for the Soneva Resort in the Maldives. Its
website offers a great amount of detailed information about the sustainability-related strategies that have
been applied in the last few years. The Soneva Resort has the objective of becoming carbon-neutral by
2014. Its environmental performance has been assessed by different benchmarking systems, obtaining,
among others, EarthCheck Benchmarked Accommodation certification in 2009. Additionally, the resort
has shown a high level of transparency throughout the communication process with the author, always
responding to specific questions related to their practices and facilitating all the requested data.
The Soneva Resort started operating on Kunfunadhoo Island (Fig. 5.11), Baa Atoll, in the Maldives in 1995.
It offers accommodation for 150 guests in 65 villas and rooms spread along the beachfront (Fig. 5.12) and
divided into different categories, depending on their size and the services included. All the villas, except for
15 rooms articulated in groups of two or three, are isolated from each other and have their own swimming
pools (Figs. 5.13, 5.14, 5.15). Accommodation sizes go from 182 sqf (Rehendi room) to 1710 sqf (The
Jungle Reserve). In addition to all the services included in the rooms, the resort has a private spa, a diving
school, and several restaurants and bars distributed across the island. Moreover, about 400 employees
live within the resort facilities.
Fig. 5.12. Soneva resort map. Source: Soneva
Fig. 5.14. Soneva resort villa, outdoor view. Source: Soneva
Fig. 5.13. Soneva resort aerial view (2). Source: Soneva
Fig. 5.15. Soneva resort villa, outdoor view (2). Source: Soneva

69
In order to be the first carbon-neutral resort in the world (Nasheed, 2009), the resort has been implementing
a series of strategies since they started operating in 1995, with the objectives of both switching to renewable
supply sources and reducing resource demand.
While many of these strategies have significantly reduced the resort’s dependence on fossil fuels (most of
the energy is produced by an on-site diesel generator), other strategies have focused on improving water
management. On the energy side, a 70kW photovoltaic plant built in 2009 (Fig. 5.16) provides 3% of the
total energy demand of the resort. An extension of this plant up to 1MW is expected to start operating in
2013 (Oines, personal communication, March 2013). Moreover, an experimental deep sea water cooling
system, aiming to reduce energy demand by an additional 25%, was tested in 2008 (Fig. 5.17). This
technology had been incorporated by other hotels at similar locations, such as at the Intercontinental
Resort in Tahiti, with very positive results (InterContinental, 2013). However, this system at Soneva Resort
was not efficient enough due to the excessively high length of the pipes for reaching sufficiently cold water,
and was therefore discarded (Kesterton, personal communication, De2011). On the water side, a reverse-
osmosis desalination plant, upgraded in 2007, fulfills the entire freshwater demand of the resort. According
to the resort’s Decarbonising Department, 9% of the total energy demand is used for desalination. Sub-
meters record daily water consumption at different areas of the resort, making it easier to identify leakage
problems. Dual-flush toilets are used in guest rooms (EarthCheck, 2010) and daily laundry service is
offered as optional in order to contribute to water conservation. Other water strategies, such as rainwater
harvesting or wastewater recycling, are not implemented. Their incorporation would contribute positively
and directly to the resort’s carbon neutrality goal, since the demand for desalinated water, and therefore its
associated energy consumption, would be reduced. One of the reasons for not having introduced these
technologies is the high cost associated with the creation of a secondary plumbing system, since currently
a central distribution scheme from the desalination plant is used (Kesterton, personal communication,
December 2011).
Fig. 5.16. Soneva resort, photovoltaic plant. Source: Soneva Fig. 5.17. Soneva resort, deep sea water cooling system. Source: Soneva
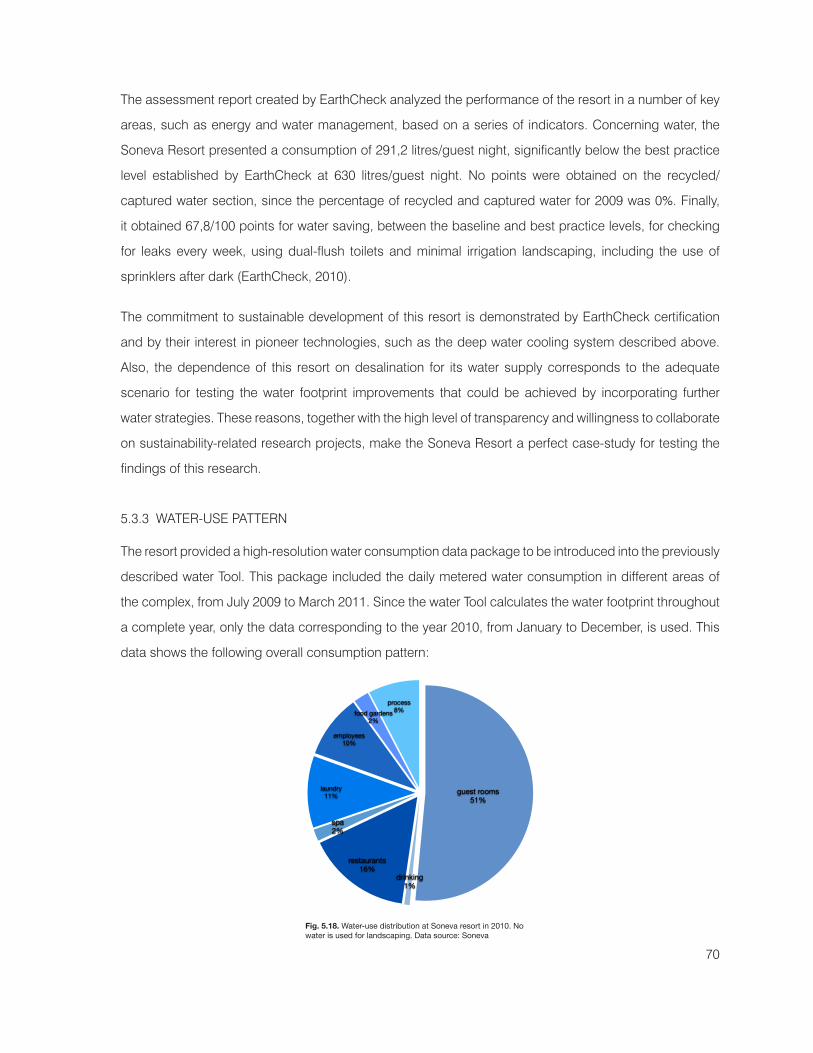
70
The assessment report created by EarthCheck analyzed the performance of the resort in a number of key
areas, such as energy and water management, based on a series of indicators. Concerning water, the
Soneva Resort presented a consumption of 291,2 litres/guest night, significantly below the best practice
level established by EarthCheck at 630 litres/guest night. No points were obtained on the recycled/
captured water section, since the percentage of recycled and captured water for 2009 was 0%. Finally,
it obtained 67,8/100 points for water saving, between the baseline and best practice levels, for checking
for leaks every week, using dual-flush toilets and minimal irrigation landscaping, including the use of
sprinklers after dark (EarthCheck, 2010).
The commitment to sustainable development of this resort is demonstrated by EarthCheck certification
and by their interest in pioneer technologies, such as the deep water cooling system described above.
Also, the dependence of this resort on desalination for its water supply corresponds to the adequate
scenario for testing the water footprint improvements that could be achieved by incorporating further
water strategies. These reasons, together with the high level of transparency and willingness to collaborate
on sustainability-related research projects, make the Soneva Resort a perfect case-study for testing the
findings of this research.
5.3.3 WATER-USE PATTERN
The resort provided a high-resolution water consumption data package to be introduced into the previously
described water Tool. This package included the daily metered water consumption in different areas of
the complex, from July 2009 to March 2011. Since the water Tool calculates the water footprint throughout
a complete year, only the data corresponding to the year 2010, from January to December, is used. This
data shows the following overall consumption pattern:
showers+hand basinsdrinkingkitchensspalaundryswimming poolsfood gardensprocesstoilet
30996000513000995200011290006832289
1307520145200048600006441480
toilet10%
process8%
food gardens2%
swimming pools2%
laundry11%
spa2%
kitchens16% drinking
1%
showers+hand basins49%
guest roomsdrinkingrestaurantsspalaundryemployeesfood gardensprocess
32688000513000995200011290006832289605700014520004860000
process8%food gardens
2%
employees10%
laundry11%
spa2%
restaurants16%
drinking1%
guest rooms51%
Fig. 5.18. Water-use distribution at Soneva resort in 2010. No water is used for landscaping. Data source: Soneva

71
The water consumption data obtained from the case-study does not specify how much water consumed
at guest rooms is used for toilet flushing, showers, and/or hand basins. This differentiation was crucial, as
the quality of the water required for these services is significantly different. Similarly, while toilets generate
blackwater, showers and hand basins produce greywater, which would also affect the calculations
associated with wastewater recycling. For these reasons, the Tool offers the possibility of assigning a
percentage to these two groups of uses, toilet flushing and showers + hand basins, for both guest rooms
and employees’ water consumption. Ideally, this data should be obtained from sub-metering the water
consumption of these two services at the assessed project. However, since this information is not available
in the data package provided by the case-study, the percentages introduced into the Tool are based
on previous studies conducted by different authors. Seattle Public Utilities presented a study (O’Neill &
Siegelbaum, 2002) in which they measured the water consumption at two hotels in the city. For one of the
hotels, the water use distribution in guest rooms was 35% for toilets and 65% for showers and lavatories.
For the other hotel, the distribution was 26% for toilets and 74% for showers and lavatories. A similar report
made in Perth, Western Australia (Saunders, 2011), calculated the room water distribution for a series of
hotels, including a resort. In this case, the obtained percentages were the following:
HOTEL Toilets Showers + Baths + Basins Kitchens
N (4 stars) 10% 90% -
J (4.5 stars) 21% 79% -
H (resort, 5 stars) 6% 84% 10%
D (5 stars) 17% 83% -
E (4.5 stars) 16% 75% -
Considering all these measurements, the average percentages (both Seattle and Perth) were 19% for
toilets and 81% for showers, baths and basins. Three of the hotels in the Australian study (Saunders,
2011) also show the percentage of the total water use required for swimming pools (3%, 3% and 1%
respectively). Relative to the room water consumption (as in the case-study used for this research, since
many villas have their own swimming pools and therefore their water consumption is included in the guest
rooms’ consumption values), these percentages would be 1,2%, 4.1% and 4.3%, respectively. Based on
these reports, the percentages used for this research were 80% for showers and basins / 16% for toilets
/ 4% for swimming pools in the case of guest rooms; and 80% for showers and basins / 20% for toilets,
in the case of employees' facilities. Based on these coefficients, the demand pattern for 2010 resulted as
follows:
Table 5.1. Room water-use distribution for 5 hotels in Perth, Australia. Souce: Saunders, A. HFM Asset Management, 2011.

72
5.3.4 RESULTS
The following table offers an overview of the results obtained for this case-study (Appendix B):
WATER FOOTPRINTSDesalinated WF reduction
Remaining Desalinated WF Grey WF reduction Remaining Grey WF Rain WF
Scenario #0 - 63.48M litres - 44.28M litres -
Scenario #1A 42.6% 36.45M litres 73.1% 11.92M litres 13.43M litres
Scenario #1B 42.1% 36.76M litres 73.1% 11.92M litres 13.11M litres
Scenario #1C 42.6% 36.45M litres 73.1% 11.92M litres 13.43M litres
Scenario #2A 95.5% 2.87M litres 100,00% 0.00M litres 32.26M litres
Scenario #2B 75.5% 15.56M litres 100,00% 0.00M litres 19.57M litres
Scenario #2C 80.6% 12.30M litres 100,00% 0.00M litres 22.83M litres
The initial desalinated water footprint (WF) and grey WF for the Soneva Resort are 63.48M litres and
44.28M litres, respectively. The results for scenarios #1A, 1B and 1C, in which harvested rainwater is used
for laundry, swimming pools, food garden irrigation, and process water, while greywater is reused only
for toilet flushing (this resort does not use water for landscaping according to their data), present very
little variation among them. Note that the difference between these three scenarios lies in the different
precipitation patterns of the three considered periods (2005, 2006 and 2010). Therefore, the performance
of the rainwater harvesting system is the only variable affected by moving among these three scenarios.
The total harvested rainwater demand for these scenarios, 13.43M litres, can be fully covered by scenarios
#1A and #1C (Fig. 5.20) and almost fully covered by scenario #1B (Fig. 5.21).
showers+hand basinsdrinkingkitchensspalaundryswimming poolsfood gardensprocesstoilet
30996000513000995200011290006832289
1307520145200048600006441480
toilet10%
process8%
food gardens2%
swimming pools2%
laundry11%
spa2%
kitchens16% drinking
1%
showers+hand basins49%
guest roomsdrinkingrestaurantsspalaundryemployeesfood gardensprocess
32688000513000995200011290006832289605700014520004860000
process8%food gardens
2%
employees10%
laundry11%
spa2%
restaurants16%
drinking1%
guest rooms51%
Fig. 5.19. Water-use distribution at Soneva resort in 2010 after applying the room water-use distribution coefficients.
Table 5.2. Summary of the results obtained for the case-study after applying the Water Footprint Design Tool.

73
In scenarios #2A, 2B and 2C, at which rainwater demand is increased (35.13M litres), as it is used for
all the services requiring potable water quality (drinking water, kitchens, showers, hand basins, and spa),
the results show a higher variation among them. Even though further strategies aimed at reducing water
demand are incorporated, compared to scenarios #1A, 1B, and 1C, such as blackwater recycling or
educational measures, the harvested rainwater demand at 2A, B, &C is higher than for the previous
scenarios and, therefore, the amount of available rainfall between the three considered periods has a
higher impact on the performance of the whole water system. This way, while the potential desalinated
water footprint (WF) reductvaries only 0.5% between the years with the highest and lowest precipitations,
when only conventional strategies are applied (scenarios #1A and #1B), this variation reaches 20% when
all the strategies are considered (between scenarios #2A and #2B). The water demand associated with
the rainwater harvesting system is thus a key variable impacting the performance of the whole system.
original DESALINATE
D WF
original GREY WF
DESALINATED WF
RAIN WF GREY WF remaining grey + black
waterjanfebmaraprmayjunjulaugsepoctnovdecTOTALaverage
5480106 3816149 0 3112000 1184960 984064 17721525063783 3484722 0 2868380 1113396 893616 16214365565049 3802887 0 3138720 1261732 1012288 17486495257001 3706593 0 3055570 1069611 1007592 16873374791424 3408051 0 2838430 912170 946072 15313524108456 2878381 0 2426840 809768 863776 12365024710983 3274258 0 2723060 989546 931952 14503565236246 3605381 0 2947410 1187829 987304 16340954744565 3257892 0 2647670 1106280 882680 14904006074826 4198101 0 3455010 1319752 1103080 19303305936495 4215852 0 3425120 1204351 1089536 19558736514355 4632348 0 3809590 1267572 1218584 2126473
63483289 44280615 0 36447800 13426966 11920544 201849575290274 3690051 0 3037317 1118914 993379 1682080
0
1000000
2000000
3000000
4000000
5000000
6000000
7000000
jan feb mar apr may jun jul aug sep oct nov dec
original DESALINATED WF original GREY WF DESALINATED WF RAIN WF GREY WF
RAINWATER HARVESTINGRAINWATER HARVESTING GRAYWATERGRAYWATERGRAYWATER GUEST ROOMS distribGUEST ROOMS distribRecycled from: Evap. coeff Toilets 16%
roof area (m2) 13500 Laundry 0.80 Showers + Sinks 80%runoff coef 0.90 Showers/bathroom sinks 0.80 Swimming pools 4%S=tank volume (l) 20000000 Spa 0.80
Greywater used for:Rainwater used for: Q2 EMPLOYEES distribQ1 Food Garden Irrigation Toilets 20%Sinks + Showers Swimming Pools Showers + Sinks 80%Spa Laundry EFFICIENT FIXTURESEFFICIENT FIXTURESKitchens Process Water Irrigation 0%Drinking Q3 Laundry 15%Q2 Landscaping Kitchens 15%Food Garden Irrigation Toilet Flushing Showers + Sinks 15%Swimming Pools BLACKWATERBLACKWATERBLACKWATER Toilets 0%Laundry Recycled from: Evap. coeff Food Gardens Irrigation 0%Process Water Kitchens 0.80 EDUCATIONEDUCATIONQ3 Toilets 0.80 Laundry 0%Landscaping Blackwater reused for: Guests Showers 0%Toilet Flushing Q3 Guests Toilets 0%
Landscaping Employees Showers 0%Toilet Flushing Employees Toilets 0%
DESALINATED WF REDUCTION
42.6%
REMAINING DESALINATED WF
36.448 M litres
GREY WF REDUCTION
73.1%
REMAINING GREY WF
11.921 M litres
original DESALINATE
D WF
original GREY WF
DESALINATED WF
RAIN WF GREY WF remaining grey + black
waterjanfebmaraprmayjunjulaugsepoctnovdecTOTALaverage
5480106 3816149 0 3112000 1184960 984064 17721525063783 3484722 0 2868380 1113396 893616 16214365565049 3802887 0 3138720 1261732 1012288 17486495257001 3706593 0 3061939 1063242 1007592 16873374791424 3408051 0 2998594 752006 946072 15313524108456 2878381 0 2426840 809768 863776 12365024710983 3274258 0 2871601 841004 931952 14503565236246 3605381 0 2947410 1187829 987304 16340954744565 3257892 0 2647670 1106280 882680 14904006074826 4198101 0 3455010 1319752 1103080 19303305936495 4215852 0 3425120 1204351 1089536 19558736514355 4632348 0 3809590 1267572 1218584 2126473
63483289 44280615 0 36762874 13111891 11920544 201849575290274 3690051 0 3063573 1092658 993379 1682080
0
1000000
2000000
3000000
4000000
5000000
6000000
7000000
jan feb mar apr may jun jul aug sep oct nov dec
original DESALINATED WF original GREY WF DESALINATED WF RAIN WF GREY WF
RAINWATER HARVESTINGRAINWATER HARVESTING GRAYWATERGRAYWATERGRAYWATER GUEST ROOMS distribGUEST ROOMS distribRecycled from: Evap. coeff Toilets 16%
roof area (m2) 13500 Laundry 0.80 Showers + Sinks 80%runoff coef 0.90 Showers/bathroom sinks 0.80 Swimming pools 4%S=tank volume (l) 4000000 Spa 0.80
Greywater used for:Rainwater used for: Q2 EMPLOYEES distribQ1 Food Garden Irrigation Toilets 20%Sinks + Showers Swimming Pools Showers + Sinks 80%Spa Laundry EFFICIENT FIXTURESEFFICIENT FIXTURESKitchens Process Water Irrigation 0%Drinking Q3 Laundry 15%Q2 Landscaping Kitchens 15%Food Garden Irrigation Toilet Flushing Showers + Sinks 15%Swimming Pools BLACKWATERBLACKWATERBLACKWATER Toilets 0%Laundry Recycled from: Evap. coeff Food Gardens Irrigation 0%Process Water Kitchens 0.80 EDUCATIONEDUCATIONQ3 Toilets 0.80 Laundry 0%Landscaping Blackwater reused for: Guests Showers 0%Toilet Flushing Q3 Guests Toilets 0%
Landscaping Employees Showers 0%Toilet Flushing Employees Toilets 0%
DESALINATED WF REDUCTION
42.1%
REMAINING DESALINATED WF
36.763 M litres
GREY WF REDUCTION
73.1%
REMAINING GREY WF
11.921 M litres
Fig. 5.20. Water Footprint Design Tool results for scenarios #1A (Conventional strategies + high precipitation) and #1C (Conventional strategies + average precipitation). The results obtained for both scenarios are exactly the same due to the relatively small rain water demand, which can be covered by the available precipitation at the two considered years, 2006 and 2010.
Fig. 5.21. Water Footprint Design Tool results for scenario #1B (Conventional strategies + low precipitation). The results obtained for this scenario are slightly different from the previous ones, as the entire rainwater demand was not met by the precipitation in 2005..

74
original DESALINATE
D WF
original GREY WF
DESALINATED WF
RAIN WF GREY WF remaining grey + black
waterjanfebmaraprmayjunjulaugsepoctnovdecTOTALaverage
5480106 3816149 0 -0 2996400 0 14896075063783 3484722 0 -0 2761246 0 13255885565049 3802887 0 0 3025534 0 14191435257001 3706593 0 0 2946464 0 15482824791424 3408051 0 737919 2000177 0 14941134108456 2878381 0 876698 1467930 0 12321254710983 3274258 0 288917 2338875 0 13253255236246 3605381 0 967261 1875191 0 13597464744565 3257892 0 0 2553524 0 12008306074826 4198101 0 0 3328292 -0 16239715936495 4215852 0 -0 3297654 0 17511536514355 4632348 0 0 3668388 -0 1977277
63483289 44280615 0 2870795 32259675 0 177471605290274 3690051 0 239233 2688306 0 1478930
0
1000000
2000000
3000000
4000000
5000000
6000000
7000000
jan feb mar apr may jun jul aug sep oct nov dec
original DESALINATED WF original GREY WF DESALINATED WF RAIN WF GREY WF
RAINWATER HARVESTINGRAINWATER HARVESTING GRAYWATERGRAYWATERGRAYWATER GUEST ROOMS distribGUEST ROOMS distribRecycled from: Evap. coeff Toilets 16%
roof area (m2) 13500 Laundry 0.80 Showers + Sinks 80%runoff coef 0.90 Showers/bathroom sinks 0.80 Swimming pools 4%S=tank volume (l) 20000000 Spa 0.80
Greywater used for:Rainwater used for: Q2 EMPLOYEES distribQ1 Food Garden Irrigation Toilets 20%Sinks + Showers Swimming Pools Showers + Sinks 80%Spa Laundry EFFICIENT FIXTURESEFFICIENT FIXTURESKitchens Process Water Irrigation 0%Drinking Q3 Laundry 15%Q2 Landscaping Kitchens 15%Food Garden Irrigation Toilet Flushing Showers + Sinks 15%Swimming Pools BLACKWATERBLACKWATERBLACKWATER Toilets 0%Laundry Recycled from: Evap. coeff Food Gardens Irrigation 0%Process Water Kitchens 0.80 EDUCATIONEDUCATIONQ3 Toilets 0.80 Laundry 5%Landscaping Blackwater reused for: Guests Showers 5%Toilet Flushing Q3 Guests Toilets 5%
Landscaping Employees Showers 5%Toilet Flushing Employees Toilets 5%
DESALINATED WF REDUCTION
95.5%
REMAINING DESALINATED WF
2.871 M litres
GREY WF REDUCTION
100.0%
REMAINING GREY WF
0 M litres
original DESALINATE
D WF
original GREY WF
DESALINATED WF
RAIN WF GREY WF remaining grey + black
waterjanfebmaraprmayjunjulaugsepoctnovdecTOTALaverage
5480106 3816149 0 2793495 202905 0 14896075063783 3484722 0 2761246 0 0 13255885565049 3802887 0 2138584 886950 0 14191435257001 3706593 0 2755709 190755 0 15482824791424 3408051 0 1454184 1283912 0 14941134108456 2878381 0 -0 2344628 0 12321254710983 3274258 0 911451 1716341 0 13253255236246 3605381 0 1971871 870581 0 13597464744565 3257892 0 0 2553524 0 12008306074826 4198101 0 0 3328292 -0 16239715936495 4215852 0 -0 3297654 0 17511536514355 4632348 0 772877 2895511 -0 1977277
63483289 44280615 0 15559417 19571053 0 177471605290274 3690051 0 1296618 1630921 0 1478930
0
1000000
2000000
3000000
4000000
5000000
6000000
7000000
jan feb mar apr may jun jul aug sep oct nov dec
original DESALINATED WF original GREY WF DESALINATED WF RAIN WF GREY WF
RAINWATER HARVESTINGRAINWATER HARVESTING GRAYWATERGRAYWATERGRAYWATER GUEST ROOMS distribGUEST ROOMS distribRecycled from: Evap. coeff Toilets 16%
roof area (m2) 13500 Laundry 0.80 Showers + Sinks 80%runoff coef 0.90 Showers/bathroom sinks 0.80 Swimming pools 4%S=tank volume (l) 4000000 Spa 0.80
Greywater used for:Rainwater used for: Q2 EMPLOYEES distribQ1 Food Garden Irrigation Toilets 20%Sinks + Showers Swimming Pools Showers + Sinks 80%Spa Laundry EFFICIENT FIXTURESEFFICIENT FIXTURESKitchens Process Water Irrigation 0%Drinking Q3 Laundry 15%Q2 Landscaping Kitchens 15%Food Garden Irrigation Toilet Flushing Showers + Sinks 15%Swimming Pools BLACKWATERBLACKWATERBLACKWATER Toilets 0%Laundry Recycled from: Evap. coeff Food Gardens Irrigation 0%Process Water Kitchens 0.80 EDUCATIONEDUCATIONQ3 Toilets 0.80 Laundry 5%Landscaping Blackwater reused for: Guests Showers 5%Toilet Flushing Q3 Guests Toilets 5%
Landscaping Employees Showers 5%Toilet Flushing Employees Toilets 5%
DESALINATED WF REDUCTION
75.5%
REMAINING DESALINATED WF
15.559 M litres
GREY WF REDUCTION
100.0%
REMAINING GREY WF
0 M litres
original DESALINATE
D WF
original GREY WF
DESALINATED WF
RAIN WF GREY WF remaining grey + black
waterjanfebmaraprmayjunjulaugsepoctnovdecTOTALaverage
5480106 3816149 0 2123809 872591 0 14896075063783 3484722 0 1633726 1127520 0 13255885565049 3802887 0 2753374 272160 0 14191435257001 3706593 0 1873619 1072845 0 15482824791424 3408051 0 532607 2205489 0 14941134108456 2878381 0 -0 2344628 0 12321254710983 3274258 0 204035 2423757 0 13253255236246 3605381 0 409854 2432598 0 13597464744565 3257892 0 1151457 1402067 0 12008306074826 4198101 0 0 3328292 -0 16239715936495 4215852 0 1612251 1685403 0 17511536514355 4632348 0 1086 3667302 -0 1977277
63483289 44280615 0 12295818 22834652 0 177471605290274 3690051 0 1024652 1902888 0 1478930
0
1000000
2000000
3000000
4000000
5000000
6000000
7000000
jan feb mar apr may jun jul aug sep oct nov dec
original DESALINATED WF original GREY WF DESALINATED WF RAIN WF GREY WF
RAINWATER HARVESTINGRAINWATER HARVESTING GRAYWATERGRAYWATERGRAYWATER GUEST ROOMS distribGUEST ROOMS distribRecycled from: Evap. coeff Toilets 16%
roof area (m2) 13500 Laundry 0.80 Showers + Sinks 80%runoff coef 0.90 Showers/bathroom sinks 0.80 Swimming pools 4%S=tank volume (l) 4000000 Spa 0.80
Greywater used for:Rainwater used for: Q2 EMPLOYEES distribQ1 Food Garden Irrigation Toilets 20%Sinks + Showers Swimming Pools Showers + Sinks 80%Spa Laundry EFFICIENT FIXTURESEFFICIENT FIXTURESKitchens Process Water Irrigation 0%Drinking Q3 Laundry 15%Q2 Landscaping Kitchens 15%Food Garden Irrigation Toilet Flushing Showers + Sinks 15%Swimming Pools BLACKWATERBLACKWATERBLACKWATER Toilets 0%Laundry Recycled from: Evap. coeff Food Gardens Irrigation 0%Process Water Kitchens 0.80 EDUCATIONEDUCATIONQ3 Toilets 0.80 Laundry 5%Landscaping Blackwater reused for: Guests Showers 5%Toilet Flushing Q3 Guests Toilets 5%
Landscaping Employees Showers 5%Toilet Flushing Employees Toilets 5%
DESALINATED WF REDUCTION
80.6%
REMAINING DESALINATED WF
12.296 M litres
GREY WF REDUCTION
100.0%
REMAINING GREY WF
0 M litres
Fig. 5.22. Water Footprint Design Tool results for scenario #2A (All strategies + high precipitation). This is the scenario in which the best results, understood as the desalinated water footprint reduction potential, are achieved. As this chart shows, desalinated water would only be required between May and August, as the available rainfall during the rest of the year 2006 is estimated to be suficient to cover the total rain water demand between September and April.
Fig. 5.23. Water Footprint Design Tool results for scenario #2B (All strategies + low precipitation). The lower precipitation values for the year 2005 prevented the achievement of results as good as those for Scenario #2A. In this case, desalination still appears to be necessary for 8 months of the year, while the rainwater for the remaining 4 months appears sufficient. In this case, the highest demand for desalinated water appears at the beginning of the year, between January and April.
Fig. 5.24. Water Footprint Design Tool results for scenario #2C (All strategies + average precipitation). The performance of the water system at this scenario is slightly higher than for scenario #2B. This chart shows that desalinated water is necessary to cover the potable water demand of the resort during 9 months of the year. Even though this period is longer than for scenario #2B (8 months in total), the estimated volume of desalinated water required to cover the total demand of the resort is lower, therefore the desalinated water footprint reduction is higher.

75
5.4 Achievability of the Net-Zero Water Scenario
The results obtained from the Tool for the case-study indicate that significant reductions in the desalinated
WF of this resort can be achieved when all the water strategies are applied. However, not even in the best-
case scenario in terms of precipitation (scenario #2A) can the desalinated WF be completely nullified. The
following paragraphs discuss the potential achievability of the net-zero water goal by either increasing the
rainwater supply or further reducing the demand.
The volumetric reliability of the RWH system, as defined in section 4.1.1, tells us what percentage of the
total demand for rainwater can be satisfied by the RWH system.
E
DY
Tt
t 1
T
tt 1
T
==
=
||
This equation can be used as an indicator to assess the achievability of the net-zero water goal, as
the fraction of the water demand not being covered by the RWH system is fully satisfied by the reused
wastewater. The volumetric reliability values of the RWH system for scenarios #2A, 2B and 2C are 91.83%,
55.71%, and 65.77%, respectively (Table 5.3).
Scenario Applied Strategies Precipitation (Year) Volumetric Reliability
#2A All High (2006) 91.83%
#2B All Low (2005) 55.71%
#2C All Average (2010) 65.77%
The net-zero water goal would only be achieved if a 100% volumetric reliability is achieved at all these
scenarios. Based on the equation, three groups of measures could be implemented in order to move
toward the net-zero water goal: a rainwater supply increase, a further rainwater demand reduction, or a
combination of both.
On the supply side, some of the parameters used for the RWH system in the previous calculations were
already at their maximum level, so that further optimization of them is not possible. The considered runoff
coefficient, 0.90, was already very high, especially considering that 27% of the catchment area corresponds
to thatched roofs. Further improvements of the runoff coefficient are therefore not possible, as the previous
one already assumed that thatch roofs could be replaced by other types of roof. Similarly, in order to
simplify the calculations and maximize the RWH system potential, an infinite storage volume (overflow=0)
Table 5.3. Volumetric reliability for scenarios #2A, #2B and #2C.

76
was considered, so there is no room for improvement regarding this variable either. The only variable
affecting the inflow volume of the RWH system that could be improved is thus the catchment area. Since
the previous calculations assumed that rainwater was harvested from the total roof area of the resort,
further increase of this variable would imply considering not only the rooftops but also the hardscape
areas of the resort as potential catchment surfaces. In addition to the ones already considered in the
previous Tool calculations (i.e. Wastewater recycling, efficient devices, and education), further demand
reduction measures could also lead to the achievement of the goal. These measures would need to
focus specifically on reducing the demand of the services requiring potable water quality, as these are
the ones using rainwater as a source. The volume of wastewater produced by the resort largely exceeds
the demand corresponding to the services that reuse the treated wastewater. Therefore, further demand
reduction options could make use of this remaining wastewater in different ways. For instance, depending
on the condition of the aquifer of the island, this remaining treated wastewater volume could be used to
refill the aquifer in a way that allows groundwater use as an additional potable source in a sustainable way.
Other demand reduction measures could rely on more ambitious water conservation programs, based on
an improvement in guest and employee behaviour, as the previous calculations assumed that only 5% of
the demand of certain services could be achieved by educational programs.
All these potential measures for further increasing the rainwater supply or reducing the rainwater demand
cannot yet be quantified, as the required information for that purpose is not available from this case-study.
However, the Tool allows us to calculate how much the catchment area would need to be increased in
order to achieve the net-zero water goal under different demand reduction hypotheses. The following
graphics (Figs. 5.25, 5.26, 5.27) show the minimum conditions of the RWH system (catchment area and
storage volume) for achieving the net-zero water goal under different demand reduction hypotheses.
Fig. 5.25. Net-zero water achievability study with no additional rainwater demand reduction for scenarios #2A, #2B and #2C. The graphic shows the minimum catchment area in sqm together with its associated storage volume in litres for achieving a 99% volumetric reliability.

77
The first graphic (Fig. 5.25) shows the minimum catchment area and its corresponding minimum storage
volume, if no further demand reduction measures are applied. It can be observed that the worst-case
rainfall scenario (2005) does not even appear within the limits of the graphic. Furthermore, the required
catchment area increase, even for the year with the highest precipitation (2006), is very high and so are the
minimum storage volume values. The second graphic (Fig. 5.26) assumes that the demand for rainwater
has been reduced by 20%, in which case the worst-case scenario already appears. For the best-case
precipitation scenario (year 2006), even withno further catchment area increase (the red line indicates the
current roof area of the resort), 100% volumetric reliability can be achieved with a storage volume of 4.5ML.
However, for the average and worst-case scenarios (years 2010 and 2005 respectively), an increase in the
catchment area is always necessary, and the required storage volumes would still have to be considerably
high. The last graphic (Fig. 5.27) shows an hypothesis in which the rainwater demand has been reduced
by 40% and, in this case, even for the average year, the goal can be achieved without increasing the
catchment area. Also, the required storage volume significantly decreases for higher catchment areas,
Fig. 5.26. Net-zero water achievability study considering an additional rainwater demand reduction of 20% for scenarios #2A, #2B and #2C. The graphic shows the minimum catchment area in sqm together with its associated storage volume in litres for achieving a 99% volumetric reliability.
Fig. 5.27. Net-zero water achievability study considering an additional rainwater demand reduction of 40% for scenarios #2A, #2B and #2C. The graphic shows the minimum catchment area in sqm together with its associated storage volume in litres for achieving a 99% volumetric reliability.

78
stabilizing under 1ML for all scenarios. A combination of both a catchment area increase and further
demand reduction measures appears thus as the best hypothesis for achieving a net-zero water goal for
this resort.
As explained above, the first calculations assumed an infinite water storage volume. However, this is one
of the most important values to be considered when designing a rainwater harvesting system. These
graphics offer an idea of what the required storage volumes would be for different catchment areas. It
should be noted that these two variables are directly dependent on each other. Storage volume needs to
receive special attention for several reasons. On the one hand, it has a major impact on the cost of the
RWH system. The potential variation between differently dimensioned RWH systems depends uniquely on
the cost variation of the storage tank (material, size) as the rest of the costs are fixed independently of the
size of the storage (Oliveira Ilha & Siqueira Campos, 2011). On the other hand, enough space for tanks
and cisterns needs to be available, as suitable places for water storage are not always easy to find on
small islands (Pigram, 2001). Moreover, environmental impacts associated with the construction of tanks
may also appear. These potential impacts and the availability of space for storage may result in further
limitations associated with the rainwater footprint component. Based on these considerations, it must be
assumed that the RWH systems need to be optimized and a site analysis assessing potential impacts
needs to be included as part of their design process.
This case-study allows us to illustrate the problem of water supply and demand in the context of this
thesis and serves as a perfect scenario at which to apply the developed Tool. The analyzed resort is a
good representative of most other resorts in the Maldives, and also in other SIDS with similar climates,
as identical supply conditions (major dependence on desalination, lack of blue water sources, and
similar precipitation patterns) can be expected. In terms of water demand, it is harder to determine how
representative the resort is, as detailed consumption patterns from other facilities could not be obtained.
The importance of how representative the case-study is in terms of water demand is however relative. This
thesis aims to assess the potential achievability of a net-zero water goal at this type of destination and
one case-study is enough for this purpose. This case-study demonstrates that very significant reductions
can be achieved through the implementation of various water strategies and indicates that the net-zero
water goal could be achieved if further measures were applied. The set of measures included in the final
hypotheses go beyond the implementation of a series of water saving technologies and imply, in many
cases, measures that could be more easily introduced during the design process of the resort. Under
these specific supply conditions, for which this case-study is representative, ambitious water goals appear
thus as achievable for new beach resorts.
.
79
6 DESIGNING A NET-ZERO WATER RESORT
ACHIEVING AMBITIOUS WATER GOALS AT NEW RESORT DEVELOPMENTS
The previous case-study is an example of how challenging it is to move toward a more sustainable water
model in the context of tourism in SIDS. The rainwater supply becomes a key piece of the system, as it
is the only water source whose environmental and social impacts do not impede the achievability of the
goal. Other locations, either in the Maldives or in any other small island developing state, would present
similar water supply access restrictions. The highest reliability on the rainwater supply system thus needs
to be assured. Moreover, the high water demand shown by the beach resort, which is characteristic of this
type of tourism facility, makes the net-zero water goal unachievable, even under favourable precipitation
conditions. However, the desalinated water footprint reduction achieved at the simulation (higher than 75%
at the worst case scenario) is very significant, even though the analyzed resort was not initially conceived
for achieving such a challenging goal. The net-zero water goal may therefore be achievable if incorporated
at early stages of the design process of a new resort. In this case, since design teams would have more
control over the supply system and demand patterns, their optimization would thus be easier to achieve
than for an existing project. This chapter explains how the previously described framework should be
applied to a new development scenario in order to facilitate the achievement of the net-zero water goal.

80
6.1 Net-Zero Water Goal Review
The achievability of the net-zero water goal has been defined by the following equation:
SUPPLY from sources meeting the established criteria (see chapter 2)
DEMAND relying on these supply sources
This case-study demonstrates how important it is to consider the water system as a whole for achieving
challenging results, including the net-zero water goal. Both sides of the previous equation thus need to be
carefully regarded (Fig. 6.1).
On the supply side, given the isolation condition of the case-study, rainwater is identified as the only
freshwater source meeting the established criteria. As defined in chapter 2, the goal is not achieved by a
complete reduction of all the water footprint components, but by nullifying all the environmental and social
impacts associated with each water footprint component. Other supply alternatives for the island, such as
desalination, groundwater or imported water are discarded in the previous example, given their associated
impacts. However, additional supply sources not existing in the Maldives, due to the very small size of most
islands, may appear at other destinations. Larger islands in other SIDS may have surface water bodies or
aquifers less vulnerable to sea water intrusion. Rainwater is therefore not necessarily the only alternative in
all geographical contexts. The potential incorporation of additional water supply sources into the net-zero
water scenario needs to be assessed, based on the specific analysis of each geographical context.
On the demand side, the potential reduction achieved through wastewater recycling and conservation
measures, such as educational programs or efficient fixtures, is highly dependent on the demand pattern
of the assessed project. The case-study, a luxury beach resort, has a very particular demand pattern due
to the amount of water intense services offered to guests and for the recreational character of this form
of tourist activity. The consumption data offered by the resort showed that the highest water consumption
occurs in guest rooms. Based on previous studies, it is considered that showers consume most of the water
in these rooms, this service requiring almost 50% of the case-study's total water consumption. Different
tourism facility types (non beach resorts) would present a different consumption pattern. Different tourist
capacities (from guesthouses to large scale resort cities), facility typologies (low versus high density), and
types of services (swimming pools, golf courses, spas) would determine the new demand pattern. The
potential savings obtained through the implementation of the same strategies may vary significantly.
These two variables, supply and demand, correspond to the two sets of data introduced in the Tool for
= 100%

81
assessing the potential footprint reduction of an existing beach resort. The same tool can be used to
assess the achievability of the net-zero water goal for new tourism projects. In these cases, as explained
above, new sets of data corresponding to the new supply and demand conditions would be introduced.
Each set of data, supply and demand, depend on different factors.
On the one hand, the water supply conditions depend exclusively on the project location. The impacts
related to the water footprint of the new development will be local, so every project requires an independent
analysis of its water context. When rainwater is considered as one of the potential supply sources, the
rainfall data to be introduced in the Tool needs to be specific to the project location. Similarly, if other
sources are considered, their supply parameters and limitations need to be determined in the initial
analysis of the local context as well.
On the other hand, the water consumption pattern of the new resort will depend on the specific program
of the new project. As no real consumption data will be available for new developments that are still
not operating at the moment of the assessment, the introduced demand pattern needs to be based on
existing projects hosting programs as similar as possible to the new one. Beach resorts that are similar
in size, accommodation type and number of water-related services offered, will generally present similar
demand patterns. However, different tourism segments are characterized by very different facility types
and services. For instance, urban hotels or ski resorts are very different from the case-study in terms of
programming. Applying this framework to other facility types would therefore require the introduction of the
specific demand estimations based on projects corresponding to the same tourism segment.
Maldives
SIDS
OtherLocation
BeachResort
TourismFacility
O t h e r Building
PROGRAMMATIC ADAPTATION
GENERIC
SPECIFIC
GEO
GRA
PHIC
AL
AD
APT
ATIO
N
CASE-STUDY
Fig. 6.1. Adaptability diagram.

82
Finally, the results of the case-study also showed that the efficiency of all the considered strategies, and
therefore the potential for improving the performance of the whole system, depended on a number of
different variables. For this reason, the appropriate design of all these strategies, associated with both the
supply and the demand, is crucial for achieving the established goal. All the design parameters that affect
the performance of each strategy will therefore have to be optimized in order to obtain the best results.
These three main components, supply, demand, and their optimization, correspond to three different
scales: geographical, system, and device scales (Fig. 6.2). For a new project, the process for achieving
the net-zero water goal needs to cover all these three scales, from selecting an appropriate site to defining
the finest detail of each water strategy.
6.2 Design Process for Achieving the Net-Zero Water Goal at New Resort Developments
The application of the proposed framework to a new beach resort is thus presented as a three-scale
process covering all the requirements for achieving a net-zero water goal (Fig. 6.3). The geographical scale
focuses on the supply sources to which the potential site may have access and the specific assessment
of each of them in order to understand their impacts. The system scale determines the conditions for the
program definition based on the previously identified supply sources. This program definition is based on
a scenario in which all the water strategies considered in the Tool are applied. Finally, at the device scale,
a series of design variables corresponding to each previous strategy is identified and controlled in order
to optimize the efficiency and transparency of all these strategies.
LOCATION SUPPLYOPTIONS
GEOGRAPHICALSCALE
PROGRAM DEMANDPATTERNS
SYSTEMSCALE
DESIGN SUPPLY + DEMANDOPTIMIZATION
DEVICESCALE
Fig. 6.2. Three-step design process diagram.

83
6.2.1 GEOGRAPHICAL SCALE
The first step of the application of the proposed framework for achieving a net-zero water goal is an
analysis of the geographical context in which the actual or potential site is located. This analysis will
determine if there are freshwater sources whose impacts do not impede the achievement of the goal
and also their capacity for supplying the required water demand associated with the new program. The
ultimate goal of this first step is the determination of the capacity of the existing sources to provide a water
supply adequate to the achievement of the goal. This capacity determination process will be based on a
complete and detailed analysis of the local water context.
GEOGRAPHICAL SCALE(island, watershed, region, city, community)
SYSTEM SCALE(project, site, building)
DEVICE SCALE(technology, strategy, tool)
Fig. 6.3. Three-scale process. Units of analysis.
Fig. 6.4. Soneva resort, Kunfunadhoo island aerial view. Source: Soneva.
Fig. 6.5. Manu Island, Fiji. By Heinz Albers,Heinz Albers (Own work). CC-BY-SA-3.0 (http://creativecommons.org/licenses/by-sa/3.0/), via Wikimedia Commons.
Fig. 6.6. English Bay, Vancouver, BC. By No real name given. CC-BY-2.0 (http://creativecommons.org/licenses/by/2.0)], via Wikimedia Commons.
Fig. 6.7. Adams River watershed map. By Obsidian Soul (Own work) [CC-BY-SA-3.0 (http://creativecommons.org/licenses/by-sa/3.0)], via Wikimedia Commons.

84
The impacts associated with the water footprint of a beach resort are always local, so an analysis on the
specific water context of each project is required. The geographical unit to be analyzed at this first scale
depends on the site conditions. For the case-study, the geographical unit was the very small island on
which the resort is located (Fig. 6.4). Other tourism destinations offering similar programs could be located
on larger islands (Fig. 6.5), on which additional supply sources, such as surface or larger groundwater
bodies could be available. Even though this thesis focuses on small island developing states, beach
resorts are also found on mainland coastlines at very different latitudes, in which case the unit of analysis
would correspond to the whole watershed in which the site is located (Fig. 6.7). Resorts can also be part
of a city and have access to the municipal water supply. In these cases, the city as a system would be the
unit of analysis at the geographical scale (Fig. 6.6).
Once the geographical unit has been defined, the next step is to identify all the potential water supply
sources to be used at the projected site. For the case-study, the available sources on the island were
desalination (offered by the existing plant at the resort), rainwater, and groundwater (these two not being
used for operating the resort at the moment). Different sites may not have some of these sources. For
instance, desalination is typical at locations where there is no access to more conventional blue water
sources. Similarly, freshwater supply from surface water bodies, such as rivers or lakes, nonexistent in this
case-study, may be an alternative at other locations.
For all the identified supply options, an analysis based on the water accounting framework adapted to the
built environment needs to be performed. This analysis includes the classification of each water supply
source according to the redefined water footprint types, as well as the identification of the impacts and
risks associated with each of them. The assessment of each water source is different, since the indicators
used for determining their impacts and risks are different (Table 6.1). Furthermore, this impact and risk
determination needs to consider the grey water footprint of the new project, even though this footprint is
not directly associated with the freshwater supply.
The analysis of each potential freshwater source needs to be detailed enough to provide a complete
understanding of the potential consequences of its use. Also, the indicators should allow the design
team to determine the freshwater capacity of the site throughout a certain time period. The parameters
determining the availability of water from each potential source are not always constant. Variations may
appear, not only between different seasons but also from one year to the next. For instance, as far as
harvested rainwater is concerned, knowing the total annual precipitation for a specific site is not enough
to determine its capacity to satisfy the rainwater demand during the peak season. As explained in chapter

85
INDICATORS FOR WATER SUPPLY SOURCE ASSESSMENTWATER SUPPLY SOURCE INDICATOR SAMPLES UNIT OF MEASUREMENT
Desalination
Type (Desalination Technology)
Capacity
Delivery Cost
Environmental Cost (impacts)
Social Cost (impacts)
Initial investment + maintenance cost
Payback period
e.g. Reverse Osmosis
Litres/day Litres/year
$/Litre
e.g. CO2 emissions, brine conditions
e.g. community access restrictions
$ $/year
Years
Groundwater
Type (Aquifer type and vulnerability)
Capacity (Renewable Recharge Rate)
Delivery Cost
Environmental Cost (impacts)
Social Cost (impacts)
Initial investment + maintenance cost
Payback period
Confined / Unconfined
Litres/day Litres/year
$/Litre
e.g. ecosystem damage
e.g. community access restrictions
$ $/year
Years
Rainwater
Type (RWH system type)
Capacity (precipitation pattern, runoff coef, dry periods)
Storage system (type + volume)
Delivery Cost
Environmental Cost (impacts)
Social Cost (impacts)
Initial investment + maintenance cost
Payback period
e.g. rooftop RWH system
Litres/day Litres/year Variability
e.g. underground cistern Litres
$/Litre
e.g. aquifer recharge interruption
e.g. community access restrictions
$ $/year
Years
Surface Water
Type (RWH system type)
Capacity (precipitation pattern, runoff coef, dry periods)
Delivery Cost
Environmental Cost (impacts)
Social Cost (impacts)
Initial investment + maintenance cost
Payback period
e.g. Stream, lake, wetland
Litres/day Litres/year Variability
$/Litre
e.g. ecosystem damage
e.g. community access restrictions
$ $/year
Years
Municipal Water Original Source (+ complete analysis of its indicators)
Delivery Cost
e.g. Groundwater, surface water
$/Litre
Imported WaterOriginal Source (+ complete analysis of its indicators)
Delivery Cost
e.g. Groundwater, surface water
$/Litre
Table 6.1. List of indicators for the assessment of different potential water supply sources.

86
4, a daily step is required for assuring reliable results in the calculation process. Daily precipitation values
allow the design team to consider seasonal variability and dry periods, which play a significant role in
designing a rainwater harvesting system. Furthermore, rainfall patterns are not constant every year. The
previous parameters, total annual precipitation or the length of dry periods, also vary inter-annually. The
obtained daily rainfall data should therefore not be limited only to a specific year but include a number of
consecutive years, allowing for an understanding of the long term variability of the precipitation patterns.
From this data, the designers can then determine the best, average, and worst case scenario years, as
the ones established for the case-study, and use them to assess the availability and/or limitations of that
source. These temporary variations are not only applicable to harvested rainwater, as seasonal and inter-
annual variations also apply to other freshwater supply options, such as groundwater or surface water. The
level of detail of their indicators should thus be equally high.
Based on an exhaustive analysis of each potential freshwater source, the impacts and risks associated
with each of them could be identified. This way, design teams will be able to determine which source/
sources should be considered for a net-zero water scenario. Moreover, the indicators above will allow
them to establish the supply limitations for each source. For instance, the rainfall pattern would indicate
how much rainwater could be harvested and used at the tourism facility at different times of the year. The
recharge rate of an aquifer would indicate how much groundwater could be used without depleting the
source. The availability limitations associated with each source will form the basis for defining the program
at the next step.
6.2.2 SYSTEM SCALE
The second step of the process corresponds to what was previously called the system scale. At this
scale, developers and design teams should define the program based on the assessment of the previous
geographical conditions. The limitations shown by the indicators associated with each freshwater supply
source will serve as references for determining the water capacity of the new project (Fig. 6.8).
SUPPLY CAPACITY(geographic scale)
+
EFFICIENT DEMANDPATTERN
(tool)
ABSOLUTE DEMAND(litres/year)
RELATIVE DEMAND(litres/occupant · day)
Program Parameters:
- Project Size- Occupant Capacity- Water-related Services- Seasonal Limitations
Fig. 6.8. Program definition diagram.

87
At this second scale, the unit of analysis is reduced to the project site. In the case-study, this system unit
was exactly the same as the geographical unit, the island (Fig. 6.9). This is a very particular situation that
does not occur in many development scenarios. On larger islands, the resort site would only occupy part
of it. Other resorts or accommodation types located in different geographical contexts will have similar
sites, smaller than the geographical unit considered at the previous step (Figs. 6.10, 6.11). In any case, the
site is the intermediate scale at which the water system of the project needs to be considered as a whole,
instead of as a group of isolated strategies.
The first step at this second scale is to determine the demand pattern of the new project. Contrary to the
case-study, new projects are being considered in this chapter, so no metered water data for the assessed
project will be available. This demand pattern must therefore be based on measurements taken at projects
that host similar programs. As in the case-study, in order to increase the reliability of the calculations
made with the Tool, this data needs to be of high resolution, metered on a daily basis, and differentiate
the main uses. Through this differentiation, the Tool will allow us to determine how much the originally
estimated demand can be reduced through the application of a closed-loop water system (Fig. 6.12).
This reduced demand pattern will finally be used to determine the maximum water capacity of the new
project, according to the limitations established by the geographical scale analysis. Based on the water
capacity, the design team and developers will be able to define different program variables, such as the
size of the operation, the number of occupants it can accommodate, and the number of services that rely
on freshwater included in the new project.
Fig. 6.9. Soneva resort, Kunfunadhoo island, aerial view. Source: Soneva.
Fig. 6.10. Bahia Principe Resort in Jamaica. By Jasonbook99 (Own work) [CC-BY-SA-3.0 (http://creativecommons.org/licenses/by-sa/3.0), via Wikimedia Commons.
Fig. 6.11. Bellagio in Las Vegas. By Kris Ziel (Own work). CC-BY-3.0 (http://creativecommons.org/licenses/by/3.0), via Wikimedia Commons.

88
6.2.3 DEVICE SCALE
The case-study showed that, even after incorporating all the water strategies considered in the Tool, the
net-zero water goal was not achievable. Based on the two previous scales, the reasons for not achieving
the goal could be either an insufficient supply, an excessive demand, or a combination of both. On the one
hand, it could be considered that the local rainfall pattern is not adequate to cover the whole demand of
a tourism facility of this type. In fact, significant variations were observed between different years, having
different amounts of total annual rainfall and diverse distribution patterns throughout the year. On the
other hand, it could be assumed that, even though the amount of rainfall available is considerably higher
when compared with other climatic zones, the size of the resort and the number of water intense services
offered to tourists make the goal unachievable. As a consequence, design teams are responsible for
optimizing the strategies that correspond to each of the two previous scales (i.e., the geographical and
system scales). Their role in maximizing the benefits from every water strategy is crucial. The key to
achieving the goal lies not only in how many water strategies are applied but also on how these strategies
are implemented. At this third step, which corresponds to the device scale, we present a list of design
parameters to be considered by teams in this optimization process.
There are many variables affecting the performance of the water system that can be controlled by design
teams from the early stages of the design process. Achieving a net-zero water goal requires the designers
to exert strong control over these variables. The way the different water-related strategies are incorporated
into the building or its surrounding landscape determines their efficiency and, in some cases, can generate
additional benefits. Design integration, increased transparency, and showing occupants how building
users’ interact with these technologies can improve their awareness, thus helping them to become active
participants in achieving the net-zero water goal.
backupsupply
Q1Q2
Q3
treatment
GW
BWsupply wastewater
Fig. 6.12. From conventional to closed-loop water systems.

89
Each strategy (e.g. a rainwater harvesting system, greywater recycling, efficient fixtures) has a different
level of flexibility in terms of design. While some of them, such as RWH depend on many different variables
that can be controlled by designers (catchment area, tank type and location, and roof materials), other
strategies, such as the use of efficient plumbing fixtures, do not leave much room for designers to improve
their water saving potential. Therefore, this third scale focuses on those strategies whose performance
mostly depends on their design: rainwater harvesting systems for water supply and wastewater recycling
for demand reduction.
The improvement of these strategies through design will focus on two main aspects (Fig. 6.13). On the
one hand, designers will examine their efficiency, which will be optimized based on the quantitative and
qualitative variables associated with each of them. On the other hand, they will look at their transparency,
which is also to be increased in order to maximize their potential use as learning tools and therefore
contribute indirectly to further water conservation by improved occupant behaviour.
EFFICIENCY
The different variables to be controlled by design teams for optimizing the efficiency of the two main
considered strategies are the following:
Rainwater Harvesting Systems:
A rainwater harvesting system is composed of many different elements, all of them described in chapter
3: catchment surfaces, storage tanks, distribution system, and treatment devices. The two components
identified as having a higher flexibility in terms of design are the catchment area and the storage system
(Table 6.2). The decisions made regarding these two sets of variables have a direct impact on the efficiency
and cost of the system. They also affect the input data introduced in the Tool for the rainwater harvesting
system and will therefore have an important influence on the results of the simulation.
SUPPLY RWH SYSTEMS
WASTEWATERRECYCLING
EFFICIENTDEVICES
IMPROVED DESIGN
INCREASEDEFFICIENCY
INCREASEDTRANSPARENCY
OCCUPANT’SBEHAVIOUR
DEMAND
Fig. 6.13. Water strategies. Optimization diagram.

90
DESIGN VARIABLES FOR RAINWATER HARVESTING SYSTEMSDESIGN VARIABLE OPTIONS DIRECT IMPACT ON TOOL CELL AFFECTED
Catchment Area
Surface Type
Rooftops
Hardscapes
Both
Water Quality
Runoff Coefficient
Potential Area
Runoff Coefficient
Area Future Uses
Size (Area) Multiple Inflow Volume Area
GeometrySlopped
Flat
Runoff Coefficient Runoff Coefficient
MaterialMultiple Water Quality
Runoff Coefficient
Runoff Coefficient
Future Uses
Storage
Type
Open
Closed
On-site
Prefabricated
Water Quality
Potential Reuse
Loss through Evaporation
Potential Volume
Future Uses
Size Multiple Storage Volume Storage Volume
Location
Aboveground
Underground
In-Between
Water Quality
Design Integration Potential
Future Uses
original DESALINATE
D WF
original GREY WF
DESALINATED WF
RAIN WF GREY WF remaining grey + black
waterjanfebmaraprmayjunjulaugsepoctnovdecTOTALaverage
5480106 3816149 0 3274055 916505 2657091 -4842465063783 3484722 0 2762120 1127520 2433752 -5028245565049 3802887 0 3998085 272160 2608602 -4670325257001 3706593 0 2921061 1072845 2514928 -3504884791424 3408051 0 1458301 2173489 2296291 -3255084108456 2878381 0 829003 2308628 1866812 -2801644710983 3274258 0 1209107 2388757 2178269 -4391285236246 3605381 0 1553788 2454104 2438145 -4740064744565 3257892 0 2246185 1394561 2208576 -4493206074826 4198101 0 1384940 3275292 2903965 -5557205936495 4215852 0 2738740 1758403 2929044 -5543546514355 4632348 0 1314295 3624388 3200323 -636776
63483289 44280615 0 25689681 22766652 30235799 -55195665290274 3690051 0 2140807 1897221 2519650 -459964
0
1000000
2000000
3000000
4000000
5000000
6000000
7000000
jan feb mar apr may jun jul aug sep oct nov dec
original DESALINATED WF original GREY WF DESALINATED WF RAIN WF GREY WF
RAINWATER HARVESTINGRAINWATER HARVESTING GRAYWATERGRAYWATERGRAYWATER GUEST ROOMS distribGUEST ROOMS distribRecycled from: Evap. coeff Toilets 16%
roof area (m2) 13500 Laundry 0.80 Showers + Sinks 80%runoff coef 0.90 Showers/bathroom sinks 0.80 Swimming pools 4%S=tank volume (l) 4000000 Spa 0.80
Greywater used for:Rainwater used for: Q2 EMPLOYEES distribQ1 Food Garden Irrigation Toilets 20%Sinks + Showers Swimming Pools Showers + Sinks 80%Spa Laundry EFFICIENT FIXTURESEFFICIENT FIXTURESKitchens Process Water Irrigation 0%Drinking Q3 Laundry 15%Q2 Landscaping Kitchens 15%Food Garden Irrigation Toilet Flushing Showers + Sinks 15%Swimming Pools BLACKWATERBLACKWATERBLACKWATER Toilets 0%Laundry Recycled from: Evap. coeff Food Gardens Irrigation 0%Process Water Kitchens 0.80 EDUCATIONEDUCATIONQ3 Toilets 0.80 Laundry 5%Landscaping Blackwater reused for: Guests Showers 5%Toilet Flushing Q3 Guests Toilets 5%
Landscaping Employees Showers 5%Toilet Flushing Employees Toilets 5%
DESALINATED WF REDUCTION
59.5%
REMAINING DESALINATED WF
25.69 M litres
GREY WF REDUCTION
31.7%
REMAINING GREY WF
30.236 M litres
Table 6.2. Design variables affecting the rainwater harvesting system.
Fig. 6.14. Water Footprint Design Tool. Page 2: Control panel.

91
A. Catchment Area: Not only the size but also the nature of the catchment area can significantly impact both
the quantity and the quality of the harvested water. The following variables associated with the catchment
area are to be optimized for increasing the water inflow into the RWH system, as well as its quality:
A.1. Surface type: two different types of catchment surfaces are generally identified: rooftops and
hardscapes (Fig. 6.15). While rooftops are more commonly used for harvesting rainwater and are generally
more protected against pollution from human use than hardscapes, floor surfaces need to be incorporated
in some cases in order to increase the rainwater inflow into the system. The type of surface considered as
catchment area will have a direct impact on the quality of the harvested rainwater and also on the runoff
coefficient.
A.2. Size: The size of the catchment area is also to be determined by designers (Fig. 6.16). While in
some cases, as explained above, rooftops may not be sufficient to cover a high rainwater demand, some
programs may not require the use of the whole roof or hardscape area of the specific project. For instance,
the CIRS building at UBC harvests rainwater for potable use only from the rooftops of the two higher wings
of the building. The rooftop of the auditorium is covered by a green roof aimed to improve stormwater
management, but rainwater is not harvested from it. The optimum size of the catchment area will depend
on other parameters, such as the rainwater demand and the storage volume of the RWH system.
ROOFTOPS
backupsupply
Q1
backupsupply
HARDSCAPES
Q1
ROOFTOPS
backupsupply
HARDSCAPES
Q1
backupsupply
Q1
60% ROOFTOP AREA
backupsupply
Q1
100% ROOFTOP AREA
Fig. 6.15. Surface types for catchment areas of rainwater harvesting systems.
Fig. 6.16. Catchment area variations for rainwater harvesting systems.

92
A.3. Geometry: The geometry of the catchment surface can also impact the runoff coefficient of the system
(Fig. 6.17). As seen in chapter 3, flat roofs generally present a lower runoff coefficient than sloped roofs
using the same material.
A.4. Material: Finally, the selection of the material used for the catchment area will impact very significantly
the runoff coefficient and therefore the inflow volume of the RWH system (Table 6.3). Climate conditions
also impact this coefficient directly, as warmer temperatures generally result in higher evaporation rates.
Some materials may also impact the quality of the harvested water. The following table shows the different
runoff coefficients for a series of materials typically used for roofs.
SLOPING ROOFSRunoff Coefficient Reference
Concrete – Asphalt 0.9 Lancaster (2006)
Metal0.95 Lancaster (2006)
0.81-0.84 Liaw & Tsai (2004)
Aluminium 0.7 Ward et al. (2010)
FLAT ROOFS
Bituminous 0.7 Ward et al. (2010)
Gravel 0.8-0.85 Lancaster (2006)
Level Cement 0.81 Liaw & Tsai (2004)
backupsupply
Q1
SLOPPED ROOF
backupsupply
Q1
FLAT ROOF
Table. 6.3. Runoff coefficient for the most common roofing materials. Source: Farrany et al. 2011.
Fig. 6.17. Roof geometry variations for rainwater harvesting systems.

93
B. Storage tank: As for the catchment area, the dimensions and nature of the water storage system are
defined by design teams. Different tank types can impact the potential size and quality of the harvested
water. These are the identified design variables related to the storage system:
B.1. Type: Generally, two types of storage options appear: open and closed storage systems (Fig. 6.18).
Open storage systems, generally natural or artificial basins, require much more space than closed storage
tanks. The lack of available land area is a typical problem of small island resort development, so this solution
may not be an option in many cases. These large tanks are also more vulnerable to external agents that
can reduce the quality of the stored water. Extreme climatic conditions, implying high evaporation rates,
may also impact the efficiency of open systems. Closed systems, on the contrary, require less space, no
evaporation occurs and the quality of the stored water can be controlled more easily. Tanks can be built on
site (usually made of concrete or masonry), or be prefabricated (generally metal or plastic barrels).
B.2. Size: Similar to the catchment area, the size of the storage tank has a high impact on the quantitative
performance of the RWH system (Fig. 6.19). The appropriate size of the tank needs to be determined
based on the water demand and the catchment area.
Q1
XXX LITRES
Q1
XXX LITRES
Q1
OPEN STORAGE
Q1
CLOSED STORAGE
CISTERNS
Q1
CLOSED STORAGE
PLASTIC / METALBARRELS
Fig. 6.18. Types of storage tanks for rainwater harvesting systems.
Fig. 6.19. Storage volume variations for rainwater harvesting systems.

94
B.3. Location: Closed tanks can be located underground, aboveground (even on the rooftops) or in between
(Fig. 6.20). While underground tanks may require higher construction costs, they are better protected
against temperature changes that might affect the quality of the water. The location of the storage system
is to be determined based on its size or the climatic conditions of the site. The selected location, as well
as the tank type, will also impact the maintenance conditions and cost of the RWH system.
Wastewater recycling:
The types and variables affecting the grey and blackwater recycling systems are multiple, and their choice
can significantly impact the efficiency of this strategy (Table 6.4). The three variables having a greater
impact on the performance of wastewater recycling systems are the treatment plant location, the treatment
type and the capacity of the treatment system.
DESIGN VARIABLES FOR WASTEWATER RECYCLING SYSTEMSDESIGN VARIABLE OPTIONS DIRECT IMPACT ON TOOL CELL AFFECTED
Location
On-Site
Off-Site
System Capacity
Design Integration Potential
Potential Reuse
Wastewater Sources
Future Uses
Treatment Type
Extensive
Intensive
Mechanical
Natural
Treatment Cost
Design Integration Potential
Potential Reuse
Efficiency
Evaporation Coefficient
Wastewater Sources
Future Uses
CapacityIndependent
Reclaiming
Treatment Cost
Efficiency
Future Uses
Q1
UNDERGROUND TANK
Q1
ABOVEGROUND TANK
Q1
IN-BETWEEN
Fig. 6.20. Storage tank location variations for rainwater harvesting systems.
Table. 6.4. Design variables affecting the wastewater recycling system..

95
A. Location: Wastewater treatment and recycling can be done at the project site or at a municipal facility
(Fig. 6.21). When performed off-site, the wastewater generated by the building is treated together with
wastewater from other developments. In some cases, the treated water is available as reclaimed water to
be reused by the same or different projects. On-site systems have a smaller size and are designed as part
of the project, so their variables are controlled by design teams.
B. Treatment type: Chapter 3 offers an overview on different treatment types for grey and blackwater
recycling. As open rainwater storage systems, artificial wetlands require larger areas and are more
vulnerable against climatic conditions or external pollutants (Fig. 6.22). Smaller scale systems can be
classified according to the treatment process. Systems imitating natural processes, such as the one used
at the CIRS building, are preferred, as the energy and treatment costs associated with them are lower.
C. Size: Again, the system size will depend on the amount of water to be treated. In some cases, the system
can be conceived for treating wastewater not only from the given site but also from those of neighbours
(Fig. 6.23), as the CIRS building does, contributing to the grey WF reduction of the whole neighbourhood.
Q2Q3
GW
BW
INTENSIVE TREATMENTMECHANICAL PROCESSES
aquifer recharge
Q2Q3
GW
BW
aquifer recharge
Q2Q3
EXTENSIVE TREATMENTCONSTRUCTED WEETLANDS
aquifer recharge
Q2Q3
GW
BW
INDEPENDENT SYSTEMS
Q2Q3
GW
BW
RECLAIMING SYSTEMS
Q2Q3
ON-SITE TREATMENT
GW
BW
Q2Q3
OFF-SITE TREATMENT municipaltreatment facility
reclaimedwater
Fig. 6.21. On-site vs. off-site wastewater recycling systems.
Fig. 6.22. Extensive vs. intensive wastewater treatment.
Fig. 6.23. Independent vs. reclaiming wastewater recycling systems.

96
TRANSPARENCY
Chapter 3 explains how building occupants are starting to be considered as key participants in achieving
the challenging goals of green building. In the case of tourism facilities, guests are responsible for a great
fraction of the demand pattern of an accommodation facility. The high-resolution water consumption data
from the case-study showed that 51% of the total water used at the resort was consumed in guest rooms.
Tourists' commitments to reduce water consumption are therefore crucial for keeping the demand below
the supply limitations and achieving a net-zero water scenario.
Different ways of “triggering” the reactions of building users, namely, tourists, have been previously
described, from interpretive signage to economic incentives, including water pricing policies. This section
focuses on the designers’ integration of the water strategies, as explained in chapter 3 of this thesis, in
order to contribute to the awareness of the resort users and therefore to their behaviour improvement.
As previously mentioned, enhancing the visibility of (and accessibility to) these strategies, along with
increased opportunities for user involvement would contribute to a higher perception and understanding
of the water resource problem, and will therefore generate a positive reaction from employees and guests
(Fig. 6.24).
Different ways of increasing these three parameters, i.e., visibility, accessibility and involvement potential,
are illustrated by recent projects as follows:
Visibility: Enhancing visibility of the devices aimed to improve water management in a project is an efficient
way to increase occupants ‘perceptions of the problem. There are different ways of making these devices
or some of their elements visible, and, in some cases, a great integration into the design of the building or
the landscape can be achieved.
problemperception VISIBILITY
problemunderstanding ACCESSIBILITYincrease
reaction INVOLVEMENT
Fig. 6.24. Design variables affecting the transparency of the different water-related strategies.

97
The Swenson Civil Engineering Building (Fig. 6.25) in Duluth, Minnesota, designed by Ross-Barney
Architects and opened in 2010, is a good example of a high level of design integration of water strategies.
Besides incorporating additional strategies aimed at reducing resource consumption, the building is
characterized by its storm water management system. The oversized wooden scuppers collecting the
runoff from the rooftop appear as one of the main design components of the whole project, participating
not only as a water feature but also as an aesthetic element, visible from both outside and inside the
building. The runoff from these scuppers falls into several corten steel drums, which become as well part
of the landscape design (Fig. 6.26). This building has received great recognition for becoming a learning
tool in itself, incorporating systems which are also part of the civil engineering core curriculum (Mays,
2011).
Wastewater treatment systems, especially extensive ones (wetlands) can also be easily integrated into
the landscape design of a project. The Omega Center for Sustainable Living (Fig. 6.27), in Rhinebeck,
New York, was designed by BNIM Architects and opened in 2010. As an example of regenerative design
(Omega Center for Sustainable Living, 2013), the heart of the Omega Center is an Eco Machine which
collects wastewater from the whole campus and treats it by mimicking natural processes before sending
it back to the aquifer (Fig. 6.28). At the end of the treatment process, the water is retained in several
dispersal fields, from which the purified water slowly flows back into the aquifer. These dispersal fields
become a central component of the landscape design.
Accessibility: Besides contributing to a higher perception of the problem through an enhanced visibility,
water devices can also be used as learning tools that allows building users to understand the issue and
its potential solutions. Guided tours are an efficient way of introducing tourists to these technologies,
and both previous projects are good examples of how these devices can be made accessible. The CIRS
building on the UBC campus in Vancouver, used as a precedent in chapter 3, also illustrates how water
processing technologies, generally hidden and inaccessible by the public, can be placed in such a way
that everyone can access and learn from them. The Adam Joseph Lewis Center (Fig. 6.29) at Oberlin
Fig. 6.25. © Kate Joyce/Chicago 2011. James I. Swenson Civil Engineering Building, Duluth. Ross Barney Architects
Fig. 6.26. Photo: Andrea Schokker. James I. Swenson Civil Engineering Building, Duluth. Ross Barney Architects.
Fig. 6.27. Omega Center for Sustainable Living in Rhinebeck, New York. BNIM Architects. Photo by Andy Milford from Dahlonega, GA (OCSL Uploaded by Ekabhishek) [CC-BY-2.0], via Wikimedia Commons.

98
College in Ohio also has a living machine for processing wastewater that is accessible to building users.
Guided tours through these facilities, accompanied by professionals and experts, would help improve
tourists’ understandings of the efforts hotels committed to addressing challenging water-saving goals are
making in order to achieve them.
Involvement: Finally, guests need to understand how their own behaviour can impact the performance
of the water system. Besides showing them the problem and helping them to understand it, they should
be made capable of measuring the effects of their behaviour. Smart metering, which allows operators
to measure the amount of water consumed by each service on a daily basis, is generally not revealed
to building users. Real-time monitoring devices based on these metering strategies can help guests to
understand the importance of the fraction of water consumed by them and trigger a reaction aimed to
improve water conservation (Fig. 6.30).
6.3 Design Process Summary
This three-scale process shows that achieving a net-zero water goal is a continuous decision-making
process that involves multiple variables at every step. Selecting the site where a new resort is to be
opened and defining its specific program are two of the earliest stages of the operation, which involve not
only design teams but also other stakeholders. Also, most of the described strategies are much easier to
incorporate at new developments, as their integration into the architectural and landscape design should
be considered in the early stages of the design. Therefore, achieving a challenging water goal, such as
the net-zero water scenario, is much easier when this goal is incorporated at the very beginning of the
development process.
The multiple steps needed to shape the whole process involve professionals from disciplines which are
not always included in conventional design teams (Fig. 6.31). While architects and landscape architects
are generally the coordinators of the whole team for a development project, experts in other fields are
Fig. 6.29. Adam Joseph Lewis Center at Oberlin College in Ohio. Photograph courtesy of Barney Taxel, © Barney Taxel, Cleveland, Ohio.
Fig. 6.28. Omega Center Eco Machine in Rhinebeck, New York. BNIM Architects. Photograph by John Todd Ecological Design.
Fig. 6.30. Real-time water consumption monitoring device. Source:

99
Besides the complexity of design teams involved in challenging water goals, the participation of other
stakeholders is also crucial for their achievement. Owners and operators are a key piece of the puzzle.
Up until recently water has not generally been considered a critical factor when choosing the location and
the scale of tourism development operations (Pigram, 2001). Their commitment is thus fundamental for
selecting appropriate sites and defining realistic programs, according to the site’s water context limitations.
Also, their initial investment for all the required technologies and processes is necessary. Moreover, many
required at all three scales of the previously described process. Urban planners play a significant role at
the geographical scale, as their decisions may determine the availability of sites for new tourism facilities.
Biologists and geologists also play a fundamental role, especially in assessing the environmental impacts
associated with each water footprint component. Their expertise is further required for establishing the
capacity and optimizing the efficiency of all the natural processes incorporated for water treatment.
Similarly, the participation of sociologists might be necessary to deal with the possible negative social
impacts associated with the intensive use of a specific water source. Economists are also necessary for
the budget estimation, both at the program definition stage and at the device optimization step.
GEOGRAPHIC
WATER CONTEXT ANALYSIS
source identification
architects + landscape architects
engineers
urban planners
biologists
economists
geologists
demand estimation
efficiency
transparency
impact assessment
system analysis
limits
capacity
PROGRAM DEFINITION
DESIGN OPTIMIZATION
DESIGN TEAMS
DEVICESYSTEM
Fig. 6.31. Multidisciplinary process diagram. In order to achieve water ambitious goals, design teams need to incorporate professionals from many different fields. While traditional design team members, such as architects, landscape architects and engineers participate across the entire three-scale process, the responsibility of other professionals focuses on specific phases of design.

100
of the mentioned strategies, such as wastewater recycling or rainwater harvesting, especially for potable
use, require regulation modifications in many countries. These regulation changes involve governments
directly, so their participation in the achievement of the goal is also significant. Finally, since tourists are
responsible for a large fraction of the total water consumption, achieving the goal will never be possible if
they do not commit to water conservation.
All stakeholders, business owners and operators, tourists and regulatory agencies play a very significant
role in making tourism, and more specifically, water management, more sustainable (Fig. 6.32). While
business owners and operators are in the strongest position to lead the change (Williams & Ponsford,
2009), tourists, local communities, and regulatory agencies can also contribute significantly to a more
sustainable tourism practice. In order to foster the involvement of all stakeholders in more sustainable
tourism development, green designers should show them all the potential benefits for everyone concerned.
.
GEOGRAPHIC
WATER CONTEXT ANALYSIS
source identification
demand estimation
efficiency
transparency
impact assessment
system analysis
limits
capacity
PROGRAM DEFINITION
DESIGN OPTIMIZATION
DESIGN TEAMS
DEVELOPERS
GOVERNMENTS
USERS
DEVICESYSTEM
Fig. 6.32. Multi-stakeholder process diagram. In addition to the multi-disciplinary teams described above, additional stakeholders such as developers, governments and users are crucial for achieving ambitious water goals. This graphic explains the impact of each of these stakeholders on every scale of design.

101
7 CONCLUSIONS
7.1 Thesis Overview
This research brings to the table the need for a shift in the way water management is considered in the
design of tourism facilities in small island developing states. The high contrast between the scarce available
freshwater resources and the heavy demand for water of luxury beach resorts at these destinations makes
it necessary to use high-energy-demanding technologies such as desalination. In a context in which
most of the energy is produced by generators depending on imported fossil fuels, a freshwater supply
based on desalinated water leads us in the opposite direction of a more sustainable future in tourism
development. More challenging water-related goals, such as the net-zero water scenario included in the
Living Building Challenge, need to be embraced by resort owners and operators in small islands if they
are truly committed to sustainability. The water footprint methodology, understood within the Corporate
Water Accounting context, offers developers and designers the necessary framework to introduce such
ambitious goals. It is possible to achieve a scenario in which the impacts and risks associated with the
water footprint of beach resorts are minimized. However, it is required that conventional water strategies,
already widely applied in the context of green building, are taken to the next level. Beach resorts on
small islands should not rely on desalination procedures for providing the freshwater that they require for
operating. Instead, tourism facilities at remote destinations must obtain water from renewable sources

102
available on their sites, for instance, by means of harvesting rainwater. Moreover, the water demand of
these facilities needs to be reduced as much as possible by treating and recycling all the wastewater
they generate, and also by implementing conservation policies involving resort employees and users.
The proposed Water Footprint Design Tool allows design teams to implement and assess the potential
reduction to be achieved by all these strategies. Its application to the case-study in the Maldives shows
that high reductions to the desalinated water footprint of the assessed resort can be achieved. The results
from this case-study indicate that, given the rainfall conditions of the Maldives, a net-zero water scenario
could be achieved if implemented at early stages of the design. An exhaustive analysis of the water context
involving professionals from multiple disciplines and performed at the beginning of the design process
would allow designers to establish the freshwater availability limitations that should guide the program
definition process. Nevertheless, the commitment of all stakeholders participating in the conception of
a new tourism facility in such a context is necessary. Regulation changes from the government, strict
environmental policies from owners and operators, water-strategy optimization from design teams, and
serious involvement from employees and tourists are mandatory. All these components are equally crucial
in the incorporation of a new water model for remote tourism facilities that would contribute to a more
sustainable future of tourism development.
7.2 Overall Significance
The increased water scarcity problem that the world is expected to suffer in the following decades is
perfectly illustrated by the two extreme conditions of the context of this thesis: on the one hand, the lack
of access to renewable supply sources of small islands; on the other hand, the excessively high water
demand typical of luxury beach resorts.
This research underlines the importance of considering water at the outset of the design process of tourism
developments. A detailed analysis of the local water context at the very beginning of the conception of
a new resort is crucial for determining some of the design parameters that will assure the achievability
of an ambitious water-related goal. These parameters include the resort’s size, capacity, and program
or morphology, among others. Furthermore, since the cost of implementing water-related strategies
increases when they are applied to existing projects, their early implementation is desired in order to
increase their cost-efficiency and reduce payback periods.
The most common green building and sustainable tourism assessment tools (i.e. LEED, EarthCheck,
GreenGlobe), include different water-related benchmarks and objectives in their certification processes.
Water-use assessment is generally based on demand reduction goals, without considering the specific

103
conditions of local water contexts. Subsequently, at destinations like SIDS, with no access to conventional
water sources, these forms of assessment appear as insufficient. A revolution in the way water-use is
benchmarked in remote tourism developments is necessary for moving toward a more sustainable future.
This research pioneers the application of the Corporate Water Accounting framework, previously tested
in other business segments, to the tourism industry. This framework enables a better understanding of
the requirements for achieving a net-zero water scenario. The analysis of the local water context of every
single new project is necessary to determine the environmental and socio-economic impacts associated
with the development of new tourism facilities. This analysis is the basis for the achievement of the net-
zero water goal, as it determines the available water sources on which new developments can rely, in a
sustainable way, at a specific site.
Within Corporate Water Accounting, the water footprint methodology provides a framework in which more
ambitious goals, in accordance with the previously mentioned extreme conditions, can be incorporated.
This research applies for the first time the water footprint methodology, introduced in 2002, to a tourism
facility in a water-scarce region. While initially conceived as applicable to any person, community, product
or business, until today, this methodology had been mostly applied to agricultural products. Applying it
to the built environment, and specifically to tourism development in small islands, requires an adaptation
process. Such adaptation is presented in this thesis and includes the redefinition of the different water
footprint types (blue, green, grey) and the incorporation of new ones (rainwater, desalinated water) which
were not covered by the original definitions.
The results from the analysis of the local water context may indicate that zero-impact freshwater sources
are not achievable at some destinations. As a consequence, the net-zero water goal, understood as the
one in which the impacts of each water footprint type of tourism development are nullified, is not always
achievable. Therefore, it has become clear that it is not only design teams that need to take part into the
achievement of these goals, but also developers, urban planners and governments, as the selection of the
site at which development is to occur is fundamental. Sustainable tourism development is not only about
how facilities are built but also about where they are built and howthey are used by consumers.
7.3 Limitations
The strict criteria established for the selection of potential case-studies determined the decision of
applying the proposed framework and the Tool to only one beach resort located in the Maldives. The Tool,
as described in chapter 4, requires the introduction of a high-resolution water-demand pattern, whose

104
availability became the hardest criterion to meet during the case-study selection process. A number
of beach resorts located in various small island developing states were identified as potential case-
studies for having shown some sort of commitment to environmental sustainability. This commitment
was demonstrated by several means: third-party verification programs (e.g. Earthcheck, Green Globe),
detailed environmental policy descriptions available on their websites, and sustainability-related online
publications. On a first approach, while several resorts expressed their willingness to participate in the
study, only two declared themselves able to provide the requested data. The reasons given by the remaining
potential participants were various nonexistent sub-metered water-use records and confidentiality being
the most common ones. Their readiness to provide the required information was the final criterion for the
case-study selection.
Focusing on only one case-study did not offer a complete understanding of the demand patterns of beach
resorts in SIDS. However, a single case-study on an existing resort was sufficient for the purpose of this
research, the aim of which was to assess the achievability of a net-zero water scenario for new coastal
tourism developments in SIDS. The case-study in the Maldives allowed us to illustrate the problem of
water supply and demand in the context of this thesis and served as a perfect example upon which to
apply the research findings and the developed Tool. In terms of water supply, the analyzed resort is a good
representative of most of other resorts in the Maldives and at other SIDS destinations, as desalination is
frequently the only freshwater source at many of them and climatic conditions are similar. It is more difficult,
though, to determine how representative this resort is in terms of water demand since, as explained above,
no access to detailed consumption patterns from other resorts was available. Together with an increased
transparency from resort operators, a higher implementation of sub-metering and smart-metering devices
were found to be crucial for improving research opportunities in the future. However, the importance of
how representative the case-study is, in terms of water demand, is relative. The goal of this research
was to demonstrate that the achievement of the net-zero water goal is possible at destinations like the
Maldives, and the case-study demonstrates that very significant reductions could be achieved through the
implementation of several water strategies. One case-study is enough for this purpose. If a resort built in
1995 can achieve more than 75% desalinated water footprint reduction for the worst-case rainfall scenario,
new resorts ought to be capable of achieving the net-zero water goal at similar locations.

105
7.4 Future Research Opportunities
Enhancing the importance of water management in the context of sustainable tourism development opens
the door to numerous further research needs and opportunities:
DATA AVAILABILITY
One of these future research opportunities arises from the limited availability of water-use data from coastal
tourism facilities. Water-use at resorts and other tourism facilities needs to become more transparent. More
studies need to focus on specific tourism facilities in order to highlight the importance of a detailed water-
use assessment. Applying the proposed framework to new tourism projects depends on the availability of
reliable water-use ratios from similar facilities. There is therefore a need for resorts to make more demand
patterns available to researchers and designers through metered studies similar to the one in this thesis.
Water sub-metering needs to be detailed enough to provide an accurate understanding of water-use
distribution by service. This way, the accuracy of the estimations made during the design process of new
resorts and hotels would increase.
Similarly, detailed rainfall patterns are necessary to perform accurate simulations. These rainfall patterns
need to cover a minimum number of years, in order to include inter-annual precipitation variations. The
impact of climate change on these precipitation regimes must also be considered.
ADDITIONAL METHODS
This research applies for the first time the water footprint methodology and the Corporate Water
Accounting framework to coastal tourism facilities. Numerous research opportunities can be derived from
this application. First, further research into the impacts and risks associated with each water supply option
available at a site is needed. While this thesis focuses on the environmental impacts and assesses the
different sources through a quantitative analysis, a complete analysis should include other parameters
as well. On the one hand, more detailed studies on the socio-economic impacts on local communities of
water-use in tourism development would be useful. On the other hand, from a business owner perspective,
a local cost-analysis associated not only with each supply alternative but also with all the proposed water
strategies is necessary. Also, this research focuses on the direct waterfootprint of tourism facilities. However,
previous studies on different business segments have shown the importance of the consequences of their
indirect water footprints. Further analyses focusing on the water-use associated with the supply-chain of
tourism facilities would bring to light additional problems that need to be addressed and incorporated into
the sustainable tourism development framework.

106
CASE-STUDIES
Finally, the potential for reducing the water footprint of the built environment by applying innovative water
strategies, such as the ones described in chapter 3, also requires further insight. More case-studies on
projects that have applied advanced water-saving strategies, such as blackwater recycling or rainwater
harvesting for potable use, would provide a better understanding of how much water can be saved from
these strategies. Based on these case-studies, new projects would therefore be able to incorporate
reliable percentages of water footprint reduction through the implementation of these strategies in their
estimations.
Similarly, recent strategies focusing on the improvement of building users’ attitudes and behaviours with
regard to water conservation also need more research. Since the tourism industry directly consumes a
large fraction of the total water used at resorts (and by the general population in their vicinity), the user
has been identified as a key agent in the achievement of the goals proposed in this thesis. Further post-
occupancy studies evaluating the impact of the educational and transparency-related strategies in the
context of tourism would also allow us to better understand their potential for water demand reduction.
.

107
References
Aladenola, O. O., & Adeboye, O. B. (2009). Assessing the potential for rainwater harvesting. Water
Resources Management, 24(10), 2129–2137. doi:10.1007/s11269-009-9542-y
Anderson, K. (2009). Raising awareness through ecotourism architecture. (Master’s thesis). Retrieved from
http://rave.ohiolink.edu/etdc/view?acc_num=ucin1242753047
AquaRecycleTM (2012) Save energy by recycling laundry wastewater. Retrieved from http://www.
aquarecycle.com/laundry-water-energy-savings.php
AQUASTAT. (2012). FAO’s information system on water and agriculture. Maldives. Retrieved from http://
www.fao.org/nr/water/aquastat/countries_regions/maldives/index.stm
Barton, B. (2010). Murky waters? Corporate reporting on water risk. Ceres: Boston, MA, 9. Retrieved from
http://www.unglobalcompact.org/
Basinger, M., Montalto, F., & Lall, U. (2010). A rainwater harvesting system reliability model based on
nonparametric stochastic rainfall generator. Journal of Hydrology, 392(3–4), 105–118. doi:10.1016/j.
jhydrol.2010.07.039
Becken, S., Hay, J., & Espiner, S. (2011). The risk of climate change for tourism in the Maldives. In J.
Carlsen & R. Butler (Eds.), Island tourism: sustainable perspectives (pp. 72–84). Wallingford: CABI
Bergin-Seers, S., & Mair, J. (2009). Emerging green tourists in Australia: Their behaviours and attitudes.
Tourism and Hospitality Research, 9(2), 109–119. doi:10.1057/thr.2009.5
Bernstein, L., & Francois, L. E. (1973). Comparisons of drip, furrow, and sprinkler irrigation. Soil Science,
115(1), 73. Retrieved from http://journals.lww.com/
Beyer, D., Anda, M., Elber, B., Revell, G., & Spring, F. (2005). Best practice model for low-impact nature
based sustainable tourism facilities in remote areas. CRC for Sustainable Tourism.
Bidhendi, G., Nasrabadi, T., Vaghefi, H., Hoveidi, H., & Jafari, H. (2008). Role of water-saving devices in
reducing urban water consumption in the mega-city of Tehran, case study: a residential complex. Journal
of Environmental Health, 70(8), 44–47. Retrieved from http://europepmc.org/abstract/MED/18468223
Bolund, P., & Hunhammar, S. (1999). Ecosystem services in urban areas. Ecological Economics, 29(2),
293–301. doi:10.1016/S0921-8009(99)00013-0
Brown, Z., O’shea, M., Cole, R. J., & Robinson, J. (2008). Re-contextualizing the notion of comfort. Building
Research & Information, 36(4), 323–336. doi:10.1080/09613210802076328
Carbone, M. (2005). Sustainable tourism in developing countries: Poverty alleviation, participatory
planning and ethical issues. European Journal of Development Research, 17(3), 559–565.
doi:10.1080/09578810500209841

108
Ceballos-Lascurain, H. (1996). Tourism, ecotourism, and protected areas: the state of nature-based tourism
around the world and guidelines for its development. IUCN
Central City Concern. (2009). Achieving water independence in buildings. Retrieved from https://ilbi.org/
education/reports/oregon
Chapagain, A. K., & Hoekstra, A. Y. (2003). Virtual water trade: A quantification of virtual water flows
between nations in relation to international trade of livestock and livestock products. In Virtual water
trade. Proceedings of the international expert meeting on virtual water trade (pp. 12–13).
Chapagain, A. K., & Hoekstra, A. Y. (2008). The global component of freshwater demand and supply:
An assessment of virtual water flows between nations as a result of trade in agricultural and industrial
products. Water International, 33(1), 19–32. doi:10.1080/02508060801927812
Cheremisinoff, N. P. (2002). Handbook of water and wastewater treatment technologies. Butterworth-
Heinemann
Cole, R. J. (2010). Green buildings and their occupants: a measure of success. Building Research &
Information, 38(5), 589–592. doi:10.1080/09613218.2010.484168
Coombes, P. J., & Barry, M. E. (2007). The effect of selection of time steps and average assumptions on
the continuous simulation of rainwater harvesting strategies. Water Science and Technology, 55(4),
125–133. doi:10.2166/wst.2007.102
Dixon, A. M., Butler, D., & Fewkes, A. (1999). Guidelines for greywater re-use: Health issues. Water and
Environment Journal, 13(5), 322–326. doi:10.1111/j.1747-6593.1999.tb01056.x
Dodds, R., & Butler, R. (2010). Barriers to implementing sustainable tourism policy in mass tourism
destinations. Tourismos, 5(1), 35–53. Retrieved from http://www.cabdirect.org/abstracts/20103307909.
html
Dodds, R., & Kuehnel, J. (2010). CSR among Canadian mass tour operators: good awareness but little
action. International Journal of Contemporary Hospitality Management, 22(2), 221–244. doi:
10.1108/09596111011018205
Dolnicar, S., & Hurlimann, A. (2010). Australians’ water conservation behaviours and atttudies. Australian
Journal of Water Resources, 14(1), 43–53. Retrieved from http://ro.uow.edu.au/commpapers/718/
EarthCheck. (2010). Benchmarking assessment report. Accommodation, vacation hotel benchmarking.
Six Senses Soneva Fushi, Maldives.
EcoTek. Ecological Technologies Inc. (2012). Operating & maintenance manual. Centre for interactive
research on sustainability. Solar aquatics system TM. Draft.
ENERGY STAR. (2013a). Clothes washers. Retrieved from http://www.energystar.gov/index.
cfm?fuseaction=find_a_product.showProductGroup&pgw_code=CW

109
ENERGY STAR. (2013b). Dishwashers key product criteria. Retrieved from http://www.energystar.gov/
index.cfm?c=dishwash.pr_crit_dishwashers
Ersson, O. (2006, November 14). Rainwater harvesting: Choice of roofing materials.Retrieved from http://
www.rwh.in/healthissues.htm
Essex, S., Kent, M., & Newnham, R. (2004). Tourism development in Mallorca: Is water supply a constraint?
Journal of Sustainable Tourism, 12(1), 4–28. doi: 10.1080/09669580408667222
Farreny, R., Gabarrell, X., & Rieradevall, J. (2011). Cost-efficiency of rainwater harvesting strategies in
dense Mediterranean neighbourhoods. Resources, Conservation and Recycling, 55(7), 686–694.
doi:10.1016/j.resconrec.2011.01.008
Farreny, R., Morales-Pinzón, T., Guisasola, A., Tayà, C., Rieradevall, J., & Gabarrell, X. (2011). Roof
selection for rainwater harvesting: Quantity and quality assessments in Spain. Water Research, 45(10),
3245–3254. doi:10.1016/j.watres.2011.03.036
Fewkes, A. (2000). Modelling the performance of rainwater collection systems: towards a generalised
approach. Urban Water, 1(4), 323–333. doi:10.1016/S1462-0758(00)00026-1
Finley, S., Barrington, S., & Lyew, D. (2009). Reuse of domestic greywater for the irrigation of food crops.
Water, Air, and Soil Pollution, 199(1-4), 235–245. doi:10.1007/s11270-008-9874-x
Forsyth, T. (1997). Environmental responsibility and business regulation: The case of sustainable tourism.
The Geographical Journal, 163(3), 270–280. doi:10.2307/3059723
Friedler, E. (2004). Quality of individual domestic greywater streams and its implication for on-site treatment
and reuse possibilities. Environmental Technology, 25(9), 997–1008. doi:10.1080/09593330.2004.961
9393
Gallagher, N. T., & Sharvelle, S. (2009). Decentralized anaerobic treatment of blackwater: A sustainable
development technology concept for urban water management. Retrieved from http://link.aip.org/link/
ascecp/v342/i41036/p569/s1
GeoNames.org. (2012). Maldives - Largest cities. Retrieved from http://www.geonames.org/MV/largest-
cities-in-maldives.html
Gilg, A., & Barr, S. (2006). Behavioural attitudes towards water saving? Evidence from a study of
environmental actions. Ecological Economics, 57(3), 400–414. doi: 10.1016/j.ecolecon.2005.04.010
Gill, A., Williams, P., & Thompson, S. (2010). Perceived water conservation attitudes and behaviours
in second-home island settings. Tourism and Hospitality Research, 10(2), 141-151. doi: 10.1057/
thr.2009.35
Gössling, S. (2000). Sustainable tourism development in developing countries: Some aspects of energy
use. Journal of Sustainable Tourism, 8(5), 410–425. doi:10.1080/09669580008667376

110
Gössling, S. (2001). The consequences of tourism for sustainable water use on a tropical island: Zanzibar,
Tanzania. Journal of Environmental Management, 61(2), 179–191. doi: 10.1006/jema.2000.0403
Gössling, S., Peeters, P., Hall, C. M., Ceron, J. P., Dubois, G., Lehmann, L. V., Scott, D. (2012). Tourism and
water use: supply, demand, and security. An international review. Tourism Management, 33(1), 1–15.
doi:10.1016/j.tourman.2011.03.015
Gude, V. G., Nirmalakhandan, N., & Deng, S. (2010). Renewable and sustainable approaches for desalination.
Renewable and Sustainable Energy Reviews, 14(9), 2641–2654. doi:10.1016/j.rser.2010.06.008
Guo, Y., & Baetz, B. (2007). Sizing of rainwater storage units for green building applications. Journal of
Hydrologic Engineering, 12(2), 197–205. doi:10.1061/(ASCE)1084-0699(2007)12:2(197)
Haandel, A. C. van, & Lubbe, J. G. M. van der. (2012). Handbook of biological wastewater treatment. IWA
Pub.
Han, M., & Ki, J. (2010). Establishment of sustainable water supply system in small islands through rainwater
harvesting (RWH): case study of Guja-do. Water Science & Technology, 62(1), 148. doi:10.2166/
wst.2010.299
Handia, L., Tembo, J. M., & Mwiindwa, C. (2003). Potential of rainwater harvesting in urban Zambia. Physics
and Chemistry of the Earth, Parts A/B/C, 28(20-27), 893–896. doi:10.1016/j.pce.2003.08.016
Helmreich, B., & Horn, H. (2009). Opportunities in rainwater harvesting. Desalination, 248(1-3), 118–124.
doi:10.1016/j.desal.2008.05.046
Henley, J. (2008, November 11). The last days of paradise. The Guardian. Retrieved from http://www.
guardian.co.uk/environment/2008/nov/11/climatechange-endangered-habitats-maldives
Herrmann, T., & Schmida, U. (2000). Rainwater utilisation in Germany: Efficiency, dimensioning, hydraulic
and environmental aspects. Urban Water, 1(4), 307–316. doi:10.1016/S1462-0758(00)00024-8
Hoekstra, A. Y. (2008). Water neutral: Reducing and offsetting the impacts of water footprints. Retrieved
from http://doc.utwente.nl/77202/1/Report28-WaterNeutral.pdf
Hoekstra, A. Y., Chapagain, A. K., Aldaya, M. M., & Mekonnen, M. M. (2009). Water footprint manual: State
of the art 2009. Retrieved from http://doc.utwente.nl/77211/1/Hoekstra09WaterFootprintManual.pdf
Howard, P., Hes, D., & Owen, C. M. (2008). Exploring principles of regenerative tourism in a community driven
ecotourism development in the Torres Strait Islands. Retrieved from http://ecite.utas.edu.au/58107
Hyde, R. A., Prasad, D., Watt, M., Blair, J., Moore, R., Sallam, I., & Sattary, S. G. (2004). Green globe design
and construct (D&C) standard: A benchmarking study of sustainable tourism development. CRC for
Sustainable Tourism. Retrieved from http://espace.library.uq.edu.au/view/UQ:84424

111
Ibrahim, M. S. A., Bari, M. M. R., & Miles, L. (2002). Water resources management in Maldives with an
emphasis on desalination. Maldives water and sanitation authority, Male, Republic of Maldives. Retrieved
from http://www. pacificwater. org/
Imteaz, M. A., Shanableh, A., Rahman, A., & Ahsan, A. (2011). Optimisation of rainwater tank design from
large roofs: A case study in Melbourne, Australia. Resources, Conservation and Recycling, 55(11),
1022–1029. doi:10.1016/j.resconrec.2011.05.013
Inman, D., & Jeffrey, P. (2006). A review of residential water conservation tool performance and influences on
implementation effectiveness. Urban Water Journal, 3(3), 127–143. doi:10.1080/15730620600961288
InterContinental (2013). Bora Bora Resort & Thalasso Spa Environment. Retrieved from http://www.tahiti.
intercontinental.com/modlresort.aspx?idpage=102
International Code Consortium. (2012). ICC IPC (2012): International Plumbing Code. Retrieved from http://
archive.org/details/gov.law.icc.ipc.2012
International Living Future Institute. (2012). Living Building Challenge 2.1. A visionary path to a restorative
future. Retrieved from http://living-future.org/lbc
Ioannides, D., Apostolopoulos, Y., & Gayle, D. J. (2002). Tourism development in Mediterranean islands:
Opportunities and constraints. In Apostolopulos, G., & Gayle, D. J. (Eds.), Island tourism and sustainable
development: Caribbean, Pacific and Mediterranean experiencies (pp. 67–89). Greenwood Publishing
Group.
Jamrah, A., Al-futaisi, A., Prathapar, S., & Harrasi, A. A. (2008). Evaluating greywater reuse potential for
sustainable water resources management in Oman. Environmental Monitoring and Assessment, 137(1-
3), 315–27. doi:10.1007/s10661-007-9767-2
Jefferson, B., Laine, A., Parsons, S., Stephenson, T., & Judd, S. (2000). Technologies for domestic
wastewater recycling. Urban Water, 1(4), 285–292. doi:10.1016/S1462-0758(00)00030-3
Jones, M. P., & Hunt, W. F. (2010). Performance of rainwater harvesting systems in the southeastern United
States. Resources, Conservation and Recycling, 54(10), 623–629. doi:10.1016/j.resconrec.2009.11.002
Kahinda, J. M., Lillie, E. S. B., Taigbenu, A. E., Taute, M., & Boroto, R. J. (2008). Developing suitability maps
for rainwater harvesting in South Africa. Physics and Chemistry of the Earth, Parts A/B/C, 33(8–13),
788–799. doi:10.1016/j.pce.2008.06.047
Keeper, B. G., Hembree, R. D., & Schrack, F. C. (1985). Optimized matching of solar photovoltaic power
with reverse osmosis desalination. Desalination, 54, 89–103. Retrieved from http://www.sciencedirect.
com/science/article/pii/0011916485800084
Kelly, J., & Williams, P. (2007). Tourism destination water management strategies: An eco-efficiency
modelling approach. Leisure/Loisir, 31(2), 427–452. doi: 10.1080/14927713.2007.9651390

112
Kerr, S. (2005). What is small island sustainable development about? Ocean & Coastal Management, 48,
503–524. doi:10.1016/j.ocecoaman.2005.03.010
Kim, Y., Lee, K. S., Koh, D. C., Lee, D. H., Lee, S. G., Park, W. B., … Woo, N. C. (2003). Hydrogeochemical
and isotopic evidence of groundwater salinization in a coastal aquifer: a case study in Jeju volcanic
island, Korea. Journal of Hydrology, 270(3), 282–294. Retrieved from http://www.sciencedirect.com/
science/article/pii/S0022169402003074
King, B. E. M. (1997). Creating island resorts. Routledge.
Lansing, P., & De Vries, P. (2007). Sustainable tourism: Ethical alternative or marketing ploy? Journal of
Business Ethics, 72(1), 77–85. doi:10.1007/s10551-006-9157-7
Lazarova, V., Choo, K.-H., & Cornel, P. (2012). Water-energy interactions in water reuse. IWA Publishing.
Lee, W. H., & Moscardo, G. (2005). Understanding the impact of ecotourism resort experiences on tourists’
environmental attitudes and behavioural intentions. Journal of Sustainable Tourism, 13(6), 546–565.
doi: 10.1080/09669580508668581
Liaw, C. H., & Tsai, Y. L. (2004). Optimum storage volume of rooftop rain water harvesting systems for
domestic use. Journal Of The American Water Resources Association, 40(4), 901–912. doi: 10.1111/
j.1752-1688.2004.tb01054.x
Maldives Ministry of Tourism, Arts and Culture. (2011). Tourism yearbook 2011. Retrieved from www.
tourism.gov.mv/pubs/yearbook_2011.pdf
Mandal, D., Labhasetwar, P., Dhone, S., Dubey, A. S., Shinde, G., & Wate, S. (2011). Water conservation
due to greywater treatment and reuse in urban setting with specific context to developing countries.
Resources, Conservation and Recycling, 55(3), 356–361. doi:10.1016/j.resconrec.2010.11.001
Mayer, P. W., DeOreo, W. B., Towler, E., Martien, L., & Lewis, D. (2004). Tampa water department residential
water conservation study: The impacts of high efficiency plumbing fixture retrofits in single-family homes.
Tampa Water Department.
Mays, V. (2011, March 2). James I. Swenson Civil Engineering Building. Architect Magazine. Retrieved from
http://www.architectmagazine.com/
Miller, G. A. (2003). Consumerism in sustainable tourism: A survey of UK consumers. Journal of Sustainable
Tourism, 11(1), 17–39. doi:10.1080/09669580308667191
Mitchell, A. (2005). The hidden curriculum: An exploration into the potential of green buildings to silently
communicate a pro-environmental message (Master’s thesis). Retrieved from https:/circle.ubc.ca/
Mitchell, V. G. (2007). How important is the selection of computational analysis method to the accuracy
of rainwater tank behaviour modelling? Hydrological Processes, 21(21), 2850–2861. doi:10.1002/
hyp.6499

113
Mondéjar-Jiménez, J. A., Cordente-Rodríguez, M., Meseguer-Santamaría, M. L., & Gázquez-Abad,
J. C. (2010). Environmental behavior and water saving in Spanish housing. International Journal of
Environmental Research, 5(1), 1-10. Retrieved from http://www.ijer.ir/
Morrison, J., Schulte, P., & Schenck, R. (2010). Corporate water accounting. An analysis of methods and
tools for measuring water use and its impacts. United Nations Environment Programme, United Nations
Global Compact & Pacific Institute.
Mourad, K. A., Berndtsson, J. C., & Berndtsson, R. (2011). Potential fresh water saving using greywater
in toilet flushing in Syria. Journal of Environmental Management, 92(10), 2447–2453. doi:10.1016/j.
jenvman.2011.05.004
Mowforth, M., & Munt, I. (2008). Tourism and sustainability: Development, globalisation and new tourism in
the third world. Taylor & Francis.
Muthukumaran, S., Baskaran, K., & Sexton, N. (2011). Quantification of potable water savings by residential
water conservation and reuse. A case study. Resources, Conservation and Recycling, 55(11), 945–952.
doi:10.1016/j.resconrec.2011.04.013
Nassauer, S. (2010, February 4). Less housekeeping, more perks. The Wall Street Journal. Retrieved from
http://online.wsj.com/
Nelson, J. G., Butler, R., & Wall, G. (1993). Tourism and sustainable development: monitoring, planning,
managing (No. 37). University of Waterloo Department of Geography.
Nepal, S. K. (1997). Sustainable tourism, protected areas and livelihood needs of local communities in
developing countries. International Journal of Sustainable Development & World Ecology, 4(2), 123–
135. doi:10.1080/13504509709469948
NovaTec Consultants Inc. (2012, September 27). University of British Columbia. Centre for Interactive
Research on Sustainability. Rainwater treatment system. Operation and maintenance manual.
O’Neill & Siegelbaum. (2002). Hotel water conservation. A Seattle demonstration. Retrieved from www.
seattle.gov/
Ockman, J., & Lasansky, D. (2004). New politics of the spectacle:“Bilbao” and the global imagination. In
M. Lasansky & B. McLaren (Eds.), Architecture and Tourism: Perception, Performance, and Place (pp.
227–240). New York. Berg.
Oliveira Ilha, M. S. de, & Siqueira Campos, M. A. (2011). Determination of the storage volume in rainwater
harvesting building systems: Incorporation of economic variable. In M. Jha (Ed.), Water conservation
(pp. 67-88). InTech.
Omega Center for Sustainable Living (2013). The building. Retrieved from http://www.eomega.org/omega-
in-action/key-initiatives/omega-center-for-sustainable-living/the-building

114
Orr, D. W. (1993). Architecture as pedagogy. Conservation Biology, 7(2), 226–228. Retrieved from http://
www.jstor.org/stable/2386418
Owen, C. (2007). Regenerative tourism: a case study of the resort town Yulara. Open House International,
32(4), 42–53. Retrieved from http://ecite.utas.edu.au/51536
Palla, A., Gnecco, I., & Lanza, L. G. (2011). Non-dimensional design parameters and performance
assessment of rainwater harvesting systems. Journal of Hydrology, 401(1–2), 65–76. doi:10.1016/j.
jhydrol.2011.02.009
Palla, A., Gnecco, I., Lanza, L. G., & La Barbera, P. (2012). Performance analysis of domestic rainwater
harvesting systems under various European climate zones. Resources, Conservation and Recycling,
62(0), 71–80. doi:10.1016/j.resconrec.2012.02.006
Peace, A. (2005). Managing the myth of ecotourism: A Queensland case study. The Australian Journal of
Anthropology, 16(3), 321–334. doi:10.1111/j.1835-9310.2005.tb00314.x
Perera, O., Hirsch, S., & Fries, P. (2003). Switched on: renewable energy opportunities for the tourism
industry. United Nations Environment Programme.
Peters, E. J. (2006). Rainwater potential for domestic water supply in Grenada. Proceedings of the ICE -
Water Management, 159(3), 147–153. doi:10.1680/wama.2006.159.3.147
Peters, E. J. (2012). Drought monitoring for rooftop rainwater-harvesting systems. Proceedings of the ICE
- Water Management, 165(6), 301–312. doi:10.1680/wama.10.00059
Pigram, J. J. (2001). Water resources management in island environments: The challenge of tourism
development. Tourism (Zagreb), 49(3), 267–274. Retrieved from http://www.cabdirect.org/
abstracts/20013156413.html
Pinfold, J. V., Horan, N. J., Wirojanagud, W., & Mara, D. (1993). The bacteriological quality of rainjar water
in rural northeast Thailand. Water Research, 27(2), 297–302. Retrieved from http://www.sciencedirect.
com/science/article/pii/004313549390089Z
Roccaro, P., Falciglia, P. P., & Vagliasindi, F. G. A. (2011). Effectiveness of water saving devices and
educational programs in urban buildings. Water Science & Technology, 63(7), 1357. doi:10.2166/
wst.2011.190
Roebuck, R. M. (2007). A whole life costing approach for rainwater harvesting systems. Bradford University.
Sadhwani, J. J., & Veza, J. M. (2008). Desalination and energy consumption in Canary Islands.
Desalination, 221(1-3), 143–150. Retrieved from http://www.sciencedirect.com/science/article/pii/
S001191640700687X
Sarni, W. (2011). Corporate water strategies. Earthscan.

115
Saunders, A. (2011). Hotel water efficiency. Trial report. HFM Asset Management.
Sazakli, E., Alexopoulos, A., & Leotsinidis, M. (2007). Rainwater harvesting, quality assessment and utilization
in Kefalonia Island, Greece. Water Research, 41(9), 2039–2047. doi:10.1016/j.watres.2007.01.037
Schreier, H., & Pang, G. (2012). Virtual water and global food security: Implications for Canada. Retrieved
from http://wmc.landfood.ubc.ca/webapp/VWM/
Semiat, R. (2008). Energy issues in desalination processes. Environmental Science & Technology, 42(22),
8193-8201. doi:10.1021/es801330u
Shaffer, P., & Leggett, D. J. (2002). Buildings that save water. Rainwater and greywater use. Proceedings of
the ICE - Municipal Engineer, 151(3), 189–196. doi:10.1680/muen.2002.151.3.189
SIDSnet (2013), About SIDS: Small island developing states network. Retrieved from www.sidsnet.org/
Simmons, G., Hope, V., Lewis, G., Whitmore, J., & Gao, W. (2001). Contamination of potable roof-collected
rainwater in Auckland, New Zealand. Water Research, 35(6), 1518–1524. Retrieved from http://www.
sciencedirect.com/science/article/pii/S0043135400004206
Smith, R. A., Henderson, J. C., Chong, V., Tay, C., & Jingwen, Y. (2011). The development and management
of beach resorts: Boracay Island, The Philippines. Asia Pacific Journal of Tourism Research, 16, 229–
245. doi:10.1080/10941665.2011.556343
Stone, R. (1996). Water efficiency program for Perth. Desalination, 106(1–3), 377–390. doi:10.1016/S0011-
9164(96)00133-6
Su, M.-D., Lin, C.-H., Chang, L.-F., Kang, J.-L., & Lin, M.-C. (2009). A probabilistic approach to rainwater
harvesting systems design and evaluation. Resources, Conservation and Recycling, 53(7), 393–399.
doi:10.1016/j.resconrec.2009.03.005
Thomas, W. (2012). Net-zero water project. Retrieved October 29, 2012, from http://netzerowater.com/
Tourtellot, J. B. (2007). 111 islands. National Geographic Traveler, 109. Retrieved from www.
nationalgeographic.com
UNEP & ICLEI. (2003). Tourism and Local Agenda 21: The Role of Local Authorities in Sustainable Tourism.
Paris. UNEP.
United Nations Department of Economic and Social Affairs. (2010). Trends in Sustainable Development.
Small Island Developing States.
United States Environmental Protection Agency (2013a). Landscape design tips. WaterSense. Retrieved
from http://www.epa.gov/watersense/outdoor/landscaping_tips.html
United States Environmental Protection Agency (2013b). Tips for Watering Wisely. Retrieved from http://
www.epa.gov/watersense/outdoor/watering_tips.html

116
United States Environmental Protection Agency (2013c). Water-Saving Technologies. Retrieved from http://
www.epa.gov/watersense/outdoor/tech.html
University of British Columbia. (2013). Centre for interactive research on sustainability. Retrieved from
http://cirs.ubc.ca/
UNWTO. (2004). Pro-poor tourism info sheets. Sheet No.6. Economic data on international tourism’s
contribution to developing countries’ economies.
UNWTO. (2011). Tourism highlights 2011 edition. Madrid. World Tourism Organization.
UNWTO. (2012a). Definition. Sustainable development of tourism. Retrieved from http://sdt.unwto.org/
UNWTO. (2012b). Tourism 2020 Vision. Retrieved from http://www.unwto.org/facts/eng/vision.htm
US Department of State. (2012). Maldives. Retrieved from http://www.state.gov/p/sca/ci/mv/
USGBC. (2003). LEED reference guide for new construction & major renovations (LEED-NC), Version 2.1.
US Green Building Council.
USGBC. (2009). LEED reference guide for building design and construction. 2009 Edition. US Green
Building Council.
USGBC (2010). Practical strategies in green building. Hotels. US Green Building Council.
Ward, S., Memon, F. A., & Butler, D. (2010). Rainwater harvesting: model-based design evaluation. Water
Science and Technology, 61(1), 85–96. doi:10.2166/wst.2010.783
Wichelns, D., & Nakao, M. (2007). Economic analysis of environmental issues regarding seawater
desalination. Water International, 32(2), 230–243. doi:10.1080/02508060708692203
Williams, P. W., Gill, A. M., Marcoux, J., & Xu, N. (2012). Nurturing “social license to operate” through
corporate–civil society relationships in tourism destinations. In Cathy H.C. Hsu & William C. Gartner
(Eds.), The Routledge Handbook of Tourism Research (p.196-). New York. Routledge.
Williams, P. W., & Ponsford, I. F. (2009). Confronting tourism’s environmental paradox: Transitioning for
sustainable tourism. Futures, 41(6), 396–404. doi:10.1016/j.futures.2008.11.019
World Travel and Tourism Council (WTTC). (2012). World Economic Impact Report. Retrieved from www.
wttc.org
Yang, M., Hens, L., De Wulf, R., & Ou, X. (2011). Measuring tourist’s water footprint in a mountain
destination of Northwest Yunnan, China. Journal of Mountain Science, 8(5), 682–693. doi:10.1007/
s11629-011-2062-2
Zhang, D., Gersberg, R. M., Wilhelm, C., & Voigt, M. (2009). Decentralized water management: rainwater
harvesting and greywater reuse in an urban area of Beijing, China. Urban Water Journal, 6(5), 375–385.
doi:10.1080/15730620902934827

117
Appendix A: Precipitation data for Malé, Maldives
Year-Month Day 01 Day 02 Day 03 Day 04 Day 05 Day 06 Day 07 Day 08 Day 09 Day 10 Day 11 Day 12 Day 13 Day 14 Day 15 Day 16 Day 17 Day 18 Day 19 Day 20 Day 21 Day 22 Day 23 Day 24 Day 25 Day 26 Day 27 Day 28 Day 29 Day 30 Day 31 TOTAL Year-Month 0 days2001-012001-022001-032001-042001-052001-062001-072001-082001-092001-102001-112001-122002-012002-022002-032002-042002-052002-062002-072002-082002-092002-102002-112002-122003-012003-022003-032003-042003-052003-062003-072003-082003-092003-102003-112003-122004-012004-022004-032004-042004-052004-062004-072004-082004-092004-102004-112004-122005-012005-022005-032005-042005-052005-062005-072005-082005-092005-102005-112005-122006-012006-022006-032006-042006-052006-062006-072006-082006-092006-102006-112006-122007-012007-022007-032007-042007-052007-062007-072007-082007-092007-102007-112007-122008-012008-022008-032008-042008-052008-062008-072008-082008-092008-102008-112008-122009-012009-022009-032009-042009-052009-062009-072009-082009-092009-102009-112009-122010-012010-022010-032010-042010-052010-062010-072010-082010-092010-102010-112010-12
0.0 0.0 0.0 0.0 0.0 0.0 0.0 0.0 1.8 1.5 0.0 0.0 0.9 0.0 0.0 0.0 0.0 0.0 0.0 0.0 0.0 0.0 0.0 1.0 7.2 85.0 11.0 1.0 6.6 23.5 0.5 140.0 2001-01 200.5 0.0 0.6 13.7 0.0 0.1 0.0 0.0 0.0 0.0 0.0 0.0 0.0 0.0 0.0 0.0 0.0 0.0 16.5 0.0 0.0 0.0 0.0 0.0 0.0 0.0 0.0 0.0 31.4 2001-02 230.0 12.8 0.0 0.0 0.0 0.0 0.0 0.0 0.0 0.0 0.0 0.0 0.0 0.0 0.6 0.0 0.0 0.0 0.0 0.0 0.0 0.0 0.0 0.0 0.0 0.0 0.0 0.0 0.0 0.0 0.0 13.4 2001-03 290.0 0.0 0.0 0.0 0.0 7.4 0.6 0.0 10.8 0.4 48.2 3.1 40.1 0.0 0.3 0.0 0.0 1.5 3.2 3.2 38.7 18.2 2.5 7.2 0.0 1.8 7.2 6.8 3.2 10.6 215.0 2001-04 10
35.7 0.1 3.3 0.4 0.0 0.2 0.0 7.2 10.0 1.4 0.0 0.0 0.0 0.0 0.1 8.7 0.4 26.0 2.2 0.9 0.0 0.0 1.0 0.0 1.8 0.0 0.0 14.6 5.1 14.7 0.0 133.8 2001-05 120.0 4.6 0.2 0.0 0.3 1.8 4.4 3.5 5.9 16.7 7.5 3.8 0.0 0.0 0.0 0.0 0.0 0.0 0.0 0.0 0.0 0.0 15.2 2.9 3.8 0.0 0.4 0.4 0.5 3.5 75.4 2001-06 13
16.9 0.0 29.0 10.5 0.9 0.0 0.0 0.0 40.6 7.5 0.0 0.0 2.0 0.0 0.0 0.0 0.0 0.0 22.7 25.7 6.7 0.0 3.7 1.1 2.8 8.7 3.2 17.6 0.0 0.0 0.2 199.8 2001-07 1412.5 1.5 4.9 0.0 0.0 0.0 0.0 2.0 7.9 1.4 0.0 1.8 0.0 0.0 0.0 0.0 0.0 0.0 3.7 0.0 0.0 0.0 13.6 6.9 15.6 0.0 6.0 0.0 0.0 0.0 6.2 84.0 2001-08 1817.9 11.1 5.8 1.4 6.4 10.5 27.0 0.2 6.9 5.1 0.0 6.8 20.5 4.3 14.3 0.0 0.0 1.2 0.3 0.0 1.9 5.9 6.5 24.5 45.3 4.9 5.4 42.5 0.7 0.0 277.3 2001-09 50.0 3.2 13.9 15.1 0.0 0.0 8.9 0.1 4.0 110.2 0.1 0.2 2.7 0.2 0.0 0.0 0.4 0.0 0.0 0.0 0.0 3.9 7.1 11.1 21.3 15.3 20.0 0.5 0.0 0.0 0.2 238.4 2001-10 110.0 0.0 0.0 0.0 0.0 0.0 1.1 0.1 8.3 17.9 0.0 0.0 0.0 0.0 0.0 0.0 8.4 0.0 0.0 0.0 11.7 5.5 9.5 1.7 2.5 0.7 11.0 0.2 0.0 0.0 78.6 2001-11 total year 170.0 17.4 5.3 5.9 2.0 1.4 24.6 26.5 0.0 0.0 0.0 0.2 0.0 0.0 0.0 0.0 1.4 4.4 48.3 0.6 5.1 0.9 0.0 3.1 18.0 0.0 17.8 0.7 56.3 0.0 0.5 240.4 2001-12 1727.5 112.3 0.0 0.0 0.0 0.4 0.4 20.6 0.0 0.0 0.0 11.4 0.0 0.0 0.0 0.0 0.0 0.0 0.0 0.0 0.0 0.0 0.0 0.0 0.0 0.0 0.0 0.0 0.0 0.0 0.5 1.0 36.6 2002-01 240.0 0.0 0.0 1.6 0.0 0.0 14.7 13.2 0.0 33.7 11.3 0.5 0.0 2.7 82.2 0.0 0.0 0.0 0.0 0.0 8.2 0.0 0.0 0.0 0.0 0.0 6.3 0.3 174.7 2002-02 177.7 0.1 0.0 0.0 0.0 0.0 0.0 16.3 4.5 0.0 0.0 0.0 0.0 0.0 2.6 0.0 0.0 0.0 0.0 0.0 31.8 0.0 0.0 0.0 0.0 0.0 0.3 0.0 0.0 0.0 30.7 94.0 2002-03 232.0 0.0 0.0 0.1 32.3 0.0 0.0 1.4 0.0 0.0 0.0 9.2 5.5 0.0 0.0 13.7 0.0 16.9 3.8 8.1 0.0 16.7 0.1 4.8 5.2 0.0 4.8 0.0 0.0 5.4 130.0 2002-04 140.2 58.0 19.1 5.7 3.7 14.2 0.2 3.8 0.0 0.0 0.0 0.0 0.0 0.1 10.6 0.1 6.4 0.0 0.0 0.0 0.0 0.0 3.3 38.9 4.6 0.0 0.4 0.0 4.5 4.5 12.2 190.5 2002-05 122.0 29.2 4.6 0.2 42.4 19.3 0.0 0.7 0.2 0.7 34.0 5.9 1.6 2.6 0.0 0.0 0.0 0.0 0.0 0.0 0.0 15.2 17.1 0.0 0.0 0.0 0.0 0.0 0.1 0.4 176.2 2002-06 130.7 0.0 0.0 0.0 6.0 8.2 49.4 2.0 0.0 0.0 2.2 1.3 2.3 0.3 0.0 0.0 0.0 0.0 1.1 0.0 0.0 0.0 0.0 0.0 0.0 0.0 0.4 2.3 2.0 59.3 64.8 202.3 2002-07 16
20.7 1.6 0.8 4.6 10.1 10.1 1.5 0.0 0.0 9.9 0.4 0.0 0.0 0.0 0.0 0.0 0.0 0.0 0.7 33.3 132.7 22.8 6.5 0.0 0.0 0.0 0.0 0.0 0.0 0.0 0.0 255.7 2002-08 170.0 0.0 0.0 0.0 6.5 2.0 0.0 0.0 0.0 0.0 0.0 8.9 0.0 0.0 0.0 0.0 0.0 0.0 2.1 7.8 19.8 8.1 31.9 9.9 10.1 0.0 6.2 2.0 6.4 8.7 130.4 2002-09 160.8 5.6 5.9 44.2 6.8 20.3 17.4 14.5 8.9 1.0 1.1 0.0 0.3 0.8 7.4 0.9 0.0 0.0 0.0 0.0 0.0 5.1 0.0 2.1 0.3 0.9 4.0 5.1 5.6 0.0 17.1 176.1 2002-10 82.1 14.7 0.0 0.0 0.0 0.0 2.0 21.0 25.6 13.0 4.2 2.4 15.8 0.0 0.0 7.9 3.7 9.4 13.6 0.0 0.0 0.0 2.3 0.0 10.6 14.0 0.2 0.7 0.0 0.0 163.2 2002-11 total year 120.1 0.0 0.0 31.8 10.8 3.3 22.0 0.6 65.3 2.3 4.6 3.3 54.0 0.3 55.3 42.0 62.1 1.7 30.3 20.8 0.0 0.0 0.2 0.0 0.0 0.0 0.0 0.0 0.0 0.0 0.0 410.8 2002-12 2140.5 120.0 0.0 0.0 0.0 0.0 25.3 0.1 3.4 0.1 0.0 0.3 0.5 0.0 0.0 0.0 0.0 0.0 0.0 8.8 1.1 6.4 59.8 78.3 0.0 0.0 0.0 0.0 0.0 0.0 0.0 0.0 184.1 2003-01 200.0 0.0 0.0 0.0 0.0 6.5 0.1 0.0 0.0 0.0 1.4 85.6 0.0 0.0 0.0 0.0 0.0 0.0 0.0 0.0 0.0 0.0 0.0 0.0 0.0 0.0 0.0 0.0 93.6 2003-02 240.0 0.0 0.0 0.0 0.0 0.0 0.0 0.0 0.0 2.0 0.0 0.0 0.0 0.0 0.0 0.9 0.1 29.4 10.9 0.0 0.0 3.8 0.0 7.9 0.0 0.0 0.0 0.0 0.0 0.0 0.0 55.0 2003-03 240.0 0.0 0.0 0.0 0.0 7.7 0.0 0.0 0.0 1.2 0.0 0.1 0.0 10.0 0.1 0.0 37.1 1.0 0.0 0.0 0.2 4.0 2.2 0.1 26.6 16.1 41.4 1.6 6.8 4.0 160.2 2003-04 133.7 4.2 0.0 0.2 0.0 20.7 0.0 2.6 0.0 36.9 0.0 0.0 0.0 0.0 0.0 0.0 3.4 32.3 0.0 0.0 2.8 0.7 0.4 5.2 7.9 3.4 0.0 0.0 0.0 0.0 0.0 124.4 2003-05 170.0 13.2 66.5 6.1 15.9 1.2 1.4 0.1 1.2 8.4 0.6 1.3 9.7 0.0 0.0 0.0 28.5 0.0 3.9 0.0 4.2 3.2 13.7 0.0 1.9 1.4 34.0 0.4 0.2 7.2 224.2 2003-06 70.0 0.0 0.0 27.6 76.6 0.0 0.0 0.0 0.0 0.0 19.5 6.5 0.0 0.0 32.1 3.6 22.1 8.8 0.0 0.0 34.0 12.0 7.1 16.9 0.3 0.0 0.6 1.1 1.6 128.1 0.0 398.5 2003-07 140.0 0.8 0.2 116.7 13.1 0.0 2.2 0.1 0.6 0.5 0.0 0.0 0.0 0.0 0.0 0.0 0.0 0.0 0.0 1.0 0.0 1.4 0.0 6.3 0.0 1.0 0.0 0.0 0.0 0.0 0.0 143.9 2003-08 19
12.1 17.2 15.1 0.0 0.0 0.0 0.0 0.0 0.0 9.1 0.0 5.4 0.0 4.0 37.7 5.5 0.0 8.7 22.0 4.4 4.8 0.0 0.0 5.3 2.8 58.4 2.6 108.6 43.3 31.6 398.6 2003-09 119.2 0.0 0.6 1.3 0.0 0.0 1.5 0.0 0.0 0.4 0.0 4.5 0.0 0.0 0.0 0.0 0.0 0.0 0.0 0.0 0.0 0.0 0.5 0.0 2.6 0.6 0.0 0.0 0.0 14.4 26.8 62.4 2003-10 20
66.7 0.0 22.1 8.6 34.5 1.8 29.3 41.5 56.7 8.6 48.4 0.0 0.3 31.0 99.1 5.0 0.3 0.0 18.2 0.0 0.0 0.0 49.6 0.2 22.4 9.4 9.2 0.0 0.0 0.0 562.9 2003-11 total year 90.2 3.5 0.5 0.0 18.7 0.0 1.9 6.5 0.0 0.0 0.0 33.6 0.0 0.0 0.0 0.0 0.0 0.0 0.0 0.0 0.0 0.0 0.0 0.0 0.0 0.0 0.4 0.0 0.3 0.0 0.0 65.6 2003-12 2473.4 220.0 0.0 0.0 0.0 0.0 0.0 0.0 0.0 0.0 1.6 0.0 0.0 0.0 0.0 0.0 0.0 0.0 0.0 0.0 0.0 1.1 0.0 0.0 0.0 0.0 0.0 0.0 0.0 0.0 0.0 0.0 2.7 2004-01 290.0 0.0 0.0 0.0 0.0 0.0 1.4 0.4 0.0 0.0 0.9 0.0 22.6 0.0 0.0 0.0 0.0 0.0 0.0 0.0 0.0 0.0 6.8 17.3 0.0 0.0 0.0 0.0 0.0 49.4 2004-02 230.0 0.0 0.0 0.0 0.0 0.0 0.0 0.0 0.0 0.0 0.0 0.0 0.0 0.0 0.0 0.0 3.8 0.0 0.0 0.0 0.0 0.0 0.0 0.0 0.7 0.0 0.0 0.0 0.0 0.0 0.0 4.5 2004-03 290.0 22.8 0.0 0.0 7.8 0.0 46.9 0.0 0.0 0.0 0.0 75.2 0.0 0.0 0.0 0.0 0.0 2.6 7.0 0.2 10.2 0.0 0.0 0.0 1.8 0.0 0.0 0.0 0.5 0.0 175.0 2004-04 200.0 0.0 54.4 6.6 5.1 19.8 3.9 4.6 3.3 0.0 0.0 0.0 0.0 10.5 0.0 0.0 0.0 0.0 0.0 0.2 0.0 0.0 0.6 1.1 0.7 1.5 0.2 0.0 0.0 0.0 0.2 112.7 2004-05 160.4 1.2 2.6 3.0 1.4 0.0 0.0 13.4 0.3 0.0 0.0 0.0 0.3 0.0 0.0 0.0 0.0 5.6 6.1 0.0 0.0 0.0 0.0 0.5 0.3 0.8 5.3 0.2 0.2 24.9 66.5 2004-06 13
17.5 19.0 11.2 24.7 6.1 15.1 1.9 0.0 0.5 0.0 0.0 0.0 0.0 0.0 0.0 0.0 43.0 41.2 6.8 0.2 3.4 0.2 7.9 0.0 0.0 23.3 10.5 8.4 7.8 0.0 0.0 248.7 2004-07 120.0 0.0 0.0 12.1 15.0 0.1 0.0 0.0 0.0 0.0 0.0 0.0 0.2 8.3 11.1 1.1 0.2 0.0 20.7 13.3 0.0 0.0 0.4 0.0 13.2 27.1 21.5 1.9 5.3 5.8 2.3 159.6 2004-08 130.0 0.0 0.0 0.0 0.0 6.9 5.8 4.8 3.0 1.1 0.0 20.9 0.4 0.0 9.0 28.2 6.3 2.9 14.2 2.4 60.1 21.5 0.6 49.2 13.3 32.2 0.6 0.0 0.0 0.0 283.4 2004-09 100.0 0.0 0.0 7.3 3.0 1.5 27.2 0.0 20.0 0.0 0.2 0.0 36.3 14.6 0.0 6.1 0.0 0.0 0.0 1.9 0.0 0.0 36.8 3.8 0.0 9.3 50.0 18.1 7.0 23.0 95.1 361.2 2004-10 13
23.6 0.0 0.0 0.0 0.0 2.0 3.6 1.2 4.6 1.4 9.5 0.0 18.5 45.6 2.8 1.3 5.9 0.0 0.0 0.0 20.4 2.6 7.0 10.7 23.9 26.6 3.2 50.4 36.0 0.0 300.8 2004-11 total year 90.0 0.0 0.3 0.0 1.3 0.0 18.5 0.0 1.0 0.0 5.7 5.1 0.0 0.3 97.4 6.3 0.0 0.0 0.0 4.1 0.0 0.0 0.0 0.0 2.2 0.0 26.5 7.2 0.0 0.3 72.8 249.0 2004-12 2013.5 160.0 0.3 0.0 0.0 0.0 0.0 0.0 0.0 0.0 0.0 0.0 0.0 0.0 0.0 0.0 0.0 0.0 0.0 0.0 0.0 5.5 0.0 0.0 2.3 0.0 4.1 4.5 0.0 0.0 0.0 0.0 16.7 2005-01 260.0 0.0 0.0 0.0 0.0 0.0 0.0 0.0 0.0 0.0 0.0 0.0 0.0 0.0 0.0 0.0 0.0 0.0 0.0 0.0 0.0 0.0 0.0 0.0 0.0 0.0 0.0 0.0 0 2005-02 280.0 0.0 0.0 0.0 0.0 0.0 1.6 6.9 61.3 3.2 0.0 0.0 0.0 0.0 0.0 0.0 0.0 0.0 0.0 0.0 0.0 0.0 0.0 0.0 0.0 0.0 0.0 0.0 0.0 0.0 0.0 73.0 2005-03 270.0 0.0 0.0 1.0 0.0 0.0 0.0 0.0 0.0 0.0 0.0 0.0 0.0 0.0 0.0 0.0 0.0 0.0 9.6 2.5 2.6 0.0 0.0 0.0 0.0 0.0 0.0 0.0 0.0 0.0 15.7 2005-04 260.0 0.0 0.0 0.6 2.5 15.8 0.0 1.0 0.0 0.0 1.1 0.0 1.0 15.0 14.0 0.0 0.0 0.0 0.5 0.0 0.0 0.0 0.0 18.1 0.0 5.3 1.9 17.5 32.3 29.3 3.3 159.2 2005-05 155.3 0.0 2.7 42.8 23.3 5.2 0.0 0.0 0.0 0.0 0.0 7.0 0.2 12.8 25.5 16.9 1.4 0.5 0.0 0.5 0.0 13.5 2.2 0.0 0.0 0.0 0.0 0.8 0.0 0.0 160.6 2005-06 140.0 0.0 0.0 0.0 0.0 9.1 0.2 7.9 14.1 5.2 3.3 1.2 29.2 36.1 6.0 0.0 0.0 0.0 0.0 0.0 0.0 0.0 0.0 0.0 0.0 0.0 0.2 11.2 4.6 20.5 9.2 158.0 2005-07 160.0 0.0 0.0 0.0 0.0 0.0 0.3 0.0 0.0 0.0 0.0 0.0 1.1 0.0 1.2 0.0 2.2 0.0 0.0 0.0 0.0 0.0 0.0 0.0 22.4 21.1 16.4 52.1 12.0 0.5 0.9 130.2 2005-08 20
64.8 1.7 4.8 15.3 1.2 0.0 1.3 0.8 4.8 31.3 50.3 0.0 0.0 0.0 0.0 0.0 0.0 0.0 0.5 4.7 2.8 0.0 52.7 17.4 0.5 0.0 0.0 10.0 20.7 0.0 285.6 2005-09 120.4 0.0 19.9 24.7 6.7 0.0 0.0 0.0 35.2 17.0 0.6 4.7 6.0 0.2 0.8 46.2 1.2 170.0 12.5 15.8 1.1 2.3 0.0 6.7 2.6 0.4 1.9 10.9 0.0 0.0 0.3 388.1 2005-10 77.0 7.8 0.0 0.0 0.0 0.0 0.0 47.9 6.6 44.9 0.0 0.0 0.1 0.0 9.8 0.0 4.2 8.9 0.0 0.0 0.0 0.5 2.7 0.0 0.0 0.0 0.0 5.2 0.4 3.2 149.2 2005-11 total year 16
12.0 3.2 0.0 3.6 0.0 0.0 0.0 0.0 0.0 10.0 3.8 19.2 39.7 0.8 14.2 1.4 0.7 0.0 0.0 0.0 0.0 0.0 0.0 0.0 0.0 1.1 0.0 0.0 0.0 2.3 0.9 112.9 2005-12 1649.2 170.0 0.0 0.0 0.0 0.0 0.0 0.0 2.8 0.0 0.0 0.0 5.5 30.3 0.0 0.0 4.2 2.5 0.0 0.0 0.0 0.0 0.0 0.0 0.0 0.0 0.0 0.0 1.2 101.1 0.0 0.0 147.6 2006-01 240.0 0.0 0.0 0.0 0.0 0.0 0.0 0.0 0.0 0.0 0.0 0.0 0.0 0.0 0.0 0.0 0.0 0.0 0.0 0.0 0.0 0.0 0.0 0.0 0.0 0.0 0.0 0.0 0 2006-02 280.0 0.0 0.0 0.0 0.0 0.0 0.0 0.2 2.5 7.5 2.0 0.0 1.4 0.0 2.7 28.1 6.2 0.0 0.0 0.0 0.0 0.0 0.0 0.0 0.0 0.0 0.9 0.0 0.0 0.0 0.0 51.5 2006-03 220.0 0.0 12.0 32.8 0.0 0.0 0.0 0.0 0.0 3.3 29.3 0.0 0.0 0.0 0.0 37.9 35.8 0.0 0.0 0.0 0.2 23.8 0.0 0.0 0.1 0.0 0.0 0.0 0.0 0.0 175.2 2006-04 210.0 0.0 0.7 0.0 0.0 9.9 0.0 1.2 5.2 0.0 0.0 0.0 0.0 4.8 0.0 0.9 25.5 0.2 0.0 29.6 2.7 1.4 2.5 0.7 0.8 0.0 0.0 0.0 1.3 0.0 0.0 87.4 2006-05 160.0 0.0 0.0 0.0 0.0 0.0 0.0 1.1 0.3 0.0 0.0 16.2 5.0 0.0 1.8 28.7 0.0 12.9 36.7 3.3 38.1 23.3 2.0 0.0 0.0 0.0 0.9 5.1 1.5 0.0 176.9 2006-06 153.7 14.7 49.6 2.6 36.3 0.0 0.0 0.0 0.2 0.0 0.0 0.0 1.5 0.0 41.8 16.3 0.0 5.6 0.0 0.0 15.8 1.7 2.7 0.0 0.0 0.0 0.0 0.0 0.0 0.0 0.0 192.5 2006-07 180.0 0.0 0.0 0.0 0.0 0.0 0.0 0.0 0.0 0.5 11.8 24.9 50.2 20.0 15.8 0.0 14.9 26.7 0.0 14.5 8.8 31.8 8.8 3.1 0.0 0.0 0.0 70.5 0.0 17.6 6.4 326.3 2006-08 150.0 0.2 16.4 113.6 30.2 9.4 15.8 41.7 75.3 33.1 6.3 0.0 0.0 0.0 0.6 0.0 0.0 0.0 0.0 0.0 0.0 0.0 7.8 10.7 0.0 8.9 37.4 9.6 15.0 0.0 432.0 2006-09 130.3 0.0 0.0 0.0 0.0 0.0 0.0 0.0 0.0 0.0 0.0 0.0 0.0 0.0 0.0 11.7 0.0 0.0 0.0 11.2 0.0 1.5 20.0 60.1 4.2 0.0 23.6 31.6 0.6 0.0 4.6 169.4 2006-10 200.7 1.1 6.8 0.2 0.1 9.8 43.9 27.1 0.0 0.0 1.1 6.8 14.5 35.0 31.7 5.4 113.2 1.3 0.0 24.5 2.7 15.8 1.0 0.0 25.9 36.6 32.5 0.5 126.4 4.3 568.9 2006-11 total year 4
52.3 5.2 0.0 48.3 1.4 43.0 11.7 3.6 0.0 0.0 0.0 0.3 7.0 0.0 0.0 25.8 63.5 2.8 1.2 0.0 28.6 24.1 2.7 50.9 0.0 0.0 4.7 4.1 2.3 0.0 0.0 383.5 2006-12 2711.2 110.0 0.0 0.0 0.0 0.0 0.0 0.0 0.0 3.5 4.7 0.0 9.4 0.0 0.0 1.2 0.0 0.0 0.0 0.0 0.0 0.0 0.0 0.0 0.0 0.0 0.0 0.0 0.0 0.0 0.0 0.1 18.9 2007-01 260.0 0.0 0.0 0.0 0.0 0.0 0.0 0.0 0.0 0.2 0.0 0.0 0.0 0.0 0.0 0.0 0.0 0.0 0.0 0.0 0.0 0.0 0.0 0.0 0.0 0.0 0.0 0.0 0.2 2007-02 270.0 0.0 0.0 0.0 0.0 0.0 0.0 0.0 0.0 0.0 0.0 0.0 0.0 2.5 12.1 0.0 0.0 7.4 0.0 0.0 0.0 0.0 0.0 0.0 0.0 0.0 0.0 0.0 0.0 0.0 0.0 22.0 2007-03 282.9 0.0 0.0 0.0 27.9 18.1 9.8 0.0 0.0 0.0 0.0 2.2 0.0 0.0 2.1 0.3 0.0 0.0 0.0 0.0 41.5 4.4 0.0 0.0 8.9 13.4 13.2 7.4 47.2 0.0 199.3 2007-04 160.0 0.0 0.0 14.8 0.0 6.1 0.0 18.2 5.2 1.3 22.8 0.0 0.0 0.0 3.9 9.4 19.5 3.1 0.0 0.0 0.0 2.0 0.0 0.0 9.7 26.5 39.1 0.0 0.0 0.3 0.0 181.9 2007-05 160.0 0.0 0.0 0.0 0.0 0.0 46.4 7.3 0.0 5.3 15.8 20.9 3.4 0.0 4.7 5.7 37.2 0.0 0.0 11.8 16.6 0.2 0.0 0.0 0.0 0.0 0.0 0.0 7.0 0.0 182.3 2007-06 171.4 0.0 6.8 0.0 1.6 9.9 3.4 3.4 0.0 0.0 0.0 4.0 6.0 35.9 2.2 10.4 22.6 9.1 15.2 3.6 3.4 0.2 35.5 3.6 0.0 0.0 0.0 0.0 0.0 0.0 0.0 178.2 2007-07 120.0 0.0 0.0 0.0 0.5 0.0 0.0 1.3 0.0 0.0 0.0 0.0 2.6 0.0 0.0 0.2 0.0 3.8 0.0 0.0 1.2 0.0 1.6 0.0 9.9 27.4 2.3 1.4 61.5 22.6 0.0 136.3 2007-08 180.0 1.4 0.0 57.1 0.5 0.0 0.0 55.6 8.4 0.1 28.6 1.2 7.5 0.0 0.0 0.0 2.0 1.7 26.0 15.8 41.2 3.7 3.3 0.3 0.0 0.0 3.8 7.1 0.0 3.0 268.3 2007-09 104.8 12.0 33.1 21.2 21.2 7.6 70.4 2.5 0.0 0.0 0.0 0.0 0.0 1.2 0.0 46.8 9.7 1.9 0.0 0.0 0.0 27.0 34.4 6.1 7.9 6.7 7.4 3.0 2.6 0.2 2.3 330.0 2007-10 90.7 0.0 0.0 0.0 0.0 0.0 0.0 0.0 0.0 0.0 0.7 0.0 0.0 0.0 0.0 0.0 0.0 0.0 0.0 0.0 17.9 1.0 0.0 0.0 3.5 0.8 0.5 0.0 0.0 16.5 41.6 2007-11 total year 220.0 17.3 33.3 17.0 11.6 0.0 0.0 7.4 3.2 0.4 25.3 7.7 0.0 0.1 0.4 0.5 39.3 0.4 18.4 0.3 48.1 2.4 0.0 0.0 0.0 0.0 0.0 0.0 0.0 0.0 0.0 233.1 2007-12 1792.1 130.0 0.0 0.0 2.1 1.3 0.0 24.2 10.7 0.0 0.5 0.0 18.8 2.3 4.0 4.3 0.0 0.0 0.0 0.0 0.0 0.0 0.0 0.0 1.4 0.0 0.0 0.0 0.0 0.0 0.0 0.0 69.6 2008-01 210.0 0.0 0.0 0.0 0.0 0.0 21.0 23.3 0.0 0.0 0.0 0.0 0.0 0.0 2.8 0.0 0.0 0.0 0.0 0.0 0.0 0.0 0.0 4.2 0.0 0.0 0.0 0.0 0.0 51.3 2008-02 250.0 2.1 0.0 0.0 11.6 0.0 0.1 12.1 2.1 91.1 0.4 0.0 0.0 3.3 1.4 0.0 20.7 18.8 4.7 3.8 0.4 0.0 0.0 0.0 0.0 0.0 0.0 0.0 0.0 0.0 4.1 176.7 2008-03 160.0 0.0 0.0 0.0 0.0 0.7 0.5 0.0 0.0 8.8 25.9 0.0 18.0 0.0 5.3 4.1 0.0 0.3 3.2 0.0 0.0 0.0 0.0 0.0 0.0 21.3 24.0 20.1 4.3 0.0 136.5 2008-04 172.0 4.7 13.3 0.0 28.4 24.1 1.3 0.0 0.0 0.0 0.0 0.2 0.0 0.7 59.8 0.0 4.2 34.8 2.8 4.5 0.0 0.0 0.0 0.0 0.0 0.5 3.8 0.9 38.9 15.9 3.9 244.7 2008-05 12
15.9 0.2 14.2 20.5 0.5 0.0 0.0 0.0 0.0 0.0 8.1 11.0 17.1 11.8 0.0 0.0 27.4 0.1 0.0 3.0 21.4 68.0 5.2 1.8 0.0 0.5 0.0 0.0 0.0 12.5 239.2 2008-06 120.0 0.0 0.0 0.0 0.0 28.6 0.0 0.0 0.2 0.0 0.0 0.0 9.2 29.9 0.3 16.0 14.9 3.2 0.0 20.0 24.1 0.0 7.4 0.0 0.0 0.0 0.0 0.0 0.0 0.0 3.3 157.1 2008-07 190.0 0.0 0.0 0.0 0.0 0.0 0.0 0.0 0.0 0.7 0.1 0.1 0.0 0.0 0.0 0.0 0.0 0.0 26.0 62.3 15.3 8.8 16.6 37.8 4.7 6.9 0.6 0.0 31.4 38.4 10.2 259.9 2008-08 160.0 0.4 0.0 7.1 0.0 0.0 9.7 1.4 0.6 0.2 2.8 0.0 0.0 0.0 0.0 0.0 0.1 0.0 0.0 0.0 0.0 6.6 4.7 4.6 2.0 0.2 0.0 0.0 0.0 0.0 40.4 2008-09 17
10.7 0.0 0.0 0.0 1.2 0.0 3.8 13.3 14.5 0.0 16.1 45.6 0.0 33.7 3.7 14.2 0.7 0.0 0.0 0.0 8.4 46.4 0.0 0.0 0.0 6.2 29.1 0.0 0.0 0.0 0.0 247.6 2008-10 160.0 0.0 0.0 0.0 0.0 0.0 0.0 0.0 1.3 18.3 27.0 1.2 0.0 0.0 0.0 3.9 0.0 0.0 0.0 30.4 31.9 3.6 29.8 0.8 0.4 4.2 1.8 1.7 0.0 0.0 156.3 2008-11 total year 168.0 56.5 0.0 0.0 0.0 0.0 0.0 0.0 13.4 3.1 6.4 24.1 0.0 4.8 0.0 0.0 7.0 14.1 72.2 12.9 0.0 0.0 0.0 0.0 0.0 0.0 0.0 0.0 0.0 0.0 0.0 222.5 2008-12 2001.8 200.0 0.0 0.0 0.0 0.0 0.0 0.0 23.8 0.0 2.0 0.0 0.0 0.0 51.9 2.8 4.7 0.0 0.0 0.0 0.0 0.0 0.0 0.0 0.0 0.0 0.0 0.0 0.0 0.0 0.0 0.0 85.2 2009-01 260.0 0.0 0.0 0.0 0.0 0.0 0.0 0.0 0.0 0.0 0.0 0.0 0.0 0.0 0.0 0.0 0.0 0.0 0.0 2.1 8.8 0.0 0.0 1.9 0.0 0.0 0.0 0.0 12.8 2009-02 250.0 0.0 0.0 0.0 0.0 0.0 1.6 0.0 0.0 0.0 0.0 0.0 0.0 0.0 0.0 0.0 0.0 0.0 0.0 0.0 0.0 0.0 0.0 0.0 0.0 21.5 0.0 0.0 0.0 13.7 0.0 36.8 2009-03 28
13.8 0.0 0.3 9.3 2.5 19.7 38.2 0.0 0.0 0.0 0.0 0.0 0.0 0.0 0.0 0.0 0.0 0.0 0.0 0.0 0.0 0.0 0.0 0.0 0.0 0.0 0.0 0.0 2.8 0.0 86.6 2009-04 230.0 0.0 0.0 1.8 0.0 0.0 4.3 4.1 2.0 1.0 0.0 3.5 0.0 1.3 2.8 0.0 20.9 8.0 21.2 11.7 24.2 25.0 30.8 1.8 0.0 9.5 0.5 0.7 0.0 0.0 0.0 175.1 2009-05 120.7 0.6 0.0 0.0 0.0 27.0 0.0 0.0 2.7 1.6 3.0 0.0 0.0 1.5 0.0 21.0 7.2 32.4 2.3 19.6 0.0 4.5 46.8 36.4 0.0 0.0 0.0 0.0 0.0 6.0 213.3 2009-06 140.0 3.9 7.4 0.0 52.7 0.2 64.9 35.6 0.0 0.0 0.0 0.0 0.0 0.9 18.1 27.3 33.3 0.8 10.1 0.9 0.5 6.9 8.9 3.5 0.0 0.0 0.0 0.0 0.0 0.0 0.0 275.9 2009-07 140.0 0.0 0.0 0.8 51.2 0.5 4.2 4.4 3.4 7.2 7.9 6.7 78.0 24.5 38.2 31.2 3.5 44.6 0.7 7.3 7.1 4.8 0.0 0.0 0.1 31.8 37.2 15.4 0.0 5.7 0.0 416.4 2009-08 76.1 50.0 1.7 0.0 0.0 0.0 15.5 8.4 2.2 17.7 36.3 0.0 6.1 12.3 0.6 0.0 0.0 0.0 0.0 0.0 0.9 0.0 0.0 0.0 0.0 0.0 27.8 5.5 0.0 2.2 193.3 2009-09 15
21.9 0.5 0.0 8.1 0.0 8.1 8.0 0.0 0.0 0.0 0.0 0.0 0.0 0.0 0.0 5.2 0.0 0.0 0.0 0.0 0.0 0.0 0.0 0.0 0.0 0.0 4.8 0.0 10.4 1.0 39.5 107.5 2009-10 2114.2 27.1 34.2 42.3 72.1 22.1 25.7 31.4 27.7 44.6 18.0 0.0 0.0 0.0 0.0 0.0 0.0 0.0 0.0 0.0 2.3 30.2 0.6 0.0 0.0 12.0 0.0 0.2 4.5 0.0 409.2 2009-11 total year 130.4 6.8 0.0 0.0 0.0 3.2 0.0 0.0 0.0 0.0 0.0 0.0 0.0 1.3 0.7 0.0 0.0 0.0 0.0 41.7 15.6 8.6 0.3 21.7 15.3 15.1 7.8 5.2 30.4 15.3 0.0 189.4 2009-12 2201.5 150.0 0.0 0.0 0.0 0.0 0.0 0.0 2.4 0.0 0.0 0.0 0.0 0.0 0.0 0.0 0.0 5.6 0.0 0.0 0.0 0.0 0.0 0.0 0.0 0.0 0.0 0.0 0.0 0.0 0.0 0.0 8.0 2010-01 290.0 0.0 0.0 0.0 0.0 0.0 0.0 0.0 0.0 0.0 0.0 0.0 60.6 0.0 0.0 0.0 32.2 0.0 0.0 0.0 0.0 0.0 0.0 0.0 0.0 0.0 0.0 0.0 92.8 2010-02 260.0 0.0 0.0 0.0 0.0 0.0 0.0 0.0 0.0 0.0 4.1 0.9 17.4 0.0 0.0 0.0 0.0 0.0 0.0 0.0 0.0 0.0 0.0 0.0 0.0 0.0 0.0 0.0 0.0 0.0 0.0 22.4 2010-03 280.0 0.0 0.0 6.2 1.2 0.0 5.7 0.0 0.0 0.2 17.2 0.0 7.4 0.0 0.0 3.0 0.0 0.0 0.0 0.9 0.0 0.0 0.0 45.5 0.0 0.0 0.0 0.0 0.0 1.0 88.3 2010-04 200.0 0.0 0.0 0.0 0.0 14.2 0.5 17.9 39.1 0.0 1.1 4.1 3.4 5.5 21.1 2.6 37.1 11.0 42.5 22.8 16.4 5.1 19.4 2.2 0.6 0.0 0.0 5.4 0.0 4.9 0.0 276.9 2010-05 100.0 0.0 0.0 2.3 0.6 0.0 1.2 3.7 53.7 16.7 0.0 6.2 13.9 0.0 0.0 0.0 0.0 0.0 0.0 3.1 13.1 1.7 2.0 2.6 6.9 8.2 14.4 46.7 9.2 29.9 236.1 2010-06 11
12.4 0.0 0.7 0.0 7.2 5.5 38.3 0.4 0.0 48.2 22.6 0.0 5.5 5.0 0.0 0.0 3.1 0.5 10.7 0.0 0.0 1.6 3.7 0.0 0.0 10.9 20.2 22.6 3.0 0.0 0.0 222.1 2010-07 120.0 0.0 0.5 4.5 0.0 0.0 0.0 3.0 27.1 27.1 0.0 0.0 9.3 75.8 2.4 6.5 0.1 0.1 0.0 0.0 0.0 0.0 0.0 0.0 1.0 0.0 6.3 0.0 12.2 1.7 0.0 177.6 2010-08 160.0 0.0 0.0 0.0 0.0 0.0 0.0 0.0 0.0 0.0 0.2 0.6 0.0 0.0 3.1 12.7 30.1 29.2 14.3 10.0 13.3 28.1 38.2 43.4 14.9 10.3 22.4 16.3 26.8 27.0 340.9 2010-09 12
52.7 0.0 0.0 0.0 0.0 0.0 0.0 0.0 0.0 0.0 0.0 0.0 0.0 0.0 0.0 0.0 0.0 0.0 0.0 0.0 0.0 0.0 0.0 0.0 0.0 0.4 0.7 0.0 0.0 0.0 15.5 69.3 2010-10 270.0 0.0 0.0 0.0 0.0 7.2 0.0 5.7 3.6 61.8 0.0 0.0 0.0 1.0 0.0 0.9 0.2 0.0 0.0 11.2 0.4 6.9 0.0 0.0 1.2 0.0 0.0 6.2 2.1 19.8 128.2 2010-11 total year 160.8 11.1 1.9 83.9 10.1 79.6 51.0 5.0 0.0 5.0 0.0 0.0 0.0 0.0 0.0 0.0 0.0 0.0 2.2 0.0 0.0 73.6 0.0 0.0 0.0 0.0 0.0 0.0 0.0 1.0 30.1 355.3 2010-12 2017.9 18
Maldives Meteorological Service - Climate Section
Daily Total Rainfall (mm) -Hulhule 2001 - 2010
Table A.1. Daily precipitation (mm) for Hulhule (Malé) in Maldives between 2001 and 2010. Source: Maldives Meteorological Agency.

118
.
averages
min year max year
jan 70.94 2.7 2004 184.1 2003feb 50.62 0 2005 2006 174.7 2002mar 54.93 4.5 2004 176.7 2008apr 138.18 15.7 2005 215 2001may 168.66 87.4 2006 276.9 2010jun 175.07 66.5 2004 239.2 2008jul 223.31 157.1 2008 398.5 2003aug 208.99 84 2001 416.4 2009sep 265.02 40.4 2008 432 2006oct 215 62.4 2003 388.1 2005nov 255.89 41.6 2007 568.9 2006dec 246.25 65.6 2003 410.8 2002year 2072.86 1649.2 2005 2711.2 2006
máx day170.0 18/10/05
Maldives Meteorological Service - Climate Section
Montly average, max & min Rainfall (mm) -Hulhule 2001 - 2010
vancouver maldives
janfebmaraprmayjunjulaugsepoctnovdecyear
153.6 70.94123.1 50.62114.3 54.93
84 138.1867.9 168.6654.8 175.0739.6 223.3139.1 208.9953.5 265.02
112.6 215181 255.89
175.7 246.251199 2072.86 0
50
100
150
200
250
300
jan feb mar apr may jun jul aug sep oct nov dec
Average rainfall comparison
vancouvermaldives
Table A.2. Monthly average, maximum and minimum precipitation values (mm) for Hulhule (Malé) in Maldives between 2001 and 2010. Source: Maldives Meteorological Agency.
Table A.3. Average number of days with different minimum precipitation values for Hulhule (Malé) in Maldives and Vancouver, BC. Source: Maldives Meteorological Agency and theweathernetwork.com.
Fig. A.1. Comparison of annual number of days with different minimum precipitation values between Hulhule (Malé) in Maldives and Vancouver, BC. Source: Maldives Meteorological Agency and theweathernetwork.com.
Fig. A.2. Comparison of monthly number of days with precipitation between Hulhule (Malé) in Maldives and Vancouver, BC. Source: Maldives Meteorological Agency and theweathernetwork.com.
Maldives Precip..>=0.2 mm
Precip.>=5 mm
Precip.>=10 mm
Precip.>=25 mm
Vancouver Precip..>=0.2 mm
Precip.>=5 mm
Precip.>=10 mm
Precip.>=25 mm
jan 6.2 2.3 1.5 0.7 jan 19 10 6 0feb 3.4 1.9 1.4 0.5 feb 16 8 4 0mar 5.3 2.3 1.7 0.6 mar 16 7 4 0apr 11.4 6.4 4.1 1.9 apr 13 5 2 0may 16.8 7.6 5.5 2.2 may 12 4 2 0jun 16.8 8.4 5.7 2.2 jun 10 3 1 0jul 16.3 9.7 6.5 2.9 jul 7 2 1 0aug 14.4 8.4 5.9 2.6 aug 7 3 1 0sep 17.7 11.4 7.4 3.8 sep 9 4 2 0oct 15.6 9 6 2.4 oct 15 7 4 0nov 16.3 9.7 6.9 3.9 nov 19 10 6 1dec 15.3 8.6 6.5 3.5 dec 21 11 7 1TOTAL 155.5 85.7 59.1 27.2 TOTAL 164 74 40 2
Maldives Meteorological Service - Climate Section
Montly average, max & min Rainfall (mm) -Hulhule 2001 - 2010
0
5
10
15
20
25
30
jan feb mar apr may jun jul aug sep oct nov dec
monthly number of days of precipitation >=0.2mm
MaldivesVancouver
0
91
183
274
365
Precip..>=0.2 mm Precip.>=5 mm Precip.>=10 mm Precip.>=25 mm
annual number of days of precipitation
MaldivesVancouver

119
Appendix B: Water Footprint Design Tool Results for Case-study
original DESALINATE
D WF
original GREY WF
DESALINATED WF
RAIN WF GREY WF remaining grey + black
waterjanfebmaraprmayjunjulaugsepoctnovdecTOTALaverage
5480106 3816149 0 5480106 0 3816149 05063783 3484722 0 5063783 0 3484722 05565049 3802887 0 5565049 0 3802887 05257001 3706593 0 5257001 0 3706593 04791424 3408051 0 4791424 0 3408051 04108456 2878381 0 4108456 0 2878381 04710983 3274258 0 4710983 0 3274258 05236246 3605381 0 5236246 0 3605381 04744565 3257892 0 4744565 0 3257892 06074826 4198101 0 6074826 0 4198101 05936495 4215852 0 5936495 0 4215852 06514355 4632348 0 6514355 0 4632348 0
63483289 44280615 0 63483289 0 44280615 05290274 3690051 0 5290274 0 3690051 0
0
1000000
2000000
3000000
4000000
5000000
6000000
7000000
jan feb mar apr may jun jul aug sep oct nov dec
original DESALINATED WF original GREY WF DESALINATED WF RAIN WF GREY WF
RAINWATER HARVESTINGRAINWATER HARVESTING GRAYWATERGRAYWATERGRAYWATER GUEST ROOMS distribGUEST ROOMS distribRecycled from: Evap. coeff Toilets 16%
roof area (m2) 13500 Laundry 0.80 Showers + Sinks 80%runoff coef 0.90 Showers/bathroom sinks 0.80 Swimming pools 4%S=tank volume (l) 4000000 Spa 0.80
Greywater used for:Rainwater used for: Q2 EMPLOYEES distribQ1 Food Garden Irrigation Toilets 20%Sinks + Showers Swimming Pools Showers + Sinks 80%Spa Laundry EFFICIENT FIXTURESEFFICIENT FIXTURESKitchens Process Water Irrigation 0%Drinking Q3 Laundry 0%Q2 Landscaping Kitchens 0%Food Garden Irrigation Toilet Flushing Showers + Sinks 0%Swimming Pools BLACKWATERBLACKWATERBLACKWATER Toilets 0%Laundry Recycled from: Evap. coeff Food Gardens Irrigation 0%Process Water Kitchens 0.80 EDUCATIONEDUCATIONQ3 Toilets 0.80 Laundry 0%Landscaping Blackwater reused for: Guests Showers 0%Toilet Flushing Q3 Guests Toilets 0%
Landscaping Employees Showers 0%Toilet Flushing Employees Toilets 0%
DESALINATED WF REDUCTION
0.0%
REMAINING DESALINATED WF
63.483 M litres
GREY WF REDUCTION
0.0%
REMAINING GREY WF
44.281 M litres
Fig. B.1. Control panel configuration for scenario #0 (current state).
Fig. B.2. Monthly water footprint components for scenario #0 (current state).
Table B.1. Monthly water footprint components for scenario #0 (current state).

120
original DESALINATE
D WF
original GREY WF
DESALINATED WF
RAIN WF GREY WF remaining grey + black
waterjanfebmaraprmayjunjulaugsepoctnovdecTOTALaverage
5480106 3816149 0 3112000 1184960 984064 17721525063783 3484722 0 2868380 1113396 893616 16214365565049 3802887 0 3138720 1261732 1012288 17486495257001 3706593 0 3055570 1069611 1007592 16873374791424 3408051 0 2838430 912170 946072 15313524108456 2878381 0 2426840 809768 863776 12365024710983 3274258 0 2723060 989546 931952 14503565236246 3605381 0 2947410 1187829 987304 16340954744565 3257892 0 2647670 1106280 882680 14904006074826 4198101 0 3455010 1319752 1103080 19303305936495 4215852 0 3425120 1204351 1089536 19558736514355 4632348 0 3809590 1267572 1218584 2126473
63483289 44280615 0 36447800 13426966 11920544 201849575290274 3690051 0 3037317 1118914 993379 1682080
0
1000000
2000000
3000000
4000000
5000000
6000000
7000000
jan feb mar apr may jun jul aug sep oct nov dec
original DESALINATED WF original GREY WF DESALINATED WF RAIN WF GREY WF
RAINWATER HARVESTINGRAINWATER HARVESTING GRAYWATERGRAYWATERGRAYWATER GUEST ROOMS distribGUEST ROOMS distribRecycled from: Evap. coeff Toilets 16%
roof area (m2) 13500 Laundry 0.80 Showers + Sinks 80%runoff coef 0.90 Showers/bathroom sinks 0.80 Swimming pools 4%S=tank volume (l) 20000000 Spa 0.80
Greywater used for:Rainwater used for: Q2 EMPLOYEES distribQ1 Food Garden Irrigation Toilets 20%Sinks + Showers Swimming Pools Showers + Sinks 80%Spa Laundry EFFICIENT FIXTURESEFFICIENT FIXTURESKitchens Process Water Irrigation 0%Drinking Q3 Laundry 15%Q2 Landscaping Kitchens 15%Food Garden Irrigation Toilet Flushing Showers + Sinks 15%Swimming Pools BLACKWATERBLACKWATERBLACKWATER Toilets 0%Laundry Recycled from: Evap. coeff Food Gardens Irrigation 0%Process Water Kitchens 0.80 EDUCATIONEDUCATIONQ3 Toilets 0.80 Laundry 0%Landscaping Blackwater reused for: Guests Showers 0%Toilet Flushing Q3 Guests Toilets 0%
Landscaping Employees Showers 0%Toilet Flushing Employees Toilets 0%
DESALINATED WF REDUCTION
42.6%
REMAINING DESALINATED WF
36.448 M litres
GREY WF REDUCTION
73.1%
REMAINING GREY WF
11.921 M litres
original DESALINATE
D WF
original GREY WF
DESALINATED WF
RAIN WF GREY WF remaining grey + black
waterjanfebmaraprmayjunjulaugsepoctnovdecTOTALaverage
5480106 3816149 0 3112000 1184960 984064 17721525063783 3484722 0 2868380 1113396 893616 16214365565049 3802887 0 3138720 1261732 1012288 17486495257001 3706593 0 3055570 1069611 1007592 16873374791424 3408051 0 2838430 912170 946072 15313524108456 2878381 0 2426840 809768 863776 12365024710983 3274258 0 2723060 989546 931952 14503565236246 3605381 0 2947410 1187829 987304 16340954744565 3257892 0 2647670 1106280 882680 14904006074826 4198101 0 3455010 1319752 1103080 19303305936495 4215852 0 3425120 1204351 1089536 19558736514355 4632348 0 3809590 1267572 1218584 2126473
63483289 44280615 0 36447800 13426966 11920544 201849575290274 3690051 0 3037317 1118914 993379 1682080
0
1000000
2000000
3000000
4000000
5000000
6000000
7000000
jan feb mar apr may jun jul aug sep oct nov dec
original DESALINATED WF original GREY WF DESALINATED WF RAIN WF GREY WF
RAINWATER HARVESTINGRAINWATER HARVESTING GRAYWATERGRAYWATERGRAYWATER GUEST ROOMS distribGUEST ROOMS distribRecycled from: Evap. coeff Toilets 16%
roof area (m2) 13500 Laundry 0.80 Showers + Sinks 80%runoff coef 0.90 Showers/bathroom sinks 0.80 Swimming pools 4%S=tank volume (l) 20000000 Spa 0.80
Greywater used for:Rainwater used for: Q2 EMPLOYEES distribQ1 Food Garden Irrigation Toilets 20%Sinks + Showers Swimming Pools Showers + Sinks 80%Spa Laundry EFFICIENT FIXTURESEFFICIENT FIXTURESKitchens Process Water Irrigation 0%Drinking Q3 Laundry 15%Q2 Landscaping Kitchens 15%Food Garden Irrigation Toilet Flushing Showers + Sinks 15%Swimming Pools BLACKWATERBLACKWATERBLACKWATER Toilets 0%Laundry Recycled from: Evap. coeff Food Gardens Irrigation 0%Process Water Kitchens 0.80 EDUCATIONEDUCATIONQ3 Toilets 0.80 Laundry 0%Landscaping Blackwater reused for: Guests Showers 0%Toilet Flushing Q3 Guests Toilets 0%
Landscaping Employees Showers 0%Toilet Flushing Employees Toilets 0%
DESALINATED WF REDUCTION
42.6%
REMAINING DESALINATED WF
36.448 M litres
GREY WF REDUCTION
73.1%
REMAINING GREY WF
11.921 M litres
Fig. B.3. Control panel configuration for scenario #1A (conventional strategies, high precipition year 2006).
Fig. B.4. Monthly water footprint components for scenario #1A (conventional strategies, high precipition year 2006).
Table B.2. Monthly water footprint components for scenario #1A (conventional strategies, high precipition year 2006).

121
original DESALINATE
D WF
original GREY WF
DESALINATED WF
RAIN WF GREY WF remaining grey + black
waterjanfebmaraprmayjunjulaugsepoctnovdecTOTALaverage
5480106 3816149 0 3112000 1184960 984064 17721525063783 3484722 0 2868380 1113396 893616 16214365565049 3802887 0 3138720 1261732 1012288 17486495257001 3706593 0 3061939 1063242 1007592 16873374791424 3408051 0 2998594 752006 946072 15313524108456 2878381 0 2426840 809768 863776 12365024710983 3274258 0 2871601 841004 931952 14503565236246 3605381 0 2947410 1187829 987304 16340954744565 3257892 0 2647670 1106280 882680 14904006074826 4198101 0 3455010 1319752 1103080 19303305936495 4215852 0 3425120 1204351 1089536 19558736514355 4632348 0 3809590 1267572 1218584 2126473
63483289 44280615 0 36762874 13111891 11920544 201849575290274 3690051 0 3063573 1092658 993379 1682080
0
1000000
2000000
3000000
4000000
5000000
6000000
7000000
jan feb mar apr may jun jul aug sep oct nov dec
original DESALINATED WF original GREY WF DESALINATED WF RAIN WF GREY WF
RAINWATER HARVESTINGRAINWATER HARVESTING GRAYWATERGRAYWATERGRAYWATER GUEST ROOMS distribGUEST ROOMS distribRecycled from: Evap. coeff Toilets 16%
roof area (m2) 13500 Laundry 0.80 Showers + Sinks 80%runoff coef 0.90 Showers/bathroom sinks 0.80 Swimming pools 4%S=tank volume (l) 4000000 Spa 0.80
Greywater used for:Rainwater used for: Q2 EMPLOYEES distribQ1 Food Garden Irrigation Toilets 20%Sinks + Showers Swimming Pools Showers + Sinks 80%Spa Laundry EFFICIENT FIXTURESEFFICIENT FIXTURESKitchens Process Water Irrigation 0%Drinking Q3 Laundry 15%Q2 Landscaping Kitchens 15%Food Garden Irrigation Toilet Flushing Showers + Sinks 15%Swimming Pools BLACKWATERBLACKWATERBLACKWATER Toilets 0%Laundry Recycled from: Evap. coeff Food Gardens Irrigation 0%Process Water Kitchens 0.80 EDUCATIONEDUCATIONQ3 Toilets 0.80 Laundry 0%Landscaping Blackwater reused for: Guests Showers 0%Toilet Flushing Q3 Guests Toilets 0%
Landscaping Employees Showers 0%Toilet Flushing Employees Toilets 0%
DESALINATED WF REDUCTION
42.1%
REMAINING DESALINATED WF
36.763 M litres
GREY WF REDUCTION
73.1%
REMAINING GREY WF
11.921 M litres
Fig. B.5. Control panel configuration for scenario #1B (conventional strategies, low precipition year 2005).
Fig. B.6. Monthly water footprint components for scenario #1B (conventional strategies, low precipition year 2005).
Table B.3. Monthly water footprint components for scenario #1B (conventional strategies, low precipition year 2005).

122
original DESALINATE
D WF
original GREY WF
DESALINATED WF
RAIN WF GREY WF remaining grey + black
waterjanfebmaraprmayjunjulaugsepoctnovdecTOTALaverage
5480106 3816149 0 3112000 1184960 984064 17721525063783 3484722 0 2868380 1113396 893616 16214365565049 3802887 0 3138720 1261732 1012288 17486495257001 3706593 0 3055570 1069611 1007592 16873374791424 3408051 0 2838430 912170 946072 15313524108456 2878381 0 2426840 809768 863776 12365024710983 3274258 0 2723060 989546 931952 14503565236246 3605381 0 2947410 1187829 987304 16340954744565 3257892 0 2647670 1106280 882680 14904006074826 4198101 0 3455010 1319752 1103080 19303305936495 4215852 0 3425120 1204351 1089536 19558736514355 4632348 0 3809590 1267572 1218584 2126473
63483289 44280615 0 36447800 13426966 11920544 201849575290274 3690051 0 3037317 1118914 993379 1682080
0
1000000
2000000
3000000
4000000
5000000
6000000
7000000
jan feb mar apr may jun jul aug sep oct nov dec
original DESALINATED WF original GREY WF DESALINATED WF RAIN WF GREY WF
RAINWATER HARVESTINGRAINWATER HARVESTING GRAYWATERGRAYWATERGRAYWATER GUEST ROOMS distribGUEST ROOMS distribRecycled from: Evap. coeff Toilets 16%
roof area (m2) 13500 Laundry 0.80 Showers + Sinks 80%runoff coef 0.90 Showers/bathroom sinks 0.80 Swimming pools 4%S=tank volume (l) 4000000 Spa 0.80
Greywater used for:Rainwater used for: Q2 EMPLOYEES distribQ1 Food Garden Irrigation Toilets 20%Sinks + Showers Swimming Pools Showers + Sinks 80%Spa Laundry EFFICIENT FIXTURESEFFICIENT FIXTURESKitchens Process Water Irrigation 0%Drinking Q3 Laundry 15%Q2 Landscaping Kitchens 15%Food Garden Irrigation Toilet Flushing Showers + Sinks 15%Swimming Pools BLACKWATERBLACKWATERBLACKWATER Toilets 0%Laundry Recycled from: Evap. coeff Food Gardens Irrigation 0%Process Water Kitchens 0.80 EDUCATIONEDUCATIONQ3 Toilets 0.80 Laundry 0%Landscaping Blackwater reused for: Guests Showers 0%Toilet Flushing Q3 Guests Toilets 0%
Landscaping Employees Showers 0%Toilet Flushing Employees Toilets 0%
DESALINATED WF REDUCTION
42.6%
REMAINING DESALINATED WF
36.448 M litres
GREY WF REDUCTION
73.1%
REMAINING GREY WF
11.921 M litres
Fig. B.7. Control panel configuration for scenario #1C (conventional strategies, average precipition year 2010).
Fig. B.8. Monthly water footprint components for scenario #1C (conventional strategies, average precipition year 2010).
Table B.4. Monthly water footprint components for scenario #1C (conventional strategies, average precipition year 2010).

123
original DESALINATE
D WF
original GREY WF
DESALINATED WF
RAIN WF GREY WF remaining grey + black
waterjanfebmaraprmayjunjulaugsepoctnovdecTOTALaverage
5480106 3816149 0 -0 2996400 0 14896075063783 3484722 0 -0 2761246 0 13255885565049 3802887 0 0 3025534 0 14191435257001 3706593 0 0 2946464 0 15482824791424 3408051 0 737919 2000177 0 14941134108456 2878381 0 876698 1467930 0 12321254710983 3274258 0 288917 2338875 0 13253255236246 3605381 0 967261 1875191 0 13597464744565 3257892 0 0 2553524 0 12008306074826 4198101 0 0 3328292 -0 16239715936495 4215852 0 -0 3297654 0 17511536514355 4632348 0 0 3668388 -0 1977277
63483289 44280615 0 2870795 32259675 0 177471605290274 3690051 0 239233 2688306 0 1478930
0
1000000
2000000
3000000
4000000
5000000
6000000
7000000
jan feb mar apr may jun jul aug sep oct nov dec
original DESALINATED WF original GREY WF DESALINATED WF RAIN WF GREY WF
RAINWATER HARVESTINGRAINWATER HARVESTING GRAYWATERGRAYWATERGRAYWATER GUEST ROOMS distribGUEST ROOMS distribRecycled from: Evap. coeff Toilets 16%
roof area (m2) 13500 Laundry 0.80 Showers + Sinks 80%runoff coef 0.90 Showers/bathroom sinks 0.80 Swimming pools 4%S=tank volume (l) 20000000 Spa 0.80
Greywater used for:Rainwater used for: Q2 EMPLOYEES distribQ1 Food Garden Irrigation Toilets 20%Sinks + Showers Swimming Pools Showers + Sinks 80%Spa Laundry EFFICIENT FIXTURESEFFICIENT FIXTURESKitchens Process Water Irrigation 0%Drinking Q3 Laundry 15%Q2 Landscaping Kitchens 15%Food Garden Irrigation Toilet Flushing Showers + Sinks 15%Swimming Pools BLACKWATERBLACKWATERBLACKWATER Toilets 0%Laundry Recycled from: Evap. coeff Food Gardens Irrigation 0%Process Water Kitchens 0.80 EDUCATIONEDUCATIONQ3 Toilets 0.80 Laundry 5%Landscaping Blackwater reused for: Guests Showers 5%Toilet Flushing Q3 Guests Toilets 5%
Landscaping Employees Showers 5%Toilet Flushing Employees Toilets 5%
DESALINATED WF REDUCTION
95.5%
REMAINING DESALINATED WF
2.871 M litres
GREY WF REDUCTION
100.0%
REMAINING GREY WF
0 M litres
original DESALINATE
D WF
original GREY WF
DESALINATED WF
RAIN WF GREY WF remaining grey + black
waterjanfebmaraprmayjunjulaugsepoctnovdecTOTALaverage
5480106 3816149 0 -0 2996400 0 14896075063783 3484722 0 -0 2761246 0 13255885565049 3802887 0 0 3025534 0 14191435257001 3706593 0 0 2946464 0 15482824791424 3408051 0 737919 2000177 0 14941134108456 2878381 0 876698 1467930 0 12321254710983 3274258 0 288917 2338875 0 13253255236246 3605381 0 967261 1875191 0 13597464744565 3257892 0 0 2553524 0 12008306074826 4198101 0 0 3328292 -0 16239715936495 4215852 0 -0 3297654 0 17511536514355 4632348 0 0 3668388 -0 1977277
63483289 44280615 0 2870795 32259675 0 177471605290274 3690051 0 239233 2688306 0 1478930
0
1000000
2000000
3000000
4000000
5000000
6000000
7000000
jan feb mar apr may jun jul aug sep oct nov dec
original DESALINATED WF original GREY WF DESALINATED WF RAIN WF GREY WF
RAINWATER HARVESTINGRAINWATER HARVESTING GRAYWATERGRAYWATERGRAYWATER GUEST ROOMS distribGUEST ROOMS distribRecycled from: Evap. coeff Toilets 16%
roof area (m2) 13500 Laundry 0.80 Showers + Sinks 80%runoff coef 0.90 Showers/bathroom sinks 0.80 Swimming pools 4%S=tank volume (l) 20000000 Spa 0.80
Greywater used for:Rainwater used for: Q2 EMPLOYEES distribQ1 Food Garden Irrigation Toilets 20%Sinks + Showers Swimming Pools Showers + Sinks 80%Spa Laundry EFFICIENT FIXTURESEFFICIENT FIXTURESKitchens Process Water Irrigation 0%Drinking Q3 Laundry 15%Q2 Landscaping Kitchens 15%Food Garden Irrigation Toilet Flushing Showers + Sinks 15%Swimming Pools BLACKWATERBLACKWATERBLACKWATER Toilets 0%Laundry Recycled from: Evap. coeff Food Gardens Irrigation 0%Process Water Kitchens 0.80 EDUCATIONEDUCATIONQ3 Toilets 0.80 Laundry 5%Landscaping Blackwater reused for: Guests Showers 5%Toilet Flushing Q3 Guests Toilets 5%
Landscaping Employees Showers 5%Toilet Flushing Employees Toilets 5%
DESALINATED WF REDUCTION
95.5%
REMAINING DESALINATED WF
2.871 M litres
GREY WF REDUCTION
100.0%
REMAINING GREY WF
0 M litres
Fig. B.9. Control panel configuration for scenario #2A (all strategies, high precipition year 2006).
Fig. B.10. Monthly water footprint components for scenario #2A (all strategies, high precipition year 2006).
Table B.5. Monthly water footprint components for scenario #2A (all strategies, high precipition year 2006).

124
original DESALINATE
D WF
original GREY WF
DESALINATED WF
RAIN WF GREY WF remaining grey + black
waterjanfebmaraprmayjunjulaugsepoctnovdecTOTALaverage
5480106 3816149 0 2793495 202905 0 14896075063783 3484722 0 2761246 0 0 13255885565049 3802887 0 2138584 886950 0 14191435257001 3706593 0 2755709 190755 0 15482824791424 3408051 0 1454184 1283912 0 14941134108456 2878381 0 -0 2344628 0 12321254710983 3274258 0 911451 1716341 0 13253255236246 3605381 0 1971871 870581 0 13597464744565 3257892 0 0 2553524 0 12008306074826 4198101 0 0 3328292 -0 16239715936495 4215852 0 -0 3297654 0 17511536514355 4632348 0 772877 2895511 -0 1977277
63483289 44280615 0 15559417 19571053 0 177471605290274 3690051 0 1296618 1630921 0 1478930
0
1000000
2000000
3000000
4000000
5000000
6000000
7000000
jan feb mar apr may jun jul aug sep oct nov dec
original DESALINATED WF original GREY WF DESALINATED WF RAIN WF GREY WF
RAINWATER HARVESTINGRAINWATER HARVESTING GRAYWATERGRAYWATERGRAYWATER GUEST ROOMS distribGUEST ROOMS distribRecycled from: Evap. coeff Toilets 16%
roof area (m2) 13500 Laundry 0.80 Showers + Sinks 80%runoff coef 0.90 Showers/bathroom sinks 0.80 Swimming pools 4%S=tank volume (l) 4000000 Spa 0.80
Greywater used for:Rainwater used for: Q2 EMPLOYEES distribQ1 Food Garden Irrigation Toilets 20%Sinks + Showers Swimming Pools Showers + Sinks 80%Spa Laundry EFFICIENT FIXTURESEFFICIENT FIXTURESKitchens Process Water Irrigation 0%Drinking Q3 Laundry 15%Q2 Landscaping Kitchens 15%Food Garden Irrigation Toilet Flushing Showers + Sinks 15%Swimming Pools BLACKWATERBLACKWATERBLACKWATER Toilets 0%Laundry Recycled from: Evap. coeff Food Gardens Irrigation 0%Process Water Kitchens 0.80 EDUCATIONEDUCATIONQ3 Toilets 0.80 Laundry 5%Landscaping Blackwater reused for: Guests Showers 5%Toilet Flushing Q3 Guests Toilets 5%
Landscaping Employees Showers 5%Toilet Flushing Employees Toilets 5%
DESALINATED WF REDUCTION
75.5%
REMAINING DESALINATED WF
15.559 M litres
GREY WF REDUCTION
100.0%
REMAINING GREY WF
0 M litres
original DESALINATE
D WF
original GREY WF
DESALINATED WF
RAIN WF GREY WF remaining grey + black
waterjanfebmaraprmayjunjulaugsepoctnovdecTOTALaverage
5480106 3816149 0 2793495 202905 0 14896075063783 3484722 0 2761246 0 0 13255885565049 3802887 0 2138584 886950 0 14191435257001 3706593 0 2755709 190755 0 15482824791424 3408051 0 1454184 1283912 0 14941134108456 2878381 0 -0 2344628 0 12321254710983 3274258 0 911451 1716341 0 13253255236246 3605381 0 1971871 870581 0 13597464744565 3257892 0 0 2553524 0 12008306074826 4198101 0 0 3328292 -0 16239715936495 4215852 0 -0 3297654 0 17511536514355 4632348 0 772877 2895511 -0 1977277
63483289 44280615 0 15559417 19571053 0 177471605290274 3690051 0 1296618 1630921 0 1478930
0
1000000
2000000
3000000
4000000
5000000
6000000
7000000
jan feb mar apr may jun jul aug sep oct nov dec
original DESALINATED WF original GREY WF DESALINATED WF RAIN WF GREY WF
RAINWATER HARVESTINGRAINWATER HARVESTING GRAYWATERGRAYWATERGRAYWATER GUEST ROOMS distribGUEST ROOMS distribRecycled from: Evap. coeff Toilets 16%
roof area (m2) 13500 Laundry 0.80 Showers + Sinks 80%runoff coef 0.90 Showers/bathroom sinks 0.80 Swimming pools 4%S=tank volume (l) 4000000 Spa 0.80
Greywater used for:Rainwater used for: Q2 EMPLOYEES distribQ1 Food Garden Irrigation Toilets 20%Sinks + Showers Swimming Pools Showers + Sinks 80%Spa Laundry EFFICIENT FIXTURESEFFICIENT FIXTURESKitchens Process Water Irrigation 0%Drinking Q3 Laundry 15%Q2 Landscaping Kitchens 15%Food Garden Irrigation Toilet Flushing Showers + Sinks 15%Swimming Pools BLACKWATERBLACKWATERBLACKWATER Toilets 0%Laundry Recycled from: Evap. coeff Food Gardens Irrigation 0%Process Water Kitchens 0.80 EDUCATIONEDUCATIONQ3 Toilets 0.80 Laundry 5%Landscaping Blackwater reused for: Guests Showers 5%Toilet Flushing Q3 Guests Toilets 5%
Landscaping Employees Showers 5%Toilet Flushing Employees Toilets 5%
DESALINATED WF REDUCTION
75.5%
REMAINING DESALINATED WF
15.559 M litres
GREY WF REDUCTION
100.0%
REMAINING GREY WF
0 M litres
Fig. B.11. Control panel configuration for scenario #2B (all strategies, low precipition year 2005).
Fig. B.12. Monthly water footprint components for scenario #2B (all strategies, low precipition year 2005).
Table B.6. Monthly water footprint components for scenario #2B (all strategies, low precipition year 2005).

125
original DESALINATE
D WF
original GREY WF
DESALINATED WF
RAIN WF GREY WF remaining grey + black
waterjanfebmaraprmayjunjulaugsepoctnovdecTOTALaverage
5480106 3816149 0 2123809 872591 0 14896075063783 3484722 0 1633726 1127520 0 13255885565049 3802887 0 2753374 272160 0 14191435257001 3706593 0 1873619 1072845 0 15482824791424 3408051 0 532607 2205489 0 14941134108456 2878381 0 -0 2344628 0 12321254710983 3274258 0 204035 2423757 0 13253255236246 3605381 0 409854 2432598 0 13597464744565 3257892 0 1151457 1402067 0 12008306074826 4198101 0 0 3328292 -0 16239715936495 4215852 0 1612251 1685403 0 17511536514355 4632348 0 1086 3667302 -0 1977277
63483289 44280615 0 12295818 22834652 0 177471605290274 3690051 0 1024652 1902888 0 1478930
0
1000000
2000000
3000000
4000000
5000000
6000000
7000000
jan feb mar apr may jun jul aug sep oct nov dec
original DESALINATED WF original GREY WF DESALINATED WF RAIN WF GREY WF
RAINWATER HARVESTINGRAINWATER HARVESTING GRAYWATERGRAYWATERGRAYWATER GUEST ROOMS distribGUEST ROOMS distribRecycled from: Evap. coeff Toilets 16%
roof area (m2) 13500 Laundry 0.80 Showers + Sinks 80%runoff coef 0.90 Showers/bathroom sinks 0.80 Swimming pools 4%S=tank volume (l) 4000000 Spa 0.80
Greywater used for:Rainwater used for: Q2 EMPLOYEES distribQ1 Food Garden Irrigation Toilets 20%Sinks + Showers Swimming Pools Showers + Sinks 80%Spa Laundry EFFICIENT FIXTURESEFFICIENT FIXTURESKitchens Process Water Irrigation 0%Drinking Q3 Laundry 15%Q2 Landscaping Kitchens 15%Food Garden Irrigation Toilet Flushing Showers + Sinks 15%Swimming Pools BLACKWATERBLACKWATERBLACKWATER Toilets 0%Laundry Recycled from: Evap. coeff Food Gardens Irrigation 0%Process Water Kitchens 0.80 EDUCATIONEDUCATIONQ3 Toilets 0.80 Laundry 5%Landscaping Blackwater reused for: Guests Showers 5%Toilet Flushing Q3 Guests Toilets 5%
Landscaping Employees Showers 5%Toilet Flushing Employees Toilets 5%
DESALINATED WF REDUCTION
80.6%
REMAINING DESALINATED WF
12.296 M litres
GREY WF REDUCTION
100.0%
REMAINING GREY WF
0 M litres
Fig. B.13. Control panel configuration for scenario #2C (all strategies, average precipition year 2010).
Fig. B.14. Monthly water footprint components for scenario #2C (all strategies, average precipition year 2010).
Table B.7. Monthly water footprint components for scenario #2C (all strategies, average precipition year 2010).
Related Documents