Water Cycle Management Report Riverstone East April 2015 NSW Department of Planning & Environment

Welcome message from author
This document is posted to help you gain knowledge. Please leave a comment to let me know what you think about it! Share it to your friends and learn new things together.
Transcript
Water Cycle Management Report
Riverstone East
April 2015
NSW Department of Planning & Environment

334311 AU SYD84 2 E
P:\Parramatta\Projects\33xxxx\334311\05 DOCUMENTS\5_1 Working Files\Riverstone East\Water Cycle Management & Flood
March 2015
Water Cycle Management Report
Riverstone East
Water Cycle Management Report
Riverstone East
April 2015
NSW Department of Planning & Environment
Mott MacDonald, L10, 383 Kent Street, Sydney NSW 2000, Australia
PO Box Q1678, QVB Sydney NSW 1230, Australia
T +61 (0)2 9098 6800 F +61 (0)2 9098 6801 W www.mottmac.com
10 Valentine Ave, Parramatta NSW 2150

Water Cycle Management Report Riverstone East
334311/AU/SYD84/2/E March 2015 P:\Parramatta\Projects\33xxxx\334311\05 DOCUMENTS\5_1 Working Files\Riverstone East\Water Cycle Management & Flood Analysis\334311-150428-Water Cycle Management Report-Riverstone East_Rev F.docx
Revision Date Originator Checker Approver Description StandardA 22.08.2014 G. Lee C. Avis C. Avis DRAFT
B 03.09.2014 J. Taylor G. Lee C. Avis Final DRAFT
C 16.01.2015 J. Taylor G. Lee C. Avis For Exhibition
D 30.01.2015 J. Taylor G. Lee C. Avis For Exhibition
E 19.03.2015 J. Taylor G. Lee C. Avis For Exhibition
F 28.04.2015 J. Taylor G. Lee C. Avis Minor Amendments
Issue and revision record
This document is issued for the party which commissioned it and for specific purposes connected with the above-captioned project only. It should not be relied upon by any other party or used for any other purpose.
We accept no responsibility for the consequences of this document being relied upon by any other party, or being used for any other purpose, or containing any error or omission which is due to an error or omission in data supplied to us by other parties.
This document contains confidential information and proprietary intellectual property. It should not be shown to other parties without consent from us and from the party which commissioned it.

Water Cycle Management Report Riverstone East
334311/AU/SYD84/2/E March 2015 P:\Parramatta\Projects\33xxxx\334311\05 DOCUMENTS\5_1 Working Files\Riverstone East\Water Cycle Management & Flood Analysis\334311-150428-Water Cycle Management Report-Riverstone East_Rev F.docx
Chapter Title Page
1 Introduction 1
1.1 Objective of report __________________________________________________________________ 1 1.2 Scope of Work _____________________________________________________________________ 1
2 The Physical Environment 2
2.1 The Site __________________________________________________________________________ 2 2.2 Data _____________________________________________________________________________ 4 2.2.1 Topography and Geology _____________________________________________________________ 4 2.2.2 Developed Layout – Indicative Layout Plan (ILP) ___________________________________________ 5 2.2.3 Rainfall Data _______________________________________________________________________ 6 2.3 Additional Information used in the Assessment ____________________________________________ 7 2.3.1 Drainage Information ________________________________________________________________ 7 2.3.2 Cadastre __________________________________________________________________________ 7 2.3.3 Creek Categories ___________________________________________________________________ 7
3 Design Controls 8
3.1 Growth Centres Development Code (October 2006) ________________________________________ 8 3.2 State Environmental Planning Policy (Sydney Region Growth Centres) 2006 _____________________ 8 3.3 NSW Floodplain Development Manual (April 2005) _________________________________________ 8 3.4 Floodplain Risk Management Guideline: Practical Consideration of Climate Change – Department of
Environment and Climate Change (2007) _______________________________________________ 10 3.5 Stream Classifications for the North West Growth Centre ___________________________________ 10 3.6 Australian Rainfall and Runoff – Volume 1 (2001) _________________________________________ 10 3.7 NSW Department of Environment and Heritage ___________________________________________ 10 3.7.1 Managing Urban Stormwater: Environmental Targets ______________________________________ 11 3.7.2 Managing Urban Stormwater: Source Control ____________________________________________ 11 3.7.3 Managing Urban Stormwater: Soils and Construction ______________________________________ 11 3.8 Blacktown City Council (BCC) Control Documents ________________________________________ 12 3.8.1 Blacktown City Council DCP 2006 _____________________________________________________ 12 3.8.2 Blacktown City Council Engineering Guide for Development _________________________________ 12 3.8.3 Blacktown City Council Developer Handbook for Water Sensitive Urban Design _________________ 13 3.8.4 Blacktown City Council Growth Centre Precincts DCP 2010 _________________________________ 13
4 Water Quantity Modelling 14
4.1 Review of Previous Studies __________________________________________________________ 14 4.1.1 Water Sensitive Urban Design and Flooding – Riverstone and Alex Avenue Precincts, GHD 2008 and
Post Exhibition Report 2010 __________________________________________________________ 14 4.1.2 Water Cycle Management – Box Hill/Box Hill Industrial Precinct, JWP 2011 _____________________ 18 4.1.3 Water Cycle Management Strategy & Flood Study – Area 20 Precinct, JWP 2010 ________________ 19 4.1.4 RAFTS Parameters ________________________________________________________________ 20 4.1.5 RAFTS Catchments ________________________________________________________________ 21 4.1.6 Existing Catchment_________________________________________________________________ 22 4.1.7 Lag Links and Model Calibration ______________________________________________________ 25
Contents
Water Cycle Management Report Riverstone East
334311/AU/SYD84/2/E March 2015 P:\Parramatta\Projects\33xxxx\334311\05 DOCUMENTS\5_1 Working Files\Riverstone East\Water Cycle Management & Flood Analysis\334311-150428-Water Cycle Management Report-Riverstone East_Rev F.docx
4.1.8 Existing Model Verification ___________________________________________________________ 26 4.1.9 Developed Catchment ______________________________________________________________ 28 4.1.10 Proposed Development Assumptions___________________________________________________ 30 4.2 Management Strategies _____________________________________________________________ 32 4.2.1 Major/Minor System ________________________________________________________________ 32 4.2.2 Detention Basins __________________________________________________________________ 33 4.3 Results __________________________________________________________________________ 39 4.3.1 Design Discharges _________________________________________________________________ 39 4.3.2 Comparison of Existing and Post-Developed Flows ________________________________________ 39 4.3.3 Probable Maximum Flood ____________________________________________________________ 40 4.3.4 Climate Change Assessment _________________________________________________________ 41
5 Hydraulics 42
5.1 Introduction _______________________________________________________________________ 42 5.2 Existing and Proposed Models ________________________________________________________ 42 5.2.1 TUFLOW Software Package _________________________________________________________ 42 5.2.2 Flood Events _____________________________________________________________________ 42 5.2.3 Hydrologic Data ___________________________________________________________________ 43 5.2.4 Digital Terrain Model _______________________________________________________________ 43 5.2.5 Boundary Conditions _______________________________________________________________ 44 5.2.6 Hydraulic structures (1D ESTRY component) ____________________________________________ 45 5.2.7 Flood Management Strategies ________________________________________________________ 46 5.3 Results __________________________________________________________________________ 47 5.3.1 Flood maps for design events ________________________________________________________ 47 5.3.2 Existing and developed scenario comparison ____________________________________________ 47 5.4 Climate Change ___________________________________________________________________ 48 5.5 Flood Evacuation Strategy ___________________________________________________________ 48 5.6 Comparison of Modelled Results ______________________________________________________ 51
6 Water Quality Modelling 52
6.1 MUSIC Methodology _______________________________________________________________ 52 6.2 Model Parameters _________________________________________________________________ 52 6.2.1 Rainfall Data ______________________________________________________________________ 52 6.2.2 Base Catchment ___________________________________________________________________ 52 6.2.3 Developed Catchment ______________________________________________________________ 58 6.3 Results __________________________________________________________________________ 63 6.3.1 Base Model ______________________________________________________________________ 63 6.3.2 Developed Model __________________________________________________________________ 63
Appendices 64
Appendix A. Drawings ________________________________________________________________________ 65 Appendix B. RAFTS Model Data ________________________________________________________________ 66 Appendix C. Peak Flows from RAFTS ____________________________________________________________ 67 Appendix D. Tuflow Results ____________________________________________________________________ 68 Appendix E. Channel Cross Section Calculations ___________________________________________________ 69
Water Cycle Management Report Riverstone East
334311/AU/SYD84/2/E March 2015 P:\Parramatta\Projects\33xxxx\334311\05 DOCUMENTS\5_1 Working Files\Riverstone East\Water Cycle Management & Flood Analysis\334311-150428-Water Cycle Management Report-Riverstone East_Rev F.docx
1
1.1 Objective of report
This report undertaken by Mott MacDonald (MM) details the procedures used and results obtained from
analyses undertaken in developing the water cycle management strategy for the Riverstone East precinct
and to support the master planning by providing engineering input to assist in the development of an
Indicative Layout Plan (ILP). The strategy has been developed using an integrated approach to flood risk
management and urban design based on water sensitive urban design principles, meeting relevant
standards.
1.2 Scope of Work
The purpose of the analyses was to:
� establish a water cycle management strategy based on water sensitive urban design principles;
� provide input into the development of the riparian corridors assessment;
� provide input into the development of the riparian land management and planning controls;
� undertake a hydrologic, hydraulic and water quality assessment of the precinct as an integrated
approach to flood risk and water cycle management;
� develop a flood evacuation strategy to assist the State Emergency Services in directing residents of the
precinct to during large storm events; and
� undertake concept design and cost analysis of water cycle infrastructure for precinct master planning.
The following analyses have taken into consideration the economical, engineering, environmental and
social aspects of the planning proposal under the draft ILP. Particular emphasis has been placed on
protecting the environment and enhancing the biodiversity of the receiving water bodies and surrounding
environment by implementing water sensitive urban design and best management practices.
The following methodology has been adopted in order to assess the above scope of work:
1. Collate existing site data;
2. Review design controls and requirements;
3. Review previous studies;
4. Undertake hydrologic catchment analysis to compare existing site flows to proposed flows and
determine stormwater detention strategies;
5. Undertake hydraulic modelling to assess the impact the proposed development has on surrounding
environs and determine appropriate modifications required to minimise the impact on surrounding land,
including channel, culvert and detention basin sizing and configuration; and
6. Assess the impact the proposed development has on regional water quality and develop water quality
treatment strategies.
1 Introduction
Water Cycle Management Report Riverstone East
334311/AU/SYD84/2/E March 2015 P:\Parramatta\Projects\33xxxx\334311\05 DOCUMENTS\5_1 Working Files\Riverstone East\Water Cycle Management & Flood Analysis\334311-150428-Water Cycle Management Report-Riverstone East_Rev F.docx
2
2.1 The Site
It is expected that by 2036 Sydney will be home to an additional 1.7 million people. Part of the NSW
government’s plan to meet this need sustainably is the creation of two growth centres in Western Sydney.
The North West Growth Centre (NWGC) located within The Hills, Blacktown and Hawkesbury local
government areas and The South West Growth Centre (SWGC) located within Liverpool, Camden and
Campbelltown local government areas. Combined, these growth centres should provide 181,000 new
dwellings for 500,000 people.
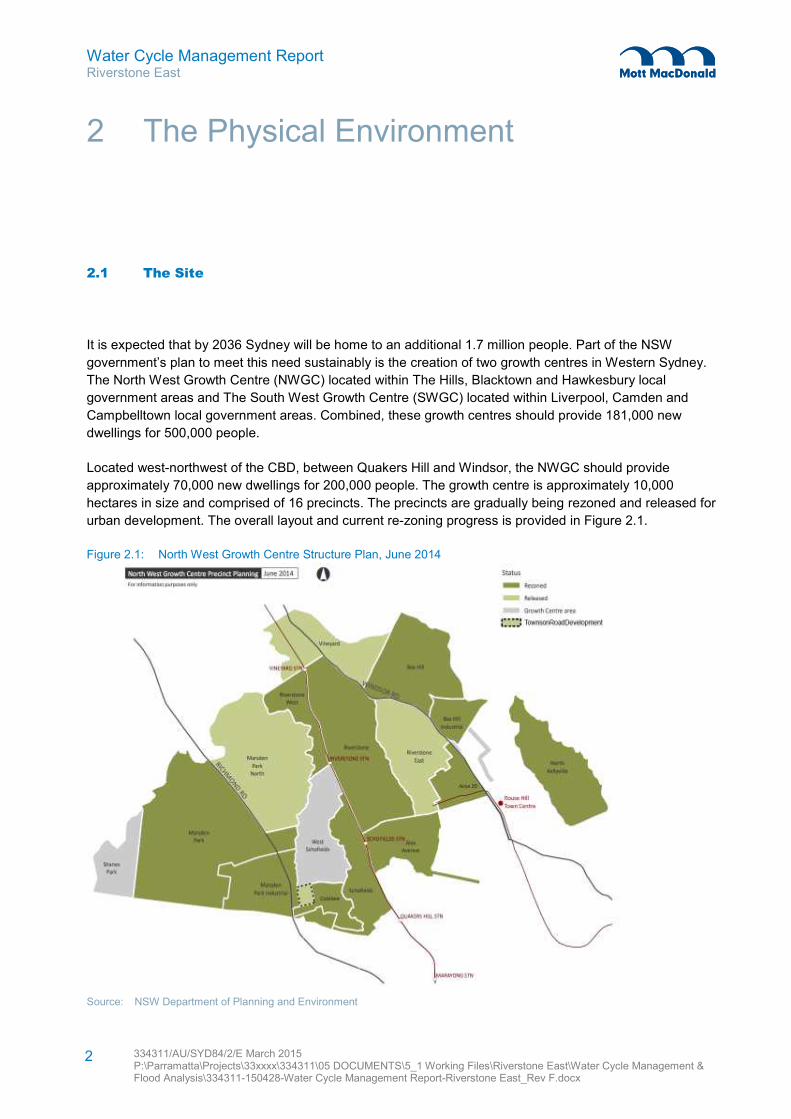
Located west-northwest of the CBD, between Quakers Hill and Windsor, the NWGC should provide
approximately 70,000 new dwellings for 200,000 people. The growth centre is approximately 10,000
hectares in size and comprised of 16 precincts. The precincts are gradually being rezoned and released for
urban development. The overall layout and current re-zoning progress is provided in Figure 2.1.
Figure 2.1: North West Growth Centre Structure Plan, June 2014
Source: NSW Department of Planning and Environment
2 The Physical Environment
Water Cycle Management Report Riverstone East
334311/AU/SYD84/2/E March 2015 P:\Parramatta\Projects\33xxxx\334311\05 DOCUMENTS\5_1 Working Files\Riverstone East\Water Cycle Management & Flood Analysis\334311-150428-Water Cycle Management Report-Riverstone East_Rev F.docx
3
The NWGC is currently serviced by the Richmond rail line, and two major roads, Richmond and Winsor
road. At the south eastern end of the growth centre, the M7 may be readily accessed. In addition, works
are underway for the future North West Rail Link (NWRL).The NWRL is proposed to connect to the
Richmond line at Vineyard station and run southeast though the Box Hill precinct to the major regional
centre, Rouse Hill. From Rouse Hill, the Northwest Rail link is proposed to continue through to Bella Vista,
Castle Hill, Macquarie Park and finally, the Chatswood interchange providing easy access to employment.
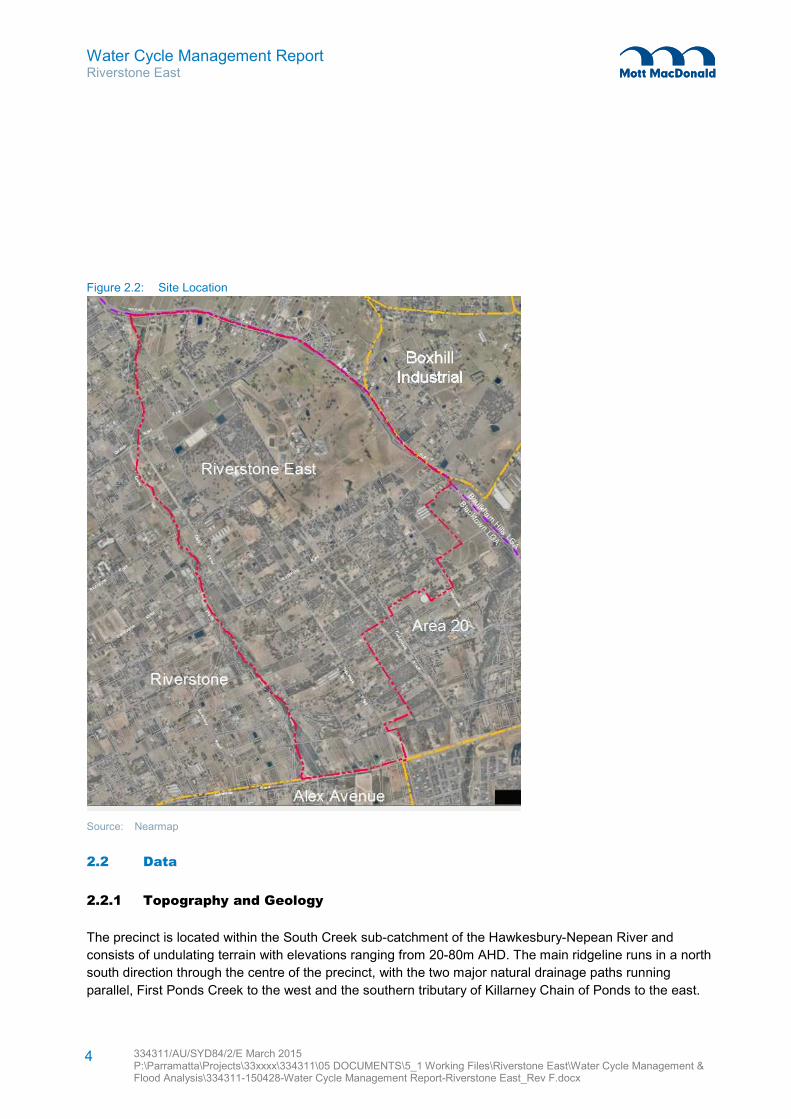
The Riverstone East precinct is located towards the eastern side of the NWGC and is bounded by Windsor
Rd to the north east, First Ponds creek to the west, Schofields Rd to the south and the precinct Area 20 to
the south east. The surrounding precincts are Box Hill, Box Hill Industrial, Alex Avenue, Riverstone and
Area 20 as shown in Figure 2.1 (above).
Riverstone East is part of the Blacktown Local Government area and is approximately 656 hectares in size.
Currently, it is predominately used for rural purposes, although once developed it is intended to provide
approximately 5,800 dwellings for 15,000 people. Most of the land to be developed however, 110 hectares
have being set aside to become part of Rouse Hill Regional Park and limited development is possible
along the riparian corridors which are subject to flooding.
Two major flow paths convey runoff for the precinct, First Ponds Creek and a southern tributary of the
Killarney Chain of Ponds; both of which direct flows north, crossing the site boundary through formal
drainage structures at Windsor Road.
Water Cycle Management Report Riverstone East
334311/AU/SYD84/2/E March 2015 P:\Parramatta\Projects\33xxxx\334311\05 DOCUMENTS\5_1 Working Files\Riverstone East\Water Cycle Management & Flood Analysis\334311-150428-Water Cycle Management Report-Riverstone East_Rev F.docx
4
Figure 2.2: Site Location
Source: Nearmap
2.2 Data
2.2.1 Topography and Geology
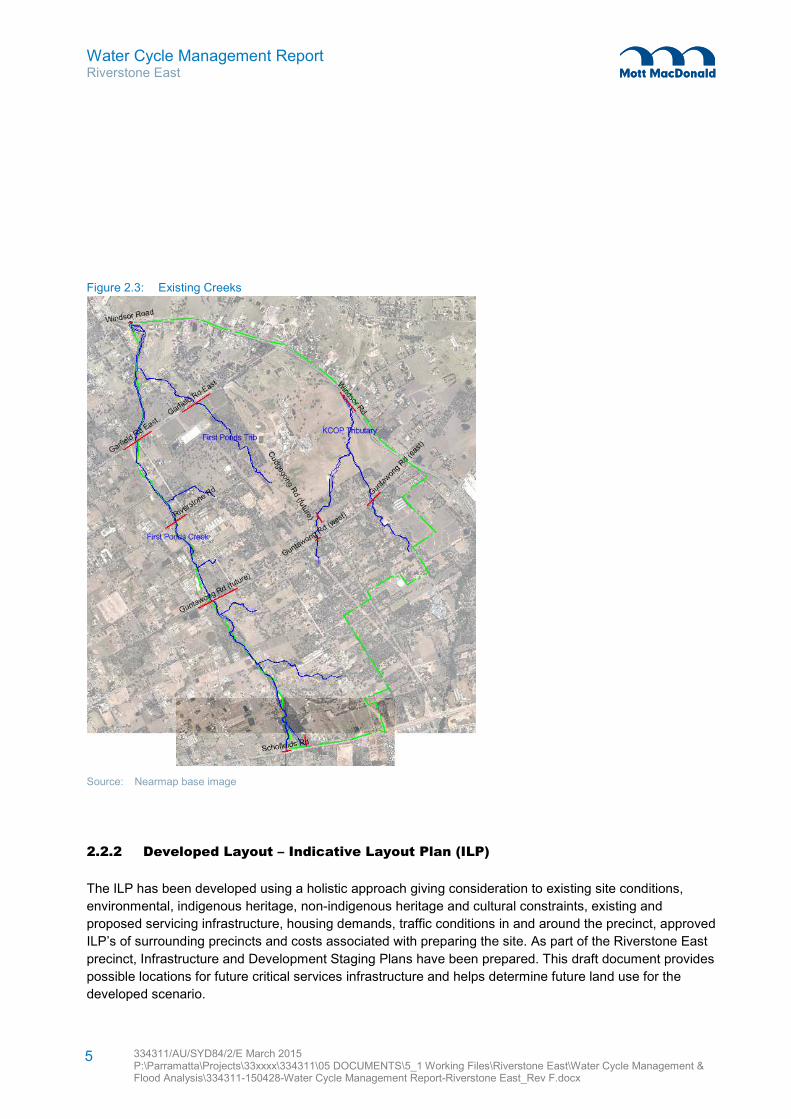
The precinct is located within the South Creek sub-catchment of the Hawkesbury-Nepean River and
consists of undulating terrain with elevations ranging from 20-80m AHD. The main ridgeline runs in a north
south direction through the centre of the precinct, with the two major natural drainage paths running
parallel, First Ponds Creek to the west and the southern tributary of Killarney Chain of Ponds to the east.
Water Cycle Management Report Riverstone East
334311/AU/SYD84/2/E March 2015 P:\Parramatta\Projects\33xxxx\334311\05 DOCUMENTS\5_1 Working Files\Riverstone East\Water Cycle Management & Flood Analysis\334311-150428-Water Cycle Management Report-Riverstone East_Rev F.docx
5
Figure 2.3: Existing Creeks
Source: Nearmap base image
2.2.2 Developed Layout – Indicative Layout Plan (ILP)
The ILP has been developed using a holistic approach giving consideration to existing site conditions,
environmental, indigenous heritage, non-indigenous heritage and cultural constraints, existing and
proposed servicing infrastructure, housing demands, traffic conditions in and around the precinct, approved
ILP’s of surrounding precincts and costs associated with preparing the site. As part of the Riverstone East
precinct, Infrastructure and Development Staging Plans have been prepared. This draft document provides
possible locations for future critical services infrastructure and helps determine future land use for the
developed scenario.
Water Cycle Management Report Riverstone East
334311/AU/SYD84/2/E March 2015 P:\Parramatta\Projects\33xxxx\334311\05 DOCUMENTS\5_1 Working Files\Riverstone East\Water Cycle Management & Flood Analysis\334311-150428-Water Cycle Management Report-Riverstone East_Rev F.docx
6
An additional driver of the indicative layout plan is the arterial road network. A preliminary road hierarchy
plan supplied by ARUP has allowed the development of a flood evacuation plan and improved compatibility
with water-cycle and flood hazard management principles. According to the road hierarchy plan Garfield
Road East will function as the major east-west thoroughfare, with Clarke Street and Tallawong Road
identified as future sub-arterial roads for north-south travel. Design of local and collector roads will be
guided by the information in this and other preliminary reports, and be documented in the Indicative Layout
Plan.
A common objective of the Water Cycle Management Strategy and the Infrastructure and Development
Staging Plan is to precede the planning process and feed robust engineering information into planners to
enable a considered Indicative Layout Plan.
2.2.3 Rainfall Data
2.2.3.1 Rainfall Records
The water quality analysis required historical rainfall data recorded, by a pluviograph station. The Liverpool
(Whitlam Centre) pluviograph recording station which is situated approximately 11km south of the
Blacktown LGA is the recommended rainfall data to be used by Council. Historical rainfall records for the
area were obtained from the Bureau of Meteorology as follows:
Table 2.1: Liverpool (Whitlam Centre) Base Pluviograph Data
Station No. Location Records Data Interval
067035 Liverpool (Whitlam Centre) 1967 - 1976 6 minute
Source: Bureau of Meteorology
2.2.3.2 Intensity-Frequency-Duration (IFD)
Rainfall intensities were calculated within the XP-RAFTS model using the automatic storm generator tool.
The tool requires input of the nine raw coefficients which were obtained from the Bureau of Meteorology’s
IFD calculator, based on the geographical coordinates.
Table 2.2 below provides a summary of the coefficients used.
Table 2.2: Bureau of Meteorology – IFD Coefficients
Intensity (mm/hr)
50 year 1 hour 58.5 2 year 1 hour 30.05
50 year 1 hour 13.04 2 year 1 hour 6.72
50 year 1 hour 4.57 2 year 1 hour 1.86
Geographic Factors
f50 15.82 f2 4.3
Water Cycle Management Report Riverstone East
334311/AU/SYD84/2/E March 2015 P:\Parramatta\Projects\33xxxx\334311\05 DOCUMENTS\5_1 Working Files\Riverstone East\Water Cycle Management & Flood Analysis\334311-150428-Water Cycle Management Report-Riverstone East_Rev F.docx
7
Intensity (mm/hr)
Location Skew
0.02
Source: Bureau of Meteorology
2.3 Additional Information used in the Assessment
2.3.1 Drainage Information
The flooding conditions on the site have potential to become worse under a developed scenario due to
increases in impervious areas. A number of existing roads may be directly impacted as a result. Windsor
Road, owned by the Roads and Maritime Services (RMS), is an arterial road and a designated flood
evacuation route. As such, it is required to maintain service up to and including the 500 year storm event.
Information on existing drainage culverts beneath Windsor Road have been provided by RMS. Where
information was not available, including on other roads within the precinct, site inspections were
undertaken to measure culvert information, including size, type and approximate length.
2.3.2 Cadastre
Existing cadastre and lot information, along with notable easements including Endeavour Energy and
TransGrid overhead transmission line easements were provided by the Department of Planning and
Environment. Information was provided in GIS format.
2.3.3 Creek Categories
Information on the existing creek locations and alignments, categories and riparian setbacks was provided
by Ecological Australia.
Water Cycle Management Report Riverstone East
334311/AU/SYD84/2/E March 2015 P:\Parramatta\Projects\33xxxx\334311\05 DOCUMENTS\5_1 Working Files\Riverstone East\Water Cycle Management & Flood Analysis\334311-150428-Water Cycle Management Report-Riverstone East_Rev F.docx
8
3.1 Growth Centres Development Code (October 2006)
This code establishes the process of precinct planning for the growth centres including a framework for the
development of the Indicative Layout Plan. This document ensures that the technical analyses necessary
to produce specific planning controls are carried out within the context of the formulation of an Indicative
Layout Plan so that the appropriate infrastructure will support future development.
3.2 State Environmental Planning Policy (Sydney Region Growth Centres) 2006
This legislation provides a set of controls on the planning process and on the development of land within
the growth centre to ensure that changes to land use can be achieved with positive economic, cultural and
ecological effects, improving the amenity of the growth centre area for future development. Of particular
relevance to this report, the legislation ensures the availability of effective flood evacuation routes, limits
any development with detrimental flood hazard impacts and maintains the overall sustainability of the water
cycle.
3.3 NSW Floodplain Development Manual (April 2005)
The NSW Government’s Floodplain Development Manual – the Management of Flood Liable Land (2005)
is concerned with the management of the consequences of flooding as they relate to the human
occupation of urban and rural developments. The manual outlines the floodplain risk management process
and assigns roles and responsibilities for the various stakeholders.
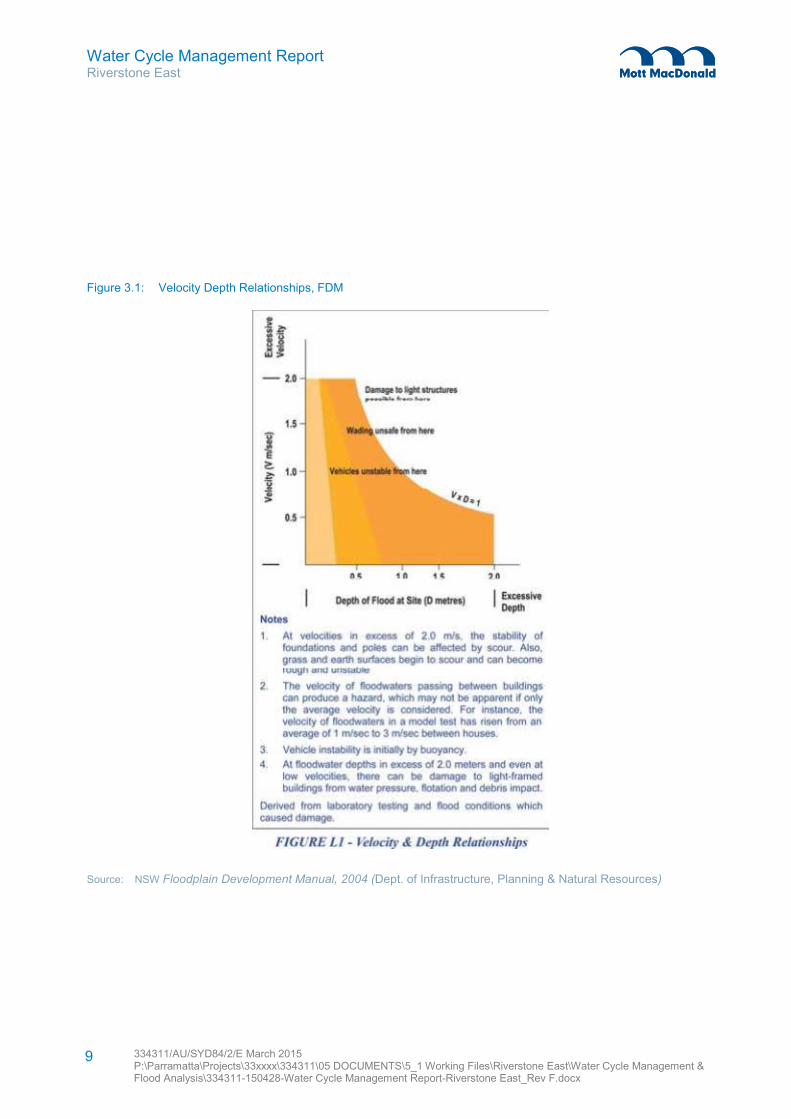
The manual applies to the development, in particular in Appendix L – Hydraulic and Hazard Categorisation
for ensuring safe overland flow paths are provided (see Figure L1 below).
3 Design Controls
Water Cycle Management Report Riverstone East
334311/AU/SYD84/2/E March 2015 P:\Parramatta\Projects\33xxxx\334311\05 DOCUMENTS\5_1 Working Files\Riverstone East\Water Cycle Management & Flood Analysis\334311-150428-Water Cycle Management Report-Riverstone East_Rev F.docx
9
Figure 3.1: Velocity Depth Relationships, FDM
Source: NSW Floodplain Development Manual, 2004 (Dept. of Infrastructure, Planning & Natural Resources)
Water Cycle Management Report Riverstone East
334311/AU/SYD84/2/E March 2015 P:\Parramatta\Projects\33xxxx\334311\05 DOCUMENTS\5_1 Working Files\Riverstone East\Water Cycle Management & Flood Analysis\334311-150428-Water Cycle Management Report-Riverstone East_Rev F.docx
10
3.4 Floodplain Risk Management Guideline: Practical Consideration of Climate
Change – Department of Environment and Climate Change (2007)
This guideline is designed to be used in addition to the Floodplain Development Manual (2005) and
provides recommendations and methodologies for examining flood risk to developments in light of the
projected impacts of climate change on sea levels and design rainfall events. The report recommends that
sensitivity analysis is undertaken to using 10, 20 and 30% increases to rainfall intensities, with an
appropriate level adopted based on the outcomes of this analysis. Previous studies on surrounding
precincts have adopted a percentage increase of approximately 15% of average.
3.5 Stream Classifications for the North West Growth Centre
The NSW Office of Water supplies stream order classification for the identification and management of
river ecosystems. The classifications of streams and the associated controls on development activities aim
to preserve riparian buffer zones which contribute to the improvement in the health of river ecosystems and
the reduction of erosion and potential flooding. Additional information was provided by Ecological Australia.
3.6 Australian Rainfall and Runoff – Volume 1 (2001)
Prepared by the Institution of Engineers, Australia Australian Rainfall and Runoff – A Guide to Flood
Estimation was written to “provide Australian designers with the best available information on design flood
estimation”. It contains procedures for estimating stormwater runoff for a range of catchments and rainfall
events and design methods for urban stormwater drainage systems.
According to the document, good water management master planning should take into account:
� hydrological and hydraulic processes;
� land capabilities;
� present and future land uses;
� public attitudes and concerns;
� environmental matters;
� costs and finances; and
� legal obligations and other aspects.
3.7 NSW Department of Environment and Heritage
The NSW Department of Environment and Heritage, formerly The Department of Environment and Climate
Change (DECC), and the NSW Environment Protection Authority (EPA) has developed a set of guidelines
known as the Managing Urban Stormwater (MUS) series. The set of guidelines includes:
� Managing Urban Stormwater: Council Handbook;
� Environmental targets;
� Managing Urban Stormwater: Source Control;
� Managing Urban Stormwater: Soils & Construction; and
� Managing Urban Stormwater: Harvesting and Reuse.
Water Cycle Management Report Riverstone East
334311/AU/SYD84/2/E March 2015 P:\Parramatta\Projects\33xxxx\334311\05 DOCUMENTS\5_1 Working Files\Riverstone East\Water Cycle Management & Flood Analysis\334311-150428-Water Cycle Management Report-Riverstone East_Rev F.docx
11
3.7.1 Managing Urban Stormwater: Environmental Targets
The NSW Department of Environment and Climate Change (DECC) encourages the principle of no net
deterioration of water quality. Under its former name, the NSWEPA, the DECC published Managing Urban
Stormwater: Environmental Targets, outlining recommended environmental targets for stormwater
management in new urban developments. These treatment objectives, along with those outlined in
Blacktown City Council’s engineering guidelines, have been shown in the below table:
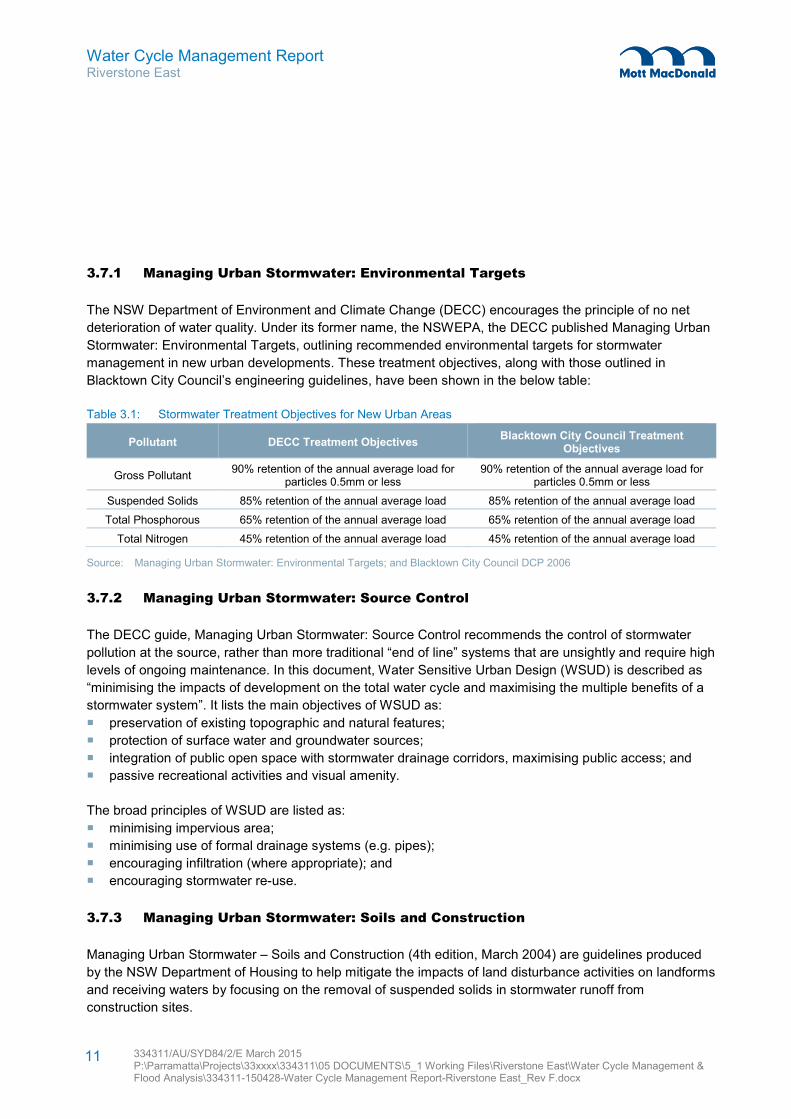
Table 3.1: Stormwater Treatment Objectives for New Urban Areas
Pollutant DECC Treatment Objectives Blacktown City Council Treatment
Objectives
Gross Pollutant 90% retention of the annual average load for
particles 0.5mm or less 90% retention of the annual average load for
particles 0.5mm or less
Suspended Solids 85% retention of the annual average load 85% retention of the annual average load
Total Phosphorous 65% retention of the annual average load 65% retention of the annual average load
Total Nitrogen 45% retention of the annual average load 45% retention of the annual average load
Source: Managing Urban Stormwater: Environmental Targets; and Blacktown City Council DCP 2006
3.7.2 Managing Urban Stormwater: Source Control
The DECC guide, Managing Urban Stormwater: Source Control recommends the control of stormwater
pollution at the source, rather than more traditional “end of line” systems that are unsightly and require high
levels of ongoing maintenance. In this document, Water Sensitive Urban Design (WSUD) is described as
“minimising the impacts of development on the total water cycle and maximising the multiple benefits of a
stormwater system”. It lists the main objectives of WSUD as:
� preservation of existing topographic and natural features;
� protection of surface water and groundwater sources;
� integration of public open space with stormwater drainage corridors, maximising public access; and
� passive recreational activities and visual amenity.
The broad principles of WSUD are listed as:
� minimising impervious area;
� minimising use of formal drainage systems (e.g. pipes);
� encouraging infiltration (where appropriate); and
� encouraging stormwater re-use.
3.7.3 Managing Urban Stormwater: Soils and Construction
Managing Urban Stormwater – Soils and Construction (4th edition, March 2004) are guidelines produced
by the NSW Department of Housing to help mitigate the impacts of land disturbance activities on landforms
and receiving waters by focusing on the removal of suspended solids in stormwater runoff from
construction sites.

Water Cycle Management Report Riverstone East
334311/AU/SYD84/2/E March 2015 P:\Parramatta\Projects\33xxxx\334311\05 DOCUMENTS\5_1 Working Files\Riverstone East\Water Cycle Management & Flood Analysis\334311-150428-Water Cycle Management Report-Riverstone East_Rev F.docx
12
According to the guide, effective soil and water management during construction involves the following key
principles:
� assess the soil and water implications of development at the subdivision or site planning stage
(including salinity and acid sulphate soils);
� plan for erosion and sediment control concurrently with engineering design and before the land
disturbance begins;
� minimise the area of soil disturbed;
� conserve topsoil for subsequent rehabilitation/revegetation;
� control surface runoff from upstream areas, as well as through the development site;
� rehabilitate disturbed lands as quickly as possible; and
� maintain soil and water management measures appropriately during, and after the construction phase
until the disturbed land is fully stabilised.
3.8 Blacktown City Council (BCC) Control Documents
3.8.1 Blacktown City Council DCP 2006
An integral part of the master planning process for developments, the Blacktown City Council DCP 2006
provides the necessary controls for the redevelopment of the site. Particular water management
requirements include:
� compliance with Council’s Engineering Design Guide for Development;
� compliance with the demands of the BASIX system; and
� adoption of the principles of WSUD (including a water cycle management plan).
3.8.2 Blacktown City Council Engineering Guide for Development
Council’s Engineering Guide for Development sets out their requirements for the design of stormwater
drainage for urban and rural areas. The Engineering Design Guide outlines the broad objectives of the
policy of:
� retention of the natural stormwater system where possible;
� a high level of safety for all users;
� acceptable levels of amenity and protection from the impact of flooding;
� consideration given to the effect of floods greater than the design flood;
� a controlled rate of discharge to reduce downstream flooding impacts;
� protection of the environment from adverse impacts as a result of the development;
� maintenance of and enhancement of the regional water quality;
� sustainability of infrastructure; and
� economy of construction and maintenance.
The policy also provides detailed requirements for the hydrologic and hydraulic design and analyses of the
developed water management system including standard calculation factors and drawings.

Water Cycle Management Report Riverstone East
334311/AU/SYD84/2/E March 2015 P:\Parramatta\Projects\33xxxx\334311\05 DOCUMENTS\5_1 Working Files\Riverstone East\Water Cycle Management & Flood Analysis\334311-150428-Water Cycle Management Report-Riverstone East_Rev F.docx
13
3.8.3 Blacktown City Council Developer Handbook for Water Sensitive Urban Design
Council’s Developer Handbook for Water Sensitive Urban Design sets out their requirements for the design
of water quality management systems to assist in mitigating the impact of urban development on local
waterways within the area. The handbook also provides Council’s modelling guidelines for the use of
MUSIC modelling software.
3.8.4 Blacktown City Council Growth Centre Precincts DCP 2010
The Department of Planning and Environment’s Growth Centre Precincts Development Control Plan sets
out their specific controls and design principles for the development of land within the growth centre
precincts in addition to the requirements of Council’s Engineering Guide for Development.
Water Cycle Management Report Riverstone East
334311/AU/SYD84/2/E March 2015 P:\Parramatta\Projects\33xxxx\334311\05 DOCUMENTS\5_1 Working Files\Riverstone East\Water Cycle Management & Flood Analysis\334311-150428-Water Cycle Management Report-Riverstone East_Rev F.docx
14
The assessment of water quantity was completed through hydrological and hydraulic modelling. Computer
based models of the existing and developed catchments were constructed using XP-RAFTS. Design
storms were applied to these models to give estimates of the 2, 20, 100, 200 and 500 year ARI discharges
as well as discharge from the probable maximum precipitation (PMP), which are examined in the following
sections. Assessment of these models then allowed the sizing and configuration of proposed detention
basins and the documentation of their requirements. Assessment was also undertaken on the existing
basin sizes.
4.1 Review of Previous Studies
4.1.1 Water Sensitive Urban Design and Flooding – Riverstone and Alex Avenue
Precincts, GHD 2008 and Post Exhibition Report 2010
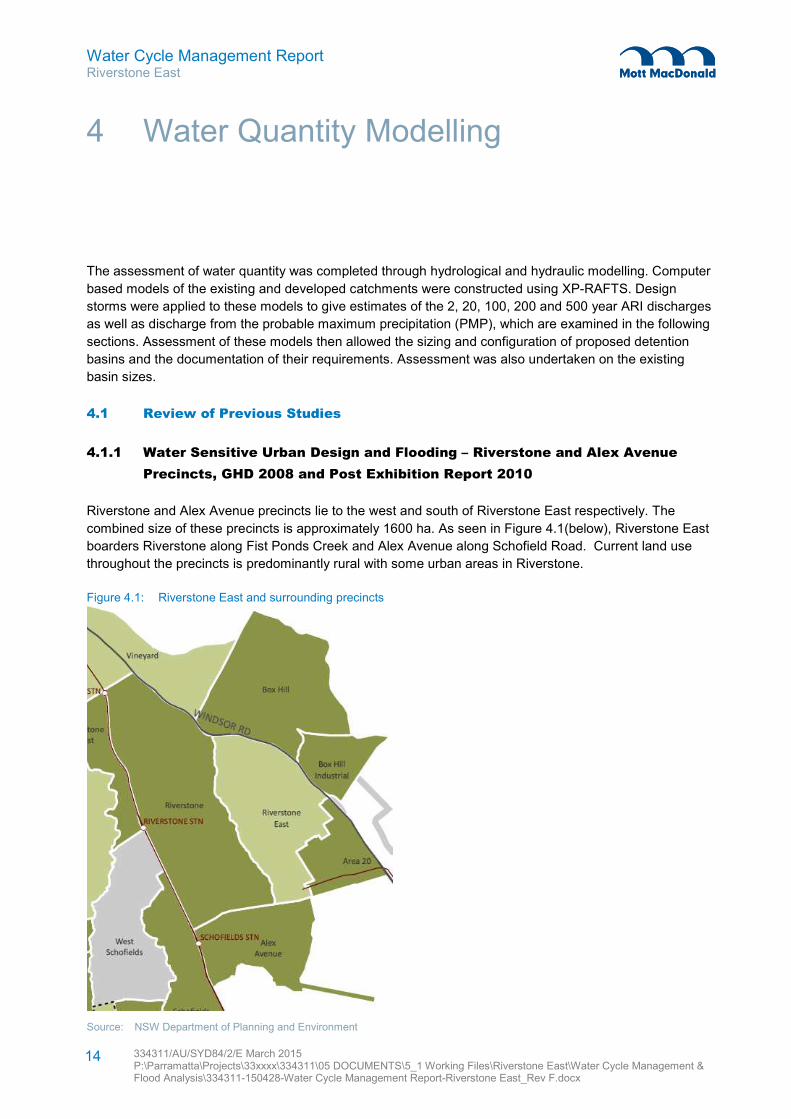
Riverstone and Alex Avenue precincts lie to the west and south of Riverstone East respectively. The
combined size of these precincts is approximately 1600 ha. As seen in Figure 4.1(below), Riverstone East
boarders Riverstone along Fist Ponds Creek and Alex Avenue along Schofield Road. Current land use
throughout the precincts is predominantly rural with some urban areas in Riverstone.
Figure 4.1: Riverstone East and surrounding precincts
Source: NSW Department of Planning and Environment
4 Water Quantity Modelling
Water Cycle Management Report Riverstone East
334311/AU/SYD84/2/E March 2015 P:\Parramatta\Projects\33xxxx\334311\05 DOCUMENTS\5_1 Working Files\Riverstone East\Water Cycle Management & Flood Analysis\334311-150428-Water Cycle Management Report-Riverstone East_Rev F.docx
15
In September 2008, GHD prepared a Water Sensitive Urban Design and Flooding (WSUD) report for
Riverstone and Alex Avenue. The report was later superseded by the Post Exhibition study in 2010. The
2008 WSUD strategy made a number of proposals for the management of water quality and quantity
including: Vegetated swales, detention/bio-retentions basins, public wetlands including a frog habitat, gross
pollutant traps and a flood evacuation strategy for PMF inundated areas.
GHD developed a one-dimensional XP-Rafts model of the Riverstone catchment area for the Riverstone
and Alex Avenue precincts using Mike 11 software. Annual recurrence intervals of 2, 4, 10, 20 and 100
years with durations of 25 minutes to 9 hours were considered. The area included in this modelling
comprised two distinct catchments, one catchment discharging to Eastern Creek and the other to First
Ponds Creek. Water quality modelling was carried out in MUSIC.
An existing scenario was modelled hydraulically by GHD for comparison with a developed scenario which
incorporated information from the indicative layout plan (ILP) for the future development of the Riverstone
and Alex Avenue precincts. Recommendations were made as to locations and sizing of online and offline
basins to attenuate the post development flows back to the flow rates determined in the existing scenario
model.
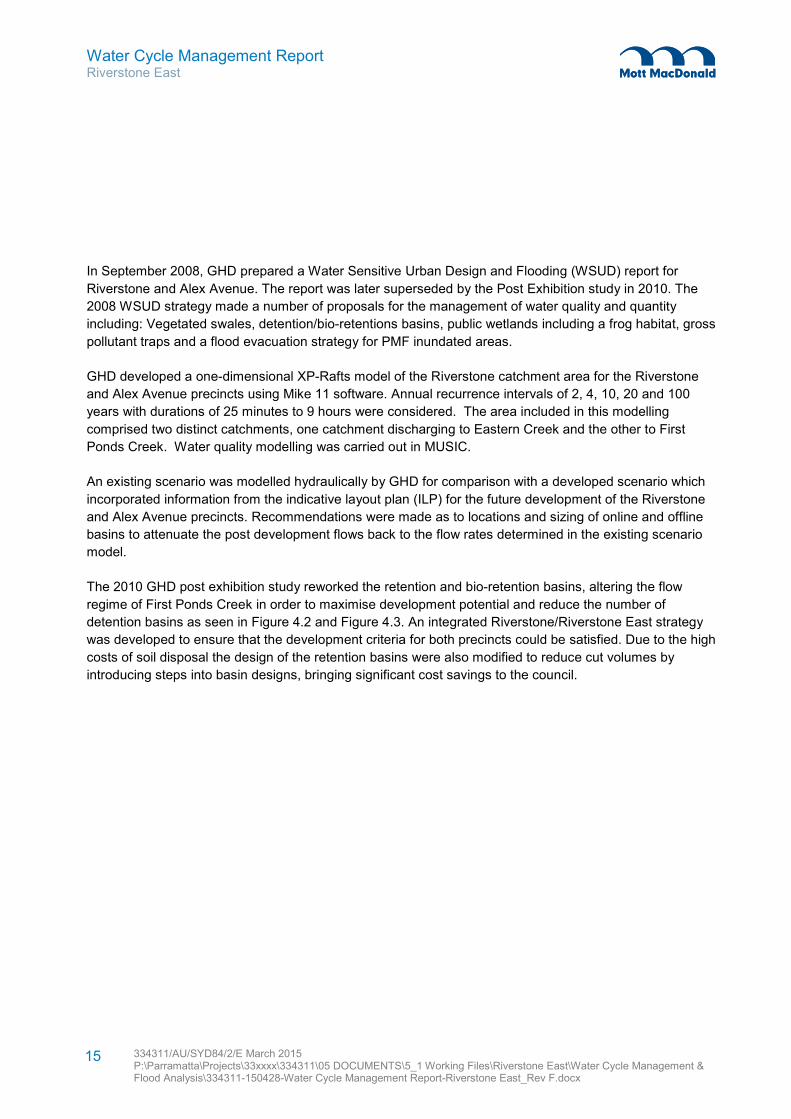
The 2010 GHD post exhibition study reworked the retention and bio-retention basins, altering the flow
regime of First Ponds Creek in order to maximise development potential and reduce the number of
detention basins as seen in Figure 4.2 and Figure 4.3. An integrated Riverstone/Riverstone East strategy
was developed to ensure that the development criteria for both precincts could be satisfied. Due to the high
costs of soil disposal the design of the retention basins were also modified to reduce cut volumes by
introducing steps into basin designs, bringing significant cost savings to the council.
Water Cycle Management Report Riverstone East
334311/AU/SYD84/2/E March 2015 P:\Parramatta\Projects\33xxxx\334311\05 DOCUMENTS\5_1 Working Files\Riverstone East\Water Cycle Management & Flood Analysis\334311-150428-Water Cycle Management Report-Riverstone East_Rev F.docx
16
Figure 4.2: Riverstone: Stromwater Management Strategy with Online Basins
Source: Riverstone Alex Avenue – GHD Draft Post Exhibition Flooding
Water Cycle Management Report Riverstone East
334311/AU/SYD84/2/E March 2015 P:\Parramatta\Projects\33xxxx\334311\05 DOCUMENTS\5_1 Working Files\Riverstone East\Water Cycle Management & Flood Analysis\334311-150428-Water Cycle Management Report-Riverstone East_Rev F.docx
17
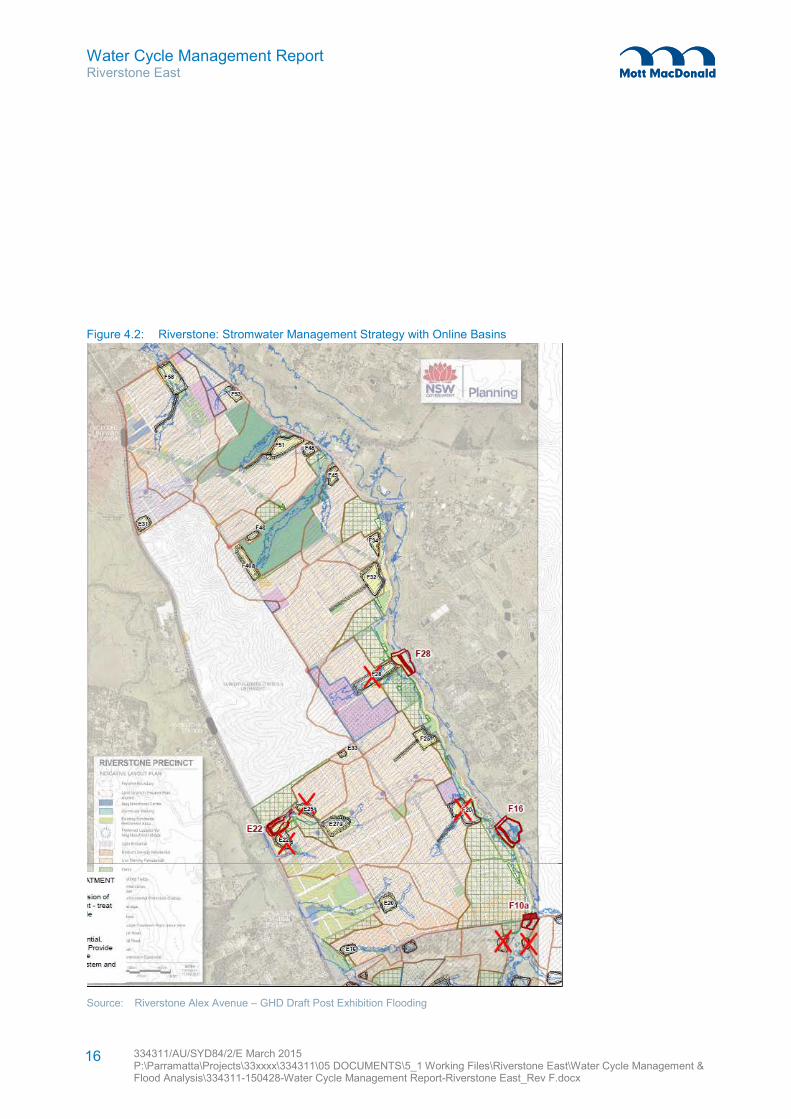
Figure 4.3: Alex Avenue – Stormwater Management Strategy with Online Basins
Source: Riverstone Alex Avenue – GHD Draft Post Exhibition Flooding
The integrated Riverstone and Riverstone East analysis gave consideration to the Riverstone East
development potential and draft basin strategies were developed however these were to be reassessed in
more detail during the preparation of the Riverstone East ILP.
The report recommended a series of offline and online detention basins for the precincts. Most importantly
four approved online detention basins were proposed, two of which are located online to First Ponds Creek
and are designed to accommodate developed flows from both Riverstone and Riverstone East, these
proposed online basins may be seen in Figure 4.2 and have been reviewed as part of this (MM) report.
Water Cycle Management Report Riverstone East
334311/AU/SYD84/2/E March 2015 P:\Parramatta\Projects\33xxxx\334311\05 DOCUMENTS\5_1 Working Files\Riverstone East\Water Cycle Management & Flood Analysis\334311-150428-Water Cycle Management Report-Riverstone East_Rev F.docx
18
Finally, the potential impacts of climate change were originally not taken into consideration in 2008 report
due to the preliminary nature of the study. This short fall was amended in the post exhibition report. The
revised storm water quantity management system was subjected to flood modelling with increased rainfalls
and flows of 20% and ~25% respectively, future proofing the region.
4.1.2 Water Cycle Management – Box Hill/Box Hill Industrial Precinct, JWP 2011
The Box Hill and Box Hill Industrial precincts border Riverstone East to the north east along Windsor road
as seen in Figure 4.1. The precincts cover an area of 974 hectares including 133 hectares of employment
land, 118 of which is industrial. The sites are expected to provide 9,900 new dwellings for 29,700 people.
To support the increased population, the precincts will feature a new town centre, 3 villages, new schools,
major road upgrades, new pedestrian and cycle ways. On the 5 of April 2013, the Box Hill precincts were
rezoned for urban development.
In 2011 J. Wyndham Prince (JWP) produced a Water Cycle Management Plan (WCMP) for the Box Hill
and Box Hill Industrial Precincts. The exhibition process received a number of submissions from land
owners and government agencies resulting in changes to the Indicative layout plan (ILP). The revised ILP
required a revaluation of the WCMP, which was performed by JWP in 2012.
For the 2011 WCMP, JWP developed a one and two-dimensional flood model for the existing and
proposed scenarios. Comparison was made between existing and proposed models for the 100 year ARI
and PMF depth profile maps. This was done to ensure that flooding was not worsened by development.
To manage flooding and water quality the WCMP included 11 detention basins, 21 bio-retention basins,
gross pollutant traps and 3kL water tanks on each lot.
In 2012, JWP re-analysed the new developed case for the 100 year ARI 2012 and produced the revised
WCMP report. This report detailed a number of amendments to the flow regime of Killarney Chain of
Ponds to manage the water cycle and address both quality and quantity targets for the precinct. Most
notably, two basins were removed and three others were increased in size to compensate. The report
identified areas where filling of the precinct could be achieved to maximise the developable land while
addressing flood risk.
The hydrologic and hydraulic modelling discussed in the JWP 2012 report provided flow rates at various
points along the Killarney Chain of Ponds and First Ponds Creek. These have been referenced in this
report for model calibration and parameter comparison purposes. This has been discussed in greater detail
in Section 5.
It is important to note that the developed scenario for the Box Hill/Box Hill Industrial precinct has assumed
an undeveloped upstream catchment for the Killarney Chain of Ponds southern tributary. A large portion of
the catchment for this tributary is within the Riverstone East precinct (upstream of Windsor Rd). Therefore
any changes to the flow regime in the tributary as a result of development in the Riverstone East precinct
could not increase the flood levels or flow rates in this tributary. This constraint on the southern tributary
flows from the Riverstone East precinct supported the need for flood mitigating works within the precinct.

Water Cycle Management Report Riverstone East
334311/AU/SYD84/2/E March 2015 P:\Parramatta\Projects\33xxxx\334311\05 DOCUMENTS\5_1 Working Files\Riverstone East\Water Cycle Management & Flood Analysis\334311-150428-Water Cycle Management Report-Riverstone East_Rev F.docx
19
4.1.3 Water Cycle Management Strategy & Flood Study – Area 20 Precinct, JWP
2010
In 2010 JWP prepared Water Cycle Management Strategy for the Department of Planning which included
a flood study for the Area 20 precinct. Area 20, is 245 ha in size and boarders Riverstone East along the
south eastern boundary (Figure 4.1). This boundary is roughly defined by a natural ridge line which also
separates the major catchments. A single catchment extends over the majority of Area 20 and drains to
Second Ponds Creek.
Continuing from prior work, JWP modified a XP-Rafts model originally created by Jacobs (then Sinclair
Knights Merz) to include the Area 20 site. The XP-Rafts output was subsequently used in a 1D, HEC-RAS
model to determine the PMF levels. Annual recurrence intervals of 2, 20 and 100 years were considered.
Area 20 lies within a much larger catchment where regional storm water management strategy has been
implemented, known as the Rouse Hill Stage 1 Trunk Drainage Strategy. Under this strategy, no
additional retention basins should be required. JWP was able to affirm this assumption through their
model. However, 13 bio-retention basins were still required for water quality purposes.
A comparison of existing and developed flood models showed that the urbanisation of the precinct would
reduce flood levels both for Area 20 and downstream sites. This reduction is due to a decrease in peak
flow rates of the urbanised catchment.
Any flows from Area 20 into Riverstone East were not considered by the JWS model, but have been
accounted for in the Riverstone East ILP 2014 model. These flows are minor and originate from differences
between the precinct boundaries and the major catchment boundaries. The major flows from Area 20 drain
through Second Ponds Creek to Smalls creek to Cattai Creek which flows away from the Riverstone East
precinct. Thus, the major flows from Area 20 will not have any impact on Riverstone East and the small
flows are considered in the Riverstone East ILP 2014 Model. Hydrological Model
The hydrological modelling for the Riverstone East precinct was undertaken using XP-RAFTS software to
determine the critical flows generated from the contributing catchments. The catchments contributing to the
study area were modelled within XP-RAFTS to determine the runoff hydrographs to be used as inflows in
the 2D terrain flood model. These flows were compared with results extracted from the approved GHD
(2010) study for verification of the XP-RAFTS modelling.
Water Cycle Management Report Riverstone East
334311/AU/SYD84/2/E March 2015 P:\Parramatta\Projects\33xxxx\334311\05 DOCUMENTS\5_1 Working Files\Riverstone East\Water Cycle Management & Flood Analysis\334311-150428-Water Cycle Management Report-Riverstone East_Rev F.docx
20
4.1.4 RAFTS Parameters
The user data inputs required by XP-RAFTS include catchment areas and slopes, pervious and impervious
areas, IFD rainfall statistics and hydrological losses. Guidelines for determining these parameters are
provided in the Australian Rainfall and Runoff (I.E Aust, 2001) and are broken up as follows:
4.1.4.1 Slopes
A three-dimensional (3D) surface was produced from aerial survey (LiDAR) data supplied by the
Department of Planning and Environment using 3D modelling software. A slope analysis was performed on
the 3D surface to determine slope profiles across the precinct. These slopes were used as the basis for the
determination of runoff flow paths and catchment areas.
4.1.4.2 Impervious Catchment Areas
For the existing scenario modelling, the areas of roads, pavements and structures were measured off
aerial photographs to determine the proportion of each catchment to be treated as impervious. For the
developed scenario the values recommended in the BCC Growth Centre Precincts Development Control
Plan 2010 were adopted since these reflect the developed land use as documented in the draft ILP and
are Council’s preferred parameters.
The North West Rail Link stabling yard has not been considered as developed for either the existing or
proposed scenarios. It is expected that the existing scenario would comprise a worst case and any future
development would modify flows through detention to have a ‘no worse or better’ impact on flows. This is
explored later in the report for the Alex Avenue Precinct which has a greater potential to influence flows.
The findings have been applied to NWRL catchment.
4.1.4.3 Intensity-Frequency-Duration (IFD)
Rainfall determined described in Section 2.2.3.2
4.1.4.4 Rainfall Losses
The loss model used to estimate rainfall excess in the development of design flow hydrographs was the
Initial Loss-Continuing Loss model. Parameters have been adopted based on a combination of site
investigations, modelling undertaken by others on surrounding Precincts and best engineering practice.
The following initial loss-continuing loss parameters were utilised within the model:
� an Initial Loss of 15mm and a Continuing Loss of 2.0mm/hour for pervious areas; and
� an Initial Loss of 2.5mm and a Continuing Loss of 0.0mm/hour for impervious areas.
Water Cycle Management Report Riverstone East
334311/AU/SYD84/2/E March 2015 P:\Parramatta\Projects\33xxxx\334311\05 DOCUMENTS\5_1 Working Files\Riverstone East\Water Cycle Management & Flood Analysis\334311-150428-Water Cycle Management Report-Riverstone East_Rev F.docx
21
4.1.4.5 Land Use
Aerial photographs provided information on current land use for the modelling of runoff in the existing
scenario. The draft Indicative Layout Plan supplied by Cox Richardson was used as the basis for land use
in the developed scenario. GIS information on the extent of the existing Rouse Hill Regional Park and the
extent of the proposed dedicated green space adjacent was provided by the Department of Planning and
Environment.
4.1.4.6 Hydraulic Roughness Parameters
Hydraulic roughness parameters for the catchments were estimated based upon site inspections and
discussions with Blacktown City Council, and were applied in accordance with recommendations in AR&R.
Manning’s values we applied to the model based on the land use of each sub-catchment.
In the existing scenario, a Manning’s roughness parameter of 0.04 was adopted for the pervious and 0.025
for the impervious portion component of all ‘undeveloped’ land,
The proposed scenario adopted the same parameters for the areas of unchanged land use (land remaining
undeveloped) and new values were adopted for the land area that is proposed for new land uses. A
Manning’s roughness parameter of 0.035 was applied to the pervious component while 0.015 was applied
to the proposed impervious component, this is to allow for increases in runoff efficiency due to pervious
areas being connected by streamlined drainage networks (such as pipes/roads).
4.1.4.7 B-Multiplier
The b-multiplier (b) used in XP-RAFTS is the coefficient used to calibrate a model to fit observed rainfall
and stream flow data/recorded floods. The existing and proposed models both adopted a default ‘b’ value
of 1.0 and no further calibration was deemed necessary based on comparisons with other approved
models (refer section 4.1.8).
4.1.5 RAFTS Catchments
Hydrologic modelling was carried out using the XP-RAFTS software package (XP Software, 2013). XP-
RAFTS is a non-linear runoff routing model that generates runoff hydrographs from rainfall.
An overall catchment is divided into a network of sub-catchments joined by links. The links represent
natural watercourses, artificial channels, or pipes. Rainfall is applied to each sub-catchment. Losses
(representing infiltration, interception, etc.) are subtracted from the rainfall and the excess is then
converted into an instantaneous flow. This instantaneous flow is then routed through the sub-area storages
to develop local sub-catchment hydrographs. Total flow hydrographs at various nodes in the drainage
network are calculated by combining local hydrographs. Hydrographs are transported through the drainage
network by time lagging or channel routing. Hydrographs may also be routed through the storage basins
such as dams or detention basins.
Water Cycle Management Report Riverstone East
334311/AU/SYD84/2/E March 2015 P:\Parramatta\Projects\33xxxx\334311\05 DOCUMENTS\5_1 Working Files\Riverstone East\Water Cycle Management & Flood Analysis\334311-150428-Water Cycle Management Report-Riverstone East_Rev F.docx
22
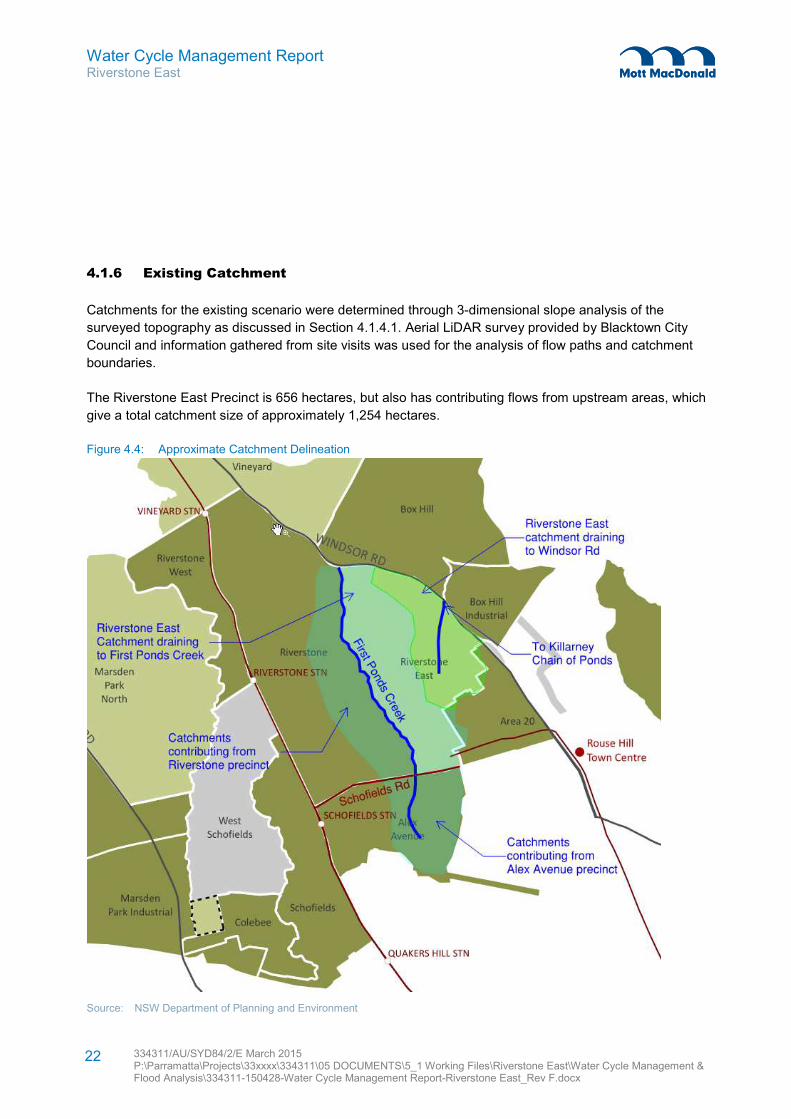
4.1.6 Existing Catchment
Catchments for the existing scenario were determined through 3-dimensional slope analysis of the
surveyed topography as discussed in Section 4.1.4.1. Aerial LiDAR survey provided by Blacktown City
Council and information gathered from site visits was used for the analysis of flow paths and catchment
boundaries.
The Riverstone East Precinct is 656 hectares, but also has contributing flows from upstream areas, which
give a total catchment size of approximately 1,254 hectares.
Figure 4.4: Approximate Catchment Delineation
Source: NSW Department of Planning and Environment
Water Cycle Management Report Riverstone East
334311/AU/SYD84/2/E March 2015 P:\Parramatta\Projects\33xxxx\334311\05 DOCUMENTS\5_1 Working Files\Riverstone East\Water Cycle Management & Flood Analysis\334311-150428-Water Cycle Management Report-Riverstone East_Rev F.docx
23
As described previously, First Ponds Creek runs from south-west to north-east along the western boundary
of the site, conveying runoff from the Riverstone and Alex Avenue growth centre precincts to the Killarney
Chain of Ponds. This major water course has a series of smaller tributaries contributing runoff to the major
channel, most of which will remain in the post-development scenario. A crest running south to north
through the eastern part of the precinct, splits a small portion of the precinct towards Windsor Road to the
east. The below figure shows roughly how the catchments within and external to the precinct drain.
The existing Riverstone East catchment has been divided into approximately 78 sub-catchments. These
sub-catchments range in size from 2.4 to 32.4 hectares (refer to Appendix B). The sub-catchments east of
the ridgeline naturally adjoin the Killarney Chain of Ponds system at various points and eventually
discharge to a large pond at the northern boundary of the Vineyard precinct. West of the ridgeline, the sub-
catchments fall to the west and also find a series of small tributaries that discharge to the main Eastern
Creek line.
Modelling results in the following sections of this report will determine the extent of additional detention
volumes and other required water cycle control measures to ensure the overall discharge from the post
development scenario does not exceed the overall site discharges in the existing scenario at the outlet of
the development precinct.
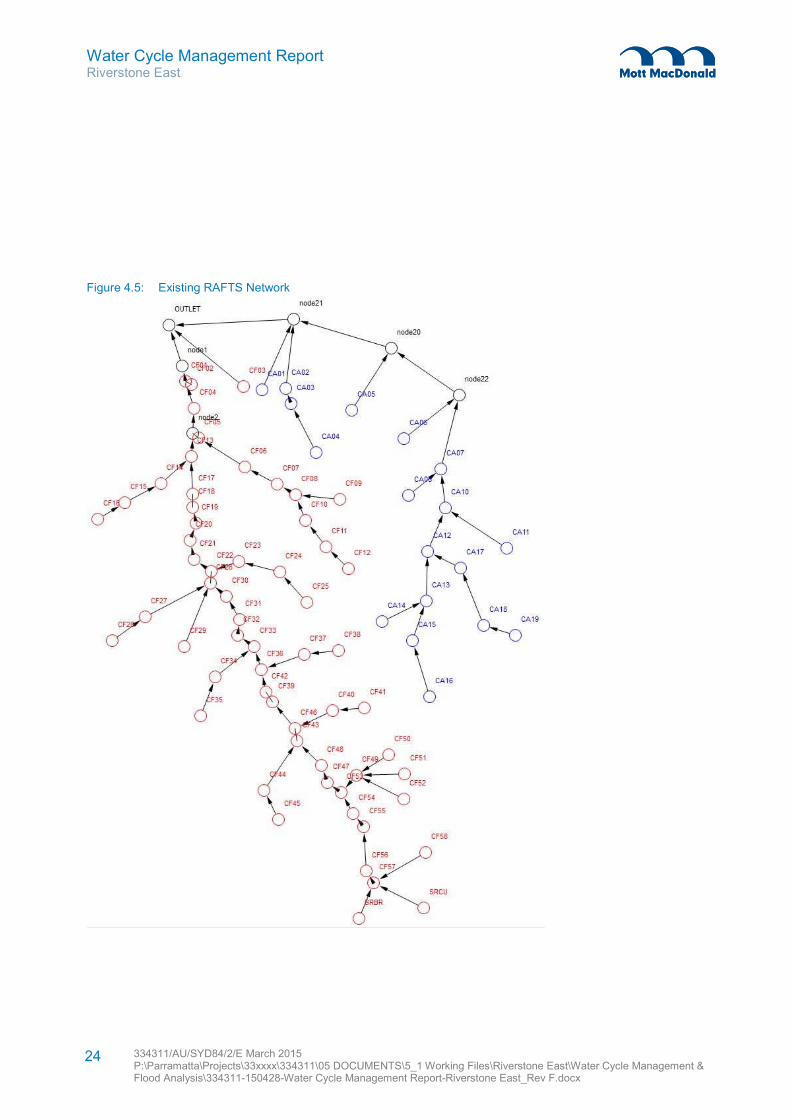
Figure 4.5 represents the existing network within XPRAFTS. The division of catchments was based upon
the overland flow paths and existing road and drainage networks. Overland flow paths generally match the
drainage and riparian corridors specified by the relevant authorities. Refer to the Water Cycle plans in
Appendix A For further details including the catchment plan. The catchments coloured in ‘red’ are directly
associated with First Ponds Creek and the catchments coloured in ‘blue’ relate specifically to Killarney
Chain of Ponds.
As both the Riverstone and Alex Avenue Precincts drain through the Riverstone East Precinct, they have
been considered as part of the assessment. The Riverstone model has been rebuilt as part of this study to
verify flows obtained in the GHD model, and confirm online basin sizing. Generally all parameters have
been maintained with the exception of manning’s roughness parameters. The Alex Avenue precinct has
been assessed as an existing ‘worst case’, as any development would be required to have a no worse or
better discharging flow. A sensitivity analysis was undertaken on the Alex Avenue Precinct to determine if
any cumulative impacts may occur under a proposed scenario. This is explored later in the report.
Water Cycle Management Report Riverstone East
334311/AU/SYD84/2/E March 2015 P:\Parramatta\Projects\33xxxx\334311\05 DOCUMENTS\5_1 Working Files\Riverstone East\Water Cycle Management & Flood Analysis\334311-150428-Water Cycle Management Report-Riverstone East_Rev F.docx
24
Figure 4.5: Existing RAFTS Network
Water Cycle Management Report Riverstone East
334311/AU/SYD84/2/E March 2015 P:\Parramatta\Projects\33xxxx\334311\05 DOCUMENTS\5_1 Working Files\Riverstone East\Water Cycle Management & Flood Analysis\334311-150428-Water Cycle Management Report-Riverstone East_Rev F.docx
25
Site investigations have confirmed that the existing catchment has a combination of minor and major
stormwater infrastructure in place to assist in conveyance of surface flows to their respective outlets.
The pre-developed RAFTS model was subsequently formulated by incorporating the following:
� “Catchment Nodes” were used to represent each of the 78 sub-catchments. Here, each node is
representative of the catchment and is divided into both pervious and impervious values (Refer
Appendix B);
� “Dummy Nodes” were used where two or more existing sub-catchments joined, which allowed both
inflow and outflow hydrographs to be assessed.
� “Lag Links” were used as the links between the nodes and were modelled to provide the travel time (in
minutes) for the peak flow to travel the length of this reach. The method for determining the lag link
times is discussed in Section 4.1.7 below.
The following additional assumptions/comments are also provided:
� No minor pipe networks have been modelled in the RAFTS model;
� External catchments which are directed through the site have been included as part of the assessment.
This includes flows from the Riverstone and Alex Avenue Precincts;
� Existing dams are assumed to be full so as not to cause any attenuation of flows. This would result in a
worst case existing scenario.
4.1.7 Lag Links and Model Calibration
Lagging links were developed (through the below iterations) to ensure a more accurate representation of
hydrograph phasing was achieved in the model.
The procedure for determining the lag times was based on an iterative process which re-rationalised the
links based on actual flow velocities generated by the catchment. The methodology is described below;
� Lag times (in minutes) were initially derived from conservative estimates of flow velocities through the
active floodway and floodplain. The RAFTS model was run with these estimations and the resulting
flow hydrographs were then applied to the 2D TUFLOW hydraulic model.
� As TUFLOW determines storm flow runoff characteristics from the physical topography, stream flow
velocities were able to be accurately measured along each of the major flow paths. After examining the
flow velocities across the precinct, an average velocity of 0.60m/s was adopted for First Ponds Creek &
Killarney Chain of Ponds. 0.35m/s was adopted for the First Ponds Creek Tributary.
� The adopted precinct flow velocity (m/s) was then converted to a lag time (in minutes) for each lag link
based on the known catchment flow path lengths (m). From this, revised XP-RAFTS lag link times were
calculated and returned into the model.
Water Cycle Management Report Riverstone East
334311/AU/SYD84/2/E March 2015 P:\Parramatta\Projects\33xxxx\334311\05 DOCUMENTS\5_1 Working Files\Riverstone East\Water Cycle Management & Flood Analysis\334311-150428-Water Cycle Management Report-Riverstone East_Rev F.docx
26
4.1.8 Existing Model Verification
4.1.8.1 Previous Studies
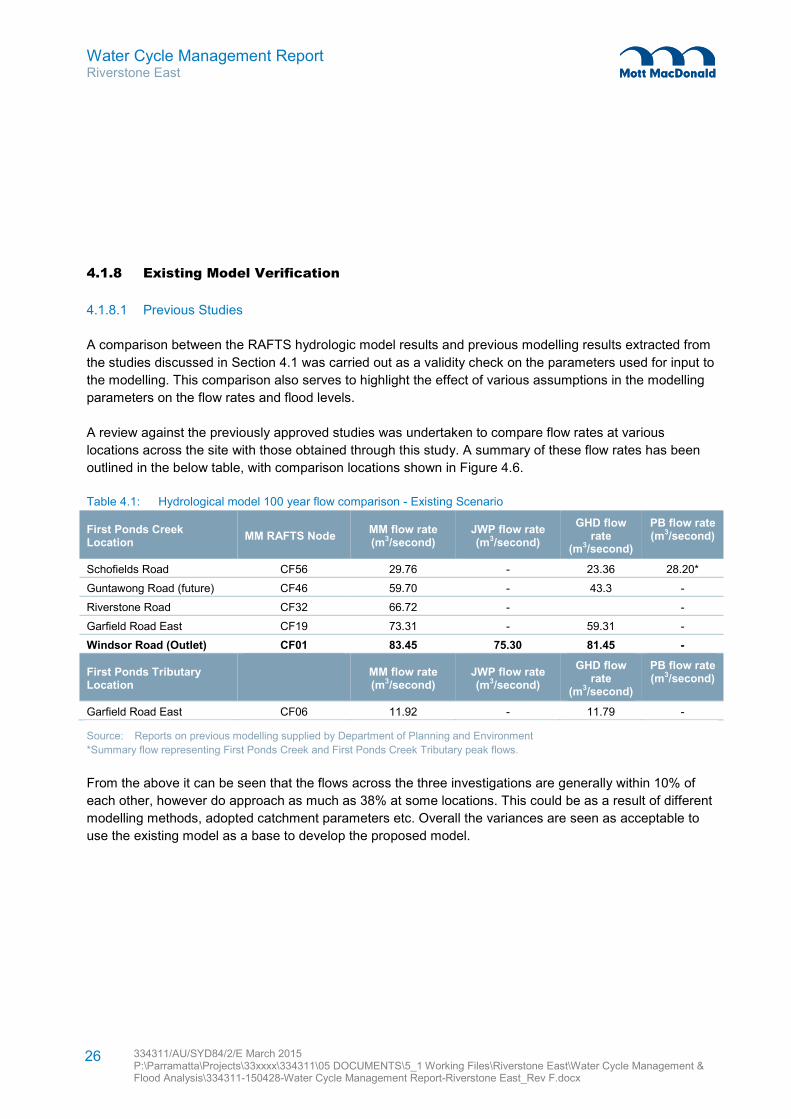
A comparison between the RAFTS hydrologic model results and previous modelling results extracted from
the studies discussed in Section 4.1 was carried out as a validity check on the parameters used for input to
the modelling. This comparison also serves to highlight the effect of various assumptions in the modelling
parameters on the flow rates and flood levels.
A review against the previously approved studies was undertaken to compare flow rates at various
locations across the site with those obtained through this study. A summary of these flow rates has been
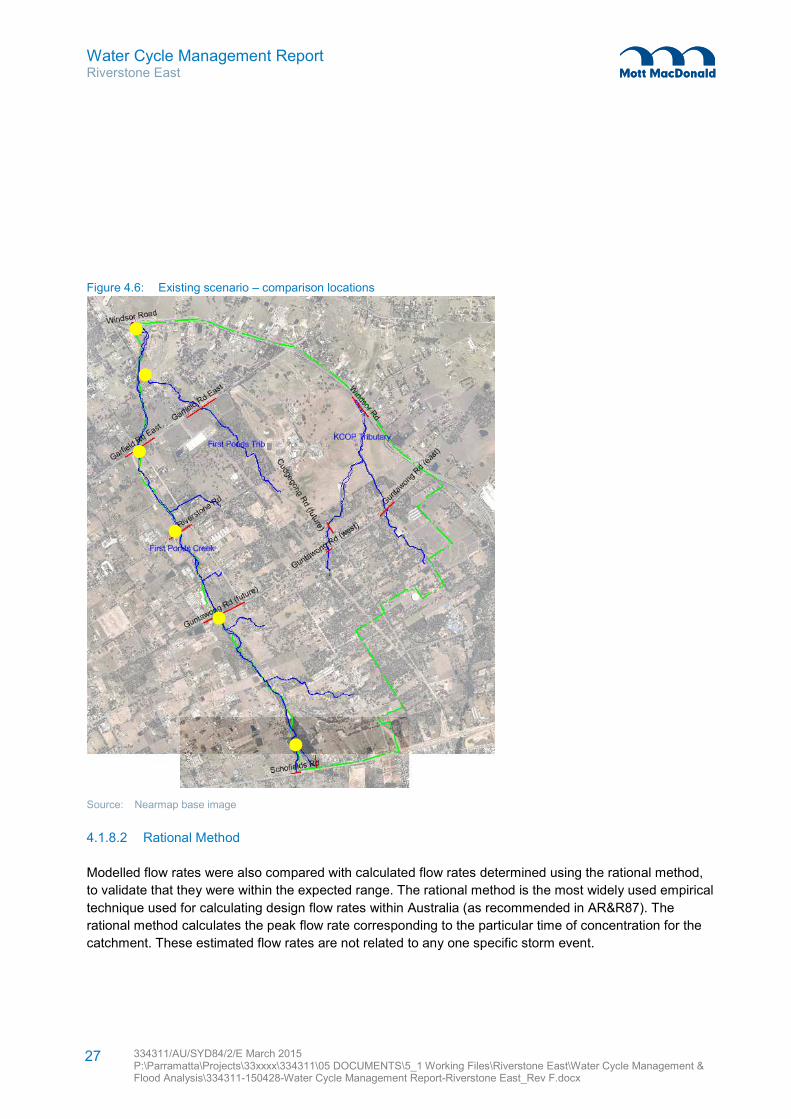
outlined in the below table, with comparison locations shown in Figure 4.6.
Table 4.1: Hydrological model 100 year flow comparison - Existing Scenario
First Ponds Creek Location
MM RAFTS Node MM flow rate (m3/second)
JWP flow rate (m3/second)
GHD flow rate
(m3/second)
PB flow rate (m3/second)
Schofields Road CF56 29.76 - 23.36 28.20*
Guntawong Road (future) CF46 59.70 - 43.3 -
Riverstone Road CF32 66.72 - -
Garfield Road East CF19 73.31 - 59.31 -
Windsor Road (Outlet) CF01 83.45 75.30 81.45 -
First Ponds Tributary Location
MM flow rate (m3/second)
JWP flow rate (m3/second)
GHD flow rate
(m3/second)
PB flow rate (m3/second)
Garfield Road East CF06 11.92 - 11.79 -
Source: Reports on previous modelling supplied by Department of Planning and Environment
*Summary flow representing First Ponds Creek and First Ponds Creek Tributary peak flows.
From the above it can be seen that the flows across the three investigations are generally within 10% of
each other, however do approach as much as 38% at some locations. This could be as a result of different
modelling methods, adopted catchment parameters etc. Overall the variances are seen as acceptable to
use the existing model as a base to develop the proposed model.
Water Cycle Management Report Riverstone East
334311/AU/SYD84/2/E March 2015 P:\Parramatta\Projects\33xxxx\334311\05 DOCUMENTS\5_1 Working Files\Riverstone East\Water Cycle Management & Flood Analysis\334311-150428-Water Cycle Management Report-Riverstone East_Rev F.docx
27
Figure 4.6: Existing scenario – comparison locations
Source: Nearmap base image
4.1.8.2 Rational Method
Modelled flow rates were also compared with calculated flow rates determined using the rational method,
to validate that they were within the expected range. The rational method is the most widely used empirical
technique used for calculating design flow rates within Australia (as recommended in AR&R87). The
rational method calculates the peak flow rate corresponding to the particular time of concentration for the
catchment. These estimated flow rates are not related to any one specific storm event.
Water Cycle Management Report Riverstone East
334311/AU/SYD84/2/E March 2015 P:\Parramatta\Projects\33xxxx\334311\05 DOCUMENTS\5_1 Working Files\Riverstone East\Water Cycle Management & Flood Analysis\334311-150428-Water Cycle Management Report-Riverstone East_Rev F.docx
28
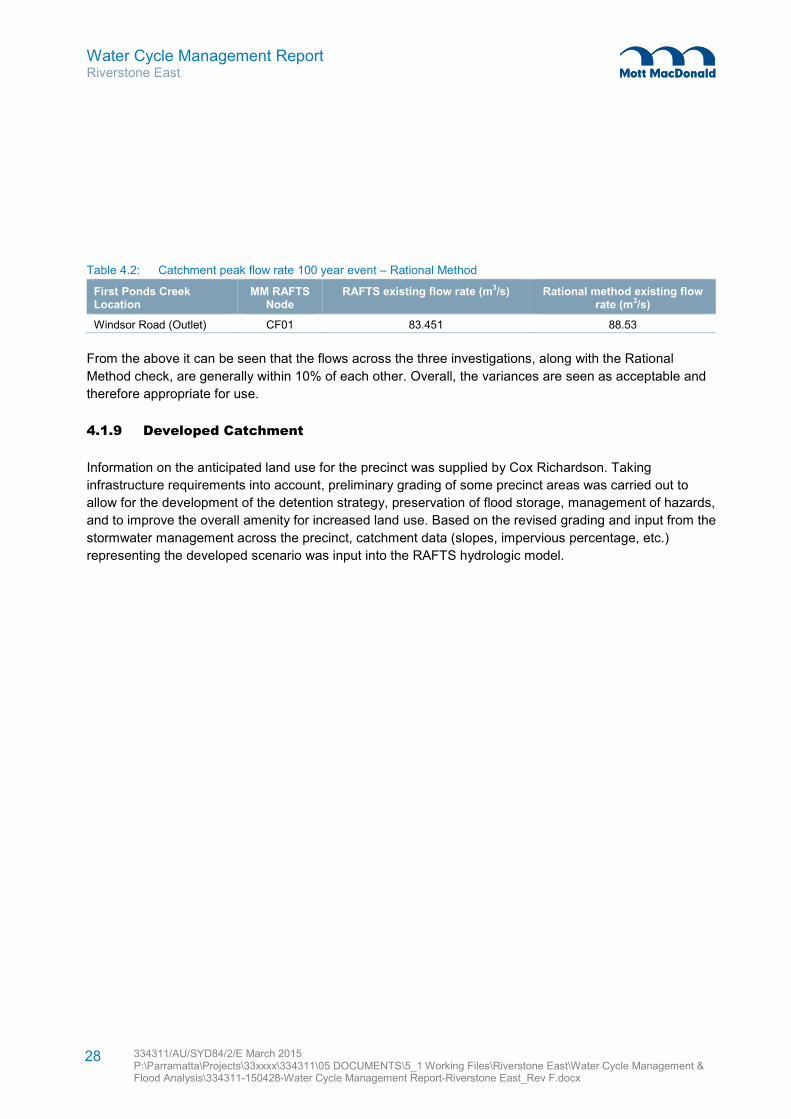
Table 4.2: Catchment peak flow rate 100 year event – Rational Method
First Ponds Creek Location
MM RAFTS Node
RAFTS existing flow rate (m3/s) Rational method existing flow rate (m3/s)
Windsor Road (Outlet) CF01 83.451 88.53
From the above it can be seen that the flows across the three investigations, along with the Rational
Method check, are generally within 10% of each other. Overall, the variances are seen as acceptable and
therefore appropriate for use.
4.1.9 Developed Catchment
Information on the anticipated land use for the precinct was supplied by Cox Richardson. Taking
infrastructure requirements into account, preliminary grading of some precinct areas was carried out to
allow for the development of the detention strategy, preservation of flood storage, management of hazards,
and to improve the overall amenity for increased land use. Based on the revised grading and input from the
stormwater management across the precinct, catchment data (slopes, impervious percentage, etc.)
representing the developed scenario was input into the RAFTS hydrologic model.
Water Cycle Management Report Riverstone East
334311/AU/SYD84/2/E March 2015 P:\Parramatta\Projects\33xxxx\334311\05 DOCUMENTS\5_1 Working Files\Riverstone East\Water Cycle Management & Flood Analysis\334311-150428-Water Cycle Management Report-Riverstone East_Rev F.docx
29
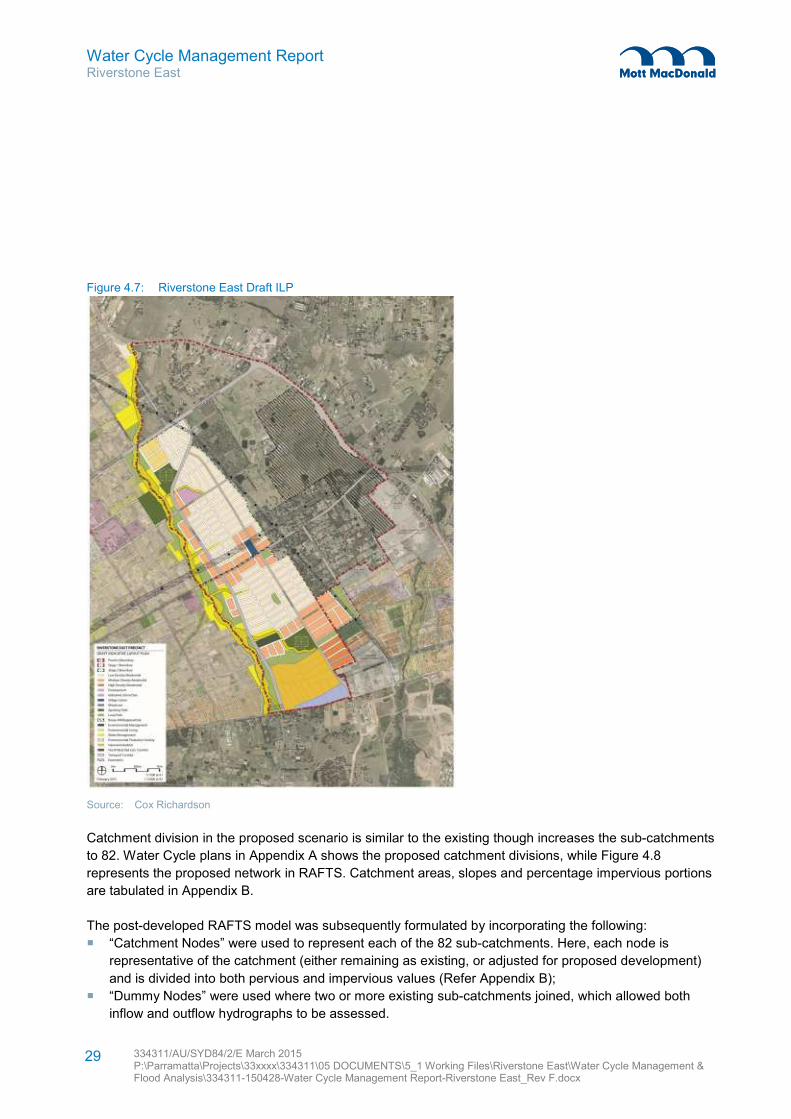
Figure 4.7: Riverstone East Draft ILP
Source: Cox Richardson
Catchment division in the proposed scenario is similar to the existing though increases the sub-catchments
to 82. Water Cycle plans in Appendix A shows the proposed catchment divisions, while Figure 4.8
represents the proposed network in RAFTS. Catchment areas, slopes and percentage impervious portions
are tabulated in Appendix B.
The post-developed RAFTS model was subsequently formulated by incorporating the following:
� “Catchment Nodes” were used to represent each of the 82 sub-catchments. Here, each node is
representative of the catchment (either remaining as existing, or adjusted for proposed development)
and is divided into both pervious and impervious values (Refer Appendix B);
� “Dummy Nodes” were used where two or more existing sub-catchments joined, which allowed both
inflow and outflow hydrographs to be assessed.
Water Cycle Management Report Riverstone East
334311/AU/SYD84/2/E March 2015 P:\Parramatta\Projects\33xxxx\334311\05 DOCUMENTS\5_1 Working Files\Riverstone East\Water Cycle Management & Flood Analysis\334311-150428-Water Cycle Management Report-Riverstone East_Rev F.docx
30
� “Lag Links” were used as the links between the nodes and were modelled to provide the travel time (in
minutes) for the peak flow to travel the length of this reach.
� “Basins” were used to represent the proposed detention basins utilised to ensure there is no increase
to peak flows exiting the overall development, which could potentially have adverse impacts on
downstream properties.
Increases to peak flows within the precinct have been addressed through the design of channels and
appropriate overland flow routes, to minimise potential flood impacts on surrounding land. This is detailed
in the Hydraulics section of the report
4.1.10 Proposed Development Assumptions
A number of assumptions have been made in the development of the existing and proposed modelling
scenarios for the Riverstone East precinct. They are as follows;
� Areas surrounding the stabling yard are assumed to be industrial/ commercial and are to provide their
own on-site detention. As described earlier, the proposed model has accounted for this by adopting the
existing parameters (i.e. no proposed development) in these areas.
� In order to properly assess the development and surrounding environs the Riverstone precinct has
been considered developed. As such in the proposed detention basins from the GHD study have been
included in the MM model. The following basins have been included,
– F16 (Online detention basin)
– F25
– F28 (Online detention basin)
– F32
– F34
� Alex Avenue has been considered undeveloped. The below section describes a sensitivity analysis
which was undertaken on the Precinct to confirm that modelling it this way was appropriate;
� No increase in impervious area was proposed for the Regional Park as such no detention related
specifically to the regional park has been provided. In discussion with Office of Environment and
Heritage (OEH) any future works in the park will be offset with local detention and water quality basins
provided and managed by OEH separate to this proposal.
4.1.10.1 Alex Avenue Precinct
A sensitivity analysis was undertaken to assess any variances between the flows developed in this study
for the Alex Avenue Precinct and those from the GHD study prepared as part of the Alex Avenue Precinct
Planning process. This study adopted an existing scenario as a worst case, assuming that the proposed
would be ‘no worse or better’. The below table shows that the changes in the peak flow fluctuate for
various storms, noting however, that the overall peak flow from the Mott MacDonald model is greater than
the overall peak flow from the GHD model.
Water Cycle Management Report Riverstone East
334311/AU/SYD84/2/E March 2015 P:\Parramatta\Projects\33xxxx\334311\05 DOCUMENTS\5_1 Working Files\Riverstone East\Water Cycle Management & Flood Analysis\334311-150428-Water Cycle Management Report-Riverstone East_Rev F.docx
31
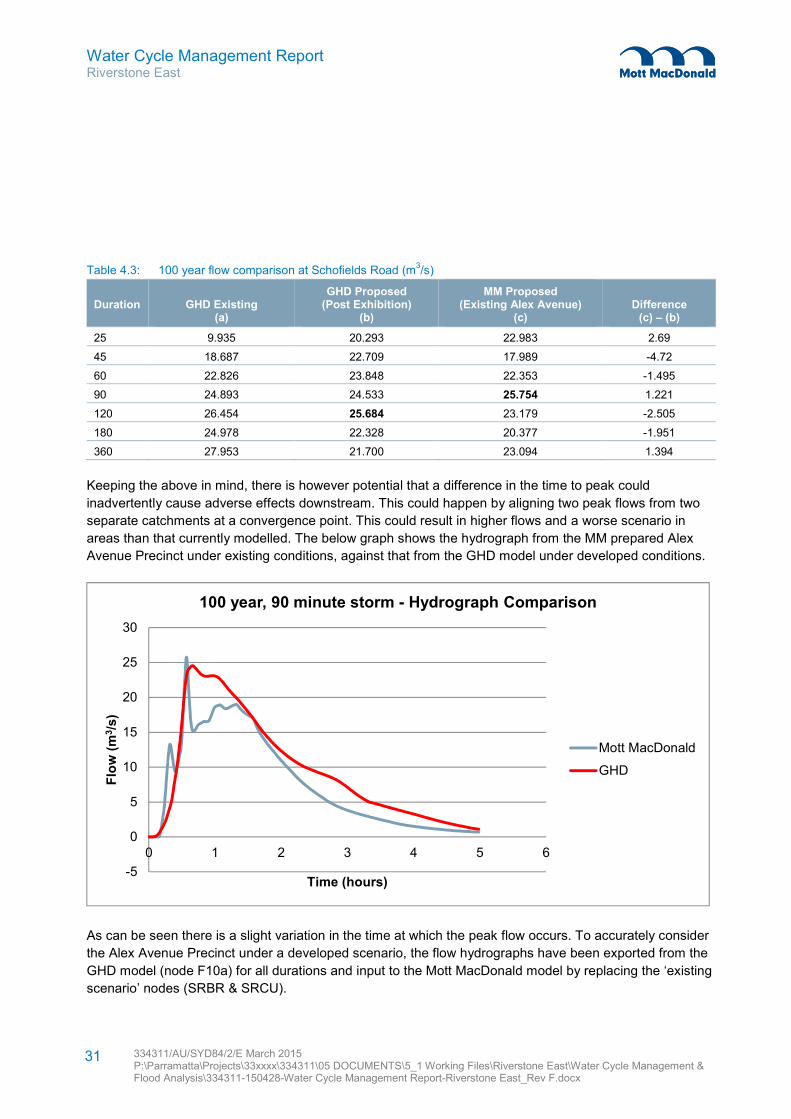
Table 4.3: 100 year flow comparison at Schofields Road (m3/s)
Duration GHD Existing (a)
GHD Proposed (Post Exhibition)
(b)
MM Proposed (Existing Alex Avenue)
(c) Difference
(c) – (b)
25 9.935 20.293 22.983 2.69
45 18.687 22.709 17.989 -4.72
60 22.826 23.848 22.353 -1.495
90 24.893 24.533 25.754 1.221
120 26.454 25.684 23.179 -2.505
180 24.978 22.328 20.377 -1.951
360 27.953 21.700 23.094 1.394
Keeping the above in mind, there is however potential that a difference in the time to peak could
inadvertently cause adverse effects downstream. This could happen by aligning two peak flows from two
separate catchments at a convergence point. This could result in higher flows and a worse scenario in
areas than that currently modelled. The below graph shows the hydrograph from the MM prepared Alex
Avenue Precinct under existing conditions, against that from the GHD model under developed conditions.
As can be seen there is a slight variation in the time at which the peak flow occurs. To accurately consider
the Alex Avenue Precinct under a developed scenario, the flow hydrographs have been exported from the
GHD model (node F10a) for all durations and input to the Mott MacDonald model by replacing the ‘existing
scenario’ nodes (SRBR & SRCU).
-5
0
5
10
15
20
25
30
0 1 2 3 4 5 6
Flo
w (
m3/s
)
Time (hours)
100 year, 90 minute storm - Hydrograph Comparison
Mott MacDonald
GHD
Water Cycle Management Report Riverstone East
334311/AU/SYD84/2/E March 2015 P:\Parramatta\Projects\33xxxx\334311\05 DOCUMENTS\5_1 Working Files\Riverstone East\Water Cycle Management & Flood Analysis\334311-150428-Water Cycle Management Report-Riverstone East_Rev F.docx
32
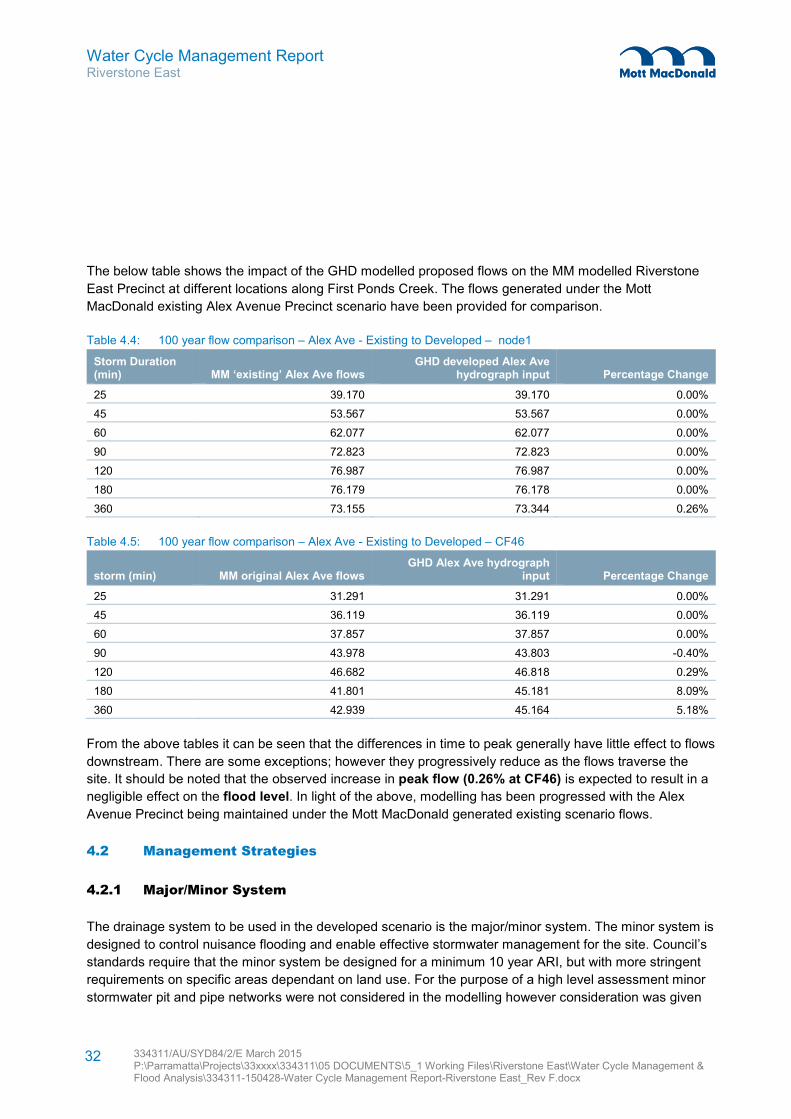
The below table shows the impact of the GHD modelled proposed flows on the MM modelled Riverstone
East Precinct at different locations along First Ponds Creek. The flows generated under the Mott
MacDonald existing Alex Avenue Precinct scenario have been provided for comparison.
Table 4.4: 100 year flow comparison – Alex Ave - Existing to Developed – node1
Storm Duration (min) MM ‘existing’ Alex Ave flows
GHD developed Alex Ave hydrograph input Percentage Change
25 39.170 39.170 0.00%
45 53.567 53.567 0.00%
60 62.077 62.077 0.00%
90 72.823 72.823 0.00%
120 76.987 76.987 0.00%
180 76.179 76.178 0.00%
360 73.155 73.344 0.26%
Table 4.5: 100 year flow comparison – Alex Ave - Existing to Developed – CF46
storm (min) MM original Alex Ave flows GHD Alex Ave hydrograph
input Percentage Change
25 31.291 31.291 0.00%
45 36.119 36.119 0.00%
60 37.857 37.857 0.00%
90 43.978 43.803 -0.40%
120 46.682 46.818 0.29%
180 41.801 45.181 8.09%
360 42.939 45.164 5.18%
From the above tables it can be seen that the differences in time to peak generally have little effect to flows
downstream. There are some exceptions; however they progressively reduce as the flows traverse the
site. It should be noted that the observed increase in peak flow (0.26% at CF46) is expected to result in a
negligible effect on the flood level. In light of the above, modelling has been progressed with the Alex
Avenue Precinct being maintained under the Mott MacDonald generated existing scenario flows.
4.2 Management Strategies
4.2.1 Major/Minor System
The drainage system to be used in the developed scenario is the major/minor system. The minor system is
designed to control nuisance flooding and enable effective stormwater management for the site. Council’s
standards require that the minor system be designed for a minimum 10 year ARI, but with more stringent
requirements on specific areas dependant on land use. For the purpose of a high level assessment minor
stormwater pit and pipe networks were not considered in the modelling however consideration was given
Water Cycle Management Report Riverstone East
334311/AU/SYD84/2/E March 2015 P:\Parramatta\Projects\33xxxx\334311\05 DOCUMENTS\5_1 Working Files\Riverstone East\Water Cycle Management & Flood Analysis\334311-150428-Water Cycle Management Report-Riverstone East_Rev F.docx
33
to sizing of regional drainage elements such as detention basins for the 2yr, 20yr, 100yr, 200yr, 500yr,
PMF and Climate Change.
The major drainage system incorporates overland flow routes through developed scenario roads and open
spaces and has been assessed against the 100 year ARI design storm event, with general safety and
flooding issues being addressed for events in excess of the 100 year ARI storm. The function of Windsor
Road was also checked against flooding affectation in the 500 year event due to its role as an emergency
evacuation route for the Riverstone, Box Hill, Vineyard and Windsor areas.
4.2.2 Detention Basins
To manage the flood risk impact on downstream properties, detention basins will be constructed for water
quantity management. Detention Basins were introduced in the hydrologic modelling for the developed
scenario to ensure that during the 2 to 100 year flood events no increase to peak flows is to be
experienced. A detention strategy was developed to determine the location, sizing and configuration of
detention basins, optimising the flow regime to satisfy the requirements of maximum permitted flows as
established through the modelling of the existing scenario.
Water Cycle Management Report Riverstone East
334311/AU/SYD84/2/E March 2015 P:\Parramatta\Projects\33xxxx\334311\05 DOCUMENTS\5_1 Working Files\Riverstone East\Water Cycle Management & Flood Analysis\334311-150428-Water Cycle Management Report-Riverstone East_Rev F.docx
34
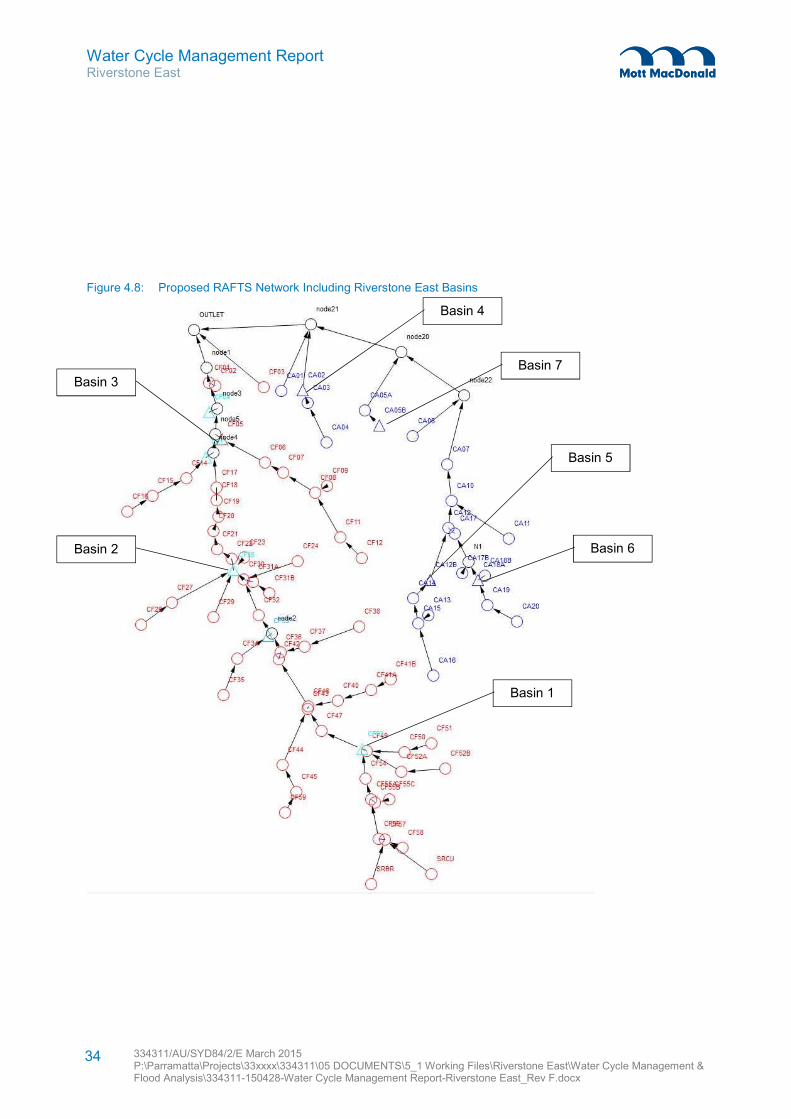
Figure 4.8: Proposed RAFTS Network Including Riverstone East Basins
Basin 1
Basin 3
Basin 2
Basin 4
Basin 6
Basin 7
Basin 5
Water Cycle Management Report Riverstone East
334311/AU/SYD84/2/E March 2015 P:\Parramatta\Projects\33xxxx\334311\05 DOCUMENTS\5_1 Working Files\Riverstone East\Water Cycle Management & Flood Analysis\334311-150428-Water Cycle Management Report-Riverstone East_Rev F.docx
35
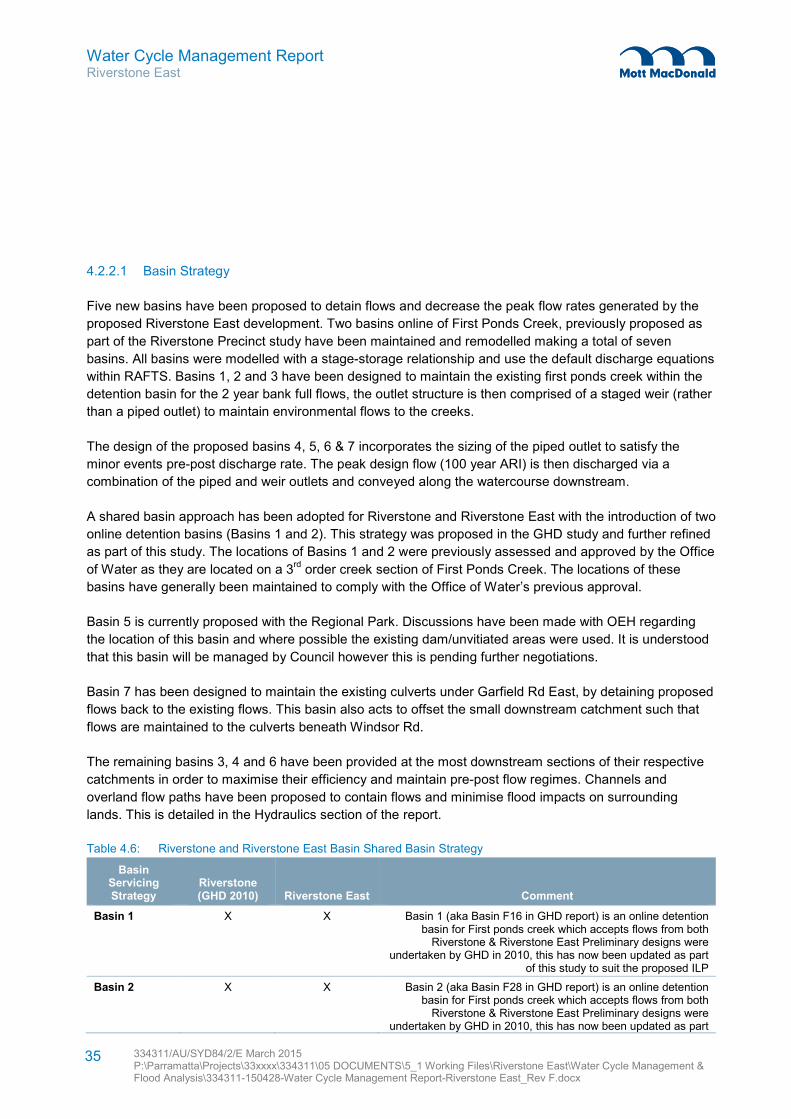
4.2.2.1 Basin Strategy
Five new basins have been proposed to detain flows and decrease the peak flow rates generated by the
proposed Riverstone East development. Two basins online of First Ponds Creek, previously proposed as
part of the Riverstone Precinct study have been maintained and remodelled making a total of seven
basins. All basins were modelled with a stage-storage relationship and use the default discharge equations
within RAFTS. Basins 1, 2 and 3 have been designed to maintain the existing first ponds creek within the
detention basin for the 2 year bank full flows, the outlet structure is then comprised of a staged weir (rather
than a piped outlet) to maintain environmental flows to the creeks.
The design of the proposed basins 4, 5, 6 & 7 incorporates the sizing of the piped outlet to satisfy the
minor events pre-post discharge rate. The peak design flow (100 year ARI) is then discharged via a
combination of the piped and weir outlets and conveyed along the watercourse downstream.
A shared basin approach has been adopted for Riverstone and Riverstone East with the introduction of two
online detention basins (Basins 1 and 2). This strategy was proposed in the GHD study and further refined
as part of this study. The locations of Basins 1 and 2 were previously assessed and approved by the Office
of Water as they are located on a 3rd
order creek section of First Ponds Creek. The locations of these
basins have generally been maintained to comply with the Office of Water’s previous approval.
Basin 5 is currently proposed with the Regional Park. Discussions have been made with OEH regarding
the location of this basin and where possible the existing dam/unvitiated areas were used. It is understood
that this basin will be managed by Council however this is pending further negotiations.
Basin 7 has been designed to maintain the existing culverts under Garfield Rd East, by detaining proposed
flows back to the existing flows. This basin also acts to offset the small downstream catchment such that
flows are maintained to the culverts beneath Windsor Rd.
The remaining basins 3, 4 and 6 have been provided at the most downstream sections of their respective
catchments in order to maximise their efficiency and maintain pre-post flow regimes. Channels and
overland flow paths have been proposed to contain flows and minimise flood impacts on surrounding
lands. This is detailed in the Hydraulics section of the report.
Table 4.6: Riverstone and Riverstone East Basin Shared Basin Strategy
Basin Servicing Strategy
Riverstone (GHD 2010) Riverstone East Comment
Basin 1 X X Basin 1 (aka Basin F16 in GHD report) is an online detention basin for First ponds creek which accepts flows from both
Riverstone & Riverstone East Preliminary designs were undertaken by GHD in 2010, this has now been updated as part
of this study to suit the proposed ILP
Basin 2 X X Basin 2 (aka Basin F28 in GHD report) is an online detention basin for First ponds creek which accepts flows from both
Riverstone & Riverstone East Preliminary designs were undertaken by GHD in 2010, this has now been updated as part
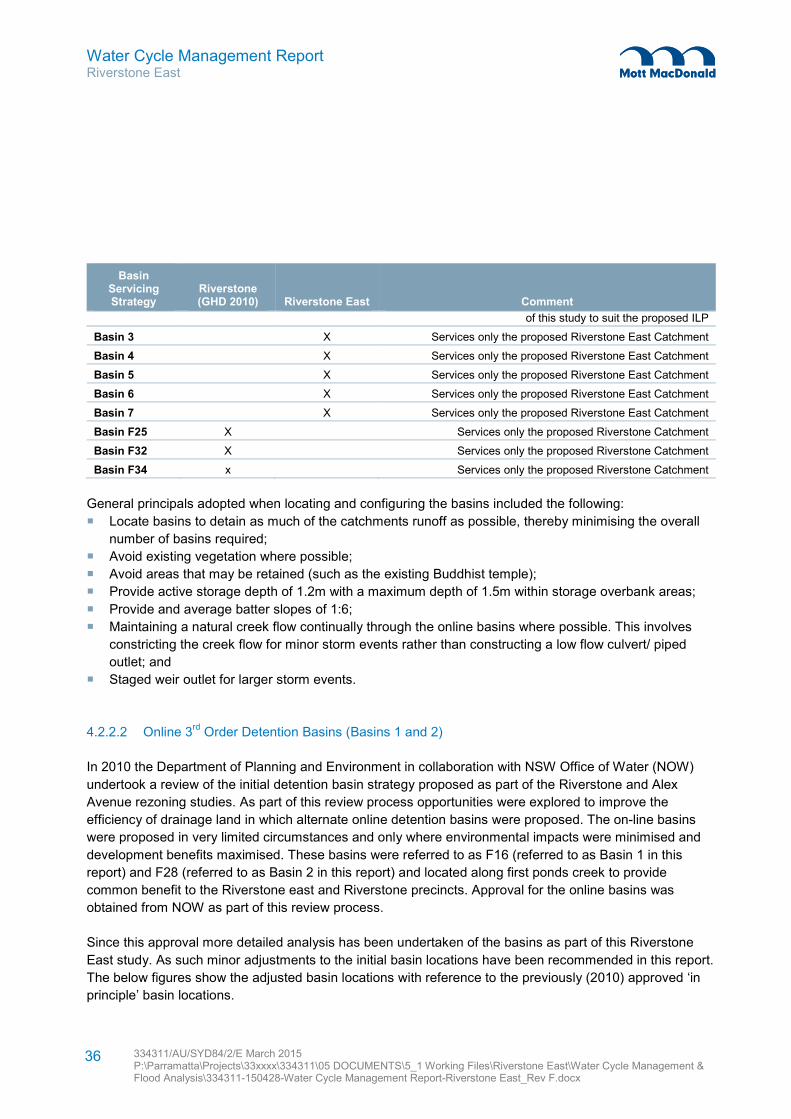
Water Cycle Management Report Riverstone East
334311/AU/SYD84/2/E March 2015 P:\Parramatta\Projects\33xxxx\334311\05 DOCUMENTS\5_1 Working Files\Riverstone East\Water Cycle Management & Flood Analysis\334311-150428-Water Cycle Management Report-Riverstone East_Rev F.docx
36
Basin Servicing Strategy
Riverstone (GHD 2010) Riverstone East Comment
of this study to suit the proposed ILP
Basin 3 X Services only the proposed Riverstone East Catchment
Basin 4 X Services only the proposed Riverstone East Catchment
Basin 5 X Services only the proposed Riverstone East Catchment
Basin 6 X Services only the proposed Riverstone East Catchment
Basin 7 X Services only the proposed Riverstone East Catchment
Basin F25 X Services only the proposed Riverstone Catchment
Basin F32 X Services only the proposed Riverstone Catchment
Basin F34 x Services only the proposed Riverstone Catchment
General principals adopted when locating and configuring the basins included the following:
� Locate basins to detain as much of the catchments runoff as possible, thereby minimising the overall
number of basins required;
� Avoid existing vegetation where possible;
� Avoid areas that may be retained (such as the existing Buddhist temple);
� Provide active storage depth of 1.2m with a maximum depth of 1.5m within storage overbank areas;
� Provide and average batter slopes of 1:6;
� Maintaining a natural creek flow continually through the online basins where possible. This involves
constricting the creek flow for minor storm events rather than constructing a low flow culvert/ piped
outlet; and
� Staged weir outlet for larger storm events.
4.2.2.2 Online 3rd
Order Detention Basins (Basins 1 and 2)
In 2010 the Department of Planning and Environment in collaboration with NSW Office of Water (NOW)
undertook a review of the initial detention basin strategy proposed as part of the Riverstone and Alex
Avenue rezoning studies. As part of this review process opportunities were explored to improve the
efficiency of drainage land in which alternate online detention basins were proposed. The on-line basins
were proposed in very limited circumstances and only where environmental impacts were minimised and
development benefits maximised. These basins were referred to as F16 (referred to as Basin 1 in this
report) and F28 (referred to as Basin 2 in this report) and located along first ponds creek to provide
common benefit to the Riverstone east and Riverstone precincts. Approval for the online basins was
obtained from NOW as part of this review process.
Since this approval more detailed analysis has been undertaken of the basins as part of this Riverstone
East study. As such minor adjustments to the initial basin locations have been recommended in this report.
The below figures show the adjusted basin locations with reference to the previously (2010) approved ‘in
principle’ basin locations.
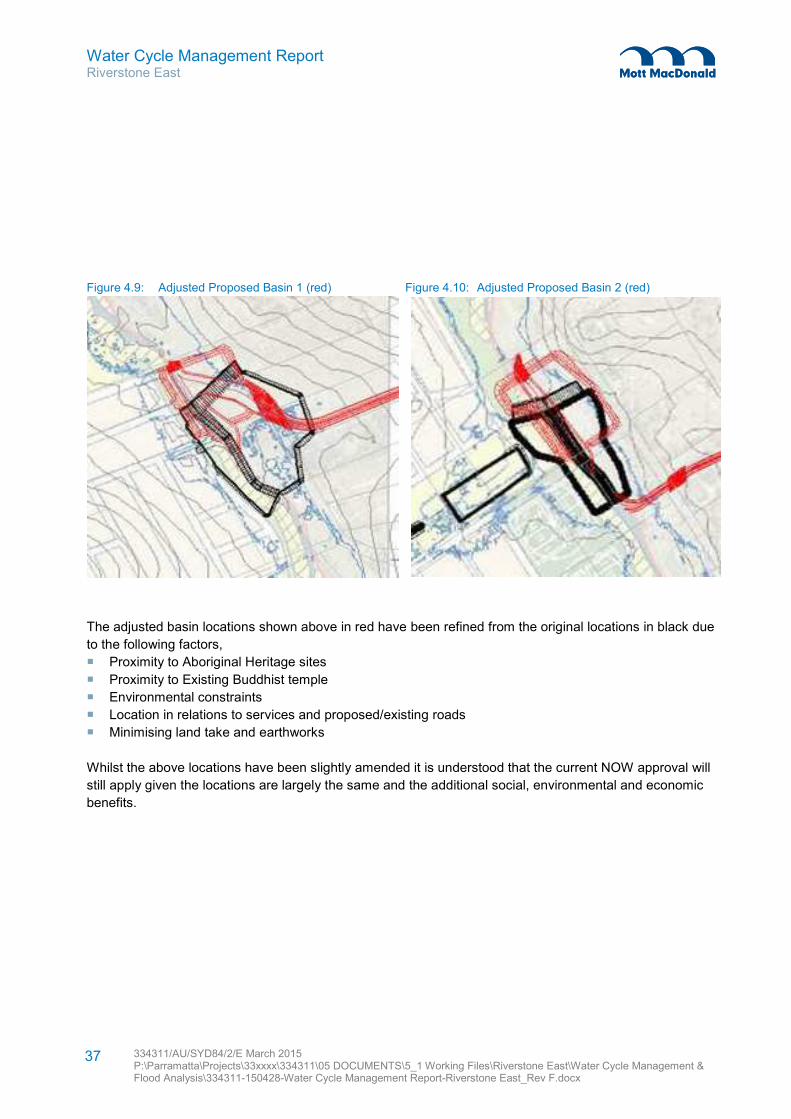
Water Cycle Management Report Riverstone East
334311/AU/SYD84/2/E March 2015 P:\Parramatta\Projects\33xxxx\334311\05 DOCUMENTS\5_1 Working Files\Riverstone East\Water Cycle Management & Flood Analysis\334311-150428-Water Cycle Management Report-Riverstone East_Rev F.docx
37
Figure 4.9: Adjusted Proposed Basin 1 (red) Figure 4.10: Adjusted Proposed Basin 2 (red)
The adjusted basin locations shown above in red have been refined from the original locations in black due
to the following factors,
� Proximity to Aboriginal Heritage sites
� Proximity to Existing Buddhist temple
� Environmental constraints
� Location in relations to services and proposed/existing roads
� Minimising land take and earthworks
Whilst the above locations have been slightly amended it is understood that the current NOW approval will
still apply given the locations are largely the same and the additional social, environmental and economic
benefits.
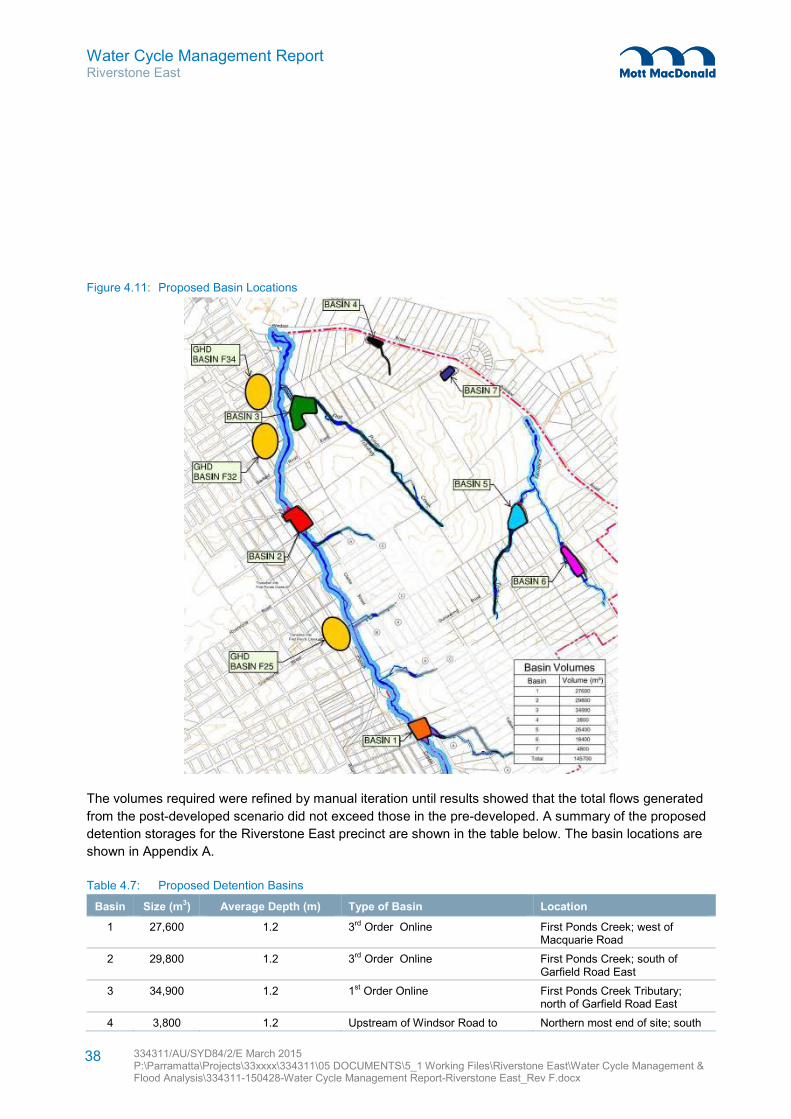
Water Cycle Management Report Riverstone East
334311/AU/SYD84/2/E March 2015 P:\Parramatta\Projects\33xxxx\334311\05 DOCUMENTS\5_1 Working Files\Riverstone East\Water Cycle Management & Flood Analysis\334311-150428-Water Cycle Management Report-Riverstone East_Rev F.docx
38
Figure 4.11: Proposed Basin Locations
The volumes required were refined by manual iteration until results showed that the total flows generated
from the post-developed scenario did not exceed those in the pre-developed. A summary of the proposed
detention storages for the Riverstone East precinct are shown in the table below. The basin locations are
shown in Appendix A.
Table 4.7: Proposed Detention Basins
Basin Size (m3) Average Depth (m) Type of Basin Location
1 27,600 1.2 3rd Order Online First Ponds Creek; west of Macquarie Road
2 29,800 1.2 3rd Order Online First Ponds Creek; south of Garfield Road East
3 34,900 1.2 1st Order Online First Ponds Creek Tributary; north of Garfield Road East
4 3,800 1.2 Upstream of Windsor Road to Northern most end of site; south
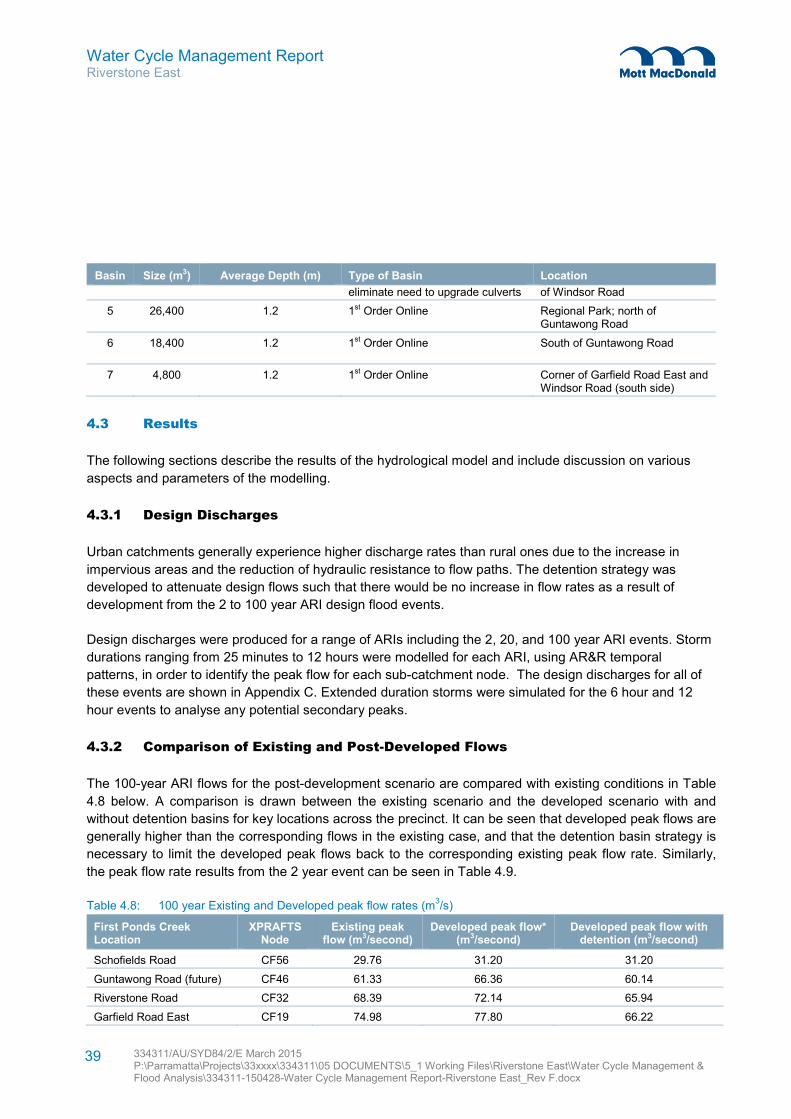
Water Cycle Management Report Riverstone East
334311/AU/SYD84/2/E March 2015 P:\Parramatta\Projects\33xxxx\334311\05 DOCUMENTS\5_1 Working Files\Riverstone East\Water Cycle Management & Flood Analysis\334311-150428-Water Cycle Management Report-Riverstone East_Rev F.docx
39
Basin Size (m3) Average Depth (m) Type of Basin Location
eliminate need to upgrade culverts of Windsor Road
5 26,400 1.2 1st Order Online Regional Park; north of Guntawong Road
6 18,400 1.2 1st Order Online South of Guntawong Road
7 4,800 1.2 1st Order Online Corner of Garfield Road East and Windsor Road (south side)
4.3 Results
The following sections describe the results of the hydrological model and include discussion on various
aspects and parameters of the modelling.
4.3.1 Design Discharges
Urban catchments generally experience higher discharge rates than rural ones due to the increase in
impervious areas and the reduction of hydraulic resistance to flow paths. The detention strategy was
developed to attenuate design flows such that there would be no increase in flow rates as a result of
development from the 2 to 100 year ARI design flood events.
Design discharges were produced for a range of ARIs including the 2, 20, and 100 year ARI events. Storm
durations ranging from 25 minutes to 12 hours were modelled for each ARI, using AR&R temporal
patterns, in order to identify the peak flow for each sub-catchment node. The design discharges for all of
these events are shown in Appendix C. Extended duration storms were simulated for the 6 hour and 12
hour events to analyse any potential secondary peaks.
4.3.2 Comparison of Existing and Post-Developed Flows
The 100-year ARI flows for the post-development scenario are compared with existing conditions in Table
4.8 below. A comparison is drawn between the existing scenario and the developed scenario with and
without detention basins for key locations across the precinct. It can be seen that developed peak flows are
generally higher than the corresponding flows in the existing case, and that the detention basin strategy is
necessary to limit the developed peak flows back to the corresponding existing peak flow rate. Similarly,
the peak flow rate results from the 2 year event can be seen in Table 4.9.
Table 4.8: 100 year Existing and Developed peak flow rates (m3/s)
First Ponds Creek Location
XPRAFTS Node
Existing peak flow (m3/second)
Developed peak flow* (m3/second)
Developed peak flow with detention (m3/second)
Schofields Road CF56 29.76 31.20 31.20
Guntawong Road (future) CF46 61.33 66.36 60.14
Riverstone Road CF32 68.39 72.14 65.94
Garfield Road East CF19 74.98 77.80 66.22
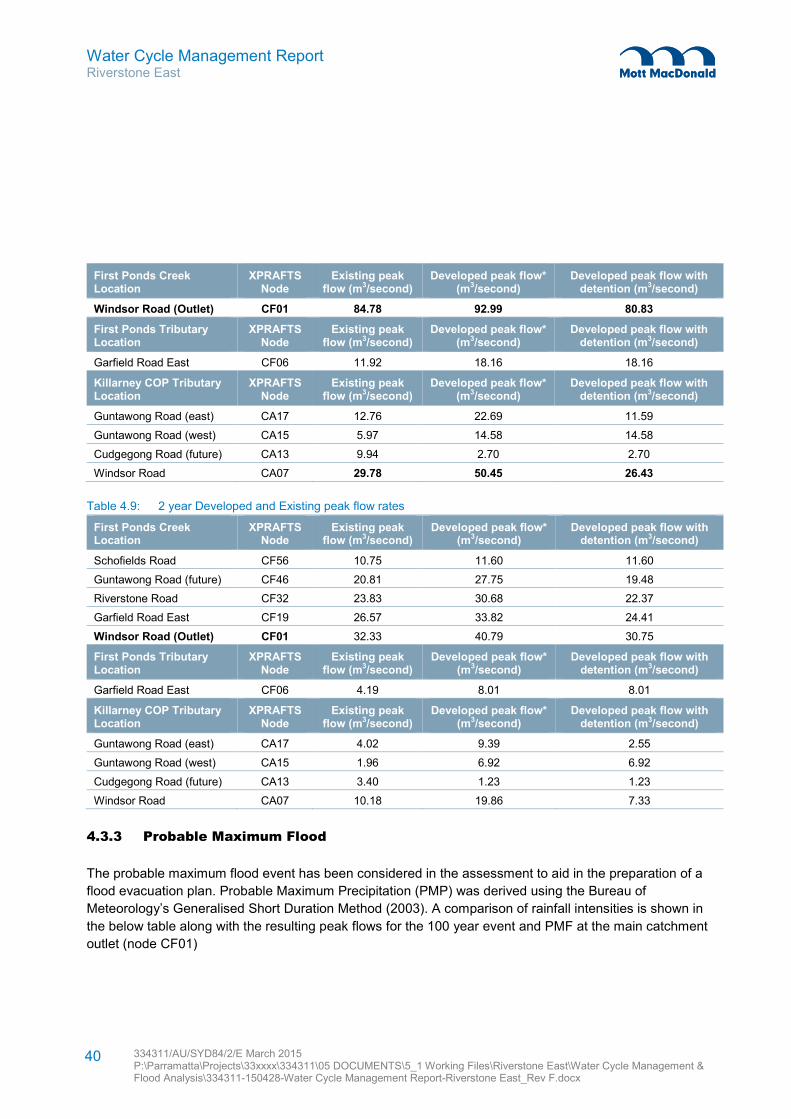
Water Cycle Management Report Riverstone East
334311/AU/SYD84/2/E March 2015 P:\Parramatta\Projects\33xxxx\334311\05 DOCUMENTS\5_1 Working Files\Riverstone East\Water Cycle Management & Flood Analysis\334311-150428-Water Cycle Management Report-Riverstone East_Rev F.docx
40
First Ponds Creek Location
XPRAFTS Node
Existing peak flow (m3/second)
Developed peak flow* (m3/second)
Developed peak flow with detention (m3/second)
Windsor Road (Outlet) CF01 84.78 92.99 80.83
First Ponds Tributary Location
XPRAFTS Node
Existing peak flow (m3/second)
Developed peak flow* (m3/second)
Developed peak flow with detention (m3/second)
Garfield Road East CF06 11.92 18.16 18.16
Killarney COP Tributary Location
XPRAFTS Node
Existing peak flow (m3/second)
Developed peak flow* (m3/second)
Developed peak flow with detention (m3/second)
Guntawong Road (east) CA17 12.76 22.69 11.59
Guntawong Road (west) CA15 5.97 14.58 14.58
Cudgegong Road (future) CA13 9.94 2.70 2.70
Windsor Road CA07 29.78 50.45 26.43
Table 4.9: 2 year Developed and Existing peak flow rates
First Ponds Creek Location
XPRAFTS Node
Existing peak flow (m3/second)
Developed peak flow* (m3/second)
Developed peak flow with detention (m3/second)
Schofields Road CF56 10.75 11.60 11.60
Guntawong Road (future) CF46 20.81 27.75 19.48
Riverstone Road CF32 23.83 30.68 22.37
Garfield Road East CF19 26.57 33.82 24.41
Windsor Road (Outlet) CF01 32.33 40.79 30.75
First Ponds Tributary Location
XPRAFTS Node
Existing peak flow (m3/second)
Developed peak flow* (m3/second)
Developed peak flow with detention (m3/second)
Garfield Road East CF06 4.19 8.01 8.01
Killarney COP Tributary Location
XPRAFTS Node
Existing peak flow (m3/second)
Developed peak flow* (m3/second)
Developed peak flow with detention (m3/second)
Guntawong Road (east) CA17 4.02 9.39 2.55
Guntawong Road (west) CA15 1.96 6.92 6.92
Cudgegong Road (future) CA13 3.40 1.23 1.23
Windsor Road CA07 10.18 19.86 7.33
4.3.3 Probable Maximum Flood
The probable maximum flood event has been considered in the assessment to aid in the preparation of a
flood evacuation plan. Probable Maximum Precipitation (PMP) was derived using the Bureau of
Meteorology’s Generalised Short Duration Method (2003). A comparison of rainfall intensities is shown in
the below table along with the resulting peak flows for the 100 year event and PMF at the main catchment
outlet (node CF01)
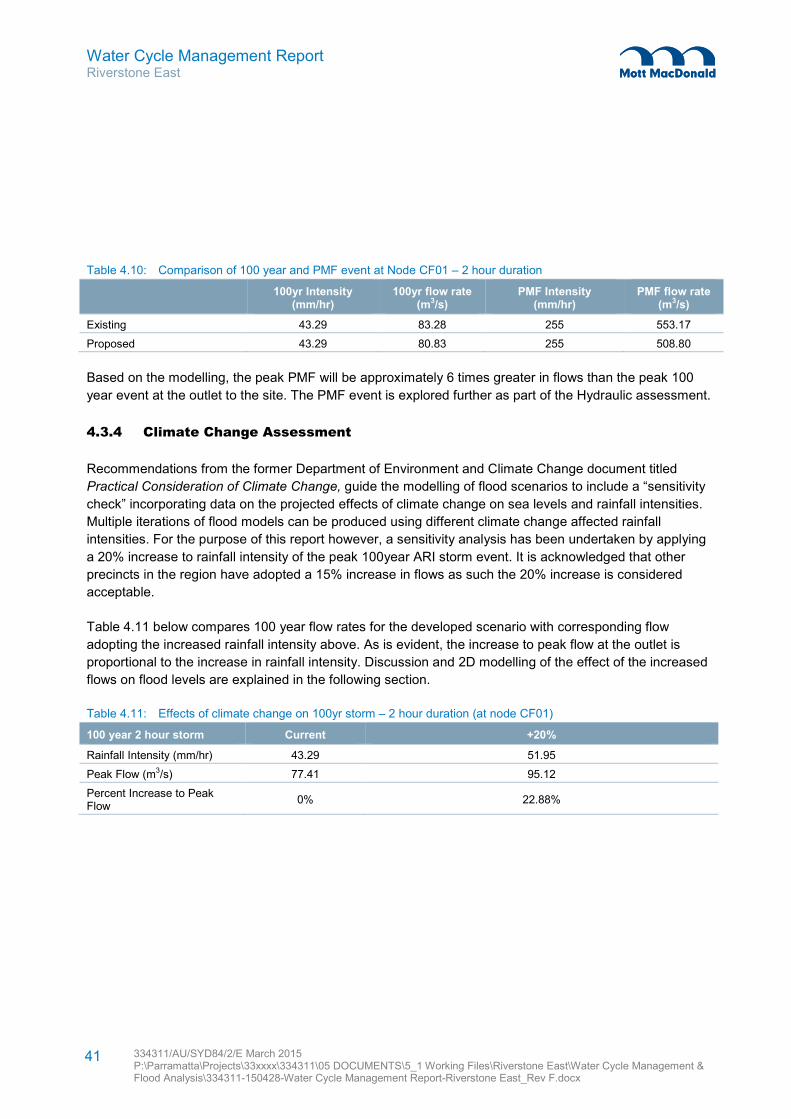
Water Cycle Management Report Riverstone East
334311/AU/SYD84/2/E March 2015 P:\Parramatta\Projects\33xxxx\334311\05 DOCUMENTS\5_1 Working Files\Riverstone East\Water Cycle Management & Flood Analysis\334311-150428-Water Cycle Management Report-Riverstone East_Rev F.docx
41
Table 4.10: Comparison of 100 year and PMF event at Node CF01 – 2 hour duration
100yr Intensity
(mm/hr) 100yr flow rate
(m3/s) PMF Intensity
(mm/hr) PMF flow rate
(m3/s)
Existing 43.29 83.28 255 553.17
Proposed 43.29 80.83 255 508.80
Based on the modelling, the peak PMF will be approximately 6 times greater in flows than the peak 100
year event at the outlet to the site. The PMF event is explored further as part of the Hydraulic assessment.
4.3.4 Climate Change Assessment
Recommendations from the former Department of Environment and Climate Change document titled
Practical Consideration of Climate Change, guide the modelling of flood scenarios to include a “sensitivity
check” incorporating data on the projected effects of climate change on sea levels and rainfall intensities.
Multiple iterations of flood models can be produced using different climate change affected rainfall
intensities. For the purpose of this report however, a sensitivity analysis has been undertaken by applying
a 20% increase to rainfall intensity of the peak 100year ARI storm event. It is acknowledged that other
precincts in the region have adopted a 15% increase in flows as such the 20% increase is considered
acceptable.
Table 4.11 below compares 100 year flow rates for the developed scenario with corresponding flow
adopting the increased rainfall intensity above. As is evident, the increase to peak flow at the outlet is
proportional to the increase in rainfall intensity. Discussion and 2D modelling of the effect of the increased
flows on flood levels are explained in the following section.
Table 4.11: Effects of climate change on 100yr storm – 2 hour duration (at node CF01)
100 year 2 hour storm Current +20%
Rainfall Intensity (mm/hr) 43.29 51.95
Peak Flow (m3/s) 77.41 95.12
Percent Increase to Peak Flow
0% 22.88%
Water Cycle Management Report Riverstone East
334311/AU/SYD84/2/E March 2015 P:\Parramatta\Projects\33xxxx\334311\05 DOCUMENTS\5_1 Working Files\Riverstone East\Water Cycle Management & Flood Analysis\334311-150428-Water Cycle Management Report-Riverstone East_Rev F.docx
42
5.1 Introduction
TUFLOW, a one and two-dimensional (1D/2D) hydraulic modelling program has been utilised to perform a
detailed assessment of the existing (pre-development) and proposed (post-development) flooding
scenarios for the Riverstone East precinct.
The objective of the flood assessment was to determine changes to flooding characteristics resulting from
development of the precinct, and examine the performance of the water cycle management strategies
discussed in Section 4.2. The flooding characteristics examined in the analysis include water level, depth,
velocity and hazard category.
Data supplied by Council, the Department of Planning and Environment and the Bureau of Meteorology
was utilised along with information gathered through first hand observations of existing conditions.
5.2 Existing and Proposed Models
5.2.1 TUFLOW Software Package
The TUFLOW (2D component) software package computes flow paths by dividing the floodplain into a grid
of individual cells. The flow of water between cells is then computed repeatedly at regular time steps by
solving two dimensional shallow water equations to estimate the flood spread and flow. As each cell
contains information on water levels, flows are routed in the direction that will naturally follow the modelled
topography.
ESTRY (1D component) is a separate calculation engine which is incorporated into TUFLOW to handle
flows through structures which cannot be accurately represented with grid cells. ESTRY is a network
dynamic flow program suitable for mathematically modelling floods and tides (and/or surges) in a virtually
unlimited number of combinations. By including non-linear geometry, ESTRY can provide an accurate
representation of the way in which channel conveyance and available storage volumes vary with changing
water depth. ESTRY has been developed in conjunction with TUFLOW to resolve complex 1D-2D flows
across the floodplain interface.
The flood assessment was modelled using TUFLOW build 2013-12-AB.
5.2.2 Flood Events
Flood events were modelled for the 2, 20, 100, 200, 500 year Average Recurrence Intervals, the Probable
Maximum Flood and Climate Change. These events were simulated in both the existing and developed
scenarios.
5 Hydraulics
Water Cycle Management Report Riverstone East
334311/AU/SYD84/2/E March 2015 P:\Parramatta\Projects\33xxxx\334311\05 DOCUMENTS\5_1 Working Files\Riverstone East\Water Cycle Management & Flood Analysis\334311-150428-Water Cycle Management Report-Riverstone East_Rev F.docx
43
5.2.3 Hydrologic Data
Results of the Hydrological assessment were input into the existing and developed TUFLOW hydraulic
models. Flows were extracted JWP’s Box Hill/Box Hill Industrial Precincts model for consistency and to
sufficiently model tailwater effects. These hydrographs have been applied to the model at specific locations
as discussed in section 5.2.5.
As the Riverstone and Riverstone East Precincts are proposed to share 2 basins, the Riverstone Precinct
has been modelled as a proposed scenario to appropriately size the detention basins. However, the Alex
Avenue Precinct shares no link to the Riverstone East Precinct and has therefore been modelled as
existing. While it’s acknowledged that surrounding growth centre precincts are in various stages of a
similar planning process to Riverstone East, the timing of development across the precincts cannot be
assumed with reliability. It is also noted that flows from developed scenarios should be attenuated back to
existing scenario flow rates through proper implementation of water sensitive urban design and flood risk
management principles. It is also acknowledged that flow volumes and peak flow times may change,
however this has been explored previously in the report
5.2.4 Digital Terrain Model
5.2.4.1 Survey data
The topography of the catchments and the creek alignments have been reproduced digitally, based on
LiDAR (Light Detection and Ranging) information supplied by Council. A 5m x 5m grid was selected for the
Digital Terrain Model (DTM) for use in TUFLOW. This grid resolution is judged appropriate for this model
given the scale of the precinct and a general lack of clearly defined creek banks which could potentially
demand a finer resolution.
5.2.4.2 Schofields Rd - Stage 2 upgrade works
In the area surrounding the Stage 2 Schofields Road upgrade works at First Ponds Creek, the DTM has
been supplemented with the designed surface levels. This incorporates First Ponds Creek re-grading
works which will affect flow regimes in the area. Current creek invert levels upstream and downstream of
the works have been modified to create a smooth transition to the design surface levels and best represent
the flow regime at completion of the works.
5.2.4.3 Developed scenario modifications
For analysis of the developed scenario earthworks have been proposed to amend flow regimes within the
upper reaches of streams (stream order 1) and overland flow paths in order to consolidate developable
land and maximise the developable value of the precinct. Where small streams are to be re-trained as
channels or flow paths as roads, 3D terrain modelling was carried out to create design surface levels
applied directly to the DTM.
Water Cycle Management Report Riverstone East
334311/AU/SYD84/2/E March 2015 P:\Parramatta\Projects\33xxxx\334311\05 DOCUMENTS\5_1 Working Files\Riverstone East\Water Cycle Management & Flood Analysis\334311-150428-Water Cycle Management Report-Riverstone East_Rev F.docx
44
Where detention basins are proposed for the management of water quantity and quality, the grading of the
basins has been created using 3D terrain modelling and applied to the DTM as surface levels. General
design principles for the basins are as follows:
• Nominal storage depth of 1.2m
• 1v:6h graded basin walls
• 2 year ARI flow channel cut through the basin.
• Modified v-notch stage-discharge
Overflow structures for the basins have been modelled as one-dimensional structures in ESTRY and
discussed in section 5.2.6.
5.2.5 Boundary Conditions
5.2.5.1 Precinct Catchments
The runoff volumes from catchments within the precinct have been determined through the hydrological
modelling, and have been applied to the hydraulic model as hydrographs (flow vs time). With this approach
the hydraulic model simulates the convergence of sub catchment rainfall at the lower portion of each sub-
catchment where it enters more defined overland flow paths or streams. For the developed scenario some
of these hydrographs have been directly applied to channel sections within the DTM to simulate the flow
within a typical future road cross-section, or the discharge of formal road network drainage infrastructure to
open drainage channels.
5.2.5.2 Upstream creek flows
First Ponds Creek crosses the model boundary near Schofields Road with two major flow paths from
upstream catchments. The culvert and bridge structures and ground model for the Stage 2 Schofields Rd
upgrade works have been incorporated into the hydraulic model to best represent the flow regime exiting
these structures. The runoff volumes for the two upstream reaches of First Ponds Creek were calculated in
the hydrological analysis discussed in section 4.3. These upstream flows have been applied as
hydrographs upstream of the Schofields Rd structures.
Tributaries of Killarney Chain of Ponds enter the model within the Box Hill/Box Hill Industrial Precincts. As
discussed in section 5.2.2, calculated flow rates and extracted flow rates from previous models were
considered in each of these tributaries. The selected hydrographs were applied across the flood plain at
the model boundary allowing TUFLOW to apply the flows to creek sections.
In the developed scenario, tributary flows entering First Ponds Creek from the Riverstone precinct have
been input to the model with attenuated hydrographs. These hydrographs reflect flow rates from
Riverstone precinct catchments integrating the performance of detention basins upstream of the
Riverstone East precinct.
Water Cycle Management Report Riverstone East
334311/AU/SYD84/2/E March 2015 P:\Parramatta\Projects\33xxxx\334311\05 DOCUMENTS\5_1 Working Files\Riverstone East\Water Cycle Management & Flood Analysis\334311-150428-Water Cycle Management Report-Riverstone East_Rev F.docx
45
5.2.5.3 Downstream creek flows
The downstream boundary levels are generated by TUFLOW through calculations of localised flood levels
through the Killarney Chain of Ponds floodway given pre-determined grades from the digital terrain model.
In the PMF event the precinct experiences backwater flooding from the greater Hawkesbury-Nepean
catchment. As such the downstream boundary condition across Killarney Chain of Ponds is configured as
a stable water level at the predetermined regional flood level. These levels were supplied by Blacktown
City Council.
5.2.5.4 Losses
Losses through evaporation and infiltration to the soil have been applied in the hydrological model for all
catchment areas of the precinct. Further infiltration and evaporation has not been incorporated into the
hydraulic model as these affects have been accounted for already in the hydrological analysis.
5.2.5.5 Existing Dam structures
Existing dams as surveyed have been examined for the sensitivity of surrounding flooding characteristics
to water levels and potential storage volumes. The initial water level of existing dams has been applied to
the model conservatively to reduce the risk of over-estimation of dam storage through flood events. This
approach is consistent with previous studies of flooding in the area and is in line with best practices.
5.2.6 Hydraulic structures (1D ESTRY component)
Where formal drainage structures are located within the model extents, additional survey information from
Blacktown City Council, data from previous models and information from site inspections have been used
to generate an accurate one-dimensional hydraulic representation of these structures within the model.
Windsor Road runs the entire length of the downstream boundary of the precinct and forces all flows
exiting the precinct through formal drainage structures or to spill across the road surface. Roads and
Maritime Services (RMS) cross drainage data for Windsor Road was provided by the Department of
Planning and Environment for incorporation into the model as one-dimensional structures.
In discussions with Blacktown City Council, inlet and culvert blockages were considered in the modelling
with a 50% blockage factor across all culverts being applied in order to assess overland flow paths.
Smaller culverts with a diameter less than or equal to 600mm were omitted from modelling in major events
to simulate potential blockages of these structures. In determination of the sizing for drainage structures
associated with arterial roads, 50% blockage was allowed for in the design capacity.
Water Cycle Management Report Riverstone East
334311/AU/SYD84/2/E March 2015 P:\Parramatta\Projects\33xxxx\334311\05 DOCUMENTS\5_1 Working Files\Riverstone East\Water Cycle Management & Flood Analysis\334311-150428-Water Cycle Management Report-Riverstone East_Rev F.docx
46
5.2.6.1 Detention basin outlet structures
The detention basin outlet structures designed integrally through the hydrological analysis have been
incorporated into the TUFLOW model as ESTRY structures. The performance of the basins, as designed,
has been replicated in TUFLOW by embedding the structures into the basin walls (within the DTM)
creating both the low flow outlet and overflow weir sections. Detention basins pipe outlets were not
considered to have a 50% blockage factor applied.
5.2.7 Flood Management Strategies
A range of measures is proposed for the flood cycle management of the Riverstone East precinct. The
following strategies were adopted,
• Detention basins have been modelled to assess the impacts of the increase in runoff from the
proposed development and to test the efficiency of the basins in relation to geometric design and
outlet function with tailwater effects.
• Opportunities have been explored to reduce the extent of flooding within the development thus
increasing the developable area. This has generally only been applied where there are existing
wide spread shallow flows. This has been achieved with localised filling and channel re-definition.
• Where it is possible to manage surface flows within the street drainage network they have been
excluded from the TUFLOW modelling.
5.2.7.1 Creek re-alignment
In the developed scenario, the construction of a road network and associated piped drainage structures will
capture rainfall and runoff flows from the upper portions of the precinct catchments. In order to consolidate
the proposed development layout and maximise the development potential of the precinct, minor flow
paths and streams have been either:
• realigned and channelized (where the existing stream-order of one applies); or
• removed and replaced with formal drainage structures.
Under existing conditions there are sections of First Ponds Creek and First Ponds Creek Tributary that
have been significantly altered by agricultural/industrial works such that in some locations there is little to
none discernable creek channel. In these areas the existing flooding is quite widespread, this is particularly
evident along First Ponds Creek Tributary where there has been significant manipulation to the existing
floodplain with farm dams and pastures, here flood depths are generally quite shallow and upgraded creek
is proposed to better manage nuisance water and floodwaters. This in turn allows previously shallow
flooded areas to be salvaged for development.
Water Cycle Management Report Riverstone East
334311/AU/SYD84/2/E March 2015 P:\Parramatta\Projects\33xxxx\334311\05 DOCUMENTS\5_1 Working Files\Riverstone East\Water Cycle Management & Flood Analysis\334311-150428-Water Cycle Management Report-Riverstone East_Rev F.docx
47
Where existing riparian corridors exist these have been maintained and creek embellishment works
proposed (these works are only proposed to 1st order streams). The existing classification has been
maintained while the flows have been channelised. The result is a formal drainage channel with riparian
offsets, better streamlined for configuration of developable areas.
5.2.7.2 Detention Basins
Detention basins have been designed through the hydrological analysis of the developed scenario to
attenuate developed scenario flows back to existing for events ranging from the 2 – 100yr ARI. The
performance of these detention basins can be observed in the attenuated flow rates discussed in the
results section following and can be observed across the flood maps for 2 to 100year ARI events. The
stage vs storage relationships for these facilities have been replicated in the TUFLOW model as discussed
in section 5.2.4.3.
5.3 Results
5.3.1 Flood maps for design events
The following TUFLOW output maps are attached to this report as Appendix A:
• 2yr Existing Flood Extents/Depths
• 2yr Proposed Flood Extents/Depths
• 100yr Existing Flood Extents/Depths
• 100yr Proposed Flood Extents/Depths
• 100yr Flood Difference maps from Existing to Proposed
• 100yr Existing Flood FDM Hazard Maps
• 100yr Proposed Flood FDM Hazard Maps
• 100yr Climate Change maps (20% Increase in rainfall intensity)
• 100yr Flood Difference maps from Proposed scenarios with and without climate change
• 500yr Proposed Flood Maps
• PMF Proposed Flood Maps
5.3.2 Existing and developed scenario comparison
Generally, flood mapping indicates that in the developed scenario the flood cycle management strategies
achieve their goal of restricting developed flows back to the existing scenario flow rates. As can be seen in
the attached flood maps flood hazards are generally not increased across the site, and in most cases are
reduced.
For the 100 year event flood water levels were generally reduced or maintained. On average flood levels
were reduced by approximately 0-50mm along the length of First Ponds Creek. Localised areas of
increase generally occur within the detention basins where they are manageable and velocities are low.
Water Cycle Management Report Riverstone East
334311/AU/SYD84/2/E March 2015 P:\Parramatta\Projects\33xxxx\334311\05 DOCUMENTS\5_1 Working Files\Riverstone East\Water Cycle Management & Flood Analysis\334311-150428-Water Cycle Management Report-Riverstone East_Rev F.docx
48
The results are consistent with the hydrologic modelling and there is no increased impact on neighbouring
properties or downstream of the site. Improvements are also noticed at sites such as the Lankarama
Vihara Buddhist Temple, here existing mainstream flooding from First Ponds Creek and overland flow from
surrounding catchments inundated the site. The proposed 1st order creek alignments and the effective
placement of Basin 1 have improved flood levels across the site, whilst the site is still not flood free there is
no worsening for storms up to and including the 100 year event.
As a result of the detention basins there is no flood worsening for all the Windsor Rd culverts and no
increased impact for the Regional Park.
5.4 Climate Change
As an extension of the climate change assessment undertaken in section 4.3.4 the proposed flow
increases were run through the flood model to determine the associated impacts and increases in flood
level. As a worst case scenario the 20% rainfall intensity climate change scenario was adopted.
The results of the study indicate that flood level increases are expected in the order of 0-300mm when
compared with the proposed development base case. Under a 20% climate change increase scenario
flood levels are similar in level to the 200yr event. It is anticipated that the increase in size and cost of
detention basins to accommodate this climate change scenario may outweigh the alternate impact of
adopting a higher freeboard. As such it is recommended that the proposed detention basins not be
upgraded to detain the 20% Climate change scenario but rather the Flood Planning Level be set at 0.5m
above the 20% Climate change level as opposed to the traditional flood planning level set at 0.5m above
the 100 year event.
5.5 Flood Evacuation Strategy
Extensive and complex operations are required to deal with severe and extreme floods within the precinct
and across the wider Hawkesbury-Nepean catchment. This dictates the need for a detailed set of
management arrangements for evacuation of flood affected areas.
For flood evacuation planning to be effective in all circumstances, preparation must take into account the
worst case floods that could occur. The Peak PMF flood event has been simulated in the proposed flood
model for this purpose.
In the PMF event the precinct experiences backwater flooding from the greater Hawkesbury-Nepean
catchment which further amplifies the impacts of flooding, particularly on the lower regions of the precinct
at the First Ponds Creek/Windsor Road crossing. As Windsor Road is cut off by severe flooding at First
Ponds Creek, safe refuge and evacuation can generally be achieved towards the South of the precinct.
The Blacktown City Local Flood Plan (November 2010, a sub-plan of the Blacktown Local Disaster Plan -
DISPLAN, March 2008) and subsequent State Emergency Services (SES) flood evacuation plans provide
comprehensive guidance for flood response strategies and govern the evacuation procedures of the
Water Cycle Management Report Riverstone East
334311/AU/SYD84/2/E March 2015 P:\Parramatta\Projects\33xxxx\334311\05 DOCUMENTS\5_1 Working Files\Riverstone East\Water Cycle Management & Flood Analysis\334311-150428-Water Cycle Management Report-Riverstone East_Rev F.docx
49
Riverstone East area. In the event of a significant flood event, the procedures detailed in these plans will
be activated and co-ordinated by SES Local Controllers and Blacktown City Council. Affected residents
within the precinct will be informed of appropriate evacuation routes and directed to emergency relief
centres, potentially located at Guntawong Road and Worcester Road. Further details relating to regional
preparedness and emergency response can be found in the Blacktown City Local Flood Plan.
Properties along the fringe that may be affected as flood levels increase during an event will be able to
safely evacuate to higher ground within Riverstone East precinct. It is recommended that proposed schools
and community facilities in the area act as localised refuge points in times of flooding to reduce the risk of
cars travelling along the flood prone Windsor Road. If a person must leave the site via Windsor Road, they
should do so only if the road is free from flood waters. It is recommended that people do not try and cross
flood waters in their vehicles and should return to higher ground and follow the procedures of the regional
flood evacuation plan.
Whilst clear evacuation strategies are defined for the precinct, significant portions of the district remain
unaffected by floodwaters during a PMF event. People should remain in these unaffected areas if possible
or seek shelter in the refuge areas designated by the Blacktown City Local Flood Plan, such as the Town
Centre or school site/s.
A sample flood evacuation route map is shown below in Figure 5.1 and has also been included in
Appendix A (Mott MacDonald Flood Response Plan, drawing MMD-334331-C-DR-RE-XX-0260). The 500
year flood level has been shown on this plan in order to highlight evacuation routes leading up to a
potential PMF event.
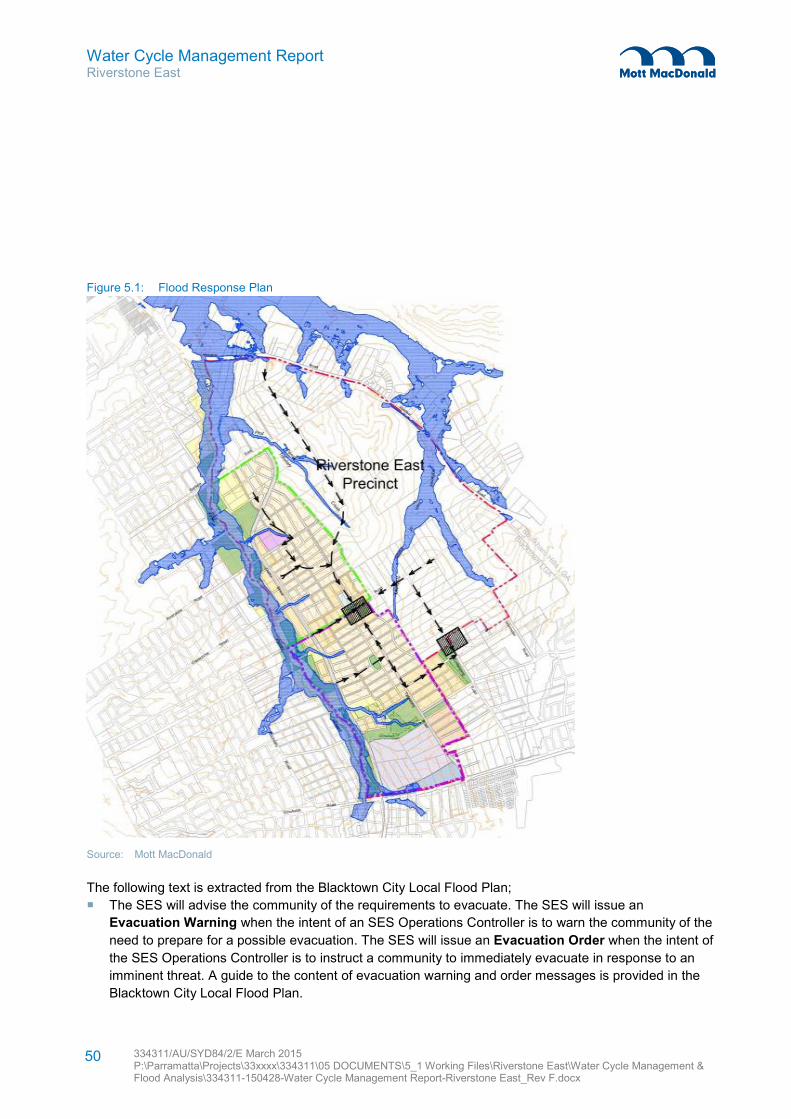
Water Cycle Management Report Riverstone East
334311/AU/SYD84/2/E March 2015 P:\Parramatta\Projects\33xxxx\334311\05 DOCUMENTS\5_1 Working Files\Riverstone East\Water Cycle Management & Flood Analysis\334311-150428-Water Cycle Management Report-Riverstone East_Rev F.docx
50
Figure 5.1: Flood Response Plan
Source: Mott MacDonald
The following text is extracted from the Blacktown City Local Flood Plan;
� The SES will advise the community of the requirements to evacuate. The SES will issue an
Evacuation Warning when the intent of an SES Operations Controller is to warn the community of the
need to prepare for a possible evacuation. The SES will issue an Evacuation Order when the intent of
the SES Operations Controller is to instruct a community to immediately evacuate in response to an
imminent threat. A guide to the content of evacuation warning and order messages is provided in the
Blacktown City Local Flood Plan.
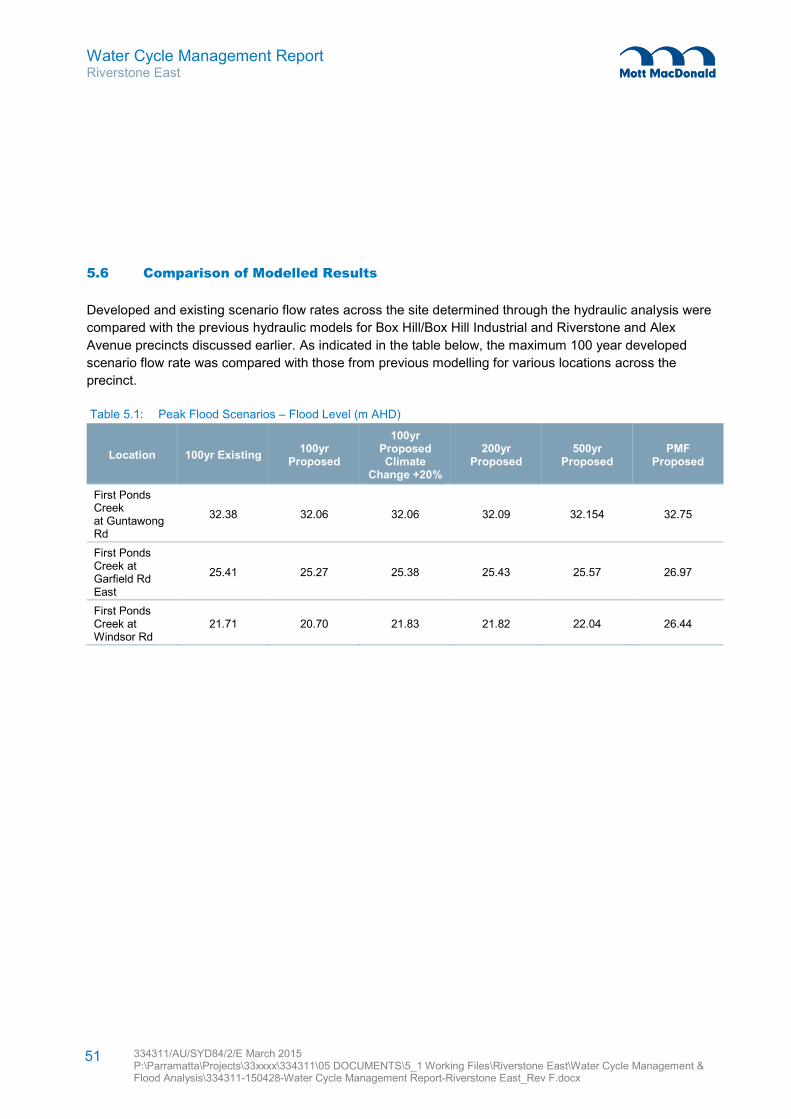
Water Cycle Management Report Riverstone East
334311/AU/SYD84/2/E March 2015 P:\Parramatta\Projects\33xxxx\334311\05 DOCUMENTS\5_1 Working Files\Riverstone East\Water Cycle Management & Flood Analysis\334311-150428-Water Cycle Management Report-Riverstone East_Rev F.docx
51
5.6 Comparison of Modelled Results
Developed and existing scenario flow rates across the site determined through the hydraulic analysis were
compared with the previous hydraulic models for Box Hill/Box Hill Industrial and Riverstone and Alex
Avenue precincts discussed earlier. As indicated in the table below, the maximum 100 year developed
scenario flow rate was compared with those from previous modelling for various locations across the
precinct.
Table 5.1: Peak Flood Scenarios – Flood Level (m AHD)
Location 100yr Existing 100yr
Proposed
100yr Proposed Climate
Change +20%
200yr Proposed
500yr Proposed
PMF Proposed
First Ponds Creek at Guntawong Rd
32.38 32.06 32.06 32.09 32.154 32.75
First Ponds Creek at Garfield Rd East
25.41 25.27 25.38 25.43 25.57 26.97
First Ponds Creek at Windsor Rd
21.71 20.70 21.83 21.82 22.04 26.44
Water Cycle Management Report Riverstone East
334311/AU/SYD84/2/E March 2015 P:\Parramatta\Projects\33xxxx\334311\05 DOCUMENTS\5_1 Working Files\Riverstone East\Water Cycle Management & Flood Analysis\334311-150428-Water Cycle Management Report-Riverstone East_Rev F.docx
52
The stormwater management systems for the site shall comply with the requirements of the Growth
Centres Commission and Blacktown City Council’s Development Control Plan. Council’s policy requires
improved water quality of the stormwater flow from the developed site prior to discharge into the authority’s
drainage system.
To demonstrate compliance with these objectives, treatment removal loads were analysed from pre to post
development scenarios using MUSIC (Model for Urban Stormwater Improvement Conceptualisation)
Version 6 software. Model development and results are discussed below.
6.1 MUSIC Methodology
MUSIC software allows the modeller to assess the effectiveness of the water quality devices. The
developed site was compared with and without water quality treatment measures and subsequent pollutant
reduction percentages calculated, based on the compared results.
These were then compared with the pollutant removal objectives set out in the Blacktown City Council
DCP as summarised below.
Table 6.1: MUSIC Pollutant Reduction Targets
Pollutant Minimum Removal Rate
Gross Pollutants (GP) 90%
Suspended Solids (TSS) 85%
Nitrogen 45%
Phosphorus 65%
Source: Blacktown City Council DCP, 2006
6.2 Model Parameters
6.2.1 Rainfall Data
In accordance with BCC Council’s requirements, pluviograph data from 067035 Liverpool (1967-1976) 6
minute interval was utilised within the model.
6.2.2 Base Catchment
The RAFTS model developed for detailed analysis and design of the proposed water management system
divided the site into 10 sub-catchments. This level of detail is required at the design stage for the site
hydrologic and hydraulic analyses. However, this level of detail is not necessary for water quality modelling
using MUSIC because the treatment devices capture runoff from large areas and sub-division of sub-
catchments smaller than the treatment catchment will not achieve improved results.
6 Water Quality Modelling
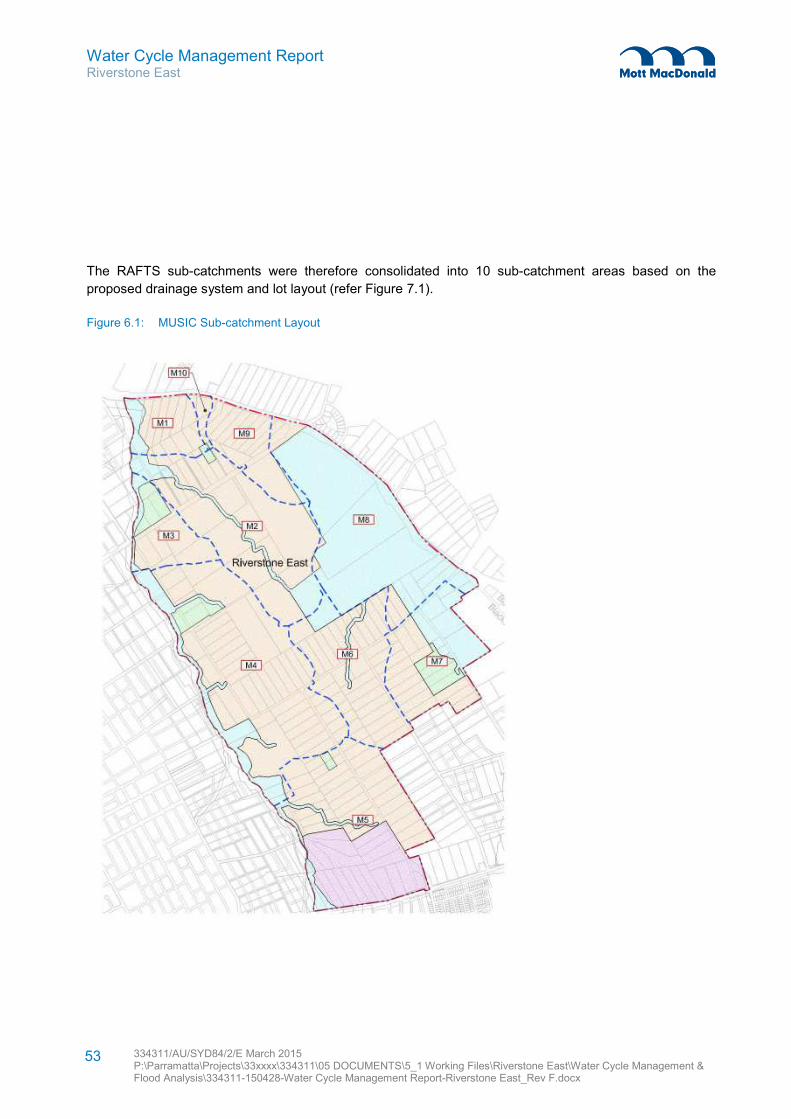
Water Cycle Management Report Riverstone East
334311/AU/SYD84/2/E March 2015 P:\Parramatta\Projects\33xxxx\334311\05 DOCUMENTS\5_1 Working Files\Riverstone East\Water Cycle Management & Flood Analysis\334311-150428-Water Cycle Management Report-Riverstone East_Rev F.docx
53
The RAFTS sub-catchments were therefore consolidated into 10 sub-catchment areas based on the
proposed drainage system and lot layout (refer Figure 7.1).
Figure 6.1: MUSIC Sub-catchment Layout
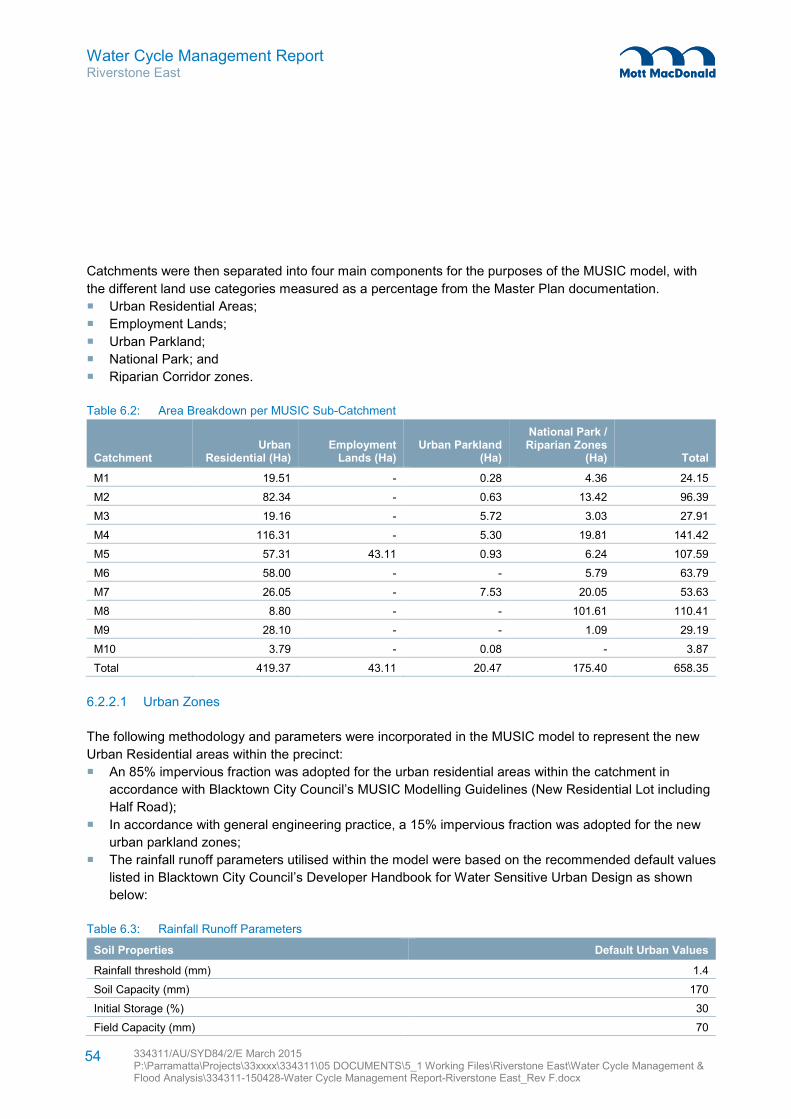
Water Cycle Management Report Riverstone East
334311/AU/SYD84/2/E March 2015 P:\Parramatta\Projects\33xxxx\334311\05 DOCUMENTS\5_1 Working Files\Riverstone East\Water Cycle Management & Flood Analysis\334311-150428-Water Cycle Management Report-Riverstone East_Rev F.docx
54
Catchments were then separated into four main components for the purposes of the MUSIC model, with
the different land use categories measured as a percentage from the Master Plan documentation.
� Urban Residential Areas;
� Employment Lands;
� Urban Parkland;
� National Park; and
� Riparian Corridor zones.
Table 6.2: Area Breakdown per MUSIC Sub-Catchment
Catchment Urban
Residential (Ha) Employment
Lands (Ha) Urban Parkland
(Ha)
National Park / Riparian Zones
(Ha) Total
M1 19.51 - 0.28 4.36 24.15
M2 82.34 - 0.63 13.42 96.39
M3 19.16 - 5.72 3.03 27.91
M4 116.31 - 5.30 19.81 141.42
M5 57.31 43.11 0.93 6.24 107.59
M6 58.00 - - 5.79 63.79
M7 26.05 - 7.53 20.05 53.63
M8 8.80 - - 101.61 110.41
M9 28.10 - - 1.09 29.19
M10 3.79 - 0.08 - 3.87
Total 419.37 43.11 20.47 175.40 658.35
6.2.2.1 Urban Zones
The following methodology and parameters were incorporated in the MUSIC model to represent the new
Urban Residential areas within the precinct:
� An 85% impervious fraction was adopted for the urban residential areas within the catchment in
accordance with Blacktown City Council’s MUSIC Modelling Guidelines (New Residential Lot including
Half Road);
� In accordance with general engineering practice, a 15% impervious fraction was adopted for the new
urban parkland zones;
� The rainfall runoff parameters utilised within the model were based on the recommended default values
listed in Blacktown City Council’s Developer Handbook for Water Sensitive Urban Design as shown
below:
Table 6.3: Rainfall Runoff Parameters
Soil Properties Default Urban Values
Rainfall threshold (mm) 1.4
Soil Capacity (mm) 170
Initial Storage (%) 30
Field Capacity (mm) 70
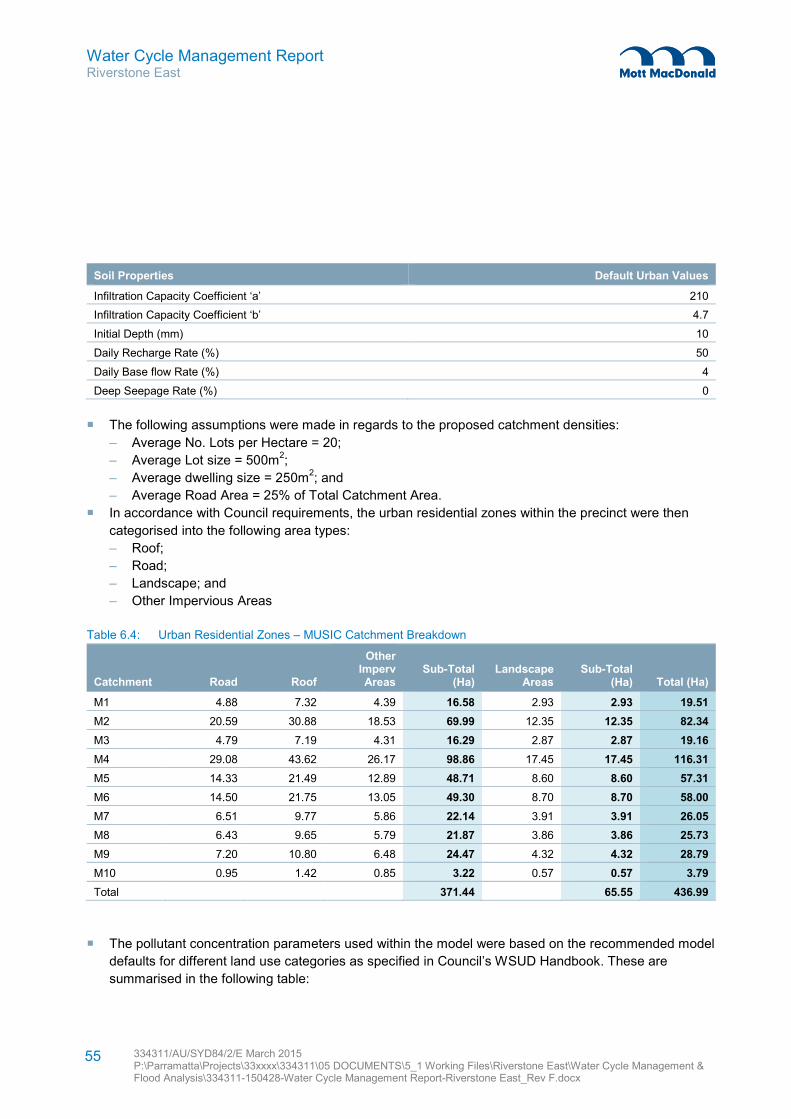
Water Cycle Management Report Riverstone East
334311/AU/SYD84/2/E March 2015 P:\Parramatta\Projects\33xxxx\334311\05 DOCUMENTS\5_1 Working Files\Riverstone East\Water Cycle Management & Flood Analysis\334311-150428-Water Cycle Management Report-Riverstone East_Rev F.docx
55
Soil Properties Default Urban Values
Infiltration Capacity Coefficient ‘a’ 210
Infiltration Capacity Coefficient ‘b’ 4.7
Initial Depth (mm) 10
Daily Recharge Rate (%) 50
Daily Base flow Rate (%) 4
Deep Seepage Rate (%) 0
� The following assumptions were made in regards to the proposed catchment densities:
– Average No. Lots per Hectare = 20;
– Average Lot size = 500m2;
– Average dwelling size = 250m2; and
– Average Road Area = 25% of Total Catchment Area.
� In accordance with Council requirements, the urban residential zones within the precinct were then
categorised into the following area types:
– Roof;
– Road;
– Landscape; and
– Other Impervious Areas
Table 6.4: Urban Residential Zones – MUSIC Catchment Breakdown
Catchment Road Roof
Other Imperv Areas
Sub-Total (Ha)
Landscape Areas
Sub-Total (Ha) Total (Ha)
M1 4.88 7.32 4.39 16.58 2.93 2.93 19.51
M2 20.59 30.88 18.53 69.99 12.35 12.35 82.34
M3 4.79 7.19 4.31 16.29 2.87 2.87 19.16
M4 29.08 43.62 26.17 98.86 17.45 17.45 116.31
M5 14.33 21.49 12.89 48.71 8.60 8.60 57.31
M6 14.50 21.75 13.05 49.30 8.70 8.70 58.00
M7 6.51 9.77 5.86 22.14 3.91 3.91 26.05
M8 6.43 9.65 5.79 21.87 3.86 3.86 25.73
M9 7.20 10.80 6.48 24.47 4.32 4.32 28.79
M10 0.95 1.42 0.85 3.22 0.57 0.57 3.79
Total 371.44 65.55 436.99
� The pollutant concentration parameters used within the model were based on the recommended model
defaults for different land use categories as specified in Council’s WSUD Handbook. These are
summarised in the following table:
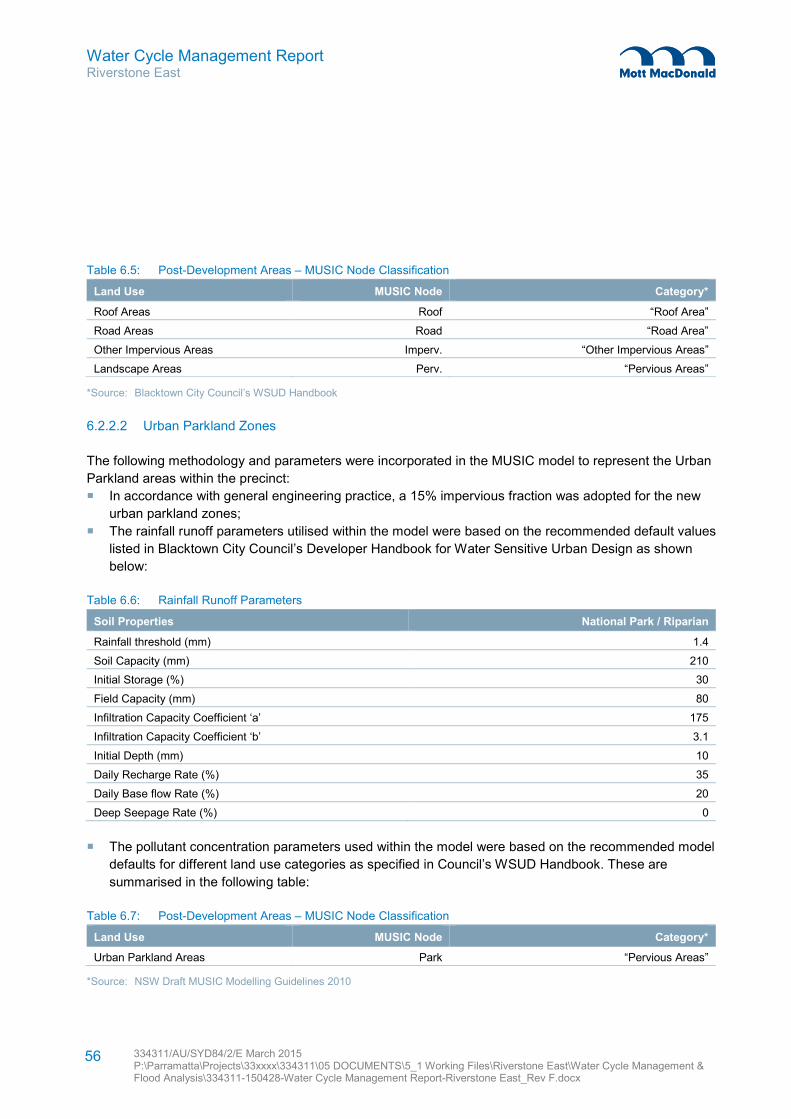
Water Cycle Management Report Riverstone East
334311/AU/SYD84/2/E March 2015 P:\Parramatta\Projects\33xxxx\334311\05 DOCUMENTS\5_1 Working Files\Riverstone East\Water Cycle Management & Flood Analysis\334311-150428-Water Cycle Management Report-Riverstone East_Rev F.docx
56
Table 6.5: Post-Development Areas – MUSIC Node Classification
Land Use MUSIC Node Category*
Roof Areas Roof “Roof Area”
Road Areas Road “Road Area”
Other Impervious Areas Imperv. “Other Impervious Areas”
Landscape Areas Perv. “Pervious Areas”
*Source: Blacktown City Council’s WSUD Handbook
6.2.2.2 Urban Parkland Zones
The following methodology and parameters were incorporated in the MUSIC model to represent the Urban
Parkland areas within the precinct:
� In accordance with general engineering practice, a 15% impervious fraction was adopted for the new
urban parkland zones;
� The rainfall runoff parameters utilised within the model were based on the recommended default values
listed in Blacktown City Council’s Developer Handbook for Water Sensitive Urban Design as shown
below:
Table 6.6: Rainfall Runoff Parameters
Soil Properties National Park / Riparian
Rainfall threshold (mm) 1.4
Soil Capacity (mm) 210
Initial Storage (%) 30
Field Capacity (mm) 80
Infiltration Capacity Coefficient ‘a’ 175
Infiltration Capacity Coefficient ‘b’ 3.1
Initial Depth (mm) 10
Daily Recharge Rate (%) 35
Daily Base flow Rate (%) 20
Deep Seepage Rate (%) 0
� The pollutant concentration parameters used within the model were based on the recommended model
defaults for different land use categories as specified in Council’s WSUD Handbook. These are
summarised in the following table:
Table 6.7: Post-Development Areas – MUSIC Node Classification
Land Use MUSIC Node Category*
Urban Parkland Areas Park “Pervious Areas”
*Source: NSW Draft MUSIC Modelling Guidelines 2010
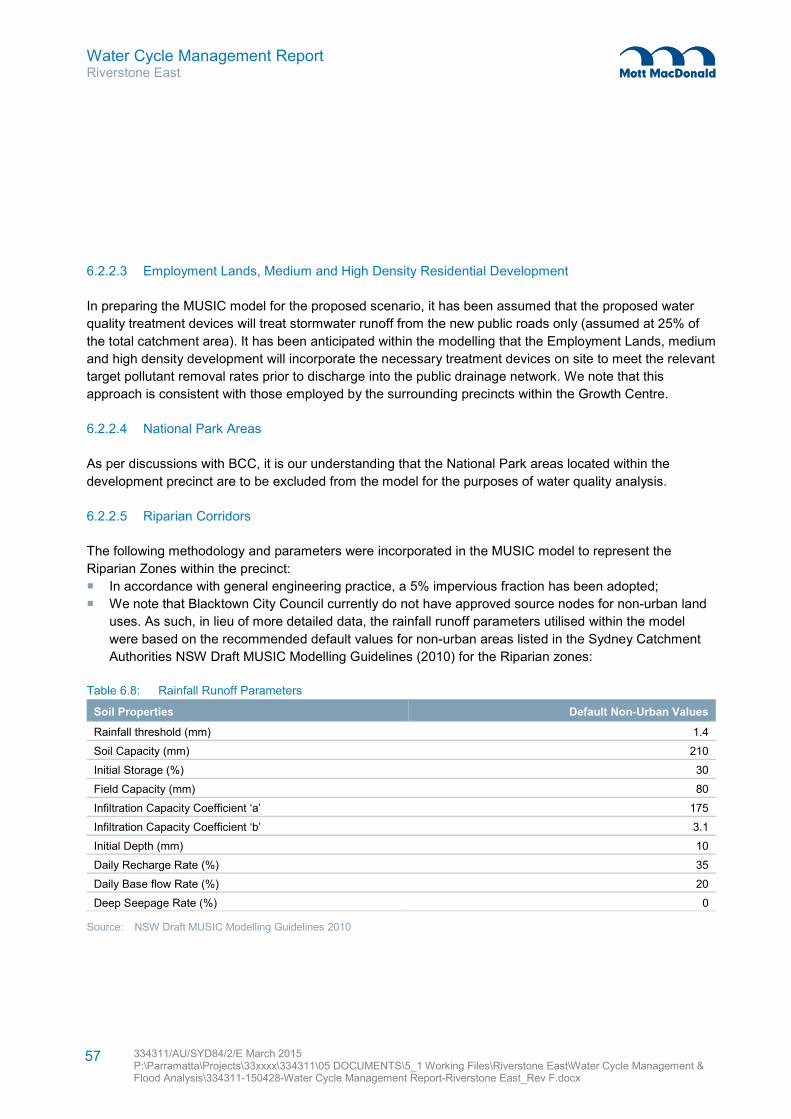
Water Cycle Management Report Riverstone East
334311/AU/SYD84/2/E March 2015 P:\Parramatta\Projects\33xxxx\334311\05 DOCUMENTS\5_1 Working Files\Riverstone East\Water Cycle Management & Flood Analysis\334311-150428-Water Cycle Management Report-Riverstone East_Rev F.docx
57
6.2.2.3 Employment Lands, Medium and High Density Residential Development
In preparing the MUSIC model for the proposed scenario, it has been assumed that the proposed water
quality treatment devices will treat stormwater runoff from the new public roads only (assumed at 25% of
the total catchment area). It has been anticipated within the modelling that the Employment Lands, medium
and high density development will incorporate the necessary treatment devices on site to meet the relevant
target pollutant removal rates prior to discharge into the public drainage network. We note that this
approach is consistent with those employed by the surrounding precincts within the Growth Centre.
6.2.2.4 National Park Areas
As per discussions with BCC, it is our understanding that the National Park areas located within the
development precinct are to be excluded from the model for the purposes of water quality analysis.
6.2.2.5 Riparian Corridors
The following methodology and parameters were incorporated in the MUSIC model to represent the
Riparian Zones within the precinct:
� In accordance with general engineering practice, a 5% impervious fraction has been adopted;
� We note that Blacktown City Council currently do not have approved source nodes for non-urban land
uses. As such, in lieu of more detailed data, the rainfall runoff parameters utilised within the model
were based on the recommended default values for non-urban areas listed in the Sydney Catchment
Authorities NSW Draft MUSIC Modelling Guidelines (2010) for the Riparian zones:
Table 6.8: Rainfall Runoff Parameters
Soil Properties Default Non-Urban Values
Rainfall threshold (mm) 1.4
Soil Capacity (mm) 210
Initial Storage (%) 30
Field Capacity (mm) 80
Infiltration Capacity Coefficient ‘a’ 175
Infiltration Capacity Coefficient ‘b’ 3.1
Initial Depth (mm) 10
Daily Recharge Rate (%) 35
Daily Base flow Rate (%) 20
Deep Seepage Rate (%) 0
Source: NSW Draft MUSIC Modelling Guidelines 2010
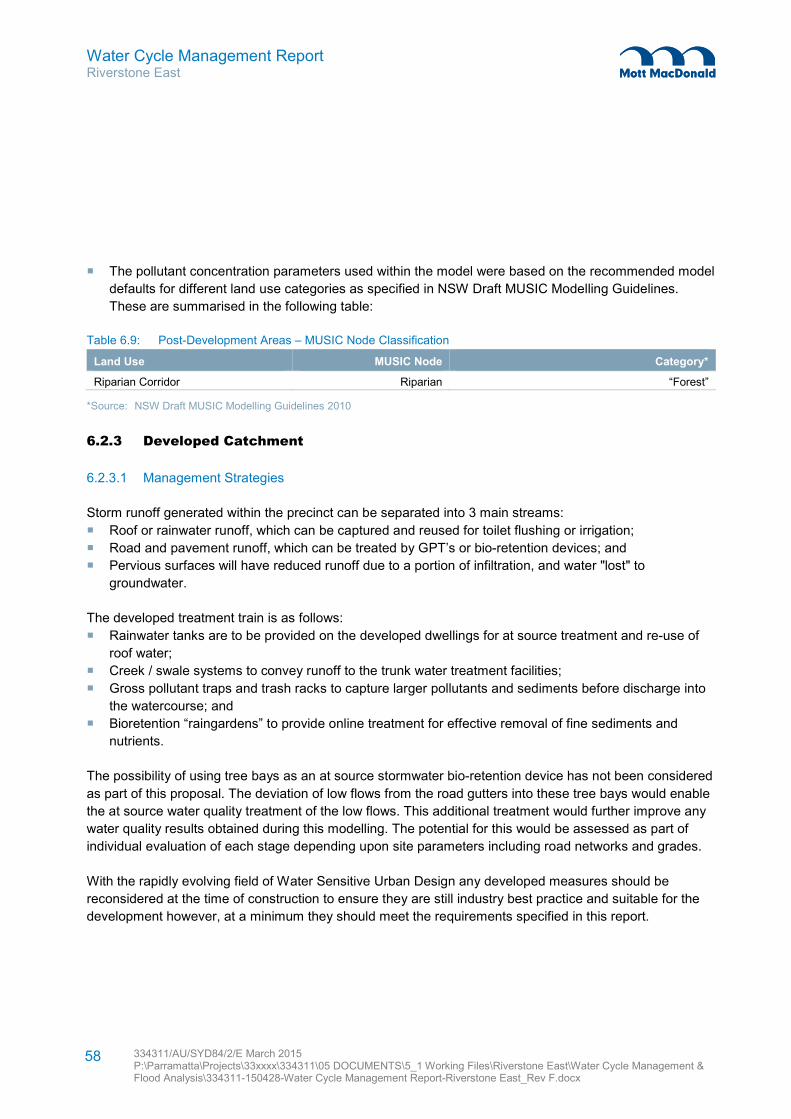
Water Cycle Management Report Riverstone East
334311/AU/SYD84/2/E March 2015 P:\Parramatta\Projects\33xxxx\334311\05 DOCUMENTS\5_1 Working Files\Riverstone East\Water Cycle Management & Flood Analysis\334311-150428-Water Cycle Management Report-Riverstone East_Rev F.docx
58
� The pollutant concentration parameters used within the model were based on the recommended model
defaults for different land use categories as specified in NSW Draft MUSIC Modelling Guidelines.
These are summarised in the following table:
Table 6.9: Post-Development Areas – MUSIC Node Classification
Land Use MUSIC Node Category*
Riparian Corridor Riparian “Forest”
*Source: NSW Draft MUSIC Modelling Guidelines 2010
6.2.3 Developed Catchment
6.2.3.1 Management Strategies
Storm runoff generated within the precinct can be separated into 3 main streams:
� Roof or rainwater runoff, which can be captured and reused for toilet flushing or irrigation;
� Road and pavement runoff, which can be treated by GPT’s or bio-retention devices; and
� Pervious surfaces will have reduced runoff due to a portion of infiltration, and water "lost" to
groundwater.
The developed treatment train is as follows:
� Rainwater tanks are to be provided on the developed dwellings for at source treatment and re-use of
roof water;
� Creek / swale systems to convey runoff to the trunk water treatment facilities;
� Gross pollutant traps and trash racks to capture larger pollutants and sediments before discharge into
the watercourse; and
� Bioretention “raingardens” to provide online treatment for effective removal of fine sediments and
nutrients.
The possibility of using tree bays as an at source stormwater bio-retention device has not been considered
as part of this proposal. The deviation of low flows from the road gutters into these tree bays would enable
the at source water quality treatment of the low flows. This additional treatment would further improve any
water quality results obtained during this modelling. The potential for this would be assessed as part of
individual evaluation of each stage depending upon site parameters including road networks and grades.
With the rapidly evolving field of Water Sensitive Urban Design any developed measures should be
reconsidered at the time of construction to ensure they are still industry best practice and suitable for the
development however, at a minimum they should meet the requirements specified in this report.
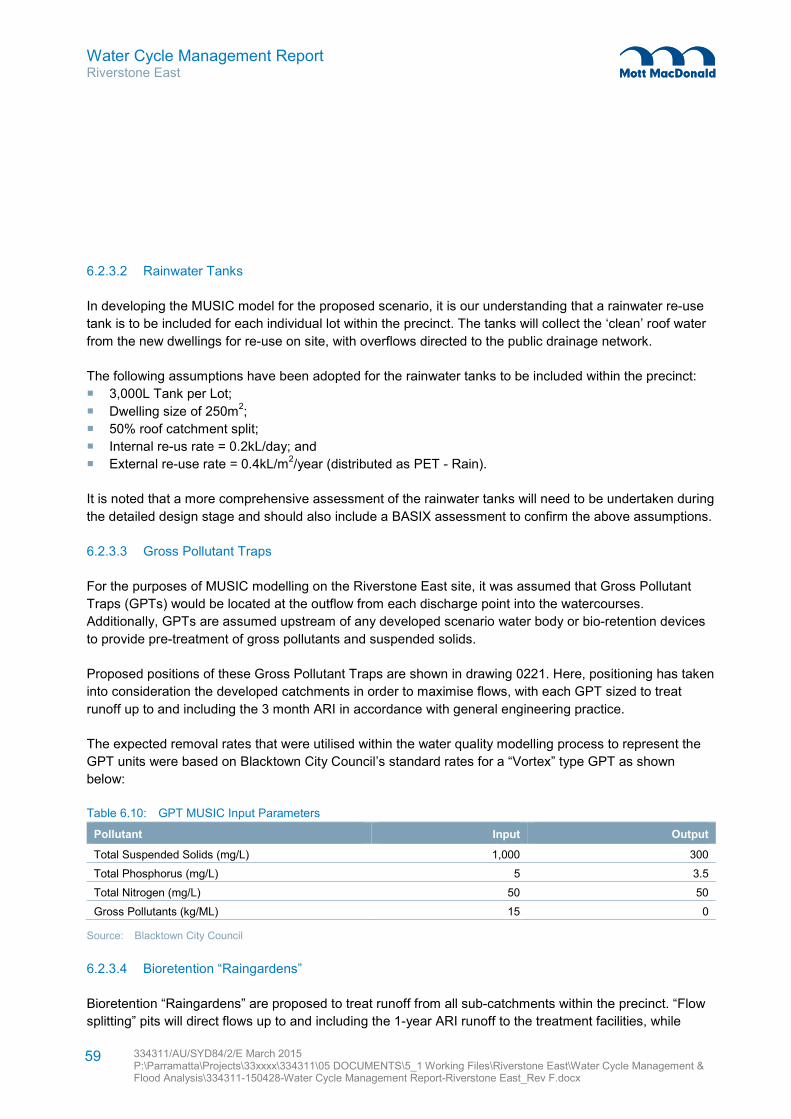
Water Cycle Management Report Riverstone East
334311/AU/SYD84/2/E March 2015 P:\Parramatta\Projects\33xxxx\334311\05 DOCUMENTS\5_1 Working Files\Riverstone East\Water Cycle Management & Flood Analysis\334311-150428-Water Cycle Management Report-Riverstone East_Rev F.docx
59
6.2.3.2 Rainwater Tanks
In developing the MUSIC model for the proposed scenario, it is our understanding that a rainwater re-use
tank is to be included for each individual lot within the precinct. The tanks will collect the ‘clean’ roof water
from the new dwellings for re-use on site, with overflows directed to the public drainage network.
The following assumptions have been adopted for the rainwater tanks to be included within the precinct:
� 3,000L Tank per Lot;
� Dwelling size of 250m2;
� 50% roof catchment split;
� Internal re-us rate = 0.2kL/day; and
� External re-use rate = 0.4kL/m2/year (distributed as PET - Rain).
It is noted that a more comprehensive assessment of the rainwater tanks will need to be undertaken during
the detailed design stage and should also include a BASIX assessment to confirm the above assumptions.
6.2.3.3 Gross Pollutant Traps
For the purposes of MUSIC modelling on the Riverstone East site, it was assumed that Gross Pollutant
Traps (GPTs) would be located at the outflow from each discharge point into the watercourses.
Additionally, GPTs are assumed upstream of any developed scenario water body or bio-retention devices
to provide pre-treatment of gross pollutants and suspended solids.
Proposed positions of these Gross Pollutant Traps are shown in drawing 0221. Here, positioning has taken
into consideration the developed catchments in order to maximise flows, with each GPT sized to treat
runoff up to and including the 3 month ARI in accordance with general engineering practice.
The expected removal rates that were utilised within the water quality modelling process to represent the
GPT units were based on Blacktown City Council’s standard rates for a “Vortex” type GPT as shown
below:
Table 6.10: GPT MUSIC Input Parameters
Pollutant Input Output
Total Suspended Solids (mg/L) 1,000 300
Total Phosphorus (mg/L) 5 3.5
Total Nitrogen (mg/L) 50 50
Gross Pollutants (kg/ML) 15 0
Source: Blacktown City Council
6.2.3.4 Bioretention “Raingardens”
Bioretention “Raingardens” are proposed to treat runoff from all sub-catchments within the precinct. “Flow
splitting” pits will direct flows up to and including the 1-year ARI runoff to the treatment facilities, while
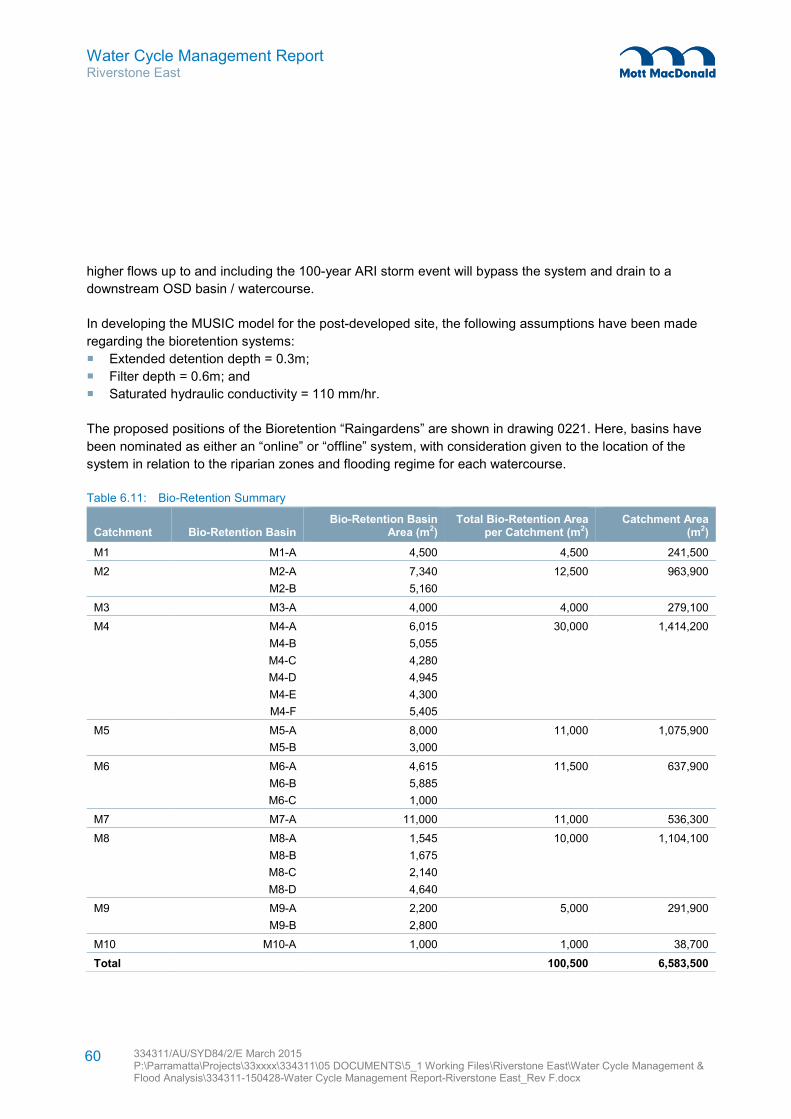
Water Cycle Management Report Riverstone East
334311/AU/SYD84/2/E March 2015 P:\Parramatta\Projects\33xxxx\334311\05 DOCUMENTS\5_1 Working Files\Riverstone East\Water Cycle Management & Flood Analysis\334311-150428-Water Cycle Management Report-Riverstone East_Rev F.docx
60
higher flows up to and including the 100-year ARI storm event will bypass the system and drain to a
downstream OSD basin / watercourse.
In developing the MUSIC model for the post-developed site, the following assumptions have been made
regarding the bioretention systems:
� Extended detention depth = 0.3m;
� Filter depth = 0.6m; and
� Saturated hydraulic conductivity = 110 mm/hr.
The proposed positions of the Bioretention “Raingardens” are shown in drawing 0221. Here, basins have
been nominated as either an “online” or “offline” system, with consideration given to the location of the
system in relation to the riparian zones and flooding regime for each watercourse.
Table 6.11: Bio-Retention Summary
Catchment Bio-Retention Basin Bio-Retention Basin
Area (m2) Total Bio-Retention Area
per Catchment (m2) Catchment Area
(m2)
M1 M1-A 4,500 4,500 241,500
M2 M2-A
M2-B
7,340
5,160
12,500 963,900
M3 M3-A 4,000 4,000 279,100
M4 M4-A
M4-B
M4-C
M4-D
M4-E
M4-F
6,015
5,055
4,280
4,945
4,300
5,405
30,000 1,414,200
M5 M5-A
M5-B
8,000
3,000
11,000 1,075,900
M6 M6-A
M6-B
M6-C
4,615
5,885
1,000
11,500 637,900
M7 M7-A 11,000 11,000 536,300
M8 M8-A
M8-B
M8-C
M8-D
1,545
1,675
2,140
4,640
10,000 1,104,100
M9 M9-A
M9-B
2,200
2,800
5,000 291,900
M10 M10-A 1,000 1,000 38,700
Total 100,500 6,583,500
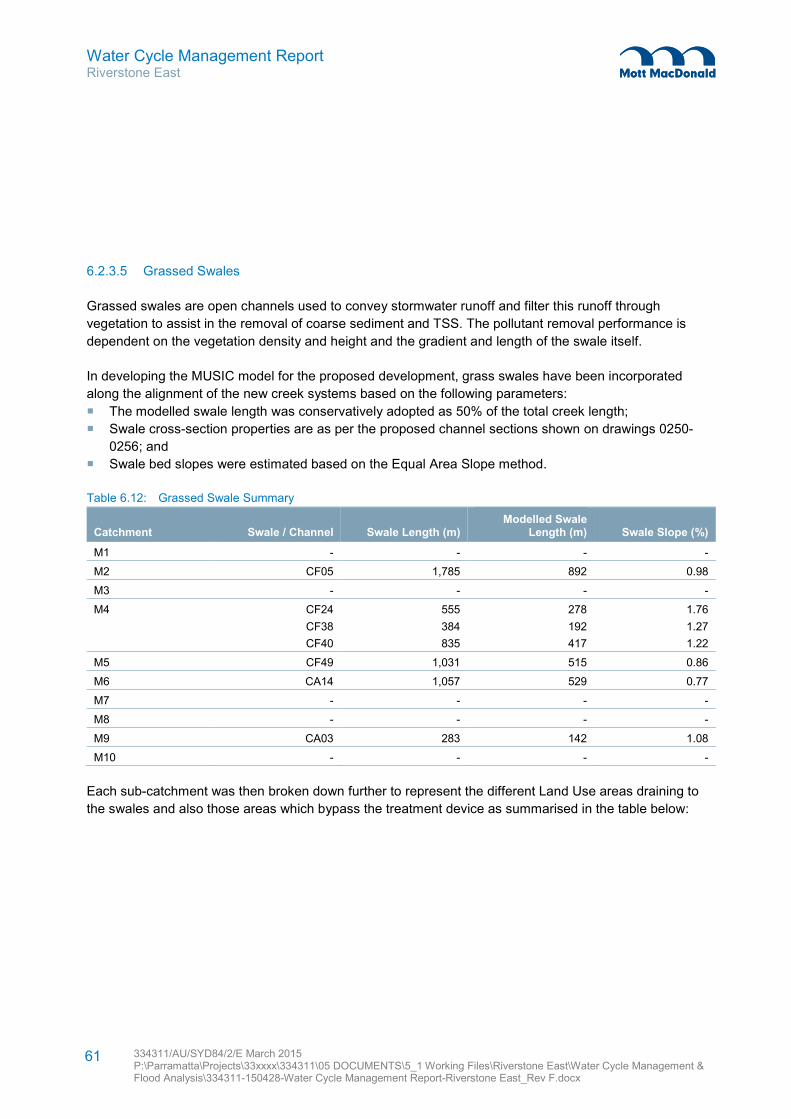
Water Cycle Management Report Riverstone East
334311/AU/SYD84/2/E March 2015 P:\Parramatta\Projects\33xxxx\334311\05 DOCUMENTS\5_1 Working Files\Riverstone East\Water Cycle Management & Flood Analysis\334311-150428-Water Cycle Management Report-Riverstone East_Rev F.docx
61
6.2.3.5 Grassed Swales
Grassed swales are open channels used to convey stormwater runoff and filter this runoff through
vegetation to assist in the removal of coarse sediment and TSS. The pollutant removal performance is
dependent on the vegetation density and height and the gradient and length of the swale itself.
In developing the MUSIC model for the proposed development, grass swales have been incorporated
along the alignment of the new creek systems based on the following parameters:
� The modelled swale length was conservatively adopted as 50% of the total creek length;
� Swale cross-section properties are as per the proposed channel sections shown on drawings 0250-
0256; and
� Swale bed slopes were estimated based on the Equal Area Slope method.
Table 6.12: Grassed Swale Summary
Catchment Swale / Channel Swale Length (m) Modelled Swale
Length (m) Swale Slope (%)
M1 - - - -
M2 CF05 1,785 892 0.98
M3 - - - -
M4 CF24
CF38
CF40
555
384
835
278
192
417
1.76
1.27
1.22
M5 CF49 1,031 515 0.86
M6 CA14 1,057 529 0.77
M7 - - - -
M8 - - - -
M9 CA03 283 142 1.08
M10 - - - -
Each sub-catchment was then broken down further to represent the different Land Use areas draining to
the swales and also those areas which bypass the treatment device as summarised in the table below:
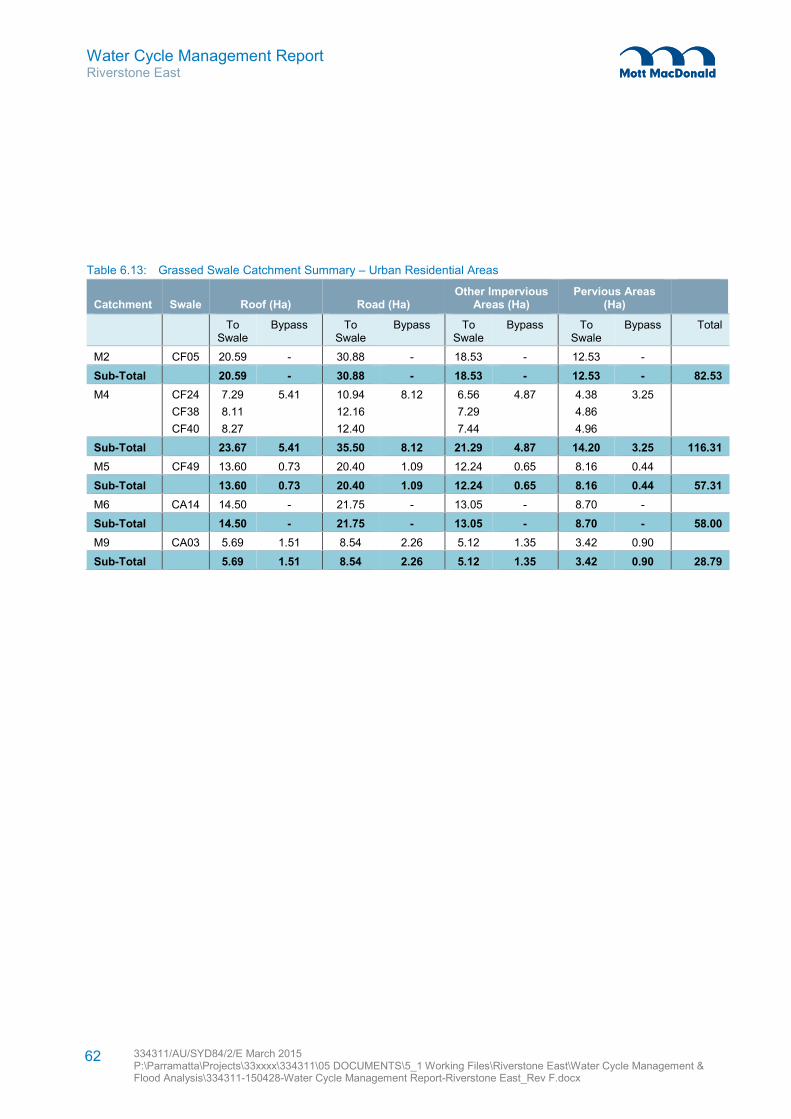
Water Cycle Management Report Riverstone East
334311/AU/SYD84/2/E March 2015 P:\Parramatta\Projects\33xxxx\334311\05 DOCUMENTS\5_1 Working Files\Riverstone East\Water Cycle Management & Flood Analysis\334311-150428-Water Cycle Management Report-Riverstone East_Rev F.docx
62
Table 6.13: Grassed Swale Catchment Summary – Urban Residential Areas
Catchment Swale Roof (Ha) Road (Ha) Other Impervious
Areas (Ha) Pervious Areas
(Ha)
To Swale
Bypass To Swale
Bypass To Swale
Bypass To Swale
Bypass Total
M2 CF05 20.59 - 30.88 - 18.53 - 12.53 -
Sub-Total 20.59 - 30.88 - 18.53 - 12.53 - 82.53
M4 CF24
CF38
CF40
7.29
8.11
8.27
5.41 10.94
12.16
12.40
8.12 6.56
7.29
7.44
4.87 4.38
4.86
4.96
3.25
Sub-Total 23.67 5.41 35.50 8.12 21.29 4.87 14.20 3.25 116.31
M5 CF49 13.60 0.73 20.40 1.09 12.24 0.65 8.16 0.44
Sub-Total 13.60 0.73 20.40 1.09 12.24 0.65 8.16 0.44 57.31
M6 CA14 14.50 - 21.75 - 13.05 - 8.70 -
Sub-Total 14.50 - 21.75 - 13.05 - 8.70 - 58.00
M9 CA03 5.69 1.51 8.54 2.26 5.12 1.35 3.42 0.90
Sub-Total 5.69 1.51 8.54 2.26 5.12 1.35 3.42 0.90 28.79
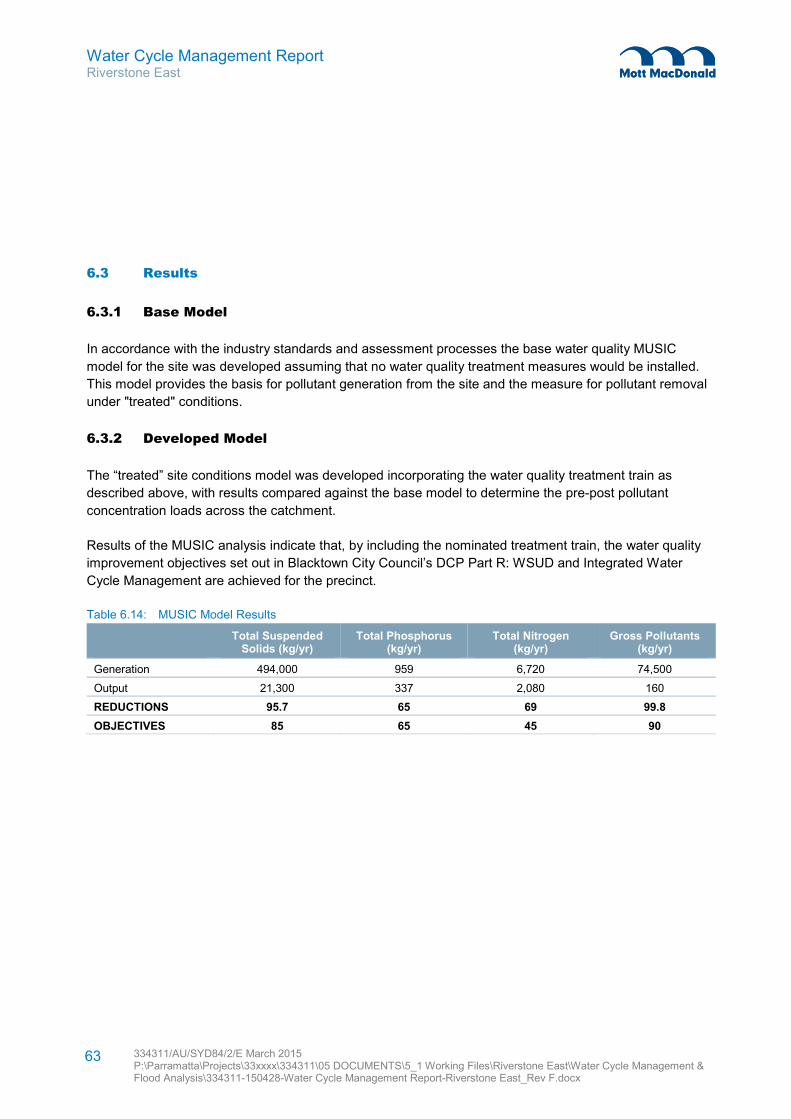
Water Cycle Management Report Riverstone East
334311/AU/SYD84/2/E March 2015 P:\Parramatta\Projects\33xxxx\334311\05 DOCUMENTS\5_1 Working Files\Riverstone East\Water Cycle Management & Flood Analysis\334311-150428-Water Cycle Management Report-Riverstone East_Rev F.docx
63
6.3 Results
6.3.1 Base Model
In accordance with the industry standards and assessment processes the base water quality MUSIC
model for the site was developed assuming that no water quality treatment measures would be installed.
This model provides the basis for pollutant generation from the site and the measure for pollutant removal
under "treated" conditions.
6.3.2 Developed Model
The “treated” site conditions model was developed incorporating the water quality treatment train as
described above, with results compared against the base model to determine the pre-post pollutant
concentration loads across the catchment.
Results of the MUSIC analysis indicate that, by including the nominated treatment train, the water quality
improvement objectives set out in Blacktown City Council’s DCP Part R: WSUD and Integrated Water
Cycle Management are achieved for the precinct.
Table 6.14: MUSIC Model Results
Total Suspended
Solids (kg/yr) Total Phosphorus
(kg/yr) Total Nitrogen
(kg/yr) Gross Pollutants
(kg/yr)
Generation 494,000 959 6,720 74,500
Output 21,300 337 2,080 160
REDUCTIONS 95.7 65 69 99.8
OBJECTIVES 85 65 45 90
Water Cycle Management Report Riverstone East
334311/AU/SYD84/2/E March 2015 P:\Parramatta\Projects\33xxxx\334311\05 DOCUMENTS\5_1 Working Files\Riverstone East\Water Cycle Management & Flood Analysis\334311-150428-Water Cycle Management Report-Riverstone East_Rev F.docx
64
Appendices
Appendix A. Drawings _________________________________________________________________________ 65 Appendix B. RAFTS Model Data _________________________________________________________________ 66 Appendix C. Peak Flows from RAFTS_____________________________________________________________ 67 Appendix D. Tuflow Results ____________________________________________________________________ 68 Appendix E. Channel Cross Section Calculations ____________________________________________________ 69
Related Documents