Communication Water Content Monitoring in Water-in-Crude-Oil Emulsions Using an Ultrasonic Multiple-Backscattering Sensor Alberto L. Durán 1, *, Ediguer E. Franco 2 , Carlos A. B. Reyna 1 , Nicolás Pérez 3 , Marcos S. G. Tsuzuki 1 and Flávio Buiochi 1 Citation: Durán, A.L.; Franco, E.E.; Reyna, C.A.B.; Pérez, N.; Tsuzuki, M.S.G.; Buiochi, F. Water Content Monitoring in Water-in-Crude-Oil Emulsions Using an Ultrasonic Multiple-Backscattering Sensor. Sensors 2021, 21, 5088. https:// doi.org/10.3390/s21155088 Academic Editor:Jangmyung Lee Received: 20 April 2021 Accepted: 12 June 2021 Published: 27 July 2021 Publisher’s Note: MDPI stays neutral with regard to jurisdictional claims in published maps and institutional affil- iations. Copyright: © 2021 by the authors. Licensee MDPI, Basel, Switzerland. This article is an open access article distributed under the terms and conditions of the Creative Commons Attribution (CC BY) license (https:// creativecommons.org/licenses/by/ 4.0/). 1 Laboratory of Computational Geometry, Escola Politécnica da Universidade de São Paulo, São Paulo 05508-220, Brazil; [email protected] (C.A.B.R.); [email protected] (M.S.G.T.); [email protected] (F.B.) 2 Facultad de Ingeniería, Universidad Autónoma de Occidente, Santiago de Cali 760030, Colombia; [email protected] 3 Facultad de Ingeniería, Universidad de la Republica, Montevideo 11200, Uruguay; nico@fisica.edu.uy * Correspondence: [email protected] Abstract: This work shows the application of an ultrasonic multiple-scattering sensor for monitoring water-in-petroleum emulsions. The sensor consists of a commercial ultrasonic transducer with an array of cylindrical scatterers placed in the near field. The scatterers are thin metal bars arranged in rows in front of the transducer. The backscattering signals were analyzed by calculating the wave energy and by a cross-correlation between signal segments; they were also used to determine the propagation velocity in the emulsions. The tests performed used emulsions with water volume concentrations from 0% to 50%. The results showed that both the signal energy and propagation velocity strongly depended on the concentration of water in the emulsion. Therefore, the ultrasonic multiple-scattering sensor can be used for on-line and real-time monitoring of the water content in water-in-crude-oil emulsions. Keywords: water-in-crude-oil emulsion; water content; ultrasound; propagation speed 1. Introduction An emulsion is a mixture of two immiscible liquids, where one liquid is dispersed in the other in the form of small drops. Water-in-oil (W/O) and oil-in-water (O/W) emulsions are present in different industrial products and processes. Examples of final products in emulsion form include homogenized milk [1] and the cutting fluids used for machining processes [2]. There are also some processes in which the raw or intermediate product is an emulsion, such as palm oil [3] and petroleum production [4]. Some physical properties of the emulsion are relevant for controlling and improving the industrial process. The main property is likely the volume fraction of the constituent liquids (phases), because other properties, such as the emulsion type (W/O or O/W), stability, density, absorptivity, viscosity, etc., strongly depend on the volume fraction. In the petroleum industry, crude oil extracted from a field has mixed water in different proportions. In the cases of offshore fields or enhanced oil recovery (EOR), in which water is used as displacement fluid to extract the remaining oil in old fields, the amount of water is generally greater. Its presence produces catalyst poisoning in the refining process, and if it is salty, additional corrosion problems are generated in pipes and equipment. In addition, the limit on the amount of water allowed in crude oil for transportation and refining is less than 1% [5]. Characterization techniques for oil-water emulsions include electron microscopy [6], light [7] and neutron [8] scattering, and nuclear magnetic resonance [9]. However, these techniques do not work well for dilute and opaque emulsions, such as water-in-crude-oil emulsions. Other techniques that perform better in opaque emulsions use X-rays [10] and Sensors 2021, 21, 5088. https://doi.org/10.3390/s21155088 https://www.mdpi.com/journal/sensors

Welcome message from author
This document is posted to help you gain knowledge. Please leave a comment to let me know what you think about it! Share it to your friends and learn new things together.
Transcript
Communication
Water Content Monitoring in Water-in-Crude-Oil EmulsionsUsing an Ultrasonic Multiple-Backscattering Sensor
Alberto L. Durán 1,*, Ediguer E. Franco 2, Carlos A. B. Reyna 1, Nicolás Pérez 3 , Marcos S. G. Tsuzuki 1
and Flávio Buiochi 1
�����������������
Citation: Durán, A.L.; Franco, E.E.;
Reyna, C.A.B.; Pérez, N.; Tsuzuki,
M.S.G.; Buiochi, F. Water Content
Monitoring in Water-in-Crude-Oil
Emulsions Using an Ultrasonic
Multiple-Backscattering Sensor.
Sensors 2021, 21, 5088. https://
doi.org/10.3390/s21155088
Academic Editor:Jangmyung Lee
Received: 20 April 2021
Accepted: 12 June 2021
Published: 27 July 2021
Publisher’s Note: MDPI stays neutral
with regard to jurisdictional claims in
published maps and institutional affil-
iations.
Copyright: © 2021 by the authors.
Licensee MDPI, Basel, Switzerland.
This article is an open access article
distributed under the terms and
conditions of the Creative Commons
Attribution (CC BY) license (https://
creativecommons.org/licenses/by/
4.0/).
1 Laboratory of Computational Geometry, Escola Politécnica da Universidade de São Paulo,São Paulo 05508-220, Brazil; [email protected] (C.A.B.R.); [email protected] (M.S.G.T.);[email protected] (F.B.)
2 Facultad de Ingeniería, Universidad Autónoma de Occidente, Santiago de Cali 760030, Colombia;[email protected]
3 Facultad de Ingeniería, Universidad de la Republica, Montevideo 11200, Uruguay; [email protected]* Correspondence: [email protected]
Abstract: This work shows the application of an ultrasonic multiple-scattering sensor for monitoringwater-in-petroleum emulsions. The sensor consists of a commercial ultrasonic transducer with anarray of cylindrical scatterers placed in the near field. The scatterers are thin metal bars arranged inrows in front of the transducer. The backscattering signals were analyzed by calculating the waveenergy and by a cross-correlation between signal segments; they were also used to determine thepropagation velocity in the emulsions. The tests performed used emulsions with water volumeconcentrations from 0% to 50%. The results showed that both the signal energy and propagationvelocity strongly depended on the concentration of water in the emulsion. Therefore, the ultrasonicmultiple-scattering sensor can be used for on-line and real-time monitoring of the water content inwater-in-crude-oil emulsions.
Keywords: water-in-crude-oil emulsion; water content; ultrasound; propagation speed
1. Introduction
An emulsion is a mixture of two immiscible liquids, where one liquid is dispersed inthe other in the form of small drops. Water-in-oil (W/O) and oil-in-water (O/W) emulsionsare present in different industrial products and processes. Examples of final products inemulsion form include homogenized milk [1] and the cutting fluids used for machiningprocesses [2]. There are also some processes in which the raw or intermediate product is anemulsion, such as palm oil [3] and petroleum production [4].
Some physical properties of the emulsion are relevant for controlling and improvingthe industrial process. The main property is likely the volume fraction of the constituentliquids (phases), because other properties, such as the emulsion type (W/O or O/W),stability, density, absorptivity, viscosity, etc., strongly depend on the volume fraction.
In the petroleum industry, crude oil extracted from a field has mixed water in differentproportions. In the cases of offshore fields or enhanced oil recovery (EOR), in which wateris used as displacement fluid to extract the remaining oil in old fields, the amount of wateris generally greater. Its presence produces catalyst poisoning in the refining process, and ifit is salty, additional corrosion problems are generated in pipes and equipment. In addition,the limit on the amount of water allowed in crude oil for transportation and refining is lessthan 1% [5].
Characterization techniques for oil-water emulsions include electron microscopy [6],light [7] and neutron [8] scattering, and nuclear magnetic resonance [9]. However, thesetechniques do not work well for dilute and opaque emulsions, such as water-in-crude-oilemulsions. Other techniques that perform better in opaque emulsions use X-rays [10] and
Sensors 2021, 21, 5088. https://doi.org/10.3390/s21155088 https://www.mdpi.com/journal/sensors
Sensors 2021, 21, 5088 2 of 10
gamma rays [11]. Yet ionizing radiation requires special handling. The best establishedtechniques are likely the electrical methods, which are based on the measurement of theelectrical conductivity, dielectric permittivity, electrical capacitance, and admittance [12,13].
These techniques are affected by the salinity and conductive properties of the mix-ture. In turn, common methods for determining the water content in crude oil, such ascentrifugation [14], Karl Fisher distillation, and grinding methods [15], require extracting asample from the pipelines for further processing in a laboratory. These laboratory tests aretime-consuming and delay the processing or transportation of the crude oil.
Ultrasonic methods have also been used to determine the volume fraction of theconstituent phases of emulsions, which are based on the ultrasonic measurement of thereflection, transmission and attenuation coefficients. These are interesting techniques dueto the following advantages: the medium can be opaque; there is no ionizing radiation;they have relatively low costs; and the sensors and equipment are robust [16]. However,the propagation of acoustic waves in emulsions is a complex phenomenon that depends onthe physical properties, the volume fraction of the phases, and the drop size distribution ofthe dispersed phase [17].
In a non-scattering medium, the attenuation is a consequence of the sound absorptionthrough mechanisms that convert wave energy into heat, such as viscous losses, heat con-duction losses, and relaxation losses [18]. In a scattering medium, an excess of attenuationand changes in the propagation velocity depend on the droplet size, the volume fraction,and the operating frequency. However, according to the scattering theory, the change in thepropagation velocity due to scattering is small at the limit of the long wavelength. In turn,a change in concentration affects the propagation velocity to a greater extent [19,20]. Thisprovides a useful measurement range for concentration monitoring using ultrasonic waves.
The literature has reported several works related to the characterization of water–oilmixtures by ultrasound. Ultrasound has been proven useful to detect water contamina-tion in lubricating oils [21] and, conversely, to detect small amounts of oily substance inwater [22]. To determine the concentration of the phases in the mixture, several approacheshave been investigated. Ultrasonic spectroscopy allows determining the distribution ofdroplet sizes and concentration by analyzing the propagation velocity and attenuationspectra [17,23]. This is a well-established technique that is useful in a wide range of dropletsizes but restricted to dilute emulsions [24].
Water-in-crude-oil emulsions are concentrated with a wide drop size distribution [25].This characteristic leads to dispersive and high attenuation media. Under these condi-tions, the best approach is the monitoring of an average acoustic parameter at a suitableoperating frequency. In this sense, some authors have used the monitoring of the receivedamplitude [26] and the propagation velocity [27] as a measurement mechanism, using avariety of techniques for analyzing the signals. Those researchers studied the response ofultrasonic sensors (in transmission-reception mode) in a vertical channel.
Using symbolic dynamic filtering for the analysis of the signals, they showed thepotential of the proposed technique to determine the water content in a water–oil mixturefor water concentrations below 35% by volume [26]. Other authors reported experimentswith mixtures of water and crude oil in a flow loop. A sensor based on acoustic methodsallowed measuring the water concentration (between 64% and 96% of water by weight)with an error of less than 2%, compared to the concentration calculated with the mass flowof each phase measured by Coriollis-type sensors [28].
Ultrasonic backscattering has been used to measure the sediment concentration inliquids [29] and directly in rivers [30]. High frequency (50 MHz) ultrasonic backscatteredsignals were used for measuring cell concentration in cell cultures, showing that this tech-nique allowed for the differentiation of red blood cells of various sizes [31]. The techniquewas also used for measuring the concentration of yeasts in suspensions, showing bettersensitivity than spectrophotometric techniques [32]. A multiple-backscattering measure-ment sensor in the configuration used herein was used to monitor milk coagulation [33]and to characterize water-in-hydraulic-oil emulsions [34].

Sensors 2021, 21, 5088 3 of 10
We report the application of a multiple-scattering ultrasonic sensor for monitoringwater-in-crude-oil emulsions. The main interest is the online determination of the watercontent. Measurement with emulsion samples with water contents ranging from 0 to 50% involume were carried out at 22 ◦C. The cross-correlation and wave energy parameters wereanalyzed as a function of time and as a function of the water concentration. Additionally,a novel signal processing methodology for measuring the propagation velocity is proposed.
2. Materials and Methods2.1. Measurement Device
Figure 1a shows the measurement device, which consisted of a 3.5-MHz and 0.75-inch-diameter commercial ultrasonic transducer (Panametrics V381-SU, Olympus NDT INC,Waltham, MA, USA ) with an array of cylindrical scatterers placed in the near field. The con-figuration of the scatterers is shown in Figure 1b. The scatterers were made of stainlesssteel bars of 1.6-mm diameter, which were arranged in rows in a square stainless steeltube, where W = H = 60 mm and L = 65 mm. The separation between the rows waslz = 6.0 mm, and the separation between scatterers of the same row was lx = 4 mm.These rows were displaced one third of the separation between scatterers of a same row(4/3 mm), and thus the fourth row was aligned with the first. A polymeric adapter heldthe ultrasonic transducer.
(a) (b) (c)
Figure 1. Multiple-scattering sensor: (a) image, (b) schematic representation of the distribution of the cylindrical scatterersin front of the transducer, and (c) acquired backscattering signal in water.
Figure 1c shows the a(t) scattering signal obtained with the sensor. The a1(t), a2(t),and a3(t) signals are segments of a(t), defined around the theoretical arrival time ofreflections from the first, second, and third row of scatterers, respectively. These theoreticalarrival times (tin) were defined using the design separation between consecutive rows ofscatterers (lz) and assuming the propagation velocity of water (cw) at the test temperature(22 ◦C):
tin =2nlzcw
, (1)
where n = 1, 2, 3 is the n th row of scatterers.
2.2. Signal Processing
In this work, we analyzed the effect of the water content in the emulsion on thebackscattering ultrasonic signals. Several methodologies were used to extract the informa-tion from the signals. These methodologies are based on monitoring the change of a signalproperty over time, in relation to the signal obtained with a reference sample. The referencesample used in all tests was pure crude oil.

Sensors 2021, 21, 5088 4 of 10
2.2.1. Cross-Correlation
The cross-correlation measures the similarity of two signals as a function of thedisplacement of one relatively to the other [35]. It is defined by
R[are f , a] =∫ +∞
−∞are f (τ)a(τ + t)dτ, (2)
where are f (t) is the reference signal and a(t) the signal obtained with the emulsion. The re-sult is normalized using the autocorrelation:
Rr =R[are f , a]
R[are f , are f ], (3)
then, Rr is denoted as the “normalized relative cross-correlation”.
2.2.2. Relative Wave Energy
The wave energy is defined as the integral of the squared voltage signal and iscalculated by
E =∫ tb
ta|a(t)|2dt, (4)
where ta and tb define the calculation time window, covering the reflections from all rowsof scatterers. Then, the energy of the signal obtained with the emulsion is normalized withthe energy of the reference signal, as follows
Er =E
Ere f(5)
2.2.3. Propagation Velocity
To determine the propagation velocity, a signal analysis methodology that looks for theposition of two consecutive rows of scatterers was implemented. A peak search algorithmseeks the arrival time of the maximum absolute value of amplitude. This is done in atime window centered around the theoretical arrival time (water case) of the reflectionsfrom the first (a1) and second (a2) rows of scatterers. The time difference (∆t12) enables thepropagation velocity to be calculated:
c12 =2lz
∆t12. (6)
The lz value is known. Small errors in the manufacturing process can modify thedesign value, and the calculated propagation velocity can be affected. To reduce this error,the lz distance was determined by performing a test with water at the temperature ofinterest, since the water propagation velocity is a well-known property.
The time delay calculation between the reflections from the first and second rowsof scatterers can also be performed using an algorithm based on the cross-correlation.However, the results from this method showed a high dispersion. The peak search algo-rithm also showed deviations caused by the detection of a neighboring peak point. In thiscase, the results that could lead to wrong interpretations can be easily filtered because theobtained speed is typically far from the expected value. Another option is to take the valuethat appears most often (the mode).
2.3. Experimental Procedure
The samples were water-in-crude-oil emulsions with the volume concentration ofwater from 0% to 50%. The emulsions were made using a light crude oil supplied by theBrazilian company Petrobras (30.5◦ API), degassed water, and a mixer (Ika Labortechnik,Staufen, Germany, 8000–24,000 rpm) for homogenization. The samples, for each concen-
Sensors 2021, 21, 5088 5 of 10
tration, were mixed for 2 min at 8000 rpm, and then left to rest for 3 to 5 min to eliminatethe air bubbles introduced in the mixing process. In the experiment, successive concen-trations were obtained by adding water, at 22 ◦C, to an emulsion that was previouslyprepared. We started with pure oil (water concentration of 0) and ended by achieving awater concentration of 50%.
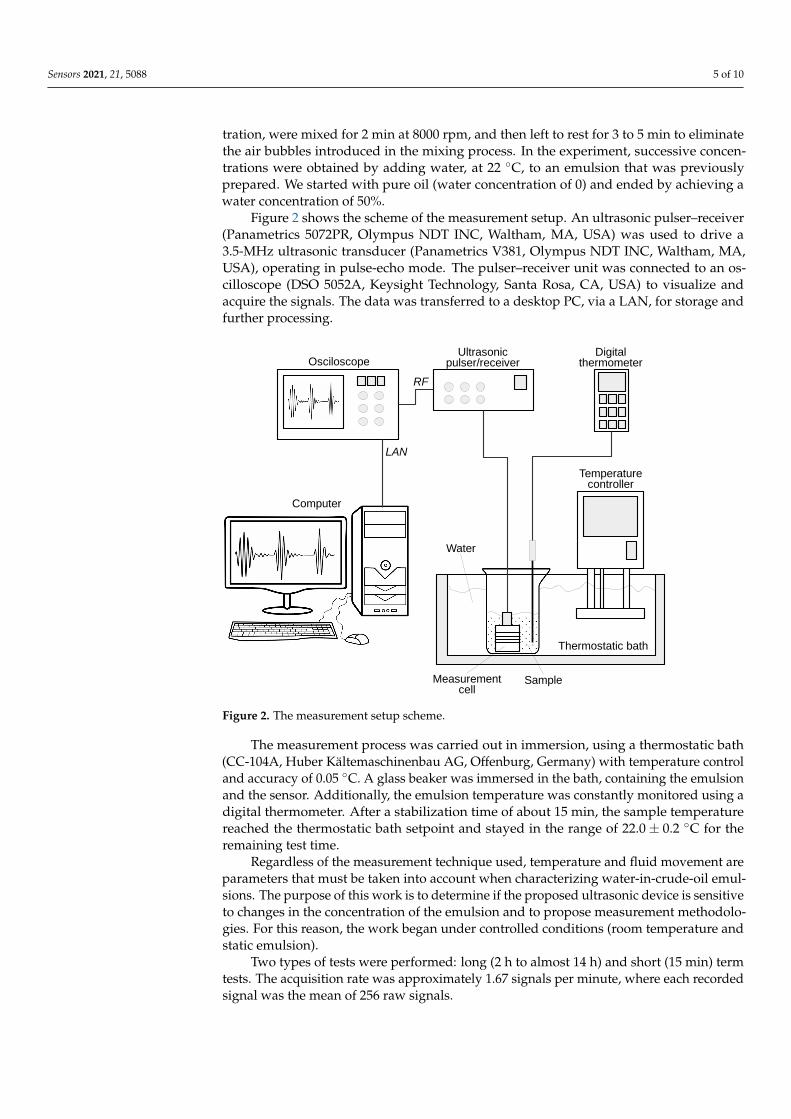
Figure 2 shows the scheme of the measurement setup. An ultrasonic pulser–receiver(Panametrics 5072PR, Olympus NDT INC, Waltham, MA, USA) was used to drive a3.5-MHz ultrasonic transducer (Panametrics V381, Olympus NDT INC, Waltham, MA,USA), operating in pulse-echo mode. The pulser–receiver unit was connected to an os-cilloscope (DSO 5052A, Keysight Technology, Santa Rosa, CA, USA) to visualize andacquire the signals. The data was transferred to a desktop PC, via a LAN, for storage andfurther processing.
Figure 2. The measurement setup scheme.
The measurement process was carried out in immersion, using a thermostatic bath(CC-104A, Huber Kältemaschinenbau AG, Offenburg, Germany) with temperature controland accuracy of 0.05 ◦C. A glass beaker was immersed in the bath, containing the emulsionand the sensor. Additionally, the emulsion temperature was constantly monitored using adigital thermometer. After a stabilization time of about 15 min, the sample temperaturereached the thermostatic bath setpoint and stayed in the range of 22.0± 0.2 ◦C for theremaining test time.
Regardless of the measurement technique used, temperature and fluid movement areparameters that must be taken into account when characterizing water-in-crude-oil emul-sions. The purpose of this work is to determine if the proposed ultrasonic device is sensitiveto changes in the concentration of the emulsion and to propose measurement methodolo-gies. For this reason, the work began under controlled conditions (room temperature andstatic emulsion).
Two types of tests were performed: long (2 h to almost 14 h) and short (15 min) termtests. The acquisition rate was approximately 1.67 signals per minute, where each recordedsignal was the mean of 256 raw signals.
Sensors 2021, 21, 5088 6 of 10
3. Results and Discussion
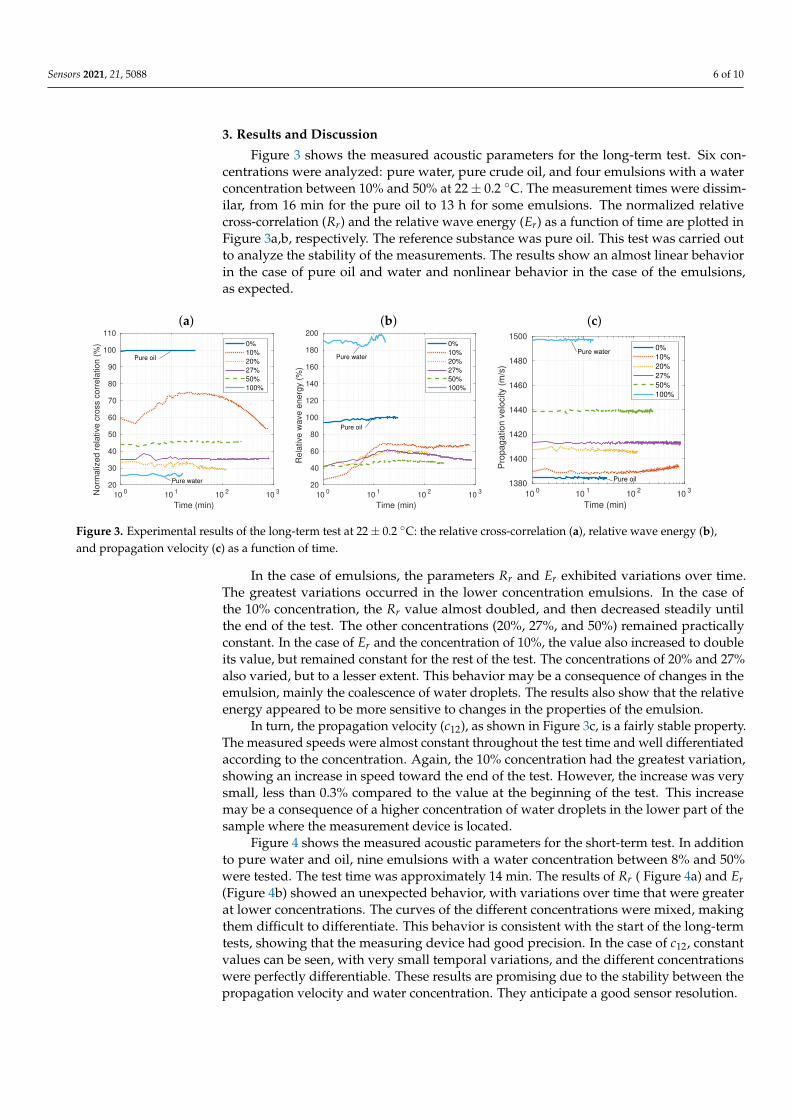
Figure 3 shows the measured acoustic parameters for the long-term test. Six con-centrations were analyzed: pure water, pure crude oil, and four emulsions with a waterconcentration between 10% and 50% at 22± 0.2 ◦C. The measurement times were dissim-ilar, from 16 min for the pure oil to 13 h for some emulsions. The normalized relativecross-correlation (Rr) and the relative wave energy (Er) as a function of time are plotted inFigure 3a,b, respectively. The reference substance was pure oil. This test was carried outto analyze the stability of the measurements. The results show an almost linear behaviorin the case of pure oil and water and nonlinear behavior in the case of the emulsions,as expected.
(a) (b) (c)
100
101
102
103
Time (min)
20
30
40
50
60
70
80
90
100
110
Norm
aliz
ed r
ela
tive c
ross c
orr
ela
tion (
%) 0%
10%
20%
27%
50%
100%
Pure oil
Pure water
100
101
102
103
Time (min)
20
40
60
80
100
120
140
160
180
200
Rela
tive w
ave e
nerg
y (
%)
0%
10%
20%
27%
50%
100%
Pure oil
Pure water
100
101
102
103
Time (min)
1380
1400
1420
1440
1460
1480
1500
Pro
pagation v
elo
city (
m/s
)
0%
10%
20%
27%
50%
100%
Pure water
Pure oil
Figure 3. Experimental results of the long-term test at 22± 0.2 ◦C: the relative cross-correlation (a), relative wave energy (b),and propagation velocity (c) as a function of time.
In the case of emulsions, the parameters Rr and Er exhibited variations over time.The greatest variations occurred in the lower concentration emulsions. In the case ofthe 10% concentration, the Rr value almost doubled, and then decreased steadily untilthe end of the test. The other concentrations (20%, 27%, and 50%) remained practicallyconstant. In the case of Er and the concentration of 10%, the value also increased to doubleits value, but remained constant for the rest of the test. The concentrations of 20% and 27%also varied, but to a lesser extent. This behavior may be a consequence of changes in theemulsion, mainly the coalescence of water droplets. The results also show that the relativeenergy appeared to be more sensitive to changes in the properties of the emulsion.
In turn, the propagation velocity (c12), as shown in Figure 3c, is a fairly stable property.The measured speeds were almost constant throughout the test time and well differentiatedaccording to the concentration. Again, the 10% concentration had the greatest variation,showing an increase in speed toward the end of the test. However, the increase was verysmall, less than 0.3% compared to the value at the beginning of the test. This increasemay be a consequence of a higher concentration of water droplets in the lower part of thesample where the measurement device is located.
Figure 4 shows the measured acoustic parameters for the short-term test. In additionto pure water and oil, nine emulsions with a water concentration between 8% and 50%were tested. The test time was approximately 14 min. The results of Rr ( Figure 4a) and Er(Figure 4b) showed an unexpected behavior, with variations over time that were greaterat lower concentrations. The curves of the different concentrations were mixed, makingthem difficult to differentiate. This behavior is consistent with the start of the long-termtests, showing that the measuring device had good precision. In the case of c12, constantvalues can be seen, with very small temporal variations, and the different concentrationswere perfectly differentiable. These results are promising due to the stability between thepropagation velocity and water concentration. They anticipate a good sensor resolution.

Sensors 2021, 21, 5088 7 of 10
(a) (b) (c)
0 5 10 15
Time (min)
20
30
40
50
60
70
80
90
100
Norm
aliz
ed r
ela
tive c
ross c
orr
ela
tion (
%)
0%
8%
14%
20%
25%
31%
37%
41%
45%
50%
100%
Pure oil
Pure water
0 5 10 15
Time (min)
40
60
80
100
120
140
160
180
200220
Rela
tive w
ave e
nerg
y (
%)
0%
8%
14%
20%
25%
31%
37%
41%
45%
50%
100%
Pure water
Pure oil
0 5 10 15
Time (min)
1380
1400
1420
1440
1460
1480
1500
Pro
pagation v
elo
city (
m/s
)
0%
8%
14%
20%
25%
31%
37%
41%
45%
50%
100%
Pure water
Pure oil
Figure 4. Experimental results of the short-term test: the relative cross-correlation (a), relative wave energy (b), and propa-gation velocity (c) as a function of time at 22± 0.2 ◦C.
The calculated acoustic parameters for both long- and short-term tests (Figures 3 and 4,respectively) are presented in the form of the mean and standard deviation of all temporalsamples, as shown in Figure 5. Figure 5a shows the relative cross-correlation (Rr) as afunction of the water concentration (in percentage) for both the long-term and short-termtests. For small concentrations, the Rr value decreased from 1 to a minimum value ofabout 0.3 at a concentration of 20%. This behavior was the same in both tests. In the rangebetween 20% and 50%, Rr increased slightly until it reached a maximum value of 0.46 justbefore 50%. The values obtained with pure water for the two tests were close to 0.26. In thisrange, the short-term test exhibited a wider variation in Rr compared to the long-term test.
(a) (b) (c)
0 20 40 60 80 100
Water concentration (%)
20
30
40
50
60
70
80
90
100
Norm
aliz
ed r
ela
tive c
ross c
orr
ela
tion (
%) Long-term test
Short-term test
0 20 40 60 80 100
Water concentration (%)
40
60
80
100
120
140
160
180
200
Rela
tive w
ave e
nerg
y (
%)
Long-term test
Short-term test
0 20 40 60 80 100
Water concentration (%)
1380
1400
1420
1440
1460
1480
1500
Pro
pagation v
elo
city (
m/s
)
Long-term test
Short-term test
Urick model
Linear model
Figure 5. The experimental results as a function of the water concentration: (a) relative cross correlation, (b) relative waveenergy, and (c) propagation velocity at 22± 0.2 ◦C.
The monotonic decreasing behavior observed at low concentrations, in both tests, pro-vides a useful measuring range between 0 and 20%. These results suggest good sensitivityand temporal stability. Taking into account that most emulsions found in the oil industryhave a volumetric water concentration of less than 20%, this result is relevant. However,additional studies are needed to support the results yielded here.
Figure 5b shows the relative wave energy as a function of the concentration for boththe long- and short-term tests. In this case, the relative energy value continuously decreasedin the entire range, from 1.0 for pure oil to 0.45 for an emulsion with water concentrationof 50%. The behavior was the same in both tests; however, there were small numericaldifferences, which were a consequence of the emulsion physical properties varying in time.
Figure 5c shows the propagation velocity as a function of the concentration for boththe long- and short-term tests. The calculation methodology was explained in Section 2.2.The propagation velocity increased from the minimum value measured with pure oil to themaximum value for water. This variation was linear with respect to the water concentration,
Sensors 2021, 21, 5088 8 of 10
suggesting that it can be modeled by a simple mixing rule, albeit different from Urick’smodel [36]. The behavior was the same in both tests, with small differences in the numericalvalues. Furthermore, the results suggest good sensitivity, since the speed changes detectedwere as small as 3.88 m/s, corresponding to 0.28% of the propagation velocity in pure oil.
The estimation of the water concentration from the measured parameters requires anerror analysis. In the case of relative cross-correlation (Figure 5a), the usable measurementrange was 0–20% of the water by volume. However, there were few measurements inthis range to fit a model. In the case of energy (Figure 5b), this is a very stable property;however, the usable measurement range is similar to that of correlation (0–20%) becausethe slope is low above 20% of water, which leads to a low sensitivity. The fitting of a thirdorder polynomial allows determining the water concentration with a relative error of lessthan 18% in the range 0–20%. Above 20% water content, the error increased considerably,becoming even greater than 50%.
The most promising parameter is the propagation velocity, because the behavior wasalmost linear over a wider concentration range (0–50%). This behavior allows proposinga simple model to represent the data. The linear model proposed consists of measuringthe propagation velocity for the pure substances (pure oil and pure water) and tracing astraight line connecting the extremes to describe the relationship between the propagationvelocities and the different contents of water in water-in-oil emulsions.
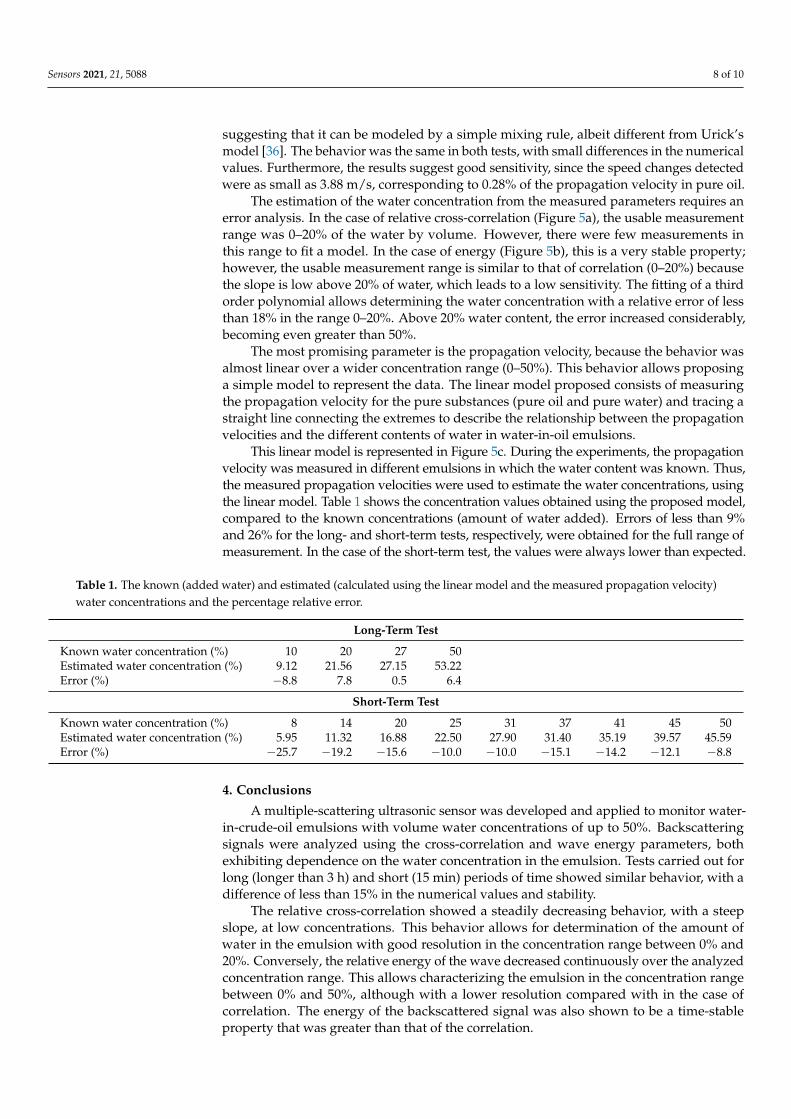
This linear model is represented in Figure 5c. During the experiments, the propagationvelocity was measured in different emulsions in which the water content was known. Thus,the measured propagation velocities were used to estimate the water concentrations, usingthe linear model. Table 1 shows the concentration values obtained using the proposed model,compared to the known concentrations (amount of water added). Errors of less than 9%and 26% for the long- and short-term tests, respectively, were obtained for the full range ofmeasurement. In the case of the short-term test, the values were always lower than expected.
Table 1. The known (added water) and estimated (calculated using the linear model and the measured propagation velocity)water concentrations and the percentage relative error.
Long-Term Test
Known water concentration (%) 10 20 27 50Estimated water concentration (%) 9.12 21.56 27.15 53.22Error (%) −8.8 7.8 0.5 6.4
Short-Term Test
Known water concentration (%) 8 14 20 25 31 37 41 45 50Estimated water concentration (%) 5.95 11.32 16.88 22.50 27.90 31.40 35.19 39.57 45.59Error (%) −25.7 −19.2 −15.6 −10.0 −10.0 −15.1 −14.2 −12.1 −8.8
4. Conclusions
A multiple-scattering ultrasonic sensor was developed and applied to monitor water-in-crude-oil emulsions with volume water concentrations of up to 50%. Backscatteringsignals were analyzed using the cross-correlation and wave energy parameters, bothexhibiting dependence on the water concentration in the emulsion. Tests carried out forlong (longer than 3 h) and short (15 min) periods of time showed similar behavior, with adifference of less than 15% in the numerical values and stability.
The relative cross-correlation showed a steadily decreasing behavior, with a steepslope, at low concentrations. This behavior allows for determination of the amount ofwater in the emulsion with good resolution in the concentration range between 0% and20%. Conversely, the relative energy of the wave decreased continuously over the analyzedconcentration range. This allows characterizing the emulsion in the concentration rangebetween 0% and 50%, although with a lower resolution compared with in the case ofcorrelation. The energy of the backscattered signal was also shown to be a time-stableproperty that was greater than that of the correlation.
Sensors 2021, 21, 5088 9 of 10
The sensor allowed measuring the propagation velocity, which is a property directlyrelated to the concentration in emulsions with low scattering. In this case, a propagationvelocity proportional to the water concentration was observed. This linear behavior, whichdid not agree with Urick’s mixing model, is promising for water content monitoring. Per-centage relative errors less than 9% and 26% for the long- and short-term tests, respectively,were obtained.
The sensor is robust and easy to manufacture. It operates in the frequency range of thetransducer. Other working frequencies can be used, as long as the transducer is changed.The rows of scatterers generate echoes in specific positions that allow determination of thepropagation velocity, but avoid most of the disadvantages associated with a design based ondelay lines. The signal processing is simple, with algorithms that allow for implementationin a microcontroller or some other embedded system of low computational power.
The results show that the sensor is promising for online and real-time monitoring ofthe water content in water-in-crude-oil emulsions. The technique requires the mean size ofthe water droplets in the emulsion (dispersed phase) to be less than the wavelength (likelyan order of magnitude smaller). However, additional research should be carried out toevaluate the best configuration of the scatterers, the working frequency, and the possibilityof measuring emulsions in motion (flowing through the sensor).
Finally, compared to the traditional technologies (emission–reception and pulse–echo),the sensor presented here was more sensitive and performed better with emulsions. In thecase of emulsions with a relatively large droplet size, where the signal is highly attenuatedsuch that the receiver cannot detect it, the multiple dispersion sensor is more likely tocontinue measuring. This subject will be studied in a future work.
Author Contributions: A.L.D. and C.A.B.R. carried out experiments; A.L.D., E.E.F., and F.B. re-searched the data processing; All the authors participated in the results analysis and discussion;A.L.D., E.E.F., and F.B. wrote the manuscript; N.P., M.S.G.T., and F.B. organized and supervised theresearch. All authors have read and agreed to the published version of the manuscript.
Funding: This research was funded by Petrobras/ANP (grant 5850. 0108871.18.9), CAPES and CNPq(MSG Tsuzuki was partially supported by grant 311.195/2019-9). EE Franco had financial supportfrom the Universidad Autónoma de Occidente (Colombia) by grant 19INTER-306. Nicolás Pérez wassupported by the Interdisciplinary Space of the University of the Republic (Uruguay).
Institutional Review Board Statement: Not applicable.
Informed Consent Statement: Not applicable.
Acknowledgments: We thank R. Oliveira for the sensor manufacturing process.
Conflicts of Interest: The authors declare no conflict of interest.
References1. Higuti, R.T.; Bacaneli, E.; Furukawa, C.M.; Adamowski, J.C. Ultrasonic characterization of emulsions: Milk and water in oil. In
Proceedings of the 1999 IEEE Ultrasonics Symposium. Proceedings. International Symposium (Cat. No.99CH37027), Tahoe, NV,USA, 17–20 October 1999; Volume 1, pp. 779–782. [CrossRef]
2. Santos, E.D.; Camargo, A.P.; Faria, E.A.; Oliveira, F.A.; Alves, S.M.; Barros, E.L. The Lubricity Analysis of Cutting Fluid Emulsions.Mater. Res. 2017, 20, 644–650. [CrossRef]
3. Pérez-Páez, R.; Catalá-Civera, J.M.; Nos, B.G.B.; Castillo, E.F.; Bastos, J.M.; Zambrano, L.S. Separation of Oil-Water-SludgeEmulsions Coming From Palm Oil Mill Process Through Microwave Techniques. J. Microw. Power Electromagn. Energy 2007,42, 39–47. [CrossRef]
4. Mandal, A.; Samanta, A.; Bera, A.; Ojha, K. Characterization of Oil-Water Emulsion and Its Use in Enhanced Oil Recovery.Ind. Eng. Chem. Res. 2010, 49, 12756–12761. [CrossRef]
5. Umar, A.A.; Saaid, I.B.M.; Sulaimon, A.A.; Pilus, R.B.M. A review of petroleum emulsions and recent progress on water-in-crudeoil emulsions stabilized by natural surfactants and solids. J. Pet. Sci. Eng. 2018, 165, 673–690. [CrossRef]
6. Stokes, D.J.; Thiel, B.L.; Donald, A.M. Direct Observation of Water-Oil Emulsion Systems in the Liquid State by EnvironmentalScanning Electron Microscopy. Langmuir 1998, 14, 4402–4408. [CrossRef]
7. Goddeeris, C.; Cuppo, F.; Reynaers, H.; Bouwman, W.; den Mooter, G.V. Light scattering measurements on microemulsions:Estimation of droplet sizes. Int. J. Pharm. 2006, 312, 187–195. [CrossRef]
Sensors 2021, 21, 5088 10 of 10
8. Alvarez, G.; Jestin, J.; Argillier, J.F.; Langevin, D. Small-Angle Neutron Scattering Study of Crude Oil Emulsions: Structure of theOil—Water Interfaces. Langmuir 2009, 25, 3985–3990. [CrossRef]
9. d’Avila, M.A.; Shapley, N.C.; Walton, J.H.; Phillips, R.J.; Dungan, S.R.; Powell, R.L. Mixing of concentrated oil-in-water emulsionsmeasured by nuclear magnetic resonance imaging. Phys. Fluids 2003, 15, 2499–2511. [CrossRef]
10. Heindel, T.J. A Review of X-ray Flow Visualization With Applications to Multiphase Flows. J. Fluids Eng. 2011, 133, 074001.[CrossRef]
11. Abro, E.; Johansen, G. Improved void fraction determination by means of multibeam gamma-ray attenuation measurements.Flow Meas. Instrum. 1999, 10, 99–108. [CrossRef]
12. García-Golding, F.; Giallorenzo, M.; Moreno, N.; Chang, V. Sensor for determining the water content of oil-in-water emulsion byspecific admittance measurement. Sens. Actuators A Phys. 1995, 47, 337–341. [CrossRef]
13. Jaworski, A.J.; Dyakowski, T. Measurements of oil–water separation dynamics in primary separation systems using distributedcapacitance sensors. Flow Meas. Instrum. 2005, 16, 113–127. [CrossRef]
14. Jadoon, S.; Malik, A.; Amin, A.A. Separation of Sediment Contents and Water from Crude Oil of Khurmala and Guwayer OilFields in Kurdistan Region by using Centrifuge Method. Int. J. Adv. Eng. Res. Sci. 2017, 4, 2919–2922. [CrossRef]
15. Ivanova, P.G.; Aneva, Z.V. Assessment and assurance of quality in water measurement by coulometric Karl Fischer titration ofpetroleum products. Accredit. Qual. Assur. 2006, 10, 543–549. [CrossRef]
16. Meng, G.; Jaworski, A.J.; White, N.M. Composition measurements of crude oil and process water emulsions using thick-filmultrasonic transducers. Chem. Eng. Process. Process Intensif. 2006, 45, 383–391. [CrossRef]
17. Su, M.; Cai, X.; Xue, M.; Dong, L.; Xu, F. Particle sizing in dense two-phase droplet systems by ultrasonic attenuation and velocityspectra. Sci. China Ser. E Technol. Sci. 2009, 52, 1502–1510. [CrossRef]
18. Kinsler, L.E.; Frey, A.R.; Coppens, A.B.; Sanders, J.V. Fundamentals of Acoustics; John Wiley & Sons: Hoboken, NJ, USA, 1999.19. McClements, D.J.; Povey, M.J.W. Scattering of ultrasound by emulsions. J. Phys. D Appl. Phys. 1989, 22, 38–47. [CrossRef]20. McClements, D.; Povey, M.; Jury, M.; Betsanis, E. Ultrasonic characterization of a food emulsion. Ultrasonics 1990, 28, 266–272.
[CrossRef]21. Juliastuti, E.; Tanogono, E.W.; Kurniadi, D. Detection of water content in lubricating oil using ultrasonics. In Proceedings of the
2017 5th International Conference on Instrumentation, Control and Automation (ICA), Yogyakarta, Indonesia, 9–11 August 2017;pp. 188–192. [CrossRef]
22. Franco, E.E.; Adamowski, J.C.; Buiochi, F. Ultrasonci sensor for the presence of oily contaminants in water. DYNA 2012, 79, 4–9.23. Richter, A.; Voigt, T.; Ripperger, S. Ultrasonic attenuation spectroscopy of emulsions with droplet sizes greater than 10 microm.
J. Colloid Interface Sci. 2007, 315, 482–492. [CrossRef] [PubMed]24. Dukhin, A.S.; Goetz, P.J. (Eds.) Characterization of Liquids, Nano- and Microparticulates, and Porous Bodies Using Ultrasound, 2nd ed.;
Studies in Interface Science 24; Elsevier: Amsterdam, The Netherlands, 2010.25. Shah, A.; Fishwick, R.; Wood, J.; Leeke, G.; Rigby, S.; Greaves, M. A review of novel techniques for heavy oil and bitumen
extraction and upgrading. Energy Environ. Sci. 2010, 3, 700–714. [CrossRef]26. Zhai, L.S.; Jin, N.D.; Gao, Z.K.; Wang, Z.Y.; Li, D.M. The ultrasonic measurement of high water volume fraction in dispersed
oil-in-water flows. Chem. Eng. Sci. 2013, 94, 271–283. [CrossRef]27. Liang, M.; Xinglian, C.; Lingjiang, Z.; Kemin, D. Measurement of Water Content of Petroleum by High Accuracy Interval
Measuring Chip. In Proceedings of the 2012 Fourth International Conference on Computational and Information Sciences,Chongqing, China, 17–19 August 2012. [CrossRef]
28. Chaudhuri, A.; Sinha, D.N.; Zalte, A.; Pereyra, E.; Webb, C.; Gonzalez, M.E. Mass Fraction Measurements in Controlled Oil-WaterFlows Using Noninvasive Ultrasonic Sensors. J. Fluids Eng. 2014, 136, 031304. [CrossRef]
29. Meral, R. Laboratory Evaluation of Acoustic Backscatter and LISST Methods for Measurements of Suspended Sediments. Sensors2008, 8, 979–993. [CrossRef]
30. Moore, S.A.; Le Coz, J.; Hurther, D.; Paquier, A. Using multi-frequency acoustic attenuation to monitor grain size and concentrationof suspended sediment in rivers. J. Acoust. Soc. Am. 2013, 133, 1959–1970. [CrossRef]
31. Chen, S.H.; Lin, Y.H.; Li, W.T.; Wang, S.H.; Huang, C.C. Estimation of Cell Concentration Using High-Frequency UltrasonicBackscattering. J. Med. Biol. Eng. 2012, 32, 157–162. [CrossRef]
32. Elvira, L.; Vera, P.; Cañadas, F.J.; Shukla, S.K.; Montero, F. Concentration measurement of yeast suspensions using high frequencyultrasound backscattering. Ultrasonics 2016, 64, 151–161. [CrossRef]
33. Blasina, F.; Pérez, N.; Budelli, E.; Lema, P.; Ing, R.K.; Negreira, C. Development of a multiple-scattering acoustic sensor for processmonitoring: Application to monitoring milk coagulation. In Proceedings of the 2017 IEEE International Instrumentation andMeasurement Technology Conference (I2MTC), Turin, Italy, 22–25 May 2017; pp. 1–5. [CrossRef]
34. Perez, N.; Blasina, F.; Buiochi, F.; Duran, A.; Adamowski, J. Evaluation of a multiple scattering sensor for water-in-oil emulsionmonitoring. Proc. Meet. Acoust. 2019, 38, 055007. [CrossRef]
35. Papoulis, A.; Maradudin, A.A. The Fourier Integral and Its Applications. Phys. Today 1963, 16, 70–72. [CrossRef]36. Urick, R.J. A Sound Velocity Method for Determining the Compressibility of Finely Divided Substances. J. Appl. Phys. 1947,
18, 983–987. [CrossRef]
Related Documents