Hydrol. Earth Syst. Sci., 17, 3983–4000, 2013 www.hydrol-earth-syst-sci.net/17/3983/2013/ doi:10.5194/hess-17-3983-2013 © Author(s) 2013. CC Attribution 3.0 License. Hydrology and Earth System Sciences Open Access Water consumption from hydropower plants – review of published estimates and an assessment of the concept T. H. Bakken 1,2 , Å. Killingtveit 1 , K. Engeland 2 , K. Alfredsen 1 , and A. Harby 2 1 Norwegian University of Science and Technology, Department of Hydraulic and Environmental Engineering, 7491 Trondheim, Norway 2 SINTEF Energy Research, 7465 Trondheim, Norway Correspondence to: T. H. Bakken ([email protected]) Received: 21 May 2013 – Published in Hydrol. Earth Syst. Sci. Discuss.: 24 June 2013 Revised: 23 August 2013 – Accepted: 5 September 2013 – Published: 15 October 2013 Abstract. Since the report from IPCC on renewable en- ergy (IPCC, 2012) was published; more studies on water consumption from hydropower have become available. The newly published studies do not, however, contribute to a more consistent picture on what the “true” water consump- tion from hydropower plants is. The dominant calculation method is the gross evaporation from the reservoirs divided by the annual power production, which appears to be an over- simplistic calculation method that possibly produces a biased picture of the water consumption of hydropower plants. This review paper shows that the water footprint of hydropower is used synonymously with water consumption, based on gross evaporation rates. This paper also documents and discusses several method- ological problems when applying this simplified approach (gross evaporation divided by annual power production) for the estimation of water consumption from hydropower projects. A number of short-comings are identified, includ- ing the lack of clarity regarding the setting of proper sys- tem boundaries in space and time. The methodology of at- tributing the water losses to the various uses in multi-purpose reservoirs is not developed. Furthermore, a correct and fair methodology for handling water consumption in reservoirs based on natural lakes is needed, as it appears meaningless that all the evaporation losses from a close-to-natural lake should be attributed to the hydropower production. It also ap- pears problematic that the concept is not related to the impact the water consumption will have on the local water resources, as high water consumption values might not be problematic per se. Finally, it appears to be a paradox that a reservoir might be accorded a very high water consumption/footprint and still be the most feasible measure to improve the avail- ability of water in a region. We argue that reservoirs are not always the problem; rather they may contribute to the solu- tion of the problems of water scarcity. The authors consider that an improved conceptual framework is needed in order to calculate the water footprint from hydropower projects in a more reasonable way. 1 Introduction Mitigating climate change requires the development of re- newable energy sources in order to replace fossil-based en- ergy. The IPCC Special Report on Renewable Energy (IPCC, 2012) was an important achievement and milestone in the assessment of the potential for renewable energy sources to replace fossil-based fuels. This report presents the most im- portant renewable energy technologies and benchmarks them with respect to various criteria, including the needed volumes of water in the production of a certain volume of energy, as- signed as “water consumption” of the benchmarked technol- ogy. This assessment reveals that in 2011 there was very lim- ited number of publications that actually compared the water consumption of the different technologies on an equal ba- sis. In addition, there were very few studies exclusively as- sessing the water consumption from hydropower production. Furthermore, there was a large spread in water consumption estimates for hydropower facilities in these studies and the values ranged from a minimum of 0.04 m 3 MWh -1 to a max- imum of 209 m 3 MWh -1 . The highest value is far beyond the other technologies which have maximum values typically Published by Copernicus Publications on behalf of the European Geosciences Union.

Welcome message from author
This document is posted to help you gain knowledge. Please leave a comment to let me know what you think about it! Share it to your friends and learn new things together.
Transcript
Hydrol. Earth Syst. Sci., 17, 3983–4000, 2013www.hydrol-earth-syst-sci.net/17/3983/2013/doi:10.5194/hess-17-3983-2013© Author(s) 2013. CC Attribution 3.0 License.
Hydrology and Earth System
SciencesO
pen Access
Water consumption from hydropower plants – review of publishedestimates and an assessment of the concept
T. H. Bakken1,2, Å. Killingtveit 1, K. Engeland2, K. Alfredsen1, and A. Harby2
1Norwegian University of Science and Technology, Department of Hydraulic and Environmental Engineering,7491 Trondheim, Norway2SINTEF Energy Research, 7465 Trondheim, Norway
Correspondence to:T. H. Bakken ([email protected])
Received: 21 May 2013 – Published in Hydrol. Earth Syst. Sci. Discuss.: 24 June 2013Revised: 23 August 2013 – Accepted: 5 September 2013 – Published: 15 October 2013
Abstract. Since the report from IPCC on renewable en-ergy (IPCC, 2012) was published; more studies on waterconsumption from hydropower have become available. Thenewly published studies do not, however, contribute to amore consistent picture on what the “true” water consump-tion from hydropower plants is. The dominant calculationmethod is the gross evaporation from the reservoirs dividedby the annual power production, which appears to be an over-simplistic calculation method that possibly produces a biasedpicture of the water consumption of hydropower plants. Thisreview paper shows that the water footprint of hydropower isused synonymously with water consumption, based on grossevaporation rates.
This paper also documents and discusses several method-ological problems when applying this simplified approach(gross evaporation divided by annual power production)for the estimation of water consumption from hydropowerprojects. A number of short-comings are identified, includ-ing the lack of clarity regarding the setting of proper sys-tem boundaries in space and time. The methodology of at-tributing the water losses to the various uses in multi-purposereservoirs is not developed. Furthermore, a correct and fairmethodology for handling water consumption in reservoirsbased on natural lakes is needed, as it appears meaninglessthat all the evaporation losses from a close-to-natural lakeshould be attributed to the hydropower production. It also ap-pears problematic that the concept is not related to the impactthe water consumption will have on the local water resources,as high water consumption values might not be problematicper se. Finally, it appears to be a paradox that a reservoirmight be accorded a very high water consumption/footprint
and still be the most feasible measure to improve the avail-ability of water in a region. We argue that reservoirs are notalways the problem; rather they may contribute to the solu-tion of the problems of water scarcity. The authors considerthat an improved conceptual framework is needed in order tocalculate the water footprint from hydropower projects in amore reasonable way.
1 Introduction
Mitigating climate change requires the development of re-newable energy sources in order to replace fossil-based en-ergy. The IPCC Special Report on Renewable Energy (IPCC,2012) was an important achievement and milestone in theassessment of the potential for renewable energy sources toreplace fossil-based fuels. This report presents the most im-portant renewable energy technologies and benchmarks themwith respect to various criteria, including the needed volumesof water in the production of a certain volume of energy, as-signed as “water consumption” of the benchmarked technol-ogy. This assessment reveals that in 2011 there was very lim-ited number of publications that actually compared the waterconsumption of the different technologies on an equal ba-sis. In addition, there were very few studies exclusively as-sessing the water consumption from hydropower production.Furthermore, there was a large spread in water consumptionestimates for hydropower facilities in these studies and thevalues ranged from a minimum of 0.04 m3 MWh−1 to a max-imum of 209 m3 MWh−1. The highest value is far beyondthe other technologies which have maximum values typically
Published by Copernicus Publications on behalf of the European Geosciences Union.

3984 T. H. Bakken et al.: Water consumption from hydropower plants
in the range of 4–5 m3 MWh−1. These findings caused greatconcern within the hydropower sector (IHA, 2011) as thismight cause a reputational risk for the sector and also be a di-rect investment risk in new projects if hydropower is consid-ered a “large-scale water consumer”. This is especially whenhydropower developments are planned in regions with lim-ited freshwater resources. On the other hand, the hydropowersector stresses the need for the development of a concep-tual framework for calculating the water consumption withcommon definitions and methodologies (IHA, 2011). This isbecause the current approach does not take the benefits ofwater storage into account (i.e., increased water availability)(IPCC, 2012), and hence might give a biased picture of therole of hydropower and water storage reservoirs in general.As a number of new studies have been carried out since therelease of the IPCC (2012) report possibly filling out the frag-mented picture, it is considered a suitable time to update thereview by the IPCC.
It appears also opportune and adequate to ask the pur-pose of estimating the water consumption/water footprint.According to the water footprint manual (Hoekstra et al.,2011) the goal of assessing the water footprint is to analyzehow human activities or specific products relate to issues ofwater scarcity and pollution. In addition, it was to study howactivities and products can become more sustainable froma water perspective. The definition of the water footprint ofa product is “the volume of freshwater used to produce theproduct, measured over the full supply chain” (Hoekstra etal., 2011).
The purpose of this study is
1. Review all published literature with respect to waterconsumption from hydropower plants, and present therange of estimates.
2. Document the methodological approaches used andevaluate the consistency in the methodology of esti-mating water consumption values.
3. Investigate trends in the published material, if any.
4. Discuss the present methodological approach whenapplied to hydropower projects and propose clarifica-tions and/or refinements in order improve the precisionof the methodology.
The basis for this study is a literature review that includesdata from peer-reviewed and grey literature on the topicof water consumption from energy production in generaland hydropower projects specifically. The literature has beencompiled using traditional tools for scientific literature col-lection and direct contact with people and institutions in-volved in the on-going debate. It should be underlined that allthe used material is available from open, public sources. Thepublished data and information was extracted from the pub-lications and reformatted for the purpose of this study. The
calculation methods applied are presented, as well as the ge-ographical extent of the estimates, ranging from single-plantestimates to global averages. Second, the single-plant dataset compiled from the published literature is diversified withrespect to a set of factors such as calculation method andclimatic region in order to uncover trends in the compileddata set. Third, the present and dominating methodology ofestimating water consumption is discussed with respect tothe specifics of hydropower technology. As this paper is ac-companied by a set of examples demonstrating aspects of themethodology that needs to be clarified, our paper should pro-vide useful input for an improved conceptual framework.
2 Overview of published literature and estimates
2.1 Terms and definitions used in the context of waterconsumption
The review of relevant literature on water consumption andhydropower production did not reveal a consistent and agreedset of terms and definitions. Terms like water consumption,water losses, water withdrawal and water footprint seem tohave slightly different meanings determined by the contextand are applied in an inconsistent manner in a number ofrelevant publications (Hutson et al., 2004; Kenny et al., 2009;Fthenakis and Kim, 2010; Macknick et al., 2012b; Pfister etal., 2011; Hoekstra et al., 2011).
In this paper we have defined water consumption in hy-dropower production as thequantity of water that leavesthe analyzed system, and can hence be considered lostfor hydropower production and the downstream waterusers/ecosystem. In the most relevant publications, i.e., thosepresented in Table 1 and listed earlier in this paragraph, “thesystem” is interpreted as being the reservoir that is directlylinked to the hydropower plant. According to the Water Foot-print Manual (Hoekstra et al., 2011), “consumption” refersto loss of water from the available ground- and surface waterbody in a catchment area. Losses occur when water evapo-rates, returns to another catchment, the sea or is incorporatedinto a product.
Following the calculation-method used in Mekonnen andHoekstra (2012), the “water footprint of hydropower” isidentical to the “water consumption of hydropower” (in theunderstanding gross annual evaporation divided by the an-nual power production) as used in the majority of the re-viewed publications, and is hence used synonymously in thispaper.
As seen in Table 1, the use of gross evaporation (divided bythe annual production) (Eq. 1) is the dominating calculationmethod for the published estimates of water consumptionfrom hydropower plants. This approach does not take intoaccount the evaporation losses prior to construction of thehydropower plant. Also, the reservoir could originally havebeen a natural lake or terrestrial area inundated due to the
Hydrol. Earth Syst. Sci., 17, 3983–4000, 2013 www.hydrol-earth-syst-sci.net/17/3983/2013/
T. H. Bakken et al.: Water consumption from hydropower plants 3985
establishment of the reservoir. The “net” calculation method(Eq. 2) subtracts evaporation rates from the reservoir surfaceby the evaporation rates prior to the hydropower developmentdivided by annual power production:
Gross water consumption=Evaporation reservoir
Annual powerproduction, (1)
Net water consumption=Evaporation reservoir− Evaporation before inundation
Annual power production. (2)
Furthermore, a third approach (“water balance”) for the cal-culation of water consumption from hydropower plants isproposed by Herath et al. (2010). This is defined as follows:
Water balance=Evaporation reservoir− Direct rainfall reservoir
Annual power production. (3)
Even though the definition of water consumption does notexclude other loss terms from being part of the water loss, itappears from the reviewed publications that the dominatingterm for water losses is evaporation losses from the reservoirsurface. The importance of seepage as a loss term has beendiscussed (e.g., Gleick, 1994), but it is argued that this is inmost cases very small and if present will return the waterback to the river basin and therefore should not be considered“lost” water.
Finally, it should be mentioned that the given water con-sumption estimates (as in Eqs. 1–3) are specific water con-sumption rates, expressed per unit of power production, andnot absolute water consumption. The specific water con-sumption estimates must be multiplied by the power produc-tion in the specific case in order to indicate how much wateris “lost” to the atmosphere due to evaporation.
2.2 Available publications and their range in estimates(primary sources)
Table 1 presents the primary sources of water consumptionestimates. Readers should note that some of the estimatespresented in Table 1 are based on different calculation meth-ods (gross, net and water balance), with gross evaporationdivided on annual production as the dominating method. Inmost cases, the three different calculation methods give suchdifferent estimates that they cannot be compared directlywithout a clear understanding of the intrinsic assumptions ofthe methods. This is discussed further in Sect. 3.1.
Furthermore, the compiled estimates include hydropowerplants where the reservoirs have a primary purpose that is dif-ferent than hydropower generation (e.g., reservoirs to supplyirrigation systems with water in dry periods). Despite this,the water losses are in all cases, except one (M. J. Pasqualettiand S. Kelly, personal communication, 2008), allocated tothe hydropower production even though the reservoir mightfacilitate two or more purposes and no defined methodologyfor allocation of the losses is available. Some of the plantsin the reviewed studies are also built with reservoirs utilizingexisting lakes for water storage, possibly adding only someminor regulation to the existing, natural variation in order
to use the storage capabilities more efficiently. The “reser-voir” would hence introduce a very limited change to a pos-sibly very large and close to pristine water body, and thewater losses attributed to the hydropower production mightappear very large compared to the change introduced bythe hydropower plant. These issues are discussed further inSect. 3.5.
The estimates provided in Table 1 vary considerably intheir spatial extent, from estimates valid for one specific (sin-gle) plant as, for example, Herath et al. (2011), via estimatesgiven as average values for a region (e.g., one US State as forinstance given by Gleick, 1992) to a global average as pro-vided by Gerbens-Leenes et al. (2009). This means that theestimates are not applicable for use on all scales and supportdifferent types of decision-making. The global values shouldhence be used as an indication for global water losses fromhydropower plants, and should not be downscaled to expressthe water consumption from an individual plant. Conversely,the results from one specific plant must be considered spe-cific for the analyzed plant only. It should added that thesystem boundary of the estimates of the global average stillmight be the reservoirs of the plants used in the calculation ofthe global average. The issue of setting the spatial and tem-poral system boundaries are discussed in Sect. 3.2.
Despite the reservations and limitations given above, itis interesting to see that some of the newly published data(e.g., Mekonnen and Hoekstra, 2012; Tefferi, 2012; andDemeke et al., 2013) are far beyond the earlier publishedestimates on hydropower by IPCC (2012). Compared withother renewable technologies, this makes the water consump-tion from hydropower plants enormous, as the other renew-ables (and non-renewables) are up to a maximum of ap-prox. 5 m3 MWh−1 (IPCC, 2012). This makes it also perti-nent to study the methodological approach and its relevanceto hydropower.
In addition to the primary sources listed in Table 1,a number of publications are considered relevant to thistopic and should be mentioned, such as US Departmentof Energy (2006), Fthenakis and Kim (2010), Macknick etal. (2011, 2012a), Pfister et al. (2011) and IPCC (2012).The IPPC Special Report on Renewable Energy Sources(IPCC, 2012) is definitely the most acclaimed of these pub-lications and uses the following sources as documentationfor their estimates of water consumption from hydropower;Gleick (1993), Torcellini et al. (2003), Mielke et al. (2010),Fthenakis and Kim (2010), indicating that until recentlythere was extensive re-use of the geographically very lim-ited data set published by Gleick (1993). The water consump-tion estimates presented in IPCC (2012) ranged from a mini-mum of 0.04 m3 MWh−1 to a maximum of 209 m3 MWh−1.This range in values is based on very few data points(n = 2) from 4 sources: Gleick (1993), LeCornu (1998),Torcellini et al. (2003) and Mielke et al. (2010). From ourreview of recent publications, it is clear that there are nowmore publications available than when the IPCC report was
www.hydrol-earth-syst-sci.net/17/3983/2013/ Hydrol. Earth Syst. Sci., 17, 3983–4000, 2013
3986 T. H. Bakken et al.: Water consumption from hydropower plants
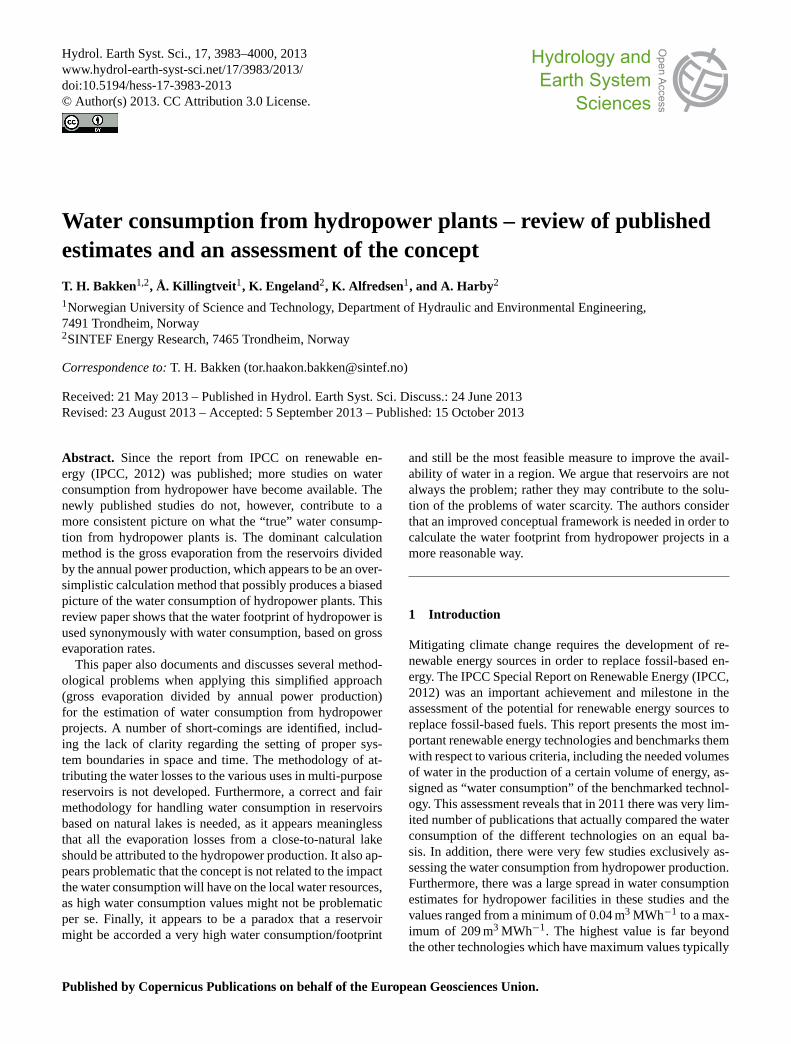
Fig. 1. The figure presents gross water consumption estimates and evaporation rates for the individual plants. The horizontal lines withnumber tags attached are average water consumption (arithmetic averages) values for the climate zones according to the classification givenby Köppen–Geiger (Köppen, 1936). The codes of the 5 climate zones are given in red. The “before” and “after” annotation to the Norwegiandata refers to before and after refurbishment of the hydropower system.
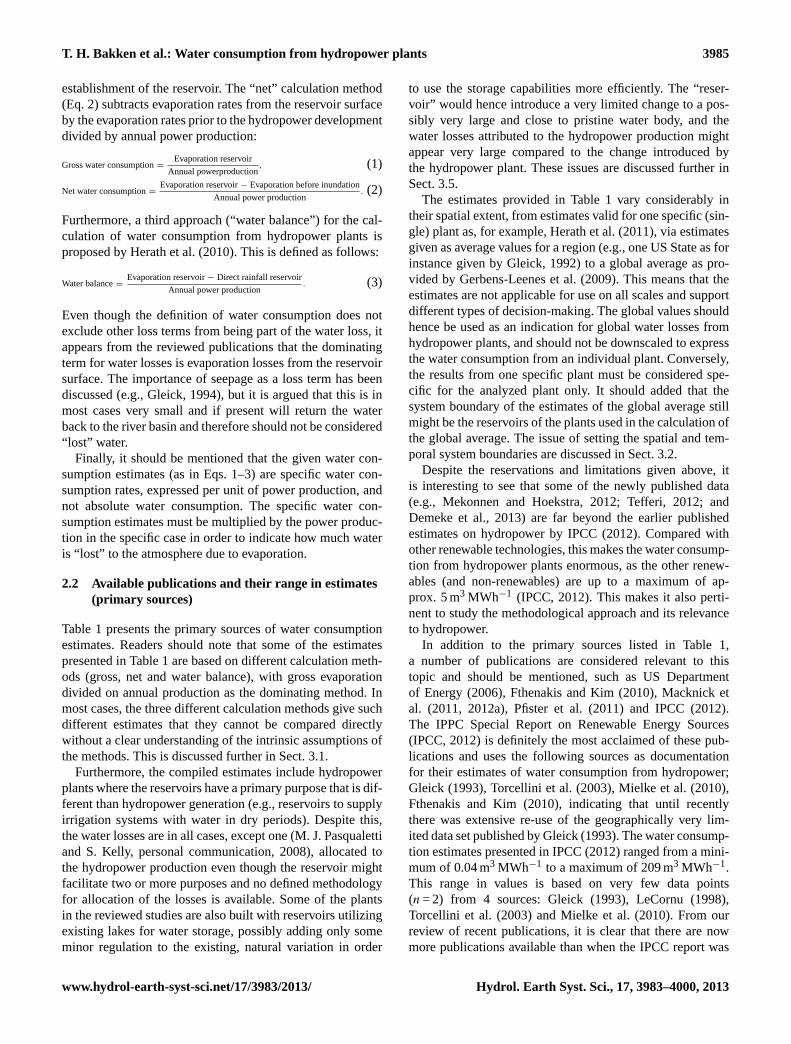
Fig. 2.The left panel of the figure presents net water consumption estimates and evaporation rates for individual plants. The number tags arearithmetic averages of water consumption. The right panel presents the differences (ratio net / gross, given in %) in water consumption ratesfor those individual plants with both net and gross water consumption estimates.
Hydrol. Earth Syst. Sci., 17, 3983–4000, 2013 www.hydrol-earth-syst-sci.net/17/3983/2013/
T. H. Bakken et al.: Water consumption from hydropower plants 3987
written, contributing to a better understanding of the perfor-mance of hydropower in the context of water consumption.
It should finally be noted that the quality of the reviewedstudies might vary considerable, as the list of publicationsrange from master’s theses and technical reports to peer-reviewed scientific articles.
2.3 Data sources providing single-plants estimates
The primary data presented in Table 1 are either a range of es-timates providing minimum, average and the maximum val-ues for a number of single-plant studies or estimates provid-ing spatial aggregated estimates for water consumption, forexample, average estimates for the region California (Gleick,1992) or a world-wide average (Gerbens-Leenes et al., 2009).Despite this, some of the given publications are based on wa-ter consumption estimates from single-plants and these dataare also available from the publications. It would hence beinteresting to compile these single-plants data together in or-der to try to explain why some of the estimates are very highor very low and try to detect any trends in the material. A fur-ther analysis of the complied data set will also be interestingin terms of improving the methodology for estimating waterconsumption values for hydropower plants.
The main data sources providing single-plant estimatedwith identifiable plants are Herath et al. (2011), Mekonnenand Hoekstra (2012), Arnøy (2012), Yesuf (2012),Tefferi (2012) and Demeke et al. (2013). In the follow-ing, these data sources are merged and represent thecompiled data set that was used in the analysis. The datasets were used directly with their given water consumptionvalues, except for units conversions into m3 MWh−1, inorder to harmonize the compiled data set. Some of thedata were supplemented with additional properties, forexample, which climatic region the plants are located, inorder to reveal some of the differences in the data estimates.The Köppen–Geiger classification method (Köppen, 1936)was used for the climatic regions. This system takes intoaccount vegetation, temperature and precipitation anddivides climates into 5 main categories, with a number ofsub-groups within each of these categories. The gross valuessorted by climatic zones are presented in Fig. 1, while thenet values are presented in the left-hand side of Fig. 2.
The 3 studies by Herath et al. (2011), Yesuf (2012) andDemeke et al. (2013) present estimates for both gross and netwater consumption rates. In these cases the inundated areasare assumed to be covered with pasture (Herath et al., 2011)and agricultural and grazing areas (Yesuf, 2012) prior to in-undation, while Demeke et al. (2013) gives no information.The difference in water consumption values between the netand gross calculation approaches is hence determined by theland use/cover prior to inundation (Fig. 2, right panel).
Looking into the presented data on gross water consump-tion rates (Fig. 1), it is clear that there are both low andvery high rates for all the three climatic zones A, B and C.
Climatic zones A and B especially show well-distributed databetween the minimum and the maximum data, while C hasbasically only one sample providing a high estimate, whichis the Kariba Dam on the border between Zambia and Zim-babwe. The reason why Kariba Dam comes out with such ahigh value is the combination of a very large surface area andhigh evaporation rate compared to the other plants in climaticzone C. The climatic zones D and E have generally lower wa-ter consumption rates than A, B and C, which is indicated bytheir average values. The maximum value in the entire dataset is the Aswan Dam in Egypt with a water consumptionestimate of 6250 m3 MWh−1.
The data set consisting of the net water consumption es-timates (Fig. 2, left panel) is much smaller than the data setof gross values (only 3 studies), and contains values that aremuch lower. The average net and gross water consumptionvalues for climate A are 23.5 and 518 m3 MWh−1, respec-tively, and for climate C 152 and 9.5 m3 MWh−1. In thesecases the net estimates were in the range of approx. 12–60 % of the gross estimates. The difference in (arithmetic)average values between climate zone A and C (23.5 and9.5 m3 MWh−1, respectively) is very small for the net val-ues compared to the similar difference for the gross values(498 and 152 m3 MWh−1, respectively).
Some of the extremes and large values can possibly be ex-plained by the fact that their reservoirs have a very large sur-face area. Mekonnen and Hoekstra (2012) have found thatthere is a relation between surface area of the reservoir andthe water consumption estimates. This is, of course, not sur-prising as the numerator of Eqs. (1) and (2) is the product ofthe specific evaporation rates (gross or net per unit area) andthe total surface area, and hence is very sensitive to evap-oration rates. The reason for having a large surface area is,however, not exclusively due to the hydropower production,as the origin of the reservoir might be a large natural lakeand that the multi-purpose function of the reservoir makesit larger than needed for hydropower production exclusively,which is also noted in the data set by Demeke et al. (2013)holding numerous multi-purpose reservoirs. The power pro-duction thus could not be determined directly by the surfacearea.
The fact that the dominating calculation method for waterconsumption values is very simplistic could also lead to indi-vidual differences being masked out. This means that the cal-culation method niether takes into account the specifics of theindividual plants/reservoirs nor the group of plants that areregulated together, for instance in a cascade. Furthermore,the calculation method does not distinguish between naturallakes used as reservoir that could have a surface that is muchlarger than needed for the purpose of the hydropower pro-duction nor have a clear methodology to “share the burden ofthe water consumption” between the various interests bene-fitting from the reservoir. Only one study (M. J. Pasqualettiand S. Kelly, peronsal, communication, 2008) attempts toassign water losses between the water uses in a multi-purpose
www.hydrol-earth-syst-sci.net/17/3983/2013/ Hydrol. Earth Syst. Sci., 17, 3983–4000, 2013
3988 T. H. Bakken et al.: Water consumption from hydropower plants
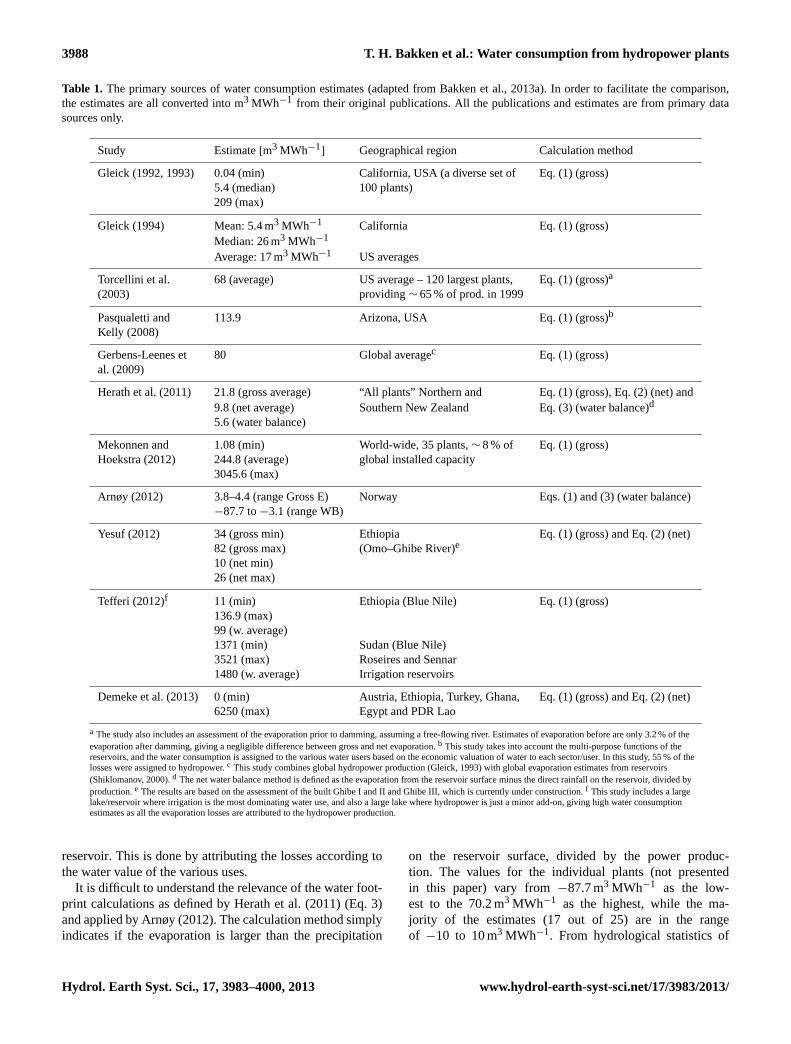
Table 1. The primary sources of water consumption estimates (adapted from Bakken et al., 2013a). In order to facilitate the comparison,the estimates are all converted into m3 MWh−1 from their original publications. All the publications and estimates are from primary datasources only.
Study Estimate[m3 MWh−1] Geographical region Calculation method
Gleick (1992, 1993) 0.04 (min) California, USA (a diverse set of Eq. (1) (gross)5.4 (median) 100 plants)209 (max)
Gleick (1994) Mean: 5.4 m3 MWh−1 California Eq. (1) (gross)Median: 26 m3 MWh−1
Average: 17 m3 MWh−1 US averages
Torcellini et al. 68 (average) US average – 120 largest plants, Eq. (1) (gross)a
(2003) providing∼ 65 % of prod. in 1999
Pasqualetti and 113.9 Arizona, USA Eq. (1) (gross)b
Kelly (2008)
Gerbens-Leenes et 80 Global averagec Eq. (1) (gross)al. (2009)
Herath et al. (2011) 21.8 (gross average) “All plants” Northern and Eq. (1) (gross), Eq. (2) (net) and9.8 (net average) Southern New Zealand Eq. (3) (water balance)d
5.6 (water balance)
Mekonnen and 1.08 (min) World-wide, 35 plants,∼ 8 % of Eq. (1) (gross)Hoekstra (2012) 244.8 (average) global installed capacity
3045.6 (max)
Arnøy (2012) 3.8–4.4 (range Gross E) Norway Eqs. (1) and (3) (water balance)−87.7 to−3.1 (range WB)
Yesuf (2012) 34 (gross min) Ethiopia Eq. (1) (gross) and Eq. (2) (net)82 (gross max) (Omo–Ghibe River)e
10 (net min)26 (net max)
Tefferi (2012)f 11 (min) Ethiopia (Blue Nile) Eq. (1) (gross)136.9 (max)99 (w. average)1371 (min) Sudan (Blue Nile)3521 (max) Roseires and Sennar1480 (w. average) Irrigation reservoirs
Demeke et al. (2013) 0 (min) Austria, Ethiopia, Turkey, Ghana, Eq. (1) (gross) and Eq. (2) (net)6250 (max) Egypt and PDR Lao
a The study also includes an assessment of the evaporation prior to damming, assuming a free-flowing river. Estimates of evaporation before are only 3.2 % of theevaporation after damming, giving a negligible difference between gross and net evaporation.b This study takes into account the multi-purpose functions of thereservoirs, and the water consumption is assigned to the various water users based on the economic valuation of water to each sector/user. In this study, 55 % of thelosses were assigned to hydropower.c This study combines global hydropower production (Gleick, 1993) with global evaporation estimates from reservoirs(Shiklomanov, 2000).d The net water balance method is defined as the evaporation from the reservoir surface minus the direct rainfall on the reservoir, divided byproduction.e The results are based on the assessment of the built Ghibe I and II and Ghibe III, which is currently under construction.f This study includes a largelake/reservoir where irrigation is the most dominating water use, and also a large lake where hydropower is just a minor add-on, giving high water consumptionestimates as all the evaporation losses are attributed to the hydropower production.
reservoir. This is done by attributing the losses according tothe water value of the various uses.
It is difficult to understand the relevance of the water foot-print calculations as defined by Herath et al. (2011) (Eq. 3)and applied by Arnøy (2012). The calculation method simplyindicates if the evaporation is larger than the precipitation
on the reservoir surface, divided by the power produc-tion. The values for the individual plants (not presentedin this paper) vary from−87.7 m3 MWh−1 as the low-est to the 70.2 m3 MWh−1 as the highest, while the ma-jority of the estimates (17 out of 25) are in the rangeof −10 to 10 m3 MWh−1. From hydrological statistics of
Hydrol. Earth Syst. Sci., 17, 3983–4000, 2013 www.hydrol-earth-syst-sci.net/17/3983/2013/
T. H. Bakken et al.: Water consumption from hydropower plants 3989
Norway (Beldring et al., 2002) it can easily be seen thatthe rainfall is basically much greater than the evaporation allover Norway, giving a negative water footprint if calculatedaccording to the water balance approach (Eq. 3) at most lo-cations. This also appears to be in conflict with the waterfootprint concept (Hoekstra et al., 2011), which should givenumbers ranging from zero to infinite positive.
From the review of the published estimates and themethodology for calculating water consumption of hy-dropower plants, the methodology generally appears over-simplistic and imprecise in order to calculate reasonable andjustifiable numbers for hydropower and omits several im-portant features of reservoirs such as cascaded developmentof plants, multi-purpose use and establishment of reservoirsbased on natural lakes. The reason why we argue this is fur-ther explored in the following section, accompanied by cal-culation examples demonstrating the wide range of outcomesgiven by the lack of a clear methodology.
3 Discussion
3.1 The problem of inconsistency in the calculationmethod
As described first in Sect. 2.1 there are basically three differ-ent methods for calculating the water consumption from hy-dropower plants. Among these, the gross water consumptionis the dominating and the only method applied and publishedup to 2010, where the net water consumption and the waterbalance approach were introduced by Herath et al. (2011).The publication by Mekonnen and Hoekstra (2012), beingamong the strong proponents of the water footprint method-ology (Hoekstra et al., 2011) claims that the gross water con-sumption approach is the correct way of applying the waterfootprint methodology on hydropower. The net approach dif-fers from gross approach as it takes into account the evapo-ration losses from an area prior to the development of thehydropower plant. The water balance approach is the thirdmethod that corrects the evaporation losses by the directrainfall to the reservoir surface. This method has been com-mented on before (see Sect. 2.3), and we find the usefulnessof this approach limited.
The use of the gross evaporation as the basis is contro-versial as even a small hydropower plant making use of verylimited water from a large lake will be attributed a large waterconsumption/footprint, but literally causing no change in thewater balance. Similarly, in the case of inundation of “wa-ter hungry” vegetation, the evaporation from the flooded ar-eas will to a limited extent change the original evaporation.There are also published studies indicating that natural veg-etation could have as high evaporation rates as from lakes(Leigh Jr., 1999). On the other extreme, the establishment ofa reservoir in a desert area (e.g., Aswan Dam on the border ofEgypt/Sudan) will cause a net loss of water as the evaporation
prior to the damming is very limited. The gross methodologydoes not differentiate between these cases and the calculatedwater consumption will be the same no matter if the area useprior to inundation by the reservoir was a lake or swamp-landon one hand or a desert on the other. Furthermore, if the spa-tial boundaries are set beyond the extent of the reservoir, in-direct effects on land and water use introduced by the estab-lishment of the reservoir should be accounted for. Estimatingthe water consumption would in this case become much moredemanding, especially if the net effect is analyzed.
According to Hoekstra et al. (2011) and Mekonnen andHoekstra (2012) the gross evaporation should be used as thebasis for calculating the water footprint of hydropower as“the water footprint is not meant to refer to additional evapo-ration (compared to some reference situation), but for quan-tifying the volume of water consumption that can be associ-ated with a specific human purpose”. Despite this, it appearsstrange to us if an activity is attributed an enormous loss ofwater (as could be the case with the gross water consump-tion) without changing the water balance from pristine areas,and we believe that a different approach should be selected toassess the water consumption from hydropower, that is, thenet water consumption or any other improved conceptualmethod, which is also supported by Demeke et al. (2013).
3.2 Setting the system boundaries
It has been identified in numerous LCA studies that the issueof setting the system boundaries might have a large effecton the outcome of the study (e.g., Raynolds et al., 2000 andModahl et al., 2013). This is also the case for water consump-tion from hydropower projects and is discussed in the fol-lowing section. The specific case of a cascaded hydropowersystem is presented in Sect. 3.3 with examples how differ-ent spatial boundaries will affect the water consumption es-timates for the different plants.
3.2.1 Setting the spatial boundaries
Based on the review presented in Sect. 2 it appears that thespatial averaged studies (e.g., Gleick, 1993; Gerbens-Leeneset al., 2009) calculate the water consumption by simply di-viding evaporation from the surface of the water reservoirs(in the desired region) by the annual hydropower productionwithin the same area. For the single-plant studies, the wa-ter consumption is in most cases calculated by dividing theevaporation from the reservoir by the power production fromthe power plant in the direct vicinity of the reservoir. Thisdefines the reservoir and the power plant directly linked to itas the spatial system boundary. However, we consider that ahydropower scheme can often be much more complex thanthis. The design of the hydropower system is also very site-specific as it is very dependent on the opportunities offeredby the topography (IPCC, 2012).
www.hydrol-earth-syst-sci.net/17/3983/2013/ Hydrol. Earth Syst. Sci., 17, 3983–4000, 2013
3990 T. H. Bakken et al.: Water consumption from hydropower plants
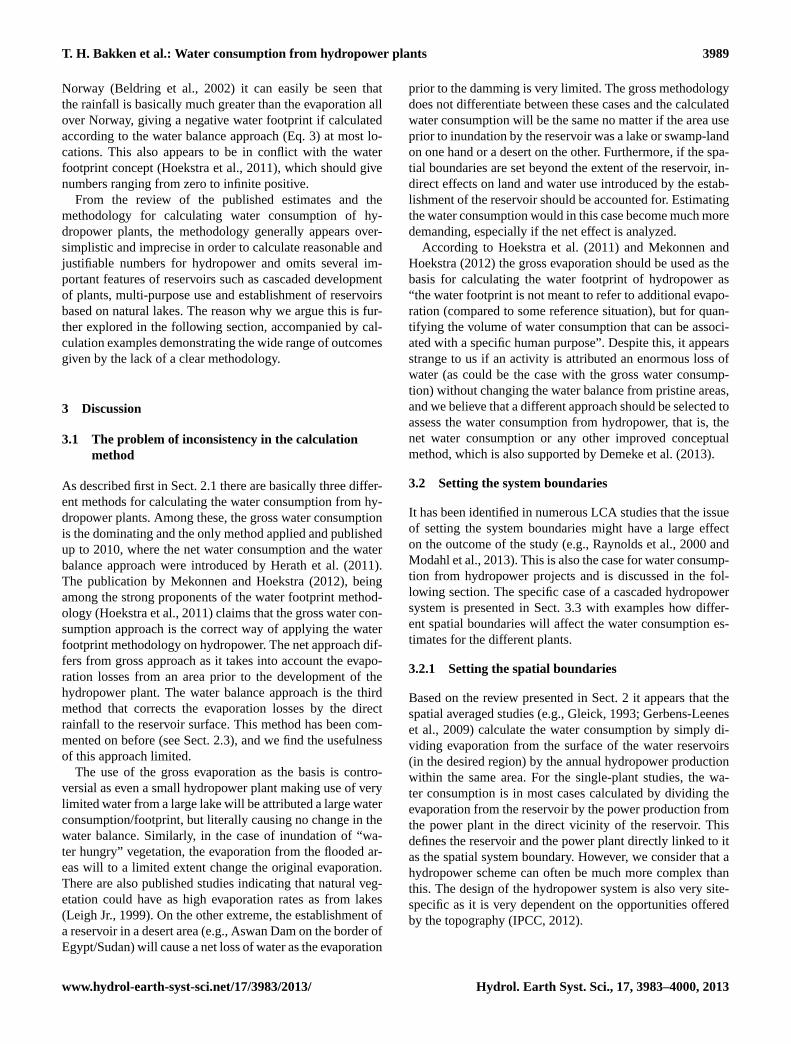
Fig. 3. The graph presents the monthly evaporation rates from the two reservoirs supplying Ghibe I, II and III power plants with water,monthly power production from the year 2005 and correspondingly monthly (gross) water consumption estimates (based on Yesuf, 2012).
A storage-based hydropower system consists of a reser-voir in the upper part that aims at collecting water from theupstream catchment and provides regulating services to thedownstream production units. It might be several intakes andtunnels from neighboring catchments collecting water intothe upstream reservoir, like Statkraft’s Ulla–Førre (Statkraft,2013) with the consequence that rivers and lakes downstreamof the intake experience reduced flows. In the case of ahigh-altitude reservoir, the original free-flowing river is oftenshortcut by tunnels leading to the hydropower station locatedat the bottom of the valley, thus creating a bypass sectionwith dramatically reduced flow. Downstream of the outlet,the same volume of water is available again, however, with achanged periodicity caused by the regulation. Further down-stream of the outlet from the uppermost hydropower plant,there could be a series of plants benefitting from the regu-lation provided by the reservoir, or, depending of the topog-raphy, a new reservoir/lake could form the basis for the reg-ulation of another series of hydropower plants. One powerplant may have tunnels coming from several reservoirs andmay also, where opportunities exist, be connected to neigh-boring watersheds or rivers (IPCC, 2012), but again, deter-mined by the topography. The groundwater levels might alsobe affected by the river regulation, especially in those areasdirectly connected to the established reservoir, but also inother areas of water bodies experiencing changes in the hy-drological regime. A run-of-the river plant mainly produceselectricity from the available river water, and affects the natu-ral hydrology to a less extent than a reservoir-based plant. Inaddition to the direct hydrological changes, the establishmentof a reservoir might also introduce changes in land and wateruse and management practices. As an example, the improved
availability of water can turn the agricultural practice fromrain-fed to irrigated crop production.
The concluding message is that a hydropower system canbe very complex affecting a large number of water bodies,possibly introducing large changes in flow from the naturalhydrological conditions. Based on this, we would argue thatthe spatial system boundaries are not always the reservoir andthe immediately connected hydropower plant as the reservoircan serve several plants with regulated flow and a large num-ber of water bodies might be affected by the regulation, evenoutside the catchment of the reservoirs and power plants. Inthe reviewed studies it is also assumed that the evaporatedwater is “lost” from the system. This water might, however,fall into the upstream part of the catchment and ultimatelyend up in the same reservoir again.
3.2.2 Setting the temporal boundaries
We assume that the estimates presenting water consumptionin Sects. 2.2 and 2.3 are all based on annual data (i.e., theevaporation rates and power production are both annual num-bers). This is not always explicitly expressed, and there arestudies calculating the water footprint on a monthly basis(e.g., Zeng et al., 2012; Hoekstra et al., 2012). As the pe-riodicity is important to consider, an example derived fromthe work of Yesuf (2012) is presented (Fig. 3).
In Fig. 3 it can be seen that the water consumption ratesvary substantially from month to month even though there isa limited change in the evaporation rates (e.g., from month 7to month 8). The reason for this is the decrease in the powerproduction, and not a reduction in the total water losses (dueto reduced surface areas) as the inflow to the reservoirs doesnot decrease in this period, actually rather the opposite oc-curs (Yesuf, 2012). If the power production drops further,
Hydrol. Earth Syst. Sci., 17, 3983–4000, 2013 www.hydrol-earth-syst-sci.net/17/3983/2013/
T. H. Bakken et al.: Water consumption from hydropower plants 3991
which happened in October in 1984, 1991, 1996 and 2002(Yesuf, 2012), we will experience that the water consumptionvalues will increase to infinity. Assuming constant evapora-tion rates, periods with high power production have a lowerwater footprint than those periods with low production. Itshould also be mentioned that some hydropower plants areconstructed for the purpose of serving peak-load to the elec-tricity system, and will hence have large variations in pro-duction over the day, week, season or year.
Similarly, the inter-annual changes in inflow to the reser-voir and the corresponding power production might give verydifferent water consumption from year to year. The site-specific shape of the reservoir (water level–surface area–volume relationship) will determine the variation total evap-oration for different inflows (given similar meteorologicalconditions), but as the relative volume of the reservoir de-creases faster than the surface area (and hence evaporation)with a drop in water level, years with low inflow/power pro-duction have generally have a higher water footprint thanyears with high inflow/production. As hydropower mighthave a lower priority than both drinking water supply andirrigation in multi-purpose reservoirs, the hydropower pro-duction might be even more reduced in dry years as otherpurposes must be fulfilled before water is allocated for elec-tricity production. This might be in line with the idea of thewater footprint, but taking into account the possible impactfrom a high water footprint it is more likely that the impactsfrom a high water footprint is larger in dry years than in wetyears.
We would hence ask for greater attention to selection ofthe time step of the calculation, as well as the time pe-riod (years) the data used in the calculation is taken from.Both the evaporation rates and power production vary on an-nual timescales, evaporation due to variation and changesin climate and land use whereas power production is alsoinfluenced by economical, technological and social factors.A well-know quasi-periodicity of climate is the El Niño–southern oscillation (ENSO), whereas trends has been ob-served in past climate and predicted for the future climate. Ifthe aim is to assess the water footprint for the coming years,it is important to consider both periodicities and trends inevaporation and power production and, if necessary, projecttrends into the future. Both too short and too long averagingperiods might introduce biases if periodicities and trends, re-spectively, are important (Wörman et al., 2010). The givenwater footprint estimates should be stamped with which timeperiod they are calculated from. In addition, an assessmentof estimation uncertainty will be valuable for supportingdecisions.
3.2.3 From selected phases to full life cycle
A life-cycle assessment (LCA) is a method which calcu-lates the environmental burdens associated with a productsystem or activity, based on the entire life cycle of the
product/activity (from “cradle to grave”). According to thedefinition of the water footprint (Hoekstra et al., 2011) “thewater footprint of a product is the volume of freshwaterused to produce the product, measured over the full sup-ply chain”. All the three discussed approaches for calcu-lating the water consumption of hydropower plants includeonly the operational phase of the plan. According to In-haber (2004) and Fthenakis and Kim (2010) the other life-cycle phases produce a much lower water footprint than theoperational phase, but as far as the authors know, no en-tire life-cycle assessment of the water consumption from hy-dropower projects has been performed. Such a study shouldalso include the planning and project preparation, construc-tion phase and the decommissioning. Including also otherphases than the operational phase will, of course, increasethe water consumption of electricity production from hy-dropower. Incorporating all life-stages is also important inorder to enable comparison of water consumption betweentechnologies. This also leads to the question regarding theassignment of life period/span for the plants.
3.3 The specifics of reservoirs in a cascaded systems
A common way of developing hydropower resources in ariver basin is to construct a series of plants (“cascade”) us-ing one or a few reservoirs regulating the whole system. Thereservoirs will typically be located in the upstream part ofthe system, where the topography is usually more favorablefor the construction of a reservoir and are often less denselypopulated areas, thus reducing the potential social conflicts.The upstream reservoir will then provide regulating servicesfor several of the downstream hydropower plants and theoperation of these downstream plants will to a large extentbe determined by the upstream release of water. There arenumerous examples of such regulation schemes worldwideand well-known hydropower systems developed this way areOmo–Ghibe in Ethiopia/Kenya (as presented in Sect. 3.2.2and later in this section), Akosombo–Kpong in Ghana (aspointed out by Mekonnen and Hoekstra, 2012) and the up-per part and side-arms of Mekong River. Lake Selbusjøenand Lake Blåsjø provide similar regulating services for Nea–Nidelva and Ulla–Førre system (Statkraft, 2013), respec-tively, as more or less arbitrary examples from Norway.
In order to illustrate how the water consumption will varydepending on the spatial system boundaries we use MandalRiver basin in southern Norway (Fig. 4), where the reservoirs(especially Nåvann and Juvann) in the upper parts of the sys-tem to a large extent regulate the inflow to all downstreamhydropower plants. The degree of regulation will vary fromplant to plant as new and unregulated flow from tributariesenters the main river where power plants are located. Thepolygons drawn on top of the sketch in Fig. 4 represent thedifferent spatial system boundaries, where the water lossesfrom the reservoirs within the same spatial boundary are dis-tributed uniformly between the power plants.
www.hydrol-earth-syst-sci.net/17/3983/2013/ Hydrol. Earth Syst. Sci., 17, 3983–4000, 2013

3992 T. H. Bakken et al.: Water consumption from hydropower plants
Fig. 4.Schematically view of Mandal River basin, including reservoirs and power plants. Modified from Agder Energi (2013).
In order to illustrate the effect on the water consumptionestimates three different spatial system boundaries have beendefined (see results in Table 2):
– system boundary 1 (SB 1): the system boundaries areset around the power plant and the immediate upstreamreservoir (i.e., all the water consumption is allocated tothe closest downstream hydropower plant).
– system boundary 2 (SB 2): the whole river basin ishandled as one system, distributing the total evapora-tion losses between all plants flat or weighted accord-ing to energy production.
– system boundary 3 (SB 3): the system boundariesdivert the system into two upstream branches andone lower part, that is, Skjerka and the upstreamreservoir capacity is handled separately from theSmeland/Logna-branch. The lower part (Håverstad,Bjelland and Laudal) is handled as a third and sepa-rate unit.
Another and a much less complex regulated system is theOmo–Ghibe River basin, as also described in Sect. 3.2.2. TheGhigel–Ghibe reservoir in the upstream end serves regulatedwater to both Ghibe I and Ghibe II. Key information to cal-culate the water consumption is given in Table 3. It is as-sumed that no additional evaporation losses happen on theriver stretch between Ghibe I and Ghibe II. System bound-ary 1 refers to setting the boundary around Ghigel–Ghibe
reservoir and Ghibe I only. System boundary 2 includes bothGhibe I and II, and the water consumption numbers are as-signed with a flat and weighted (with respect to power pro-duction) approach. The results are presented in Table 3 to-gether with characteristics of the plants and reservoir.
Based on the results from Mandal River basin and Omo–Ghibe River basin (Tables 2 and 3, respectively), we cansee that the definition of the spatial system boundaries con-siderably affects the water consumption estimates, and wecall for clarification about how this should be done in away that captures the complexity of a large number ofhydropower projects. The water consumption of Bjellandpower plant (Mandal River basin) will vary from 0.75 to21.7 m3 MWh−1, depending on the system boundaries. Fromthe case in Omo–Ghibe River basin we can read that ifGhibe II is treated as a run-of-the-river (R-O-R) plant withno reservoir, the water consumption is 0 m3 MWh−1, whileif it is acknowledged that this plant also benefits from theupstream reservoir the water consumption vary from 30.5–42.4 m3 MWh−1, depending on how the reservoir losses aredistributed between Ghibe I and II. It is worthwhile notingthat Demeke et al. (2013) has estimated the water consump-tion for Gilgel Ghibe I to 142.4 m3 MWh−1 (using the av-erage evaporation rates), which fits well with the calculatedwater consumption rates in our paper, using system bound-ary 1 (138.3 m3 MWh−1).
Water consumption estimates have been prepared for Ako-sombo by both Mekonnen and Hoekstra (2012) and Demeke
Hydrol. Earth Syst. Sci., 17, 3983–4000, 2013 www.hydrol-earth-syst-sci.net/17/3983/2013/

T. H. Bakken et al.: Water consumption from hydropower plants 3993
Table 2. Power plants, annual production and corresponding water consumption estimates for three different approaches for setting thespatial system boundaries for the cascaded regulation in Mandal River basin. The estimates given in the three columns to the right refer toflat and weighted (with respect to power production) water consumption numbers, respectively. Data sources: Agder Energi (2013), NVEAtlas (2013) and Beldring et al. (2002).
Power Annual Surface at Acc. Evaporation Water consumption estimate[m3 MWh−1]
plant production reservoir reservoir [mm]b SB 1 SB 2 SB 3
[GWh yr−1] directly surface Flat/weightedc Flat/weighted
connected area[km2]
[km2]a
Logna 105 8.1 8.1 450 34.8 9.9/24.7 53.5/57.1Smeland 119 1.6 12.0 450 6.1 9.9/21.8 53.5/50.4Skjerka 612 1.7 28.3 450 1.3 9.9/4.2 26.6/26.6Håverstad 282 3.8 32.1 450 6.1 9.9/9.2 8.6/7.5Bjelland 312 0.5 32.6 450 0.8 9.9/8.3 8.6/6.8Laudal 146 2.0 34.6 450 6.2 9.9/17.8 8.6/14.5
a The number given for Skjerka includes only Skjerkevann, not Nåvann and Langevann.b The evaporation rates should be given for each reservoir, butwill for each power plant vary according to which reservoirs that are assigned to each power plant, i.e., the spatial system boundaries.c The evaporationlosses are distributed with an even share on all plants, and these numbers are divided on the actual production for each plant.
Table 3.Characteristics and water consumption estimates for Ghibe I and II. The power production data are average production values for anon-specified period. Primary source: Yesuf (2012).
Power Annual Accumulated Evaporation Water consumption estimate[m3 MWh−1]b
plant production reservoir [mm] System boundary 1 System boundary 2[GWh yr−1
] surface area Flat/weighted[km2
]a
Ghibe I 722 62 1611 138.3 42.4/69.2Ghibe II 1635 62 1611 0 42.4/30.5
a The reservoir area is taken from Yewhalaw et al. (2009) as this is not given in Yesuf (2012).b The reader should note that these numbersdiffer from those given in Table 1 from the same publication, w hich is first of all due to the fact that data from the planned Ghibe III (witha new, large reservoir) are used in the calculations presented in Table 1, hence affecting the results. Furthermore, the data on powerproduction and evaporation originate from different periods and that there might also be differences in the reservoir area used in thecalculation.
et al. (2013), giving estimates on 3046 and 2656 m3 MWh−1,respectively. Mekonnen and Hoekstra (2012) states thatthey calculate the water footprint for the combinedAkosombo–Kpong system, while this information is notprovided by Demeke et al. (2013). The evaporation ratesused in the calculations explain some of the differencesin the water consumption estimates, where Demeke etal. (2013) use the mean value from several years of mea-surements (1500 mm yr−1), while the evaporation values(2185 mm yr−1) used by Mekonnen and Hoekstra (2012) arecalculated based on the Penman–Monteith equation.
From these cases we can conclude that a simplistic ap-proach of calculating the water consumption/footprint wouldpossibly give a very biased picture on how water lossesshould be assigned in a fair way. Defining the system bound-aries to the reservoir and the immediate hydropower plantwould typically overestimate the water consumption for thisindividual plant. A fairer approach would be to distribute
these losses also to the downstream plants benefitting fromthe reservoir.
We would also underline that the methodological approachapplied in our cases also make several rough simplifications,e.g., with respect to changes in surface area of the other wa-ter bodies and rivers affected by the regulation, ignoring thetransfer of water between catchments and the variation inflow, evaporation rates and power production throughout theyear. There are also hydropower plants that periodically areoperated with water originating from different reservoirs.
Furthermore, we would like to draw the attention to thefact that hydropower systems might also include pump-storage plants (PSPs) which will add further complexity tothe analysis. Development of PSPs is expected to increase thecoming years due to extensive development of non-regulatedrenewable energy sources (Gabrielsen and Grue, 2012) thatneeds regulating services, where hydropower is expected toplay an important role. Existing reservoirs might have theirtypical regulations regimes changed (Solvang et al., 2012)
www.hydrol-earth-syst-sci.net/17/3983/2013/ Hydrol. Earth Syst. Sci., 17, 3983–4000, 2013
3994 T. H. Bakken et al.: Water consumption from hydropower plants
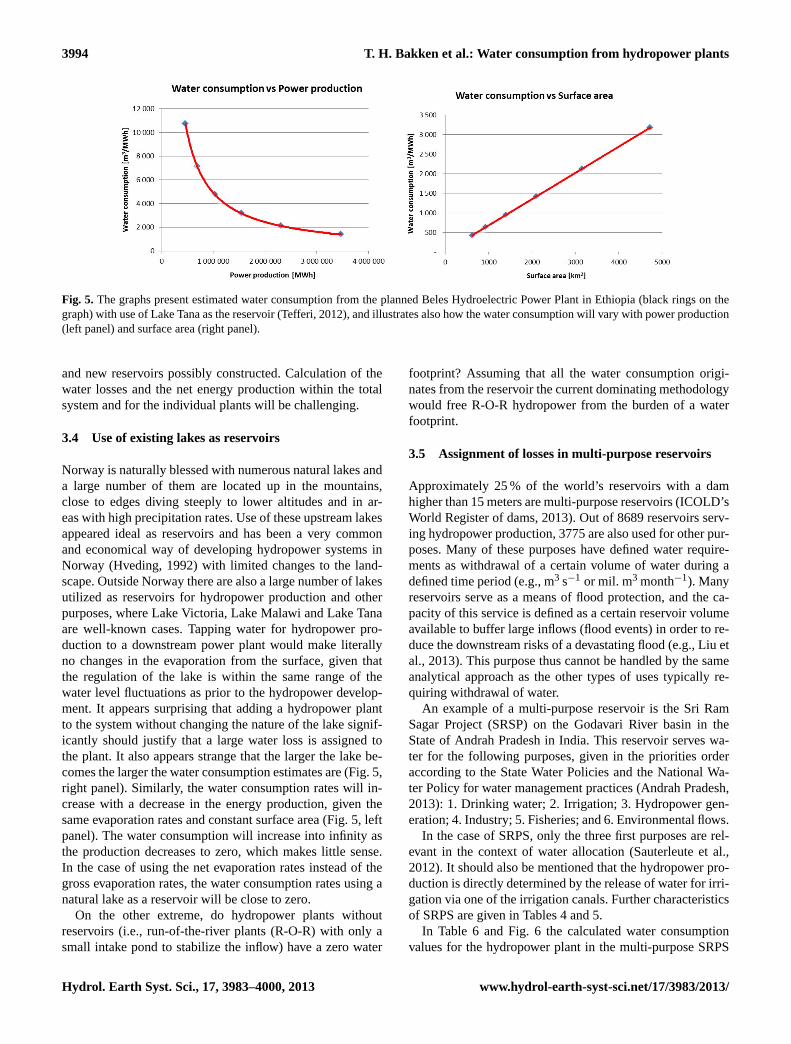
Fig. 5. The graphs present estimated water consumption from the planned Beles Hydroelectric Power Plant in Ethiopia (black rings on thegraph) with use of Lake Tana as the reservoir (Tefferi, 2012), and illustrates also how the water consumption will vary with power production(left panel) and surface area (right panel).
and new reservoirs possibly constructed. Calculation of thewater losses and the net energy production within the totalsystem and for the individual plants will be challenging.
3.4 Use of existing lakes as reservoirs
Norway is naturally blessed with numerous natural lakes anda large number of them are located up in the mountains,close to edges diving steeply to lower altitudes and in ar-eas with high precipitation rates. Use of these upstream lakesappeared ideal as reservoirs and has been a very commonand economical way of developing hydropower systems inNorway (Hveding, 1992) with limited changes to the land-scape. Outside Norway there are also a large number of lakesutilized as reservoirs for hydropower production and otherpurposes, where Lake Victoria, Lake Malawi and Lake Tanaare well-known cases. Tapping water for hydropower pro-duction to a downstream power plant would make literallyno changes in the evaporation from the surface, given thatthe regulation of the lake is within the same range of thewater level fluctuations as prior to the hydropower develop-ment. It appears surprising that adding a hydropower plantto the system without changing the nature of the lake signif-icantly should justify that a large water loss is assigned tothe plant. It also appears strange that the larger the lake be-comes the larger the water consumption estimates are (Fig. 5,right panel). Similarly, the water consumption rates will in-crease with a decrease in the energy production, given thesame evaporation rates and constant surface area (Fig. 5, leftpanel). The water consumption will increase into infinity asthe production decreases to zero, which makes little sense.In the case of using the net evaporation rates instead of thegross evaporation rates, the water consumption rates using anatural lake as a reservoir will be close to zero.
On the other extreme, do hydropower plants withoutreservoirs (i.e., run-of-the-river plants (R-O-R) with only asmall intake pond to stabilize the inflow) have a zero water
footprint? Assuming that all the water consumption origi-nates from the reservoir the current dominating methodologywould free R-O-R hydropower from the burden of a waterfootprint.
3.5 Assignment of losses in multi-purpose reservoirs
Approximately 25 % of the world’s reservoirs with a damhigher than 15 meters are multi-purpose reservoirs (ICOLD’sWorld Register of dams, 2013). Out of 8689 reservoirs serv-ing hydropower production, 3775 are also used for other pur-poses. Many of these purposes have defined water require-ments as withdrawal of a certain volume of water during adefined time period (e.g., m3 s−1 or mil. m3 month−1). Manyreservoirs serve as a means of flood protection, and the ca-pacity of this service is defined as a certain reservoir volumeavailable to buffer large inflows (flood events) in order to re-duce the downstream risks of a devastating flood (e.g., Liu etal., 2013). This purpose thus cannot be handled by the sameanalytical approach as the other types of uses typically re-quiring withdrawal of water.
An example of a multi-purpose reservoir is the Sri RamSagar Project (SRSP) on the Godavari River basin in theState of Andrah Pradesh in India. This reservoir serves wa-ter for the following purposes, given in the priorities orderaccording to the State Water Policies and the National Wa-ter Policy for water management practices (Andrah Pradesh,2013): 1. Drinking water; 2. Irrigation; 3. Hydropower gen-eration; 4. Industry; 5. Fisheries; and 6. Environmental flows.
In the case of SRPS, only the three first purposes are rel-evant in the context of water allocation (Sauterleute et al.,2012). It should also be mentioned that the hydropower pro-duction is directly determined by the release of water for irri-gation via one of the irrigation canals. Further characteristicsof SRPS are given in Tables 4 and 5.
In Table 6 and Fig. 6 the calculated water consumptionvalues for the hydropower plant in the multi-purpose SRPS
Hydrol. Earth Syst. Sci., 17, 3983–4000, 2013 www.hydrol-earth-syst-sci.net/17/3983/2013/

T. H. Bakken et al.: Water consumption from hydropower plants 3995
Table 4. Key characteristics of the reservoir and the hydropowerproduction of SRPS. Source: Sauterleute et al. (2012).
Characteristics Value Unit
Surface area of reservoir 453 km2
Installed capacity 36 MWEstimated annual energy productiona 236.5 GWhEstimated annual evaporation lossesb 1696 mmEstimated total annual evaporation losses 768.3 Mill. m3
a Assumed 75 % period of use (6570 h) of full capacity, which is probably anoptimistic estimate.b Based on evaporation data from the gauging stationHydro-Meteorological station Ramagundam of the SRPS (documented in internalnote).
is made with various models for attributing water losses tothe hydropower production.
We emphasize that the water values and allocation ra-tios are very site-specific and transfer of these data shouldbe avoided in a real case. The reason we include the watervalues from Kadigi et al. (2008) and M. J. Pasqualetti andS. Kelly (personal communication, 2008) are for the purposeof illustrating the effect the use of water values might haveon the attribution of water consumption might have on hy-dropower. Given the complexity of this example of SRSP,which is not unique, it appears very difficult to assign theburden of the water losses between the different purposes,and not fairly assign all the losses to the hydropower produc-tion. It should also be noted that the given calculations takeonly irrigation, hydropower and drinking water into consid-eration, and no other social or environmental benefits such asflood control.
The publication by M. J. Pasqualetti and S. Kelly (personalcommunication, 2008) should be mentioned specifically asthis is one of the few publications that have made an attemptto assign the water losses to the different water uses. In thispublication the approach was to assign a financial value toall of the uses of the water, namely electricity production,recreation, agriculture and domestic water supply, using thewholesale price sale of water. This was demonstrated for thecase of Glen Canyon Dam storing the water of Lake Powell,giving 55 % of the burden to hydropower. We would, how-ever, underline that the financial value does not tell the wholestory, as “social value” of water, for example irrigation mightbe very high (Kadigi et al., 2008).
The order of the development should maybe also be con-sidered when assigning the water losses to the various uses.It could be argued that water uses that arise after the con-struction of the reservoir should only be assigned those extrawater losses caused by the new activity. As in SRPS there ispotential to generate electricity in many irrigation systems,both by using the head directly at the dam site and from lowhead generation systems within the canals (e.g., US NationalHydropower Association, 2013). This would generate ben-efits to areas with limited and unreliable electricity supply
Fig. 6. The water consumption for hydropower in a multi-purposereservoir, given different models to attribute losses. The figure isbased on the numbers given in Table 6, where also the descriptionof the models can be found.
with basically no negative impacts to other water user (norchanges in evaporation). If the hydropower generation fromthese systems is attributed a large water footprint, possiblywith a high reputational risk for an energy developer, thismight stop sound projects, which is an undesired outcomeseen from all perspectives.
How much of the water consumption should be attributedto hydropower generation is controversial. Different ap-proaches for distributing the losses will lead to a wide rangeof estimates in multi-purpose reservoirs. As multi-purposereservoirs are very common and rather the rule than the ex-ception, we would argue that a methodology for estimatingwater consumption from such reservoirs must be developedin order to calculate credible estimates. This is also supportedby Mekonnen and Hoekstra (2012) and Demeke et al. (2013)that both urge the need for a methodology to distribute thewater losses in the case of multi-purpose reservoirs.
3.6 The water footprint concept and its lack ofconnection to impact
Calculation of the CO2 footprint could be seen as a par-allel to the calculation of a water footprint. In contrast toCO2, water is a local resource with local impacts if it isnot managed properly. While emissions of CO2 add to theglobal pool (atmosphere) of CO2, the water losses are not aglobal loss of a resource, but have only local or regional im-pacts (basically within the river basin). The impact of emit-ting 1 t of CO2 is independent of place while the impact ofconsuming 1 m3 can only be determined by the local situ-ation. Considering water on a global scale, it is not lost orused up due to evaporation. Increased losses or water foot-prints of electricity production will not cause any imbalanceto the global hydrological cycle. We would hence argue thatthe water consumption must be accompanied by a local or
www.hydrol-earth-syst-sci.net/17/3983/2013/ Hydrol. Earth Syst. Sci., 17, 3983–4000, 2013

3996 T. H. Bakken et al.: Water consumption from hydropower plants
Table 5.Assumed average demand fulfillment for the various sectors in the SRPS. Optimal and minimum refer to level of demand fulfillment.Source: Sauterleute et al. (2012).
Water use Demand fulfillment Demand fulfillment, ratio of[Mill. m 3 month−1
] flow [%]
Optimal Minimum Optimal MinimumDrinking water supply 20.1 11.3 2.8 2.9Irrigation 419.1 334.1 58.0 86.8Hydropower production∗ 283.2 39.6 39.2 10.3
∗ Hydropower production and supply of irrigation water via Kakatiya canal (the canal linked with thehydropower plant) is here assumed as independent of each other.
Table 6.Calculated water consumption values for the hydropower plant in the multi-purpose SRPS with various models for attributing waterlosses to the hydropower production.
Approach for assigning the water consumption Gross WC assigned toHP plant[m3 MWh−1
]
A All losses assigned to the top priority uses (drinking water) 0
B All losses assigned the hydropower plant 3248
C Losses attributed according to water use (Table 5, optimum) 1273
D Losses attributed according to water use (Table 5, minimum) 334
E1 Attribution according to economic return, using “low” 3121agricultural values from Kadigi et al. (2008)a
E2 Attribution according to economic return, using “default” 2016agricultural values from Kadigi et al. (2008)b
F Attribution according to water value principle, using water 1787values from M. J. Pasqualetti and S. Kelly (personal communication, 2008)
G Attribution according to allocation ratios given by Jain 1364(2007)c – giving a 42 % share to hydropower
a The “low” value is the agricultural value (US$ 0.01 pr m3) taken directly from the study of Kadigi et al. (2008). All the water losses areattributed to irrigation and hydropower production only.b The “default” value is the mid-value (US$ 0.10–0.20 pr m3) of “typical” values ofwater consumed for agricultural production (Perry, 2001). All the water losses are attributed to irrigation and hydropower production only.c The Government of India adopted the use-of-facilities method for allocation of joint costs of multi-purpose projects between flood control,irrigation and power in the ratio of 38 : 20 : 42 (Jain, 2007; IPCC, 2012), based on experience from the Hirakund project.
regional study on the impacts of the water resources. This isalso supported by the IPCC (2012) that underlines that theimpacts “are site specific and need to be considered withrespect to local resources and needs. RE technologies likehydropower and some bioenergy systems, for example, aredependent on water availability and can either increase com-petition or mitigate water scarcity”. This topic is, however,controversial and our views are supported by for instancePfister and Hellweg (2009), Berger and Finkbeiner (2010)and Chenoweth et al. (2013), but not by Mekonnen andHoekstra (2012).
A mature and well-tested methodology of assessing theimpacts on the water resources is not available, but a num-ber of attempts can be found. Zeng et al. (2012) demon-strates the water footprint sustainability assessment, definedby Hoekstra et al. (2011) on a river basin level, where a “sus-tainability concern” should be raised when the water foot-print exceeds the available blue water component (Hoekstra
et al., 2011). The blue water is defined as the blue waterresources under natural conditions and without human inter-vention, subtracted the environmental flow requirements.
Ridoutt and Pfister (2010) propose that a water impact in-dex should be linked to how certain types of human activitymight contribute to water scarcity and hence reduce the avail-ability of freshwater resources for both human use and theenvironment. This approach is developed with agriculturalproduction in mind. Pfister et al. (2011) propose an approachfor assessing water consumption and impact from power pro-duction by introducing climatic data, where potential evapo-ration affects the water consumption according to the tradi-tional approach, and aridity relates to the water availability.
Finally, we believe that a methodology for assessing theimpact should also take on board the fact that a reservoir im-proves the availability of water for many water users. This isfurther explored in the following section.
Hydrol. Earth Syst. Sci., 17, 3983–4000, 2013 www.hydrol-earth-syst-sci.net/17/3983/2013/

T. H. Bakken et al.: Water consumption from hydropower plants 3997
3.7 The paradox of the water footprint of the reservoir
Storage of water from the wet season to the dry season inreservoirs is acknowledged as the most common, efficientand maybe the only possible way of storing large volumesof water for longer periods (van Steenbergen et al., 2011).By use of reservoirs civilizations have to large extent over-come the risk of famine and reservoirs linked with irrigationcanals have supported the development of a farming systemwith much higher and more reliable yields (e.g., Liu et al.,2013). Reservoirs have enabled societies to have access toa secure supply of water in periods with literally no naturalrunoff. A recent publication (UNICEF and World Health Or-ganization, 2012) states that as many as 780 million peoplestill lack access to adequate drinking water services. On topof this, predictions for climate change indicate that changesin rainfall patterns and temperatures, combined with popu-lation growth, may add even more pressure on scarce waterresources (Bates et al., 2008). Given this situation, a watermanager will strive to make the management of these re-sources even more efficient in order to save and protect thisprecious resource.
There is “no way” around the fact that the evaporationlosses from reservoirs are very large in many regions, butthere is a pertinent question to ask then; would a water man-ager start removing dams and reservoirs in order to reducethe water footprint of human activities within his or her ju-risdiction in order to increase the water that is available forother purposes? The answer to this is most likely no, as wewould guess the strategy of the water manager would bethe opposite (i.e., build more reservoirs in order to catch therunoff from disappearing into the ocean). Reservoirs are ac-knowledged as an important part of the infrastructure in or-der to cope with climate change to secure water supply in thefuture (Bates et al., 2008). In many regions climate changeswill reduce precipitation further and additional reservoirs arenecessary (Harman et al., 2005).
The development of the building block method (BBM)(Tharme and King, 1998) was originally developed to as-sess environmental and downstream flows. This approach hasbeen used in a number of cases for this purpose (Bakkenet al., 2012) and has also been tested as an approach to setwater level regulation (Skarbøvik et al., 2011) and for wa-ter allocation between competing water uses (Bakken et al.,2013b). The idea of the BBM is that improved water man-agement should be reached by the involvement of expertsand stakeholders in workshops where different water alloca-tion regimes are discussed and optimum flow conditions areset in a process that is supposed to end in consensus. Thismethodology would be a way to measure to which extent theneeds of the various water uses is fulfilled and hence be aproxy for change in water availability.
We argue that the methodology for the assessment of thewater footprint of hydropower plants with reservoirs, as de-fined “to analyze how human activities or specific products
relate to issues of water scarcity and pollution, and to see howactivities and products can become more sustainable from awater perspective” (Hoekstra et al., 2011) fails in this pur-pose, since defining a management strategy based on the wa-ter footprint of reservoirs would lead to a wrong managementaction.
4 Conclusions
More studies on water consumption from hydropower arenow available since the report from IPCC on renewable en-ergy (IPCC, 2012) was published. The IPCC report wasbased on very few sources providing a wide range in theirestimates compared to the other technologies. The newlypublished studies, however, do not provide a more consis-tent picture about what the “true” water consumption fromhydropower plants is, as some of the new studies are far be-yond earlier published values on hydropower (Mekonnen andHoekstra, 2012; Tefferi, 2012).
This review reveals that three different methodological ap-proaches have been used, namely the gross and net evap-oration (Eqs. 1 and 2, respectively) and the water balancemethod published by Herath et al. (2011), where the firstapproach (gross evaporation divided by annual power pro-duction) is the dominating method. The water footprint ofhydropower is calculated using the same simplistic approachbased on gross evaporation rates (Mekonnen and Hoekstra,2012). In the cases where both the gross and the net wa-ter consumption estimates are calculated, the net valuesare in the range of approx. 12–60 % of the gross waterconsumption.
The analysis of the compiled data set of single-plant esti-mates was diversified with respect to climatic zone (Köppen,1936) and shows that the water consumption estimates fromclimatic zones A and B appear to be higher than especiallythose from zones D and E. These conclusions are based onlimited data. The difference in water consumption values be-tween the climatic zones (A and C) decreases considerablywhen calculating the average net water consumption esti-mates compared to the gross values. We believe that an over-simplistic calculation method combined with a lack of re-finement of the data set makes it difficult to identify furthertrends in the material.
This study documents and discusses several methodologi-cal problems when applying this simplified approach (grossevaporation divided by annual power production) for the esti-mation of water consumption from hydropower projects. Ashydropower projects are very site specific, the methodologi-cal approach is to a little extent suitable for this technology.A number of short-comings are identified, including the lackof clarity regarding the setting of proper system boundariesin space and time. This affects the results from cascaded sys-tems considerably, as well as possibly giving a biased pic-ture of the temporal distribution of the water consumption.
www.hydrol-earth-syst-sci.net/17/3983/2013/ Hydrol. Earth Syst. Sci., 17, 3983–4000, 2013

3998 T. H. Bakken et al.: Water consumption from hydropower plants
The methodology of attributing the water losses to the var-ious uses in multi-purpose reservoirs is not developed. Fur-thermore, a proper and fair methodology for handling waterconsumption in reservoirs based on natural lakes is needed,as it appears meaningless that all the evaporation losses froma close to natural lake should be attributed to the hydropowerproduction. It also appears problematic that the concept isnot related to the impact the water consumption will have onthe local water resources, as high water consumption valuesmight not be problematic per se. Finally, it appears as a para-dox that a reservoir might end up with very high water con-sumption/footprint and still be the most feasible measure toimprove the availability of water in a region. We argue thatreservoirs are not always the problem, but might rather bethe solution to problems of water scarcity. The authors urgefor an improved conceptual framework in order calculate thewater footprint from hydropower projects.
Acknowledgements.The study has received financial support viaEcoManage, funded by the Research Council of Norway (contractno. 215934/E20). EcoManage is organized under the researchcentre CEDREN (Centre for Environmental Design of RenewableEnergy –www.cedren.no).
Edited by: J. Liu
References
Agder Energi:www.ae.no/ae/english/, last access: 21 August 2013.Andrah Pradesh (India): State Water Policies and the National Wa-
ter Policy for water management practices,http://wrmin.nic.in/writereaddata/linkimages/anu29668628373.pdf, last access: Au-gust 2013.
Arnøy, S.: Water Footprint Approaches in Life Cycle Assessment:State-of-the-Art and a Case Study of Hydroelectric Generationin the Høyanger Area, Master’s thesis at Norwegian Universityof Life Sciences (UMB), Ås, Norway, 2012.
Bakken, T. H., Zinke, P., Melcher, A., Sundt, H., Vehanen, T., Jorde,K., and Acreman, M.: Setting environmental flows in regulatedrivers, SINTEF report Serial No. TR A7246, SINTEF EnergyResearch, Trondheim, Norway, 2012.
Bakken, T. H., Killingtveit, Å., Engeland, K., Alfredsen, K., andHarby, A.: Water consumption from hydropower production:review of published estimates, in: Considering HydrologicalChange in Reservoir Planning and Management, edited by: Schu-mann, A., IAHS Press, 2013a.
Bakken, T. H., Skarbøvik, E., Gosain, A. K., Palanisami, K., Sauter-leute, J., Egeland, H., Kakumanu, K. R., Nagothu, U. S., Harby,A., Tirupataiah, K., and Stålnacke, P.: Water Allocation WithUse of the Building Block Methodology (BBM) in the GodavariBasin, India, J. Sustain. Develop., 6, doi:10.5539/jsd.v6n8p93,2013b.
Bates, B. C., Kundzewicz, Z. W., Wu, S., and Palutikof, J. P. (Eds.):Climate Change and Water, Technical Paper of the Intergov-ernmental Panel on Climate Change, IPCC Secretariat, Geneva,210],pp., 2008.
Beldring, S., Roald, L. A., and Voksø, A.: Avrenningskart forNorge, Årsmiddelverdier for avrenning 1961–1990, Norgesvassdrags-og energidirektorat, Norges vassdrags- og energidirek-torat, Oslo, Norway, 2002.
Berger, M. and Finkbeiner, M.: Water Footprinting: How to Ad-dress Water Use in Life Cycle Assessment?, Sustainability, 2,919–944, 2010.
Chenoweth, J., Hadjikakou, M., and Zoumides, C.: Review article:Quantifying the human impact on water resources: a critical re-view of the water footprint concept, Hydrol. Earth Syst. Sci. Dis-cuss., 10, 9389–9433, doi:10.5194/hessd-10-9389-2013, 2013.
Demeke, T. A., Marence, M., and Mynett, A. E.: Evaporation fromreservoirs and the hydropower water footprint, in: Proceedingsfrom Africa 2013, 16–18 April 2013, Addis Ababa, Ethiopia,2013.
Fthenakis, V. and Kim, H. C.: Life-cycle uses of water in U.S. elec-tricity generation, Renew. Sustain. Energy Rev., 14, 2039–2048,2010.
Gabrielsen, R. H. and Grue, J. (Eds.): Norwegian Energy Pol-icy in Context of the Global Energy Situation, The NorwegianAcademy of Science and Letters, Oslo, Norway, 2012.
Gerbens-Leenes, P. W., Hoekstra, A. Y., and van der Meer, Th.: Thewater footprint of energy from biomass: A quantitative assess-ment and consequences of an increasing share of bio-energy inenergy supply, Ecol. Econom., 68, 1052–1060, 2009.
Gleick, P. H.: Environmental consequences of hydroelectric devel-opment: The role of facility size and type, Energy, 17, 735–747,1992.
Gleick, P. H.: Water in Crisis: A Guide to the World’s Fresh WaterResources, Oxford University Press, New York, NY, USA, 1993.
Gleick, P. H.: Water and energy, Annu. Rev. Energy Environ., 19,267–299, 1994.
Harman, J., Gawith, M., and Calley, M.: Progress on assessingclimate impacts through the UK Climate Impacts Programme,Weather, 60, 258–262, 2005.
Herath, I., Deurer, M., Horne, D., Singh, R., and Clothier, B.: Thewater footprint of hydroelectricity: a methodological comparisonfrom a case study in New Zealand, J. Clean. Prod., 19, 1582–1589, 2011.
Hoekstra, A. Y., Chapagain, A. K., Aldaya, M. M., and Mekonnen,M. M.: The water footprint assessment manual: Setting the globalstandard, Earthscan, London, UK, 2011.
Hoekstra, A. Y., Mekonnen, M. M., Chapagain, A. K., Mathews,R. E., and Richter, B. D.: Global Monthly Water Scarcity: BlueWater Footprints versus Blue Water Availability, PLoS ONE, 7,e32688, doi:10.1371/journal.pone.0032688, 2012.
Hutson, S. S., Barber, N. L., Kenny, J. F., Linsey, K. S., Lumia,D. S., and Maupin, M. A.: Estimated use of water in the UnitedStates in 2000, US Geological Survey, Virginia, USA, 2004.
Hveding, Q.: Hydropower development in Norway, Vol. 1, Norwe-gian Institute of Technology, Division of Hydraulic Engineering,Trondheim, Norway, 1992.
ICOLD’s World Register of dams:http://www.icold-cigb.net/GB/World_register/generalsynthesis.asp, last acess: 21 August 2013.
IHA: World Congress Bulletin: Summary of the International Hy-dropower Association Paper presented at the World Congress onadvancing sustainable hydropower, New York,http://www.iisd.ca/ymb/hydro/iha2011/html/ymbvol139num7e.html(last access:21 August 2013), 2011.
Hydrol. Earth Syst. Sci., 17, 3983–4000, 2013 www.hydrol-earth-syst-sci.net/17/3983/2013/
T. H. Bakken et al.: Water consumption from hydropower plants 3999
Inhaber, H.: Water Use in Renewable and Conventional ElectricityProduction, Energy Sourc., 26, 309–322, 2004.
IPCC: Edenhofer, O., Pichs-Madruga, R., Sokona, Y., Seyboth, K.,Matschoss, P., Kadner, S., Zwickel, T., Eickemeier, P., Hansen,G., Schlömer, S., and von Stechow, C. E.: IPCC Special Reporton Renewable Energy Sources and Climate Change Mitigation.Cambridge University Press, Cambridge, UK and New York, NY,USA, 2012.
Jain, S. K.: Hydrology and water resources of India, Water Sci.Technol., 57, 388–389, 2007.
Kadigi, R. M. J., Mdoe, N. S. Y., Ashimogo, G. C., and Morardet,S.: Water for irrigation or hydropower generation? Complexquestions regarding water allocation in Tanzania, Agr. WaterManage., 95, 984–992, 2008.
Kenny, J. F., Barber, N. L., Hutson, S. S., Linsey, K. S., Lovelace,J. K., and Maupin, M. A.: Estimated Use of Water in the UnitedStates in 2005, US Geological Survey Circular vol. 1344, US Ge-ological Survey, Reston, VA, 2009.
Köppen, W.: Das geographisca System der Klimate, in: Handbuchder Klimatologie, edited by: Köppen, W. and Geiger, G. C.,Gebr. Borntraeger, 1–44, 1936.
LeCornu, J.: Dams and water management, Report of the Secre-tary General, International Commission on Large Dams to theConférence Internationale Eau et Développement Durable, 19–21 March 1998, Paris, France, 1998.
Leigh Jr., E. G.: Tropical Forest Ecology, A view from Barro Col-orado Island, Oxford University Press, 2009.
Liu, J., Zang, C., Tian, S., Liu, J., Yang, H., Jia, S., You, L., Liu, B.,and Zhang, M.: Water conservancy projects in China: achieve-ments, challenges and way forward, Global Environ. Change, 23,633–643, 2013.
Macknick, J., Newmark, R., Heath, G., and Hallett, K. C.: AReview of Operational Water Consumption and WithdrawalFactors for Electricity Generating Technologies, Technical Re-port NREL/TP-6A20-50900, National Renewable Energy Labo-ratories, Colorado, USA, 2011.
Macknick, J., Newmark, R., Heath, G., and Hallett, K. C.: Oper-ational water consumption and withdrawal factors for electric-ity generating technologies: a review of existing literature. Env-iron. Res. Lett., 7, 045802, doi:10.1088/1748-9326/7/4/045802,2012a.
Macknick, J., Sattler, S., Averyt, K., Clemmer, S., and Rogers,J.: The water implications of generating electricity: water useacross the United States based on different electricity pathwaysthrough 2050, Environ. Res. Lett., 7, 045803, doi:10.1088/1748-9326/7/4/045803, 2012b.
Mekonnen, M. M. and Hoekstra, A. Y.: The blue water footprint ofelectricity from hydropower, Hydrol. Earth Syst. Sci., 16, 179–187, doi:10.5194/hess-16-179-2012, 2012.
Mielke, E., Anadon, L. D., and Narayanamurti, V.: Water Consump-tion of Energy Resource Extraction, Processing and Conversion,Discussion Paper No. 2010-15, Harvard Kennedy School, Cam-bridge, MA, USA, 2010.
Modahl, I. S., Raadal, H. L., Gagnon, L., and Bakken, T. H.: Howsystem boundaries affect the energy indicator results for differ-ent electricity generation technologies, Energy Policy, in press,2013.
NVE Atlas: http://atlas.nve.no/ge/Viewer.aspx?Site=NVEAtlas,last access: 21 August 2013.
Pasqualetti, M. J. and Kelley, S.: The Water Costs of Electricity inArizona Arizona Department of Water Resources, Phoenix, AZ,2008.
Perry, C. J.: Charging for irrigation water: The issues and options,with a case study from Iran, Research Report 52, InternationalWater Management Institute, Colombo, Sri Lanka, 2001.
Pfister, S. and Hellweg, S.: The water “Shoesize” vs. Footprint ofbioenergy, P. Natl. Acad. Sci., 106, E93–E94, 2009.
Pfister, S., Saner, D., and Koehler, A.: The environmental rele-vance of water consumption in global power production, Int. J.Life Cycle Assess., 16, 580–591, doi:10.1007/s11367-011-0284-8, 2011.
Raynolds, M., Fraser, R., and Checkel, D.: The relative mass-energy-economic (RMEE) method for system boundary selec-tion Part 1: A means to systematically and quantitatively selectLCA boundaries, Int. J. Life Cycle Assess., 5, 37–46, 2000.
Ridoutt, B. G. and Pfister, S.: A revised approach to water foot print-ing to make transparent the impacts of consumption and produc-tion on global freshwater scarcity, Global Environ. Change, 20,113–120, 2010.
Sauterleute, J., Skarbøvik, E., Bakken, T. H., Egeland, H., Harby,A., Stålnacke, P. Nagothu, U. S., Palanisami, K., KrishnaReddy, K., and Gosain, K.: Application of the Building BlockMethodology to the Sri Ram Sagar Project, SINTEF ReportNo. TR A7181, Trondheim, Norway, 44 pp., 2012.
Shiklomanov, I. A.: Appraisal and Assessment ofWorld Water Resources, Water Int., 25, 11–32,doi:10.1080/02508060008686794, 2000.
Skarbøvik, E., Udnes, H., Øgaard, A., Eggestad, H., Rohrlack,T., Tingvold, J., and Drageseth, T.: Helhetlig utredning avmanøvrering og flombegrensning i Vansjø, Integrated evaluationof dam operation and flood management of Lake Vansjø; in Nor-wegian, Bioforsk Rapport, 6, p. 60, 2011.
Solvang, E. Harby, A., and Killingtveit, Å.: Increasing balancepower capacity in Norwegian hydroelectric power stations, SIN-TEF Report Serial No. TR A7195, SINTEF Energy Research,Trondheim, Norway, 2012.
Statkraft: Ulla-Førre Hydropower system,http://www.statkraft.no/energikilder/vannkraft/ulla-forreverkene.aspx, last access:21 August 2013.
Tefferi, M.-E. A.: The effect of Ethiopian hydropower reservoirs onBlue Nile River flow regime, Master’s thesis at Norwegian Uni-versity of Science and Technology, Dept. of Hydraulic and En-vironmental Engineering, Norwegian University of Science andTechnology, Trondheim, Norway, 2012.
Tharme, R. E. and King, J. M.: Development of the Building BlockMethodology for instream flow assessments, and supporting re-search on the effects of different magnitude flows on riverineecosystems, Water Research Commission Report No. 576/1/98,Water Research Commission, South Africa, p. 452, 1998.
Torcellini, P., Long, N., and Judkoff, R.: Consumptive Water Usefor U.S. Power Production, Technical Report-TP-550-33905,National Renewable Energy Laboratory (NREL), Golden, CO,USA, 2003.
UNICEF and World Health Organization: Progress on drinkingwater and sanitation, 2012 Update, WHO/UNICEF Joint Mon-itoring Programme for Water Supply and Sanitation, Geneva,Switzerland, 2012.
www.hydrol-earth-syst-sci.net/17/3983/2013/ Hydrol. Earth Syst. Sci., 17, 3983–4000, 2013

4000 T. H. Bakken et al.: Water consumption from hydropower plants
US Department of Energy: Energy demands on water resources, Re-port to Congress on the interdependency of energy and water,US Department of Energy, Washington, D.C., USA, p. 80, 2006.
US National Hydropower Association:http://www.hydro.org/tech-and-policy/technology/small-hydro/, last access: 21 Au-gust 2013.
van Steenbergen, F., Tuinhof, A., and Knoop, L.: Transforminglives, transforming landscapes. The business of sustainable wa-ter buffer management, 3R Water Secretariat, Wagenegen, theNetherlands, 2011.
Wörman, A., Lindström, G., Riml, J., and Åkesson, A.: Drift-ing runoff periodicity during the 20th century due to chang-ing surface water volume, Hydrol. Process., 24, 3772–3784,doi:10.1002/hyp.7810, 2010.
Yesuf, M. B.: Impacts of Cascade Hydropower Plants on the flow ofthe River System and Water level in Lake Turkana in Omo-GhibeCatchment, Ethiopia, Master’s thesis at Norwegian University ofScience and Technology, Dept. of Hydraulic and EnvironmentalEngineering, Trondheim, Norway, 2012.
Yewhalaw, D., Legesse, W., Van Bortel, W., Gebre-Selassie, S.,Kloos, H., Duchateau, L., and Speybroeck, N.: Malaria and wa-ter resource development: the case of Gilgel-Gibe hydroelectricdam in Ethiopia, Malaria J., 8, 21, doi:10.1186/1475-2875-8-21,2009.
Zeng, Z., Liu, J., Koeneman, P. H., Zarate, E., and Hoekstra, A. Y.:Assessing water footprint at river basin level: a case study for theHeihe River Basin in northwest China, Hydrol. Earth Syst. Sci.,16, 2771–2781, doi:10.5194/hess-16-2771-2012, 2012.
Hydrol. Earth Syst. Sci., 17, 3983–4000, 2013 www.hydrol-earth-syst-sci.net/17/3983/2013/
Related Documents