Technical Memorandum EMA # 391 Water Budget Analysis for Stormwater Treatment Area 6, Section 1 (January 1, 1998 to December 31, 1999) February 2001 by R. Scott Huebner Hydro Information Systems and Assessment Department Environmental Monitoring and Assessment Division South Florida Water Management District West Palm Beach, FL 33406

Welcome message from author
This document is posted to help you gain knowledge. Please leave a comment to let me know what you think about it! Share it to your friends and learn new things together.
Transcript

Technical MemorandumEMA # 391
Water Budget Analysis for StormwaterTreatment Area 6, Section 1
(January 1, 1998 to December 31, 1999)
February 2001
by
R. Scott Huebner
Hydro Information Systems and Assessment DepartmentEnvironmental Monitoring and Assessment Division
South Florida Water Management DistrictWest Palm Beach, FL 33406


EXECUTIVE SUMMARY
This report presents a water budget for Stormwater Treatment Area (STA) 6,Section 1, from January 1, 1998, through December 31, 1999. STA 6, Section 1, was thefirst of six stormwater treatment areas to be built and was substantially completed onOctober 31, 1997 at a cost of $1.9 million. STA 6 started full operation on December 9,1997 with the purpose of reducing the phosphorous concentration in runoff fromapproximately 10,400 acres of agricultural land north of STA 6. Prior to construction,STA 6 was a runoff detention area belonging to US Sugar Corporation.
STA 6, Section 1, is comprised of two bermed, wetland treatment cells, Cell 3 andCell 5, with a total effective treatment area of 870 acres (245 acres and 625 acres,respectively). Under typical operating conditions, the cells are designed to have waterdepths of 0.5 to 4.5 feet with a long-term design operating water depth of 2.0 feet. Waterflows from west to east across the cells and eventually discharges to the L4 canal.
In 1998 and 1999, STA 6 received 128,287 acre-feet (ac-ft) of water frompumping operations at G600_P. An additional 9065 ac-ft was input to STA 6 via rainfall;8063 ac-ft was lost through evapotranspiration. Seepage was 17.7 percent of the waterbudget during this period, losing 24,440 ac-ft to surrounding water bodies and thesurficial aquifer. Outflow from STA 6 at G606 was 75.8 percent of the flow enteringSTA 6 at G600_P or 97,250 ac-ft. This volume entered the L4 canal via the G607culverts. The amount of water stored in STA 6 was reduced by 665 ac-ft in two years.The error in the biennial water budget was 8,265 ac-ft or 6.0 percent. Cell 3 retainedwater an average of 4.2 days in 1998 and 1999. The average retention time in Cell 5 was8.8 days.
There were two unexpected outcomes that resulted from the water budget analysisof STA 6. The first was that estimated seepage constituted a much larger part of thewater budget (17.7 percent) than was anticipated. The second was that mean hydraulicretention times were significantly lower than those computed for the Everglades NutrientRemoval project (17 to 25.4 days versus 4.2 days for Cell 3 and 8.8 days for Cell 5).
The water budget for STA 6, Section 1, will improve with additional years of dataand improved information about seepage at the site. A better understanding of watermovement including retention and seepage should aid in the design and optimization offuture STAs used in the restoration of South Florida's water resources.

ACKNOWLEDGEMENTS
The following people helped in preparing and reviewing the drafts of this document:Wossenu Abtew, Susan Bennett, Guy Germain, Muluneh Imru, Nagendra Khanal, LindaLindstrom, Hedy Marshall, Zaki Moustafa, Chandra Pathak, Tracey Piccone, JohnRaymond, Garth Redfield and Mary Skinner.

TABLE OF CONTENTS
EXECUTIVE SUMMARY .............................. ... ............ ---...................... iACKNOW LEDGEMENTS .......................................................... ...................................TABLE OF CONTENTS .................................................................. iiiLIST OF TABLES .................................................................................................... iv
LIST OF FIGURES .......................................................................... - --... ...... ............. v
INTRODUCTION .............................................................................................................. 1B ackground ................................................................................. ................................. 1Site Description .................................... .................................................................... 3
M on ito rin g ....................................................................................................................... 5STA OPERATION........................................................ ................................................ 6HYDROLOGIC AND HYDRAULIC DATA .................................................................. 7
Rainfall ....................................................... ............................................................. 7
Evapotranspiration ...................................................... ......... ---. --... -.. 8Stage ............................................................................-..... . .......................... 8
F lo w ........................................................... ...................................................................... 9S eep age ..................................................................................... ............................... 10
W ATER BUDGET....................................... 15
Methodology ............................................................... ............................................. 15
R esults .............................. ............................................ .............................................. 15Supply C anal ............................................................................................................... 15Cell 5 .................................................. 19C ell 3 ....................................... . .............................................................................. 22
Discharge Canal .......................................................................................... . ........ 26
S T A 6 .................................................................................... ................................ 2 9Mean Hydraulic Retention Time......................................................... .................... 30
SUMMARY AND DISCUSSION ................................................................................. 37
RECOMMENDATIONS .................................................................................... .............. 38
CONCLUSIONS ......................................................................... . ........ 39
APPENDICES .............................................................- ... . .............-- .- - -. ... 42
Appendix A. Site Properties and Monitoring Stations ....................................................... 43Appendix B - Rainfall Data..... ................................... 46Appendix C - Evapotranspiration Data .............................................. ........................ 49Appendix D - Soil M oisture Equations ....................................................................... 52
11i

LIST OF TABLES
Table 1. Flow Monitoring Locations at STA 6.........................................................6Table 2. Stage Recording Locations at STA 6 .......................................................... 6Table 3. Supply Canal Water Budget Summary 1998-99 ..................................... 16Table 4. Cell 5 Water Budget Summary 1998-99 ...................................................... 19Table 5. Cell 5 Monthly Water Budget 1998-99 ..................................................... 22Table 6. Cell 3 Water Budget Summary 1998-99 ...................................................... 23Table 7. Cell 3 Monthly Water Budget 1998-99 .................................................... 24Table 8. Discharge Canal Water Budget Summary 1998-99 .................................... 27Table 9. STA 6 Water Budget Summary............................ ............. 31Table 10. STA 6 Monthly Water Budget 1998-99....................................................31Table 11. Mean Hydraulic Retention Time.................................36Table A - 1. STA 6 Site Properties............................................ .......... ............ 43Table A - 2. Stage M onitoring Stations.....................................................................44Table A - 3. Flow Monitoring Stations ................................................... 44Table A - 4. Rainfall M onitoring Sites................................ ............... ........................... 45Table A - 5. Evapotranspiration Monitoring Sites ........................................................ 45Table B - 1. 1998 Rainfall at G600_R (inches) ............................................................ 46Table B - 2. 1999 Rainfall at G600 R (inches)..............................................................47Table C - 1. 1998 Evapotranspiration at STA 6 (mm) ..................................................... 49Table C - 2. 1999 Evapotranspiration at STA 6 (mm) ..................................... 50
LIST OF FIGURES
Figure 1. ST A 6 Site M ap ................................................................... .................. 4Figure 2. STA 6, Section 1 Structure and Monitoring Locations ...................... 5.........Figure 3. Average Groundwater Table Elevations without STA 6 or the USSC
Unit 2 Pump Station at G600 - January 1, 1998, to April 15, 1998 ......... 13Figure 4. Average Groundwater Table Elevations with STA 6 January 1, 1998,
to A pril 15, 1998 ...................................................................................... 13Figure 5. Average Groundwater Table Elevations without STA6 or the USSC
Unit 2 Pump Station at G600 - April 16, 1998, to June 30, 1998 ........... 14Figure 6. Average Groundwater Table Elevations with STA6 - April 16, 1998,
to June 30, 1998 ........ ....................................................... ...................... 14Figure 7. Daily Water Budget Residuals for the Supply Canal 1998-99 ................ 17Figure 8. Supply Canal Estimated Seepage 1998-99 ................................................. 17
Figure 9. Supply Canal Stage versus Surrounding Water Bodies 1998-99.............18Figure 10. Supply Canal Inflow, Outflow and Stage 1998-99............................. 18Figure 11. Daily Water Budget Residuals for Cell 5 1998-99 .................................. 20
Figure 12. Cell 5 Estimated Seepage 1998-99 ................................................................ 20Figure 13. Stage in Cell 5 Stage and Surrounding Water Bodies 1.998-99 ............... 21Figure 14. Cell 5 Inflow, Outflow and Stage 1998-99 ............................................. 21Figure 15. Daily Water Budget Residuals for Cell 3 1998-99 ..................................... 24
Figure 16. Cell 3 Estimated Seepage 1998-99 ......................................... ............ 25Figure 17. Stage in Cell 3 and Surrounding Water Bodies 1998-99 ............................ 25Figure 18. Cell 3 Inflow, Outflow and Stage 1998-99 ................................................. 26
Figure 19. Daily Water Budget Residuals for the Discharge Canal 1998-99 ...... 27Figure 20. Discharge Canal Estimated Seepage 1998-99 ............................................ 28Figure 21. Stage in the Discharge Canal and Surrounding Water Bodies 1998-99.....28Figure 22. Discharge Canal Inflow, Outflow and Stage 1998-99 ................................ 29
Figure 23. Water Budget Residual for STA 6 1998-99..................... 32Figure 24. STA 6 Estimated Seepage 1998-99 ........................................................... 32Figure 25. Stage along the Northern Boundary of STA 6 1998-99 ............................. 33Figure 26. Stage along the Western Boundary of STA 6 1998-99...............................33Figure 27. Stage along the Eastern Boundary of STA 6 1998-99 ................................ 34Figure 28. Inflow, Outflow and Seepage for STA 6 1998 ......................... .............. 34Figure 29. Inflow, Outflow and Seepage for STA 6 1999 ............................ .... 35Figure 30. STA 6 Water Budget Inflow and Outflow Volumes 1998-99 ................. 35Figure 31. STA 6 Water Budget Volumes 1998-99 .................................... ..........36Figure 32. STA 6 Inflow, Seepage and Water Budget Residuals 1998-99 ............... 38Figure B - 1. Rainfall in Inches at G600_R 1998-1999 .............................................. 48Figure C - 1. Evapotranspiration in Millimeters at STA 6..........................................51Figure D - 1. Falling Water Table (Drying Front) Equation .............................. ..........52
Figure D - 2. Rising Water Table (Wetting Front) Equation .......................... ..........52


INTRODUCTION
This report presents a water budget for Stormwater Treatment Area (STA) 6,Section 1. The budget covers the period of operations from January 1, 1998, throughDecember 31, 1999. During this period South Florida experienced the end of an El Nifoweather pattern (January to March 1998), which produced higher than average rainfall,stages and flows (Huebner, 2000), and the onset of La Niia-influenced weather thatresulted in drier than average summer months. Another major event, Hurricane Irene,affected the area from October 14 to 17, 1999 (Abtew and Huebner, 2000) resulting in anaverage of 6.84 inches of rain over the South Florida Water Management District. Ingeneral, 1998 was drier than average and specifically the wet season in 1998 (Junethrough October) was drier than average. There was significantly more rain in 1999 thanaverage (66.65 in. versus 53.47 in.); most of the increase occurred during the wet season.
A water budget is an important analytical technique used to assess the relativeimpact of various hydrologic and hydraulic components (rainfall, flow, seepage, etc.) onthe units that make up a hydrologic system (e.g., channels, lakes, etc.). It is one of thesimplest forms of hydrologic model and is often used to determine the amount of wateravailable to meet water supply needs. It can also be used to assess the sensitivity of aunit to changes in component inputs, such as changes in rainfall, and to determine therelative impact of each of the components to the overall budget and the error involvedwith its measurement. Hydrologic analysis is vital to on-going research and evaluationefforts to optimize performance of STAs, a cornerstone of Everglades restoration. Theinformation gives us a better understanding of the physical processes occurring and canbe used to target efforts to improve data acquisition and evaluation. Ultimately, it givesthe observer a sense of where water is coming from and where it is going and in whatquantities.
The analysis presented herein is based upon a daily water budget for hydrologicunits in STA 6. Daily results were aggregated to develop monthly, annual and biennialwater budgets. The daily water budget accounted for inflow, outflow, rainfall,evapotranspiration, seepage and error. This section of the report presents backgroundinformation about STA 6, water budget analyses and monitoring at STA 6. Sectionsdescribing the operation of STA 6 and the sources of data used for the report follow. Thelatter of these two presents information on previous studies on areas similar to STA 6.The actual water budget analysis is presented in the next section followed by a summary,recommendations and conclusions.
BackgroundSTA 6, Section 1, was the first of six STAs to be built and operated following the
success of the prototype Everglades Nutrient Removal (ENR) project started in August1994. Construction of STA 6 was substantially completed October 31, 1997, at a cost of$1.9 million. It was funded as part of the Everglades Construction Project (ECP), anelement of the Everglades Program established by the Everglades Forever Act

(§373.4592, Fla. Stat.). STA 6 received a discharge permit from the Florida Departmentof Environmental Protection (DEP) and started full operation on December 9, 1997. Itsprincipal purpose is to reduce phosphorous concentrations in runoff from U.S. SugarCorporation's (USSC) Unit 2 development (approximately 10,400 acres) north of STA 6.Prior to construction, the stormwater treatment area was a runoff detention areabelonging to USSC.
Since the ENR was a prototype wetland treatment area, it was well instrumentedand closely observed. Water budgets were completed for the periods 1994-96 (SFWMD,1996), 1996-97 (Abtew and Mullen, 1997, Guardo, 1999) and 1997-98 (Abtew andDowney, 1998). The form of these analyses and the presentation of the results stronglyinfluenced the methods used in this study. Results from the ENR water budget studieswere also used to evaluate and compare water budget errors in this analysis for STA 6.
The water budget at STA 6 involves the following hydrologic/hydrauliccomponents:
* Inflow through pumps and weirs* Outflow through weirs and culverts* Rainfall* Evapotranspiration* Seepage* Change in storage* Water budget error
Each component makes up an important part of the water budget for STA 6. Thebudget is developed for varying time periods ranging from one day to two years using thefollowing equation:
A I-O+R-ET G+e (1)At
where AS = change in storage over the time periodAt = time periodI = average inflow over the time period
O = average outflow over the time periodR = rainfall over the time period
ET = evapotranspiration over the time periodG = levee and deep seepage over the time periode = water budget error over the time period
In equation 1, all terms have the same units, acre-feet per unit time (day, month,year). In order to do this for rainfall and evapotranspiration, the values (in inches ormillimeters) are converted to feet and multiplied by the effective surface area in acres,

(e.g., 245 acres for Cell 3) to get a volume of rainfall or evapotranspiration for a selectedtime period.
Two years of daily average stage, flow, rainfall and evapotranspiration data wereused in this report. The data were analyzed using equation 1 on a daily, monthly andannual basis. For each time period, each of the terms in equation I was quantified.Optimization techniques, described in the section titled Seepage, were used to minimizethe water budget error term in the equation.
Site DescriptionSTA 6 is in the southwestern corner of the Everglades Agricultural Area (EAA)
adjacent to the Rotenberger Wildlife Management Area. STA 6 and its location relativeto major canals and roadways are shown in Figure 1. It is comprised of two treatmentcells, Cell 3 and Cell 5, with a total effective treatment area of 870 acres (245 acres and625 acres, respectively). The cells are bermed wetlands with structures that controlinflow, outflow and stage within the cells.
According to a survey conducted in 1998 (GEONEX, 1999), Cell 3 wasdominated by sawgrass (45.0 percent), but other wetland species were present, such asSagittaria lancifolia (12.0 percent), willow (6.5 percent), and cattail (2.0 percent). Mixedshrubs covered 21.0 percent of the cell. Only 3.0 percent was open water and/orsubmerged algae. The plant community in Cell 5 was dominated (62.0 percent) bymiscellaneous grasses, including Panicum purpurescens and Panicum repens. Cattailmade up 4.4 percent of the vegetation and willow about 2.0 percent. Sawgrass andSagittaria were also present, but made up less than 2,0 percent of the plant coverage. Atthe time of the survey 14.6 percent of the area in Cell 5 was open water and/or submergedalgae. Table A-1 in Appendix A contains a summary of site properties used in the waterbudget calculations for STA 6.
The treatment cells receive water via a supply canal that is west of the cells(Figure 2). Under normal operating conditions, water enters the supply canal from thenorth through pump station 600_P. During periods of drought, it can also enter the canalthrough G604, a set of five culverts with upstream flap gates at the southern end of thesupply canal. Water entering the supply canal through G604, is used to irrigate USSC'sUnit 2 development to the north of STA 6. The stage in the canal is typically below thecrest of the inlet weirs under drought conditions.
There is one inflow weir for Cell 3 and two inflow weirs for Cell 5. Water leavesthe treatment cells through a series of three outlet weir structures in each cell (G393Athough C and G354A through C). Treated water then enters a discharge canal thatconnects to the L4 canal. The L4 canal runs east-west along the southern boundary of theEAA flowing east during the wet season to the South Florida Water ManagementDistrict's (SFWMD) S8 pump station and the Miami canal. The two treatment cells, thesupply canal and the discharge canal cover a total area of 912 acres.

A full description of STA 6, its design and operation are provided in theOperation Plan Stormwater Treatment Area No. 6, Section 1 (SFWMD, 1997).
6 0 6 12 Miles- --
Figure 1. STA 6 Site Map
Major roadsLakesj" County Boundary0 Water Conservation Area, STA Boundary
Canal F

Monitoring
Three hydrologic parameters were monitored at STA 6, flow, stage and rainfall.The monitoring locations are shown in Figure 2. Table 1 lists the stations where dailyaverage flow data was recorded. Daily average stage (water surface elevation) wasrecorded at the stations shown in Table 2.
The depth of rainfall in inches was recorded at G600_R, located near pumpstation G600_P. The rainfall data were compared to rainfall amounts at nearby rainfallrecording locations to check for potential data errors. The station names, database (DB)keys and station descriptions are shown in Tables A-2 through A-4 in Appendix A.
NOT TO SCALE
L-3 BORROW CANAL-.SBORROW CANAL STA6 INFLOW CANAL
S (Tretment Cell Inflow S irce)
0W00_H&T'
00 (Inflow Pump Station) i m. ----G60501 1 'reml Cel 5 G354A
0602 ... w G354 B
'GZ54C
age Monitoring 060333 m - 393Alrnfall Monitoring 43 G3
'l G393Bscharge Operallons Water Ouality Monioring
low Weirs 0604 n lh
.w Through Culverts (BnvoArriim o aermo m ' .Dn
G605 G607Fin., /5toqe I IelQ Vr IrwD/s lo olt h, SIGe(U M FlorW)/WD/lge MonIig SLe
Figure 2. STA 6, Section 1 Structure and Monitoring Locations
G6
st
[. Ro
* Dis
Sin> FIo

Table 1. Flow Monitoring Locations at STA 6
G600P inflow pumps at the northwest corner of STA 6G601 northern inflow weir to Cell 5G802 southern inflow weir to Cell 5G603 inflow weir to Cell 3G354A, B and C outflow weir/culverts for Cell 5G393A, B and C outlet weir/culverts for Cell 3G605 ultrasonic velocity meter (UVM) for flow to the supply canal (south of culver G604)G806 ultrasonic velocity meter (UVM) for flow out of the discharge canalG607 flow through culvert G607
Table 2. Stage Recording Locations at STA 6
G600_H headwater elevation for the pumps at G600G600_T tailwater elevation for the pumps at G600G352S H headwater elevation for the inlet weirs at G601 and G602G352ST tallwater elevation for the inlet weirs at G601 and G602G392S_H headwater elevation for the inlet weir at G603G392S T tailwater elevation for the inlet weir at G603G354CH headwater elevation for outlet weirs at G354A, B and CG354C T tailwater elevation for outlet welrs at G354A, B and CG393B_H headwater elevation for outlet weirs at G393A, B and CG393B_T tailwater elevation for outlet welrs at G393A, B and CG604 headwater elevation for the culvert at G604G605 talilwater elevation for the culvert at G604 (water elevation at the UVM at G605)G606 Water elevation at the UVM at G606G607_H headwater elevation for the culvert at G607G607_T tallwater elevation for the culvert at G607
Evapotranspiration (ET) is the loss of water to the atmosphere by vaporization(evaporation) at the surface of a water body and/or by respiration of living organismsincluding vegetation (transpiration). The evapotranspiration data used in this waterbudget analysis were derived from two sources: 1) ET data for the ENR and STA 1 West;and 2) ET values computed using recorded air temperature and total radiation. Thestation information for the ET database that was used in this study is listed in Table A-5.
STA OPERATIONThe five pumps at station G600_P typically run during the wet season in order to
drain agricultural fields to the north of STA 6. Each pump has a capacity of 100 cfs. Thepumps are cycled on and off depending upon the amount of water that needs to bewithdrawn from the fields. This water discharges into the supply canal and creates ahydraulic head on the inlet weirs, G601, G602 and G603 to Cells 3 and 5. There is noinflow control to the treatment cells other than controlling the stage in the supply canalby varying the amount of water pumped at G600_P. Since Cell 3 has a surface area thatis 28.0 percent of the total effective treatment area of STA 6 (245 acres vs. 870 acres), itwas designed to treat 28.0 percent of the total inflow. The design of the inlet weirs wasbased upon this division of flow (SFWMD, 1997). The inlet weir crests for G601 andG602 (Cell 5) is set at 14.1 ft NGVD. The crest of the weir at G603 (Cell 3) is set at 14.2

ft NGVD. The maximum total design inflow for both cells is 500 cfs. This value hasnever been exceeded. The maximum inflow since the start-up of STA 6 was 456.7 cfsrecorded at G600_P on October 18, 1999, attributed to runoff caused by Hurricane Irene.
Under typical operating conditions, the cells are designed to have water depths of0,5 to 4.5 ft. The average ground elevation of each cell is 12.4 ft NGVD. The long-termdesign operating depth is 2.0 ft (14.4 ft NGVD). The outlet weir boxes at G354Athrough C and G393A through C control the water surface elevations in each of thetreatment cells. The outlet weir crest elevations were set at 13.6 ft NGVD. Sometimeduring the first two years of operation, the outlet weir boxes at G354 (Cell 5) and G393(Cell 3) were observed to be no longer level. (In April 2000, weir plates were installed tocorrect this problem. The crests of the weir plates are now set at 14.0 ft NGVD in Cell 3and 14.1 ft NGVD in Cell 5). Each of the six outlet weir boxes is connected to gatedculverts that allow water to flow into the discharge canal. Normally, all three gates inCell 5, G354A through C, are open. In Cell 3, only one gate is usually open, i.e., oneoutlet structure is operating. This means that the maximum flow rate under normaloperating conditions in Cell 3 is 140 cfs, 28.0 percent of the total design inflow of 500cfs. Flow in the discharge canal goes to G607, a set of six culverts that connect thedischarge canal to the L4 canal.
All STAs go through an initial start-up phase during which the four-week flow-weighted geometric mean phosphorous concentration at the outlet structure(s) iscompared to the same parameter at the inflow to STA 6. The Florida Department ofEnvironmental Protection permits discharges from STA 6 to begin when the value at theoutlet is less than the value at the inlet indicating a reduction in phosphorousconcentration resulting from treatment within STA 6. STA 6, Section 1, met theseconditions and started normal operation on December 9, 1997.
Two other flow conditions affect the operational plan for STA 6. They areextreme storm conditions and drought conditions. During extreme storm conditions, allof the outlet structures for Cells 3 and 5 will be open and operate at maximum capacity(147 cfs at each of the 6 culverts) based on a stage within the cells of 17.6 ft NGVD.Under drought conditions, minimum water levels in the cells should, to the greatestextent practicable, be maintained at 12.4 ft NGVD. This would maintain static waterlevels above the average ground surface elevation for approximately 50 percent of thetreatment area.
HYDROLOGIC AND HYDRAULIC DATAThe following sections describe the data that were used for the water budget
computations and any special considerations for using the data. The source for the datawas the South Florida Water Management District's corporate database, DBHYDRO.The corresponding database (DB) keys and station names are presented in Appendix A.
RainfallDaily rainfall data for STA 6 is collected at G600_P (the inflow pumping station).
The data, stored in the DB key for G600_R, is compared to rainfall values at seven
nearby rain gage locations to check for data errors. Missing values are filled based uponthe best available information usually from nearby rain gages. The data are loaded into apreferred DB key every month. A final QA/QC check of the data is completed on aquarterly basis. The preferred DB key provides a high-quality, continuous record of dailyrainfall amounts. Table B-i in Appendix B lists the daily rainfall amounts recorded atG600_R.
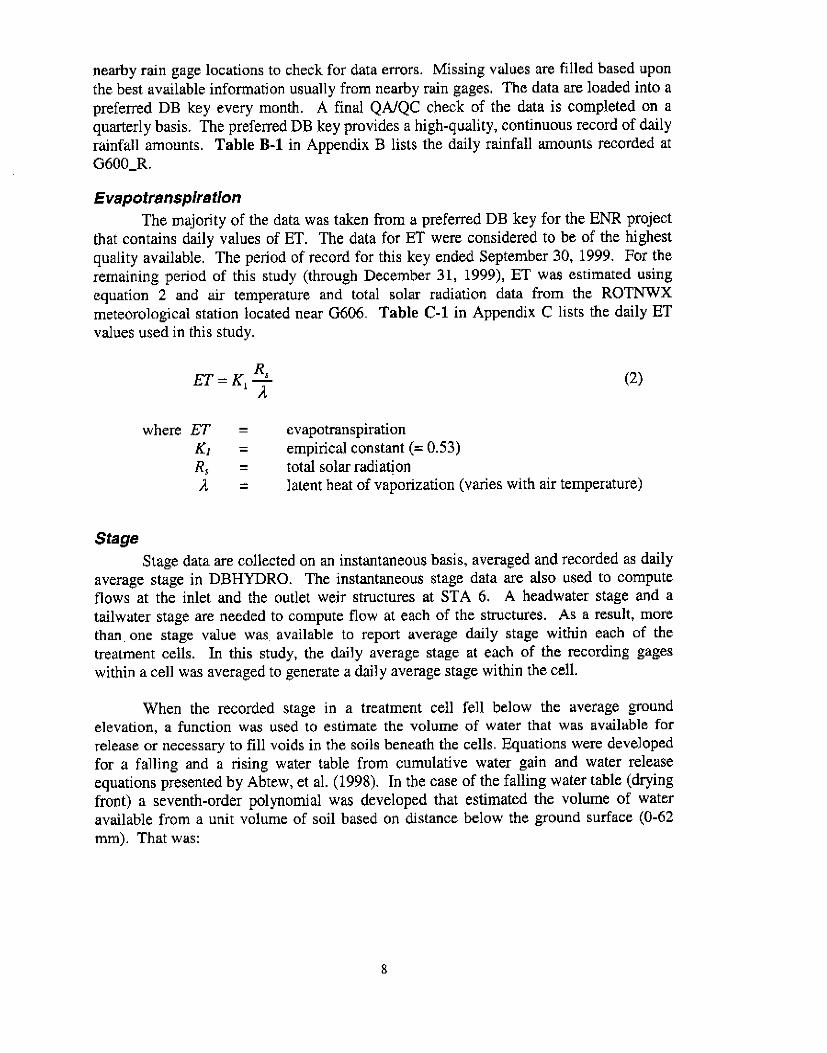
EvapotranspiratlonThe majority of the data was taken from a preferred DB key for the ENR project
that contains daily values of ET. The data for ET were considered to be of the highestquality available. The period of record for this key ended September 30, 1999. For theremaining period of this study (through December 31, 1999), ET was estimated usingequation 2 and air temperature and total solar radiation data from the ROTNWXmeteorological station located near G606. Table C-1 in Appendix C lists the daily ETvalues used in this study.
ET = K, R- (2)
where ET = evapotranspirationKI = empirical constant (= 0.53)Rs = total solar radiationA = latent heat of vaporization (varies with air temperature)
StageStage data are collected on an instantaneous basis, averaged and recorded as daily
average stage in DBHYDRO. The instantaneous stage data are also used to computeflows at the inlet and the outlet weir structures at STA 6. A headwater stage and atailwater stage are needed to compute flow at each of the structures. As a result, morethan. one stage value was available to report average daily stage within each of thetreatment cells. In this study, the daily average stage at each of the recording gageswithin a cell was averaged to generate a daily average stage within the cell.
When the recorded stage in a treatment cell fell below the average groundelevation, a function was used to estimate the volume of water that was available forrelease or necessary to fill voids in the soils beneath the cells. Equations were developedfor a falling and a rising water table from cumulative water gain and water releaseequations presented by Abtew, et al. (1998). In the case of the falling water table (dryingfront) a seventh-order polynomial was developed that estimated the volume of wateravailable from a unit volume of soil based on distance below the ground surface (0-62mm). That was:

V, = 0.949734-0.274805d +0.0359762dZ
- 0.00237059d + 0.000085123 id - 0.00000169054d 5 (3)
+1.74307E - 8d 6 - 7.27834E - 1 d 7
where V, - volume of water available per unit volume of soil (cm 3/cm 3)d = distance from the ground surface to the water table (cm)
Equation 3 had an adjusted coefficient of determination (r2) of 0.981. Figure D-1 inAppendix D shows the function versus the observed values generated from equationsgiven in Abtew, et al (1998).
The expression for the amount of water needed to fill pores that resulted from arising water table (wetting front) was represented by a cubic equation or third-orderpolynomial and is shown in equation 4:
V = 0.591486 - 0.0329963d + 0.000676337d 2 (4)- 0.00000482634d
where V,, and d are described above.
The adjusted r2 value for equation 4 was 0.998. Figure D-2 in Appendix D shows thefunction versus the observed data for equation 4.
Flow
Daily average flow rates were determined using three methods, weir equations,ultrasonic velocity meters and pump performance curves. At G600_P, average dailyflow is computed instantaneously using motor speed, headwater and tailwater elevationdata, The daily average flow at G600_P is recorded in DBHYDRO and reviewed on amonthly basis for accuracy and missing data. A complete record of daily average flow isloaded to a preferred DB key in DBHYDRO monthly. A final QA/QC check of the flowdata in the preferred DB key is done on a quarterly basis.
Daily average flows at G601, G602, G603 (inlet weirs), G354A through C andG393A through C were computed using weir equations for each structure and wererecorded in DBHYDRO. This information was not loaded into preferred DB keys andthus received less scrutiny. Because these flows were based primarily on changes instage data and the fact that stage data records have relatively few missing values, thedaily average flow records at these stations were complete for the period of the study.
Flow at stations G605 and G606 were computed using data from ultrasonicvelocity meters (UVM). UVMs rely on the reflection of ultrasonic waves by movingparticles in the water. They work well under certain conditions. At low flow conditionshowever, they tend to overestimate total flow and, instead, represent local flowphenomena such as thermal and wind-driven circulation. Such was the case in this studyat G605 and G606. Small flows at G605 into the supply canal during drought conditions

were not accurate and thus were not used in the water budget calculations. During thewet season, flow out of the supply canal to G605 was prevented by flap gates and stoplogs at G604. Average daily flow data for both stations are maintained in preferred DBkeys. For low flows at G606, data recorded were compared to outlet weir flow for Cells3 and 5. If there was no outflow from the treatment cells, flow at G606 was recorded aszero in the preferred DB key. Likewise at G605, if stage information indicated that flowwould be out of the supply canal to G605, the flow was set to zero in the preferred DBkey because of the flap gates and stop logs. These changes to the daily average flow datarecorded at G605 and G606 have implications with respect to the water budgetcalculations. The changes made for low flow conditions at these two stations, however,should have improved water budget calculations. Because these occurred at low flowsituations, the impact on the water budget has been minimal.
SeepageNo direct measurement of seepage was made at STA 6 during the period of this
study. A number of attempts to quantify seepage at sites like STA 6 have been made.The most recent, detailed studies of seepage at a site like STA 6 have been associatedwith the ENR project and are discussed here.
Prior to the start-up of the ENR, Smith (1990) used MODFLOW to modelgroundwater flow in Hendry County. STA 6 lies along the southeastern boundary ofHendry County. The model used three layers, the surficial aquifer, the Lower Tamiamiaquifer and the sandstone aquifer. The Tamiami confining zone separates the surficial (orwater table) aquifer from the Lower Tamiami aquifer. Smith found that there was verylittle loss from the surficial aquifer to the Lower Tamiami aquifer through the Tamiamiconfining zone (less than 5.0 percent) and that upflow from the Lower Tamiami wasabout equal to down flow from the surficial aquifer (3.7 versus 7.0 percent). Therefore,the water budget for STA 6 is based upon seepage from and to the surficial aquifer aswell as to surrounding canals and impoundments.
A Brown and Caldwell design team (1996) summarized the results of a number ofstudies of drainage and seepage in the Everglades Agricultural Area (EAA) as part of thepre-design data gathering process for STA 2. They identified two principal zones in theaquifer underlying the EAA. The upper zone had vertical and horizontal permeabilitiesof 40 feet per day (ft/d) and 200 ft/d, respectively. The lower zone was 250.0 percentmore permeable than the upper zone. Rohrer (1999) also used two principal zones in thearea of the EAA to quantify seepage. As the result of pump tests, he found that thetransmissivity of the upper zone was 9.4 ft2/min as opposed to the lower zone that had atransmissivity of 44.9 ft'/min. The Brown and Caldwell team reported seepage losses onthe order of 2 to 3 cubic feet per second per mile of levee per foot of head difference(cfs/mi/ft). They concluded that the "vertical component (of seepage) is significant andprobably responsible for the continual residual loss in the water budget." Levee seepagewas found to be approximately 0.6 cfs/milft. The report also concluded that"significantly higher values, thought to be in the range of 3 to 4 cfs/mi/ft, include bothshallow (levee) and deep-seated seepage flows." The "deep-seated component" ofseepage was considered to be comparatively large when the low permeability cap rock

layer was penetrated or disturbed. Seepage for STA 2 was estimated to be on the order of35.0 percent of the inflow pump volume in Brown and Caldwell (1996).
In a 1997 water budget analysis of the Everglades Nutrient Removal (ENR)project, Abtew and Mullen (1997) lumped seepage that could not be quantified into aremainder term in the water budget equation. The remainders for the daily water budgetwere occasionally in excess of 100.0 percent of the daily inflow or outflow. On anannual basis, the remainders were 3.8 percent of total inflow or outflow for 1996-97.Quantifiable seepage was 26.3 percent of the total inflow or outflow for the same period.
The Detailed Design Report for STA 6 (Burns and McDonnell, 1997) estimatedseepage for Cells 2, 3, 4 and 5 to be between 0.1 to 0.8 cfs/mi/ft using the SEEP2D finiteelement model and hydraulic conductivity ranging from 22 ft/d to 150 ft/d. It advisedusing the higher value for design purposes and pointed out that flexibility should beincorporated into the design and operation of STA 6 due to the variation in lithology thatexisted at the site.
Guardo and Prymas (1998) used the FastSEEP/SEEP2D model to develop anequation for seepage from Water Conservation Area 1 (WCA1) into the ENR project:
Qss = 0.42* [STGWAI J3.06 * [STGN R ]-3.7 (5)
where Qss = seepage into the ENR project from WCA1 (m3/s)STGwcAI = mean daily stage in WCAI (m NGVD)STGENR = mean daily stage in the ENR project (m NGVD)
The coefficient of determination for equation 5 based upon 42 observations was0.962. In a related study, Prymas (1997) found that 23.0 percent of the outflows from theENR could be attributed to seepage. Guardo (1999) subsequently modified equation 5:
SURFSEEP = 0.2158* (STGwacl - 4.57)1 ' 2 * (STGwC, - STGN )Zoz (6)
where SURFSEEP = surficial seepage into the ENR project fromWCAI (m3/s)
STGwcAI and STGENR are described above for equation 5. The coefficient ofdetermination for equation 6 was 0.932. While equations 5 and 6 are the best availableequations for quantifying seepage, they are empirical and applicable only to the ENRproject. Remainders in the water budget for 1998 were 9.1 percent of the inflow oroutflow. Quantifiable seepage was 27.2 percent of the annual inflow or outflow.
Guardo and Rohrer (2000) used data from three test cells at the ENR project andthe FastSEEP/SEEP2D model to quantify seepage gains from an adjacent agriculturalcanal. The three test cells were varied in terms of the bottom of the cells. One cell hadan undisturbed bottom of muck 0.65 ft thick. Another had the muck removed down to acap stone layer. The third had the muck and capstone layer removed. Data presented in

the report showed that seepage into the cells occurred at different rates depending uponthe difference in hydraulic head between the agricultural canal and the cell. The rate ofseepage was also affected by the bottom condition of the cell. Seepage rates variedbetween 2.4 and 5.56 cfs/mi/ft. There was about a 50.0 percent increase in seepage in thecell where the cap rock layer had been removed.
Choi and Harvey (2000) used water and solute mass balances, seepage meters andgroundwater modeling to estimate groundwater recharge in the ENR over a 4-year period(1994-1998). They estimated that net groundwater recharge was between 13 and 14hectare-meters per day (ha-m/d, 53.1 to 57.2 cfs). They found that approximately 31percent of the surface water pumped into the ENR was lost to seepage. A portion of thatflow, 73 percent, was collected by the seepage canal and returned to the ENR. Seepagethat was not captured by the seepage canal occurred when pumped inflow rates to theENR were relatively high. There was also a 2.8 percent gain due to seepage, primarilyfrom Water Conservation Area 1.
Figures 3 through 6 were developed from surface water and groundwater data inthe region surrounding STA 6 to depict subsurface and near surface groundwater flowdomains. Figures 3 and 4 depict groundwater table levels during a wet period (January1, 1998, to April 15, 1998) and Figures 5 and 6 show groundwater table conditionsduring a dry period (April 16, 1998, to June 30, 1998). These two ranges of dates do notrepresent the usual wet and dry periods for this region. They resulted from the effect ofEl Nifio and La Nifia weather patterns during 1998. By examining both sets of figuresthe impact of STA 6 on ground water and groundwater flows can be visualized. Note thecone of depression in the northwest corner of STA 6 especially during the wet period(Figure 4). This is due to the pumping at G600_P that occurs more frequently during thewet season and thus has a more pronounced effect on the surrounding groundwater table.The area of influence of the pump extends back into STA 6 and thus some re-circulationof flow from STA 6 probably occurs as a result of pumping at G600_P. A similar set ofclosely spaced contours is evident at the southern end of STA 6 in Figure 4. The steepgroundwater table gradients at the south end of STA 6 are due to two features of thesystem. In addition to being a point value of higher water surface elevation within STA 6in comparison to the surrounding groundwater table, water in the L3 canal that drainsfrom the C-139 basin ponds at this point behind weirs at structures G88, G89 and G155creating a locally high groundwater table.

I / /'/'
.~ 7
'
/•
//
/•
0.. ,+
Figure 3. Average Groundwater Table Elevations without STA 6 or the USSC Unit 2Pump Station at G600 - January 1, 1998, to April 15, 1998
Figure 4. Average Groundwater Table Elevations with STA 6 January 1, 1998, toApril 15, 1998
13
L,2B
.... .. .1 ,.
W Wn

,,a
An
_0
tOp "~ -~ p
111 _~-.-.
Figure 5. Average Groundwater Table Elevations without STA6 or the USSC Unit 2Pump Station at G600 - April 16, 1998, to June 30, 1998
Figure 6. Average Groundwater Table Elevations with STA6 -April 16, 1998, to June 30, 1998
14

WATER BUDGET
MethodologyFor the purposes of a water budget analysis, STA 6 can be divided into four
hydrologic units: 1) the supply canal; 2) Cell 5; 3) Cell 3; and 4) the discharge canal. Awater budget analysis was performed on each of the units on a daily, annual and biennialbasis using equation 1. Monthly water budgets were developed for Cells 3 and 5. Adaily, monthly, annual and biennial water budget was also completed for the entire STAusing data from all four units. Terms in equation 1 were converted to acre-feet (ac-ft) perunit time (day, month or year depending upon the period being used for the water budgetcalculations). The discussion of the results in the following section of the report focuseson the biennial water budget. The annual summaries are provided to show the range ofvalues in the data used for the biennial water budget.
In the analysis, seepage was computed as:
G=1.983*KK, *L* AH (7)
where C = seepage, levee and deep (ac-ft/d)K,, = coefficient of seepage (cfs/mi/ft)L = length along the seepage boundary (mi)AH = hydraulic head difference between the unit
and the boundary (ft)1.938 = constant to convert from cfs to ac-ft/d
The value of Ksp was optimized using a genetic algorithm (New Light Industries,1995). The optimized coefficient was used in the daily water budget to minimize the netwater budget error in the two-year period of study. The results from Guardo and Rohrer(2000) and Brown and Caldwell (1996) were used to compare value of the optimizedcoefficient. In all cases, the optimized value compared favorably with the range of valuespresented in both studies. An additional parameter, a surface area coefficient, was alsoused initially in the optimization runs to account for variations in vegetation andhydrologic unit geometric properties. It was eventually discarded because the change inwater budget error was relatively insensitive to reasonable changes in this term.
Results
Supply CanalTable 3 presents the biennial (1998-99) and annual water budgets for the supply
canal. The properties of the canal (width, length, and surface area) are listed in T'able A-1 in Appendix A. Table 3 also shows summary information for the daily water budgetanalysis in the section titled Residuals Analysis. A similar table is shown in thecorresponding section for the other hydrologic units at STA 6.

In Table 3, error in the biennial water budget is 6.5 percent. However, thepercentage of days where the daily water budget did not balance within a 0.25 ft (3 in)depth was 94.9 percent. This implies that daily values in the budget were not adequatelyquantified. Budget residuals are shown in Figure 7. Increasing the seepage ratecoefficient improved the daily budget, but not considerably. The seepage coefficient was4.0 cfs/mi/ft, the maximum suggested by Brown and Caldwell (1996) and less than themaximum value found by Guardo and Rohrer (2000). Figure 8 shows the estimatedseepage for the supply canal over the period of the study and Figure 9 displays the waterlevels in the supply canal versus surrounding canals and cells. Considering that thesupply canal covers a little more than 2.0 percent of the surface area of STA 6 (20 ac vs.912 ac) and that flows and stages in the canal are highly dependent upon the operation ofthe pumps at G600P (Figure 10), the variation in the water budget was expected andhad a minor impact on the water budget for the entire STA. In addition, STAoptimization is a long-term process. Thus, short-term budget variance is not a majorconcern for operation and optimization. Seepage constituted 5.0 percent of the biennialwater budget. Approximately 89.0 percent of the flow from the pumps at G600_Pentered the treatment cells at G601, G602 and G603 (-11% loss).
Table 3. Supply Canal Water Budget Summary 1998-99
Supply Canal1998-99 INFLOWS ac-ft Percent OUTFLOWS ac-ft Percent
Inflow Pumps 128287 99.85 Outflow Weirs 113551 85.34Rain 199 0.15 Seepage 6465 6.03
ET 177 0.14Error 8345 6.49
Total 128466 100 Total 128537 100Storage Chg. -51
1998 INFLOWS ac-ft Percent OUTFLOWS sc-ft PercentInflow Pumps 59365 99.85 Outflow Wlars 53257 89.57RaIn 88 0.15 Sepage . 2429 4.08
ET 93 0.16Error 3681 6.19
Total 59453 100 Total 59460 100Storage Chg. -7
1999 INFLOWS ac-ft Percent OUTFLOWS ac-ft PercentInflow Pumps 68922 99.84 Outflow Weirs 50294 B7.29Rain 111 0.15 Seepage 4036 5.84
ET 83 0.12Error 4664 8.75
Total 89033 100 Total 69076 100Storage Chg.. -44
:I :I Resd as ay Js ' I COUNT 1: error 2"error erro ,, ,
SUM. ,, i 5Mt StWDe 5. .517 Paroept 98. 96.. I7 .9"M 4e83 s 1m 5 0572 Combn ed Abrdt~ute Percent Error 12
Seepage Coefflclent - 4 A . Are Coflit - I .,0

Figure 7. Daily Water Budget Residuals for the Supply Canal 1998-99
Figure 8. Supply Canal Estimated Seepage 1998-99
17
"a a a a Fa 5 N a 5 a a a a

17.00
16.00
15.00
14.00
12.00
11.00
10.00
9.00
Figure 9. Supply Canal Stage versus Surrounding Water Bodies 1998-99
Figure 10. Supply Canal Inflow, Outflow and Stage 1998-99
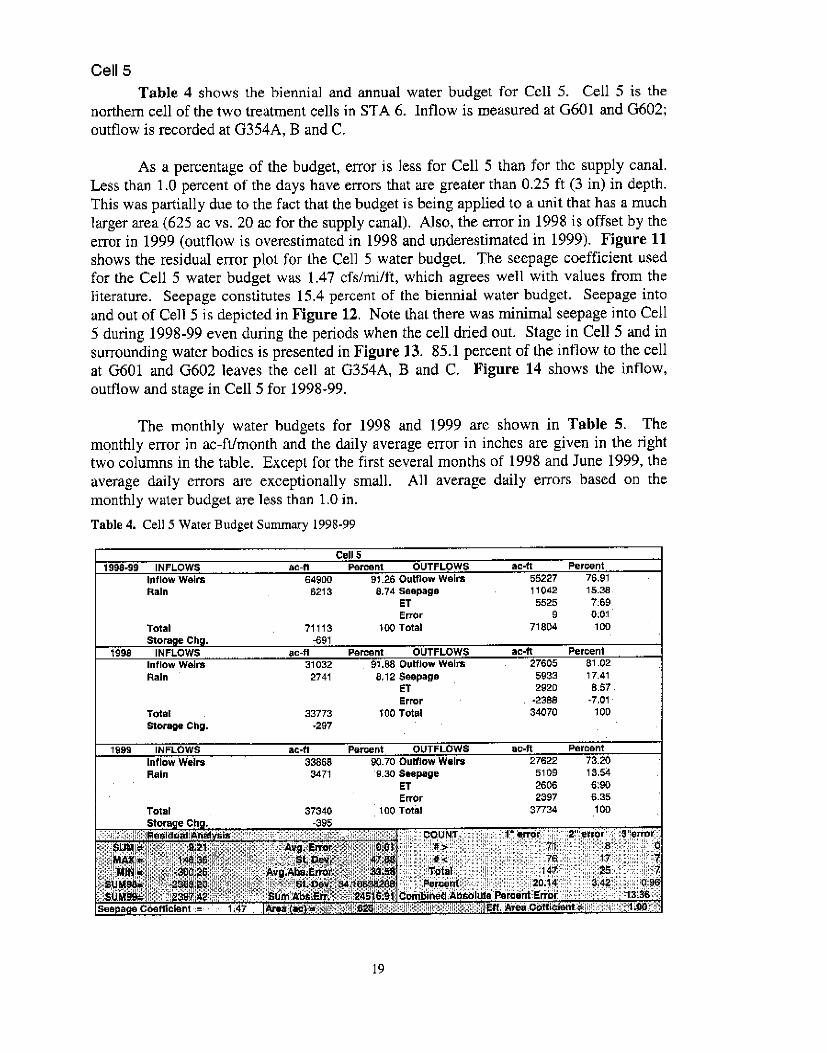
Cell 5Table 4 shows the biennial and annual water budget for Cell 5. Cell 5 is the
northern cell of the two treatment cells in STA 6. Inflow is measured at G601 and G602;outflow is recorded at G354A, B and C.
As a percentage of the budget, error is less for Cell 5 than for the supply canal.Less than 1.0 percent of the days have errors that are greater than 0.25 ft (3 in) in depth.This was partially due to the fact that the budget is being applied to a unit that has a muchlarger area (625 ac vs. 20 ac for the supply canal). Also, the error in 1998 is offset by theeor in 1999 (outflow is overestimated in 1998 and underestimated in 1999). Figure 11shows the residual error plot for the Cell 5 water budget. The seepage coefficient usedfor the Cell 5 water budget was 1.47 cfs/mi/ft, which agrees well with values from theliterature. Seepage constitutes 15.4 percent of the biennial water budget. Seepage intoand out of Cell 5 is depicted in Figure 12. Note that there was minimal seepage into Cell5 during 1998-99 even during the periods when the cell dried out. Stage in Cell 5 and insurrounding water bodies is presented in Figure 13. 85.1 percent of the inflow to the cellat G601 and G602 leaves the cell at G354A, B and C. Figure 14 shows the inflow,outflow and stage in Cell 5 for 1998-99.
The monthly water budgets for 1998 and 1999 are shown in Table 5. Themonthly error in ac-ft/month and the daily average error in inches are given in the righttwo columns in the table. Except for the first several months of 1998 and June 1999, theaverage daily errors are exceptionally small. All average daily errors based on themonthly water budget are less than 1.0 in.
Table 4. Cell 5 Water Budget Sununary 1998-99
Cell 51998-99 INFLOWS ac-ft Percent OUTFLOWS ac-ft Percent
Inflow Weirs 64900 91.26 Outflow Weirs 55227 76.91Rain 6213 8.74 Seepage 11042 15.38.
ET 5525 7:69Error 9 0:01
Total 71113 100 Total 71804 100Storage eCh. -691
1998 INFLOWS acf4t Percent. OUTFLOWS ac-ft PercentInflow Weirs 31032 91.88 Outflow Wes . 27605 81.02Rain 2741 8.12 Seepage 5933 17.41
ET 2920 8.57Error -2388 -7.01
Total 33773 100 Total 34070 100Storage Chg. -297
1999 INFLOWS ac-fl Percent OUTFLOWS ac-ft PercentInflow Weirs 33868 90.70 Outflow Weirs 27622 73.20Rain 3471 9.30 Seepage 5109 13.54
ET 2606 6790Error 2397 6.35
Total 37340 100 Total 37734 100
Storage Chg. -395
4 '. eeldual A s ) COUNT 1 error 2 error erm:
U 3972 Sm AE 2416. ombned Abo PercentErro 1336 S age Coefficlent - 1.47 Are(aac2Vo 2 E.AreaCffet 1

Figure 11. Daily Water Budget Residuals for Cell 5 1998-99
Figure 12. Cell 5 Estimated Seepage 1998-99
$ $$ $$ &$ $2 $$ $ $$ $ , $ $ $

11.
o0.00
Figure 13. Stage in Cell 5 Stage and Surrounding Water Bodies 1998-99
Figure 14. Cell 5 Inflow, Outflow and Stage 1998-99
~ 5Eg g~ggr~ $g

Table 5. Cell 5 Monthly Water Budget 1998-99
JAN 3671.49 451217 -102.19 56.77 153.03 -59625 -1431.00 -0.89
DEC 1694.20 154.22 46.88
-1230.75-1529.29474.28-237.16-408.22248.83380.80115.54662.19161.55
159.61 -444.59 405.23 0.25
JAN 1859.05 930.90 -3.44 97.92 155.20 -515.63 3586.7 0.22
Cell 3Table 6 shows the biennial and annual water budgets for Cell 3 for 1998 and
1999. Cell 3 is south of Cell 5. It is the smaller of the treatment cells at STA 6 covering245 ac. Inflow is measured at G603; outflow is recorded at weir boxes G393A, B andC. Table 7 contains the monthly water budget for Cell 3. Missing data for flow at G603in DBHYDRO were supplied by running the FLOWCALC program using archived stagedata.
Error in the biennial water budget was 2.8 percent. Of the total number of days inthe biennial study, 1.1 percent had a daily water budget residual that represented morethan a 0.25 ft (3.0 in) error. The seepage coefficient used for the water budget for Cell 3was 3.79, which is within the values found in the literature, Using this value, however,resulted in seepage rates that represented 19.6 percent of the water budget for 1998 and1999. Although this percentage appears high, there is a significant groundwater gradientat the southern end of Cell 3 that may contribute to the increase in seepage losses(Figures 4 and 6). Outflow through weir boxes G393A through C was 77.0 percent ofthe inflow to Cell 3 measured at G603.
The average daily error in the monthly water budget analysis shown in Table 7 isless than 1.0 inch for all months except October 1999. The monthly volumes in the

budget for October 1999 in Cell 5 were also much larger than the average. HurricaneIrene affected flows and stage at STA 6 in October 1999.
Figure 15 presents the residuals in the Cell 3 water budget for 1998-99. Figure16 shows the estimated seepage into and out of Cell 3 and Figure 17 shows the stage inCell 3 versus that in the supply and discharge canals and Cell 5. The variation in Cell 3inflow, outflow and stage is depicted in Figure 18. Cell 3 displayed the least amount ofvariation in the water budget residuals because it is the smaller of the two treatment cellsand receives less flow. Proportionally, the water budget residuals for Cell 5 were on thesame order as those for Cell 3.
Table 6. Cell 3 Water Budget Summary 1998-99
Cell 31998-99 INFLOWS ac-ft Percent OUTFLOWS ac-ft Percent
Inflow Weirs. 48650 95.23 Outflow Weira 37479 73.34Rain 2435 4.77 Seepage 10038 19.64
ET 2166 4.24Error 1418 2.78
Total 51086 100.00 Total 51101 100.00Storage Chg, -15
1998 INFLOWS ac-ft Percent OUTFLOWS ac-ft PercentInflow Weirs 22225 95.39 Outflow Weirs 15745 67.54Rain 1075 4.61 Seepage 5014 21.51
ET 1145 4.91Error 1410 6.05
Total 23300 100.00 Total 23314 100.00Storage Chg. -14
1999 INFLOWS ac-ft Percent OUTFLOWS ac-ft Percent
Inflow Weirs 26425 95.10 Outflow Weirs 21734 78.21Rain 1361 4.90 Seepage 5024 18.08
ET 1021 3.68Error 8 0.03
Total 27786 100.00 Total 27787 100.00Storage Ch g. -1Re.Idu I An al#y , CqUNIT " rror 2 error 3error
SM , 1 4 Avg E 1. 7 .. > , 140 37 ,M X 9 9 39 1 D .I < l 14 1 {6
MI N G 1 85 A g b .1 7 0 Ttkal 24 5 8 ' ..
SUM.. 9 34f04 Sum A.Err . 1,28 4 C mblne ,Abote Pere Eor .0.8.seepage Coefficient =.. 3.79 Are .(: ac ",5: 2 E A Iioftlplettti 1cffcient , 4, 1.0'i0 ;I

Table 7. Cell 3 Monthly Water Budget 1998-99
JAN 2355.51 1439.38 -44.10 22,25 59.99 -778.91 143.58 0.23FEB 2179.72 1468.08 -46.92 94.73 59.71 -608.12 185.46 0.32MAR 2804.71 1958.53 -23.03 103.31 80.03 -585.79 106.68 0.17APR 315.84 95.85 -128.14 13.88 103.80 -339.19 -80.985 0.13MAY 0.00 0.00 -239.36 21.44 136.80 -87.55 38.45 0.06JUN 57.82 0.00 71.39 38.59 139.40 102.85 -11.54 -0.02JUL 2010.97 1106.72 368.63 174.15 125.97 -474.20 109.60 0.17AUG 4109.23 3216.99 33.81 198.45 126.95 -569.63 360.30 0.57SEP 2632.04 1848.21 122.26 140.67 85.82 -655.01 61.41 0.10OCT 715.30 589.83 -210.46 68.40 91.79 -320.63 -8.10 -0,01NOV 3992.42 3414.04 49.00 180.28 71.71 -381.28 276.68 0.45DEC 1251.67 607.25 33.01 18.38 62.57 -336.37 230.84 0.36
JAN 1386.95 750.88 -17.27 38.38 60.84 -520.10 110.80 0.18FEB 860,64 436.25 -5225 18.58 63.07 -382.01 4,812 0.08MAR 0.00 0.17 -348.08 5.31 93.33 -446.33 -188.44 -0.30APR 0.00 0.00 33.16 16.33 103.83 88.78 -31.68 -0.05MAY 198.19 0.00 156.59 223.56 110.39 69.47 224.25 0.35JUN 5182.82 3836.37 499.62 304.41 84.29 -614.06 452.90 0.74JUL 3093.93 2425.67 -162.56 97.80 109.40 -541.48 277.73 0.44AUG 2592.02 1815.20 61.86 193.14 96,49 -789.02 22.60 0.04SEP 4149.98 3467.27 213.76 207.03 84.71 -517.61 73.65 0.12OCT 5371.08 6237.77 -139.71 225.81 77.86 -376,.42 -955.45 -1.51NOV 2941.90 2238.88 -131.57 23.07 76.34 -453.58 327.74 0.54DEC 647.64 523.34 -116.93 7.35 61.03 -541.73 -354.18 -0.56
Figure 15. Daily Water Budget Residuals for Cell 3 1998-99
MS a a ro a a
e~MR MQ MR

- r r -a rr a- N+~ '# * Z,- .E o)~
Figure 16. Cell 3 Estimated Seepage 1998-99
Figure 17. Stage in Cell 3 and Surrounding Water Bodies 1998-99
I

200.00
150.00
100.00
50.00
18.00
14.00
12.00
10.00
.00 =
8.00
4.00
2.00
0.00
Figure 18. Cell 3 Inflow, Outflow and Stage 1998-99
Discharge Canal
The summary table of the biennial and annual water budgets for the dischargecanal is shown in Table 8. Implementing a water budget for the discharge canal was
difficult. The outflow recorded at G606 in 1999 was greater than the inflow to thedischarge canal that year. This may be due to flows that enter the discharge canal fromthe L-4 canal through the culverts at G607. Never the less, the discharge canal gainedwater through seepage. The seepage coefficient used for the discharge canal waterbudget was 0.59 efs/mi/ft. Increasing it beyond this value reduced the water budget error
in 1.999 but increased the error in the budget for 1998. This value for the seepagecoefficient resulted in the lowest combined error for both years. Seepage was 4.6 percentof the biennial water budget. As was the case for the supply canal, the majority of thedaily water budgets, 75.9 percent, had an error that represented more than 0.25ft (3.0 in).The surface area of the discharge canal represents less than 3.0 percent of the totaleffective area of STA 6, so the errors in the water budget, although large, are not
significant with respect to the overall budget for STA 6.
Figure 19 shows the daily water budget residual for the discharge canal for 1998-99. Figure 20 depicts the estimated seepage for the discharge canal, which is primarilyinto the canal. The stage in the discharge canal versus those in Cells 3 and 5 and theRotenberger Wildlife Management Area is shown in Figure 21. Figure 22 showsrecorded stage, inflow and outflow for the discharge canal for 1998-99.

Discharge Canal1998-99 INFLOWS ac-ft Percent OUTFLOWS ac-ft Percent
Inflow Weirs 92706 96,14 Outflow UVM 97250 99.81Rain 219 0,22 ET 194 0.20
Seepage 4520 464 Error '9 -0.01
Total 97446 100 Total 97436 100
Storage Chg. 9
1998 INFLOWS ac-ft Percent OUTFLOWS a-ft PercentInflow Weirs 43350 96,18 Outflow UVM 36503 80.15Rain 96 0.21 ET 103 0.23Seepage 2099 461 Error 8940 19.63
Total 45545 100 Total 45545 100
Storage Chg. 0
1999 INFLOWS ac-ft Percent OUTFLOWS efft PercentInflow Weirs 49366 95.10 Outflow UVM 60748 117.07Rain 122 0.24 ET 92 0.18
Seepage 2421 4.66 Error -8948 -17.24
Total 51899 100 Total 51891 100Storage Chg. 8
le 8. Discharge Canal Water Budgetrr Summary 1998-99rr
IiSUM9. *4. S aer "8 Comb61ned Absolute Paroant Erro " 7367Sea a eCoetflcient * 0.69 . Aa.c - 22 f Are Qrfflei tw - 1t
Table 8. Discharge Canal Water Budget Summary 1998-99
200
150
100
to
1 5I
-150
.200
-250
Figure 19. Daily Water Budget Residuals for the Discharge Canal 1998-99

Figure 20. Discharge Canal Estimated Seepage 1998-99
Figure 21. Stage in the Discharge Canal and Surrounding Water Bodies 1998-99
16.00
_ a r a a a _ a _ a "n a a W a _

600.00
500.00
400.00
300.00
200.00
100.00
0.00
14,00
12.00
10,00
8.00 0
6.00
4.00
2.00
0.00
Sr.. " "IM
Figure 22. Discharge Canal Inflow, Outflow and Stage 1998-99
STA 6Table 9 contains the summary of the biennial and annual water budgets for the
entire STA, which includes all four hydrologic units, discussed above. The water budgetfor the entire STA was affected by the apparent problems with outflow measurement forSTA 6 at the discharge canal. Seepage was estimated by using stages in Cell 5 along thenorthern boundary of STA 6, in the supply canal along the western boundary with the L3canal and the discharge canal along the eastern boundary with the Rotenberger WildlifeManagement Area. Using a seepage coefficient of 7.0 cfs/mi/ft, errors for the two yearswere 6.0 percent of the budget. The value of the seepage coefficient is greater thanreported in the literature but it resulted in lower error in the biennial budget. Seepage was17.7 percent of the water budget. Increasing the seepage coefficient reduced the waterbudget error but increased the percentage of the water budget attributed to seepage in1998 to nearly 30.0 percent. This was considered to be unreasonably large. Slightly morethan 6.0 percent of the days during the two-year period had errors that were greater than0.25 ft (3.0 in).
Table 10 shows the monthly water budget summary. Most of the daily averageerrors are less than 1.0 in. except in June 1998 and six months in 1999. June 1999 was thebeginning of a wetter than normal wet season after a drier than normal spring (the signsof the average daily errors reflect these trends). October 1999 was the month in whichHurricane Irene produced unusually large rainfall amounts over southeastern Florida.

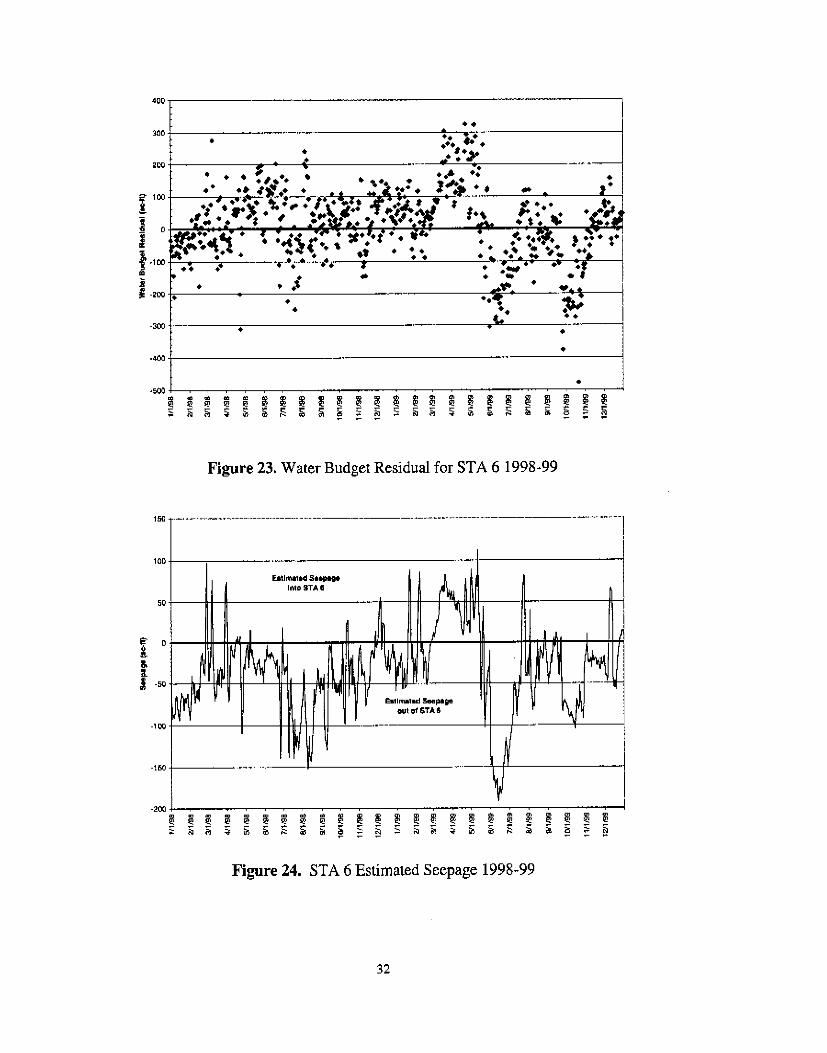
Figure 23 shows the residual in the daily water budgets. The peaks in the residualplot occur during periods of high inflow, showing that the daily water budget under theseconditions does not accurately quantify all of the hydrologic processes occurring in STA6. Figure 24 presents the estimated seepage into and out of STA 6. It shows that there isa net loss of water seeping from STA 6 into the surrounding area. This is consistent withgroundwater gradients depicted in Figure 25, 26 and 27 and Figures 3 to 6. Sinceinflow, outflow and seepage constitute such large portions of the water budget, theirvalues over time are shown in Figures 28 and 29.
Figure 30 shows the inflow and outflow volumes for STA 6 as a singlehydrologic unit based upon the results of the water budget for 1998-99. The value withinSTA 6 represents the change in storage from 1998 to 1999. More detailed information
about how each of the four hydrologic units, the supply canal, treatment cell 3, treatmentcell 5 and the discharge canal, fit into the overall STA biennial water budget is shown in
Figure 31. It depicts the inflow and outflow volumes in ac-ft for each of the fourhydrologic units that make up STA 6. Percentages in parentheses indicate the relationshipbetween flow upstream and flow at that point in the diagram. For instance, the outflowfrom the discharge canal was 75.8 percent of the inflow to the supply canal. Also, the64,901 ac-ft of water entering Cell 5 was 57.2 percent of the flow leaving the supplycanal (113,551 ac-ft). Inflow to the discharge canal from Cells 3 and 5 was 75.9 percentof the surface flow into the cells (113,551ac-ft plus 8,648 ac-ft from rainfall). The values
within each hydrologic unit indicate the change in storage in ac-ft from 1998 to 1999.
Mean Hydraulic Retention Time
Hydraulic retention time is a measure of how long water remains in each cell. Itestimates the period of time that water will be treated in a cell. Over this period,physical, chemical and biological processes remove particulate and soluble phosphorousand other contaminants. The mean hydraulic retention time (also referred to as mean cell
residence time) was determined using equation 8:
t = V (8)Q
where t = mean hydraulic retention time (d)V = cell volume (ac-ft)Q = flow rate (ac-ft/d)

Table 9. STA 6 Water Budget SummarySTA 6
1998-99 INFLOWS sc-it Percent OUTFLOWS ae-ft Percentinflow Pumps 12B287 93.40 Outflow UVM 97250 70.46Rain 9065 6.60 Seepage 24440 17.71
ET 6063 5.84Error 8265 6.99
Total 137353 100.00 Total 138017 100.00Storage Chg. -665
1998 INFLOWS ac-ft Percent OUTFLOWS sc-it PercentInflow Pumps 59365 93.69 Outflow UVM 36503 57.33Rain 4000 6.31 Seepage 15550 24.42
ET 4261 6.69Error 7356 11.55
Total 63365 100.00 Total 63669 100.00Storage Chg- -304
1999 INFLOWS ac-ft Percent OUTFLOWS ac-ft PercentInflow Pumps 68922 93.16 Outflow UVM 60748 81.71Rain 5065 6.85 Seepage 8890 11.96
ET 3802 5.11Error 909 1.22
Total 73987 100.00 Total 74348 10000Storage Chg. -361
. ealWJasAnalyss COUNT 1" aro 2I erro 3"error '
Table 10. STA 6 Monthly Water Budget 1998-99
M - 46 A E t To 31 1eeIa 7 44
JAN 456000 3944.94 -145.58 82.84 223.30 2366.23 -1746.07 -0.74
FEB 4603.62 4257.42 -184.64 352.64 222.26 1009.87 -348.65 -0.16
APR 1376.33 527.23 -874.12 51.68 386.40 -804.78 583.72 0.26MAY 3298.85 0.00 -470.21 79.80 509.23 -867.96 2671.67 1.13JUN 3629.12 0.00 126.52 143.64 518.92 -875.62 2251.68 0 99JUL 5330.22 3017.40 1139.84 648.28 48.93 -2636.39 -1284.05 -0.55AU 10965.60 69986.20 150.33 7384.5672 472.58 -2612.63 1470.11 0.62
SEP 5783.35 3666.09 510.17 523.64 319.47 -1644.57 166.69 0.07OCT 1870.89 487.20 -1081.25 254.60 341.67 -1267.69 1110.18 0.47NOV 9504.26 8290.49 428.62 671.08 265.93 -850.08 339.22 0.15DEC 2473.49 46.91 177.98 68.40 232.91 -197.49 1886.60 0.80
JAN 2784.02 495.11 -22.35 142.88 226.47 -556.29 1671.38 0.71
FEB 1665.52 1033.11 -327.97 69.16 234.79 -154.86 639.88 0.30MAR 2396.25 0.00 -1057.91 19.76 347.42 1534.10 4660.61 1.98APR 4227.73 0.00 48.19 60.80 385.74 1152.86 5007.45 2.20MAY 2451.43 0.00 587.93 832.20 410.91 238.24 2523.03 1.07JUN 11501.38 11457.06 1506.48 1133.16 313.75 -4690.58 -5333.34 -2.34JUL 6676.50 6970.97 -550.55 354.04 407.23 -1283.95 -1171.06 -0.50AUG 5430.49 5164.54 267.40 718.96 359.17 -896.02 -537.69 -0.23SEP 9190.61 10411.99 576.02 770.64 315.34 -967.40 -2309.50 -1.01
OCT 14734.43 18847.22 -324.72 840.58 289.83 -2385.45 -5622.78 -2.39
NOV 5822.26 5231.96 -385.12 85.88 284.16 -644.68 132.46 0.06DEC 2141.26 1135.54 -678.29 27.36 227.19 -235.61 1248.57 0.53
n""~$~~ { V n r A a v
Figure 23. Water Budget Residual for STA 6 1998-99
Figure 24. STA 6 Estimated Seepage 1998-99
z aa s Ss m n m ' = AA a a a a a

Figure 25. Stage along the Northern Boundary of STA 6 1998-99
Figure 26. Stage along the Western Boundary of STA 6 1998-99

15.00
Figure 27. Stage along the Eastern Boundary of STA 6 1998-99
Figure 28. Inflow, Outflow and Seepage for STA 6 1998

Figure 29. Inflow, Outflow and Seepage for STA 6 1999
Infit
Note: All values In acre-feet (sc-ft) except as shown(Drawing not to scale)
mgndary
Outflow at G06
97,250(75.8%of STA Inflow)
Figure 30,. STA 6 Water Budget Inflow and Outflow Volumes 1998-99

Note: All values in acm-eel (ac-lt) except as shown (75.7%of STA 6B Inflow)(Drawing not to scale)
Figure 31. STA 6 Water Budget Volumes 1998-99
Table 11 shows the mean hydraulic retention time in days for Cells 3 and 5. Thetwo-year mean was based upon the average stage during the biennial period (calendaryears 1998 and 1999) and the average volume of inflow and outflow including rainfall,evapotranspiration and seepage.
Table 11. Mean Hydraulic Retention Time
Cell 3 1.20 4.20Cell 5 1.25 8.79
These retention times are significantly less than those reported for the ENR (17days in 1994-96, 24.5 days in 1996-97 and 25.4 days in 1997-98). In April 2000, theoutlet weir box crest elevations at STA 6 and were increased to 14.1 ft NGVD in Cell 5(stations G354A, B and C) and 14.0 ft NGVD in Cell 3 (stations G393A, B and C). Thisshould increase the mean hydraulic retention time for each of the cells by several days.
Seepage
BudgetResidual
I

SUMMARY AND DISCUSSION
Over the two-year period, calendar years 1998 and 1999, STA 6 received 128,287ac-ft of water from pumping operations at G600_P. An additional 9,065 ac-ft was inputto STA 6 via rainfall; 8,063 ac-ft was lost through evapotranspiration. Seepage was 17.7percent of the water budget during this period, losing 24,440 ac-ft to surrounding waterbodies and the surficial aquifer. Outflow from STA 6 at G606 was 75.8 percent of theflow entering STA 6 at G600_P or 97,250 ac-ft. This volume entered the L4 canal viathe G607 culverts, The amount of water stored in STA 6 was reduced by 665 ac-ft in twoyears. The error in the water budget was 8,265 ac-ft or 6.0 percent of the budget. Cell 3retained water an average of 4.2 days in 1998 and 1999. The average retention time inCell 5 was 8.79 days. STA 6 was a net loser to ground water with significant gradientsduring the wet season at the southern tip of Cell 3 in STA 6 and the northwestern cornerof Cell 5 where the G600_P pumps are located (Figures 4 and 6).
There were a number of problems associated with calculating the water budget forSTA 6 similar to those encountered for the ENR. The largest source of error may be thevalues computed for seepage. The seepage and budget residual combined constitute 23.7percent of the water budget. It should be noted that the seepage coefficients used in thisstudy were calibrated based on minimizing net water budget error. Their values may alsoreflect other errors. When examining the estimated seepage by year for 1998 and 1999, itappears that seepage was higher during 1998, the drier of the two years. A similar resultoccurred when analyzing water budget data for the first half of 2000 which was dry incomparison to average.
In addition, there appeared to be an inconsistency between the 1998 and 1999values of inflow to and outflow from the discharge canal. The end of an El Niflo eventand the start of a La Nifa pattern affected weather in 1998. The latter caused a dry wetseason in 1998. The wet season in 1999 had nearly 15 in. more rain than average (50.36in. versus 35.41 in.). Unfortunately, a review of data from the first half of 2000 did notresolve the discrepancy. In the future, flow measurements from STA 6 should beimproved since outflow monitoring is being moved to the outlet weirs from G606. Oncecalibrated, the outlet weirs should provide more accurate flow information especially forextreme flows.
The water budget residuals for STA 6 shown in Figures 7, 19 and 23 (residualsfor the supply canal, the discharge canal and STA 6 as a whole) are not random,especially for 1999. The residuals increase when flow increases. Figure 32 shows theresiduals for STA 6 plotted with inflow data and seepage data. The largest residuals areobserved in 1999 during two consecutive, extended periods of significantly higherinflow. Although seepage also increases during these periods (in response to increasedstages in STA 6), the volume of outflow from STA 6 plus the increased seepage and theincrease in storage do not equal the volume of water entering STA 6 on a daily basis.Flow measurement error may account for this, but this may also indicate that there is aresponse to large pulse inflows that is not adequately represented by the traditionalequations for levee seepage used in this and other studies.

Iloo
900
800
700
600
2' 500
400
200
m 100
-100
-200
-300
-400
Figure 32. STA 6 Inflow, Seepage and Water Budget Residuals 1998-99
Other possible sources of error in the budget include use of ET values from theENR located approximately 35 miles to the northeast of STA 6 and using a groundelevation of 12.4 ft NGVD for the bottom of the treatment cells. Both of these shouldhave had a minor impact on the biennial water budget.
RECOMMENDATIONSAdditional study of the geology and the seepage characteristics of the area is
warranted at STA 6. Overall seepage constituted the largest single quantifiable unknownat the site. Although the percentage of the water budget attributed to seepage fell withinliterature values, it is greater than values found in reports for the ENR. The quantity ofwater lost through seepage has implications for STA design and water qualitymanagement in the basin. A previous study (SFWMD, 2000) found that roughly 50.0percent of the total phosphorous load was dissolved phosphorous in the NorthernEverglades. If 17.7 percent of the water entering STA 6 leaves via seepage, 50.0 percentof the phosphorous load is dissolved and the cell is 76.0 percent efficient (based onmonthly flow-weighted mean concentrations reported for STA 6, Section 1 January 1998to February 1999, SFWMD 2000), then 11.6 percent of the removal efficiency of thetreatment cell can be attributed directly to dissolved phosphorous removed in seepagewater. Seepage also enhances the removal of particulate phosphorous through filtration.Soluble phosphorous in the form of orthophosphate may also be removed by precipitationas it comes in contact with limestone and reacts with calcium and hydroxyl ions
_^^^
Soo ~

(Hammer, 1986). Further investigation of this aspect of treatment cell dynamics isneeded.
A dye study test should be conducted in order to assess flow short-circuiting inCells 3 and 5. This is important since the retention time of the cells is significantly lowerthan that reported for the ENR and short-circuiting is likely to have a more pronouncedimpact on the removal efficiency of the treatment cells.
Observation wells with stage recorders located outside the boundary of STA 6would have aided the analysis of seepage for this study especially along the northern andeastern boundaries. The ability to calculate seepage into and out of an STA should be adesign criterion. Location and installation of observation wells for this purpose should bea design/construction requirement for all STAs.
Consideration should be given to relocating flow measurement at G605 using aultrasonic velocity meter (UVM) to G604 using a culvert flow equation based onheadwater and tailwater elevations. Usually flow only occurs at G604 during dry periodswhen demand for irrigation water for USSC's Unit 2 fields. The flows are very small and
fall within the "noise" level for UVMs. Often the UVM readings at G605 during theseperiods account for local thermal and wind-driven circulation as opposed to flow throughthe culverts at G604. During wet periods, water is prevented from flowing southward atG604 by flap gates and stop-logs.
CONCLUSIONSThere were two unexpected outcomes of the water budget analysis. The first was
that seepage was a large percentage of the water budget. The biennial and annual waterbudgets for the Everglades Nutrient Removal (ENR) project did not estimate unknownseepage quantities but included them in the water budget remainder term. If the samewere done for STA 6, the aggregated remainders would constitute 23.7 percent of thebiennial water budget. This compares with annual water budget remainders of 3.8 to 9.1percent for the ENR project. The second was that mean hydraulic retention times weresignificantly less than those computed for the ENR project which ranged from 17.0 to25.4 days. Cell 3 in STA 6 had a mean hydraulic retention time of 4.2 days and Cell 5had a mean hydraulic retention time of 8.8 days.
The water budget for STA 6, Section 1, will improve with additional years of data
and improved information about seepage at the site. This should aid in the design offuture STAs for the Everglades Agricultural Area as well as STAs in other parts of theDistrict's jurisdiction such as the Kissimmee River basin and the Lower West Coast.

REFERENCES
Abtew, W., D. L. Anderson, L. J. Lindstrom and A. Cadogan. 1998. Soil Moisture andShallow Water Table Monitoring for Irrigation and Drainage Decision-making. Drainagein the 21' Century: Food Production and the Environment, Proceedings of the 7tm AnnualDrainage Symposium. Orlando, FL March 9-10, 1998. ASAE. St. Joseph, MI.
Abtew, W. and D. Downey. 1998. Water Budget Analysis for the Everglades NutrientRemoval Project (August 20,1997, to August 19, 1998). Technical Memorandum WRE#368. South Florida Water Management District. West Palm Beach, FL. November,1998.
Abtew W. and R. S. Huebner. 2000. Hydrologic Impact of Hurricane Irene on SouthFlorida (October 13 through 17, 1999). Technical Publication EMA #386. South FloridaWater Management District. West Palm Beach, FL. May, 2000.
Abtew, W. and V. Mullen. 1997. Water Budget Analysis for the Everglades NutrientRemoval Project (August 20,1996, to August 19, 1997). Technical Memorandum WRE#354. South Florida Water Management District. West Palm Beach, FL. November,1997.
Brown and Caldwell Design Team. 1996. Everglades Protection Project, Contract C-E201, Phase 1, STA 2 Treatment Works and WCA-2A Hydropattem Restoration.Amendment No. 1, Task 2-5: Seepage and Groundwater Interaction. TechnicalMemorandum. April 29, 1996.
Burns and McDonnell. 1997. Everglades Construction Project Detailed Design ReportStormwater Treatment Area No. 6 (STA-6). Kansas City, MO. March 1997.
Choi, Jungyill and Judson W. Harvey. 2000. Quantifying Time-varying Ground-waterDischarge and Recharge in Wetlands of the Northern Florida Everglades. Wetlands. V.20, no. 3. September 2000, pp. 500-511. The Society of Wetland Scientists.
GEONEX. 1999. Stormwater Treatment Area 6 Aerial Photointerpretation SummaryReport August 24, 1998. Prepared for the South Florida Water Management District,West Palm Beach, FL. January 19, 1999.
Guardo, M. 1999. Hydrologic Balance for a Subtropical Treatment Wetland Constructedfor Nutrient Removal. Ecological Engineering. v. 12. Elsevier Science B.V.
Guardo, M. and A. A. Prymas. 1998. Calibration of Steady-state Seepage Simulations toEstimate Subsurface Seepage into an Artificial Wetland. Proceedings of the Conferenceon Engineering Approaches to Ecosystem Restoration. American Society of CivilEngineers. Denver, CO. March 22-27, 1998.

Guardo, M. and K. P. Rohrer. 2000. Calibration of a Steady-state Seepage Model from aTransient Recovery of Field Data. Journal of the American Water ResourcesAssociation. v. 36, no. 1. pp.8 7 -9 4 .
Hammer, M. J. 1986. Water and Wastewater Technology. Second edition. Prentice-Hall, Inc. Englewood Cliffs, NJ.
Huebner, R. S. 2000. Hydrologic Impacts of the 1997-98 El Nifo and La Nifia on Centraland South Florida. Technical Publication EMA #384. South Florida Water ManagementDistrict. West Palm Beach, FL. March, 2000.
New Light Industries, Ltd. 1995. Generator vl.0. (Genetic Algorithm Software for
Multi-variate, Non-linear Optimization). Spokane, WA.
Prymas, A. A. 1997. Calibration of Seepage from Steady-state Simulation for Water
Budget Estimation. Thesis for the Degree of Master of Science in Civil Engineering.Florida Atlantic University. Boca Raton, FL.
Rohrer, K. P. 1999. Hydrogeologic Characterization and Estimation of Ground WaterSeepage in the Everglades Nutrient Removal Project. Technical Publication WRE #372.
South Florida Water Management District. West Palm Beach, FL. February, 1999.
SFWMD. 1996. Water Budget Analysis for the Everglades Nutrient Removal Project(August 19, 1994, to August 19, 1996). Technical Memorandum WRE #347. SouthFlorida Water Management District. West Palm Beach, FL. November, 1996.
SFWMD. 1997. Operation Plan Stormwater Treatment Area No.6, Section 1 (STA-6Section 1). South Florida Water Management District. West Palm Beach, FL. July,1997.
SFWMD. 2000. Everglades Consolidated Report. G. Redfield, ed. South Florida WaterManagement District. West Palm Beach, FL. January, 2000.
Smith, K. R. 1990. A Three-dimensional Finite Difference Ground Water Model of
Hendry County. Technical Publication 90-04. South Florida Water Management District.West Palm Beach, FL. October, 1990.

APPENDICES

Appendix A. Site Properties and Monitoring Stations
Table A - 1. STA 6 Site Properties
Surface AreaSupply Canal -20 acDischarge Canal -22 ac
Cell 5 625 ac
Cell 3 245 ac
Cell 5 Ground Elevation -12.4 ft
Cell 3 Ground Elevation -12.4 ft
Levee LengthAlong Northern Boundary 7785 ft
Supply CanalTotal 11548 ft
Along Cell 5 4412 ft
Along Cell 3 7136 ft
Discharge CanalTotal 10596 ft
Along Cell 5 6012 ft
Along Cell 3 4584 ft
Between Cells 3 and 5 4195 ft
Canal Width
Supply Canal 75 ft
Discharge Canal 90 ft

Table A -2. Stage Monitoring Stations
G6559 G352S_1 STA 6 SECTION 1 (ON SUPPLY CANAL ACROSS FROM CELL 5) HENDRY
G6560 G352S_T STA 6 SECTION 1 (IN CELL 5 ACROSS FROM SUPPLY CANAL) HENDRY
G6563 G354C_H STA 6 SECTION 1 IN CELL 5 NEAR OUTFLOW C HENDRY
G6564 G354C_T STA 6 SECTION I IN DISCHARGE CANAL NEAR OUTFLOW C HENDRY
G6561 0392S H STA 6 SECTION 1 (ON SUPPLY CANAL ACROSS FROM CELL 3) HENDRY
06562 G392S_T STA 6 SECTION 1 (IN CELL3 ACROSS FROM SUPPLY CANAL) HENDRY
G6565 G393BJH STA 6 SECTION 1 IN CELL 3 AT OUTFLOW B HENDRY
G6566 G393B T STA 6 SECTION 1 IN DISCHARGE CANAL AT OUTFLOW B HENDRY
06528 G600H STA 6 SECTION 1, INFLOW PUMP STATION, HEADWATER HENDRY
06529 0600_T STA 6 SECTION 1, INFLOW PUMP STATION, TAILWATER HENDRY
GA117 G604H STA 6 SECTION I GRAVITY STRUCTURE HENDRY
GA118 G605 STA 6 SECTION 1 BYPASS CANAL HENDRY
GA115 G606 STA 6 SECTION 1 DISCHARGE CANAL OUTFLOW HENDRY
FI260 G607H" STORMWATER TREATMENT AREA 6, OUTFLOW AT USSC STRUCTURE BROWARD
F1261 0607_T STORMWATER TREATMENT AREA 6, OUTFLOW AT USSC STRUCTURE BROWARD
15794 G'8_T CMP CULVERT IN NW CORNER OF WCA 3A BROWARD
15795 G89_T 089 CULVERT AT NW CORNER OF WCA 3A HENDRY
16745 G890 OPEN CHANNEL UVM 500' BELOW 089 CULVERTS HENDRY
15790 155_T WEIR TAIWATER AT NW CORNER WCA 3A HENDRY
15791 0155H WEIR AT NW CORNER WCA 3A HENDRY
P1321 L3.2 L-3 CANAL NR CLEWISTON MIDWAY BETWEEN DEER FENCE AND L-4 CANALS HENDRY
16244 L3BRS_O L-3 CANAL NORTH OF OIL WELL BRIDGE (BORROW CANAL SOUTH), OPEN CHANNEL HENDRY
16748 USSO_O U.S. SUGAR OUTFLOW OPEN CHANNEL UVM HENDRY
Table A - 3. Flow Monitoring Stations
15569 G393 C STA 6 SECTION 1 CELL 3 COMBINED OUTFLOW FOR G393A,B,C HENDRY
J0939 G354_C STA 6 SECTION 1, DISCHARGE CANAL, COMBINED FLOW FOR 0354A,B,C USING HENDRYG354C+H/TN
GG955 G600 P STA 6 SECTION 1, INFLOW IPUMP STATION HENDRY
15566 G601 STA 6 SECTION 1 CELL 5 INFLOW WEIR 1 HENDRY
J5567 G602 STA 6 SECTION 1 CELL 5 INFLOW WEIR 2 HENDRY
J5568 G603 STA 6 SECTION 1 CELL 3 INFLOW WEIR 3 HENDRY
H3143 G605 STA 6 SECTION 1 BYPASS CANAL HENDRY
GA116 G606 STA 6 SECTION 1 DISCHARGE CANAL OUTFLOW HENDRY
HDSS9 TA6OUT STA 6 ESTIMATED COMBINED OUTFLOW FROM CELLS 3 AND 5 HENDRY

Table A - 4. Rainfall Monitoring Sites
G6530 G600_R STA 6 SECTION 1 INFLOW PUMP STATION AT RAINGAGE HENDRY
Table A - 5. Evapotranspiration Monitoring Sites
JD470 ENRP AREAL COMPUTED PARAMETER FOR ENR PROJECT PALM BEACH
GPE352 ROTNWX ROTENBERGER TRACT WEATHER STATION, LOCATED BROWARD
BY 0606 AT STA6GE348 ROTNWX ROTENBERGER TRACT WEATHER STATION, LOCATED BROWARD
BY 0606 AT STA6
ETAIRT
RADT

Appendix B - Rainfall Data
Table B-1. 1998 Rainfall at G600_R (inches).
1 0 0 0.68 0 0.04 0 0.28 0 0 .08E 0 02 0 1.59 0.17 0 0 0 0 0 0 0.15 0 03 0 0.1 0 0 0 0 0 255 0 0 0 04 0 0.03 0 0.01 0.01 0 0 0 0.69 0.41 4.5 0.015 0 0 0 0 0 0 0.15 0.47 0 3.56 0.016 .00E 0.36 0 0 0 0.04 0.09 1.09 0.01 0.19 0 07 .00E 0 0 0 0 0 1.98 0 0.32 0 0 0.018 0 0 0 0 00.51 0.06 0 0 0 0 09 0 0 1.41 0 0 0 0 0.31 0.12 0 0.01 010 0.01 0 0 0 0 0 0.36 0.04 0.01 0.1 0 0.0111 0 0 0 0 0.01 0 0.07 0.14 0 0 0.2512 0 0 0 0 00.01 0 0 0 0.2 0 0.213 0 0 0 0 0 0.03 1.57 0 0 0 0.0614 0 0 0 0 0 0 0.42 0.49 0 0.09 0 0.12
15 0.67 1.04 0 0 0 0 0.97 0.01 0.06 0 0 016 0.16 0.09 0 0 0 0 0.17 0.31 0.58 0 0 017 0 0.54 0 0 0 0 0 0,28 0.97 0 0 018 0 0 0.01 0 0 0 0.1 3.4 0.11 0.02 0 019 0 0 2.25 0 0 0 0.87 0.05 0.13 0.01 0.2 020 0 0 0.54 0 0 0 0.76 0.05 0.01 0 021 0 0 0 .30E 0 0.04 0.32 0.82 1.24 2.08 0.01 022 0 0 0 0 0.07 0.42 0.02 0 0 0 023 0 0.88 0 0 0 0.04 0 0.04 0.01 0 0 0.0124 0 0 0 0 0 0.21 0 0 .12E 0 0.52 0
25 0 0 0 0 0 0.12 0 0.02 1.67E 0 0.01 0
26 0.16 0 0 0 0 0.01 0.09 0 .29E 0 0.02 0.0127 0.09 0.01 0 0 0 0 0 0 0.04 0 0 028 0 0 0 00.66 0 0 0 0 0 0 0.2129 0 0 0.34 0,2 0 0 0 0 0 0 0
30 0 0 0.03 0.11 0.81 0 0 0 0.01 0 0
31 0 0 0.02 0 0 0 0

Table B-2. 1999 Rainfall at G600_R (inches).
1 0.01 0.21 0 0.1 0 0.01 0.05 0.01 0.01 0 0.04 02 0.16 0.01 0 0 0 0.67 0.99 0 0 0 0.68 03 0.38 0.01 0.09 0 0 0.91 0.03 2.32 0 0.03 0 04 0.05 0 0 0 0 0.01 0.13 0 0 0.86 0 0
5 0.01 0 0 0 0 0.77 0.06 0.68 0 0 0 0
6 0 0.01 0 0 0 0 0 0.62 0.22 0.02 0 07 0.02 0 0 0 1.19 2.2 0 0 1.3 0.78 0 08 0 0.01 0 0 0 1.58 0.04 0.18 0.84 0.41 0 09 0.15 0 0 0 2.08 0.48 0 1.29 .77E 0.21 0 0
10 0.1 0.17 0 0 0.06 0.19 0 0 .49E 0 0 011 0 0 0 0 0.44 1.47 1.31 0.13 .00E 0 0 0.02
12 0 0.12 0 0.01 0.66 0 0 0.06 .00E 0.03 0 013 0 0 0 0 0.48 0.02 0 0.02E 0 0 014 0.02 0 0.08 0 0.01 0.67 0.18 0.02 .04E 2.52 0 015 0.01 0 0.05 0 0.93 0.27 0.18 0 .01E 4.3 0 016 0.01 0 0 0 0 0.38 0.19 0 .00E 0.02 0 017 0 0 0 0.2 0 0.83 0.8 0.21 .02E 0 0 0.0618 0.01 0.36 0 0.05 0 0.21 0.01 0.09 .84E 0 0 0.0219 0 0 0 0 0.3 0 0 0.14 1.30E 0 0 020 0 0 0 0 0.01 0 0 0 .31E 1.88 0.18 021 0.01 0 0 0 2.02 0.13 0 0.66 ,79E 0 0 0.02
22 0.01 0 0 0 0 00.09 0.09 .00E 0 0 0
23 0 0 0 0 0 0.14 0 1.36 .01E 0 024 0.89 0 0 0 0 0 0 0 .15E 0 0.23 0
25 0.01 0 0 0 0 0.46 0 0 ,21E 0 0 0
26 0.02 0 0.04 0.2 0 1.62 0.54 64 0 0 0
27 0.01 0 0 0.11 0 1.56 0 02.10E 0 0 0
28 0 0.01 0 0.12 0.27 0 0 0.04 .03E 0 0 0.2429 0 0 0 1 0.01 0 0.3 .04E 0 0 0
30 0 0 0.01 1.49 0.32 0 1.16 0 0 0 0
31 0 0 0.01 0.19 0.1 0

8 ~ 8o °a a m) ri
aaa
=
S
'-a'
66/ L2 L
66/M /
66lL/0
66/ L/6
6/8
* 64/L
*98B//4
* 6// L
* 6/ L/O L
8 6/6
BB/L/8
*96/ Lit
- 6/4/9
96/ LS
- 6/ I./
-96/A
S6/L/L
-q
a0N%
o
ti
mow..
J
( I) Ilplulou

Appendix C - Evapotranspiration Data
Table C-1. 1998 Evapotranspiration at STA 6 (mm).
1 2.24 366 1.01 3.37 3.87 4.87 6,09 488 5.13 4.47 4.10 2.552 2.47 0.96 3.88 3.51 5.83 5.53 6.35 4.17 5.00 4.57 2.84 2.953 1.67 0.82 3.26 4.02 6.67 5.63 6.29 6.47 5.72 4.68 1.98 2.644 3.71 3.21 4.18 3.83 6.05 6.28 5.33 5.96 4.95 3.60 0.30 2.965 2.19 3.36 4.02 5.35 5.54 6.59 4.67 6.46 1.47 4.07 0.70 0.596 1.68 1.26 335 4.99 5.58 6.49 5.90 2,10 5.16 3.15 2.18 2.867 1.93 2.56 3,52 3.77 4,99 7.08 4.22 4.01 1.65 4.54 3.00 3.218 2.74 2.61 2.84 3.61 5.95 4.49 5,39 4.41 4.62 4.17 3.59 1.799 2.84 2.96 2.76 3,41 5,54 5.54 6.39 4.67 4.18 3.91 3,96 2.6410 3.41 3.42 3.64 5.15 6.21 5.07 4.94 4.65 2.18 3.16 3.69 2.9211 3,77 2.08 4.23 4.04 7.18 5.28 4.68 6.36 3.32 4.01 4.21 1,1212 3.52 1,83 4.14 4.27 6,30 6.03 4.74 5.69 3.57 2,96 4,37 0,7113 2.08 2.18 3,92 4,03 6,39 6.20 5.49 5.54 4.65 3.02 4.52 2.1814 3.25 3.26 2.70 4.03 5.91 5.95 2,80 6.67 4.97 2.39 2.87 1.8315 1.52 0.65 2.34 3.87 6,67 6.81 2,64 6.14 1.63 4.28 3.90 2.3416 2,80 1.42 3,51 4.78 6.73 7.15 5.29 5.76 1.02 4.09 2.40 2.9217 3.48 1.01 3.25 5.19 6,36 6.58 4.82 5.23 1.83 4.34 2.50 3.0718 2.53 3.80 1.32 4.68 5.89 5.89 4.98 5.49 198 3,93 2.65 2.9219 1.57 2.91 1.68 5.40 5.08 6.39 3.00 5,33 2.90 2.04 1.89 2.0820 2.34 2.29 2.95 3.76 5.54 5.68 3.15 2.50 2.55 3.57 2.88 3.0621 1.42 4.12 3.21 2.34 6.40 6.10 3.66 3.33 4.36 2.91 3.57 2.9022 2.18 2.69 2.20 6.01 6.71 4.89 5.03 4.69 4.37 2.61 3.05 2.7423 0.91 3.51 3.97 5.50 6.65 5.49 5.70 5.45 3.73 3.74 2.80 2.4524 1.78 4.43 4.47 5.89 5.77 3.80 3.32 1.47 2.6525 1.53 4.18 3.77 4.62 5.19 5.75 6.15 6.06 152 3.91 3.64 2.7526 1.10 3.36 3.83 4.67 3,97 3.51 4.62 5.04 2.87 3,93 3.44 2.1327 1.48 3.00 2.85 4,78 4.52 6.80 5.89 3.20 4.48 3,74 3.62 2.7728 3.68 2.74 2,64 3.70 1.73 5.83 6.15 5.04 4.50 3.94 3.53 1.3329 2.69 3.93 2.59 2.74 4.56 5.99 5.38 4.33 3.63 2.76 3.1230 3.04 3.27 4.17 4.41 6.50 6.31 5.59 4,33 3.64 2.81 3.2831 3.08 3.31 4.21 4.17 5.90 3.88 4.38

Table C-2. 1999 Eva otrans iration at STA 6 (mm)
1 2.62 1.31 3.92 3.93 4.52 2.44 2.42 5.81 5.04 4.21 2.45 3.40
2 1,87 2.25 3.91 4,31 5.84 2.41 2.44 3,50 4.40 4.13 3.29 3.46
3 1.87 3.19 1.30 4,87 4.52 3.57 2.68 4.17 5.72 2.03 4.16 2.42
4 0.75 3.57 4,47 4.49 5.28 4.87 3.00 3-61 5.34 2.13 3.64 1,55
5 2.24 3.19 4.29 4.67 3.96 4.69 4.88 3.72 4,89 2.60 3.35 1.65
6 2.98 3.19 3.36 3.74 5.47 5.25 5.48 3.98 3.95 1.75 3.00 2.53
7 2.61 2.25 3.92 4.87 5.48 0.75 4.70 4.09 1.69 2,78 3.02 2.55
8 2.05 2.25 3.73 4.68 3.97 131 3.95 4.86 3.58 2.35 3.82 2.66
9 2.80 2.25 4.10 4.68 3.95 4.12 4.32 3.15 2,82 2.301 3.77 2.08
10 01.75 2.06 3.36 5.45 3.75 4.51 4.13 4,08 4.63 3.62 2.01
11 2.80 2.81 4.29 4.69 3.39 3.75 3.38 5.13 4.70 4.07 2.50 2,46
12 2.24 2.25 4.10 3.75 2,26 2.63 5.02 4.04 3.63 3.05 3.72 2.06
13 2.05 1.88 3.17 5.06 5.45 4.88 5.07 2.57 3.80 3.26 3,56 2.78
14 2.05 3.00 2.99 4.69 4.89 4.70 4,38 1.16 3.30 0.94
15 2.05 2.06 2.24 469 1.88 3.36 4.51 4 4,58 3.33 0.17 3.74 1.55
16 2.80 1.87 4.29 4.13 3.95 2.42 4.51 4.41 5.20 3,48 3.35 1.85
17 2.62 2.43 4.10 206 4.51 3.46 4.94 3.44 2.42 3,84 1.92 1.97
18 2.43 318 373 .19 4.32 1,92 5.26 1.52 2.54 4.19 3.44 1.93
19 2.81 3.00 4.6 4.68 4.70 205 4.70 2.44 2.40 4.16 1.82 3.24
20 2.62 3.56 3.17 5.25 2.82 3.49 3.95 4.37 .16 3.18 2.28 2.11
21 2.99 3.18 3.92 5.44 4.32 5.76 4.89 3.04 2.18 3.14 3.26 1.76
22 2.99 3.74 4.85 4.32 432 4.64 3.95 3.47 4.45 2.36 3.39 2.95
23 3.00 2.06 3.73 4.33 5,82 4.15 4.86 2,95 3.96 4.27 3.41 1.65
24 1.87 3.74 4.30 509 4.32 4.02 532 2.08 2.52 4.37 2.74 3.21
25 2.99 3.36 4.31 4,15 5.07 3.32 5.26 5.05 1.13 3,26 2.96 3.38
26 3.37 374 337 4.71 5.26 3.70 4.13 4.86 1.69 2.25 3.00 3.30
27 3.18 3.74 4.87 2.64 5.64 3.89 4.47 5.22 2.89 3.94 2.90 3.25
28 3.18 3.36 393 2,07 5.26 3.31 3.94 4.87 4.36 3.88 3.27 1.42
29 2.62 3.18 3.96 338 3.38 5.22 5.28 3,79 3.44 3.26 3.33
30 3.37 3.74 4.72 3,01 2.87 4.89 538 4.38 4.00 3.03 3.35
31 1.12 2.81 4.32 5.07 2,84 2.48 3.14

66/ L2 L66/L/ LL
66/L/OL
66/4/6
66/4/
66/L/9
66/L/g
66/,
66/LC
66/LE
66/ L/L
86/OL t
86/ L/ L L
86//0 4-
96/L/6
96/L/I
96/l/-
U64/986/L/9
86/L/486/ L/"
86/ I2
96/L/L
c(u lu) . lellU)od(uiw)1.3 ItIUB0d

Appendix D - Soil Moisture Equations
Ps 4 PDplh to Water TebI (em)
Figure D- 1. Falling Water Table (Drying Front) Equation
apm tows.rt .1.in.)
Figure D- 2. Rising Water Table (Wetting Front) Equation
0.90
Y O.,49-O.275 d+0,0360t -0.00237Td l+O.00Q $1d"..OOW00l0 d 1.74E-td-7.76 11 d'
R-H-
weIm
-~~* .. .'" ' ''' ''''-''''' '''-
V *Q'm.flOdO"OMBt-Cn00434
-
-
Related Documents