СБОРНИК ДОКЛАДИ научна конференция Географски аспекти на планирането и използването на територията в условията на глобални промени гр. Вършец, България, 23. 09 – 25. 09. 2016 г. ISBN: 978-619-90446-1-2 Water balance modeling for hydrological ecosystem services assessment in Ogostsa River Basin (NW Bulgaria) using GIS and remote sensing Ekaterina Ivanova, Space research and Technology Institute, BAS, Sofia 1113, Acad. G. Bonchev Str., bl. 1, e-mail: [email protected] Margita Kiryakova, Sofia University “St. Kl. Ohridski”, Faculty of Geology and Geography, 15 Tsar Osvoboditel bld., e-mail: [email protected] Abstract: The demand of fresh water is one of the key issue against the global warming and growing population of the world. The assessment and valuation of water resources as a natural capital is a new comprehensive powerful tool for better understanding the relationship "society-nature" and elaboration effective policies for sustainable development. A possible approach for assessing water resources in a given area is calculating the balance between incoming water from precipitation and outgoing water by evapotranspiration, groundwater recharge and runoff. A water balance calculation was applied in this study on the area of Ogosta River Basin, using GIS and remote sensing. Thornthwaite and Mather method (TM model) was chosen for this purpose in order to compute seasonal and geographical patterns of water availability. The technique uses spatial data for monthly precipitation, temperature, topography, land cover, soils and river network. Various thematic layers were integrated mathematically to provide a grid-based spatial patterns of monthly and annual surface runoff of the entire river basin taking into account evapotranspiration, soil retaining capacity and vegetation cover. The resulting digital maps, which indicate the water supply functions of the ecosystems, were transform in monetary valuated map of the ecosystem services flow, based on the price of drinking water. Keywords: water balance, ecosystem services, GIS, Ogosta River Basin 1. Introduction Large variety of services, that ecosystems provide to humans, are associated directly or indirectly with the hydrological cycle and are named hydrological ecosystem services or water related ecosystem services (Koshke et al., 2014). “Hydrologic services encompass the benefits to people produced by terrestrial ecosystem effects on freshwater” – from the water supply to the mitigation of flood damages (Brauman et al., 2007). Each hydrological service the authors characterize by the hydrological attributes of quantity, quality, location and timing. Ecosystem services related to water and aquatic ecosystems are included in the general classifications of MAES (2014) and MARS (Grizzetti et al., 2015). MAES (Maes et al., 2012) have examined aquatic ecosystems per typology of ecosystem considering the services delivered from inland waters (rivers, lakes, groundwater and wetlands), those from the shelf and open ocean and the services provided by transitional waters in coastal areas. MARS (Grizzetti et al., 2015) have distinguished three large groups of ecosystem services: services provided by aquatic ecosystems, which can be linked to the water bodies; hydrological ecosystem services relevant to river basins; and ecosystem services at European level. This study focuses on ecosystem services at the river basin scale, the most important of which are the water supply for drinking and not drinking purpose, irrigation, power generation and many regulating services such as water purification and erosion control ( Table 1). Hydrological ES are most heavily dependent on ground characteristics of the watershed, such as topography, slope, depth of soil and especially on the natural vegetation status and land use within the watershed area (Terrado et al., 2013, Pattanayak and Wendland, 2007). Table 1. Water related ecosystem services, representative of the Ogosta River Basin (ESs classification is adapted to MAES, 2014 and Grizzetti et al., 2015) Water related ecosystem services Biophysical Indicators Section Division Group Class Provisioning Nutrition Biomass Food Fisheries Aquaculture Water Surface water for drinking purposes Surface water availability (surface runoff) Materials Water Ground water for non- drinking purposes Water storage capacity (AWC) Energy Abiotic energy sources Hydropower generation Regulation and Maintenance Water quality regulation Water purification Nitrogen removal Natural hazard protection Erosion prevention Soil erosion rate by land use type Water regulation Flood protection Water storage capacity; Trend in flooding frequency Lifecycle maintenance, habitat and gene pool protection Maintaining populations and habitats Species diversity or abundance; Hydromorphological status Climate regulation Carbon sequestration Total carbon storage

Welcome message from author
This document is posted to help you gain knowledge. Please leave a comment to let me know what you think about it! Share it to your friends and learn new things together.
Transcript
СБОРНИК ДОКЛАДИ
научна конференция
Географски аспекти на планирането и използването на територията в условията на глобални промени
гр. Вършец, България, 23. 09 – 25. 09. 2016 г.
ISBN: 978-619-90446-1-2
Water balance modeling for hydrological ecosystem services assessment in Ogostsa
River Basin (NW Bulgaria) using GIS and remote sensing
Ekaterina Ivanova, Space research and Technology Institute, BAS, Sofia 1113, Acad. G. Bonchev Str., bl. 1,
e-mail: [email protected]
Margita Kiryakova, Sofia University “St. Kl. Ohridski”, Faculty of Geology and Geography, 15 Tsar
Osvoboditel bld., e-mail: [email protected]
Abstract: The demand of fresh water is one of the key issue against the global warming and growing population of the world.
The assessment and valuation of water resources as a natural capital is a new comprehensive powerful tool for better understanding
the relationship "society-nature" and elaboration effective policies for sustainable development. A possible approach for assessing
water resources in a given area is calculating the balance between incoming water from precipitation and outgoing water by
evapotranspiration, groundwater recharge and runoff. A water balance calculation was applied in this study on the area of Ogosta
River Basin, using GIS and remote sensing. Thornthwaite and Mather method (TM model) was chosen for this purpose in order to
compute seasonal and geographical patterns of water availability. The technique uses spatial data for monthly precipitation,
temperature, topography, land cover, soils and river network. Various thematic layers were integrated mathematically to provide a
grid-based spatial patterns of monthly and annual surface runoff of the entire river basin taking into account evapotranspiration,
soil retaining capacity and vegetation cover. The resulting digital maps, which indicate the water supply functions of the
ecosystems, were transform in monetary valuated map of the ecosystem services flow, based on the price of drinking water.
Keywords: water balance, ecosystem services, GIS, Ogosta River Basin
1. Introduction
Large variety of services, that ecosystems provide to humans, are associated directly or indirectly with the hydrological cycle and
are named hydrological ecosystem services or water related ecosystem services (Koshke et al., 2014). “Hydrologic services
encompass the benefits to people produced by terrestrial ecosystem effects on freshwater” – from the water supply to the mitigation
of flood damages (Brauman et al., 2007). Each hydrological service the authors characterize by the hydrological attributes of
quantity, quality, location and timing.
Ecosystem services related to water and aquatic ecosystems are included in the general classifications of MAES (2014) and MARS
(Grizzetti et al., 2015). MAES (Maes et al., 2012) have examined aquatic ecosystems per typology of ecosystem considering the
services delivered from inland waters (rivers, lakes, groundwater and wetlands), those from the shelf and open ocean and the
services provided by transitional waters in coastal areas. MARS (Grizzetti et al., 2015) have distinguished three large groups of
ecosystem services: services provided by aquatic ecosystems, which can be linked to the water bodies; hydrological ecosystem
services relevant to river basins; and ecosystem services at European level.
This study focuses on ecosystem services at the river basin scale, the most important of which are the water supply for drinking and
not drinking purpose, irrigation, power generation and many regulating services such as water purification and erosion control (
Table 1). Hydrological ES are most heavily dependent on ground characteristics of the watershed, such as topography, slope, depth
of soil and especially on the natural vegetation status and land use within the watershed area (Terrado et al., 2013, Pattanayak and
Wendland, 2007).
Table 1. Water related ecosystem services, representative of the Ogosta River Basin (ESs classification is adapted to MAES, 2014
and Grizzetti et al., 2015)
Water related ecosystem services Biophysical Indicators
Section Division Group Class
Provisioning Nutrition Biomass Food Fisheries
Aquaculture
Water Surface water for drinking
purposes
Surface water availability (surface
runoff)
Materials Water Ground water for non-
drinking purposes
Water storage capacity (AWC)
Energy Abiotic energy sources Hydropower generation
Regulation and
Maintenance
Water quality regulation Water purification Nitrogen removal
Natural hazard protection Erosion prevention Soil erosion rate by land use type
Water regulation Flood protection Water storage capacity;
Trend in flooding frequency
Lifecycle maintenance,
habitat and gene pool
protection
Maintaining populations
and habitats
Species diversity or abundance;
Hydromorphological status
Climate regulation Carbon sequestration Total carbon storage

СБОРНИК ДОКЛАДИ
научна конференция
Географски аспекти на планирането и използването на територията в условията на глобални промени
гр. Вършец, България, 23. 09 – 25. 09. 2016 г.
ISBN: 978-619-90446-1-2
Cultural Recreation
and tourism
Aesthetic appreciation Density of visits
Hunting and fishing Density of visits
In any case, the assessment of the hydrological ecosystem services uses an integrated approach to analysis of ecosystems and
processes occurring in the river basin and it is directly related to river basin management (Guswa et al., 2014; Brauman et al. 2007;
Grizzetti et al., 2015). The comprehensive approach for ecosystem services assessment at the river basin scale suggests the need to
use of hydrological models as a means of information. In this context, the hydrological models should provide quantitative and
qualitative information, while the assessment of ecosystem services focuses on land cover and land use, as emphasize Guswa et al.
(2014). The choice of model will depend on the context of the decision to achieve desired biophysical indicator and dominating
hydrological processes (Guswa et al., 2014).
Various tools in GIS software were developed in recent years for hydrological modeling of ecosystem services. Examples of such
list Vigerstol and Aukema (2011): SWAT - Soil and Water Assessment Tool, VIC - Variable Infiltration Capacity model, InVEST
- Integrated Valuation of Ecosystem Services and Tradeoffs, ARIES - Artificial Intelligence for Ecosystem Services.
Hydrological modeling in GIS environment for assessment of ecosystem services have been already applied to the watershed of
Upper Ogosta River and some others regions of Bulgaria. Soil and Water Assessment Tool (SWAT model) have been used for
water balance calculating and ecosystem services assessing in the Basin of Upper Ogosta River (Boyanova et al., 2016). Flood
regulating ecosystem services capacities have been mapped in the area of the Malki Iskar River Basin and Municipality of Etropole
based on the catchment hydrologic model KINEROS (Nikolova et al., 2009, Nedkov and Burkhard, 2012). Hydrological models
KINEROS and SWAT have been used for floods hazard mapping and risk assessment in Yantra River Basin (Nedkov et al, 2006,
Nikolova et al., 2007).
Specific data-base typologies and their respective lookup tables and needs from large amounts of data records are disadvantages of
software-based modeling toolsets, which complicate implementation of the models (Boyanova et al., 2016). For that reason,
Thornthwaite and Mather (TM) model (Thornthwaite and Mather, 1955, 1957) was chosen in this study, which allows adapting the
available database to the model, using only the ArcGIS software toolset.
Water quantity is one of the most important attributes of hydrological ecosystems that provide drinking and irrigation water. Its
components surface runoff and groundwater recharge feed the springs and flows of the rivers. Information about water quantity can
be provided through water balance calculation. Three environmental factors affect the water balance: the climate, with its elements
precipitation and temperature; the physical characteristics of the soils and rocks; and the plant communities. Water balance
calculating of Ogosta River Basin for hydrological ecosystem services valuation is the purpose of this study by application of grid-
based TM model in GIS. The model inputs are spatial variables of precipitation, temperature, soil structure and vegetation in a
grid-cell of 27 m. The outputs of the model are monthly and annual evapotranspiration, soil moisture storage capacity of the root-
zone and water surplus that is available for runoff. The outputs variables can be used as indicators for water ecosystem assessment
and valuation. The potential of ecosystems was assess within the basin to provide water provisioning ecosystem services. Then,
costing of services “Surface water for drinking purposes” and “Ground water for non-drinking purposes” was done based on
indicators “Surface water availability” and “Water storage capacity” (Tab. 1).
2. Study area
This study covers the area of Ogosta River Basin and its river network developed in the northwestern part of Danube catchment
area, including basins of the rivers Ogosta and Skat. East border of the study region is the Iskar River Basin and south border – the
catchment area of Nishava River. To the southwest Ogosta River Basin extends to the state border with Republic of Serbia, and to
the west it reaches the watershed of Lom River (the catchment area of Tsibritsa River). It occupies an area of 4351.2 km², including
parts of two administrative regions – Montana District and Vratsa District (Fig. 1).
СБОРНИК ДОКЛАДИ
научна конференция
Географски аспекти на планирането и използването на територията в условията на глобални промени
гр. Вършец, България, 23. 09 – 25. 09. 2016 г.
ISBN: 978-619-90446-1-2
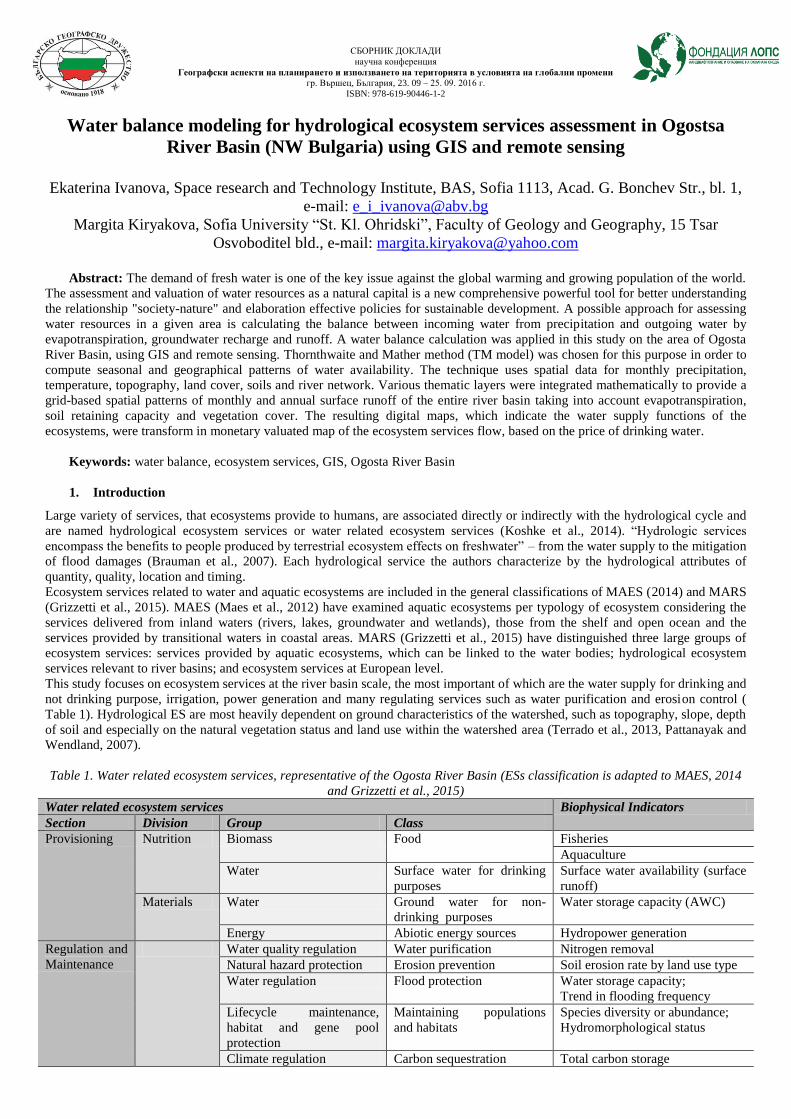
Figure 1. Location map of the Ogosta River Basin
Some northern slopes of the Western Balkan Mountains and parts of western Danubian Plain are included in the area of research.
The Stream of Ogosta takes many first-order tributaries forming a right asymmetric river system (Hristova, 2012). The continental
feature of the climate are emphasized by its elements temperature and precipitation. The climate is characterized with high
temperature amplitude and well expressed maximum in the spring and minimum in the winter. The average annual temperature
ranges from 4.8 ° C to 12.2 ° C and annual precipitation sum – between 518 and 1163 mm, depending on the elevation (Climate
Reference book for Bulgaria, 1983; Koleva and Peneva, 1990). The annual discharge of the Ogosta River is 23.8 m3 / s and it is
characterized by a relatively low variability. The coefficient of variation is between 0.32 and 0.34. The annual discharge varies
from 1.22 m3 / s measured at the upstream gauging stations to 23.8 m
3 / s measured at the mouth of the river (Hydrological
reference book, 1981; Zaharieva, 2005). Total annual water volume of the river was estimated at 1794.3 million m3 (Hydrological
reference book, 1981).
The main soil types presented in the researched area are following: Calcic Chernozems (Phaeozems), Fluvisols, Dystric Cambisols,
Chromic Luvisols and Orthic Luvisols (Soil map of Bulgaria, 1956; FAO, 1998). Forest communities are represented mainly by
deciduous and account for only 19.7 % of the total area of the basin (CLC 2012, National Reference Centre, Executive
Environmental Agency at the Bulgarian Ministry of Environment and Waters). There is high anthropogenic impact on the
hydrologic ecosystems of the Ogosta River Basin, expressed by use of water for drinking and industrial purpose, irrigation, power
generation and recreation (Zaharieva, 2005). A large number of settlements (149) are included in the watershed area, 9 of which are
towns.
3. Materials and methods
The methodology of this study can be divided into several stages, which include: identification of hydrological ecosystem services
provided potentially from ecosystems of Ogosta River Basin and choice of model for water balance calculation; creating a database
necessary for the application of the model in GIS environment and generating the relevant information layers; applying the TM
model for water balance calculation and generating the model outputs, representing grid-based spatial variables of potential
evapotranspiration, soil moisture storage capacity and surface runoff; and finally, implementation of direct valuation of water
supply ecosystem services. Among the various methods for water balance calculation the TM model is one of the most widely used
and its application in GIS makes it possible to find out location and timing of water surplus and water deficit for an entire basin
(Jasrotuia et al., 2009). The technique relies on long term average monthly rainfall, long term average temperature, soils and
vegetation characteristics of the catchment area. Several advantages the TM model has. It is one of the simplest model, uses easily
accessible climatic data and can be used for different periods and at different spatial scales.
a. Data collection and processing
As a first step, 24 grid-layers were generated representing spatial variation of temperature and precipitation within the watershed
area using linear regression method based on DEM and climatic data for average monthly long-term observations. The Digital
СБОРНИК ДОКЛАДИ
научна конференция
Географски аспекти на планирането и използването на територията в условията на глобални промени
гр. Вършец, България, 23. 09 – 25. 09. 2016 г.
ISBN: 978-619-90446-1-2
Elevation Model (DEM) is based on satellite data with cell size 27 meters (ASTER Global DEM, modified version 2012). Climatic
data from 30 ground-based meteorological stations was used in order to calculate the regression coefficients. These stations are
located in the northwest region of Bulgaria, including the territory of the researched area. The observation periods are 40 years for
the temperature and 55 years for the precipitation, from 1931 to 1970 and from 1931 to 1985 respectively (Climate Reference book
for Bulgaria, 1983; Koleva and Peneva, 1990). The soil water content (Tab. 2), i.e. available water capacity (AWC of the root-
zone) was calculated based upon the land-use, soil texture and rooting depth, using the method suggested by Thornthwaite and
Mather (1955, 1957). Digital soil map in scale 1: 200, 000 (Soil map of Bulgaria, 1956) and digital map of soil structure from
European Soil Database – ESDB v2.0 (JRC of the IES, EUR 19945 EN, 2004; Panagos, 2006, 2012) were used for this purpose.
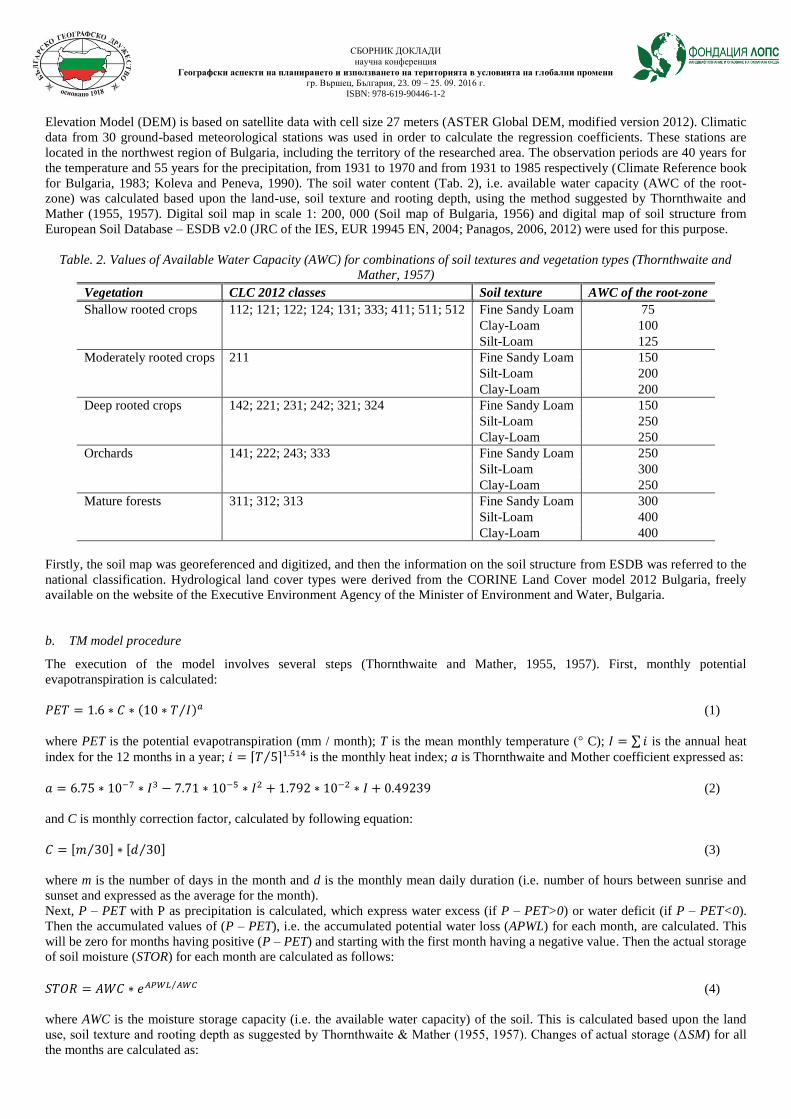
Table. 2. Values of Available Water Capacity (AWC) for combinations of soil textures and vegetation types (Thornthwaite and
Mather, 1957)
Vegetation CLC 2012 classes Soil texture AWC of the root-zone
Shallow rooted crops 112; 121; 122; 124; 131; 333; 411; 511; 512 Fine Sandy Loam 75
Clay-Loam 100
Silt-Loam 125
Moderately rooted crops 211 Fine Sandy Loam 150
Silt-Loam 200
Clay-Loam 200
Deep rooted crops 142; 221; 231; 242; 321; 324
Fine Sandy Loam 150
Silt-Loam 250
Clay-Loam 250
Orchards 141; 222; 243; 333 Fine Sandy Loam 250
Silt-Loam 300
Clay-Loam 250
Mature forests 311; 312; 313 Fine Sandy Loam 300
Silt-Loam 400
Clay-Loam 400
Firstly, the soil map was georeferenced and digitized, and then the information on the soil structure from ESDB was referred to the
national classification. Hydrological land cover types were derived from the CORINE Land Cover model 2012 Bulgaria, freely
available on the website of the Executive Environment Agency of the Minister of Environment and Water, Bulgaria.
b. TM model procedure
The execution of the model involves several steps (Thornthwaite and Mather, 1955, 1957). First, monthly potential
evapotranspiration is calculated:
(1)
where PET is the potential evapotranspiration (mm / month); T is the mean monthly temperature (° C); is the annual heat
index for the 12 months in a year; is the monthly heat index; a is Thornthwaite and Mother coefficient expressed as:
(2)
and C is monthly correction factor, calculated by following equation:
(3)
where m is the number of days in the month and d is the monthly mean daily duration (i.e. number of hours between sunrise and
sunset and expressed as the average for the month).
Next, P – PET with P as precipitation is calculated, which express water excess (if P – PET>0) or water deficit (if P – PET<0).
Then the accumulated values of (P – PET), i.e. the accumulated potential water loss (APWL) for each month, are calculated. This
will be zero for months having positive (P – PET) and starting with the first month having a negative value. Then the actual storage
of soil moisture (STOR) for each month are calculated as follows:
(4)
where AWC is the moisture storage capacity (i.e. the available water capacity) of the soil. This is calculated based upon the land
use, soil texture and rooting depth as suggested by Thornthwaite & Mather (1955, 1957). Changes of actual storage (ΔSM) for all
the months are calculated as:
СБОРНИК ДОКЛАДИ
научна конференция
Географски аспекти на планирането и използването на територията в условията на глобални промени
гр. Вършец, България, 23. 09 – 25. 09. 2016 г.
ISBN: 978-619-90446-1-2
(5)
A negative value of ΔSM implies subtraction of water from the storage to be used for evapotranspiration, whereas a positive value
of ΔSM implies infiltration of water into the soil and its addition to the soil moisture storage.
The actual evapotranspiration (AET) are computed for all the months, using equations (6) and (7):
(for ΔSM < 0) (6)
(for ΔSM > 0) (7)
The water deficit (DEF) for crop evapotranspiration in each month are calculated for the months having negative (P – PET) as
follows:
(8)
The amount of excess water that cannot be stored is denoted as moisture surplus (SUR). When storage reaches its capacity, SUR is
calculated using equation (9):
(9)
When the soil storage is not at its capacity, no surplus exists. In a month in which the soil moisture storage capacity is just satisfied,
SUR is obtained using equation (10):
(10)
where ΔSM is the change in actual soil moisture storage.
4. Results
Potential evapotranspiration (PET) was calculated by means of equations (1), (2) and (3). Then, P – PET was calculated for all the
months. The resulting maps show water excess (P – PET>0) for each month. Consequently, the water balance of the Ogosta River
Basin is positive through all the year (i.e. no water deficit exist). Therefore, the soil storage is at its capacity and the actual soil
moisture for each month is equal to AWC. Hence, changes of actual storage (ΔSM) for all the months were zero and surplus was
calculated using equation (9). The actual evapotranspiration is equal to potential respectively.
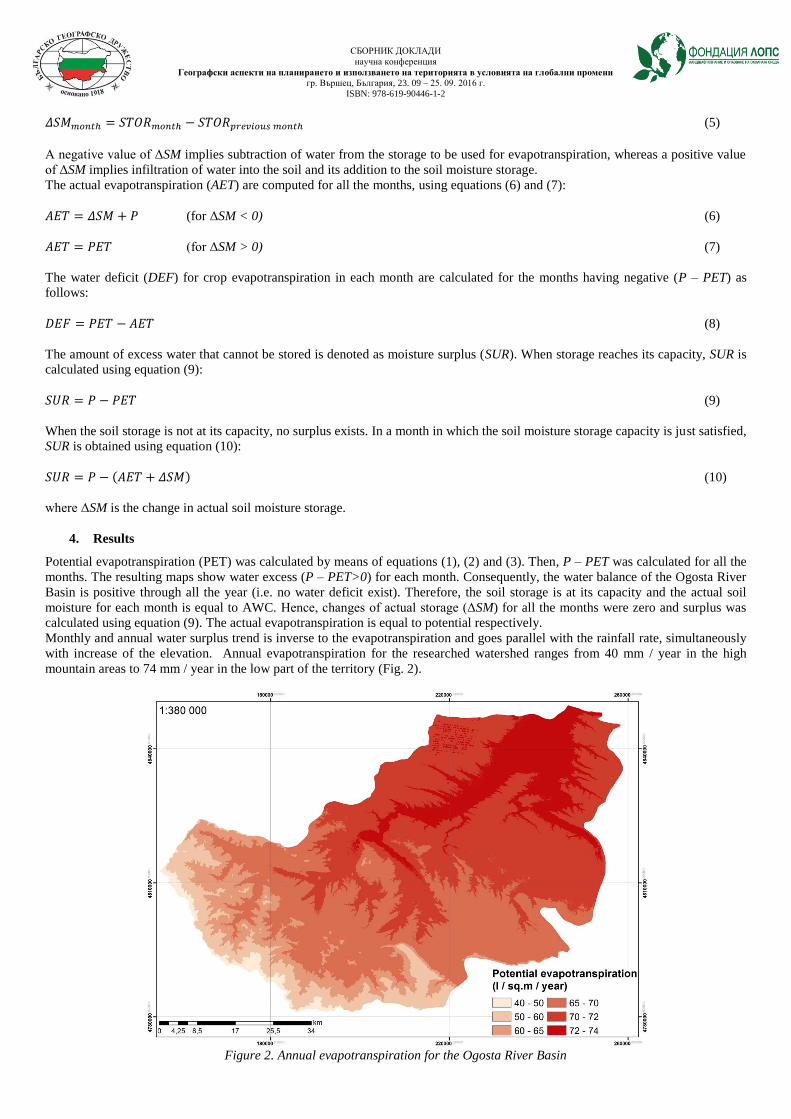
Monthly and annual water surplus trend is inverse to the evapotranspiration and goes parallel with the rainfall rate, simultaneously
with increase of the elevation. Annual evapotranspiration for the researched watershed ranges from 40 mm / year in the high
mountain areas to 74 mm / year in the low part of the territory (Fig. 2).
Figure 2. Annual evapotranspiration for the Ogosta River Basin
СБОРНИК ДОКЛАДИ
научна конференция
Географски аспекти на планирането и използването на територията в условията на глобални промени
гр. Вършец, България, 23. 09 – 25. 09. 2016 г.
ISBN: 978-619-90446-1-2
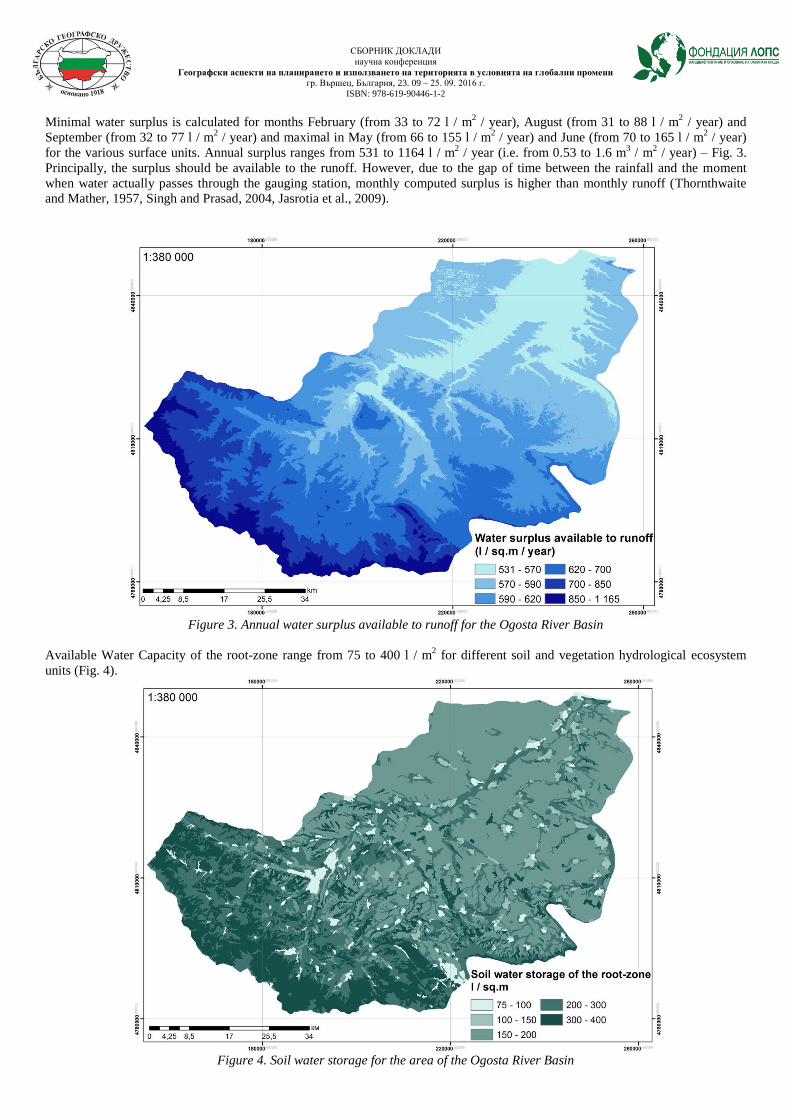
Minimal water surplus is calculated for months February (from 33 to 72 l / m2 / year), August (from 31 to 88 l / m
2 / year) and
September (from 32 to 77 l / m2 / year) and maximal in May (from 66 to 155 l / m
2 / year) and June (from 70 to 165 l / m
2 / year)
for the various surface units. Annual surplus ranges from 531 to 1164 l / m2 / year (i.e. from 0.53 to 1.6 m
3 / m
2 / year) – Fig. 3.
Principally, the surplus should be available to the runoff. However, due to the gap of time between the rainfall and the moment
when water actually passes through the gauging station, monthly computed surplus is higher than monthly runoff (Thornthwaite
and Mather, 1957, Singh and Prasad, 2004, Jasrotia et al., 2009).
Figure 3. Annual water surplus available to runoff for the Ogosta River Basin
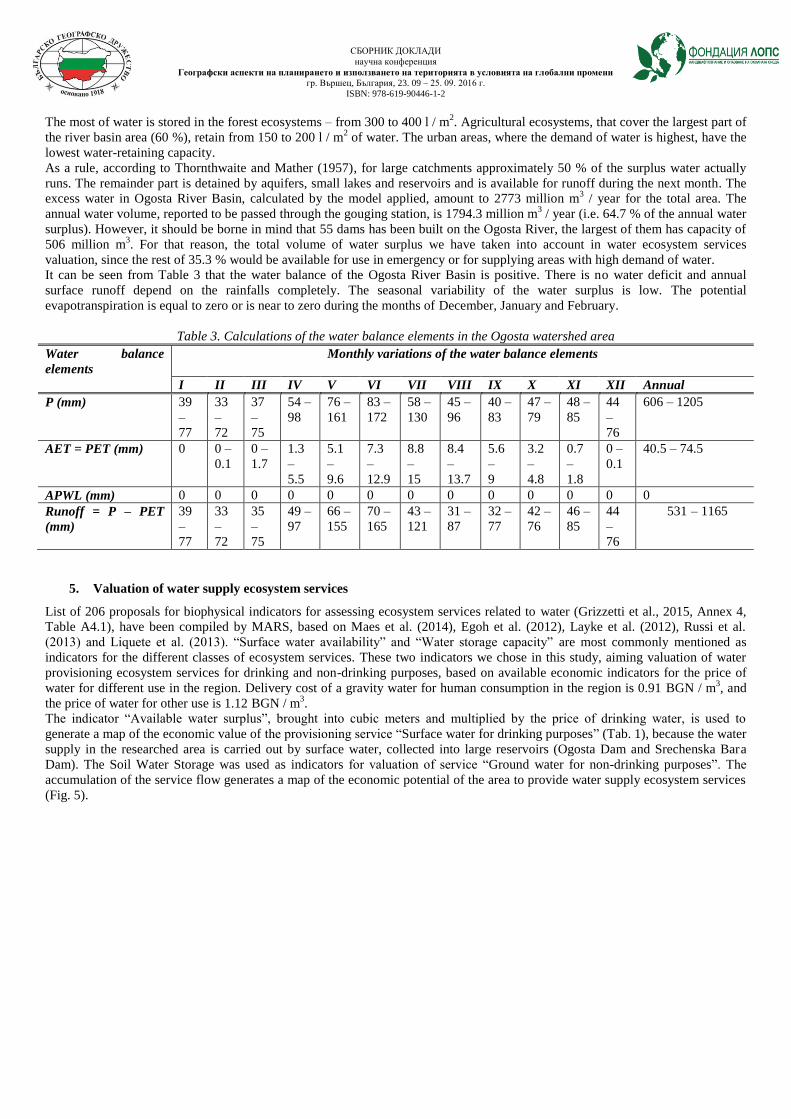
Available Water Capacity of the root-zone range from 75 to 400 l / m2 for different soil and vegetation hydrological ecosystem
units (Fig. 4).
Figure 4. Soil water storage for the area of the Ogosta River Basin
СБОРНИК ДОКЛАДИ
научна конференция
Географски аспекти на планирането и използването на територията в условията на глобални промени
гр. Вършец, България, 23. 09 – 25. 09. 2016 г.
ISBN: 978-619-90446-1-2
The most of water is stored in the forest ecosystems – from 300 to 400 l / m2. Agricultural ecosystems, that cover the largest part of
the river basin area (60 %), retain from 150 to 200 l / m2 of water. The urban areas, where the demand of water is highest, have the
lowest water-retaining capacity.
As a rule, according to Thornthwaite and Mather (1957), for large catchments approximately 50 % of the surplus water actually
runs. The remainder part is detained by aquifers, small lakes and reservoirs and is available for runoff during the next month. The
excess water in Ogosta River Basin, calculated by the model applied, amount to 2773 million m3 / year for the total area. The
annual water volume, reported to be passed through the gouging station, is 1794.3 million m3 / year (i.e. 64.7 % of the annual water
surplus). However, it should be borne in mind that 55 dams has been built on the Ogosta River, the largest of them has capacity of
506 million m3. For that reason, the total volume of water surplus we have taken into account in water ecosystem services
valuation, since the rest of 35.3 % would be available for use in emergency or for supplying areas with high demand of water.
It can be seen from Table 3 that the water balance of the Ogosta River Basin is positive. There is no water deficit and annual
surface runoff depend on the rainfalls completely. The seasonal variability of the water surplus is low. The potential
evapotranspiration is equal to zero or is near to zero during the months of December, January and February.
Table 3. Calculations of the water balance elements in the Ogosta watershed area
Water balance
elements
Monthly variations of the water balance elements
I II III IV V VI VII VIII IX X XI XII Annual
P (mm) 39
–
77
33
–
72
37
–
75
54 –
98
76 –
161
83 –
172
58 –
130
45 –
96
40 –
83
47 –
79
48 –
85
44
–
76
606 – 1205
AET = PET (mm) 0 0 –
0.1
0 –
1.7
1.3
–
5.5
5.1
–
9.6
7.3
–
12.9
8.8
–
15
8.4
–
13.7
5.6
–
9
3.2
–
4.8
0.7
–
1.8
0 –
0.1
40.5 – 74.5
APWL (mm) 0 0 0 0 0 0 0 0 0 0 0 0 0
Runoff = P – PET
(mm)
39
–
77
33
–
72
35
–
75
49 –
97
66 –
155
70 –
165
43 –
121
31 –
87
32 –
77
42 –
76
46 –
85
44
–
76
531 – 1165
5. Valuation of water supply ecosystem services
List of 206 proposals for biophysical indicators for assessing ecosystem services related to water (Grizzetti et al., 2015, Annex 4,
Table A4.1), have been compiled by MARS, based on Maes et al. (2014), Egoh et al. (2012), Layke et al. (2012), Russi et al.
(2013) and Liquete et al. (2013). “Surface water availability” and “Water storage capacity” are most commonly mentioned as
indicators for the different classes of ecosystem services. These two indicators we chose in this study, aiming valuation of water
provisioning ecosystem services for drinking and non-drinking purposes, based on available economic indicators for the price of
water for different use in the region. Delivery cost of a gravity water for human consumption in the region is 0.91 BGN / m3, and
the price of water for other use is 1.12 BGN / m3.
The indicator “Available water surplus”, brought into cubic meters and multiplied by the price of drinking water, is used to
generate a map of the economic value of the provisioning service “Surface water for drinking purposes” (Tab. 1), because the water
supply in the researched area is carried out by surface water, collected into large reservoirs (Ogosta Dam and Srechenska Bara
Dam). The Soil Water Storage was used as indicators for valuation of service “Ground water for non-drinking purposes”. The
accumulation of the service flow generates a map of the economic potential of the area to provide water supply ecosystem services
(Fig. 5).
СБОРНИК ДОКЛАДИ
научна конференция
Географски аспекти на планирането и използването на територията в условията на глобални промени
гр. Вършец, България, 23. 09 – 25. 09. 2016 г.
ISBN: 978-619-90446-1-2
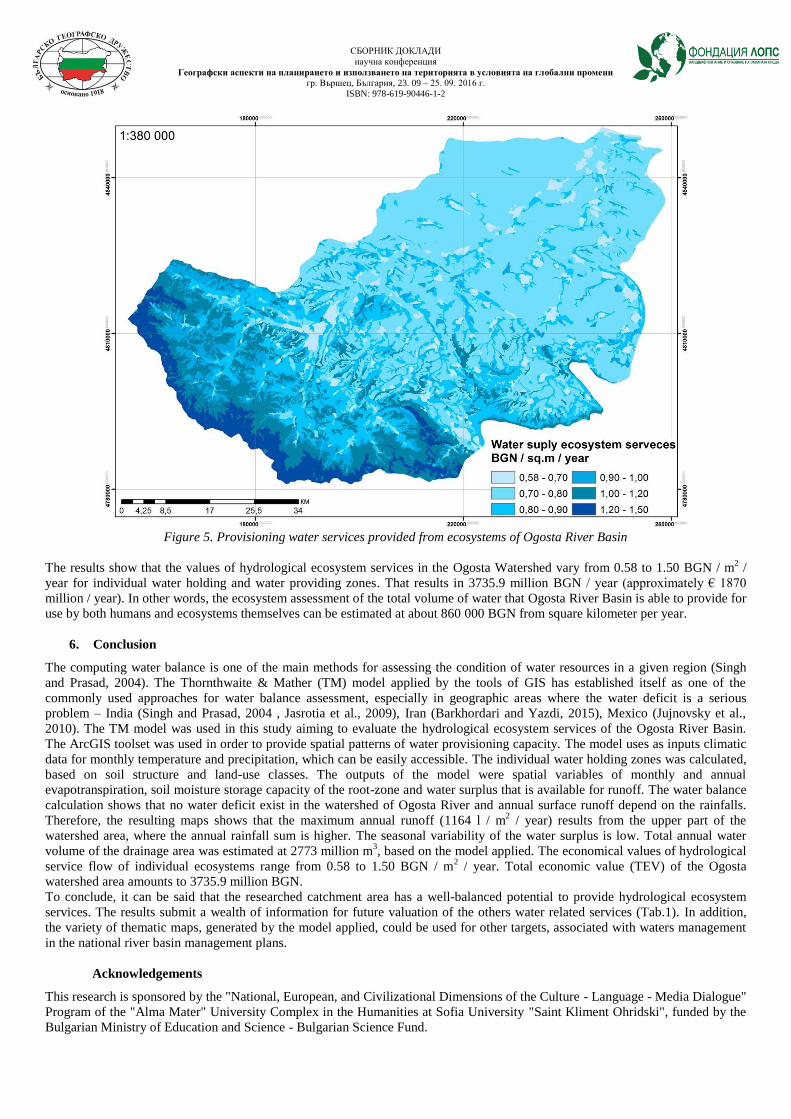
Figure 5. Provisioning water services provided from ecosystems of Ogosta River Basin
The results show that the values of hydrological ecosystem services in the Ogosta Watershed vary from 0.58 to 1.50 BGN / m2 /
year for individual water holding and water providing zones. That results in 3735.9 million BGN / year (approximately € 1870
million / year). In other words, the ecosystem assessment of the total volume of water that Ogosta River Basin is able to provide for
use by both humans and ecosystems themselves can be estimated at about 860 000 BGN from square kilometer per year.
6. Conclusion
The computing water balance is one of the main methods for assessing the condition of water resources in a given region (Singh
and Prasad, 2004). The Thornthwaite & Mather (TM) model applied by the tools of GIS has established itself as one of the
commonly used approaches for water balance assessment, especially in geographic areas where the water deficit is a serious
problem – India (Singh and Prasad, 2004 , Jasrotia et al., 2009), Iran (Barkhordari and Yazdi, 2015), Mexico (Jujnovsky et al.,
2010). The TM model was used in this study aiming to evaluate the hydrological ecosystem services of the Ogosta River Basin.
The ArcGIS toolset was used in order to provide spatial patterns of water provisioning capacity. The model uses as inputs climatic
data for monthly temperature and precipitation, which can be easily accessible. The individual water holding zones was calculated,
based on soil structure and land-use classes. The outputs of the model were spatial variables of monthly and annual
evapotranspiration, soil moisture storage capacity of the root-zone and water surplus that is available for runoff. The water balance
calculation shows that no water deficit exist in the watershed of Ogosta River and annual surface runoff depend on the rainfalls.
Therefore, the resulting maps shows that the maximum annual runoff (1164 l / m2 / year) results from the upper part of the
watershed area, where the annual rainfall sum is higher. The seasonal variability of the water surplus is low. Total annual water
volume of the drainage area was estimated at 2773 million m3, based on the model applied. The economical values of hydrological
service flow of individual ecosystems range from 0.58 to 1.50 BGN / m2 / year. Total economic value (TEV) of the Ogosta
watershed area amounts to 3735.9 million BGN.
To conclude, it can be said that the researched catchment area has a well-balanced potential to provide hydrological ecosystem
services. The results submit a wealth of information for future valuation of the others water related services (Tab.1). In addition,
the variety of thematic maps, generated by the model applied, could be used for other targets, associated with waters management
in the national river basin management plans.
Acknowledgements
This research is sponsored by the "National, European, and Civilizational Dimensions of the Culture - Language - Media Dialogue"
Program of the "Alma Mater" University Complex in the Humanities at Sofia University "Saint Kliment Ohridski", funded by the
Bulgarian Ministry of Education and Science - Bulgarian Science Fund.

СБОРНИК ДОКЛАДИ
научна конференция
Географски аспекти на планирането и използването на територията в условията на глобални промени
гр. Вършец, България, 23. 09 – 25. 09. 2016 г.
ISBN: 978-619-90446-1-2
References
Koschke L., C. Lorz, Ch. Furst, T. Lehmann, F. Makeschin (2014). Assessing hydrological and provisioning ecosystem services in a case study in Western Central
Brazil. Ecological Processes 2014, 3:2 Brauman, K.A., Daily, G.C., Duarte, T.K., Mooney, H.A., (2007). The nature and value of ecosystem services: An overview highlighting hydrologic services,
Annual Review of Environment and Resources, pp. 67-98.
MAES: (2014). Mapping and Assessment of Ecosystems and their Services. Indicators and guidelines for ecosystem assessments under Action 5 of the EU Biodiversity Strategy to 2020. Publications office of the European Union, Luxembourg.
Maes J., B. Egoh, L. Willemen, C. Liquete, P. Vihervaara, J. Philipp Schagner, B. Grizzetti, E.G. Drakou, A. La Notte, G. Zulian, F. Bouraoui, M.L. Paracchini, L. Braat, G. Bidoglio (2012). Mapping ecosystem services for policy support and decision making in the European Union. Ecosystem Services, 1, pp. 31–
39
Grizzetti B., D. Lanzanova, C. Liquete, A. Reynaud (2015). Cook-book for water ecosystem service assessment and valuation. JRS Science and Policy Report, European Commission, EUR 27141 EN
Guswa A.J., K.A. Brauman, C. Brown, P. Hamel, B.L. Keeler, S. Stratton Sayre (2014). Ecosystem services: Challenges and opportunities for hydrologic modeling
to support decision making. Water Resources research, AGU
Terrado M., A. Momblanch, M. Bardina, L. Boithias, A. Munne, S. Sabater, A. Solera, V. Acuna (2016). Integrating ecosystem services in river basin management
plans. Journal of Applied Ecology, 53, pp. 865–875
Pattanayak, S. K., and K. J. Wendland. 2007. Nature’s care: Diarrhea, watershed protection and biodiversity conservation in flores, Indonesia. Biodiversity and Conservation 16(10), pp. 2801–2819.
Cook, B.R., Spray, C.J., (2012). Ecosystem services and integrated water resource management: Different paths to the same end? Journal of Environmental
Management 109, pp. 93-100 Vigerstol K.L., J.E. Aukema (2011). A comparison of tools for modeling freshwater ecosystem services. Journal of Environmental Management, 92, pp. 2403–
2409
Boyanova K., S. Nedkov, B. Burkhard (2016). Applications of GIS-Based Hydrological Models in Mountain Areas in Bulgaria for Ecosystem Services Assessment: Issues and Advantages Sustainable Mountain Regions: Challenges and Perspectives in Southeastern Europe. Springer International Publishing
Switzerland, Chapter 3, pp. 35–51
Nedkov S., B. Burkhard (2012). Flood regulating ecosystem services—Mapping supply and demand, in the Etropole municipality, Bulgaria. Ecological Indicators, 21, pp. 67–97
Nikolova, M., Nedkov, S., Nikolov, V., Zuzdrov, I., Genev, M., Kotsev, T., Vatseva, R., Krumova, Y., 2009. Implementation of the “KINEROS” model for
estimation of the flood prone territories in the Malki Iskar River Basin. Information & Security: An International Journal 24, 76–88. Nedkov, S., Nikolova, M., 2006. Modeling floods hazard in Yantra river basin. In: Proceedings from Balwois Conference. Ohrid, May 23–26
Nikolova, M., Nedkov, S., Semmens, D., Iankov, S., 2007. Environmental quality and landscape risk assessment in Yantra River Basin. In: Petrosillo, I., Muller, F.,
Jones, K.B., Zurlini, G., Krauze, K., Victorov, S., Li, B.-L., Kepner, W.G. (Eds.), Use of Landscape Sciences for the Assessment of Environmental Security. Springer, The Netherlands, pp. 202–217
Thornthwaite, C. W. & Mather, R. J. (1955) The water balance. Publications in Climatology 8, 1–86. DIT, Laboratory of Climatology, Centerton, New Jersey,
USA. Thornthwaite, C. W. & Mather, R. J. (1957) Instructions and tables for computing potential evapotranspiration and water balance. Publ. no. 10, Laboratory of
Climatology, Centerton, New Jersey, USA.
Hristova N. (2012). The river waters of Bulgaria. Sofia, ISBN: 978-954-723-080-4 Climate Reference book for Bulgaria (1983), 3rd edn. NIMH – BAS, Sofia
Koleva E, Peneva R (1990) Climate Reference book. Precipitation in Bulgaria. BAS, Sofia, (in Bulgarian)
Zaharieva V. (2005). Water development study of the Ogosta River Basin. Water problems, 35, pp. 20–28 Hydrological reference book of the rivers in Bulgaria. 1981. NIMH – BAS, Sofia, II
Soil Atlas of Bulgaria (1956). Soil Map 1: 200 000
FAO. 1998. World Reference Base for Soil Resources, by ISSS–ISRIC–FAO. World Soil Resources Report No. 84. Rome. Jasrotia A.S., A. Majhi, S. Singh (2009). Water Balance Approach for Rainwater Harvesting using Remote Sensing and GIS Techniques, Jammu Himalaya, India.
Water Resour Manage, 23, pp. 3035–3055
ESDB v2.0: The European Soil Database distribution version 2.0, Joint Research Center of the Institute for Environment and Sustainable Development, European Commission and the European Soil Bureau Network, CD-ROM, EUR 19945 EN, 2004.
Panagos P. (2006) The European soil database. GEO: connexion, 5 (7), pp. 32-33.
Panagos P., M. Van Liedekerke, A. Jones, L. Montanarella (2012). European Soil Data Centre: Response to European policy support and public data requirements. Land Use Policy, 29 (2), pp. 329-338
Singh R. K., V. H. Prasad (2004). Remote sensing and GIS approach for assessment of the water balance of a watershed. Hydrological Sciences–Journal–des
Sciences Hydrologiques, 49(1), pp. 131–141 Egoh B, Drakou EG, Dunbar MB, Maes J, Willemen L (2012) Indicators for mapping ecosystem services : a review. Publications Office of the European Union,
Luxembourg.
Layke C, Mapendembe A, Brown C, Walpole M, Winn J (2012) Indicators from the global and sub-global Millennium Ecosystem Assessments: An analysis and next steps. Ecological Indicators 17: 77–87.
Russi D., ten Brink P., Farmer A., Badura T., Coates D., Förster J., Kumar R. and Davidson N. (2013) The Economics of Ecosystems and Biodiversity for Water and Wetlands. IEEP, London and Brussels; Ramsar Secretariat, Gland.
Liquete C, Piroddi C, Drakou EG, et al. (2013). Current status and future prospects for the assessment of marine and coastal ecosystem services: a systematic
review. PloS one 8 (7): e67737. Barkhordari J., A. Semsar Yazdi (2015). Assessment of the Monthly Water Balance in an Arid Region Using TM Model and GIS (Case Study: Pishkouh
Watershed, Iran). Journal of Rangeland Science, 2015, Vol. 5, No. 2
Jujnovsky J., L. Almeida-Lenero, M. Bojorge-Garcia, Y. Laura Monges, E. Cantoral-Uriza and M. Mazari-Hiriart (2010). Hydrologic ecosystem services: water quality and quantity in the Magdalena River, Mexico City. Hidrobiologica, 20 (2), pp. 113-126
Related Documents