, WATER AVAILABILITY IN THE TWIN CITY METROPOLITAN AREA: THE WATER BALANCE Working Paper No.3 June, 1991 Sheryl Corrigan Mears Park Centre, 230 East Fifth Street, St. Paul, Minnesota 55101 Publication No. 590-91-008 This document is made available electronically by the Minnesota Legislative Reference Library as part of an ongoing digital archiving project. http://www.leg.state.mn.us/lrl/lrl.asp , WATER AVAILABILITY IN THE TWIN CITY METROPOLITAN AREA: THE WATER BALANCE Working Paper No.3 June, 1991 Sheryl Corrigan Mears Park Centre, 230 East Fifth Street, St. Paul, Minnesota 55101 Publication No. 590-91-008

Welcome message from author
This document is posted to help you gain knowledge. Please leave a comment to let me know what you think about it! Share it to your friends and learn new things together.
Transcript

,
WATER AVAILABILITYIN THE
TWIN CITYMETROPOLITAN AREA:THE WATER BALANCE
Working Paper No.3
June, 1991
Sheryl Corrigan
METROPOLITANCOUNC~
Mears Park Centre, 230 East Fifth Street, St. Paul, Minnesota 55101Publication No. 590-91-008
This document is made available electronically by the Minnesota Legislative Reference Library as part of an ongoing digital archiving project. http://www.leg.state.mn.us/lrl/lrl.asp ,
WATER AVAILABILITYIN THE
TWIN CITYMETROPOLITAN AREA:THE WATER BALANCE
Working Paper No.3
June, 1991
Sheryl Corrigan
METROPOLITANCOUNC~
Mears Park Centre, 230 East Fifth Street, St. Paul, Minnesota 55101Publication No. 590-91-008

METROPOLITAN COUNCIL MEMBERS
Mary Anderson, Chair
Liz Anderson, District 1Dede Wolfson, District 2James W. Senden, District 3Carol Kummer, District 4David F. Fisher, District 5Donald B. Riley, District 6Esther Newcome, District 7Susan E. Anderson, District 8
Ken Kunzman, District 9James J. Krautkremer, District 10Dottie Rietow, District 11Sondra R. Simonson, District 12Dirk devries, District 13Bonita D. Featherstone, District 14Margaret Schreiner, District 15E. Craig Morris, District 16
The Metropolitan Council coordinates the planning and development of the seven-countyMetropolitan Area. The Council is authorized by state and federal laws to plan for highways andtransit, sewers, parks and open space, airports, land use, air and water quality, health, housing,aging and arts.
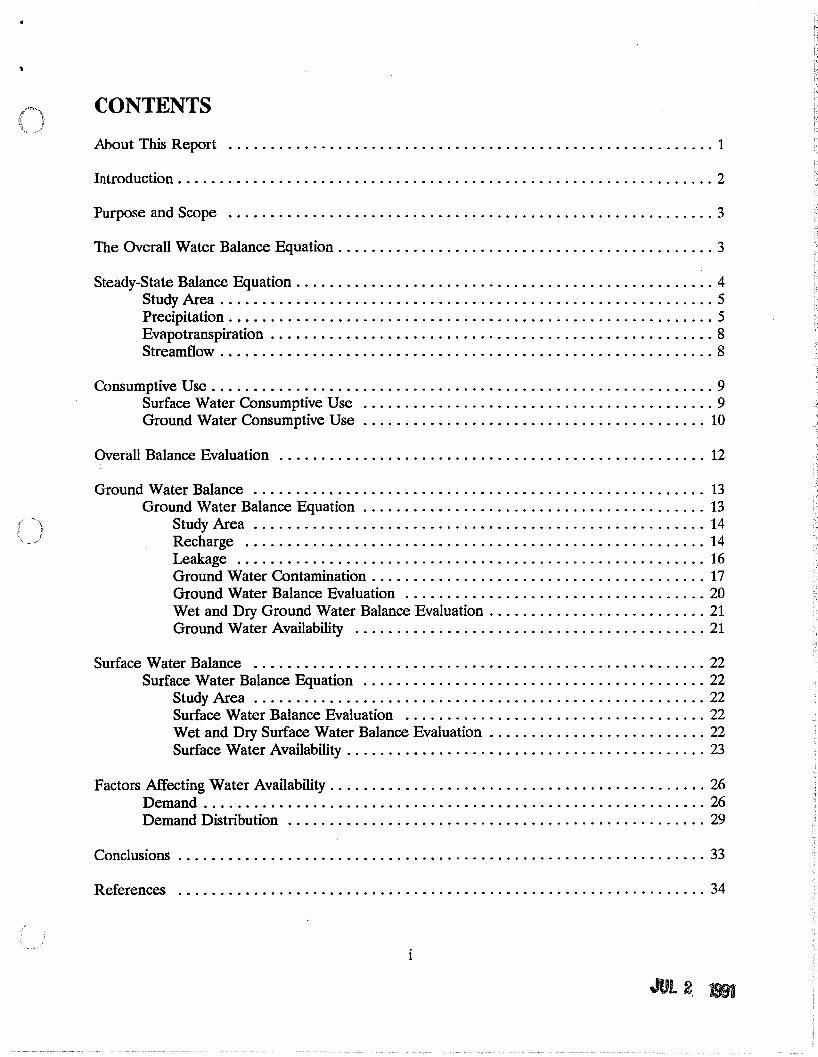
CONTENTS
About This Report 1
Introduction 2
Purpose and Scope 3
The Overall Water Balance Equation 3
Steady-State Balance Equation 4Study Area . . . . . . . . . . . . . . . . . . . . . . . . . . . . . . . . . . . . . . . . . . . . . . . . . . . . . . . . . . . 5Precipitation . . . . . . . . . . . . . . . . . . . . . . . . . . . . . . . . . . . . . . . . . . . . . . . . . . . . . . . . . . 5Evapotranspiration . . . . . . . . . . . . . . . . . . . . . . . . . . . . . . . . . . . . . . . . . . . . . . . . . . . . . 8Streamflow . . . . . . . . . . . . . . . . . . . . . . . . . . . . . . . . . . . . . . . . . . . . . . . . . . . . . . . . ... . 8
Consumptive Use 9Surface Water Consumptive Use 9Ground Water Consumptive Use 10
Overall Balance Evaluation 12
Ground Water Balance 13Ground Water Balance Equation 13
Study Area 14Recharge 14I..eakage 16Ground Water Contamination . . . . . . . . . . . . . . . . . . . . . . . . . . . . . . . . . . . . . . .. 17Ground Water Balance Evaluation 20Wet and Dry Ground Water Balance Evaluation 21Ground Water Availability 21
Surface Water Balance 22Surface Water Balance Equation 22
Study Area 22Surface Water Balance Evaluation 22Wet and Dry Surface Water Balance Evaluation 22Surface Water Availability 23
Factors Affecting Water Availability 26Demand . . . . . . . . . . . . . . . . . . . . . . . . . . . . . . . . . . . . . . . . . . . . . . . . . . . . . . . . . . . . 26Demand Distribution 29
Conclusions . . . . . . . . . . . . . . . . . . . . . . . . . . . . . . . . . . . . . . . . . . . . . . . . . . . . . . . . . . . . . . . 33
References 34
JUl2, 1991
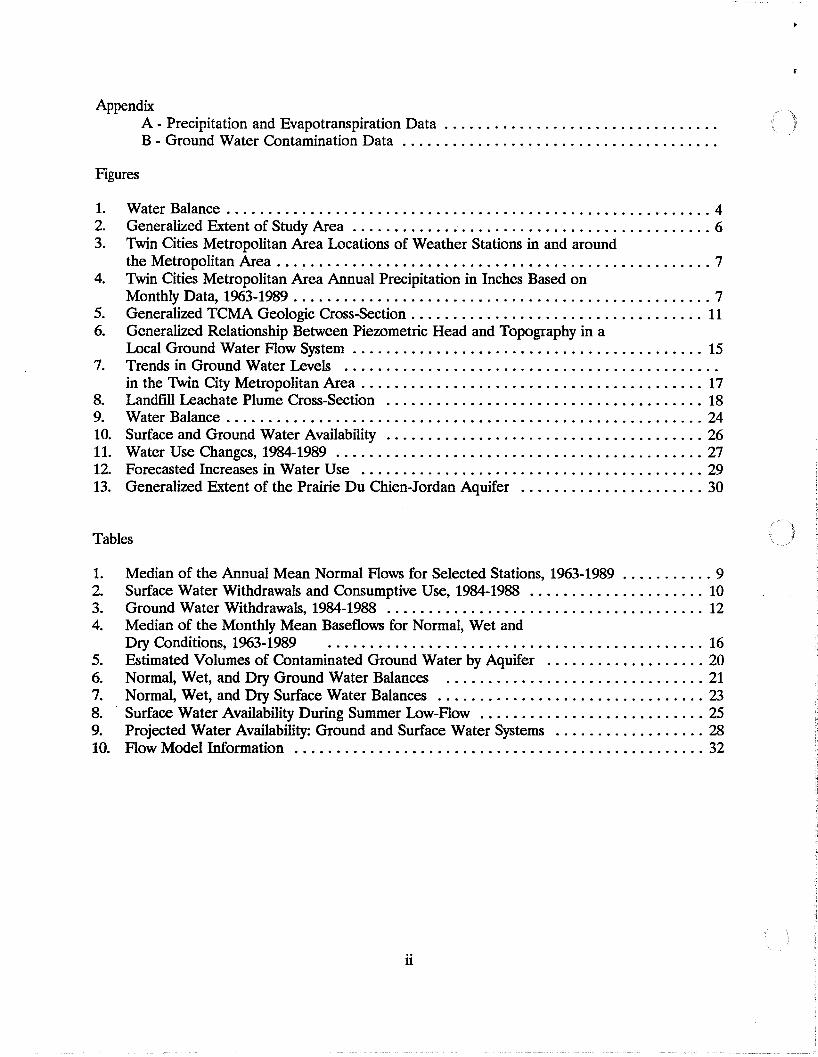
AppendixA - Precipitation and Evapotranspiration Data .B - Ground Water Contamination Data .
Figures
1. Water Balance 42. Generalized Extent of Study Area 63. Twin Cities Metropolitan Area Locations of Weather Stations in and around
the Metropolitan Area . . . . . . . . . . . . . . . . . . . . . . . . . . . . . . . . . . . . . . . . . . . . . . . . . . . . 74. Twin Cities Metropolitan Area Annual Precipitation in Inches Based on
Monthly Data, 1963-1989 75. Generalized TCMA Geologic Cross-Section . . . . . . . . . . . . . . . . . . . . . . . . . . . . . . . . . .. 116. Generalized Relationship Between Piezometric Head and Topography in a
Local Ground Water Flow System . . . . . . . . . . . . . . . . . . . . . . . . . . . . . . . . . . . . . . . . .. 157. Trends in Ground Water Levels .
in the Twin City Metropolitan Area . . . . . . . . . . . . . . . . . . . . . . . . . . . . . . . . . . . . . . . .. 178. Landfill Leachate Plume Cross-Section 189. Water Balance 2410. Surface and Ground Water Availability 2611. Water Use Changes, 1984-1989 2712. Forecasted Increases in Water Use 2913. Generalized Extent of the Prairie Du Chien-Jordan Aquifer 30
Tables
1. Median of the Annual Mean Normal Flows for Selected Stations, 1963-1989 92. Surface Water Withdrawals and Consumptive Use, 1984-1988 103. Ground Water Withdrawals, 1984-1988 124. Median of the Monthly Mean Baseflows for Normal, Wet and
Dry Conditions, 1963-1989 . . . . . . . . . . . . . . . . . . . . . . . . . . . . . . . . . . . . . . . . . . . . . 165. Estimated Volumes of Contaminated Ground Water by Aquifer 206. Normal, Wet, and Dry Ground Water Balances 217. Normal, Wet, and Dry Surface Water Balances 238. . Surface Water Availability During Summer Low-Flow 259. Projected Water Availability: Ground and Surface Water Systems 2810. Flow Model Information 32
ii
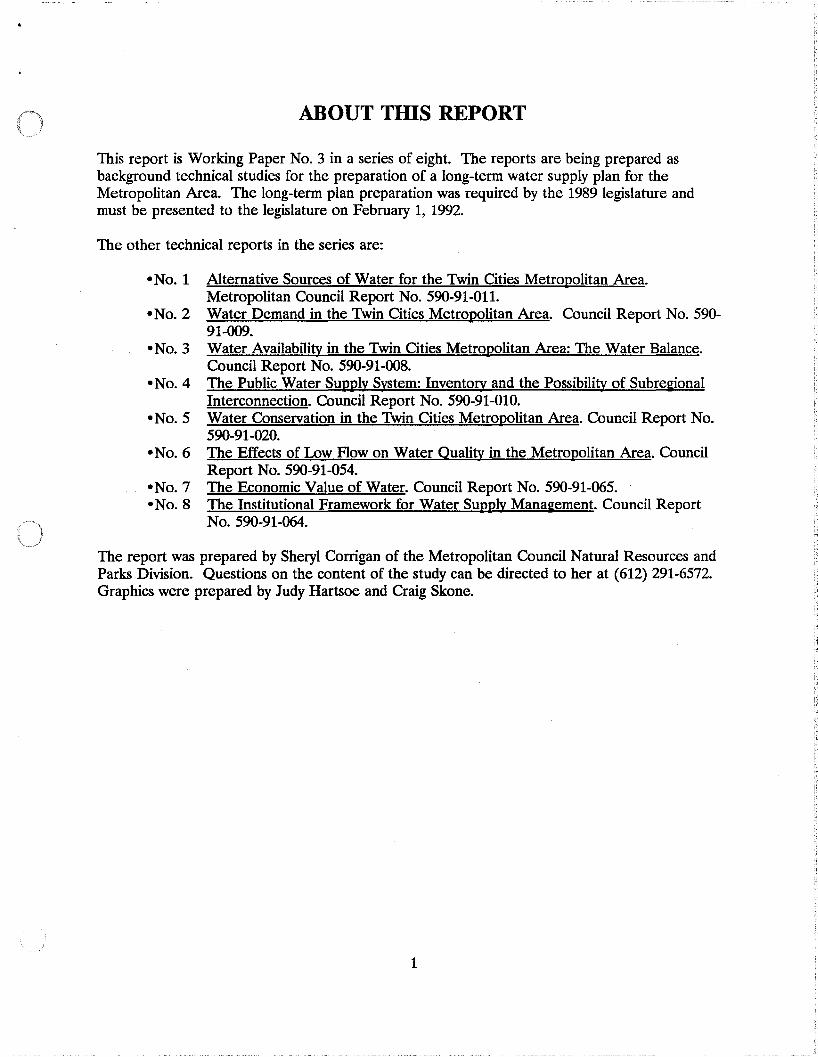
ABOUT TInS REPORT
This report is Working Paper No.3 in a series of eight. The reports are being prepared asbackground technical studies for the preparation of a long-term water supply plan for theMetropolitan Area. The long-term plan preparation was required by the 1989 legislature andmust be presented to the legislature on February 1, 1992.
The other technical reports in the series are:
-No.1 Alternative Sources of Water for the Twin Cities Metropolitan Area.Metropolitan Council Report No. 590-91-011.
-No.2 Water Demand in the Twin Cities Metropolitan Area. Council Report No. 59091-009.
-No.3 Water Availability in the Twin Cities Metropolitan Area: The Water Balance.Council Report No. 590-91-008.
-No.4 The Public Water Supply System: Inventory and the Possibility of SubregionalInterconnection. Council Report No. 590-91-010.
-No.5 Water Conservation in the Twin Cities Metropolitan Area. Council Report No.590-91-020.
-No.6 The Effects of Low Flow on Water Quality in the Metropolitan Area. CouncilReport No. 590-91-054.
-No.7 The Economic Value of Water. Council Report No. 590-91-065.- No.8 The Institutional Framework for Water Supply Management. Council Report
No. 590-91-064.
The report was prepared by Sheryl Corrigan of the Metropolitan Council Natural Resources andParks Division. Questions on the content of the study can be directed to her at (612) 291-6572.Graphics were prepared by Judy Hartsoe and Craig Skone.
1
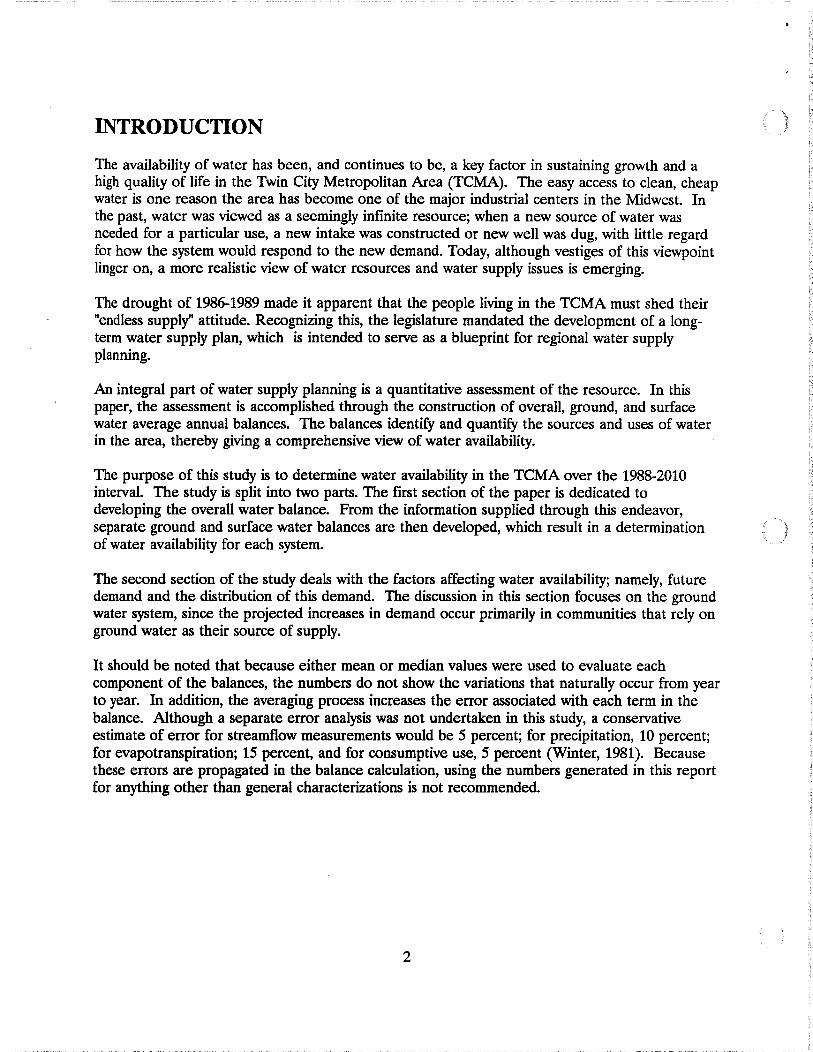
INTRODUCTION
The availability of water has been, and continues to be, a key factor in sustaining growth and ahigh quality of life in the Twin City Metropolitan Area (TCMA). The easy access to clean, cheapwater is one reason the area has become one of the major industrial centers in the Midwest. Inthe past, water was viewed as a seemingly infinite resource; when a new source of water wasneeded for a particular use, a new intake was constructed or new well was dug, with little regardfor how the system would respond to the new demand. Today, although vestiges of this viewpointlinger on, a more realistic view of water resources and water supply issues is emerging.
The drought of 1986-1989 made it apparent that the people living in the TCMA must shed their"endless supply" attitude. Recognizing this, the legislature mandated the development of a longterm water supply plan, which is intended to serve as a blueprint for regional water supplyplanning.
An integral part of water supply planning is a quantitative assessment of the resource. In thispaper, the assessment is accomplished through the construction of overall, ground, and surfacewater average annual balances. The balances identify and quantify the sources and uses of waterin the area, thereby giving a comprehensive view of water availability.
The purpose of this study is to determine water availability in the TCMA over the 1988-2010interval. The study is split into two parts. The first section of the paper is dedicated todeveloping the overall water balance. From the information supplied through this endeavor,separate ground and surface water balances are then developed, which result in a determinationof water availability for each system.
The second section of the study deals with the factors affecting water availability; namely, futuredemand and the distribution of this demand. The discussion in this section focuses on the groundwater system, since the projected increases in demand occur primarily in communities that rely onground water as their source of supply.
It should be noted that because either mean or median values were used to evaluate eachcomponent of the balances, the numbers do not show the variations that naturally occur from yearto year. In addition, the averaging process increases the error associated with each term in thebalance. Although a separate error analysis was not undertaken in this study, a conservativeestimate of error for streamflow measurements would be 5 percent; for precipitation, 10 percent;for evapotranspiration; 15 percent, and for consumptive use, 5 percent (Winter, 1981). Becausethese errors are propagated in the balance calculation, using the numbers generated in this reportfor anything other than general characterizations is not recommended.
2
PURPOSE AND SCOPE
The TCMA relies on both surface and ground water to satisfy the demands of the industrial,residential, and agricultural communities in the area. While the area has never suffered a severeshortage of water, the recent drought raised important questions regarding the impact droughtand development can have on the water resources within the region. The purpose behind theconstruction of the water balance was to identify and generally quantify the major sources andsinks of water in the TCMA so that an overall picture of water availability, and hence, watersupply could be obtained.
In terms of water supply, the primary surface water sources for the TCMA are the Mississippi, St.Croix, and the Minnesota Rivers. Historically, the Mississippi has been the only source used fordrinking water, while the other two are used for industrial purposes, power generation, andirrigation. Aside from the water withdrawn to satisfy these uses, surface water passes through thearea largely unused. To determine whether the surface water system could be used more fully, i.e.,how much additional surface water could be captured, an average annual surface water balancewas constructed.
The ground water system, on the other hand, is used extensively throughout the TCMA as asource for drinking water, industrial, and irrigation purposes. A recent ground water modelingstudy done by the United States Geological Survey (USGS) suggested that in some areas,additional pumping focused on the three primary aquifers could result in significant reductions inhydraulic head, as well as reductions in the amount of ground water discharged to TCMA streams.To better understand how the ground water system is responding to the pressures ofdevelopment--both existing and planned--an average annual ground water balance wasconstructed.
The results from each of the balances are used in the paper to formulate conclusions regardingthe direction we should take in planning for future water supplies.
THE OVERALL WATER BALANCE EQUATION
If steady state, or equilibrium conditions are assumed to exist in the area, then, over the longterm, the same amount of water can be expected to flow into the system as will flow out, asexpressed by the equation:
INFLOW = OUTFLOW
This equation represents a water balance in its simplest form. When the inflow/outflow balance isdisrupted over the long-term, either by overuse or natural climatic changes, the system begins tomove to a new state of equilibrium. Examples of the kinds of adjustments that can occur include alowering of ground water levels, a decrease in stream discharge, and an increase in recharge tothe regional aquifer system. The impact that these changes can have on water supply can besevere.
To gain a better idea of how much water typically enters the area on an annual basis, an averageannual water balance was constructed. The balance describes the system as if it were in a steadystate, or equilibrium condition. This entailed defining the system and time period underconsideration and all of the inputs and outputs affecting it.
3

STEADY-STATE BALANCE EQUATION
The water inputs to the study area can be represented by precipitation (P), and streamflow intothe study area (I). Conversely, evapotranspiration (ET), streamflow out of the study area (0), andconsumptive use (U) constitute the outputs. Ground water flow into and out of the study area isalso considered an input and output, but under steady-state conditions they are assumed to beequal, which cancels them from the equation. The sign of each of the terms denotes whether it isbeing added to, or taken from the system. In equation form, this relationship is set equal to zero,because the inputs should equal the outputs.
P + I - ET - 0- U = 0
This equation represents the overall water balance, assuming steady-state conditions. This balanceequation is valid only if surface and ground water storage within the study area remains constant,meaning the volume of water stored in lakes, depressions, and reservoirs, as well as within theaquifer system does not change over time. Of course, significant changes in storage during thesummer months and short drought periods can lower surface and ground water levelsconsiderably. However, to fulfill the steady state condition, it is assumed the system reboundsfrom these seasonal depletions during the fall and winter when most recharge occurs.
Under predevelopment conditions, the consumptive use term (U) in the equation would be zero,and the only outputs in the area would be evapotranspiration and streamflow. Under theseconditions, the system equilibrium is inherently preserved. But because the TCMA is an urbanarea, natural conditions no longer exist. Therefore, the consumptive use element thataccompanies development must be accounted for in the overall water balance equation.
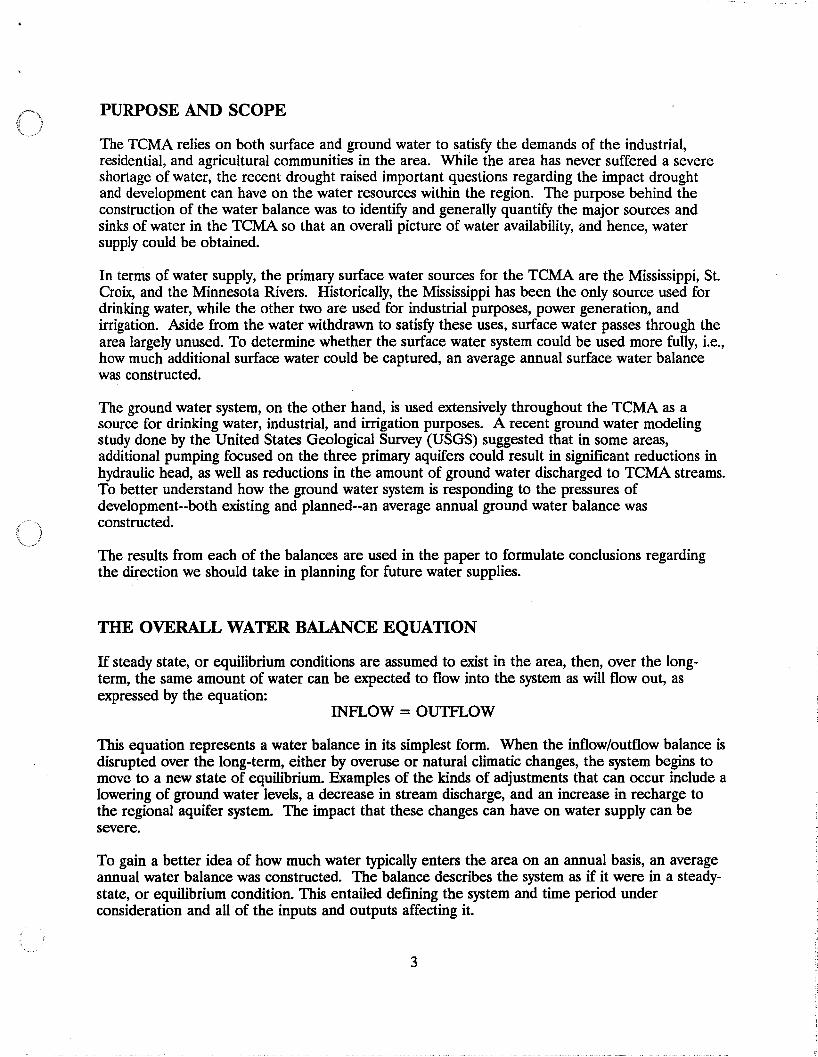
Figure 1 is a diagram that shows the relationship between the inputs and outputs to the system.In both sections of the diagram, blocks representing precipitation and stream inflow are placed onthe input side of the balance. On the output side, evapotranspiration and outflow blocks appearin both, along with a block representing consumptive uses. The sizes of the blocks indicate therelative volumes associated with each input and output.
Figure 1WATER BALANCE
INFLOW OUTFLOW
AI oonaumptlve ua. (U) Incre.aeL
INFLOW OUTFLOW
4
From the figure, the effects of a growing consumptive use term on the other outputs can be seen.Keeping inputs constant, either the evapotranspiration or the stream outflow term must bereduced to accommodate the increase in consumption. Since evapotranspiration is onlydependent on climatic conditions, it is not affected by consumption. Therefore, to ''balance''consumption, a reduction in stream outflow from the study area must occur.
In the following sections, each term of the balance is evaluated to determine the flows associatedwith the equilibrium condition.
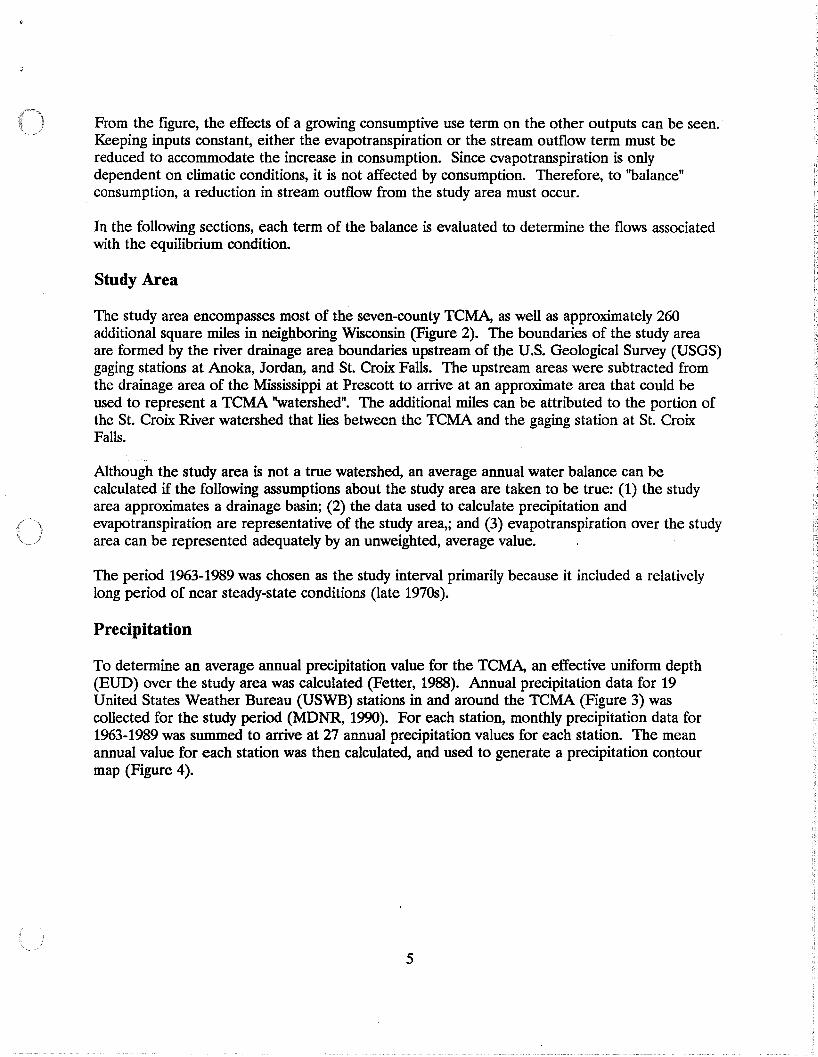
Study Area
The study area encompasses most of the seven-county TCMA, as well as approximately 260additional square miles in neighboring Wisconsin (Figure 2). The boundaries of the study areaare formed by the river drainage area boundaries upstream of the U.S. Geological Survey (USGS)gaging stations at Anoka, Jordan, and S1. Croix Falls. The upstream areas were subtracted fromthe drainage area of the Mississippi at Prescott to arrive at an approximate area that could beused to represent a TCMA "watershed". The additional miles can be attributed to the portion ofthe S1. Croix River watershed that lies between the TCMA and the gaging station at S1. CroixFalls.
Although the study area is not a true watershed, an average annual water balance can becalculat~d if the following assumptions about the study area are taken to be true: (1) the studyarea approximates a drainage basin; (2) the data used to calculate precipitation andevapotranspiration are representative of the study area,; and (3) evapotranspiration over the studyarea can be represented adequately by an unweighted, average value.
The period 1963-1989 was chosen as the study interval primarily because it included a relativelylong period of near steady-state conditions (late 19708).
Precipitation
To determine an average annual precipitation value for the TCMA, an effective uniform depth(EUD) over the study area was calculated (Fetter, 1988). Annual precipitation data for 19United States Weather Bureau (USWB) stations in and around the TCMA (Figure 3) wascollected for the study period (MDNR, 1990). For each station, monthly precipitation data for1963-1989 was summed to arrive at 27 annual precipitation values for each station. The meanannual value for each station was then calculated, and used to generate a precipitation contourmap (Figure 4).
5

Figure 2
GENERALIZEDEXTENT OFSTUDY AREA
_ Study area
oMiles
WISCoNSIN
The mapping was done at the State Climatologist's Office (MDNR), and entailed running thedata first through "MinnMap", a program developed by the Climatology Office to generate basemaps, and then through "Surfer" (Golden Software, Inc.) which is the program used to draw theisohyets across the region. From this map, weighted precipitation averages were computed andsummed, (Appendix A) resulting in a value of 29.57 inches (4,592 million gallons per day) for aneffective uniform depth, or EUD. It should be noted that this figure is approximately four inchesgreater than the 1951-1980 precipitation normal for Minneapolis-St. Paul (MSP). The variationcan probably be attributed to the fact that precipitation levels increase significantly with distancefrom the MSP weather station (Kuehnast et aI, 1975), in addition to the 10 percent errorassociated with areal averaging (Winter, 1981).
6

Figure 3TWIN CITIES METROPOLITAN AREALOCATIONS OF WEATHER STATIONSIN AND AROUND THE METROPOLITAN AREA
Figure 4TWIN CITIES METROPOLITAN AREAAVERAGE ANNUAL PRECIPITATION IN INCHESBASED ON MONTHLY DATA, 1963-1989
Miles
Source: MDNR, State Climatologist's Office
•(] Red Wing
•Red Wing Dam
GOODHUERIC ELeSUEUR
• cambr/~ge
WRIGHT
Buffalo
•
I SAN T ISHERBURNE
•Winsted
MoL E 0 D J-.-.--JL---,-l-';""".....I.,--.i,---j
Evapotranspiration
Unlike precipitation, direct measurement of evapotranspiration is a difficult task, and is seldomundertaken. In the TCMA, only one station, St. Paul, has recorded evapotranspiration data.Because actual measurements are so rare, several methods of calculating evapotranspirationindirectly have been developed. Perhaps the most widely used method is the Thornthwaitemethod (Thornthwaite, and Mather, 1957), which was the method of choice for this study.
To compute potential evapotranspiration using the Thornthwaite method, mean monthlytemperature, mean monthly precipitation, latitude and the holding capacity of the soil must beknown. The climatological data were provided by the State Climatologist's Office, while the soilinformation was obtained from county soil survey maps. Holding capacity estimates for varioussoil types were provided by Thornthwaite. Using this information, in addition to the conversionand computational tables developed by Thornthwaite, it was possible to make a determination ofpotential evapotranspiration at each site. It should be pointed out that the value arrived atthrough the Thornthwaite analysis is a theoretical value--it represents the amount of water thatcould be lost to evapotranspiration, not necessarily the actual loss. In humid regions such as theTCMA, however, potential and actual evapotranspirative losses are closely aligned (Baker, 1979).
Potential evapotranspiration for 11 of the 19 USWB stations was determined according to theThornthwaite method (Appendix A). As in the precipitation calculations, these average valueswere used to generate a contour map; however, no spatial relationship betweenevapotranspiration and geographic location was evident from the map. Since evapotranspiration isdependent on the site-specific parameters discussed earlier, and since these parameters are highlyvariable across the study area, this result was not surprising. In lieu of a map, the mean annualevapotranspiration was characterized by the median of the mean values determined by theThornthwaite calculations. This figure was found to be 23.36 inches (3,629 million gallons perday), which is again higher than is generally expected for the area. The higher value can probablybe attributed to the error inherent in the measurements used in Thornthwaite analysis, as well aserror associated with the analysis itself.
Streamflow
Four USGS gaging stations account for roughly 97 percent of the inflow to the TCMA (Norvitch,1974): the Mississippi River at Anoka, the Minnesota River at Jordan, the St. Croix River at St.Croix Falls and the Crow River at Rockford. One gaging station, the Mississippi River atPrescott, accounts for approximately 99 percent of the outflow. Because the unaccounted portionof the inflows and outflow was so small, it was assumed that any error in the water balance causedby these flows would be well within the margin of uncertainty expected in this type of analysis.
Flow data records for the five gaging stations were collected for the study period (USGS, 1990).Table 1 shows the median of the annual mean normal flows for each station for the period 19631989. The Crow River is not depicted in the table, because its confluence with the Mississippioccurs above the Anoka gage.
8
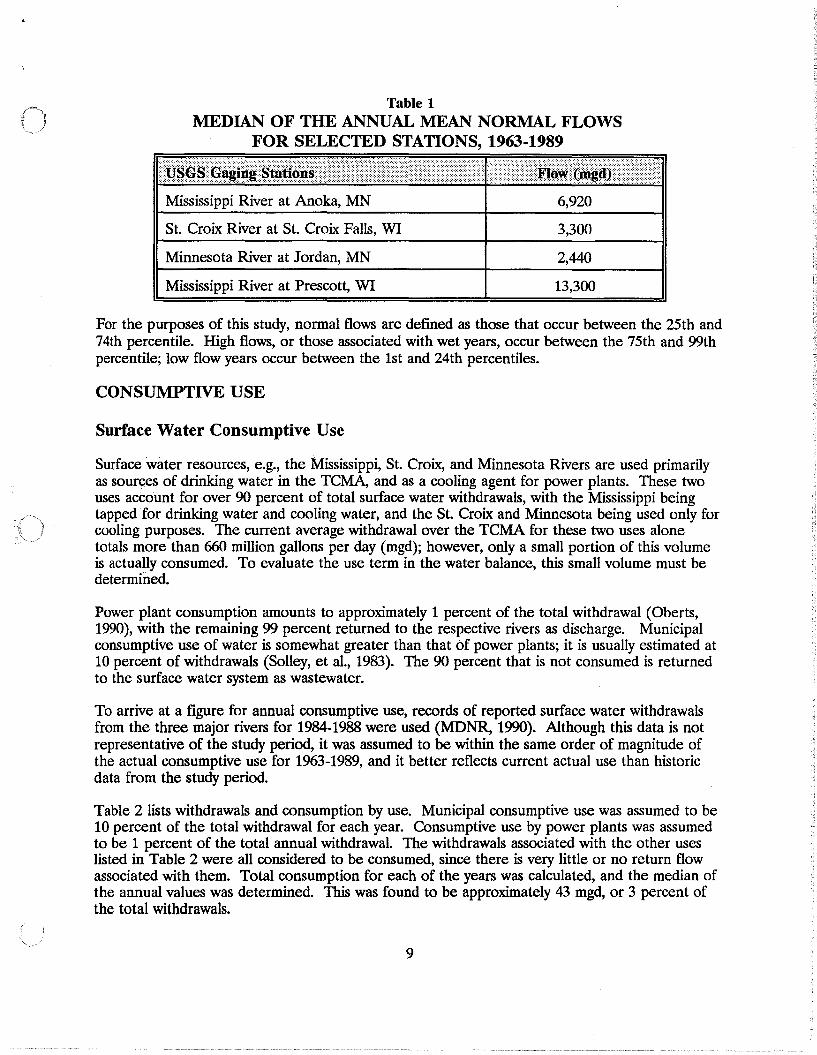
Table 1MEDIAN OF THE ANNUAL MEAN NORMAL FLOWS
FOR SELECTED STATIONS, 1963-1989:::::=:::::::=::==::::::::
Mississippi River at Anoka, MN
St. Croix River at St. Croix Falls, WI
Minnesota River at Jordan, MN
Mississippi River at Prescott, WI
6,920
3,300
2,440
13,300
For the purposes of this study, normal flows are defined as those that occur between the 25th and74th percentile. High flows, or those associated with wet years, occur between the 75th and 99thpercentile; low flow years occur between the 1st and 24th percentiles.
CONSUMPTIVE USE
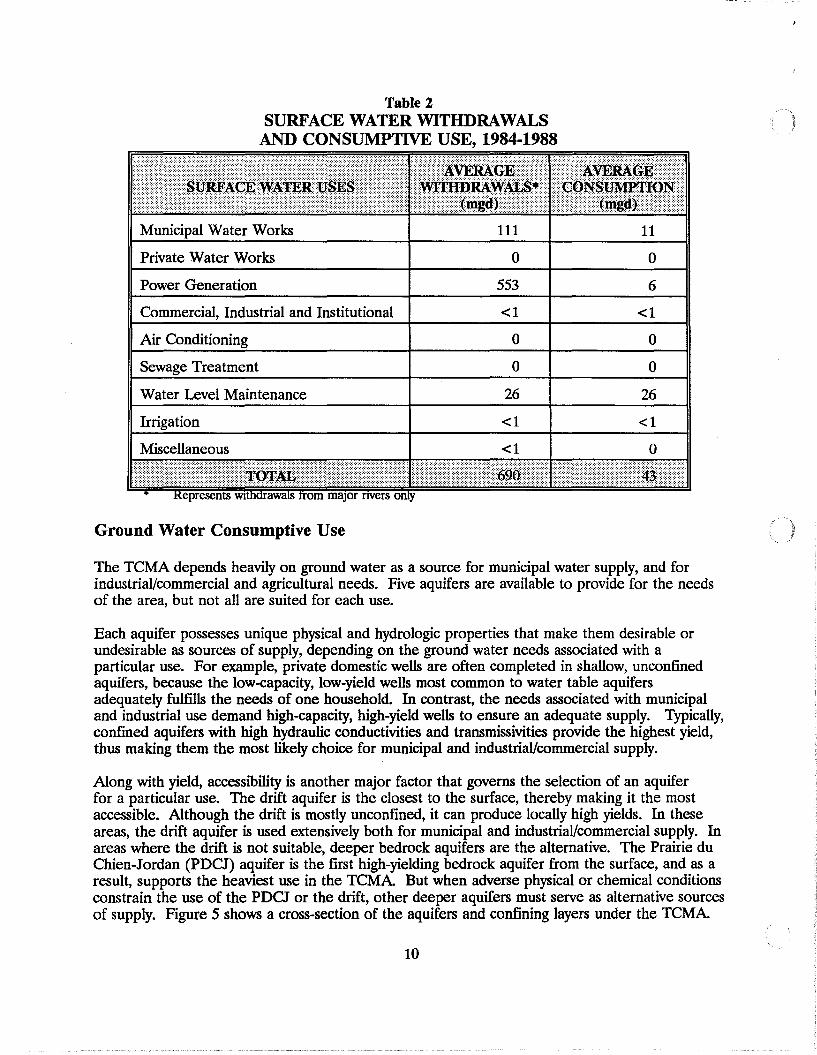
Surface Water Consumptive Use
Surface water resources, e.g., the Mississippi, St. Croix, and Minnesota Rivers are used primarilyas sourc,es of drinking water in the TCMA, and as a cooling agent for power plants. These twouses account for over 90 percent of total surface water withdrawals, with the Mississippi beingtapped for drinking water and cooling water, and the St. Croix and Minnesota being used only forcooling purposes. The current average withdrawal over the TCMA for these two uses alonetotals more than 660 million gallons per day (mgd); however, only a small portion of this volumeis actually consumed. To evaluate the use term in the water balance, this small volume must bedetermined.
Power plant consumption amounts to approximately 1 percent of the total withdrawal (Oberts,1990), with the remaining 99 percent returned to the respective rivers as discharge. Municipalconsumptive use of water is somewhat greater than that of power plants; it is usually estimated at10 percent of withdrawals (Solley, et aI., 1983). The 90 percent that is not consumed is returnedto the surface water system as wastewater.
To arrive at a figure for annual consumptive use, records of reported surface water withdrawalsfrom the three major rivers for 1984-1988 were used (MDNR, 1990). Although this data is notrepresentative of the study period, it was assumed to be within the same order of magnitude ofthe actual consumptive use for 1963-1989, and it better reflects current actual use than historicdata from the study period.
Table 2 lists withdrawals and consumption by use. Municipal consumptive use was assumed to be10 percent of the total withdrawal for each year. Consumptive use by power plants was assumedto be 1 percent of the total annual withdrawal. The withdrawals associated with the other useslisted in Table 2 were all considered to be consumed, since there is very little or no return flowassociated with them. Total consumption for each of the years was calculated, and the median ofthe annual values was determined. This was found to be approximately 43 mgd, or 3 percent ofthe total withdrawals.
9
Municipal Water Works
Table 2SURFACE WATER WITHDRAWALS
AND CONSUMPTIVE USE, 1984-1988
!ill~.'il.~ ·.!!~)lg~li:i!r\:··tmg~)::·:: ::1::111111011
111 11
Private Water Works
Power Generation
Commercial, Industrial and Institutional
Air Conditioning
Sewage Treatment
Water Level Maintenance
Irrigation
Miscellaneous
o553
<1
oo
26
<1
<1
o6
<1
oo
26
<1
o
Ground Water Consumptive Use
The TCMA depends heavily on ground water as a source for municipal water supply, and forindustrial/commercial and agricultural needs. Five aquifers are available to provide for the needsof the area, but not all are suited for each use.
Each aquifer possesses unique physical and hydrologic properties that make them desirable orundesirable as sources of supply, depending on the ground water needs associated with aparticular use. For example, private domestic wells are often completed in shallow, unconfinedaquifers, because the low-capacity, low-yield wells most common to water table aquifersadequately fulfills the needs of one household. In contrast, the needs associated with municipaland industrial use demand high-capacity, high-yield wells to ensure an adequate supply. Typically,confined aquifers with high hydraulic conductivities and transmissivities provide the highest yield,thus making them the most likely choice for municipal and industriaVcommercial supply.
Along with yield, accessibility is another major factor that governs the selection of an aquiferfor a particular use. The drift aquifer is the closest to the surface, thereby making it the mostaccessible. Although the drift is mostly unconfined, it can produce locally high yields. In theseareas, the drift aquifer is used extensively both for municipal and industriaVcommercial supply. Inareas where the drift is not suitable, deeper bedrock aquifers are the alternative. The Prairie duChien-Jordan (PDCJ) aquifer is the first high-yielding bedrock aquifer from the surface, and as aresult, supports the heaviest use in the TCMA. But when adverse physical or chemical conditionsconstrain the use of the PDCJ or the drift, other deeper aquifers must serve as alternative sourcesof supply. Figure 5 shows a cross-section of the aquifers and confining layers under the TCMA.
10
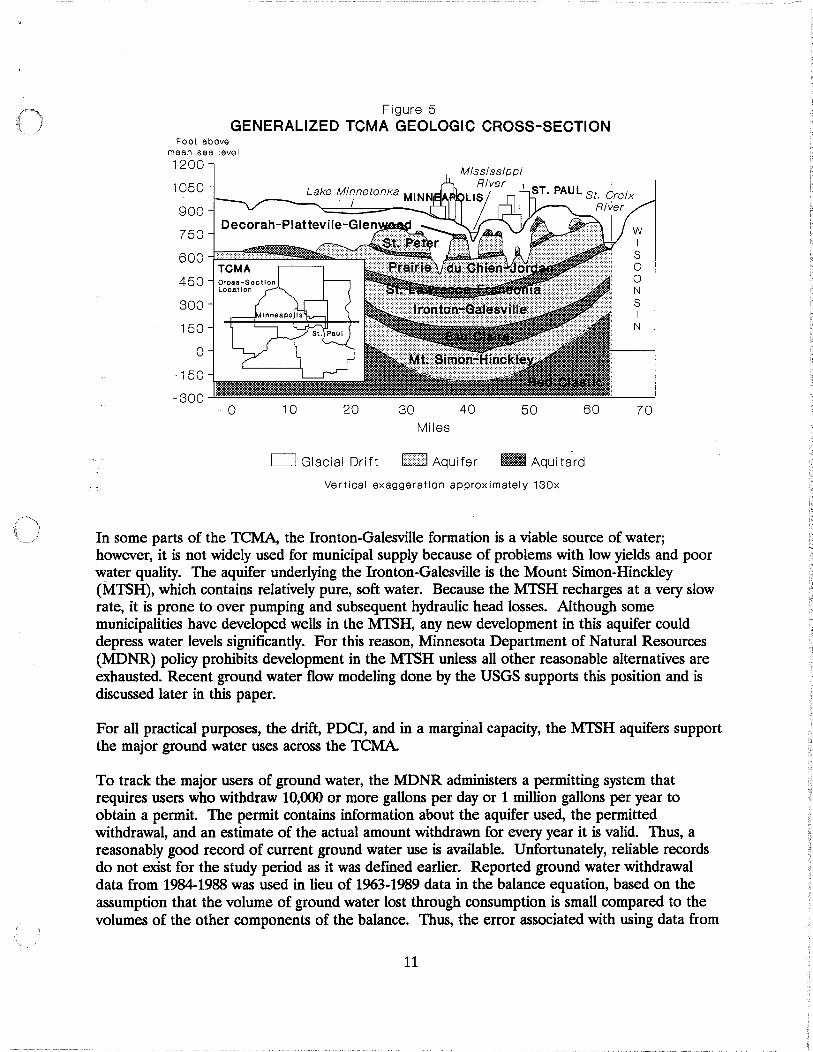
Figure 5GENERALIZED TCMA GEOLOGIC CROSS-SECTION
70605030 40Miles
2010o
Feet abovemean sea level
1200
1050
900
750
600~~~~450
300
150
o-150
-300
o Glacial Drift II Aquifer _ Aquit~rd
Vertical exaggeration approximately 130x
In some parts of the TCMA, the Ironton-Galesville formation is a viable source of water;however, it is not widely used for municipal supply because of problems with low yields and poorwater quality. The aquifer underlying the Ironton-Galesville is the Mount Simon-Hinckley(MTSH), which contains relatively pure, soft water. Because the MTSH recharges at a very slowrate, it is prone to over pumping and subsequent hydraulic head losses. Although somemunicipalities have developed wells in the MTSH, any new development in this aquifer coulddepress water levels significantly. For this reason, Minnesota Department of Natural Resources(MDNR) policy prohibits development in the MTSH unless all other reasonable alternatives areexhausted. Recent ground water flow modeling done by the USGS supports this position and isdiscussed later in this paper.
For all practical purposes, the drift, PDCJ, and in a marginal capacity, the MTSH aquifers supportthe major ground water uses across the TCMA
To track the major users of ground water, the MDNR administers a permitting system thatrequires users who withdraw 10,000 or more gallons per day or 1 million gallons per year toobtain a permit. The permit contains information about the aquifer used, the permittedwithdrawal, and an estimate of the actual amount withdrawn for every year it is valid. Thus, areasonably good record of current ground water use is available. Unfortunately, reliable recordsdo not exist for the study period as it was defined earlier. Reported ground water withdrawaldata from 1984-1988 was used in lieu of 1963-1989 data in the balance equation, based on theassumption that the volume of ground water lost through consumption is small compared to thevolumes of the other components of the balance. Thus, the error associated with using data from
11
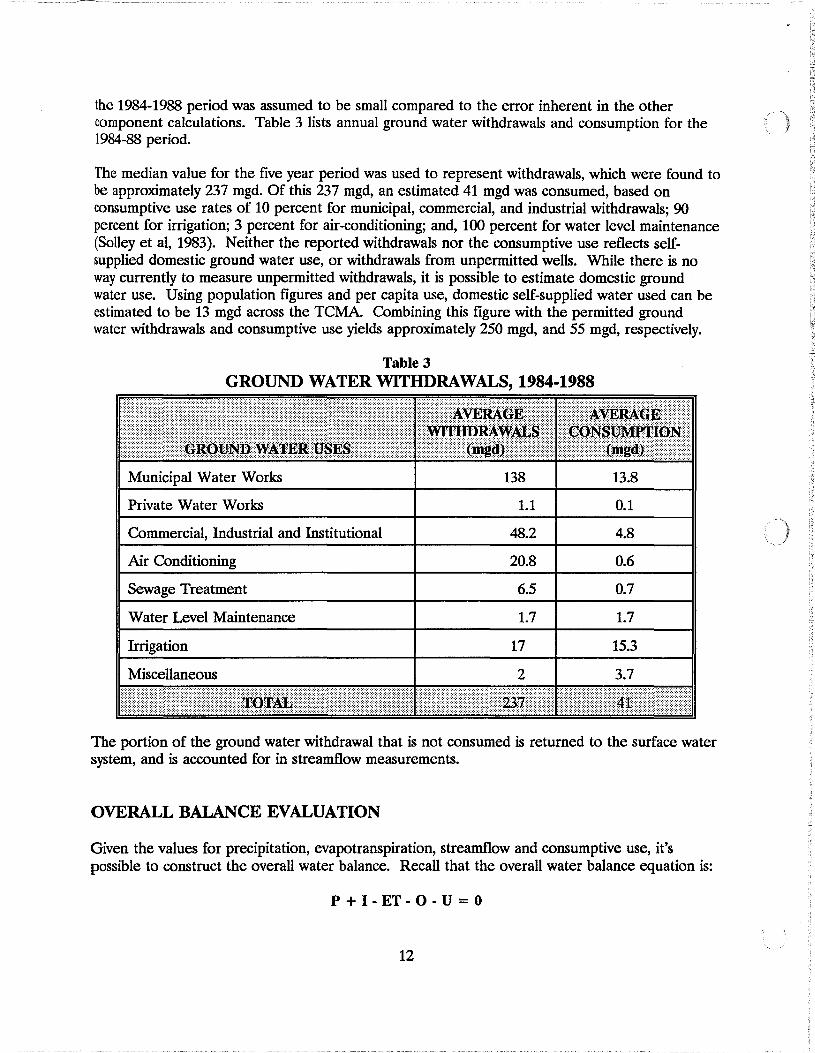
the 1984-1988 period was assumed to be small compared to the error inherent in the othercomponent calculations. Table 3 lists annual ground water withdrawals and consumption for the1984-88 period.
The median value for the five year period was used to represent withdrawals, which were found tobe approximately 237 mgd. Of this 237 mgd, an estimated 41 mgd was consumed, based onconsumptive use rates of 10 percent for municipal, commercial, and industrial withdrawals; 90percent for irrigation; 3 percent for air-conditioning; and, 100 percent for water level maintenance(Solleyet aI, 1983). Neither the reported withdrawals nor the consumptive use reflects selfsupplied domestic ground water use, or withdrawals from unpermitted wells. While there is noway currently to measure unpermitted withdrawals, it is possible to estimate domestic groundwater use. Using population figures and per capita use, domestic self-supplied water used can beestimated to be 13 mgd across the TCMA Combining this figure with the permitted groundwater withdrawals and consumptive use yields approximately 250 mgd, and 55 mgd, respectively.
Table 3GROUND WATER WITHDRAWALS, 1984-1988
!;!:!:!::!!::!:ii:~J!!lllii:·llli:iiii:iii:·:··::::::~_&G~:··
:!:IUIIIIIIIIIIIIII:I :·:~IIII'~llr:::Municipal Water Works
Private Water Works
Commercial, Industrial and Institutional
Air Conditioning
Sewage Treatment
Water Level Maintenance
Irrigation
Miscellaneous
138
1.1
48.2
20.8
6.5
1.7
17
2
13.8
0.1
4.8
0.6
0.7
1.7
15.3
3.7
The portion of the ground water withdrawal that is not consumed is returned to the surface watersystem, and is accounted for in streamflow measurements.
OVERALL BALANCE EVALUATION
Given the values for precipitation, evapotranspiration, streamflow and consumptive use, it'spossible to construct the overall water balance. Recall that the overall water balance equation is:
P+I-ET-O-U=O
12
Substituting in the calculated values yields (in mgd):
4590 + 12660 - 3630 - 13300 - 100 = 220
Ideally, the terms on the left side of the equation should equal zero; however, in thiS equation, aresidual of 220 mgd remains. Because of the propagation of error within the balance calculation,obtaining a zero residual is highly unlikely. Since the residual is small compared to the totaloutflow «2%), it can be assumed that it is not significant.
The overall balance is useful in that it describes the flows needed to maintain a theoreticalequilibrium. These can be compared to the current flows to determine how the system differsfrom steady-state conditions. To determine the current capacities of the surface and groundwater system, a balance was developed for each.
GROUND WATER BALANCE
Ground Water Balance Equation
The ground water system underlying the TCMA can be thought of as a layer cake of aquifers andaquitards~- Figure 5 shows the five principal aquifers, or water-bearing units, along with theaquitards, or confining layers. Although the system consiSts of diScrete layers, it is treatedholistically in the ground water balance because aggregated data was used.
Assuming that ground water inflow to and outflow from the study area is constant, the singleinput to·the ground water system is recharge (R), while ground water withdrawal (W), andleakage to major rivers (L) represent the major outputs. In equation form, the ground waterbalance can be represented by:
R - W - L = ±S·
*Source: Guide Manual for Preparation of Water Balances, U.S. Army Corps of Engineers
The resultant, or (S) term in the equation represents the change in ground water storageassociated with the level of withdrawal identified in the balance. A positive result indicates thatstorage is being repleniShed, while a negative result indicates that storage is being depleted.
Under normal climatic conditions, if the resultant change in storage is negative, more water isbeing pumped from the system than is being replaced. This means that to support the withdrawal,water from storage must be used, causing a lowering of ground water levels and/or reduceddischarge to surface waters. Conversely, if the resultant is positive, more water is being added tothe system than is being pumped out. ThiS translates into an increase in aquifer water levels. Toensure that ground water remains a viable source for water supply, large negative changes instorage should be avoided. To determine what the change in storage is under varying climaticconditions, the ground water balance was evaluated.
13

Study Area
The same study area (Figure 2) was used, as the three main rivers represent major ground waterdivides. It should be noted, however, that the withdrawal data only covers the seven-countyTCMA
Recharge
Recharge to the ground water system occurs through two processes: percolation of surface runoffthrough the soil to the water table, and seepage from lake and stream beds or other aquifers.Either directly, as in the case of the former, or indirectly, in the case of the latter, these processesare dependent on the amount of runoff generated in the watershed. Therefore, to get an idea ofthe amount of recharge emanating within the study area, it is necessary to briefly understand therunoff process.
Runoff is the result of precipitation falling on saturated soil. When the holding capacity of thesoil has been reached, precipitation flows horizontally along the surface and below it, eventuallycollecting in topographic lows. The amount of runoff generated is dependent on the duration andintensity of the precipitation event, and antecedent soil moisture. A short duration, high intensityevent can result in saturation of the uppermost layer of soil, but may not last long enough toallow the precipitation to percolate through the soil. Large amounts of runoff can be the result,despite the fact that the soil is only "temporarily" saturated. This situation commonly occursduring times of drought when soils are extremely dry. Conversely, a long duration, low intensityevent typically results in a more normal runoff regime, with deep percolation of precipitation.
Thus, runoff is a function of both precipitation and evapotranspiration, since evapotranspirationcontrols soil moisture levels. Translating this relationship into an equation yields:
P·ET=TR
where P, ET, and TR represent precipitation, evapotranspiration and total runoff, respectively.Total runoff refers to the maximum amount of water that could become runoff. From thediscussion above, some portion of the total runoff infiltrates the soil and recharges the underlyingaquifers. Unfortunately, there is no way to directly measure the amount of recharge reaching theground water system. Consequently, it is usually determined indirectly.
Over the long term, it can be assumed that ground water recharge is equal to ground waterdischarge. Discharge from the ground water system occurs when the land surface intersects theaquifer system. Examples of common discharge points are wetlands, rivers, springs, and somelakes. Discharge typically occurs in these areas because they are situated in topographic lows,which generally exhibit lower "heads", (piezometric head) or ground water pressures, thantopographic highs.
Figure 6 shows a generalized relationship between discharge and topography for a local flowsystem. In the figure, ground water flow is driven by the difference between the head in theuplands and the lowlands. The flow direction is towards the areas with lower head; consequently,discharge is situated in the lowlands.
14
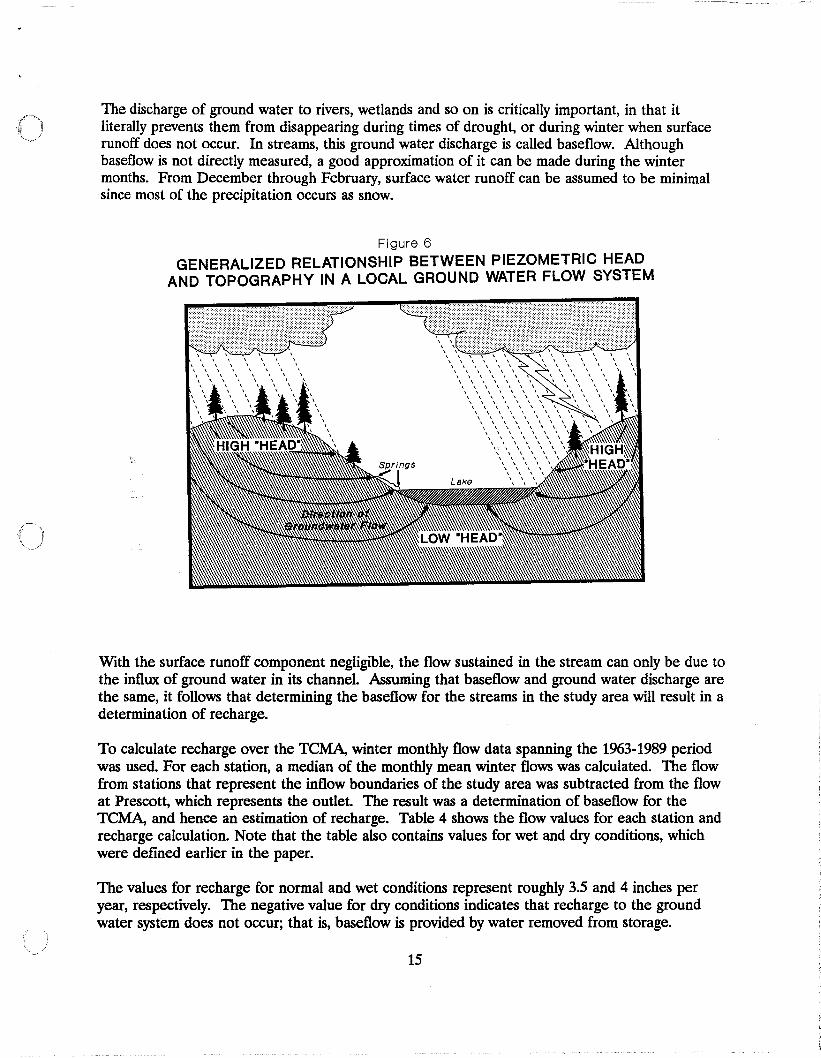
The discharge of ground water to rivers, wetlands and so on is critically important, in that itliterally prevents them from disappearing during times of drought, or during winter when surfacerunoff does not occur. In streams, this ground water discharge is called baseflow. Althoughbaseflow is not directly measured, a good approximation of it can be made during the wintermonths. From December through February, surface water runoff can be assumed to be minimalsince most of the precipitation occurs as snow.
Figure 6
GENERALIZED RELATIONSHIP BETWEEN PIEZOMETRIC HEADAND TOPOGRAPHY IN A LOCAL GROUND WATER FLOW SYSTEM
With the surface runoff component negligible, the flow sustained in the stream can only be due tothe influx of ground water in its channel. Assuming that baseflow and ground water discharge arethe same, it follows that determining the baseflow for the streams in the study area will result in adetermination of recharge.
To calculate recharge over the TCMA, winter monthly flow data spanning the 1963-1989 periodwas used. For each station, a median of the monthly mean winter flows was calculated. The flowfrom stations that represent the inflow boundaries of the study area was subtracted from the flowat Prescott, which represents the outlet. The result was a determination of baseflow for theTCMA, and hence an estimation of recharge. Table 4 shows the flow values for each station andrecharge calculation. Note that the table also contains values for wet and dry conditions, whichwere defined earlier in the paper.
The values for recharge for normal and wet conditions represent roughly 3.5 and 4 inches peryear, respectively. The negative value for dry conditions indicates that recharge to the groundwater system does not occur; that is, baseflow is provided by water removed from storage.
15
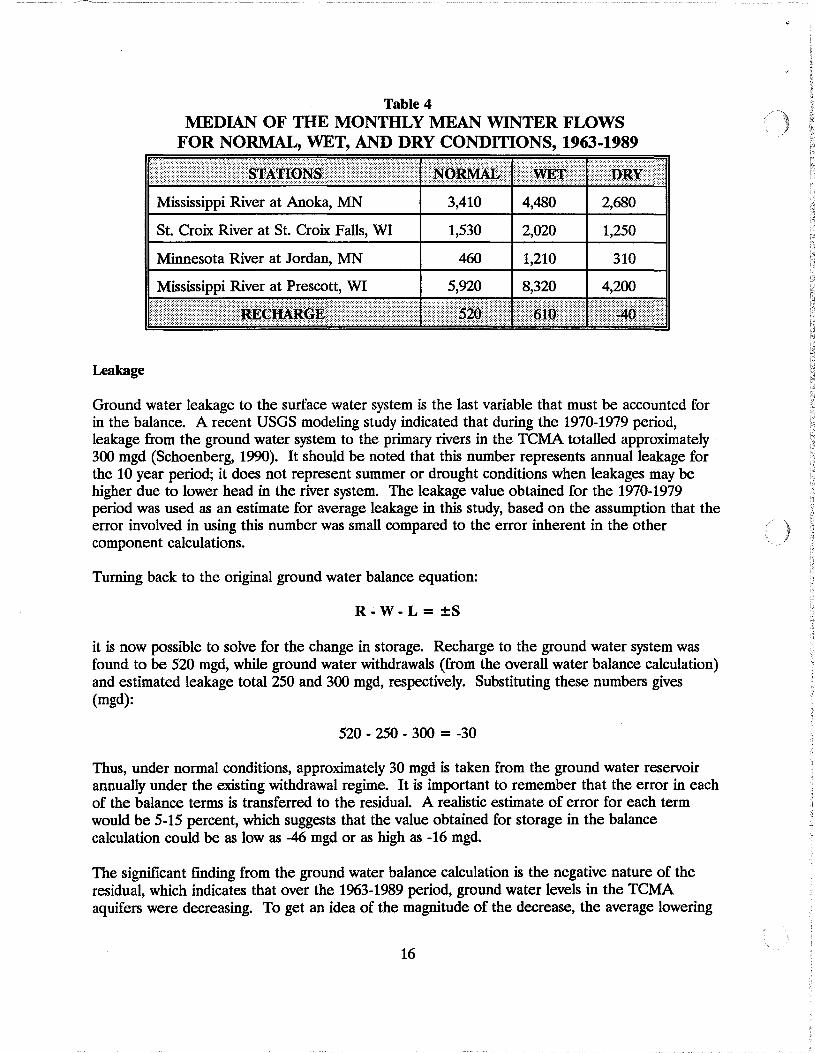
Table 4MEDIAN OF THE MONTHLY MEAN WINTER FLOWS
FOR NORMAL, WET, AND DRY CONDffiONS, 1963-1989
i8_:.·•••Mississippi River at Anoka, MN
St. Croix River at St. Croix Falls, WI
Minnesota River at Jordan, MN
Mississippi River at Prescott, WI
3,410 4,480
1,530 2,020
460 1,210
5,920 8,320
2,680
1,250
310
4,200
Leakage
Ground water leakage to the surface water system is the last variable that must be accounted forin the balance. A recent USGS modeling study indicated that during the 1970-1979 period,leakage from the ground water system to the primary rivers in the TCMA totalled approximately300 mgd (Schoenberg, 1990). It should be noted that this number represents annual leakage forthe 10 year period; it does not represent summer or drought conditions when leakages may behigher due to lower head in the river system. The leakage value obtained for the 1970-1979period was used as an estimate for average leakage in this study, based on the assumption that theerror involved in using this number was small compared to the error inherent in the othercomponent calculations.
Turning back to the original ground water balance equation:
R- W - L = ±S
it is now possible to solve for the change in storage. Recharge to the ground water system wasfound to be 520 mgd, while ground water withdrawals (from the overall water balance calculation)and estimated leakage total 250 and 300 mgd, respectively. Substituting these numbers gives(mgd):
520 - 250 - 300 = -30
Thus, under normal conditions, approximately 30 mgd is taken from the ground water reservoirannually under the existing withdrawal regime. It is important to remember that the error in eachof the balance terms is transferred to the residual. A realistic estimate of error for each termwould be 5-15 percent, which suggests that the value obtained for storage in the balancecalculation could be as low as -46 mgd or as high as -16 mgd.
The significant finding from the ground water balance calculation is the negative nature of theresidual, which indicates that over the 1963-1989 period, ground water levels in the TCMAaquifers were decreasing. To get an idea of the magnitude of the decrease, the average lowering
16

of the water table associated with a storage loss of 30 mgd was calculated. It was found to beclose to an inch, assuming a storage coefficient of 0.3, suggesting that the expected annual drop inwater levels under normal conditions is very small. Thus, over the 1963-1989 period, generallylevel or gentle downward trends in water levels should have occurred.
As a check, long-term hydrographs for observation wells within the TCMA were examined(MDNR, 1989). Figure 7 summarizes the water level trends for the aquifers in the area. Fromthe figure, water levels for the PDCJ are increasing in Dakota and Ramsey county, while inHennepin county they are dropping. The drift is mostly level throughout the area, while theMTSH is trending downward throughout the TCMA Even though in some parts of the TCMAaquifer levels are rising, these increases are canceled by the reductions in others. If the system islooked at from an aggregated viewpoint, the overall trend seems to be for level or slightlydecreasing water levels, which is supported by the findings of the water balance.
20,10111..
10,
CARVER
o,
Figure 7TRENDS IN GROUNDWATER LEVELSIN THE TWIN CITIESMETROPOLITAN AREA
Irm:l
t Upward... Level
... Downward
Ground Water Source
~ Surflolal AQuiferaHfl Prairie du Chien-Jordan_ Mt. Slmon-HlncKley
Ground Water Contamination
Large- and small-scale ground water contamination is a significant problem in the TCMA With atotal of 78 sites currently on the Superfund list (MPCA, 1990), the existing impact on groundwater resources is substantial, and continues to grow. Because contamination effectively"removes" ground water from the potable water supply, it should be accounted for in the groundwater balance as a negative component.
17

By far, the two most common known sources of large scale aquifer contamination by hazardousconstituents are landfills and chemical spills. Of the 78 Superfund sites, 18 are due to "leaky"landfIlls or dumps, and 60 are due to chemical leaks, spills or improper chemical disposal.
Landfills, especially older ones, can contain toxic and hazardous wastes along with municipalrefuse, demolition debris, garbage, etc. When precipitation infiltrates the buried waste, it can mixwith liquids already present and leach harmful compounds from the solid waste. This leachatethen can move into the water table and into underlying aquifers. The leachate forms a plumethat spreads in the direction of ground water flow, becoming larger and less concentrated as itmoves away from the source (Fetter, 1989). Figure 8 shows a cross-section of a typical plumegenerated from a landfIll. The extent of the plume is constrained by the hydraulic characteristicsof the aquifer and the associated confining layers. In this particular case, the plume is stoppedby the river to the east, which provides a flow barrier.
The volume of leachate produced depends on the amount of water percolating through the buriedwaste. In humid climates, more leachate is produced because higher precipitation and soilmoisture levels allow more of the precipitation infiltrating the cover soils to percolate into thesolid waste below. Fortunately, some constituents of this leachate are naturally attenuated as theypass through the soil; however, significant amounts can reach the water table and underlyingaquifers, adversely affecting water supply.
Figure 8
LANDFILL LEACHATE PLUME CROSS-SECTION
UncontaminatedWell
l
·!!::!.··I·...:·'!:::::!:!:::!:::·:!:,:.::::
.~~~,~_ •.:..:.'....:.'.:.:..::.:..::.:::.,.:::..:...:..:::...::'.:.:':::.:'::::::::::.,.,:,::':::1.:1:1.:1::.:1:1.:!:I.:I:::IL...,!..:I...:!..:!...:•..:!.::I..:I:.,:.:..•:.::...:!.•I..~..:·....:I...:.u..::i:.:_~.p..,i..•I.::••,:.,.i.,~.!..:DW:.,!.,!:!.:::!..::.:.!::.::!.:!:I.:,1.·.I..:'.i:..:.ia..::i:...,i.:te.:i!...:i"..•I.•..:I....:I...,I...:I...:I...:I...:•..:•.1...:I...:•.:.,!..:!.
:':::::::::;'/f ;:;::::;::::;: :·:·:·:·::::::::·::::\)f~}jI\\~)?~~~~~\\\\\\\jjj?)\?~~?\~\\\\\~)jj11r~~r~\[\~\j\j\j\1~~:::::: ::( ;:;::: r:~::::(\::: :..::~:~::::::::::~:::::::.:::::::::. ~~~~\~\~\:~ ~f;~;;~;;;~;~):· :::.:.- ':'::::;::::::'. :::::::::: : :.:.:.:}j:~jt~:~:::: :·::~:~r:~:~: ::r~:~:::::::::: ::::::::::::::::::::;:::.:::::::::::.:.:.;.:
18

Ground water contamination due to organic and inorganic compounds is often the result ofimproper disposal of waste chemicals, chemical spills, and leaking underground storage tanks.Fifty-seven of the 78 sites in the TCMA can be attributed to at least one of these three modes ofintroduction. The plumes formed from spills and leaks can be quite complex, because of thedifferent travel times of the various compounds and their chemical properties. The contaminationfront can spread for miles, making it possible for a single plume to affect a large area.
Two well known sites of regional ground water contamination in the TCMA are the Twin CityArsenal and Ammunitions Plant (TCAAP) located in Arden Hills and the Reilly Tar site in St.Louis Park. These are both good examples of contamination due to improper chemical disposaltechniques. In the case of TCAAP, solvents were dumped at the site in areas that were laterfound to be hydrogeologically sensitive. Consequently, regional contamination of the surficial andPDCJ aquifers occurred, and several wells in the area were closed. At the Reilly Tar site,wastewater laden with creosote and other hazardous compounds was discharged directly intomulti-aquifer wells, and also into a nearby wetland, where it infiltrated the ground water system.Contamination of the PDCJ aquifer due to the discharge resulted in the closure of municipalwells in St. Louis Park and Hopkins.
Ground water contamination on a smaller scale is often attributed to leaking underground storagetanks. The Minnesota Pollution Control Agency (MPCA) estimates that 1,400 of the 15,174registered underground storage tanks located in the TCMA are leaking, causing localizedcontamination problems. However, in cases where tanks have been leaking for long periods oftime, extensive plumes of contamination have resulted in regional contamination.
Using hydrologic information provided by the MPCA for 74 of the 78 Superfund sites(information for the other four was not available at the time this paper was being written), it waspossible to make rough estimates regarding the extent of ground water contamination in theTCMAIt should be emphasized that the estimates listed here are very rough approximations.For the purposes of this study, only ground water associated with the Superfund sites wasconsidered, since these sites were the most likely to contain large volumes of ground waterpolluted beyond maximum contaminant levels (MCLs)--the highest concentration of a solute
. permissible in a public drinking water supply.
Table 5 shows the estimated volumes of affected ground water associated with each aquifer. Itshould be noted that the calculation of these volumes entailed using estimated or assumed valueswhen essential data was not provided. For example, if the vertical thickness of an aquifer was notgiven, it was assumed to be 100 feet; when a range of porosities was included, the average wasused; and when a porosity measurement was not given, a value of 0.3 was assumed for the Prairiedu Chien-Jordan, and 0.25 for the Platteville. More information regarding individual sites can befound in Appendix B.
19
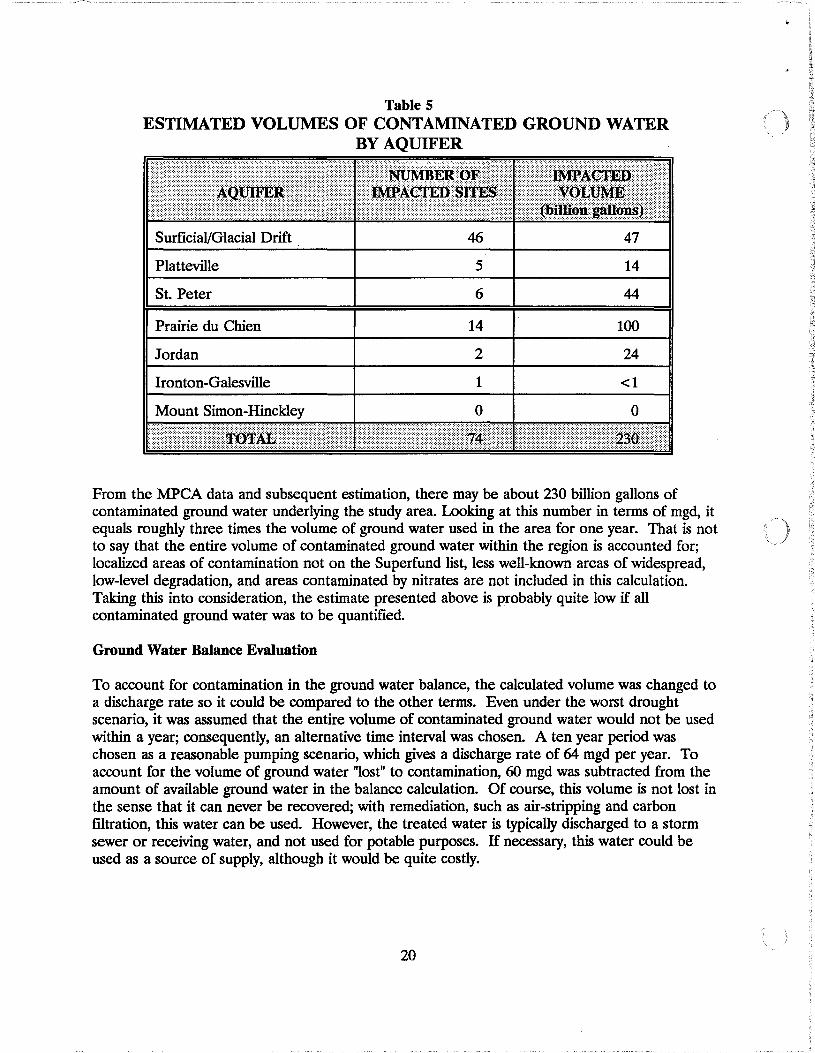
Table 5ESTIMATED VOLUMES OF CONTAMINATED GROUND WATER
BY AQUIFER
Surficial/Glacial Drift _
Platteville
St. Peter
Prairie du Chien
Jordan
Ironton-Galesville
Mount Simon-Hinckley
46
5
6
14
2
1
o
47
14
44
100
24
<1
o
From the MPCA data and subsequent estimation, there may be about 230 billion gallons ofcontaminated ground water underlying the study area. Looking at this number in terms of mgd, itequals roughly three times the volume of ground water used in the area for one year. That is notto say that the entire volume of contaminated ground water within the region is accounted for;localized areas of contamination not on the Superfund list, less well-known areas of widespread,low-level degradation, and areas contaminated by nitrates are not included in this calculation.Taking this into consideration, the estimate presented above is probably quite low if allcontaminated ground water was to be quantified.
Ground Water Balance Evaluation
To account for contamination in the ground water balance, the calculated volume was changed toa discharge rate so it could be compared to the other terms. Even under the worst droughtscenario, it was assumed that the entire volume of contaminated ground water would not be usedwithin a year; consequently, an alternative time interval was chosen. A ten year period waschosen as a reasonable pumping scenario, which gives a discharge rate of 64 mgd per year. Toaccount for the volume of ground water "lost" to contamination, 60 mgd was subtracted from theamount of available ground water in the balance calculation. Of course, this volume is not lost inthe sense that it can never be recovered; with remediation, such as air-stripping and carbonfiltration, this water can be used. However, the treated water is typically discharged to a stormsewer or receiving water, and not used for potable purposes. If necessary, this water could beused as a source of supply, although it would be quite costly.
20

Wet and Dry Ground Water Balance Evaluation
The method used to construct the wet and dry ground water balance was largely the same as thatused to evaluate the normal balance. Recall that earlier in this study, wet conditions were definedby flows from the 75th to 99th percentile. Similarly, dry conditions were characterized by flowswithin the 1st to 24th percentile. Table 6 summarizes the results of the normal, wet, and drybalance calculations.
Table 6NORMAL, WET, AND DRY GROUND WATER BALANCES (MGD)
Normal
Wet
Dry
520
610
-40
250
210
290
60
60
60
300
300
300
-90
40
-690
Note that the withdrawals associated with wet and dry flows differ from normal withdrawals. Thewet and dry figures represent the total withdrawals for 1986 and 1988--1986 being a wet yearaccording to the definition above, and 1988 being a dry year. Also, the leakage term is the samefor all climatic conditions in the table. Although leakages to the river system can be expected tochange with varying climatic conditions, ground water flow modeling (Schoenberg, 1990) indicatesa minimal change in flux between "dry" and "normal" conditions. A representative value for "wet"leakage was not determined from the modeling. Considering the flux change from dry to normalwas small and information regarding ''wet'' leakage was unavailable, the "normal" value was used asan estimate for each condition.
Ground Water Availability
To ensure the long-term viability of the ground water system, a significant negative change instorage should be prevented. It was shown that under normal conditions, the resultant loweringof the water table was on the order of inches. This is clearly not the case under dry conditions, asthe storage loss is an order of magnitude more. This necessarily translates into a much greaterhead loss throughout the area--on the order of feet instead of inches. This suggests that severalconsecutive drought years could have a serious impact on water levels, which is supported byobservation well data from the 1986-1989 drought (MONR, 1990). Water levels in the primaryaquifers plummeted; though they are currently rising, many have not yet reached pre-droughtlevels.
In terms of water supply, the results of the balance suggest that impact of a long-term (5-10years) drought on the ground water reservoir could be sizable, with the associated recovery periodpossibly spanning decades.
21
SURFACE WATER BALANCE
Surface Water Balance Equation
The surface water balance can be represented by the following equation:
I+LI-ET-U=O*
*(Source: Guide Manual for Preparation of Water Balances, U.S. Army Corps of Engineers)
where I, LI, ET, U, and 0 represent stream inflow from outside the study area, stream andground water inflow from within the study area, evapotranspiration from the stream valley,consumptive use, and stream outflow from the study area, respectively.
Study Area
The study area consists of the Mississippi, S1. Croix, and Minnesota River valleys.
Surface Water Balance Evaluation
From the overall balance calculation, stream inflow, consumptive use, and stream outflow arealready known. This leaves evapotranspiration and local inflow as unknowns in the surface waterbalance equation. Evapotranspiration from the stream valleys can be estimated by taking thebasin value and applying it to the surface area associated with the river valleys. This calculationyielded a value of approximately 20 mgd.
The local inflow term represents the ground water influx to the major rivers, as well as the flowattributable to the ungaged tributary streams and creeks within the TCMA To determine thelocal inflow, the terms of the balance equation can be rearranged to solve for local inflow:
LI=O+ET+U-I
Substituting in the appropriate values yields (mgd):
660 = 13300 + 20 + 40 - 12700
Of the 660 mgd, at least 520 mgd can be considered ground water inflow (see previouscalculation), while the remainder can be attributed to small stream inflows.
Wet and Dry Surface Water Balance Evaluation
The surface water balance for wet and dry conditions was constructed in the same fashion as thenormal surface water balance. Wet and dry years were selected according to the criteria discussedearlier in the paper.
Although precipitation information was not used directly in the surface water balance calculation,it was used to check the reasonableness of the "wet" and "dry" evapotranspiration calculation.Precipitation records for 11 USWB stations were used to calculate mean annual precipitation for
22

wet and dry conditions (MDNR, 1990). 18.6 inches, or 2,885 mgd, and 33.9, or 5,259 mgd,respectively, represent the mean annual amount of precipitation that typically falls during dry andwet years within the TCMA 18.6 inches is 40% less than the normal value of 29.6 inches, while33.9 inches represents an increase of 13%.
Evapotranspiration was determined according to the Thornthwaite method for the 11 USWBstations identified above. 16.7 inches (2,592 mgd), and 24.8 inches (3,849 mgd) represent dry andwet conditions, respectively. These figures represent a departure from the calculated normalvalue of approximately -6.5 inches (dry), and +1.2 inches (wet).
Stream inflow and outflows were determined using the same methodology as in the "normal"water balance. Table 7 summarizes the results of the normal, wet and dry surface water balanceevaluation.
Table 7NORMAL, WET, AND DRY SURFACE WATER BALANCES
Normal
Wet
Dry
12,700
15,200
7,900
660
2,500
900
20
16
24
44
50
53
13,300
17,600
8,800
The local inflow term for the "normal" condition seems to be low when compared to the "dry"value. The most likely reason for the disparity is the propagation of error within the balancecalculation. Using error estimations provided previously, the inflow value could contain an errorof roughly 35 percent. This means that for the "normal" balance, the inflow could be between 430and 900 mgd; similarly, the "dry" inflow could range from 575 to 1,200 mgd. Historical flow datafor the study area (USGS, 1990) indicates that local inflows for drought periods such as the 19308are typically on the low side of the range identified in the balance. "Normal" flows, such as thoseexperienced during the early 19808 fall into the high end of the balance range. This suggests thatthe "dry" local inflow value calculated in the balance is probably higher than it should be, and thatthe "normal" value is probably lower than that of a typical year.
Another possible factor contributing to the higher local inflow value under the "dry" condition isthat during drought the head in rivers is reduced, which can cause increased ground water leakageto streams. Whether or not this occurs is governed by the response of ground water levels.Typically, there is a lag time between the onset of drought impacts on the surface water systemand on the ground water system. If ground water levels are relatively high, e.g. at the beginningof a dry period, higher leakages may occur.
Surface Water Availability
The amount of water leaving the study area can be thought of as the maximum amount of surfacewater available. From the surface water balance under normal conditions, this number is more
23

than 13,000 mgd and is reflected in the outflow at Prescott. The balance shows that most of thewater entering the TCMA passes through it. It could be used as a source of supply withoutaffecting the surface water system. Figure 9 illustrates this concept.
Figure 9WATER BALANCE
INFLOW OUTFLOW
The balance ualnll the entire outflow (0)_
INFLOW OUTFLOW
The increased use component causes the outflow to be reduced, but the balance is unaffectedbecause the volume of output is the same.
While much of this outflow could theoretically be consumed, realistically, some constraints on theuse of this water exist. Each of the major rivers has at least one wastewater treatment plant thatrelies on the river for effluent discharge purposes. Reducing flow in the channel throughincreased consumptive use could have a significant effect on the assimilation capacity of the rivers,particularly during low flow periods. This in turn could trigger in-stream water quality violations,which is an unacceptable outcome.
Another concern that should be explored is the increase in hydraulic gradient near ground waterdischarge points. Pumping could cause the head in the rivers to drop below natural levels. Thiswould establish a steeper gradient, possibly resulting in increased ground water discharge tostreams, and greater recharge. While this would probably not be a problem on the Mississippidue to the constant water levels of the pool elevations, the Minnesota and St. Croix River valleyscould be affected.
Clearly, not all of the outflow can be used because of the concerns listed above, and because ofdownstream needs. A "critical outflow" must be established to serve as a lower limit. Forwastewater assimilation and water quality standards development, the "7QlO"--the minimum sevenday low flow with a recurrence interval of once every ten years--is the critical flow (USGS, 1990).The 7Q10 is the design flow for wasteload allocations. At flows less than the 7Q10, wastewaterdischargers are not required by law to maintain water quality in the receiving stream. They must,however, continue to meet the stringent effluent limitations on their discharges.
To ensure that water quality standards are met in the TCMA and downstream, the 7Q10 atPrescott should not be breached. Looking at the surface water balance calculation, it looks as
24
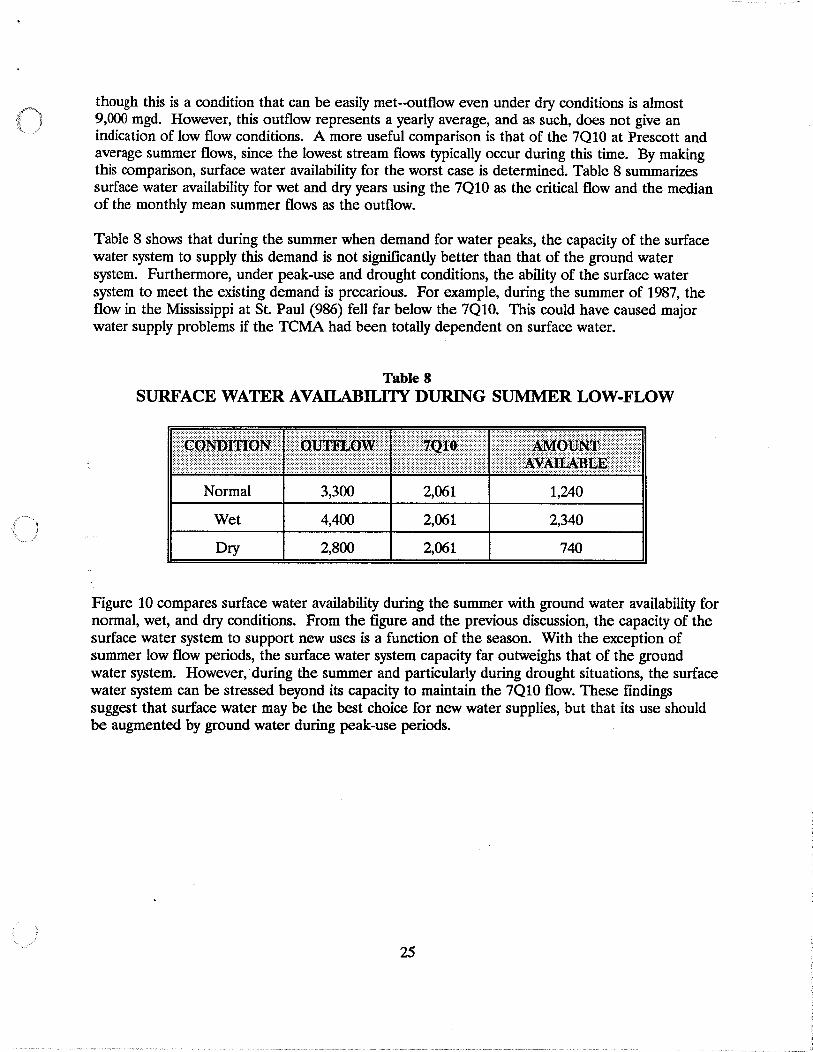
though this is a condition that can be easily met--outflow even under dry conditions is almost9,000 mgd. However, this outflow represents a yearly average, and as such, does not give anindication of low flow conditions. A more useful comparison is that of the 7QlO at Prescott andaverage summer flows, since the lowest stream flows typically occur during this time. By makingthis comparison, surface water availability for the worst case is determined. Table 8 summarizessurface water availability for wet and dry years using the 7Q10 as the critical flow and the medianof the monthly mean summer flows as the outflow.
Table 8 shows that during the summer when demand for water peaks, the capacity of the surfacewater system to supply this demand is not significantly better than that of the ground watersystem. Furthermore, under peak-use and drought conditions, the ability of the surface watersystem to meet the existing demand is precarious. For example, during the summer of 1987, theflow in the Mississippi at 81. Paul (986) fell far below the 7Q10. This could have caused majorwater supply problems if the TCMA had been totally dependent on surface water.
Table 8SURFACE WATER AVAILABILITY DURING SUMMER LOW-FLOW
··················llm21IID:I::::: ...:..1.:•..:.:.:.1..:.:.1...::1..:.· ..1.[.t.[.~.~.~.~.~.~.~.~.~.:.~.·.r.~:.~.~.~ ····:::.t=:X=t:il=:TJ:::::A::OT:::V;··········.\ij:tt*~4p.?f
Normal
Wet
Dry
3,300
4,400
2,800
2,061
2,061
2,061
1,240
2,340
740
Figure 10 compares surface water availability during the summer with ground water availability fornormal, wet, and dry conditions. From the figure and the previous discussion, the capacity of thesurface water system to support new uses is a function of the season. With the exception ofsummer low flow periods, the surface water system capacity far outWeighs that of the groundwater system. However,' during the summer and particularly during drought situations, the surfacewater system can be stressed beyond its capacity to maintain the 7Q10 flow. These findingssuggest that surface water may be the best choice for new water supplies, but that its use shouldbe augmented by ground water during peak-use periods.
25
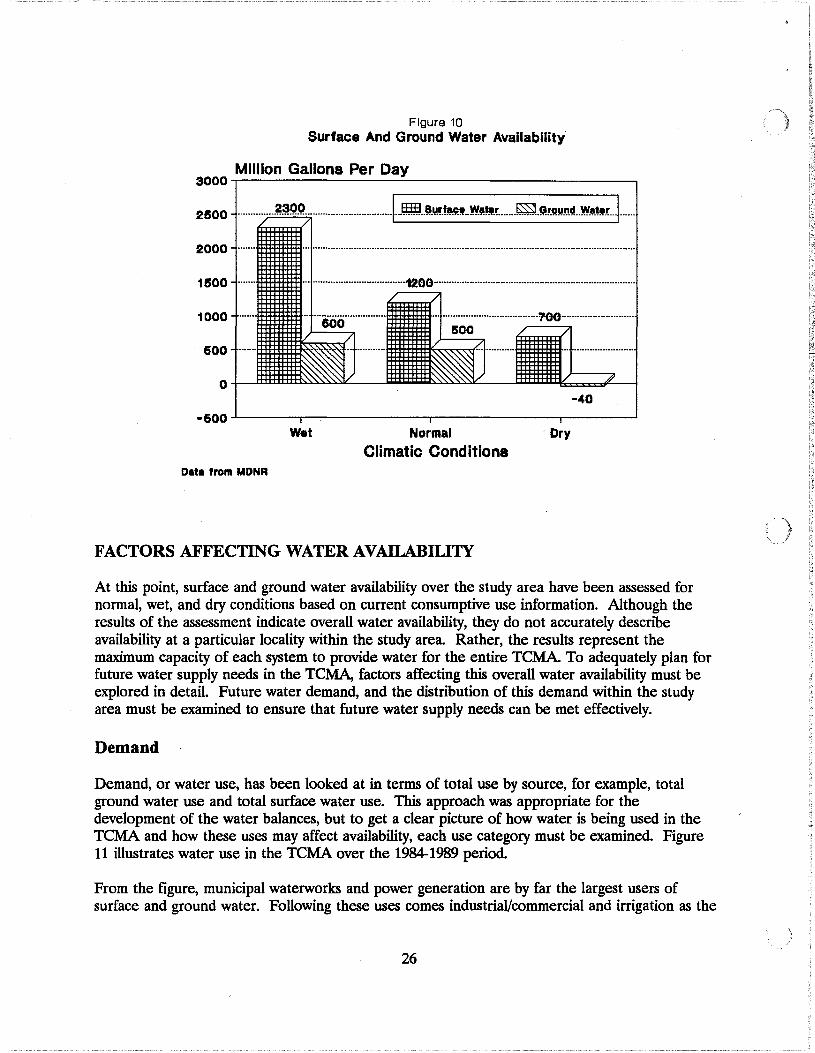
Figure 10Surface And Ground Water Availability
Million Gallons Per Day3000 -r---------......:----------------,
2500 m g~9.9. m···..·············..··I···w;a.·.,.lA~.f~" ..w...~r..m..~.~r9.!!."-!! ..w..~.r···I······
2000
1500
1000
500
o
························..·············1200··········· .
.. ···eoo················lwr··· '10(} .
500
-40-500...J...----,--------,--------,.-------'
Data 'rom MDNR
Wet NormalClimatic Conditione
Dry
FACTORS AFFECTING WATER AVAILABILITY
At this point, surface and ground water availability over the study area have been assessed fornormal, wet, and dry conditions based on current consumptive use information. Although theresults of the assessment indicate overall water availability, they do not accurately describeavailability at a particular locality within the study area. Rather, the results represent themaximum capacity of each system to provide water for the entire TCMA To adequately plan forfuture water supply needs in the TCMA, factors affecting this overall water availability must beexplored in detail. Future water demand, and the distribution of this demand within the studyarea must be examined to ensure that future water supply needs can be met effectively.
Demand
Demand, or water use, has been looked at in terms of total use by source, for example, totalground water use and total surface water use. This approach was appropriate for thedevelopment of the water balances, but to get a clear picture of how water is being used in theTCMA and how these uses may affect availability, each use category must be examined. Figure11 illustrates water use in the TCMA over the 1984-1989 period.
From the figure, municipal waterworks and power generation are by far the largest users ofsurface and ground water. Following these uses comes industriaVcommercial and irrigation as the
26

second and third largest users of water; both these uses are primarily supported by ground water.Residential use is supported by ground and surface water sources, however, the only cities thatuse surface water are Minneapolis and S1. Paul, and the municipalities they supply. Othersignificant uses include air conditioning, and water level maintenance.
Figure 11
Water Use By Category, 1984-1989
Use (mgd)800,---------------------------,
600
F
V1(. •••••••••••••••••••••••••••••••••••••••••••••••••••••••••••••••••••••••••••••••••••••••••••••••••.•..••••••••.•••.•vv
~~ .
iI'
Water- Power Cooling Induat. Waterwork. Level
Irrlg.
:'\ .
o
400 ........................... 7'
~ /.
'" /'/' ~ /:
200 7./'
~ /./: :-.; /.
I§2l8I 1984
~ 1987
IZ2J 1985
IZ2I 1988
w;m 1986
g 1989
Oat. from DNR
Because the TCMA is growing, demand for water is increasing--but not uniformly throughout theuse categories. Some uses are being phased-out, thereby diminishing demand, while others areleveling out as shown in the figure. For example, the Ground Water Protection Act of 1989prohibits the construction of any new once-through air conditioning systems, and mandates aphase-out of existing systems by 2010. From a water availability standpoint, the 23 mgd of groundwater that had been devoted to this use may be available to fulfill other use requirements after2010. Similarly, water level maintenance uses might be phased-out, possibly freeing an additional4 mgd for future use, assuming that this water could be captured completely for other uses.Whether or not this occurs is a function of the position of the wells used for air-conditioning andwater level maintenance, in relation to new wells and the river system.
Examples of uses that should remain constant within the TCMA include power generation andmajor crop irrigation, which together constitute a volume of approximately 44 mgd. This leavesresidential and commerciaVindustrial uses as the only areas in which demand is likely to increase.To get an idea of the magnitude of the increases in these two areas, a statistical model wasdeveloped to forecast water demand. The model is described in detail in Working Paper No.2,"Water Demand in the TCMA". Essentially, the model separates uses into residential andindustriaVcommercial sectors, and forecasts demand based on projections of population for
27

indirect effect of the additional pumpage in the drift and PDCJ was the lowering of water levelsin the MTSH. The lowest water levels occurred in Edina, and in northern Hennepin andsouthern Anoka counties (Schoenberg, 1990).
The second scenario projected a pumping rate of 510 mgd from the PDCJ and the drift, whichrepresents an increase of 260 mgd from present levels. According to the model, the additionalwithdrawal further exacerbated the situation described in scenario one. Water levels in the PDCJwere projected to fall below natural discharge points at the cities mentioned in the first scenario,in addition to Eden Prairie, the Minneapolis Water Works in Fridley, Minneapolis, Energy Parkin St. Paul, and in Roseville. Similarly, water levels in the MTSH dropped in the northernsuburbs of Minneapolis, as well as St. Louis Park, Savage, and Edina due to greater pumpagefrom the aquifer (Schoenberg, 1990).
The third scenario projected a pumping rate of 370 mgd, but shifted the withdrawal from the driftto the MTSH. Thus, the pumpage was confined to the PDCI and MTSH aquifers, as opposed tothe PDCJ and the drift. The results indicated that water levels in the PDCJ could fall belowdischarge points in Burnsville, Bloomington, and the St. Paul Water Utility. MTSH water levelswere lowest at Andover, Maple Grove, and Brooklyn Park, in addition to the cities mentioned inscenario two (Schoenberg, 1990).
The fourth scenario projected pumpage of 670 mgd from the PDCJ and drift aquifers,representing an increase of 420 mgd from existing levels. This scenario approaches "maximum"capacity, since recharge to the system is roughly 500 mgd. Water levels in the PDCJ dropped byas much as 300 feet in the northern portions of Ramsey county as a result of the modeledincrease in withdrawal. A similar decrease was predicted for the MTSH in the Brooklyn Parkarea (Schoenberg, 1990). Table 10 summarizes the results of the four modeling runs.
The ground water flow modeling results suggest that increased withdrawals from the threeaquifers could seriously affect the ability of some areas to obtain sufficient water supplies. Evenminimal increases in pumpage from the PDCJ and drift (Scenario #1) could result in significantlowering of water levels in the southern and northern portion of the developing ring, as well asfor St. Paul. These problems are further aggravated in Scenario #2 by increasing the pumpagerate even further.
In Scenario #3, the shift in pumpage from the drift to the MTSH and the subsequent lowering ofhydraulic head in the aquifer indicates that it is not capable of handling a large increase inpumpage. This could result in problems for the northern and western portions of the area wherethe PDCJ is not available, and the drift is the primary source of supply. If the drift becamecontaminated in these areas, the MTSH would probably not be a viable alternative due toincreased pumping costs.
The final scenario indicates that at a pumping rate close to the maximum capacity of the system,large reductions in hydraulic head occur in the primary aquifers. The largest cone of depressionoccurs over the St. Paul Water Utility.
31
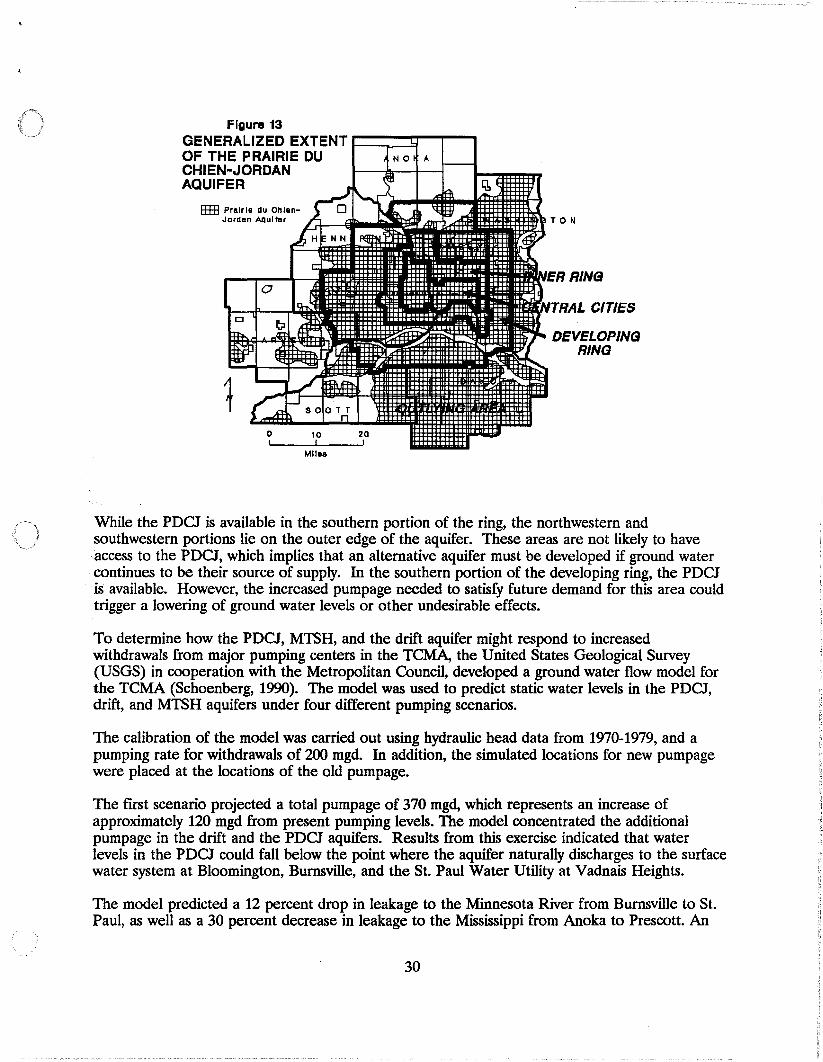
Figure 13GENERALIZED EXTENT ....--'"""l"T-r--....OF THE PRAIRIE DUCHIEN-JORDANAQUIFER
IIE3 Pralrls du Ohlsn- 1111iJordan Aquller n--€jil-1IiilIl 1lI_1IIIf+"~1+ TON
R9IP\IO"'J~ttI-I.
l:R RING
DEVELOPINGRING
1.1IIea
While the PDCJ is available in the southern portion of the ring, the northwestern andsouthwestern portions lie on the outer edge of the aquifer. These areas are not likely to haveaccess to the PDCJ, which implies that an alternative aquifer must be developed if ground watercontinues to be their source of supply. In the southern portion of the developing ring, the PDCJis available. However, the increased pumpage needed to satisfy future demand for this area couldtrigger a lowering of ground water levels or other undesirable effects.
To determine how the PDCJ, MTSH, and the drift aquifer might respond to increasedwithdrawals from major pumping centers in the TCMA, the United States Geological Survey(USGS) in cooperation with the Metropolitan Council, developed a ground water flow model forthe TCMA (Schoenberg, 1990). The model was used to predict static water levels in the PDCJ,drift, and MTSH aquifers under four different pumping scenarios.
The calibration of the model was carried out using hydraulic head data from 1970-1979, and apumping rate for withdrawals of 200 mgd. In addition, the simulated locations for new pumpagewere placed at the locations of the old pumpage.
The first scenario projected a total pumpage of 370 mgd, which represents an increase ofapproximately 120 mgd from present pumping levels. The model concentrated the additionalpumpage in the drift and the PDCJ aquifers. Results from this exercise indicated that waterlevels in the PDCJ could fall below the point where the aquifer naturally discharges to the surfacewater system at Bloomington, Burnsville, and the St. Paul Water Utility at Vadnais Heights.
The model predicted a 12 percent drop in leakage to the Minnesota River from Burnsville to St.Paul, as well as a 30 percent decrease in leakage to the Mississippi from Anoka to Prescott. An
30

residential use and number of employees for commercial/industrial use. A forecast of overalldemand for residential and commercial/industrial sectors was made for 2000 and 2010, as well asseparate forecasts for the 111 cities within the TCMA that have municipal water systems.
According to the model, by 2010 overall residential demand will increase by 17% from 1988 levels,which corresponds to an additional 40 mgd. To make up for this increased demand, the amountof available water must reduced by the same increment. Similarly, commercial use is projected torise by 12%, corresponding to an additional 24 mgd. The amount of available water must befurther reduced to balance this loss. Since most of the predicted growth will be in communitiesserved by ground water, it is likely that the increases in demand will be focused on the groundwater reservoir.
Table 9 shows how the projected residential and commercial/industrial demand increases for 2000and 2010 would affect surface and ground water availability for normal, wet, and dry conditions ifthey were focused entirely on either system. The forecasts indicated that from 1988 to 1990,demand would increase by approximately 17 mgd. This volume was subtracted from the amountavailable in 1988 to show the "new" amount available for 1990. Similarly, from 1990 to 2000demand was projected to increase by roughly 29 mgd, thereby reducing the amount available in2000 by an additional 29 mgd. Finally, from 2000 to 2010, an increase of 18 mgd was projected,which reduced the amount available in 2010 by 18 mgd. Because there is no way of accuratelypredicting what portion of this additional demand will be focused on the surface or ground watersystem, it was assumed that the entire demand would be satisfied by either one or the other.
In doing this calculation, it was also assumed that the only significant increases in water demandwould occur in the residential and commercial/industrial use sectors. The variation in demand forthe other use categories was assumed to be insignificant when compared to the increasesresidential and commercial/industrial demand.
Table 9PROJECTED WATER AVAILABILITY:
GROUND AND SURFACE WATER SYSTEMS
GW Normal 520 503 474 456
GW Wet 610 593 564 546
GW Dry -40 -57 -86 -104
SW Normal * 1,240 1,223 1,194 1,176
SW Wet * 2,340 2,322 2,293 2,275
SW Dry * 740 723 694 676
* Indicates median of the monthly mean summer flows.
28

From the table it can be seen that while each system is capable of handling the increased demand,the ground water system would be significantly stressed during dry periods if the entire demandincrease were focused on it.
Demand Distribution
The overall forecasts suggest that under normal conditions, the demand for water can be easilymet. However, this overall forecast does not concentrate the demand where it actually occurs-rather, it spreads it over the entire TCMA To help identify areas where future demand is likelyto be the heaviest, individual city forecasts were used. From these forecasts, the northern portionof Dakota county, the northeastern portion of Hennepin county, and eastern CarverlwesternHennepin county were identified as areas where major increases in water use were likely to occur.
Figure 12 shows the forecasted increases for each of the areas. The projected increases forBurnsville, Apple Valley, Eagan, and Rosemount account for roughly 46 percent of the totalincrease in water use from 1988-2010. This translates into an increase of about 19 mgd for justthese four cities. The increases for Maple Grove, Brooklyn Park, Brooklyn Center and Plymouthin northeastern Hennepin county are not quite as dramatic, accounting for 30 percent of the totalincrease; while Minnetonka, Chanhassen, and Chaska account for 12 percent. The remaining 100cities in the TCMA account for the remaining 12 percent of the forecasted increase in demand.
The increases noted above are significant, but they are made even more so by the fact that thethree growth centers also occur in areas that rely solely on ground water as their source of supply.To accommodate the projected growth in the region, as many as 160 additional municipal wellsmay have to be developed, based on a rate of 1 new well for every 2,000 additional people servedby the utility (Oberts et aI., 1990). Figure 13 shows the "developing ring", which outlines themajor growth areas, and the lateral extent of the region's most productive aquifer, the PDCJ.
Figure 12FORECASTED INCREASES IN WATER USE
Burnsville, Eagan,
46%
Chanhassen, tllllllij;:::Chaska. Minnetonka
12%Rest of Cities
12%
Plymouth, Brooklyn Center,Brooklyn Park, Maple Grove
30%
29

Table 10FLOW MODEL INFORMATION
.gJ!jgl:~.:IQPII§lll·'....•.•....!:..I...•:.·..•....'..•..•..•..1..1..•..•..•.•·...•.•:...1..1••:...•••:..••..•:.••..•.•..••...I.••..!...A..:.•r••.••.•.•.~.•.•••.•·.·.uU·.•.•.•.•.•..·.••.1F.•.D·•.•··.•.•.··Ei.•~.•.•.•.••D.••..•• .••.•.••.••..•.•·.••.•••.••:·•...•:.1..•.•..I.I..•.I..I:•..•.·.I.•·..:.·:•...•.!..•.•.:.•:•.:!:.:.: ..•:•.:·:•.•·.1:•..:•.:1:•.:1:•.:1.:••••.:••.•·...••.••...I.:•.:•.:.:AE.:.:.:.:••••. :.·.•.•..••:.!.:.:••.:..•..:•.·.'•.•u.:.E·.••.•:·.•v..c•.•.•.••.••.••·.•·...••..•.·.S'.E·.••.••·.•.•.•U•.:•.:•.:•.::.·.•·.:•.:
i:.:.•·:1 .• :•.•:•.•.1·.•.•.•.•.••.•••.•••. :.:•••••••••••
$CENAlUQ$>IN~SJi...vLuc ~
#1
#2
#3
#4
120 mgd
260 mgd
120 mgd
420 mgd
Drift, PDCJ
Drift, PDCJ
PDCJ, MTSH
Drift, PDCJ
Bloomington,Burnsville, St. Paul
Same as Scenario #1,plus Minneapolis, EdenPrairie, Roseville
Same as Scenario #1,plus Andover, MapleGrove and BrooklynPark.
Same as Scenario #1,plus New Brighton,Blaine, Coon Rapids,Vadnais Heights.
The modeling results also suggest that well distribution is an important factor in obtaining groundwater at the least possible cost. Increases in pumpage were placed in existing pumping centers tosimulate wellfield conditions. The modeling shows that large cones of depression surroundingthese areas can be expected to develop as a result of the increased withdrawals. This implies thatinstead of concentrating a number of wells in one area, an even distribution of wells should bedeveloped. By doing this, the formation of the large cones could be circumvented, thus reducingpumping costs.
A final conclusion that can be drawn from the modeling runs is that if additional water suppliesmust be obtained from the MTSH aquifer instead of the drift, the MTSH could be seriouslyaffected.
As a follow-up to the initial modeling done by the USGS, the Council is currently developing aflow model that will target the problem areas identified in the USGS effort. The first stage of thecurrent modeling is focused on the drift aquifer in Maple Grove and Brooklyn Park; the objectiveis to determine whether the drift is capable of supplying the projected demand. This stage isnearing completion and the results will be published in the near future. The next stage will be todevelop a similar model for western Hennepin and eastern Carver counties. Eventually, aworking model for the entire aquifer system will be developed to help guide water supplydevelopment and management.
Clearly, both demand and the distribution of this demand are critical factors in determining wateravailability. It has been shown that although the projected demand for the next 20 year period issmall compared to the 520 mgd currently available from the entire regional ground water system,the fact that the increased demand will probably be focused in areas where the ground water
32
system is least capable of handling the demand magnifies the negative effects of this smallwithdrawal.
CONCLUSIONS
The water balance calculations indicate the TCMA has surplus of water available to meet futuredemand, but the use of this water is constrained by several factors. Although the surface watersystem on the whole can produce much more water than the ground water system, during criticalsummer low flow, it cannot be relied on to meet any increase in demand. This suggests that ifsurface water is looked at as a source of supply, a reservoir system such as in St. Paul, or a groundwater backup would be necessary to ensure sufficient volumes during low-flow periods.
Another constraint on the use of surface water is the possibility of alterations in the hydraulicgradient as a result of pumpage from the rivers, which could cause increased ground waterdischarge to streams and induce increases in recharge. While this would probably not be aproblem given the small increases in demand forecasted for 2010, it could become a concern asdemand increases in the future.
The ground water balance showed that under normal conditions, water levels are dropping--albeitalmost imperceptibly. While a loss in head on the order of inches over the aquifer system couldprobably be considered a tolerable loss, the question remains as to what constitutes an intolerableloss. These kind of limits need to be set so that potential ground water supply problems can beavoided.
The USGS modeling scenarios provide a snapshot of what the future may hold for the arearegarding ground water impacts. The modeling results suggest that even a small increase inground water withdrawals focused in existing pumping centers could reduce water levels in themajor aquifers significantly. As more and more water is pumped from these areas, large cones ofdepression can be expected to develop. This translates into greater energy costs for pumping, inaddition to possible reductions in stream flow in the TCMA.
One way to reduce the likelihood of these kinds of problems is to control the spacing of highcapacity wells. With a more even distribution of wells, hydraulic head losses would not beconcentrated in a small zone, thus reducing the impact on the resource. As an added benefit, thecost of pumping would also be reduced. Another possibility that merits exploration is the sharingof water across municipal boundaries. This concept is developed more fully in Working Paper#4.
Although the discussion provided here and throughout the paper points out several concernsregarding the use of surface and ground water, it is important to keep in mind that there is morethan enough water available to meet forecasted demand. The issue that needs to be addressed ishow this surplus will be managed so that: (1) existing and future withdrawals and uses can bemaintained throughout the year; and (2) minimal impacts are imposed on the surface and groundwater system to ensure long-term viability.
33

REFERENCES
An Analysis of Water Use in Minnesota. St. Paul: Minnesota Department of Natural Resources.1987.
Baker, D.G., Nelson, W.W. and Kuehnast, E.L. "Climate of Minnesota Part XII--The HydrologicCycle and Soil Water." Minnesota Agricultural Experiment Station Technical Bulletin 322.Minneapolis: University of Minnesota. 1979.
Climatologic data obtained from the CLIMON database. St. Paul: Minnesota Department ofNatural Resources. 1990.
County base maps generated from MINNMAP software, developed by the State ClimatologyOffice. Minnesota Department of Natural Resources. 1990.
Delin, G.N. and Woodward, D.G. Hydrogeologic Setting and Potentiometric Surfaces ofRegional Aquifers in the Hollandale Embayment, Southeastern Minnesota. U.S. GeologicalSurvey Water-Supply Paper 2219. 1985.
Fetter, C.W. Applied Hydrogeology. 2nd ed. Columbus, Ohio: Merrill Publishing Co. 1988.
Golden Software, Inc. P.O. Box 281, Golden, Colorado 80402.
Handbook of Applied Hydrogeology. ed. V.T. Chow. McGraw-Hill, Inc. 1964. pp. 11-1, 14-49.
Hartsoe, J.A Water Demand in the Twin Cities Metropolitan Area. St. Paul: MetropolitanCouncil. 1991.
Horn, M.A Groundwater-Use Trends in the Twin Cities Metropolitan Area, 1880-1980. U.S.Geological Survey Water Resources Investigations Report 83-4033. 1983.
Kuehnast, E.L., Baker, D.G. and Enz, J.W. "Climate of Minnesota Part VIII--PrecipitationPatterns in the Minneapolis-St. Paul Metropolitan Area and Surrounding Counties." MinnesotaAgricultural Experiment Station Technical Bulletin 301. Minneapolis: University of Minnesota.1975.
Liesch, B. A and Associates. Ground Water Study: Final Report. Prepared for the OnceThrough Usage of Water Steering Committee. 1990.
Metropolitan Area Short-term Water Supply Plan. St. Paul: Metropolitan Council. 1990.
Norvitch, R.F., Ross, T.G. and Brietkrietz, A Water Resources Outlook for the Minneapolis-St.Paul Metropolitan Area. Prepared by the U.S. Geological Survey in cooperation with theMetropolitan Council. 1974.
34
Oberts, G.L. Alternative Sources of Water for the Twin City Metropolitan Area. St. Paul:Metropolitan Council. 1991.
Oberts, G.L., Hartsoe, J.A and Corrigan, S.A Water Supply Planning in the Land of 10.000Lakes. Accepted for presentation at the Symposium of Water Supply and Water Use: 1991 andBeyond. San Diego. June 1991.
Schoenberg, M.E. Effects of Present and Projected Ground-Water Withdrawals on the TwinCities Aquifer System, Minnesota. U.S. Geological Survey Water Resources InvestigationsReport 90-4001. 1990. .
Schoenberg, M.E. "Factors Affecting Water-Supply Potential of the Twin Cities MetropolitanArea Aquifer System." Journal of the Minnesota Academy of Science. 55, No. 1. 1989. p. 8.
Schoenberg, M.E. Water Levels and Water-Level Changes in the Prairie du Chien-Jordan andMount Simon-Hinckley Aquifers, Twin Cities Metropolitan Area, Minnesota, 1971-1980. U.S.Geological Survey Water-Resources Investigations Report 83-4237. 1984.
Solley, W.B., Chase, E.B. and Mann, W.B. Estimated Use of Water in the United States in 1980.U.S. Geological Survey Circular 1001. 1983.
Stoner, J.D. and Schoenberg, M.E. Preliminal)' Evaluation of Effects of GroundwaterWithdrawals on Mississippi River Flow Near the Twin Cities Metropolitan Area, Minnesota.Minnesota Water Resources Research Center Special Report No. 18. Minneapolis: University ofMinnesota. 1989. pp. 5-6.
Superfund Permanent List of Priorities as of December, 1989. St. Paul: Minnesota PollutionControl Agency. 1990.
Thornthwaite, C.W. and Mather, J.R. "Instructions and Tables for Computing PotentialEvapotranspiration and the Water Balance." Climatology. 10, No.3. Centerton, N.J.: DrexelInstitute of Technology. 1957.
Understanding Ground Water Level Trends: A Key to Managing Water Use. St. Paul: MinnesotaDepartment of Natural Resources. 1989.
Guide Manual for Preparation of Water Balances. U.S. Army Corps of Engineers. HydrologicEngineering Center. Davis, California. 1980.
U.S. Geological Survey. Hydrologic data obtained from the WAlSTORE database. 1990.
Winter, T.C. "Uncertainties in Estimating the Water Balance of Lakes." Water ResourcesBulletin, Vol. 17, No. 1. American Water Resources Association. February, 1981.
35
APPENDIX A
PRECIPITATION AND EVAPOTRANSPIRATION DATA
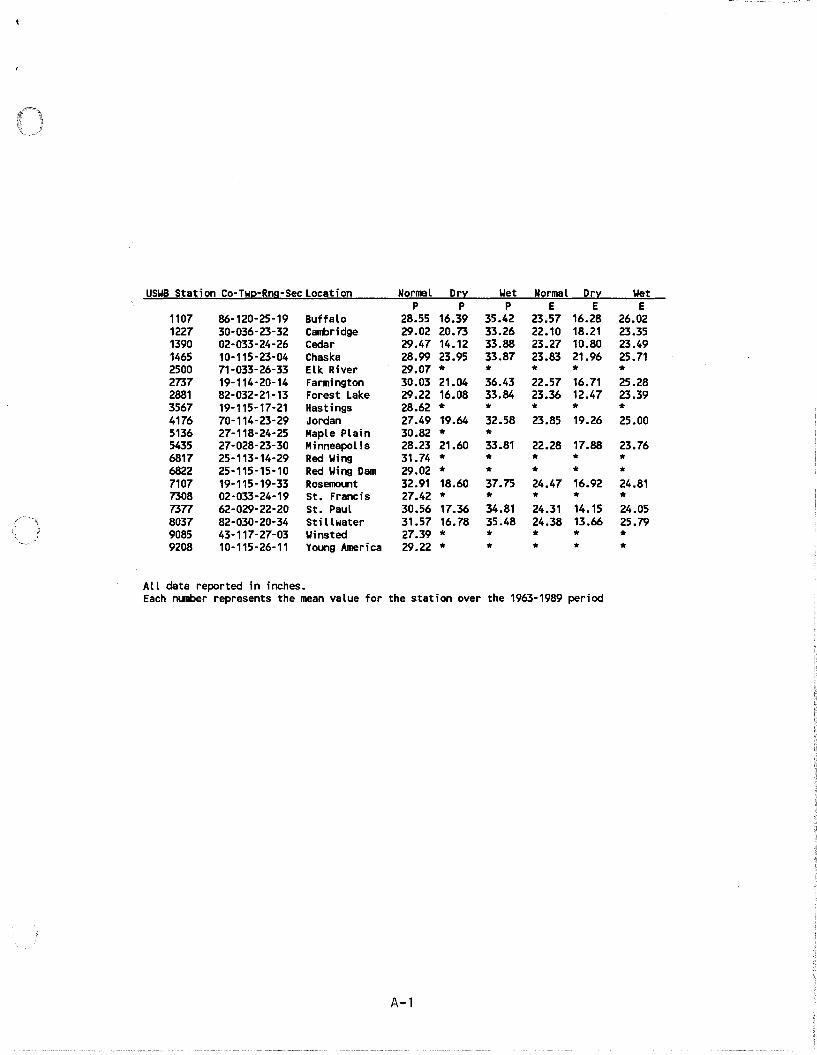
USWB Station Co-Twp-Rng-SecLocation Normal Dry Wet Normal Dry WetP P P E E E
1107 86-120-25-19 Buffalo 28.55 16.39 35.42 23.57 16.28 26.021227 30-036-23-32 CalJt)ridge 29.02 20.73 33.26 22.10 18.21 23.351390 02-033-24-26 Cedar 29.47 14.12 33.88 23.27 10.80 23.491465 10-115-23-04 Chaska 28.99 23.95 33.87 23.83 21.96 25.712500 71-033-26-33 Elk River 29.07 * * * * *2737 19-114-20-14 Farmington 30.03 21.04 36.43 22.57 16.71 25.282881 82-032-21-13 Forest Lake 29.22 16.08 33.84 23.36 12.47 23.393567 19-115-17-21 Hastings 28.62 * * * * *4176 70-114-23-29 Jordan 27.49 19.64 32.58 23.85 19.26 25.005136 27-118-24-25 Maple Plain 30.82 * *5435 27-028-23-30 Minneapolis 28.23 21.60 33.81 22.28 17.88 23.766817 25-113-14-29 Red Wing 31.74 * * * * *6822 25-115-15-10 Red Wing Dam 29.02 * * * * *7107 19-115-19-33 Rosemount 32.91 18.60 37.75 24.47 16.92 24.817308 02-033-24-19 St. Francis 27.42 * * * * *7377 62-029-22-20 St. Paul 30.56 17.36 34.81 24.31 14.15 24.058037 82-030-20-34 Stillwater 31.57 16.78 35.48 24.38 13.66 25.799085 43-117-27-03 Winsted 27.39 * * * * *9208 10-115-26-11 Young America 29.22 * * * * *
All data reported in inches.Each number represents the mean value for the station over the 1963-1989 period
A-l

APPENDIXB
GROUND WATER CONTAMINATION DATA

/<~:;'~"'"
r \,\. i'<'O-;:::'J
SITE SURF PDCJ STP PLATT JRDN IG POR surfxpor pdcjxpor stpxpor platxpor jrdJxpor igxpor
1 1.ge+06 0.27 5.1e+05 0.0 0.0 0.0 0.0 0.02 6.8e+06 0.30 2.0e+06 0.0 0.0 0.0 0.0 0.03 2.8e+08 0.30 8.4e+07 0.0 0.0 0.0 0.0 0.04 0.30 0.0 0.0 0.0 0.0 0.0 0.05 0.30 0.0 0.0 0.0 0.0 0.0 0.06 8.7e+08 0.30 0.0 2.6e+08 0.0 0.0 0.0 0.07 0.30 0.0 0.0 0.0 0.0 0.0 0.08 1.1e+10 0.30 0.0 3.3e+09 0.0 0.0 0.0 0.09 1.3e+08 0.30 3.9e+07 0.0 0.0 0.0 0.0 0.010 3.0e+08 3.0e+08 0.30 9.0e+07 9.0e+07 0.0 0.0 0.0 0.011 0.30 0.0 0.0 0.0 0.0 0.0 0.012 0.30 0.0 0.0 0.0 0.0 0.0 0.013 4.6e+08 0.30 0.0 1.4e+08 0.0 0.0 0.0 0.014 4.5e+07 6.9e+06 0.30 1.4e+07 0.0 0.0 2.1e+06 0.0 0.015 3.5e+08 3.5e+08 3.5e+08 0.30 1.0e+08 1.1e+08 0.0 0.0 1.1e+08 0.016 2.6e+07 0.35 9.1e+06 0.0 0.0 0.0 0.0 0.017 1.0e+05 0.30 3.0e+04 0.0 0.0 0.0 0.0 0.018 1.2e+06 0.27 3.2e+05 0.0 0.0 0.0 0.0 0.019 1.1e+08 0.37 4.1e+07 0.0 0.0 0.0 0.0 0.020 6.0e+05 6.0e+04 0.30 1.8e+05 1.8e+04 0.0 0.0 0.0 0.021 2.3e+07 0.30 6.9e+06 0.0 0.0 0.0 0.0 0.022 5.6e+08 0.30 0.0 1.7e+08 0.0 0.0 0.0 0.023 1.2e+06 0.30 3.6e+05 0.0 0.0 0.0 0.0 0.024 5.0e+08 0.30 1.5e+08 0.0 0.0 0.0 0.0 0.025 0.30 0.0 0.0 0.0 0.0 0.0 0.0
OJ 26 4.5e+06 0.30 1.4e+06 0.0 0.0 0.0 0.0 0.0I27 0.30 0.0 0.0 0.0 0.0 0.0 0.028 0.30 0.0 0.0 0.0 0.0 0.0 0.029 3.7e+07 0.30 1.1e+07 0.0 0.0 0.0 0.0 0.030 2.2e+08 0.30 6.6e+07 0.0 0.0 0.0 0.0 0.031 0.30 0.0 0.0 0.0 0.0 0.0 0.032 2.3e+08 0.30 6.9e+07 0.0 0.0 0.0 0.0 0.033 1.6e+08 0.30 4.8e+07 0.0 0.0 0.0 0.0 0.034 4.2e+06 0.30 1.3e+06 0.0 0.0 0.0 0.0 0.035 0.30 0.0 0.0 0.0 0.0 0.0 0.036 3.8e+08 3.3e+08 1.3e+08 0.30 1.1e+08 0.0 9.ge+07 3.3e+06 0.0 0.037 1.6e+07 0.30 4.8e+06 0.0 0.0 0.0 0.0 0.038 4.1e+09 0.30 1.2e+09 0.0 0.0 0.0 0.0 0.039 1.8e+08 1.5e+08 0.30 5.4e+07 4.5e+07 0.0 0.0 0.0 0.040 2.0e+08 0.30 6.0e+07 0.0 0.0 0.0 0.0 0.041 3.0e+05 0.25 7.5e+04 0.0 0.0 0.0 0.0 0.042 0.30 0.0 0.0 0.0 0.0 0.0 0.043 3.5e+06 2.1e+07 0.20 7.0e+05 0.0 0.0 5.3e+05 0.0 0.044 1.6e+09 1.8e+10 3.0e+09 0.30 4.8e+08 0.0 5.4e+09 9.0e+08 0.0 0.045 0.30 0.0 0.0 0.0 0.0 0.0 0.046 0.30 0.0 0.0 0.0 0.0 0.0 0.047 1.8e+07 0.30 5.4e+06 0.0 0.0 0.0 0.0 0.048 6.4e+08 1.0e+08 3.5e+09 0.30 1.9e+08 0.0 3.Oe+07 1.1e+09 0.0 0.049 3.5e+07 0.30 1.1e+07 0.0 0.0 0.0 0.0 0.050 0.30 0.0 0.0 0.0 0.0 0.0 0.051 1.0e+09 0.30 3.0e+08 0.0 0.0 0.0 0.0 0.052 1.4e+09 1.2e+10 1.2e+09 1.0e+10 9.6e+07 0.32 4.5e+08 3.8e+09 3.8e+08 0.0 3.2e+09 3.1e+0753 0.30 0.0 0.0 0.0 0.0 0.0 0.054 3.5e+08 0.30 0.0 1.1e+08 0.0 0.0 0.0 0.0
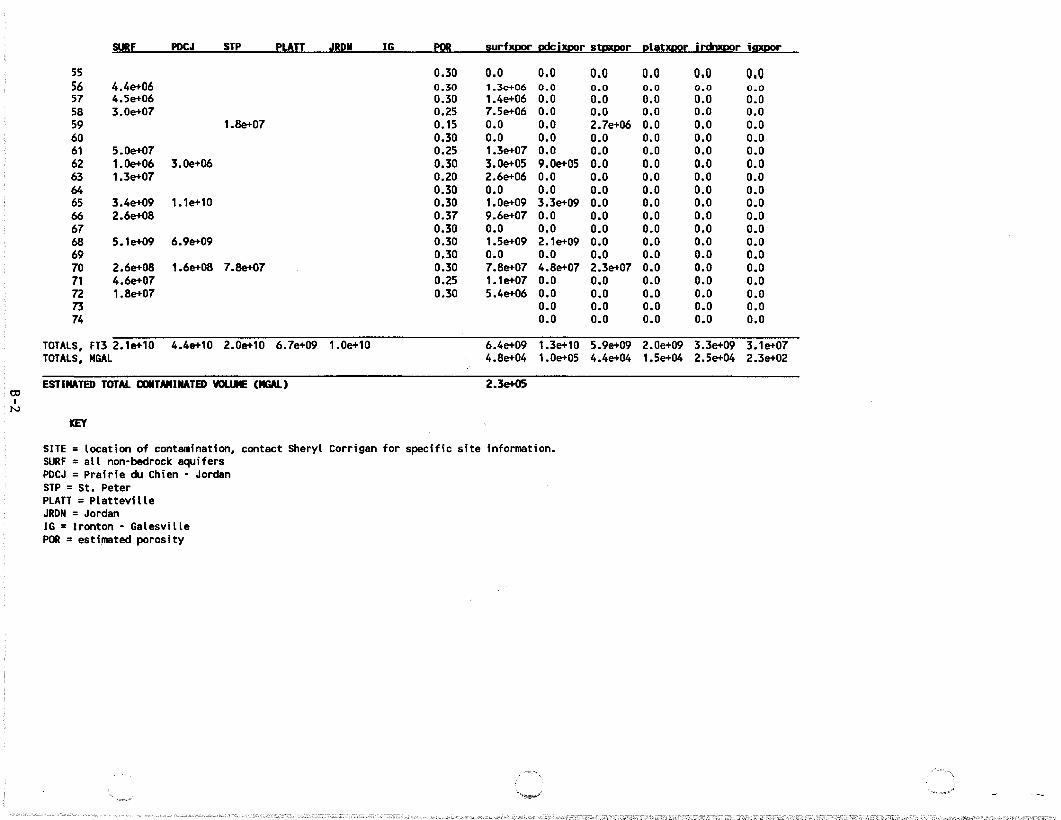
SURF PDCJ STP PLATT JRDN IG POR surfxpor pdcjxpor stpxpor platxpor jrdJxpor isxpor
55 0.30 0.0 0.0 0.0 0.0 0.0 0.0S6 4.4e+06 0.30 1.3e+06 0.0 0.0 0.0 0.0 0.057 4.5e+06 0.30 1.4e+06 0.0 0.0 0.0 0.0 0.058 3.0e+07 0.25 7.5e+06 0.0 0.0 0.0 0.0 0.059 1.8e+07 0.15 0.0 0.0 2.7e+06 0.0 0.0 0.060 0.30 0.0 0.0 0.0 0.0 0.0 0.061 5.0e+07 0.25 1.3e+07 0.0 0.0 0.0 0.0 0.062 1.0e+06 3.0e+06 0.30 3.0e+05 9.0e+05 0.0 0.0 0.0 0.063 1.3e+07 0.20 2.6e+06 0.0 0.0 0.0 0.0 0.064 0.30 0.0 0.0 0.0 0.0 0.0 0.065 3.4e+09 1.1e+10 0.30 1.0e+09 3.3e+09 0.0 0.0 0.0 0.066 2.6e+08 0.37 9.6e+07 0.0 0.0 0.0 0.0 0.067 0.30 0.0 0.0 0.0 0.0 0.0 0.068 5.1e+09 6.9e+09 0.30 1.5e+09 2.1e+09 0.0 0.0 0.0 0.069 0.30 0.0 0.0 0.0 0.0 0.0 0.070 2.6e+08 1.6e+08 7.8e+07 0.30 7.8e+07 4.8e+07 2.3e+07 0.0 0.0 0.071 4.6e+07 0.25 1.1e+07 0.0 0.0 0.0 0.0 0.072 1.8e+07 0.30 5.4e+06 0.0 0.0 0.0 0.0 0.073 0.0 0.0 0.0 0.0 0.074 0.0 0.0 0.0 0.0 0.0
TOTALS, FT32.1e+10 4.4e+10 2.0e+10 6.7e+09 1.0e+10 6.4e+09 1.3e+10 5.9e+09 2.0e+09 3.3e+09 3.1e+07TOTALS, MGAL 4.8e+04 1.0e+05 4.4e+04 1.5e+04 2.5e+04 2.3e+02
ESTIMATED TOTAL CONTAMINATED VOUIE (MGAL) 2.3e+05coI
N
KEY
SITE =location of contamination, contact Sheryl Corrigan for specific site information.SURF =all non-bedrock aquifersPDCJ =Prairie du Chien - JordanSTP =St. PeterPLATT =PlattevilleJRDN =JordanIG =Ironton - GalesvillePOR =estimated porosity
Related Documents