Universität zu Köln Water availability and water demand under Global Change in Benin, West Africa GLOWA Conference Ouagadougou, 25 th – 28 th August 2008 B. Diekkrüger , M. Diederich, S. Giertz, B. Höllermann, A. Kocher, B. Reichert, and G. Steup

Welcome message from author
This document is posted to help you gain knowledge. Please leave a comment to let me know what you think about it! Share it to your friends and learn new things together.
Transcript

Universität zu Köln
Water availability and water demand under Global Change in Benin, West Africa
GLOWA ConferenceOuagadougou, 25th – 28th August 2008
B. Diekkrüger, M. Diederich, S. Giertz, B. Höllermann, A. Kocher, B. Reichert, and G. Steup

Outline
• From local scale knowledge to regional simulation
• From analysis of the current situation to scenario development and quantification
• From water availability to water demand: Is there water scarcity in Benin?
Outline
• From local scale knowledge to regional simulation
• From analysis of the current situation to scenario development and quantification
• From water availability to water demand: Is there water scarcity in Benin?

Why local scale analysis?• to understand the effects of
global change on the hydrological processes
• to be able to develop models which describe the Global Change effects correctly
Approach• local scale gained through
measurements and analysis of processes in the Ara and the Aguima catchments
• transfer of the knowledge to the whole Ouémé basin

Hydrological processes at the local scale
Process studies
Agricultural land use Natural vegetation
Saprolite
Migmatitic basement
Hillwash
e
Saprolite
Hillwash
Plinthite
Lateral processes are important! Processes differ with land use
Giertz et al. HESS 2006

e
Physical-based model on the local scaleSIMULAT- H
Aguima Catchment 16 km²
Modeling water fluxes at the local scale
Giertz & Diekkrüger GEO-ÖKO 2006
0 – 20 cm
30 – 50 cm
measured
simulated
measured
simulated
0
0.5
1
1.5
2
2.5
3
3.5
20.0
6.01
26.0
6.01
02.0
7.01
08.0
7.01
14.0
7.01
20.0
7.01
26.0
7.01
01.0
8.01
07.0
8.01
13.0
8.01
19.0
8.01
25.0
8.01
31.0
8.01
06.0
9.01
12.0
9.01
18.0
9.01
24.0
9.01
30.0
9.01
06.1
0.01
12.1
0.01
18.1
0.01
24.1
0.01
30.1
0.01
05.1
1.01
11.1
1.01
17.1
1.01
disc
harg
e [m
m/d
]
measured simulated
water content
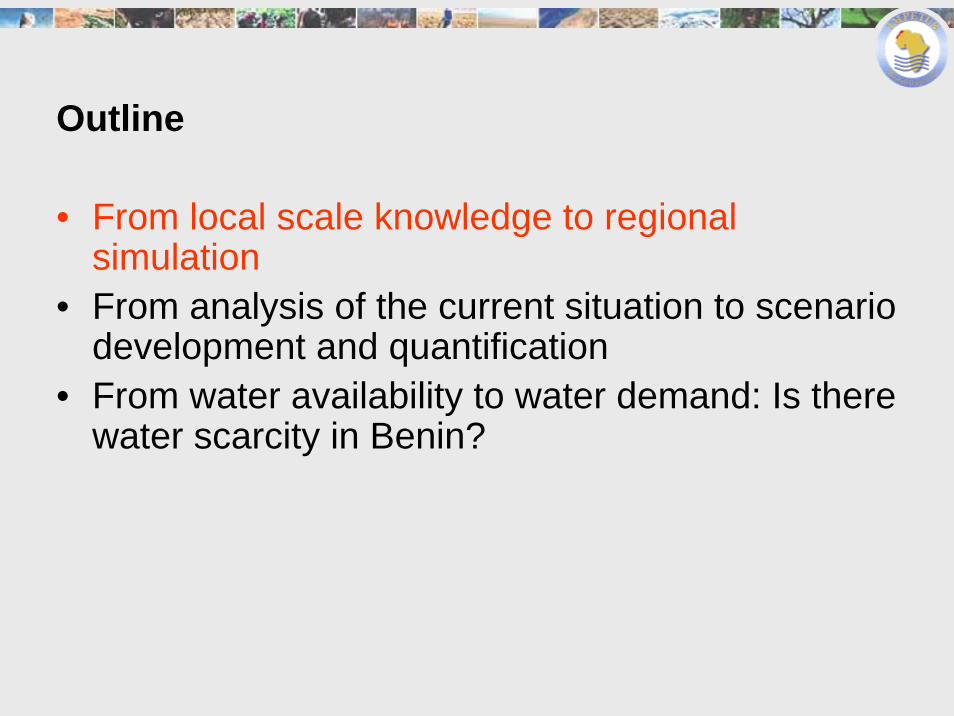
• Conceptual, spatially distributed model with an unlimited numberof HRUs, defined by land use and soil types
• Evapotranspiration: optionally: Penman, Priestley-Taylor, Turc• Surface runoff: SCS curve number• Linear storage for root zone, unsaturated zone and groundwater zone• Surface reservoirs• Inland valleys
Model concept UHP-HRU
Capillary rise
Surface runoff
Percolation
Interception
Evapotranspiration
Interflow Infiltration Root zone
Base flowGroundwater zone
Unsaturated zone
Deep groundwater recharge
Catchment withHRUs

Modeling UHP-HRU Ouémé-Bonou: Validation
Save
Cotonou
Bassila
Parakou
Djougou
Natintingou
¹0 25 50 75 10012.5Kilometers
Rivière
Oueme Bonou
Oueme Save
Oueme Zangnanado
Zou Atcherigbe
Validation Ouémé Save
0
200
400
600
800
1000
1200
1400
1600
07.0
1.19
86
07.0
5.19
86
07.0
9.19
86
07.0
1.19
87
07.0
5.19
87
07.0
9.19
87
07.0
1.19
88
07.0
5.19
88
07.0
9.19
88
07.0
1.19
89
07.0
5.19
89
07.0
9.19
89
07.0
1.19
90
07.0
5.19
90
07.0
9.19
90
07.0
1.19
91
07.0
5.19
91
07.0
9.19
91
07.0
1.19
92
07.0
5.19
92
07.0
9.19
92
07.0
1.19
93
07.0
5.19
93
07.0
9.19
93
m³/s
observedsimulated
Period Surface (km²) R² MEOuémé Save (Cal) 1985-1986 49285 0.9 0.69Ouémé Save (Val) 1996-2003 49285 0.84 0.8Ouémé Zangnanado (Val) 1986-1994 23491 0.64 0.55Zou Atcheribé (Val) 1980-1993 7035 0.84 0.83

Conclusion: from local to regional scale • Knowledge on local scale processes is most important
for inland valley studies, small reservoirs studies as well as agricultural production.
• Local scale knowledge is considered in the Spatial Decision Support Systems
BenIvis Pedro
• Hydrological simulation models for the local and the regional scale have been developed and validated
• These models can be applied for scenario quantification and for Decision Support

Outline
• From local scale knowledge to regional simulation
• From analysis of the current situation to scenario development and quantification
• From water availability to water demand: Is there water scarcity in Benin?

Hydrologisches ModellUHP
SIMULAT-H
climateland use/land cover
hydrologic modelUHP-HRU
soilDEM
surface water resources

Station Parakou - rainfall distribution 1960-2000
0%
10%
20%
30%
40%
50%
<1 mm 1-5 mm 5-10 mm 10-20 mm 20-50 mm 50-100mm
>100 mm
Rainfall amount per day
Frac
tion
of to
tal r
ainf
al
simulated_mean (REMO 6 runs)measured
From climate modeling to hydrological scenarios
100
120
140
160
180
200
220
240
260
280
300
1 2 3 4 5 6 7 8 9 9 10 11 12
REMO901 REMO902 REMO903 measured
[mm
]
• Scale of climate models often do not match the scale of the hydrological models
• For linking mesoscale climate model output to a hydrological model a probability matching concerning amount and frequency distribution is required
• After post-processing the climate model output an one-way coupling of climate and hydrological model possible
Mean Potential Evapotranspiration for Parakou(1979-1993) calculated using the Penman-Monteithequation with simulated REMO-Data and measured data

Simulated climate scenariosOuémé Bonou
0
50
100
150
200
250
1985-1995 1995-2004 2005-2015 2015-2025 2025-2035 2035-2045
[mm
/a]
Simulated usingmeasurements
A1B B1
Renewable water resources

Universität zu Köln
Comparison of renewable water resourcesperiod 1995-2004 and scenario A1B 2035-2045
Save
Cotonou
Bassila
Parakou
Djougou
Natintingou
¹0 25 50 75 10012.5Kilometers
Renewable water ressourcesMean 2035-2045 [mm/y]
40 - 60
61 - 80
81 - 100
101 - 120
121 - 140
141 - 160
161 - 180
181 - 200
201 - 220
221 - 260
261 - 280
281 - 400
Rivers
Save
Cotonou
Bassila
Parakou
Djougou
Natintingou
¹0 25 50 75 10012.5Kilometers
Renewable water ressourcesMean 1995-2004 [mm/y]
40 - 60
61 - 80
81 - 100
101 - 120
121 - 140
141 - 160
161 - 180
181 - 200
201 - 220
221 - 260
261 - 280
281 - 400
Rivers

Conclusion: hydrological scenarios
• The scenarios reveal a significant decrease of available water resources in the Ouémé basin
• Detailed and distributed information on water availability is provided based on a thorough understanding of the processes
• The model is implemented in the Spatial Decision Support System BenHydro which allows to analyze the effects of climate change, land use change, reservoirs etc. on water availability
• Test the SDSS BenHydro
Outline
• From local scale knowledge to regional simulation
• From analysis of the current situation to scenario development and quantification
• From water availability to water demand: Is there water scarcity in Benin?
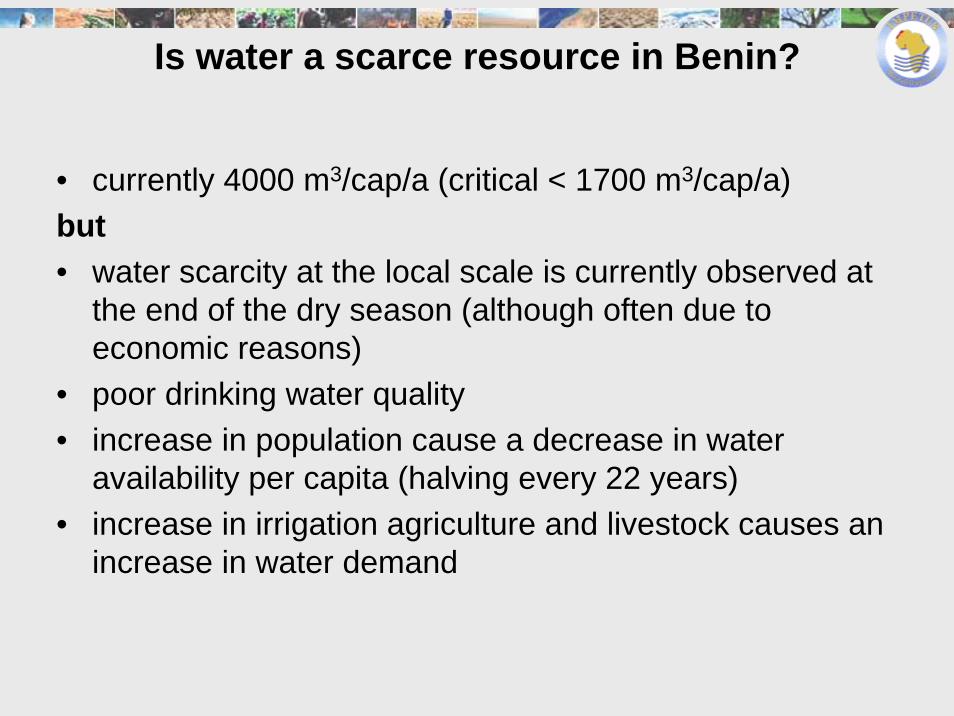
Is water a scarce resource in Benin?
• currently 4000 m3/cap/a (critical < 1700 m3/cap/a)but• water scarcity at the local scale is currently observed at
the end of the dry season (although often due to economic reasons)
• poor drinking water quality• increase in population cause a decrease in water
availability per capita (halving every 22 years)• increase in irrigation agriculture and livestock causes an
increase in water demand
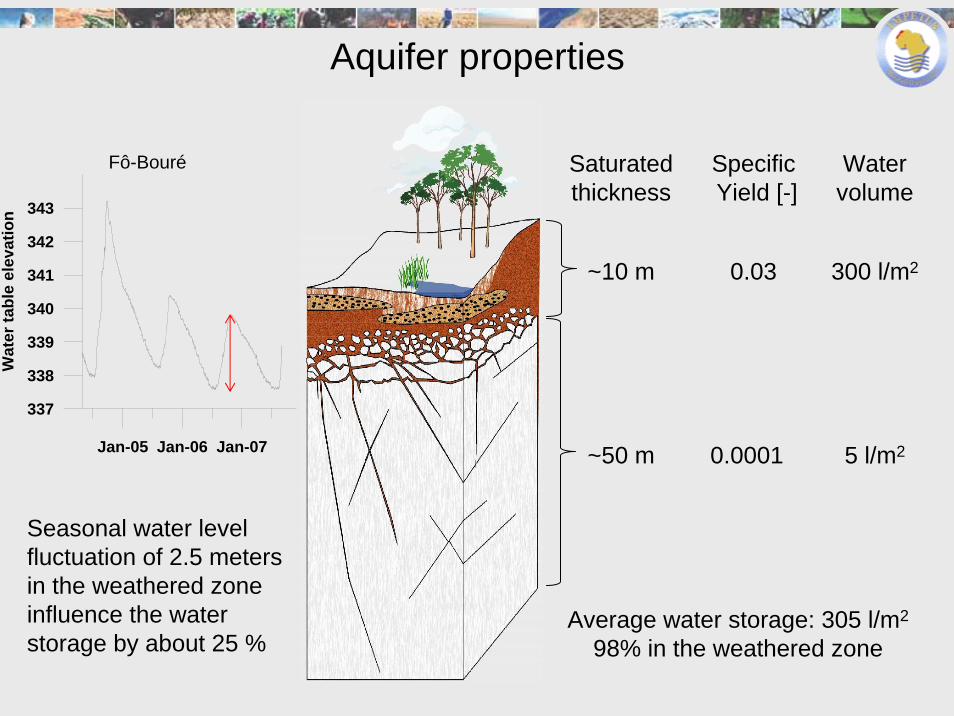
Aquifer properties
~10 m
~50 m
Saturated thickness
Watervolume
Specific Yield [-]
0.03
0.0001Jan-05 Jan-06 Jan-07
337
338
339
340
341
342
343
Wat
er ta
ble
elev
atio
n
Fô-Bouré
Seasonal water level fluctuation of 2.5 meters in the weathered zone influence the water storage by about 25 %
300 l/m2
5 l/m2
Average water storage: 305 l/m2
98% in the weathered zone

Balancing water availability and water demandWEAP: Water Evaluation and Planning System
WEAP is able to• use external simulation results concerning water availability
or use integrated simple hydrological modeling • consider surface water reservoirs• compute water demand considering different sectors
– domestic water use– agricultural water use– industrial water use
and to consider access to water • consider water price development• to compute water quality• …

#
#
#
#
#
#
#
#
#
#
#
#
#
#
%
#
#
%
#
#
#
%
#
#
#
%
#
#
#
%
#
#
#
#
#
#
#
#
%
#
#
##
# %
#
#
#
%
#
#
% #
#
%
#
#
#
%
#
%#%
#
%
#
#
#
#
%
#
%
#
%
#
#
#
%
#
#
#
#
#
%
#
#
#
#
#
#
#
#
%
#
#
#
#
#
#%
# ##
#
#
#
#
#
##
% ##
#
#
##
# #%
#
##
##
###
#
#
#
%
##
#
#
##
#
%
#
##
#
# #
#
#
#
#
%
%
##
#
#
#
#
# #
#
#
#
#
###
#
#
#
#
#
#
#
#
#
#
#
#
#
#
## ##
#
#
#
#
#
#
##
#
#
#
#
#
#
#
#
#
#
#
#
#
#
#
#
#
##
#
#
#
#
##
#
#
##
##
##
###
##
#
#
#
#
#
#
#
#
#
#
#
#
###
#
#
##
###
#
##
##
#
#
#
## #
# ##
##
##
#
#
##
#
#
##
##
##
##
#
#
#
#
##
##
# #
##
#
#
##
##
##
#
#
# #
##
#
#
#
#
#
#
#
#
#
#
%
#
#
#
#
#
#
#
#
##
#
#
#
#
#
#
#
#
#
#
#
#
#
#
#
#
#
#
#
##
#
#
#
#
#
#
#
# #
#
##
#
#
##
#
#
#
##
#
#
#
#
#
#
#
$
$
$
$
#
#
#
#
#
#
#
#
#
#
#
#
#
#
#
#
#
#
#
#
##
##
#
#
#
#
#
#
#
##
#
#
Com
mun
eTc
haou
rou
Com
mun
eO
uess
e
Sub-basin no. 93
Oue
me
catc
hmen
twith
27
sub-
basi
ns
• 27 sub-basins
• 5 departments
• 34 communes
• 32 river segments
• 28 groundwater aquifers
• 188 demand sites
• 4 reservoirs (Djougou, Parakou, Savalou, Savé)
• monthly time steps
Application of WEAP to the Ouémé basin
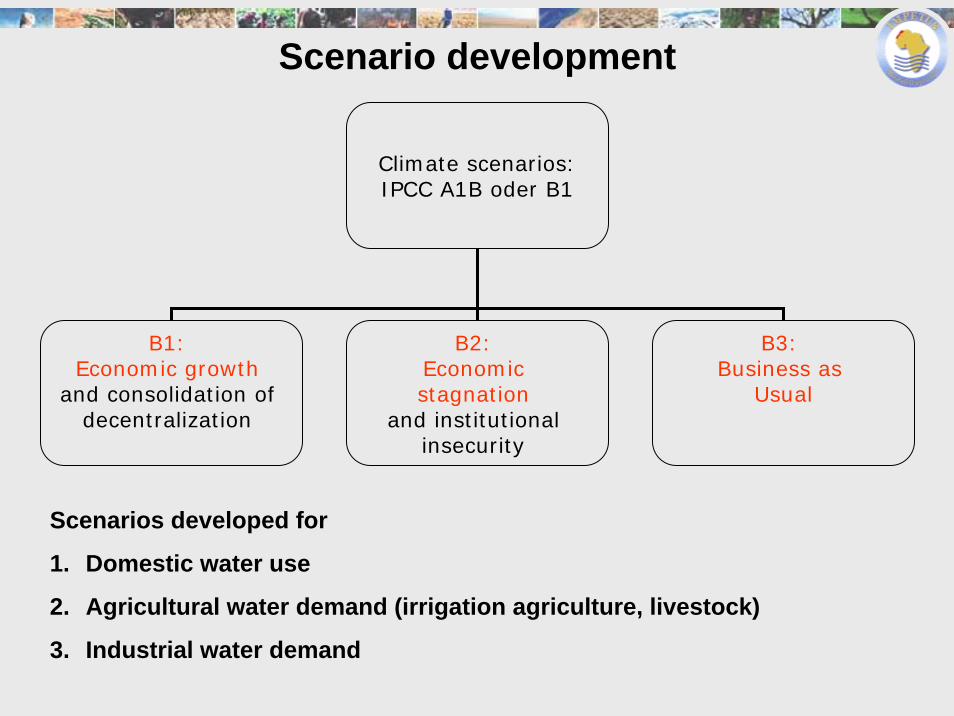
Scenario development
Climate scenarios:IPCC A1B oder B1
B1: Economic growth
and consolidation of decentralization
B2: Economic stagnation
and institutional insecurity
B3: Business as
Usual
Scenarios developed for
1. Domestic water use
2. Agricultural water demand (irrigation agriculture, livestock)
3. Industrial water demand

Water demand per sector and scenario in Mm³/a
0
5
10
15
20
25
30
35
40Ye
ar 2
002
Year
200
5Ye
ar 2
010
Year
201
5Ye
ar 2
020
Year
202
5Ye
ar 2
002
Year
200
5Ye
ar 2
010
Year
201
5Ye
ar 2
020
Year
202
5Ye
ar 2
002
Year
200
5Ye
ar 2
010
Year
201
5Ye
ar 2
020
Year
202
5Ye
ar 2
002
Year
200
5Ye
ar 2
010
Year
201
5Ye
ar 2
020
Year
202
5Ye
ar 2
002
Year
200
5Ye
ar 2
010
Year
201
5Ye
ar 2
020
Year
202
5Ye
ar 2
002
Year
200
5Ye
ar 2
010
Year
201
5Ye
ar 2
020
Year
202
5Ye
ar 2
002
Year
200
5Ye
ar 2
010
Year
201
5Ye
ar 2
020
Year
202
5
Domestic: Rural Domestic: Urban Industry Periurban Irrigation Basfonds Irrigation Large Scale Irrigation Livestock
Scenario B1 Scenario B2 Scenario B3
Scenario
Domestic: Domestic: Industry Periurban Inland Large Livestock Rural Urban Irrigation Valley Scale
Irrigation Irrigation
B1: economic growth B2: economic stagnation B3: business as usual

Total monthly water demand in Mm³mean over 2002 - 2025
B1: economic growth B2: economic stagnation B3: business as usual
0
1
2
3
4
5
6
7
8
9
10
January
Febru
ary
March
April
May
June July
AugustSep
tember
October
November
Decem
ber
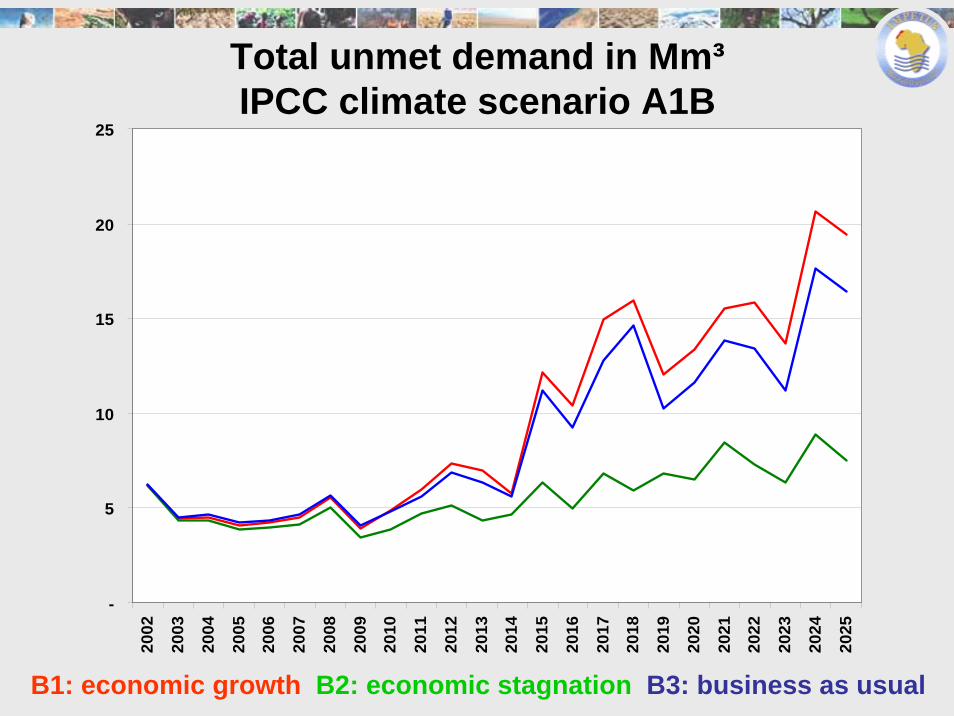
Total unmet demand in Mm³IPCC climate scenario A1B
B1: economic growth B2: economic stagnation B3: business as usual
-
5
10
15
20
2520
02
2003
2004
2005
2006
2007
2008
2009
2010
2011
2012
2013
2014
2015
2016
2017
2018
2019
2020
2021
2022
2023
2024
2025

Unmet demand per sector and scenario in Mm³IMPETUS B1 economic growth with
IPCC climate scenario A1B
-
2
4
6
8
10
12
14
16
18
20
22
2002
2003
2004
2005
2006
2007
2008
2009
2010
2011
2012
2013
2014
2015
2016
2017
2018
2019
2020
2021
2022
2023
2024
2025
Urban Rural Livestock Periurban Irrigation

Total monthly unmet demand in Mm³IMPETUS B1 economic growth with
IPCC climate scenario A1B
0
0.5
1
1.5
2
2.5
3
January
Febru
ary
March
April
May
June
July
AugustSep
tember
October
November
Decem
ber
Scenario B1 A1B 2015 -2025 Scenario B1 A1B 2002 - 2014

Conclusion: water demand• Scenario calculations reveal an
– increase in water demand due to an increase in domestic water use and irrigation agriculture
– increase in total unmet demand (2015 – 2025)
– increase in length of the water scarcity period up to 8 to 10 months with a peak from December to March
– increasing pressure on reservoirs and surface water
• User relying upon groundwater are less affected although groundwater level decreases (economic scarcity possible)
• Test the Spatial Decision Support System BenEau
BenEAU

Conclusion
• The analysis of water availability and water demand reveals that water is one of the key issues for sustainable development in Benin
• The IMPETUS studies are important for supporting the Integrated Water Resource Management process which is currently developing in Benin
• Based on the interdisciplinary modeling approach a number of Spatial Decision Support Systems have been developed which links knowledge gained at different scale with scenario development
• Please visit the poster session and test our SDSS

Thank you for your attention
Universität zu Köln
Related Documents