Water & Atmosphere February 2011 Scrutiny on the Bounty The risks and riches of seabed mining Looking for CLEWS An eye on the sky for Samoa 1080 tests clear Water safe after pest control Seagrass Serengetis Our vanishing fish nurseries Pernicious particles What's in the air you breathe?

Welcome message from author
This document is posted to help you gain knowledge. Please leave a comment to let me know what you think about it! Share it to your friends and learn new things together.
Transcript
Water & AtmosphereFebruary 2011
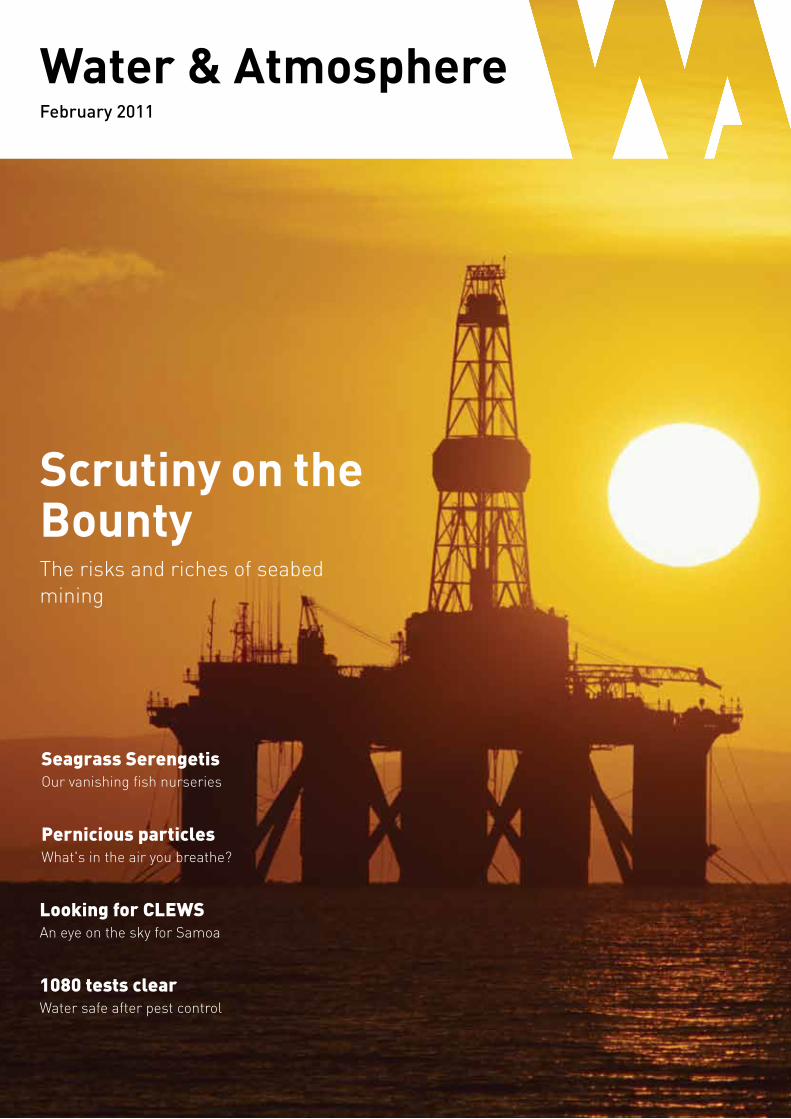
Scrutiny on the BountyThe risks and riches of seabed mining
Looking for CLEWSAn eye on the sky for Samoa
1080 tests clearWater safe after pest control
Seagrass SerengetisOur vanishing fish nurseries
Pernicious particles What's in the air you breathe?
Water & AtmosphereFebruary 2011
Scrutiny on the BountyThe risks and riches of seabed mining
Looking for CLEWSAn eye on the sky for Samoa
1080 tests clearWater safe after pest control
Seagrass SerengetisOur vanishing fish nurseries
Pernicious particlesWhat's in the air you breathe?
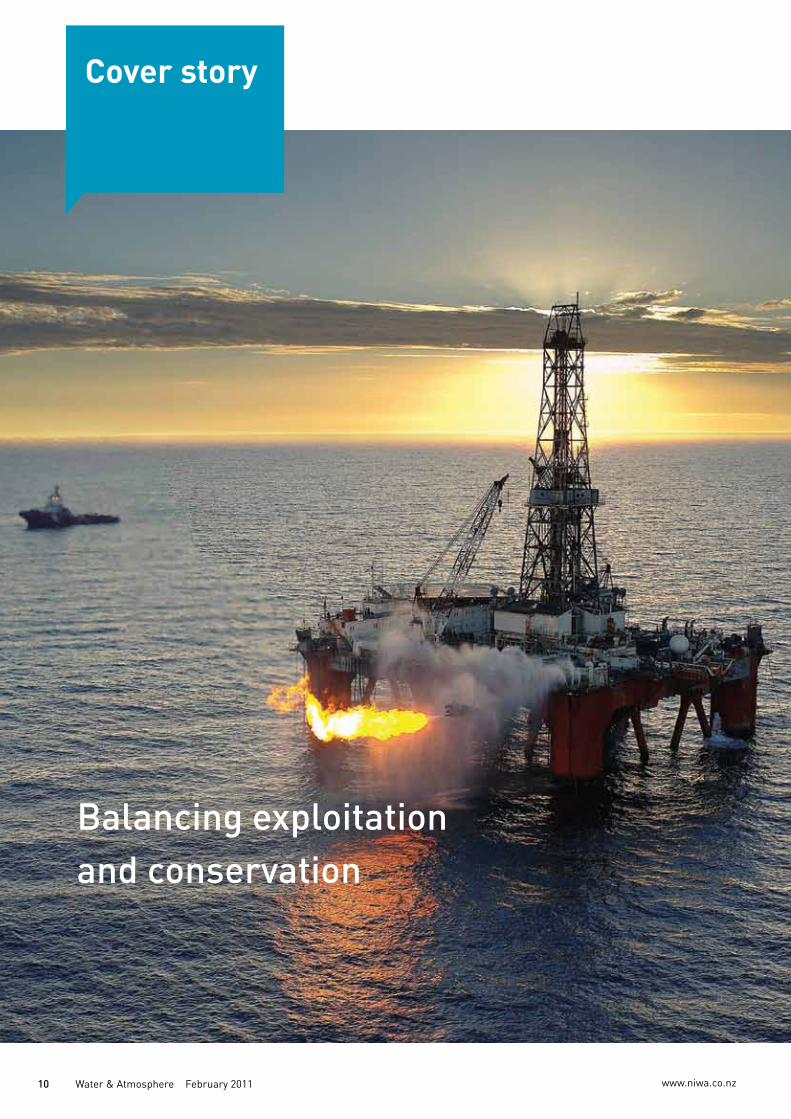
Cover Since 2007, the Tui oil field has yielded nearly 30 million barrels of crude. Now, energy companies are searching the depths for other minerals and gases to drive New Zealand's energy future.(New Zealand Oil & Gas)
Water & Atmosphere is published by the National Institute of Water & Atmospheric Research (NIWA). It is available online at www.niwa.co.nz/pubs/wa
Enquiries to:
The Editor Water & Atmosphere NIWA Private Bag 14901 Kilbirnie Wellington 6241 New Zealand
email: [email protected]
©National Institute of Water & Atmospheric Research Ltd 2011 ISSN 1172-1041
Water & Atmosphere team:
Advisory Board: Geoff Baird, Dr Bryce Cooper, Dr Barb Hayden, Dr Rob Murdoch
Managing Editor: Michele Hollis
Editor: Dave Hansford
Subeditor: Harriet Palmer
Designer: Mark Tucker
Production Assistant: Frances Nolan
Water & Atmosphere Issue 2 February 2011
2 Water & Atmosphere February 2011 www.niwa.co.nz
4EditorialWhen values collide – NIWA’s Chief Executive, John Morgan, emphasises that science and business must go hand-in-hand
5SolutionsEradicating a freshwater invader
6In briefFrom the ozone hole to the depths of the Kaikoura canyon, mapping and stream restoration tools to sea-level rise, and the Canterbury earthquake
34 34Q&AUndersea earthquakes – the lowdown
Water & Atmosphere is produced using vegetable-based inks on paper made from FSC certifed mixed-source fibres under the ISO 14001 environmental management system.
www.niwa.co.nz Water & Atmosphere February 2011 3
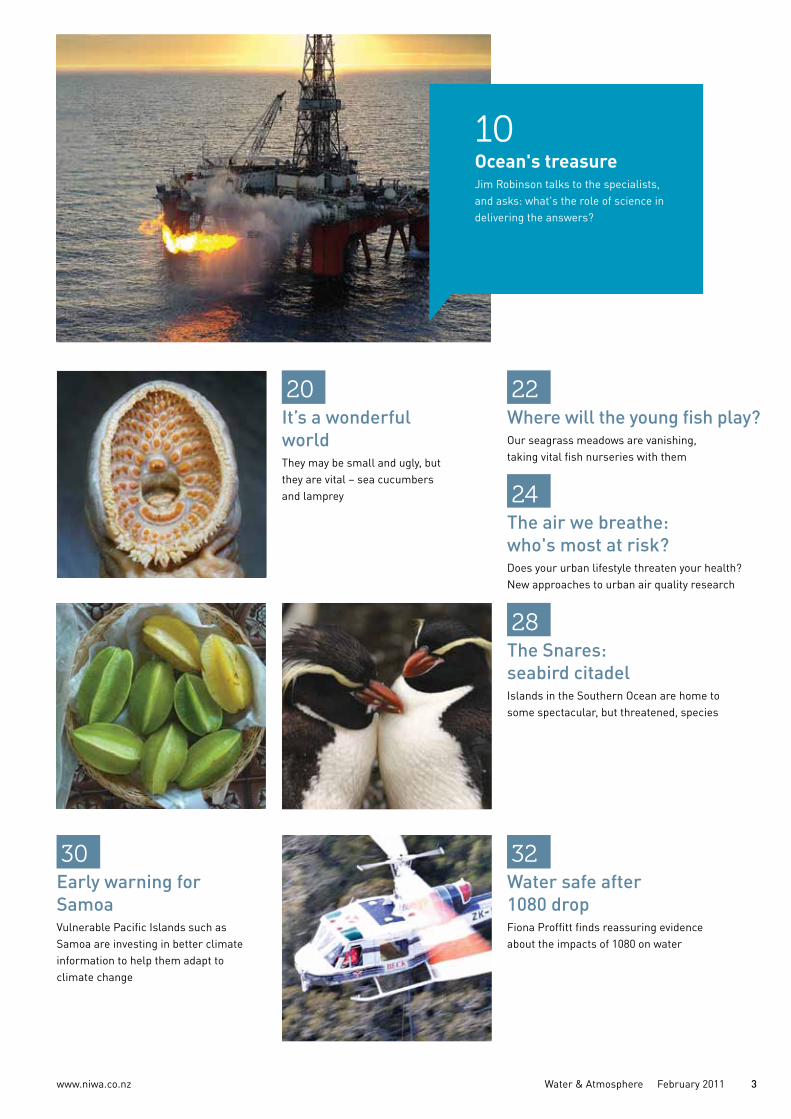
20It’s a wonderful worldThey may be small and ugly, but they are vital – sea cucumbers and lamprey
28The Snares: seabird citadelIslands in the Southern Ocean are home to some spectacular, but threatened, species
32Water safe after 1080 dropFiona Proffitt finds reassuring evidence about the impacts of 1080 on water
30Early warning for SamoaVulnerable Pacific Islands such as Samoa are investing in better climate information to help them adapt to climate change
10
Ocean's treasureJim Robinson talks to the specialists, and asks: what's the role of science in delivering the answers?
22Where will the young fish play?Our seagrass meadows are vanishing, taking vital fish nurseries with them
24The air we breathe: who's most at risk?Does your urban lifestyle threaten your health? New approaches to urban air quality research
www.niwa.co.nz4 Water & Atmosphere February 2011
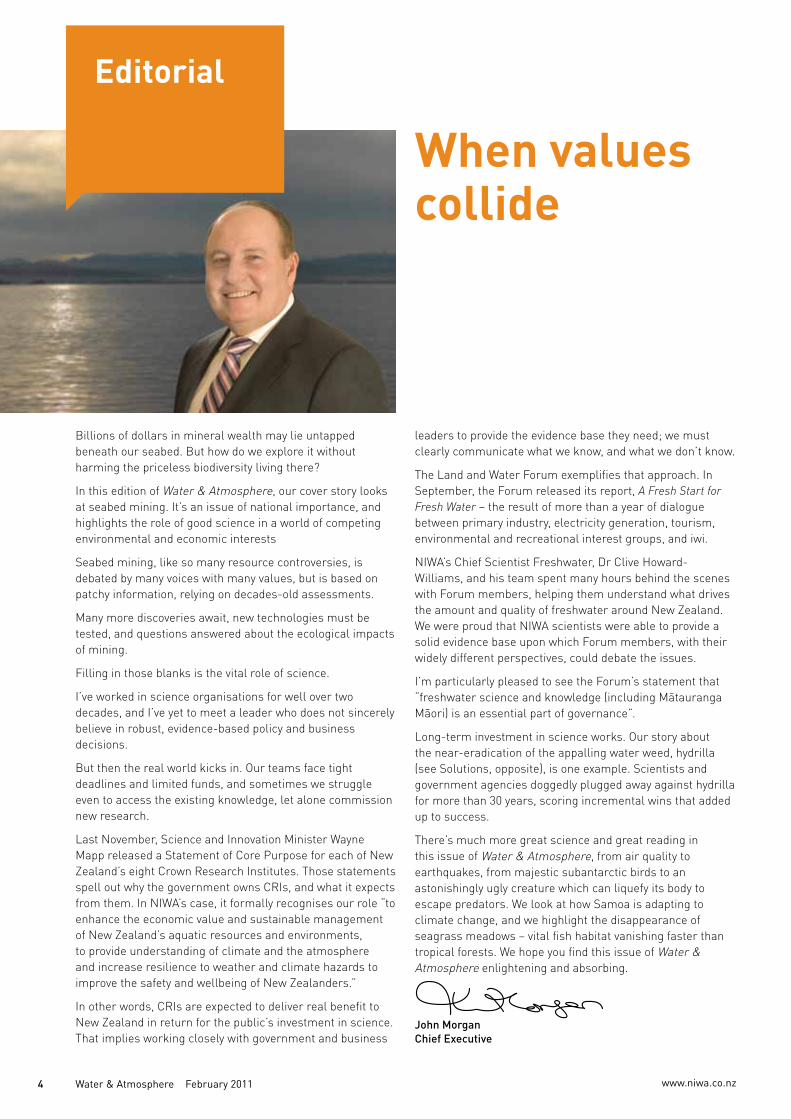
When values collide
Editorial
Billions of dollars in mineral wealth may lie untapped beneath our seabed. But how do we explore it without harming the priceless biodiversity living there?
In this edition of Water & Atmosphere, our cover story looks at seabed mining. It’s an issue of national importance, and highlights the role of good science in a world of competing environmental and economic interests
Seabed mining, like so many resource controversies, is debated by many voices with many values, but is based on patchy information, relying on decades-old assessments.
Many more discoveries await, new technologies must be tested, and questions answered about the ecological impacts of mining.
Filling in those blanks is the vital role of science.
I’ve worked in science organisations for well over two decades, and I’ve yet to meet a leader who does not sincerely believe in robust, evidence-based policy and business decisions.
But then the real world kicks in. Our teams face tight deadlines and limited funds, and sometimes we struggle even to access the existing knowledge, let alone commission new research.
Last November, Science and Innovation Minister Wayne Mapp released a Statement of Core Purpose for each of New Zealand’s eight Crown Research Institutes. Those statements spell out why the government owns CRIs, and what it expects from them. In NIWA’s case, it formally recognises our role “to enhance the economic value and sustainable management of New Zealand’s aquatic resources and environments, to provide understanding of climate and the atmosphere and increase resilience to weather and climate hazards to improve the safety and wellbeing of New Zealanders.”
In other words, CRIs are expected to deliver real benefit to New Zealand in return for the public’s investment in science. That implies working closely with government and business
leaders to provide the evidence base they need; we must clearly communicate what we know, and what we don’t know.
The Land and Water Forum exemplifies that approach. In September, the Forum released its report, A Fresh Start for Fresh Water – the result of more than a year of dialogue between primary industry, electricity generation, tourism, environmental and recreational interest groups, and iwi.
NIWA’s Chief Scientist Freshwater, Dr Clive Howard-Williams, and his team spent many hours behind the scenes with Forum members, helping them understand what drives the amount and quality of freshwater around New Zealand. We were proud that NIWA scientists were able to provide a solid evidence base upon which Forum members, with their widely different perspectives, could debate the issues.
I’m particularly pleased to see the Forum’s statement that “freshwater science and knowledge (including Mātauranga Māori) is an essential part of governance”.
Long-term investment in science works. Our story about the near-eradication of the appalling water weed, hydrilla (see Solutions, opposite), is one example. Scientists and government agencies doggedly plugged away against hydrilla for more than 30 years, scoring incremental wins that added up to success.
There’s much more great science and great reading in this issue of Water & Atmosphere, from air quality to earthquakes, from majestic subantarctic birds to an astonishingly ugly creature which can liquefy its body to escape predators. We look at how Samoa is adapting to climate change, and we highlight the disappearance of seagrass meadows – vital fish habitat vanishing faster than tropical forests. We hope you find this issue of Water & Atmosphere enlightening and absorbing.
John Morgan Chief Executive
www.niwa.co.nz Water & Atmosphere February 2011 5
Eradicating a freshwater invader
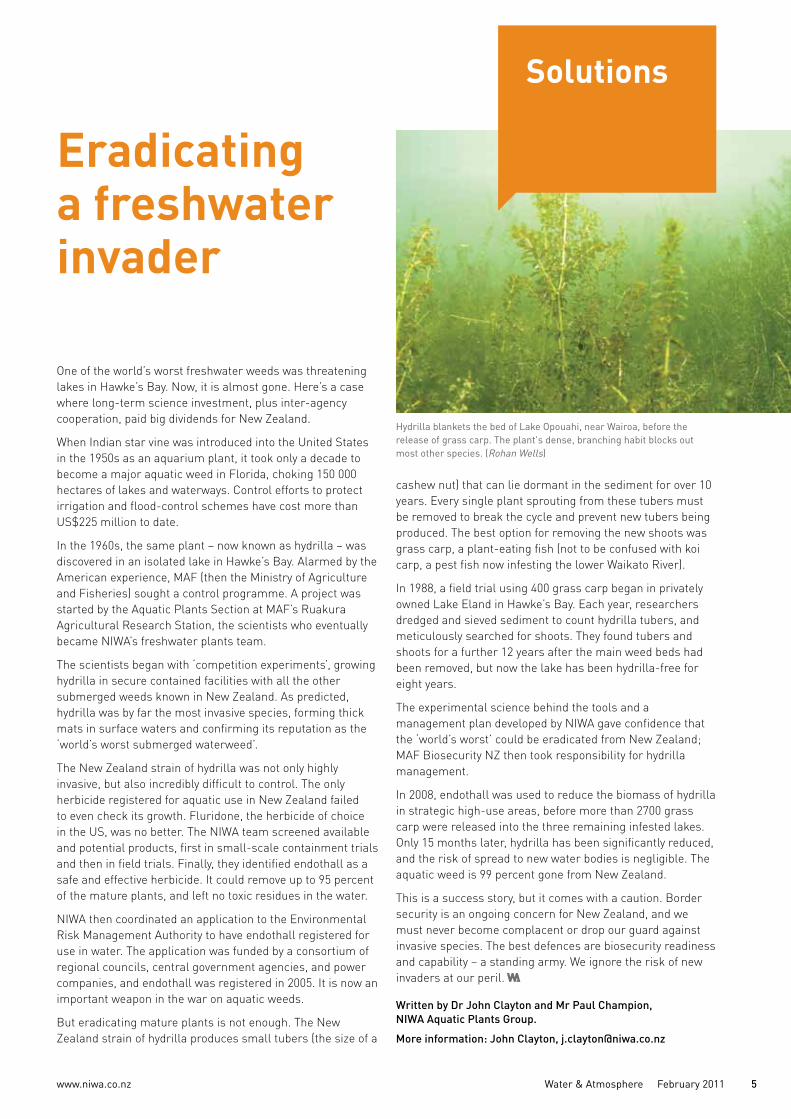
One of the world’s worst freshwater weeds was threatening lakes in Hawke’s Bay. Now, it is almost gone. Here’s a case where long-term science investment, plus inter-agency cooperation, paid big dividends for New Zealand.
When Indian star vine was introduced into the United States in the 1950s as an aquarium plant, it took only a decade to become a major aquatic weed in Florida, choking 150 000 hectares of lakes and waterways. Control efforts to protect irrigation and flood-control schemes have cost more than US$225 million to date.
In the 1960s, the same plant – now known as hydrilla – was discovered in an isolated lake in Hawke’s Bay. Alarmed by the American experience, MAF (then the Ministry of Agriculture and Fisheries) sought a control programme. A project was started by the Aquatic Plants Section at MAF’s Ruakura Agricultural Research Station, the scientists who eventually became NIWA’s freshwater plants team.
The scientists began with ‘competition experiments’, growing hydrilla in secure contained facilities with all the other submerged weeds known in New Zealand. As predicted, hydrilla was by far the most invasive species, forming thick mats in surface waters and confirming its reputation as the ‘world’s worst submerged waterweed’.
The New Zealand strain of hydrilla was not only highly invasive, but also incredibly difficult to control. The only herbicide registered for aquatic use in New Zealand failed to even check its growth. Fluridone, the herbicide of choice in the US, was no better. The NIWA team screened available and potential products, first in small-scale containment trials and then in field trials. Finally, they identified endothall as a safe and effective herbicide. It could remove up to 95 percent of the mature plants, and left no toxic residues in the water.
NIWA then coordinated an application to the Environmental Risk Management Authority to have endothall registered for use in water. The application was funded by a consortium of regional councils, central government agencies, and power companies, and endothall was registered in 2005. It is now an important weapon in the war on aquatic weeds.
But eradicating mature plants is not enough. The New Zealand strain of hydrilla produces small tubers (the size of a
Solutions
cashew nut) that can lie dormant in the sediment for over 10 years. Every single plant sprouting from these tubers must be removed to break the cycle and prevent new tubers being produced. The best option for removing the new shoots was grass carp, a plant-eating fish (not to be confused with koi carp, a pest fish now infesting the lower Waikato River).
In 1988, a field trial using 400 grass carp began in privately owned Lake Eland in Hawke’s Bay. Each year, researchers dredged and sieved sediment to count hydrilla tubers, and meticulously searched for shoots. They found tubers and shoots for a further 12 years after the main weed beds had been removed, but now the lake has been hydrilla-free for eight years.
The experimental science behind the tools and a management plan developed by NIWA gave confidence that the ‘world’s worst’ could be eradicated from New Zealand; MAF Biosecurity NZ then took responsibility for hydrilla management.
In 2008, endothall was used to reduce the biomass of hydrilla in strategic high-use areas, before more than 2700 grass carp were released into the three remaining infested lakes. Only 15 months later, hydrilla has been significantly reduced, and the risk of spread to new water bodies is negligible. The aquatic weed is 99 percent gone from New Zealand.
This is a success story, but it comes with a caution. Border security is an ongoing concern for New Zealand, and we must never become complacent or drop our guard against invasive species. The best defences are biosecurity readiness and capability – a standing army. We ignore the risk of new invaders at our peril.
Written by Dr John Clayton and Mr Paul Champion, NIWA Aquatic Plants Group.More information: John Clayton, [email protected]
Hydrilla blankets the bed of Lake Opouahi, near Wairoa, before the release of grass carp. The plant's dense, branching habit blocks out most other species. (Rohan Wells)
www.niwa.co.nz6 Water & Atmosphere February 2011
The ocean around Kaikoura is not just popular with tourists, sperm whales, and albatrosses: it holds one of the most productive deepsea habitats known to science.
Recently published research reveals the bottom of Kaikoura Canyon – a large underwater canyon off the east coast of the South Island – hosts an astonishing number of fish, plus large invertebrates, burrowing sea cucumbers, and various marine worms.
Scientists from NIWA and the University of Hawaii analysed samples of seafloor invertebrates, seafloor images, and bottom-trawl data from depths of up to 1400 metres in the canyon. These revealed invertebrate biomass values 100 times higher than any previously reported for deepsea habitats below 500 metres (other than those supported by hydrothermal vents).
There are at least 660 submarine canyons worldwide, of which about 100 could be biomass hotspots similar to the Kaikoura Canyon.
Contact: Dr Ashley Rowden [email protected]
1 2
In brief
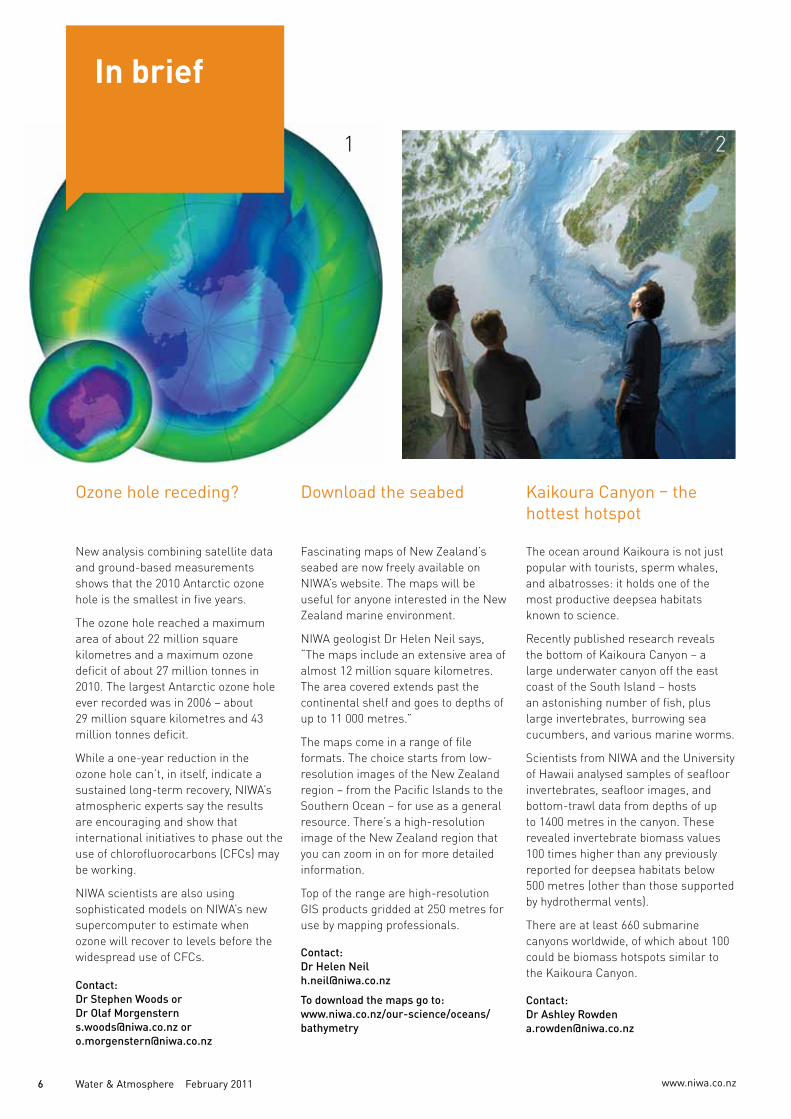
New analysis combining satellite data and ground-based measurements shows that the 2010 Antarctic ozone hole is the smallest in five years.
The ozone hole reached a maximum area of about 22 million square kilometres and a maximum ozone deficit of about 27 million tonnes in 2010. The largest Antarctic ozone hole ever recorded was in 2006 – about 29 million square kilometres and 43 million tonnes deficit.
While a one-year reduction in the ozone hole can’t, in itself, indicate a sustained long-term recovery, NIWA’s atmospheric experts say the results are encouraging and show that international initiatives to phase out the use of chlorofluorocarbons (CFCs) may be working.
NIWA scientists are also using sophisticated models on NIWA’s new supercomputer to estimate when ozone will recover to levels before the widespread use of CFCs.
Contact: Dr Stephen Woods or Dr Olaf Morgenstern [email protected] or [email protected]
Ozone hole receding?
Fascinating maps of New Zealand’s seabed are now freely available on NIWA’s website. The maps will be useful for anyone interested in the New Zealand marine environment.
NIWA geologist Dr Helen Neil says, “The maps include an extensive area of almost 12 million square kilometres. The area covered extends past the continental shelf and goes to depths of up to 11 000 metres.”
The maps come in a range of file formats. The choice starts from low-resolution images of the New Zealand region – from the Pacific Islands to the Southern Ocean – for use as a general resource. There’s a high-resolution image of the New Zealand region that you can zoom in on for more detailed information.
Top of the range are high-resolution GIS products gridded at 250 metres for use by mapping professionals.
Contact: Dr Helen Neil [email protected] download the maps go to: www.niwa.co.nz/our-science/oceans/bathymetry
Download the seabed Kaikoura Canyon – the hottest hotspot
www.niwa.co.nz Water & Atmosphere February 2011 7
3
1. The ozone hole is the blue region: the large image is from 2010, the inset shows the largest ever ozone hole measured, September 2006. (Goddard Space Flight Center, NASA, USA)
2. Online maps of New Zealand's seabed are available, and can be reproduced at any size. (Dave Allen)
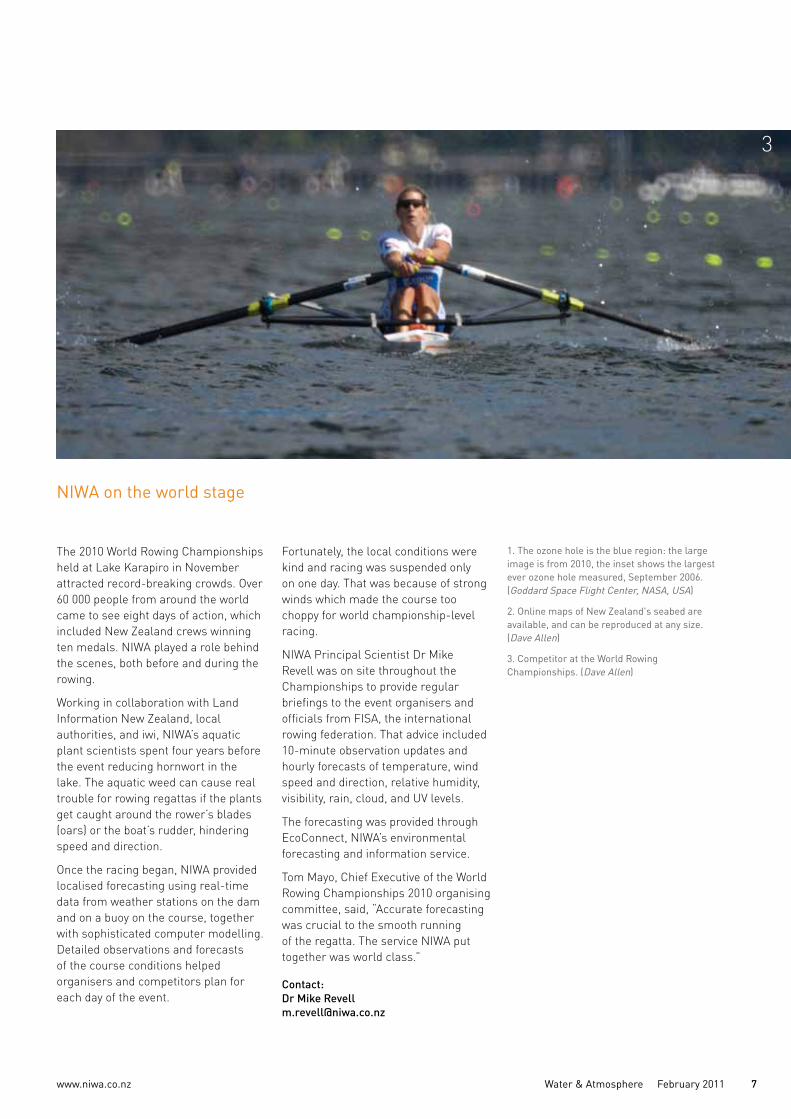
3. Competitor at the World Rowing Championships. (Dave Allen)
NIWA on the world stage
The 2010 World Rowing Championships held at Lake Karapiro in November attracted record-breaking crowds. Over 60 000 people from around the world came to see eight days of action, which included New Zealand crews winning ten medals. NIWA played a role behind the scenes, both before and during the rowing.
Working in collaboration with Land Information New Zealand, local authorities, and iwi, NIWA’s aquatic plant scientists spent four years before the event reducing hornwort in the lake. The aquatic weed can cause real trouble for rowing regattas if the plants get caught around the rower’s blades (oars) or the boat’s rudder, hindering speed and direction.
Once the racing began, NIWA provided localised forecasting using real-time data from weather stations on the dam and on a buoy on the course, together with sophisticated computer modelling. Detailed observations and forecasts of the course conditions helped organisers and competitors plan for each day of the event.
Fortunately, the local conditions were kind and racing was suspended only on one day. That was because of strong winds which made the course too choppy for world championship-level racing.
NIWA Principal Scientist Dr Mike Revell was on site throughout the Championships to provide regular briefings to the event organisers and officials from FISA, the international rowing federation. That advice included 10-minute observation updates and hourly forecasts of temperature, wind speed and direction, relative humidity, visibility, rain, cloud, and UV levels.
The forecasting was provided through EcoConnect, NIWA’s environmental forecasting and information service.
Tom Mayo, Chief Executive of the World Rowing Championships 2010 organising committee, said, “Accurate forecasting was crucial to the smooth running of the regatta. The service NIWA put together was world class.”
Contact: Dr Mike Revell [email protected]
2800
2400
2000
1600
12002 Sept 4 Sept 6 Sept 8 Sept 10 SeptSource: Environment Canterbury and Christchurch City Council
Flow site – Heathcote River at Buxton Terrace
Rainfall-induced runoff
Earthquake-induced runoff
Litr
es p
er s
econ
d
2800
2400
2000
1600
12002 Sept 4 Sept 6 Sept 8 Sept 10 SeptSource: Environment Canterbury and Christchurch City Council
Flow site – Heathcote River at Buxton Terrace
Rainfall-induced runoff
Earthquake-induced runoff
Litr
es p
er s
econ
d
www.niwa.co.nz8 Water & Atmosphere February 2011
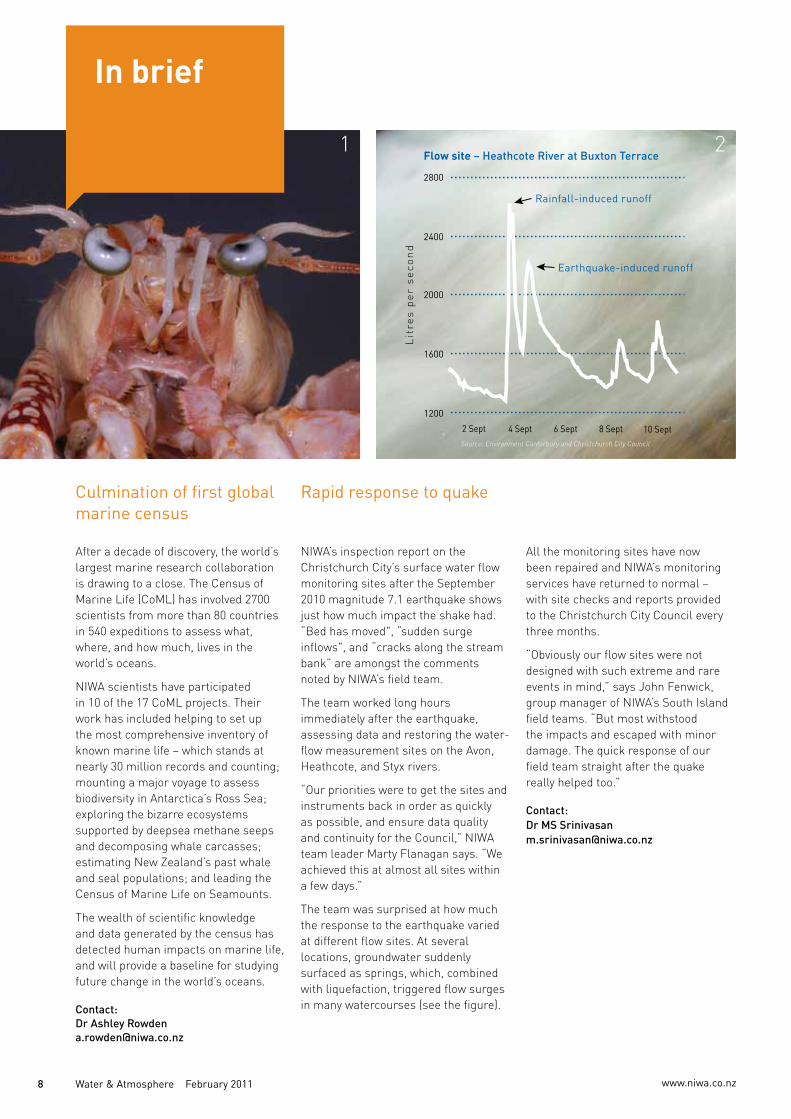
NIWA’s inspection report on the Christchurch City’s surface water flow monitoring sites after the September 2010 magnitude 7.1 earthquake shows just how much impact the shake had. “Bed has moved", “sudden surge inflows", and “cracks along the stream bank” are amongst the comments noted by NIWA’s field team.
The team worked long hours immediately after the earthquake, assessing data and restoring the water-flow measurement sites on the Avon, Heathcote, and Styx rivers.
“Our priorities were to get the sites and instruments back in order as quickly as possible, and ensure data quality and continuity for the Council,” NIWA team leader Marty Flanagan says. “We achieved this at almost all sites within a few days.”
The team was surprised at how much the response to the earthquake varied at different flow sites. At several locations, groundwater suddenly surfaced as springs, which, combined with liquefaction, triggered flow surges in many watercourses (see the figure).
Rapid response to quake
After a decade of discovery, the world’s largest marine research collaboration is drawing to a close. The Census of Marine Life (CoML) has involved 2700 scientists from more than 80 countries in 540 expeditions to assess what, where, and how much, lives in the world’s oceans.
NIWA scientists have participated in 10 of the 17 CoML projects. Their work has included helping to set up the most comprehensive inventory of known marine life – which stands at nearly 30 million records and counting; mounting a major voyage to assess biodiversity in Antarctica’s Ross Sea; exploring the bizarre ecosystems supported by deepsea methane seeps and decomposing whale carcasses; estimating New Zealand’s past whale and seal populations; and leading the Census of Marine Life on Seamounts.
The wealth of scientific knowledge and data generated by the census has detected human impacts on marine life, and will provide a baseline for studying future change in the world’s oceans.
Contact: Dr Ashley Rowden [email protected]
Culmination of first global marine census
All the monitoring sites have now been repaired and NIWA’s monitoring services have returned to normal – with site checks and reports provided to the Christchurch City Council every three months.
“Obviously our flow sites were not designed with such extreme and rare events in mind,” says John Fenwick, group manager of NIWA’s South Island field teams. “But most withstood the impacts and escaped with minor damage. The quick response of our field team straight after the quake really helped too.”
Contact: Dr MS Srinivasan [email protected]
1 2
In brief
www.niwa.co.nz Water & Atmosphere February 2011 9
A new stream restoration toolkit is helping regional councils, community groups, and schools restore ailing streams back to health. NIWA and partners have produced an online guide to help identify restoration goals and choose indicators to measure progress. It also outlines how to design a monitoring programme, and when to expect success.
Common goals of stream restoration projects are often based around returning the stream to pre-human levels of biodiversity and water quality.
“It’s about helping people to get going,” says NIWA freshwater scientist Dr John Quinn, “and defining where they are going, then helping them get there cost-effectively.” The toolkit – funded by the Envirolink Tools programme – is being used in projects to restore streams around New Zealand. It’s free to download from www.niwa.co.nz/our-science/freshwater/restoration_toolkit
Contact: Dr John Quinn [email protected]
NIWA is working with coastal communities and councils on how to adapt to sea-level rise caused by climate change. New Zealand sea levels are predicted to rise by between 18 and 59 centimetres by 2090, potentially exacerbating problems of coastal inundation and erosion. Forward planning is crucial for communities likely to be affected.
NIWA is leading a three-year project which will map the vulnerability of the New Zealand coast to sea-level rise, and help councils and communities develop proactive adaptation strategies.
As part of this, NIWA scientists ran three public forums in Whitianga last year, using maps to communicate the likely impacts of sea-level rise on Whitianga’s coast by the 2090s. They also canvassed the community on valued aspects of Whitianga that may be threatened, and discussed ways of managing these threats. This case study will help guide work with coastal communities throughout New Zealand.
Contact: Dr Helen Rouse [email protected]
How-to guide for stream restoration
Adapting to sea-level rise
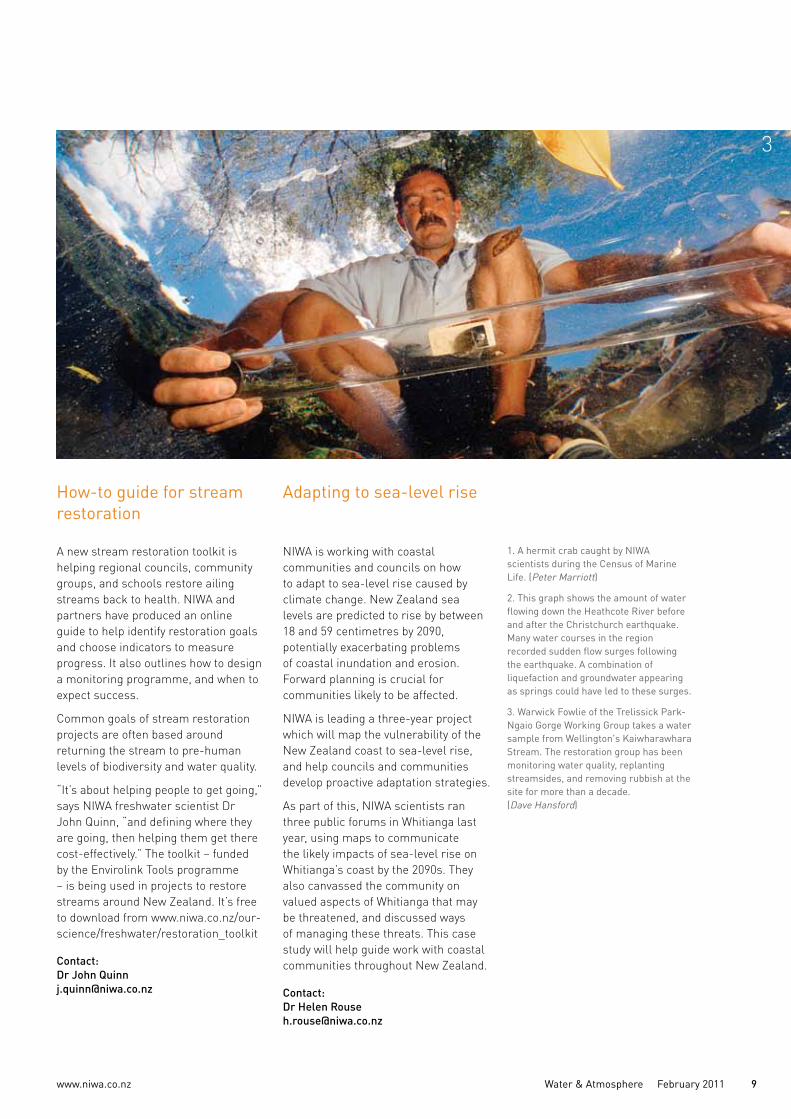
1. A hermit crab caught by NIWA scientists during the Census of Marine Life. (Peter Marriott)
2. This graph shows the amount of water flowing down the Heathcote River before and after the Christchurch earthquake. Many water courses in the region recorded sudden flow surges following the earthquake. A combination of liquefaction and groundwater appearing as springs could have led to these surges.
3. Warwick Fowlie of the Trelissick Park-Ngaio Gorge Working Group takes a water sample from Wellington's Kaiwharawhara Stream. The restoration group has been monitoring water quality, replanting streamsides, and removing rubbish at the site for more than a decade. (Dave Hansford)
3
www.niwa.co.nz10 Water & Atmosphere February 2011
Cover story
Balancing exploitation and conservation
www.niwa.co.nz Water & Atmosphere February 2011 11
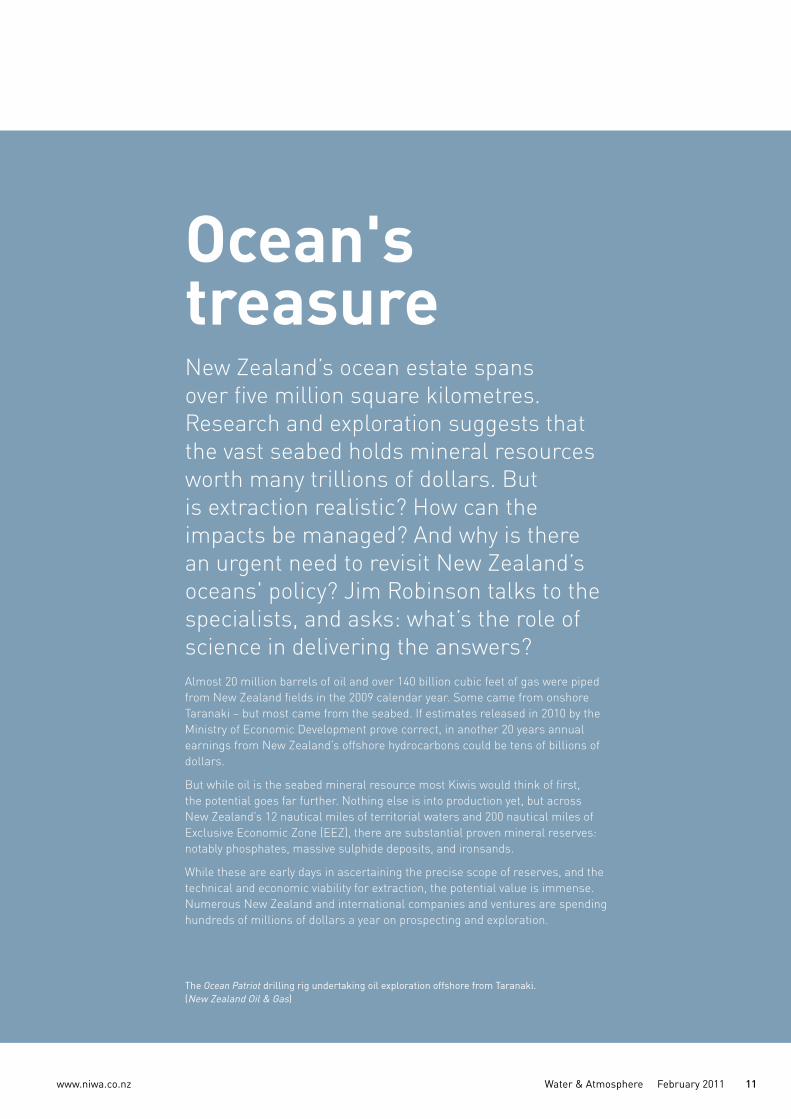
Ocean's treasureNew Zealand’s ocean estate spans over five million square kilometres. Research and exploration suggests that the vast seabed holds mineral resources worth many trillions of dollars. But is extraction realistic? How can the impacts be managed? And why is there an urgent need to revisit New Zealand’s oceans' policy? Jim Robinson talks to the specialists, and asks: what’s the role of science in delivering the answers?Almost 20 million barrels of oil and over 140 billion cubic feet of gas were piped from New Zealand fields in the 2009 calendar year. Some came from onshore Taranaki – but most came from the seabed. If estimates released in 2010 by the Ministry of Economic Development prove correct, in another 20 years annual earnings from New Zealand’s offshore hydrocarbons could be tens of billions of dollars.
But while oil is the seabed mineral resource most Kiwis would think of first, the potential goes far further. Nothing else is into production yet, but across New Zealand’s 12 nautical miles of territorial waters and 200 nautical miles of Exclusive Economic Zone (EEZ), there are substantial proven mineral reserves: notably phosphates, massive sulphide deposits, and ironsands.
While these are early days in ascertaining the precise scope of reserves, and the technical and economic viability for extraction, the potential value is immense. Numerous New Zealand and international companies and ventures are spending hundreds of millions of dollars a year on prospecting and exploration.
The Ocean Patriot drilling rig undertaking oil exploration offshore from Taranaki. (New Zealand Oil & Gas)
www.niwa.co.nz12 Water & Atmosphere February 2011
Ocean's treasure
Yet, here’s the sting. Just as nobody knows the full extent of reserves, nobody knows the full extent of the environmental risks of extraction, let alone how to mitigate those risks. There’s some knowledge about deepwater species and ecosystems, potential impacts, and steps to recovery, but the understanding is far from comprehensive. What is certain is that deepwater environments themselves have immense value, supporting sustainable fisheries and perhaps carbon sequestering, as well as holding their own intrinsic worth.
“Given the value of the mineral resources and how many companies are now interested, it’s time to ask some serious questions about how to manage them,” argues Dr Alison MacDiarmid, NIWA Principal Scientist, Marine Ecology. “We need to balance mineral extraction with the other benefits of the marine environments. Some degree of exploitation of the resources is probably fine. But what degree? What is the balance?”
And to even begin answering that question, we first need to know what’s down there.
Phosphate on the Chatham Rise
Thanks to government-led exploration, sampling, and research from the 1950s to 1980s, it’s well known that the crest of the Chatham Rise holds major phosphate deposits. Phosphorite nodules sit in sandy silt in the top 70 centimetres of seabed, at sea depths around 400 metres. When crushed, they produce a proven slow-release fertiliser. Estimated reserves exceed 100 million tonnes, enough to meet New Zealand’s current phosphate requirements for decades.
Even so, there has never been commercial production from the Chatham Rise. In large part that’s because of the 1980s discovery of huge phosphate reserves, largely in Morocco. But in recent years, rock phosphate from Morocco has soared to US$500 a tonne, rekindling interest in the Chatham Rise reserves.
A joint venture between Widespread Energy and Widespread Portfolios of New Zealand currently holds a prospecting licence for a 4500 square-kilometre block, about 250 kilometres west of the Chatham Islands. For their feasibility studies, Widespread has accessed historic seabed samples, data, and research held by NIWA. NIWA has also undertaken oceanography and analysis of seabed communities.
The studies indicate commercial extraction is realistic. Widespread is currently raising capital to progress appraisal and could be ready to place a mining application in about two years’ time. As well as dredging companies, Widespread is liaising with the Department of Conservation, Ministry for the Environment, Ministry of Fisheries, and others.
“All the stakeholders will need to hold hands," says Chris Castle, Managing Director of Widespread Energy. “It’s
imperative we work in harmony with the environment as much as we can. It’s not just lip service.”
Mr Castle notes that the total area of extraction sites will be just 300 square kilometres. The nature of the reserves means sites will be small and scattered. He also raises “a few big pluses” from production: savings to the New Zealand fertiliser sector would be an estimated $75 million a year, with assured continuity of supply and cost. And tapping supplies closer to home would slash fuel use and carbon emissions from transport.
Widespread’s prospecting licence requires that all activities comply with the International Marine Minerals Society’s ‘Code for Environmental Management of Marine Mining’. As a publicly listed venture, Widespread must also comply with stock exchange reporting codes.
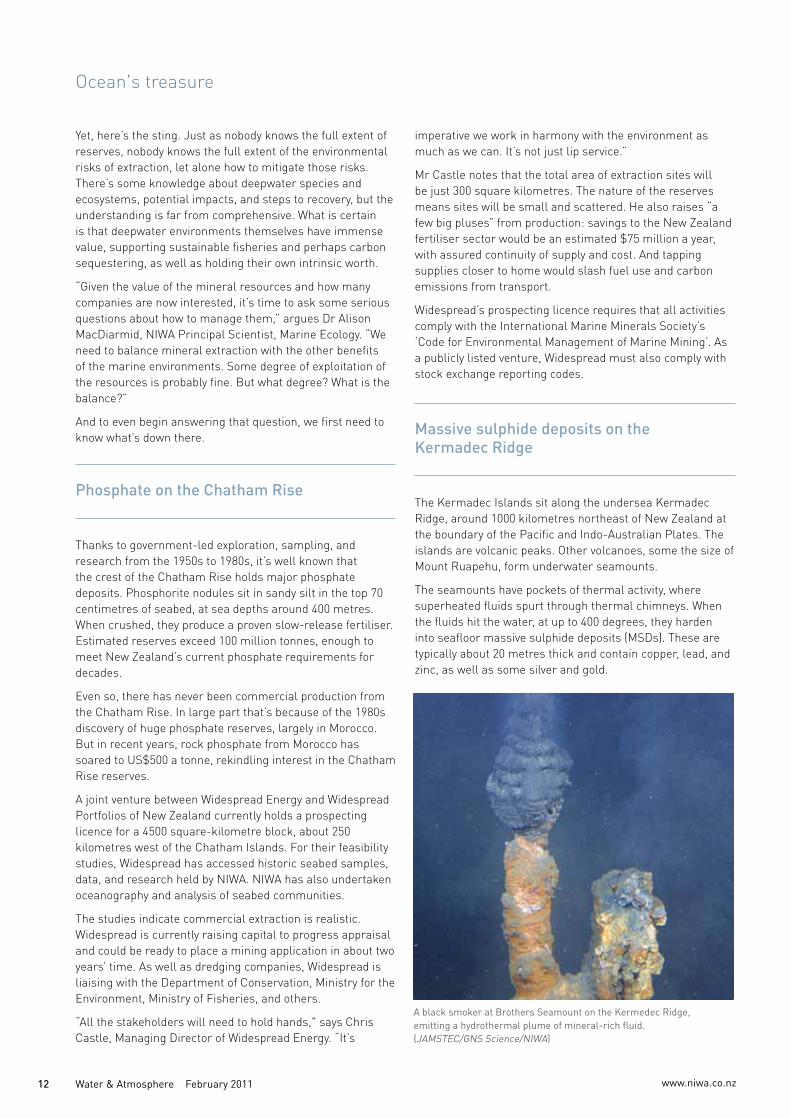
Massive sulphide deposits on the Kermadec Ridge
The Kermadec Islands sit along the undersea Kermadec Ridge, around 1000 kilometres northeast of New Zealand at the boundary of the Pacific and Indo-Australian Plates. The islands are volcanic peaks. Other volcanoes, some the size of Mount Ruapehu, form underwater seamounts.
The seamounts have pockets of thermal activity, where superheated fluids spurt through thermal chimneys. When the fluids hit the water, at up to 400 degrees, they harden into seafloor massive sulphide deposits (MSDs). These are typically about 20 metres thick and contain copper, lead, and zinc, as well as some silver and gold.
A black smoker at Brothers Seamount on the Kermedec Ridge, emitting a hydrothermal plume of mineral-rich fluid. (JAMSTEC/GNS Science/NIWA)
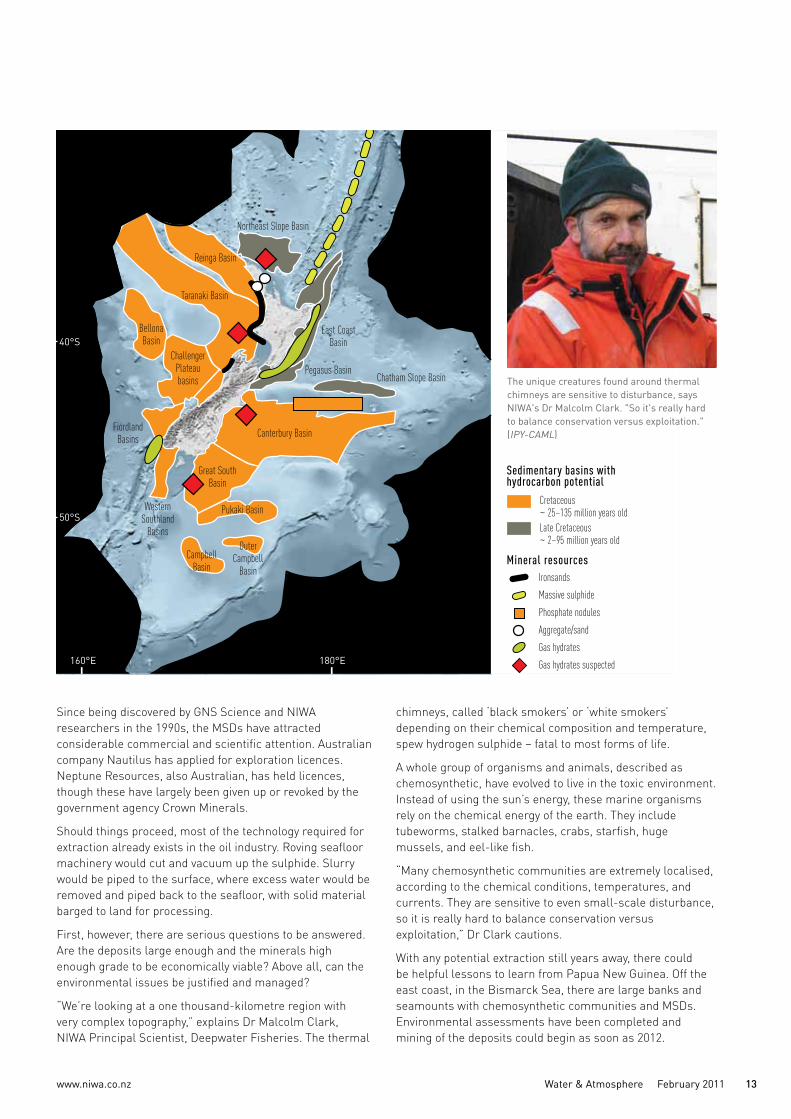
160°E
50°S
40°S
180°E
Canterbury Basin
Chatham Slope BasinPegasus Basin
East Coast Basin
Northeast Slope Basin
Reinga Basin
Challenger Plateau basins
Bellona Basin
Fiordland Basins
Western Southland
Basins
Taranaki Basin
Great South Basin
Pukaki Basin
Campbell Basin
Outer Campbell
Basin
Limit of NZ extended continental shelf
IronsandsMassive sulphidePhosphate nodulesAggregate/sandGas hydratesGas hydrates suspected
Cretaceous~ 25–135 million years oldLate Cretaceous~ 2–95 million years old
Sedimentary basins with hydrocarbon potential
Mineral resources
www.niwa.co.nz Water & Atmosphere February 2011 13
Since being discovered by GNS Science and NIWA researchers in the 1990s, the MSDs have attracted considerable commercial and scientific attention. Australian company Nautilus has applied for exploration licences. Neptune Resources, also Australian, has held licences, though these have largely been given up or revoked by the government agency Crown Minerals.
Should things proceed, most of the technology required for extraction already exists in the oil industry. Roving seafloor machinery would cut and vacuum up the sulphide. Slurry would be piped to the surface, where excess water would be removed and piped back to the seafloor, with solid material barged to land for processing.
First, however, there are serious questions to be answered. Are the deposits large enough and the minerals high enough grade to be economically viable? Above all, can the environmental issues be justified and managed?
“We’re looking at a one thousand-kilometre region with very complex topography,” explains Dr Malcolm Clark, NIWA Principal Scientist, Deepwater Fisheries. The thermal
chimneys, called ‘black smokers’ or ‘white smokers’ depending on their chemical composition and temperature, spew hydrogen sulphide – fatal to most forms of life.
A whole group of organisms and animals, described as chemosynthetic, have evolved to live in the toxic environment. Instead of using the sun’s energy, these marine organisms rely on the chemical energy of the earth. They include tubeworms, stalked barnacles, crabs, starfish, huge mussels, and eel-like fish.
“Many chemosynthetic communities are extremely localised, according to the chemical conditions, temperatures, and currents. They are sensitive to even small-scale disturbance, so it is really hard to balance conservation versus exploitation,” Dr Clark cautions.
With any potential extraction still years away, there could be helpful lessons to learn from Papua New Guinea. Off the east coast, in the Bismarck Sea, there are large banks and seamounts with chemosynthetic communities and MSDs. Environmental assessments have been completed and mining of the deposits could begin as soon as 2012.
The unique creatures found around thermal chimneys are sensitive to disturbance, says NIWA's Dr Malcolm Clark. "So it's really hard to balance conservation versus exploitation." (IPY-CAML)

www.niwa.co.nz14 Water & Atmosphere February 2011
Ocean's treasure
Ironsands off the Taranaki coast
For decades, iron-rich mineral sand has been extracted from ancient dunes at Taharoa and Waikato North Head. The ironsand is used for domestic and international steel manufacture and is worth almost $30 million a year.
Ironsand stretches along a 450-kilometre sweep between Whanganui and Kaipara Harbour. The titanomagnetite, magnetite, and ilmenite (iron and titanium oxide) minerals are eroded from the volcanic rocks of Taranaki.
Offshore Taranaki deposits have been known since the 1960s and could yield over 500 million tonnes of ore. Until recently, there was no impetus to define the reserves, but in 2008 global ore prices soared after the Chinese – the world’s major producers of steel – began stockpiling reserves.
“That sparked off the interest here. In the last two years, we’ve been approached by four or five mining companies wanting to know the knowledge base, distribution, and size of reserves,” says NIWA geologist Dr Alan Orpin. Several prospecting licences have been issued by Crown Minerals, with more pending. The companies are driving their own research programmes, gathering remote data by aerial magnetics and strategic seabed sampling.
NIWA has analysed historic ironsand samples for two multinational companies, one of which has an exploratory drilling campaign underway. An aside here: while much research is high tech, the veracity of geological interpretation still depends on basic observation. To validate the concentration of iron ore in a sample, geologists use a magnet on the end of a pencil.
As yet, offshore reserves are still “poorly defined,” Dr Orpin says. “There are some sedimentary bodies that are very rich in ironsands. But, to be economic, it’s all about volume. The scale of extraction we are talking about is vast.” NIWA scientists are working with mining companies to establish potential impacts.
A coastal environment is inherently more mobile than, for example, that of the deepwater Chatham Rise. Sands shift with currents, tidal flows, and storms, so species and ecosystems are naturally geared to recover from change. Nonetheless, the impacts the seabed and the organisms living there are a major concern.
Dr Orpin emphasises that NIWA’s role is to deliver answers that allow the best decisions to be made. “Our goal is to provide very sound, objective information. Big decisions will have to be made on the basis of acceptable risk. Both sides of the argument need to be played out.”
Offshore ironsand reserves fall within the 12 nautical mile limit, so any development and production will fall under the jurisdiction of the Resource Management Act 1991 (RMA), regional councils, and iwi.
“...key decisions on if, and how, to proceed with the extraction of offshore resources must include measures to protect our marine environment...
”
Bronwen Golder, Pew Environment Group
Coastal sand extraction and the RMA
Coastal resources aren’t the prime focus of this article, but it’s worth touching on coastal sands, used for building, construction, and beach nourishment projects like Wellington’s Oriental Bay.
With little suitable river sand, the Auckland region sees the most coastal extraction: over 350,000 cubic metres is taken each year from east coast beaches and the entrance to Kaipara Harbour. This contributes over half of the city’s concrete sand requirements.
Quality sand sits at depths of five to 15 metres, where the wave action has scoured away ‘the fines’ and the texture is even, explains Dr Terry Hume, NIWA’s Principal Scientist, Coastal Geomorphology. He observes that it’s extremely difficult to forecast the precise effects of extraction, because effects are blurred by natural ‘sand swapping’ between the beach and shallow nearshore, due to tides, currents, and waves. There’s no doubt, however, that removing sand from too close to shore can cause serious beach erosion.
Like ironsand, coastal sand extraction is covered by the RMA. Operators need to gain a coastal permit from their local council, with any appeals considered by the Environment Court. Dr Hume is involved in presenting assessment reports to hearings. He believes that in the main, the RMA works well: “It’s a pretty consultative and robust process.”
The way coastal sand extraction is managed is perhaps a precedent for activities further offshore. There’s clear legislation, there’s a commitment to ongoing scientific investigations and monitoring, and there’s a public voice. These factors all contribute to making sound decisions on resource allocation and use.
www.niwa.co.nz Water & Atmosphere February 2011 15
Zealandia’s petroleum potential
In the last financial year, petroleum was again New Zealand’s number three export earner. All current oil and gas production is around – and mostly offshore of – Taranaki.
Since 2006, four new offshore gas and oil fields have come on-stream: Pohukura, Tui, Maari, and Kupe. Maari is New Zealand’s largest, reaching 40 000 barrels a day by mid 2009. Shell Todd Oil Services has been extending the life of the Maui field, producing since 1979, by drilling from two platforms.
Over the last decade, much has been learned about potential. Because it was once a large continent, now commonly called Zealandia, New Zealand’s surrounding undersea geography shows evidence of ancient river deltas – prime estate for hydrocarbons. To support exploration, the government continues to invest in seismic data acquisition.
Austrian energy company OMV holds a prospecting licence for the Great South Basin. In September 2010, OMV revealed that seismic mapping had identified potential hydrocarbon-bearing structures in the basin. Other potential fields include offshore Canterbury. Nothing is definite, but a reasonable estimate of New Zealand’s recoverable petroleum reserves could be in the realm of ten to twenty billion barrels.
GNS Science is a key player in supporting the sector. NIWA’s participation is currently smaller, focusing upstream (such as researching fault geometry and sediment architecture) and downstream (such as environmental baseline studies, potential impacts, and location of rigs and pipelines).
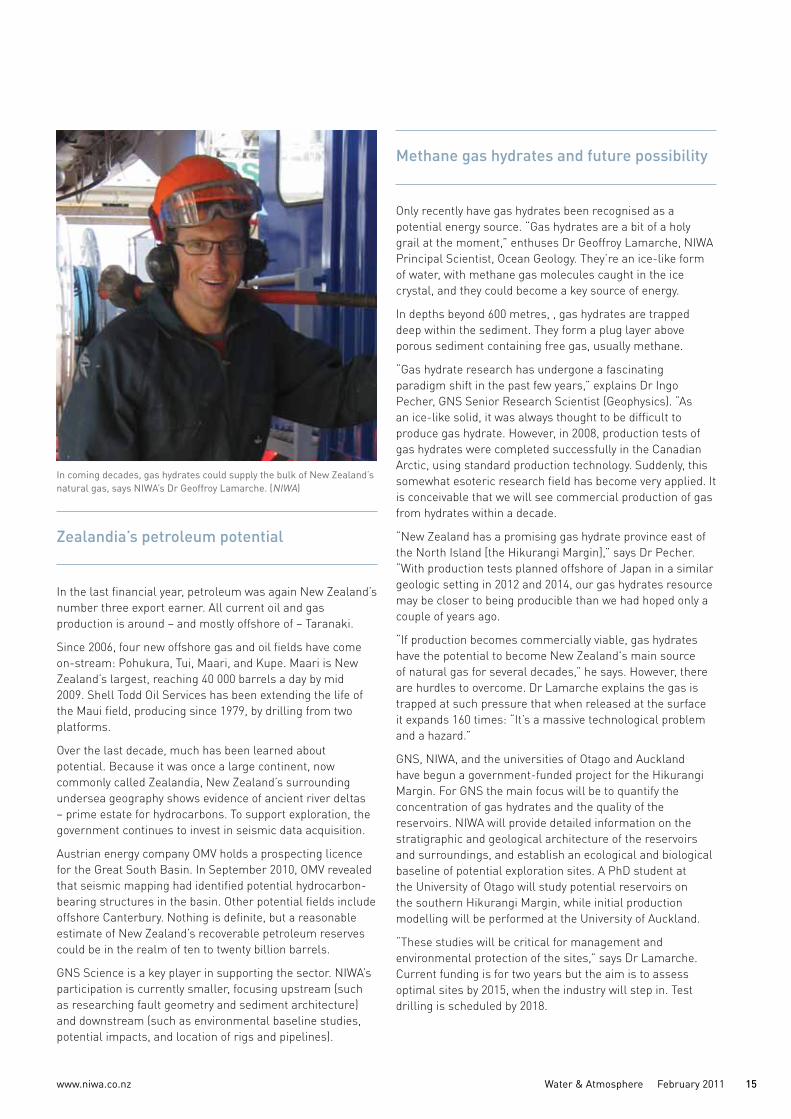
Methane gas hydrates and future possibility
Only recently have gas hydrates been recognised as a potential energy source. “Gas hydrates are a bit of a holy grail at the moment,” enthuses Dr Geoffroy Lamarche, NIWA Principal Scientist, Ocean Geology. They’re an ice-like form of water, with methane gas molecules caught in the ice crystal, and they could become a key source of energy.
In depths beyond 600 metres, , gas hydrates are trapped deep within the sediment. They form a plug layer above porous sediment containing free gas, usually methane.
“Gas hydrate research has undergone a fascinating paradigm shift in the past few years,” explains Dr Ingo Pecher, GNS Senior Research Scientist (Geophysics). “As an ice-like solid, it was always thought to be difficult to produce gas hydrate. However, in 2008, production tests of gas hydrates were completed successfully in the Canadian Arctic, using standard production technology. Suddenly, this somewhat esoteric research field has become very applied. It is conceivable that we will see commercial production of gas from hydrates within a decade.
“New Zealand has a promising gas hydrate province east of the North Island [the Hikurangi Margin],” says Dr Pecher. “With production tests planned offshore of Japan in a similar geologic setting in 2012 and 2014, our gas hydrates resource may be closer to being producible than we had hoped only a couple of years ago.
“If production becomes commercially viable, gas hydrates have the potential to become New Zealand's main source of natural gas for several decades,” he says. However, there are hurdles to overcome. Dr Lamarche explains the gas is trapped at such pressure that when released at the surface it expands 160 times: “It’s a massive technological problem and a hazard.”
GNS, NIWA, and the universities of Otago and Auckland have begun a government-funded project for the Hikurangi Margin. For GNS the main focus will be to quantify the concentration of gas hydrates and the quality of the reservoirs. NIWA will provide detailed information on the stratigraphic and geological architecture of the reservoirs and surroundings, and establish an ecological and biological baseline of potential exploration sites. A PhD student at the University of Otago will study potential reservoirs on the southern Hikurangi Margin, while initial production modelling will be performed at the University of Auckland.
“These studies will be critical for management and environmental protection of the sites,” says Dr Lamarche. Current funding is for two years but the aim is to assess optimal sites by 2015, when the industry will step in. Test drilling is scheduled by 2018.
In coming decades, gas hydrates could supply the bulk of New Zealand’s natural gas, says NIWA’s Dr Geoffroy Lamarche. (NIWA)
www.niwa.co.nz16 Water & Atmosphere February 2011
Ocean's treasure
The argument for adaptive management
“There will always be an impact from mining,” states Dr Alison MacDiarmid. Being dredged or sucked up to the surface then piped down again, with all the associated changes in pressure, light, and temperature, means few species or organisms will survive. “So the big questions are: how big an area is envisaged? And how fast can it recover?”
“For deepwater, we don’t yet know the answers. For shallower waters, we know more about natural processes of change, so we can ascertain more of the effects of change due to mining. But deeper than 50 metres, natural disturbance is rarer. It’s much harder to build a picture.”
“Recovery time is a huge unknown. Every month we still are finding new deepwater species. We don’t know anything about their lifestyle, so we can’t say how long they will take to recover.” On land, mining is followed by restoration, but nothing is known about restoring a deepwater environment.
This is why adaptive management is so crucial, she says. Essentially, adaptive management is about informed trial and error: learning as you go. There’s emphasis on monitoring and measurement, learning what works best, then adapting management processes accordingly. Monitoring needs to be long-term, and is a major commitment.
“It is essential to get as much information as possible, as early as possible. The sooner we get a little bit of information, the more quickly best practices can be implemented,” Dr MacDiarmid advises. Adaptive management depends on good science, so it’s important to
have close links between scientists, companies, government, and resource managers. It also means honesty.
“Our role as scientists is to be upfront about what we know, what we don’t know, and what we need to know. Our job is to provide it straight, warts and all. It’s vital we are in a position to point things out, and to point out what needs to happen. Scientists need to be in a position to inform whoever is responsible, so that clear decisions can be made one way or the other,” Dr MacDiarmid says.
Encouraging recolonisation
So, where and how should mining be permitted? General opinion appears to be that some areas of the seabed should be untouched. These protected areas will need to be unaffected by physical disturbance or sediment drift, so careful selection will be vital.
To ensure species survival, the features and communities of an area to be mined must be present in other areas. Determining this should be relatively easy for some areas, but for others, like the chemosynthetic micro-worlds of the Kermadecs, it could be problematic.
Dr Malcolm Clark observes that full baseline information is essential before any excavation. “We need to describe the natural seafloor biota before any changes are caused by human activities, and to evaluate the full spatial footprint of the predicted impacts,” he says.
Many questions will need answering. What species are down there? Which of those species are particularly vulnerable?
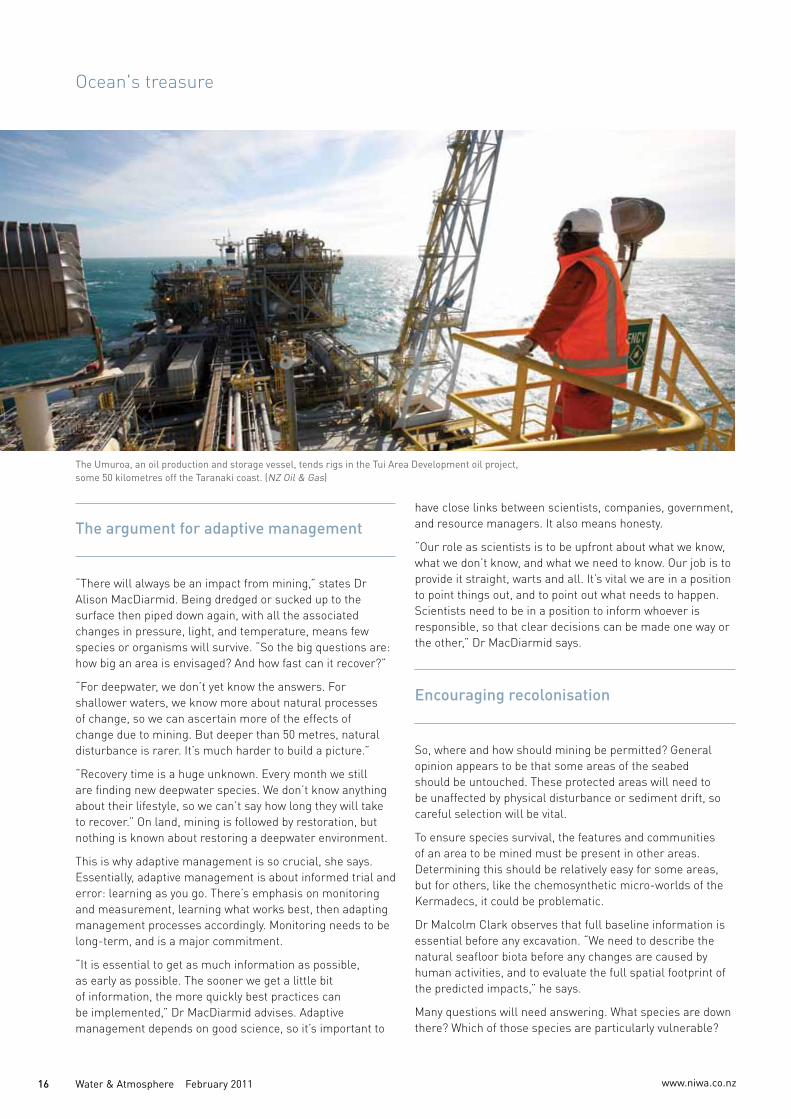
The Umuroa, an oil production and storage vessel, tends rigs in the Tui Area Development oil project, some 50 kilometres off the Taranaki coast. (NZ Oil & Gas)
www.niwa.co.nz Water & Atmosphere February 2011 17
Which are found only in the affected areas? Will sediment plumes be released? Where? Where will any toxic release go? How will downstream filter feeders be affected? Will species recolonise the areas from elsewhere? How slowly do they grow? What is the time period to any recovery?
Current thinking suggests extraction could be best undertaken in a strip or checkerboard pattern. Leaving strips or squares of untouched seabed will probably give species the best chance to recolonise impacted areas.
It will be very important to avoid releasing unwanted water or material at the surface, because that risks a plume spreading kilometres. But the impacts of pumping large volumes of water and material back down to the seafloor are unknown, and will require careful evaluation.
Dr Clark concludes: “While there is a lot to know, we have the advantage of being in the early stages of exploration. The stage is set for a challenge, but also an opportunity, for
Policy, legislation, and the new EPA
United Nations Convention on the Law of the Sea (UNCLOS)UNCLOS was ratified in 1982 and has been endorsed by over 150 countries. It confirms New Zealand’s sovereignty out to the 200 nautical mile limit of our Exclusive Economic Zone (EEZ); and since 2008, across the 1.7 million square kilometres of the extended continental shelf. Under UNCLOS, New Zealand has rights to non-living seafloor and sub-seafloor resources, such as minerals or petroleum.
International Seabed Authority’s Mining Code
The Code has rules and procedures for prospecting, exploration, and the exploitation of marine minerals within a framework established by UNCLOS.
Continental Shelf ActThis 1964 Act covers exploration and exploitation of the EEZ and extended continental shelf, including the granting of licences for prospecting and mining.
Maritime Transport ActThis 1994 Act covers maritime shipping and issues, again spanning the EEZ and extended continental shelf. Under the Act, an incident such as an oil spill would involve Maritime New Zealand.
Crown Minerals ActThe Act (1991) and associated regulations govern allocation of permits to prospect, explore, or mine minerals.
Resource Management Act (RMA)The RMA (1991) applies to the 12 nautical mile limit of New Zealand’s territorial waters. All exploration, development, and production of seabed resources must comply. Local
authorities manage consents and monitoring, with objections going to the Environment Court. The Department of Conservation has a mandate to comment on all activities.Environmental Protection Authority (EPA)The EPA was announced in 2009 as part of amendments to the Resource Management Act, and established in October 2010 within the Ministry for the Environment.
The stated purpose of the EPA is ‘to provide efficient and timely processing for proposals of national significance’. After assessing an application, the EPA will recommend to the Minister for the Environment whether it should be referred to a board of inquiry or the Environment Court. If the Minister directs such action, the EPA will notify the application and call for public submissions. More: www.epa.govt.nz
Offshore petroleum health, safety, and environmental (HSE) legislation review
A comparative review of New Zealand HSE arrangements with those of other jurisdictions was commissioned in June 2010 to ensure international best practices in New Zealand operations. Recommendations include:
•establishing an environmental assessment and approval framework for petroleum operations in the EEZ and extended continental shelf
•establishing an agency with responsibility for environmental regulation in the EEZ and extended continental shelf
•considering future consolidation of offshore environmental jurisdictions.
mining companies, scientists, and environmental managers to work together to ensure that objectives of both exploitation and conservation can be met.”
Keeping options open
Chris Baker is CEO of Straterra, the industry group representing the New Zealand resource sector. From the industry perspective, he says, it’s important for New Zealand to keep options open before making decisions about where to allow mining, and where not to.
“We don’t yet know where all the potential mines are. This is for two reasons. Firstly, it’s time consuming and expensive to find out. Secondly, there’s no incentive to find now all the mines that humanity will need over the next 100 or 1000 years.
www.niwa.co.nz18 Water & Atmosphere February 2011
Ocean's treasure
On the spot
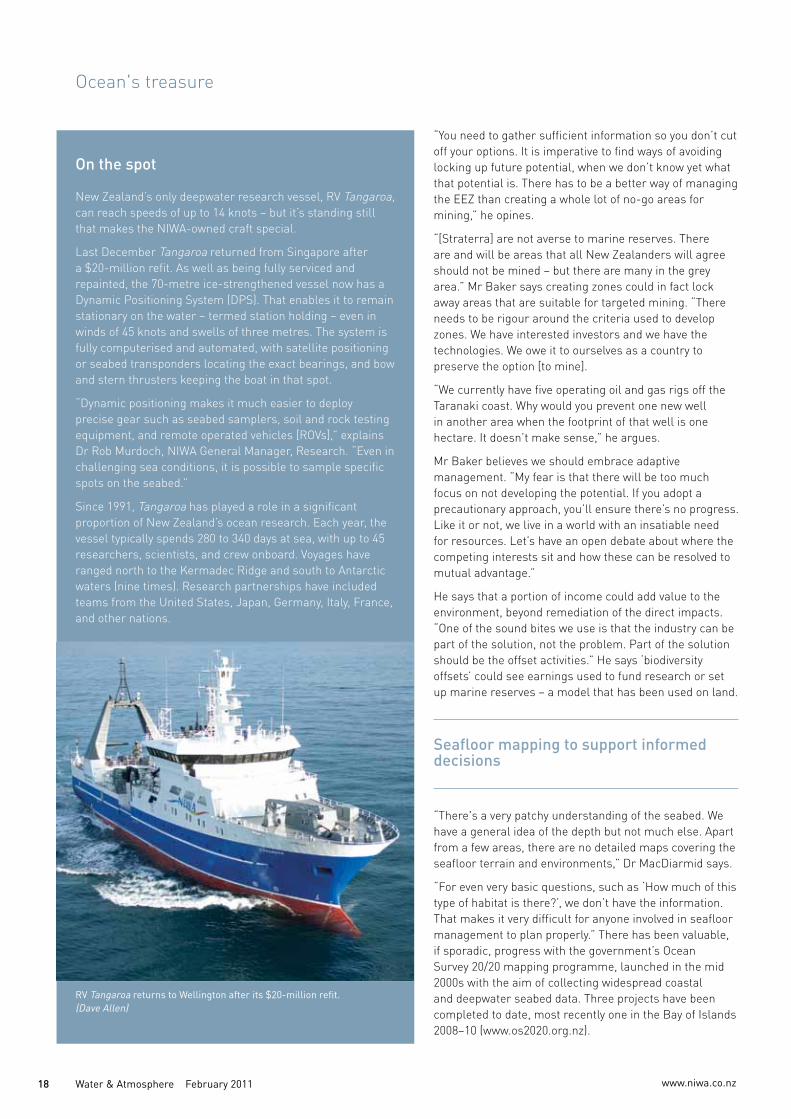
New Zealand’s only deepwater research vessel, RV Tangaroa, can reach speeds of up to 14 knots – but it’s standing still that makes the NIWA-owned craft special.
Last December Tangaroa returned from Singapore after a $20-million refit. As well as being fully serviced and repainted, the 70-metre ice-strengthened vessel now has a Dynamic Positioning System (DPS). That enables it to remain stationary on the water – termed station holding – even in winds of 45 knots and swells of three metres. The system is fully computerised and automated, with satellite positioning or seabed transponders locating the exact bearings, and bow and stern thrusters keeping the boat in that spot.
“Dynamic positioning makes it much easier to deploy precise gear such as seabed samplers, soil and rock testing equipment, and remote operated vehicles [ROVs],” explains Dr Rob Murdoch, NIWA General Manager, Research. “Even in challenging sea conditions, it is possible to sample specific spots on the seabed.”
Since 1991, Tangaroa has played a role in a significant proportion of New Zealand’s ocean research. Each year, the vessel typically spends 280 to 340 days at sea, with up to 45 researchers, scientists, and crew onboard. Voyages have ranged north to the Kermadec Ridge and south to Antarctic waters (nine times). Research partnerships have included teams from the United States, Japan, Germany, Italy, France, and other nations.
“You need to gather sufficient information so you don’t cut off your options. It is imperative to find ways of avoiding locking up future potential, when we don’t know yet what that potential is. There has to be a better way of managing the EEZ than creating a whole lot of no-go areas for mining,” he opines.
“[Straterra] are not averse to marine reserves. There are and will be areas that all New Zealanders will agree should not be mined – but there are many in the grey area.” Mr Baker says creating zones could in fact lock away areas that are suitable for targeted mining. “There needs to be rigour around the criteria used to develop zones. We have interested investors and we have the technologies. We owe it to ourselves as a country to preserve the option [to mine].
“We currently have five operating oil and gas rigs off the Taranaki coast. Why would you prevent one new well in another area when the footprint of that well is one hectare. It doesn’t make sense,” he argues.
Mr Baker believes we should embrace adaptive management. “My fear is that there will be too much focus on not developing the potential. If you adopt a precautionary approach, you’ll ensure there’s no progress. Like it or not, we live in a world with an insatiable need for resources. Let’s have an open debate about where the competing interests sit and how these can be resolved to mutual advantage.”
He says that a portion of income could add value to the environment, beyond remediation of the direct impacts. “One of the sound bites we use is that the industry can be part of the solution, not the problem. Part of the solution should be the offset activities.” He says ‘biodiversity offsets’ could see earnings used to fund research or set up marine reserves – a model that has been used on land.
Seafloor mapping to support informed decisions
“There's a very patchy understanding of the seabed. We have a general idea of the depth but not much else. Apart from a few areas, there are no detailed maps covering the seafloor terrain and environments,” Dr MacDiarmid says.
“For even very basic questions, such as ‘How much of this type of habitat is there?’, we don’t have the information. That makes it very difficult for anyone involved in seafloor management to plan properly.” There has been valuable, if sporadic, progress with the government’s Ocean Survey 20/20 mapping programme, launched in the mid 2000s with the aim of collecting widespread coastal and deepwater seabed data. Three projects have been completed to date, most recently one in the Bay of Islands 2008–10 (www.os2020.org.nz).
RV Tangaroa returns to Wellington after its $20-million refit. (Dave Allen)
www.niwa.co.nz Water & Atmosphere February 2011 19
OS20/20 involves acoustic mapping to determine the depth of the seafloor and hardness, from which probable habitats can be determined and later confirmed with remote camera systems. Dr MacDiarmid was involved in the Bay of Islands survey and endorses the intent of the programme. She believes OS20/20 deserves ramping back up to the initial vision.
Time for a sea change?
“Our oceans need to be better managed if we are to safeguard the full range of their marine life and ecosystem services,” says Bronwen Golder, Director of the Kermadecs Initiative of the Pew Environment Group (PEG). “That will require that key decisions on if, and how, to proceed with the extraction of offshore resources must include measures to protect our marine environment and coastal economies.
“Decisions about offshore development must consider safety and security, commercial and recreational activities, and the critical ecosystem services provided by healthy oceans. If extractive development is to be part of our agenda, then it shouldn't be at the expense of cultural and environmental values our ocean currently provides,” she argues.
Dr Rob Murdoch, NIWA’s General Manager, Research, concurs with that thinking. “Under international law and agreement, New Zealand has one of the largest areas of marine estate on the planet,” he observes. “To realise the resources, and do so in a responsible way, we need an overall approach to guide the stewardship and management of the ocean estate. We need a cohesive oceans policy.”
Such a policy would encompass the country’s coastline to the outer limit of the extended continental shelf. It would support research and surveillance, building the knowledge base for responsible use of resources. It would also assist in managing areas of conflict, such as between fisheries and minerals interests.
From 2000 there was initial work to develop an oceans policy, but progress stalled when debate focused on immediate foreshore zones. There’s currently fragmentation of stewardship between local authorities and a whole range of government agencies. Within the 12 nautical mile limit there’s the transparency of the RMA, but beyond that things are less clear.
“There’s nothing pulling it all together. There needs to be greater cohesion across central and local government,” Dr Murdoch states. He notes that future oceans policy development could lead to one government agency taking an overall lead in stewardship.
As well as leaving the environment at threat, the current lack of a guiding oceans policy means there’s less protection for the rights of exploration and mining companies. Exposure to risk will deter long-term investment and growth.
“There needs to be a framework so all interests can compete fairly," says Straterra’s Chris Baker. “Mining companies need secure title over the resource. How you achieve that in a new frontier, I wouldn’t be arrogant enough to say I know the answer. But I certainly want to be round the table to work out how the framework can be developed. It’s a new frontier. There’s the opportunity to develop a framework that works for the whole range of interests.”
Dr Alison MacDiarmid urges: “We need to have the national conversation about the all-embracing oceans governance. We have to get this national conversation going quickly.”
Science, adds Dr Malcolm Clark, should be there all the way. “Policy and regulation need to be based on good science. We don’t do research to lock things away. We do it to help decision makers balance exploration and protection. It’s our role to inform managers: to give them information they can use.”
Jim Robinson is a Qantas Award-winning freelance journalist and copywriter: www.penandink.co.nzMore information: Dr Rob Murdoch, [email protected]
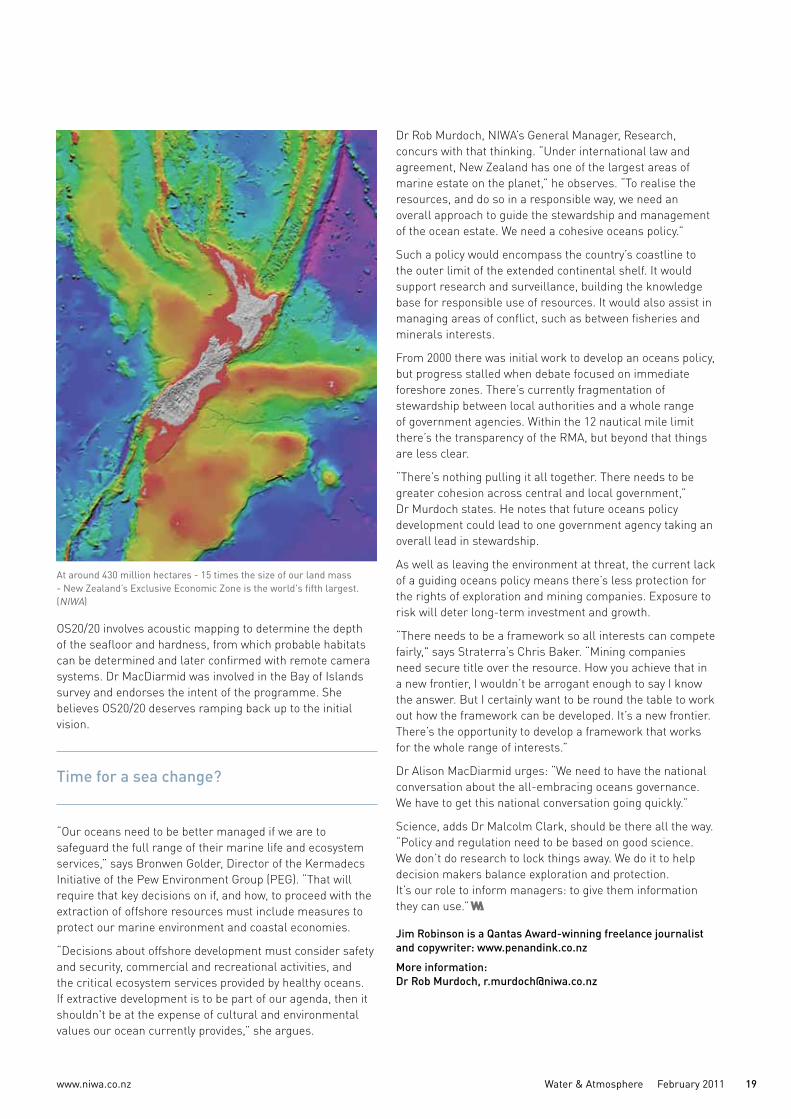
At around 430 million hectares - 15 times the size of our land mass - New Zealand’s Exclusive Economic Zone is the world's fifth largest.(NIWA)
www.niwa.co.nz20 Water & Atmosphere February 2011
1
2
www.niwa.co.nz Water & Atmosphere February 2011 21
It’s a wonderful worldNews reporting of the natural world tends to focus on ‘charismatic megafauna’ – the big and the beautiful, the strong and the terrible – like polar bears, pandas, whales, and sharks. Far from the easy headlines, however, a fascinating array of smaller, uglier creatures are lynchpins of ecosystems. Here Water & Atmosphere profiles two of our favourites: a creature which can liquefy its body, and one which uses its sucker-like mouth to drink the blood of its prey.
Lamprey: vampires of the sea
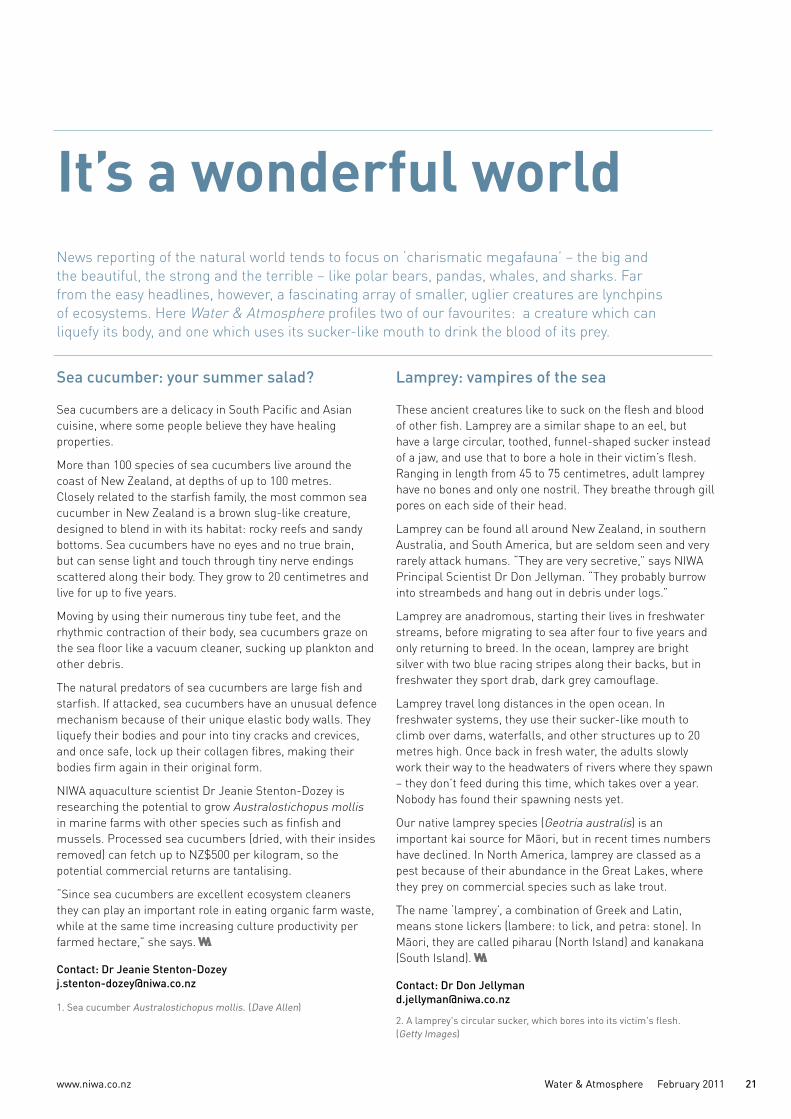
These ancient creatures like to suck on the flesh and blood of other fish. Lamprey are a similar shape to an eel, but have a large circular, toothed, funnel-shaped sucker instead of a jaw, and use that to bore a hole in their victim’s flesh. Ranging in length from 45 to 75 centimetres, adult lamprey have no bones and only one nostril. They breathe through gill pores on each side of their head.
Lamprey can be found all around New Zealand, in southern Australia, and South America, but are seldom seen and very rarely attack humans. “They are very secretive,” says NIWA Principal Scientist Dr Don Jellyman. “They probably burrow into streambeds and hang out in debris under logs.”
Lamprey are anadromous, starting their lives in freshwater streams, before migrating to sea after four to five years and only returning to breed. In the ocean, lamprey are bright silver with two blue racing stripes along their backs, but in freshwater they sport drab, dark grey camouflage.
Lamprey travel long distances in the open ocean. In freshwater systems, they use their sucker-like mouth to climb over dams, waterfalls, and other structures up to 20 metres high. Once back in fresh water, the adults slowly work their way to the headwaters of rivers where they spawn – they don’t feed during this time, which takes over a year. Nobody has found their spawning nests yet.
Our native lamprey species (Geotria australis) is an important kai source for Māori, but in recent times numbers have declined. In North America, lamprey are classed as a pest because of their abundance in the Great Lakes, where they prey on commercial species such as lake trout.
The name ‘lamprey’, a combination of Greek and Latin, means stone lickers (lambere: to lick, and petra: stone). In Māori, they are called piharau (North Island) and kanakana (South Island).
Contact: Dr Don Jellyman [email protected]
2. A lamprey's circular sucker, which bores into its victim's flesh. (Getty Images)
Sea cucumber: your summer salad?
Sea cucumbers are a delicacy in South Pacific and Asian cuisine, where some people believe they have healing properties.
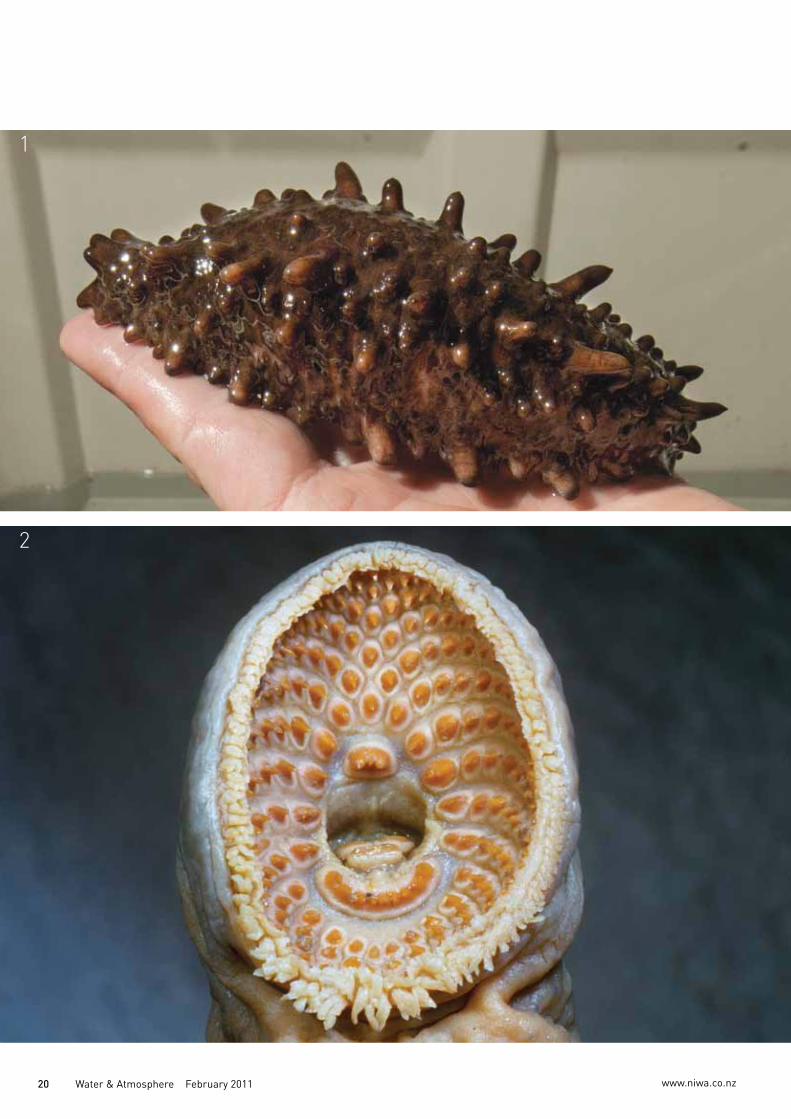
More than 100 species of sea cucumbers live around the coast of New Zealand, at depths of up to 100 metres. Closely related to the starfish family, the most common sea cucumber in New Zealand is a brown slug-like creature, designed to blend in with its habitat: rocky reefs and sandy bottoms. Sea cucumbers have no eyes and no true brain, but can sense light and touch through tiny nerve endings scattered along their body. They grow to 20 centimetres and live for up to five years.
Moving by using their numerous tiny tube feet, and the rhythmic contraction of their body, sea cucumbers graze on the sea floor like a vacuum cleaner, sucking up plankton and other debris.
The natural predators of sea cucumbers are large fish and starfish. If attacked, sea cucumbers have an unusual defence mechanism because of their unique elastic body walls. They liquefy their bodies and pour into tiny cracks and crevices, and once safe, lock up their collagen fibres, making their bodies firm again in their original form.
NIWA aquaculture scientist Dr Jeanie Stenton-Dozey is researching the potential to grow Australostichopus mollis in marine farms with other species such as finfish and mussels. Processed sea cucumbers (dried, with their insides removed) can fetch up to NZ$500 per kilogram, so the potential commercial returns are tantalising.
“Since sea cucumbers are excellent ecosystem cleaners they can play an important role in eating organic farm waste, while at the same time increasing culture productivity per farmed hectare,” she says.
Contact: Dr Jeanie Stenton-Dozey [email protected]
1. Sea cucumber Australostichopus mollis. (Dave Allen)
www.niwa.co.nz22 Water & Atmosphere February 2011
Where will the young fish play?
Flow-on effects of the loss of seagrass are significant for other parts of the ecosystem too. “If you degrade a habitat, then you degrade the density of the fish associated with that habitat. It has a cascade effect,” says Dr Mark Morrison, NIWA fisheries ecologist. Research has shown just how vulnerable adult fish populations are to habitat disruption in juvenile nurseries. For example, says Dr Morrison, “We now know that Kaipara Harbour is the single main nursery for juvenile snapper on the North Island’s west coast. If the nursery habitat is lost here, the whole west coast commercial snapper fishery will be lost too.”
Fish hungry for habitat
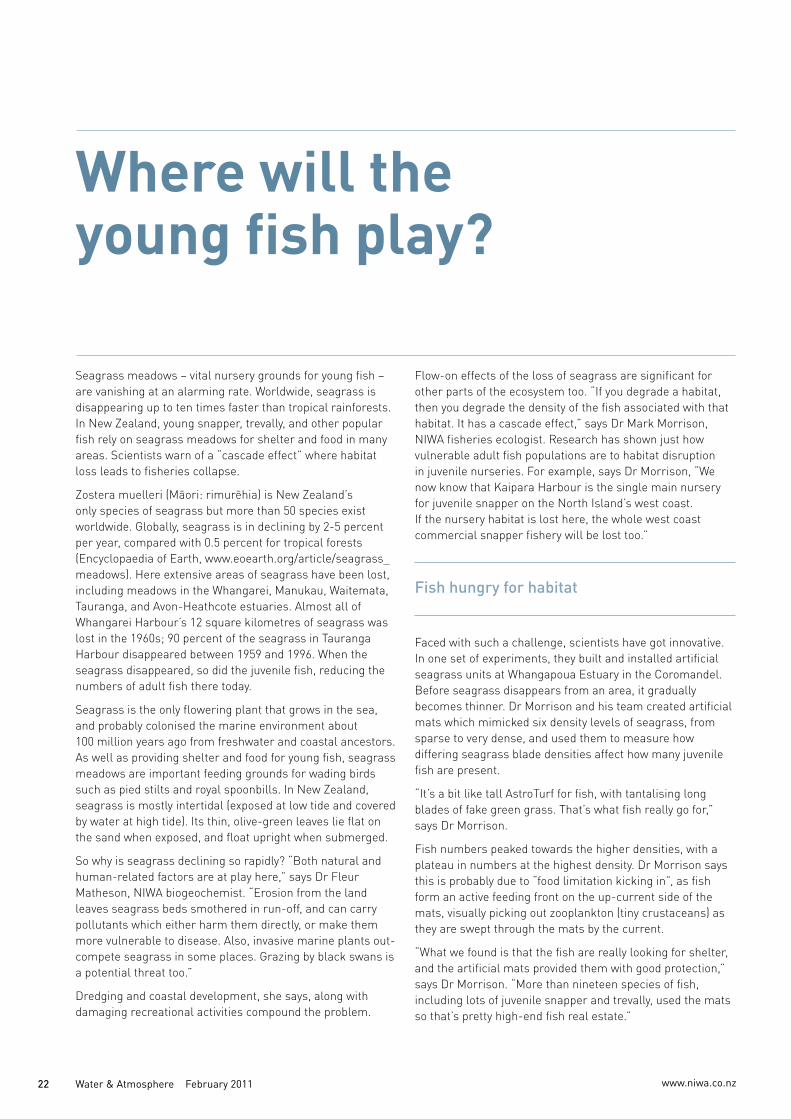
Faced with such a challenge, scientists have got innovative. In one set of experiments, they built and installed artificial seagrass units at Whangapoua Estuary in the Coromandel. Before seagrass disappears from an area, it gradually becomes thinner. Dr Morrison and his team created artificial mats which mimicked six density levels of seagrass, from sparse to very dense, and used them to measure how differing seagrass blade densities affect how many juvenile fish are present.
“It’s a bit like tall AstroTurf for fish, with tantalising long blades of fake green grass. That’s what fish really go for,” says Dr Morrison.
Fish numbers peaked towards the higher densities, with a plateau in numbers at the highest density. Dr Morrison says this is probably due to “food limitation kicking in”, as fish form an active feeding front on the up-current side of the mats, visually picking out zooplankton (tiny crustaceans) as they are swept through the mats by the current.
“What we found is that the fish are really looking for shelter, and the artificial mats provided them with good protection,” says Dr Morrison. “More than nineteen species of fish, including lots of juvenile snapper and trevally, used the mats so that’s pretty high-end fish real estate.”
Seagrass meadows – vital nursery grounds for young fish – are vanishing at an alarming rate. Worldwide, seagrass is disappearing up to ten times faster than tropical rainforests. In New Zealand, young snapper, trevally, and other popular fish rely on seagrass meadows for shelter and food in many areas. Scientists warn of a “cascade effect” where habitat loss leads to fisheries collapse.
Zostera muelleri (Māori: rimurēhia) is New Zealand’s only species of seagrass but more than 50 species exist worldwide. Globally, seagrass is in declining by 2-5 percent per year, compared with 0.5 percent for tropical forests (Encyclopaedia of Earth, www.eoearth.org/article/seagrass_meadows). Here extensive areas of seagrass have been lost, including meadows in the Whangarei, Manukau, Waitemata, Tauranga, and Avon-Heathcote estuaries. Almost all of Whangarei Harbour’s 12 square kilometres of seagrass was lost in the 1960s; 90 percent of the seagrass in Tauranga Harbour disappeared between 1959 and 1996. When the seagrass disappeared, so did the juvenile fish, reducing the numbers of adult fish there today.
Seagrass is the only flowering plant that grows in the sea, and probably colonised the marine environment about 100 million years ago from freshwater and coastal ancestors. As well as providing shelter and food for young fish, seagrass meadows are important feeding grounds for wading birds such as pied stilts and royal spoonbills. In New Zealand, seagrass is mostly intertidal (exposed at low tide and covered by water at high tide). Its thin, olive-green leaves lie flat on the sand when exposed, and float upright when submerged.
So why is seagrass declining so rapidly? “Both natural and human-related factors are at play here,” says Dr Fleur Matheson, NIWA biogeochemist. “Erosion from the land leaves seagrass beds smothered in run-off, and can carry pollutants which either harm them directly, or make them more vulnerable to disease. Also, invasive marine plants out-compete seagrass in some places. Grazing by black swans is a potential threat too.”
Dredging and coastal development, she says, along with damaging recreational activities compound the problem.
www.niwa.co.nz Water & Atmosphere February 2011 23
The scientists are now developing a model of how changing seagrass blade density affects fish populations. The next series of experiments, led by NIWA’s Dr Darren Parsons, will focus on how fish survival, growth, and movement vary in relation to seagrass blade density.
In the meantime, Dr Matheson is working on ways to help seagrass recover naturally, by transplanting locally-sourced healthy plants to areas where degradation has occurred. With Northland Regional Council and the local kaitiaki roopu, trials have been carried out in Whangarei Harbour.
Dr Matheson says eliminating the cause of the decline is key to the success of the transplanting – the water quality and seabed conditions must be suitable for seagrass growth.
“In 2009 we transplanted nine square metres of plants to one site using a couple of different techniques,” says Dr Matheson. “These plants are now thriving and spreading, which is very encouraging, and the kaitiaki roopu report that snapper have returned to this area.” This year, the scientists will transplant more plants to two more sites in the harbour.
Artificial seagrass beds in Whangapoua Estuary, Coromandel, provide an attractive nursery environment for juvenile fish, including spotties. (Crispin Middleton)
Encouragingly, in the Auckland region, seagrass is expanding or re-establishing in parts of the lower Kaipara Harbour, and at Snells Beach and St Heliers Beach.
Good news also from Whangarei Harbour, where a significant area of seagrass has returned and in fact more than half the harbour area reportedly has seagrass now. Restoration has helped the return of seagrass; there is also a lot of natural recovery thanks to better management of discharges in the upper harbour since the 1970s improved water clarity in the lower harbour.
There are still extensive seagrass meadows in some other harbours; these include Parengarenga, Rangaunu, Kaipara, Kawhia, Tairua, and Tauranga in the North Island, Wanganui Inlet, Farewell Spit, and Bluff Harbour in the South Island, and Paterson Inlet in Stewart Island.
Written by Jayne Cooper-Woodhouse and Harriet Palmer, NIWA science writersMore information: Dr Mark Morrison, [email protected]; Dr Fleur Matheson, [email protected]
www.niwa.co.nz24 Water & Atmosphere February 2011
The air we breathe: who's most at risk?
The annual cost of air pollution
Auckland
• 600 premature deaths
• 750 000 days of people’s lives hampered by pollution-related illnesses such as asthma and bronchitis
• $547 million cost to the health sector.
(State of the Auckland Region report 2010)
Christchurch
• 168 premature deaths
• health costs of $168 million.
(Health and Air Pollution in New Zealand: Christchurch pilot study, 2007)
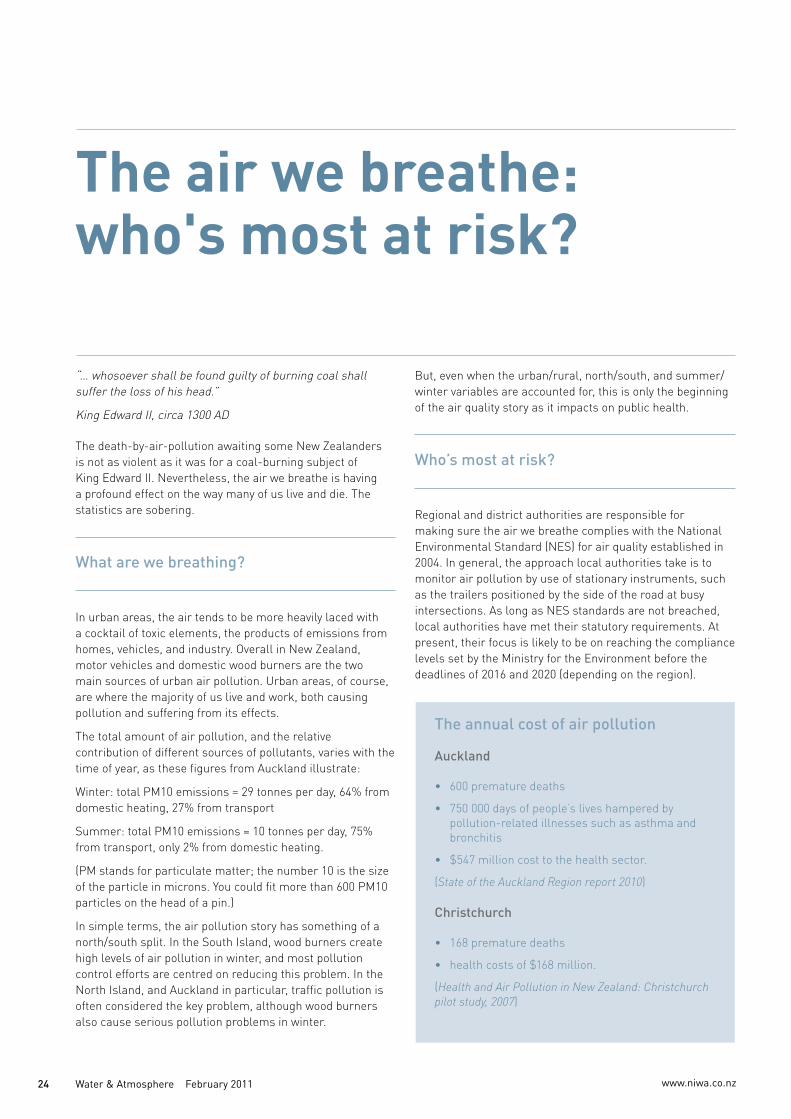
“… whosoever shall be found guilty of burning coal shall suffer the loss of his head.”
King Edward II, circa 1300 AD
The death-by-air-pollution awaiting some New Zealanders is not as violent as it was for a coal-burning subject of King Edward II. Nevertheless, the air we breathe is having a profound effect on the way many of us live and die. The statistics are sobering.
What are we breathing?
In urban areas, the air tends to be more heavily laced with a cocktail of toxic elements, the products of emissions from homes, vehicles, and industry. Overall in New Zealand, motor vehicles and domestic wood burners are the two main sources of urban air pollution. Urban areas, of course, are where the majority of us live and work, both causing pollution and suffering from its effects.
The total amount of air pollution, and the relative contribution of different sources of pollutants, varies with the time of year, as these figures from Auckland illustrate:
Winter: total PM10 emissions = 29 tonnes per day, 64% from domestic heating, 27% from transport
Summer: total PM10 emissions = 10 tonnes per day, 75% from transport, only 2% from domestic heating.
(PM stands for particulate matter; the number 10 is the size of the particle in microns. You could fit more than 600 PM10 particles on the head of a pin.)
In simple terms, the air pollution story has something of a north/south split. In the South Island, wood burners create high levels of air pollution in winter, and most pollution control efforts are centred on reducing this problem. In the North Island, and Auckland in particular, traffic pollution is often considered the key problem, although wood burners also cause serious pollution problems in winter.
But, even when the urban/rural, north/south, and summer/winter variables are accounted for, this is only the beginning of the air quality story as it impacts on public health.
Who’s most at risk?
Regional and district authorities are responsible for making sure the air we breathe complies with the National Environmental Standard (NES) for air quality established in 2004. In general, the approach local authorities take is to monitor air pollution by use of stationary instruments, such as the trailers positioned by the side of the road at busy intersections. As long as NES standards are not breached, local authorities have met their statutory requirements. At present, their focus is likely to be on reaching the compliance levels set by the Ministry for the Environment before the deadlines of 2016 and 2020 (depending on the region).
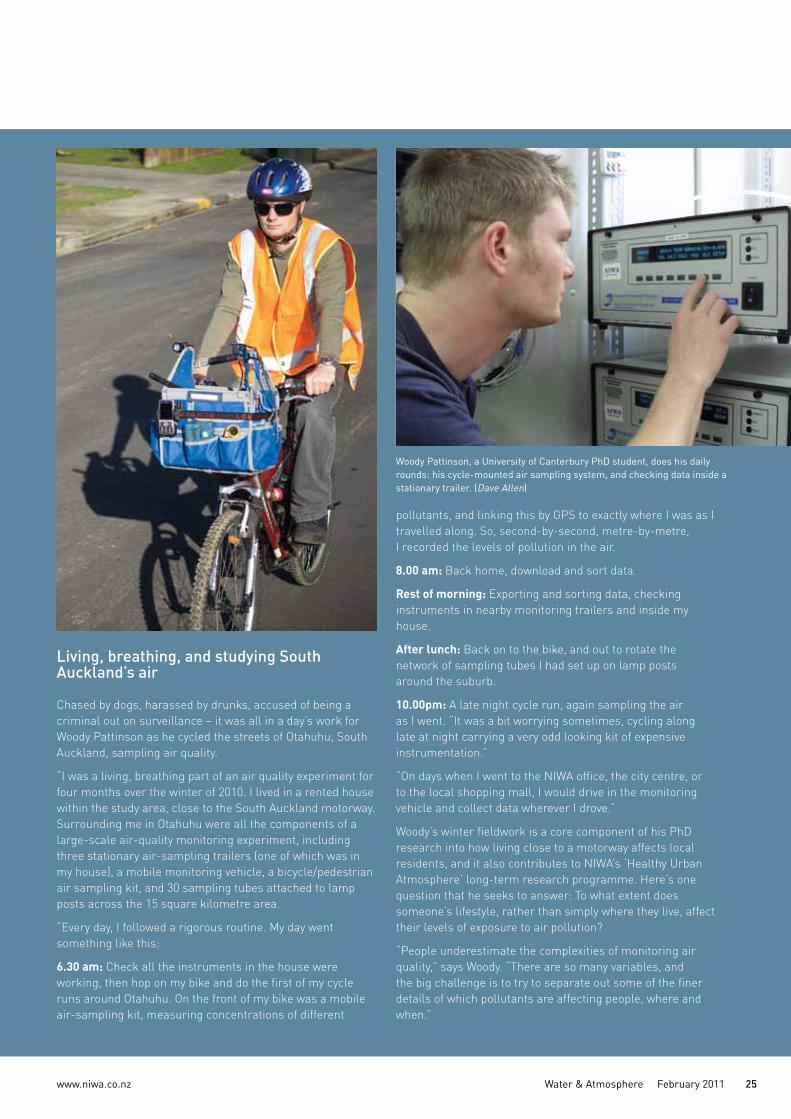
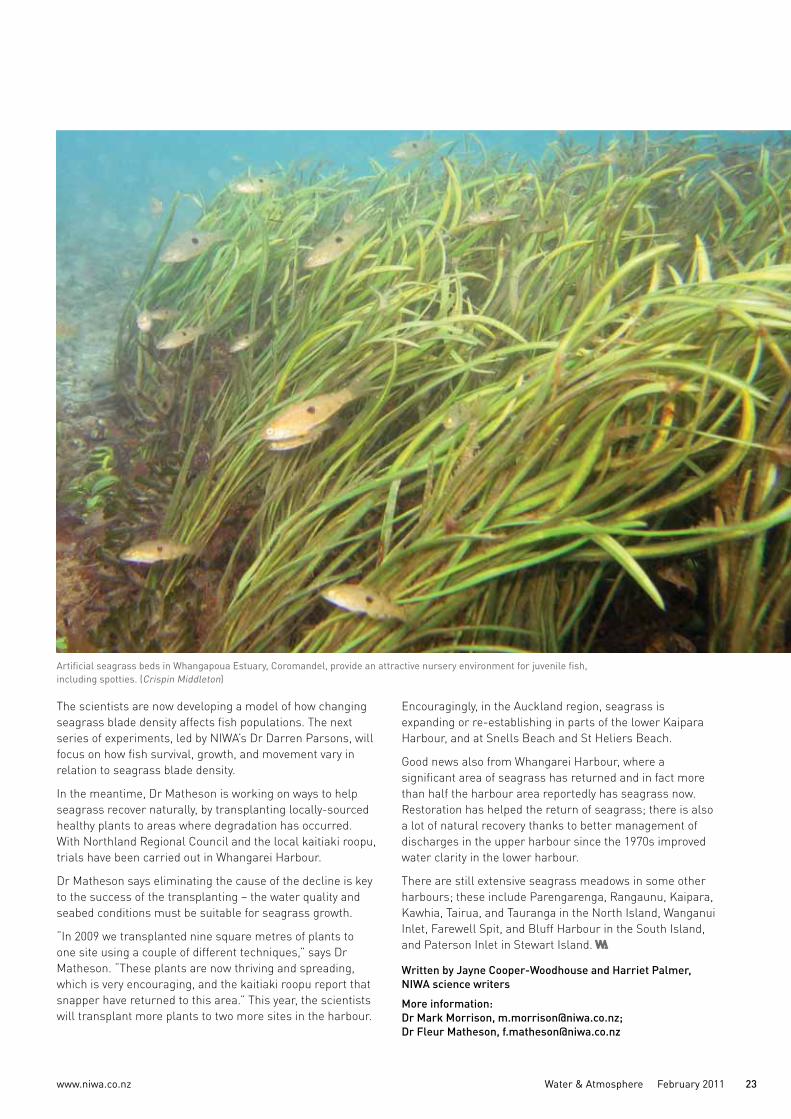
Living, breathing, and studying South Auckland’s air
Chased by dogs, harassed by drunks, accused of being a criminal out on surveillance – it was all in a day’s work for Woody Pattinson as he cycled the streets of Otahuhu, South Auckland, sampling air quality.
“I was a living, breathing part of an air quality experiment for four months over the winter of 2010. I lived in a rented house within the study area, close to the South Auckland motorway. Surrounding me in Otahuhu were all the components of a large-scale air-quality monitoring experiment, including three stationary air-sampling trailers (one of which was in my house), a mobile monitoring vehicle, a bicycle/pedestrian air sampling kit, and 30 sampling tubes attached to lamp posts across the 15 square kilometre area.
“Every day, I followed a rigorous routine. My day went something like this:
6.30 am: Check all the instruments in the house were working, then hop on my bike and do the first of my cycle runs around Otahuhu. On the front of my bike was a mobile air-sampling kit, measuring concentrations of different
pollutants, and linking this by GPS to exactly where I was as I travelled along. So, second-by-second, metre-by-metre, I recorded the levels of pollution in the air.
8.00 am: Back home, download and sort data.
Rest of morning: Exporting and sorting data, checking instruments in nearby monitoring trailers and inside my house.
After lunch: Back on to the bike, and out to rotate the network of sampling tubes I had set up on lamp posts around the suburb.
10.00pm: A late night cycle run, again sampling the air as I went. “It was a bit worrying sometimes, cycling along late at night carrying a very odd looking kit of expensive instrumentation.”
“On days when I went to the NIWA office, the city centre, or to the local shopping mall, I would drive in the monitoring vehicle and collect data wherever I drove.”
Woody’s winter fieldwork is a core component of his PhD research into how living close to a motorway affects local residents, and it also contributes to NIWA’s ‘Healthy Urban Atmosphere’ long-term research programme. Here’s one question that he seeks to answer: To what extent does someone’s lifestyle, rather than simply where they live, affect their levels of exposure to air pollution?
“People underestimate the complexities of monitoring air quality,” says Woody. “There are so many variables, and the big challenge is to try to separate out some of the finer details of which pollutants are affecting people, where and when.”
www.niwa.co.nz Water & Atmosphere February 2011 25
Woody Pattinson, a University of Canterbury PhD student, does his daily rounds: his cycle-mounted air sampling system, and checking data inside a stationary trailer. (Dave Allen)
www.niwa.co.nz26 Water & Atmosphere February 2011
The air we breathe: who is most at risk?
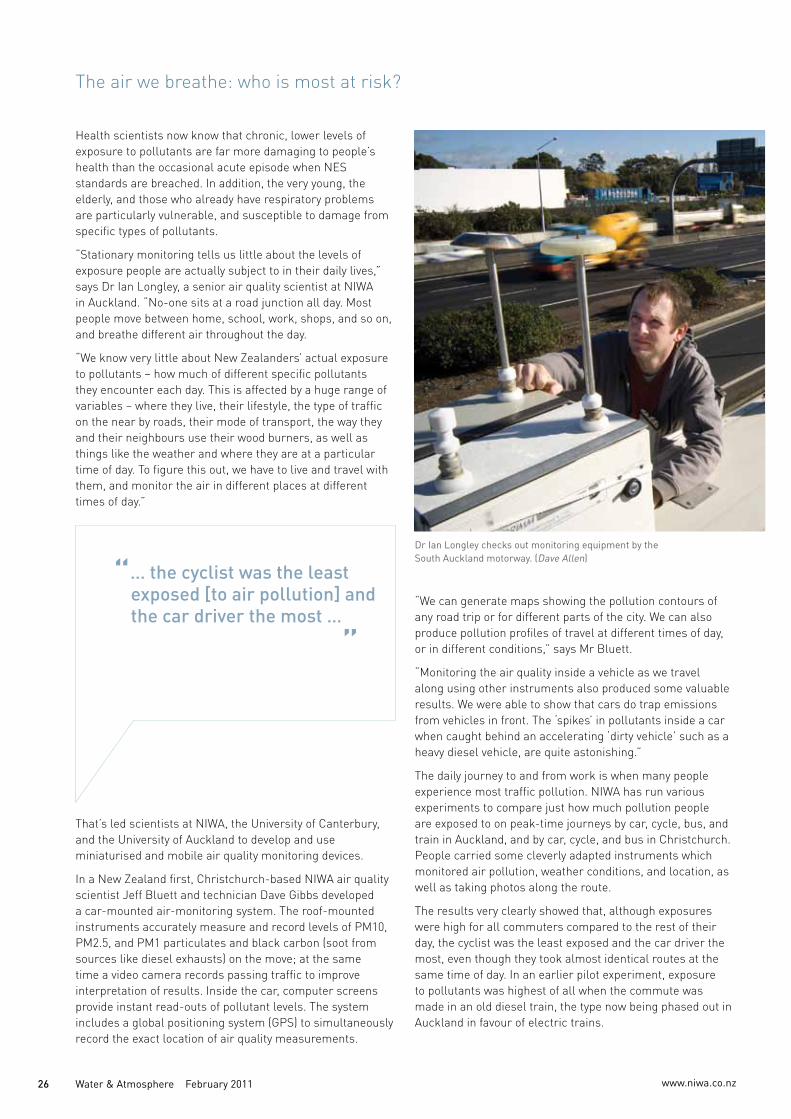
Health scientists now know that chronic, lower levels of exposure to pollutants are far more damaging to people’s health than the occasional acute episode when NES standards are breached. In addition, the very young, the elderly, and those who already have respiratory problems are particularly vulnerable, and susceptible to damage from specific types of pollutants.
“Stationary monitoring tells us little about the levels of exposure people are actually subject to in their daily lives,” says Dr Ian Longley, a senior air quality scientist at NIWA in Auckland. “No-one sits at a road junction all day. Most people move between home, school, work, shops, and so on, and breathe different air throughout the day.
“We know very little about New Zealanders’ actual exposure to pollutants – how much of different specific pollutants they encounter each day. This is affected by a huge range of variables – where they live, their lifestyle, the type of traffic on the near by roads, their mode of transport, the way they and their neighbours use their wood burners, as well as things like the weather and where they are at a particular time of day. To figure this out, we have to live and travel with them, and monitor the air in different places at different times of day.”
“… the cyclist was the least exposed [to air pollution] and the car driver the most …
”
“We can generate maps showing the pollution contours of any road trip or for different parts of the city. We can also produce pollution profiles of travel at different times of day, or in different conditions,” says Mr Bluett.
“Monitoring the air quality inside a vehicle as we travel along using other instruments also produced some valuable results. We were able to show that cars do trap emissions from vehicles in front. The ‘spikes’ in pollutants inside a car when caught behind an accelerating ‘dirty vehicle’ such as a heavy diesel vehicle, are quite astonishing.”
The daily journey to and from work is when many people experience most traffic pollution. NIWA has run various experiments to compare just how much pollution people are exposed to on peak-time journeys by car, cycle, bus, and train in Auckland, and by car, cycle, and bus in Christchurch. People carried some cleverly adapted instruments which monitored air pollution, weather conditions, and location, as well as taking photos along the route.
The results very clearly showed that, although exposures were high for all commuters compared to the rest of their day, the cyclist was the least exposed and the car driver the most, even though they took almost identical routes at the same time of day. In an earlier pilot experiment, exposure to pollutants was highest of all when the commute was made in an old diesel train, the type now being phased out in Auckland in favour of electric trains.
Dr Ian Longley checks out monitoring equipment by the South Auckland motorway. (Dave Allen)
That’s led scientists at NIWA, the University of Canterbury, and the University of Auckland to develop and use miniaturised and mobile air quality monitoring devices.
In a New Zealand first, Christchurch-based NIWA air quality scientist Jeff Bluett and technician Dave Gibbs developed a car-mounted air-monitoring system. The roof-mounted instruments accurately measure and record levels of PM10, PM2.5, and PM1 particulates and black carbon (soot from sources like diesel exhausts) on the move; at the same time a video camera records passing traffic to improve interpretation of results. Inside the car, computer screens provide instant read-outs of pollutant levels. The system includes a global positioning system (GPS) to simultaneously record the exact location of air quality measurements.

www.niwa.co.nz Water & Atmosphere February 2011 27
New tools for regional councils
Another challenge for scientists is analysing long-term runs of air-quality data. Local authorities need to know how well mitigation measures they have introduced are working, but it has been very difficult for them to compare air monitoring data from one year or time period to the next, because of the variables that affect the data.
“What happens to emissions can vary every night,” explains Jeff Bluett, “because of varying weather conditions. For example, the night-time temperature, wind speed and direction, and relative humidity can all vary significantly from one night to the next. Also, we might have a relatively warm winter one year and a harsh one the next. This makes it very difficult to compare pollutant concentrations, not just over different nights but also between years.”
NIWA is developing statistical analyses that tease out key meteorological variables from concentration variables, enabling year-on-year comparisons of air quality. Simple spreadsheet-based tools that can be used by regional authority staff will soon be ready.
NIWA is now leading a major eight-year Foundation for Research, Science & Technology-funded ‘Healthy Urban Atmosphere’ research programme, which runs until 2016. Other funders and collaborators include local authorities, the
Pollutant Type and main sources Health impacts
Benzene Colourless, sweet-smelling gas. Motor vehicle emissions and domestic fires.
Causes drowsiness, headaches, skin, eye, and respiratory infections. High levels cause unconsciousness. Carcinogen.
1,3 Butadiene Colourless gas. Motor vehicle emissions. Irritates eyes, nose, throat, and lungs. Probable carcinogen.
Carbon monoxide* Colourless gas. Mainly motor vehicle emissions.
Interferes with blood’s ability to absorb and circulate oxygen. Extreme levels are fatal.
Nitrogen dioxide* Brown pungent gas.Burning fossil fuels, especially by motor vehicles.
Irritates lungs, worsens asthma, lowers resistance to infections.Causes haze and smog and contributes to acid rain.
Ozone* Colourless gas – a secondary pollutant when nitrogen oxides mix with hydrocarbons in sunlight.
Irritates eyes, nose, and throat; damages lungs, especially in infants and the elderly.Causes smog.
Particulates (PM10*) – inhalable
Solid and liquid particles – dust, soot, wood smoke, vehicle exhausts, pollen, etc.
Respiratory and cardiac problems. Act as transporters of carcinogens to the lungs.
Particulates (PM2.5*, PM1) - respirable
Smaller fraction of PM10. Fine particles most damaging; penetrate deep into the lungs.
Sulphur dioxide* Colourless pungent gas.Industrial processes and burning fossil fuels.
Irritates lungs. Asthmatics badly affected. Can aggravate heart disease.
* most commonly monitored by regional authorities. Inhalable particles are breathed in, but usually don’t make it past the mucus linings of the nose and throat. Respirable particles are smaller and can get deep into the lungs. The ultrafine ones can enter the blood stream and even end up in organs such as the heart and brain.
Air pollutants – what they are, and how they harm us
NZ Transport Authority, ministries of Health and Transport, the universities of Auckland and Canterbury, Landcare Research, and Australian researchers working in the same field.
Much of the research will build on the pilot work done by NIWA and its collaborators over the past few years.
Projects include looking more closely at indoor exposure to air pollutants, examining the use of wood burners and the pollution they cause, and investigating road dust and sea salt as sources of pollutants. On a larger scale, one project is looking at the emissions footprint of neighbourhoods, and how the way a neighbourhood is designed influences emissions and exposure.
Dr Guy Coulson, research programme leader, summarises the challenges ahead. “This is a fast-moving area of science: new instrumentation and new assessment methods are improving our understanding of pollution concentrations and their health impacts. We’re working out what questions we can and cannot tackle with these new techniques.
“Knowing more about personal exposure will, at the very least, enable us to better inform people who may unwittingly be encountering levels of air pollution that put their health at risk. In the case of vulnerable people, it could make a big difference to their quality of life and life expectancy.”
Written by Harriet Palmer, a NIWA science writer.More information: Dr Guy Coulson, [email protected]
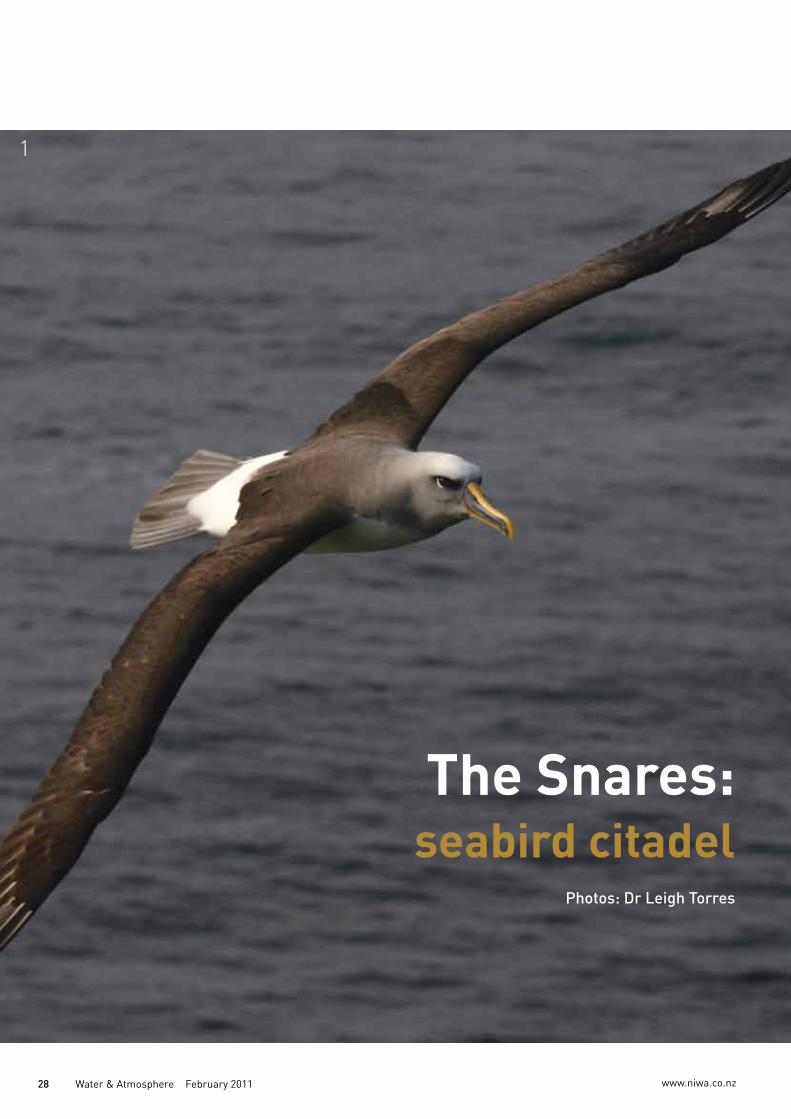
www.niwa.co.nz28 Water & Atmosphere February 2011
1
The Snares: seabird citadel
Photos: Dr Leigh Torres
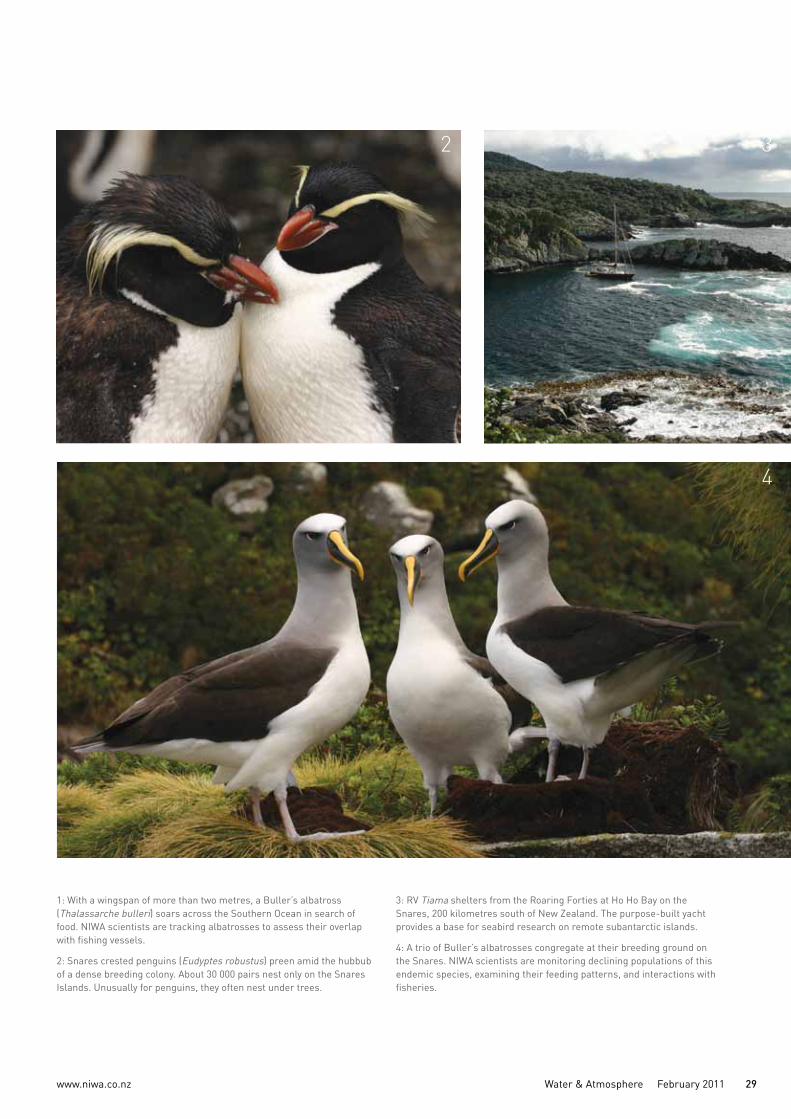
www.niwa.co.nz Water & Atmosphere February 2011 29
1: With a wingspan of more than two metres, a Buller’s albatross (Thalassarche bulleri) soars across the Southern Ocean in search of food. NIWA scientists are tracking albatrosses to assess their overlap with fishing vessels.
2: Snares crested penguins (Eudyptes robustus) preen amid the hubbub of a dense breeding colony. About 30 000 pairs nest only on the Snares Islands. Unusually for penguins, they often nest under trees.
2 3
4
3: RV Tiama shelters from the Roaring Forties at Ho Ho Bay on the Snares, 200 kilometres south of New Zealand. The purpose-built yacht provides a base for seabird research on remote subantarctic islands.
4: A trio of Buller’s albatrosses congregate at their breeding ground on the Snares. NIWA scientists are monitoring declining populations of this endemic species, examining their feeding patterns, and interactions with fisheries.
www.niwa.co.nz30 Water & Atmosphere February 2011
Early warning for Samoa
Samoa’s devastating 2009 tsunami highlighted the importance of early warning systems for the small Pacific nation. But the Samoan community is also looking for an early warning of another kind – a system to help the islands cope with the changing climate.
As a small economy reliant on agriculture, fishing, forestry, and tourism, Samoa is particularly vulnerable to the anticipated effects of climate change: rising sea level and changes to the frequency and severity of tropical cyclones, drought, flooding, and increased risks of climate-related disease and pests. All are seen as a barrier to the country’s future development.
Samoans see their climate changing
Anne Rasmussen is Principal Officer on Climate Change for the Ministry of Natural Resources and Environment (MNRE) in Samoa. She says ‘climate change’ is a still a relatively new term in Samoa, but the people have been aware that it has been happening for some time.
“Their traditional knowledge and observations over the years show incremental changes to their landscape, affecting food crops and their livelihoods. They know instinctively that it’s happening. And now the government is working hard to integrate climate change adaptation programmes into all sectors. We cannot continue to think of it as just an environmental issue.”
A century of meteorological data collected by the Samoa Meteorology Division supports the anecdotal evidence of the community. Temperatures have increased by 0.59 °C on average; annual precipitation has decreased by almost 50 millimetres; sea level at Apia has risen by 4.6 millimetres a year for the period 1993–2009.
What would projected climate change mean for Samoa? The Meteorology Division’s Climate Risk Profile warns of reduced overall annual rainfall, more high-intensity rainfall, higher average temperatures, and increased intensity of cyclones. And a projected sea-level rise of 36 centimetres by
2050 is a significant threat, given that 70 percent of Samoa’s population and infrastructure is in low-lying coastal areas.
The Samoan community has critical concerns about the effects of climate change: fluctuating food production, impacts of drought and flooding on water quality and availability, more vector-borne and water-borne diseases, higher risk of forest fires, damage to low-lying infrastructure, and land loss. Impacts on energy supplies and tourism are further concerns.
Samoa makes an action plan
Following three years of community consultation, the Government of Samoa addressed those concerns by formulating a National Adaptation Programme of Action. The NAPA, as it is known, sets out a coordinated countrywide response to these climate-change risks.
The community consultations identified nine priority projects, including CLEWS, a climate early warning system. CLEWS is designed to help the country respond quickly and effectively to adverse climate events and, in the longer term, to adapt to changes in the climate, particularly where they affect agriculture and health.
The system is being implemented in three stages:
1. strengthening Samoa’s existing climate monitoring network
2. installing a new database to archive and deliver climate data
3. developing a range of climate information reports and warnings for government departments and other agricultural and health stakeholders.
NIWA climate scientist Alan Porteous says the impetus for the early warning system has come from the Samoan people.
“The MNRE took the opportunity to consult widely across the country, and then secured enough funding to provide enduring outcomes for Samoa.
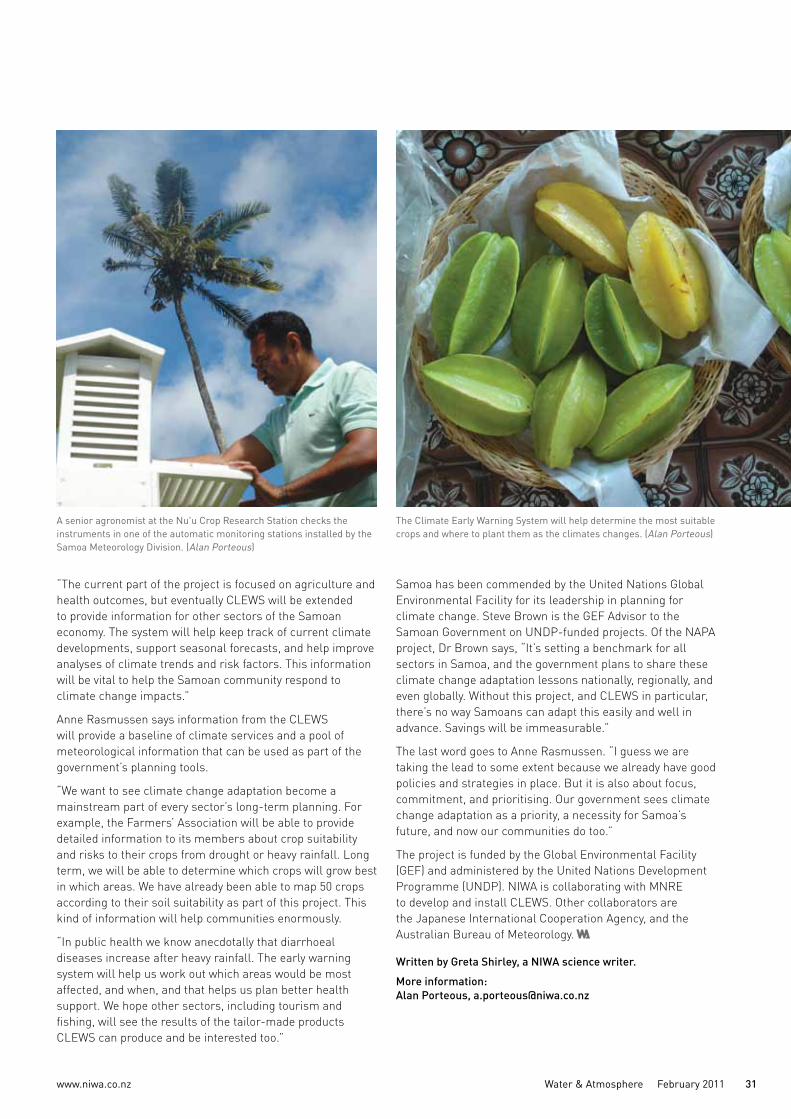
www.niwa.co.nz Water & Atmosphere February 2011 31
The Climate Early Warning System will help determine the most suitable crops and where to plant them as the climates changes. (Alan Porteous)
A senior agronomist at the Nu'u Crop Research Station checks the instruments in one of the automatic monitoring stations installed by the Samoa Meteorology Division. (Alan Porteous)
Samoa has been commended by the United Nations Global Environmental Facility for its leadership in planning for climate change. Steve Brown is the GEF Advisor to the Samoan Government on UNDP-funded projects. Of the NAPA project, Dr Brown says, “It’s setting a benchmark for all sectors in Samoa, and the government plans to share these climate change adaptation lessons nationally, regionally, and even globally. Without this project, and CLEWS in particular, there’s no way Samoans can adapt this easily and well in advance. Savings will be immeasurable.”
The last word goes to Anne Rasmussen. “I guess we are taking the lead to some extent because we already have good policies and strategies in place. But it is also about focus, commitment, and prioritising. Our government sees climate change adaptation as a priority, a necessity for Samoa’s future, and now our communities do too.”
The project is funded by the Global Environmental Facility (GEF) and administered by the United Nations Development Programme (UNDP). NIWA is collaborating with MNRE to develop and install CLEWS. Other collaborators are the Japanese International Cooperation Agency, and the Australian Bureau of Meteorology.
Written by Greta Shirley, a NIWA science writer.More information: Alan Porteous, [email protected]
“The current part of the project is focused on agriculture and health outcomes, but eventually CLEWS will be extended to provide information for other sectors of the Samoan economy. The system will help keep track of current climate developments, support seasonal forecasts, and help improve analyses of climate trends and risk factors. This information will be vital to help the Samoan community respond to climate change impacts.”
Anne Rasmussen says information from the CLEWS will provide a baseline of climate services and a pool of meteorological information that can be used as part of the government’s planning tools.
“We want to see climate change adaptation become a mainstream part of every sector’s long-term planning. For example, the Farmers’ Association will be able to provide detailed information to its members about crop suitability and risks to their crops from drought or heavy rainfall. Long term, we will be able to determine which crops will grow best in which areas. We have already been able to map 50 crops according to their soil suitability as part of this project. This kind of information will help communities enormously.
“In public health we know anecdotally that diarrhoeal diseases increase after heavy rainfall. The early warning system will help us work out which areas would be most affected, and when, and that helps us plan better health support. We hope other sectors, including tourism and fishing, will see the results of the tailor-made products CLEWS can produce and be interested too.”
www.niwa.co.nz32 Water & Atmosphere February 2011
Water safe after 1080 drop
The pesticide known as 1080 is a key weapon in the battle against New Zealand’s plague of possums, helping to control bovine tuberculosis and protect native biodiversity. Aerial dispersal of 1080 pellets from helicopters is the most efficient and cost-effective way of deploying the pesticide in inaccessible areas, but public concerns persist. One concern is over potential contamination of water supplies following aerial drops, despite 20 years of research that shows this is very unlikely.
Between 1990 and 2008, Landcare Research tested 2098 water samples following aerial 1080 operations. Taken during the subsequent 24 hours, just three per cent were found to contain traces of 1080 and, apart from one test suspected of contamination, levels averaged 0.2 parts per billion. This is well below the Ministry of Health’s precautionary drinking water standard of two parts per billion. Importantly, no 1080 has been detected in drinking water supplies.
In a study for the Animal Health Board, NIWA intensively sampled a West Coast stream after an aerial drop of cereal 1080 baits in August 2009. The study was aimed at investigating the potential for short-term contamination from baits landing directly in the stream, and rainfall leaching 1080 from baits.
“Even in a worst-case scenario, the amount of 1080 detected in the stream was extremely small and transient, with levels well below the drinking water standard set by the Ministry of Health,” says NIWA freshwater ecologist Dr Alastair Suren, who led the research.
Reducing risks of contamination
Because it is highly water soluble, 1080 (sodium fluoroacetate) readily leaches from cereal baits exposed to rain. 1080 from uneaten baits could get into streams and rivers via soil water (the moisture held in soil) and runoff, or directly from baits falling into streams.
Although 1080 is rapidly diluted, some regional councils require a bait-free buffer around larger streams during aerial drops to reduce the risk of contamination. The Department of Conservation and the Animal Health Board also avoid aerial 1080 drops in water-supply catchments, and time their operations to coincide with dry spells.
Designing a worst-case scenario
“For the NIWA study, we deliberately tested 1080 levels under a worst-case scenario: in a small stream in steep country after rain and in cool temperatures,” says Dr Suren.
Laboratory studies by Landcare Research have shown that 1080 is broken down into harmless components by micro-organisms and aquatic plants, with faster breakdown in warmer temperatures. Regardless of temperature, dilution has a much greater and quicker effect than biological breakdown in reducing 1080 levels in water.
The 150-hectare study site was chosen because it was steep (to maximise potential runoff), had a relatively shallow soil profile (to maximise the flow of soil water towards the stream), and was drained by a single small stream, less than a metre wide (to minimise the dilution effect). The study was conducted soon after a much larger bait drop in the area. With most of the possums in the area already poisoned, there would presumably be more uneaten baits lying around.
What the scientists did
The scientists set their instruments to measure rainfall and stream flow every 15 minutes during the experiment, and took frequent water samples from the stream at the base of the catchment to ensure their sampling represented flow from the entire area covered by 1080 baits.
They tested intensively for 1080 in stream samples when it was most likely to be found – after significant rainfall.
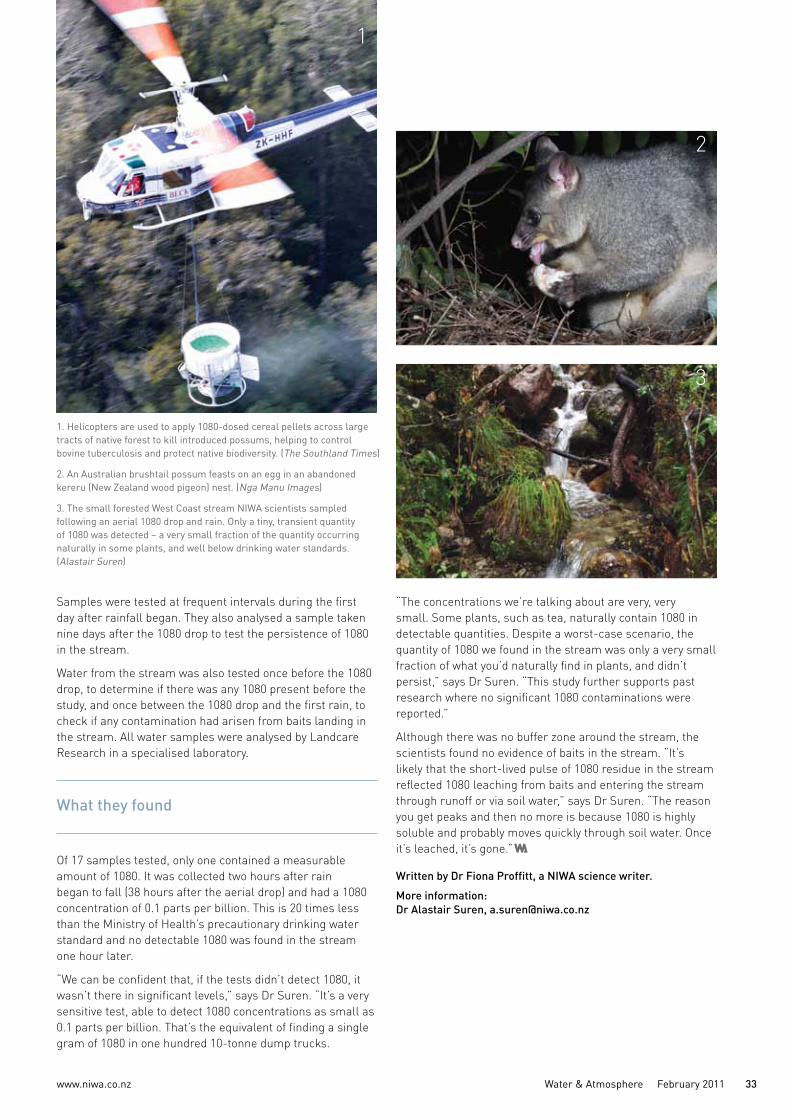
www.niwa.co.nz Water & Atmosphere February 2011 33
1. Helicopters are used to apply 1080-dosed cereal pellets across large tracts of native forest to kill introduced possums, helping to control bovine tuberculosis and protect native biodiversity. (The Southland Times)
2. An Australian brushtail possum feasts on an egg in an abandoned kereru (New Zealand wood pigeon) nest. (Nga Manu Images)
3. The small forested West Coast stream NIWA scientists sampled following an aerial 1080 drop and rain. Only a tiny, transient quantity of 1080 was detected – a very small fraction of the quantity occurring naturally in some plants, and well below drinking water standards. (Alastair Suren)
“The concentrations we’re talking about are very, very small. Some plants, such as tea, naturally contain 1080 in detectable quantities. Despite a worst-case scenario, the quantity of 1080 we found in the stream was only a very small fraction of what you’d naturally find in plants, and didn’t persist,” says Dr Suren. “This study further supports past research where no significant 1080 contaminations were reported.”
Although there was no buffer zone around the stream, the scientists found no evidence of baits in the stream. “It’s likely that the short-lived pulse of 1080 residue in the stream reflected 1080 leaching from baits and entering the stream through runoff or via soil water,” says Dr Suren. “The reason you get peaks and then no more is because 1080 is highly soluble and probably moves quickly through soil water. Once it’s leached, it’s gone.”
Written by Dr Fiona Proffitt, a NIWA science writer.More information: Dr Alastair Suren, [email protected]
Samples were tested at frequent intervals during the first day after rainfall began. They also analysed a sample taken nine days after the 1080 drop to test the persistence of 1080 in the stream.
Water from the stream was also tested once before the 1080 drop, to determine if there was any 1080 present before the study, and once between the 1080 drop and the first rain, to check if any contamination had arisen from baits landing in the stream. All water samples were analysed by Landcare Research in a specialised laboratory.
What they found
Of 17 samples tested, only one contained a measurable amount of 1080. It was collected two hours after rain began to fall (38 hours after the aerial drop) and had a 1080 concentration of 0.1 parts per billion. This is 20 times less than the Ministry of Health’s precautionary drinking water standard and no detectable 1080 was found in the stream one hour later.
“We can be confident that, if the tests didn’t detect 1080, it wasn’t there in significant levels,” says Dr Suren. “It’s a very sensitive test, able to detect 1080 concentrations as small as 0.1 parts per billion. That’s the equivalent of finding a single gram of 1080 in one hundred 10-tonne dump trucks.
2
3
1
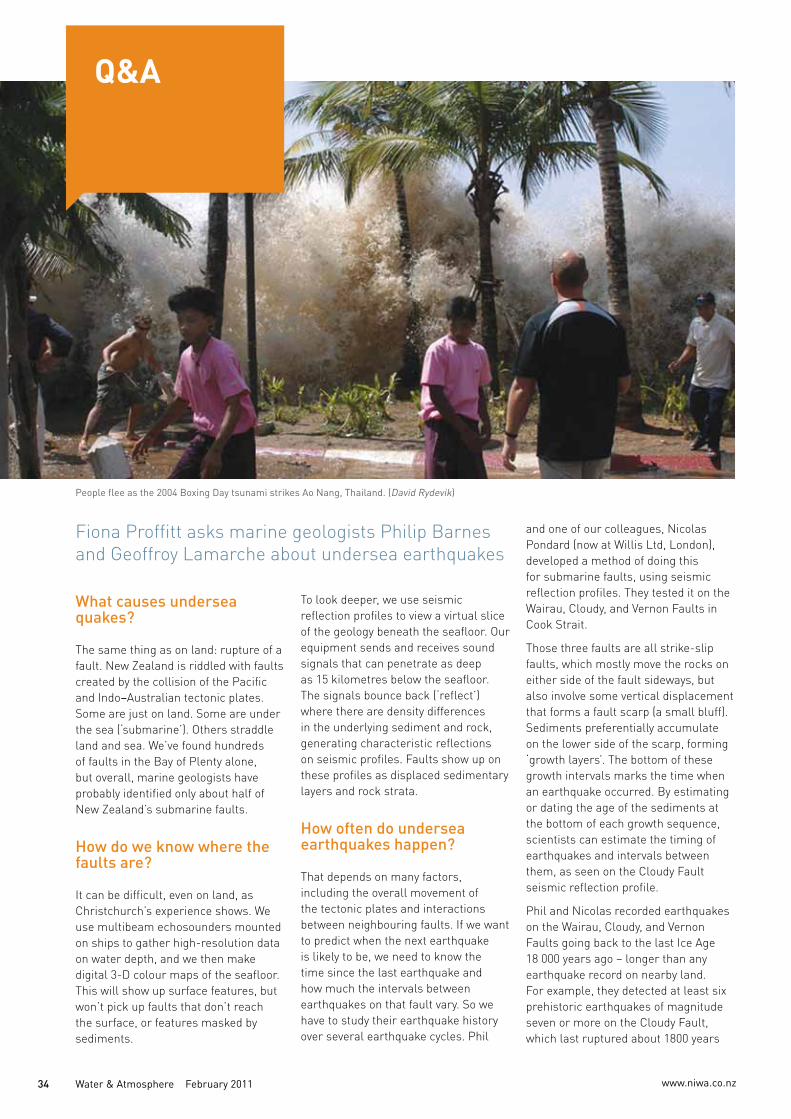
www.niwa.co.nz34 Water & Atmosphere February 2011
Q&A
What causes undersea quakes?
The same thing as on land: rupture of a fault. New Zealand is riddled with faults created by the collision of the Pacific and Indo–Australian tectonic plates. Some are just on land. Some are under the sea (‘submarine’). Others straddle land and sea. We’ve found hundreds of faults in the Bay of Plenty alone, but overall, marine geologists have probably identified only about half of New Zealand’s submarine faults.
How do we know where the faults are?
It can be difficult, even on land, as Christchurch’s experience shows. We use multibeam echosounders mounted on ships to gather high-resolution data on water depth, and we then make digital 3-D colour maps of the seafloor. This will show up surface features, but won’t pick up faults that don’t reach the surface, or features masked by sediments.
To look deeper, we use seismic reflection profiles to view a virtual slice of the geology beneath the seafloor. Our equipment sends and receives sound signals that can penetrate as deep as 15 kilometres below the seafloor. The signals bounce back (‘reflect’) where there are density differences in the underlying sediment and rock, generating characteristic reflections on seismic profiles. Faults show up on these profiles as displaced sedimentary layers and rock strata.
How often do undersea earthquakes happen?
That depends on many factors, including the overall movement of the tectonic plates and interactions between neighbouring faults. If we want to predict when the next earthquake is likely to be, we need to know the time since the last earthquake and how much the intervals between earthquakes on that fault vary. So we have to study their earthquake history over several earthquake cycles. Phil
People flee as the 2004 Boxing Day tsunami strikes Ao Nang, Thailand. (David Rydevik)
and one of our colleagues, Nicolas Pondard (now at Willis Ltd, London), developed a method of doing this for submarine faults, using seismic reflection profiles. They tested it on the Wairau, Cloudy, and Vernon Faults in Cook Strait.
Those three faults are all strike-slip faults, which mostly move the rocks on either side of the fault sideways, but also involve some vertical displacement that forms a fault scarp (a small bluff). Sediments preferentially accumulate on the lower side of the scarp, forming ‘growth layers’. The bottom of these growth intervals marks the time when an earthquake occurred. By estimating or dating the age of the sediments at the bottom of each growth sequence, scientists can estimate the timing of earthquakes and intervals between them, as seen on the Cloudy Fault seismic reflection profile.
Phil and Nicolas recorded earthquakes on the Wairau, Cloudy, and Vernon Faults going back to the last Ice Age 18 000 years ago – longer than any earthquake record on nearby land. For example, they detected at least six prehistoric earthquakes of magnitude seven or more on the Cloudy Fault, which last ruptured about 1800 years
Fiona Proffitt asks marine geologists Philip Barnes and Geoffroy Lamarche about undersea earthquakes
www.niwa.co.nz Water & Atmosphere February 2011 35
NIWA (the National Institute of Water & Atmospheric Research) was established as a Crown Research Institute in 1992. It operates as a stand-alone company with its own Board of Directors, and is wholly owned by the New Zealand government.
NIWA’s expertise is in:
•Aquaculture&biotechnology•Atmosphere•Biodiversity&biosecurity•Climate•Coasts•Energy• Fisheries• Freshwater•Ma-ori development•Naturalhazards•Oceans•PacificRim
NIWA employs approximately 750 scientists, technicians, and support staff. Our people are our greatest asset.
NIWA also owns and operates nationally significant scientific infrastructure, including a fleet of research vessels, a high performance computing facility, and unique environmental monitoring networks, databases, and collections.
Back cover:
This two week old Buller’s albatross chick will spend about four more months on its pedestal nest before fledging. Scientists put tracking tags on parents when they are still alternating between chick guarding and foraging trips. Once the chicks are about three weeks old, their parents leave them unattended while they forage. (Leigh Torres)
NIWA - leading environmental science
ago. Earthquakes occurred on this fault every 2700 years on average, vertically displacing the seafloor sediments by an average of 2.7 metres.
How big and dangerous are they?
The size of submarine earthquakes depends on the size and type of fault that causes them. A combination of fault length, depth, and angle determines its overall size or area. Because it’s on a low angle, a thrust fault (where one side is pushed over the other), has a bigger surface area than a vertically aligned fault that reaches the same depth in the Earth’s crust. In many cases thrust faults can generate bigger earthquakes, especially at ‘subduction’ zones, where one tectonic plate is being thrust beneath the other.
The danger that active faults pose depends not only on their size, but also on the rate of displacement, and location, relative to where buildings and people are. Many submarine faults that lie within about 100 kilometres of the coast have the potential to cause strong earthquake ground shaking or tsunami on adjacent land. For instance, the Wairau, Vernon, and Cloudy Faults all pose a major earthquake and tsunami hazard to central New Zealand. A rupture on one fault can put stress on another, triggering further quakes sooner than otherwise, if the faults overlap closely. In New Zealand, earthquakes are unlikely to spread from the North Island to the South Island, because the overlap of the faults from one island to another isn’t sufficiently close.
Do all big quakes generate tsunami?
Ruptures of any of the big faults can cause tsunami if they move the seafloor sufficiently to displace the water above. Shallowly dipping thrust faults have the greatest potential to displace water over enormous areas. The massive tsunami in Indonesia on Boxing Day 2004, for instance, was caused by a 1200-kilometre-long megathrust fault.
Strike-slip faults tend to be less of a threat, displacing water over much smaller areas. A normal fault (where most movement is vertical) will also create more localised water displacement. Earthquakes on the Wairau, Cloudy, and Vernon strike-slip faults typically involve several metres of vertical displacement, so they could produce local tsunami.
Scientists determine future earthquake and tsunami hazards with probabilistic models, using information on return times, magnitude, and long-term ‘slip rates’ (how fast the two sides of a fault are slipping relative to one another), among other things.
Dr Fiona Proffitt is a NIWA science writer.Dr Philip Barnes and Dr Geoffroy Lamarche are members of the NIWA Ocean Geology Group.More information: [email protected]; [email protected]
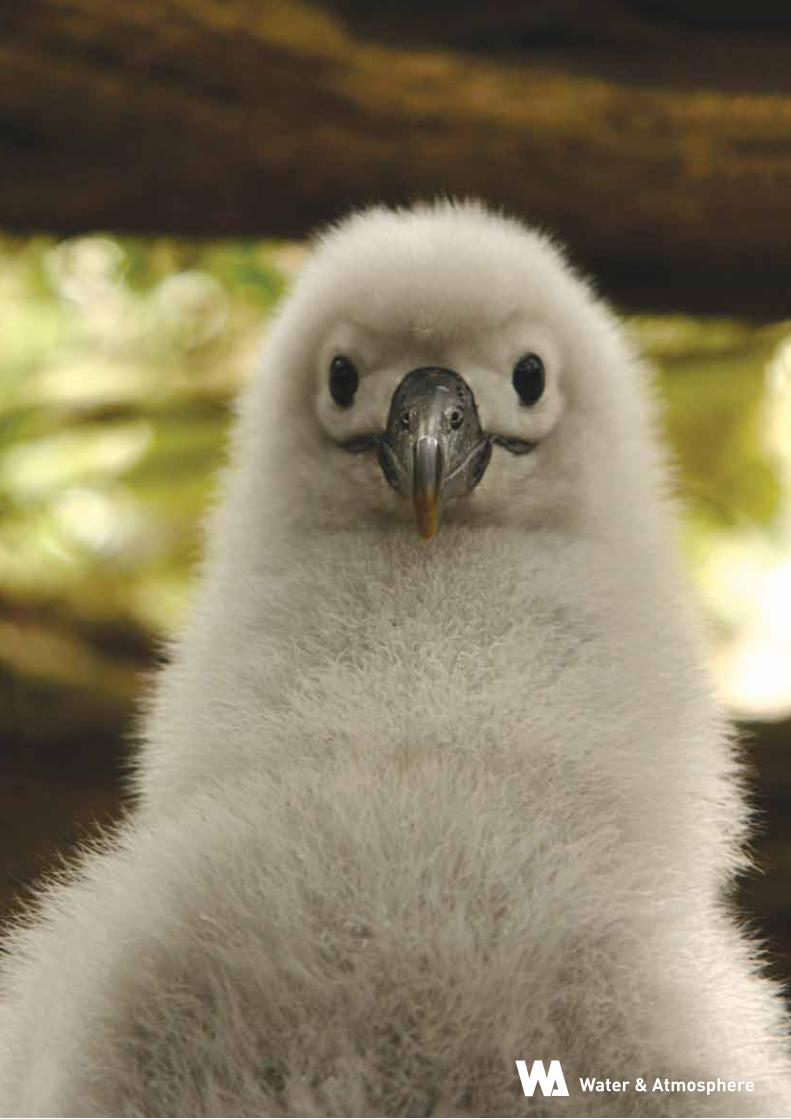
Water & Atmosphere
Related Documents