Water and Nitrogen Balance in Natural and Agricultural Systems in the Wet Tropics of North Queensland: a Review Keith L. Bristow, Peter J. Thorburn, Caecelia A. Sweeney and Heiko P. Bohl

Welcome message from author
This document is posted to help you gain knowledge. Please leave a comment to let me know what you think about it! Share it to your friends and learn new things together.
Transcript

Water and Nitrogen Balance in Naturaland Agricultural Systems in the WetTropics of North Queensland: a Review
Keith L. Bristow, Peter J. Thorburn, Caecelia A. Sweeney and Heiko P. Bohl
Published by: Land and Water Resources Research and Development CorporationGPO Box 2182Canberra ACT 2601Telephone: (02) 6257 3379Facsimile: (02) 6257 3420Email: [email protected]: www.lwrrdc.gov.au
© LWRRDC
Disclaimer: The information contained in this publication has been published by LWRRDC to assist publicknowledge and discussion and to help improve the sustainable management of land, water andvegetation. Where technical information has been prepared by or contributed by authorsexternal to the Corporation, readers should contact the author(s), and conduct their ownenquiries, before making use of that information.
Publication data: ‘Water and Nitrogen Balance in Natural and Agricultural Systems in the Wet Tropics of NorthQueensland: A Review’, Occasional Paper RAPPS03/98.
Authors Keith Bristow* Peter ThorburnCSIRO Land and Water CSIRO Tropical AgriculturePMB PO Box 306 Carmody RoadAitkenvale QLD 4814 St Lucia QLD 4067Telephone: (07) 4753 8596 Telephone: (07) 3214 2316Facsimile: (07) 4753 8600 Facsimile: (07) 3214 2325Email: [email protected] Email: [email protected]
Caecelia Sweeney Heiko Bohl*Queensland Department CSIRO Land and Waterof Natural Resources PMB PO BoxResource Sciences Centre Aitkenvale QLD 481480 Meiers Road Telephone: (07) 4753 8596Indooroopilly QLD 4068 Facsimile: (07) 4753 8600Telephone: (07) 3896 9302 Email: [email protected]: (07) 3896 9898Email: [email protected]
* Keith Bristow and Heiko Bohl can alternatively be contacted through the CRC forSustainable Sugar Production, James Cook University, Townsville QLD 4811.Telephone: (07) 7781 5763Facsimile: (07) 7781 5506Email: [email protected]
ISSN 1441-2764
ISBN 0 642 26747 2
Design by: Arawang Communication Group
Printed by: Expo Document Copy Centre
December 1998
iii
Contents
Executive summary .......................................................................................................................................... 1
Introduction ...................................................................................................................................................... 3
The wet tropics ................................................................................................................................................. 4Location and climate .................................................................................................................................... 4Soils .............................................................................................................................................................. 6Land use ........................................................................................................................................................ 8Water and nitrogen balance—a general overview ....................................................................................... 9
Water balance .......................................................................................................................................... 9Nitrogen balance ................................................................................................................................... 10
Rainforests ...................................................................................................................................................... 13Water balance.............................................................................................................................................. 13
Precipitation .......................................................................................................................................... 13Run-off and streamflow ........................................................................................................................ 14Evapotranspiration ................................................................................................................................ 15Deep drainage ....................................................................................................................................... 15
Nitrogen balance ......................................................................................................................................... 15Nitrogen inputs ..................................................................................................................................... 15Nitrogen outputs ................................................................................................................................... 17Cycling between nitrogen pools ........................................................................................................... 17
Impacts of deforestation ............................................................................................................................. 18Changes to soil properties and the water balance ................................................................................ 18Changes to the nitrogen cycle ............................................................................................................... 19
Summary ..................................................................................................................................................... 19
Agricultural systems ...................................................................................................................................... 20Water balance.............................................................................................................................................. 20
Precipitation .......................................................................................................................................... 20Run-off .................................................................................................................................................. 20Evapotranspiration ................................................................................................................................ 20Deep drainage ....................................................................................................................................... 21Field water balance study ..................................................................................................................... 21
Nitrogen balance ......................................................................................................................................... 22Nitrogen inputs ..................................................................................................................................... 23Nitrogen outputs ................................................................................................................................... 23Field nitrogen balance study ................................................................................................................. 27
Summary ..................................................................................................................................................... 28
Summary and Conclusions ............................................................................................................................ 31
Acknowledgments .......................................................................................................................................... 32
References ....................................................................................................................................................... 33
Appendices ...................................................................................................................................................... 391 Terms of reference ................................................................................................................................ 392 Details of library searches .................................................................................................................... 403 Workshop report .................................................................................................................................... 41
Annex: Workshop presentation slides .................................................................................................. 47

iv
List of figures
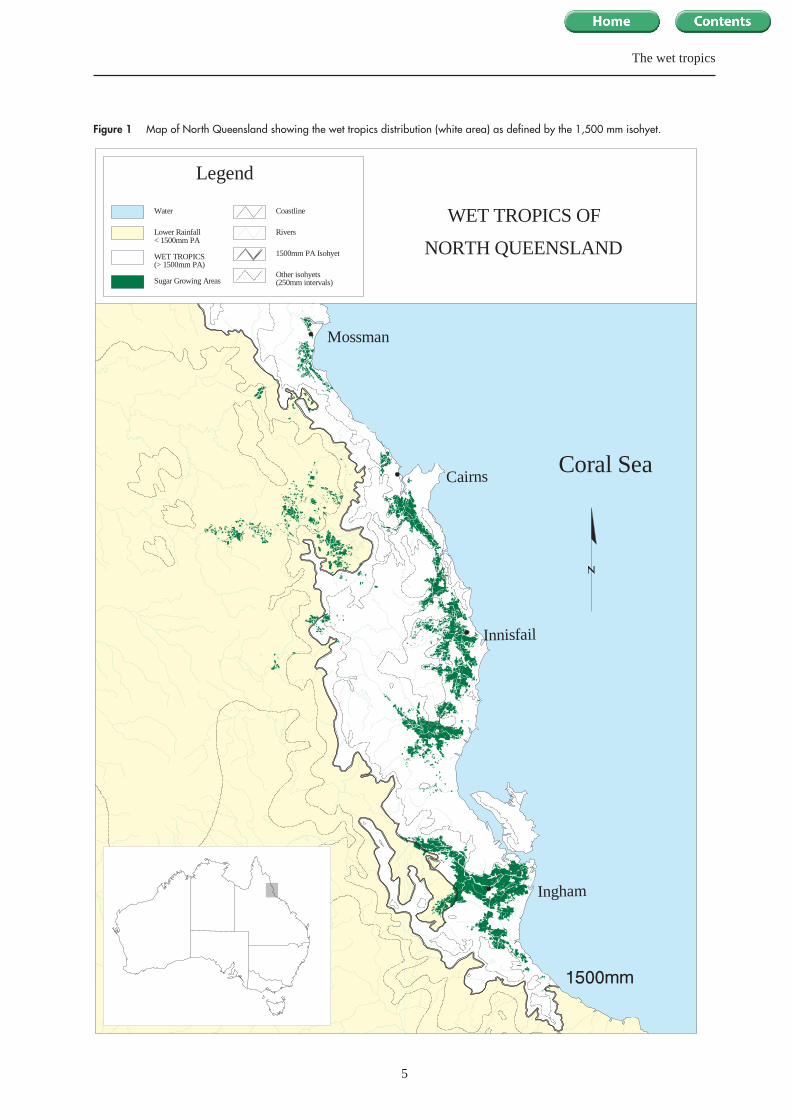
1 Map of North Queensland showing the wet tropics distribution (white area) as defined by the1,500 mm isohyet ....................................................................................................................................... 5
2 Diagrammatic section of soils and landscapes in the Tully–Innisfail wet tropics area(taken from Isbell and Edwards 1988) ....................................................................................................... 7
3 Map showing distribution of key soils within the wet tropics ..................................................................84 Schematic diagram showing key components of the water balance, including major flow pathways
(arrows) and key issues that need addressing in both natural and agricultural systems ......................... 105 Schematic diagram showing key components of the nitrogen balance (after Jordan 1985) ................... 116 Schematic representation of the water balance of a rainforest. The processes considered are
represented by the solid arrows................................................................................................................ 137 Schematic representation of the nitrogen balance of a rainforest. The processes considered are
represented by the solid arrows................................................................................................................ 16
List of tables
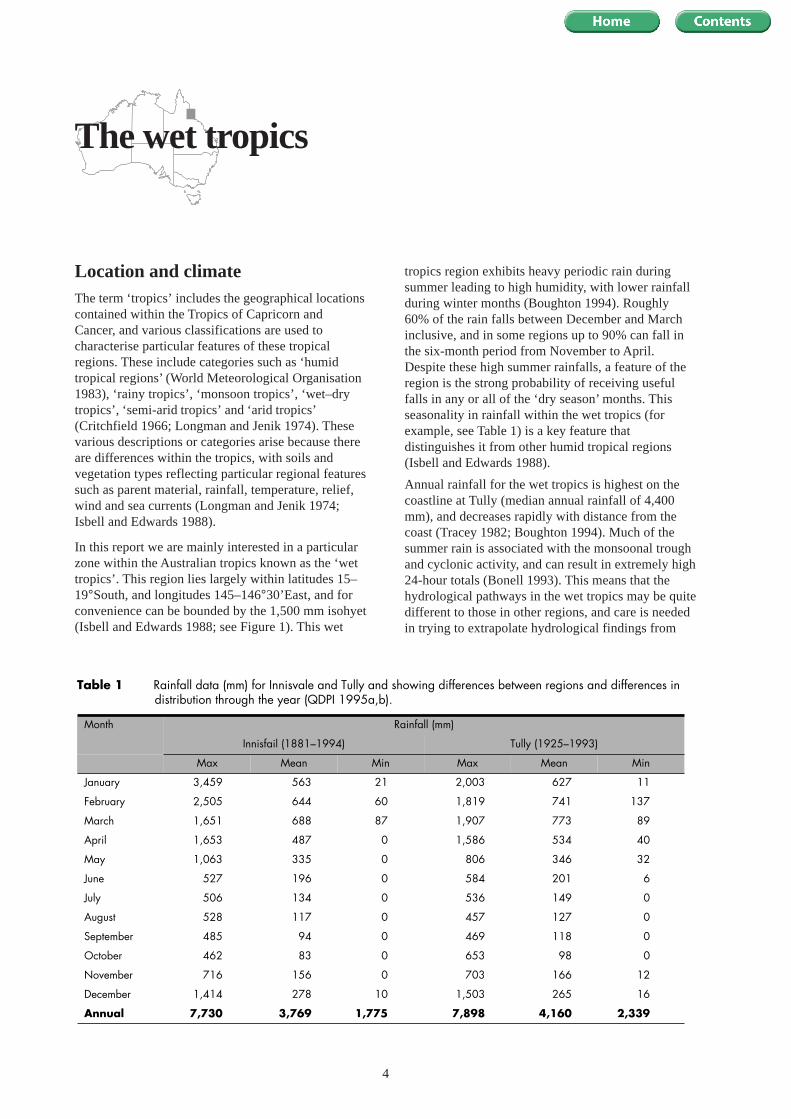
1 Rainfall data (mm) for Innisfail and Tully showing differences betweeN regions and differencesin distribution through the year (QDPI 1995a,b) ....................................................................................... 4
2 Evaporation data for Innisfail and Koombooloomba showing differences between regionsand differences in distribution through the year (QDPI 1995a,b) ............................................................. 6
3 Types and descriptions of soils found north of Rockhampton (taken from Thompson andBeckman1981; Hubble and Isbell 1983) ................................................................................................... 7
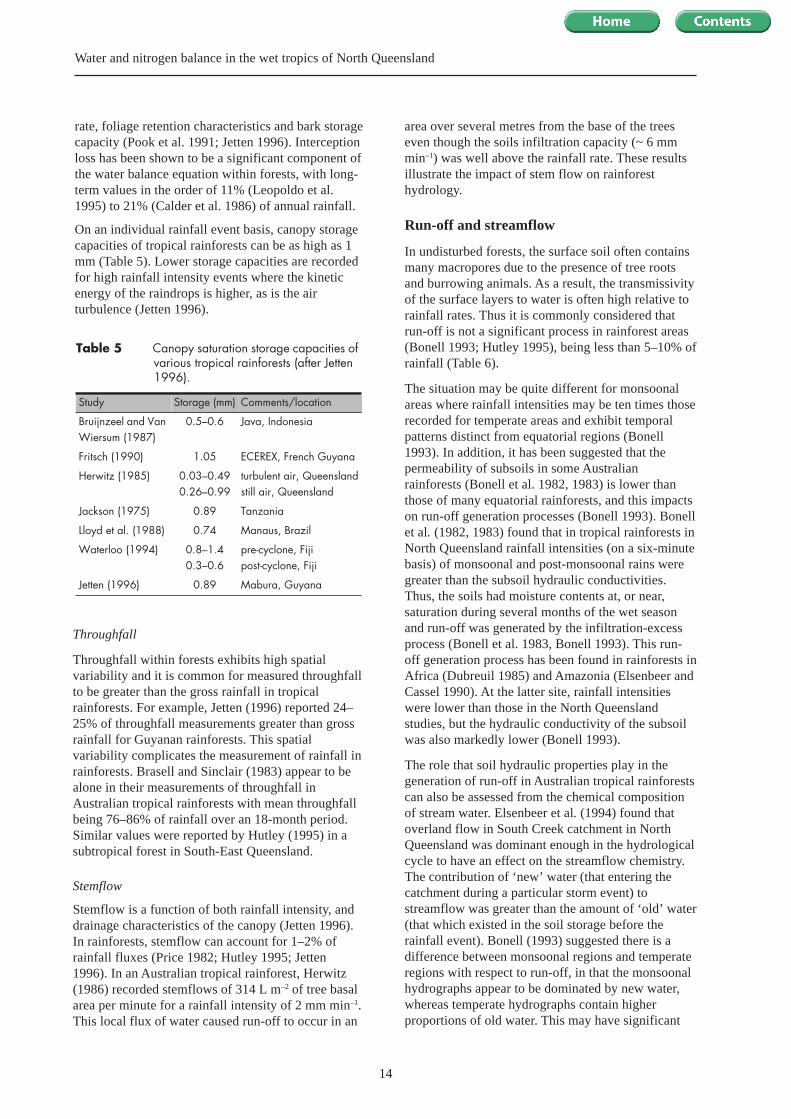
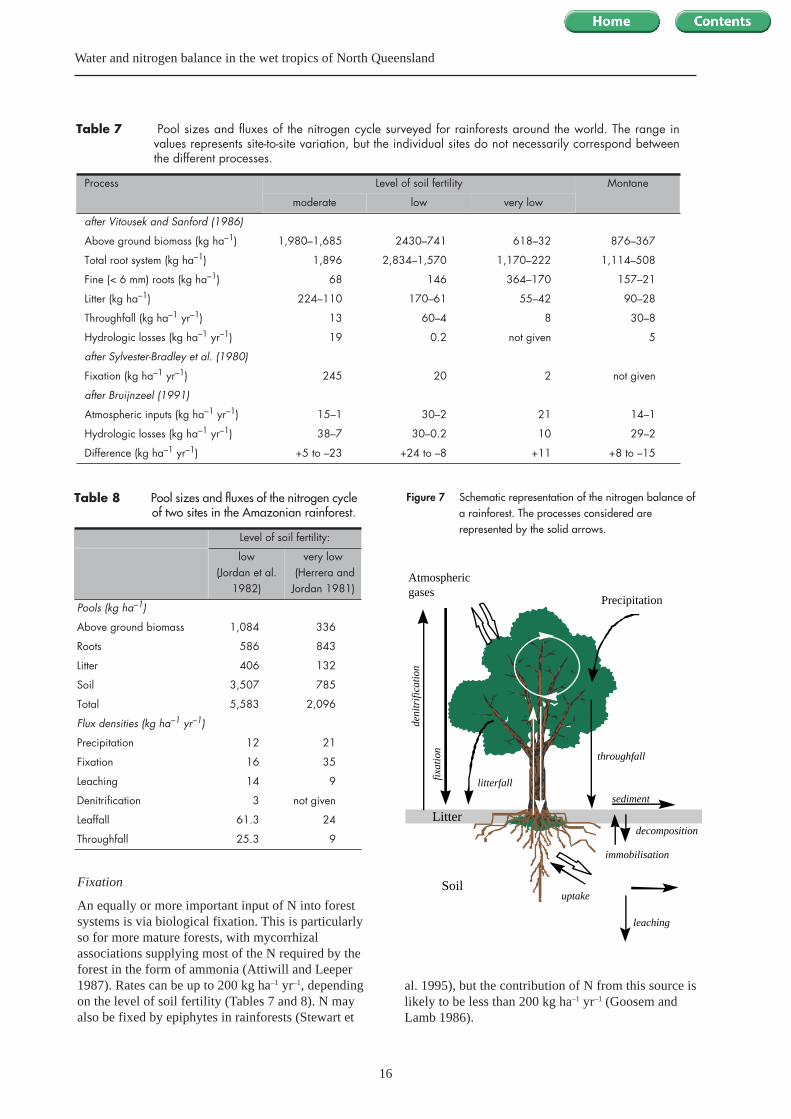
4 Agriculture in the wet tropics of North-East Queensland (taken from QDPI 1995). ............................... 95 Canopy saturation storage capacities of various tropical rainforests (after Jetten 1996) ....................... 146 Terms in the water balance of wet tropical rainforests ............................................................................ 157 Pool sizes and fluxes of the nitrogen cycle surveyed for rainforests around the world. The range
in values represents site-to-site variation, but the individual sites do not necessarily correspondbetween the different processes ............................................................................................................... 16
8 Pool sizes and fluxes of the nitrogen cycle of two sites in the Amazonian rainforest ............................ 169 Effect of various land clearing methods on soil properties illustrated by before clearing and
after clearing measurements in the top 10 cm of an Alfisol (reproduced from Lal andCummings 1979, as cited in Lal 1986) .................................................................................................... 18
10 Average hydrological data for sugarcane, banana, pasture and rainforest from 1992–1995.Values in brackets indicate percentage of rainfall (including irrigation for banana) (taken fromProve et al. 1997) ..................................................................................................................................... 21
11 Summary of hydrological data for sugarcane, banana, pasture and rainforest from 1992–93(taken from Prove et al. 1997) ................................................................................................................. 22
12 Summary of hydrological data for sugarcane, banana, pasture and rainforest for 1993–94(taken from Prove et al. 1997) ................................................................................................................. 22
13 Summary of hydrological data for sugarcane, banana, pasture and rainforest for 1994–95(taken from Prove et al. 1997) ................................................................................................................. 23
14 Fertiliser applications reported for agricultural industries in the humid tropics (kg N ha–1 year–1) ........ 2415 Nitrogen (N) removed from the system during harvest ........................................................................... 2516 Leaching losses in tropical agricultural systems ..................................................................................... 2517 Reported nitrogen losses via erosion and run-off .................................................................................... 2618 Reported values for gaseous losses of nitrogen (N) ................................................................................ 2719 Nitrogen balance (kg N ha–1) for sugarcane (1992–1995) (taken from Prove et al. 1997) ..................... 2820 Nitrogen balance (kg N ha–1) for plant and two ratoon banana crops (1992–95) (taken from
Prove et al. 1997) ..................................................................................................................................... 2921 An approximate sugarcane nitrogen (N) budget for a plant crop plus four ratoon crops (taken
from Vallis and Keating 1994) ................................................................................................................. 29A1 Workshop participants .............................................................................................................................. 42A2 Key points addressed during workshop discussions ................................................................................ 43A3 Summary of the workshop working groups tasked to address the questions .......................................... 45

1
Executive summary
natural and agricultural systems tends to be highlyevent-driven in this environment.
• Agricultural systems in the wet tropics aredominated by sugarcane, which is grown as amonoculture, and there is an increasinglyimportant horticultural industry. Both sugarcaneand horticulture use large quantities of fertilisers(especially nitrogen, phosphorus and potassium)and other agrochemicals as inputs.
• Data on water and nitrogen balances and the‘leakiness’ of wet tropical systems are virtuallynon-existent, in either the natural or agriculturalecosystems. Only one study has attempted toaddress the complete water and nitrogen balancein wet tropics systems, although not allcomponents were measured. There are some othershort-term data on various components of thewater and/or nitrogen balance in agriculturalsystems, but they have generally not beenmeasured simultaneously. Thus, there is no complete‘picture’ of the water or nitrogen balance, and it isdifficult to determine the importance of thedifferent aspects of these balances in the contextof productivity and sustainability. However, thefollowing generalisations can be made:– deep drainage rates, in both natural and
agricultural systems, are higher in the wettropics than in other ecosystems in Australia;
– agriculture appears to increase deep drainageand run-off, as happens in other parts ofAustralia;
– there are no long-term measurements ofevapotranspiration from either natural oragricultural systems in the wet tropics;
– nutrient cycling in natural systems is reportedto be very efficient, with few nutrientsescaping the rootzone;
– nutrient inputs and outputs in agriculturalsystems are event-driven, being dominated byfertiliser applications and crop harvests whichoccur at specific times through the year. Theevent-driven nature of fertiliser applicationstends to reduce the efficiency of nutrientrecycling within agricultural systems;
– in agricultural systems, nitrogen is applied inexcess of plant needs, suggesting that there isroom for considerable improvement innitrogen management; and
• Most current Australian agricultural productionsystems are modified versions (albeit innovativeand experience-based) of Northern Hemispherepractices, and evidence is mounting that they arenot sustainable.
• Many of the sustainability problems occurbecause our agricultural systems are out ofbalance with the natural environment, so that theyleak water and/or nutrients (vertically and/orhorizontally). This ‘leakage’ can causedegradation of soil and water resources throughsoil salinisation, acidification, erosion,development of nutrient bulges below the rootzone, rising watertables, and decreasing river andgroundwater quality. Loss of soil organic matterand soil structural decline are further evidence thatcurrent agricultural systems are not sustainable.
• A major difference between natural and agriculturalsystems is the agriculturist’s ability to manipulatefluxes of nutrients into and out of the system
• The Redesign of Australian Plant ProductionsSystems (RAPPS) research and developmentprogram is a new national effort initiated by theCommonwealth Scientific and Industrial ResearchOrganisation (CSIRO) and the Land and WaterResources Research and DevelopmentCorporation (LWRRDC) to help address thesesustainability issues. The main aim of the RAPPSprogram is to enhance understanding of how naturaland man-managed ecosystems function, especiallyin terms of the temporal and spatial distribution ofwater and nutrients, as a prelude to redesigning orreinventing plant production systems that are betteraligned with the uniquely Australian environment.
• The wet tropics of northern Australia is a special,unique and environmentally sensitive ecosystemwhich will require site-specific solutions indeveloping more-productive and ecologicallysustainable agricultural practices. It is one of thefocus areas for the RAPPS effort.
• The wet tropics is characterised by hightemperatures and high humidities, large amountsof rainfall with high intensities, the occurrence ofmajor cyclonic events, soils with unique, variablecharge characteristics, soils and landscapes thathave evolved to cope with (and shed) largeamounts of water, and unique native vegetationtypes (including rainforests). Water input in both

2
Water and nitrogen balance in the wet tropics of North Queensland
– this excess nitrogen application and its event-driven nature, together with the large, deepdrainage fluxes in permeable soils, suggestthat nitrogen loss below the rootzone will beconsiderable.
• A major challenge in trying to align agriculturalsystems with the natural environment is foragriculturists to better match the supply of waterand nutrients to the actual needs of plantproduction systems. This will require:– a better understanding of plant needs as a
function of crop growth stage;– development of practices where the type
(organic, inorganic, slow-release sources etc.),timing of application, and spatial placement(most appropriate vertical and/or horizontalplacement) of nutrients is better matched tomeet actual plant needs; and
– experimentation with novel vegetation patternsinvolving variations in space and time, or plantsequences that run in series or parallel, andwhich may or may not include trees.
• There is a need to improve understanding andquantification of water and nutrient balances inthe wet tropics if the above ideal of moresustainable agricultural systems is to be achieved.
Future research and development efforts willtherefore need to include studies on:– the major water and nutrient flow pathways in
the various soils and landscapes;– nitrate leaching and the development and
amelioration of soil acidity, particularly atdepth;
– water and nutrient storage and movement invariable charge soils;
– the potential for development and likelybehaviour of deep nutrient bulges;
– evapotranspiration;– water and nutrient uptake patterns by crops as
a function of time, depth and crop growthstage; and
– development of management strategies thatmatch nutrient supply to actual plant needs.
• While any research and development work aimedat addressing the above issues will need to befocused at specific sites in the wet tropics, it willalso be essential to develop predictive capabilitiesso that the experimental work that is undertakencan be extrapolated in space and time. TheRAPPS research and development program is oneinitiative that can help facilitate this.

3
Introduction
potential for significant on- and off-site impacts if notmanaged appropriately. The wet tropics is thereforean important region to study, and a valuable region inwhich to validate and test modelling tools that may beapplied to the nation-wide assessment and design ofnew plant production systems. Site-specific solutionswill be required to meet the area’s uniqueenvironmental characteristics, and its closeness to theGreat Barrier Reef demands that these issues receiveurgent attention.
This report provides a review of water and nitrogenbalance in natural (rainforest) and agricultural(sugarcane and horticulture) systems in the tropics,with a special focus on the North Queensland wettropics (see Appendix 1 for Terms of Reference).Information on which the review is based wasobtained from:1. a formal literature review (see Appendix 2 for
search details and databases searched);2. a survey of some 100 researchers who were
known to have worked in, or who have had somecontact with, the wet tropics [details of the surveyquestionnaire and results are summarised byBristow et al. (1998) in a report to LWRRDCwhich is available at a cost of $5 from theAustralia Agriculture, Fisheries and Forestryshopfront on 1800 020 157 (free call)]; and
3. a workshop involving key staff from severaldifferent research and development (R&D)organisations.
The aim of this review document is to provide anoverview of the current state of knowledge of thewater and nitrogen balance in wet tropics systems anda summary of key issues requiring future R&D.
Most rural production systems currently practised inAustralia are modified versions (albeit innovative andexperience-based) of Northern Hemisphere practices.While they have served Australia well, their longer-term sustainability is increasingly under question.Reasons for this are the ever-increasing signs ofdepletion and degradation of our natural resources, asevidenced by loss of soil organic matter, soilstructural decline, salinisation, acidification, erosion,occurrence of nutrient bulges below the root zone,rising watertables, and decreasing river andgroundwater quality. Many of these problems occurbecause current plant production systems are out ofbalance with the natural environment and theytherefore leak water and nutrients. If it is possible toredesign plant production systems that make full useof the available water and nutrients so that leakagefrom the system is minimised, then the opportunityexists to create systems that may be both moreproductive and more ecologically sustainable.
This opportunity was recognised in the early 1990sand resulted in the establishment of the Redesign ofAustralian Plant Production Systems (RAPPS)initiative, brokered jointly by CSIRO and LWRRDC.The main aims of this initiative are to enhance theunderstanding of key characteristics of Australianagricultural environments, particularly the temporaland spatial distribution of water and nutrients, as aprelude to redesigning plant production systems thatmatch the natural characteristics dictated by theuniquely Australian environment (see LWRRDCOccasional Papers RAPPS 01/98 and RAPPS 02/98).
The wet tropics of northern Australia is an especiallyunique and environmentally sensitive ecosystemwithin Australia, and therefore one which requiresparticular focus within the overall RAPPS program.High rainfall amounts and intensities have thepotential to produce large water fluxes from thesurface as run-off, and from the root zone as deepdrainage in both natural and man-managed systems.The wet tropics is also characterised by unique soils,particularly in terms of their pH and chargecharacteristics, and landscapes which have deepgroundwater systems in some places and shallow,highly responsive groundwaters in others. These wettropical conditions are also conducive to highchemical fluxes across and through soils, with the
4
The wet tropics
tropics region exhibits heavy periodic rain duringsummer leading to high humidity, with lower rainfallduring winter months (Boughton 1994). Roughly60% of the rain falls between December and Marchinclusive, and in some regions up to 90% can fall inthe six-month period from November to April.Despite these high summer rainfalls, a feature of theregion is the strong probability of receiving usefulfalls in any or all of the ‘dry season’ months. Thisseasonality in rainfall within the wet tropics (forexample, see Table 1) is a key feature thatdistinguishes it from other humid tropical regions(Isbell and Edwards 1988).
Annual rainfall for the wet tropics is highest on thecoastline at Tully (median annual rainfall of 4,400mm), and decreases rapidly with distance from thecoast (Tracey 1982; Boughton 1994). Much of thesummer rain is associated with the monsoonal troughand cyclonic activity, and can result in extremely high24-hour totals (Bonell 1993). This means that thehydrological pathways in the wet tropics may be quitedifferent to those in other regions, and care is neededin trying to extrapolate hydrological findings from
Location and climateThe term ‘tropics’ includes the geographical locationscontained within the Tropics of Capricorn andCancer, and various classifications are used tocharacterise particular features of these tropicalregions. These include categories such as ‘humidtropical regions’ (World Meteorological Organisation1983), ‘rainy tropics’, ‘monsoon tropics’, ‘wet–drytropics’, ‘semi-arid tropics’ and ‘arid tropics’(Critchfield 1966; Longman and Jenik 1974). Thesevarious descriptions or categories arise because thereare differences within the tropics, with soils andvegetation types reflecting particular regional featuressuch as parent material, rainfall, temperature, relief,wind and sea currents (Longman and Jenik 1974;Isbell and Edwards 1988).
In this report we are mainly interested in a particularzone within the Australian tropics known as the ‘wettropics’. This region lies largely within latitudes 15–19°South, and longitudes 145–146°30’East, and forconvenience can be bounded by the 1,500 mm isohyet(Isbell and Edwards 1988; see Figure 1). This wet
Table 1 Rainfall data (mm) for Innisvale and Tully and showing differences between regions and differences in distribution through the year (QDPI 1995a,b).
Month Rainfall (mm)
Innisfail (1881–1994) Tully (1925–1993)
Max Mean Min Max Mean Min
January 3,459 563 21 2,003 627 11
February 2,505 644 60 1,819 741 137
March 1,651 688 87 1,907 773 89
April 1,653 487 0 1,586 534 40
May 1,063 335 0 806 346 32
June 527 196 0 584 201 6
July 506 134 0 536 149 0
August 528 117 0 457 127 0
September 485 94 0 469 118 0
October 462 83 0 653 98 0
November 716 156 0 703 166 12
December 1,414 278 10 1,503 265 16
Annual 7,730 3,769 1,775 7,898 4,160 2,339
5
The wet tropics
Figure 1 Map of North Queensland showing the wet tropics distribution (white area) as defined by the 1,500 mm isohyet.
Cairns
Ingham
Innisfail
Mossman
Coral Sea
WET TROPICS OF
NORTH QUEENSLAND
Legend
Water
Lower Rainfall < 1500mm PA
WET TROPICS (> 1500mm PA)
Sugar Growing Areas
Coastline
Rivers
1500mm PA Isohyet
Other isohyets (250mm intervals)
6
Water and nitrogen balance in the wet tropics of North Queensland
one climatic zone to another. Another featureassociated with tropical rainfall is that rain drop sizestend to be bigger than in other regions (Calder et al.1986), again cautioning against simple extrapolationof experience across regions.
In terms of temperature, a feature of the wet tropics isthe relatively low minimum temperatures that canoccur during the coldest months, with light frostshaving been recorded on rare occasions on the coastallowlands. This situation is in strong contrast to themore traditional humid tropical (equatorial) regions(Isbell and Edwards 1988).
Evaporative demand as given by pan data also variesthrough the year and is variable between regionswithin the wet tropics. Example data from two sitesare given in Table 2. In most months of the yearrainfall exceeds the evaporation, and it is only in thelater part of the year from August–November thatevaporation is likely to exceed rainfall.
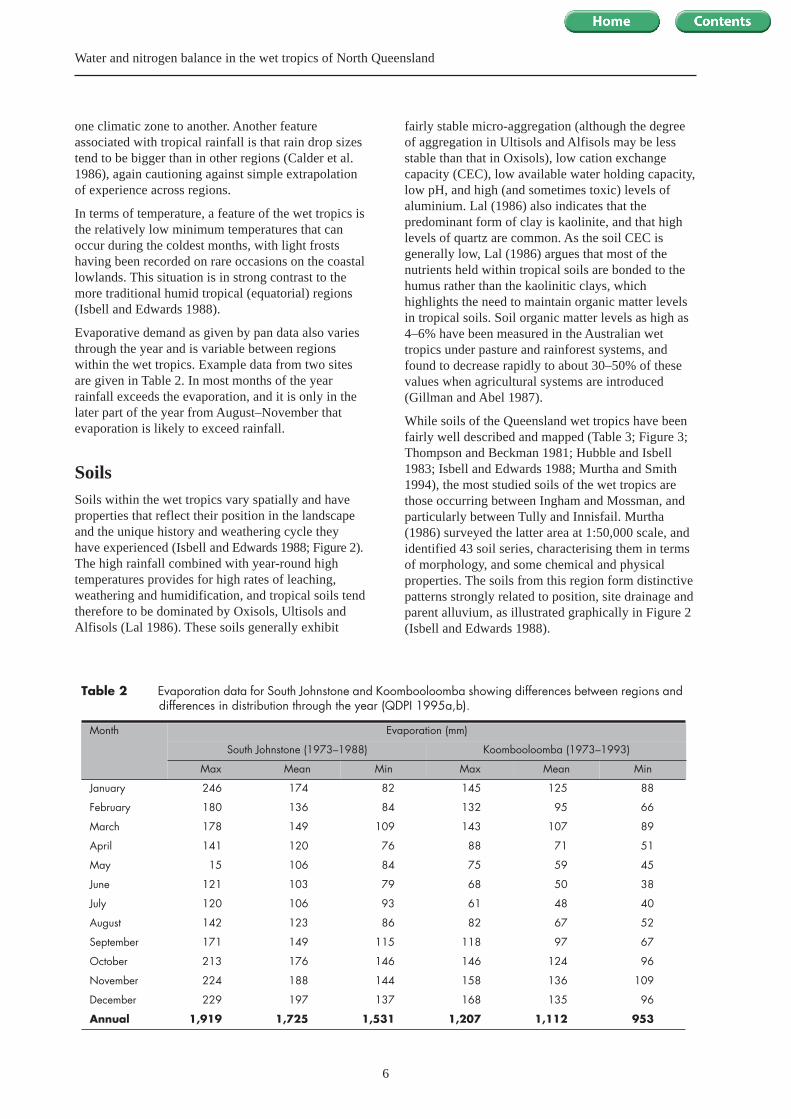
SoilsSoils within the wet tropics vary spatially and haveproperties that reflect their position in the landscapeand the unique history and weathering cycle theyhave experienced (Isbell and Edwards 1988; Figure 2).The high rainfall combined with year-round hightemperatures provides for high rates of leaching,weathering and humidification, and tropical soils tendtherefore to be dominated by Oxisols, Ultisols andAlfisols (Lal 1986). These soils generally exhibit
fairly stable micro-aggregation (although the degreeof aggregation in Ultisols and Alfisols may be lessstable than that in Oxisols), low cation exchangecapacity (CEC), low available water holding capacity,low pH, and high (and sometimes toxic) levels ofaluminium. Lal (1986) also indicates that thepredominant form of clay is kaolinite, and that highlevels of quartz are common. As the soil CEC isgenerally low, Lal (1986) argues that most of thenutrients held within tropical soils are bonded to thehumus rather than the kaolinitic clays, whichhighlights the need to maintain organic matter levelsin tropical soils. Soil organic matter levels as high as4–6% have been measured in the Australian wettropics under pasture and rainforest systems, andfound to decrease rapidly to about 30–50% of thesevalues when agricultural systems are introduced(Gillman and Abel 1987).
While soils of the Queensland wet tropics have beenfairly well described and mapped (Table 3; Figure 3;Thompson and Beckman 1981; Hubble and Isbell1983; Isbell and Edwards 1988; Murtha and Smith1994), the most studied soils of the wet tropics arethose occurring between Ingham and Mossman, andparticularly between Tully and Innisfail. Murtha(1986) surveyed the latter area at 1:50,000 scale, andidentified 43 soil series, characterising them in termsof morphology, and some chemical and physicalproperties. The soils from this region form distinctivepatterns strongly related to position, site drainage andparent alluvium, as illustrated graphically in Figure 2(Isbell and Edwards 1988).
Table 2 Evaporation data for South Johnstone and Koombooloomba showing differences between regions and differences in distribution through the year (QDPI 1995a,b).
Month Evaporation (mm)
South Johnstone (1973–1988) Koombooloomba (1973–1993)
Max Mean Min Max Mean Min
January 246 174 82 145 125 88
February 180 136 84 132 95 66
March 178 149 109 143 107 89
April 141 120 76 88 71 51
May 15 106 84 75 59 45
June 121 103 79 68 50 38
July 120 106 93 61 48 40
August 142 123 86 82 67 52
September 171 149 115 118 97 67
October 213 176 146 146 124 96
November 224 188 144 158 136 109
December 229 197 137 168 135 96
Annual 1,919 1,725 1,531 1,207 1,112 953
7
The wet tropics
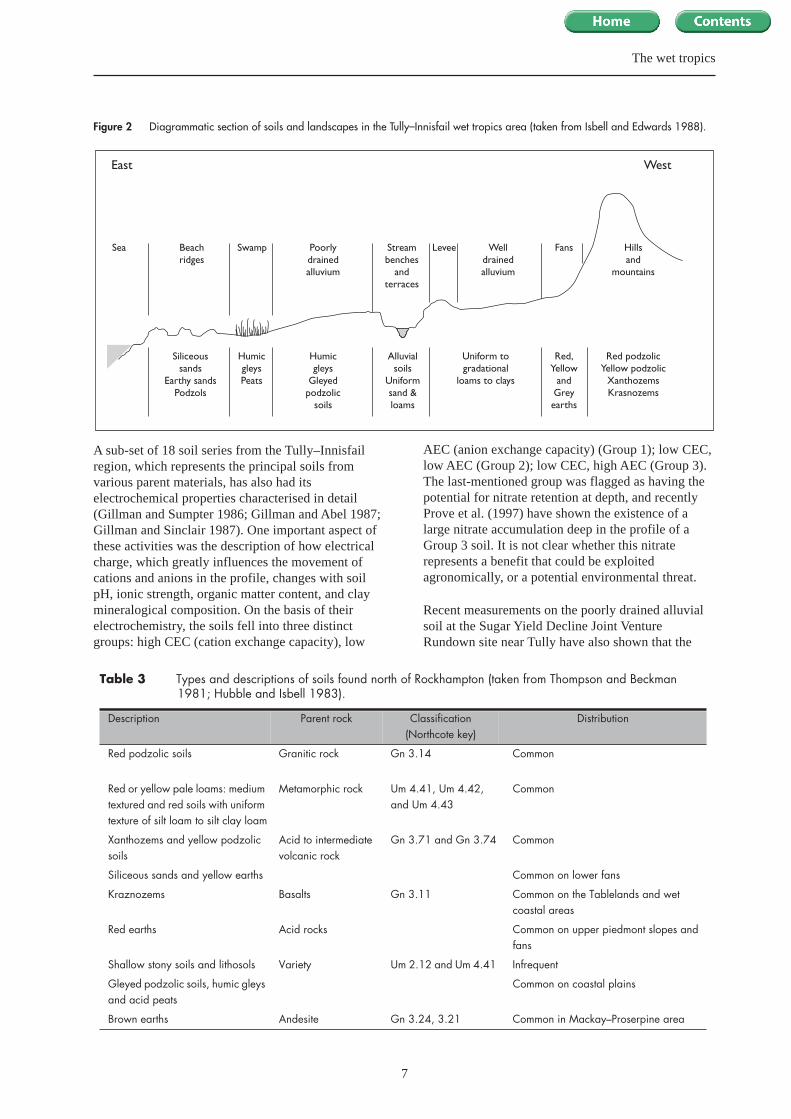
A sub-set of 18 soil series from the Tully–Innisfailregion, which represents the principal soils fromvarious parent materials, has also had itselectrochemical properties characterised in detail(Gillman and Sumpter 1986; Gillman and Abel 1987;Gillman and Sinclair 1987). One important aspect ofthese activities was the description of how electricalcharge, which greatly influences the movement ofcations and anions in the profile, changes with soilpH, ionic strength, organic matter content, and claymineralogical composition. On the basis of theirelectrochemistry, the soils fell into three distinctgroups: high CEC (cation exchange capacity), low
AEC (anion exchange capacity) (Group 1); low CEC,low AEC (Group 2); low CEC, high AEC (Group 3).The last-mentioned group was flagged as having thepotential for nitrate retention at depth, and recentlyProve et al. (1997) have shown the existence of alarge nitrate accumulation deep in the profile of aGroup 3 soil. It is not clear whether this nitraterepresents a benefit that could be exploitedagronomically, or a potential environmental threat.
Recent measurements on the poorly drained alluvialsoil at the Sugar Yield Decline Joint VentureRundown site near Tully have also shown that the
Table 3 Types and descriptions of soils found north of Rockhampton (taken from Thompson and Beckman 1981; Hubble and Isbell 1983).
Description Parent rock Classification (Northcote key)
Distribution
Red podzolic soils Granitic rock Gn 3.14 Common
Red or yellow pale loams: medium textured and red soils with uniform texture of silt loam to silt clay loam
Metamorphic rock Um 4.41, Um 4.42, and Um 4.43
Common
Xanthozems and yellow podzolic soils
Acid to intermediate volcanic rock
Gn 3.71 and Gn 3.74 Common
Siliceous sands and yellow earths Common on lower fans
Kraznozems Basalts Gn 3.11 Common on the Tablelands and wet coastal areas
Red earths Acid rocks Common on upper piedmont slopes and fans
Shallow stony soils and lithosols Variety Um 2.12 and Um 4.41 Infrequent
Gleyed podzolic soils, humic gleys and acid peats
Common on coastal plains
Brown earths Andesite Gn 3.24, 3.21 Common in Mackay–Proserpine area
Figure 2 Diagrammatic section of soils and landscapes in the Tully–Innisfail wet tropics area (taken from Isbell and Edwards 1988).
Sea
East West
Beachridges
Swamp Poorlydrainedalluvium
Streambenches
andterraces
Welldrainedalluvium
Levee Fans Hillsand
mountains
Siliceoussands
Earthy sandsPodzols
HumicgleysPeats
Humicgleys
Gleyedpodzolic
soils
Alluvialsoils
Uniformsand &loams
Uniform togradational
loams to clays
Red,Yellow
andGreyearths
Red podzolicYellow podzolic
XanthozemsKrasnozems
8
Water and nitrogen balance in the wet tropics of North Queensland
AEC at depth (50–80 cm) is equivalent to, if notgreater than, the CEC, suggesting the presence ofvariable charge characteristics in this soil as well. Justhow widespread these features are and theimplications for development of nutrient bulges atdepth warrants further investigation because it is clearthat soils with variable charge characteristics maybehave differently to other soils with respect to thesoil solution. It is thought that ions moving downthrough such soil profiles could be simultaneouslyadsorbed in the diffuse double layers of the oppositecharge colloids, and that they could be immediately,and in some subsoils completely, depleted from thesoil solution. While the full implications of this arestill to be elucidated, it is clear that our water andchemical transport models cannot, at present, dealwith these issues which, if not addressed, will placesome doubt on the validity of modelling nutrientmovement in these variable charge soils.
It is clear from the foregoing that improvedunderstanding of the chemical/hydrologicalinteractions in the soils of the wet tropics will be ofcritical importance in helping redesign innovativeplant production systems to minimise leakage fromagricultural systems.
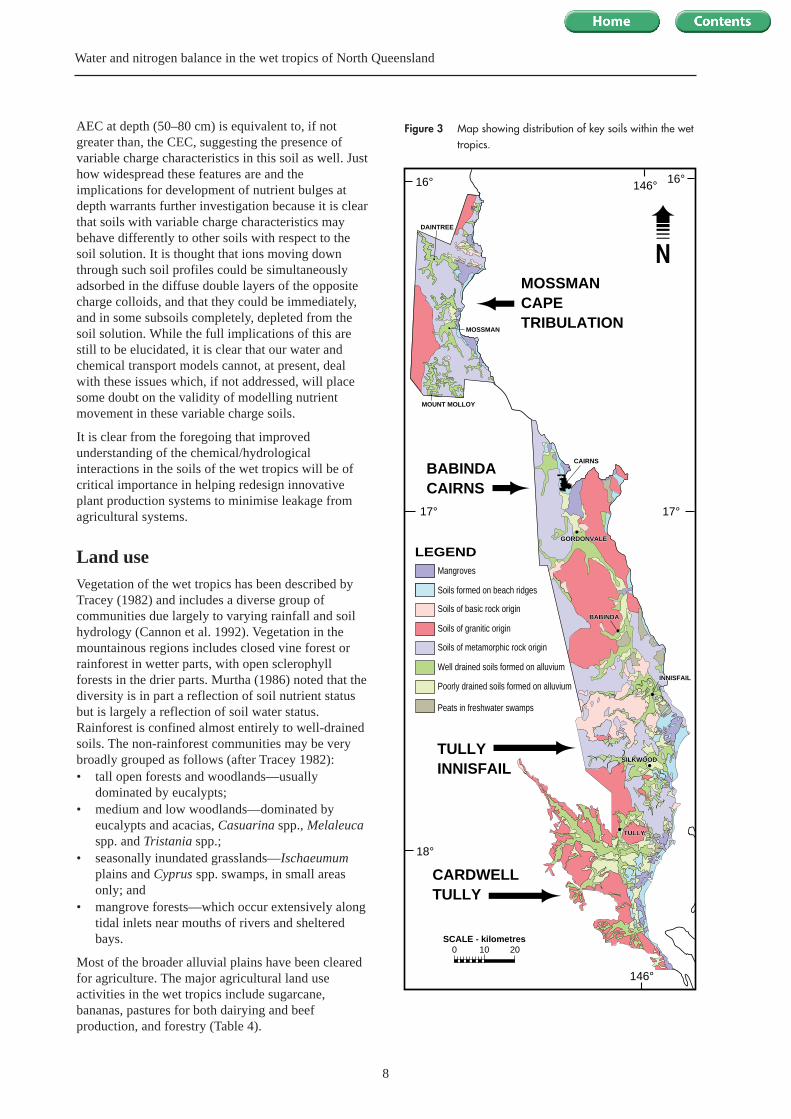
Land useVegetation of the wet tropics has been described byTracey (1982) and includes a diverse group ofcommunities due largely to varying rainfall and soilhydrology (Cannon et al. 1992). Vegetation in themountainous regions includes closed vine forest orrainforest in wetter parts, with open sclerophyllforests in the drier parts. Murtha (1986) noted that thediversity is in part a reflection of soil nutrient statusbut is largely a reflection of soil water status.Rainforest is confined almost entirely to well-drainedsoils. The non-rainforest communities may be verybroadly grouped as follows (after Tracey 1982):• tall open forests and woodlands—usually
dominated by eucalypts;• medium and low woodlands—dominated by
eucalypts and acacias, Casuarina spp., Melaleucaspp. and Tristania spp.;
• seasonally inundated grasslands—Ischaeumumplains and Cyprus spp. swamps, in small areasonly; and
• mangrove forests—which occur extensively alongtidal inlets near mouths of rivers and shelteredbays.
Most of the broader alluvial plains have been clearedfor agriculture. The major agricultural land useactivities in the wet tropics include sugarcane,bananas, pastures for both dairying and beefproduction, and forestry (Table 4).
Figure 3 Map showing distribution of key soils within the wettropics.
MOSSMANCAPETRIBULATION
BABINDACAIRNS
TULLYINNISFAIL
CARDWELLTULLY
146°
18°
17°17°
16°16° 146°
MOUNT MOLLOY
DAINTREE
MOSSMAN
Mangroves
CAIRNS
Soils formed on beach ridges
Soils of basic rock origin
Soils of granitic origin
Soils of metamorphic rock origin
Well drained soils formed on alluvium
Poorly drained soils formed on alluvium
Peats in freshwater swamps
0 20SCALE - kilometres
LEGEND
10
BABINDABABINDA
GORDONVALEGORDONVALE
INNISFAIL
SILKWOODSILKWOOD
TULLYTULLY
INNISFAIL
9
The wet tropics
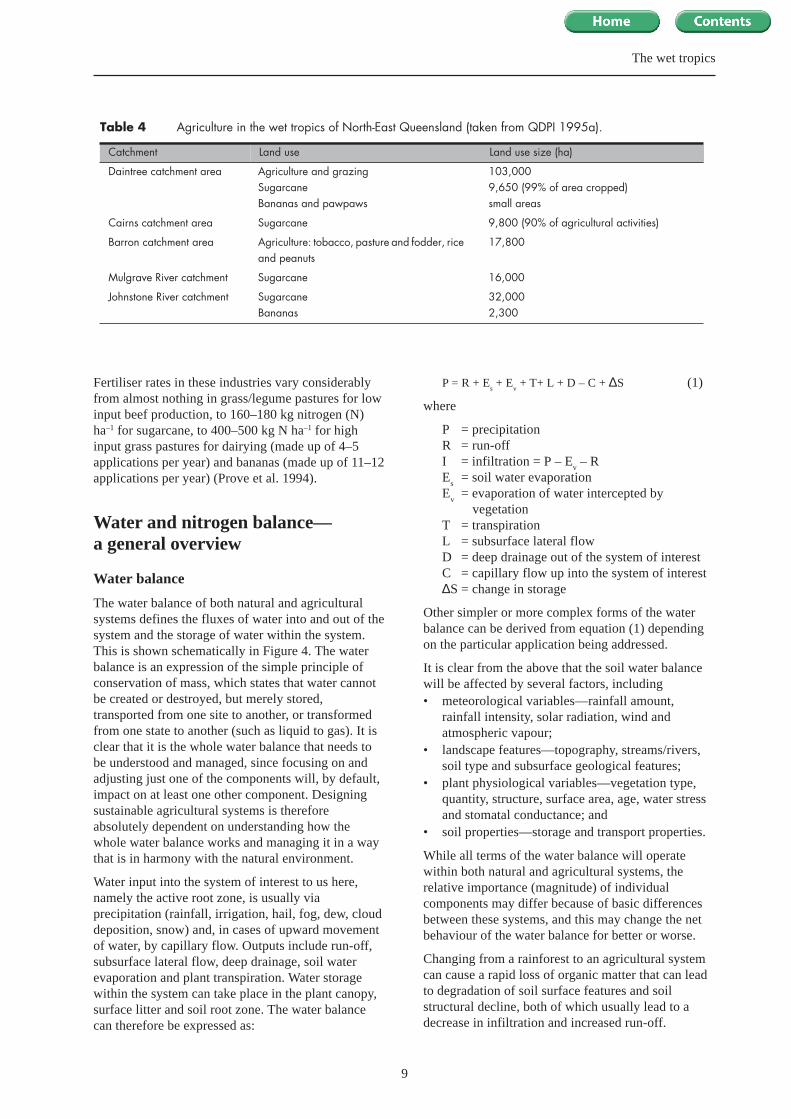
Fertiliser rates in these industries vary considerablyfrom almost nothing in grass/legume pastures for lowinput beef production, to 160–180 kg nitrogen (N)ha–1 for sugarcane, to 400–500 kg N ha–1 for highinput grass pastures for dairying (made up of 4–5applications per year) and bananas (made up of 11–12applications per year) (Prove et al. 1994).
Water and nitrogen balance—a general overview
Water balance
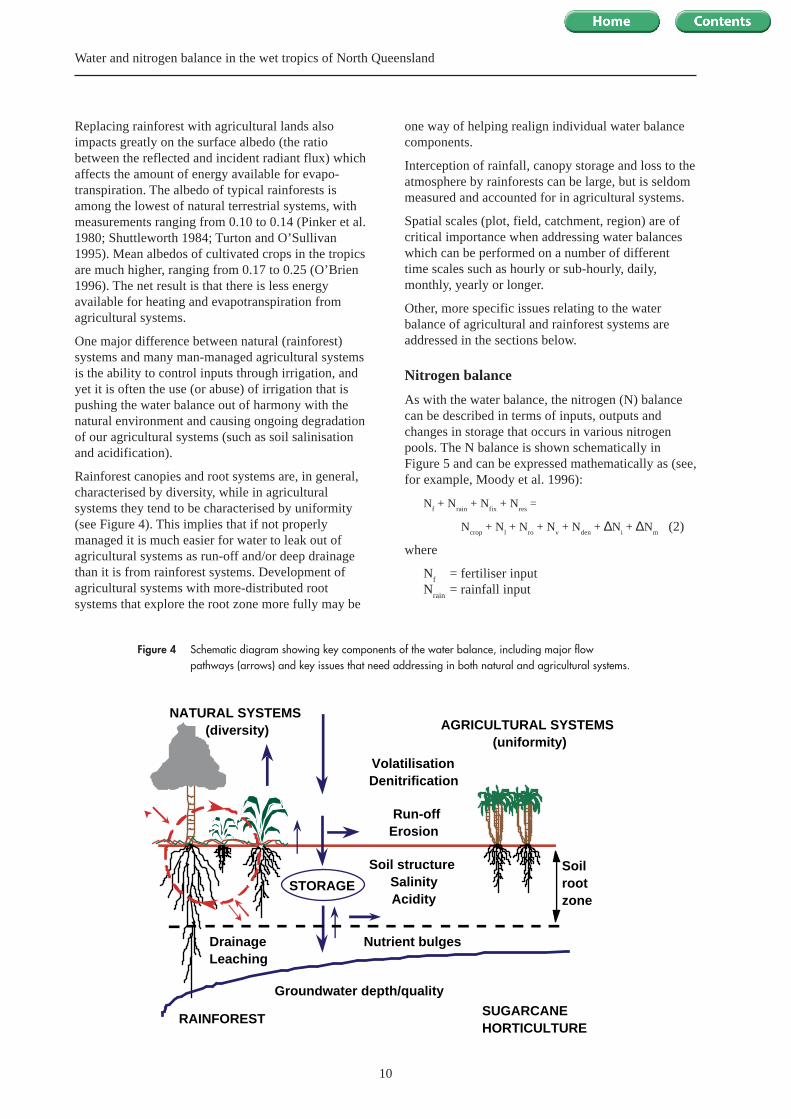
The water balance of both natural and agriculturalsystems defines the fluxes of water into and out of thesystem and the storage of water within the system.This is shown schematically in Figure 4. The waterbalance is an expression of the simple principle ofconservation of mass, which states that water cannotbe created or destroyed, but merely stored,transported from one site to another, or transformedfrom one state to another (such as liquid to gas). It isclear that it is the whole water balance that needs tobe understood and managed, since focusing on andadjusting just one of the components will, by default,impact on at least one other component. Designingsustainable agricultural systems is thereforeabsolutely dependent on understanding how thewhole water balance works and managing it in a waythat is in harmony with the natural environment.
Water input into the system of interest to us here,namely the active root zone, is usually viaprecipitation (rainfall, irrigation, hail, fog, dew, clouddeposition, snow) and, in cases of upward movementof water, by capillary flow. Outputs include run-off,subsurface lateral flow, deep drainage, soil waterevaporation and plant transpiration. Water storagewithin the system can take place in the plant canopy,surface litter and soil root zone. The water balancecan therefore be expressed as:
P = R + Es + E
v + T+ L + D – C + ∆S (1)
where
P = precipitationR = run-offI = infiltration = P – E
v – R
Es
= soil water evaporationE
v= evaporation of water intercepted by
vegetationT = transpirationL = subsurface lateral flowD = deep drainage out of the system of interestC = capillary flow up into the system of interest∆S = change in storage
Other simpler or more complex forms of the waterbalance can be derived from equation (1) dependingon the particular application being addressed.
It is clear from the above that the soil water balancewill be affected by several factors, including• meteorological variables—rainfall amount,
rainfall intensity, solar radiation, wind andatmospheric vapour;
• landscape features—topography, streams/rivers,soil type and subsurface geological features;
• plant physiological variables—vegetation type,quantity, structure, surface area, age, water stressand stomatal conductance; and
• soil properties—storage and transport properties.
While all terms of the water balance will operatewithin both natural and agricultural systems, therelative importance (magnitude) of individualcomponents may differ because of basic differencesbetween these systems, and this may change the netbehaviour of the water balance for better or worse.
Changing from a rainforest to an agricultural systemcan cause a rapid loss of organic matter that can leadto degradation of soil surface features and soilstructural decline, both of which usually lead to adecrease in infiltration and increased run-off.
Table 4 Agriculture in the wet tropics of North-East Queensland (taken from QDPI 1995a).
Catchment Land use Land use size (ha)
Daintree catchment area Agriculture and grazingSugarcaneBananas and pawpaws
103,0009,650 (99% of area cropped)small areas
Cairns catchment area Sugarcane 9,800 (90% of agricultural activities)
Barron catchment area Agriculture: tobacco, pasture and fodder, rice and peanuts
17,800
Mulgrave River catchment Sugarcane 16,000
Johnstone River catchment SugarcaneBananas
32,0002,300
10
Water and nitrogen balance in the wet tropics of North Queensland
Replacing rainforest with agricultural lands alsoimpacts greatly on the surface albedo (the ratiobetween the reflected and incident radiant flux) whichaffects the amount of energy available for evapo-transpiration. The albedo of typical rainforests isamong the lowest of natural terrestrial systems, withmeasurements ranging from 0.10 to 0.14 (Pinker et al.1980; Shuttleworth 1984; Turton and O’Sullivan1995). Mean albedos of cultivated crops in the tropicsare much higher, ranging from 0.17 to 0.25 (O’Brien1996). The net result is that there is less energyavailable for heating and evapotranspiration fromagricultural systems.
One major difference between natural (rainforest)systems and many man-managed agricultural systemsis the ability to control inputs through irrigation, andyet it is often the use (or abuse) of irrigation that ispushing the water balance out of harmony with thenatural environment and causing ongoing degradationof our agricultural systems (such as soil salinisationand acidification).
Rainforest canopies and root systems are, in general,characterised by diversity, while in agriculturalsystems they tend to be characterised by uniformity(see Figure 4). This implies that if not properlymanaged it is much easier for water to leak out ofagricultural systems as run-off and/or deep drainagethan it is from rainforest systems. Development ofagricultural systems with more-distributed rootsystems that explore the root zone more fully may be
one way of helping realign individual water balancecomponents.
Interception of rainfall, canopy storage and loss to theatmosphere by rainforests can be large, but is seldommeasured and accounted for in agricultural systems.
Spatial scales (plot, field, catchment, region) are ofcritical importance when addressing water balanceswhich can be performed on a number of differenttime scales such as hourly or sub-hourly, daily,monthly, yearly or longer.
Other, more specific issues relating to the waterbalance of agricultural and rainforest systems areaddressed in the sections below.
Nitrogen balance
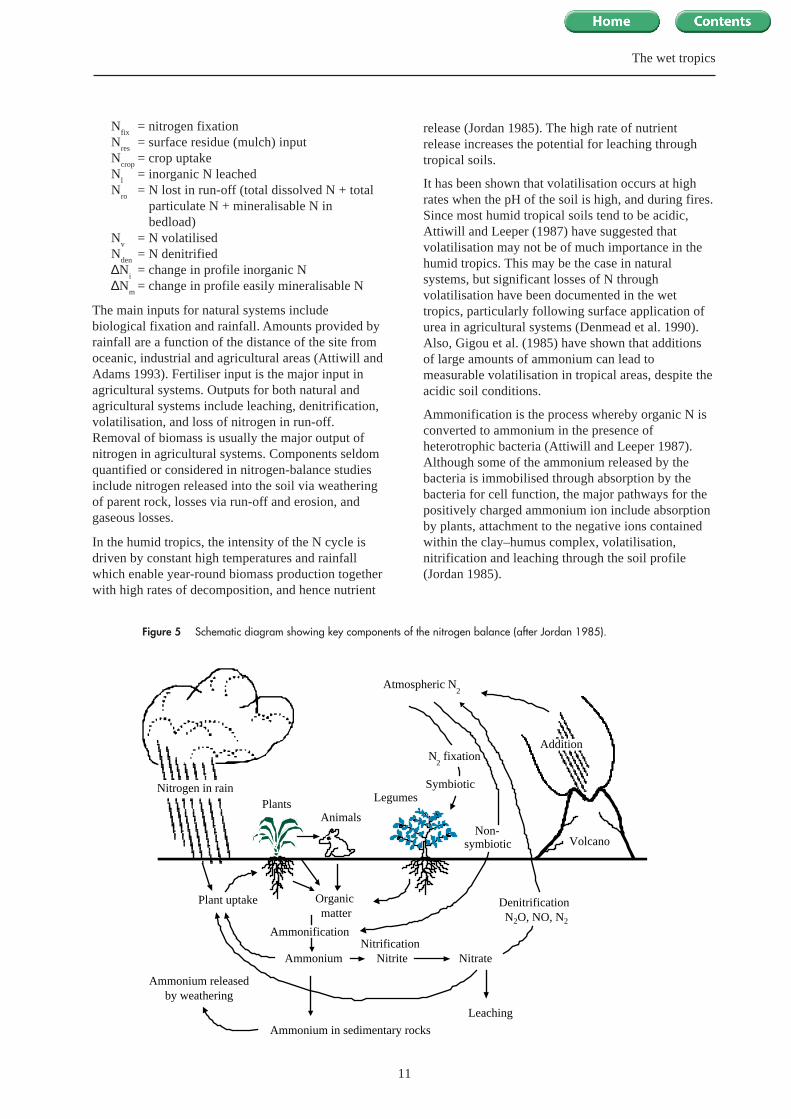
As with the water balance, the nitrogen (N) balancecan be described in terms of inputs, outputs andchanges in storage that occurs in various nitrogenpools. The N balance is shown schematically inFigure 5 and can be expressed mathematically as (see,for example, Moody et al. 1996):
Nf + N
rain + N
fix + N
res =
Ncrop
+ Nl + N
ro + N
v + N
den + ∆N
i + ∆N
m(2)
where
Nf
= fertiliser inputN
rain= rainfall input
Figure 4 Schematic diagram showing key components of the water balance, including major flowpathways (arrows) and key issues that need addressing in both natural and agricultural systems.
Soil structureSalinityAcidity
STORAGE
Drainage Leaching
Run-offErosion
VolatilisationDenitrification
NATURAL SYSTEMS(diversity) AGRICULTURAL SYSTEMS
(uniformity)
Soilrootzone
Groundwater depth/quality
Nutrient bulges
RAINFORESTSUGARCANEHORTICULTURE
11
The wet tropics
Nfix
= nitrogen fixationN
res= surface residue (mulch) input
Ncrop
= crop uptakeN
l= inorganic N leached
Nro
= N lost in run-off (total dissolved N + totalparticulate N + mineralisable N inbedload)
Nv
= N volatilisedN
den= N denitrified
∆Ni
= change in profile inorganic N∆N
m= change in profile easily mineralisable N
The main inputs for natural systems includebiological fixation and rainfall. Amounts provided byrainfall are a function of the distance of the site fromoceanic, industrial and agricultural areas (Attiwill andAdams 1993). Fertiliser input is the major input inagricultural systems. Outputs for both natural andagricultural systems include leaching, denitrification,volatilisation, and loss of nitrogen in run-off.Removal of biomass is usually the major output ofnitrogen in agricultural systems. Components seldomquantified or considered in nitrogen-balance studiesinclude nitrogen released into the soil via weatheringof parent rock, losses via run-off and erosion, andgaseous losses.
In the humid tropics, the intensity of the N cycle isdriven by constant high temperatures and rainfallwhich enable year-round biomass production togetherwith high rates of decomposition, and hence nutrient
release (Jordan 1985). The high rate of nutrientrelease increases the potential for leaching throughtropical soils.
It has been shown that volatilisation occurs at highrates when the pH of the soil is high, and during fires.Since most humid tropical soils tend to be acidic,Attiwill and Leeper (1987) have suggested thatvolatilisation may not be of much importance in thehumid tropics. This may be the case in naturalsystems, but significant losses of N throughvolatilisation have been documented in the wettropics, particularly following surface application ofurea in agricultural systems (Denmead et al. 1990).Also, Gigou et al. (1985) have shown that additionsof large amounts of ammonium can lead tomeasurable volatilisation in tropical areas, despite theacidic soil conditions.
Ammonification is the process whereby organic N isconverted to ammonium in the presence ofheterotrophic bacteria (Attiwill and Leeper 1987).Although some of the ammonium released by thebacteria is immobilised through absorption by thebacteria for cell function, the major pathways for thepositively charged ammonium ion include absorptionby plants, attachment to the negative ions containedwithin the clay–humus complex, volatilisation,nitrification and leaching through the soil profile(Jordan 1985).
Figure 5 Schematic diagram showing key components of the nitrogen balance (after Jordan 1985).
Atmospheric N2
Legumes
Organic matter
Ammonium Nitrite Nitrate
Leaching
Plant uptake
PlantsAnimals
Ammonium releasedby weathering
Ammonium in sedimentary rocks
Volcano
Nitrification
Nitrogen in rain
Addition
Symbiotic
N2 fixation
DenitrificationN2O, NO, N2
Ammonification
Non-symbiotic
12
Water and nitrogen balance in the wet tropics of North Queensland
The rate of ammonification is dependent upon thenature of organic matter present (C (carbon)/N(nitrogen)) and the rate of decomposition. When C/Nratios are high, large quantities of nitrogen areimmobilised for microbial cell functions, and onlysmall amounts of the N released by decomposition areavailable for plant uptake (Attiwill and Leeper 1987).
Nitrification is also a microbially controlled processin which ammonium is converted to nitrite and thento the essential nutrient, nitrate. Nitrification rates aregenerally high where there is a high amount ofnitrogen within soil reserves, the cycling of nitrogenis rapid, and low C/N ratios exist (Attiwill and Adams1993; Riley and Vitousek 1995). The major pathwaysfor nitrate, which is positively charged and highlymobile, include absorption by plants, attachment toanion exchange sites within the soil, leaching anddenitrification (Jordan 1985). Nitrification is limitedby rates of decomposition, extreme temperatures,anaerobic conditions and low pH values (Attiwill andLeeper 1987). The limiting factor of low pH valueshas been disputed, with some studies showingconsiderable nitrification in soils with pH valueslower than five, particularly when large amounts of Nare added to the soil (Attiwill and Adams 1993).Indeed, nitrification rates appear to be greatest intropical regions where soils are most likely acidic(Attiwill and Adams 1993).
Denitrification refers to the conversion of nitrate togaseous N (nitrous oxide [N
2O], nitric oxide [NO], or
nitrogen [N2]) by denitrifying anaerobic bacteria
(Jordan 1985; Magdoff et al. 1997). It is generallyassociated with saturated (waterlogged) conditions(Grimme and Juo 1985). This suggests thatdenitrification could be a major loss pathway in thosewet tropic regions that experience frequentwaterlogging.
Storage of N in the system occurs in various N pools,which are usually grouped to reflect plant N, soil Nand N within leaf litter. The leaf litter pools areparticularly relevant in forest systems. N cycling canoccur within plant pools where N is moved fromsenescing leaves to sites of new activity (Attiwill andLeeper 1987). Plant N is taken up from the soil aseither ammonium or nitrate. Where ammoniumuptake is predominant, the soil solution becomesacidic, as hydrogen ions (H+) are exchanged forammonium ions (NH
4+). Where nitrate uptake is
dominant, the soil solution may become slightlyalkaline (Attiwill and Leeper 1987). Attiwill andLeeper (1987) report the total N available in surfacesoils (0–20 cm) is in the range 0.8–10 tonnes ha–1. Inmature forests, most of this N is inaccessible toplants, with ionic forms rarely reported above 5% ofthe total N in surface soils (Attiwill and Leeper1987).
As with the water balance, most components of the Nbalance operate in both natural and agriculturalsystems. Here again the relative importance(magnitude) of individual components may differbecause of basic differences between natural andagricultural systems. Because this may change the netbehaviour of the nitrogen balance for better or worse,it is crucial that the whole nitrogen balance beaddressed and managed, not just one component inisolation from the others.
Other more specific issues relating to the nitrogenbalance of agricultural and rainforest systems areaddressed in the sections to follow.
13
rates during the first few hours of the day (Longmanand Jenik 1974).
Longman and Jenik (1974) estimate that between 0.1and 0.3 mm of water can be contributed by dewfollowing cloudless nights. In Australia, fog occurs ataltitudes above 800–900 m for sites within the GreatDividing Range (Hutley et al. 1997). Yates andHutley (1995) recorded large throughfall excessesthat were attributed to fog and cloud deposition at asubtropical rainforest site at Gambubal, Queensland.In a subsequent study at the same site, Hutley et al.(1997) found that, of a total of 154 throughfallmeasurements, only 13 contained little or no fogdeposition and that fog deposition was approximately30% of total precipitation.
In this section, the water and N balances of wet,tropical rainforests are examined. The approach takenis to present data on the different components of theN and water cycles. Wherever possible, an overviewof knowledge of rainforests in general has been given,followed by information for those forests in Australia.Likely differences between rainforests in Australiaand other parts of the world are highlighted. Finally,the likely changes that will occur to the N and waterbalances following deforestation are discussed.
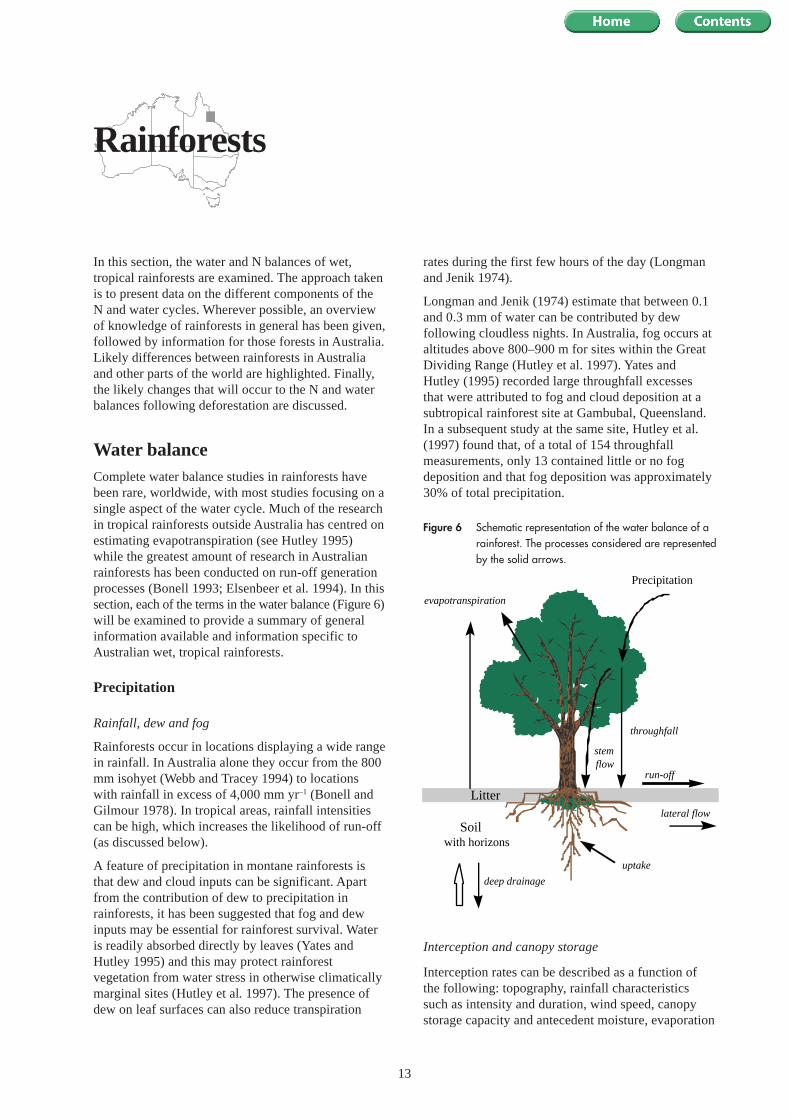
Water balanceComplete water balance studies in rainforests havebeen rare, worldwide, with most studies focusing on asingle aspect of the water cycle. Much of the researchin tropical rainforests outside Australia has centred onestimating evapotranspiration (see Hutley 1995)while the greatest amount of research in Australianrainforests has been conducted on run-off generationprocesses (Bonell 1993; Elsenbeer et al. 1994). In thissection, each of the terms in the water balance (Figure 6)will be examined to provide a summary of generalinformation available and information specific toAustralian wet, tropical rainforests.
Precipitation
Rainfall, dew and fog
Rainforests occur in locations displaying a wide rangein rainfall. In Australia alone they occur from the 800mm isohyet (Webb and Tracey 1994) to locationswith rainfall in excess of 4,000 mm yr–1 (Bonell andGilmour 1978). In tropical areas, rainfall intensitiescan be high, which increases the likelihood of run-off(as discussed below).
A feature of precipitation in montane rainforests isthat dew and cloud inputs can be significant. Apartfrom the contribution of dew to precipitation inrainforests, it has been suggested that fog and dewinputs may be essential for rainforest survival. Wateris readily absorbed directly by leaves (Yates andHutley 1995) and this may protect rainforestvegetation from water stress in otherwise climaticallymarginal sites (Hutley et al. 1997). The presence ofdew on leaf surfaces can also reduce transpiration
Rainforests
Figure 6 Schematic representation of the water balance of arainforest. The processes considered are representedby the solid arrows.
Interception and canopy storage
Interception rates can be described as a function ofthe following: topography, rainfall characteristicssuch as intensity and duration, wind speed, canopystorage capacity and antecedent moisture, evaporation
Soilwith horizons
Litter
Precipitation
throughfall
deep drainage
uptake
run-off
interception
stemflow
evapotranspiration
lateral flow
14
Water and nitrogen balance in the wet tropics of North Queensland
area over several metres from the base of the treeseven though the soils infiltration capacity (~ 6 mmmin–1) was well above the rainfall rate. These resultsillustrate the impact of stem flow on rainforesthydrology.
Run-off and streamflow
In undisturbed forests, the surface soil often containsmany macropores due to the presence of tree rootsand burrowing animals. As a result, the transmissivityof the surface layers to water is often high relative torainfall rates. Thus it is commonly considered thatrun-off is not a significant process in rainforest areas(Bonell 1993; Hutley 1995), being less than 5–10% ofrainfall (Table 6).
The situation may be quite different for monsoonalareas where rainfall intensities may be ten times thoserecorded for temperate areas and exhibit temporalpatterns distinct from equatorial regions (Bonell1993). In addition, it has been suggested that thepermeability of subsoils in some Australianrainforests (Bonell et al. 1982, 1983) is lower thanthose of many equatorial rainforests, and this impactson run-off generation processes (Bonell 1993). Bonellet al. (1982, 1983) found that in tropical rainforests inNorth Queensland rainfall intensities (on a six-minutebasis) of monsoonal and post-monsoonal rains weregreater than the subsoil hydraulic conductivities.Thus, the soils had moisture contents at, or near,saturation during several months of the wet seasonand run-off was generated by the infiltration-excessprocess (Bonell et al. 1983, Bonell 1993). This run-off generation process has been found in rainforests inAfrica (Dubreuil 1985) and Amazonia (Elsenbeer andCassel 1990). At the latter site, rainfall intensitieswere lower than those in the North Queenslandstudies, but the hydraulic conductivity of the subsoilwas also markedly lower (Bonell 1993).
The role that soil hydraulic properties play in thegeneration of run-off in Australian tropical rainforestscan also be assessed from the chemical compositionof stream water. Elsenbeer et al. (1994) found thatoverland flow in South Creek catchment in NorthQueensland was dominant enough in the hydrologicalcycle to have an effect on the streamflow chemistry.The contribution of ‘new’ water (that entering thecatchment during a particular storm event) tostreamflow was greater than the amount of ‘old’ water(that which existed in the soil storage before therainfall event). Bonell (1993) suggested there is adifference between monsoonal regions and temperateregions with respect to run-off, in that the monsoonalhydrographs appear to be dominated by new water,whereas temperate hydrographs contain higherproportions of old water. This may have significant
rate, foliage retention characteristics and bark storagecapacity (Pook et al. 1991; Jetten 1996). Interceptionloss has been shown to be a significant component ofthe water balance equation within forests, with long-term values in the order of 11% (Leopoldo et al.1995) to 21% (Calder et al. 1986) of annual rainfall.
On an individual rainfall event basis, canopy storagecapacities of tropical rainforests can be as high as 1mm (Table 5). Lower storage capacities are recordedfor high rainfall intensity events where the kineticenergy of the raindrops is higher, as is the airturbulence (Jetten 1996).
Table 5 Canopy saturation storage capacities of various tropical rainforests (after Jetten 1996).
Study Storage (mm) Comments/location
Bruijnzeel and Van Wiersum (1987)
0.5–0.6 Java, Indonesia
Fritsch (1990) 1.05 ECEREX, French Guyana
Herwitz (1985) 0.03–0.490.26–0.99
turbulent air, Queenslandstill air, Queensland
Jackson (1975) 0.89 Tanzania
Lloyd et al. (1988) 0.74 Manaus, Brazil
Waterloo (1994) 0.8–1.40.3–0.6
pre-cyclone, Fijipost-cyclone, Fiji
Jetten (1996) 0.89 Mabura, Guyana
Throughfall
Throughfall within forests exhibits high spatialvariability and it is common for measured throughfallto be greater than the gross rainfall in tropicalrainforests. For example, Jetten (1996) reported 24–25% of throughfall measurements greater than grossrainfall for Guyanan rainforests. This spatialvariability complicates the measurement of rainfall inrainforests. Brasell and Sinclair (1983) appear to bealone in their measurements of throughfall inAustralian tropical rainforests with mean throughfallbeing 76–86% of rainfall over an 18-month period.Similar values were reported by Hutley (1995) in asubtropical forest in South-East Queensland.
Stemflow
Stemflow is a function of both rainfall intensity, anddrainage characteristics of the canopy (Jetten 1996).In rainforests, stemflow can account for 1–2% ofrainfall fluxes (Price 1982; Hutley 1995; Jetten1996). In an Australian tropical rainforest, Herwitz(1986) recorded stemflows of 314 L m–2 of tree basalarea per minute for a rainfall intensity of 2 mm min–1.This local flux of water caused run-off to occur in an
15
Rainforests
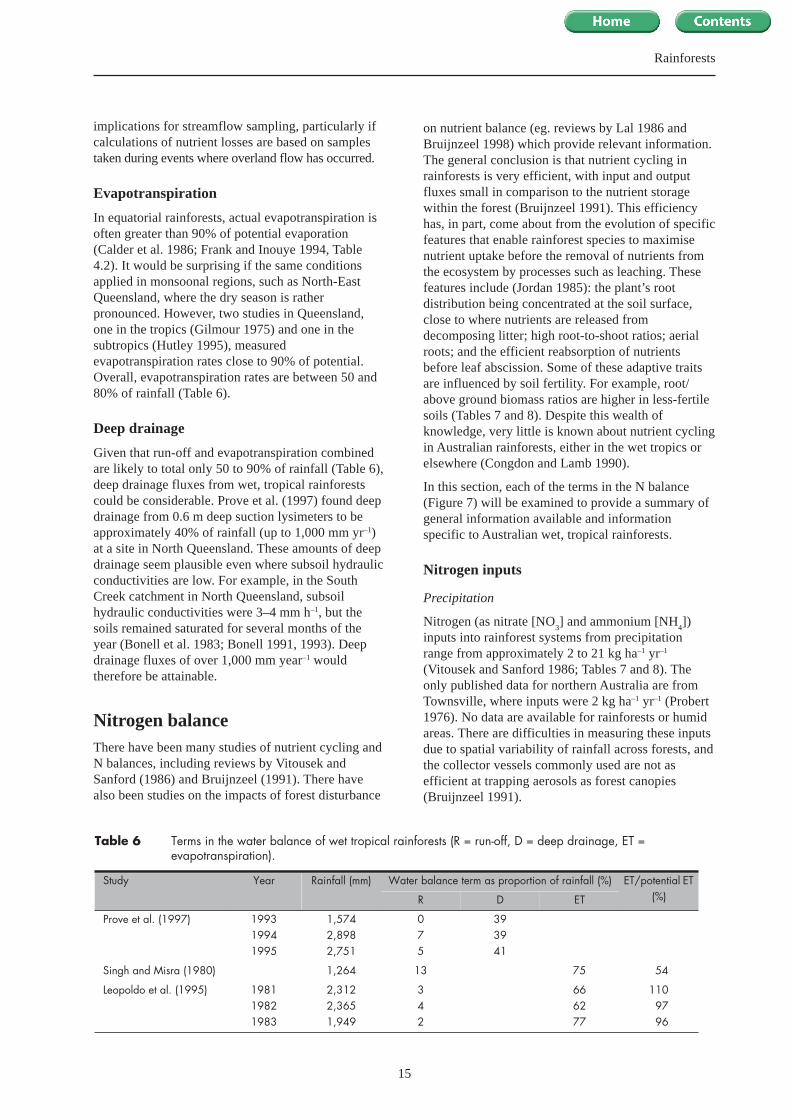
Table 6 Terms in the water balance of wet tropical rainforests (R = run-off, D = deep drainage, ET = evapotranspiration).
Study Year Rainfall (mm) Water balance term as proportion of rainfall (%) ET/potential ET (%)R D ET
Prove et al. (1997) 199319941995
1,5742,8982,751
075
393941
Singh and Misra (1980) 1,264 13 75 54
Leopoldo et al. (1995) 198119821983
2,3122,3651,949
342
666277
1109796
implications for streamflow sampling, particularly ifcalculations of nutrient losses are based on samplestaken during events where overland flow has occurred.
Evapotranspiration
In equatorial rainforests, actual evapotranspiration isoften greater than 90% of potential evaporation(Calder et al. 1986; Frank and Inouye 1994, Table4.2). It would be surprising if the same conditionsapplied in monsoonal regions, such as North-EastQueensland, where the dry season is ratherpronounced. However, two studies in Queensland,one in the tropics (Gilmour 1975) and one in thesubtropics (Hutley 1995), measuredevapotranspiration rates close to 90% of potential.Overall, evapotranspiration rates are between 50 and80% of rainfall (Table 6).
Deep drainage
Given that run-off and evapotranspiration combinedare likely to total only 50 to 90% of rainfall (Table 6),deep drainage fluxes from wet, tropical rainforestscould be considerable. Prove et al. (1997) found deepdrainage from 0.6 m deep suction lysimeters to beapproximately 40% of rainfall (up to 1,000 mm yr–1)at a site in North Queensland. These amounts of deepdrainage seem plausible even where subsoil hydraulicconductivities are low. For example, in the SouthCreek catchment in North Queensland, subsoilhydraulic conductivities were 3–4 mm h–1, but thesoils remained saturated for several months of theyear (Bonell et al. 1983; Bonell 1991, 1993). Deepdrainage fluxes of over 1,000 mm year–1 wouldtherefore be attainable.
Nitrogen balanceThere have been many studies of nutrient cycling andN balances, including reviews by Vitousek andSanford (1986) and Bruijnzeel (1991). There havealso been studies on the impacts of forest disturbance
on nutrient balance (eg. reviews by Lal 1986 andBruijnzeel 1998) which provide relevant information.The general conclusion is that nutrient cycling inrainforests is very efficient, with input and outputfluxes small in comparison to the nutrient storagewithin the forest (Bruijnzeel 1991). This efficiencyhas, in part, come about from the evolution of specificfeatures that enable rainforest species to maximisenutrient uptake before the removal of nutrients fromthe ecosystem by processes such as leaching. Thesefeatures include (Jordan 1985): the plant’s rootdistribution being concentrated at the soil surface,close to where nutrients are released fromdecomposing litter; high root-to-shoot ratios; aerialroots; and the efficient reabsorption of nutrientsbefore leaf abscission. Some of these adaptive traitsare influenced by soil fertility. For example, root/above ground biomass ratios are higher in less-fertilesoils (Tables 7 and 8). Despite this wealth ofknowledge, very little is known about nutrient cyclingin Australian rainforests, either in the wet tropics orelsewhere (Congdon and Lamb 1990).
In this section, each of the terms in the N balance(Figure 7) will be examined to provide a summary ofgeneral information available and informationspecific to Australian wet, tropical rainforests.
Nitrogen inputs
Precipitation
Nitrogen (as nitrate [NO3] and ammonium [NH
4])
inputs into rainforest systems from precipitationrange from approximately 2 to 21 kg ha–1 yr–1
(Vitousek and Sanford 1986; Tables 7 and 8). Theonly published data for northern Australia are fromTownsville, where inputs were 2 kg ha–1 yr–1 (Probert1976). No data are available for rainforests or humidareas. There are difficulties in measuring these inputsdue to spatial variability of rainfall across forests, andthe collector vessels commonly used are not asefficient at trapping aerosols as forest canopies(Bruijnzeel 1991).
16
Water and nitrogen balance in the wet tropics of North Queensland
Fixation
An equally or more important input of N into forestsystems is via biological fixation. This is particularlyso for more mature forests, with mycorrhizalassociations supplying most of the N required by theforest in the form of ammonia (Attiwill and Leeper1987). Rates can be up to 200 kg ha–1 yr–1, dependingon the level of soil fertility (Tables 7 and 8). N mayalso be fixed by epiphytes in rainforests (Stewart et
al. 1995), but the contribution of N from this source islikely to be less than 200 kg ha–1 yr–1 (Goosem andLamb 1986).
Figure 7 Schematic representation of the nitrogen balance ofa rainforest. The processes considered arerepresented by the solid arrows.
Table 8 Pool sizes and fluxes of the nitrogen cycle of two sites in the Amazonian rainforest.
Level of soil fertility:
low(Jordan et al.
1982)
very low (Herrera and Jordan 1981)
Pools (kg ha–1)
Above ground biomass 1,084 336
Roots 586 843
Litter 406 132
Soil 3,507 785
Total 5,583 2,096
Flux densities (kg ha–1 yr–1)
Precipitation 12 21
Fixation 16 35
Leaching 14 9
Denitrification 3 not given
Leaffall 61.3 24
Throughfall 25.3 9
Table 7 Pool sizes and fluxes of the nitrogen cycle surveyed for rainforests around the world. The range invalues represents site-to-site variation, but the individual sites do not necessarily correspond betweenthe different processes.
Process Level of soil fertility Montane
moderate low very low
after Vitousek and Sanford (1986)
Above ground biomass (kg ha–1) 1,980–1,685 2430–741 618–32 876–367
Total root system (kg ha–1) 1,896 2,834–1,570 1,170–222 1,114–508
Fine (< 6 mm) roots (kg ha–1) 68 146 364–170 157–21
Litter (kg ha–1) 224–110 170–61 55–42 90–28
Throughfall (kg ha–1 yr–1) 13 60–4 8 30–8
Hydrologic losses (kg ha–1 yr–1) 19 0.2 not given 5
after Sylvester-Bradley et al. (1980)
Fixation (kg ha–1 yr–1) 245 20 2 not given
after Bruijnzeel (1991)
Atmospheric inputs (kg ha–1 yr–1) 15–1 30–2 21 14–1
Hydrologic losses (kg ha–1 yr–1) 38–7 30–0.2 10 29–2
Difference (kg ha–1 yr–1) +5 to –23 +24 to –8 +11 +8 to –15
Soil
Litter
Precipitation
Atmosphericgases
throughfall
litterfall
deni
trif
icat
ion
fixa
tion
leaching
uptake
sediment
decomposition
immobilisation
lateral flow
17
Rainforests
be of little value, because of disparities betweencollection methods and definitions. What compriseslitter can be quite different between studies, withsome researchers including twigs, flowers, fruit,stems, branches, or a selection of these in theirdefinition.
At two rainforest sites on the Atherton Tablelands inNorth Queensland, the flux of N falling in litter was120–130 kg ha–1 yr–1 (Brasell and Sinclair 1983) with120–140 kg ha–1 of N stored in the litter (Brasell et al.1980). These litterfall rates are higher than thoserecorded in Amazonian rainforests (Table 8), althoughthe storage is similar to that found in rainforests onsoil of low fertility (Table 7).
N in leaf litter is often measured for assessing aforest’s efficiency with respect to mineral cycling.Vitousek (1984) suggested that the ratio of litter drymass to litter nutrient content is useful in determiningthe nutrient cycling efficiency of a stand in terms ofbiomass production per unit of nutrient acquired. Thisefficiency is different to that of the stand to absorbnutrients released from decomposing litter, althoughthe two may be correlated. Vitousek (1984) found thatforests exhibiting high N efficiency (high litter drymass:N ratios) were associated with systemsexhibiting low N fluxes in litterfall, and lowefficiencies corresponded to high N fluxes inlitterfall. The low efficiencies were particularlyevident in lowland tropical forests.
Soil nitrogen and its availability
While total N levels in rainforest soils are highrelative to other N pools, even in soils of low fertility(Table 8), there is little information on the availabilityof soil N. Given the high C/N ratios of rainforest litter(Attiwill and Leeper 1987) and substantial amounts oflitter on the forest floor (10–20 t ha–1; Brasell et al.1980; Vitousek and Sanford 1986), it is likely thatmuch of the available nitrogen will be immobilised asthe litter breaks down. However, there is someevidence that soil mineralisation and nitrificationrates in rainforests are higher than in pastures (Neillet al. 1995).
There have been many studies of N mineralisationrates in rainforest soils. These studies indicate thatboth mineralisation and nitrification rates generallyincrease as forests mature (Riley and Vitousek 1995).Research by Lamb (1980) of a succession ofAustralian subtropical rainforests found soil nitrateexhibited gradual increases during successionalstages. This indicates that nitrate is not lacking inmature forests, and that ammonia becomes moreaccessible to microbes as forests age (Lamb 1980).
Nitrogen outputs
Denitrification
That rainforests are wet places suggests thatdenitrification may be an important pathway fornitrogen losses. This may be particularly so wherewatertables are shallow (eg. in riparian zones) orwhere perched watertables are common. Bowden etal. (1992) in a study of two watersheds in Luquilloexperimental forest, Puerto Rico, found nitrous oxide(N
2O) production associated with anaerobic
conditions and availability of nitrate, suggesting thatdenitrification was responsible. They suggest thathigh concentrations of N
2O in groundwater may be
indicative of surface fluxes of N2O. Owing to
potentially high levels of denitrification taking placein riparian zones, Bowden et al. (1992) suggest thatthese zones may contribute a disproportionateamount of gaseous loss from a watershed and haveimportant implications for N balances for watershedareas. This may be of particular importance where Nconcentrations in streamflow are used to estimateleaching losses from the catchment.
Hydrological outputs
While the humid tropics create ideal conditions forleaching, mature forests are highly efficient atconserving N, and very little is lost by leaching(Jordan 1985). N losses associated with run-off arerarely quantified. In general, rates of hydrologiclosses of N from rainforests are similar to net inputrates (Table 7).
In an Australian tropical rainforest, Walton andHunter (1997) found < 10 kg ha–1 of N was lost fromrainforested sub-catchments in the Johnston Rivercatchment. In a more detailed study, Prove et al.(1997) found < 2 kg ha–1 yr–1 of N was lost in run-offfrom plots, but up to 13 kg ha–1 yr–1 of N was lost(below 60 cm depth) in deep drainage from suctionlysimeters. These values are comparable with thosefrom other countries (Tables 7 and 8).
Cycling between nitrogen pools
Storage in plant biomass and litter
Of all research pertaining to N balances in tropicalrainforests, values of N contained within the soil,plant and litter are the most reported. The vegetation,including roots, has the highest nutrient capitalswithin tropical rainforest systems (Tables 7 and 8).
N stored in leaf litter is less than that stored withinthe vegetation. However, N in litter can be substantialwhen compared with above ground biomass.Between-study comparison of litterfall measures may
18
Water and nitrogen balance in the wet tropics of North Queensland
Rates of N mineralisation have been reported as beingdependent upon altitude as well as latitude (Vitousekand Matson 1988). Montane forests are reported ashaving lower N transformation rates than lowlandtropical forests, and lowland tropical forests exhibithigher net mineralisation and nitrification rates thantemperate forests (Riley and Vitousek 1995; Vitousekand Matson 1988). The study of Vitousek and Matson(1988) revealed that not all tropical soils have rapid ratesof mineralisation, particularly at upper montane sites.
Low soil nitrification rates are most likely to beassociated with low soil fertility and availability ofammonia (Lamb 1980; Vitousek and Matson 1988).Vitousek and Matson (1988) recorded associations oflow N mineralisation with low annual N circulation,based on measurements at 15 sites throughout CostaRica, Panama, Brazil and Hawaii. These authorssuggest that in N-limited sites (ie. wheredecomposition rates are low and C and N accumulatein the soil and litter), the adaptive features of thevegetation which have evolved to conserve nutrientsactually help to perpetuate reduced nitrogenavailability to plants. They describe a feedback cyclewhich occurs due to the system becoming moreconservative in response to low levels of N, which inturn decreases N levels found in the litter andincreases the immobilisation of N.
Studies of the soil N pool indicate that N accumulatesover time, or as the forest ages. Most parent materialscontain little N and, consequently, initial stages ofsoil development exhibit low soil N concentrations(Kawahara and Tsutsumi 1972; Riley and Vitousek1995). In a study of five montane forests exhibitingsimilar environmental conditions throughout Hawaii,Riley and Vitousek (1995) found that Nconcentrations of mineral soil per mass basisincreased with age. They also found that foliar andlitter N concentrations increased to an intermediateage, 185,000 yrs, and decreased thereafter (sitesstudied ranged in age from 200 to 4,500,000 years).The ratio of (foliar – litter)/foliar N concentrations
was lowest at the intermediate sites. Seasonal patternsin soil net mineralisation and nitrification rates werenot obvious in a study conducted by Neill et al.(1995) of Brazilian forest over a period of a year anda half. Given the uniform climatic conditions thatoccur in equatorial zones, this may not be the case formonsoonal regions.
Impacts of deforestation
Changes to soil properties and the waterbalance
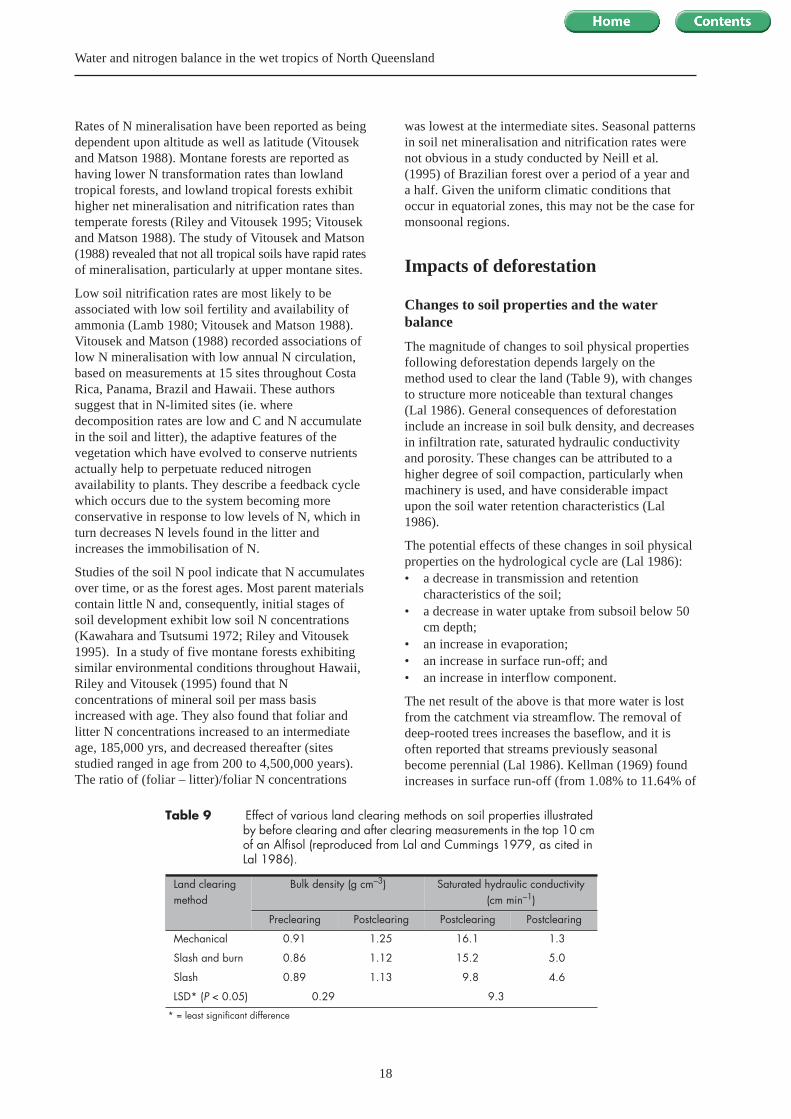
The magnitude of changes to soil physical propertiesfollowing deforestation depends largely on themethod used to clear the land (Table 9), with changesto structure more noticeable than textural changes(Lal 1986). General consequences of deforestationinclude an increase in soil bulk density, and decreasesin infiltration rate, saturated hydraulic conductivityand porosity. These changes can be attributed to ahigher degree of soil compaction, particularly whenmachinery is used, and have considerable impactupon the soil water retention characteristics (Lal1986).
The potential effects of these changes in soil physicalproperties on the hydrological cycle are (Lal 1986):• a decrease in transmission and retention
characteristics of the soil;• a decrease in water uptake from subsoil below 50
cm depth;• an increase in evaporation;• an increase in surface run-off; and• an increase in interflow component.
The net result of the above is that more water is lostfrom the catchment via streamflow. The removal ofdeep-rooted trees increases the baseflow, and it isoften reported that streams previously seasonalbecome perennial (Lal 1986). Kellman (1969) foundincreases in surface run-off (from 1.08% to 11.64% of
Table 9 Effect of various land clearing methods on soil properties illustrated by before clearing and after clearing measurements in the top 10 cm of an Alfisol (reproduced from Lal and Cummings 1979, as cited in Lal 1986).
Land clearing method
Bulk density (g cm–3) Saturated hydraulic conductivity(cm min–1)
Preclearing Postclearing Postclearing Postclearing
Mechanical 0.91 1.25 16.1 1.3
Slash and burn 0.86 1.12 15.2 5.0
Slash 0.89 1.13 9.8 4.6
LSD* (P < 0.05) 0.29 9.3
* = least significant difference
19
Rainforests
rainfall) and soil erosion (from 1.45 g day–1 to 119.31g day–1) after 12 years cultivation following forestclearing in the Philippines. Malmer (1993, cited inBonell 1993) recorded a change in flow paths fromsubsurface stormflow to infiltration–excess overlandflow for an area where timber extraction was carriedout using mechanical equipment at Sabah. Thesaturated hydraulic conductivity on tractor tracksdeclined from 154 mm h–1 to 0.28 mm h–1 for clays,and from 48.7 mm h–1 to 1.26 mm h–1 for sands.Bonell (1993) draws the conclusion that the tropicalareas most likely to exhibit drastic changes inhydrological components upon land-use changes arethose where soils of high permeability becomecompacted at or near the surface. The water balancestudy at the South Creek catchment, where a shallowimpeding layer exists, showed that, followingclearing, the streamflow recorded only slightly higherdischarges than previously (Gilmour 1975, cited inBonell 1993). In this area, overland flow is thedominant hydrological process in natural forests.
Changes to the nitrogen cycle
The major changes that occur to the nitrogen cycleupon deforestation are that the N losses increasewhile N inputs decrease. Perhaps the biggest changeis the removal of above-ground biomass and thecessation of litterfall. The consequence of this is thatsoil microbial populations decrease, the C to N ratiofalls, and nitrification rates increase (Jordan 1985;Attiwill and Leeper 1987). Neill et al. (1995) statethat the elevated levels of N fluxes (increased nitrate,net nitrification and net mineralisation) can occur forperiods up to two to three years following slash-and-burn clearing. Surface litter layer removal impacts onthe system by increasing run-off, evaporation andsurface salt content, as well as increasing thetemperatures and aeration in the surface. The result ofall these changes is an increased concentration ofnitrate in the soil. As water is no longer lost viaevapotranspiration, more water drains through theprofile, and leaching of N increases (Attiwill andLeeper 1987). Vitousek (1980) indicates that it is notuncommon for the soil N pool to decrease by over1,000 kg ha–1 in the top 30 cm of soil during the firstfew years following deforestation or burning.
Attiwill and Leeper (1987) describe the progressionof nutrient cycling following clearing. They state thatin the initial years after clearing there is littleevidence of any nutrient cycling taking place. As timeprogresses, the pattern of nutrient conservationbecomes established in the forest regrowth. Vitousek(1980) reports that for plantation forests as comparedwith natural ecosystems, N contents are loweralthough they increase at a much faster rate over time.
SummaryRainforests of the wet tropics have evolved tosuccessfully grow in areas of high annual rainfall onsoils of low to moderate fertility. Fog and dew areimportant sources of water at higher altitudes, andmay have particular ecological significance in thereduction of plant water stress in some hydrologicallymarginal environments. Rainforest plants sufferseasonal water stress in the monsoonal tropics, butless so in the continually moist humid tropics of theequatorial regions. Evapotranspiration can be as lowas 50% of rainfall annually, so the fluxes of otherterms of the water balance can be high. Run-off isprimarily controlled by the hydraulic conductivity ofsubsurface soil horizons. Where these horizons are oflow conductivity, run-off can be significant, beingderived from saturation overland flow and base flowfrom perched watertables. This situation appears to becommon in Australian tropical rainforests. Despite thelow hydraulic conductivity of subsurface soilhorizons, deep drainage can still be substantial due tothe length of time (months) the profile remainssaturated. There is no complete water balance of anAustralian, wet tropical rainforest, although one studyhas been conducted in a subtropical forest.
Rainforests, worldwide, have very low (~1%) inputand output fluxes of N compared with the amountstored within the above- and below-ground vegetationand litter layer. Nutrients are conserved by efficienttranslocation within the plants and efficient uptake ofN reaching the ground, in precipitation (throughfall orstem flow) or litter, and by dense surface root mats.Inputs are from rainfall and dry deposition andfixation. Doubt exists over the magnitude of N fixed.Outputs are N carried in run-off and deep drainagewater, with an Australian study suggesting mostlosses are via deep drainage. Apart from this latterstudy and some information of litterfall, there is noinformation to confirm that this general model of Ncycling operates in Australian rainforests.
20
As already noted, agricultural plant productionsystems in the wet tropics are dominated bysugarcane with small, but important, areas ofhorticulture interspersed. In this section we focus onthese systems. Literature on complete water andnutrient balances of these agriculture systems is almostnon-existent. Most effort to date has been directed at‘improving’ water and nutrient use efficiency, butusually by dealing with only a specific nutrient orcomponent of the water or nutrient balance. There isonly one study that has attempted to address the fullwater and nutrient balance (Prove et al. 1997).
The biggest difference between natural andagricultural systems is the agriculturist’s ability tomanipulate fluxes of nutrients, and to a lesser extentwater, into and out of the system. Under rainfedconditions, control over water input is minimal, whileunder irrigated conditions the agriculturist has theability to significantly alter the water input. Ingeneral, fluxes of nutrients into and out of agriculturalsystems are higher than those in natural systemsbecause of fertiliser inputs and the regular removal ofbiomass during harvest. Nutrient losses to erosion,run-off and leaching are also higher in agriculturalsystems, usually because of increased availability ofnutrients, occurrence of bare soil in the system anddecreases in organic matter (Lal 1986; Magdoff et al.1997). Removal of biomass from agricultural systemsreduces the recycling of nutrients within the system.
Water inputs in both natural and agricultural systemstend to be event-driven, particularly in rainfed situations.While there is some continuity in the nutrient cyclingin natural systems, nutrient inputs and outputs inagricultural systems tend to be event driven, beingdominated by fertiliser applications and crop harvestswhich occur at specific times through the year. One ofthe biggest challenges therefore is for agriculturists toimprove the matching of supply of water andnutrients to meet the needs of production systems.
Water balanceResearch on water balance in the tropics has tended tofocus on wateruse efficiency associated withirrigation (eg. Kingston and Ham 1975; Turner 1990).However, since irrigation in the wet tropics is usuallyonly supplementary, little water balance work has
been done is this region. The one wet tropics studythat has attempted to address the complete waterbalance is that of Prove et al. (1997). The results ofthat study, together with other data addressing variouscomponents of the water balance, are considered inthis section.
Precipitation
Agricultural plant production in the wet tropics takesplace under very high rainfall (> 1,500 mm per year).Key features of this rain are its high intensity andmarked seasonality, with up to 90% falling in the six-month November–April period. We are not aware ofany studies in wet tropics agricultural systems thathave addressed dew, fog, interception, canopystorage, throughfall or stemflow and their role in theoverall water balance.
Run-off
Partitioning of precipitation between infiltration andrun-off is controlled by soil surface and near surfaceproperties. Although there tends to be more baresurface area and increased compaction in agriculturalsystems that will favour generation of run-off, fewstudies have quantified run-off from wet tropicssystems. Prove (1991) reported run-off fromindividual storms that ranged from 35 to 65% of totalrainfall for conventionally cultivated sugarcane lands.He reported similar values for run-off but noted thatthe peak run-off rates tended to be lower for zero-tillsystems. The data of Prove et al. (1997), whenaveraged over their three-year study period, indicatethat run-off (expressed as a percentage ofprecipitation) was < 1% in pastures, roughly 7% inbananas and 12% in sugarcane, compared with about5% in rainforest (see Table 10). The value forsugarcane is significantly lower than those reportedearlier.
Evapotranspiration
In the wet tropics there are only a few months of theyear (August–November) where rainfall is less thanevaporative demand as quantified by pan evaporation.While this suggests that the soil profile should remainwet for large parts of the year and thatevapotranspiration from agricultural systems will
Agricultural systems
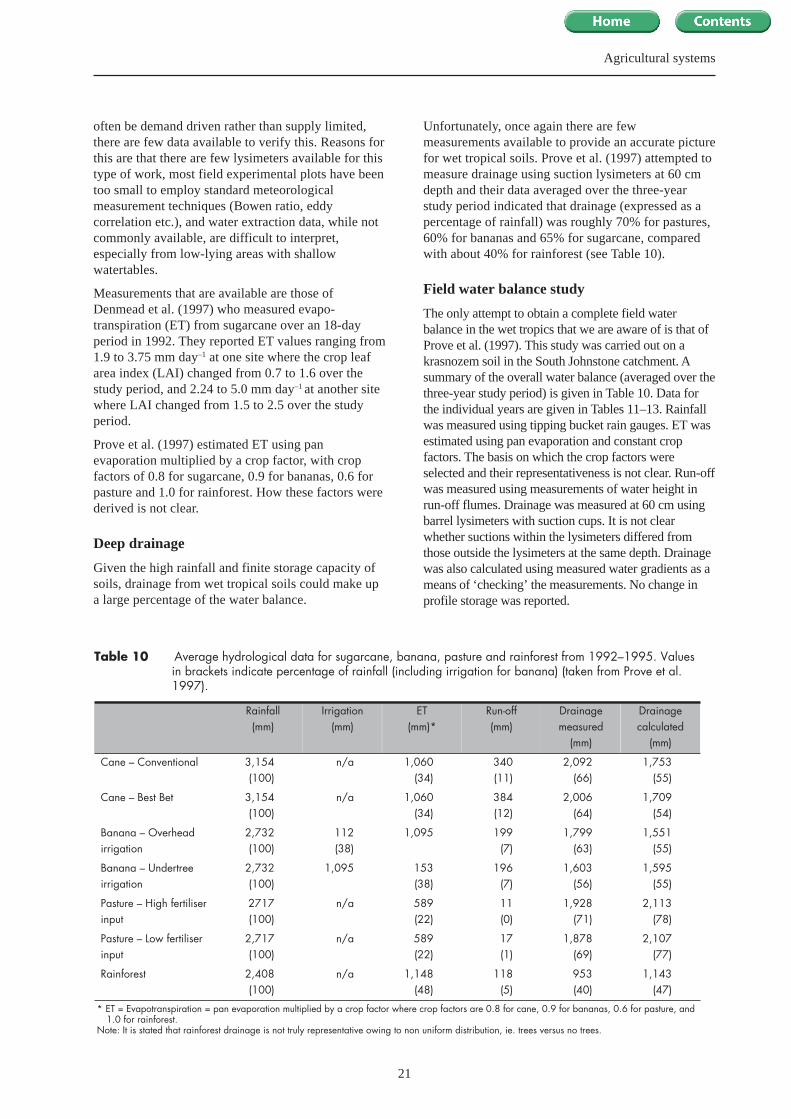
21
Agricultural systems
often be demand driven rather than supply limited,there are few data available to verify this. Reasons forthis are that there are few lysimeters available for thistype of work, most field experimental plots have beentoo small to employ standard meteorologicalmeasurement techniques (Bowen ratio, eddycorrelation etc.), and water extraction data, while notcommonly available, are difficult to interpret,especially from low-lying areas with shallowwatertables.
Measurements that are available are those ofDenmead et al. (1997) who measured evapo-transpiration (ET) from sugarcane over an 18-dayperiod in 1992. They reported ET values ranging from1.9 to 3.75 mm day–1 at one site where the crop leafarea index (LAI) changed from 0.7 to 1.6 over thestudy period, and 2.24 to 5.0 mm day–1 at another sitewhere LAI changed from 1.5 to 2.5 over the studyperiod.
Prove et al. (1997) estimated ET using panevaporation multiplied by a crop factor, with cropfactors of 0.8 for sugarcane, 0.9 for bananas, 0.6 forpasture and 1.0 for rainforest. How these factors werederived is not clear.
Deep drainage
Given the high rainfall and finite storage capacity ofsoils, drainage from wet tropical soils could make upa large percentage of the water balance.
Unfortunately, once again there are fewmeasurements available to provide an accurate picturefor wet tropical soils. Prove et al. (1997) attempted tomeasure drainage using suction lysimeters at 60 cmdepth and their data averaged over the three-yearstudy period indicated that drainage (expressed as apercentage of rainfall) was roughly 70% for pastures,60% for bananas and 65% for sugarcane, comparedwith about 40% for rainforest (see Table 10).
Field water balance study
The only attempt to obtain a complete field waterbalance in the wet tropics that we are aware of is that ofProve et al. (1997). This study was carried out on akrasnozem soil in the South Johnstone catchment. Asummary of the overall water balance (averaged over thethree-year study period) is given in Table 10. Data forthe individual years are given in Tables 11–13. Rainfallwas measured using tipping bucket rain gauges. ET wasestimated using pan evaporation and constant cropfactors. The basis on which the crop factors wereselected and their representativeness is not clear. Run-offwas measured using measurements of water height inrun-off flumes. Drainage was measured at 60 cm usingbarrel lysimeters with suction cups. It is not clearwhether suctions within the lysimeters differed fromthose outside the lysimeters at the same depth. Drainagewas also calculated using measured water gradients as ameans of ‘checking’ the measurements. No change inprofile storage was reported.
Table 10 Average hydrological data for sugarcane, banana, pasture and rainforest from 1992–1995. Values in brackets indicate percentage of rainfall (including irrigation for banana) (taken from Prove et al. 1997).
Rainfall(mm)
Irrigation (mm)
ET(mm)*
Run-off (mm)
Drainage measured
(mm)
Drainage calculated
(mm)
Cane – Conventional 3,154(100)
n/a 1,060(34)
340(11)
2,092(66)
1,753(55)
Cane – Best Bet 3,154(100)
n/a 1,060(34)
384(12)
2,006(64)
1,709(54)
Banana – Overhead irrigation
2,732(100)
112(38)
1,095 199(7)
1,799(63)
1,551(55)
Banana – Undertree irrigation
2,732(100)
1,095 153(38)
196(7)
1,603(56)
1,595(55)
Pasture – High fertiliser input
2717(100)
n/a 589(22)
11(0)
1,928(71)
2,113(78)
Pasture – Low fertiliser input
2,717(100)
n/a 589(22)
17(1)
1,878(69)
2,107(77)
Rainforest 2,408(100)
n/a 1,148(48)
118(5)
953(40)
1,143(47)
* ET = Evapotranspiration = pan evaporation multiplied by a crop factor where crop factors are 0.8 for cane, 0.9 for bananas, 0.6 for pasture, and 1.0 for rainforest.
Note: It is stated that rainforest drainage is not truly representative owing to non uniform distribution, ie. trees versus no trees.
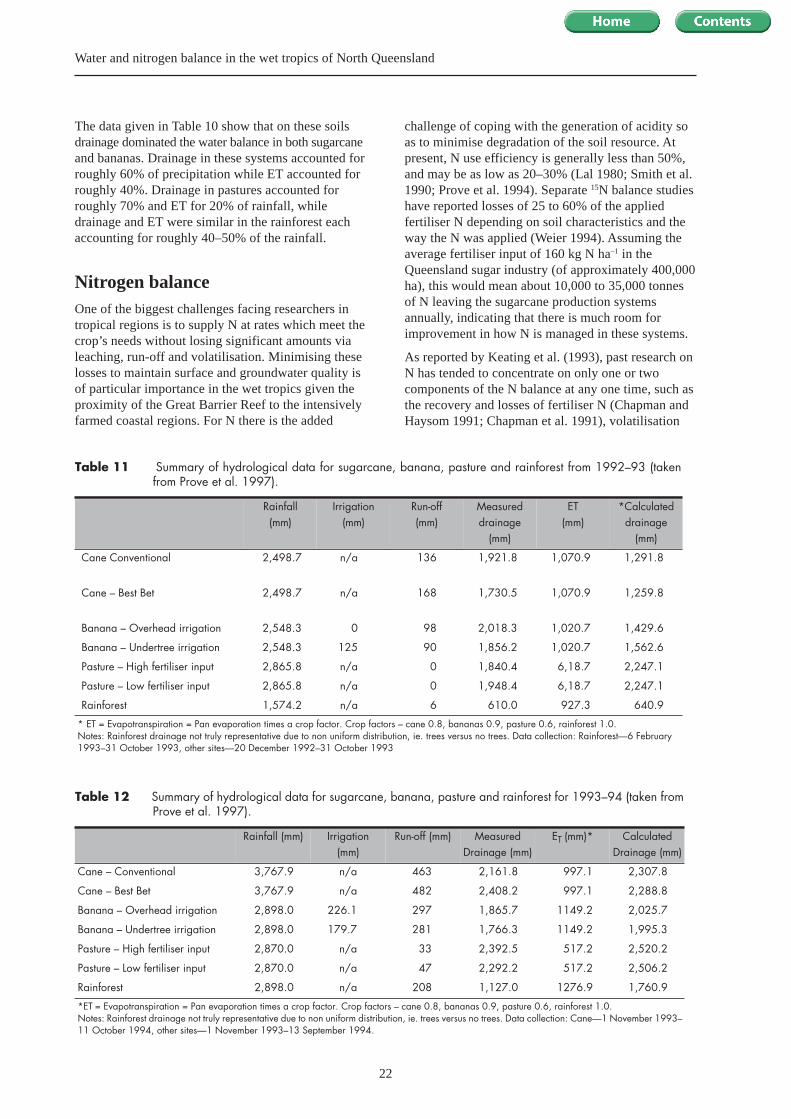
22
Water and nitrogen balance in the wet tropics of North Queensland
The data given in Table 10 show that on these soilsdrainage dominated the water balance in both sugarcaneand bananas. Drainage in these systems accounted forroughly 60% of precipitation while ET accounted forroughly 40%. Drainage in pastures accounted forroughly 70% and ET for 20% of rainfall, whiledrainage and ET were similar in the rainforest eachaccounting for roughly 40–50% of the rainfall.
Nitrogen balanceOne of the biggest challenges facing researchers intropical regions is to supply N at rates which meet thecrop’s needs without losing significant amounts vialeaching, run-off and volatilisation. Minimising theselosses to maintain surface and groundwater quality isof particular importance in the wet tropics given theproximity of the Great Barrier Reef to the intensivelyfarmed coastal regions. For N there is the added
challenge of coping with the generation of acidity soas to minimise degradation of the soil resource. Atpresent, N use efficiency is generally less than 50%,and may be as low as 20–30% (Lal 1980; Smith et al.1990; Prove et al. 1994). Separate 15N balance studieshave reported losses of 25 to 60% of the appliedfertiliser N depending on soil characteristics and theway the N was applied (Weier 1994). Assuming theaverage fertiliser input of 160 kg N ha–1 in theQueensland sugar industry (of approximately 400,000ha), this would mean about 10,000 to 35,000 tonnesof N leaving the sugarcane production systemsannually, indicating that there is much room forimprovement in how N is managed in these systems.
As reported by Keating et al. (1993), past research onN has tended to concentrate on only one or twocomponents of the N balance at any one time, such asthe recovery and losses of fertiliser N (Chapman andHaysom 1991; Chapman et al. 1991), volatilisation
Table 11 Summary of hydrological data for sugarcane, banana, pasture and rainforest from 1992–93 (takenfrom Prove et al. 1997).
Rainfall (mm)
Irrigation(mm)
Run-off(mm)
Measureddrainage
(mm)
ET(mm)
*Calculated drainage
(mm)
Cane Conventional 2,498.7 n/a 136 1,921.8 1,070.9 1,291.8
Cane – Best Bet 2,498.7 n/a 168 1,730.5 1,070.9 1,259.8
Banana – Overhead irrigation 2,548.3 0 98 2,018.3 1,020.7 1,429.6
Banana – Undertree irrigation 2,548.3 125 90 1,856.2 1,020.7 1,562.6
Pasture – High fertiliser input 2,865.8 n/a 0 1,840.4 6,18.7 2,247.1
Pasture – Low fertiliser input 2,865.8 n/a 0 1,948.4 6,18.7 2,247.1
Rainforest 1,574.2 n/a 6 610.0 927.3 640.9
* ET = Evapotranspiration = Pan evaporation times a crop factor. Crop factors – cane 0.8, bananas 0.9, pasture 0.6, rainforest 1.0. Notes: Rainforest drainage not truly representative due to non uniform distribution, ie. trees versus no trees. Data collection: Rainforest—6 February 1993–31 October 1993, other sites—20 December 1992–31 October 1993
Table 12 Summary of hydrological data for sugarcane, banana, pasture and rainforest for 1993–94 (taken fromProve et al. 1997).
Rainfall (mm) Irrigation(mm)
Run-off (mm) Measured Drainage (mm)
ET (mm)* Calculated Drainage (mm)
Cane – Conventional 3,767.9 n/a 463 2,161.8 997.1 2,307.8
Cane – Best Bet 3,767.9 n/a 482 2,408.2 997.1 2,288.8
Banana – Overhead irrigation 2,898.0 226.1 297 1,865.7 1149.2 2,025.7
Banana – Undertree irrigation 2,898.0 179.7 281 1,766.3 1149.2 1,995.3
Pasture – High fertiliser input 2,870.0 n/a 33 2,392.5 517.2 2,520.2
Pasture – Low fertiliser input 2,870.0 n/a 47 2,292.2 517.2 2,506.2
Rainforest 2,898.0 n/a 208 1,127.0 1276.9 1,760.9
*ET = Evapotranspiration = Pan evaporation times a crop factor. Crop factors – cane 0.8, bananas 0.9, pasture 0.6, rainforest 1.0. Notes: Rainforest drainage not truly representative due to non uniform distribution, ie. trees versus no trees. Data collection: Cane—1 November 1993–11 October 1994, other sites—1 November 1993–13 September 1994.
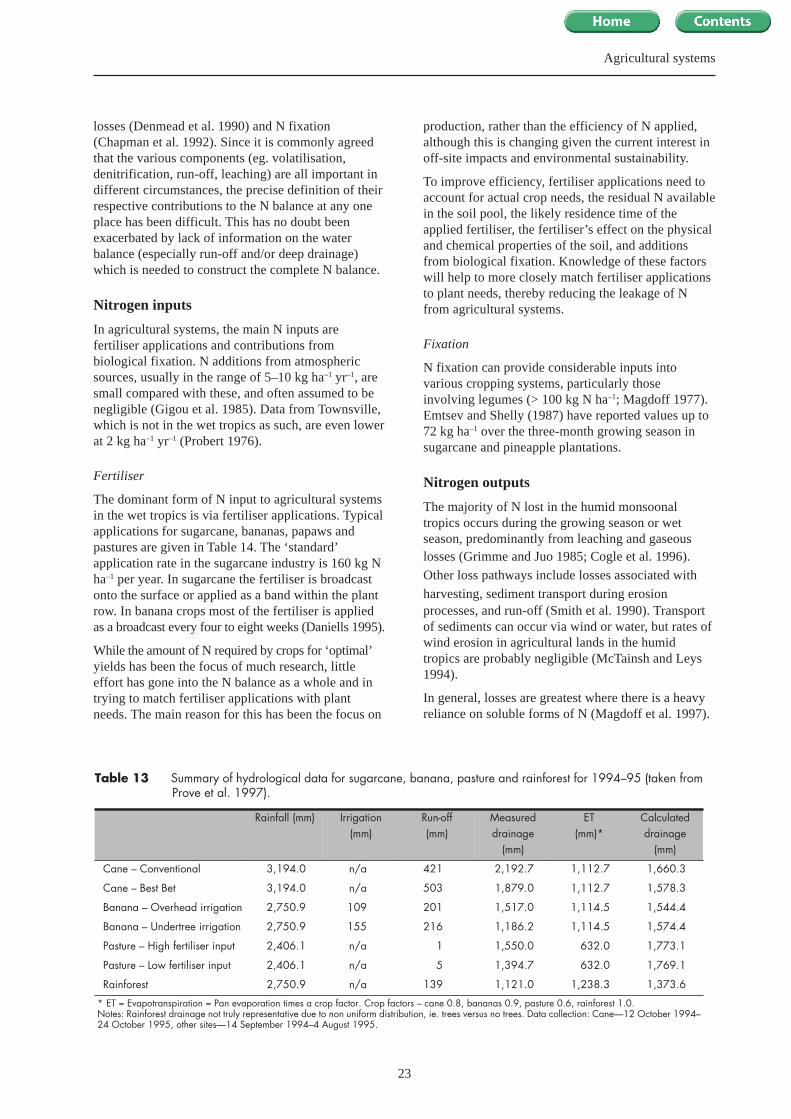
23
Agricultural systems
losses (Denmead et al. 1990) and N fixation(Chapman et al. 1992). Since it is commonly agreedthat the various components (eg. volatilisation,denitrification, run-off, leaching) are all important indifferent circumstances, the precise definition of theirrespective contributions to the N balance at any oneplace has been difficult. This has no doubt beenexacerbated by lack of information on the waterbalance (especially run-off and/or deep drainage)which is needed to construct the complete N balance.
Nitrogen inputs
In agricultural systems, the main N inputs arefertiliser applications and contributions frombiological fixation. N additions from atmosphericsources, usually in the range of 5–10 kg ha–1 yr–1, aresmall compared with these, and often assumed to benegligible (Gigou et al. 1985). Data from Townsville,which is not in the wet tropics as such, are even lowerat 2 kg ha–1 yr–1 (Probert 1976).
Fertiliser
The dominant form of N input to agricultural systemsin the wet tropics is via fertiliser applications. Typicalapplications for sugarcane, bananas, papaws andpastures are given in Table 14. The ‘standard’application rate in the sugarcane industry is 160 kg Nha–1 per year. In sugarcane the fertiliser is broadcastonto the surface or applied as a band within the plantrow. In banana crops most of the fertiliser is appliedas a broadcast every four to eight weeks (Daniells 1995).
While the amount of N required by crops for ‘optimal’yields has been the focus of much research, littleeffort has gone into the N balance as a whole and intrying to match fertiliser applications with plantneeds. The main reason for this has been the focus on
production, rather than the efficiency of N applied,although this is changing given the current interest inoff-site impacts and environmental sustainability.
To improve efficiency, fertiliser applications need toaccount for actual crop needs, the residual N availablein the soil pool, the likely residence time of theapplied fertiliser, the fertiliser’s effect on the physicaland chemical properties of the soil, and additionsfrom biological fixation. Knowledge of these factorswill help to more closely match fertiliser applicationsto plant needs, thereby reducing the leakage of Nfrom agricultural systems.
Fixation
N fixation can provide considerable inputs intovarious cropping systems, particularly thoseinvolving legumes (> 100 kg N ha–1; Magdoff 1977).Emtsev and Shelly (1987) have reported values up to72 kg ha–1 over the three-month growing season insugarcane and pineapple plantations.
Nitrogen outputs
The majority of N lost in the humid monsoonaltropics occurs during the growing season or wetseason, predominantly from leaching and gaseouslosses (Grimme and Juo 1985; Cogle et al. 1996).
Other loss pathways include losses associated with
harvesting, sediment transport during erosionprocesses, and run-off (Smith et al. 1990). Transportof sediments can occur via wind or water, but rates ofwind erosion in agricultural lands in the humidtropics are probably negligible (McTainsh and Leys1994).
In general, losses are greatest where there is a heavyreliance on soluble forms of N (Magdoff et al. 1997).
Table 13 Summary of hydrological data for sugarcane, banana, pasture and rainforest for 1994–95 (taken fromProve et al. 1997).
Rainfall (mm) Irrigation(mm)
Run-off(mm)
Measured drainage
(mm)
ET(mm)*
Calculated drainage
(mm)
Cane – Conventional 3,194.0 n/a 421 2,192.7 1,112.7 1,660.3
Cane – Best Bet 3,194.0 n/a 503 1,879.0 1,112.7 1,578.3
Banana – Overhead irrigation 2,750.9 109 201 1,517.0 1,114.5 1,544.4
Banana – Undertree irrigation 2,750.9 155 216 1,186.2 1,114.5 1,574.4
Pasture – High fertiliser input 2,406.1 n/a 1 1,550.0 632.0 1,773.1
Pasture – Low fertiliser input 2,406.1 n/a 5 1,394.7 632.0 1,769.1
Rainforest 2,750.9 n/a 139 1,121.0 1,238.3 1,373.6
* ET = Evapotranspiration = Pan evaporation times a crop factor. Crop factors – cane 0.8, bananas 0.9, pasture 0.6, rainforest 1.0. Notes: Rainforest drainage not truly representative due to non uniform distribution, ie. trees versus no trees. Data collection: Cane—12 October 1994–24 October 1995, other sites—14 September 1994–4 August 1995.
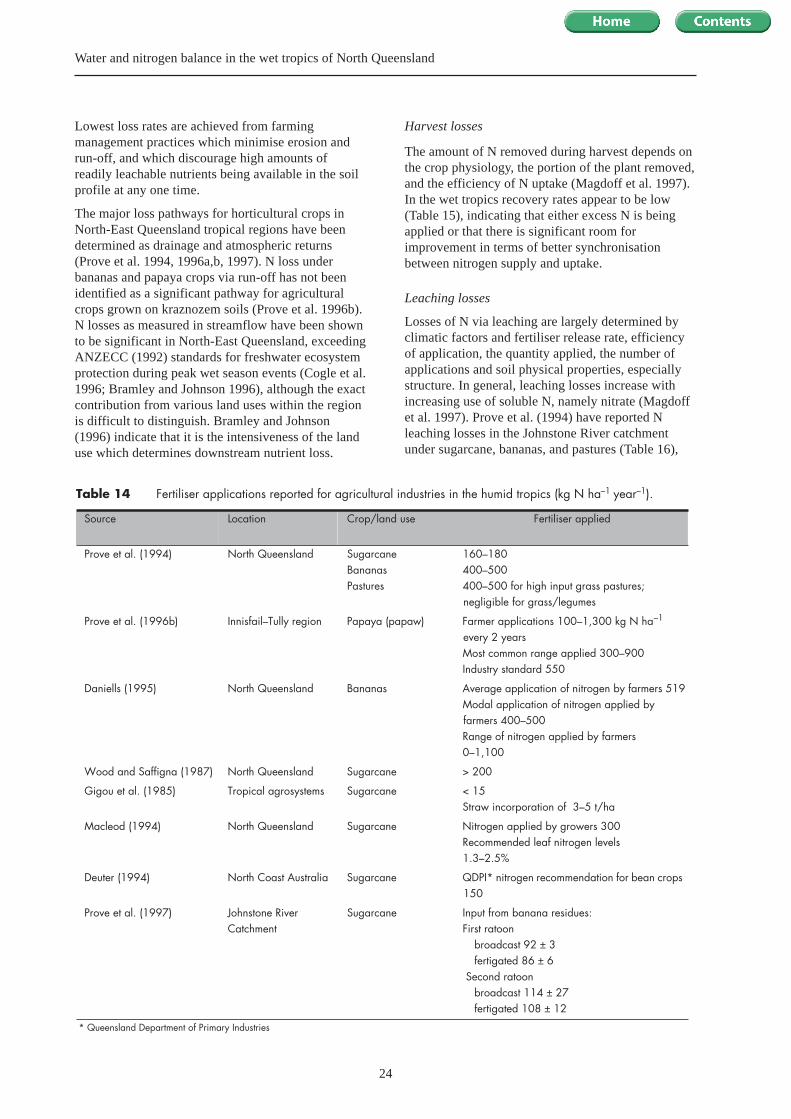
24
Water and nitrogen balance in the wet tropics of North Queensland
Lowest loss rates are achieved from farmingmanagement practices which minimise erosion andrun-off, and which discourage high amounts ofreadily leachable nutrients being available in the soilprofile at any one time.
The major loss pathways for horticultural crops inNorth-East Queensland tropical regions have beendetermined as drainage and atmospheric returns(Prove et al. 1994, 1996a,b, 1997). N loss underbananas and papaya crops via run-off has not beenidentified as a significant pathway for agriculturalcrops grown on kraznozem soils (Prove et al. 1996b).N losses as measured in streamflow have been shownto be significant in North-East Queensland, exceedingANZECC (1992) standards for freshwater ecosystemprotection during peak wet season events (Cogle et al.1996; Bramley and Johnson 1996), although the exactcontribution from various land uses within the regionis difficult to distinguish. Bramley and Johnson(1996) indicate that it is the intensiveness of the landuse which determines downstream nutrient loss.
Harvest losses
The amount of N removed during harvest depends onthe crop physiology, the portion of the plant removed,and the efficiency of N uptake (Magdoff et al. 1997).In the wet tropics recovery rates appear to be low(Table 15), indicating that either excess N is beingapplied or that there is significant room forimprovement in terms of better synchronisationbetween nitrogen supply and uptake.
Leaching losses
Losses of N via leaching are largely determined byclimatic factors and fertiliser release rate, efficiencyof application, the quantity applied, the number ofapplications and soil physical properties, especiallystructure. In general, leaching losses increase withincreasing use of soluble N, namely nitrate (Magdoffet al. 1997). Prove et al. (1994) have reported Nleaching losses in the Johnstone River catchmentunder sugarcane, bananas, and pastures (Table 16),
Table 14 Fertiliser applications reported for agricultural industries in the humid tropics (kg N ha–1 year–1).
Source Location Crop/land use Fertiliser applied
Prove et al. (1994) North Queensland
SugarcaneBananasPastures
160–180400–500400–500 for high input grass pastures; negligible for grass/legumes
Prove et al. (1996b) Innisfail–Tully region Papaya (papaw) Farmer applications 100–1,300 kg N ha–1 every 2 yearsMost common range applied 300–900Industry standard 550
Daniells (1995) North Queensland Bananas Average application of nitrogen by farmers 519Modal application of nitrogen applied by farmers 400–500Range of nitrogen applied by farmers0–1,100
Wood and Saffigna (1987) North Queensland Sugarcane > 200
Gigou et al. (1985) Tropical agrosystems Sugarcane < 15Straw incorporation of 3–5 t/ha
Macleod (1994) North Queensland Sugarcane Nitrogen applied by growers 300Recommended leaf nitrogen levels1.3–2.5%
Deuter (1994) North Coast Australia Sugarcane QDPI* nitrogen recommendation for bean crops 150
Prove et al. (1997) Johnstone River Catchment
Sugarcane Input from banana residues:First ratoon
broadcast 92 ± 3fertigated 86 ± 6
Second ratoonbroadcast 114 ± 27fertigated 108 ± 12
* Queensland Department of Primary Industries
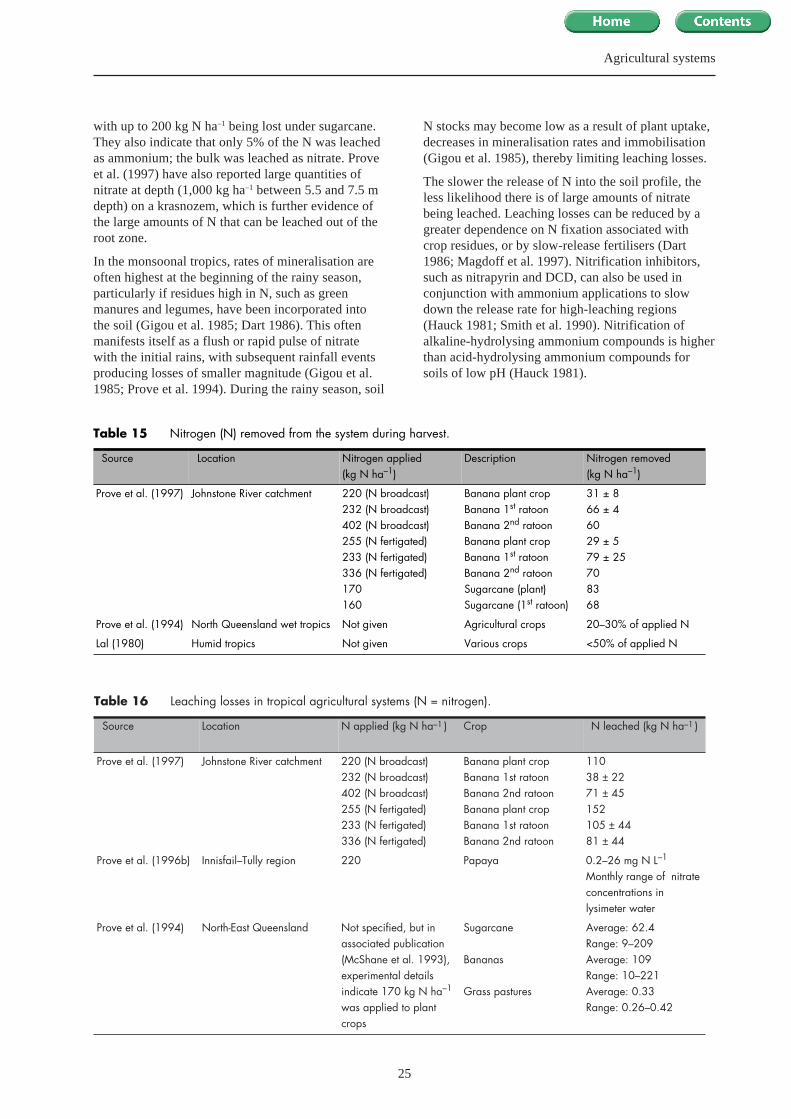
25
Agricultural systems
with up to 200 kg N ha–1 being lost under sugarcane.They also indicate that only 5% of the N was leachedas ammonium; the bulk was leached as nitrate. Proveet al. (1997) have also reported large quantities ofnitrate at depth (1,000 kg ha–1 between 5.5 and 7.5 mdepth) on a krasnozem, which is further evidence ofthe large amounts of N that can be leached out of theroot zone.
In the monsoonal tropics, rates of mineralisation areoften highest at the beginning of the rainy season,particularly if residues high in N, such as greenmanures and legumes, have been incorporated intothe soil (Gigou et al. 1985; Dart 1986). This oftenmanifests itself as a flush or rapid pulse of nitratewith the initial rains, with subsequent rainfall eventsproducing losses of smaller magnitude (Gigou et al.1985; Prove et al. 1994). During the rainy season, soil
N stocks may become low as a result of plant uptake,decreases in mineralisation rates and immobilisation(Gigou et al. 1985), thereby limiting leaching losses.
The slower the release of N into the soil profile, theless likelihood there is of large amounts of nitratebeing leached. Leaching losses can be reduced by agreater dependence on N fixation associated withcrop residues, or by slow-release fertilisers (Dart1986; Magdoff et al. 1997). Nitrification inhibitors,such as nitrapyrin and DCD, can also be used inconjunction with ammonium applications to slowdown the release rate for high-leaching regions(Hauck 1981; Smith et al. 1990). Nitrification ofalkaline-hydrolysing ammonium compounds is higherthan acid-hydrolysing ammonium compounds forsoils of low pH (Hauck 1981).
Table 16 Leaching losses in tropical agricultural systems (N = nitrogen).
Source Location N applied (kg N ha–1 ) Crop N leached (kg N ha–1 )
Prove et al. (1997) Johnstone River catchment 220 (N broadcast)232 (N broadcast)402 (N broadcast)255 (N fertigated)233 (N fertigated)336 (N fertigated)
Banana plant cropBanana 1st ratoonBanana 2nd ratoonBanana plant cropBanana 1st ratoonBanana 2nd ratoon
11038 ± 2271 ± 45152105 ± 4481 ± 44
Prove et al. (1996b) Innisfail–Tully region 220 Papaya 0.2–26 mg N L–1
Monthly range of nitrate concentrations in lysimeter water
Prove et al. (1994) North-East Queensland Not specified, but in associated publication(McShane et al. 1993), experimental details indicate 170 kg N ha–1 was applied to plant crops
Sugarcane
Bananas
Grass pastures
Average: 62.4Range: 9–209Average: 109Range: 10–221Average: 0.33Range: 0.26–0.42
Table 15 Nitrogen (N) removed from the system during harvest.
Source Location Nitrogen applied (kg N ha–1)
Description Nitrogen removed (kg N ha–1)
Prove et al. (1997) Johnstone River catchment
220 (N broadcast) 232 (N broadcast)402 (N broadcast)255 (N fertigated)233 (N fertigated)336 (N fertigated) 170160
Banana plant cropBanana 1st ratoonBanana 2nd ratoonBanana plant cropBanana 1st ratoonBanana 2nd ratoonSugarcane (plant)Sugarcane (1st ratoon)
31 ± 866 ± 46029 ± 579 ± 25708368
Prove et al. (1994) North Queensland wet tropics Not given Agricultural crops 20–30% of applied N
Lal (1980) Humid tropics Not given Various crops <50% of applied N
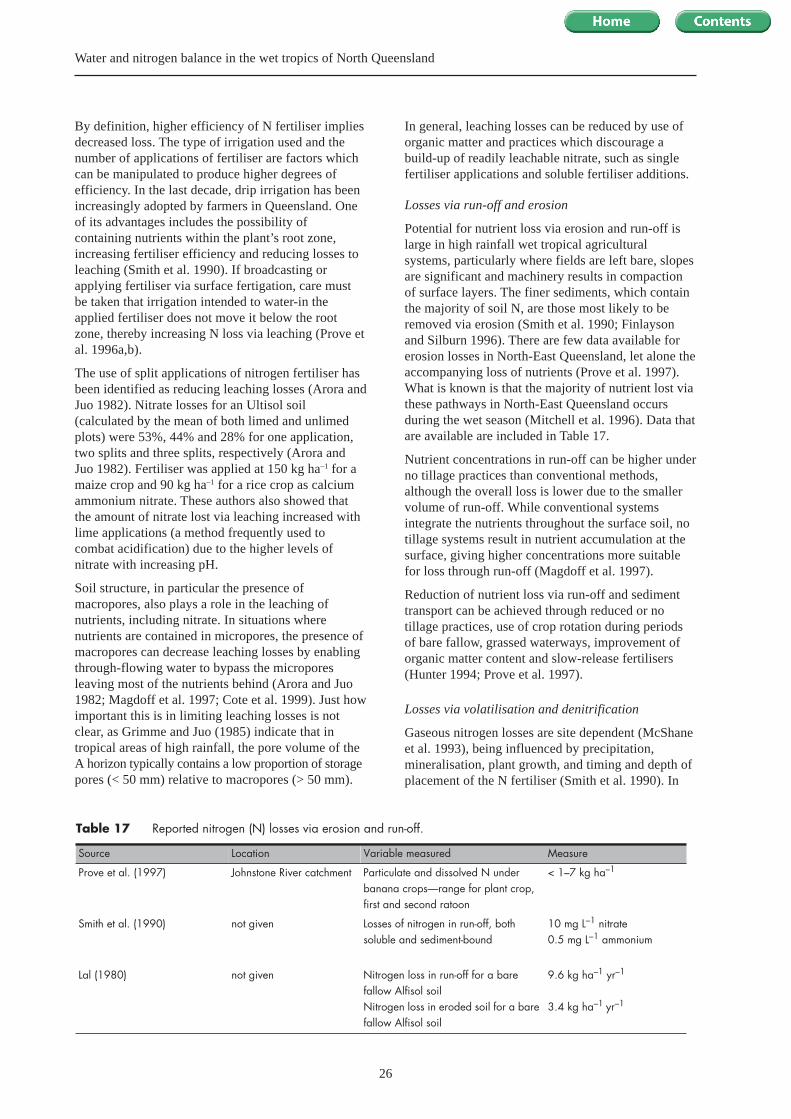
26
Water and nitrogen balance in the wet tropics of North Queensland
Table 17 Reported nitrogen (N) losses via erosion and run-off.
Source Location Variable measured Measure
Prove et al. (1997) Johnstone River catchment Particulate and dissolved N under banana crops—range for plant crop, first and second ratoon
< 1–7 kg ha–1
Smith et al. (1990) not given Losses of nitrogen in run-off, both soluble and sediment-bound
10 mg L–1 nitrate0.5 mg L–1 ammonium
Lal (1980) not given Nitrogen loss in run-off for a bare fallow Alfisol soilNitrogen loss in eroded soil for a bare fallow Alfisol soil
9.6 kg ha–1 yr–1
3.4 kg ha–1 yr–1
By definition, higher efficiency of N fertiliser impliesdecreased loss. The type of irrigation used and thenumber of applications of fertiliser are factors whichcan be manipulated to produce higher degrees ofefficiency. In the last decade, drip irrigation has beenincreasingly adopted by farmers in Queensland. Oneof its advantages includes the possibility ofcontaining nutrients within the plant’s root zone,increasing fertiliser efficiency and reducing losses toleaching (Smith et al. 1990). If broadcasting orapplying fertiliser via surface fertigation, care mustbe taken that irrigation intended to water-in theapplied fertiliser does not move it below the rootzone, thereby increasing N loss via leaching (Prove etal. 1996a,b).
The use of split applications of nitrogen fertiliser hasbeen identified as reducing leaching losses (Arora andJuo 1982). Nitrate losses for an Ultisol soil(calculated by the mean of both limed and unlimedplots) were 53%, 44% and 28% for one application,two splits and three splits, respectively (Arora andJuo 1982). Fertiliser was applied at 150 kg ha–1 for amaize crop and 90 kg ha–1 for a rice crop as calciumammonium nitrate. These authors also showed thatthe amount of nitrate lost via leaching increased withlime applications (a method frequently used tocombat acidification) due to the higher levels ofnitrate with increasing pH.
Soil structure, in particular the presence ofmacropores, also plays a role in the leaching ofnutrients, including nitrate. In situations wherenutrients are contained in micropores, the presence ofmacropores can decrease leaching losses by enablingthrough-flowing water to bypass the microporesleaving most of the nutrients behind (Arora and Juo1982; Magdoff et al. 1997; Cote et al. 1999). Just howimportant this is in limiting leaching losses is notclear, as Grimme and Juo (1985) indicate that intropical areas of high rainfall, the pore volume of theA horizon typically contains a low proportion of storagepores (< 50 mm) relative to macropores (> 50 mm).
In general, leaching losses can be reduced by use oforganic matter and practices which discourage abuild-up of readily leachable nitrate, such as singlefertiliser applications and soluble fertiliser additions.
Losses via run-off and erosion
Potential for nutrient loss via erosion and run-off islarge in high rainfall wet tropical agriculturalsystems, particularly where fields are left bare, slopesare significant and machinery results in compactionof surface layers. The finer sediments, which containthe majority of soil N, are those most likely to beremoved via erosion (Smith et al. 1990; Finlaysonand Silburn 1996). There are few data available forerosion losses in North-East Queensland, let alone theaccompanying loss of nutrients (Prove et al. 1997).What is known is that the majority of nutrient lost viathese pathways in North-East Queensland occursduring the wet season (Mitchell et al. 1996). Data thatare available are included in Table 17.
Nutrient concentrations in run-off can be higher underno tillage practices than conventional methods,although the overall loss is lower due to the smallervolume of run-off. While conventional systemsintegrate the nutrients throughout the surface soil, notillage systems result in nutrient accumulation at thesurface, giving higher concentrations more suitablefor loss through run-off (Magdoff et al. 1997).
Reduction of nutrient loss via run-off and sedimenttransport can be achieved through reduced or notillage practices, use of crop rotation during periodsof bare fallow, grassed waterways, improvement oforganic matter content and slow-release fertilisers(Hunter 1994; Prove et al. 1997).
Losses via volatilisation and denitrification
Gaseous nitrogen losses are site dependent (McShaneet al. 1993), being influenced by precipitation,mineralisation, plant growth, and timing and depth ofplacement of the N fertiliser (Smith et al. 1990). In
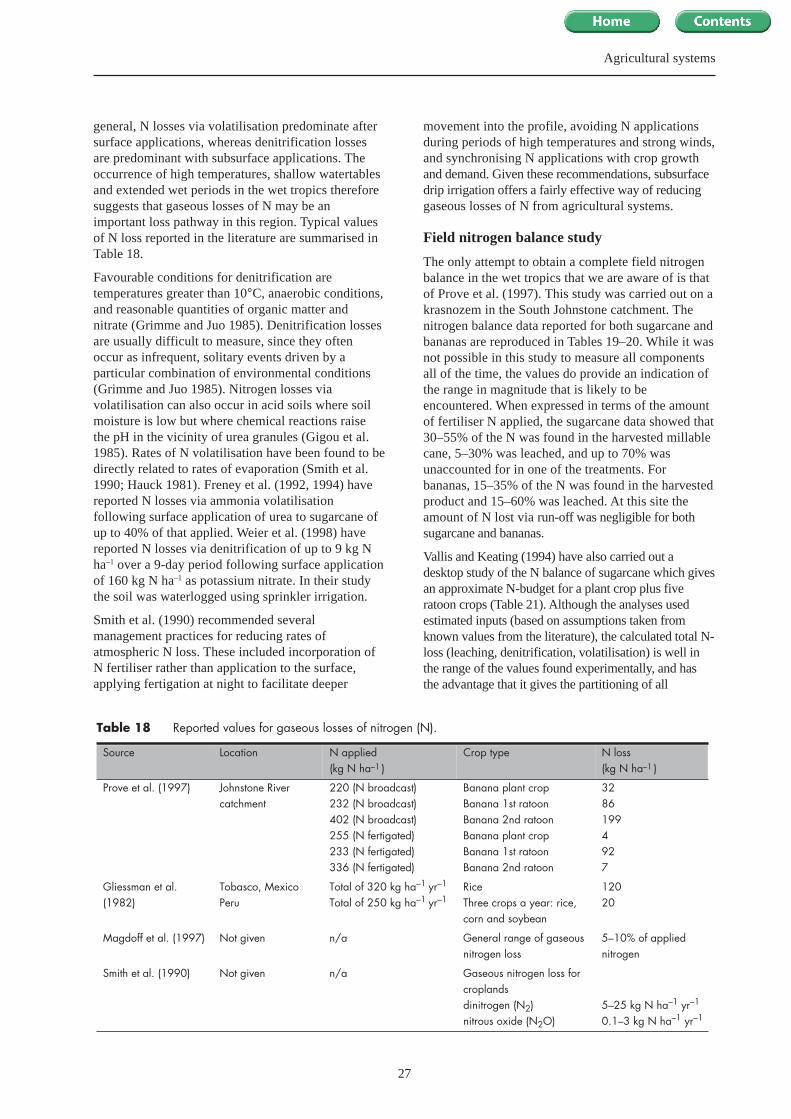
27
Agricultural systems
general, N losses via volatilisation predominate aftersurface applications, whereas denitrification lossesare predominant with subsurface applications. Theoccurrence of high temperatures, shallow watertablesand extended wet periods in the wet tropics thereforesuggests that gaseous losses of N may be animportant loss pathway in this region. Typical valuesof N loss reported in the literature are summarised inTable 18.
Favourable conditions for denitrification aretemperatures greater than 10°C, anaerobic conditions,and reasonable quantities of organic matter andnitrate (Grimme and Juo 1985). Denitrification lossesare usually difficult to measure, since they oftenoccur as infrequent, solitary events driven by aparticular combination of environmental conditions(Grimme and Juo 1985). Nitrogen losses viavolatilisation can also occur in acid soils where soilmoisture is low but where chemical reactions raisethe pH in the vicinity of urea granules (Gigou et al.1985). Rates of N volatilisation have been found to bedirectly related to rates of evaporation (Smith et al.1990; Hauck 1981). Freney et al. (1992, 1994) havereported N losses via ammonia volatilisationfollowing surface application of urea to sugarcane ofup to 40% of that applied. Weier et al. (1998) havereported N losses via denitrification of up to 9 kg Nha–1 over a 9-day period following surface applicationof 160 kg N ha–1 as potassium nitrate. In their studythe soil was waterlogged using sprinkler irrigation.
Smith et al. (1990) recommended severalmanagement practices for reducing rates ofatmospheric N loss. These included incorporation ofN fertiliser rather than application to the surface,applying fertigation at night to facilitate deeper
movement into the profile, avoiding N applicationsduring periods of high temperatures and strong winds,and synchronising N applications with crop growthand demand. Given these recommendations, subsurfacedrip irrigation offers a fairly effective way of reducinggaseous losses of N from agricultural systems.
Field nitrogen balance study
The only attempt to obtain a complete field nitrogenbalance in the wet tropics that we are aware of is thatof Prove et al. (1997). This study was carried out on akrasnozem in the South Johnstone catchment. Thenitrogen balance data reported for both sugarcane andbananas are reproduced in Tables 19–20. While it wasnot possible in this study to measure all componentsall of the time, the values do provide an indication ofthe range in magnitude that is likely to beencountered. When expressed in terms of the amountof fertiliser N applied, the sugarcane data showed that30–55% of the N was found in the harvested millablecane, 5–30% was leached, and up to 70% wasunaccounted for in one of the treatments. Forbananas, 15–35% of the N was found in the harvestedproduct and 15–60% was leached. At this site theamount of N lost via run-off was negligible for bothsugarcane and bananas.
Vallis and Keating (1994) have also carried out adesktop study of the N balance of sugarcane which givesan approximate N-budget for a plant crop plus fiveratoon crops (Table 21). Although the analyses usedestimated inputs (based on assumptions taken fromknown values from the literature), the calculated total N-loss (leaching, denitrification, volatilisation) is well inthe range of the values found experimentally, and hasthe advantage that it gives the partitioning of all
Table 18 Reported values for gaseous losses of nitrogen (N).
Source Location N applied(kg N ha–1 )
Crop type N loss(kg N ha–1 )
Prove et al. (1997) Johnstone River catchment
220 (N broadcast)232 (N broadcast)402 (N broadcast)255 (N fertigated)233 (N fertigated)336 (N fertigated)
Banana plant cropBanana 1st ratoonBanana 2nd ratoonBanana plant cropBanana 1st ratoonBanana 2nd ratoon
32861994927
Gliessman et al. (1982)
Tobasco, MexicoPeru
Total of 320 kg ha–1 yr–1
Total of 250 kg ha–1 yr–1RiceThree crops a year: rice, corn and soybean
12020
Magdoff et al. (1997) Not given n/a General range of gaseous nitrogen loss
5–10% of applied nitrogen
Smith et al. (1990) Not given n/a Gaseous nitrogen loss for croplandsdinitrogen (N2)nitrous oxide (N2O)
5–25 kg N ha–1 yr–1
0.1–3 kg N ha–1 yr–1
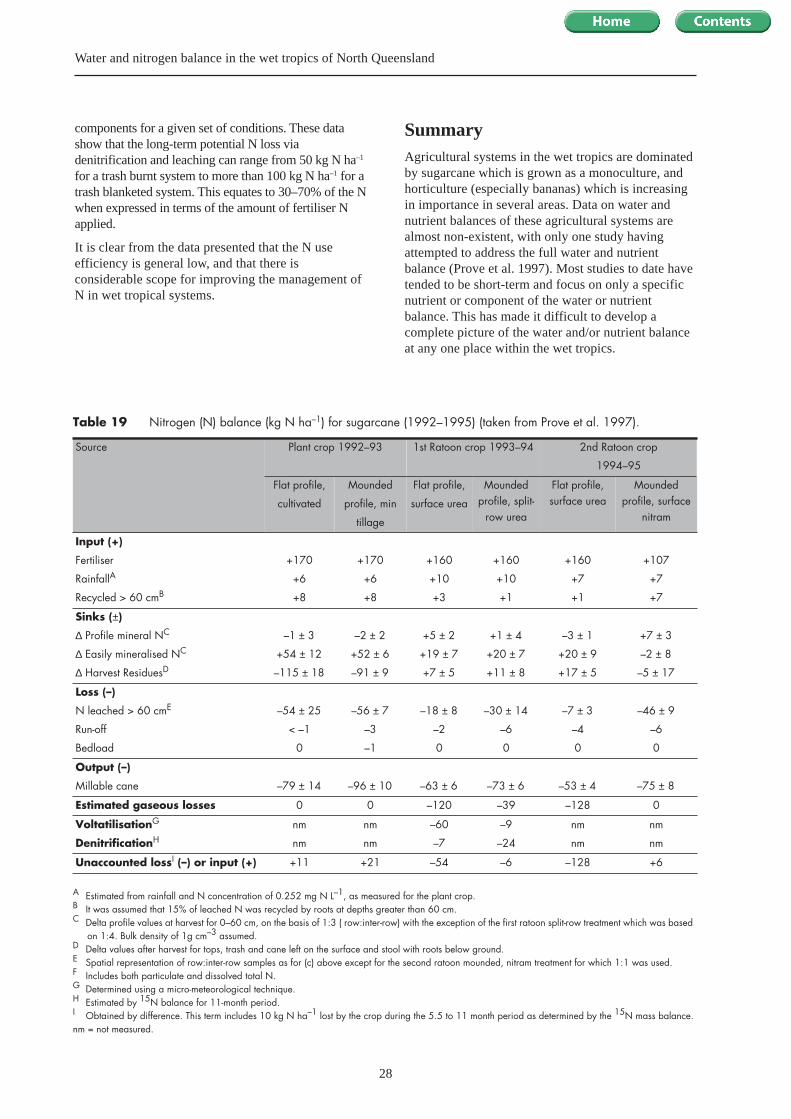
28
Water and nitrogen balance in the wet tropics of North Queensland
components for a given set of conditions. These datashow that the long-term potential N loss viadenitrification and leaching can range from 50 kg N ha–1
for a trash burnt system to more than 100 kg N ha–1 for atrash blanketed system. This equates to 30–70% of the Nwhen expressed in terms of the amount of fertiliser Napplied.
It is clear from the data presented that the N useefficiency is general low, and that there isconsiderable scope for improving the management ofN in wet tropical systems.
SummaryAgricultural systems in the wet tropics are dominatedby sugarcane which is grown as a monoculture, andhorticulture (especially bananas) which is increasingin importance in several areas. Data on water andnutrient balances of these agricultural systems arealmost non-existent, with only one study havingattempted to address the full water and nutrientbalance (Prove et al. 1997). Most studies to date havetended to be short-term and focus on only a specificnutrient or component of the water or nutrientbalance. This has made it difficult to develop acomplete picture of the water and/or nutrient balanceat any one place within the wet tropics.
A Estimated from rainfall and N concentration of 0.252 mg N L–1, as measured for the plant crop.B It was assumed that 15% of leached N was recycled by roots at depths greater than 60 cm.C Delta profile values at harvest for 0–60 cm, on the basis of 1:3 ( row:inter-row) with the exception of the first ratoon split-row treatment which was based
on 1:4. Bulk density of 1g cm–3 assumed.D Delta values after harvest for tops, trash and cane left on the surface and stool with roots below ground.E Spatial representation of row:inter-row samples as for (c) above except for the second ratoon mounded, nitram treatment for which 1:1 was used.F Includes both particulate and dissolved total N.G Determined using a micro-meteorological technique.H Estimated by 15N balance for 11-month period.I Obtained by difference. This term includes 10 kg N ha–1 lost by the crop during the 5.5 to 11 month period as determined by the 15N mass balance.nm = not measured.
Table 19 Nitrogen (N) balance (kg N ha–1) for sugarcane (1992–1995) (taken from Prove et al. 1997).
Source Plant crop 1992–93 1st Ratoon crop 1993–94 2nd Ratoon crop
1994–95
Flat profile,
cultivated
Mounded
profile, min
tillage
Flat profile,
surface urea
Mounded profile, split-
row urea
Flat profile, surface urea
Mounded profile, surface
nitram
Input (+)
Fertiliser
RainfallA
Recycled > 60 cmB
+170
+6
+8
+170
+6
+8
+160
+10
+3
+160
+10
+1
+160
+7
+1
+107
+7
+7
Sinks (±)
∆ Profile mineral NC
∆ Easily mineralised NC
∆ Harvest ResiduesD
–1 ± 3
+54 ± 12
–115 ± 18
–2 ± 2
+52 ± 6
–91 ± 9
+5 ± 2
+19 ± 7
+7 ± 5
+1 ± 4
+20 ± 7
+11 ± 8
–3 ± 1
+20 ± 9
+17 ± 5
+7 ± 3
–2 ± 8
–5 ± 17
Loss (–)
N leached > 60 cmE
Run-off
Bedload
–54 ± 25
< –1
0
–56 ± 7
–3
–1
–18 ± 8
–2
0
–30 ± 14
–6
0
–7 ± 3
–4
0
–46 ± 9
–6
0
Output (–)
Millable cane –79 ± 14 –96 ± 10 –63 ± 6 –73 ± 6 –53 ± 4 –75 ± 8
Estimated gaseous losses 0 0 –120 –39 –128 0
VoltatilisationG
DenitrificationH
nm
nm
nm
nm
–60
–7
–9
–24
nm
nm
nm
nm
Unaccounted lossI (–) or input (+) +11 +21 –54 –6 –128 +6
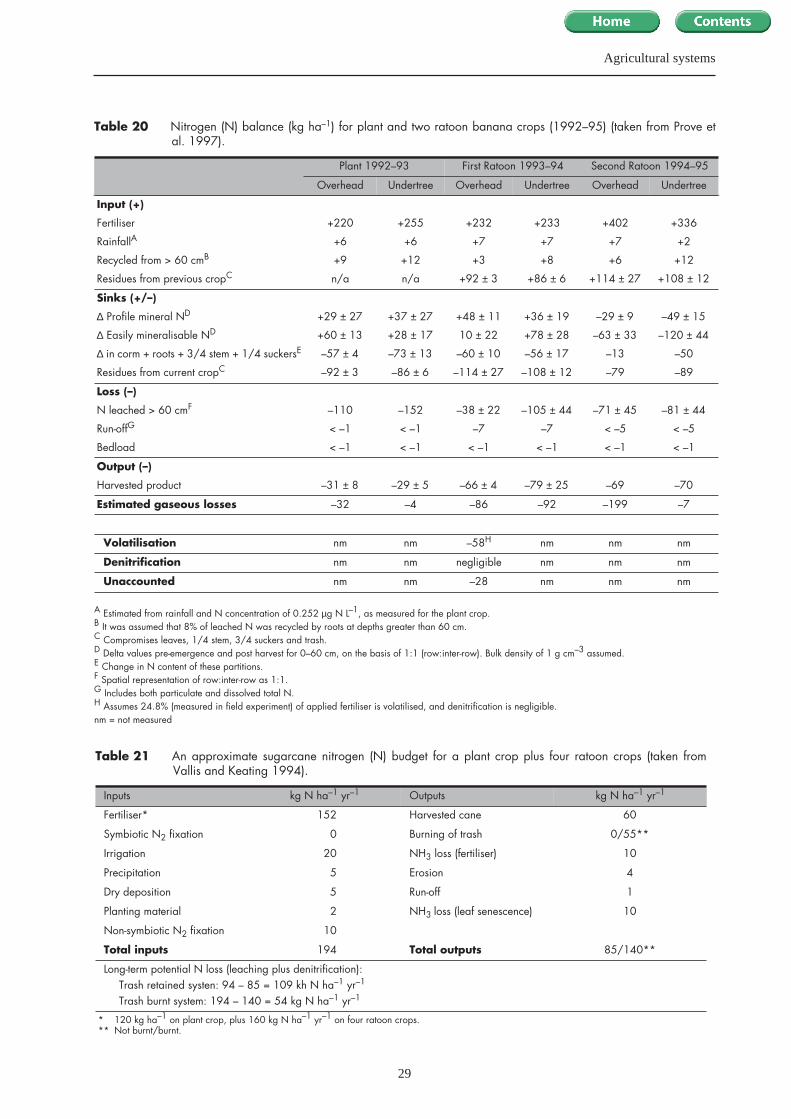
29
Agricultural systems
A Estimated from rainfall and N concentration of 0.252 µg N L–1, as measured for the plant crop. B It was assumed that 8% of leached N was recycled by roots at depths greater than 60 cm.C Compromises leaves, 1/4 stem, 3/4 suckers and trash.D Delta values pre-emergence and post harvest for 0–60 cm, on the basis of 1:1 (row:inter-row). Bulk density of 1 g cm–3 assumed.E Change in N content of these partitions.F Spatial representation of row:inter-row as 1:1.G Includes both particulate and dissolved total N.H Assumes 24.8% (measured in field experiment) of applied fertiliser is volatilised, and denitrification is negligible.nm = not measured
Table 20 Nitrogen (N) balance (kg ha–1) for plant and two ratoon banana crops (1992–95) (taken from Prove etal. 1997).
Plant 1992–93 First Ratoon 1993–94 Second Ratoon 1994–95
Overhead Undertree Overhead Undertree Overhead Undertree
Input (+)
Fertiliser
RainfallA
Recycled from > 60 cmB
Residues from previous cropC
+220
+6
+9
n/a
+255
+6
+12
n/a
+232
+7
+3
+92 ± 3
+233
+7
+8
+86 ± 6
+402
+7
+6
+114 ± 27
+336
+2
+12
+108 ± 12
Sinks (+/–)
∆ Profile mineral ND
∆ Easily mineralisable ND
∆ in corm + roots + 3/4 stem + 1/4 suckersE
Residues from current cropC
+29 ± 27
+60 ± 13
–57 ± 4
–92 ± 3
+37 ± 27
+28 ± 17
–73 ± 13
–86 ± 6
+48 ± 11
10 ± 22
–60 ± 10
–114 ± 27
+36 ± 19
+78 ± 28
–56 ± 17
–108 ± 12
–29 ± 9
–63 ± 33
–13
–79
–49 ± 15
–120 ± 44
–50
–89
Loss (–)
N leached > 60 cmF
Run-offG
Bedload
–110
< –1
< –1
–152
< –1
< –1
–38 ± 22
–7
< –1
–105 ± 44
–7
< –1
–71 ± 45
< –5
< –1
–81 ± 44
< –5
< –1
Output (–)
Harvested product –31 ± 8 –29 ± 5 –66 ± 4 –79 ± 25 –69 –70
Estimated gaseous losses –32 –4 –86 –92 –199 –7
Volatilisation nm nm –58H nm nm nm
Denitrification nm nm negligible nm nm nm
Unaccounted nm nm –28 nm nm nm
Table 21 An approximate sugarcane nitrogen (N) budget for a plant crop plus four ratoon crops (taken fromVallis and Keating 1994).
Inputs kg N ha–1 yr–1 Outputs kg N ha–1 yr–1
Fertiliser* 152 Harvested cane 60
Symbiotic N2 fixation 0 Burning of trash 0/55**
Irrigation 20 NH3 loss (fertiliser) 10
Precipitation 5 Erosion 4
Dry deposition 5 Run-off 1
Planting material 2 NH3 loss (leaf senescence) 10
Non-symbiotic N2 fixation 10
Total inputs 194 Total outputs 85/140**
Long-term potential N loss (leaching plus denitrification):Trash retained systen: 94 – 85 = 109 kh N ha–1 yr–1
Trash burnt system: 194 – 140 = 54 kg N ha–1 yr–1
* 120 kg ha–1 on plant crop, plus 160 kg N ha–1 yr–1 on four ratoon crops.** Not burnt/burnt.

30
Water and nitrogen balance in the wet tropics of North Queensland
The lack of data on the fate of water and nutrients isof particular concern given the high chemical andfertiliser inputs (especially N/phosphorus/potassium)which are used in both sugarcane and horticulture andthe very high rainfall that occurs in the wet tropics.The data that are available indicate that, in general,very little of the applied N is removed in theharvested product (< 55% for sugarcane and < 35%for bananas), and that drainage and leaching can bedominant loss pathways for water and nutrients, atleast for the landscapes and soils studied. For other
landscapes and soils, run-off and/or subsurface lateralflow could play a more dominant role. The mainmessage from the available data, however, is that N isusually applied in excess of plant requirements andthere is considerable room for improvement in Nmanagement. The need for improvement inquantifying plant needs and matching N supply tomeet these needs is especially apparent whenattempting to address sustainability of soil and waterresources rather than just trying to maximiseproduction.
31
The wet tropics of North Queensland is unique interms of its soils, vegetation and climate (with rainfallin excess of 1,500 mm annually), and its proximity tothe environmentally sensitive Great Barrier Reef.Natural systems in the wet tropics are dominated byrainforest in the uplands and a mosaic of differentvegetation types in the lowlands. Agricultural systemsare dominated by sugarcane and increasing areas ofhorticulture, and like other man-managed systemsaround Australia, their long term sustainability andimpact on the environment are being questioned.Most of the sustainability problems can be linked inone way or another to ‘leakage’ of water and/ornutrients from agricultural systems. There is thereforea need to improve understanding of the water andnutrient fluxes in both natural and agriculturalsystems, so that new and better design principles canbe employed to align agricultural systems moreclosely with the unique wet tropics environment.
Natural systems such as rainforests tend to becharacterised by diversity, whereas agriculturalsystems tend to be characterised by uniformity (seeFigure 4). The neat rows and uniform vegetationheight are classic agricultural features, but raisequestions about how efficient they are at exploitingthe available water and nutrients. There have beensuggestions that modern agricultural systems need agreater diversity, and agroforestry systems are onearea where we are seeing this. Invariably, when theseissues are raised, the need for trees to be incorporatedinto the system is highlighted. Reasons for this arethat trees tend to be deep rooted so that they cancapture water and nitrogen that is missed byagricultural crops. While there would no doubt beadvantages to incorporating high-value, fast-growing,deep-rooted trees into agricultural systems so thatthey can ‘mop up’ excess water and nitrogen, theabsolute need for this requires careful analysis. It maybe that design and management principles based onbetter understanding of water and nutrient processeswill open a range of options that may or may notinclude trees. Having more than one option availablefor agriculturists to consider will, in the long run,provide greater chances for successful adoption ofnew, more sustainable practices.
There are currently very few data on water andnitrogen fluxes in the wet tropics, and even fewer
data on complete water and nitrogen balances. Thosedata that are available tend to focus on one or twosite-specific components of the water and/or nitrogenbalance, and tend to be short-term. Only one studyhas attempted to address the complete water and Nbalance of sugarcane, bananas, and rainforest, andeven then not all components were measured. Thedata that are available clearly show that inagricultural systems N is applied in excess of plantneeds, suggesting that there is room for considerableimprovement in N management.
The biggest difference between natural andagricultural systems is the agriculturist’s ability tomanipulate fluxes of nutrients, and to a lesser extentwater, into and out of the system. Under rainfedconditions, control over water input is minimal, whileunder irrigated conditions the agriculturist has theability to significantly alter the water input. Ingeneral, fluxes of nutrients into and out of agriculturalsystems are higher than those in natural systemsbecause of fertiliser inputs and the regular removal ofbiomass during harvest. It has been suggested thatnutrient losses to erosion, run-off and leaching arealso higher in agricultural systems, usually because ofincreased availability of nutrients, occurrence of baresoil in the system, and decreases in organic matter(Lal 1986; Magdoff et al. 1997). There are, however,very few water and nutrient data available for wettropics systems that can be used to help verify orrefute this. It is clear though that addition of largeamounts of particular nutrients (eg. N, phosphorus,potassium) and removal of biomass from agriculturalsystems reduces the recycling of nutrients withinthose systems.
Water input in both natural and agricultural systemstends to be event driven, particularly in rainfedsituations. While it is felt that there is some continuityin the nutrient cycling in natural systems, nutrientinputs and outputs in agricultural systems are eventdriven, being dominated by fertiliser applications andcrop harvests which occur at specific times throughthe year. Therefore, one of the biggest challenges intrying to align agricultural systems with the naturalenvironment is for agriculturists to improve thematching of supply of water and nutrients to meet theactual needs of plant production systems.
Summary and conclusions

32
Water and nitrogen balance in the wet tropics of North Queensland
This will require:• a better understanding of plant needs as a function
of crop growth stage;• development of practices where the type (organic,
inorganic, slow-release sources etc.), timing ofapplication, and spatial placement (mostappropriate vertical and/or horizontal placement)of nutrients are better matched to meet actualplant needs; and
• most probably, new vegetation patterns involvingvariations in space and time and/or plantsequences that run in series or parallel, and whichmay or may not include trees.
While none of the issues raised above is trivial, thereis a need to improve understanding and quantificationof water and nutrient balances in the wet tropics if theideal of more sustainable agricultural systems thanthose currently employed is to be achieved. Futureresearch and development efforts will therefore needto include studies on:• the major water and nutrient flow pathways in the
various soils and landscapes;• nitrate leaching and the development and
amelioration of soil acidity, particularly at depth;
• water and nutrient storage and movement invariable charge soils;
• the potential for development and likelybehaviour of deep nutrient bulges;
• evapotranspiration;• water and nutrient uptake patterns by crops as a
function of time, depth and crop growth stage;and
• development of management strategies that matchnutrient supply to actual plant needs.
In addressing the above issues it will be important torecognise that:• the wet tropics consists of a diverse range of soils,
landscapes and vegetation types;• the soils and landscapes of the wet tropics have
evolved to cope with and shed large amounts ofwater, and that any new plant system designs willneed to accommodate this feature; and
• while any R&D work that is undertaken will needto be focused, it will also be essential to developpredictive capabilities so that the experimentalwork that is undertaken can be extrapolated inspace and time.
This work was supported by CSIRO Land and Water,CSIRO Tropical Agriculture and LWRRDC. We alsothank all participants in the ‘Redesign of AustralianPlant Production Systems in the Wet Tropics:
Identification of Research and Development Priorities’Workshop held in Brisbane on 16 March 1998 for theircritical input. Thanks in particular to Dr Warren Bondfor keeping notes during the workshop.
Acknowledgments
33
ANZECC 1992. Australian water quality guidelines forfresh and marine waters. Australian and New ZealandEnvironment and Conservation Council, Canberra.
Arora, Y. and A.S.R. Juo 1982. Leaching of fertiliser ionsin a koalinitic ultisol in the high rainfall tropics: leachingof nitrate in field plots under cropping and bare fallow.Soil Sci. Soc. Am. J. 46: 1212–1218.
Attiwill, P.M. and M.A. Adams 1993. Tansley Review No.50: Nutrient cycling in forests. New Phytologist 124:561–582.
Attiwill, P.M. and G.W. Leeper 1987. Forest Soils andNutrient Cycles, Melbourne: Melbourne UniversityPress.
Bonell, M. 1991. Progress and future research needs inwater catchment conservation within the wet tropicalcoast of NE Queensland. In: Tropical RainforestResearch in Australia: Present Status and FutureDirections for the Institute of Tropical RainforestStudies, Proceedings of a workshop held in Townsville,Australia, 4–6 May, 1990, edited by Goudberg, N.Bonell, M. and Benzaken, D. Townsville: Institute ofTropical Rainforest Studies, pp. 59–86.
Bonell, M. 1993. Progress in the understanding of runoffgeneration dynamics in forests. Journal of Hydrology150: 217–275.
Bonell, M. Cassells, D.S. and D.A. Gilmour 1982. Verticaland lateral soil water movement in a tropical rainforestcatchment. In: The First National Symposium on ForestHydrology 1982, edited by O’Loughlin, E.M. and Bren,L.J. The Institution of Engineers, Barton, Australia, pp.30–38.
Bonell, M. and D.A. Gilmour 1978. The development ofoverland flow in a tropical rainforest catchment. Journalof Hydrology 39: 365–382.
Bonell, M., Gilmour, D.A. and D.S. Cassells 1983. Apreliminary survey of the hydraulic properties ofrainforest soils in tropical north-east Queensland andtheir implications for the runoff process. In: RainfallSimulation, Runoff and Soil Erosion, edited by De Ploy,J. Catena Supplement 4: 57–78.
Boughton, W.C. 1994. Atmospheric processes and runoff.In: Land Degradation Processes in Australia, edited byMcTainsh, G. and Boughton, W.C. Longman CheshirePty Ltd, Melbourne, pp. 19–51.
Bowden, W.B, Mcdowell, W.H, Asbury, C.E. and A.M.Finley 1992. Riparian nitrogen dynamics in twogeomorphologically distinct tropical rain forestwatersheds: nitrous oxide fluxes. Biogeochemistry 18:77–99.
Bramley R.G.V. and A.K.L. Johnson 1996. Land useimpacts on nutrient loading in the Herbert River. In:Downstream Effects of Land Use, edited by Hunter
H.M., Eyles A.G., and Rayment G.E.. QueenslandDepartment of Natural Resources, Brisbane, pp. 61.
Brasell, H.M. and D.F. Sinclair 1983. Elements returned toforest floor in two rainforest and three plantation plots intropical Australia. Journal of Ecology 71: 367–378.
Brasell, H.M, Unwin, G.L. and G.C. Stocker 1980. Thequantity, temporal distribution and mineral-elementcontent of litterfall in two forest types at two sites intropical Australia. Journal of Ecology 68: 123–139.
Bristow, K.L, Thorburn, P.J. Sweeney, C.A. and H.P.W.Bohl 1998. Water and nitrogen balance in natural andagricultural systems in the wet tropics of northQueensland: survey of past and present research. Reportto LWRRDC.
Bruijnzeel, L.A. 1991. Nutrient input–output budgets oftropical forest ecosystems: a review. Journal of TropicalEcology 7: 1–24, 1991.
Bruijnzeel, L.A. 1998. Soil chemical changes after tropicalforest disturbance and conversion: the hydrologicalperspective. In: Soils of Tropical Forest Ecosystems:Characteristics, Ecology and Management, edited bySchulte, A. and Ruhiyat, D. Springer-Verlag, Berlin, pp45–61.
Bruijnzeel, L.A. and K.F. Wiersum 1987. Rainfallinterception by young Acacia auricultformis (A. Cunn)plantation forest in West Java (Indonesia): application ofGash’s analytical model. Hydrological Processes 1: 309–317.
Calder, I.R., Wright, I.R. and D. Murdiyarso 1986. A studyof evaporation from tropical rain forest—West Java.Journal of Hydrology, Netherlands 89: 13–31.
Cannon, M.G., Smith, C.D. and G.G. Murtha 1992. Soils ofthe Cardwell–Tully area, north Queensland. CSIRODivision of Soils Divisional Report 115. pp. 141.
Chapman L.S. and M.B.C. Haysom 1991. Nitrogenfertilisation for fields with sugar cane crop residues.Proc. Aust. Soc. Sugar Cane Technol. 13: 53–58.
Chapman L.S., Haysom, M.B.C. and P.G. Saffigna 1992. Ncycling in cane field from 15N labelled trash and residualfertilisers. Proc. Aust. Soc. Sugar Cane Technol. 14: 84–89.
Chapman L.S., Haysom M.B.C., Saffigna P.G. and J.R.Freeney 1991. The effect of placement and irrigation onthe efficiency of use of 15N labelled urea by sugar cane.Proc. Aust. Soc. Sugar Cane Technol. 13: 44–52.
Cogle A.L., Best E., Sadler G., Gourley J., Herbert B. andN. Wright 1996. Water quality and land use impacts onLake Tinaroo/Barron River. I. Background and currentstatus. In: Downstream Effects of Land Use, edited byHunter H.M., Eyles A.G., and Rayment, G.E.Queensland Department of Natural Resources,Brisbane,pp. 77–80.
References
34
Water and nitrogen balance in the wet tropics of North Queensland
Congdon R. and D. Lamb 1990. Essential nutrient cycles.In: Australian Tropical Rainforests, edited by Webb, L.J.and Kikkawa, J. CSIRO, Melbourne, pp. 105–113.
Cote, C.M., Bristow, K.L. and P.J. Ross 1999. Quantifyingthe influence of intra-aggregate concentration gradientson solute transport. Soil Sci. Soc. Am. J. (in press).
Critchfield, H.J. 1966. General Climatology, Prentice-Hall,New Jersey.
Daniells, J.W. 1995. Results of a survey of research/development priorities and crop management practices inthe north Queensland banana industry. QueenslandDepartment of Primary Industries, Brisbane.
Dart, P.J. 1986. Nitrogen fixation associated with non-legumes in agriculture. Plant and Soil 90: 303–334.
Denmead O.T., Freney J.R., Jackson A.V., Smith J.W.B.,Saffigna P.G., Wood A.W. and L.S. Chapman 1990.Volatilisation of ammonia from urea and ammoniumsulfate applied to sugarcane trash in north Queensland.Proc. Aust. Soc. Sugar Cane Technol. 12: 72–78.
Denmead, O.T., Mayocchi, C.L. and F.X. Dunin 1997.Does green cane harvesting conserve soil water? Proc.Aust. Soc. Sugar Cane Technol. 19: 139–146.
Deuter, P. 1994. Fertility management in vegetable crops.In: Nutrition in Horticulture: Proceedings of a ReviewWorkshop, Gatton, 4–6 May 1993, edited by HunterM.N., Eldershaw, V.J. and Agricultural ProductionGroup. Queensland Government, Brisbane.
Downes, R.G. 1959. The ecology and prevention of soilerosion. In: Biogeography and Ecology in Australia, 111.Junk, Den Haag, Netherlands, pp. 472–486.
Dubreuil, P.L. 1985. Review of field observations of runoffgeneration in the tropics. Journal of Hydrology 80: 237–264.
Elsenbeer H. and D.K. Cassel 1990. Surficial processes inthe rain-forest of western Amazonia. InternationalAssociation of Hydrological Sciences 192: 289–297.
Elsenbeer, H., West, A. and M. Bonell 1994. Hydrologicpathways and stormflow hydrochemistry at South Creek,north-east Queensland. Journal of Hydrology 162: 1–21.
Emtsev, V.T. and S.I. Shelly 1987. Nitrogen-fixing activityof tropical soils of Bangladesh. In: InternationalSymposium: Advances in Nitrogen Cycling inAgricultural Ecosystems Poster Abstracts, edited byAdams G.T. CSIRO Division of Tropical Crops andPastures, Brisbane, Queensland, pp. 27–28.
Finlayson, B. and M. Silburn 1996. Soil, nutrient andpesticide movements from different land use practices,and subsequent transport by rivers and streams. In:Downstream Effects of Land Use, edited by Hunter H.M.,Eyles A.G., and Rayment G.E. Queensland Departmentof Natural Resources, Brisbane, p. 9.
Frank, D.A. and R.S. Inouye 1994. Temporal variation inactual evapotranspiration of terrestrial ecosystems:patterns and ecological implications. Journal ofBiogeography 21: 401–411.
Freney, J.R., Denmead, O.T., Wood, A.W. and P.G. Saffigna1994. Ammonia loss following urea addition to tosugarcane trash blankets. Proc. Aust. Soc. Sugar CaneTechnol. 16: 114–121.
Freney, J.R., Denmead, O.T., Wood, A.W., Saffigna, P.G.,Chapman, L.S., Ham, G.J. Hurney, A.P. and R.L. Stewart1992. Factors controlling ammonia loss from trashcovered sugarcane fields fertilised with urea. Fert. Res.31: 341–349.
Fritsch, J. M. 1990. Les effects du defrichement de la foretAmazonienne et de la mise en culture sur l’hydrologie depetis basins versants, Operation ECEREX en GuyaneFracaise. Thesis/Dissertation, Universitie de Montpellier,France.
Gigou, J., Ganry, F. and J. Pichot 1985. Nitrogen balance insome tropical agrosystems. In: Nitrogen Management inFarming Systems in Humid and Subhumid Tropics,edited by Kant, B.T. and van der Heide, J. Institute forSoil Fertility and International Institute of TropicalAgriculture, Haren, pp. 247–268.
Gillman, G.P. and D.J. Abel 1987. A summary of surfacecharge characteristics of the major soils of the Tully–Innisfail area, north Queensland. CSIRO Division ofSoils Divisional Report No. 85, Adelaide, Australia.
Gillman, G.P. and D.F. Sinclair 1987. The grouping of soilswith similar charge properties as a basis foragrotechnology transfer. Aust. J. Soil Res. 25: 275–285.
Gillman, G.P. and E.A. Sumpter 1986. Surface chargecharacteristics and lime requirements of soils derivedfrom basaltic, granitic, and metamorphic rocks in highrainfall tropical Queensland. Aust. J. Soil Res. 24: 173–192.
Gilmour, D.A. 1975. Catchment water balance studies onthe wet tropical coast of North Queensland. Thesis/Dissertation, Department of Geography, James CookUniversity of North Queensland, Townsville.
Gliessman S.R., Lambert J.D.H., Arnason J.T. and P.A.Sanchez 1982. Report of work group shifting cultivationand traditional agriculture. Plant and Soil 67: 389–394.
Goosem, S. and D. Lamb 1986. Measurements ofphyllosphere nitrogen fixation in a tropical and two sub-tropical rain forests. Journal of Tropical Ecology 2: 373–376.
Grimme, H. and A.S.R. Juo 1985. Inorganic nitrogen lossesthrough leaching and denitrification in soils of the humidtropics. In: Nitrogen Management in Farming Systems inHumid and Subhumid Tropics, edited by Kang, B.T. andvan der Heide, J. Institute for Soil Fertility andInternational Institute of Tropical Agriculture, Haren, pp.57–71.
Hauck R.D. 1981. Nitrogen fertiliser effects on nitrogencycle processes. In: Terrestrial Nitrogen Cycles:Processes, Ecosystem Strategies and ManagementImpacts, edited by Clard F.E. and Rosswall T. EcologicalBulletins, Stockholm, pp. 551–564.
Herrera, R. F. and C.F. Jordan 1981. Nitrogen cycle in atropical rain forest of Amazonia: the case of low nutrientstatus in the Amazon caatinga. In: Terrestrial NitrogenCycles: Processes, Ecosystem Strategies andManagement Impacts, edited by Clard F.E. and RosswallT. Ecological Bulletins, Stockholm, pp. 493–505.
Herwitz, S.R. 1985. Interception storage and capacities oftropical rainforest canopy trees. Journal of Hydrology77: 237–252.
35
References
Herwitz, S.R. 1986. Infiltration-excess caused by stemflowin a cyclone-prone tropical rainforest. Earth SurfaceProcesses and Landforms 11: 401–412.
Hubble, G.D. and R.F. Isbell 1983. Eastern Highlands (VI).In: Soils: An Australian Viewpoint, edited by Division ofSoils, CSIRO/Academic Press, pp. 219–230.
Hunter H.M. 1994. Impacts of fertiliser management inhorticulture on aquatic environments. In: Nutrition inHorticulture: Proceedings of a review workshop. Gatton4–6 May 1993, edited by Hunter M.N., Eldershaw V.J.,and Agricultural Production Group. QueenslandGovernment, Brisbane, pp. 71–79.
Hutley, L.B. 1995. The water balance of Sloanea woollsii(F. Muell.), an Australian subtropical rainforest tree.Thesis/Dissertation, University of Queensland, Brisbane,pp. 207.
Hutley, L.B., Doley, D., Yates, D.J. and A. Boonsaner 1997.Water balance of an Australian subtropical rainforest ataltitude—the ecological and physiological significanceof intercepted cloud and fog. Australian Journal ofBotany 45: 311–329.
Isbell, R.F. and D.G. Edwards 1988. Soils and theirmanagement in the Australian wet tropics. In:Proceedings of the National Soils Conference, edited byLoveday, J. Australian National University, Canberra,May 1988, pp. 152–180.
Jackson, I.J. 1975. Relationships between rainfallparameters and interception by tropical forest. Journal ofHydrology 24: 215–238.
Jetten, V.G. 1996. Interception of tropical rain forest:performance of a canopy water balance model.Hydrological Processes 10: 671–685.
Jordan, C.F. 1985. Nutrient Cycling in Tropical ForestEcosystems. John Wiley & Sons, Chichester, pp. 190.
Jordan, C.F., Caskey, W., Escalante, G., Herrera, R.,Montagnini, F., Todd, R. and C. Uhl 1982. The nitrogencycle in a ‘Terra Firme’ rainforest on oxisol in theAmazon territory of Venezuela. Plant and Soil 67: 325–332.
Kawahara, T. and T. Tsutsumi 1972. Studies on thecirculation of carbon and nitrogen in forest ecosystems.Bulletin of the Kyoto University Forests 44: 141–158.
Keating, B.A., Vallis, I., Hughes, M. and D.R. Ridge 1993.Strategic directions for nitrogen research—a view fromthe south. Proc. Aust. Soc. Sugar Cane Technol. 15: 276–284.
Kellman, M.C. 1969. Some environmental components ofshifting cultivation in upland Mindanao. J. Trop. Geog.28: 40–56.
Kingston, G. and G.J. Ham 1975. Water requirements andirrigation scheduling of sugar cane in Queensland. 42nd
Conference, 57–67.
Lal, R. 1980. Losses of plant nutrients in runoff and erodedsoil. In: Nitrogen Cycling in West African Ecosystems,edited by Rosswall T. SCOPE/UNEP InternationalNitrogen Unit, Royal Swedish Academy of Sciences,Uppsala, pp. 31–38.
Lal, R. 1986. Conversion of tropical rainforest: agronomicpotential and ecological consequences. Advances inAgronomy 39: 173–264.
Lal, R. and D.J. Cummings 1979. Clearing a tropical forestI. Effects on soil and micro-climate. Field CropsResearch 2: 91–107.
Lamb, D. 1980. Soil nitrogen mineralisation in a secondaryrainforest succession. Oecologia 47: 257–263.
Leopoldo, P.R., Franken, W.K. and N.N. Villa 1995. Realevapotranspiration and transpiration through a tropicalrain forest in central Amazonia as estimated by the waterbalance method. Forest Ecology and Management 73:185–195.
Lloyd, C.R., Gash, J.H.C., Shuttleworth, W.J. and F.A.D.Marques 1988. The measurement and modelling ofrainfall interception by Amazonian rainforest.Agric.Forest Meteorology 43: 277–294.
Longman, K.A. and J. Jenik 1974. Tropical Forest and itsEnvironment. Longman Group Limited, London, pp. 196.
Macleod, W.N.B. 1994. Papaw—current nutritionmanagement. In: Nutrition in Horticulture: Proceedingsof a review workshop, Gatton 4–6 May 1993, edited byHunter M.N., Eldershaw V.J., and AgriculturalProduction Group. Queensland Government, Brisbane,pp. 28–33.
McShane, T.J., Reghenzani, J.R., Prove, B.G and P.W.Moody. 1993. Nutrient balances and transport fromsugarcane land—a preliminary report. Proc. Aust. Soc.Sugar Cane Technol. 15: 268–275.
McTainsh, G. and Leys, J. 1994. Soil Erosion by Wind. In:Land Degradation Processes in Australia, edited byMcTainsh, G.H. and Boughton, W.C. Longman Cheshire,Melbourne, pp. 188–233. z
Magdoff, F., Lanyon, L. and B. Liebhardt 1997. Nutrientcycling, transformations, and flows: implications for amore sustainable agriculture. Advances in Agronomy 60:1–73.
Malmer, A. 1993. Dynamics of hydrology and nutrientlosses as response to establishment of forest plantation: acase study on tropical rainforest land in Sabah, Malaysia.Thesis/Dissertation, Department of Forest Ecology,Swedish University of Agricultural Sciences, Umea.
Mitchell A.W., Reghenzani J.R., Hunter H.M. and R.G.V.Bramley 1996. Water quality and nutrient fluxes fromriver systems draining to the Great Barrier Reef MarinePark. In: Downstream Effects of Land Use, edited byHunter H.M., Eyles A.G. and Rayment G.E. QueenslandDepartment of Natural Resources, Brisbane, pp. 23–33.
Moody, P.W., Reghenzani, J.R., Armour, J.D., Prove, B.G.and T.J. McShane 1996. Nutrient balances and transportat farm-scale—Johnstone Rive catchment. In:Downstream Effects of Land Use, edited by Hunter H.M.,Eyles A.G. and Rayment G.E. Queensland Department ofNatural Resources, Brisbane, pp. 347–351.
Murtha, G.G. 1986. Soils of the Tully–Innisfail region.CSIRO Division of Soils Divisional Report No. 82,Adelaide, Australia.
36
Water and nitrogen balance in the wet tropics of North Queensland
Murtha, G.G. and C.D. Smith 1994. Key to the Soils andLand Suitability of the Wet Tropical Coast: Cardwell–Cape Tribulation. CSIRO Australia. pp.38
Neill, C., Piccolo, M.C., Steudler, P.A., Melillo, J.M.,Feigl, B.J. and C.C. Cerri 1995. Nitrogen dynamics insoils of forests and active pastures in the westernBrazilian Amazon Basin. Soil Biology and Biochemistry27: 1167–1175.
O’Brien, K.L. 1996. Tropical deforestation and climatechange. Prog. Phys. Geog. 20: 311–335.
Pinker, R.T., Thompson, O.E. and T.F. Eck 1980. Thealbedo of a tropical evergreen forest. Quart. J. Roy. Met.Soc. 106: 551–555.
Pook, E.W., Moore, P.H.R. and T. Hall 1991. Rainfallinterception by trees of Pinus radiata and Euclayptusviminalis in a 1,300 mm rainfall area of southeasternNew South Wales: I. Influence of wind-borneprecipitation. Hydrological Processes 5: 143–155.
Price, N.W. 1982. A comparison of water balancecomponents in natural and plantation forests in ElSalvador, Central America. Turrialba 32: 399–416.
Probert, M.E. 1976. The composition of rainwater at twosites near Townsville, Queensland. Australian Journal ofSoil Research 14: 397–402.
Prove, B.G. 1991. A study of the hydrological anderosional processes under sugarcane culture on the wettropical coast of north eastern Australia. PhD thesis,James Cook University, Townsville, Australia.
Prove, B.G., McShane, T.J., Reghenzani, J.R., Armour,J.D., Sen, S. and P.W. Moody 1994. Nutrient loss viadrainage from the major agricultural industries on thewet tropical coast of Queensland. In: Water DownUnder, Conference, Adelaide, November 1994.. Vol. 2Institution of Engineers Australia, vol. 2, pp 439–443.
Prove, B.G., McShane, T.J., Reghenzani, J.R., Armour,J.D., Sen, S. and P.W. Moody 1996a. Managementoptions to reduce loss of applied nitrogen fertilisers inthe major rural industries in the Johnstone RiverCatchment. In:Measurement and Management ofNitrogen Losses for Groundwater Protection inAgricultural Production Systems (WorkshopProceedings), edited by Bond, W.J. Occasional Paper08/96 LWRRDC, pp 72–77.
Prove, B.G., Moody, P.W. and J.R. Reghanzani 1997.Nutrient balances and transport from agricultural andrainforest lands: a case study of the Johnstone Rivercatchment, DAQ3S Final Report, QueenslandDepartment of Natural Resources and BSES, pp. 31.
Prove, B., Richards, N., Lindsay, S., Ross, P. and T.McShane 1996b. Implications of current irrigation andfertiliser management practices and the quest forsustainability. In: Challenges for Horticulture in theTropics, 3rd Aust. Soc. Hort. Sci. and 1st Aust.Macadamia Research Conference, August 1996, GoldCoast, Australia.
QDPI (Queensland Department of Primary Industries)1995a. Overview of Water Resources and Related Issues: the Northern Wet Tropics. Queensland Government, pp.131+.
QDPI 1995b. Overview of Water Resources and RelatedIssues : the Southern Wet Tropics. QueenslandGovernment, pp. 117+.
Riley, R.H. and P.M. Vitousek 1995. Nutrient dynamicsand nitrogen trace gas flux during ecosystemdevelopment in montane rain forest. Ecology 76: 292–304.
Shuttleworth, W.J. 1984. Observations of radiationexchange above and below Amazonian forest. Quart. J.Roy. Met. Soc. 110: 1163–1169.
Singh, A.K. and K.N. Misra 1980. Climatic water balanceof a tropical deciduous forest of India. Journal of theJapanese Forestry Society 62: 195–199.
Smith S.J., Schepers J.S. and L.K. Porter 1990. NitrogenLosses to the environment. Advances in Soil Science, 14:1–43.
Stewart, G.R., Schmidt, S., Handley, L. L., Turnbull, M.H., Erskine, P. D. and C.A. Joly 1995. 15N naturalabundance of vascular rainforest epiphytes: implicationsfor nitrogen source and acquisition. Plant, Cell andEnvironment 18: 85–90.
Sylvester-Bradley, R., Oliveira, L. A., de Podesta Filho, J.A. and T.V. St John 1980. Nodulation of legumes,nitrogenase activity of roots and occurence of nitrogenfixing Azospirillum spp. in representative soils ofCentral Amazonia. Agro Ecosystems 6: 249–266.
Thompson, C.H. and G.G. Beckman 1981. Soils ofAustralian forests: distribution, morphology and genesis.In: Australian Forest Nutrition Workshop Productivity inPerpetuity, edited by CSIRO. CSIRO, Melbourne, pp.29–41.
Tracey, G.J. 1982. The Vegetation of the Humid TropicalRegion of North Queensland. CSIRO, Melbourne. pp.124.
Turner, N.C. 1990. Plant water relations and irrigationmanagement. Agricultural Water Management. 17: 1–3,59–73.
Turton, S.M. and S.K. O’Sullivan 1995. Seasonalvariations in radiation exchange above and within anupland tropical rainforest canopy in northeastQueensland. In: Monash Publications in Geography 14,edited by Dixon G. and Aitken, D.Monash University,Melbourne, pp. 334–342.
Vallis, I. and B.A. Keating 1994. Uptake and loss offertiliser and soil nitrogen in sugarcane crops. Proc.Aust. Soc. Sugar Cane Technol. 16: 105–113.
Vitousek, P.M. 1980. Report of the work group on tropicalforests. In: Nitrogen Cycling in West AfricanEcosystems, edited by Rosswall, T. SCOPE/UNEPInternational Nitrogen Unit, Sweden, pp. 409–414.
Vitousek, P.M. 1984. Litterfall, nutrient cycling, andnutrient limitation in tropical forests. Ecology 65: 285–298.
Vitousek, P.M. and P.A. Matson 1988. Nitrogentransformations in a range of tropical forest soils. SoilBiology and Biochemistry 20: 361–367.
Vitousek, P. M. and R.L. Sanford Jr. 1986. Nutrient cyclingin moist tropical forest. Annual Review of Ecology andSystematics 17: 137–167.

37
References
Walton, R. S. and H.M. Hunter 1997. Water qualitymodelling with HSPF in a tropical catchment. In:Proceedings of the 24th Hydrology and Water ResourcesSymposium, Auckland, New Zealand, November 1997.The Institution of Engineers Australia, Canberra, pp.469–474.
Waterloo, M.J. 1994. Water and nutrient dynamics ofPinus caribaea plantation forests on former grasslandsoils in Southwest Viti Levu, Fiji. Thesis/Dissertation,Faculty of Earth Sciences, Free University, Amsterdam.
Webb, L.J. and J.G. Tracey 1994. The rainforests ofnorthern Australia. In: Australian Vegetation, edited byGroves, R.H. Cambridge University Press, Cambridge,pp. 87–129.
Weier, K.L. 1994. Nitrogen use and losses in agriculture insubtropical Australia. Fertiliser Research 39: 245–257.
Weier, K.L., Rolston, D.E. and P.J. Thorburn 1998. Thepotential for N losses via denitirfication beneath a greencane trash blanket. Proc. Aust. Soc. Sugar Cane Technol.20: 118–125.
World Meteorological Organization 1983. Operationalhydrology in the humid tropical regions. In: Hydrologyof Humid Tropical Regions, edited by Keller, R.International Association of Hydrological Sciences, pp.3–28.
Wood A.W. and P.G. Saffigna 1987. Nitrogen studies withsugar cane under different methods of trash managementin North Queensland. In: International Symposium:Advances in Nitrogen Cycling in AgriculturalEcosystems Poster Abstracts, edited by Adams G.T.CSIRO Division of Tropical Crops and Pastures,Brisbane, Queensland.
Yates, D.J. and L.B. Hutley 1995. Foliar uptake of water bywet leaves of Sloanea woolsii, an Australian subtropicalrainforest tree. Australian Journal of Botany 43: 157–167.

38

39
The purpose of this study is to review existinginformation and data sets concerning water andnitrogen (N) use by natural plant communities andagricultural plant production systems in northernAustralia (primarily the wet tropics). The purpose ofthe review is to provide a sound starting base forR&D projects within the CSIRO/LWRRDC Redesignof Australian Plant Production Systems R&DProgram.
The major components of the review will be asfollows:
1. Review and summarise from published literature,work that quantifies the availability, uptake andloss of water and N (especially via deep drainage)from within natural vegetation ecosystems andfrom the agricultural plant production systems(primarily sugar and horticulture) that havelargely replaced them in the wet tropics ofAustralia
2. Identify, as far as possible, similar work availablein the ‘grey’ literature or as unpublished technicalreports etc.
3. Summarise the information available in thosereports, including a brief description of thelocation and natural or agricultural vegetationtype, the representativeness of the climaticconditions during data collection, trends in wateruse efficiency, together with a collation andsummary of the quantitative data collected.
4. Provide wherever possible, contact details on thelocation of those data sets for use by others
5. Draw out any general conclusions arising from thereviewed results
6. Arrange and hold a workshop at a suitablelocation to review the results of the project so far,including discussion of the sites and plantsystems, the measurement techniques, and thedata obtained
7. Prepare a written summary of the project, toinclude the review of past work and data sets,general conclusions drawn, and results of theworkshop.
Appendix 1
Terms of reference

40
The search strategy and databases searched for thisreview are summarised below. We recovered 4,134references, which are available in electronic form onrequest. It goes without saying that only a smallpercentage of these were directly relevant to the aimsof this review.
The search strategy used was based on the following:
Search 1: ((water and B) or C) and A
Search 2: (nitrogen or nitrate) and B and A
Search 3: (salinity or acidification or sustain* or D)and A
whereA (tropic* or Queensland or rainforest or
sugarcane or sugarcane or banana ormango or Atherton or tea)
B (balance or cycle* or flux* or leaching ordrainage)
C (evapotranspiration or transpiration or run-off orsurface flow or infiltration or seepage)
D (groundwater or ground water or recharge orbaseflow or stream water or discharge)
DATABASES:The following information concerning the databasesthat were searched was reproduced from theUniversity of Queensland’s database information pagelocated at the Internet address:
http://www.library.uq.edu.au/database/catalog.html
CAB ABSTRACTS (1969+)
The database contains more than 3 million recordsfrom over 10,000 journals, books, conferences,reports, and other kinds of literature publishedinternationally. Subjects covered: Agriculture,Agronomy, Animal Science, Biology, Botany, CropManagement, Dairy Science, Environment,Fertilisers, Food & Agriculture, Forestry,Horticulture, Natural Resources, Pesticides, Plant,Genetics, Soils, Veterinary Science, Water.
CURRENT CONTENTS (1994–PRESENT)
Current Contents Search provides access to tablesof contents and bibliographic data from currentissues of the world’s leading scholarly researchjournals in the sciences, social sciences, and artsand humanities. Cover-to-cover indexing ofarticles, reviews, meeting abstracts, and editorials,is provided for over 7,000 journals. Subjectscovered: Agriculture, Art, Biology, Chemistry,Computer, Earth Sciences, Engineering,Environment, Humanities, Life Sciences,Medicine, Science and Technology, SocialSciences.
STREAMLINE (1982+)
Subjects covered include: soil degradation,sustainable primary production systems,conservation, land use, vegetation rehabilitation,ecological processes, river health, management ofnutrients and eutrophication, wetlands, aquaticecosystems, urban water utilities, wastewatermanagement and irrigation systems. Journalarticles, published and unpublished reports,research in progress, books, book chapters andconference papers are all included. Material istaken from both Australian and internationalsources, but all relates to the Australian situation.Contains over 30,000 records, from 1982 onwards.
Appendix 2
Details of library searches

41
A workshop entitled
‘REDESIGN OF AUSTRALIAN PLANTPRODUCTION SYSTEMS IN THE WETTROPICS: IDENTIFICATION OF RESEARCHAND DEVELOPMENT PRIORITIES’
was held in Brisbane on 16 March 1998 as part of thewet tropics review. The aim of the workshop was topresent results of the review to a broader audiencefrom a range of organisations, and to discuss thescope of future R&D priorities for RAPPS work to becarried out in the wet tropics. The workshopparticipants are listed in Table A1.
The workshop was divided into several sessions:1. Introduction (Bristow)2. Background to the RAPPS effort (Williams/Price)3. The wet tropics review (Bristow/Thorburn)4. Scoping research and development priorities
(workshop groups)5. Conclusion (Williams/Price)
Discussion and debate was encouraged during andafter each session. Key points addressed during thediscussions are summarised in Table A2. Workshopparticipants were divided into three smaller groupsduring session four to address three key questions,namely• What do we know?• What do we need to know to meet RAPPS design
criteria?• What R&D strategy do we need to adopt?
A summary of the issues raised by each group isgiven in Table A3. The slides used by Drs K.L.Bristow and P.J. Thorburn to facilitate presentation ofthe wet tropics review and guide the workshopprogress are given in an annex to this appendix.
Summary of the main pointshighlighted during workshopdiscussionsThe wet tropics of North Queensland is characterisedby diversity in soils, landscapes and vegetation.
There are deep, well-drained soils in some uplandregions and poorly drained soils with shallow
fluctuating watertables in some lowland areas. Thesedifferences need to be acknowledged and addressed,with particular emphasis given to the differences inmovement of water and nutrients in these twocontrasting systems. The role of interflow (lateralflow) in the low lying, poorly drained soils as a flowpathway, especially for nutrients, needs attention.
The unique features of variable charge soils washighlighted together with the need to improveunderstanding of water and nutrient movement inthese soils, especially as it relates to the developmentand fate of deep nutrient bulges.
While rainforests are important and occupy fairlylarge areas in the upland regions, the point was madethat in the coastal lowlands there is a mosaic ofdifferent native vegetation types that are dominatedby the local water regime. The point was also madethat the current vegetation in these areas probablyreflects the impact of drainage and changed waterregimes more so than the impact of clearing.Improved understanding of natural vegetationfunction was suggested as one way of teaching designprinciples needed in the RAPPS effort.
The role of roots in water and nutrient dynamics wasraised and the need to differentiate betweendistribution and function highlighted. The presence ofmycorrhiza as a means of enhancing nutrient uptakeby native vegetation and the general inefficiency ofuse of nutrients by crops was also highlighted.
It was felt that run-off was often overlooked as amajor flow pathway in the wet tropics, and that a fewmassive events associated with cyclonic activitycould cause large losses of surface litter from naturalsystems. With this in mind it was suggested thatnutrient cycling within native systems might notalways be as tight or as efficient as thought, or asreported in the literature.
The scarcity of water and nutrient balance data fromthe wet tropics was highlighted with particularmention made of the fact that there were no ETmeasurements of any reasonably useful time duration.
In addressing what knowledge gaps existed and whatwas needed to address the RAPPS R&D priorities thefollowing points were highlighted:
Appendix 3
Workshop report
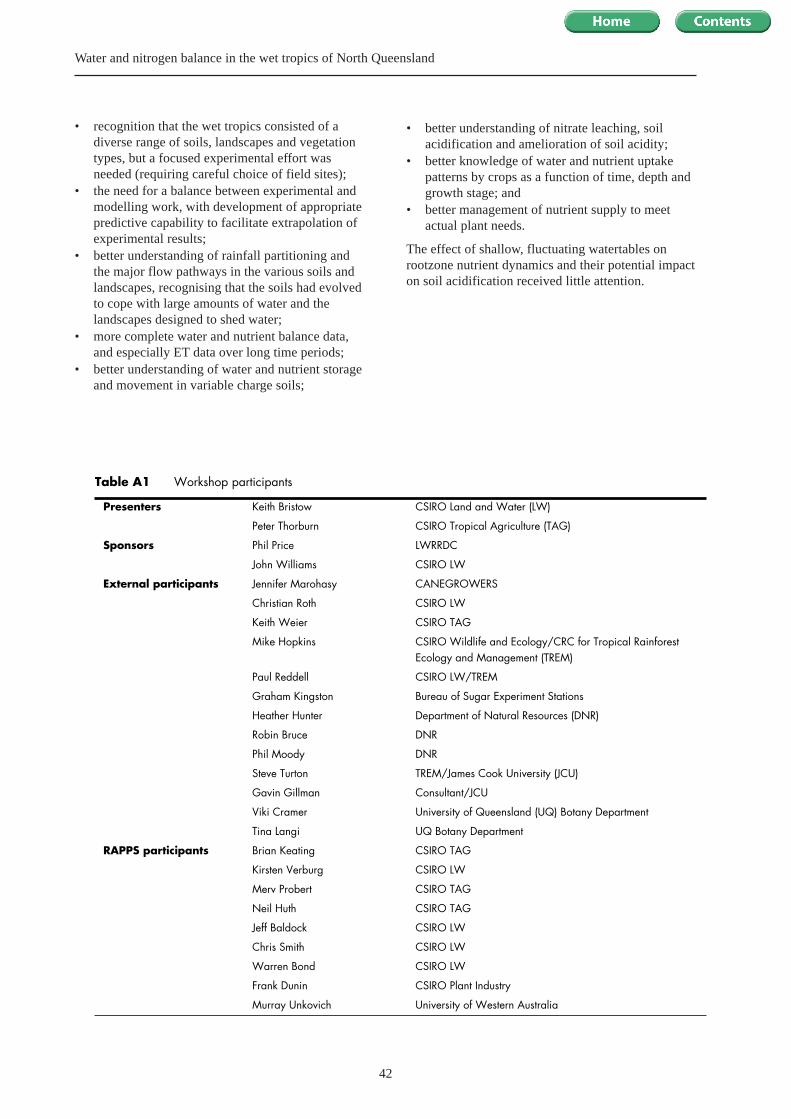
42
Water and nitrogen balance in the wet tropics of North Queensland
• recognition that the wet tropics consisted of adiverse range of soils, landscapes and vegetationtypes, but a focused experimental effort wasneeded (requiring careful choice of field sites);
• the need for a balance between experimental andmodelling work, with development of appropriatepredictive capability to facilitate extrapolation ofexperimental results;
• better understanding of rainfall partitioning andthe major flow pathways in the various soils andlandscapes, recognising that the soils had evolvedto cope with large amounts of water and thelandscapes designed to shed water;
• more complete water and nutrient balance data,and especially ET data over long time periods;
• better understanding of water and nutrient storageand movement in variable charge soils;
• better understanding of nitrate leaching, soilacidification and amelioration of soil acidity;
• better knowledge of water and nutrient uptakepatterns by crops as a function of time, depth andgrowth stage; and
• better management of nutrient supply to meetactual plant needs.
The effect of shallow, fluctuating watertables onrootzone nutrient dynamics and their potential impacton soil acidification received little attention.
Table A1 Workshop participants
Presenters Keith Bristow CSIRO Land and Water (LW)
Peter Thorburn CSIRO Tropical Agriculture (TAG)
Sponsors Phil Price LWRRDC
John Williams CSIRO LW
External participants Jennifer Marohasy CANEGROWERS
Christian Roth CSIRO LW
Keith Weier CSIRO TAG
Mike Hopkins CSIRO Wildlife and Ecology/CRC for Tropical Rainforest Ecology and Management (TREM)
Paul Reddell CSIRO LW/TREM
Graham Kingston Bureau of Sugar Experiment Stations
Heather Hunter Department of Natural Resources (DNR)
Robin Bruce DNR
Phil Moody DNR
Steve Turton TREM/James Cook University (JCU)
Gavin Gillman Consultant/JCU
Viki Cramer University of Queensland (UQ) Botany Department
Tina Langi UQ Botany Department
RAPPS participants Brian Keating CSIRO TAG
Kirsten Verburg CSIRO LW
Merv Probert CSIRO TAG
Neil Huth CSIRO TAG
Jeff Baldock CSIRO LW
Chris Smith CSIRO LW
Warren Bond CSIRO LW
Frank Dunin CSIRO Plant Industry
Murray Unkovich University of Western Australia
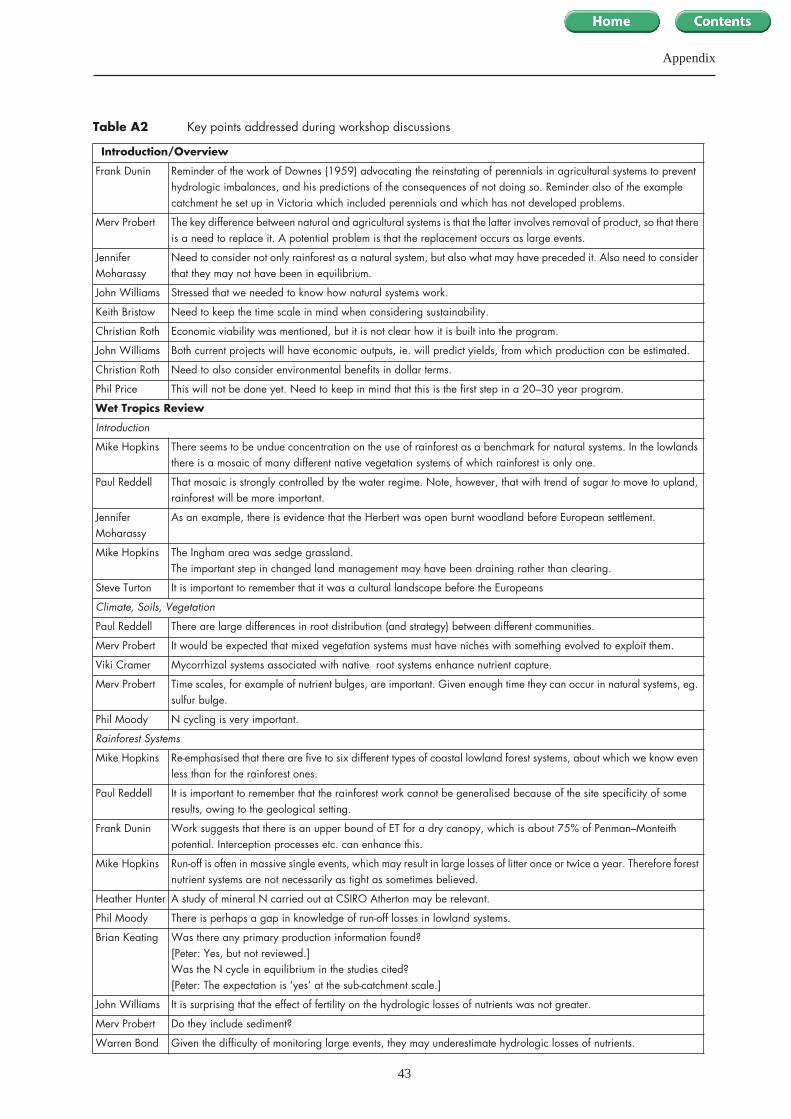
43
Appendix
Table A2 Key points addressed during workshop discussions
Introduction/Overview
Frank Dunin Reminder of the work of Downes (1959) advocating the reinstating of perennials in agricultural systems to prevent hydrologic imbalances, and his predictions of the consequences of not doing so. Reminder also of the example catchment he set up in Victoria which included perennials and which has not developed problems.
Merv Probert The key difference between natural and agricultural systems is that the latter involves removal of product, so that there is a need to replace it. A potential problem is that the replacement occurs as large events.
Jennifer Moharassy
Need to consider not only rainforest as a natural system, but also what may have preceded it. Also need to consider that they may not have been in equilibrium.
John Williams Stressed that we needed to know how natural systems work.
Keith Bristow Need to keep the time scale in mind when considering sustainability.
Christian Roth Economic viability was mentioned, but it is not clear how it is built into the program.
John Williams Both current projects will have economic outputs, ie. will predict yields, from which production can be estimated.
Christian Roth Need to also consider environmental benefits in dollar terms.
Phil Price This will not be done yet. Need to keep in mind that this is the first step in a 20–30 year program.
Wet Tropics Review
Introduction
Mike Hopkins There seems to be undue concentration on the use of rainforest as a benchmark for natural systems. In the lowlands there is a mosaic of many different native vegetation systems of which rainforest is only one.
Paul Reddell That mosaic is strongly controlled by the water regime. Note, however, that with trend of sugar to move to upland, rainforest will be more important.
Jennifer Moharassy
As an example, there is evidence that the Herbert was open burnt woodland before European settlement.
Mike Hopkins The Ingham area was sedge grassland.The important step in changed land management may have been draining rather than clearing.
Steve Turton It is important to remember that it was a cultural landscape before the Europeans
Climate, Soils, Vegetation
Paul Reddell There are large differences in root distribution (and strategy) between different communities.
Merv Probert It would be expected that mixed vegetation systems must have niches with something evolved to exploit them.
Viki Cramer Mycorrhizal systems associated with native root systems enhance nutrient capture.
Merv Probert Time scales, for example of nutrient bulges, are important. Given enough time they can occur in natural systems, eg. sulfur bulge.
Phil Moody N cycling is very important.
Rainforest Systems
Mike Hopkins Re-emphasised that there are five to six different types of coastal lowland forest systems, about which we know even less than for the rainforest ones.
Paul Reddell It is important to remember that the rainforest work cannot be generalised because of the site specificity of some results, owing to the geological setting.
Frank Dunin Work suggests that there is an upper bound of ET for a dry canopy, which is about 75% of Penman–Monteith potential. Interception processes etc. can enhance this.
Mike Hopkins Run-off is often in massive single events, which may result in large losses of litter once or twice a year. Therefore forest nutrient systems are not necessarily as tight as sometimes believed.
Heather Hunter A study of mineral N carried out at CSIRO Atherton may be relevant.
Phil Moody There is perhaps a gap in knowledge of run-off losses in lowland systems.
Brian Keating Was there any primary production information found? [Peter: Yes, but not reviewed.]Was the N cycle in equilibrium in the studies cited?[Peter: The expectation is ‘yes’ at the sub-catchment scale.]
John Williams It is surprising that the effect of fertility on the hydrologic losses of nutrients was not greater.
Merv Probert Do they include sediment?
Warren Bond Given the difficulty of monitoring large events, they may underestimate hydrologic losses of nutrients.
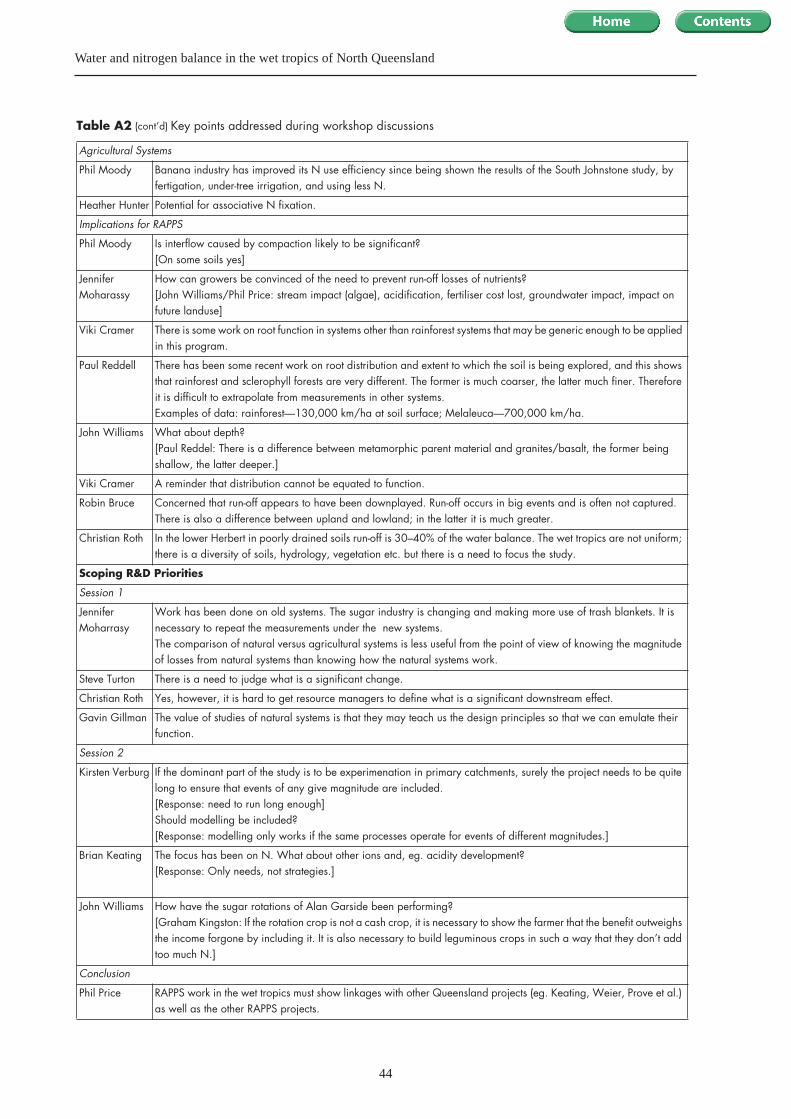
44
Water and nitrogen balance in the wet tropics of North Queensland
Agricultural Systems
Phil Moody Banana industry has improved its N use efficiency since being shown the results of the South Johnstone study, by fertigation, under-tree irrigation, and using less N.
Heather Hunter Potential for associative N fixation.
Implications for RAPPS
Phil Moody Is interflow caused by compaction likely to be significant?[On some soils yes]
Jennifer Moharassy
How can growers be convinced of the need to prevent run-off losses of nutrients?[John Williams/Phil Price: stream impact (algae), acidification, fertiliser cost lost, groundwater impact, impact on future landuse]
Viki Cramer There is some work on root function in systems other than rainforest systems that may be generic enough to be applied in this program.
Paul Reddell There has been some recent work on root distribution and extent to which the soil is being explored, and this shows that rainforest and sclerophyll forests are very different. The former is much coarser, the latter much finer. Therefore it is difficult to extrapolate from measurements in other systems.Examples of data: rainforest—130,000 km/ha at soil surface; Melaleuca—700,000 km/ha.
John Williams What about depth?[Paul Reddel: There is a difference between metamorphic parent material and granites/basalt, the former being shallow, the latter deeper.]
Viki Cramer A reminder that distribution cannot be equated to function.
Robin Bruce Concerned that run-off appears to have been downplayed. Run-off occurs in big events and is often not captured. There is also a difference between upland and lowland; in the latter it is much greater.
Christian Roth In the lower Herbert in poorly drained soils run-off is 30–40% of the water balance. The wet tropics are not uniform; there is a diversity of soils, hydrology, vegetation etc. but there is a need to focus the study.
Scoping R&D Priorities
Session 1
Jennifer Moharrasy
Work has been done on old systems. The sugar industry is changing and making more use of trash blankets. It is necessary to repeat the measurements under the new systems.The comparison of natural versus agricultural systems is less useful from the point of view of knowing the magnitude of losses from natural systems than knowing how the natural systems work.
Steve Turton There is a need to judge what is a significant change.
Christian Roth Yes, however, it is hard to get resource managers to define what is a significant downstream effect.
Gavin Gillman The value of studies of natural systems is that they may teach us the design principles so that we can emulate their function.
Session 2
Kirsten Verburg If the dominant part of the study is to be experimenation in primary catchments, surely the project needs to be quite long to ensure that events of any give magnitude are included.[Response: need to run long enough]Should modelling be included?[Response: modelling only works if the same processes operate for events of different magnitudes.]
Brian Keating The focus has been on N. What about other ions and, eg. acidity development?[Response: Only needs, not strategies.]
John Williams How have the sugar rotations of Alan Garside been performing?[Graham Kingston: If the rotation crop is not a cash crop, it is necessary to show the farmer that the benefit outweighs the income forgone by including it. It is also necessary to build leguminous crops in such a way that they don’t add too much N.]
Conclusion
Phil Price RAPPS work in the wet tropics must show linkages with other Queensland projects (eg. Keating, Weier, Prove et al.) as well as the other RAPPS projects.
Table A2 Key points addressed during workshop discussions(cont’d)

45
Appendix
Table A3 Summary of the workshop working groups tasked to address the questions
GROUP A:
What do we need to know to meet RAPPS design criteria?
• Differentiate ‘wet tropics’– land systems– hydrologic units– physico-chemical behaviour
• Understand relationships between units (‘catchment dimensions’)
• What is ‘unsustainable’? Do we attempt to match water and nutrient fluxes from natural systems or define thresholds to N inputs accepted by society?
• Need to develop predictive capabilities
What R&D strategy do we need to adopt ?
• Throw all resources at a site, calibrate system model, run scenarios, derive strategies for redesign, test
• Criteria for site selection– accessibility– sensitivity of response– uniqueness for wet tropics
• Link into additional (existing) sites to test extrapolative capability
• Ensure current modeling frameworks capable of reproducing variable charge soils
GROUP B:
What do we know?
• Water has to go somewhere
• Systems are complex
• Sparseness/non-representativeness of existing data—why ? Curiosity driven work, few ‘scientists’?
• Current cultural practice leads to unsustainable systems– Sugar—perennial– Bananas—multi-canopy
• Soils acidify—at minimum pH ultimate limitation is calcium (or aluminium or magnesium?)
What do we need to know to meet RAPPS design criteria?
• ET of natural systems and crops
• Partitioning of water into run-off and drainage
• To what extent we can use models to extrapolate
• How groundwater systems impact locally and downstream
• More about root distribution and function
• More about variable charge soils and nutrient fluxes
• More about soil biology and nutrient cycling
• Impacts of riparian zone and remnant wetlands on nutrient cycling
• Up-scaling
What R&D strategy do we need to adopt?
To improve sugarcane production we need to 1. Identify leaks2. Can then (i) Exploit/Trap nutrients or (ii) Reduce leaks eg.—by controlled input, associative N fixation
• Experimentation– Contrasting sites (a) free draining soil, (b) poorly drained, shallow watertable

46
Water and nitrogen balance in the wet tropics of North Queensland
Table A3 Summary of the workshop working groups tasked to address the questions
GROUP C:
What do we know?
• Need to improve current agricultural systems—nutrients, sediments, fertility
• Inefficient use of nutrients by current crops
What do we need to know to meet RAPPS design criteria?
• Degree of change in leakiness following development
• Effect of heterogeneity of soils and vegetation
• Is the issue the deep drainage or the nutrients/contaminants ?
• Damping effects of system on episodic events
• Nature of nutrients in the system and susceptibility to movement
• Nutrient movement in two systems (deep versus shallow watertables) different
• Benchmarking of present systems under best practices
• Alternatives to monoculture
• Water/nutrient uptake by cane and other crops; time, depth, growth stage. Also need for natural systems
What R&D strategy do we need to adopt?
Scale:1. Primary catchment level with well characterised properties (soil, vegetation, slope, flow etc). Land use—natural and agricultural
paired catchments2. River basin
Balance between experiment/modelling? • Data collection/experiment dominant• Scale up 1 to river basin via modelling
Where would we do the work ? • Identify potential areas with significant problems• Define where we are at with the study area using existing literature and current research (unpublished)
Assess potential of possible sites1. Will implementation of best management practices improve current situation?
– modeling– experimentation
2. Explore options with data we have to ensure a potential benefit3. Release information along the way—don’t hold back data or findings
Sustainability involves defining a time scale—are we at equilibrium or still changing?
(cont’d)
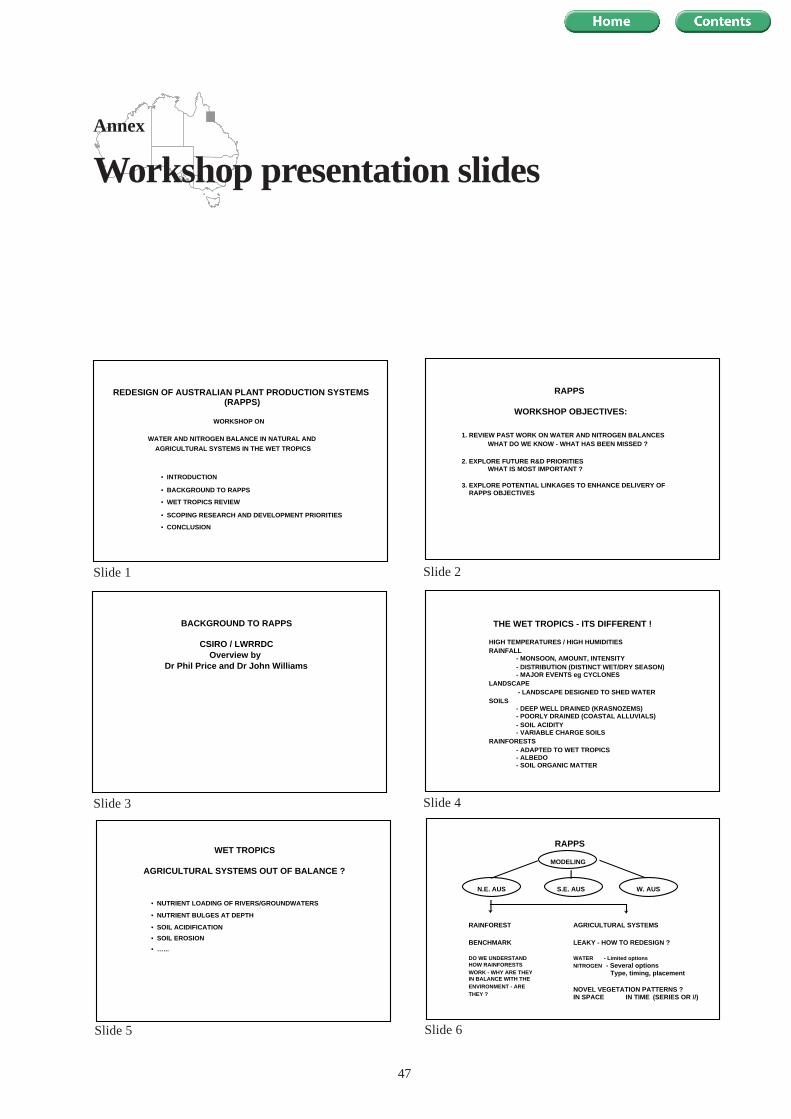
47
REDESIGN OF AUSTRALIAN PLANT PRODUCTION SYSTEMS(RAPPS)
WORKSHOP ON
WATER AND NITROGEN BALANCE IN NATURAL AND
AGRICULTURAL SYSTEMS IN THE WET TROPICS
• INTRODUCTION
• BACKGROUND TO RAPPS
• WET TROPICS REVIEW
• SCOPING RESEARCH AND DEVELOPMENT PRIORITIES
• CONCLUSION
1. REVIEW PAST WORK ON WATER AND NITROGEN BALANCESWHAT DO WE KNOW - WHAT HAS BEEN MISSED ?
2. EXPLORE FUTURE R&D PRIORITIESWHAT IS MOST IMPORTANT ?
3. EXPLORE POTENTIAL LINKAGES TO ENHANCE DELIVERY OF RAPPS OBJECTIVES
RAPPS
WORKSHOP OBJECTIVES:
BACKGROUND TO RAPPS
CSIRO / LWRRDCOverview by
Dr Phil Price and Dr John Williams
THE WET TROPICS - ITS DIFFERENT !
HIGH TEMPERATURES / HIGH HUMIDITIESRAINFALL
- MONSOON, AMOUNT, INTENSITY- DISTRIBUTION (DISTINCT WET/DRY SEASON)- MAJOR EVENTS eg CYCLONES
LANDSCAPE - LANDSCAPE DESIGNED TO SHED WATER
SOILS- DEEP WELL DRAINED (KRASNOZEMS)- POORLY DRAINED (COASTAL ALLUVIALS)- SOIL ACIDITY- VARIABLE CHARGE SOILS
RAINFORESTS- ADAPTED TO WET TROPICS- ALBEDO- SOIL ORGANIC MATTER
WET TROPICS
AGRICULTURAL SYSTEMS OUT OF BALANCE ?
• NUTRIENT LOADING OF RIVERS/GROUNDWATERS
• NUTRIENT BULGES AT DEPTH
• SOIL ACIDIFICATION
• SOIL EROSION
• …...
RAPPS
MODELING
N.E. AUS S.E. AUS W. AUS
RAINFOREST
BENCHMARK
DO WE UNDERSTANDHOW RAINFORESTSWORK - WHY ARE THEYIN BALANCE WITH THEENVIRONMENT - ARETHEY ?
AGRICULTURAL SYSTEMS
LEAKY - HOW TO REDESIGN ?
WATER - Limited optionsNITROGEN - Several options
Type, timing, placement
NOVEL VEGETATION PATTERNS ?IN SPACE IN TIME (SERIES OR //)
Annex
Workshop presentation slides
Slide 1 Slide 2
Slide 3 Slide 4
Slide 5 Slide 6
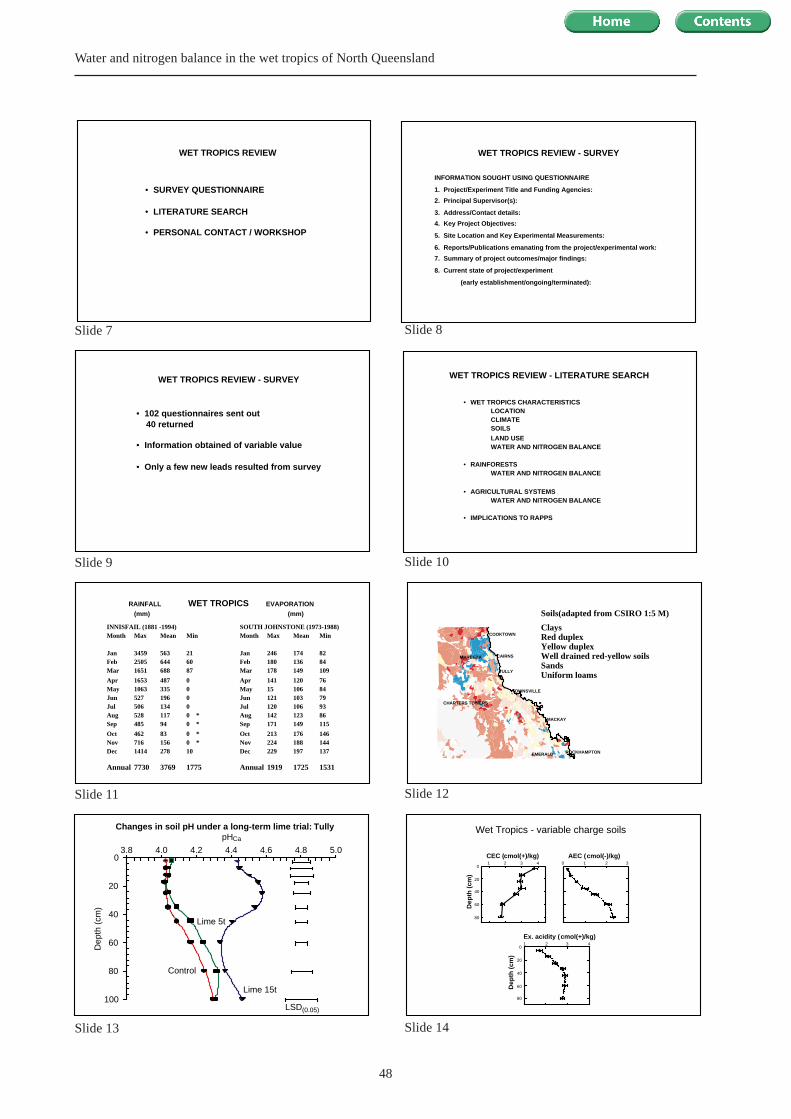
48
Water and nitrogen balance in the wet tropics of North Queensland
WET TROPICS REVIEW - SURVEY
• 102 questionnaires sent out 40 returned
• Information obtained of variable value
• Only a few new leads resulted from survey
WET TROPICS REVIEW - LITERATURE SEARCH
• WET TROPICS CHARACTERISTICSLOCATIONCLIMATESOILS
LAND USEWATER AND NITROGEN BALANCE
• RAINFORESTSWATER AND NITROGEN BALANCE
• AGRICULTURAL SYSTEMSWATER AND NITROGEN BALANCE
• IMPLICATIONS TO RAPPS
INNISFAIL (1881 -1994)Month Max Mean Min
Jan 3459 563 21Feb 2505 644 60Mar 1651 688 87
Apr 1653 487 0May 1063 335 0Jun 527 196 0Jul 506 134 0Aug 528 117 0 *Sep 485 94 0 *
Oct 462 83 0 *Nov 716 156 0 *Dec 1414 278 10
Annual 7730 3769 1775
SOUTH JOHNSTONE (1973-1988)Month Max Mean Min
Jan 246 174 82Feb 180 136 84Mar 178 149 109
Apr 141 120 76May 15 106 84Jun 121 103 79Jul 120 106 93Aug 142 123 86Sep 171 149 115
Oct 213 176 146Nov 224 188 144Dec 229 197 137
Annual 1919 1725 1531
RAINFALL WET TROPICS EVAPORATION
(mm) (mm)
lllllllll
lllllllll
lllllllll
lllllllll
lllllllll
lllllllll
lllllllll
lllllllll
lllllllll
CHARTERS TOWERS
MACKAY
MAREEBA CAIRNS
COOKTOWN
EMERALD ROCKHAMPTON
TOWNSVILLE
TULLY
Well drained red-yellow soils
ClaysRed duplexYellow duplex
SandsUniform loams
Soils(adapted from CSIRO 1:5 M)
pHCa
3.8 4.0 4.2 4.4 4.6 4.8 5.0
Dep
th (
cm)
0
20
40
60
80
100LSD(0.05)
Control
Lime 15t
Lime 5t
Changes in soil pH under a long-term lime trial: Tully
CEC (cmol(+)/kg)1 2 3 4
Dep
th (
cm)
Dep
th (
cm)
0
20
40
60
80
AEC (cmol(-)/kg)0 1 2 3
Ex. acidity (cmol(+)/kg)1 2 3 4
0
20
40
60
80
Wet Tropics - variable charge soils
• SURVEY QUESTIONNAIRE
• LITERATURE SEARCH
• PERSONAL CONTACT / WORKSHOP
WET TROPICS REVIEW
INFORMATION SOUGHT USING QUESTIONNAIRE
1. Project/Experiment Title and Funding Agencies:
2. Principal Supervisor(s):
3. Address/Contact details:
4. Key Project Objectives:
5. Site Location and Key Experimental Measurements:
6. Reports/Publications emanating from the project/experimental work:
7. Summary of project outcomes/major findings:
8. Current state of project/experiment
(early establishment/ongoing/terminated):
WET TROPICS REVIEW - SURVEY
Slide 7 Slide 8
Slide 13 Slide 14
Slide 9 Slide 10
Slide 11 Slide 12
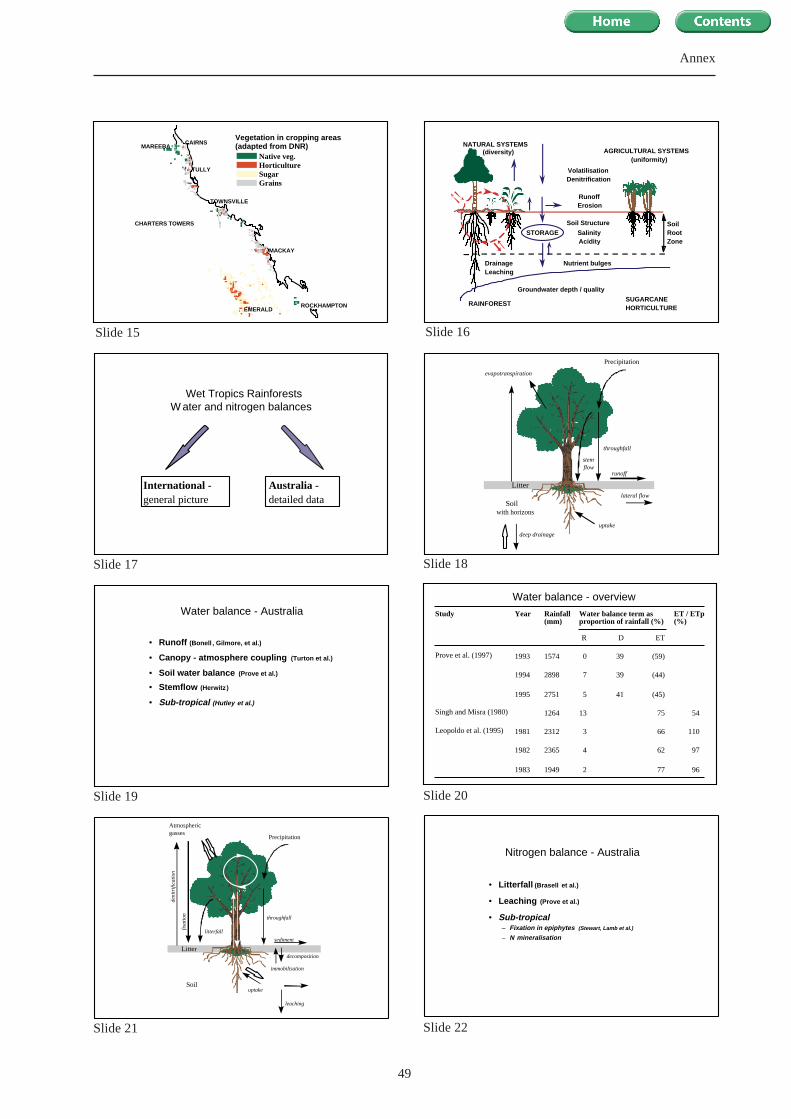
49
Annex
lllllllll
lllllllll
lllllllll
lllllllll
lllllllll
lllllllll
lllllllll
MAREEBA
CHARTERS TOWERS
CAIRNS
EMERALD
MACKAY
ROCKHAMPTON
TOWNSVILLE
TULLY
Grains
Native veg.HorticultureSugar
Vegetation in cropping areas(adapted from DNR)
Soil Structure
SalinityAcidity
STORAGE
Drainage Leaching
RunoffErosion
VolatilisationDenitrification
NATURAL SYSTEMS(diversity) AGRICULTURAL SYSTEMS
(uniformity)
SoilRootZone
Groundwater depth / quality
Nutrient bulges
RAINFORESTSUGARCANEHORTICULTURE
Wet Tropics RainforestsW ater and nitrogen balances
Australia -detailed data
International -general picture Soil
with horizons
Litter
Precipitation
throughfall
deep drainage
uptake
runoff
interception
stemflow
evapotranspiration
lateral flow
Soil
Litter
Precipitation
Atmosphericgasses
throughfall
litterfall
deni
trif
icat
ion
fixa
tion
leaching
uptake
sediment
decomposition
immobilisation
lateral flow
Nitrogen balance - Australia
• Litterfall (Brasell et al.)
• Leaching (Prove et al.)
• Sub-tropical– Fixation in epiphytes (Stewart, Lamb et al.)
– N mineralisation
Water balance - Australia
• Runoff (Bonell , Gilmore, et al.)
• Canopy - atmosphere coupling (Turton et al.)
• Soil water balance (Prove et al.)
• Stemflow (Herwitz)
• Sub-tropical (Hutley et al.)
Water balance - overview
Study Year Rainfall(mm)
Water balance term asproportion of rainfall (%)
ET / ETp(%)
R D ET
Prove et al. (1997) 1993 1574 0 39 (59)
1994 2898 7 39 (44)
1995 2751 5 41 (45)
Singh and Misra (1980) 1264 13 75 54
Leopoldo et al. (1995) 1981 2312 3 66 110
1982 2365 4 62 97
1983 1949 2 77 96
Slide 15 Slide 16
Slide 17 Slide 18
Slide 19 Slide 20
Slide 21 Slide 22
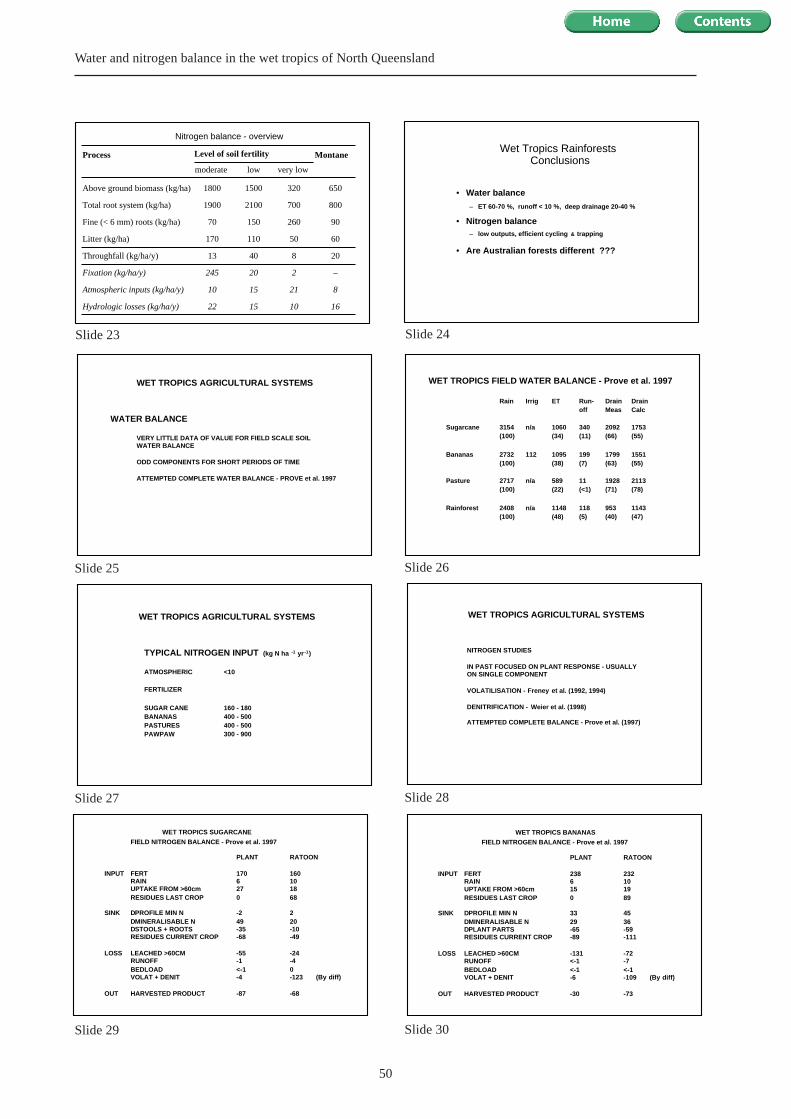
50
Water and nitrogen balance in the wet tropics of North Queensland
WET TROPICS AGRICULTURAL SYSTEMS
WATER BALANCE
VERY LITTLE DATA OF VALUE FOR FIELD SCALE SOILWATER BALANCE
ODD COMPONENTS FOR SHORT PERIODS OF TIME
ATTEMPTED COMPLETE WATER BALANCE - PROVE et al. 1997
Rain Irrig ET Run- Drain Drainoff Meas Calc
Sugarcane 3154 n/a 1060 340 2092 1753(100) (34) (11) (66) (55)
Bananas 2732 112 1095 199 1799 1551(100) (38) (7) (63) (55)
Pasture 2717 n/a 589 11 1928 2113(100) (22) (<1) (71) (78)
Rainforest 2408 n/a 1148 118 953 1143(100) (48) (5) (40) (47)
WET TROPICS FIELD WATER BALANCE - Prove et al. 1997
WET TROPICS AGRICULTURAL SYSTEMS
TYPICAL NITROGEN INPUT (kg N ha -1 yr -1)
ATMOSPHERIC <10
FERTILIZER
SUGAR CANE 160 - 180BANANAS 400 - 500PASTURES 400 - 500PAWPAW 300 - 900
WET TROPICS AGRICULTURAL SYSTEMS
NITROGEN STUDIES
IN PAST FOCUSED ON PLANT RESPONSE - USUALLYON SINGLE COMPONENT
VOLATILISATION - Freney et al. (1992, 1994)
DENITRIFICATION - Weier et al. (1998)
ATTEMPTED COMPLETE BALANCE - Prove et al. (1997)
WET TROPICS SUGARCANE
FIELD NITROGEN BALANCE - Prove et al. 1997
PLANT RATOON
INPUT FERT 170 160RAIN 6 10UPTAKE FROM >60cm 27 18RESIDUES LAST CROP 0 68
SINK DPROFILE MIN N -2 2DMINERALISABLE N 49 20DSTOOLS + ROOTS -35 -10RESIDUES CURRENT CROP -68 -49
LOSS LEACHED >60CM -55 -24RUNOFF -1 -4BEDLOAD <-1 0VOLAT + DENIT -4 -123 (By diff)
OUT HARVESTED PRODUCT -87 -68
WET TROPICS BANANAS
FIELD NITROGEN BALANCE - Prove et al. 1997
PLANT RATOON
INPUT FERT 238 232RAIN 6 10UPTAKE FROM >60cm 15 19RESIDUES LAST CROP 0 89
SINK DPROFILE MIN N 33 45DMINERALISABLE N 29 36DPLANT PARTS -65 -59RESIDUES CURRENT CROP -89 -111
LOSS LEACHED >60CM -131 -72RUNOFF <-1 -7BEDLOAD <-1 <-1VOLAT + DENIT -6 -109 (By diff)
OUT HARVESTED PRODUCT -30 -73
Nitrogen balance - overview
Process Level of soil fertility Montane
moderate low very low
Above ground biomass (kg/ha) 1800 1500 320 650
Total root system (kg/ha) 1900 2100 700 800
Fine (< 6 mm) roots (kg/ha) 70 150 260 90
Litter (kg/ha) 170 110 50 60
Throughfall (kg/ha/y) 13 40 8 20
Fixation (kg/ha/y) 245 20 2 –
Atmospheric inputs (kg/ha/y) 10 15 21 8
Hydrologic losses (kg/ha/y) 22 15 10 16
Wet Tropics RainforestsConclusions
• Water balance
– ET 60-70 %, runoff < 10 %, deep drainage 20-40 %
• Nitrogen balance– low outputs, efficient cycling & trapping
• Are Australian forests different ???
Slide 23 Slide 24
Slide 25 Slide 26
Slide 27 Slide 28
Slide 29 Slide 30

51
Annex
INPUTS kg N ha -1 yr -1 OUTPUTS kg N ha -1 yr -1
Fertiliser * 152 Harvested cane 60Symbiotic N2 fixation 0 Burning of trash 0/55 **Irrigation 20 NH3 loss ( fert ) 10
Precipitation 5 Erosion 4Dry deposition 5 Runoff 1Planting material 2 NH3 loss (leaf senes ) 10Non-symbiotic N2 fixation 10
Total inputs 194 Total outputs 85/140 **
Long term potential N loss (leaching plus denitrification ):
Trash retained system: 194 - 85 = 109 kg N ha -1 yr -1
Trash burnt system: 194 - 140 = 54 kg N ha -1 yr -1
APPROXIMATE N BUDGET FOR SUGARCANE (Plant + 4 ratoons)
DESK TOP STUDY (VALLIS AND KEATING, 1994)IMPLICATIONS TO RAPPS
RAINFOREST
NO COHERENT KNOWLEDGE ON WATER AND NITROGEN BALANCE(BENCHMARK ?)PLANT/SOIL COUPLINGROOT DISTRIBUTION/FUNCTION
AGRICULTURAL SYSTEMS
NO COHERENT KNOWLEDGE ON WATER AND NITROGEN BALANCE OF TREE CROPS
LEACHING LOSSES AND IMPLICATIONS
CHEMISTRY/HYDROLOGY OF VARIABLE CHARGE SOILSIMPLICATIONS TO LEACHING LOSSES
DEVELOPMENT/PREVENTION OF SOIL ACIDIFICATION
SHALLOW WATER TABLES
IMPLICATIONS TO WATER/NUTRIENT FLUXES IN NATURAL AND AGRICULTURALSYSTEMS (Plant / water table interactions, nutrient / water table interactions)
RAPPS - ISSUES TO ADDRESS
WET TROPICS - DIFFERENT PROBLEMS / DIFFERENT SOLUTIONS
1) WHAT DO WE KNOW ?
2) WHAT DO WE NEED TO KNOW TO MEET RAPPS DESIGN CRITERIA ?
3) WHAT R&D STRATEGY DO WE NEED TO ADOPT ?
ISSUES TO KEEP IN MIND -
BALANCE BETWEEN MODELING / EXPERIMENTATIONEXISTING VS NEW WORK - FIELD SITESCORE WET TROPICS FOCUS SITE / SITESTENURE OF FIELD SITESFIELD TRIAL NEW NOVEL DESIGNS
PART OF SUPPORT NETWORK FOR MODELING EFFORTDEVELOPMENT / TESTING / APPLICATION
Slide 31 Slide 32
Slide 33
Related Documents


![2008 Natural and Agricultural Sciences] Part 1] Natural ...](https://static.cupdf.com/doc/110x72/618f9dfaa9f5b50a5640a109/2008-natural-and-agricultural-sciences-part-1-natural-.jpg)