Author's personal copy Water absorption in internally cured mortar made with water-filled lightweight aggregate Ryan Henkensiefken a, ⁎, Javier Castro b , Dale Bentz c , Tommy Nantung d , Jason Weiss b a US Concrete, 755 Stockton Ave, San Jose, CA 95126, USA b Purdue University, School of Civil Engineering, 550 Stadium Mall Drive, West Lafayette, IN 47906, USA c National Institute of Standards and Technology, Materials and Construction Research Division, Building and Fire Research Laboratory,100 Bureau Drive, Stop 8615, Gaithersburg, MD 20899-8615, USA d Indiana Department of Transportation, Office of Research and Development, 1205 Montgomery St, West Lafayette, IN, 47906, USA abstract article info Article history: Received 9 February 2009 Accepted 9 June 2009 Keywords: Interfacial transition zone Internal curing Lightweight aggregate Sorptivity The increased propensity for shrinkage cracking in low water-to-cement ratio (w/c) concrete has inspired the development of new technologies that can reduce the risk of early-age cracking. One of these is internal curing. Internal curing uses saturated lightweight aggregate to supply ‘curing water’ to low w/c paste as it hydrates. Significant research has been performed to determine the effects of internal curing on shrinkage and stress development; however, relatively little detailed information exists about the effects of internal curing on fluid transport properties such as water absorption or diffusivity. This study examines the absorption of water into mortar specimens made with saturated lightweight aggregates (SLWA). These results indicate that the inclusion of SLWA can reduce the water absorption of mortar specimens. This observation was reinforced with electrical conductivity measurements that exhibited similar reductions. © 2009 Elsevier Ltd. All rights reserved. 1. Introduction High performance concrete (HPC) mixtures have been increasingly promoted due to potential long-term benefits in performance [1]. HPC mixtures generally have a low water-to-cement ratio (w/c) and may contain fine supplementary cementitious materials, (e.g., silica fume). While the fine pore system is beneficial for increased strength [2] and reduced fluid transport [3,4], the finer pore network can lead to increased volumetric changes in sealed systems as a result of self- desiccation [5] and the inability of external water to penetrate readily to the interior of HPC members. This volume change (autogenous shrinkage) is an issue as it can result in cracking if the concrete is restrained from shrinking freely. One strategy to mitigate autogenous shrinkage is the incorporation of water filled inclusions [6–8]. The use of saturated lightweight aggregate (SLWA), enables water from the SLWA to be supplied to the paste after setting [9], thereby reducing the effects of self-desiccation. This strategy has proven to be quite effective in reducing autogenous shrinkage and cracking [10,11]. The influence of SLWA inclusions on the fluid transport and water absorption properties of concrete is much less understood. This study provides experimental results to quantify the performance of plain and SLWA systems in absorption tests and electrical conductivity measurements. The performance of the SLWA systems is related to aspects of the pore structure of the paste, the pore structure of the LWA, and the pore structure of the interfacial transition zone (ITZ). 1.1. Background on sorptivity The durability of concrete subjected to aggressive environments depends largely on the penetrability of the pore system [12,13]. Three mechanisms can be used to describe transport in cementitious systems: (1) permeability, (2) diffusion and (3) absorption. Perme- ability is the measure of the flow of water under a pressure gradient while diffusion is the movement of ions due to a concentration gradient. Absorption can be described as the materials ability to take in water by means of capillary suction. Water absorption is an important factor for quantifying the durability of cementitious systems [14–16] and is the primary focus in this study. The test method that is most commonly used to determine the absorption and rate of absorption (sorptivity) of water in unsaturated hydraulic cement concretes is ASTM C1585 [13]. This test consists of exposing the bottom surface of a sample to water and measuring the increase in mass resulting from absorption. Before the test is conducted, samples are conditioned for 18 days. The samples are first placed in a 50 °C and 80% RH environment. After three days of conditioning, the samples are removed from the oven and placed in individually sealed containers where the samples are retained for 15 days to allow internal moisture equilibrium before the test begins. The absorption test involves recording incremental mass change Cement and Concrete Research 39 (2009) 883–892 ⁎ Corresponding author. Tel.: +1 408 404 2310; fax: +1 408 404 2550. E-mail address: [email protected] (R. Henkensiefken). 0008-8846/$ – see front matter © 2009 Elsevier Ltd. All rights reserved. doi:10.1016/j.cemconres.2009.06.009 Contents lists available at ScienceDirect Cement and Concrete Research journal homepage: http://ees.elsevier.com/CEMCON/default.asp

Welcome message from author
This document is posted to help you gain knowledge. Please leave a comment to let me know what you think about it! Share it to your friends and learn new things together.
Transcript
Author's personal copy
Water absorption in internally cured mortar made with water-filledlightweight aggregate
Ryan Henkensiefken a,⁎, Javier Castro b, Dale Bentz c, Tommy Nantung d, Jason Weiss b
a US Concrete, 755 Stockton Ave, San Jose, CA 95126, USAb Purdue University, School of Civil Engineering, 550 Stadium Mall Drive, West Lafayette, IN 47906, USAc National Institute of Standards and Technology, Materials and Construction Research Division, Building and Fire Research Laboratory, 100 Bureau Drive, Stop 8615,Gaithersburg, MD 20899-8615, USAd Indiana Department of Transportation, Office of Research and Development, 1205 Montgomery St, West Lafayette, IN, 47906, USA
a b s t r a c ta r t i c l e i n f o
Article history:Received 9 February 2009Accepted 9 June 2009
Keywords:Interfacial transition zoneInternal curingLightweight aggregateSorptivity
The increased propensity for shrinkage cracking in low water-to-cement ratio (w/c) concrete has inspiredthe development of new technologies that can reduce the risk of early-age cracking. One of these is internalcuring. Internal curing uses saturated lightweight aggregate to supply ‘curing water’ to low w/c paste as ithydrates. Significant research has been performed to determine the effects of internal curing on shrinkageand stress development; however, relatively little detailed information exists about the effects of internalcuring on fluid transport properties such as water absorption or diffusivity. This study examines theabsorption of water into mortar specimens made with saturated lightweight aggregates (SLWA). Theseresults indicate that the inclusion of SLWA can reduce the water absorption of mortar specimens. Thisobservation was reinforced with electrical conductivity measurements that exhibited similar reductions.
© 2009 Elsevier Ltd. All rights reserved.
1. Introduction
High performance concrete (HPC)mixtures have been increasinglypromoted due to potential long-term benefits in performance [1]. HPCmixtures generally have a low water-to-cement ratio (w/c) and maycontain fine supplementary cementitious materials, (e.g., silica fume).While the fine pore system is beneficial for increased strength [2] andreduced fluid transport [3,4], the finer pore network can lead toincreased volumetric changes in sealed systems as a result of self-desiccation [5] and the inability of external water to penetrate readilyto the interior of HPC members. This volume change (autogenousshrinkage) is an issue as it can result in cracking if the concrete isrestrained from shrinking freely.One strategy to mitigate autogenous shrinkage is the incorporation
of water filled inclusions [6–8]. The use of saturated lightweightaggregate (SLWA), enables water from the SLWA to be supplied to thepaste after setting [9], thereby reducing the effects of self-desiccation.This strategy has proven to be quite effective in reducing autogenousshrinkage and cracking [10,11].The influence of SLWA inclusions on the fluid transport and water
absorption properties of concrete is much less understood. This studyprovides experimental results to quantify the performance of plainand SLWA systems in absorption tests and electrical conductivity
measurements. The performance of the SLWA systems is related toaspects of the pore structure of the paste, the pore structure of theLWA, and the pore structure of the interfacial transition zone (ITZ).
1.1. Background on sorptivity
The durability of concrete subjected to aggressive environmentsdepends largely on the penetrability of the pore system [12,13]. Threemechanisms can be used to describe transport in cementitioussystems: (1) permeability, (2) diffusion and (3) absorption. Perme-ability is the measure of the flow of water under a pressure gradientwhile diffusion is the movement of ions due to a concentrationgradient. Absorption can be described as the materials ability to takein water by means of capillary suction. Water absorption is animportant factor for quantifying the durability of cementitioussystems [14–16] and is the primary focus in this study.The test method that is most commonly used to determine the
absorption and rate of absorption (sorptivity) of water in unsaturatedhydraulic cement concretes is ASTM C1585 [13]. This test consists ofexposing the bottom surface of a sample to water and measuring theincrease in mass resulting from absorption. Before the test isconducted, samples are conditioned for 18 days. The samples arefirst placed in a 50 °C and 80% RH environment. After three days ofconditioning, the samples are removed from the oven and placed inindividually sealed containers where the samples are retained for15 days to allow internal moisture equilibrium before the test begins.The absorption test involves recording incremental mass change
Cement and Concrete Research 39 (2009) 883–892
⁎ Corresponding author. Tel.: +1 408 404 2310; fax: +1 408 404 2550.E-mail address: [email protected] (R. Henkensiefken).
0008-8846/$ – see front matter © 2009 Elsevier Ltd. All rights reserved.doi:10.1016/j.cemconres.2009.06.009
Contents lists available at ScienceDirect
Cement and Concrete Research
j ourna l homepage: ht tp: / /ees.e lsev ie r.com/CEMCON/defau l t .asp
Author's personal copy
measurements during the first six hours after the sample came incontact with water and taking one measurement every day for thenext eight days. The amount of absorbed water is normalized by thecross-sectional area of the specimen exposed to the fluid using Eq. (1).
I =mt
a � dð Þ ð1Þ
where: I (mm3/mm2) is the normalized absorbed water, mt (g) is thechange in specimenmass at time t; a (mm2) is the area of the specimenexposed to water (i.e., that of the bottom face), and d (g/mm3) is thedensity of the water (taken to be 0.001 g/mm3 at 23 °C).The absorption measurements are then plotted as a function of the
square root of time. The initial sorptivity is the slope of the curveduring the first six hours, while secondary sorptivity is the slope of thesame measurements between one to eight days as outlined in ASTMC1585 [13].The initial and secondary sorptivity can be used to evaluate the con-
nectivity of the pore network [15]. Additionally, the secondary sorptivity,
combined with exposure conditions, has been used for performingservice life predictions [16].
1.2. Background on the effects of internal curing on sorptivity
Low w/c mixtures undergo self-desiccation, especially in sealedcuring conditions. Self-desiccation occurs as a result of chemicalshrinkage. During cement hydration, the hydration products occupy avolume that is approximately 10% smaller than the initial reactants[17–19]. This results in the creation of vapor filled voids inside theconcrete [20]. These vapor-filled voids grow with increased hydrationand penetrate smaller and smaller pores. Lightweight aggregate canbe used as a water reservoir to supply water to replenish the waterdemanded by the hydrating cement paste thereby reducing the vapor-filled voids and therefore mitigating the effects of self-desiccation inlow w/c concrete mixtures. A more thorough description of thisprocess can be found elsewhere [10,21].The inclusion of SLWA is hypothesized to influence the absorption
ofwater; reasons canbe given for either an increase or a decrease in the
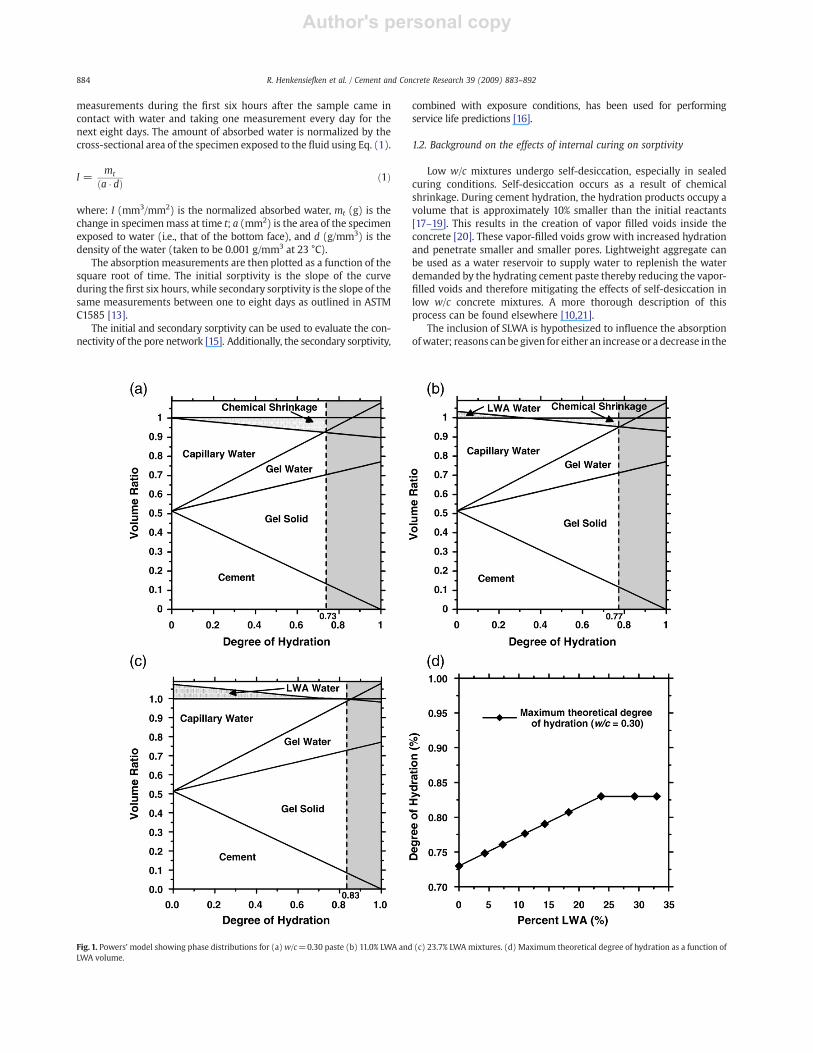
Fig. 1. Powers' model showing phase distributions for (a) w/c=0.30 paste (b) 11.0% LWA and (c) 23.7% LWAmixtures. (d) Maximum theoretical degree of hydration as a function ofLWA volume.
884 R. Henkensiefken et al. / Cement and Concrete Research 39 (2009) 883–892
Author's personal copy
water absorption. At first glance, one would think that the incorpora-tion of porous inclusions (i.e., LWA)would result in an overall increasein the porosity of the system. The pores in the LWA are large and in thesize range of or slightly larger than the largest capillary pores. As aresult, the addition of larger pores into the system could result inhigher water absorption.However, alternate reasons exist to explain why a reduction in
the water absorption could also occur. When water leaves the LWA,the paste continues to hydrate resulting in a denser microstructurein the paste. This is similar to the supply of extra water from exter-nal curing. This concept is shown using Powers' model in Fig. 1(a)for cement paste with a w/c of 0.30. As the paste hydrates, hydra-tion products are formed. When the water supply is exhausted,hydration ceases. In the case of a paste with a w/c of 0.30, hydrationstops at a degree of hydration of 0.73 for hydration under sealedconditions.If however, additional water is supplied, hydration can continue.
Fig. 1(b) shows Powers' model for a mixture that provides an extra3.2% volume of water (by total volume) to the system, designated11.0% in the mixtures to follow (Table 1). The 11.0% indicates thevolume fraction occupied by the pre-wetted lightweight fineaggregates in the mortar mixture. Note that this water is not includedin the total volume used to calculate the porosity (shown as beinggreater than 1) since it is not part of the paste pore structure at thetime of setting. After approximately 32% hydration, the water in theLWA has been drawn out of the LWA by the hydrating cement paste tofill the voids within the capillary porosity created by chemicalshrinkage. During this process, the water from the LWA has resultedin further hydration. The theoretical maximumdegree of hydration forthis mixture would occur when the system runs out of water atapproximately 0.77. A 23.7% LWAmixture provides more water for thecement to hydrate and hydration for the 23.7% mixture is complete ata degree of hydration of 0.83. This is shown in Fig. 1(c). The maximumtheoretical degree of hydration increases as the volume replacementincreases but comes to a limiting value for an LWA addition of 23.7%(Fig. 1(d)). This is because at that degree of hydration, no pore spaceremains within the hydrating specimen. It is believed that the waterprovided does not leave the LWA before set for curing under sealedconditions [9], which explains why the initial paste porosity would beexpected to be the same for the paste in thesemixtures. The continuedhydration that occurs due to the additional water from the LWA resultsin a denser microstructure that could slow the ingress of water intothe system [22].The last aspect to consider for a reduction in the water absorp-
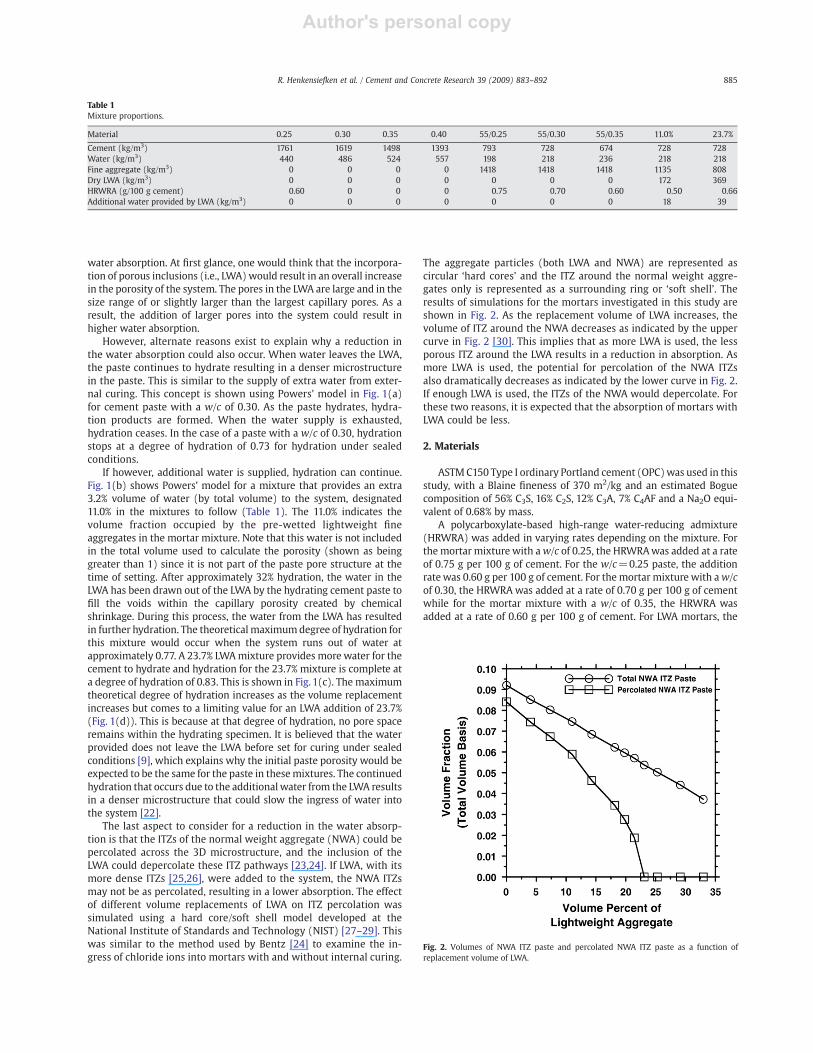
tion is that the ITZs of the normal weight aggregate (NWA) could bepercolated across the 3D microstructure, and the inclusion of theLWA could depercolate these ITZ pathways [23,24]. If LWA, with itsmore dense ITZs [25,26], were added to the system, the NWA ITZsmay not be as percolated, resulting in a lower absorption. The effectof different volume replacements of LWA on ITZ percolation wassimulated using a hard core/soft shell model developed at theNational Institute of Standards and Technology (NIST) [27–29]. Thiswas similar to the method used by Bentz [24] to examine the in-gress of chloride ions into mortars with and without internal curing.
The aggregate particles (both LWA and NWA) are represented ascircular ‘hard cores’ and the ITZ around the normal weight aggre-gates only is represented as a surrounding ring or ‘soft shell’. Theresults of simulations for the mortars investigated in this study areshown in Fig. 2. As the replacement volume of LWA increases, thevolume of ITZ around the NWA decreases as indicated by the uppercurve in Fig. 2 [30]. This implies that as more LWA is used, the lessporous ITZ around the LWA results in a reduction in absorption. Asmore LWA is used, the potential for percolation of the NWA ITZsalso dramatically decreases as indicated by the lower curve in Fig. 2.If enough LWA is used, the ITZs of the NWA would depercolate. Forthese two reasons, it is expected that the absorption of mortars withLWA could be less.
2. Materials
ASTMC150 Type I ordinary Portland cement (OPC)was used in thisstudy, with a Blaine fineness of 370 m2/kg and an estimated Boguecomposition of 56% C3S, 16% C2S, 12% C3A, 7% C4AF and a Na2O equi-valent of 0.68% by mass.A polycarboxylate-based high-range water-reducing admixture
(HRWRA) was added in varying rates depending on the mixture. Forthe mortar mixture with aw/c of 0.25, the HRWRAwas added at a rateof 0.75 g per 100 g of cement. For the w/c=0.25 paste, the additionrate was 0.60 g per 100 g of cement. For the mortar mixture with aw/cof 0.30, the HRWRA was added at a rate of 0.70 g per 100 g of cementwhile for the mortar mixture with a w/c of 0.35, the HRWRA wasadded at a rate of 0.60 g per 100 g of cement. For LWA mortars, the
Table 1Mixture proportions.
Material 0.25 0.30 0.35 0.40 55/0.25 55/0.30 55/0.35 11.0% 23.7%
Cement (kg/m3) 1761 1619 1498 1393 793 728 674 728 728Water (kg/m3) 440 486 524 557 198 218 236 218 218Fine aggregate (kg/m3) 0 0 0 0 1418 1418 1418 1135 808Dry LWA (kg/m3) 0 0 0 0 0 0 0 172 369HRWRA (g/100 g cement) 0.60 0 0 0 0.75 0.70 0.60 0.50 0.66Additional water provided by LWA (kg/m3) 0 0 0 0 0 0 0 18 39
Fig. 2. Volumes of NWA ITZ paste and percolated NWA ITZ paste as a function ofreplacement volume of LWA.
885R. Henkensiefken et al. / Cement and Concrete Research 39 (2009) 883–892
Author's personal copy
HRWRAwas added at rates of 0.50 and 0.66 g per 100 g of cement forthe 11.0% and 23.7% mixtures, respectively. Different rates of HRWRAaddition were employed to maintain similar consistencies (i.e., work-ability) of these mixtures.
The normal weight sand used was natural river sand with a fine-ness modulus of 2.71 and an apparent specific gravity of 2.58. Portionsof the normal weight sand were replaced with rotary kilned expandedshale with a fineness modulus of 3.10 and an apparent specific gravityof 1.56 (LWA). The 24-hour absorption of the LWAwas determined tobe 10.5% according to ASTM C128-07 [31].
2.1. Mixture proportioning
Nine different mixtures were prepared in total. Four mixtureswere cement paste with different w/c (w/c of 0.25, 0.30, 0.35, and0.40). These mixtures were designated as 0.25, 0.30, 0.35 and 0.40,with the numbers representing the different w/c. Three mixtureswere plainmortar with a single volume fraction of fine aggregate anddifferent w/c (designated as 55/0.25, 55/0.30, and 55/0.35) with thenumber on the left representing the volume fraction of fine aggregateand the number on the right representing w/c. Two mortar mixtureswere prepared with different volumes of sand replaced by satu-rated LWA and a w/c of 0.30. These mixtures were designated as11.0% and 23.7%. It is important to note that though the designationsare on a total volume basis, the volume of aggregate (LWA and sand)remained constant at 55% since only the sandwas replacedwith LWA.The numbers in the designations for the LWA mixtures representthe total volume of the mixture occupied by the LWA (in percent). Itshould be noted that 23.7% corresponds to the amount of LWAnecessary to eliminate self-desiccation [10]. A list of the mixtureproportions can be found in Table 1.
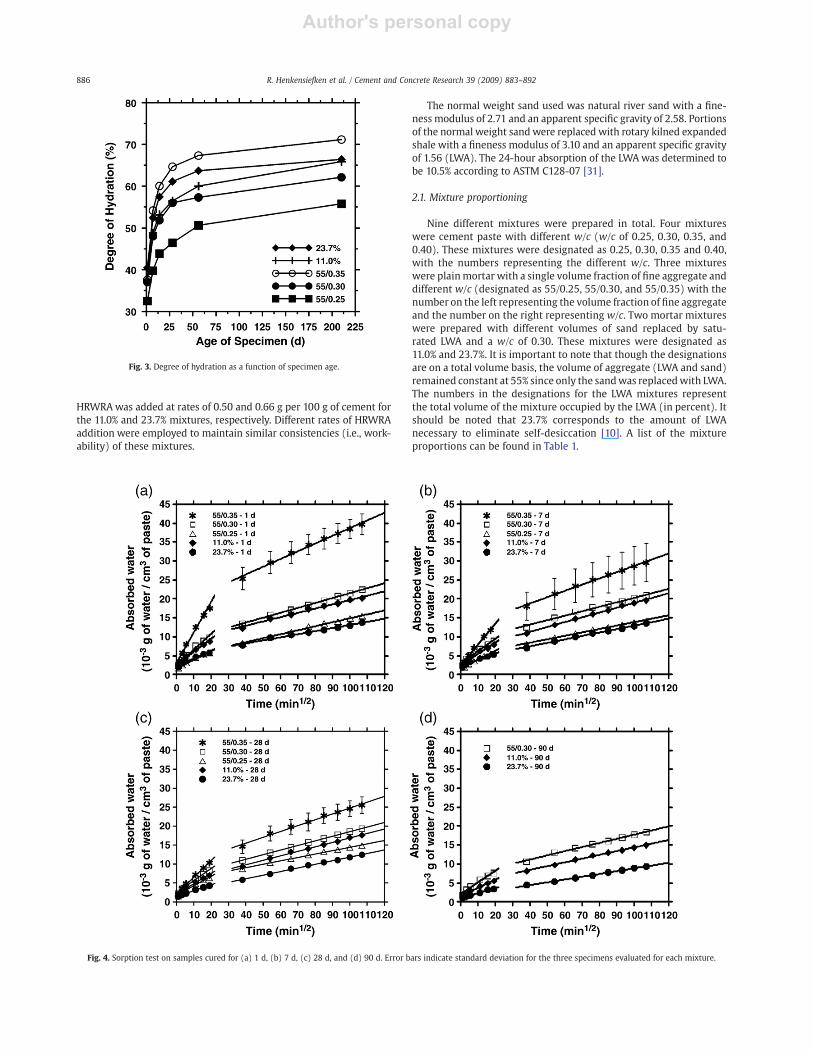
Fig. 3. Degree of hydration as a function of specimen age.
Fig. 4. Sorption test on samples cured for (a) 1 d, (b) 7 d, (c) 28 d, and (d) 90 d. Error bars indicate standard deviation for the three specimens evaluated for each mixture.
886 R. Henkensiefken et al. / Cement and Concrete Research 39 (2009) 883–892
Author's personal copy
2.2. Mixing procedure
The mixing procedure used for the mortar was in accordance withASTM C192-06 [32] while the procedure for the paste was inaccordance with ASTM C305-06 [33]. The LWA was oven dried, aircooled, and then submerged in water for 24±1 h prior to mixing. Thevolume of water used to submerge the LWA included both mixingwater and the water the LWA would absorb in 24 h. The excess water(water not absorbed in 24 h) was then decanted and used as themixing water. The normal weight sand was oven dried and cooled for24 h before mixing. For the plain mortar mixtures and the pastes, thewater and cement were conditioned for 24 h at room temperature.
3. Experimental methods
3.1. Degree of hydration
To measure the degree of hydration, fresh cement paste (in thecase of LWA mixtures, paste with LWA) was cast that was identical tothe mortar without NWA in air-tight plastic vials. At ages of 1 d, 7 d,28 d, 56 d and 210 d, approximately 10 g of cement paste was crushedand placed in ceramic crucibles. The samples were placed in an ovenat 105 °C for 24 h. The sample was weighed and then placed in afurnace at 1050 °C for 3 h. The weights were recorded to monitor theevaporable and non-evaporable water contents. The measurementswere corrected to account for loss on ignition of the cement. There isno measurable loss-on-ignition for the LWA since it goes through akiln during manufacturing.
3.2. Sorptivity
Five 100 mm×200 mm cylinders were cast for each mixture. Afteronedayof curing, the samplesweredemolded and three 50mm±2mmthick samples were cut from the central portion of each cylinder witha wet saw. The samples were sealed in double plastic bags until theyreached ages of 7 d, 28 d, and 90 d. After curing in the plastic bags wascomplete, samples were conditioned by placing them in a desiccatorover a potassium bromide (KBr) salt solution which provided an 80%relative humidity environment at 50 °C [34]. The desiccator was placedin an oven at 50 °C for 3 d. The samples were removed, and then storedin sealed containers for 15 d to allow the moisture to equilibrate withinthe samples. It should be noted that the 1 d samples were not storedin plastic bags but were placed directly in the desiccators after cutting.Once the samples were removed from the sealed containers, the sidesurfacewas sealedwith aluminum tape and the top surfacewas coveredwith plastic to avoid evaporation from the sample during testing. Afterthe samples were prepared, testing occurred in accordance withASTM C1585-04 [13].
3.3. Electrical impedance spectroscopy
After the sorptivity measurements were completed (120 d), theconductivity of the samples was measured using electrical impedancespectroscopy (EIS). The samples were vacuum saturated using tapwater and weighed. After EIS testing, the samples were oven driedat 105 °C until mass equilibrium was reached (until the differencebetween two successive 24 h measurements was less than 0.1%). Thiswas done to determine the total volume of water that was in thesystem after vacuum saturation.Electrodes were placed on the top and bottom surface of the
samples; however contact issues with the samples and electrodeexisted [35,36]. For this reason, wet sponges were placed between thesamples and the electrodes. Two other methods were compared withthe wet sponges. The first involved placing conductive silver paintand copper electrodes on the surfaces of the samples before theEIS measurements were taken. The second method involved placing
conductive gel [37] on the top and bottom surfaces to which theelectrodes were attached. The methods were applied on 3 differentsamples and similar results were achieved. The wet sponge methodwas selected instead of the conductive gel or the conductive silverpaint because of its simplicity. After a reliable method wasdetermined, all of the samples were tested. The impedance measure-ments were made over a frequency range from 10 MHz to 10 Hz, usinga 500 mV AC signal.
4. Experimental results and discussion
4.1. Effects of internal curing on the degree of hydration
Fig. 3 shows the degree of hydration (DOH) for five of the mixturestested. As the w/c increases, the DOH also increases. The 11.0%mixture has a slightly higher DOH than the 55/0.30 mixture. This islikely due to the fact that a small volume of additional water in theLWA is available in the 11.0% mixture. The 23.7% mixture has a higherDOH than the 55/0.30 mixture and it is approaching the DOH of the55/0.35 mixture. Again, this is due to the extra water provided by the
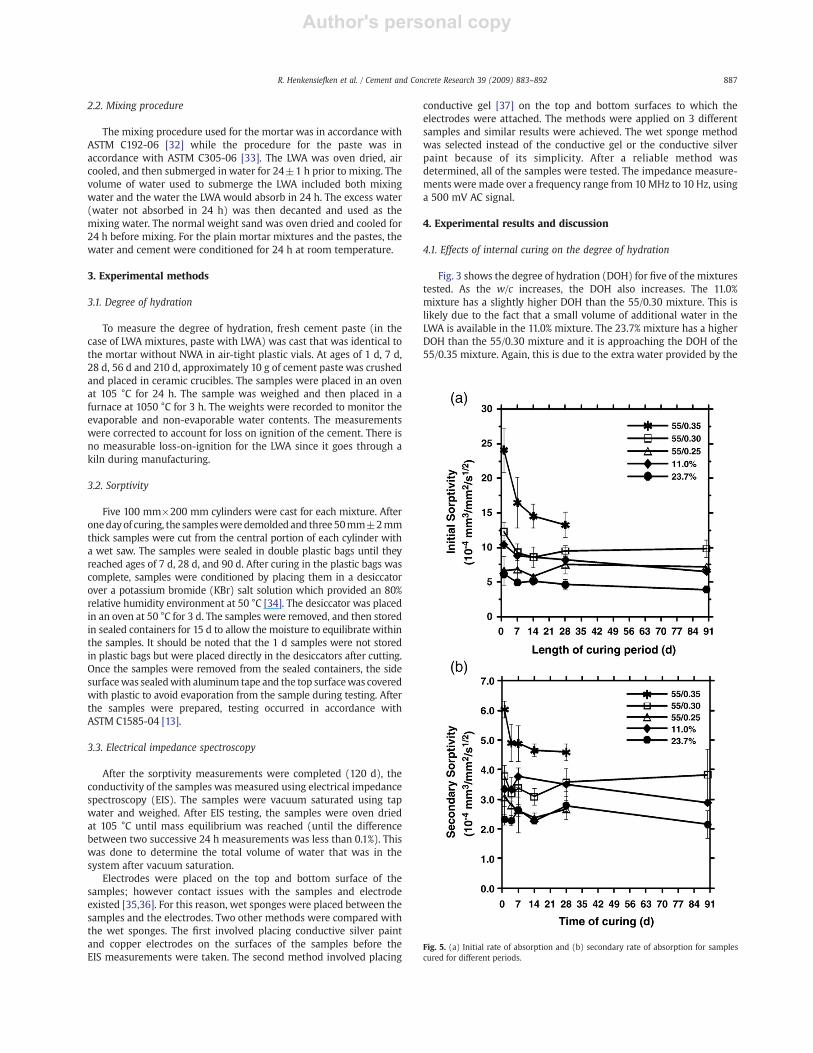
Fig. 5. (a) Initial rate of absorption and (b) secondary rate of absorption for samplescured for different periods.
887R. Henkensiefken et al. / Cement and Concrete Research 39 (2009) 883–892
Author's personal copy
LWA hydrating more cement. The maximum standard deviation forthese measurements was 0.006%.
4.2. Effects of internal curing on the initial and secondary sorptivity
Fig. 4(a) through Fig. 4(d) show the initial and secondary rates ofwater absorption for samples cured for 1 d, 7 d, 28 d, and 90 d. Theabsorbed water is expressed as grams of water per unit volume ofpaste. The volume percentage of cement paste in the mortar sampleswas approximately 45%.For all mixture except the 55/0.35, the typical standard deviation
in the average of 3 samples was lower than 2×10⁻³ g of water/cm3 ofpaste and it is not included in the plot. For mixture 55/0.35 variabilitywas higher and error bars are included indicating the standarddeviation for the three specimens evaluated.Comparing the mixtures with a similar w/c (55/0.30, 11.0%, 23.7%),
it can be seen the absorption for the 55/0.30 was the highest, with theabsorption decreasing with increasing LWA replacement volume.It can also be seen that the 23.7% mixture has a lower absorptionthan the 55/0.25 mixture. This behavior was observed on all sorptiontests performed on samples cured for different periods. The lower
absorptions seen are likely due to the increased hydration, the factthat the LWA is not re-saturating even as the hydrated cement paste isabsorbing water due to an improved interfacial transition zone, andthe depercolation of the interfacial transition zones surrounding theNWA.Fig. 5(a) shows the initial rate of absorption for samples cured for
different periods. The addition of LWA reduces the initial rate ofabsorption. Comparing the mixtures with a similar w/c (55/0.30,11.0%, 23.7%), the 55/0.30 mixture exhibits the highest initialsorptivity with lower sorptivity being observed with increasingvolume replacement of LWA. The 23.7% mixture has an even lowerinitial sorptivity than the 55/0.25 mixture. The 11.0% LWAmixture hasan average reduction of 4% on initial sorptivity and 1% on secondarysorptivity in comparison to the 55/0.30 mixture. Similarly, the 23.7%LWA mixture has an average reduction of 46% on initial sorptivity and28% on secondary sorptivity.Longer curing times reduce the initial sorptivity. However, themain
reduction of initial sorptivity in samples containing LWA is achievedduring the first week of curing. The 11.0% LWA mixture reaches a
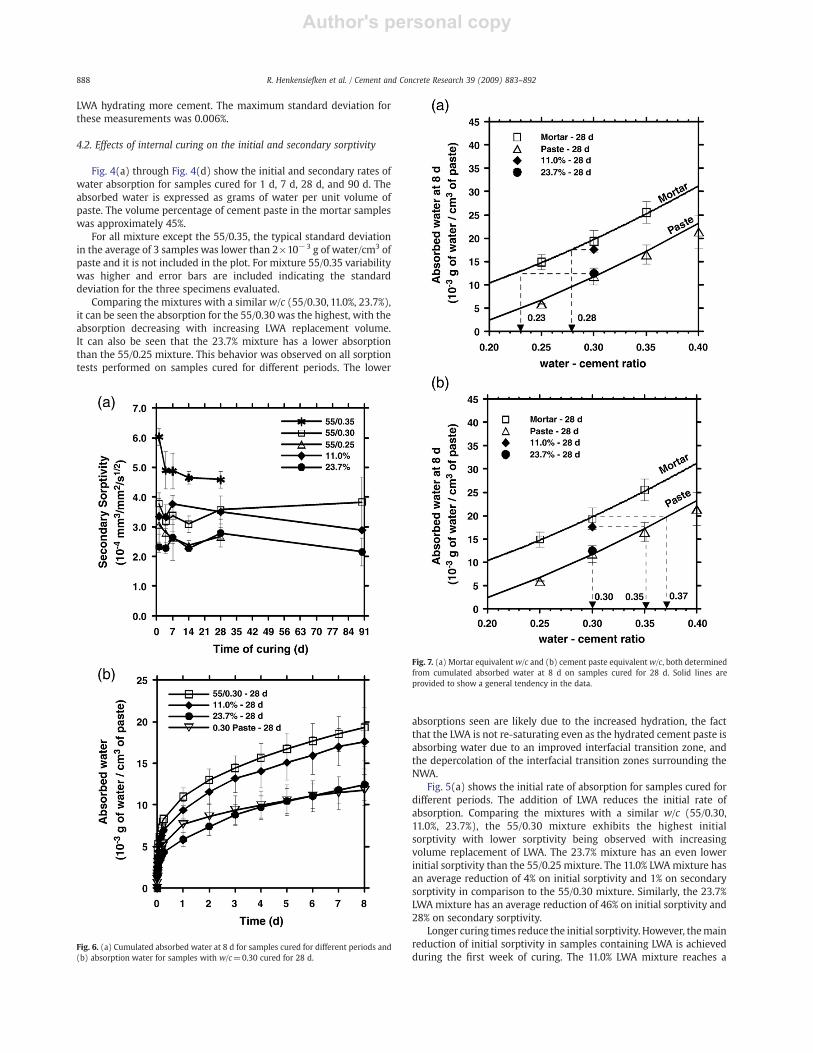
Fig. 7. (a) Mortar equivalentw/c and (b) cement paste equivalentw/c, both determinedfrom cumulated absorbed water at 8 d on samples cured for 28 d. Solid lines areprovided to show a general tendency in the data.
Fig. 6. (a) Cumulated absorbed water at 8 d for samples cured for different periods and(b) absorption water for samples with w/c=0.30 cured for 28 d.
888 R. Henkensiefken et al. / Cement and Concrete Research 39 (2009) 883–892
Author's personal copy
sorptivity that is similar to the 55/0.25 mixture when samples arecured for 90 d. At all ages, the 23.7% LWA mixtures reach lower initialsorptivity values than the 55/0.25 mixtures.When samples without LWA are analyzed, a considerable dif-
ference is observed when the w/c changes. The mixture with a higherw/c (55/0.35) has an important reduction of the rate of absorp-tion when longer curing times are allowed. Mixtures with w/c=0.3show a reduction in the absorption for the first day. The mixture withw/c=0.25 does not show a statistically significant difference onsorptivity with the change of curing time.Fig. 5(b) shows the secondary rate of absorption. Similar to the initial
sorptivity, the 23.7%mixture produces a reduction of the secondary rateof absorption. This reduction is comparablewith the one obtained usinga plain mixture with w/c of 0.25. Results from the 11.0% mixture can-not be clearly distinguished from the 55/0.30 mixture, likely because ofthe inherent variability of the measurements.
4.3. Effects of internal curing on the amount of absorbed water duringthe sorption test
Fig. 6(a) shows the cumulative absorbed water after 8 d of testingfor samples cured for different periods. All the mixtures exhibit adecrease in the total amount of absorbed water when a longer curingperiod is used. A longer curing period will provide time to develop amore dense internal structure, reducing the size and connectivity ofthe pore network.It can be observed that the mixture with a lower LWA replacement
volume (11.0%) has a lower absorption than the 55/0.30 mixture. The23.7% mixture has a lower total absorption than the 55/0.25 mixture.Mixture 11.0% has an average reduction of 8% on absorbed water after8 d of test in comparison to the 55/0.30 mixture. Mixture 23.7% has anaverage reduction of 38% on absorbed water after 8 d of test.Fig. 6(b) shows the cumulated absorption of water on samples
with w/c=0.30 (including cement paste), cured for 28 d. It can beobserved that the addition of 23.7% LWA significantly reduces theamount of absorbed water, showing a performance very similar to thecement paste samples. This result supports the concept of depercola-tion of the interfacial transition zone.Fig. 7(a) shows the relationship between the amount of absorbed
water at 8 d and the w/c for samples cured for 28 d. Because of thecontinued hydration of the LWA mixtures, they exhibit behavior ofa conventional mortar with a lower w/c. A “mortar equivalent w/c”
(i.e., the w/c of a mortar sample that would exhibit a similar absorp-tion to the absorption in the LWA mixtures) is shown in Fig. 7(a). The11.0% LWA mortar with w/c=0.30 has a performance similar to amortar with a w/c of 0.28, while the 23.7% LWA mixture exhibits aperformance equivalent to a mortar with w/c of 0.23.Fig. 7(b) shows the same data as Fig. 7(a), but now is used to
determine a “cement paste equivalent w/c”. The 55/0.30 mixture hasa performance similar to a paste sample with w/c of 0.37. The 11.0%LWA mortar has a performance similar to a paste with a w/c of 0.35,while the 23.7% LWA mixture exhibits a performance equivalent toa paste with w/c of 0.30. In general, a conventional mortar of a spe-cific w/c such as 0.30 exhibits a higher absorption per unit volume ofpaste than an equivalent cement paste, suggesting the porous andwell connected ITZs surrounding each NWA are contributing inincreased sorption relative to a plain paste where no such ITZs arepresent.
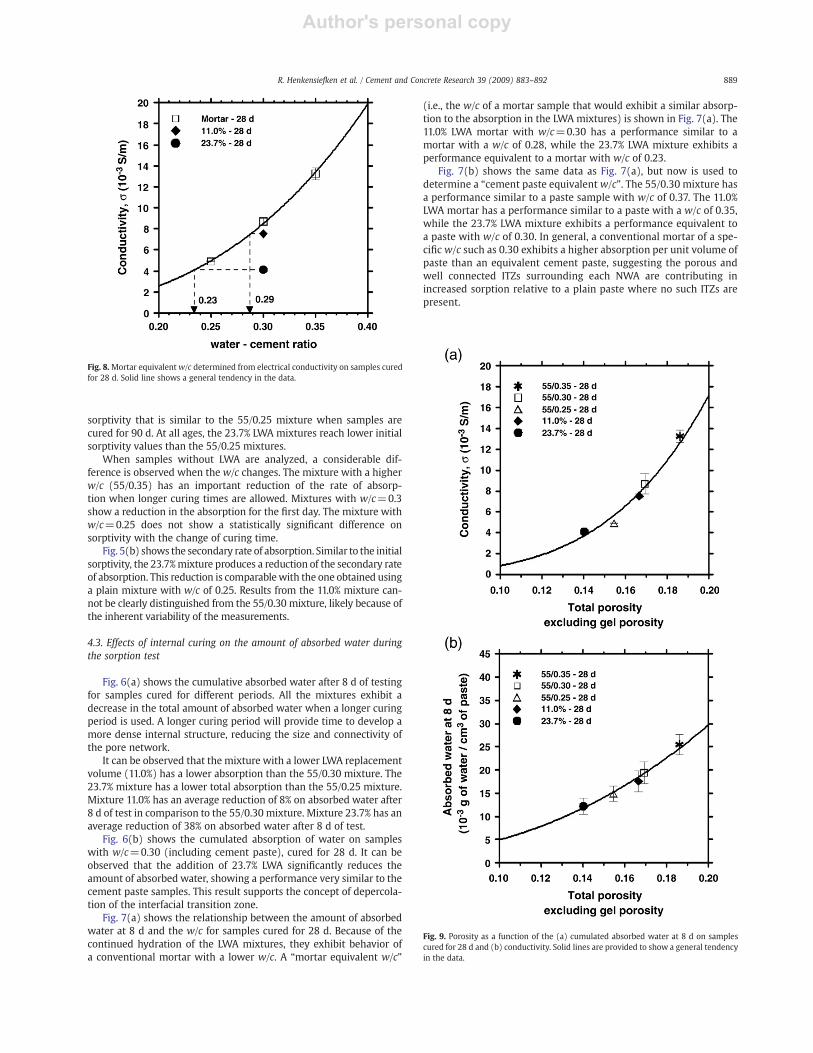
Fig. 9. Porosity as a function of the (a) cumulated absorbed water at 8 d on samplescured for 28 d and (b) conductivity. Solid lines are provided to show a general tendencyin the data.
Fig. 8.Mortar equivalentw/c determined from electrical conductivity on samples curedfor 28 d. Solid line shows a general tendency in the data.
889R. Henkensiefken et al. / Cement and Concrete Research 39 (2009) 883–892
Author's personal copy
4.4. Effects of internal curing on electrical conductivity properties
Fig. 8 shows the relationship between the electrical conductivityand the w/c for samples cured for 28 d. Similar to the results forabsorbed water, a “mortar equivalent w/c” was calculated. The 11.0%LWA mortar has a performance similar to a mortar of a w/c of 0.29,while the 23.7% LWA mixture exhibits a performance equivalent to amortar with w/c of 0.23, consistent with the sorptivity results fromFig. 7(a).Due to the continued hydration, the porosity of the LWA mixtures
will be reduced as compared to the plain mortar mixture. Fig. 9(a)shows the amount of absorbed water at 8 d for the samples cured for28 d as a function of the porosity (excluding the gel porosity) of themixtures. The conductivity is also plotted as a function of the porosityin Fig. 9(b), and a similar result is seen. Mixtures with 11.0% and 23.7%LWA have average conductivity reductions of 13% and 53%, respec-tively. Similar magnitude reductions have been observed for chlorideion diffusivity in mortars containing LWA [24].
4.5. Effects of available space on both sorptivity and total amount ofabsorbed water
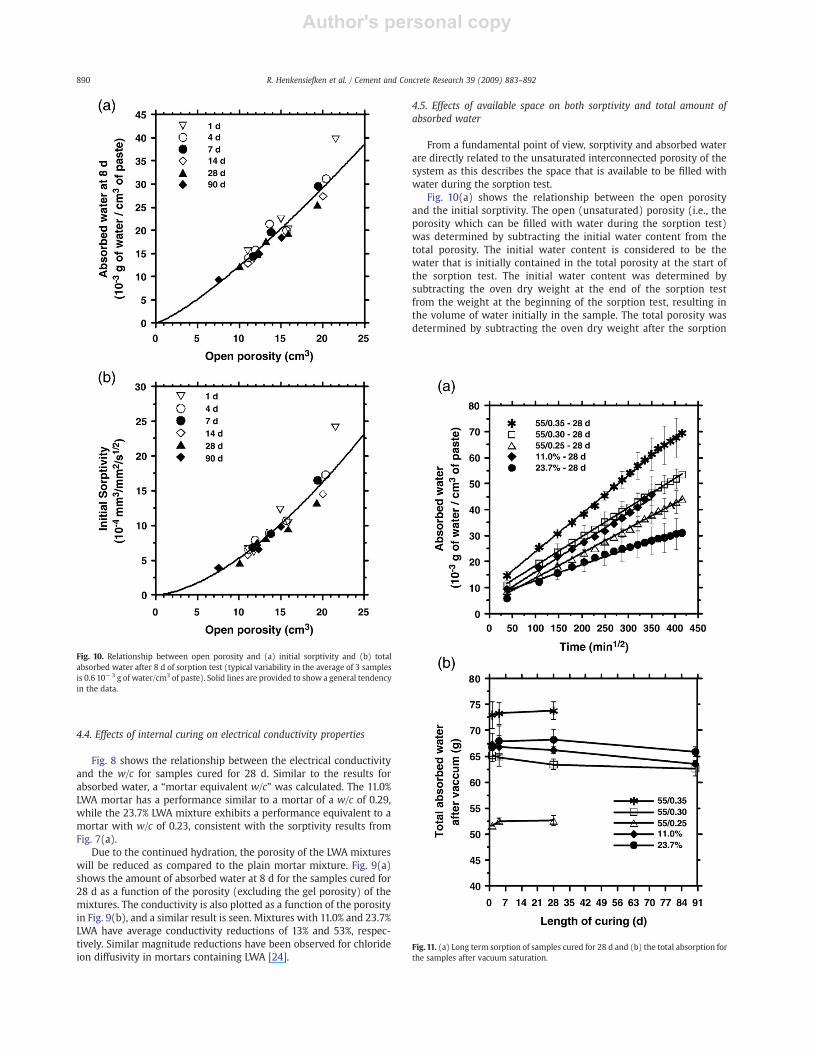
From a fundamental point of view, sorptivity and absorbed waterare directly related to the unsaturated interconnected porosity of thesystem as this describes the space that is available to be filled withwater during the sorption test.Fig. 10(a) shows the relationship between the open porosity
and the initial sorptivity. The open (unsaturated) porosity (i.e., theporosity which can be filled with water during the sorption test)was determined by subtracting the initial water content from thetotal porosity. The initial water content is considered to be thewater that is initially contained in the total porosity at the start ofthe sorption test. The initial water content was determined bysubtracting the oven dry weight at the end of the sorption testfrom the weight at the beginning of the sorption test, resulting inthe volume of water initially in the sample. The total porosity wasdetermined by subtracting the oven dry weight after the sorption
Fig. 10. Relationship between open porosity and (a) initial sorptivity and (b) totalabsorbed water after 8 d of sorption test (typical variability in the average of 3 samplesis 0.6 10−3 g of water/cm3 of paste). Solid lines are provided to show a general tendencyin the data.
Fig. 11. (a) Long term sorption of samples cured for 28 d and (b) the total absorption forthe samples after vacuum saturation.
890 R. Henkensiefken et al. / Cement and Concrete Research 39 (2009) 883–892
Author's personal copy
test from the vacuum saturated weight, resulting in the totalvolume of water (i.e. the total porosity) in the sample. From Fig. 10(a), it can be seen that the initial sorptivity is a function of theopen porosity of the system. Fig. 10(b) show the relationshipbetween the open porosity and the total absorbed water afterthe sorption test. A similar trend can be seen and it can be saidthat the amount of water absorbed is also a function of the openporosity.To observe the long term absorption, mixtures cured for 28 d
were monitored past the eight days suggested by ASTM C1585 andwere measured for 120 d, as shown in Fig. 11(a). This plot indicatesthat the mixtures will continue to absorb water for an extendedperiod of time. Because the LWA mixtures (11.0% and 23.7%) con-tinually show lower absorption than the plain mixture (55/0.30), itcan also be said that during the testing period, it does not appearthat the LWA re-saturates. However, under vacuum saturation, theLWA appears to re-saturate, as seen in Fig. 11(b), where the LWAmixtures (11.0% and 23.7%) have a higher total vacuum absorption.The LWA likely does not re-saturate during standard testing becauseof the improved ITZ, however it does re-saturate with a largepressure from the vacuum forcing water through the ITZ into thepores of the LWA. Even when resaturated, these mortars stillexhibited a significant reduction in conductivity, due to their overalldenser microstructure.
5. Conclusions
This paper has described the absorption behavior of mortars madewith SLWA. The inclusion of a sufficient volume of LWA can signifi-cantly reducewater absorption. A summary of the general conclusionsfrom the data presented in this paper are:
• The addition of LWA as an internal curing agent increases the degreeof hydration, producing a denser microstructure. The densermicrostructure results in less water absorption, less sorptivity anda decrease in the electrical conductivity of the samples.
• According to computermodeling results, the addition of LWA, whichhas a more dense ITZ due to continued hydration, as an internalcuring agent produces a systemwith less percolated normal weightaggregate ITZs that could provide a further reduction in sorptivity.
• From a sorptivity and conductivity perspective, the w/c=0.3mixture with 23.7% LWA performs better than the conventionalmortar mixture with a w/c=0.25. The average reduction using thismixture was 46% on initial sorptivity, 28% on secondary sorptivity,38% on absorbed water after 8 d of test, and 53% on electricalconductivity.
• A reduction in electrical conductivity was observed on vacuum-saturated specimens, indicating that the influences of increasedhydration and denser bulk and ITZ microstructures overwhelmthose of the increased water-filled porosity of the vacuum-saturatedLWA. Thus, isolated water-filled inclusions do not substantiallyincrease conductive/diffusive transport in a well-hydrated densemortar microstructure.
Acknowledgements
This work was supported in part by the Joint TransportationResearch Program administered by the Indiana Department ofTransportation and Purdue University (Project SPR 3211 and SPR3093). The contents of this paper reflect the views of the authors, whoare responsible for the facts and the accuracy of the data presentedherein, and do not necessarily reflect the official views or policies ofthe Federal Highway Administration and the Indiana Department ofTransportation, nor do the contents constitute a standard, specifica-tion, or regulation. The authors gratefully acknowledge supportreceived from the Center for Advanced Cement Based Materials as
well as material supplied by Northeast Solite Corporation andHydraulic Press Brick Company.
References
[1] FHWA, qCompilation and evaluation of results from high-performance concretebridge projects, volume 1: Final report,q FHWA-HRT05-056, 2006.
[2] S. Shah, S. Ahmad, High performance concretes and applications, Butterworth-Heinemann, 1994 416.
[3] A.S. El-Dieb, R.D. Hooton, Water-permeability measurement of high performanceconcrete using a high-pressure triaxial cell, Cement and Concrete Research 25 (6)(1995) 1199–1208.
[4] M.I. Khan, C.J. Lynsdale, Strength, permeability, and carbonation of high-performance concrete, Cement and Concrete Research 32 (1) (2002) 123–131.
[5] S. Shah, J. Weiss, High performance concrete: strength, permeability, andshrinkage cracking, Proceedings of the PCI/FHWA International Symposium onHigh Performance Concrete, 2000, pp. 331–340, Orlando, FL.
[6] O.M. Jensen, P.F. Hansen, Autogenous deformation and rh-change in perspective,Cement and Concrete Research 31 (12) (2001) 1859–1865.
[7] Lura, P., Autogenous deformation and internal curing, PhD Dissertation, TechnicalUniversity of Delft, The Netherlands, 2003, pp. 225.
[8] Mohr, B.J., Durability of pulp fiber-cement composites, PhD Dissertation, School ofCivil and Environmental Engineering, Georgia Institute of Technology, Atlanta, GA,2005, pp. 227.
[9] R. Henkensiefken, G. Sant, T. Nantung, J. Weiss, Detecting solidification usingmoisture transport from saturated lightweight agregate, in SP-259, TechnicalSession on Transition from Fluid to Solid: Reexamining the Behavior of Concrete atEarly Ages, ACI Spring Convention, San Antonio, TX, 2009, pp. 77–88.
[10] R. Henkensiefken, T. Nantung, D. Bentz, J. Weiss, Volume change and cracking ininternally cured mixtures made with saturated lightweight aggregate undersealed and unsealed conditions, Cement and Concrete Composites 31 (7) (2009)427–437.
[11] R. Henkensiefken, T. Nantung, J. Weiss, Reducing restrained shrinkage cracking inconcrete: examining the behavior of self-curing concrete made using differentvolumes of saturated lightweight aggregate, Proceedings of the Concrete BridgeConference, St. Louis, MO, 2008, pp. 1–14.
[12] B. Sabir, S. Wild, M. O'Farrell, A water sorptivity test for mortar and concrete,Materials and Structures 31 (8) (1998) 568–574.
[13] ASTM International, Standard test method for measurement of rate of absorptionof water by hydraulic-cement concretes, ASTM, 2004 C1585.
[14] N. Neithalath, Analysis of moisture transport in mortars and concrete usingsorption-diffusion approach, ACI Materials Journal 103 (3) (2006) 209–218.
[15] Yang, Z., Assessing cumulative damage in concrete and quantifying its influence onlife cycle performance modeling, PhD Dissertation, School of Civil Engineering,Purdue University, West Lafayette, 2004, pp. 245.
[16] D.P. Bentz, M.A. Ehlen, C.F. Ferraris, E.J. Garboczi, Sorptivity-based service lifepredictions for concrete pavements, Proceedings of the 7th InternationalConference on Concrete Pavements, Orlando, FL, 2001, pp. 181–193.
[17] H. La Chatelier, Sur les changements de volume qui accompagent le durcissementdes ciments, Bulletin Societe de l'encouragement pour l'industrie nationale, 1900,Paris, France.
[18] R.G. L'Hermite, Volume changes of concrete, 4th International Symposium on theChemistry of Cement, 1960, Washington D.C.
[19] G. Sant, P. Lura, J. Weiss, Measurement of volume change in cementitious materialsat early ages: review of testing protocols and interpretation of results,Transportation Research Record 1976 (2006) 21–29.
[20] J. Couch, P. Lura, O.M. Jensen, J. Weiss, Use of acoustic emission to detect cavitationand solidification (time zero) in cement pastes, International RILEM Conferenceon Volume Changes of Hardening Concrete: Testing and Mitigation, Lyngby,Denmark, 2006, pp. 393–400.
[21] A. Radlinska, F. Rajabipour, B. Bucher, R. Henkensiefken, G. Sant, J. Weiss, Shrinkagemitigation strategies in cementitious systems: a closer look at sealed and unsealedmaterial behavior, Transportation Research Record 2070 (2008) 59–67.
[22] D.P. Bentz, K.A. Snyder, Protected paste volume in concrete: extension to internalcuring using saturated lightweight fine aggregate, Cement and Concrete Research29 (11) (1999) 1863–1867.
[23] D.N. Winslow, M.D. Cohen, D.P. Bentz, K.A. Snyder, E.J. Garboczi, Percolation andpore structure in mortars and concrete, Cement and Concrete Research 24 (1)(1994) 25–37.
[24] D.P. Bentz, Influence of internal curing using lightweight aggregates on interfacialtransition zone percolation and chloride ingress in mortars, Cement and ConcreteComposites 31 (5) (2009) 285–289.
[25] M.H. Zhang, O.E. Gjørv, Microstructure of the interfacial zone between lightweightaggregate and cement paste, Cement and Concrete Research 20 (4) (1990)610–618.
[26] T.Y. Lo, H.Z. Cui, Effect of porous lightweight aggregate on strength of concrete,Materials Letters 58 (6) (2004) 916–919.
[27] D.P. Bentz, E.J. Garbozi, K.A. Snyder, A hard core/soft shell microstructural modelfor studying percolation and transport in three-dimensional composite media,NISTIR 6265, U.S., Department of Commerce, 1999.
[28] B. Lu, S. Torquato, Nearest-surface distribution functions for polydispersed particlesystems, Physical Review. A 45 (8) (1992) 5530.
[29] R. Chaube, T. Kishi, K. Maekawa, Modelling of concrete performance, Hydration,microstructure and mass transport, Taylor and Francis, London, 1999, p. 328.
891R. Henkensiefken et al. / Cement and Concrete Research 39 (2009) 883–892

Author's personal copy
[30] A. Elsharief, M.D. Cohen, J. Olek, Influence of lightweight aggregate on themicrostructure and durability of mortar, Cement and Concrete Research 35 (7)(2005) 1368–1376.
[31] ASTM International, Standard test method for density, relative density (specificgravity), and absorption of fine aggregate, ASTM, 2007 C128.
[32] ASTM International, Standard practice for making and curing concrete testspecimens in the laboratory, ASTM, 2006 C192.
[33] ASTM International, Standard practice for mechanical mixing of hydraulic cementpastes and mortars of plastic consistency, ASTM, 2006 C305.
[34] L. Greenspan, Humidity fixed points of binary saturated aqueous solutions, Journalof Research of the National Bureau of Standards — Physics and Chemistry 81A (1)(1977) 89–96.
[35] S.J. Ford, J.D. Shane, T.O. Mason, Assignment of features in impedance spectra ofthe cement-paste/steel system, Cement and Concrete Research 28 (12) (1998)1737–1751.
[36] W.J. Weiss, J.D. Shane, A. Mieses, T.O. Mason, S.P. Shah, Aspects of monitoringmoisture changes using electrical impedance spectroscopy, 2nd Symposium onSelf-Desiccation and Its Importance in Concrete Technology, Lund, Sweden, 1999,pp. 31–48.
[37] Personal Communication (2008), Thomas, M., J. Weiss, qUse of conductive gelq.
892 R. Henkensiefken et al. / Cement and Concrete Research 39 (2009) 883–892
Related Documents


