22 Oilfield Review Watching Rocks Change—Mechanical Earth Modeling Anwar Husen Akbar Ali Cairo, Egypt Tim Brown Marathon Oklahoma City, Oklahoma, USA Roger Delgado Pluspetrol Lima, Peru Don Lee Dick Plumb Nikolay Smirnov Houston, Texas, USA Rob Marsden Abu Dhabi, UAE Erling Prado-Velarde Al-Khobar, Saudi Arabia Lee Ramsey Sugar Land, Texas Dave Spooner BP Aberdeen, Scotland Terry Stone Abingdon, England Tim Stouffer Marathon Moscow, Russia For help in preparation of this article, thanks to Usman Ahmed, Karen Glaser and Eduard Siebrits, Sugar Land, Texas, USA; Tom Bratton, Pat Hooyman and Gemma Keaney, Houston, Texas; Jim Brown, BG Tunisia, Tunis, Tunisia; John Cook, Cambridge, England; Juan Pablo Cassenelli, Pluspetrol, Lima, Peru; Marcelo Frydman, Bogatá, Colombia; Alejandro Martin and Julio Palacio, Lima, Peru; Adrian Newton, Gatwick, England; Bill Rau, ChevronTexaco, New Orleans, Louisiana, USA; and Ken Russell and Kate Webb, Aberdeen, Scotland. Thanks also to Pluspetrol, Hunt Oil, SK Corporation and Tecpetrol for their contributions and release of the Camisea case. APWD (Annular Pressure While Drilling), CMR (Combinable Magnetic Resonance), DrillMAP, DSI (Dipole Shear Sonic Imager), ECLIPSE, FMI (Fullbore Formation MicroImager), FracCADE, MDT (Modular Formation Dynamics Tester), PowerDrive, PowerSTIM, RFT (Repeat Formation Tester), UBI (Ultrasonic Borehole Imager) and USI (UltraSonic Imager) are marks of Schlumberger. In many complex drilling, completion and exploitation operations today, failure to understand a field’s geomechanics represents an expensive risk. Developing a consistent mechanical earth model can mitigate that risk and provide benefit throughout the life of the field. The Earth is a stressful place. The science of geomechanics attempts to understand earth stresses, whether they are in a simple subsiding basin or at the intersection of colliding tectonic plates. A basic model might suffice in the first case, but complex tectonic settings and other situations encountered in the exploration and development of hydrocarbons require increasingly sophisticated geomechanical tools and models. Stresses on people often lead them to change their behavior or personality. Similarly, stresses in the Earth often change its features, sometimes creating conditions for hydrocarbon trapping. Salt diapirism creates traps where porous forma- tions abut impermeable salt; salt movement also creates complex stress fields. Tectonic plates col- lide, uplifting formations into mountain ranges, and also form conditions for hydrocarbon accu- mulation. The rapid deposition of sediment in places like the Gulf of Mexico generates pressure differentials that can result in shallow-water flows and deeper overpressured zones, both of which are hazards to drilling operations. 1 Understanding hazards generated by stresses in the Earth is important for safe and effective drilling and drives the development of geome- chanical models. Earth stresses also influence other aspects of reservoir evaluation and develop- ment. Stress magnitude and orientation affect fracture initiation and propagation. Weakly con- solidated formations may fail into the wellbore because of compressional stresses at the borehole wall—borehole breakout. Formation compress- ibility can be an important drive mechanism in weak reservoirs; the resulting subsidence can damage surface facilities and pipelines or decrease the gap between the bottom of an off- shore platform deck and the top of the highest waves, a potentially hazardous condition. These few examples illustrate the need for a coherent picture of earth stresses. Unfortunately, data obtained within a geographic area are often 1. Alsos T, Eide A, Astratti D, Pickering S, Benabentos M, Dutta N, Mallick S, Schultz G, den Boer L, Livingstone M, Nickel M, Sønneland L, Schlaf J, Schoepfer P, Sigismondi M, Soldo JC and Strønen LK: “Seismic Applications Throughout the Life of the Reservoir,” Oilfield Review 14, no. 2 (Summer 2002): 48–65. Carré G, Pradié E, Christie A, Delabroy L, Greeson B, Watson G, Fett D, Piedras J, Jenkins R, Schmidt D, Kolstad E, Stimatz G and Taylor G: “High Expectations from Deepwater Wells,” Oilfield Review 14, no. 4 (Winter 2002/2003): 36–51. 2. Andersen MA: Petroleum Research in North Sea Chalk. Stavanger, Norway: RF–Rogaland Research (1995): 142. 3. Andersen, reference 2: 1.

Welcome message from author
This document is posted to help you gain knowledge. Please leave a comment to let me know what you think about it! Share it to your friends and learn new things together.
Transcript
22 Oilfield Review
Watching Rocks Change—MechanicalEarth Modeling
Anwar Husen Akbar AliCairo, Egypt
Tim BrownMarathonOklahoma City, Oklahoma, USA
Roger DelgadoPluspetrolLima, Peru
Don LeeDick PlumbNikolay SmirnovHouston, Texas, USA
Rob MarsdenAbu Dhabi, UAE
Erling Prado-VelardeAl-Khobar, Saudi Arabia
Lee RamseySugar Land, Texas
Dave SpoonerBPAberdeen, Scotland
Terry StoneAbingdon, England
Tim StoufferMarathonMoscow, Russia
For help in preparation of this article, thanks to UsmanAhmed, Karen Glaser and Eduard Siebrits, Sugar Land,Texas, USA; Tom Bratton, Pat Hooyman and Gemma Keaney,Houston, Texas; Jim Brown, BG Tunisia, Tunis, Tunisia; John Cook, Cambridge, England; Juan Pablo Cassenelli,Pluspetrol, Lima, Peru; Marcelo Frydman, Bogatá,Colombia; Alejandro Martin and Julio Palacio, Lima, Peru;Adrian Newton, Gatwick, England; Bill Rau, ChevronTexaco,New Orleans, Louisiana, USA; and Ken Russell and Kate Webb, Aberdeen, Scotland. Thanks also to Pluspetrol,Hunt Oil, SK Corporation and Tecpetrol for their contributionsand release of the Camisea case.APWD (Annular Pressure While Drilling), CMR (CombinableMagnetic Resonance), DrillMAP, DSI (Dipole Shear SonicImager), ECLIPSE, FMI (Fullbore Formation MicroImager),FracCADE, MDT (Modular Formation Dynamics Tester),PowerDrive, PowerSTIM, RFT (Repeat Formation Tester),
UBI (Ultrasonic Borehole Imager) and USI (UltraSonicImager) are marks of Schlumberger.
In many complex drilling, completion and exploitation operations today, failure to
understand a field’s geomechanics represents an expensive risk. Developing a
consistent mechanical earth model can mitigate that risk and provide benefit
throughout the life of the field.
The Earth is a stressful place. The science ofgeomechanics attempts to understand earthstresses, whether they are in a simple subsidingbasin or at the intersection of colliding tectonicplates. A basic model might suffice in the firstcase, but complex tectonic settings and other situations encountered in the exploration anddevelopment of hydrocarbons require increasinglysophisticated geomechanical tools and models.
Stresses on people often lead them to changetheir behavior or personality. Similarly, stressesin the Earth often change its features, sometimescreating conditions for hydrocarbon trapping.Salt diapirism creates traps where porous forma-tions abut impermeable salt; salt movement alsocreates complex stress fields. Tectonic plates col-lide, uplifting formations into mountain ranges,and also form conditions for hydrocarbon accu-mulation. The rapid deposition of sediment inplaces like the Gulf of Mexico generates pressuredifferentials that can result in shallow-water
flows and deeper overpressured zones, both ofwhich are hazards to drilling operations.1
Understanding hazards generated by stressesin the Earth is important for safe and effectivedrilling and drives the development of geome-chanical models. Earth stresses also influenceother aspects of reservoir evaluation and develop-ment. Stress magnitude and orientation affectfracture initiation and propagation. Weakly con-solidated formations may fail into the wellborebecause of compressional stresses at the boreholewall—borehole breakout. Formation compress-ibility can be an important drive mechanism inweak reservoirs; the resulting subsidence candamage surface facilities and pipelines ordecrease the gap between the bottom of an off-shore platform deck and the top of the highestwaves, a potentially hazardous condition.
These few examples illustrate the need for acoherent picture of earth stresses. Unfortunately,data obtained within a geographic area are often
1. Alsos T, Eide A, Astratti D, Pickering S, Benabentos M,Dutta N, Mallick S, Schultz G, den Boer L, Livingstone M,Nickel M, Sønneland L, Schlaf J, Schoepfer P, Sigismondi M,Soldo JC and Strønen LK: “Seismic ApplicationsThroughout the Life of the Reservoir,” Oilfield Review 14,no. 2 (Summer 2002): 48–65.Carré G, Pradié E, Christie A, Delabroy L, Greeson B,Watson G, Fett D, Piedras J, Jenkins R, Schmidt D,Kolstad E, Stimatz G and Taylor G: “High Expectationsfrom Deepwater Wells,” Oilfield Review 14, no. 4 (Winter 2002/2003): 36–51.
2. Andersen MA: Petroleum Research in North Sea Chalk.Stavanger, Norway: RF–Rogaland Research (1995): 142.
3. Andersen, reference 2: 1.
Summer 2003 23
sparse and sometimes may even seem conflict-ing. In addition, stress conditions at a given wellmay differ significantly from conditions at offsetwells. Experts must be able to adjust the stressmodel to fit a specific location.
As complex as the state of stress can be at anyparticular place, drilling a borehole and extract-ing hydrocarbons make this state even morecomplex. Drilling and production activities alterthe local stresses, sometimes to the detriment ofreservoir-exploitation activities. Drilling removesmaterial from a formation, changing the near-well stresses. Drilling over- or underbalanced,respectively, increases or decreases formationpore pressure. These changes can make drillingmore difficult or easier, depending on local con-ditions, and it is important to know in advancewhich outcome is most likely. Increasing pres-sure in a wellbore can alter the local stresses somuch that the rock breaks. This can be good if itis a planned hydraulic fracture or bad if it gener-ates fluid losses while drilling. Productiondecreases pore pressure, which may result inpermeability decrease or formation compaction.These effects of depletion might not bereversible, even if the pore pressure increases asa result of water or gas injection.
Positive or negative results can be predictedmore reliably if the stress state is understood.Monitoring the state of stress while drilling isparticularly important in providing a measure oflocal rather than offset conditions. In addition,there often are gaps in the predrill data that con-tinuous recording of stress conditions can fill.Real-time stress measurement supplies key infor-mation for mitigating drilling risks. These dataare input into a mechanical earth model (MEM).
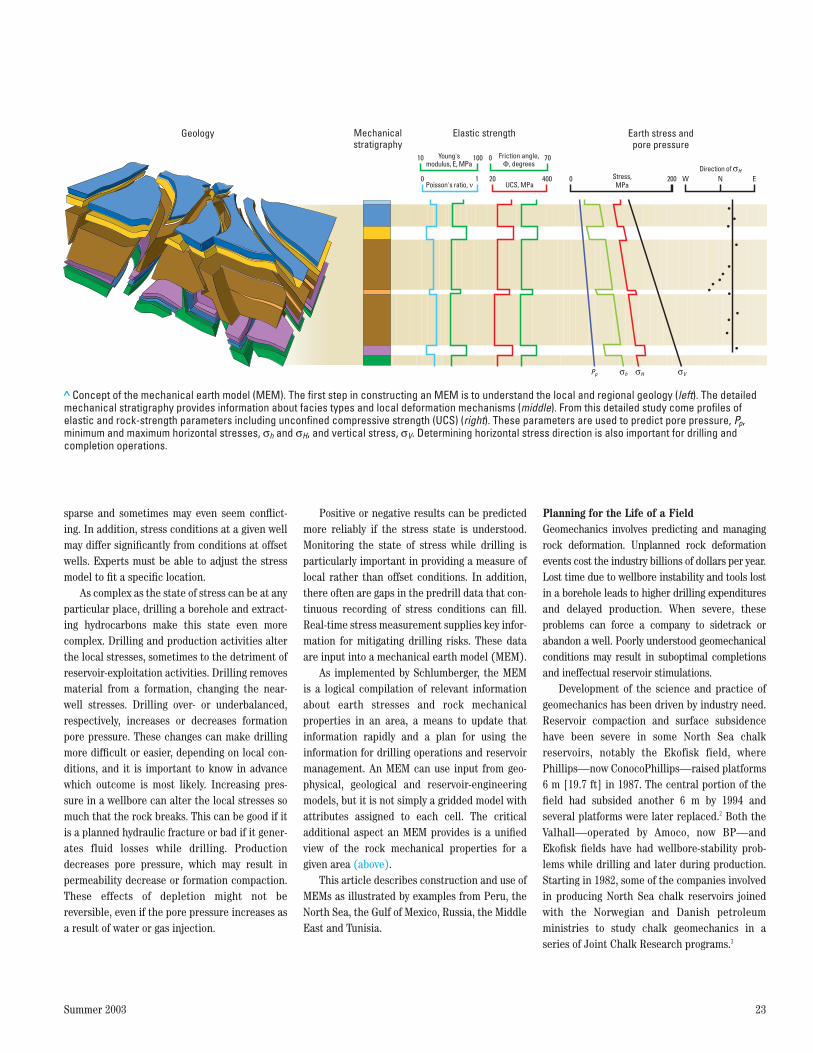
As implemented by Schlumberger, the MEMis a logical compilation of relevant informationabout earth stresses and rock mechanical properties in an area, a means to update thatinformation rapidly and a plan for using theinformation for drilling operations and reservoirmanagement. An MEM can use input from geo-physical, geological and reservoir-engineeringmodels, but it is not simply a gridded model withattributes assigned to each cell. The criticaladditional aspect an MEM provides is a unifiedview of the rock mechanical properties for agiven area (above).
This article describes construction and use ofMEMs as illustrated by examples from Peru, theNorth Sea, the Gulf of Mexico, Russia, the MiddleEast and Tunisia.
Planning for the Life of a FieldGeomechanics involves predicting and managingrock deformation. Unplanned rock deformationevents cost the industry billions of dollars per year.Lost time due to wellbore instability and tools lostin a borehole leads to higher drilling expendituresand delayed production. When severe, these problems can force a company to sidetrack orabandon a well. Poorly understood geomechanicalconditions may result in suboptimal completionsand ineffectual reservoir stimulations.
Development of the science and practice ofgeomechanics has been driven by industry need.Reservoir compaction and surface subsidencehave been severe in some North Sea chalk reservoirs, notably the Ekofisk field, wherePhillips—now ConocoPhillips—raised platforms6 m [19.7 ft] in 1987. The central portion of thefield had subsided another 6 m by 1994 and several platforms were later replaced.2 Both theValhall—operated by Amoco, now BP—andEkofisk fields have had wellbore-stability prob-lems while drilling and later during production.Starting in 1982, some of the companies involvedin producing North Sea chalk reservoirs joinedwith the Norwegian and Danish petroleum ministries to study chalk geomechanics in aseries of Joint Chalk Research programs.3
> Concept of the mechanical earth model (MEM). The first step in constructing an MEM is to understand the local and regional geology (left). The detailedmechanical stratigraphy provides information about facies types and local deformation mechanisms (middle). From this detailed study come profiles ofelastic and rock-strength parameters including unconfined compressive strength (UCS) (right). These parameters are used to predict pore pressure, Pp,minimum and maximum horizontal stresses, σh and σH, and vertical stress, σV. Determining horizontal stress direction is also important for drilling and completion operations.
Mechanicalstratigraphy
Elastic strengthGeology Earth stress and pore pressure
10
0 1
100Young's modulus, E, MPa
Stress,MPaPoisson's ratio, ν
20 400 0 200 W NDirection of σH
EUCS, MPa
0 70Friction angle,Φ, degrees
Pp σVσHσh
In the early 1990s, BP encountered severewellbore-stability problems in the Cusiana fieldin Colombia.4 Conventional approaches to solvingwellbore-stability problems were ineffective inthis field. A multicompany team of geoscientistsand engineers spent almost a year compiling sufficient geomechanical information to enablethem to improve drilling performance.Experience gained during this project ledSchlumberger experts to develop the concept ofa mechanical earth model.5 An MEM comprisespetrophysical and geomechanical data relatingto the state of a reservoir, its overburden and the nearby bounding layers, and, in addition, aunified understanding of that data.
Several MEM principles originated with theCusiana field study. First, all available datashould be used to develop the geomechanicalmodel of a field. The complexity of any data analysis must be balanced against available timeconstraints and the potential value of informa-tion gained. Three specific types of informationare of key importance: failure mechanisms, stateof stress and rock mechanical properties. Finally,real-time information to update the model, datamanagement and good communications are necessary for successful execution of the drillingprogram using an MEM.
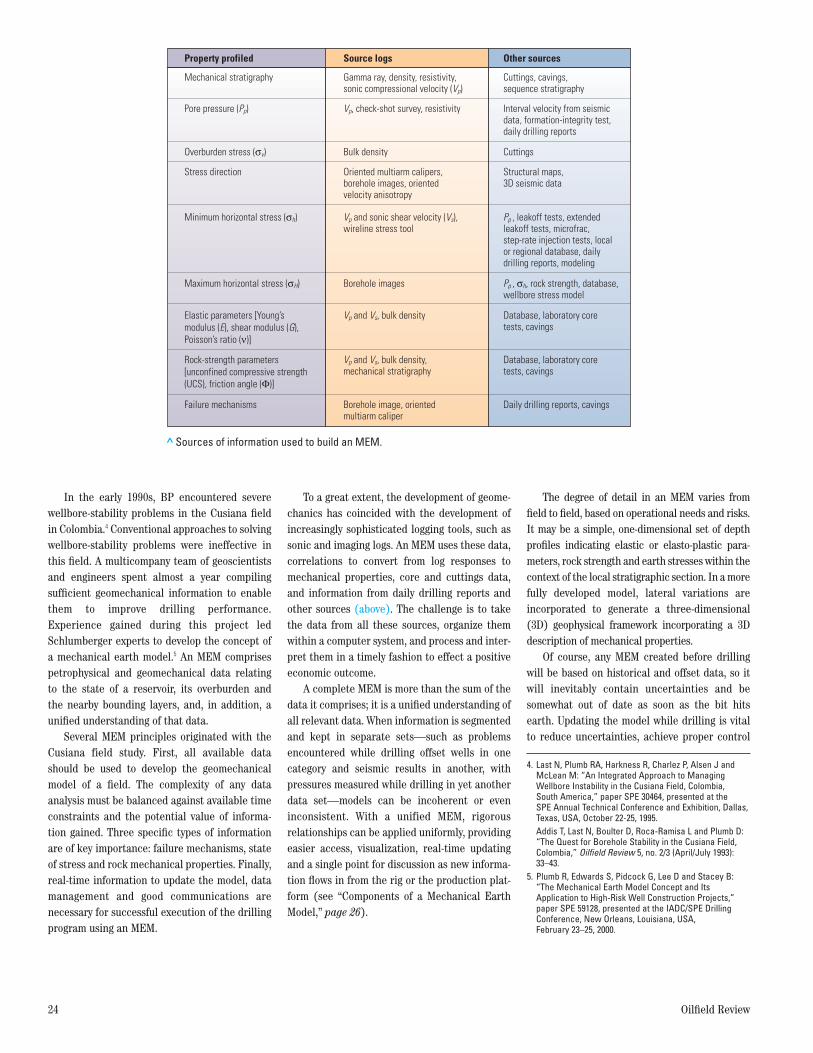
To a great extent, the development of geome-chanics has coincided with the development ofincreasingly sophisticated logging tools, such assonic and imaging logs. An MEM uses these data,correlations to convert from log responses tomechanical properties, core and cuttings data,and information from daily drilling reports andother sources (above). The challenge is to takethe data from all these sources, organize themwithin a computer system, and process and inter-pret them in a timely fashion to effect a positiveeconomic outcome.
A complete MEM is more than the sum of thedata it comprises; it is a unified understanding ofall relevant data. When information is segmentedand kept in separate sets—such as problemsencountered while drilling offset wells in onecategory and seismic results in another, withpressures measured while drilling in yet anotherdata set—models can be incoherent or eveninconsistent. With a unified MEM, rigorous relationships can be applied uniformly, providingeasier access, visualization, real-time updatingand a single point for discussion as new informa-tion flows in from the rig or the production plat-form (see “Components of a Mechanical EarthModel,” page 26).
The degree of detail in an MEM varies fromfield to field, based on operational needs and risks.It may be a simple, one-dimensional set of depthprofiles indicating elastic or elasto-plastic para-meters, rock strength and earth stresses within thecontext of the local stratigraphic section. In a morefully developed model, lateral variations are incorporated to generate a three-dimensional (3D) geophysical framework incorporating a 3Ddescription of mechanical properties.
Of course, any MEM created before drillingwill be based on historical and offset data, so itwill inevitably contain uncertainties and besomewhat out of date as soon as the bit hitsearth. Updating the model while drilling is vitalto reduce uncertainties, achieve proper control
24 Oilfield Review
4. Last N, Plumb RA, Harkness R, Charlez P, Alsen J andMcLean M: “An Integrated Approach to ManagingWellbore Instability in the Cusiana Field, Colombia, South America,” paper SPE 30464, presented at the SPE Annual Technical Conference and Exhibition, Dallas,Texas, USA, October 22-25, 1995. Addis T, Last N, Boulter D, Roca-Ramisa L and Plumb D:“The Quest for Borehole Stability in the Cusiana Field,Colombia,” Oilfield Review 5, no. 2/3 (April/July 1993):33–43.
5. Plumb R, Edwards S, Pidcock G, Lee D and Stacey B:“The Mechanical Earth Model Concept and ItsApplication to High-Risk Well Construction Projects,”paper SPE 59128, presented at the IADC/SPE DrillingConference, New Orleans, Louisiana, USA, February 23–25, 2000.
> Sources of information used to build an MEM.
Property profiled
Mechanical stratigraphy
Pore pressure (Pp)
Overburden stress (σv)
Minimum horizontal stress (σh)
Maximum horizontal stress (σH)
Elastic parameters [Young’smodulus (E), shear modulus (G),Poisson’s ratio (ν)]
Rock-strength parameters[unconfined compressive strength(UCS), friction angle (Φ)]
Failure mechanisms
Source logs
Gamma ray, density, resistivity,sonic compressional velocity (Vp)
Vp, check-shot survey, resistivity
Bulk density
Vp and sonic shear velocity (Vs),wireline stress tool
Borehole images
Vp and Vs, bulk density
Vp and Vs, bulk density,mechanical stratigraphy
Borehole image, orientedmultiarm caliper
Other sources
Cuttings, cavings,sequence stratigraphy
Interval velocity from seismicdata, formation-integrity test,daily drilling reports
Cuttings
Stress direction Oriented multiarm calipers,borehole images, orientedvelocity anisotropy
Structural maps,3D seismic data
Pp , leakoff tests, extendedleakoff tests, microfrac,step-rate injection tests, localor regional database, dailydrilling reports, modeling
Pp , σh, rock strength, database,wellbore stress model
Database, laboratory coretests, cavings
Database, laboratory coretests, cavings
Daily drilling reports, cavings
Summer 2003 25
of the drilling process and obtain superior resultsin subsequent development. An MEM can beupdated using newly acquired informationincluding logging-while-drilling (LWD) and measurements-while-drilling (MWD) data.
Small problems encountered while drillingcan become costly when decisions must be maderapidly based on insufficient and incompleteinformation. With an MEM in place, the team cananticipate potential trouble and check incomingdata for consistency with the model. When problems do occur, the team can make rapid,informed decisions and prevent minor occur-rences from becoming major problems.
Sometimes stress conditions indicate that awellbore should be stable, but field experienceshows it is not. In these cases, an MEM providesguidance for drilling-fluid selection. For example, if the instability is due to sensitive,expandable clays such as smectite, a drillingfluid compatible with this type of formationshould be used. Often, the wellbore instability isassociated with planes of weakness, such as bedding planes or small, centimeter-scale, pre-existing fractures, and a low-fluid-loss drillingfluid with crack-blocking additives is recommended. In some Gulf of Mexico fields, thesafe pressure window is so small that the gelstrength of the drilling fluid must be reduced toavoid fracturing a formation.
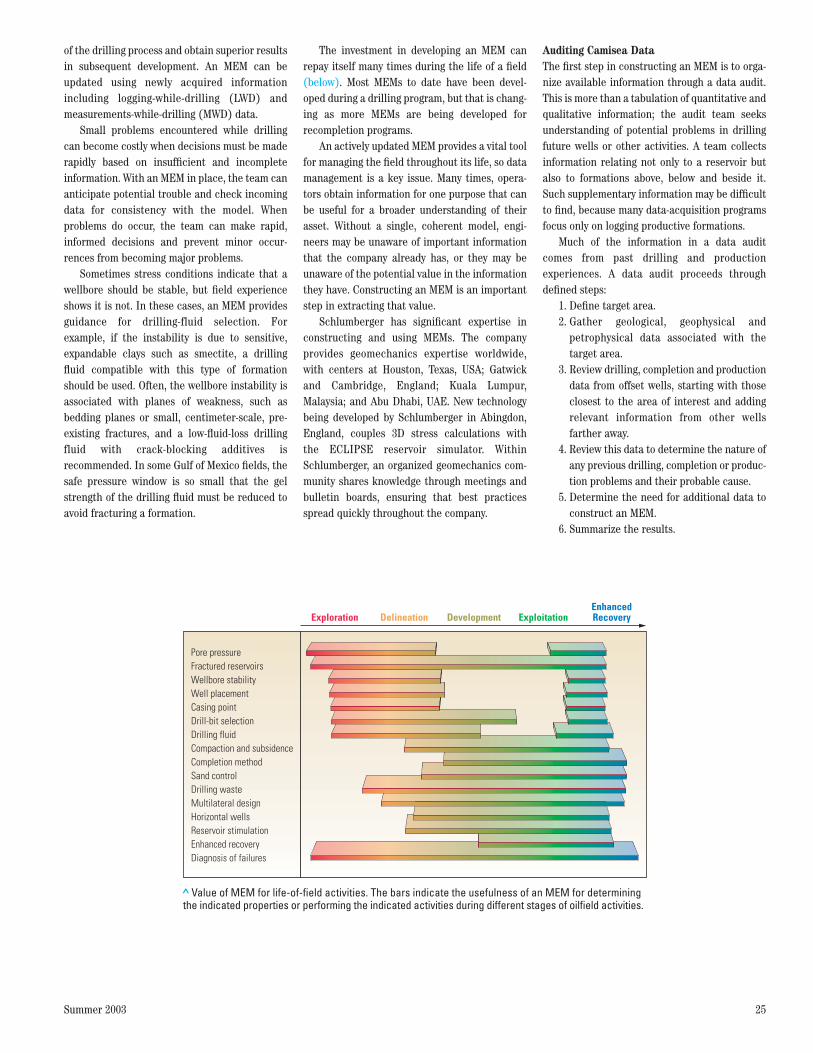
The investment in developing an MEM canrepay itself many times during the life of a field(below). Most MEMs to date have been devel-oped during a drilling program, but that is chang-ing as more MEMs are being developed forrecompletion programs.
An actively updated MEM provides a vital toolfor managing the field throughout its life, so datamanagement is a key issue. Many times, opera-tors obtain information for one purpose that canbe useful for a broader understanding of theirasset. Without a single, coherent model, engi-neers may be unaware of important informationthat the company already has, or they may beunaware of the potential value in the informationthey have. Constructing an MEM is an importantstep in extracting that value.
Schlumberger has significant expertise inconstructing and using MEMs. The company provides geomechanics expertise worldwide,with centers at Houston, Texas, USA; Gatwickand Cambridge, England; Kuala Lumpur,Malaysia; and Abu Dhabi, UAE. New technologybeing developed by Schlumberger in Abingdon,England, couples 3D stress calculations with the ECLIPSE reservoir simulator. WithinSchlumberger, an organized geomechanics com-munity shares knowledge through meetings andbulletin boards, ensuring that best practicesspread quickly throughout the company.
Auditing Camisea Data The first step in constructing an MEM is to orga-nize available information through a data audit.This is more than a tabulation of quantitative andqualitative information; the audit team seeksunderstanding of potential problems in drillingfuture wells or other activities. A team collectsinformation relating not only to a reservoir butalso to formations above, below and beside it.Such supplementary information may be difficultto find, because many data-acquisition programsfocus only on logging productive formations.
Much of the information in a data auditcomes from past drilling and production experiences. A data audit proceeds throughdefined steps:
1. Define target area.2. Gather geological, geophysical and
petrophysical data associated with the target area.
3. Review drilling, completion and productiondata from offset wells, starting with thoseclosest to the area of interest and addingrelevant information from other wells farther away.
4. Review this data to determine the nature ofany previous drilling, completion or produc-tion problems and their probable cause.
5. Determine the need for additional data toconstruct an MEM.
6. Summarize the results.
> Value of MEM for life-of-field activities. The bars indicate the usefulness of an MEM for determiningthe indicated properties or performing the indicated activities during different stages of oilfield activities.
Exploration Delineation Development ExploitationEnhancedRecovery
Pore pressureFractured reservoirsWellbore stabilityWell placementCasing pointDrill-bit selectionDrilling fluidCompaction and subsidenceCompletion methodSand controlDrilling wasteMultilateral designHorizontal wellsReservoir stimulationEnhanced recoveryDiagnosis of failures
26 Oilfield Review
Schlumberger spent several years develop-ing a process for constructing a mechanicalearth model (MEM). Although the detailsvary depending on the availability of dataand specific business needs for a given situa-tion, the methodology carries across a varietyof instances.
The first step in the method is to accumu-late and audit available data. All the relevantinformation is combined into a consistentframework, the MEM, that allows prediction ofgeomechanical properties—such as stresses,pore pressure and rock strength.
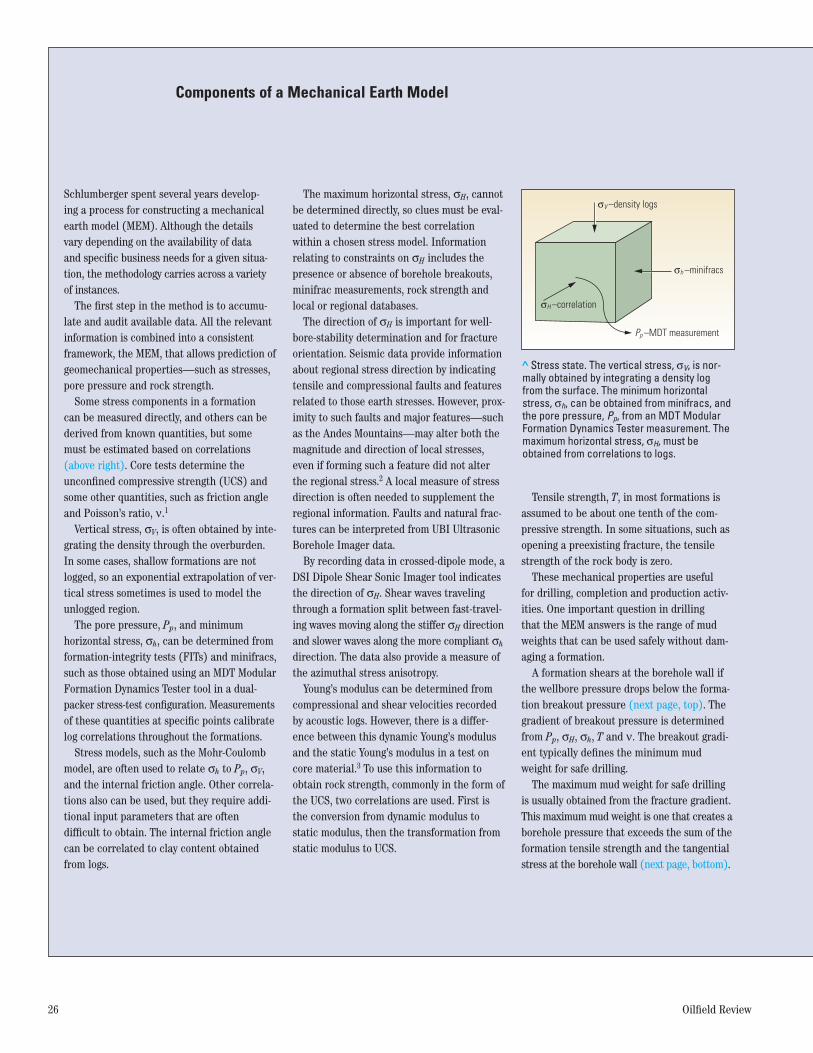
Some stress components in a formationcan be measured directly, and others can bederived from known quantities, but somemust be estimated based on correlations(above right). Core tests determine theunconfined compressive strength (UCS) andsome other quantities, such as friction angleand Poisson’s ratio, ν.1
Vertical stress, σV, is often obtained by inte-grating the density through the overburden.In some cases, shallow formations are notlogged, so an exponential extrapolation of ver-tical stress sometimes is used to model theunlogged region.
The pore pressure, Pp, and minimumhorizontal stress, σh, can be determined fromformation-integrity tests (FITs) and minifracs,such as those obtained using an MDT ModularFormation Dynamics Tester tool in a dual-packer stress-test configuration. Measurementsof these quantities at specific points calibratelog correlations throughout the formations.
Stress models, such as the Mohr-Coulombmodel, are often used to relate σh to Pp, σV,and the internal friction angle. Other correla-tions also can be used, but they require addi-tional input parameters that are oftendifficult to obtain. The internal friction anglecan be correlated to clay content obtainedfrom logs.
The maximum horizontal stress, σH, cannotbe determined directly, so clues must be eval-uated to determine the best correlationwithin a chosen stress model. Informationrelating to constraints on σH includes thepresence or absence of borehole breakouts,minifrac measurements, rock strength andlocal or regional databases.
The direction of σH is important for well-bore-stability determination and for fractureorientation. Seismic data provide informationabout regional stress direction by indicatingtensile and compressional faults and featuresrelated to those earth stresses. However, prox-imity to such faults and major features—suchas the Andes Mountains—may alter both themagnitude and direction of local stresses,even if forming such a feature did not alterthe regional stress.2 A local measure of stressdirection is often needed to supplement theregional information. Faults and natural frac-tures can be interpreted from UBI UltrasonicBorehole Imager data.
By recording data in crossed-dipole mode, aDSI Dipole Shear Sonic Imager tool indicatesthe direction of σH. Shear waves travelingthrough a formation split between fast-travel-ing waves moving along the stiffer σH directionand slower waves along the more compliant σh
direction. The data also provide a measure ofthe azimuthal stress anisotropy.
Young’s modulus can be determined fromcompressional and shear velocities recordedby acoustic logs. However, there is a differ-ence between this dynamic Young’s modulusand the static Young’s modulus in a test oncore material.3 To use this information toobtain rock strength, commonly in the form ofthe UCS, two correlations are used. First isthe conversion from dynamic modulus tostatic modulus, then the transformation fromstatic modulus to UCS.
Tensile strength, T, in most formations isassumed to be about one tenth of the com-pressive strength. In some situations, such asopening a preexisting fracture, the tensilestrength of the rock body is zero.
These mechanical properties are usefulfor drilling, completion and production activ-ities. One important question in drillingthat the MEM answers is the range of mudweights that can be used safely without dam-aging a formation.
A formation shears at the borehole wall ifthe wellbore pressure drops below the forma-tion breakout pressure (next page, top). Thegradient of breakout pressure is determinedfrom Pp, σH, σh, T and ν. The breakout gradi-ent typically defines the minimum mudweight for safe drilling.
The maximum mud weight for safe drillingis usually obtained from the fracture gradient.This maximum mud weight is one that creates aborehole pressure that exceeds the sum of theformation tensile strength and the tangentialstress at the borehole wall (next page, bottom).
Components of a Mechanical Earth Model
> Stress state. The vertical stress, σV, is nor-mally obtained by integrating a density logfrom the surface. The minimum horizontalstress, σh, can be obtained from minifracs, andthe pore pressure, Pp, from an MDT ModularFormation Dynamics Tester measurement. Themaximum horizontal stress, σH, must beobtained from correlations to logs.
σV –density logs
σh –minifracs
σH –correlation
Pp –MDT measurement
Summer 2003 27
A safe drilling window is the range of mudweights between the breakout pressure andthe fracture pressure, including a safety fac-tor when possible. Combining the breakoutand fracture gradients with the direction ofmaximum horizontal stress provides a keyinput for stability of deviated and horizontalwells. The most stable direction is usuallyalong the minimum horizontal stress direction.
With the stress gradients and formationproperties defined, the MEM is ready forgeomechanics experts to use to make predic-tions. A DrillMAP drilling management andprocess software plan, developed from theMEM, indicates the locations and types ofexpected risks, along with a means to miti-gate those risks. New information can becompared with predictions from the MEM.Anomalies between the new information andthe model provide opportunitiesfor improving the model and ultimately forimproving understanding of the field.
1. Unconfined compressive strength is the maximumvalue of axial compressive stress that a material canwithstand, under the condition of no confining stress.
2. For mathematical details of stress changes nearfaults: Jaeger JC and Cook NGW: Fundamentals ofRock Mechanics. London, England: Chapman and Hall,Ltd. and Science Paperbacks (1971): 400–434.
3. A dynamic modulus is derived from a traveling acous-tic wave with a frequency of a few kilohertz, perturb-ing the material at a constant stress. A static modulusis derived from laboratory tests performed atextremely low rates of stress change, but over a muchlarger stress range.
> Stress direction and borehole damage. Drilling-induced fractures can occuralong the maximum horizontal stress direction if the mud weight is too high.Borehole breakouts can occur in the minimum stress direction when the mudweight is too low.
Maximumhorizontalstress (σH)
Borehole breakout
Drilling-inducedfractures
σh
Borehole
Minimum horizontalstress (σh)
σH
> Schematic of breakout and fracturing gradients. The equivalent static den-sity (ESD) is greater than the mud weight (MW), due to cuttings in the mud andmud compressibility. The equivalent circulating density (ECD) also includesdynamic effects. Both ESD and ECD should stay within the safe window(green on bar). The illustrations indicate the type of failure possible withineach stress regime (top). The middle condition is a stable borehole. Moving tomud weights less than the minimum ESD (left), the formation can break outinto the wellbore in shear failure; if it drops below the pore pressure, well con-trol can be lost, a severe condition. At mud weights greater than the stablerange (right), ECD could exceed the minimum horizontal stress, generatingtensile damage in the formation; if it exceeds the fracture pressure, a fracturecan propagate into the formation.
MW
Porepressure
MinimumESD
Minimumhorizontal
stress
Fracturepressure
ECDESD
A data audit is primarily a data review andsummary, but it also identifies gaps in informa-tion needed to prepare an MEM. Missing datacan be highlighted and prioritized for collectionin the next drilling or data-collection program.
In many cases, consolidating information intoa 3D graphical format is the best way to appreci-ate the amount and quality of data available.Geophysical and geological interpretations,including locations of faults and formation tops,can be combined with qualitative or quantitativeinformation obtained from drilling reports andmud-log data. Problem zones and geologic eventlocations are easier to correlate when both typesof information are combined into one 3D display.
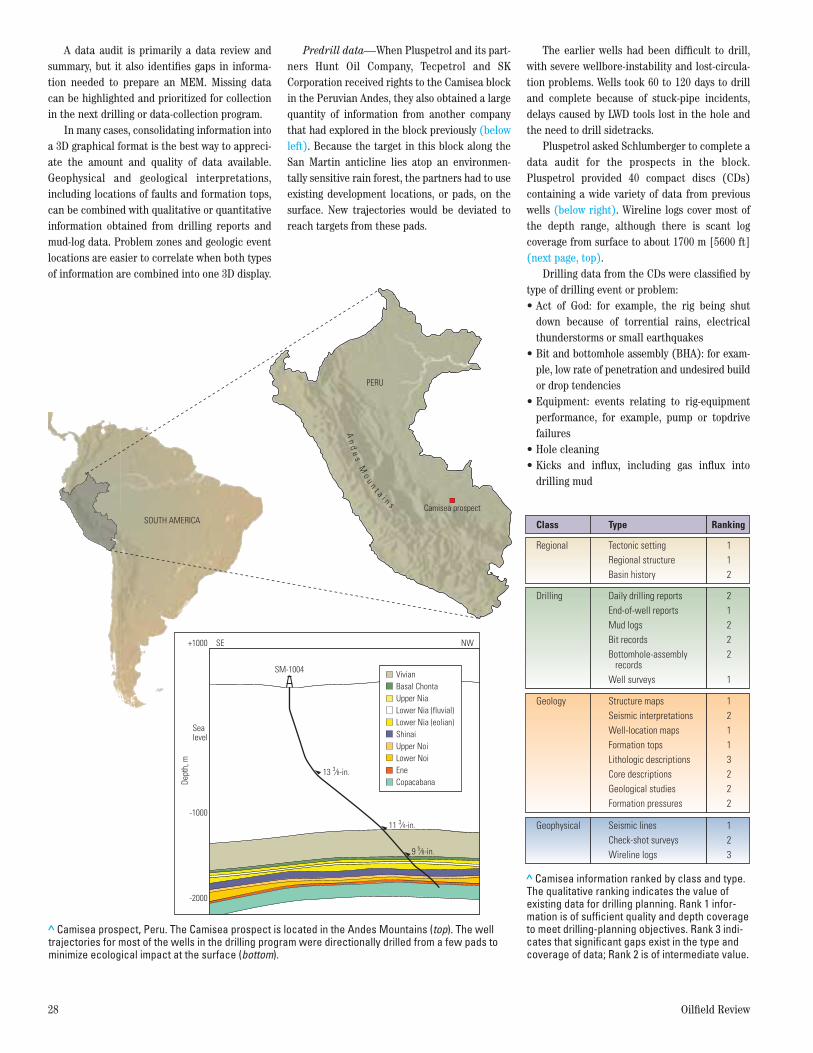
Predrill data—When Pluspetrol and its part-ners Hunt Oil Company, Tecpetrol and SKCorporation received rights to the Camisea blockin the Peruvian Andes, they also obtained a largequantity of information from another companythat had explored in the block previously (belowleft). Because the target in this block along theSan Martin anticline lies atop an environmen-tally sensitive rain forest, the partners had to useexisting development locations, or pads, on thesurface. New trajectories would be deviated toreach targets from these pads.
The earlier wells had been difficult to drill,with severe wellbore-instability and lost-circula-tion problems. Wells took 60 to 120 days to drilland complete because of stuck-pipe incidents,delays caused by LWD tools lost in the hole andthe need to drill sidetracks.
Pluspetrol asked Schlumberger to complete adata audit for the prospects in the block.Pluspetrol provided 40 compact discs (CDs) containing a wide variety of data from previouswells (below right). Wireline logs cover most ofthe depth range, although there is scant log coverage from surface to about 1700 m [5600 ft](next page, top).
Drilling data from the CDs were classified bytype of drilling event or problem:• Act of God: for example, the rig being shut
down because of torrential rains, electricalthunderstorms or small earthquakes
• Bit and bottomhole assembly (BHA): for exam-ple, low rate of penetration and undesired buildor drop tendencies
• Equipment: events relating to rig-equipmentperformance, for example, pump or topdrivefailures
• Hole cleaning • Kicks and influx, including gas influx into
drilling mud
28 Oilfield Review
> Camisea prospect, Peru. The Camisea prospect is located in the Andes Mountains (top). The welltrajectories for most of the wells in the drilling program were directionally drilled from a few pads tominimize ecological impact at the surface (bottom).
+1000
Sealevel
-1000
Dept
h, m
-2000
SE NW
SM-1004
13 3⁄8-in.
11 3⁄4-in.
9 5⁄8-in.
VivianBasal ChontaUpper NiaLower Nia (fluvial)Lower Nia (eolian)ShinaiUpper NoiLower NoiEneCopacabana
SOUTH AMERICA
PERU
Camisea prospect
An
de
sM
o u n t a i n s
9 5⁄8-in.
> Camisea information ranked by class and type.The qualitative ranking indicates the value ofexisting data for drilling planning. Rank 1 infor-mation is of sufficient quality and depth coverageto meet drilling-planning objectives. Rank 3 indi-cates that significant gaps exist in the type andcoverage of data; Rank 2 is of intermediate value.
Class Type Ranking
Regional Tectonic settingRegional structureBasin history
112
Drilling Daily drilling reportsEnd-of-well reportsMud logsBit recordsBottomhole-assembly recordsWell surveys
21222
1
Geology Structure mapsSeismic interpretationsWell-location mapsFormation topsLithologic descriptionsCore descriptionsGeological studiesFormation pressures
12113222
Geophysical Seismic linesCheck-shot surveysWireline logs
123
Summer 2003 29
• Downhole mud losses, typically losses greaterthan 10 bbl [1.6 m3] per incident
• Leakoff or formation-integrity tests • Stuck-pipe incidents• Tight-hole and wellbore-stability problems,
including excessive backreaming, reamingwhile tight in hole or packoffs.
The analysis indicated that tight hole andwellbore-stability problems caused more than athird of the events and occupied 36% of the non-productive time. Other major causes of drillingproblems included bit and BHA, equipment andstuck-pipe events.
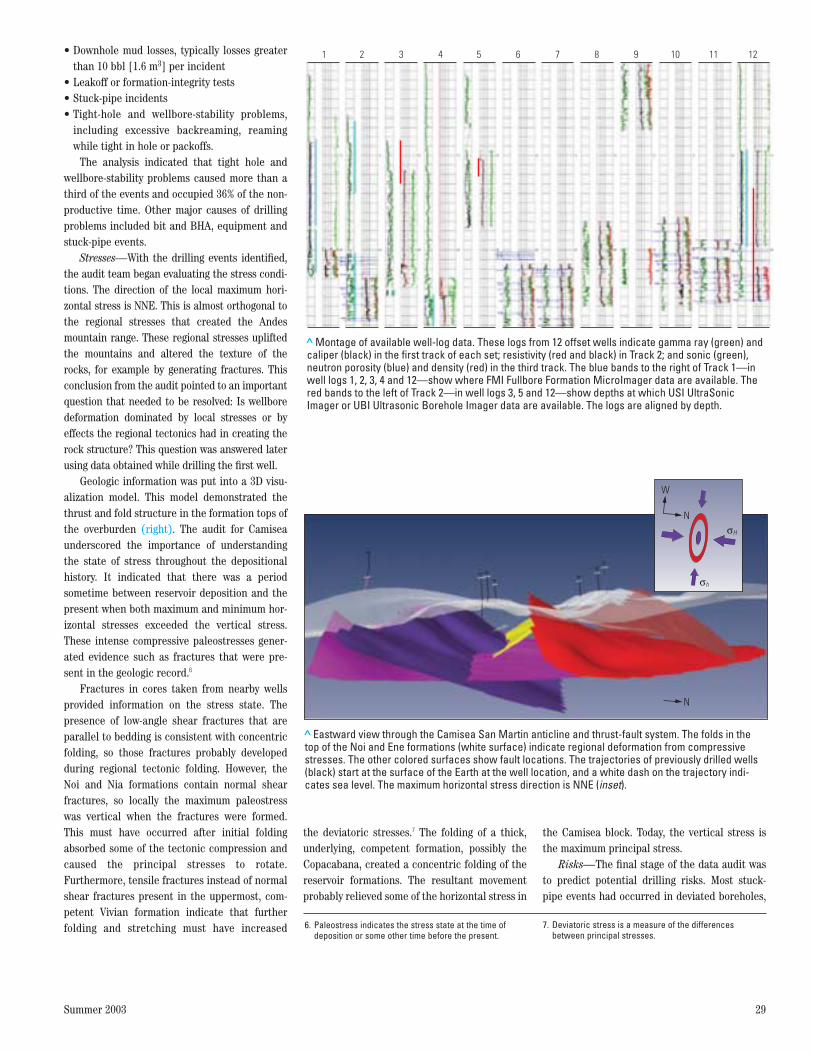
Stresses—With the drilling events identified,the audit team began evaluating the stress condi-tions. The direction of the local maximum hori-zontal stress is NNE. This is almost orthogonal tothe regional stresses that created the Andesmountain range. These regional stresses upliftedthe mountains and altered the texture of therocks, for example by generating fractures. Thisconclusion from the audit pointed to an importantquestion that needed to be resolved: Is wellboredeformation dominated by local stresses or byeffects the regional tectonics had in creating therock structure? This question was answered laterusing data obtained while drilling the first well.
Geologic information was put into a 3D visu-alization model. This model demonstrated thethrust and fold structure in the formation tops ofthe overburden (right). The audit for Camiseaunderscored the importance of understandingthe state of stress throughout the depositionalhistory. It indicated that there was a periodsometime between reservoir deposition and thepresent when both maximum and minimum hor-izontal stresses exceeded the vertical stress.These intense compressive paleostresses gener-ated evidence such as fractures that were pre-sent in the geologic record.6
Fractures in cores taken from nearby wellsprovided information on the stress state. Thepresence of low-angle shear fractures that areparallel to bedding is consistent with concentricfolding, so those fractures probably developedduring regional tectonic folding. However, theNoi and Nia formations contain normal shearfractures, so locally the maximum paleostresswas vertical when the fractures were formed.This must have occurred after initial foldingabsorbed some of the tectonic compression andcaused the principal stresses to rotate.Furthermore, tensile fractures instead of normalshear fractures present in the uppermost, com-petent Vivian formation indicate that furtherfolding and stretching must have increased
the deviatoric stresses.7 The folding of a thick,underlying, competent formation, possibly theCopacabana, created a concentric folding of thereservoir formations. The resultant movementprobably relieved some of the horizontal stress in
the Camisea block. Today, the vertical stress isthe maximum principal stress.
Risks—The final stage of the data audit wasto predict potential drilling risks. Most stuck-pipe events had occurred in deviated boreholes,
6. Paleostress indicates the stress state at the time ofdeposition or some other time before the present.
> Montage of available well-log data. These logs from 12 offset wells indicate gamma ray (green) andcaliper (black) in the first track of each set; resistivity (red and black) in Track 2; and sonic (green),neutron porosity (blue) and density (red) in the third track. The blue bands to the right of Track 1—inwell logs 1, 2, 3, 4 and 12—show where FMI Fullbore Formation MicroImager data are available. Thered bands to the left of Track 2—in well logs 3, 5 and 12—show depths at which USI UltraSonicImager or UBI Ultrasonic Borehole Imager data are available. The logs are aligned by depth.
1 2 3 4 5 6 7 8 9 10 11 12
> Eastward view through the Camisea San Martin anticline and thrust-fault system. The folds in thetop of the Noi and Ene formations (white surface) indicate regional deformation from compressivestresses. The other colored surfaces show fault locations. The trajectories of previously drilled wells(black) start at the surface of the Earth at the well location, and a white dash on the trajectory indi-cates sea level. The maximum horizontal stress direction is NNE (inset).
W
N
N
σH
σh
7. Deviatoric stress is a measure of the differencesbetween principal stresses.
which was significant because the planned boreholes would be deviated. However, previouswells with stuck-pipe problems were deviatedinto a direction almost parallel to the strike ofthe San Martin anticline, while the proposedwells would strike in directions either oblique ororthogonal to the anticlinal trend (above).
The proposed Camisea wells potentiallywould have more drilling risks than the previouswells. Pluspetrol authorized Schlumberger toconstruct an MEM for the Camisea prospects.This MEM included a DrillMAP plan that provided a forecast of probable risks—ranked for each drilling section—and their impact on drilling.8
Monte Carlo modeling helped identify thepotential variability in some of the quantitiesthat were poorly constrained by data from earlierwells. For example, modeling showed that theunconfined compressive strength (UCS) had thegreatest impact on predicting shear failure, butmeasurements of UCS were not in the auditeddata. After evaluating this Monte Carlo result,Pluspetrol determined UCS from tests on corefrom a previously drilled well.
A Schlumberger No Drilling Surprises (NDS)team and Pluspetrol used the MEM and DrillMAPresults to create a drilling plan.9 To improve bore-hole cleaning, Pluspetrol upgraded the drillmotor to a PowerDrive rotary steerable system.10
The team monitored drilling performance usingLWD and MWD systems.
Drilling—The NDS team updated the MEMand DrillMAP plans while drilling the first well inthe block, filling in data where the data audit indi-cated gaps. Information gathered while drilling thiswell confirmed the stress directions. The drillingdata from the new well provided the answer to thequestion about the influence of current localstresses and paleostresses. Borehole image analysisof breakouts showed that local stresses, rather thanremnant texture due to regional tectonics, domi-nated wellbore deformation.
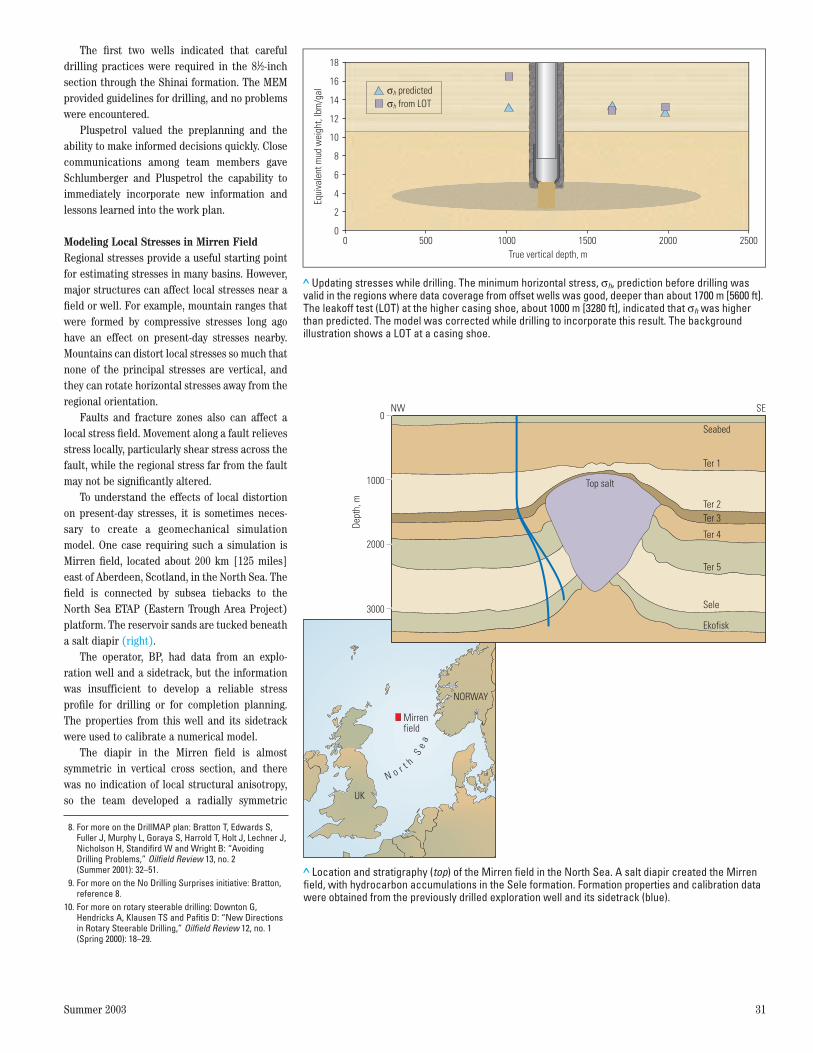
The previously predicted stress magnitudeswere close to the while-drilling observations inthe reservoir, but the model had to be adjusted inthe overburden, where minimal predrill data hadbeen available (next page, top).
The operator’s first well was completed in82 days without incident, five days fewer thanplanned. Pluspetrol was pleased with the results
of using the No Drilling Surprises approach, andcontinued working with Schlumberger on additional wells.
Drilling on the second well proceededuneventfully through the reactive clays in thelower Red Beds and casing was set successfully.The bit got stuck in a lower section, so the wellwas sidetracked to achieve total depth, which wasreached only three days behind schedule becauseof the preplanning provided with the MEM.
While drilling the third well, the NDS teamobserved an unusual formation-integrity test(FIT). This test, usually performed after settingand drilling through a casing shoe, provides a calibration for minimum horizontal stress. TheFIT behavior in the first pressure cycle was normal, but a second cycle had an abnormallyrapid pressure decline. To confirm a hypothesisthat the behavior was caused by natural frac-tures, the team modeled the FIT result in a frac-ture simulator using parameters available in theMEM. Understanding this phenomenon providedan explanation of losses that had occurred whilecementing and helped reduce the risk of lost cir-culation in deeper sections.
30 Oilfield Review
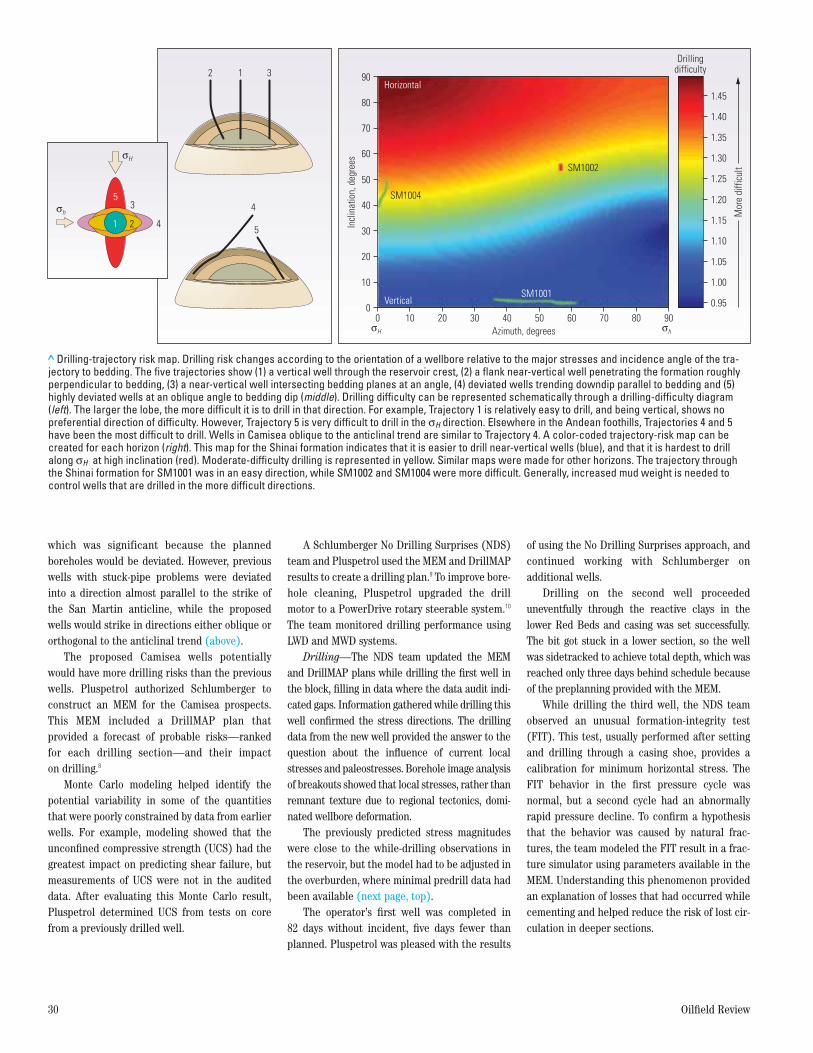
> Drilling-trajectory risk map. Drilling risk changes according to the orientation of a wellbore relative to the major stresses and incidence angle of the tra-jectory to bedding. The five trajectories show (1) a vertical well through the reservoir crest, (2) a flank near-vertical well penetrating the formation roughlyperpendicular to bedding, (3) a near-vertical well intersecting bedding planes at an angle, (4) deviated wells trending downdip parallel to bedding and (5)highly deviated wells at an oblique angle to bedding dip (middle). Drilling difficulty can be represented schematically through a drilling-difficulty diagram(left). The larger the lobe, the more difficult it is to drill in that direction. For example, Trajectory 1 is relatively easy to drill, and being vertical, shows nopreferential direction of difficulty. However, Trajectory 5 is very difficult to drill in the σH direction. Elsewhere in the Andean foothills, Trajectories 4 and 5have been the most difficult to drill. Wells in Camisea oblique to the anticlinal trend are similar to Trajectory 4. A color-coded trajectory-risk map can becreated for each horizon (right). This map for the Shinai formation indicates that it is easier to drill near-vertical wells (blue), and that it is hardest to drillalong σH at high inclination (red). Moderate-difficulty drilling is represented in yellow. Similar maps were made for other horizons. The trajectory throughthe Shinai formation for SM1001 was in an easy direction, while SM1002 and SM1004 were more difficult. Generally, increased mud weight is needed tocontrol wells that are drilled in the more difficult directions.
0.95
1.00
1.05
1.20
1.10
1.15
1.35
1.25
1.30
1.40
1.45
00
10
20
30
40
50
60
70
80
90
10 20 30 40Azimuth, degrees
Incl
inat
ion,
deg
rees
Vertical
Horizontal
Mor
e di
fficu
lt
Drillingdifficulty
50 60 70 80 90
SM1004
SM1002
SM1001
σH σh
2
4
5
31
σH
σh3
4
5
1 2
8. For more on the DrillMAP plan: Bratton T, Edwards S,Fuller J, Murphy L, Goraya S, Harrold T, Holt J, Lechner J,Nicholson H, Standifird W and Wright B: “AvoidingDrilling Problems,” Oilfield Review 13, no. 2 (Summer 2001): 32–51.
9. For more on the No Drilling Surprises initiative: Bratton,reference 8.
10. For more on rotary steerable drilling: Downton G,Hendricks A, Klausen TS and Pafitis D: “New Directionsin Rotary Steerable Drilling,” Oilfield Review 12, no. 1(Spring 2000): 18–29.
Summer 2003 31
The first two wells indicated that carefuldrilling practices were required in the 81⁄2-inchsection through the Shinai formation. The MEMprovided guidelines for drilling, and no problemswere encountered.
Pluspetrol valued the preplanning and theability to make informed decisions quickly. Closecommunications among team members gaveSchlumberger and Pluspetrol the capability toimmediately incorporate new information andlessons learned into the work plan.
Modeling Local Stresses in Mirren FieldRegional stresses provide a useful starting pointfor estimating stresses in many basins. However,major structures can affect local stresses near afield or well. For example, mountain ranges thatwere formed by compressive stresses long agohave an effect on present-day stresses nearby.Mountains can distort local stresses so much thatnone of the principal stresses are vertical, andthey can rotate horizontal stresses away from theregional orientation.
Faults and fracture zones also can affect alocal stress field. Movement along a fault relievesstress locally, particularly shear stress across thefault, while the regional stress far from the faultmay not be significantly altered.
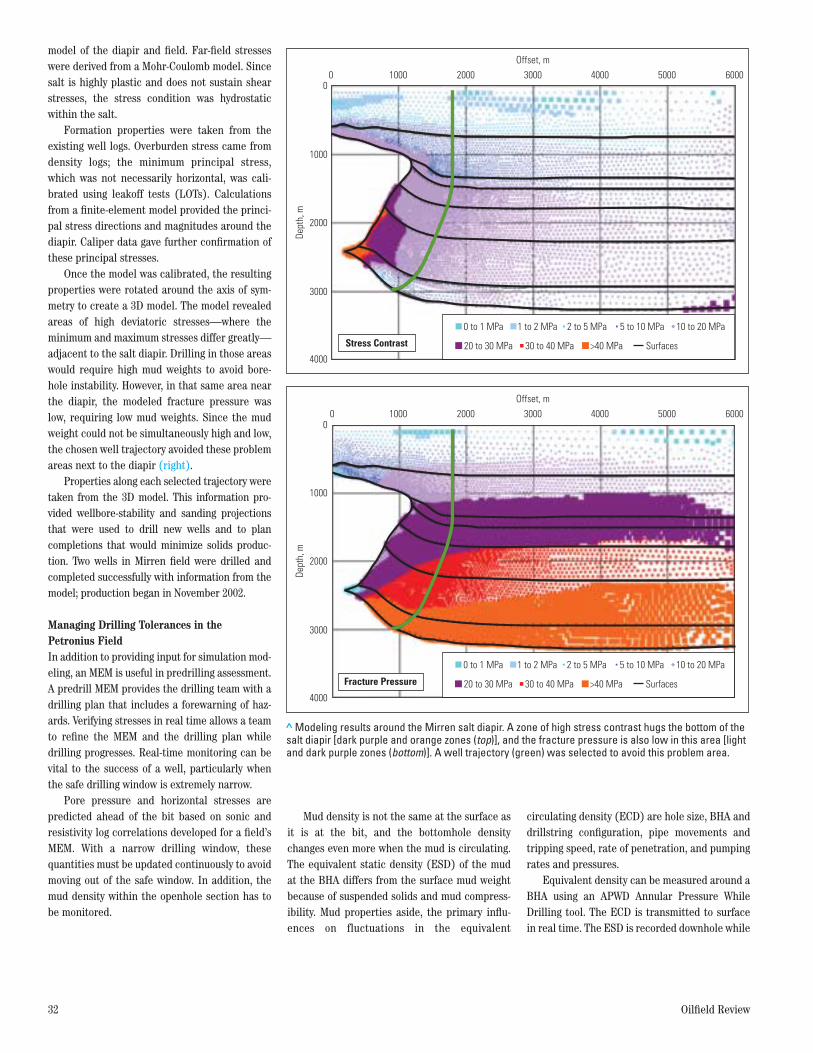
To understand the effects of local distortionon present-day stresses, it is sometimes neces-sary to create a geomechanical simulationmodel. One case requiring such a simulation isMirren field, located about 200 km [125 miles]east of Aberdeen, Scotland, in the North Sea. Thefield is connected by subsea tiebacks to theNorth Sea ETAP (Eastern Trough Area Project)platform. The reservoir sands are tucked beneatha salt diapir (right).
The operator, BP, had data from an explo-ration well and a sidetrack, but the informationwas insufficient to develop a reliable stress profile for drilling or for completion planning.The properties from this well and its sidetrackwere used to calibrate a numerical model.
The diapir in the Mirren field is almost symmetric in vertical cross section, and therewas no indication of local structural anisotropy,so the team developed a radially symmetric
> Updating stresses while drilling. The minimum horizontal stress, σh, prediction before drilling wasvalid in the regions where data coverage from offset wells was good, deeper than about 1700 m [5600 ft].The leakoff test (LOT) at the higher casing shoe, about 1000 m [3280 ft], indicated that σh was higherthan predicted. The model was corrected while drilling to incorporate this result. The backgroundillustration shows a LOT at a casing shoe.
Equi
vale
nt m
ud w
eigh
t, lb
m/g
al
0 500 1000True vertical depth, m
1500 2000 2500
18
16
14
12
10
8
6
4
2
0
σh predictedσh from LOT
UK
Mirrenfield
NORWAY
N o r t h
Se
a0
1000
NW SE
2000
Dept
h, m
3000
Top salt
Ter 1
Ter 2Ter 3
Ter 4
Ter 5
Sele
Ekofisk
Seabed
> Location and stratigraphy (top) of the Mirren field in the North Sea. A salt diapir created the Mirrenfield, with hydrocarbon accumulations in the Sele formation. Formation properties and calibration datawere obtained from the previously drilled exploration well and its sidetrack (blue).
model of the diapir and field. Far-field stresseswere derived from a Mohr-Coulomb model. Sincesalt is highly plastic and does not sustain shearstresses, the stress condition was hydrostaticwithin the salt.
Formation properties were taken from theexisting well logs. Overburden stress came fromdensity logs; the minimum principal stress,which was not necessarily horizontal, was cali-brated using leakoff tests (LOTs). Calculationsfrom a finite-element model provided the princi-pal stress directions and magnitudes around thediapir. Caliper data gave further confirmation ofthese principal stresses.
Once the model was calibrated, the resultingproperties were rotated around the axis of sym-metry to create a 3D model. The model revealedareas of high deviatoric stresses—where theminimum and maximum stresses differ greatly—adjacent to the salt diapir. Drilling in those areaswould require high mud weights to avoid bore-hole instability. However, in that same area nearthe diapir, the modeled fracture pressure waslow, requiring low mud weights. Since the mudweight could not be simultaneously high and low,the chosen well trajectory avoided these problemareas next to the diapir (right).
Properties along each selected trajectory weretaken from the 3D model. This information pro-vided wellbore-stability and sanding projectionsthat were used to drill new wells and to plan completions that would minimize solids produc-tion. Two wells in Mirren field were drilled andcompleted successfully with information from themodel; production began in November 2002.
Managing Drilling Tolerances in thePetronius FieldIn addition to providing input for simulation mod-eling, an MEM is useful in predrilling assessment.A predrill MEM provides the drilling team with adrilling plan that includes a forewarning of haz-ards. Verifying stresses in real time allows a teamto refine the MEM and the drilling plan whiledrilling progresses. Real-time monitoring can bevital to the success of a well, particularly whenthe safe drilling window is extremely narrow.
Pore pressure and horizontal stresses arepredicted ahead of the bit based on sonic andresistivity log correlations developed for a field’sMEM. With a narrow drilling window, these quantities must be updated continuously to avoidmoving out of the safe window. In addition, themud density within the openhole section has tobe monitored.
Mud density is not the same at the surface asit is at the bit, and the bottomhole densitychanges even more when the mud is circulating.The equivalent static density (ESD) of the mudat the BHA differs from the surface mud weightbecause of suspended solids and mud compress-ibility. Mud properties aside, the primary influ-ences on fluctuations in the equivalent
circulating density (ECD) are hole size, BHA anddrillstring configuration, pipe movements andtripping speed, rate of penetration, and pumpingrates and pressures.
Equivalent density can be measured around aBHA using an APWD Annular Pressure WhileDrilling tool. The ECD is transmitted to surfacein real time. The ESD is recorded downhole while
32 Oilfield Review
> Modeling results around the Mirren salt diapir. A zone of high stress contrast hugs the bottom of thesalt diapir [dark purple and orange zones (top)], and the fracture pressure is also low in this area [lightand dark purple zones (bottom)]. A well trajectory (green) was selected to avoid this problem area.
0
1000
0 1000 2000 3000Offset, m
Stress Contrast
Fracture Pressure
4000 5000 6000
0 1000 2000 3000Offset, m
4000 5000 6000
2000
Dept
h, m
3000
4000
0
1000
2000
Dept
h, m
3000
4000
0 to 1 MPa
20 to 30 MPa >40 MPa Surfaces30 to 40 MPa
1 to 2 MPa 2 to 5 MPa 5 to 10 MPa 10 to 20 MPa
0 to 1 MPa
20 to 30 MPa >40 MPa Surfaces30 to 40 MPa
1 to 2 MPa 2 to 5 MPa 5 to 10 MPa 10 to 20 MPa
Summer 2003 33
the mud is not circulating, and the minimum andmaximum ESD values are transmitted as soon acirculation begins again. When the safedrilling—or mud-weight—window becomessmaller than the difference between ESD andECD, normal drilling operations are likely tocause either fracturing or breakouts, or, in somecases, both types of failure in the same wellbore.
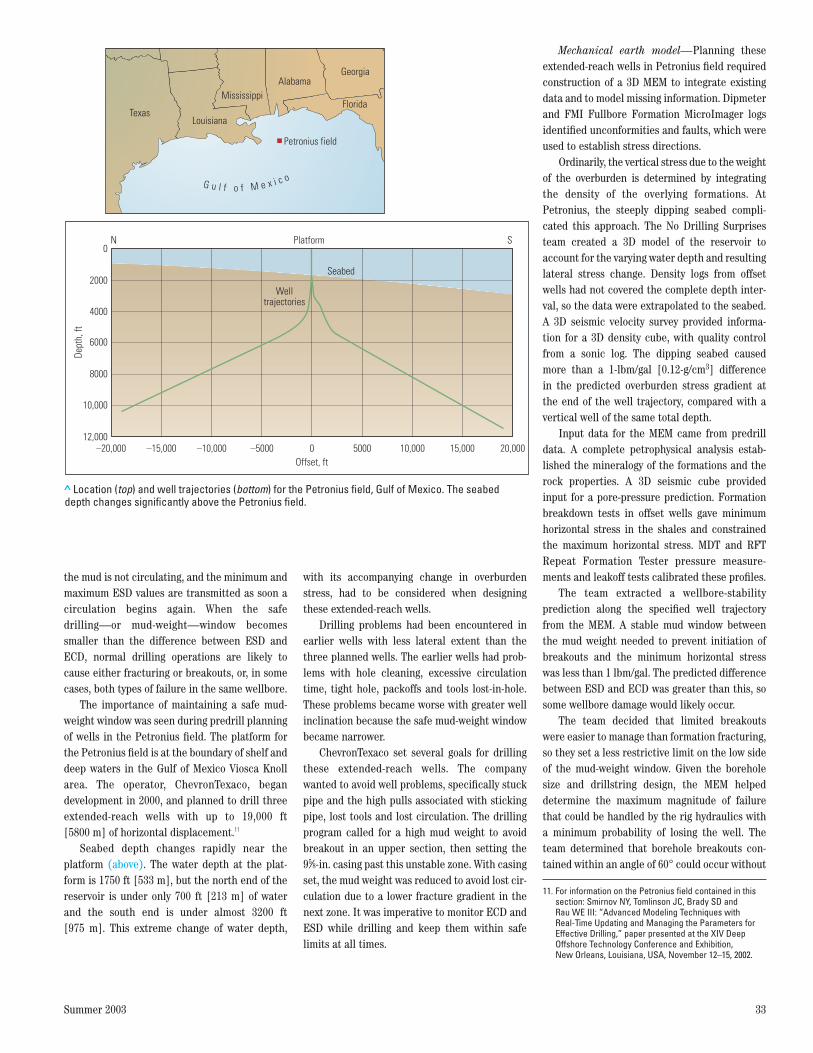
The importance of maintaining a safe mud-weight window was seen during predrill planningof wells in the Petronius field. The platform forthe Petronius field is at the boundary of shelf anddeep waters in the Gulf of Mexico Viosca Knollarea. The operator, ChevronTexaco, began development in 2000, and planned to drill threeextended-reach wells with up to 19,000 ft[5800 m] of horizontal displacement.11
Seabed depth changes rapidly near the platform (above). The water depth at the plat-form is 1750 ft [533 m], but the north end of thereservoir is under only 700 ft [213 m] of waterand the south end is under almost 3200 ft[975 m]. This extreme change of water depth,
with its accompanying change in overburdenstress, had to be considered when designingthese extended-reach wells.
Drilling problems had been encountered inearlier wells with less lateral extent than thethree planned wells. The earlier wells had prob-lems with hole cleaning, excessive circulationtime, tight hole, packoffs and tools lost-in-hole.These problems became worse with greater wellinclination because the safe mud-weight windowbecame narrower.
ChevronTexaco set several goals for drillingthese extended-reach wells. The companywanted to avoid well problems, specifically stuckpipe and the high pulls associated with stickingpipe, lost tools and lost circulation. The drillingprogram called for a high mud weight to avoidbreakout in an upper section, then setting the95⁄8-in. casing past this unstable zone. With casingset, the mud weight was reduced to avoid lost cir-culation due to a lower fracture gradient in thenext zone. It was imperative to monitor ECD andESD while drilling and keep them within safelimits at all times.
Mechanical earth model—Planning theseextended-reach wells in Petronius field requiredconstruction of a 3D MEM to integrate existingdata and to model missing information. Dipmeterand FMI Fullbore Formation MicroImager logsidentified unconformities and faults, which wereused to establish stress directions.
Ordinarily, the vertical stress due to the weightof the overburden is determined by integratingthe density of the overlying formations. AtPetronius, the steeply dipping seabed compli-cated this approach. The No Drilling Surprisesteam created a 3D model of the reservoir toaccount for the varying water depth and resultinglateral stress change. Density logs from offsetwells had not covered the complete depth inter-val, so the data were extrapolated to the seabed.A 3D seismic velocity survey provided informa-tion for a 3D density cube, with quality controlfrom a sonic log. The dipping seabed causedmore than a 1-lbm/gal [0.12-g/cm3] difference in the predicted overburden stress gradient atthe end of the well trajectory, compared with avertical well of the same total depth.
Input data for the MEM came from predrilldata. A complete petrophysical analysis estab-lished the mineralogy of the formations and therock properties. A 3D seismic cube providedinput for a pore-pressure prediction. Formationbreakdown tests in offset wells gave minimumhorizontal stress in the shales and constrainedthe maximum horizontal stress. MDT and RFTRepeat Formation Tester pressure measure-ments and leakoff tests calibrated these profiles.
The team extracted a wellbore-stability prediction along the specified well trajectoryfrom the MEM. A stable mud window betweenthe mud weight needed to prevent initiation ofbreakouts and the minimum horizontal stresswas less than 1 lbm/gal. The predicted differencebetween ESD and ECD was greater than this, sosome wellbore damage would likely occur.
The team decided that limited breakoutswere easier to manage than formation fracturing,so they set a less restrictive limit on the low sideof the mud-weight window. Given the boreholesize and drillstring design, the MEM helpeddetermine the maximum magnitude of failurethat could be handled by the rig hydraulics witha minimum probability of losing the well. Theteam determined that borehole breakouts con-tained within an angle of 60° could occur without
11. For information on the Petronius field contained in thissection: Smirnov NY, Tomlinson JC, Brady SD and Rau WE III: “Advanced Modeling Techniques with Real-Time Updating and Managing the Parameters forEffective Drilling,” paper presented at the XIV DeepOffshore Technology Conference and Exhibition, New Orleans, Louisiana, USA, November 12–15, 2002.
> Location (top) and well trajectories (bottom) for the Petronius field, Gulf of Mexico. The seabeddepth changes significantly above the Petronius field.
TexasLouisiana
Mississippi
Petronius field
Alabama
Florida
Georgia
G u l f o f M e x i c o
12,000
10,000
8000
6000
Dept
h, ft
–20,000 –15,000 –10,000 –5000
PlatformN S
0Offset, ft
5000 10,000 15,000 20,000
4000
2000
0
Welltrajectories
Seabed
impacting borehole cleaning and well integrity,so this was the design criterion for the mudweight (above). However, the conditions had tobe monitored carefully. Once borehole-wall fail-ure initiated, there was no way to predict howthe breakout would behave. Failure would likelyworsen with time as the stress conditionremained outside the safe condition. The ECDand ESD were monitored carefully while drilling.
A model of the drilling mechanics indicatedthat a PowerDrive PD900 rotary steerable systemimproved borehole cleaning and permitted flowwith less pressure drop in the tool than a downhole drilling motor. The wellbore-stabilityanalysis predicted the ECD and annular
velocities necessary to optimize hole cleaning. Acomplete drillstring stress analysis establishedoperating limits to avoid failure and eliminatepotential downtime.12
The lessons learned and good practices discovered during predrill preparations werecaptured in the MEM database. Using root-causeanalysis, the team developed preventive andremedial actions for potential events.
Drilling—With a plan in place, drillingbegan in 2002. Engineers at the rig site continu-ously monitored drilling operations and real-timelogging, including gamma ray, resistivity, sonic,density and neutron porosity logs. A multidisci-plinary team onshore gave 24-hour support.
Borehole cleaning was critical. The ECD issensitive to borehole condition, and, in this case,the margin between collapsing and fracturingthe formation was narrow. Stress calibrationrequired monitoring of ECD to within 0.1 lbm/gal[0.012 g/cm3], as well as calibrations of the pre-dicted gradients from formation-integrity, leakoffand extended leakoff tests. Conventional holecleaning by bottoms-up circulation to surfaceyielded few cavings from breakouts. However, by logging the drilling mechanics conditions—such as torque and drag—the likelihood of generating cavings larger than drilling cuttingswas monitored.
34 Oilfield Review
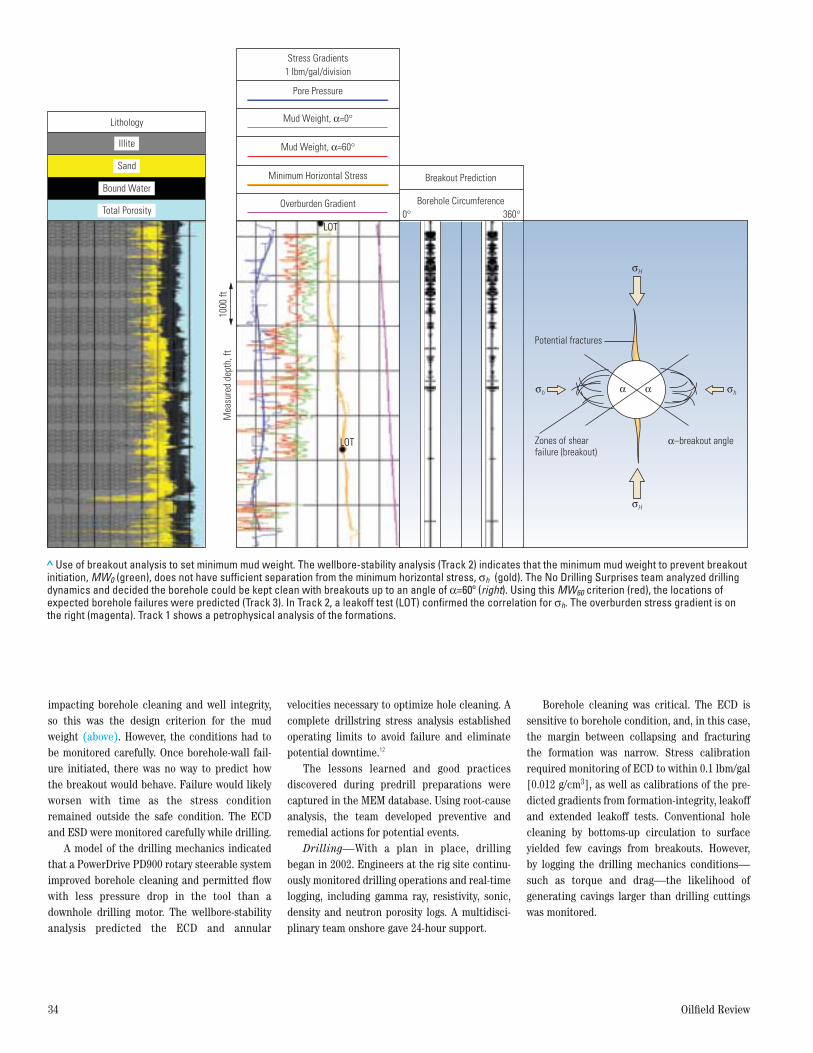
> Use of breakout analysis to set minimum mud weight. The wellbore-stability analysis (Track 2) indicates that the minimum mud weight to prevent breakoutinitiation, MW0 (green), does not have sufficient separation from the minimum horizontal stress, σh (gold). The No Drilling Surprises team analyzed drillingdynamics and decided the borehole could be kept clean with breakouts up to an angle of α=60º (right). Using this MW60 criterion (red), the locations ofexpected borehole failures were predicted (Track 3). In Track 2, a leakoff test (LOT) confirmed the correlation for σh. The overburden stress gradient is onthe right (magenta). Track 1 shows a petrophysical analysis of the formations.
σh σh
σH
σH
Potential fractures
Zones of shearfailure (breakout)
α α
α–breakout angle
Mea
sure
d de
pth,
ft10
00 ft
LOT
LOT
Lithology
Total Porosity
Bound Water
Overburden Gradient Borehole Circumference0° 360°
Sand
Illite
Minimum Horizontal Stress
Mud Weight, α=60°
Mud Weight, α=0°
Pore Pressure
1 lbm/gal/divisionStress Gradients
Breakout Prediction
Summer 2003 35
Special hole-cleaning and tripping proce-dures provided a mechanical action to removelarger cavings. Circulation time was increasedbefore pulling the drillpipe out of the boreholewhen drilling reached the casing-shoe depth, theborehole bottom and at certain critical inclina-tion angles. Caving material reached the shaleshakers after several full circulations, when normal drilling cuttings were no longer cyclingonto the shakers, and cavings continued to makeit to surface for several hours.
The acceptable mud-weight window was sonarrow that the possibility of fracturing the for-mation remained. The drilling team saw someborehole ballooning followed by mud losses.Fractures in this interval were located by analyz-ing time-lapse MWD resistivity logs acquiredwhile drilling and again while pulling out of theborehole.13 The drilling team treated the frac-tures with loss-control material and lowered themud weight to an acceptable level based on thereal-time MEM.
Analysis indicated minimum horizontal stressgradient in the sand bodies was 0.3 lbm/gal[0.035 g/cm3] less than that of the shales, so themodel was updated to account for this lithologicdifference in strength properties.
Full-time monitoring of the wells, coupledwith an MEM that allowed an understanding of unwanted events, resulted in three wells successfully reaching total depth. There were nostuck-pipe incidents, tools lost-in-hole or side-tracks. The minor fluid losses encountered weremanaged successfully. All targets were reached;all the casing strings landed at the planneddepth. On average, the total time savings on constructing these three wells was 15%.Considering only the time spent drilling, the savings was about 45% compared with thePetronius predrill plan.
Controlling Sand Production The MEM also plays a role in controlling sand production that is often seen in weak and uncon-solidated formations. Sand moving in the flowstream erodes tubulars and can damage surfaceand subsurface equipment. Preventing sand pro-duction at the formation face is often the bestapproach to minimize this damage, using eitheroriented perforating or screenless completions.14
In some situations, indirect vertical fracturing(IVF) provides sand control by perforating into acompetent zone and fracturing into an adjacent,less competent productive zone.15 The properapplication of IVF requires a detailed understand-ing of formation lithology and geomechanicalproperties, which can be obtained from an MEM.
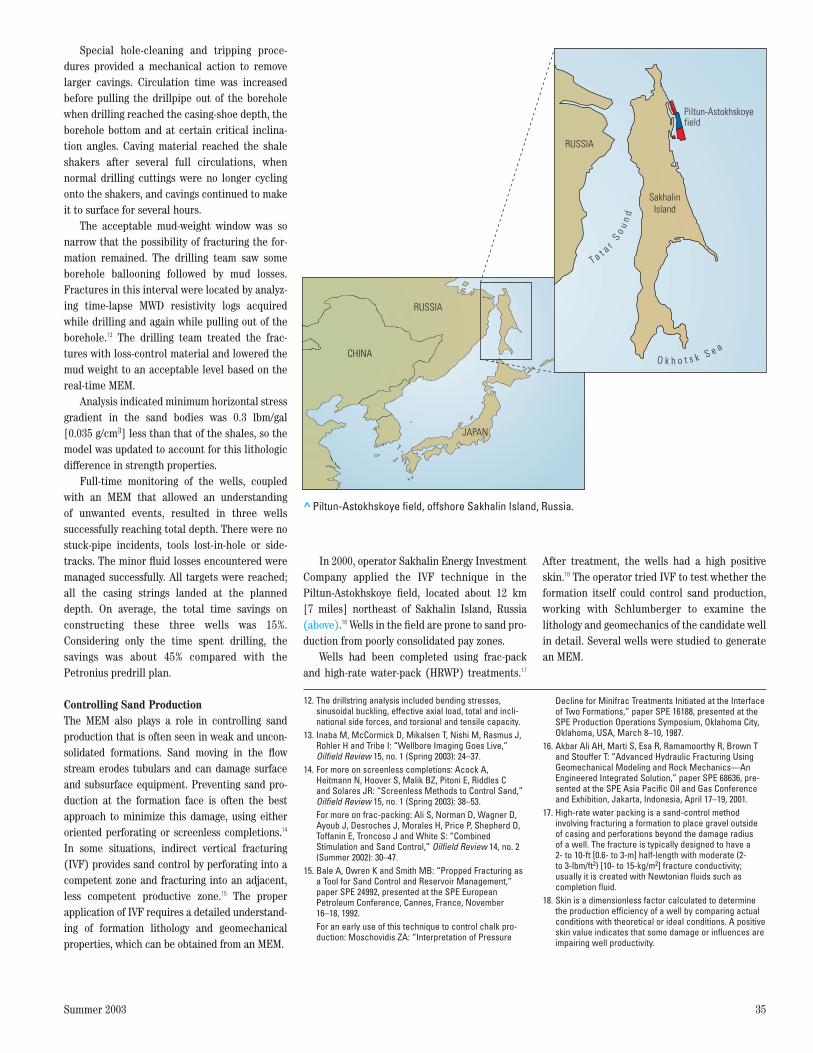
In 2000, operator Sakhalin Energy InvestmentCompany applied the IVF technique in thePiltun-Astokhskoye field, located about 12 km[7 miles] northeast of Sakhalin Island, Russia(above).16 Wells in the field are prone to sand pro-duction from poorly consolidated pay zones.
Wells had been completed using frac-packand high-rate water-pack (HRWP) treatments.17
After treatment, the wells had a high positiveskin.18 The operator tried IVF to test whether theformation itself could control sand production,working with Schlumberger to examine thelithology and geomechanics of the candidate wellin detail. Several wells were studied to generatean MEM.
12. The drillstring analysis included bending stresses, sinusoidal buckling, effective axial load, total and incli-national side forces, and torsional and tensile capacity.
13. Inaba M, McCormick D, Mikalsen T, Nishi M, Rasmus J,Rohler H and Tribe I: “Wellbore Imaging Goes Live,”Oilfield Review 15, no. 1 (Spring 2003): 24–37.
14. For more on screenless completions: Acock A, Heitmann N, Hoover S, Malik BZ, Pitoni E, Riddles C and Solares JR: “Screenless Methods to Control Sand,”Oilfield Review 15, no. 1 (Spring 2003): 38–53. For more on frac-packing: Ali S, Norman D, Wagner D,Ayoub J, Desroches J, Morales H, Price P, Shepherd D,Toffanin E, Troncoso J and White S: “CombinedStimulation and Sand Control,” Oilfield Review 14, no. 2(Summer 2002): 30–47.
15. Bale A, Owren K and Smith MB: “Propped Fracturing asa Tool for Sand Control and Reservoir Management,”paper SPE 24992, presented at the SPE EuropeanPetroleum Conference, Cannes, France, November16–18, 1992. For an early use of this technique to control chalk pro-duction: Moschovidis ZA: “Interpretation of Pressure
> Piltun-Astokhskoye field, offshore Sakhalin Island, Russia.
RUSSIA
RUSSIA
SakhalinIsland
Piltun-Astokhskoyefield
CHINA
JAPAN
T a t a rS
o un
d
O k h o t s k S e a
Decline for Minifrac Treatments Initiated at the Interfaceof Two Formations,” paper SPE 16188, presented at theSPE Production Operations Symposium, Oklahoma City,Oklahoma, USA, March 8–10, 1987.
16. Akbar Ali AH, Marti S, Esa R, Ramamoorthy R, Brown Tand Stouffer T: “Advanced Hydraulic Fracturing UsingGeomechanical Modeling and Rock Mechanics—AnEngineered Integrated Solution,” paper SPE 68636, pre-sented at the SPE Asia Pacific Oil and Gas Conferenceand Exhibition, Jakarta, Indonesia, April 17–19, 2001.
17. High-rate water packing is a sand-control methodinvolving fracturing a formation to place gravel outsideof casing and perforations beyond the damage radius of a well. The fracture is typically designed to have a 2- to 10-ft [0.6- to 3-m] half-length with moderate (2- to 3-lbm/ft2) [10- to 15-kg/m2] fracture conductivity; usually it is created with Newtonian fluids such as completion fluid.
18. Skin is a dimensionless factor calculated to determinethe production efficiency of a well by comparing actualconditions with theoretical or ideal conditions. A positiveskin value indicates that some damage or influences areimpairing well productivity.
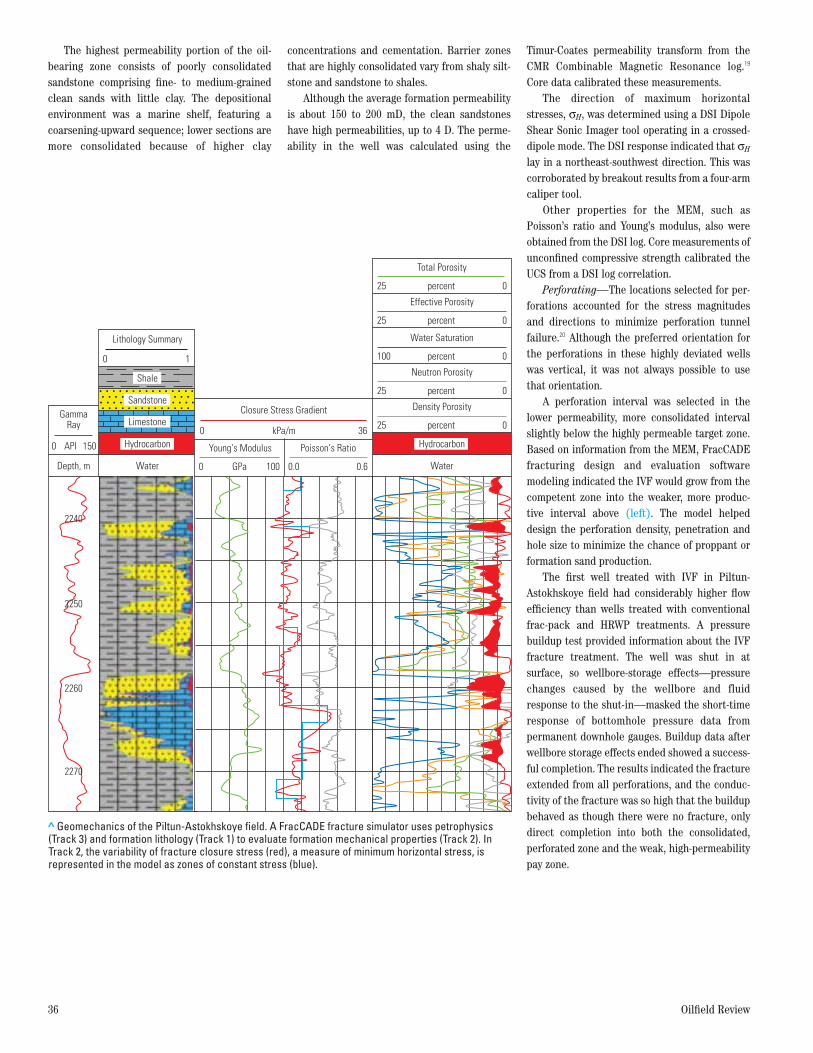
The highest permeability portion of the oil-bearing zone consists of poorly consolidatedsandstone comprising fine- to medium-grainedclean sands with little clay. The depositionalenvironment was a marine shelf, featuring acoarsening-upward sequence; lower sections aremore consolidated because of higher clay
concentrations and cementation. Barrier zonesthat are highly consolidated vary from shaly silt-stone and sandstone to shales.
Although the average formation permeabilityis about 150 to 200 mD, the clean sandstoneshave high permeabilities, up to 4 D. The perme-ability in the well was calculated using the
Timur-Coates permeability transform from theCMR Combinable Magnetic Resonance log.19
Core data calibrated these measurements.The direction of maximum horizontal
stresses, σH, was determined using a DSI DipoleShear Sonic Imager tool operating in a crossed-dipole mode. The DSI response indicated that σH
lay in a northeast-southwest direction. This wascorroborated by breakout results from a four-armcaliper tool.
Other properties for the MEM, such asPoisson’s ratio and Young’s modulus, also wereobtained from the DSI log. Core measurements ofunconfined compressive strength calibrated theUCS from a DSI log correlation.
Perforating—The locations selected for per-forations accounted for the stress magnitudesand directions to minimize perforation tunnelfailure.20 Although the preferred orientation forthe perforations in these highly deviated wellswas vertical, it was not always possible to usethat orientation.
A perforation interval was selected in thelower permeability, more consolidated intervalslightly below the highly permeable target zone.Based on information from the MEM, FracCADEfracturing design and evaluation softwaremodeling indicated the IVF would grow from thecompetent zone into the weaker, more produc-tive interval above (left). The model helpeddesign the perforation density, penetration andhole size to minimize the chance of proppant orformation sand production.
The first well treated with IVF in Piltun-Astokhskoye field had considerably higher flowefficiency than wells treated with conventionalfrac-pack and HRWP treatments. A pressurebuildup test provided information about the IVFfracture treatment. The well was shut in atsurface, so wellbore-storage effects—pressurechanges caused by the wellbore and fluidresponse to the shut-in—masked the short-timeresponse of bottomhole pressure data frompermanent downhole gauges. Buildup data afterwellbore storage effects ended showed a success-ful completion. The results indicated the fractureextended from all perforations, and the conduc-tivity of the fracture was so high that the buildupbehaved as though there were no fracture, onlydirect completion into both the consolidated,perforated zone and the weak, high-permeabilitypay zone.
36 Oilfield Review
> Geomechanics of the Piltun-Astokhskoye field. A FracCADE fracture simulator uses petrophysics(Track 3) and formation lithology (Track 1) to evaluate formation mechanical properties (Track 2). InTrack 2, the variability of fracture closure stress (red), a measure of minimum horizontal stress, isrepresented in the model as zones of constant stress (blue).
GammaRay
Depth, m Water
Hydrocarbon
Water
Hydrocarbon
0 1
Lithology Summary
2240
2250
2260
2270
API0 150
0 GPa 100
Young‘s Modulus
0 kPa/m 36
Closure Stress Gradient25 percent 0
Density Porosity
0.0 0.6
Poisson‘s Ratio
Shale
Sandstone
Limestone
25 percent 0
Neutron Porosity
100 percent 0
Water Saturation
25 percent 0
Effective Porosity
25 percent 0
Total Porosity
Summer 2003 37
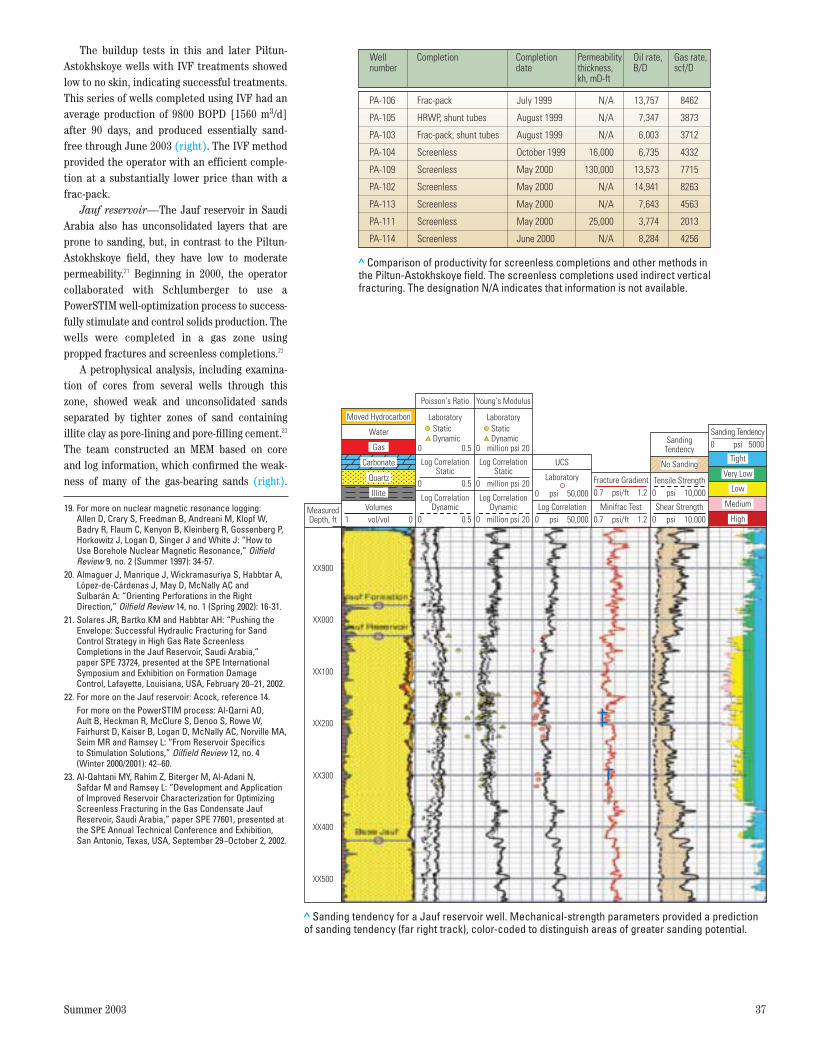
The buildup tests in this and later Piltun-Astokhskoye wells with IVF treatments showedlow to no skin, indicating successful treatments.This series of wells completed using IVF had anaverage production of 9800 BOPD [1560 m3/d]after 90 days, and produced essentially sand-free through June 2003 (right). The IVF methodprovided the operator with an efficient comple-tion at a substantially lower price than with afrac-pack.
Jauf reservoir—The Jauf reservoir in SaudiArabia also has unconsolidated layers that areprone to sanding, but, in contrast to the Piltun-Astokhskoye field, they have low to moderatepermeability.21 Beginning in 2000, the operatorcollaborated with Schlumberger to use aPowerSTIM well-optimization process to success-fully stimulate and control solids production. Thewells were completed in a gas zone usingpropped fractures and screenless completions.22
A petrophysical analysis, including examina-tion of cores from several wells through thiszone, showed weak and unconsolidated sandsseparated by tighter zones of sand containingillite clay as pore-lining and pore-filling cement.23
The team constructed an MEM based on core and log information, which confirmed the weak-ness of many of the gas-bearing sands (right).
19. For more on nuclear magnetic resonance logging: Allen D, Crary S, Freedman B, Andreani M, Klopf W,Badry R, Flaum C, Kenyon B, Kleinberg R, Gossenberg P,Horkowitz J, Logan D, Singer J and White J: “How toUse Borehole Nuclear Magnetic Resonance,” OilfieldReview 9, no. 2 (Summer 1997): 34-57.
20. Almaguer J, Manrique J, Wickramasuriya S, Habbtar A,López-de-Cárdenas J, May D, McNally AC and Sulbarán A: “Orienting Perforations in the RightDirection,” Oilfield Review 14, no. 1 (Spring 2002): 16-31.
21. Solares JR, Bartko KM and Habbtar AH: “Pushing theEnvelope: Successful Hydraulic Fracturing for SandControl Strategy in High Gas Rate ScreenlessCompletions in the Jauf Reservoir, Saudi Arabia,” paper SPE 73724, presented at the SPE InternationalSymposium and Exhibition on Formation DamageControl, Lafayette, Louisiana, USA, February 20–21, 2002.
22. For more on the Jauf reservoir: Acock, reference 14. For more on the PowerSTIM process: Al-Qarni AO, Ault B, Heckman R, McClure S, Denoo S, Rowe W,Fairhurst D, Kaiser B, Logan D, McNally AC, Norville MA,Seim MR and Ramsey L: “From Reservoir Specifics to Stimulation Solutions,” Oilfield Review 12, no. 4(Winter 2000/2001): 42–60.
23. Al-Qahtani MY, Rahim Z, Biterger M, Al-Adani N, Safdar M and Ramsey L: “Development and Applicationof Improved Reservoir Characterization for OptimizingScreenless Fracturing in the Gas Condensate JaufReservoir, Saudi Arabia,” paper SPE 77601, presented atthe SPE Annual Technical Conference and Exhibition,San Antonio, Texas, USA, September 29–October 2, 2002.
> Comparison of productivity for screenless completions and other methods inthe Piltun-Astokhskoye field. The screenless completions used indirect verticalfracturing. The designation N/A indicates that information is not available.
Wellnumber
Completion Completiondate
Permeabilitythickness,kh, mD-ft
Oil rate,B/D
Gas rate,scf/D
PA-106
PA-105
PA-103
PA-104
PA-109
PA-102
PA-113
PA-111
PA-114
Frac-pack
HRWP, shunt tubes
Frac-pack, shunt tubes
Screenless
Screenless
Screenless
Screenless
Screenless
Screenless
July 1999
August 1999
August 1999
October 1999
May 2000
May 2000
May 2000
May 2000
June 2000
N/A
N/A
N/A
16,000
130,000
N/A
N/A
25,000
N/A
13,757
7,347
6,003
6,735
13,573
14,941
7,643
3,774
8,284
8462
3873
3712
4332
7715
8263
4563
2013
4256
> Sanding tendency for a Jauf reservoir well. Mechanical-strength parameters provided a predictionof sanding tendency (far right track), color-coded to distinguish areas of greater sanding potential.
XX000
XX900
MeasuredDepth, ft
Volumes
Moved Hydrocarbon
Water
Gas
Quartz
Illite
vol/vol 01
XX200
XX100
XX400
XX300
XX500
Log CorrelationDynamic
million psi0.50
Log CorrelationStatic
Laboratory
Poisson‘s Ratio
StaticDynamic
0.50
0.50
Carbonate
Log CorrelationDynamic
200 psiLog Correlation
50,0000
psi 50,0000
psi/ftMinifrac Test
1.20.7
psi/ftFracture Gradient
1.20.7
psiShear Strength
10,0000
psiSanding Tendency
50000
psiTensile Strength
SandingTendency
No SandingVery Low
Low
Medium
High
Tight
10,0000
Log CorrelationStatic
Laboratory
Laboratory
UCS
Young‘s Modulus
StaticDynamic
200
20
million psi
million psi0
Young’s modulus, and the correlated UCS value,decreased by about a factor of six from the competent zones to the unconsolidated layers.The weak layers were prone to sanding. On the basis of the MEM, wherever possible, perforations were placed 10 to 20 feet [3 to 6 m]away from these areas, and the perforation inter-val was restricted to be shorter than 30 or 40 feet[9 or 12 m].
The MEM and stimulation plan were updatedwith results from each well. Close collaborationbetween the operator and Schlumberger expertswas essential in successfully designing and imple-menting this stimulation program. The operatorestablished a balance between eliminating solidsproduction and achieving maximum well deliver-ability. Cleanup time and cleanup costs declinedas the PowerSTIM program progressed.24
Coupling Geomechanics and Fluid Flow Schlumberger performed a data audit and created an MEM of the Miskar field for operatorBG. The field is located about 110 km [68 miles]east-southeast of Sfax, Tunisia in the Gulf ofGabes. The predrill report identified hazards and recommendations for safe drilling in thisgas-condensate field. Most of the drilling difficul-ties in earlier wells occurred while drilling intomechanically weak, overpressured, chemicallyactive, and fractured or faulted formations. Usingthe MEM, BG began a new drilling campaign in the field.
During the drilling of the lower portion of thefirst well in the program, a Schlumberger geome-chanics engineer was present on the rig to moni-tor the daily drilling reports and update theMEM. This well was drilled without the non-productive time incidents of previous wells. BGused the updated MEM for two additional wells,which successfully reached their primary andsecondary directional targets without instabilityevents. With each well drilled, the databasecould be updated, providing a basis for continu-ing drilling improvements in Miskar field.
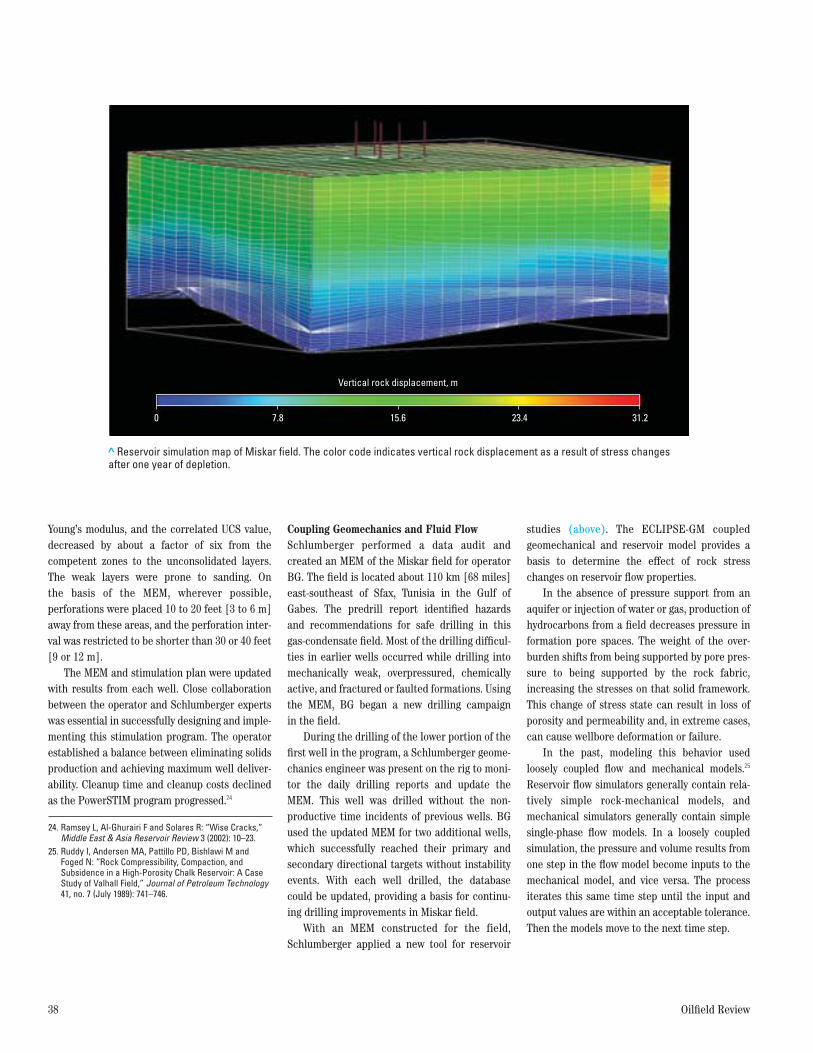
With an MEM constructed for the field,Schlumberger applied a new tool for reservoir
studies (above). The ECLIPSE-GM coupledgeomechanical and reservoir model provides abasis to determine the effect of rock stresschanges on reservoir flow properties.
In the absence of pressure support from anaquifer or injection of water or gas, production ofhydrocarbons from a field decreases pressure information pore spaces. The weight of the over-burden shifts from being supported by pore pres-sure to being supported by the rock fabric,increasing the stresses on that solid framework.This change of stress state can result in loss ofporosity and permeability and, in extreme cases,can cause wellbore deformation or failure.
In the past, modeling this behavior usedloosely coupled flow and mechanical models.25
Reservoir flow simulators generally contain rela-tively simple rock-mechanical models, andmechanical simulators generally contain simplesingle-phase flow models. In a loosely coupledsimulation, the pressure and volume results fromone step in the flow model become inputs to themechanical model, and vice versa. The processiterates this same time step until the input andoutput values are within an acceptable tolerance.Then the models move to the next time step.
38 Oilfield Review
24. Ramsey L, Al-Ghurairi F and Solares R: “Wise Cracks,”Middle East & Asia Reservoir Review 3 (2002): 10–23.
25. Ruddy I, Andersen MA, Pattillo PD, Bishlawi M andFoged N: “Rock Compressibility, Compaction, andSubsidence in a High-Porosity Chalk Reservoir: A CaseStudy of Valhall Field,” Journal of Petroleum Technology41, no. 7 (July 1989): 741–746.
> Reservoir simulation map of Miskar field. The color code indicates vertical rock displacement as a result of stress changesafter one year of depletion.
0 7.8 15.6
Vertical rock displacement, m
23.4 31.2
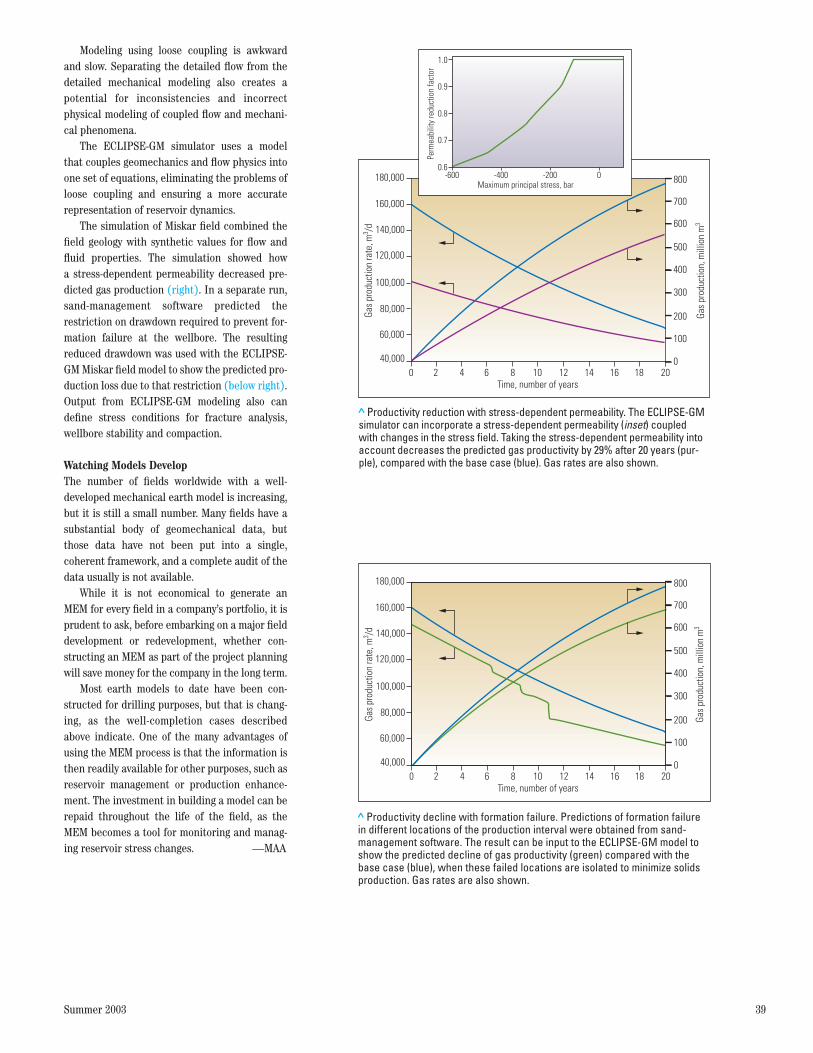
Summer 2003 39
Modeling using loose coupling is awkwardand slow. Separating the detailed flow from thedetailed mechanical modeling also creates apotential for inconsistencies and incorrect physical modeling of coupled flow and mechani-cal phenomena.
The ECLIPSE-GM simulator uses a modelthat couples geomechanics and flow physics intoone set of equations, eliminating the problems ofloose coupling and ensuring a more accurate representation of reservoir dynamics.
The simulation of Miskar field combined thefield geology with synthetic values for flow andfluid properties. The simulation showed how a stress-dependent permeability decreased pre-dicted gas production (right). In a separate run,sand-management software predicted therestriction on drawdown required to prevent for-mation failure at the wellbore. The resultingreduced drawdown was used with the ECLIPSE-GM Miskar field model to show the predicted pro-duction loss due to that restriction (below right).Output from ECLIPSE-GM modeling also candefine stress conditions for fracture analysis,wellbore stability and compaction.
Watching Models DevelopThe number of fields worldwide with a well-developed mechanical earth model is increasing,but it is still a small number. Many fields have asubstantial body of geomechanical data, butthose data have not been put into a single, coherent framework, and a complete audit of thedata usually is not available.
While it is not economical to generate anMEM for every field in a company’s portfolio, it isprudent to ask, before embarking on a major fielddevelopment or redevelopment, whether con-structing an MEM as part of the project planningwill save money for the company in the long term.
Most earth models to date have been con-structed for drilling purposes, but that is chang-ing, as the well-completion cases describedabove indicate. One of the many advantages ofusing the MEM process is that the information isthen readily available for other purposes, such asreservoir management or production enhance-ment. The investment in building a model can berepaid throughout the life of the field, as theMEM becomes a tool for monitoring and manag-ing reservoir stress changes. —MAA
> Productivity reduction with stress-dependent permeability. The ECLIPSE-GMsimulator can incorporate a stress-dependent permeability (inset) coupledwith changes in the stress field. Taking the stress-dependent permeability intoaccount decreases the predicted gas productivity by 29% after 20 years (pur-ple), compared with the base case (blue). Gas rates are also shown.
180,000 800
160,000
140,000
120,000
100,000
80,000
60,000
40,000
700
600
500
400
300
200
100
00 2 4 6 8 10 12 14 16 18 20
Time, number of years
Gas
prod
uctio
n ra
te, m
3 /d
Gas
prod
uctio
n, m
illio
n m
3
1.0
0.9
0.8
Perm
eabi
lity
redu
ctio
n fa
ctor
0.7
0.6-600 -400 -200
Maximum principal stress, bar0
> Productivity decline with formation failure. Predictions of formation failurein different locations of the production interval were obtained from sand-management software. The result can be input to the ECLIPSE-GM model toshow the predicted decline of gas productivity (green) compared with thebase case (blue), when these failed locations are isolated to minimize solidsproduction. Gas rates are also shown.
180,000 800
160,000
140,000
120,000
100,000
80,000
60,000
40,000
700
600
500
400
300
200
100
00 2 4 6 8 10 12 14 16 18 20
Time, number of years
Gas
prod
uctio
n ra
te, m
3 /d
Gas
prod
uctio
n, m
illio
n m
3
Related Documents


![Research Article Characterization of Rock Mechanical ...Mechanical properties of rocks are usually measured using static and dynamic methods [, ] . Static methods are generally conducted](https://static.cupdf.com/doc/110x72/61052ae9a5885e77311e0580/research-article-characterization-of-rock-mechanical-mechanical-properties-of.jpg)