Watching diagnoses develop: Eye movements reveal symptom processing during diagnostic reasoning Agnes Scholz 1 & Josef F. Krems 2 & Georg Jahn 2 Published online: 25 April 2017 # Psychonomic Society, Inc. 2017 Abstract Finding a probable explanation for observed symp- toms is a highly complex task that draws on information re- trieval from memory. Recent research suggests that observed symptoms are interpreted in a way that maximizes coherence for a single likely explanation. This becomes particularly clear if symptom sequences support more than one explanation. However, there are no existing process data available that allow coherence maximization to be traced in ambiguous di- agnostic situations, where critical information has to be re- trieved from memory. In this experiment, we applied memory indexing, an eye-tracking method that affords rich time-course information concerning memory-based cognitive processing during higher order thinking, to reveal symptom processing and the preferred interpretation of symptom sequences. Participants first learned information about causes and symp- toms presented in spatial frames. Gaze allocation to emptied spatial frames during symptom processing and during the di- agnostic response reflected the subjective status of hypotheses held in memory and the preferred interpretation of ambiguous symptoms. Memory indexing traced how the diagnostic deci- sion developed and revealed instances of hypothesis change and biases in symptom processing. Memory indexing thus provided direct online evidence for coherence maximization in processing ambiguous information. Keywords Eye movements . Process tracing . Memory indexing . Diagnostic reasoning . Coherence maximization Diagnostic reasoning involves finding a probable explanation for a set of observations (Johnson & Krems, 2001; Meder, Mayrhofer, & Waldmann, 2014; Patel, Arocha, & Zhang, 2005). A physician, for example, is required to find the most likely cause for a patient’ s symptoms. Usually, symptoms are reported sequentially and have to be evaluated based on knowledge stored in long-term memory (Mehlhorn, Taatgen, Lebiere, & Krems, 2011; Thomas, Dougherty, Sprenger, & Harbison, 2008). Symptom information can be sufficient to determine a single explanation, but often the available infor- mation supports more than one hypothesis (McKenzie, 1998) and is thus ambiguous (Holyoak & Simon, 1999). An ambig- uous case elicits differing final diagnoses from different diag- nosticians. Each single diagnostician may adhere to an initial hypothesis or adopt an alternative. In this study, we applied eye tracking to investigate memory processes (memory indexing) during diagnostic reasoning to reveal coherence maximizing in symptom processing. Previous research has shown that symptom processing in memory is biased toward the hypothesis supported by symp- toms presented early in the sequence (Baumann, Krems, & Ritter, 2010 ; Busemeyer & Townsend, 1993 ; Lange, Thomas, & Davelaar, 2012; Rebitschek, Bocklisch, Scholz, Krems, & Jahn, 2015; Rebitschek, Scholz, Bocklisch, Krems, & Jahn, 2012; Weber, Böckenholt, Hilton, & Wallace, 1993), especially if the response is given after all the symptom information has been received (end-of-sequence response mode; Hogarth & Einhorn, 1992). These findings on Electronic supplementary material The online version of this article (doi:10.3758/s13423-017-1294-8) contains supplementary material, which is available to authorized users. * Agnes Scholz [email protected] 1 Department of Psychology, University of Zurich, Zurich, Switzerland 2 Department of Psychology, Technische Universität Chemnitz, Chemnitz, Germany Psychon Bull Rev (2017) 24:1398–1412 DOI 10.3758/s13423-017-1294-8

Welcome message from author
This document is posted to help you gain knowledge. Please leave a comment to let me know what you think about it! Share it to your friends and learn new things together.
Transcript
Watching diagnoses develop: Eye movements reveal symptomprocessing during diagnostic reasoning
Agnes Scholz1 & Josef F. Krems2 & Georg Jahn2
Published online: 25 April 2017# Psychonomic Society, Inc. 2017
Abstract Finding a probable explanation for observed symp-toms is a highly complex task that draws on information re-trieval from memory. Recent research suggests that observedsymptoms are interpreted in a way that maximizes coherencefor a single likely explanation. This becomes particularly clearif symptom sequences support more than one explanation.However, there are no existing process data available thatallow coherence maximization to be traced in ambiguous di-agnostic situations, where critical information has to be re-trieved from memory. In this experiment, we applied memoryindexing, an eye-trackingmethod that affords rich time-courseinformation concerning memory-based cognitive processingduring higher order thinking, to reveal symptom processingand the preferred interpretation of symptom sequences.Participants first learned information about causes and symp-toms presented in spatial frames. Gaze allocation to emptiedspatial frames during symptom processing and during the di-agnostic response reflected the subjective status of hypothesesheld in memory and the preferred interpretation of ambiguoussymptoms. Memory indexing traced how the diagnostic deci-sion developed and revealed instances of hypothesis changeand biases in symptom processing. Memory indexing thus
provided direct online evidence for coherence maximizationin processing ambiguous information.
Keywords Eyemovements . Process tracing .Memoryindexing . Diagnostic reasoning . Coherence maximization
Diagnostic reasoning involves finding a probable explanationfor a set of observations (Johnson & Krems, 2001; Meder,Mayrhofer, & Waldmann, 2014; Patel, Arocha, & Zhang,2005). A physician, for example, is required to find the mostlikely cause for a patient’s symptoms. Usually, symptoms arereported sequentially and have to be evaluated based onknowledge stored in long-term memory (Mehlhorn, Taatgen,Lebiere, & Krems, 2011; Thomas, Dougherty, Sprenger, &Harbison, 2008). Symptom information can be sufficient todetermine a single explanation, but often the available infor-mation supports more than one hypothesis (McKenzie, 1998)and is thus ambiguous (Holyoak & Simon, 1999). An ambig-uous case elicits differing final diagnoses from different diag-nosticians. Each single diagnostician may adhere to an initialhypothesis or adopt an alternative. In this study, we appliedeye tracking to investigate memory processes (memoryindexing) during diagnostic reasoning to reveal coherencemaximizing in symptom processing.
Previous research has shown that symptom processing inmemory is biased toward the hypothesis supported by symp-toms presented early in the sequence (Baumann, Krems, &Ritter, 2010; Busemeyer & Townsend, 1993; Lange,Thomas, & Davelaar, 2012; Rebitschek, Bocklisch, Scholz,Krems, & Jahn, 2015; Rebitschek, Scholz, Bocklisch,Krems, & Jahn, 2012; Weber, Böckenholt, Hilton, &Wallace, 1993), especially if the response is given after allthe symptom information has been received (end-of-sequenceresponse mode; Hogarth & Einhorn, 1992). These findings on
Electronic supplementary material The online version of this article(doi:10.3758/s13423-017-1294-8) contains supplementary material,which is available to authorized users.
* Agnes [email protected]
1 Department of Psychology, University of Zurich, Zurich, Switzerland2 Department of Psychology, Technische Universität Chemnitz,
Chemnitz, Germany
Psychon Bull Rev (2017) 24:1398–1412DOI 10.3758/s13423-017-1294-8
the so-called diagnosis momentum (Croskerry, 2003) consti-tute instances of confirmation bias (Nickerson, 1998) and canbe interpreted as a reasoner’s tendency to strive for a coherentinterpretation (Glöckner, Betsch, & Schindler, 2010; Holyoak& Simon, 1999; Mehlhorn & Jahn, 2009; Kostopoulou,Russo, Keenan, Delaney, & Douiri, 2012; Wang, Johnson,& Zhang, 2006). The coherence effect is closely related toresearch on information distortion (DeKay, Stone, &Sorenson, 2011; Hagmayer & Kostopoulou, 2013; Russo,Medvec, & Meloy, 1996; Strickland & Keil, 2011).Incoherent representations are transformed into coherent rep-resentations through information distortion to maximize co-herence. Coherence can also be achieved by biased informa-tion processing maximizing the belief in one hypothesis whiledecreasing the belief in alternatives. Maximizing coherenceoften favors the initially leading hypothesis, yet it canstrengthen an alternative hypothesis if stronger evidence forthis alternative has accumulated and a hypothesis change takesplace.
Coherence maximization has been studied by analyzing theoutcome of the reasoning process. For instance, symptom se-quences with equal support for multiple hypotheses can pro-vide evidence for coherence maximizing in unequal propor-tions of diagnoses. Thus, the probability that a certain diseasehas caused a patient’s symptoms given equal support for thisdisease and an alternative (and equal base rates) is .5 (maxi-mally ambiguous). Deviations of diagnosis proportions from.5 indicate biased symptom processing to increase coherencein a diagnostic decision. In previous studies with maximallyambiguous sequences, the initial hypothesis was chosen as thefinal diagnosis with a proportion higher than .5 (Rebitschek,Bocklisch, et al., 2015).
Coherence maximization can be described by parallelconstraint-satisfaction models (Glöckner & Betsch, 2008;McClelland & Rumelhart 1981; Read, Vanman, & Miller,1997; Simon, Snow, & Read, 2004; Simon, Stenstrom, &Read, 2015; Thagard, 1989). Theories of coherence maximi-zation are grounded in cognitive consistency theories. At theheart of cognitive consistency lies the Gestaltian principle thathuman cognition is affected by mutual interaction among con-stituent elements of a cognitive representation. In parallel con-straint satisfaction models, the reasoning task is representedby a network, in which symptoms and diagnoses are intercon-nected by excitatory and inhibitory links representing positiveand negative relations between symptoms and diagnoses.Bidirectional activation and inhibition settles the network ina stable and thus coherent state favoring either one or the otherdiagnosis.
Despite their merits, it is difficult to use these models toclarify the underlying cognitive processes (Amaya, 2015;Mehlhorn & Jahn, 2009; Rumelhart , Smolensky,McClelland, & Hinton, 1986) that lead to the observed biasesin symptom processing. However, this clarification is
necessary to enable understanding of how coherence maxi-mizing lends weight to one of two competing hypotheses,and to clarify how the coherence maximizing process canresult in the selection of a less supported diagnosis. One im-portant means of clarifying the cognitive processes is the col-lection of process data to inform and enhance process modelsof coherence-based diagnostic reasoning.
Process tracing methods, such as verbal protocols, infor-mation boards, or Mouselab allow the study of informationprocessing prior to and during the response (for overviews,see Glaholt & Reingold, 2011; Schulte-Mecklenbeck,Kühberger, & Ranyard, 2011). However, memory-based rea-soning processes usually cannot be observed because most ofthe time cognition proceeds without systematic accompanyingovert actions. Recent research on the looking-at-nothing phe-nomenon and the visual-world paradigm has shown that eyemovements are applicable to the study of real-time retrievalprocesses (e.g., Hoover & Richardson, 2008; Johansson,Holsanova, Dewhurst, & Holmqvist, 2012; Johansson,Holsanova, & Holmqvist, 2006; Martarelli, Mast, &Hartmann, 2017; Richardson & Kirkham, 2004; Richardson& Spivey, 2000; Spivey &Geng, 2001) and language process-ing (Allopenna, Magnuson, & Tanenhaus, 1998; Altmann,2004; Altmann & Kamide, 2007, 2009; Tanenhaus, Spivey-Knowlton, Eberhard, & Sedivy, 1995). Extending these re-sults, memory indexing has been developed as a process mea-sure to study higher level cognitive tasks (Renkewitz & Jahn,2010, 2012) and has been successfully applied to study rea-soning and decision making (Jahn & Braatz, 2014; Platzer,Bröder, & Heck, 2014; Scholz, von Helversen, & Rieskamp,2015). Inferring memory-based processing by observing eyemovements is possible because reactivating information thatis linked to a location reestablishes a spatial index that leadsthe gaze to the relevant location (Huettig, Olivers, &Hartsuiker, 2011; Johansson & Johansson, 2014; Scholz,Mehlhorn, & Krems, 2016; Spivey & Dale, 2011).
Jahn and Braatz (2014) applied memory indexing to studysequential diagnostic reasoning. Participants were told toimagine they were physicians trying to identify the chemicalwith which a worker in a chemical plant had been affectedduring an accident (chemical accident task; Mehlhorn et al.,2011). Information concerning the symptoms and thechemicals that could potentially elicit such symptoms werelearned during a preceding learning phase. Symptom classesand the chemicals (possible diagnoses) were associated tospatial locations on a computer screen. During reasoning tri-als, the spatial locations that previously contained informationduring the learning phase were empty, and symptoms werepresented auditorily in sequence. Eye movements were re-corded during reasoning trials. Gaze allocation to emptiedscreen locations revealed the changing activation status ofhypotheses over the course of a reasoning trial and indicatedhow symptoms were interpreted. For example, in trials with
Psychon Bull Rev (2017) 24:1398–1412 1399
early symptoms supporting a hypothesis that had to bechanged to arrive at the correct diagnosis, fixation proportionswere highest for the initial hypothesis first and highest for thecorrect hypothesis later. In the study by Jahn and Braatz(2014), most symptom sequences had a single correctdiagnosis.
Present study
In the present study, we focused on exploring memory pro-cesses during sequential diagnostic reasoning with ambiguoussymptom sequences to extend previous findings concerningeye movements during decision making and diagnostic rea-soning and to test process assumptions about coherence max-imization. In everyday life, people are regularly faced withcomplex, ambiguous situations that nonetheless call for a de-cision (e.g., Holyoak & Simon, 1999). Studying ambiguityallows one to specify how conflicting information is integrat-ed and therefore presents a strong case of testing process as-sumptions about coherence maximization. Ambiguity resultswhen two or more hypotheses are supported by the symptomsequence, and there is no single correct diagnosis at the endafter all symptom information has been presented.We use twohypothetical examples to illustrate this next.
First, consider the symptom sequence a-ab-ab-b. In thissequence, a denotes a symptom that is caused by a ChemicalA but by none of the other chemicals in question and thusstrongly supports Chemical A as a candidate diagnosis; abdenotes a symptom that is caused by Chemical A and byChemical B and thus supports two Chemicals A and B; andb supports only Chemical B. In the sequence a-ab-ab-b, twohypotheses are supported equally by the set of symptoms. Asecond example of an ambiguous symptom set would be an a-bd-a-ab sequence. This sequence contains support for theHypotheses A, B, and D, but with a clear ordering:Hypothesis A is supported by three symptoms (two of whichare not caused by any other chemical), Hypothesis B is sup-ported by two symptoms, and Hypothesis D is supported by asingle symptom only. Note that, like in the example before, thefirst symptom elicits A as the leading hypothesis. The secondsymptom, however, does not support A and suggests B or Dinstead. Thus, B and D may be added to the set of consideredhypotheses and could become strengthened by coherencemaximizing in processing later symptoms, such that the finaldiagnosis could be B although the sequence provides superiorsupport for A.
We tested ambiguous symptom sequences of this kind toexplore coherence maximization during diagnostic reasoningby applying the memory indexing method. Recent researchhas shown that biased information processing and informationdistortion can increase or decrease the belief in a hypothesisand explain diagnostic preferences beyond mere retrieval
processes. In the framework of parallel constraint satisfactionmodels, these processes are implemented by bidirectional as-sociations between symptoms and hypotheses that settle anetwork toward a coherent explanation of given information.Following this line of research, we aimed to demonstrate thateye movements could trace the changing activations resultingfrom the mutual interactions between symptom informationand diagnoses held in memory.
In a first set of analyses, we clarified the broader relationbetween eye movements and the outcome of the reasoningprocess; that is, the diagnostic response (Hypothesis 1).Based on the literature review, wewanted to replicate previousfindings on the relation between eye movements and complexthinking processes (Hypotheses 2 and 5). This first set ofanalyses aimed to further strengthen our methodological ap-proach and can be seen as testing preconditions for our secondset of analyses. In the second set, we tested more specifichypotheses on the effects of coherence maximization duringdiagnostic reasoning (integrated probability matching,Hypothesis 3; hypothesis changes, Hypothesis 4). Next, weoutline all hypotheses in more detail.
Hypothesis 1: Gaze behavior and diagnostic response
We assume that if gaze data indeed reflect memory retrieval inambiguous diagnostic situations, eye gaze should correspondto the outcome of the reasoning process. In decisionmaking, ithas been shown that the preferred option was gazed at longer(Stewart, Hermens, & Matthews, 2015; for an overview, seeOrquin &Mueller Loose, 2013). Additionally, recent researchon diagnostic reasoning has shown that eye movements canreflect symptom integration in memory and that eye move-ments can indicate the diagnostic response (Jahn & Braatz,2014). Based on these findings, we assume that gaze durationto an alternative during diagnostic reasoning and processingof an ambiguous symptom sequence should predict how likelythis alternative is to be chosen at the end of the reasoningprocess.
Hypothesis 2: Location matching
When the first symptom establishes a single leading hypothe-sis, gaze data following the presentation of this symptomshould reflect which hypothesis it supports and thus the cor-rect retrieval of the symptom location from memory.Consequently, if only one hypothesis is supported by the firstsymptom, this hypothesis should be gazed at longer than anyother hypothesis. Such momentary probability matching hasonly once been shown in diagnostic reasoning (Jahn &Braatz,2014). It would be in line with previous findings on the
1400 Psychon Bull Rev (2017) 24:1398–1412
looking-at-nothing phenomenon (e.g., Richardson & Spivey,2000).
Hypothesis 3: Integrated probability matching
If eye movements can trace coherence maximization duringsequential diagnostic reasoning, eye movements during latersymptom presentations should reveal the integration of symp-tom information (see Renkewitz & Jahn, 2012; Jahn&Braatz,2014; Scholz et al., 2015). For instance, if a later symptomsupports two alternatives, gaze duration should be longer to-ward the leading hypothesis. Alternatively, if gaze behaviormerely reflects retrieval processes without revealing symptomintegration, when being presented with a symptom that isequally strongly associated with two hypotheses, participantsshould look at both diagnoses for about the same duration.Recent findings on gaze allocation during diagnostic reason-ing suggest that eye movements reflect integrated probabilitymatching and thus reasoning instead of just memory retrieval.However, there has been no statistical test of this hypothesis.
Hypothesis 4: Hypothesis change
When being presented with an ambiguous symptom se-quence, a person’s belief can change from the leading to analternative hypothesis, when enough evidence for an alterna-tive hypothesis has accumulated. Coherence maximizationcan affect this symptom integration process. For instance, co-herence maximization can lead to participants not changingtheir belief by distorting information supporting an alternativehypothesis, leading them to respond with the initial hypothe-sis. Assuming that memory-indexing gaze data reveal a par-ticipant’s currently-preferred hypothesis, if the proportion offixations toward a hypothesis stays about the same throughoutthe symptom sequence, this would indicate that a hypothesischange is unlikely to have occurred. By contrast, if there is achange in the proportion of fixations to the leading hypothesisover the symptom sequence, this would likely suggest theoccurrence of a hypothesis change. Thus, if eye movementsreflect processes of coherence maximization, differences infixation proportions between the beginning and the end of asymptom sequence should predict the hypothesis change.
Coherence maximization can also affect information pro-cessing after a hypothesis change has taken place. Biased in-formation processing can strengthen the alternative hypothesiseven if no further evidence supporting this hypothesis is pre-sented (Holyoak & Simon, 1999). If the memory indexinggaze data are able to reveal such biases in information pro-cessing, we should observe fixations that are unrelated to thecurrent symptom. That means, the most fixated hypothesis
could be the alternative hypothesis and not the hypothesis thatis supported by the symptom sequence.
Hypothesis 5: Response matching
In decision making it has been shown that people choose theoption for which the most evidence has been accumulated(Busemeyer & Townsend, 1993, Krajbich, Armel, &Rangel, 2010). Further, fixation durations get longer for theoption that is finally chosen (gaze-cascade, e.g., Fiedler &Glöckner, 2012; Glaholt & Reingold, 2011; Shimojo,Simion, Shimojo, & Scheier, 2003). Congruently and in linewith previous findings, we expect that fixations directed to-ward a participant’s final diagnosis will increase toward theend of the reasoning trial and will be at the highest proportionduring the response interval. Table 1 provides an overview ofthe tested gaze hypotheses and the main results.
Method
The study consisted of a learning phase followed by a reason-ing phase. The reasoning task required participants to deter-mine the most likely cause of a patient’s symptoms. In thelearning phase, participants first learned how symptoms areassigned to symptom classes, and then how symptom classesrelate to chemicals. Participants were informed that the pa-tients in need of diagnosis were workers employed in a chem-ical plant, that their symptoms were caused by one of theprocessed chemicals, and that each patient was affected byonly one of the listed chemicals (the chemical list was exhaus-tive with mutually exclusive explanations). Associations be-tween symptom classes and chemicals were established bypresenting symptom classes in rectangular frames in thescreen quadrants that each represented one chemical (seeFig. 1). During reasoning, symptoms were presented audito-rily while participants observed the emptied rectangularframes. Eye movements were recorded throughout the reason-ing phase, and the diagnostic decision was collected at the endof each reasoning trial.
Participants
Of the 34 participants, for whom calibration of the eye trackersucceeded to an accuracy of at least 2° of visual angle, twoparticipants were excluded because eye-tracking accuracydecreased during the experiment. The final 32 participantswere all students from Chemnitz University of Technology(21 female, 11 male), with a mean age of 22.4 years (rangingfrom 19 to 39 years). All had normal or corrected-to-normalvision.
Psychon Bull Rev (2017) 24:1398–1412 1401
Apparatus
Participants were seated at a distance of 63 cm in front of a 22-in. computer screen (1680 × 1050 pixels). Stimuli were
presented via E-Prime 2.0. Auditory recordings were present-ed through headphones and responses were given on a stan-dard keyboard. An SMI RED remote eye tracker sampled datafrom the right eye at 120 Hz. Gaze data were recorded with
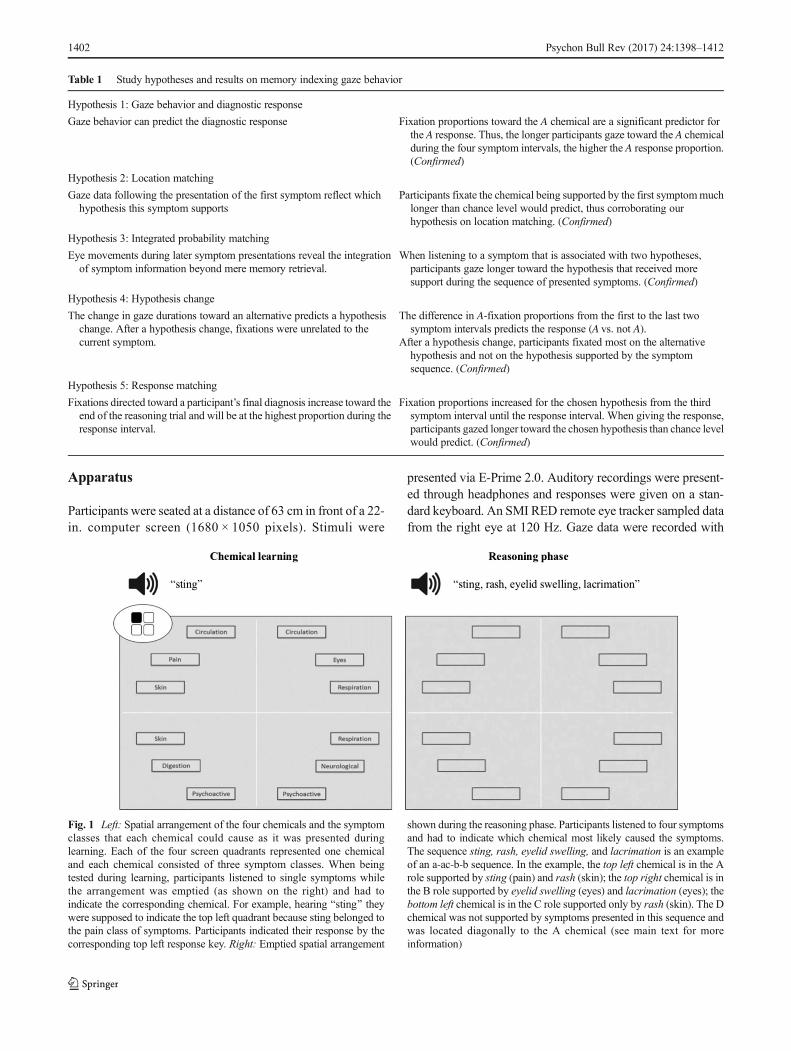
Table 1 Study hypotheses and results on memory indexing gaze behavior
Hypothesis 1: Gaze behavior and diagnostic response
Gaze behavior can predict the diagnostic response Fixation proportions toward the A chemical are a significant predictor forthe A response. Thus, the longer participants gaze toward the A chemicalduring the four symptom intervals, the higher the A response proportion.(Confirmed)
Hypothesis 2: Location matching
Gaze data following the presentation of the first symptom reflect whichhypothesis this symptom supports
Participants fixate the chemical being supported by the first symptommuchlonger than chance level would predict, thus corroborating ourhypothesis on location matching. (Confirmed)
Hypothesis 3: Integrated probability matching
Eye movements during later symptom presentations reveal the integrationof symptom information beyond mere memory retrieval.
When listening to a symptom that is associated with two hypotheses,participants gaze longer toward the hypothesis that received moresupport during the sequence of presented symptoms. (Confirmed)
Hypothesis 4: Hypothesis change
The change in gaze durations toward an alternative predicts a hypothesischange. After a hypothesis change, fixations were unrelated to thecurrent symptom.
The difference in A-fixation proportions from the first to the last twosymptom intervals predicts the response (A vs. not A).
After a hypothesis change, participants fixated most on the alternativehypothesis and not on the hypothesis supported by the symptomsequence. (Confirmed)
Hypothesis 5: Response matching
Fixations directed toward a participant’s final diagnosis increase toward theend of the reasoning trial and will be at the highest proportion during theresponse interval.
Fixation proportions increased for the chosen hypothesis from the thirdsymptom interval until the response interval. When giving the response,participants gazed longer toward the chosen hypothesis than chance levelwould predict. (Confirmed)
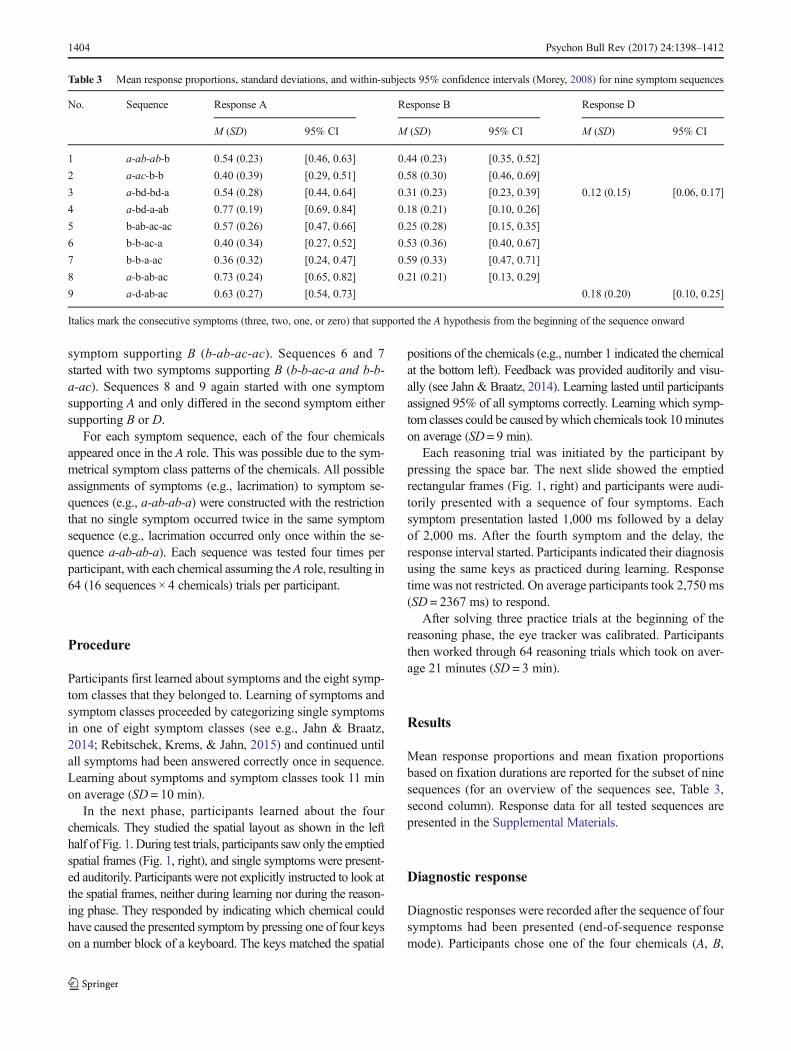
Fig. 1 Left: Spatial arrangement of the four chemicals and the symptomclasses that each chemical could cause as it was presented duringlearning. Each of the four screen quadrants represented one chemicaland each chemical consisted of three symptom classes. When beingtested during learning, participants listened to single symptoms whilethe arrangement was emptied (as shown on the right) and had toindicate the corresponding chemical. For example, hearing Bsting^ theywere supposed to indicate the top left quadrant because sting belonged tothe pain class of symptoms. Participants indicated their response by thecorresponding top left response key. Right: Emptied spatial arrangement
shown during the reasoning phase. Participants listened to four symptomsand had to indicate which chemical most likely caused the symptoms.The sequence sting, rash, eyelid swelling, and lacrimation is an exampleof an a-ac-b-b sequence. In the example, the top left chemical is in the Arole supported by sting (pain) and rash (skin); the top right chemical is inthe B role supported by eyelid swelling (eyes) and lacrimation (eyes); thebottom left chemical is in the C role supported only by rash (skin). The Dchemical was not supported by symptoms presented in this sequence andwas located diagonally to the A chemical (see main text for moreinformation)
1402 Psychon Bull Rev (2017) 24:1398–1412

iView X 2.5 following 5-point calibration and analyzed withBeGaze 2.3. Fixation detection used a dispersion threshold of80 pixels and a duration threshold of 100 ms. For the statisticalanalyses we used the R language (R Core Team, 2016) andJASP 0.8.0.0 (JASP Team, 2016).
Material
The four chemicals were assigned to screen quadrants (seeFig. 1, left). Each quadrant enclosed three rectangular frames,which contained the three symptom classes that the respectivechemical could cause. For example, the chemical at the top leftin Fig. 1 triggered symptoms derived from the symptom clas-ses circulation, pain, and skin. One symptom class was unique(pain for the top left chemical) and two symptom classes wereshared with other chemicals. Table 2 lists all eight symptomclasses and symptoms.
Frames containing symptom classes were arranged in acircle. The distance between the center of the screen and thecenter of each rectangle was 12.2° of visual angle. The foursymptom classes that were uniquely caused by a chemicalwere presented in the center of the respective quadrant (e.g.,the symptom class pain in the center of the top left quadrant inFig. 1 is located between the symptom classes circulation andskin). The symptom classes that were triggered by twochemicals featured in two quadrants and were presented intwo neighboring frames of the circle (e.g., circulation inFig. 1 is located top right and top left).
Symptoms from symptom classes that were associatedwithone chemical are denoted with a single small letter (a, b, c, ord). Symptoms from symptom classes that were associatedwith two chemicals are denoted with two small letters (e.g.,symptom ab can be caused by Chemical A and Chemical B).
A single trial in the reasoning phase consisted of foursymptoms presented auditorily; for example, sting, rash, eye-lid swelling, and lacrimation (Fig. 1, right). In this example,sting (belonging to the pain class) supported the top left chem-ical; rash (skin) supported the top left and the bottom left
chemicals, and eyelid swelling (eyes) and lacrimation (eyes)supported the top right chemical. The chemical that was as-sumed to have an advantage in participants’ diagnostic rea-soning is the chemical in the A role (henceforth called A chem-ical). The advantage may have been due to (1) the chemicalbeing supported by more symptoms than alternativechemicals, or (2) it having received equal support like alterna-tives but benefited from being supported by the first symptom,or (3) the chemical being supported by an equal number ofsymptoms but by more diagnostic symptoms or symptomsfrom more than one symptom category. The competing alter-native chemical in this study is referred to as the chemical inthe B role (henceforth called B chemical), with further com-petitors referred to as C and D chemicals. Note that the chem-ical roles changed from trial to trial. Thus, the eye symptomcould support a chemical in the A role in one trial but support achemical in the C role in another trial.
Sixteen symptom sequences were constructed thatcontained support for two or three hypotheses and consistedof symptoms that supported either one or two hypotheses. Asubset of nine sequences shown in Table 3 was selected todemonstrate how memory indexing tracks the subjective sta-tus of hypotheses and provides information about coherencemaximization. In all of the selected sequences, the first symp-tom established a single leading hypothesis. The developmentof a coherent explanation can most clearly be observed whenthe first symptom supported one hypothesis. The remainingseven sequences mainly differed from the selected sequencesin the order of symptom presentation and in the first symptomsupporting two hypotheses (A and C or A and B). The full setof sequences and a discussion of order effects on responseproportions are included in the Supplemental Materials.
The nine selected sequences varied in the number of con-secutive symptoms that supported the A hypothesis from thebeginning of the sequence onward (see Table 3). Sequence 1in Table 3 started with three symptoms supporting A (a-ab-ab-b). Sequence 2 started with two symptoms supportingA (a-ac-b-b). Sequences 3 and 4 started with a single a symptom (a-bd-bd-a and a-bd-a-ab). Sequence 5 started with one
Table 2 Symptom classes and symptoms (originally in German)
Symptom class Symptom Symptom
Eyes (Augen) Eyelid swelling (Lidschwellung) Lacrimation (Tränenfluss)
Respiration (Atemwege) Difficulty breathing (Erstickungsgefühl) Cough (Husten)
Neurological (Nervensystem) Speech disorder (Sprachstörung) Paralysis (Lähmung)
Circulation (Kreislauf) Sweating (Schwitzen) Fainting (Ohnmacht)
Pain (Schmerzen) Twinge (Stechen) Sting (Brennen)
Skin (Haut) Rash (Ausschlag) Acid burn (Verätzung)
Digestion (Verdauung) Vomiting (Erbrechen) Diarrhoea (Durchfall)
Psychoactive (Psychoaktiv) Aggression (Aggressivität) Anxiety (Angstzustände)
Psychon Bull Rev (2017) 24:1398–1412 1403
symptom supporting B (b-ab-ac-ac). Sequences 6 and 7started with two symptoms supporting B (b-b-ac-a and b-b-a-ac). Sequences 8 and 9 again started with one symptomsupporting A and only differed in the second symptom eithersupporting B or D.
For each symptom sequence, each of the four chemicalsappeared once in the A role. This was possible due to the sym-metrical symptom class patterns of the chemicals. All possibleassignments of symptoms (e.g., lacrimation) to symptom se-quences (e.g., a-ab-ab-a) were constructed with the restrictionthat no single symptom occurred twice in the same symptomsequence (e.g., lacrimation occurred only once within the se-quence a-ab-ab-a). Each sequence was tested four times perparticipant, with each chemical assuming theA role, resulting in64 (16 sequences × 4 chemicals) trials per participant.
Procedure
Participants first learned about symptoms and the eight symp-tom classes that they belonged to. Learning of symptoms andsymptom classes proceeded by categorizing single symptomsin one of eight symptom classes (see e.g., Jahn & Braatz,2014; Rebitschek, Krems, & Jahn, 2015) and continued untilall symptoms had been answered correctly once in sequence.Learning about symptoms and symptom classes took 11 minon average (SD = 10 min).
In the next phase, participants learned about the fourchemicals. They studied the spatial layout as shown in the lefthalf of Fig. 1. During test trials, participants saw only the emptiedspatial frames (Fig. 1, right), and single symptoms were present-ed auditorily. Participants were not explicitly instructed to look atthe spatial frames, neither during learning nor during the reason-ing phase. They responded by indicating which chemical couldhave caused the presented symptom by pressing one of four keyson a number block of a keyboard. The keys matched the spatial
positions of the chemicals (e.g., number 1 indicated the chemicalat the bottom left). Feedback was provided auditorily and visu-ally (see Jahn & Braatz, 2014). Learning lasted until participantsassigned 95% of all symptoms correctly. Learning which symp-tom classes could be caused bywhich chemicals took 10minuteson average (SD = 9 min).
Each reasoning trial was initiated by the participant bypressing the space bar. The next slide showed the emptiedrectangular frames (Fig. 1, right) and participants were audi-torily presented with a sequence of four symptoms. Eachsymptom presentation lasted 1,000 ms followed by a delayof 2,000 ms. After the fourth symptom and the delay, theresponse interval started. Participants indicated their diagnosisusing the same keys as practiced during learning. Responsetime was not restricted. On average participants took 2,750 ms(SD = 2367 ms) to respond.
After solving three practice trials at the beginning of thereasoning phase, the eye tracker was calibrated. Participantsthen worked through 64 reasoning trials which took on aver-age 21 minutes (SD = 3 min).
Results
Mean response proportions and mean fixation proportionsbased on fixation durations are reported for the subset of ninesequences (for an overview of the sequences see, Table 3,second column). Response data for all tested sequences arepresented in the Supplemental Materials.
Diagnostic response
Diagnostic responses were recorded after the sequence of foursymptoms had been presented (end-of-sequence responsemode). Participants chose one of the four chemicals (A, B,
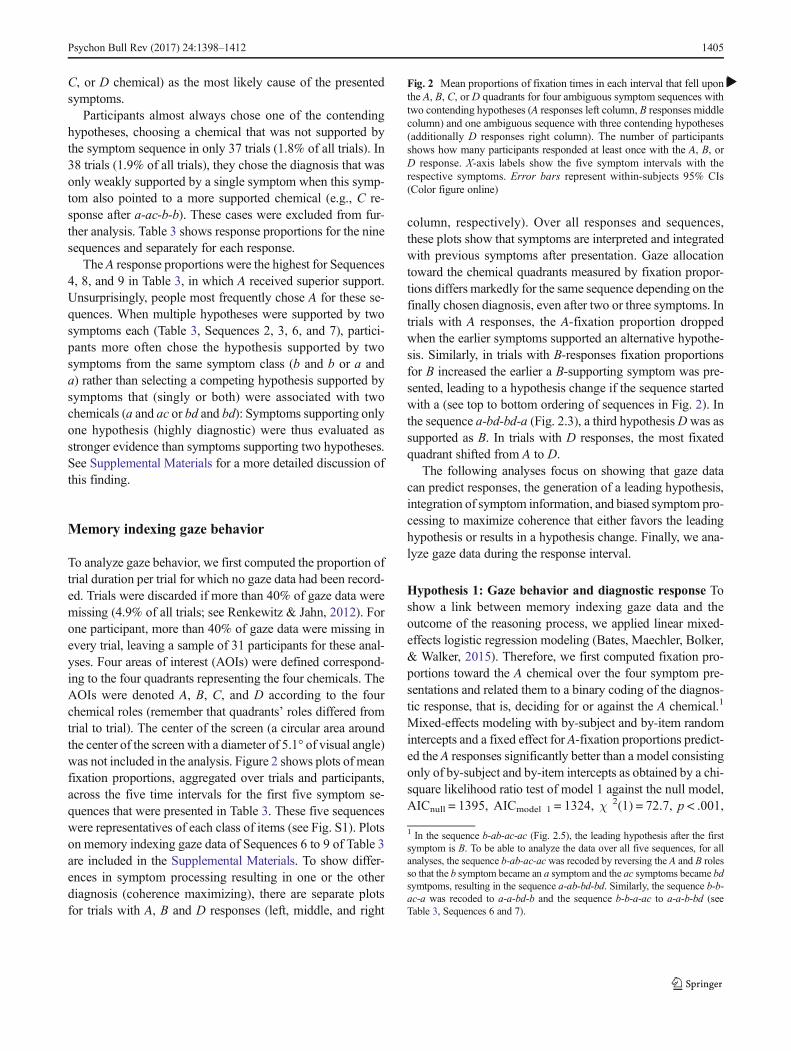
Table 3 Mean response proportions, standard deviations, and within-subjects 95% confidence intervals (Morey, 2008) for nine symptom sequences
No. Sequence Response A Response B Response D
M (SD) 95% CI M (SD) 95% CI M (SD) 95% CI
1 a-ab-ab-b 0.54 (0.23) [0.46, 0.63] 0.44 (0.23) [0.35, 0.52]
2 a-ac-b-b 0.40 (0.39) [0.29, 0.51] 0.58 (0.30) [0.46, 0.69]
3 a-bd-bd-a 0.54 (0.28) [0.44, 0.64] 0.31 (0.23) [0.23, 0.39] 0.12 (0.15) [0.06, 0.17]
4 a-bd-a-ab 0.77 (0.19) [0.69, 0.84] 0.18 (0.21) [0.10, 0.26]
5 b-ab-ac-ac 0.57 (0.26) [0.47, 0.66] 0.25 (0.28) [0.15, 0.35]
6 b-b-ac-a 0.40 (0.34) [0.27, 0.52] 0.53 (0.36) [0.40, 0.67]
7 b-b-a-ac 0.36 (0.32) [0.24, 0.47] 0.59 (0.33) [0.47, 0.71]
8 a-b-ab-ac 0.73 (0.24) [0.65, 0.82] 0.21 (0.21) [0.13, 0.29]
9 a-d-ab-ac 0.63 (0.27) [0.54, 0.73] 0.18 (0.20) [0.10, 0.25]
Italics mark the consecutive symptoms (three, two, one, or zero) that supported the A hypothesis from the beginning of the sequence onward
1404 Psychon Bull Rev (2017) 24:1398–1412
C, or D chemical) as the most likely cause of the presentedsymptoms.
Participants almost always chose one of the contendinghypotheses, choosing a chemical that was not supported bythe symptom sequence in only 37 trials (1.8% of all trials). In38 trials (1.9% of all trials), they chose the diagnosis that wasonly weakly supported by a single symptom when this symp-tom also pointed to a more supported chemical (e.g., C re-sponse after a-ac-b-b). These cases were excluded from fur-ther analysis. Table 3 shows response proportions for the ninesequences and separately for each response.
The A response proportions were the highest for Sequences4, 8, and 9 in Table 3, in which A received superior support.Unsurprisingly, people most frequently chose A for these se-quences. When multiple hypotheses were supported by twosymptoms each (Table 3, Sequences 2, 3, 6, and 7), partici-pants more often chose the hypothesis supported by twosymptoms from the same symptom class (b and b or a anda) rather than selecting a competing hypothesis supported bysymptoms that (singly or both) were associated with twochemicals (a and ac or bd and bd): Symptoms supporting onlyone hypothesis (highly diagnostic) were thus evaluated asstronger evidence than symptoms supporting two hypotheses.See Supplemental Materials for a more detailed discussion ofthis finding.
Memory indexing gaze behavior
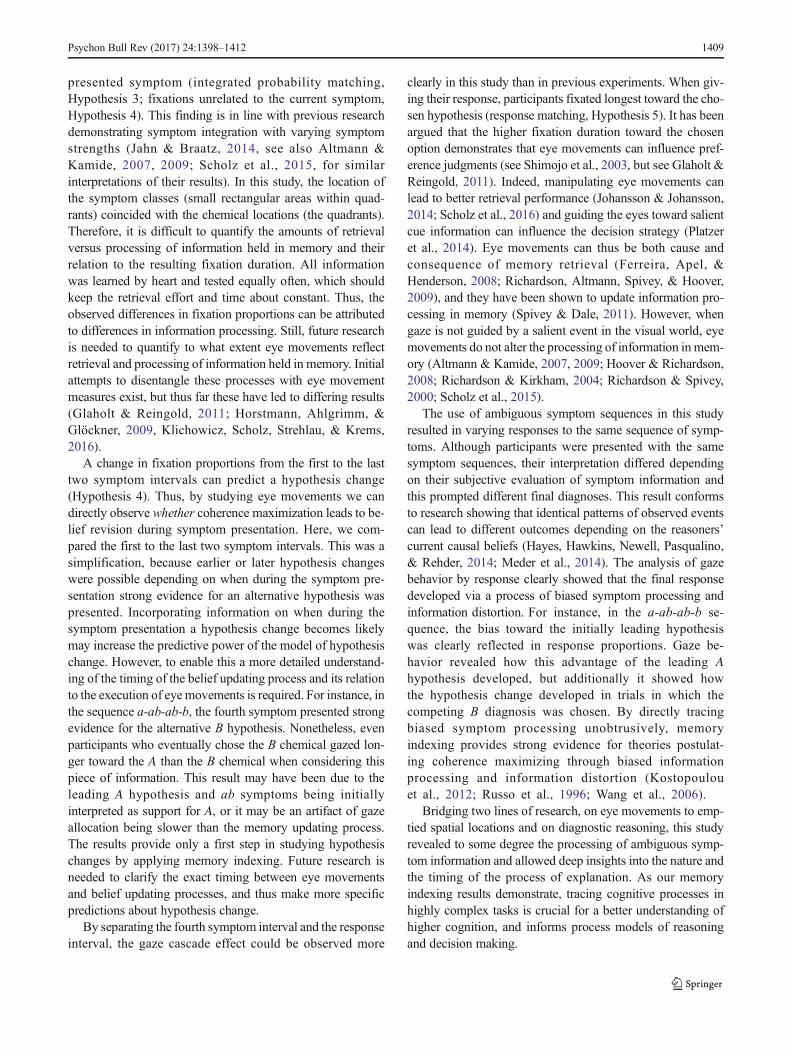
To analyze gaze behavior, we first computed the proportion oftrial duration per trial for which no gaze data had been record-ed. Trials were discarded if more than 40% of gaze data weremissing (4.9% of all trials; see Renkewitz & Jahn, 2012). Forone participant, more than 40% of gaze data were missing inevery trial, leaving a sample of 31 participants for these anal-yses. Four areas of interest (AOIs) were defined correspond-ing to the four quadrants representing the four chemicals. TheAOIs were denoted A, B, C, and D according to the fourchemical roles (remember that quadrants’ roles differed fromtrial to trial). The center of the screen (a circular area aroundthe center of the screen with a diameter of 5.1° of visual angle)was not included in the analysis. Figure 2 shows plots of meanfixation proportions, aggregated over trials and participants,across the five time intervals for the first five symptom se-quences that were presented in Table 3. These five sequenceswere representatives of each class of items (see Fig. S1). Plotson memory indexing gaze data of Sequences 6 to 9 of Table 3are included in the Supplemental Materials. To show differ-ences in symptom processing resulting in one or the otherdiagnosis (coherence maximizing), there are separate plotsfor trials with A, B and D responses (left, middle, and right
column, respectively). Over all responses and sequences,these plots show that symptoms are interpreted and integratedwith previous symptoms after presentation. Gaze allocationtoward the chemical quadrants measured by fixation propor-tions differs markedly for the same sequence depending on thefinally chosen diagnosis, even after two or three symptoms. Intrials with A responses, the A-fixation proportion droppedwhen the earlier symptoms supported an alternative hypothe-sis. Similarly, in trials with B-responses fixation proportionsfor B increased the earlier a B-supporting symptom was pre-sented, leading to a hypothesis change if the sequence startedwith a (see top to bottom ordering of sequences in Fig. 2). Inthe sequence a-bd-bd-a (Fig. 2.3), a third hypothesisDwas assupported as B. In trials with D responses, the most fixatedquadrant shifted from A to D.
The following analyses focus on showing that gaze datacan predict responses, the generation of a leading hypothesis,integration of symptom information, and biased symptom pro-cessing to maximize coherence that either favors the leadinghypothesis or results in a hypothesis change. Finally, we ana-lyze gaze data during the response interval.
Hypothesis 1: Gaze behavior and diagnostic response Toshow a link between memory indexing gaze data and theoutcome of the reasoning process, we applied linear mixed-effects logistic regression modeling (Bates, Maechler, Bolker,& Walker, 2015). Therefore, we first computed fixation pro-portions toward the A chemical over the four symptom pre-sentations and related them to a binary coding of the diagnos-tic response, that is, deciding for or against the A chemical.1
Mixed-effects modeling with by-subject and by-item randomintercepts and a fixed effect for A-fixation proportions predict-ed the A responses significantly better than a model consistingonly of by-subject and by-item intercepts as obtained by a chi-square likelihood ratio test of model 1 against the null model,AICnull = 1395, AICmodel 1 = 1324, χ 2(1) = 72.7, p < .001,
1 In the sequence b-ab-ac-ac (Fig. 2.5), the leading hypothesis after the firstsymptom is B. To be able to analyze the data over all five sequences, for allanalyses, the sequence b-ab-ac-ac was recoded by reversing the A and B rolesso that the b symptom became an a symptom and the ac symptoms became bdsymtpoms, resulting in the sequence a-ab-bd-bd. Similarly, the sequence b-b-ac-a was recoded to a-a-bd-b and the sequence b-b-a-ac to a-a-b-bd (seeTable 3, Sequences 6 and 7).
�Fig. 2 Mean proportions of fixation times in each interval that fell uponthe A, B, C, or D quadrants for four ambiguous symptom sequences withtwo contending hypotheses (A responses left column, B responses middlecolumn) and one ambiguous sequence with three contending hypotheses(additionally D responses right column). The number of participantsshows how many participants responded at least once with the A, B, orD response. X-axis labels show the five symptom intervals with therespective symptoms. Error bars represent within-subjects 95% CIs(Color figure online)
b
Psychon Bull Rev (2017) 24:1398–1412 1405

1406 Psychon Bull Rev (2017) 24:1398–1412

Nagelkerke’s R2 = 9.0, N = 1,073. Additionally, the fixed ef-fect A-fixation proportions significantly predicted the finalchoice as revealed by the Wald-statistic (also known as z sta-tistic) testing whether the fixed-effect coefficient significantlydiffered from zero (see Table 4, Model 1). Each increase in A-fixation proportions by 0.1 increased the odds for an A re-sponse by 20.9%.
Hypothesis 2: Location matching In the first symptom inter-val, fixation proportions should reflect how much the firstsymptom supported each individual hypothesis (momentaryprobability matching). The first four symptom sequences (seeFigs. 2.1–2.4) began with an a symptom. Accordingly, the Aquadrant in the first interval should be fixated on longer thanthe other three spatial areas B, C, and D. Likewise, in thesymptom sequence commencing with a b symptom (seeFig. 2.5), B should be fixated on longer than A. Given fourpossible diagnoses, fixation proportions toward the chemicalsupported by symptoms during the first symptom intervalshould differ significantly from the chance level of .25. Asexpected and confirmed by a one-sample t test, during the firstsymptom interval, participants gazed at the chemical support-ed by the first symptom (M = 0.44, SD = 0.19) longer thanpredicted by chance, t(30) = 5.6, p < .001, 95% CI [0.37,0.51], d = 1.0.
Hypothesis 3: Integrated probability matching If eyemovements can demonstrate the integration of symptom in-formation beyond mere symptom retrieval, then when listen-ing to a symptom supporting two chemicals, participantsshould gaze longer toward the more supported chemical. Forinstance, when listening to Bsweating^ that is associated withtwo chemicals, such as A and B (see Fig. 1), participantsshould look longer toward the A than the B chemical whenA is the leading hypothesis. Alternatively, if it is merely re-trieval that automatically guides the eyes to all associated spa-tial locations, when listening to Bsweating,^ the A and B chem-ical should be looked at for about the same duration.
In all sequences presented in Fig. 2, a single hypothesis (theA chemical) was established as leading hypothesis, followedby symptoms supporting an alternative hypothesis B1.Following the hypothesis on integrated likelihood matching,fixation durations should be longer for the A chemical than forthe B chemical when listening to an ab symptom. In order totest this, fixation durations2 were aggregated for all sequencesand participants for the ab symptoms. In cases with two absymptoms in one sequence (e.g., Sequence 1 in Fig. 2), weaggregated fixation durations for the two respective intervals.A paired t test supports the hypothesis on integrated probabil-ity matching: MA = 891.1 ms, SDA = 514.6 ms, MB =385.8 ms, SDB = 220.9 ms, t(30) = 6.84, p < .001, 95% CI[354.4, 656.1], d = 1.23. That is, participants looked longertoward the chemical that received more support during thesequence of presented symptoms. Consequently, the null hy-pothesis that eye movements merely show retrieval processesshould be rejected.
Hypothesis 4: Hypothesis change To test whether a changein fixation proportions can predict the dichotomized diagnos-tic response (A or not A), we ran a second analysis of fixationproportions with a mixed-effects logistic regression model. Inthis model we included the change in fixation proportions aswell as the A-fixation proportions as predictors for the dichot-omized diagnostic response. To arrive at a measure for thechange in fixation proportions, we first computed two A-fixa-tion proportions: one for the first two symptom intervals com-puted from fixation durations during the first and secondsymptom presentations, and another for the last two symptomintervals computed from fixation durations during the thirdand fourth symptom presentations. Second, we subtractedthe A-fixation proportions for the last two intervals from theA-fixation proportions for the first two intervals. If the
Table 4 Coefficients of mixed-effects logistic regression and z statistics testing A-fixation proportions over all four symptom presentations (Model 1)and A-fixation proportions plus the proportional change in fixations from the first to the last two symptom intervals (Model 2) as predictors of the final Aresponse
Model 1 Model 2
b[95% CI]
z p b[95% CI]
z p
Intercept -0.54[-1.02, -0.05]
-0.46[-0.94, 0.03]
A-fixation proportions 1.90[1.45, 2.36]
8.2 <.001 1.96[1.50, 2.43]
8.3 <.001
Diff. A-fixation proportions -0.83[-1.21, -0.45]
-4.3 <.001
2 For this analysis, we used fixation durations because fixation proportionstoward the A chemical diminish with an increase in fixation proportions towardB. Similarly, fixation proportions toward B diminish with an increase in fixa-tion proportions toward A. Thus, fixation proportions toward differentchemicals are not independent of each other.
Psychon Bull Rev (2017) 24:1398–1412 1407

resulting difference in A-fixation proportions (first minus lasttwo symptoms) has a value greater than zero, this means that aparticipant’s orientation toward the A chemical was stronger inthe first two symptom intervals than during the last two symp-tom intervals. By contrast, a value smaller than zero indicatesthat a participant’s orientation toward the A-chemical in-creased from the first two to the last two symptom intervals.A value around zero means that A-fixation proportions weresimilar during the first two and last two symptom intervals.Mixed-effects modeling showed that a model with by-subjectand by-item random intercepts, and fixed effects for the A-fixation proportions and the difference in A-fixation propor-tions, predicted the A responses significantly better (chi-square likelihood ratio test) than a model consisting of A-fix-ation proportions as a single fixed effect and by-subject andby-item intercepts, AICmodel 1 = 1324, AICmodel 2 = 1307, χ2(2) = 19.06, p < .001, Nagelkerke’s R2 = 2.5, N = 1,073. Thedifference in A-fixation proportions significantly predicted thefinal choice as tested with the Wald-statistic (see Table 4,Model 2). Each increase in the early-minus-late-difference inA-fixation proportions by 0.1 decreased the odds for an Aresponse by 8.0%.
In addition, following a hypothesis change, fixation pro-portions changed away from the presented symptom informa-tion (fixations unrelated to the current symptom). This becamevisible in cases where participants changed their belief awayfrom the leading A hypothesis following the presentation of aninconsistent bd symptom (Sequence 3: a-bd-bd-a andSequence 4: a-bd-a-ab in Fig. 2). When listening to a bdsymptom, participants gazed longer toward the B or D chem-ical than toward the A chemical. In the a symptom intervalfollowing the presentation of the bd symptom, fixation pro-portions significantly increased for the diagnosis that was cho-sen—not just if the final diagnosis was A but also if the finaldiagnosis was B or D. In order to test the reliability of thispattern, we compared mean fixation proportions toward thechosen diagnoses for the bd-symptom interval (M= 0.35,SD = 0.33) with the immediately following a-symptom inter-val (M= 0.51, SD = 0.32), t(29) = -2.95, p = .006, 95% CI [-0.28, -0.05], d = 0.6. In the immediately following a-symptominterval and when responding with B or D (mean fixationproportion for B and D: M= 0.60, SD = 0.35), the A hypoth-esis was almost never gazed at (M= 0.11, SD = 0.18), t(20) =4.91, p < .001, 95%CI [0.28, 0.69], d = 1.1. Thus, participantsfinally choosing B or D only infrequently looked at the loca-tion of the A chemical even when an a symptom was present-ed. Instead, they looked at the location of the chemical theybelieved in.
Hypothesis 5: Response matching To determine whetherfixation proportions directed toward a participant’s final diag-nosis (e.g., A-fixation proportions when choosing the A diag-nosis) increased toward the end of the reasoning trial, a
repeated-measures ANOVA comparing fixation proportionsbetween the third (M3 = 0.33, SD3 = 0.12), fourth (M4 =0.37, SD4 = 0.13), and response (Mresp= 0.44, SDresp = 0.18)intervals for the chosen diagnosis was conducted. The testrevealed a significant increase in fixation proportions ap-proaching the response interval, Greenhouse–Geissercorrected, F(2, 41.7) = 15.96, p < .001, η p
2 = .35.Furthermore, during the response interval itself, participants’fixation proportions were the highest for the chosen diagnosis(see Fig. 2) as confirmed by a one-sample t test comparingfixation proportions to the chance level of .25, t(30) = 5.89,p < .001, 95% CI [0.38, 0.51], d = 1.1.
Discussion
In everyday life, humans have to cope with ambiguous, un-certain situations. This is particularly evident when peoplehave to find an explanation for a set of inconclusive observa-tions. How do people cope with ambiguity in such challenginginstances of diagnostic reasoning? Outcome data suggest thatpeople strive for a coherent interpretation of observations(Glöckner et al., 2010; Holyoak & Simon, 1999; Mehlhorn& Jahn, 2009; Kostopoulou et al., 2012; Wang et al., 2006). Acoherent interpretation can be achieved through biased infor-mation processing and information distortion. Observing suchprocesses directly had not been done before, because methodswere missing that could reveal the changing activation statusof hypotheses over the course of a reasoning trial. We testedcoherence maximization during diagnostic reasoningusing memory indexing—a new method that is basedon observing eye movements while participants solvememory-based, higher level cognitive tasks (Jahn &Braatz, 2014; Renkewitz & Jahn, 2010, 2012; Scholzet al., 2015). This study provides evidence that eyemovements reflect the tendency to maximize coherencein diagnostic reasoning. The current experiment showedthese effects with symptom sequences that were highlyambiguous and supported the initial hypothesis withmore or fewer symptoms in a row.
At the beginning of a reasoning trial, gaze behaviorreflected the momentary probability of hypotheses given thepresented symptom information (location matching,Hypothesis 2), replicating previous findings on the looking-at-nothing behavior (e.g., Richardson & Spivey, 2000). Eyemovements, however, did not only reflect (automatic) retriev-al processes initiated by hearing an auditorily presented symp-tom. Instead, eye movements reflected the tendency to strivefor a coherent interpretation of symptom information. Thisbecame evident during later symptom presentations, in whicheye movements were predominantly directed to locations ofsymptom interpretations consistent with the leading hypothe-sis and not to all locations that were associated with the
1408 Psychon Bull Rev (2017) 24:1398–1412
presented symptom (integrated probability matching,Hypothesis 3; fixations unrelated to the current symptom,Hypothesis 4). This finding is in line with previous researchdemonstrating symptom integration with varying symptomstrengths (Jahn & Braatz, 2014, see also Altmann &Kamide, 2007, 2009; Scholz et al., 2015, for similarinterpretations of their results). In this study, the location ofthe symptom classes (small rectangular areas within quad-rants) coincided with the chemical locations (the quadrants).Therefore, it is difficult to quantify the amounts of retrievalversus processing of information held in memory and theirrelation to the resulting fixation duration. All informationwas learned by heart and tested equally often, which shouldkeep the retrieval effort and time about constant. Thus, theobserved differences in fixation proportions can be attributedto differences in information processing. Still, future researchis needed to quantify to what extent eye movements reflectretrieval and processing of information held in memory. Initialattempts to disentangle these processes with eye movementmeasures exist, but thus far these have led to differing results(Glaholt & Reingold, 2011; Horstmann, Ahlgrimm, &Glöckner, 2009, Klichowicz, Scholz, Strehlau, & Krems,2016).
A change in fixation proportions from the first to the lasttwo symptom intervals can predict a hypothesis change(Hypothesis 4). Thus, by studying eye movements we candirectly observe whether coherence maximization leads to be-lief revision during symptom presentation. Here, we com-pared the first to the last two symptom intervals. This was asimplification, because earlier or later hypothesis changeswere possible depending on when during the symptom pre-sentation strong evidence for an alternative hypothesis waspresented. Incorporating information on when during thesymptom presentation a hypothesis change becomes likelymay increase the predictive power of the model of hypothesischange. However, to enable this a more detailed understand-ing of the timing of the belief updating process and its relationto the execution of eye movements is required. For instance, inthe sequence a-ab-ab-b, the fourth symptom presented strongevidence for the alternative B hypothesis. Nonetheless, evenparticipants who eventually chose the B chemical gazed lon-ger toward the A than the B chemical when considering thispiece of information. This result may have been due to theleading A hypothesis and ab symptoms being initiallyinterpreted as support for A, or it may be an artifact of gazeallocation being slower than the memory updating process.The results provide only a first step in studying hypothesischanges by applying memory indexing. Future research isneeded to clarify the exact timing between eye movementsand belief updating processes, and thus make more specificpredictions about hypothesis change.
By separating the fourth symptom interval and the responseinterval, the gaze cascade effect could be observed more
clearly in this study than in previous experiments. When giv-ing their response, participants fixated longest toward the cho-sen hypothesis (response matching, Hypothesis 5). It has beenargued that the higher fixation duration toward the chosenoption demonstrates that eye movements can influence pref-erence judgments (see Shimojo et al., 2003, but see Glaholt &Reingold, 2011). Indeed, manipulating eye movements canlead to better retrieval performance (Johansson & Johansson,2014; Scholz et al., 2016) and guiding the eyes toward salientcue information can influence the decision strategy (Platzeret al., 2014). Eye movements can thus be both cause andconsequence of memory retrieval (Ferreira, Apel, &Henderson, 2008; Richardson, Altmann, Spivey, & Hoover,2009), and they have been shown to update information pro-cessing in memory (Spivey & Dale, 2011). However, whengaze is not guided by a salient event in the visual world, eyemovements do not alter the processing of information inmem-ory (Altmann & Kamide, 2007, 2009; Hoover & Richardson,2008; Richardson & Kirkham, 2004; Richardson & Spivey,2000; Scholz et al., 2015).
The use of ambiguous symptom sequences in this studyresulted in varying responses to the same sequence of symp-toms. Although participants were presented with the samesymptom sequences, their interpretation differed dependingon their subjective evaluation of symptom information andthis prompted different final diagnoses. This result conformsto research showing that identical patterns of observed eventscan lead to different outcomes depending on the reasoners’current causal beliefs (Hayes, Hawkins, Newell, Pasqualino,& Rehder, 2014; Meder et al., 2014). The analysis of gazebehavior by response clearly showed that the final responsedeveloped via a process of biased symptom processing andinformation distortion. For instance, in the a-ab-ab-b se-quence, the bias toward the initially leading hypothesiswas clearly reflected in response proportions. Gaze be-havior revealed how this advantage of the leading Ahypothesis developed, but additionally it showed howthe hypothesis change developed in trials in which thecompeting B diagnosis was chosen. By directly tracingbiased symptom processing unobtrusively, memoryindexing provides strong evidence for theories postulat-ing coherence maximizing through biased informationprocessing and information distortion (Kostopoulouet al., 2012; Russo et al., 1996; Wang et al., 2006).
Bridging two lines of research, on eye movements to emp-tied spatial locations and on diagnostic reasoning, this studyrevealed to some degree the processing of ambiguous symp-tom information and allowed deep insights into the nature andthe timing of the process of explanation. As our memoryindexing results demonstrate, tracing cognitive processes inhighly complex tasks is crucial for a better understanding ofhigher cognition, and informs process models of reasoningand decision making.
Psychon Bull Rev (2017) 24:1398–1412 1409
Acknowledgments This research was supported by the Swiss NationalScience Foundation (SNF) Grant PP00P1_157432 to the first author andGerman Research Foundation (DFG) Grants KR 1057/17-1 and JA 1761/7-1 to the second and third authors. The authors would like to thankRicarda Fröde and Claudia Dietzel for their help in conducting the exper-iment, and Bettina von Helversen, Peter Shepherdson, YvonneOberholzer, and Tibor Petzoldt for helpful comments on an earlier versionof the manuscript.
References
Allopenna, P. D., Magnuson, J. S., & Tanenhaus, M. K. (1998). Trackingthe time course of spoken word recognition using eye movements:Evidence for continuous mapping models. Journal of Memory andLanguage, 38, 419–439. doi:10.1006/jmla.1997.2558
Altmann, G. T. M. (2004). Language-mediated eye movements in theabsence of a visual world: The ‘blank screen paradigm’.Cognition, 93, 79–87. doi:10.1016/j.cognition.2004.02.005
Altmann, G. T. M., & Kamide, Y. (2007). The real-time mediation ofvisual attention by language and world knowledge: Linking antici-patory (and other) eye movements to linguistic processing. Journalof Memory and Language, 57, 502–518. doi:10.1016/j.jml.2006.12.004
Altmann, G. T. M., & Kamide, Y. (2009). Discourse-mediation of themapping between language and the visual world: Eye movementsand mental representation. Cognition, 111, 55–71. doi:10.1016/j.cognition.2008.12.005
Amaya, A. (2015). The tapestry of reason: An inquiry into the nature ofcoherence and its role in legal argument. Oxford: Hart.
Bates, D., Maechler, M., Bolker, B., & Walker, S. (2015). Fitting linearmixed-effects models using lme4. Journal of Statistical Software,67, 1–48. doi:10.18637/jss.v067.i01
Baumann, M. R. K., Krems, J. F., & Ritter, F. E. (2010). Learning fromexamples does not prevent order effects in belief revision. Thinkingand Reasoning, 16, 98–130. doi:10.1080/13546783.2010.484211
Busemeyer, J. R., & Townsend, J. T. (1993). Decision field theory: Adynamic-cognitive approach to decision making in an uncertain en-vironment. Psychological Review, 100, 432–459. doi:10.1037/0033-295X.100.3.432
R Core Team. (2016). R: A language and environment for statisticalcomputing. Vienna: R Foundation for Statistical Computing.Available from https://www.R-project.org/.
Croskerry, P. (2003). The importance of cognitive errors in diagnosis andstrategies to minimize them. Academic Medicine, 78, 775–780. doi:10.1097/00001888-200308000-00003
DeKay, M. L., Stone, E. R., & Sorenson, C. M. (2011). Sizing up infor-mation distortion: Quantifying its effect on the subjective values ofchoice options. Psychonomic Bulletin & Review, 19, 349–356. doi:10.3758/s13423-011-0184-8.
Ferreira, F., Apel, J., & Henderson, J. M. (2008). Taking a new look atlooking at nothing. Trends in Cognitive Sciences, 12, 405–410. doi:10.1016/j.tics.2008.07.007
Fiedler, S., & Glöckner, A. (2012). The dynamics of decision making inrisky choice: An eye-tracking analysis. Frontiers in Psychology, 3,1–18. doi:10.3389/fpsyg.2012.00335
Glaholt, M.G., &Reingold, E.M. (2011). Eyemovementmonitoring as aprocess tracing methodology in decision making research. Journalof Neuroscience, Psychology, and Economics, 4, 125–146. doi:10.1037/a0020692
Glöckner, A., & Betsch, T. (2008). Modeling option and strategy choiceswith connectionist networks: Towards an integrative model of auto-matic and deliberate decision making. Judgment and DecisionMaking, 3, 215–228.
Glöckner, A., Betsch, T., & Schindler, N. (2010). Coherence shifts inprobabilistic inference tasks. Journal of Behavioral DecisionMaking, 23(5), 439–462.
Hagmayer, Y., & Kostopoulou, O. (2013). A parallel constraint satisfac-tion model of information distortion in diagnostic reasoning. In M.Knauff, M. Pauen, N. Sebanz, & I. Wachsmuth (Eds.), Proceedingsof the 35th annual conference of the cognitive science society (pp.531–536). Austin: Cognitive Science Society.
Hayes, B. K., Hawkins, G. E., Newll, B. R., Pasqualino,M., & Rehder, B.(2014). The role of causal models in multiple judgments under un-certainty. Cognition, 133, 611–620. doi:10.1016/j.cognition.2014.08.011
Hogarth, R. M., & Einhorn, H. J. (1992). Order effects in belief updating:The belief-adjustment model. Cognitive Psychology, 24, 1–55. doi:10.1016/0010-0285(92)90002-J
Holyoak, K. J., & Simon, D. (1999). Bidirectional reasoning in decisionmaking by constraint satisfaction. Journal of ExperimentalPsychology: General, 128, 3–31. doi:10.1037/0096-3445.128.1.3
Hoover, M. A., & Richardson, D. C. (2008). When facts go down therabbit hole: Contrasting features and objecthood as indexes to mem-ory. Cognition, 108, 533–542. doi:10.1016/j.cognition.2008.02.011
Horstmann, N., Ahlgrimm, A., & Glöckner, A. (2009). How distinct areintuition and deliberation? An eye-tracking analysis of instruction-induced decision modes. Judgment and Decision Making, 4, 335-354. http://papers.ssrn.com/abstract=1393729.
Huettig, F., Olivers, C. N. L., & Hartsuiker, R. J. (2011). Looking, lan-guage, and memory: Bridging research from the visual world andvisual search paradigms. Acta Psychologica, 137, 138–150. doi:10.1016/j.actpsy.2010.07.013
Jahn, G., & Braatz, J. (2014). Memory indexing of sequential symptomprocessing in diagnostic reasoning. Cognitive Psychology, 68, 59–97. doi:10.1016/j.cogpsych.2013.11.002
JASP Team. (2016). JASP (Version 0.8.0.0)[Computer software].Available from https://jasp-stats.org/
Johansson, R., Holsanova, J., Dewhurst, R., & Holmqvist, K. (2012). Eyemovements during scene recollection have a functional role, butthey are not reinstatements of those produced during encoding.Journal of Experimental Psychology: Human Perception andPerformance, 38, 1289–1314. doi:10.1037/a0026585
Johansson, R., Holsanova, J., & Holmqvist, K. (2006). Pictures and spo-ken descriptions elicit similar eye movements during mental imag-ery, both in light and in complete darkness. Cognitive Science, 30,1053–1079. doi:10.1207/s15516709cog0000
Johansson, R., & Johansson, M. (2014). Look here, eye movements playa functional role in memory retrieval. Psychological Science, 25,236–242. doi:10.1177/0956797613498260
Johnson, T. R., & Krems, J. F. (2001). Use of current explanations inmulticausal abductive reasoning. Cognitive Science, 25, 903–939.doi:10.1207/s15516709cog2506_2
Klichowicz, A., Scholz, A., Strehlau, S., & Krems, J. F. (2016).Differentiating between encoding and processing during sequentialdiagnostic reasoning: An eye-tracking study. In D. Papafragou, D.Grodner, D. Mirman, & J. C. Trueswell (Eds.), Proceedings of the38th annual conference of the cognitive science society (pp. 129–134). Austin: Cognitive Science Society.
Kostopoulou, O., Russo, J. E., Keenan, G., Delaney, B. C., & Douiri, A.(2012). Information distortion in physicians’ diagnostic judgments.Medical Decision Making, 32, 831–839. doi:10.1177/0272989X12447241
Krajbich, I., Armel, C., & Rangel, A. (2010). Visual fixations and thecomputation and comparison of value in simple choice. NatureNeuroscience, 13, 1292–1298. doi:10.1038/nn.2635
Lange, N. D., Thomas, R. P., & Davelaar, E. J. (2012). Temporal dynam-ics of hypothesis generation: The influences of data serial order, dataconsistency, and elicitation timing.Frontiers in Psychology, 3, 1–16.doi:10.3389/fpsyg.2012.00215
1410 Psychon Bull Rev (2017) 24:1398–1412
Martarelli, C. S., Mast, F. W., & Hartmann, M. (2017). Time in the eye ofthe beholder: Gaze position reveals spatial-temporal associationsduring encoding and memory retrieval of future and past. Memory& Cognition, 45, 40-48. doi:10.3758/s13421-016-0639-2.
McClelland, J. L., & Rumelhart, D. E. (1981). An interactive model ofcontext effects in letter perception. Part 1. An account of basic find-ings. Psychological Review, 88, 375-407.
McKenzie, C. R. M. (1998). Taking into account the strength of an alter-native hypothesis. Journal of Experimental Psychology: Learning,Memory, and Cognition, 24, 771–792. doi:10.1037/0278-7393.24.3.771
Meder, B., Mayrhofer, R., & Waldmann, M. R. (2014). Structure induc-tion in diagnostic causal reasoning. Psychological Review, 121,277–301. doi:10.1037/a0035944
Mehlhorn, K., & Jahn, G. (2009). Modeling sequential information inte-gration with parallel constraint satisfaction. In N. A. Taatgen & H.van Rijn (Eds.), Proceedings of the 31st annual conference of thecognitive science society (pp. 2469–2474). Austin: CognitiveScience Society.
Mehlhorn, K., Taatgen, N. A., Lebiere, C., & Krems, J. F. (2011).Memory activation and the availability of explanations in sequentialdiagnostic reasoning. Journal of Experimental Psychology:Learning, Memory, and Cognition, 37, 1391–1411. doi:10.1037/a0023920
Morey, R. D. (2008). Confidence intervals from normalized data: A cor-rection to Cousineau. In Tutorials in Quantitative Methods forPsychology, 4, 61–64.
Nickerson, R. S. (1998). Confirmation bias: A ubiquitous phenomenon inmany guises. Review of General Psychology, 2, 175–220. doi:10.1037//1089-2680.2.2.175
Orquin, J., & Mueller Loose, S. (2013). Attention and choice: A reviewon eye movements in decision making. Acta Psychologica, 144,190–206. doi:10.1016/j.actpsy.2013.06.003
Patel, V. L., Arocha, J. F., & Zhang, J. (2005). Thinking and reasoning inmedicine. In K. J. Holyoak & R. G. Morrison (Eds.), TheCambridge handbook of thinking and reasoning (pp. 727–750).New York: Cambridge University Press.
Platzer, C., Bröder, A., & Heck, D. W. (2014). Deciding with the eye:How the visually manipulated accessibility of information in mem-ory influences decision behavior. Memory & Cognition, 42, 595–608. doi:10.3758/s13421-013-0380-z
Read, S. J., Vanman, E. J., &Miller, L. C. (1997). Connectionism, parallelconstraint satisfaction processes, and gestalt principles:(Re)introducing cognitive dynamics to social psychology.Personality and Social Psychology Review, 1, 26–53. doi:10.1207/s15327957pspr0101_3.
Rebitschek, F., Bocklisch, F., Scholz, A., Krems, J. F., & Jahn, G. (2015).Biased processing of ambiguous symptoms favors the initially lead-ing hypothesis in sequential diagnostic reasoning. ExperimentalPsychology, 62, 287–305. doi:10.1027/1618-3169/a000298
Rebitschek, F., Krems, J. F., & Jahn, G. (2015). Memory activation ofmultiple hypotheses in sequential diagnostic reasoning. Journal ofCognitive Psychology, 6, 780–796. doi:10.1080/20445911.2015.1026825.
Rebitschek, F., Scholz, A., Bocklisch, F., Krems, J. F., & Jahn, G. (2012).Order effects in diagnostic reasoning with four candidate hypothe-ses. In N.Miyake, D. Peebles, & R. P. Cooper (Eds.),Proceedings ofthe 34th annual conference of the cognitive science society (pp. 905–910). Austin: Cognitive Science Society.
Renkewitz, F., & Jahn, G. (2010). Tracking memory search for cue in-formation. In A. Glöckner & C. Witteman (Eds.), Foundations fortracing intuition: Challenges and methods (pp. 199–218). NewYork: Psychology Press.
Renkewitz, F., & Jahn, G. (2012). Memory indexing: A novel method fortracing memory processes in complex cognitive tasks. Journal of
Experimental Psychology: Learning, Memory, and Cognition, 38,1622–1639. doi:10.1037/a0028073
Richardson, D. C., Altmann, G. T. M., Spivey, M. J., & Hoover,M. A. (2009). Much ado about eye movements to nothing: Aresponse to Ferreira et al.: Taking a new look at looking atnothing. Trends in Cognitive Sciences, 13, 235–236. doi:10.1016/j.tics.2009.02.006
Richardson, D. C., & Kirkham, N. Z. (2004). Multimodal events andmoving locations: Eye movements of adults and 6-month-olds re-veal dynamic spatial indexing. Journal of Experimental Psychology:General, 133, 46–62. doi:10.1037/0096-3445.133.1.46
Richardson, D. C., & Spivey, M. J. (2000). Representation, space andhollywood squares: Looking at things that aren’t there anymore.Cognition, 76, 269–295. doi:10.1016/S0010-0277(00)00084-6
Rumelhart, D. E., Smolensky, P., McClelland, J. L., & Hinton, G. E.(1986). Schemata and sequential thought processes in PDP models.In J. L. McClelland, D. E. Rumelhart, & The PDP Research Group(Eds.), Parallel distributed processing: Explorations in the micro-structure of cognition, (Vol. 2, pp. 7–57). Cambridge, MA: MITPress.
Russo, J. E., Medvec, V. H., & Meloy, M. G. (1996). The distortion ofinformation during decisions. Organizational Behavior and HumanDecision Processes, 66, 102–110. doi:10.1006/obhd.1996.0041
Scholz, A., Mehlhorn, K., & Krems, J. F. (2016). Listen up, eye move-ments play a role in verbal memory retrieval. PsychologicalResearch, 80, 149–158. doi:10.1007/s00426-014-0639-4.
Scholz, A., von Helversen, B., & Rieskamp, J. (2015). Eye movementsreveal memory processes during similarity- and rule-based decisionmaking.Cognition, 136, 228–246. doi:10.1016/j.cognition.2014.11.019
Schulte-Mecklenbeck, M., Kühberger, A., & Ranyard, R. (2011). Therole of process data in the development and testing of processmodels of judgment and decision making. Judgment and DecisionMaking, 6, 733–739.
Shimojo, S., Simion, C., Shimojo, E., & Scheier, C. (2003). Gaze biasboth reflects and influences preference. Nature Neuroscience, 6,1317–1322. doi:10.1038/nn1150
Simon, D., Snow, C. J., & Read, S. J. (2004). The redux of cognitiveconsistency theories: Evidence judgments by constraint satisfaction.Journal of Personality and Social Psychology, 86, 814–837. doi:10.1037/0022-3514.86.6.814.
Simon, D., Stenstrom, D. M., & Read, S. J. (2015). The coherence effect:Blending cold and hot cognitions. Journal of Personality and SocialPsychology, 109, 369–394. doi:10.1037/pspa0000029.
Spivey, M. J., & Dale, R. (2011). Eye movements both reveal and influ-ence problem solving. In S. P. Liversedge, I. Gilchrist, & S. Everling(Eds.), The Oxford handbook of eye movements (pp. 551–562). NewYork: Oxford University Press.
Spivey, M. J., & Geng, J. J. (2001). Oculomotor mechanisms activated byimagery and memory: Eye movements to absent objects.Psychological Research, 65, 235–241. doi:10.1007/s004260100059
Stewart, N., Hermens, F., & Matthews, W. J. (2015). Eye movements inrisky choice. Journal of Behavioral Decision Making, 29, 116–136.doi:10.1002/bdm.1854.
Strickland, B., & Keil, F. (2011). Event completion: Event based infer-ences distort memory in a matter of seconds. Cognition, 121, 409–415. doi:10.1016/j.cognition.2011.04.007
Tanenhaus, M. K., Spivey-Knowlton, M. J., Eberhard, K. M., & Sedivy,J. C. (1995). Integration of visual and linguistic information in spo-ken language comprehension. Science, 268, 1632–1634. doi:10.1126/science.7777863
Thagard, P. (1989). Explanatory coherence. Behavioral and BrainSciences, 12, 435–467. doi:10.1017/S0140525X00057046.
Thomas, R. P., Dougherty, M. R., Sprenger, A. M., & Harbison, J. I.(2008). Diagnostic hypothesis generation and human judgment.
Psychon Bull Rev (2017) 24:1398–1412 1411

Psychological Review, 115, 155–185. doi:10.1037/0033-295X.115.1.155
Wang, H., Johnson, T. R., & Zhang, J. (2006). The order effect in humanabductive reasoning: An empirical and compuational study. Journalof Experimental & Theoretical Artificial Intelligence, 18, 215–247.doi:10.1080/09528130600558141
Weber, E. U., Böckenholt, U., Hilton, D. J., & Wallace, B. (1993).Determinants of diagnostic hypothesis generation: Effects of infor-mation, base rates, and experience. Journal of ExperimentalPsychology: Learning, Memory, and Cognition, 19, 1151–1164.doi:10.1037/0278-7393.19.5.1151
1412 Psychon Bull Rev (2017) 24:1398–1412
Related Documents