City of Riverside WASTEWATER COLLECTION AND TREATMENT FACILITIES INTEGRATED MASTER PLAN VOLUME 4: WASTEWATER TREATMENT SYSTEM CHAPTER 7: SECONDARY TREATMENT FINAL February 2008 10540 TALBERT AVENUE, SUITE 200 EAST • FOUNTAIN VALLEY, CALIFORNIA 92708 • (714) 593-5100 • FAX (714) 593-5101 H:\Client\Riversid_SAOW\7472A00\Rpt\Volume 04\Ch07.doc

Welcome message from author
This document is posted to help you gain knowledge. Please leave a comment to let me know what you think about it! Share it to your friends and learn new things together.
Transcript

City of Riverside WASTEWATER COLLECTION AND TREATMENT FACILITIES INTEGRATED MASTER PLAN VOLUME 4: WASTEWATER TREATMENT SYSTEM CHAPTER 7: SECONDARY TREATMENT FINAL February 2008
10540 TALBERT AVENUE, SUITE 200 EAST • FOUNTAIN VALLEY, CALIFORNIA 92708 • (714) 593-5100 • FAX (714) 593-5101H:\Client\Riversid_SAOW\7472A00\Rpt\Volume 04\Ch07.doc

February 2008 i H:\Client\Riversid_SAOW\7472A00\Rpt\Volume 04\Ch07.doc
City of Riverside
WASTEWATER COLLECTION AND TREATMENT FACILITIES INTEGRATED MASTER PLAN
VOLUME 4: WASTEWATER TREATMENT SYSTEM
CHAPTER 7: SECONDARY TREATMENT
TABLE OF CONTENTS
Page No. 7.1 PURPOSE.............................................................................................................. 7-1 7.2 RECOMMENDATIONS AND CONCLUSIONS ...................................................... 7-1 7.3 DESCRIPTION OF EXISTING TREATMENT ........................................................ 7-2
7.3.1 Process Design Criteria .............................................................................. 7-2 7.3.2 Sludge-Settling Characteristics - Clariflux™ Model .................................... 7-4
7.4 IDENTIFICATION OF SECONDARY TREATMENT EXPANSION ALTERNATIVES FOR THE RWQCP..................................................................... 7-7 7.4.1 Enhanced Primary Treatment..................................................................... 7-7 7.4.2 Conventional Activated Sludge Process..................................................... 7-9 7.4.3 Membrane Bioreactor Process ................................................................. 7-12 7.4.4 Attached Growth Processes ..................................................................... 7-15
7.5 PROCESS MODELING OF TREATMENT ALTERNATIVES............................... 7-20 7.5.1 Conventional Activated Sludge Alternative............................................... 7-20 7.5.2 Membrane Bioreactor Alternative ............................................................. 7-20 7.5.3 Integrated Fixed Film Activated Sludge Alternative .................................. 7-20 7.5.4 Process Modeling ..................................................................................... 7-21
7.6 COMPARISON OF SECONDARY TREATMENT ALTERNATIVES .................... 7-26 7.6.1 Non-Economic Comparison...................................................................... 7-26 7.6.2 Economic Evaluation ................................................................................ 7-27
7.7 EXPANSION PROJECT PHASING...................................................................... 7-30 7.8 CONTROL OF EFFLUENT ORGANICS .............................................................. 7-30 7.9 ODOR CONTROL ................................................................................................ 7-31 7.10 RETURN ACTIVATED SLUDGE/WASTE ACTIVATED SLUDGE PUMPING ..... 7-31 7.11 REFERENCE ....................................................................................................... 7-31
APPENDIX A – BIOTRAN MODEL
LIST OF TABLES Table 7.1 Design Criteria for Expansion of the RWQCP............................................... 7-2 Table 7.2 Summary of Secondary Sludge-Settling Tests ............................................. 7-6 Table 7.3 Enhanced Primary Treatment Bench Test Results ....................................... 7-8 Table 7.4 Summary of Enhanced Primary Treatment Testing Results ......................... 7-8 Table 7.5 Comparison of Combined and Separate Membrane Tank Processes........ 7-14 Table 7.6 Comparison of Suspended and Attached Growth Processes ..................... 7-15 Table 7.7 Comparison of IFAS and MBBR Processes................................................ 7-16 Table 7.8 Comparison of Fixed Film Process Media .................................................. 7-18 Table 7.9 Modeling of Secondary Treatment Alternatives for Plant 1......................... 7-21

Table 7.10 Advantages and Disadvantages of Secondary Treatment Alternatives ...... 7-26 Table 7.11 Comparison of Recycle Treatment Alternatives.......................................... 7-27 Table 7.12 Life-Cycle Cost of Secondary Treatment Alternatives -
With Primary Effluent Equalization.............................................................. 7-28 Table 7.13 Life-Cycle Cost of Secondary Treatment Alternatives -
Without Primary Effluent Equalization......................................................... 7-28 Table 7.14 Life-Cycle Cost of Secondary Treatment Alternatives - High SRT
(Without Primary Effluent Equalization) ...................................................... 7-29
LIST OF FIGURES
Figure 7.1 RWQCP Process Flow Diagram ................................................................... 7-3 Figure 7.2 Secondary Sludge-Settling Test Results....................................................... 7-5 Figure 7.3 EPT Test Results ........................................................................................ 7-10 Figure 7.4 Process Schematic (a) CAS, (b) MBR, and (c) IFAS.................................. 7-11 Figure 7.5 MBR Process Configuration........................................................................ 7-13 Figure 7.6 Attached Growth Process Schematic.......................................................... 7-17 Figure 7.7 Attached Growth Media Options ................................................................. 7-19 Figure 7.8 CAS Alternative Proposed Site Layout ....................................................... 7-23 Figure 7.9 MBR Alternative Proposed Site Layout....................................................... 7-24 Figure 7.10 IFAS Alternative Proposed Site Layout....................................................... 7-25 Figure 7.11 Typical Weir Cover for Circular Secondary Clarifier.................................... 7-32 Figure 7.12 Typical Weir Cover for Rectangular Secondary Clarifier............................. 7-33
February 2008 ii H:\Client\Riversid_SAOW\7472A00\Rpt\Volume 04\Ch07.doc

February 2008 7-1 H:\Client\Riversid_SAOW\7472A00\Rpt\Volume 04\Ch07.doc
Chapter 7
SECONDARY TREATMENT
7.1 PURPOSE The purpose of this chapter is to summarize the evaluation of the existing secondary treatment facility at the City of Riverside (City) Regional Water Quality Control Plant (RWQCP). This chapter also includes a description of additions or modifications required for Secondary Treatment Facilities to increase capacity to 52.2-mgd annual average (AA) flow.
7.2 RECOMMENDATIONS AND CONCLUSIONS • The existing treatment system was evaluated and the plant capacity is 40-mgd AA.
• Four options for expanding the RWQCP secondary treatment plant were considered: Conventional Activated Sludge (CAS), Enhanced Primary Treatment (EPT), Membrane Bioreactor (MBR), and Integrated Fixed Film Activated Sludge (IFAS).
• EPT reduced the aeration influent biochemical oxygen demand (BOD) such that denitrification is affected and no increase in capacity is achieved. EPT therefore is not feasible for increasing the secondary treatment capacity.
• CAS, MBR, and IFAS options can all achieve the required expanded capacity. The IFAS option presents more risks than the other alternatives due to the limited experience and number of installations using this technology.
• For meeting current effluent limits, CAS is the most cost-effective alternative followed by IFAS.
• For meeting current effluent limits plus improved Whole Effluent Toxicity (WET) results and better Endocrine Disrupting Compounds (EDCs) destruction, the life-cycle costs for all options are nearly the same, within the uncertainty of the cost estimate.
• Based on the ability to achieve better effluent quality, the City chose the MBR alternative for the future expansion at a meeting on November 17, 2006.
• The current influent flow to the RWCP is approximately 80 percent of the plant’s rated capacity, indicating a need for expansion. However, because of a slow down in the housing market, the City has decided to perform this expansion in two phases. The first phase will expand the Plant 1 secondary treatment facilities from 20 to 26-mgd AA. The second phase will expand the secondary facilities from 26 to 32 mgd.

7.3 DESCRIPTION OF EXISTING TREATMENT Figure 7.1 shows the flow schematic of the existing facilities. The influent wastewater stream is divided into two plants (Plant 1 and Plant 2) after screening and grit removal.
In both Plant 1 and Plant 2, wastewater is clarified in primary clarifiers before biological treatment. Plant 1 has four rectangular aeration basins and four rectangular secondary clarifiers, and Plant 2 has six rectangular aeration basins and four circular secondary clarifiers. For a detailed description of the existing facilities, refer to Volume 4, Chapter 1 - Description of Existing Facilities. The description of facilities for handling waste solids generated during the wastewater treatment process is discussed separately in Volume 8, Chapter 1 - Biosolids Management: Existing Facilities. The design criteria for the solids handling facilities are discussed in Volume 8, Chapter 3 - Biosolids Management: Design Criteria Development.
7.3.1 Process Design Criteria
Table 7.1 presents a summary of the design criteria for expansion of facilities at the RWQCP. For detailed information on the process design criteria, refer to Volume 4, Chapter 3 - Process Design and Reliability Criteria.
Table 7.1 Design Criteria for Expansion of the RWQCP Wastewater Collection and Treatment Facilities Integrated Master Plan City of Riverside
Effluent Parameter Value Design Flows
Average Dry Weather Flow (ADWF), mgd 52.2 Peak Wet Weather Flow (PWWF), mgd 115(1) Approximate Recycle Flow to Headworks, mgd 5.5
Average Influent Wastewater Characteristics(2) BOD, mg/L 250 TSS, mg/L 250 TKN, mg/L as N 35.5
Effluent Quality Requirements BOD, mg/L <10 TSS, mg/L <10 Total Inorganic Nitrogen, mg/L as N <10(3)
Notes: (1) Based on a wet weather peak hour flow factor of 2.2. (2) Does not include impact of recycle streams from dewatering, thickening, and tertiary
filter backwash. (3) The current requirement is 13 mg/L, but this will change to 10 mg/L when flows exceed
35-mgd AA.
February 2008 7-2 H:\Client\Riversid_SAOW\7472A00\Rpt\Volume 04\Ch07.doc

RWQCP PROCESSFLOW DIAGRAM
FIGURE 7.1
= Units Out of Service= Units Out of Service
= Sampling Point No. XX
WASTEWATER COLLECTION AND TREATMENTFACILITIES INTEGRATED MASTER PLAN
JUNCTION BOX 7
JUNCTION BOX 6
AB SPLITTER
BOX
PLANT 1
PLANT 2
PLANT 1A/1BDISTRIBUTION
CHANNEL
DIST.BOX 1
DIST.BOX 2
1
3
2
8
5
6
7
8
9
10
7
6
5
4
JUNCTIONBOX 8
JUNCTIONBOX 9
JUNCTIONBOX 10
JUNCTIONBOX 11
DISTRIBUTIONBOX 18
EFFLUENTMETER
STRUCTURE
BOX 18
FILTER PUMPSTATION
JUNCTIONBOX 16
JUNCTIONBOX 17
JUNCTIONCHAMBER
JUNCTIONBOX 12
JUNCTIONBOX 13A
FILTERPUMP STATION
DISTRIBUTIONBOX 4
DISTRIBUTIONBOX 3
JUNCTIONBOX 13A
JUNCTIONBOX 14
1
2
3
4
COMBOBOX B
1
2
3
4
20-R
ivers
ide2-0
8V
olu
me 4
-F7.1
-7472A
00.c
dr

7.3.2 Sludge-Settling Characteristics - Clariflux™ Model
There are three different factors that could limit the capacity of a secondary treatment system (aeration basins and clarifiers):
• Aeration Basin Capacity: In a nitrifying system, such as at the RWQCP, the basin must be large enough to ensure full nitrification at design loads and minimum expected wastewater temperatures. Basin capacity typically increases as Mixed Liquor Suspended Solids (MLSS) concentration is increased.
• Aeration System Capacity: The aeration system (blowers and diffusers) must be able to supply sufficient oxygen to the aeration basin under design load conditions. Blower capacity must be assessed at maximum expected air temperatures. The oxygen transfer efficiency of the diffusers depends on air flux and process conditions, such as Sludge Retention Time (SRT), MLSS concentration, etc.
• Clarifier Capacity: The clarifiers must be able to produce an effluent with a low Total Suspended Solids (TSS) concentration under design loads. Typically, clarifier capacity increases with lower MLSS concentrations.
Both aeration basin capacity and aeration system capacity can be modeled to a high degree of accuracy using existing process models for the aeration system. Secondary clarifier capacity, however, depends on sludge-settling characteristics. These characteristics may be assumed or estimated based on available data such as Sludge Volume Index (SVI) data. Translating SVI data to sludge-settling characteristics does carry some risk, as the SVI test does not discriminate between sludge settling, which determines the required Surface Overflow Rater (SOR) and sludge compaction, which determines the required Return Activated Sludge (RAS) rate.
A sludge-settling test was performed to determine the sludge-settling characteristics of the mixed liquor for both Plants 1 and 2. A sample of mixed liquor from the aeration basin effluent was collected and settling tests were performed, in duplicate, in a 6-foot sludge-settling column. The test was repeated with increasingly dilute mixed liquor samples (diluted with secondary effluent) to obtain initial sludge settling velocity as a function of MLSS concentration. These results were then used to estimate the settling properties of sludge for both Plant 1 and Plant 2.
Rate of settling data for various solids concentrations was collected and compared with typical settling rates. Figure 7.2 shows a summary of the results of the settling tests. The figure shows the effect of MLSS concentrations on the settling rates (i.e., SOR). From the figure, it is apparent that the mixed liquor settles very fast in the secondary clarifiers at both Plants 1 and 2.
February 2008 7-4 H:\Client\Riversid_SAOW\7472A00\Rpt\Volume 04\Ch07.doc

FIGURE 7.2
SECONDARY SLUDGESETTLING TEST RESULTS
WASTEWATER COLLECTION AND TREATMENTFACILITIES INTEGRATED MASTER PLAN
0
1,000
2,000
3,000
4,000
5,000
6,000
7,000
8,000
9,000
10,000
0 1,000 2,000 3,000 4,000 5,000 6,000 7,000
MLSS, mg/L
SO
R,
gp
d/f
t2
BioTran Default
Plant 1
Plant 2
Typical Maximum SOR
20-Riverside2-08Volume 4-F7.2-7472A00.cdr

The figure suggests that at a typical MLSS operating concentration range of 2,500 to 3,500 mg/L, the clarifiers can be loaded at a much higher SOR ranging from 3,000 to 4,500 gpd/ft2. This indicates that sludge-settling characteristics are not the limiting factor for the RWQCP secondary clarifiers. Experience and clarifier stress testing at other plants indicate that where SOR exceeds 1,500 gpd/ft2 hydraulic effects begin to dominate, causing an increase in effluent TSS concentration, regardless of sludge-settling characteristics. Therefore, the loading of the secondary clarifiers should be limited to 1,500 gpd/ft2 under all conditions.
Hence, in order to increase the capacity at the RWQCP, the clarifiers can be operated at higher SOR, which would enable the operators to maintain a higher MLSS concentration (i.e., higher capacity) in the aeration basins. Table 7.2 summarizes the existing and proposed clarifier operating conditions.
Table 7.2 Summary of Secondary Sludge-Settling Tests Wastewater Collection and Treatment Facilities Integrated Master Plan City of Riverside
Parameter Plant 1 Plant 2
Current Operation
Average Influent Flow, mgd 11 20.1
MLSS, mg/L 2,858 3,173
SOR at Average Flow, gpd/ft2 386 494
Design for 40 mgd
Average Influent Flow, mgd 20 20
MLSS, mg/L 3,500 2,500
SOR at Average Flow, gpd/ft2 645 631
Previously during the secondary system upgrades project, done by Carollo Engineers (Carollo) in 2002, the Biotran showed that the plant capacity was approximately 36 mgd. At the time of that project, a settling test was not conducted for the evaluation of the performance of the secondary clarifiers and sludge-settling characteristics were assumed. The settling test results as discussed above indicate that the sludge-settling characteristics at both Plants 1 and 2 are very good, and better than assumed. Due to the good sludge-settling characteristics, the aeration basins can be operated at a higher MLSS to achieve higher treatment capacity. Only the MLSS in Plant 1 can be increased to 3,500 mg/L to increase capacity. The MLSS concentration in Plant 2 should not be increased beyond 2,500 mg/L, as the capacity of Plant 2 is limited by the capacity of the aeration system and not the performance of the secondary clarifiers. Making these adjustments, the combined capacity of the secondary system for Plant 1 and Plant 2 is 40 mgd, based on the Biotran model.
February 2008 7-6 H:\Client\Riversid_SAOW\7472A00\Rpt\Volume 04\Ch07.doc

7.4 IDENTIFICATION OF SECONDARY TREATMENT EXPANSION ALTERNATIVES FOR THE RWQCP
Based on the current and expected future treated effluent discharge requirements, and also keeping in mind the City’s requirements for future treatment goals and operational flexibility, the following four secondary treatment alternatives were identified:
1. Using EPT to increase secondary treatment capacity.
2. Expand the existing CAS system at Plant 1.
3. Convert the existing Plant 1 secondary treatment facility into a MBR plant capable of treating the 32.2 mgd of plant flow.
4. Convert the existing Plant 1 secondary treatment facility into an IFAS facility.
In addition to the above four processes, the Waste Activated Sludge Anaerobic Contact (WASAC) process was also considered for secondary treatment expansion. The WASAC is a proprietary process developed by Carollo that uses phosphorus-harboring organisms to remove BOD from wastewater in an anaerobic environment. The WASAC process would be inserted between the primary clarifiers and the aeration basins. This process would supplement the secondary treatment process such that the secondary expansion could be delayed. The WASAC process can potentially provide the City significant cost and energy savings. Since at this time the WASAC process has not been proven, it was not evaluated further or recommended to the City. However, in the future, if proven successful through pilot testing, the WASAC process could be a viable alternative for the City, since it could make best use of the existing facilities. Appropriate design considerations were made in this Master Plan to leave room for the potential implementation of the WASAC process.
For this project only the four alternatives listed above were evaluated. The four alternatives are described and discussed in the following subsections.
7.4.1 Enhanced Primary Treatment
EPT doses ferric iron and polymer (typically anionic polymer) to the primary influent to increase flocculation and settling, hence improving primary clarifier performance, specifically TSS and BOD removal. This reduces the load on the secondary treatment plant. The reduced load translates into reduced operating costs (mostly due to lower aeration air requirements and lower secondary solids production). In some cases, the secondary treatment capacity can also be increased. Carollo investigated whether EPT would significantly increase primary clarifier performance by performing a bench test. The effect of EPT on secondary treatment was also considered.
For the test, a sample of primary influent from each plant was taken. The sample was divided into six samples that were dosed with 0.5 mg/L of anionic polymer and different concentrations of ferric chloride: 5, 10, 15, 20, and 25 mg/L. The control received neither ferric nor polymer. All the samples were thoroughly mixed and allowed to settle in Imhoff cones. After about half an hour the settled solids were drained from the Imhoff cone and a
February 2008 7-7 H:\Client\Riversid_SAOW\7472A00\Rpt\Volume 04\Ch07.doc

sample of the supernatant was collected and submitted to the RWQCP laboratory for analysis. The test results are summarized on Figure 7.3. As shown in the figure, EPT did increase primary clarifier performance. The key results from the experiment are summarized in Table 7.3.
Table 7.3 Enhanced Primary Treatment Bench Test Results Wastewater Collection and Treatment Facilities Integrated Master Plan City of Riverside
Parameter Plant 1 Plant 2 Control
COD Removal 32% 24% TSS Removal 59% 54%
Optimum Dose Dose, mg/L as FeCl3 10 15 COD Removal 46% 45% TSS Removal 68% 71%
Maximum Dose Tested COD Removal 50% 49% TSS Removal 76% 72%
The optimum ferric chloride dose at Plant 1 appeared to be approximately 10 mg/L and 15 mg/L at Plant 2.
The effect of EPT on secondary treatment is summarized in Table 7.4.
Table 7.4 Summary of Enhanced Primary Treatment Testing Results Wastewater Collection and Treatment Facilities Integrated Master Plan City of Riverside
Parameter Conventional EPT Aeration Basin Influent
BOD, mg/L 160 112 TSS, mg/L 101 61 NH4-N, mg/L 29 28 TKN, mg/L 38 35 Soluble BOD, mg/L 64 60 BOD: TKN Ratio 4.2 3.2
Aeration Basin Operating Conditions SRT, days 5.3 8.9 MLSS, mg/L 3,500 3,500 Anoxic Fraction 25% 50% Primary Sludge, lb/d 63,250 82,900 WAS, lb/d 43,200 25,400 Digester Feed Flow, mgd 0.50 0.49 Aeration Basin Air, scfm 27,600 21,500
February 2008 7-8 H:\Client\Riversid_SAOW\7472A00\Rpt\Volume 04\Ch07.doc

Table 7.4 Summary of Enhanced Primary Treatment Testing Results Wastewater Collection and Treatment Facilities Integrated Master Plan City of Riverside
Parameter Conventional EPT Secondary Effluent Quality
NH4-N, mg/L 0.7 0.5 Total Organic Nitrogen, mg/L 2.7 2.7 NO3-N, mg/L 6.9 7.5 Total Inorganic Nitrogen, mg/L 7.6 7.9 Total Nitrogen, mg/L 10.3 10.6
The table confirms that EPT has the potential to reduce the operating costs of the secondary treatment (approximately 22-percent savings in aeration air and 41-percent savings in WAS mass, while primary sludge production increases by 31 percent). However, it should be noted that EPT reduces the BOD to Total Kjeldahl Nitrogen (TKN) ratio in the aeration basin influent from 4.2 to 3.2.
Typically, when this ratio drops below 4.0, special measures are required to achieve a high level of denitrification. In this case, the anoxic fraction in the aeration basin needs to be increased to 50 percent. This means that there is no capacity increase as the reduced aerobic volume requirement with EPT is taken up by the increased anoxic volume. Operating the basin at such a high anoxic fraction may also increase the SVI. Should that happen, secondary clarifier performances would be affected and the secondary treatment capacity could be reduced.
For these reasons, EPT is not recommended for the RWQCP and is not discussed further.
7.4.2 Conventional Activated Sludge Process
The City operates two separate trains of CAS process. The secondary treatment processes at Plant 1 and Plant 2 are rated at 20-mgd AA each. For future increase in capacity, Plant 1 will be expanded since some of the process units in Plant 1 have aged and there is enough room for future units in Plant 1, whereas Plant 2 has limited room for future expansions. The expansion would increase Plant 1 capacity to 32.2-mgd AA and the total RWQCP treatment capacity to 52.2-mgd AA.
The CAS process is a proven wastewater treatment method and the City has had good experience with the process. Additionally, the operators at the RWQCP are well versed with the operation and maintenance of the facilities involved in a CAS process. Hence, for the next expansion, the CAS process was chosen as a secondary treatment alternative for further evaluation. For the comparison of the treatment alternatives, the CAS alternative was used as a base case scenario. A process schematic of the CAS process is shown on Figure 7.4.
The process requirements for the CAS process are summarized in Section 7.5.
February 2008 7-9 H:\Client\Riversid_SAOW\7472A00\Rpt\Volume 04\Ch07.doc

CITY OF RIVERSIDE
EPT TEST RESULTS
FIGURE 7.3
(A)
(B)
Plant 1
0
10
20
30
40
50
60
70
80
0 5 10 15 20 25 30
FeCl 3 Dose (mg/L)
% R
em
ov
al
TSS COD
Plant 2
0
10
20
30
40
50
60
70
80
0 5 10 15 20 25 30
FeCl3 Dose (mg/L)
% R
em
oval
TSS COD
20-R
ivers
ide2-0
8V
olu
me 4
-F7.3
-7472A
00.c
dr

PROCESS SCHEMATICS
FIGURE 7.4
WASTEWATER COLLECTION AND TREATMENTFACILITIES INTEGRATED MASTER PLAN
WAS
WAS
WAS
Recycle
RAS
RAS
Aeration Basins
Aeration Basins
Aeration Basins
MembraneBasins
SecondaryClarifiers
SecondaryClarifiers
Distinfection
Distinfection
Distinfection
TertiaryFilters
TertiaryFilters
EQ
EQ
PrimaryEffluent
PrimaryEffluent
PrimaryEffluent
(B) MBR Schematic
(A) CAS Schematic
(C) IFAS Schematic
20-R
ivers
ide2-0
8V
olu
me 4
-F7.4
-7472A
00.c
dr

7.4.3 Membrane Bioreactor Process
The MBR combines conventional biological treatment with the use of membranes for the separation of the solid and liquid phases. The MBR treatment train is similar to the existing secondary processes except that membranes replace the secondary clarifiers and tertiary filters. In the MBR process, the MLSS can be increased beyond that which is possible in CAS systems. Figure 7.4 includes a process schematic for the MBR alternative.
Typically, MBR systems operate at MLSS concentrations in the range of 8,000 to 10,000 mg/L, compared with a value of around 2,500 to 3,000 mg/L in the CAS. The higher MLSS provides the benefit of a greater treatment capacity per unit volume of aeration basin. In order to minimize the solids buildup near the membrane surface, which would reduce the flow of water through the membranes, membrane agitation air is introduced to scour the membrane surface. This air is usually in addition to the biological process air requirements, although at least one manufacturer combines both air needs as shown on Figure 7.5, part (A).
Because the process incorporates a membrane barrier, it produces a low turbidity effluent that is not impacted by quality changes in the feed water. Another benefit is that the effluent TSS concentration is low enough that tertiary filtration is not required. In addition, the treated effluent consistently has a low turbidity, which means process reliability is good. Finally, because the MBR system would operate at a longer SRT, there would be some endogenous destruction of the biomass within the process. Therefore, total sludge production from the facility be would reduced by about 10 to 15 percent, compared with operating a CAS plant.
The higher SRT also has benefits related to future regulatory requirements. At the Inland Empire Utilities Agency Regional Plant 5, it was shown that operating a CAS at a very high SRT (40 days) the effluent was able to perform much better in the WET test. Operating at a high SRT also improves the destruction of recalcitrant compounds including EDCs. The consistently low TSS concentration in the MBR effluent also means that disinfection is easier to achieve and that more disinfection process options are available. The MBR effluent would also be most compatible with using an advanced oxidation process (such as ozone) to destroy remaining organic compounds. All these factors make MBR the process that could most easily be combined with advanced tertiary treatment options to meet future effluent limits (Volume 2, Chapter 2 - Regulatory Requirements).
All MBR systems require screening of the influent to protect the membranes. In systems that incorporate hollow-fiber membranes (most systems), it is important that abrasive solids and hair be removed. To accomplish this, MBR systems require fine screening of the feed water in the range of 1 mm. Abrasive solids can wear through the membrane fibers and cause failures, while hair wraps around the fibers, causes clumping of the mixed liquor and is very difficult to remove. Ideally, fine screens are installed upstream of the aeration basins, but they can also be installed in the sludge recycle line between the aeration basins and the membrane tanks depending on the site layout.
February 2008 7-12 H:\Client\Riversid_SAOW\7472A00\Rpt\Volume 04\Ch07.doc

MBR PROCESS CONFIGURATION
FIGURE 7.5
(B) Separate Membrane Tank
(A) Combined Membrane-Aeration Tank
WASTEWATER COLLECTION AND TREATMENTFACILITIES INTEGRATED MASTER PLAN
WAS
WAS
To Disinfection
Recycle
PrimaryEffluent
PrimaryEffluent
20-R
ivers
ide2-0
8V
olu
me 4
-F7.5
-7472A
00.c
dr

One MBR supplier has a flat sheet membrane configuration, which is less susceptible to issues with hair, but is still subject to abrasion. This system can be used with 3-mm screens.
Even with air agitation, membranes lose their water permeability (flux rate) with time and require cleaning. Most MBR systems include regular relaxing (zero flux) or back pulsing (using permeate to dislodge accumulated solids). Depending on operating conditions, a chemical clean may be required every 3 to 6 months. Chemical cleaning typically involves submerging the membranes in a solution of either sodium hypochlorite (to remove biological fouling) or citric acid (to remove lime scale).
There are different ways to configure an MBR system as shown on Figure 7.5. In the original plants that were built (around 1 mgd or less), the membranes (in the form of cassettes) were simply installed directly into the aeration basins creating a combined membrane-aeration tank. When it is time for chemical cleaning, the membrane cassettes are lifted out of the aeration basins (by crane) and dipped into a cleaning tank. Cleaning could require 4 to 6 hours of soaking before the cassette is returned to the aeration basin. Alternatively, at least one manufacturer operates by cleaning the membranes in place in the aeration basin.
The other approach to designing MBR systems, as shown on Figure 7.5, part (B), is to construct a separate membrane tank to house the membranes. The mixed liquor is circulated from the aeration basin to the membrane tank and back to the aeration basin. In this configuration, the membrane tank can be divided into cells that can be taken off-line and cleaned. A potential disadvantage of this approach is that a separate tank is required. For the RWQCB, the secondary clarifiers could be modified to become the membrane tanks.
A comparison of the separate membrane tank approaches is presented in Table 7.5.
Table 7.5 Comparison of Combined and Separate Membrane Tank Processes Wastewater Collection and Treatment Facilities Integrated Master Plan City of Riverside
Combined Membrane-Aeration Separate Membrane Tank
Removing membranes, placing them in a small cleaning tank and then returning them to the aeration basins is operator intensive.
Without individual flow control on each cassette, the clean membrane, when returned to operation, would take most of the load compared to the other membrane cassettes. This leads to uneven distribution of flow through the membrane cassettes and inefficient use of the available membrane area.
Removal of membrane cassettes for cleaning is not needed, as individual cells can be taken off-line.
A complete train of membranes can be cleaned simultaneously, so the flow through the membranes can be controlled (relative to the other trains) when the clean membranes are brought back online.
Major modifications to the aeration basins are not required.
February 2008 7-14 H:\Client\Riversid_SAOW\7472A00\Rpt\Volume 04\Ch07.doc

Table 7.5 Comparison of Combined and Separate Membrane Tank Processes Wastewater Collection and Treatment Facilities Integrated Master Plan City of Riverside
Combined Membrane-Aeration Separate Membrane Tank
Aeration basins tend to be much deeper than required to house the membranes, so complex systems are required to support the membranes and associated piping.
The activated sludge biological system can be designed, configured, and operated independently of the membrane tanks.
The separate membrane tank approach is well suited to larger installations where the number of membrane cassettes is high.
The main disadvantage of the separate membrane tank configuration is that a high rate mixed liquor recycle system must be installed and operated. Typically, a recycle rate of 400 percent is used to maintain the aeration tank MLSS concentration at 80 percent of the membrane tank MLSS concentration.
Based on the above discussion, the combined membrane-aeration tank option is not considered further. For the preliminary evaluation of expansion of Plant 1, the separate membrane tank approach will be used.
The process requirements for converting the Plant 1 CAS system to an MBR system are summarized in Section 7.5.
7.4.4 Attached Growth Processes
Attached growth processes use biomass attached to media to perform the required biological transformations. In these applications, the attached growth forms a film on the media; this is referred to as biofilm. The differences between suspended and attached growth processes are summarized in Table 7.6.
Table 7.6 Comparison of Suspended and Attached Growth Processes Wastewater Collection and Treatment Facilities Integrated Master Plan City of Riverside Suspended Growth Attached Growth
No gradient for soluble compounds under typical conditions.
A significant gradient that drives diffusion of soluble compounds.
Biomass moves with effluent through bioreactor. Biomass stationary while effluent passes through.
Bioreactor effluent has a high TSS concentration. Bioreactor effluent TSS is low. Clarifier design must take both solids and hydraulic loads into account.
Clarifier design based on hydraulic loading only.
Produces more WAS. Produces less WAS. Process parameters (such as SRT, aeration MLSS concentration) can be controlled.
Limited process control options.
February 2008 7-15 H:\Client\Riversid_SAOW\7472A00\Rpt\Volume 04\Ch07.doc

Table 7.6 Comparison of Suspended and Attached Growth Processes Wastewater Collection and Treatment Facilities Integrated Master Plan City of Riverside Suspended Growth Attached Growth
Provides contact time between biomass and effluent of several hours.
Contact time of minutes.
Can be designed to perform Biological Nutrient Removal (BNR).
Limited ability to perform BNR.
Superior effluent quality. Inferior effluent quality.
Some modern attached growth processes differ from the more traditional processes in that in the modern process the media is submerged below the water surface. This means that, as for suspended growth processes, aeration air must be introduced at pressure (related to the diffuser submergence depth). This also allows for increased contact times, but still does not allow the operator to completely control the solids inventory.
There are two versions of the modern attached growth processes:
• Moving Bed Bioreactor (MBBR) or Submerged Fixed Film (SFF).
• IFAS.
The process schematic for each process is shown on Figure 7.6. Primary effluent enters the basin that contains the media and the attached biomass. The effluent from the basin passes through a clarifier before proceeding to tertiary treatment. Settled sludge goes to sludge handling. For MBBR/SFF, as with trickling filter effluent, the TSS concentration in the bioreactor effluent is low.
The IFAS process schematic is similar to the MBBR/SFF flow diagram. The main difference is the presence of a RAS line that allows the cultivation of suspended biomass in addition to the attached biomass. The bioreactor effluent has a high TSS concentration, similar to suspended growth processes.
The two processes are compared in Table 7.7.
Table 7.7 Comparison of IFAS and MBBR Processes Wastewater Collection and Treatment Facilities Integrated Master Plan City of Riverside MBBR/SFF IFAS
Attached biomass only Attached and suspended biomass No RAS line RAS to a CAS process Biomass inventory cannot be controlled Biomass inventory can be partially controlled Pin floc due to low TSS in basin effluent Typically have low SVI No control over solids inventory Solids inventory can be controlled
February 2008 7-16 H:\Client\Riversid_SAOW\7472A00\Rpt\Volume 04\Ch07.doc

ATTACHED GROWTHPROCESS SCHEMATIC
FIGURE 7.6
MBBR/SFF
IFAS
WASTEWATER COLLECTION AND TREATMENTFACILITIES INTEGRATED MASTER PLAN
Influent
RAS WAS
Influent
TertiaryTreatment
TertiaryTreatment
SolidsHandling
SolidsHandling
20-R
ivers
ide2-0
8V
olu
me 4
-F7.6
-7472A
00.c
dr

The IFAS system has some important advantages, especially the ability to partially control biomass inventory (or SRT). Since the activated sludge process at the RWQCP already includes RAS pumps and provisions to handle high bioreactor TSS concentrations, there is no additional investment for selecting IFAS above MBBR. In addition, the suspended biomass does not have to be attached to media, which means that the total surface area of the required media is reduced. For these reasons, further evaluation of attached growth processes is based on an IFAS system.
There are two different kinds of media that can be used with the IFAS system, free floating or fixed, as shown on Figure 7.7. The free-floating media consist of small plastic elements that have positive buoyancy. Fixed media is typically attached to a frame that can be lowered to the floor of the basin. Fixed media can consist of either rigid media (like structured packing used in trickling filters) or pliable media (typically attached to a frame that allows for limited media movement). Free-floating and fixed media are compared in Table 7.8.
Table 7.8 Comparison of Fixed Film Process Media Wastewater Collection and Treatment Facilities Integrated Master Plan City of Riverside
Free-Floating Media Fixed Media
Influent: Fine Screens and Primary Treatment are required
Influent: Fine Screens not required
Coarse Bubble Aeration only Fine or Coarse Bubble Aeration
Screens required in Basin to Retain Media(1) No Screens required in basin
Large area per unit volume Smaller area per unit volume
Notes: (1) Screens typically produce 2 to 6 inches of water column head loss, per screen.
Free-floating media require fine screens upstream of the basin to prevent plugging of the screens in the basin itself. Coarse bubble aeration is required to achieve enough turbulence to ensure a good distribution of the media throughout the basin depth. The coarse air also helps to prevent plugging of the basin’s screens. The free-floating media allows greater treatment capacity for a given basin volume, due to its greater surface area.
Due to the facts that the City has recently installed new fine bubble diffusers and that plant hydraulics are already a limiting factor, it was decided to concentrate on fixed media for this evaluation. The evaluation specifically considered pliable media, as it allows more biomass attachment per unit area. Should IFAS be selected, a comparison of rigid and pliable media alternatives can be made during preliminary design.
To increase the treatment capacity at the RWQCP to 52.2 mgd, both Plant 1 and Plant 2 CAS processes would have to be converted to the IFAS process. The process requirements for the conversion are summarized in Section 7.5.
February 2008 7-18 H:\Client\Riversid_SAOW\7472A00\Rpt\Volume 04\Ch07.doc

CITY OF RIVERSIDE
ATTACHED GROWTH MEDIA OPTIONS
FIGURE 7.7
Free Floating Media
Fixed Media
Rigid Media Pliable Media
20-R
ivers
ide2
-08V
olu
me 4
-F7.7
-7472A
00.c
dr

7.5 PROCESS MODELING OF TREATMENT ALTERNATIVES
7.5.1 Conventional Activated Sludge Alternative
Expansion using CAS would entail adding aeration basins and secondary clarifiers to the Plant 1 system. The primary effluent piping from the new Plant 1 primary clarifiers would need to be expanded. Mixed liquor piping between the Plant 1 aeration basins and secondary clarifiers would also need to be expanded. Secondary effluent piping to transfer secondary effluent to the equalization basins would also need to be expanded. The diffuser count in the existing basins would be increased from the current 588 to 694 units.
7.5.2 Membrane Bioreactor Alternative
One additional aeration basin would be required. The recycle from the membrane tank will have a high Dissolved Oxygen (DO) concentration and would inhibit denitrification if returned to the anoxic zone of the aeration basins. Instead, the membrane tank recycle will be discharged in the aerobic zone of the aeration basin. The existing mixed liquor return system in the aeration basins would be expanded from the existing 7,000 gpm to 17,000 gpm. The diffuser count in the existing basins would be increased to 1,096 units. Two of the existing secondary clarifiers would be retrofitted into membrane tanks. There would be nine trains in total. The plant would be able to operate at full capacity even with one membrane train out of service.
The MBR system in Plant 1 would treat 32.2 mgd, to give a total capacity of 52.2 mgd for the whole plant. Treated effluent would be pumped through the membrane by permeate pumps and the solids would be returned to the aeration basin by recycle pumps. WAS would be withdrawn from the return line where the MLSS concentration is at its highest.
In order to implement this alternative, fine screens (about 1-mm openings) would need to be installed. Based on the existing site configuration it is proposed that the screens would be installed to treat the primary effluent upstream of the Plant 1 aeration basins. A new pipe would be needed to convey primary effluent from the new Plant 1 primary clarifiers (Volume 4, Chapter 6 - Primary Treatment). In addition, the Plant 1 aeration basin influent channel would need to be extended for the new aeration basin. By further extending this channel, a channel is created that could house the new fine screens. However, due to the high head loss at the fine screens, there might be a need to pump the primary effluent to accommodate the screens. The hydraulic requirements should be determined during the preliminary design.
7.5.3 Integrated Fixed Film Activated Sludge Alternative
Implementing the IFAS process would mean increasing the secondary treatment capacity of both Plants 1 and 2. It is estimated that a total media surface area of 1,360,000 feet2 would need to be installed in Plant 1 and 1,836,000 feet2 in Plant 2. The increased biomass in the aeration basins would increase the oxygen demand, increasing required blower capacity as
February 2008 7-20 H:\Client\Riversid_SAOW\7472A00\Rpt\Volume 04\Ch07.doc

well as diffusers. The diffuser count in Plant 1 would increase to 896 units per basin and to 818 units per basin in Plant 2.
7.5.4 Process Modeling A Biotran process model was set up for the three secondary treatment alternatives for the RWQCP. A copy of the Biotran model is included in Appendix A. The modeled plant performance characteristics are summarized in Table 7.9. Figures 7.8, 7.9, and 7.10 show the proposed layout for the CAS, MBR, and IFAS alternatives, respectively.
Table 7.9 Modeling of Secondary Treatment Alternatives for Plant 1 Wastewater Collection and Treatment Facilities Integrated Master Plan City of Riverside
Parameter CAS MBR IFAS
Plant 1(1) IFAS
Plant 2(1)
Aeration Basin Influent(2) Average Flow, mgd 32.2 32.2 22.1 30.1
BOD, mg/L 160 169 164 176
TSS, mg/L 101 106 104 130
VSS, % 86 90 88 109
NH3-N, mg/L 29.2 32.5 27.8 30.3
Organic-N, mg/L 8.7 8.9 8.8 9.8
NO3-N, mg/L 0.6 0.3 0.4 0.7
Alkalinity, mg/L as CaCO3 266 279 262 270
Filterable ("soluble") BOD, mg/L 64 67 66 63
Process Requirements No. of Fine Screens N/A 4 N/A N/A
Clear Screen Opening, mm N/A ~1 N/A N/A
New Aeration Basins 4 1 0 0
New Secondary Clarifiers 3 0 0 0
Membrane Tanks N/A 2(3) N/A N/A
Tertiary Equalization Requirement Yes No Yes Yes
New Tertiary Filters(4) 10 0 10 10
Aeration Basin Operating Conditions SRT, days 5.3 9.6 6.5 5.6
MLSS, mg/L 3,500 10,000 5,500(5) 4,500(5)
February 2008 7-21 H:\Client\Riversid_SAOW\7472A00\Rpt\Volume 04\Ch07.doc

Table 7.9 Modeling of Secondary Treatment Alternatives for Plant 1 Wastewater Collection and Treatment Facilities Integrated Master Plan City of Riverside
Parameter CAS MBR IFAS
Plant 1(1) IFAS
Plant 2(1)
WAS, lb/day 43,200 40,500 28,000 55,150
Aeration Basin Air, scfm 29,500 35,200 22,400 32,300
Scour Air, scfm N/A 25,000(6) N/A N/A
Sludge Disposal, wet tons/day 206 198 207
Expected Secondary Effluent Quality BOD, mg/L 3 1 3 3
TSS (nominal), mg/L 5 0 5 5
Ammonia, mg/L as N 0.7 0.3 0.5 0.5
Total Organic Nitrogen, mg/L as N 2.7 2.3 2.6 2.6
NO3-N, mg/L as N 6.9 7.3 5.4 5.4
Total Inorganic Nitrogen, mg/L 7.6 7.6 5.9 5.9
Total Nitrogen, mg/L 10.3 9.9 8.5 8.5
Turbidity, NTU <1.0 <0.2 <1.0 <1.0
Notes: (1) For the IFAS alternative, it is assumed that both Plants 1 and 2 would be converted to
IFAS from CAS. (2) The aeration basin influent quality varies for the three processes because of the effects
of the different quality of the recycle streams. (3) Two Plant 1 secondary clarifiers would be retrofitted into membrane tanks. (4) For this analysis, it is assumed that if the City decides to expand the tertiary filtration
facility, the new filter would be a cloth-media filter (for details refer to Volume 4, Chapter 8 - Tertiary Treatment).
(5) The MLSS concentrations for the IFAS systems are effective biomass concentration values (including attached growth) and not the actual MLSS concentration.
(6) The scour air is required only for 15 seconds per minute during normal operation. Under high loads, the scour aeration rate can be doubled to 30 seconds per minute.
MBR effluent quality is better than the other alternatives, particularly for TSS and turbidity. Tertiary filtration is not required for this alternative. In the future, if the City has to use Reverse Osmosis (RO) treatment to meet lower dissolved salt limits or is required to have higher quality recycle water, the MBR alternative provides a distinct advantage.
February 2008 7-22 H:\Client\Riversid_SAOW\7472A00\Rpt\Volume 04\Ch07.doc

FIGURE 7.8
CAS ALTERNATIVEPROPOSED SITE LAYOUT
WASTEWATER COLLECTION AND TREATMENTFACILITIES INTEGRATED MASTER PLAN
20-Riverside2-08Volume 4-F7.8-7472A00.cdr

FIGURE 7.9
MBR ALTERNATIVEPROPOSED SITE LAYOUT
WASTEWATER COLLECTION AND TREATMENTFACILITIES INTEGRATED MASTER PLAN
20-Riverside2-08Volume 4-F7.9-7472A00.cdr

FIGURE 7.10
IFAS ALTERNATIVEPROPOSED SITE LAYOUT
WASTEWATER COLLECTION AND TREATMENTFACILITIES INTEGRATED MASTER PLAN
20-Riverside2-08Volume 4-F7.10-7472A00.cdr

7.6 COMPARISON OF SECONDARY TREATMENT ALTERNATIVES
7.6.1 Non-Economic Comparison
Table 7.10 lists some advantages and disadvantages for the three alternatives discussed above.
Table 7.10 Advantages and Disadvantages of Secondary Treatment Alternatives Wastewater Collection and Treatment Facilities Integrated Master Plan City of Riverside
Advantages Disadvantages Alternative 1 - CAS • Proven system with long operational history. • Relatively easy to control and operate.
• Large volume and footprint requirements. • Limited to MLSS concentrations in the
1,000- to 5,000-mg/L (max.) range. Alternative 2 - MBR • Longer SRTs increase the potential for
complete nitrification. • Longer SRTs enhance the oxidation of
recalcitrant toxic compounds, which may be regulated in the future.
• Stable process operation due to higher MLSS.
• Longer SRTs lead to lower sludge production.• High-quality effluent irrespective of fluctuation
of influent water quality. No tertiary filtration required.
• Small footprint.
• High MLSS and SRT means higher aeration cost.
• High operating costs due to scour air requirement.
• High membrane replacement costs. • Most membrane units available in the
market are proprietary and the units are not interchangeable.
Alternative 3 - IFAS • Higher effective MLSS translates to higher
aeration basin capacity. • Improved sludge settleability increases
capacity of secondary clarifiers. • Small footprint.
• New technology with limited operational history.
• Treatment performance deteriorates at peak flow conditions.
• Most existing installations are small plants with limited operational/performance data.
• Media for attached growth is proprietary. • Process models are still under
development.
February 2008 7-26 H:\Client\Riversid_SAOW\7472A00\Rpt\Volume 04\Ch07.doc
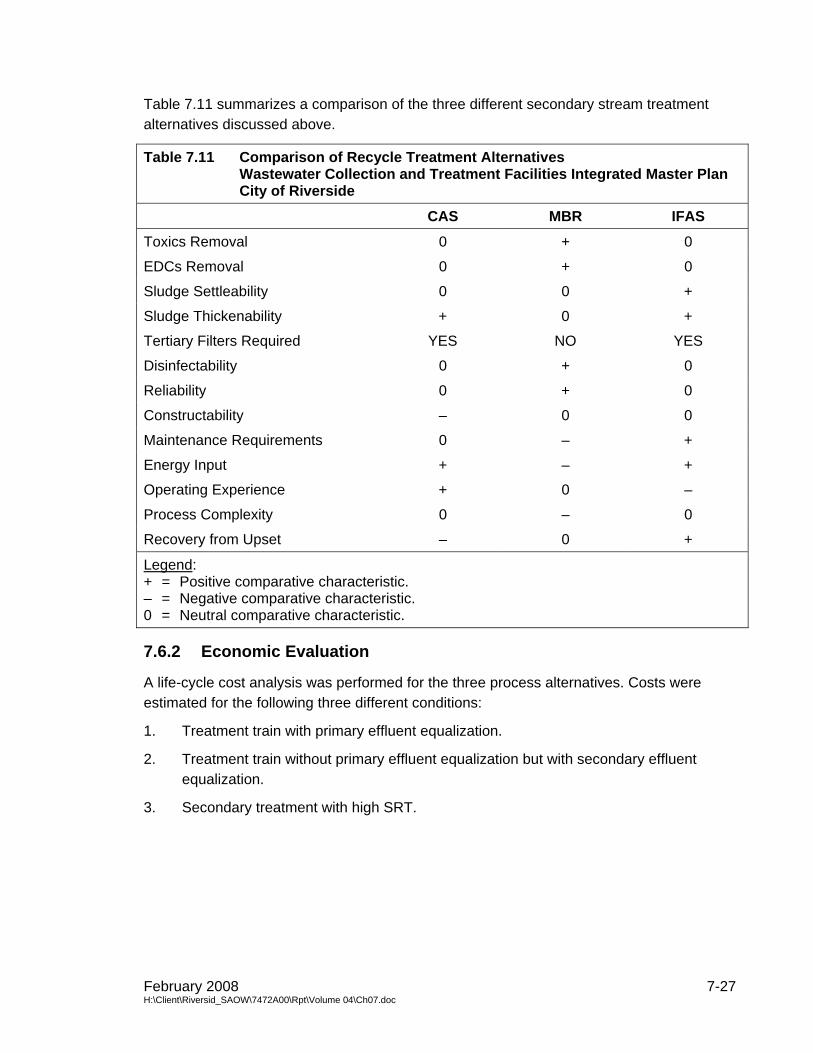
Table 7.11 summarizes a comparison of the three different secondary stream treatment alternatives discussed above.
Table 7.11 Comparison of Recycle Treatment Alternatives Wastewater Collection and Treatment Facilities Integrated Master Plan City of Riverside
CAS MBR IFAS
Toxics Removal 0 + 0
EDCs Removal 0 + 0
Sludge Settleability 0 0 +
Sludge Thickenability + 0 +
Tertiary Filters Required YES NO YES
Disinfectability 0 + 0
Reliability 0 + 0
Constructability – 0 0
Maintenance Requirements 0 – +
Energy Input + – +
Operating Experience + 0 –
Process Complexity 0 – 0
Recovery from Upset – 0 +
Legend: + = Positive comparative characteristic. – = Negative comparative characteristic. 0 = Neutral comparative characteristic.
7.6.2 Economic Evaluation
A life-cycle cost analysis was performed for the three process alternatives. Costs were estimated for the following three different conditions:
1. Treatment train with primary effluent equalization.
2. Treatment train without primary effluent equalization but with secondary effluent equalization.
3. Secondary treatment with high SRT.
February 2008 7-27 H:\Client\Riversid_SAOW\7472A00\Rpt\Volume 04\Ch07.doc

A summary of the costs for the treatment train alternative with primary equalization is shown in Table 7.12.
Table 7.12 Life-Cycle Cost of Secondary Treatment Alternatives - With Primary Effluent Equalization Wastewater Collection and Treatment Facilities Integrated Master Plan City of Riverside
CAS MBR IFAS Project Cost $103,105,000 $118,190,000 $104,970,000Annual O&M Cost $1,150,000 $1,800,000 $1,120,000 Membrane/Media Replacement Cost(1) N/A $6,610,000(2) $700,000(3)
Life-Cycle Cost(4) $122,890,000 $158,800,000 $135,500,000Notes: (1) The costs associated with replacement of diffusers and other process equipment was
not included for this comparison as the costs for such items would be similar for all three alternatives.
(2) For this analysis, it was assumed that the average membrane life is 6 years. The replacement cost includes only the cost for replacing the membranes.
(3) The cost of media replacement was based on the assumption that about 5 percent of the media would be destroyed or lost every year.
(4) As present value, assuming life-cycle period of 19 years, discount rate of 6 percent, and escalation rate of 6 percent for the first 5 years and 4 percent thereafter.
The table shows that CAS is the most cost effective, with IFAS the next most cost effective. To show the effect of primary effluent equalization the cost estimates for all three options without primary effluent equalization are summarized in Table 7.13.
Table 7.13 Life-Cycle Cost of Secondary Treatment Alternatives - Without Primary Effluent Equalization Wastewater Collection and Treatment Facilities Integrated Master PlanCity of Riverside
CAS MBR IFAS Project Cost $95,824,000 $126,992,000 $98,370,000 Annual O&M Cost $1,152,000 $1,624,000 $1,120,000 Membrane/Media Replacement Cost(1) N/A $ 6,600,000(2) $700,000(3)
Life-Cycle Cost(4) $115,610,000 $166,740,000 $128,880,000 Notes: (1) The costs associated with replacement of diffusers and other process equipment was
not included for this comparison as the costs for such items would be similar for all three alternatives.
(2) For this analysis, it was assumed that the average membrane life is 6 years. The replacement cost includes only the cost for replacing the membranes.
(3) The cost of media replacement was based on the assumption that about 5 percent of the media would be destroyed or lost every year.
(4) As present value, assuming life-cycle period of 19 years, discount rate of 6 percent, and escalation rate of 6 percent for the first 5 years and 4 percent thereafter.
February 2008 7-28 H:\Client\Riversid_SAOW\7472A00\Rpt\Volume 04\Ch07.doc

A comparison of these two tables shows that without primary effluent equalization there is an even bigger difference between MBR and the other two options. This is due to the fact that without equalization, more membrane cassettes must be installed to allow the system to handle the higher diurnal peaks. Hence, the primary effluent equalization benefits the economics of the MBR alternative. However, the costs presented above do not account for the benefits of an MBR system regarding WET. Drury et al. (1999) postulated that both high SRT and high MLSS concentration were helpful in improving effluent WET results. High SRT would enable slow growing biomass, capable of toxic compound destruction, to survive in the aeration basin. High MLSS concentrations would improve adsorption of the toxic compounds onto the biomass. As indicated in Table 7.9, the MBR alternative would have both higher SRT and MLSS concentration than the other two alternatives. The high MLSS concentration is unique to the MBR process. This means that if the Drury hypothesis is correct, the MBR process will have unique advantages regarding WET. It is assumed that EDCs would respond the same way as toxic compounds to an increase in both MLSS concentration and SRT. If the CAS and IFAS systems were to be designed for a higher SRT, the process would require additional aeration basins and secondary clarifiers. Table 7.14 shows a cost estimate that assumes operating all three processes at a high SRT.
Table 7.14 Life-Cycle Cost of Secondary Treatment Alternatives - High SRT (Without Primary Effluent Equalization) Wastewater Collection and Treatment Facilities Integrated Master PlanCity of Riverside
CAS MBR IFAS
Project Cost $139,730,000 $126,922,000 $137,720,000
Annual O&M Cost $1,095,000 $1,624,000 $1,053,000
Membrane/Media Replacement Cost(1) N/A $6,600,000(2) $700,000(3)
Life-Cycle Cost(4) $159,082,000 $166,740,000 $167,120,000
Notes: (1) The costs associated with replacement of diffusers and other process equipment was
not included for this comparison as the costs for such items would be similar for all three alternatives.
(2) For this analysis, it was assumed that the average membrane life is 6 years. The replacement cost includes only the cost for replacing the membranes.
(3) The cost of media replacement was based on the assumption that about 5 percent of the media would be destroyed or lost every year.
(4) As present value, assuming life-cycle period of 19 years, discount rate of 6 percent, and escalation rate of 6 percent for the first 5 years and 4 percent thereafter.
The table shows that increasing the SRT for the CAS and IFAS systems increases the capital cost for the alternative to more that that of the MBR system. The annual operating and maintenance cost is still higher for the MBR alternative. The result is that the life-cycle cost for all three alternatives are with the range of uncertainty for the cost estimates. Under these conditions life-cycle costs do not strongly favor any of the three options. Based on the
February 2008 7-29 H:\Client\Riversid_SAOW\7472A00\Rpt\Volume 04\Ch07.doc

ability to achieve better effluent quality and do so more consistently, the City chose the MBR alternative for future expansion.
7.7 EXPANSION PROJECT PHASING Current flows of approximately 33 mgd (80 percent of rated capacity) and 30-day running averages as high as 35 mgd would indicate that the RWQCP needs additional capacity. The City has no control over how fast the CSDs and the Highgrove area increase their flows into the RWQCP. And, based on housing activity in the summer of 2006, there was concern that residential development would grow faster than was currently predicted. If these occurred there was a good chance that RWQCP flows would tend toward the high-growth scenario. In addition, for a master planning process it is more prudent to plan based on conservative assumptions about future growth. For these reasons, the City chose to use the high-growth scenario (52.2 mgd and an annual growth rate of 1.5 percent) as the basis of the process alternative evaluations for the Integrated Master Plan. This decision was made at a meeting on August 31, 2006. Since that time, a slow down in the housing market has occurred, which caused the City to reevaluate the potential RWQCP influent flows for the master plan planning period. Based on the reevaluation, the City, at a meeting on September 20, 2007, decided that the lower end of the 90-percent confidence interval would be more appropriate as the basis for 2025 RWQCP flow projections. This results in an average daily flow of 47.3 mgd, which corresponds to an annual growth rate of 0.75 percent (low-growth scenario). The City therefore decided to expand the secondary treatment facilities in two phases. The first phase will expand the treatment capacity of Plant 1 from 20 mgd to 26.1 mgd and the second phase to 32.2 mgd. The capacity of Plant 2 will remain at 20 mgd.
For such a phased expansion, the City has decided to purchase MBR equipment to construct an MBR facility of 26.1 mgd. However, the Plant 1 structures will be modified to handle the final expanded flow capacity of 32.2 mgd during the first phase and the additional aeration basin would be constructed. The MBR equipment for the full capacity will be procured when actual influent flow to the RWQCP starts approaching the 46.1-mgd capacity of the first phase.
7.8 CONTROL OF EFFLUENT ORGANICS The City presently owns and operates constructed wetlands in the Hidden Valley area. Originally developed to aid in nutrient removal, such wetlands may also be useful for reducing trace metals, complex organics, and providing a carbon matrix in the final effluent that is more similar to that found in natural streams. Due to the present regulatory environment, it is unlikely that the wetlands can be expanded at this time. However, the City plans to continue to use the existing wetlands as an effluent polishing treatment process.
February 2008 7-30 H:\Client\Riversid_SAOW\7472A00\Rpt\Volume 04\Ch07.doc

7.9 ODOR CONTROL The City requested that Carollo investigate covering of secondary clarifiers for odor concerns. While secondary clarifiers are not typically prime sources of odor in a wastewater treatment plant, some owners choose to cover the clarifiers for aesthetic reasons. For this evaluation, it was assumed that only the effluent weirs would be covered, as the hydraulic conditions at the weirs would promote the bulk of any released odor. A typical weir cover is shown on Figure 7.11 for a circular clarifier. The weir cover for a rectangular clarifier would require some additional elements to support it above the weir, as shown on Figure 7.12. In addition to the weir covers, the odor control system would include blowers to collect the headspace air, some form of odor control system such as a biofilter, and the required ducting. Additional evaluation of secondary clarifier odor control would be done during preliminary design if the City decides to pursue it further.
7.10 RETURN ACTIVATED SLUDGE/WASTE ACTIVATED SLUDGE PUMPING
Selection of RAS/WAS pumps is based on the flow and head characteristics of the RAS/WAS. Final selection of the pump types will be determined during preliminary design when the flow and head characteristics are known.
7.11 REFERENCE Drury D, Clifton N., Todd A.C., Buhr H.O. and Moore T. Operating and Designing Municipal Wastewater Treatment Plants to Treat Toxicity, WEFTEC (October 1999), New Orleans, LA.
February 2008 7-31 H:\Client\Riversid_SAOW\7472A00\Rpt\Volume 04\Ch07.doc

FIGURE 7.11
WEIR COVER FORCIRCULAR CLARIFIERS
WASTEWATER COLLECTION AND TREATMENTFACILITIES INTEGRATED MASTER PLAN
20-Riverside2-08Volume 4-F7.11-7472A00.cdr

FIGURE 7.12
TYPICAL WEIR COVERFOR RECTANGULAR
CLARIFIERS
WASTEWATER COLLECTION AND TREATMENTFACILITIES INTEGRATED MASTER PLAN
20-Riverside2-08Volume 4-F7.12-7472A00.cdr

Appendix A
BIOTRAN MODEL
February 2008 A-1 H:\Client\Riversid_SAOW\7472A00\Rpt\Volume 04\Ch07.doc

== CONFIDENTIAL == NOT FOR DISTRIBUTION ===
CAROLLO ENGINEERS, PCW.O./CLIENT: 7472A.00 / CITY OF RIVERSIDEPROJECT: REGIONAL WATER QUALITY CONTROL PLANT - SUBJECT: PROCESS ANALYSIS AND MASS BALANCECalc by Date Time Chk by/Date FileName:CFP,NV 02/27/2008 1:50 PM Ch07-AppA.xlsBiotran05 v.1106
Setup BasisPlant 1 Plant 2 Combined Plant 1 Plant 2 Combined Plant 1 Plant 2 Combined Plant 1 Plant 2 Combined info
Annual Average Plant Flow, mgd * 32.0 20.0 52.0 32.0 20.0 52.0 32.0 20.0 52.0 22.0 30.0 52.0Design (Max-Month) Flow, mgd 35.5 22.2 57.7 35.5 22.2 57.7 35.5 22.2 57.7 24.4 33.3 57.7
NOTES regarding this application: With Better Sludge Settleability MBR With Better Sludge Settleability With Better Sludge Settleability60:40 Recycle Split With Better Sludge Settleability 60:40 Recycle Split 30:70 Recycle SplitBased on aeration capacity 80:20 Recycle Split Based on aeration capacity Based on aeration capacityAPAD Based on aeration capacity APAD APADCentrifuge, not BP APAD Centrifuge, not BP Centrifuge, not BP
Centrifuge, not BP
SUMMARY:FLOW RATES, mgd:- Raw WW Flow 35.5 22.2 35.5 22.2 35.5 22.2 24.4 33.3- Flow to Primaries 40.6 25.6 39.3 23.2 41.0 25.9 26.9 39.0- Flow to Activated Sludge 39.2 25.3 37.8 23.0 39.1 25.0 26.0 38.4
SECONDARY EFFLUENT QUALITY, mg/L:- BOD (est.), mg/L 2 2 1 2 2 2 2 2- TSS (nominal), mg/L 5 4 0 4 5 4 5 4- NH3-N, mg/L [Note] 0.26 0.40 0.24 0.29 0.46 0.87 0.19 0.42- NO3/NO2-N, mg/L 6.7 7.4 7.4 6.6 7.5 7.7 5.4 7.2- T.I.N., mg/L 7.0 7.8 7.6 6.9 8.0 8.6 5.6 7.7
PRIMARY CLARIFIERS- # of Clarifiers 4 4 4 4 4 4 4 4- # in Service 4 4 4 4 4 4 4 4- Surface Overflow Rate, gpd/sf 897 902 869 817 907 913 948 1,376
AERATION BASINS- # of Basins 12 6 13 6 8 6 6 6- # in Service 11 6 13 6 8 6 6 6- Hydraulic Deten. Time, hr 6.8 7.5 3.6 8.2 5.0 7.5 5.6 4.9- Operating Last-Pass MLSS, mg/L 3,500 2,500 10,000 2,500 3,500 2,500 5,500 4,500- Design Temperature, deg C 20.0 20.0 20.0 20.0 20.0 20.0 20.0 20.0- Unaerated Volume Fraction 0.25 0.40 0.45 0.40 0.50 0.60 0.25 0.40 Selected- Aerobic SRT, days 5.95 3.52 5.23 4.08 4.41 3.93 8.13 3.39
-- Min. Aerobic SRT for Nitrification 5.46 4.41 5.03 4.41 4.68 5.38 5.76 4.41- Total SRT, days 7.93 5.87 8.37 6.80 8.83 9.84 10.84 5.64
-- Recommended Min. Total SRT for Nitrification 7.28 7.35 8.04 7.35 9.36 13.46 7.68 7.35- F/M, lb BOD Appl./lb MLSS-day 0.21 0.33 0.24 0.31 0.31 0.35 0.17 0.31- Aer. BOD Loading, lb BOD/1000 cf-day 47 52 127 49 67 55 58 88- ML Recirculation Ratio 2.5 2.0 3.2 2.2 2.5 2.0 2.3 2.0 Selected- Process Air (est.), scfm 19,300 12,910 25,000 11,350 15,530 8,780 13,910 23,600
MEMBRANE BIO-REACTOR- # of Membrane Zones (Basins) 8- # of Membrane Cassettes per Zone 18- Total Membrane Modules (Elements) 7,022- Total Membrane Area, sf 2,387,383- Average Operating Flux, gfd 15.6- Normal Daily Peak Flux, gfd 20.1
-- One Membrane Zone Out of Service, gfd 23.0- Scrubbing Air Blowers Installed (1 standby) 9- Blower Capacity, each, scfm 1,200- Blower Motor Size, each, hp 60
Design Capacity (Conv. IFAS)-high SRTDesign Capacity (Conv. ASP)-high SRT Design Capacity (MBR) Design Capacity (EPT)
* Input Data Ch07-AppA.xls - Page 1 of 26
H:\Client\Riversid_SAOW\7472A00\Rpt\Volume 04\Ch07-AppA.pdf

== CONFIDENTIAL == NOT FOR DISTRIBUTION ===
CAROLLO ENGINEERS, PCW.O./CLIENT: 7472A.00 / CITY OF RIVERSIDEPROJECT: REGIONAL WATER QUALITY CONTROL PLANT - SUBJECT: PROCESS ANALYSIS AND MASS BALANCECalc by Date Time Chk by/Date FileName:CFP,NV 02/27/2008 1:50 PM Ch07-AppA.xlsBiotran05 v.1106
Setup BasisPlant 1 Plant 2 Combined Plant 1 Plant 2 Combined Plant 1 Plant 2 Combined Plant 1 Plant 2 Combined info
Annual Average Plant Flow, mgd * 32.0 20.0 52.0 32.0 20.0 52.0 32.0 20.0 52.0 22.0 30.0 52.0Design (Max-Month) Flow, mgd 35.5 22.2 57.7 35.5 22.2 57.7 35.5 22.2 57.7 24.4 33.3 57.7
Design Capacity (Conv. IFAS)-high SRTDesign Capacity (Conv. ASP)-high SRT Design Capacity (MBR) Design Capacity (EPT)
SECONDARY CLARIFIERS- # of Basins 7 4 4 7 4 4 5- # in Service 6 4 4 6 4 4 5- Sec. Clarifier SOR, gpd/sf 735 589 537 737 587 731 683- Sec. Clar. Solids Loading, lb/day-sf 29 16 15 29 16 54 37- Clarifier Safety Factor (CSF) 2.4 3.0 3.3 2.4 3.1 1.6 2.1
-- CSF Target 2.3 2.3 2.3 2.3 2.3 2.3 2.3
DETAILED CALCULATIONS:
RAW WASTEWATER (excluding Recycles)o Plant Flow Rate, mgd 35.5 22.2 35.5 22.2 35.5 22.2 24.4 33.3o Flow Characteristic Ratios
- Max Month/Annual Avg * 1.11 1.11 1.11 1.11 1.11 1.11 1.11 1.11 Default- Peak 4-hr Wet-W Flow/Annual Avg * 2.2 2.2 2.2 2.2 2.2 2.2 2.2 2.2 Default- Typical 4-hr Diurnal Peak/Daily Avg * 1.3 1.3 1.3 1.3 1.3 1.3 1.3 1.3 Default
o Wastewater Characteristics- BOD, mg/L, Annual Average * 250 250 250 250 250 250 250 250 Default
-- Mass Load (lb/d) Peaking Factor * 1.25 1.25 1.25 1.25 1.25 1.25 1.25 1.25-- Effective BOD, mg/L 282 282 282 282 282 282 282 282"Effective" concentrations correspond to Peak Mass Loads with the flow rate used in the calculation
- TSS, mg/L, Annual Average * 250 250 250 250 250 250 250 250 Default-- Mass Load (lb/d) Peaking Factor * 1.25 1.25 1.25 1.25 1.25 1.25 1.25 1.25-- Effective TSS, mg/L 282 282 282 282 282 282 282 282
- Fpv, VSS fraction * 0.83 0.83 0.83 0.83 0.83 0.83 0.83 0.83 Default-- Effective VSS, mg/L 234 234 234 234 234 234 234 234
- NH3-N, mg/L, Annual Average * 21.0 21.0 21.0 21.0 21.0 21.0 21.0 21.0 Default-- Mass Load (lb/d) Peaking Factor * 1.25 1.25 1.25 1.25 1.25 1.25 1.25 1.25-- Effective NH3-N, mg/L 23.6 23.6 23.6 23.6 23.6 23.6 23.6 23.6Organic-N, mg/L, Annual Average * 14.5 14.5 14.5 14.5 14.5 14.5 14.5 14.5 Default-- Mass Load (lb/d) Peaking Factor * 1.25 1.25 1.25 1.25 1.25 1.25 1.25 1.25-- Effective Org-N, mg/L 16.3 16.3 16.3 16.3 16.3 16.3 16.3 16.3
- NO3-N, mg/L, Annual Average * 0 0 0 0 0 0 0 0 Default- Alkalinity, mg/L, Annual Average * 250 250 250 250 250 250 250 250 Default- Filterable ("soluble") BOD -- fraction, Fbf * 0.25 0.25 0.25 0.25 0.25 0.25 0.25 0.25 Default -- mg/L 70 70 70 70 70 70 70 70- Fvu, Fraction VSS that is Unbiodeg * 0.600 0.600 0.600 0.600 0.600 0.600 0.600 0.600 Estimated- Total Phosphorus, mg/L, Annual Average * 11.0 11.0 11.0 11.0 11.0 11.0 11.0 11.0 Default
-- Mass Load (lb/d) Peaking Factor * 1.25 1.25 1.25 1.25 1.25 1.25 1.25 1.25-- Effective Total-P, mg/L 12.4 12.4 12.4 12.4 12.4 12.4 12.4 12.4-- Fraction filterable ("soluble") * 0.32 0.32 0.32 0.32 0.32 0.32 0.32 0.32 Default-- Filterable P, mg/L 3.94 3.94 3.94 3.94 3.94 3.94 3.94 3.94
o Design Temperature, deg. C- Minimum (Winter) * 20 20 20 20 20 20 20 20 Default- Maximum (Summer) * 29 29 29 29 29 29 29 29 Default- Design * 20 20 20 20 20 20 20 20 Winter
RECYCLE TO HEADWORKS/PRIM CLAR.So Flow Rate, mgd
- Filter Backwash * 3.440 2.293 5.733 1.632 0.408 2.041 3.442 2.295 5.736 1.719 4.012 5.731- Dewatering Filterate + Washwater/Centrate * 0.163 0.108 0.271 0.216 0.054 0.269 0.166 0.110 0.276 0.080 0.187 0.268
* Input Data Ch07-AppA.xls - Page 2 of 26
H:\Client\Riversid_SAOW\7472A00\Rpt\Volume 04\Ch07-AppA.pdf

== CONFIDENTIAL == NOT FOR DISTRIBUTION ===
CAROLLO ENGINEERS, PCW.O./CLIENT: 7472A.00 / CITY OF RIVERSIDEPROJECT: REGIONAL WATER QUALITY CONTROL PLANT - SUBJECT: PROCESS ANALYSIS AND MASS BALANCECalc by Date Time Chk by/Date FileName:CFP,NV 02/27/2008 1:50 PM Ch07-AppA.xlsBiotran05 v.1106
Setup BasisPlant 1 Plant 2 Combined Plant 1 Plant 2 Combined Plant 1 Plant 2 Combined Plant 1 Plant 2 Combined info
Annual Average Plant Flow, mgd * 32.0 20.0 52.0 32.0 20.0 52.0 32.0 20.0 52.0 22.0 30.0 52.0Design (Max-Month) Flow, mgd 35.5 22.2 57.7 35.5 22.2 57.7 35.5 22.2 57.7 24.4 33.3 57.7
Design Capacity (Conv. IFAS)-high SRTDesign Capacity (Conv. ASP)-high SRT Design Capacity (MBR) Design Capacity (EPT)
- Primary Sludge Thickener Supernatant * 1.450 0.967 2.417 1.954 0.488 2.442 1.902 1.268 3.170 0.646 1.508 2.154- Total 5.052 3.368 3.802 0.950 5.509 3.673 2.446 5.707
o Wastewater Characteristics, mg/L- Total Recycle
-- BOD 173 173 308 308 222 222 162 162-- TSS 301 301 510 510 342 342 288 288-- VSS 237 237 399 399 260 260 226 226-- NH3-N 66 66 116 116 57 57 66 66-- Organic-N 15 15 23 23 16 16 15 15-- NO3/NO2-N 5 5 3 3 5 5 5 5-- Alkalinity 378 378 559 559 343 343 378 378-- Filterable ("soluble") BOD 26.5 26.5 48.3 48.3 28.1 28.1 25.4 25.4-- Total soluble Organic N 3.0 3.0 3.5 3.5 3.1 3.1 3.0 3.0-- Fpv, VSS fraction 0.79 0.79 0.78 0.78 0.76 0.76 0.78 0.78
- Fvu, Fraction VSS that is Unbiodeg * 0.700 0.700 0.700 0.700 0.700 0.700 0.700 0.700 Default
PRIMARY TREATMENT In Service In Service In Service In Service In Service In Service In Service In Serviceo Flow Rate, mgd
- Raw Wastewater 35.5 22.2 35.5 22.2 35.5 22.2 24.4 33.3- Recycle stream 5.05 3.37 3.80 0.95 5.51 3.67 2.45 5.71- Total Influent 40.6 25.6 39.3 23.2 41.0 25.9 26.9 39.0
o Wastewater Characteristics, mg/L- BOD 268 267 284 283 274 273 271 264- TSS 284 284 304 291 290 290 282 282- VSS 234 234 250 240 237 237 233 232- NH3-N 29 29 33 27 28 28 28 30- Organic-N 16 16 17 17 16 16 16 16- NO3-N 1 1 0 0 1 1 0 1- Alkalinity 266 267 280 263 262 263 262 269- Filterable ("soluble") BOD 65 65 68 69 65 64 66 64- Fpv, VSS fraction 0.82 0.82 0.82 0.83 0.82 0.82 0.83 0.82
o Basin dimensions (inside)- Basins Set - 1,2,3,4- Number of Basins * 4 4 4 4 4 4 4 4- Number of Units in Service * 4 4 4 4 4 4 4 4- Diameter, ft * 120 95 120 95 120 95 95 95- Side Water Depth, ft * 12 9 12 9 12 9 12 9- Surface Area per Basin, sf 11,310 7,088 11,310 7,088 11,310 7,088 7,088 7,088- Surface Area in Service, sf 45,239 28,353 45,239 28,353 45,239 28,353 28,353 28,353- Basins Set - 5,6- Number of Basins * 0 0 0 0 0 0 0 0- Number of Units in Service * 0 0 0 0 0 0 0 0- Diameter, ft * 0 0 0 0 0 0 0 0- Side Water Depth, ft * 9 0 9 0 9 0 9 0- Surface Area per Basin, sf 6,050 0 6,050 0 6,050 0 6,050 0- Surface Area in Service, sf 0 0 0 0 0 0 0 0- Total Surface Area in Service, sf 45,239 28,353 45,239 28,353 45,239 28,353 28,353 28,353
o Surface Overflow Rate, gpd/sf- At Design Flow 897 902 869 817 907 913 948 1,376- At Diurnal Peak Flow 1,050 1,056 1,018 956 1,062 1,069 1,110 1,611- At Peak WW Flow 1,778 1,787 1,723 1,618 1,798 1,809 1,878 2,727
o Detention Time, hr 2.4 1.8 2.5 2.0 2.4 1.8 2.3 1.2o Chemically Enhanced Primary Treatment
- CEPT applied? [Y=1; N=0] * 0 0 0 0 1 1 0 0 Default
* Input Data Ch07-AppA.xls - Page 3 of 26
H:\Client\Riversid_SAOW\7472A00\Rpt\Volume 04\Ch07-AppA.pdf

== CONFIDENTIAL == NOT FOR DISTRIBUTION ===
CAROLLO ENGINEERS, PCW.O./CLIENT: 7472A.00 / CITY OF RIVERSIDEPROJECT: REGIONAL WATER QUALITY CONTROL PLANT - SUBJECT: PROCESS ANALYSIS AND MASS BALANCECalc by Date Time Chk by/Date FileName:CFP,NV 02/27/2008 1:50 PM Ch07-AppA.xlsBiotran05 v.1106
Setup BasisPlant 1 Plant 2 Combined Plant 1 Plant 2 Combined Plant 1 Plant 2 Combined Plant 1 Plant 2 Combined info
Annual Average Plant Flow, mgd * 32.0 20.0 52.0 32.0 20.0 52.0 32.0 20.0 52.0 22.0 30.0 52.0Design (Max-Month) Flow, mgd 35.5 22.2 57.7 35.5 22.2 57.7 35.5 22.2 57.7 24.4 33.3 57.7
Design Capacity (Conv. IFAS)-high SRTDesign Capacity (Conv. ASP)-high SRT Design Capacity (MBR) Design Capacity (EPT)
- Ferric Chloride dosage, mg/L as FeCl3 * 10 10 10 10 10 10 10 10 Default-- FeCl3 used, lb/d 0 0 0 0 3,422 2,158 0 0
- Polymer dosage, mg/L * 0.00 0.00 0.00 0.00 0.00 0.00 0.00 0.00 Default-- Polymer used, lb/d 0 0 0 0 0 0 0 0
- Chem Sludge Generated, lb/d -- Total, lb/d 0 0 0 0 3,483 2,197 0 0
- Alkalinity Reduction, mg/L 0 0 0 0 6 6 0 0o Removal Efficiency, %
- BOD Removal, % 40.3 40.3 40.7 41.5 59.0 58.9 39.6 33.5- TSS Removal, % 64.4 64.3 65.0 66.1 79.0 78.8 63.3 53.9- Non-volatile SS %, Rpn 69.6 69.5 70.3 71.4 80.7 80.5 68.5 58.4- Organic-N Removal, % 46.5 46.4 47.4 47.6 56.7 56.6 45.6 39.2
o Primary Sludge- Solids removed, lb/d
-- Non-chemical primary solids 63,163 39,762 66,122 37,882 79,326 49,991 40,860 50,873-- Chemical solids from CEPT 0 0 0 0 3,483 2,197 0 0-- Total solids removed 63,163 39,762 102,925 66,122 37,882 104,003 82,809 52,188 134,997 40,860 50,873 91,734
- Concentration, % * 0.5 0.5 0.5 0.5 0.5 0.5 0.5 0.5 Default- Flow Rate, mgd 1.515 0.954 1.586 0.908 1.986 1.252 0.980 1.220- Organic N removed, lb/d 2,654 1,670 2,757 1,592 3,263 2,054 1,723 2,150
o Primary Effluent Flow, mgd 39.1 24.6 37.7 22.2 39.0 24.6 25.9 37.8o Primary Effluent, mg/L
- BOD 160 160 168 165 112 112 163 175- TSS 101 101 106 99 61 61 104 130- VSS 86 86 90 84 51 51 88 109- NH3-N 29.0 29.3 32.6 27.4 28.1 28.3 27.5 29.8- Organic-N 8.66 8.66 8.93 8.70 7.03 7.04 8.81 9.78- NO3-N 0.6 0.7 0.3 0.1 0.7 0.7 0.4 0.7- Alkalinity 266 267 280 263 262 263 262 269- Filterable ("soluble") BOD 65 65 68 69 61 60 66 64
RECYCLE TO ACTIVATED SLUDGEo Flow Rate, mgd
- DAF Underflow * 0.000 0.585 0.585 0.000 0.693 0.693 0.000 0.352 0.352 0.000 0.517 0.517- Stream 2 * 0.000 0.000 0.000 0.000 0.000 0.000 0.000 0.000- Stream 3 * 0.000 0.000 0.000 0.000 0.000 0.000 0.000 0.000- Spray Water to Basins * 0.096 0.060 0.096 0.060 0.096 0.060 0.066 0.090 Default- Total 0.096 0.645 0.096 0.753 0.096 0.412 0.066 0.607
o Wastewater Characteristics, mg/L- Total Recycle
-- BOD 0 191 0 156 0 174 0 217-- TSS 0 654 0 546 0 632 0 792-- VSS 0 553 0 461 0 531 0 664-- NH3-N 0 0 0 0 0 1 0 0-- Organic-N 0 44 0 36 0 42 0 51-- NO3-N 0 6 0 6 0 7 0 6-- Alkalinity 0 127 0 130 0 119 0 121-- Filterable ("soluble") BOD 0.0 1.0 0.0 1.0 0.0 0.9 0.0 1.0-- Total soluble Organic N 0.0 2.2 0.0 2.1 0.0 2.0 0.0 2.0-- Fpv, VSS fraction 0.00 0.85 0.84 0.84 0.00 0.84 0.00 0.84
- Fvu, Fraction VSS that is Unbiodeg * 0.700 0.700 0.700 0.700 0.700 0.700 0.700 0.700 Default
ACTIVATED SLUDGE PROCESS
* Input Data Ch07-AppA.xls - Page 4 of 26
H:\Client\Riversid_SAOW\7472A00\Rpt\Volume 04\Ch07-AppA.pdf

== CONFIDENTIAL == NOT FOR DISTRIBUTION ===
CAROLLO ENGINEERS, PCW.O./CLIENT: 7472A.00 / CITY OF RIVERSIDEPROJECT: REGIONAL WATER QUALITY CONTROL PLANT - SUBJECT: PROCESS ANALYSIS AND MASS BALANCECalc by Date Time Chk by/Date FileName:CFP,NV 02/27/2008 1:50 PM Ch07-AppA.xlsBiotran05 v.1106
Setup BasisPlant 1 Plant 2 Combined Plant 1 Plant 2 Combined Plant 1 Plant 2 Combined Plant 1 Plant 2 Combined info
Annual Average Plant Flow, mgd * 32.0 20.0 52.0 32.0 20.0 52.0 32.0 20.0 52.0 22.0 30.0 52.0Design (Max-Month) Flow, mgd 35.5 22.2 57.7 35.5 22.2 57.7 35.5 22.2 57.7 24.4 33.3 57.7
Design Capacity (Conv. IFAS)-high SRTDesign Capacity (Conv. ASP)-high SRT Design Capacity (MBR) Design Capacity (EPT)
o Flow Rate, mgd- Main-Stream Influent 39.06 24.61 37.74 22.24 39.04 24.62 25.89 37.79- Recycle directly to AS 0.10 0.65 0.10 0.75 0.10 0.41 0.07 0.61- Total to Activated Sludge 39.15 25.26 37.83 22.99 39.14 25.03 25.95 38.39
o Influent Characteristics, mg/L- Total BOD 160 161 168 165 112 113 163 176- TSS 101 116 106 113 61 71 103 141- VSS 86 98 90 97 51 59 88 118- NH3-N 29 29 32 27 28 28 27 29- Organic-N 9 10 9 10 7 8 9 10- NO3-N 1 1 0 0 1 1 0 1- Alkalinity 265 263 279 258 262 261 261 266- Filterable ("soluble") BOD 65 63 68 67 61 59 66 63- Fpv, VSS fraction 0.85 0.85 0.85 0.85 0.83 0.83 0.85 0.84- AB Influent D.O. Concentration, mg/L 0.0 0.0 0.0 0.0 0.0 0.0 0.0 0.0
o Basin dimensions- Main Basins MBR For MBR, MBR
-- No. of Basins * 12 6 5 6 8 6 6 6 enter 0-- Number of Units in Service * 11 6 5 6 8 6 6 6 Basin 0-- Length, ft (inside) * 200 250 200 250 200 250 200 250 dimen.s 0-- Width, ft (inside) * 40 40 40 40 40 40 40 40 in the 0-- Side Water Depth, ft * 16.9 17.5 16.9 17.5 16.9 17.5 16.9 17.5 MBR 0
.. Recomm inside Wall height, incl. Freeboard, ft 19.9 20.5 22.9 20.5 19.9 20.5 19.9 20.5 section 3-- Liquid Volume per Basin, mil gal 1.01 1.31 1.01 1.31 1.01 1.31 1.01 1.31 (not HERE) 0.00
- Supplemental Basins or Sections-- Identification * Membrn Zn calcs Membrn Zn-- No. of Basins * 0 0 8 0 0 0 0 0 0-- Number of Units in Service * 0 0 8 0 0 0 0 0 into 0-- Length, ft (inside) * 200 200 19.5 200 200 200 200 200 < - - these 0-- Width, ft (inside) * 40 100 75 100 40 100 40 100 columns 0-- Side Water Depth, ft * 16.9 17 11.9 17 16.9 17 16.9 17 0-- Volume per Basin, mil gal 1.01 2.54 0.13 2.54 1.01 2.54 1.01 2.54 0.00
o Total Volume of Basins, mil gal- Total Basin volume in service 11.12 7.85 6.10 7.85 8.09 7.85 6.07 7.85
-- Reduction for MBR cassettes 0.00 0.00 0.41 0.00 0.00 0.00 0.00 0.00- Biological Reaction Volume 11.12 7.85 5.69 7.85 8.09 7.85 6.07 7.85
o Aerated Zone BOD Loading, lb/1,000 cf-day 46.5 52.0 126.8 48.7 67.3 54.9 57.6 87.8o Hydraulic Detention Time, hr 6.82 7.46 3.61 8.20 4.96 7.53 5.61 4.91o Selected Operating L-P MLSS, mg/L 3,500 2,500 10,000 2,500 3,500 2,500 5,500 4,500
PROCESS LAYOUTo Zone Sizes (Fraction of Total Volume) Selected
- Zone 1 * 0.125 0.186 0.225 0.186 0.125 0.186 0.125 0.186 For MBR, 0.000- Zone 2 * 0.125 0.214 0.225 0.214 0.125 0.214 0.125 0.214 Copy 0.000- Zone 3 * 0.000 0.000 0.225 0.000 0.000 0.000 0.000 0.000 & Paste 0.000- Zone 4 * 0.000 0.000 0.000 0.000 0.000 0.000 0.000 0.000 these - - > 0.000- Zone 5 * 0.250 0.200 0.000 0.200 0.250 0.200 0.250 0.200 calcs into 0.000- Zone 6 * 0.250 0.200 0.225 0.200 0.250 0.200 0.250 0.200 < - - these 0.000- Zone 7 (by difference) 0.250 0.200 0.100 0.200 0.250 0.200 0.250 0.200 columns 0.000
-- Total 1.000 1.000 1.000 1.000 1.000 1.000 1.000 1.000 0.000o DO in each Zone (Unaerated, Set = 0), mg/L
- Zone 1 * 0.0 0.0 0.0 0.0 0.0 0.0 0.0 0.0 For MBR, 0.0- Zone 2 * 0.0 0.0 0.0 0.0 0.0 0.0 0.0 0.0 Adjust 2.0- Zone 3 * 0.0 2.0 0.5 2.0 0.0 0.0 0.0 2.0 D.O. as 2.0
* Input Data Ch07-AppA.xls - Page 5 of 26
H:\Client\Riversid_SAOW\7472A00\Rpt\Volume 04\Ch07-AppA.pdf

== CONFIDENTIAL == NOT FOR DISTRIBUTION ===
CAROLLO ENGINEERS, PCW.O./CLIENT: 7472A.00 / CITY OF RIVERSIDEPROJECT: REGIONAL WATER QUALITY CONTROL PLANT - SUBJECT: PROCESS ANALYSIS AND MASS BALANCECalc by Date Time Chk by/Date FileName:CFP,NV 02/27/2008 1:50 PM Ch07-AppA.xlsBiotran05 v.1106
Setup BasisPlant 1 Plant 2 Combined Plant 1 Plant 2 Combined Plant 1 Plant 2 Combined Plant 1 Plant 2 Combined info
Annual Average Plant Flow, mgd * 32.0 20.0 52.0 32.0 20.0 52.0 32.0 20.0 52.0 22.0 30.0 52.0Design (Max-Month) Flow, mgd 35.5 22.2 57.7 35.5 22.2 57.7 35.5 22.2 57.7 24.4 33.3 57.7
Design Capacity (Conv. IFAS)-high SRTDesign Capacity (Conv. ASP)-high SRT Design Capacity (MBR) Design Capacity (EPT)
- Zone 4 * 0.0 2.0 2.0 2.0 0.0 0.0 0.0 2.0 needed, 2.0- Zone 5 * 0.2 2.0 2.0 2.0 0.0 0.0 0.1 2.0 except for 2.0- Zone 6 * 2.0 2.0 2.0 2.0 2.0 2.0 2.0 2.0 Zone 7 2.0- Zone 7 * 2.0 2.0 1.5 2.0 2.0 2.0 2.0 2.0 < - - copy 0.0
o Aerated/Unaerated Fractions- Total Unaerated Volume Fraction 0.25 0.40 0.45 0.40 0.50 0.60 0.25 0.40
-- Total Unaerated Volume, mil gal 2.78 3.14 2.56 3.14 4.05 4.71 1.52 3.14- Total Aerated Volume Fraction 0.75 0.60 0.55 0.60 0.50 0.40 0.75 0.60
-- Total Aerated Volume, mil gal 8.34 4.71 3.13 4.71 4.05 3.14 4.55 4.71- Total Aerated Mass Fraction 0.75 0.60 0.63 0.60 0.50 0.40 0.75 0.60
o Plant Influent Flow Routing- Fraction to Zone 1 * 1.00 1.00 1.00 1.00 1.00 1.00 1.00 1.00 Default- Fraction to Zone 2 * 0.00 0.00 0.00 0.00 0.00 0.00 0.00 0.00 Default- Fraction to Zone 3 * 0.00 0.00 0.00 0.00 0.00 0.00 0.00 0.00 Default- Fraction to Zone 4 * 0.00 0.00 0.00 0.00 0.00 0.00 0.00 0.00 Default- Fraction to Zone 5 * 0.00 0.00 0.00 0.00 0.00 0.00 0.00 0.00 Default- Remainder to Zone 6 0.00 0.00 0.00 0.00 0.00 0.00 0.00 0.00
o Return Sludge Routing- Fraction to Zone 1 * 1.00 1.00 0.00 1.00 1.00 1.00 1.00 1.00 Default- Fraction to Zone 2 * 0.00 0.00 0.00 0.00 0.00 0.00 0.00 0.00 Default- Remainder to Zone 3 0.00 0.00 1.00 0.00 0.00 0.00 0.00 0.00
o Mixed-Liquor Recirculation Routing- MLR Taken from Zone (3, 4, 5, 6, 7) * 7 7 6 7 7 7 7 7 Default- MLR Returned to Zone (1, 2, 3, 4, 5) * 1 1 1 1 1 1 1 1 Default- MLR Flow, mgd 96.00 50.00 120.00 50.00 96.00 50.00 60.00 75.00- MLR Ratio 2.45 1.98 3.17 2.17 2.45 2.00 2.31 1.95
o Sludge Wasting Method For MBR,- Wasting from RAS (1) or ML (0) * 1 1 0 1 1 1 1 1 < - - copy 0 Default
-- If ML, Waste taken from Zone # (1, 2, - - 7) * (RAS) (RAS) 7 (RAS) (RAS) (RAS) (RAS) (RAS) < - - copy 7 Default
LOADING CRITERIAo BOD Applied, lb/d
- Total Influent 52,109 33,813 53,012 31,643 36,531 23,652 35,290 56,403- (-) WAS Recycled 228 1,028 0 980 159 598 225 1,100- Net BOD Load 51,881 32,785 53,012 30,663 36,373 23,054 35,065 55,303
o MLSS under aeration, lb 243,533 98,205 218,609 98,225 118,074 65,491 208,756 176,793- F/M, lb BOD Appl./lb MLSS-day 0.21 0.33 0.24 0.31 0.31 0.35 0.17 0.31
o Organic Loading, Based on Aerated Zone- Aerated Volume in Service, 1,000 cf 1,115 630 418 630 541 420 608 630- Aer. BOD Loading, lb BOD/1000 cf-day 46.5 52.0 126.8 48.7 67.3 54.9 57.6 87.8
o Unaerated Zone- Actual HRT (Throughflow), hr 0.45 0.91 0.39 0.94 0.66 1.36 0.36 0.58- Mixing Power, total
-- Total BHP, all Unaerated Zones * 97.3 110.0 89.6 110.0 141.6 164.9 53.1 110.0-- Mixing, hp/mil gal 35 35 35 35 35 35 35 35
ACTIVATED SLUDGE - ZONE 1 Un-Aer Un-Aer Un-Aer Un-Aer Un-Aer Un-Aer Un-Aer Un-Aero Zone Volume, mil gal 1 1.391 1.461 1.280 1.461 1.011 1.461 0.758 1.461o Flows Entering, mgd 1
- Plant Influent Flow 1 39.15 25.26 37.83 22.99 39.14 25.03 25.95 38.39- RAS Stream 1 13.01 7.99 0.00 7.27 13.01 7.91 15.66 16.87- Centrate * 0.00 0.00 0.00 0.00 0.00 0.00 0.00 0.00- ML Recirculation 1 96.00 50.00 120.00 50.00 96.00 50.00 60.00 75.00
* Input Data Ch07-AppA.xls - Page 6 of 26
H:\Client\Riversid_SAOW\7472A00\Rpt\Volume 04\Ch07-AppA.pdf

== CONFIDENTIAL == NOT FOR DISTRIBUTION ===
CAROLLO ENGINEERS, PCW.O./CLIENT: 7472A.00 / CITY OF RIVERSIDEPROJECT: REGIONAL WATER QUALITY CONTROL PLANT - SUBJECT: PROCESS ANALYSIS AND MASS BALANCECalc by Date Time Chk by/Date FileName:CFP,NV 02/27/2008 1:50 PM Ch07-AppA.xlsBiotran05 v.1106
Setup BasisPlant 1 Plant 2 Combined Plant 1 Plant 2 Combined Plant 1 Plant 2 Combined Plant 1 Plant 2 Combined info
Annual Average Plant Flow, mgd * 32.0 20.0 52.0 32.0 20.0 52.0 32.0 20.0 52.0 22.0 30.0 52.0Design (Max-Month) Flow, mgd 35.5 22.2 57.7 35.5 22.2 57.7 35.5 22.2 57.7 24.4 33.3 57.7
Design Capacity (Conv. IFAS)-high SRTDesign Capacity (Conv. ASP)-high SRT Design Capacity (MBR) Design Capacity (EPT)
- Total Flow to this Zone 1 148.17 83.25 157.83 80.26 148.15 82.95 101.62 130.26o ML Flow removed from this Zone, mgd 1
- ML Recirculated to Other Zones 1 n/a n/a n/a n/a n/a n/a n/a n/a- ML Wasted from this Zone 1 0.00 0.00 0.00 0.00 0.00 0.00 0.00 0.00- Other ML Flow removed from this Zone * 0.00 0.00 0.00 0.00 0.00 0.00 0.00 0.00- Net ML Flow to Next Zone, mgd 1 148.17 83.25 157.83 80.26 148.15 82.95 101.62 130.26
o HRT in this Zone 1- Hydraulic Detention time, Actual, hr 1 0.23 0.42 0.19 0.44 0.16 0.42 0.18 0.27
o Effluent from this Zone 1-- MLSS, mg/L 1 3,500 2,498 6,134 2,499 3,501 2,502 5,502 4,497-- NH3-N, mg/L 1 7.67 8.83 8.43 7.73 7.51 8.85 7.03 8.88-- NO3-N, mg/L 1 2.12 1.34 1.74 0.78 3.24 1.96 1.13 1.25-- D.O., mg/L 1 0.01 0.00 0.00 0.00 0.01 0.00 0.01 0.00
o Biological Growth Summary 1- Increase in VSS, lb/d 1 5,943 3,690 5,537 3,568 5,713 3,672 3,974 5,455- Increase in ISS, lb/d 1 533 354 528 338 498 336 354 531
ACTIVATED SLUDGE - ZONE 2 Un-Aer Un-Aer Un-Aer Un-Aer Un-Aer Un-Aer Un-Aer Un-Aero Zone Volume, mil gal 2 1.391 1.681 1.280 1.681 1.011 1.681 0.758 1.681o Flows Entering, mgd 2
- Throughflow 2 148.17 83.25 157.83 80.26 148.15 82.95 101.62 130.26- Plant Influent to this Zone 2 0.00 0.00 0.00 0.00 0.00 0.00 0.00 0.00- RAS Stream 2 0.00 0.00 0.00 0.00 0.00 0.00 0.00 0.00- ML Recirculation 2 0.00 0.00 0.00 0.00 0.00 0.00 0.00 0.00- Total Flow to this Zone 2 148.17 83.25 157.83 80.26 148.15 82.95 101.62 130.26
o ML Flow removed from this Zone, mgd 2- ML Recirculated to Other Zones 2 n/a n/a n/a n/a n/a n/a n/a n/a- ML Wasted from this Zone 2 0.00 0.00 0.00 0.00 0.00 0.00 0.00 0.00- Other ML Flow removed from this Zone * 0.00 0.00 0.00 0.00 0.00 0.00 0.00 0.00- Net ML Flow to Next Zone, mgd 2 148.17 83.25 157.83 80.26 148.15 82.95 101.62 130.26
o HRT in this Zone 2- Hydraulic Detention time, Actual, hr 2 0.23 0.48 0.19 0.50 0.16 0.49 0.18 0.31
o Effluent from this Zone 2-- MLSS, mg/L 2 3,500 2,495 6,133 2,495 3,501 2,500 5,501 4,494-- NH3-N, mg/L 2 7.92 9.26 8.74 8.30 7.68 9.18 7.35 9.35-- NO3-N, mg/L 2 0.81 0.04 0.29 0.01 2.00 0.34 0.11 0.02-- D.O., mg/L 2 0.00 0.00 0.00 0.00 0.00 0.00 0.00 0.00
o Biological Growth Summary 2- Increase in VSS, lb/d 2 -480 -1,857 -2,178 -2,752 505 -845 -943 -3,546- Increase in ISS, lb/d 2 -4 -88 -118 -144 63 -33 -52 -177
ACTIVATED SLUDGE - ZONE 3 N.I.S. N.I.S. Aerated N.I.S. N.I.S. N.I.S. N.I.S. N.I.S.o Zone Volume, mil gal 3 0.000 0.000 1.280 0.000 0.000 0.000 0.000 0.000o Flows Entering, mgd 3
- Throughflow 3 148.17 83.25 157.83 80.26 148.15 82.95 101.62 130.26- Plant Influent to this Zone 3 0.00 0.00 0.00 0.00 0.00 0.00 0.00 0.00- RAS Stream 3 0.00 0.00 151.33 0.00 0.00 0.00 0.00 0.00- ML Recirculation 3 0.00 0.00 0.00 0.00 0.00 0.00 0.00 0.00- Total Flow to this Zone 3 148.17 83.25 309.16 80.26 148.15 82.95 101.62 130.26
o ML Flow removed from this Zone, mgd 3- ML Recirculated to Other Zones 3 0.00 0.00 0.00 0.00 0.00 0.00 0.00 0.00- ML Wasted from this Zone 3 0.00 0.00 0.00 0.00 0.00 0.00 0.00 0.00- Other ML Flow removed from this Zone * 0.00 0.00 0.00 0.00 0.00 0.00 0.00 0.00- Net ML Flow to Next Zone, mgd 3 148.17 83.25 309.16 80.26 148.15 82.95 101.62 130.26
* Input Data Ch07-AppA.xls - Page 7 of 26
H:\Client\Riversid_SAOW\7472A00\Rpt\Volume 04\Ch07-AppA.pdf

== CONFIDENTIAL == NOT FOR DISTRIBUTION ===
CAROLLO ENGINEERS, PCW.O./CLIENT: 7472A.00 / CITY OF RIVERSIDEPROJECT: REGIONAL WATER QUALITY CONTROL PLANT - SUBJECT: PROCESS ANALYSIS AND MASS BALANCECalc by Date Time Chk by/Date FileName:CFP,NV 02/27/2008 1:50 PM Ch07-AppA.xlsBiotran05 v.1106
Setup BasisPlant 1 Plant 2 Combined Plant 1 Plant 2 Combined Plant 1 Plant 2 Combined Plant 1 Plant 2 Combined info
Annual Average Plant Flow, mgd * 32.0 20.0 52.0 32.0 20.0 52.0 32.0 20.0 52.0 22.0 30.0 52.0Design (Max-Month) Flow, mgd 35.5 22.2 57.7 35.5 22.2 57.7 35.5 22.2 57.7 24.4 33.3 57.7
Design Capacity (Conv. IFAS)-high SRTDesign Capacity (Conv. ASP)-high SRT Design Capacity (MBR) Design Capacity (EPT)
o HRT in this Zone 3- Hydraulic Detention time, Actual, hr 3 0.00 0.00 0.10 0.00 0.00 0.00 0.00 0.00
o Effluent from this Zone 3-- MLSS, mg/L 3 3,500 2,495 8,026 2,495 3,501 2,500 5,501 4,494-- NH3-N, mg/L 3 7.92 9.26 2.72 8.30 7.68 9.18 7.35 9.35-- NO3-N, mg/L 3 0.81 0.04 5.26 0.01 2.00 0.34 0.11 0.02-- D.O., mg/L 3 0.00 0.00 0.50 0.00 0.00 0.00 0.00 0.00
o Biological Growth Summary 3- Increase in VSS, lb/d 3 0 0 211 0 0 0 0 0- Increase in ISS, lb/d 3 0 0 426 0 0 0 0 0
ACTIVATED SLUDGE - ZONE 4 N.I.S. N.I.S. N.I.S. N.I.S. N.I.S. N.I.S. N.I.S. N.I.S.o Zone Volume, mil gal 4 0.000 0.000 0.000 0.000 0.000 0.000 0.000 0.000o Flows Entering, mgd 4
- Throughflow 4 148.17 83.25 309.16 80.26 148.15 82.95 101.62 130.26- Plant Influent to this Zone 4 0.00 0.00 0.00 0.00 0.00 0.00 0.00 0.00- ML Recirculation 4 0.00 0.00 0.00 0.00 0.00 0.00 0.00 0.00- Total Flow to this Zone 4 148.17 83.25 309.16 80.26 148.15 82.95 101.62 130.26
o ML Flow removed from this Zone, mgd 4- ML Recirculated to Other Zones 4 0.00 0.00 0.00 0.00 0.00 0.00 0.00 0.00- ML Wasted from this Zone 4 0.00 0.00 0.00 0.00 0.00 0.00 0.00 0.00- Other ML Flow removed from this Zone * 0.00 0.00 0.00 0.00 0.00 0.00 0.00 0.00- Net ML Flow to Next Zone, mgd 4 148.17 83.25 309.16 80.26 148.15 82.95 101.62 130.26
o HRT in this Zone 4- Hydraulic Detention time, Actual, hr 4 0.00 0.00 0.00 0.00 0.00 0.00 0.00 0.00
o Effluent from this Zone 4-- MLSS, mg/L 4 3,500 2,495 8,026 2,495 3,501 2,500 5,501 4,494-- NH3-N, mg/L 4 7.92 9.26 2.72 8.30 7.68 9.18 7.35 9.35-- NO3-N, mg/L 4 0.81 0.04 5.26 0.01 2.00 0.34 0.11 0.02-- D.O., mg/L 4 0.00 0.00 0.50 0.00 0.00 0.00 0.00 0.00
o Biological Growth Summary 4- Increase in VSS, lb/d 4 0 0 0 0 0 0 0 0- Increase in ISS, lb/d 4 0 0 0 0 0 0 0 0
ACTIVATED SLUDGE - ZONE 5 Aerated Aerated N.I.S. Aerated Un-Aer Un-Aer Aerated Aeratedo Zone Volume, mil gal 5 2.781 1.571 0.000 1.571 2.023 1.571 1.517 1.571o Flows Entering, mgd 5
- Throughflow 5 148.17 83.25 309.16 80.26 148.15 82.95 101.62 130.26- Plant Influent to this Zone 5 0.00 0.00 0.00 0.00 0.00 0.00 0.00 0.00- ML Recirculation 5 0.00 0.00 0.00 0.00 0.00 0.00 0.00 0.00- Total Flow to this Zone 5 148.17 83.25 309.16 80.26 148.15 82.95 101.62 130.26
o ML Flow removed from this Zone, mgd 5- ML Recirculated to Other Zones 5 0.00 0.00 0.00 0.00 0.00 0.00 0.00 0.00- ML Wasted from this Zone 5 0.00 0.00 0.00 0.00 0.00 0.00 0.00 0.00- Other ML Flow removed from this Zone * 0.00 0.00 0.00 0.00 0.00 0.00 0.00 0.00- Net ML Flow to Next Zone, mgd 5 148.17 83.25 309.16 80.26 148.15 82.95 101.62 130.26
o HRT in this Zone 5- Hydraulic Detention time, Actual, hr 5 0.45 0.45 0.00 0.47 0.33 0.45 0.36 0.29
o Effluent from this Zone 5-- MLSS, mg/L 5 3,500 2,497 8,026 2,498 3,499 2,497 5,500 4,497-- NH3-N, mg/L 5 5.71 5.24 2.72 4.37 7.98 9.52 5.56 5.34-- NO3-N, mg/L 5 1.88 3.32 5.26 3.12 0.68 0.01 0.63 3.23-- D.O., mg/L 5 0.15 2.00 0.50 2.00 0.00 0.00 0.10 2.00
o Biological Growth Summary 5- Increase in VSS, lb/d 5 -548 1,283 0 1,960 -2,260 -2,440 -857 2,399
* Input Data Ch07-AppA.xls - Page 8 of 26
H:\Client\Riversid_SAOW\7472A00\Rpt\Volume 04\Ch07-AppA.pdf
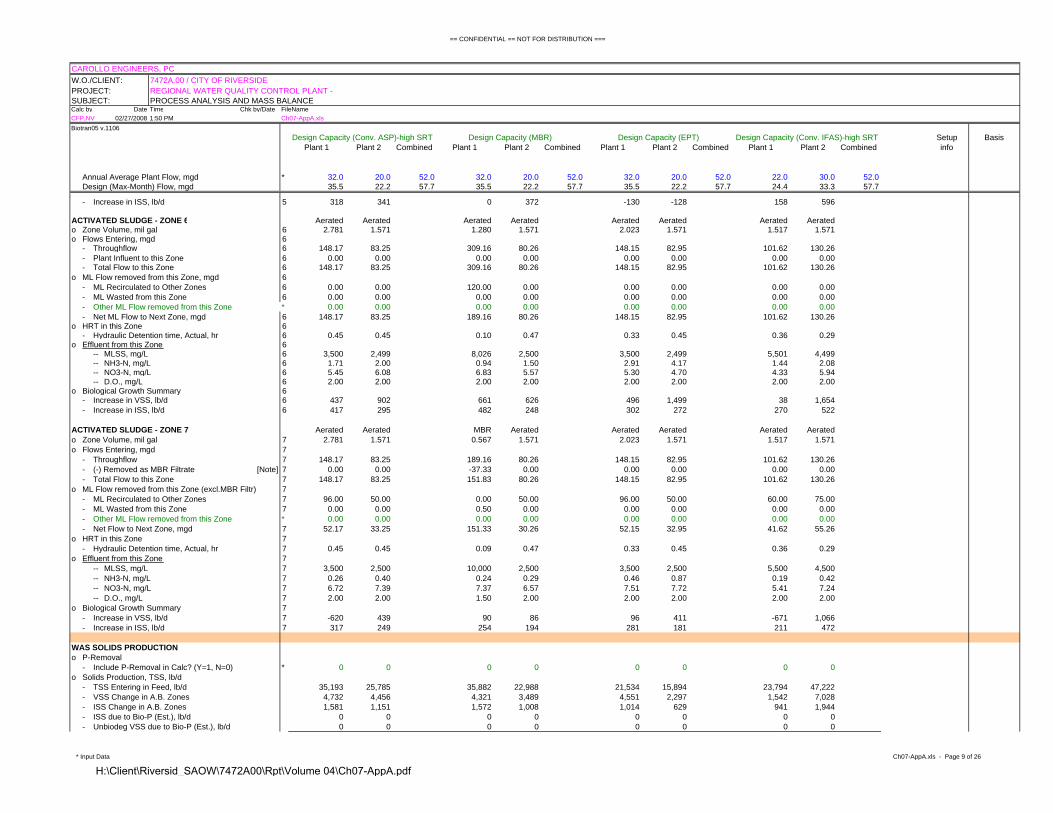
== CONFIDENTIAL == NOT FOR DISTRIBUTION ===
CAROLLO ENGINEERS, PCW.O./CLIENT: 7472A.00 / CITY OF RIVERSIDEPROJECT: REGIONAL WATER QUALITY CONTROL PLANT - SUBJECT: PROCESS ANALYSIS AND MASS BALANCECalc by Date Time Chk by/Date FileName:CFP,NV 02/27/2008 1:50 PM Ch07-AppA.xlsBiotran05 v.1106
Setup BasisPlant 1 Plant 2 Combined Plant 1 Plant 2 Combined Plant 1 Plant 2 Combined Plant 1 Plant 2 Combined info
Annual Average Plant Flow, mgd * 32.0 20.0 52.0 32.0 20.0 52.0 32.0 20.0 52.0 22.0 30.0 52.0Design (Max-Month) Flow, mgd 35.5 22.2 57.7 35.5 22.2 57.7 35.5 22.2 57.7 24.4 33.3 57.7
Design Capacity (Conv. IFAS)-high SRTDesign Capacity (Conv. ASP)-high SRT Design Capacity (MBR) Design Capacity (EPT)
- Increase in ISS, lb/d 5 318 341 0 372 -130 -128 158 596
ACTIVATED SLUDGE - ZONE 6 Aerated Aerated Aerated Aerated Aerated Aerated Aerated Aeratedo Zone Volume, mil gal 6 2.781 1.571 1.280 1.571 2.023 1.571 1.517 1.571o Flows Entering, mgd 6
- Throughflow 6 148.17 83.25 309.16 80.26 148.15 82.95 101.62 130.26- Plant Influent to this Zone 6 0.00 0.00 0.00 0.00 0.00 0.00 0.00 0.00- Total Flow to this Zone 6 148.17 83.25 309.16 80.26 148.15 82.95 101.62 130.26
o ML Flow removed from this Zone, mgd 6- ML Recirculated to Other Zones 6 0.00 0.00 120.00 0.00 0.00 0.00 0.00 0.00- ML Wasted from this Zone 6 0.00 0.00 0.00 0.00 0.00 0.00 0.00 0.00- Other ML Flow removed from this Zone * 0.00 0.00 0.00 0.00 0.00 0.00 0.00 0.00- Net ML Flow to Next Zone, mgd 6 148.17 83.25 189.16 80.26 148.15 82.95 101.62 130.26
o HRT in this Zone 6- Hydraulic Detention time, Actual, hr 6 0.45 0.45 0.10 0.47 0.33 0.45 0.36 0.29
o Effluent from this Zone 6-- MLSS, mg/L 6 3,500 2,499 8,026 2,500 3,500 2,499 5,501 4,499-- NH3-N, mg/L 6 1.71 2.00 0.94 1.50 2.91 4.17 1.44 2.08-- NO3-N, mg/L 6 5.45 6.08 6.83 5.57 5.30 4.70 4.33 5.94-- D.O., mg/L 6 2.00 2.00 2.00 2.00 2.00 2.00 2.00 2.00
o Biological Growth Summary 6- Increase in VSS, lb/d 6 437 902 661 626 496 1,499 38 1,654- Increase in ISS, lb/d 6 417 295 482 248 302 272 270 522
ACTIVATED SLUDGE - ZONE 7 Aerated Aerated MBR Aerated Aerated Aerated Aerated Aeratedo Zone Volume, mil gal 7 2.781 1.571 0.567 1.571 2.023 1.571 1.517 1.571o Flows Entering, mgd 7
- Throughflow 7 148.17 83.25 189.16 80.26 148.15 82.95 101.62 130.26- (-) Removed as MBR Filtrate [Note] 7 0.00 0.00 -37.33 0.00 0.00 0.00 0.00 0.00- Total Flow to this Zone 7 148.17 83.25 151.83 80.26 148.15 82.95 101.62 130.26
o ML Flow removed from this Zone (excl.MBR Filtr) 7- ML Recirculated to Other Zones 7 96.00 50.00 0.00 50.00 96.00 50.00 60.00 75.00- ML Wasted from this Zone 7 0.00 0.00 0.50 0.00 0.00 0.00 0.00 0.00- Other ML Flow removed from this Zone * 0.00 0.00 0.00 0.00 0.00 0.00 0.00 0.00- Net Flow to Next Zone, mgd 7 52.17 33.25 151.33 30.26 52.15 32.95 41.62 55.26
o HRT in this Zone 7- Hydraulic Detention time, Actual, hr 7 0.45 0.45 0.09 0.47 0.33 0.45 0.36 0.29
o Effluent from this Zone 7-- MLSS, mg/L 7 3,500 2,500 10,000 2,500 3,500 2,500 5,500 4,500-- NH3-N, mg/L 7 0.26 0.40 0.24 0.29 0.46 0.87 0.19 0.42-- NO3-N, mg/L 7 6.72 7.39 7.37 6.57 7.51 7.72 5.41 7.24-- D.O., mg/L 7 2.00 2.00 1.50 2.00 2.00 2.00 2.00 2.00
o Biological Growth Summary 7- Increase in VSS, lb/d 7 -620 439 90 86 96 411 -671 1,066- Increase in ISS, lb/d 7 317 249 254 194 281 181 211 472
WAS SOLIDS PRODUCTIONo P-Removal
- Include P-Removal in Calc? (Y=1, N=0) * 0 0 0 0 0 0 0 0o Solids Production, TSS, lb/d
- TSS Entering in Feed, lb/d 35,193 25,785 35,882 22,988 21,534 15,894 23,794 47,222- VSS Change in A.B. Zones 4,732 4,456 4,321 3,489 4,551 2,297 1,542 7,028- ISS Change in A.B. Zones 1,581 1,151 1,572 1,008 1,014 629 941 1,944- ISS due to Bio-P (Est.), lb/d 0 0 0 0 0 0 0 0- Unbiodeg VSS due to Bio-P (Est.), lb/d 0 0 0 0 0 0 0 0
* Input Data Ch07-AppA.xls - Page 9 of 26
H:\Client\Riversid_SAOW\7472A00\Rpt\Volume 04\Ch07-AppA.pdf

== CONFIDENTIAL == NOT FOR DISTRIBUTION ===
CAROLLO ENGINEERS, PCW.O./CLIENT: 7472A.00 / CITY OF RIVERSIDEPROJECT: REGIONAL WATER QUALITY CONTROL PLANT - SUBJECT: PROCESS ANALYSIS AND MASS BALANCECalc by Date Time Chk by/Date FileName:CFP,NV 02/27/2008 1:50 PM Ch07-AppA.xlsBiotran05 v.1106
Setup BasisPlant 1 Plant 2 Combined Plant 1 Plant 2 Combined Plant 1 Plant 2 Combined Plant 1 Plant 2 Combined info
Annual Average Plant Flow, mgd * 32.0 20.0 52.0 32.0 20.0 52.0 32.0 20.0 52.0 22.0 30.0 52.0Design (Max-Month) Flow, mgd 35.5 22.2 57.7 35.5 22.2 57.7 35.5 22.2 57.7 24.4 33.3 57.7
Design Capacity (Conv. IFAS)-high SRTDesign Capacity (Conv. ASP)-high SRT Design Capacity (MBR) Design Capacity (EPT)
- Total Solids Production, lb/d 41,506 31,392 41,775 27,485 27,098 18,820 26,277 56,195
MLSS CHARACTERISTICSo Mixed Liquor Components, mg TSS/L
- Solids, mg TSS/L-- Slowly Biodegradable 26 28 86 23 28 21 34 51-- Active Biomass 1,261 996 3,526 977 1,238 838 1,723 1,661-- Endogenous Biomass 415 206 1,180 230 406 255 758 345-- Nitrifiers 59 44 182 41 91 63 81 67-- Unbiodegradable VSS (Influent + Bio-P) 1,196 881 3,443 887 1,185 947 2,020 1,686-- Inorganic SS (influent + Biogrowth) 550 384 1,585 383 557 410 897 732-- Inorganic SS due to Bio-P (est.) 0 0 0 0 0 0 0 0-- Total Last-Pass MLSS 3,506 2,539 10,002 2,542 3,506 2,535 5,514 4,541-- Total Soluble Organic N (SolOrgN) 2.3 2.4 2.3 2.3 2.3 2.4 2.3 2.4-- Alkalinity, mg/L as CaCO3 141.2 139.2 138.6 142.2 139.0 139.7 145.8 139.8
o Org N fraction of MLVSS (NinVSS) 0.079 0.081 0.078 0.081 0.079 0.079 0.077 0.078o MLVSS Fraction 0.84 0.85 0.84 0.85 0.84 0.84 0.84 0.84o BOD of AS Solids
- BOD/TSS ratio 0.28 0.31 0.28 0.30 0.28 0.26 0.24 0.29
SOLIDS RETENTION TIME, SRTo Total Solids Wasted, lb/d 41,506 31,392 41,775 27,485 27,098 18,820 26,277 56,195
- Recycled WAS Solids, lb/d 582 3,522 0 3,425 343 2,173 600 4,007- Net lb Solids Yield/day 40,924 27,870 41,775 24,060 26,755 16,646 25,677 52,188
o Total BOD Load, lb/d 51,881 32,785 53,012 30,663 36,373 23,054 35,065 55,303- Recycled BOD, lb/d 228 1,028 0 980 159 598 225 1,100- Net BOD Load, lb/d 51,653 31,757 53,012 29,684 36,214 22,456 34,841 54,203
o Solids Production- lb Dry SS/lb BOD Applied 0.792 0.878 0.788 0.811 0.739 0.741 0.737 0.963
o Total Mass TSS in System, lb 324,711 163,609 349,539 163,644 236,149 163,723 278,358 294,577- Total SRT (Rs), days 7.93 5.87 7.24 8.37 6.80 7.87 8.83 9.84 9.24 10.84 5.64 8.17- lb/mgd 8,293 6,477 9,239 7,117 6,034 6,540 10,726 7,673
o Total Mass TSS in Aerated Zones, lb 243,533 98,205 218,609 98,225 118,074 65,491 208,756 176,793- Nominal Aerated Mass Fraction 0.750 0.600 0.625 0.600 0.500 0.400 0.750 0.600- Nominal Aerobic SRT, days 5.95 3.52 5.23 4.08 4.41 3.93 8.13 3.39
o Mass Fraction in Each Zone- Zone 1 0.125 0.186 0.187 0.186 0.125 0.186 0.125 0.186- Zone 2 0.125 0.214 0.187 0.214 0.125 0.214 0.125 0.214- Zone 3 0.000 0.000 0.245 0.000 0.000 0.000 0.000 0.000- Zone 4 0.000 0.000 0.000 0.000 0.000 0.000 0.000 0.000- Zone 5 0.250 0.200 0.000 0.200 0.250 0.200 0.250 0.200- Zone 6 0.250 0.200 0.245 0.200 0.250 0.200 0.250 0.200- Zone 7 0.250 0.200 0.135 0.200 0.250 0.200 0.250 0.200
1.000 1.000 1.000 1.000 1.000 1.000 1.000 1.000o Min. Aer. SRT recommended for
nitrification, days 5.5 4.4 5.0 4.4 4.7 5.4 5.8 4.4- Washout SRT(total)
-- Rwashout = 1/(Ua*DOsw - ba) 3.16 3.20 3.56 3.20 4.28 6.52 3.37 3.20- Recommended Aerobic SRT
-- Max slope criterion, dNH3/dSRT, mg/L-d * 0.20 0.20 0.20 0.20 0.20 0.20 0.20 0.20-- Recomm. Min. Operating SRT(total) 7.3 7.4 8.0 7.4 9.4 13.5 7.7 7.4-- Recomm. Min. Operating SRT(Nominal aerobic) 5.5 4.4 5.0 4.4 4.7 5.4 5.8 4.4-- Nitrification Safety Factor 2.31 2.30 2.26 2.30 2.19 2.06 2.28 2.30
* Input Data Ch07-AppA.xls - Page 10 of 26
H:\Client\Riversid_SAOW\7472A00\Rpt\Volume 04\Ch07-AppA.pdf

== CONFIDENTIAL == NOT FOR DISTRIBUTION ===
CAROLLO ENGINEERS, PCW.O./CLIENT: 7472A.00 / CITY OF RIVERSIDEPROJECT: REGIONAL WATER QUALITY CONTROL PLANT - SUBJECT: PROCESS ANALYSIS AND MASS BALANCECalc by Date Time Chk by/Date FileName:CFP,NV 02/27/2008 1:50 PM Ch07-AppA.xlsBiotran05 v.1106
Setup BasisPlant 1 Plant 2 Combined Plant 1 Plant 2 Combined Plant 1 Plant 2 Combined Plant 1 Plant 2 Combined info
Annual Average Plant Flow, mgd * 32.0 20.0 52.0 32.0 20.0 52.0 32.0 20.0 52.0 22.0 30.0 52.0Design (Max-Month) Flow, mgd 35.5 22.2 57.7 35.5 22.2 57.7 35.5 22.2 57.7 24.4 33.3 57.7
Design Capacity (Conv. IFAS)-high SRTDesign Capacity (Conv. ASP)-high SRT Design Capacity (MBR) Design Capacity (EPT)
AERATION REQUIREMENTSo Oxygen Required, lb/d
- Net Oxygen Demand in Zone 1 0 0 0 0 0 0 0 0- Net Oxygen Demand in Zone 2 0 0 0 0 0 0 0 0- Net Oxygen Demand in Zone 3 0 0 32,850 0 0 0 0 0- Net Oxygen Demand in Zone 4 0 0 0 0 0 0 0 0- Net Oxygen Demand in Zone 5 21,855 19,647 0 18,910 257 331 13,151 31,512- Net Oxygen Demand in Zone 6 37,129 16,293 38,026 14,599 38,401 22,395 26,548 26,362- Net Oxygen Demand in Zone 7 21,810 11,582 12,182 9,948 22,983 15,185 14,952 19,338- (-) Oxygen provided by MBR Scouring 0 0 -10,220 0 0 0 0 0- Total Oxygen required lb/d 80,794 47,522 72,838 43,458 61,641 37,911 54,651 77,212
o Diffuser Analysis 42,715 58,144 42,715 58,144 42,715 58,144Note:
All values of air and blower requirementsgiven below are preliminary estimates,to be refined during detailed design
o Oxygen Transfer Efficiency [EDI] [EDI] [EDI] [EDI] [EDI] [EDI] [EDI] [EDI]- Diffuser Type Mini- Mini- Mini- Mini- Mini- Mini- Mini- Mini-
Panel Panel Panel Panel Panel Panel Panel Panel- Aeration Basin D.O. (Avg), mg/L 1.4 2.0 1.3 2.0 2.0 2.0 1.4 2.0- Design Water Temperature, C 29 29 29 29 29 29 29 29 Summer- Diffuser submergence, ft 15.9 16.5 15.9 16.5 15.9 16.5 15.9 16.5- Air loading, scfm/unit [Note] 1.25 1.25 1.25 1.25 1.25 1.25 1.25 1.25
scfm/sf scfm/sf scfm/sf scfm/sf scfm/sf scfm/sf scfm/sf scfm/sf- Floor Coverage 23.4 28.7 70.3 25.2 38.8 29.3 30.9 52.4
%Actv A %Actv A %Actv A %Actv A %Actv A %Actv A %Actv A %Actv A- Clean Water SOTE * 36.2 37.1 36.2 37.1 36.2 37.1 36.2 37.1 Mfr. lit.- Site Conditions Adjustment Factor
F = Actual / Standard OTE-- Alpha factor, including fouling 0.54 0.50 0.37 0.52 0.56 0.59 0.50 0.45 Estimate-- Theta factor * 1.024 1.024 1.024 1.024 1.024 1.024 1.024 1.024 Default-- Temp. correction, Tau 0.85 0.85 0.85 0.85 0.85 0.85 0.85 0.85-- Elevation above MSL, ft * 695 695 695 695 695 695 695 695 Site-- ..Pressure correction, Omega 0.97 0.97 0.97 0.97 0.97 0.97 0.97 0.97-- Beta factor * 0.99 0.99 0.99 0.99 0.99 0.99 0.99 0.99 Default-- Equilibrium C*20 10.64 10.70 10.64 10.70 10.64 10.70 10.64 10.70
..Depth Adjustment Factor * 0.37 0.37 0.37 0.37 0.37 0.37 0.37 0.37 Default- F = Alpha x [Theta ^(T-20)] 0.46 0.39 0.32 0.41 0.43 0.46 0.43 0.35
x (Tau Beta Omega C*20 - C)/C*20- Oxygen Transfer Efficiency 16.57 14.57 11.53 15.16 15.71 17.09 15.55 12.95
OTE = F x SOTE Percent Percent Percent Percent Percent Percent Percent PercentPreliminary Estimate
o Surface Aerators #N/A #N/A #N/A #N/A #N/A #N/A #N/A #N/A- Oxygen to be transferred, lb/hr- Aerator hp required
[Ox. Requ.d/Eff.]- Peaking factor *- Aerator hp Installed
o SOTR Required- Average Day @ Design flow
-- Actual Ox Tr Requd, AOTR, lb/d 80,794 47,522 72,838 43,458 61,641 37,911 54,651 77,212-- Site Conditions Adjustment, F 0.46 0.39 0.32 0.41 0.43 0.46 0.43 0.35-- Standard Ox Tr Rate, SOTR, lb/d 176,639 121,066 228,813 106,388 142,119 82,336 127,308 221,242
SOTR = AOTR / F
* Input Data Ch07-AppA.xls - Page 11 of 26
H:\Client\Riversid_SAOW\7472A00\Rpt\Volume 04\Ch07-AppA.pdf

== CONFIDENTIAL == NOT FOR DISTRIBUTION ===
CAROLLO ENGINEERS, PCW.O./CLIENT: 7472A.00 / CITY OF RIVERSIDEPROJECT: REGIONAL WATER QUALITY CONTROL PLANT - SUBJECT: PROCESS ANALYSIS AND MASS BALANCECalc by Date Time Chk by/Date FileName:CFP,NV 02/27/2008 1:50 PM Ch07-AppA.xlsBiotran05 v.1106
Setup BasisPlant 1 Plant 2 Combined Plant 1 Plant 2 Combined Plant 1 Plant 2 Combined Plant 1 Plant 2 Combined info
Annual Average Plant Flow, mgd * 32.0 20.0 52.0 32.0 20.0 52.0 32.0 20.0 52.0 22.0 30.0 52.0Design (Max-Month) Flow, mgd 35.5 22.2 57.7 35.5 22.2 57.7 35.5 22.2 57.7 24.4 33.3 57.7
Design Capacity (Conv. IFAS)-high SRTDesign Capacity (Conv. ASP)-high SRT Design Capacity (MBR) Design Capacity (EPT)
o Air Supply Required- Average Day @ Design flow
-- Ox Transfer Rate, AOTR, lb/d 80,794 47,522 72,838 43,458 61,641 37,911 54,651 77,212-- Oxygen Supplied, lb/min 338.6 226.5 438.6 199.1 272.4 154.1 244.0 414.0-- cf Air/lb Oxygen 57.0 57.0 57.0 57.0 57.0 57.0 57.0 57.0
[23.3 lb O2/100 lb Air] [0.0753 lb Air/scf]
-- Process Air, scfm 19,300 12,910 25,000 11,350 15,530 8,780 13,910 23,600..scfm per lb/d Oxygen 0.239 0.272 0.343 0.261 0.252 0.232 0.255 0.306..scf/lb BOD Applied 536 567 679 533 615 548 571 615
-- Other Uses, e.g. Channel Air * 1,500 1,200 1,500 1,200 1,500 1,200 1,200 1,400 Default-- Total Blower Air, scfm 20,800 14,110 26,500 12,550 17,030 9,980 15,110 25,000
- Peak Day @ Design Flow-- Peaking factor * 1.3 1.3 1.3 1.3 1.3 1.3 1.3 1.3 Default-- Process Air, scfm 25,100 16,800 32,500 14,800 20,200 11,400 18,100 30,700-- Total Blower Air, scfm 26,600 18,000 34,000 16,000 21,700 12,600 19,300 32,100
o Diffusers- Expressed as active sq ft or # diffusers sq ft sq ft sq ft sq ft sq ft sq ft sq ft sq ft - Recommended
-- Air Loading, scfm/(sf or dfr) 1.25 1.25 1.25 1.25 1.25 1.25 1.25 1.25-- Number recommended per Basin 1,403 1,722 4,000 1,513 1,553 1,171 1,854 3,146
- Actual Installed, per basin-- Main Basin * 1,403 1,722 4,000 1,513 1,553 1,171 1,854 3,146-- Additional Basin * 0 0 0 0 0 0 0 0
- Total Installed, sf or dfr 15,438 10,330 19,998 9,078 12,421 7,025 11,126 18,878- Air Loading, scfm/sf or dfr
-- Daily Average 1.25 1.25 1.25 1.25 1.25 1.25 1.25 1.25- Floor Coverage
-- Total Basin Floor Area in Service, sf 88,000 60,000 51,700 60,000 64,000 60,000 48,000 60,000-- Total Aerated Floor Area in service 66,000 36,000 28,427 36,000 32,000 24,000 36,000 36,000-- Coverage 23.4 28.7 70.3 25.2 38.8 29.3 30.9 52.4
.. Expressed as %Actv A %Actv A %Actv A %Actv A %Actv A %Actv A %Actv A %Actv A- Active sf/diffuser, or 1 2.54 2.54 2.54 2.54 2.54 2.54 2.54 2.54- Number of diffuser units 6,078 4,067 7,873 3,574 4,890 2,766 4,380 7,432
o Blower Discharge pressure- Head, ft water
-- Submergence 15.9 16.5 15.9 16.5 15.9 16.5 15.9 16.5-- Freeboard above normal op level 0.0 0.0 4.0 0.0 0.0 0.0 0.0 0.0-- Diffuser head loss 1.5 1.5 1.5 1.5 1.5 1.5 1.5 1.5-- Pipe & Valve friction 2.5 2.5 2.5 2.5 2.5 2.5 2.5 2.5-- Total Head, ft 19.9 20.5 23.9 20.5 19.9 20.5 19.9 20.5
- Discharge pressure, psig 8.6 8.9 10.4 8.9 8.6 8.9 8.6 8.9o Delivered Horsepower
- Max Operating Air Temp, C * 34 34 34 34 34 34 34 34 Default- Barometric Pressure, psia 14.3 14.3 14.3 14.3 14.3 14.3 14.3 14.3- Blower Suction Pressure, psia 14.0 14.0 14.0 14.0 14.0 14.0 14.0 14.0- Daily Average Total Air, scfm 20,800 14,110 26,500 12,550 17,030 9,980 15,110 25,000- Avg Delivered Horsepower, hp 738 513 1,091 456 604 363 536 909- Peak Day Delivered hp 944 655 1,400 582 770 458 685 1,167
o Wire power required- Energy Efficiency, % * 61.0 61.0 61.0 61.0 61.0 61.0 61.0 61.0 Default- Wire power required, hp
-- Daily Average 1,210 840 1,790 750 990 590 880 1,490-- Firm Installed 1,550 1,070 2,290 950 1,260 750 1,120 1,910
* Input Data Ch07-AppA.xls - Page 12 of 26
H:\Client\Riversid_SAOW\7472A00\Rpt\Volume 04\Ch07-AppA.pdf

== CONFIDENTIAL == NOT FOR DISTRIBUTION ===
CAROLLO ENGINEERS, PCW.O./CLIENT: 7472A.00 / CITY OF RIVERSIDEPROJECT: REGIONAL WATER QUALITY CONTROL PLANT - SUBJECT: PROCESS ANALYSIS AND MASS BALANCECalc by Date Time Chk by/Date FileName:CFP,NV 02/27/2008 1:50 PM Ch07-AppA.xlsBiotran05 v.1106
Setup BasisPlant 1 Plant 2 Combined Plant 1 Plant 2 Combined Plant 1 Plant 2 Combined Plant 1 Plant 2 Combined info
Annual Average Plant Flow, mgd * 32.0 20.0 52.0 32.0 20.0 52.0 32.0 20.0 52.0 22.0 30.0 52.0Design (Max-Month) Flow, mgd 35.5 22.2 57.7 35.5 22.2 57.7 35.5 22.2 57.7 24.4 33.3 57.7
Design Capacity (Conv. IFAS)-high SRTDesign Capacity (Conv. ASP)-high SRT Design Capacity (MBR) Design Capacity (EPT)
SECONDARY SEDIMENTATION BASINSo Flow Rates, mgd
- AS Influent, Q 39.15 25.26 37.83 22.99 39.14 25.03 25.95 38.39- Net Sed. Basin Inflow (excl. RAS), Qci 39.15 25.26 37.33 22.99 39.14 25.03 25.95 38.39- Return Sludge Flow, Qr 13.01 7.99 151.33 7.27 13.01 7.91 15.66 16.87 (not including waste sludge flow)- Total Sed Basin Inflow 52.17 33.25 188.66 30.26 52.15 32.95 41.62 55.26- Total Sed. Basin Underflow 13.36 8.35 151.33 7.59 13.23 8.13 15.87 17.33- Net Sec. Effluent, Qe 38.80 24.89 37.33 22.67 38.92 24.82 25.74 37.93
o Basin dimensions- Group 1 *
-- No. of Basins * 7 2 8 2 7 2 4 3 1 more for-- Number of Units in Service * 6 2 7 2 6 2 4 3 hydraulics-- Diameter, ft (inside) * 0 130 0 130 0 130 0 130-- Side Water Depth, ft * 11.9 14.0 11.9 14.0 11.9 14.0 11.9 14.0-- Surface Area per Basin, sf 8,800 13,273 8,800 13,273 8,800 13,273 8,800 13,273-- Volume per Basin, cf 104,720 185,825 104,720 185,825 104,720 185,825 104,720 185,825
- Group 2 *-- No. of Basins * 0 2 0 2 0 2 0 2-- Number of Units in Service * 0 2 0 2 0 2 0 2-- Diameter, ft (inside) * 120 100 120 100 120 100 120 100-- Side Water Depth, ft * 14.0 10.3 14.0 10.3 14.0 10.3 14.0 10.3-- Surface Area per Basin, sf 11,310 7,854 11,310 7,854 11,310 7,854 11,310 7,854-- Volume per Basin, cf 158,336 80,503 158,336 80,503 158,336 80,503 158,336 80,503
o Flow Split- Fraction of ML Flow to Group 1:
-- Fraction based on Surface Area 1.00 0.63 1.00 0.63 1.00 0.63 1.00 0.72-- Fraction selected * 1.00 0.63 1.00 0.63 1.00 0.63 1.00 0.72
- Effective (Flow-weighted) SWD, ft 11.90 12.61 11.90 12.61 11.90 12.61 11.90 12.94o Surface Overflow Rate
- Group 1-- Surface Area in service, sf 52,800 26,546 61,600 26,546 52,800 26,546 35,200 39,820-- Surface Overflow Rate, gpd/sf 735 589 606 537 737 587 731 683
- Group 2-- Surface Area in service, sf 0 15,708 0 15,708 0 15,708 0 15,708-- Surface Overflow Rate, gpd/sf 0 589 0 537 0 587 0 683
o Solids Loading Rate, lb/day-sf- Group 1 29 16 255 15 29 16 54 37- Group 2 0 16 0 15 0 16 0 37
o Volume in service, mil gal- Group 1 4.70 2.78 5.48 2.78 4.70 2.78 3.13 4.17- Group 2 0.00 1.20 0.00 1.20 0.00 1.20 0.00 1.20
o Hydraulic Detention Time, hr (based on Q)- Group 1 2.9 4.2 N.A. 4.6 2.9 4.2 2.9 3.6- Group 2 N.A. 3.1 N.A. 3.4 N.A. 3.1 N.A. 2.7
o Weir Loading- Group 1
-- Actual weir length per unit, ft * 808 745 667 745 811 745 804 745 Default-- Weir loading, gpd/ft 8,000 10,502 8,000 9,566 8,000 10,472 8,000 12,179
- Group 2-- Actual weir length per unit, ft * 0 556 0 556 0 556 0 556 Default-- Weir loading, gpd/ft 0 8,320 0 7,579 0 8,297 0 9,649
o Sludge Settling Characteristics
* Input Data Ch07-AppA.xls - Page 13 of 26
H:\Client\Riversid_SAOW\7472A00\Rpt\Volume 04\Ch07-AppA.pdf

== CONFIDENTIAL == NOT FOR DISTRIBUTION ===
CAROLLO ENGINEERS, PCW.O./CLIENT: 7472A.00 / CITY OF RIVERSIDEPROJECT: REGIONAL WATER QUALITY CONTROL PLANT - SUBJECT: PROCESS ANALYSIS AND MASS BALANCECalc by Date Time Chk by/Date FileName:CFP,NV 02/27/2008 1:50 PM Ch07-AppA.xlsBiotran05 v.1106
Setup BasisPlant 1 Plant 2 Combined Plant 1 Plant 2 Combined Plant 1 Plant 2 Combined Plant 1 Plant 2 Combined info
Annual Average Plant Flow, mgd * 32.0 20.0 52.0 32.0 20.0 52.0 32.0 20.0 52.0 22.0 30.0 52.0Design (Max-Month) Flow, mgd 35.5 22.2 57.7 35.5 22.2 57.7 35.5 22.2 57.7 24.4 33.3 57.7
Design Capacity (Conv. IFAS)-high SRTDesign Capacity (Conv. ASP)-high SRT Design Capacity (MBR) Design Capacity (EPT)
- Design Max. SVI, ml/g * 150 150 150 150 150 150 150 150 DefaultISV = a x exp(-b MLSS), ft/h
- "a" Value, ft/hr * 21.3 21.3 21.3 21.3 21.3 21.3 21.3 21.3- "b" Value [x 1,000,000] * 218 218 218 218 218 218 218 218
o Target Settling Values- Effluent rise rate (SOR), ft/hr
-- Group 1 4.09 3.28 3.38 2.99 4.11 3.27 4.07 3.81-- Group 2 N.A. 3.28 N.A. 2.99 N.A. 3.27 N.A. 3.81-- Average 4.09 3.28 3.38 2.99 4.11 3.27 4.07 3.81
- Clarifier Safety Factor, CSF * 2.3 2.3 2.3 2.3 2.3 2.3 2.3 2.3 Default- Initial Settling Velocity, ISV, ft/hr 9.3 7.5 7.7 6.8 9.4 7.5 9.3 8.7- Preferred Max. Last-Pass MLSS, mg/L 3,786 4,801 4,671 5,229 3,773 4,814 3,809 4,121
o Selected Settling Values- Operating L-P MLSS conc, mg/L 3,500 2,500 10,000 2,500 3,500 2,500 5,500 4,500- Operating ISV, ft/h 9.9 12.4 2.4 12.4 9.9 12.4 6.4 8.0- Operating CSF
-- Group 1 2.4 3.0 0.7 3.3 2.4 3.1 1.6 2.1-- Group 2 N.A. 3.0 N.A. 3.3 N.A. 3.1 N.A. 2.1
MEMBRANE BIO-REACTOR (MBR)o MBR System in Service? (Y=1; N=0) * 0 0 1 0 0 0 0 0
into column B) but DO NOT DELETE the sectiono Flow Rates, mgd
- Nominal Plant Flow Rate, mgd-- Daily Average 35.52 22.20 35.52 22.20 35.52 22.20 24.42 33.30-- 4-Hour Diurnal Peak Flow, mgd 46.18 28.86 46.18 28.86 46.18 28.86 31.75 43.29-- Max Instantaneous Flow, mgd 70.40 44.00 70.40 44.00 70.40 44.00 48.40 66.00
- Actual Secondary Effluent, mgd-- Daily Average 38.80 24.89 37.33 22.67 38.92 24.82 25.74 37.93-- 4-Hour Diurnal Peak Flow, mgd 49.46 31.55 47.99 29.33 49.57 31.48 33.07 47.92-- Max Instantaneous Flow, mgd 73.68 46.69 72.21 44.47 73.80 46.62 49.72 70.63
- Design Flow through Membranes-- Daily Average 38.80 24.89 37.33 22.67 38.92 24.82 25.74 37.93-- Peak Flow (Short Term) * 49.46 31.55 47.99 29.33 49.57 31.48 33.07 47.92
o Reaction Zone dimensions- (NOT INCLUDING the membrane zones)- No. of Units (parallel trains) * 2 2 5 2 2 2 2 2- Number of Units in Service * 2 2 5 2 2 2 2 2- Length, ft (inside) * 200 200 200 200 200 200 200 200- Width, ft (inside) * 100 100 40 100 100 100 100 100- Side Water Depth, ft * 17 17 16.9 17 17 17 17 17- Volume per Basin, mil gal 2.54 2.54 1.01 2.54 2.54 2.54 2.54 2.54
o Membrane System Characteristics- Membrane identification ZW-500b ZW-500b ZW-500d ZW-500b ZW-500b ZW-500b ZW-500b ZW-500b- Average Operating Flux, gfd * 14 14 15.44 14 14 14 14 14- Stressed Operating Flux (4 hours), gfd * 18.2 18.2 27.35 18.2 18.2 18.2 18.2 18.2- Membrane area per module (element), sf * 650 650 340 650 650 650 650 650- Modules (Elements) per Cassette * 8 8 48 8 8 8 8 8- Cassette dimensions, ft
-- Length * 6 6 7.1 6 6 6 6 6-- Width * 2.39 2.39 5.7 2.39 2.39 2.39 2.39 2.39-- Depth (Height) * 6.73 6.73 8.3 6.73 6.73 6.73 6.73 6.73Scrubbing air, acfm per sf membrane * 0.0192 0.0192 0.0128 0.0192 0.0192 0.0192 0.0192 0.0192-- acfm per module 12.48 12.48 4.35 12.48 12.48 12.48 12.48 12.48
* Input Data Ch07-AppA.xls - Page 14 of 26
H:\Client\Riversid_SAOW\7472A00\Rpt\Volume 04\Ch07-AppA.pdf

== CONFIDENTIAL == NOT FOR DISTRIBUTION ===
CAROLLO ENGINEERS, PCW.O./CLIENT: 7472A.00 / CITY OF RIVERSIDEPROJECT: REGIONAL WATER QUALITY CONTROL PLANT - SUBJECT: PROCESS ANALYSIS AND MASS BALANCECalc by Date Time Chk by/Date FileName:CFP,NV 02/27/2008 1:50 PM Ch07-AppA.xlsBiotran05 v.1106
Setup BasisPlant 1 Plant 2 Combined Plant 1 Plant 2 Combined Plant 1 Plant 2 Combined Plant 1 Plant 2 Combined info
Annual Average Plant Flow, mgd * 32.0 20.0 52.0 32.0 20.0 52.0 32.0 20.0 52.0 22.0 30.0 52.0Design (Max-Month) Flow, mgd 35.5 22.2 57.7 35.5 22.2 57.7 35.5 22.2 57.7 24.4 33.3 57.7
Design Capacity (Conv. IFAS)-high SRTDesign Capacity (Conv. ASP)-high SRT Design Capacity (MBR) Design Capacity (EPT)
-- Percent of time that air is ON * 100 100 25 100 100 100 100 100-- Net scfm per module 14.7 14.7 1.3 14.7 14.7 14.7 14.7 14.7
o Est.Membrane Units Required ( In Service )- Membrane Area, sf
-- Based on Avg Flux 2,771,653 1,777,953 2,072,197 1,619,488 2,779,845 1,772,894 1,838,726 2,709,590-- Based on Max Flux 2,717,536 1,733,590 1,754,586 1,611,694 2,723,837 1,729,699 1,816,932 2,633,201-- Membrane area in service, sf 2,771,653 1,777,953 2,072,197 1,619,488 2,779,845 1,772,894 1,838,726 2,709,590
- Number of Modules (Elements) 4,264 2,735 6,095 2,492 4,277 2,728 2,829 4,169- Number of Cassettes in service (typ.) 533 342 127 312 535 341 354 522
o Membrane Zone Configuration- Total Number of Membrane Zones * 2 2 8 2 2 2 2 2- Cassettes Required per Zone
-- All units in service 267 171 16 156 268 171 177 261-- Allowing for one unit out of service 534 342 18 312 536 342 354 522
- Cassettes Installed per Zone * 534 342 18 312 536 342 354 522-- Cassettes spaces provided, incl. Spares * 534 342 22 312 Per Zenon 536 342 354 522
- Total Membrane Area, all Zones, sf 5,553,600 3,556,800 2,387,383 3,244,800 5,574,400 3,556,800 3,681,600 5,428,800- Flux @ Daily Avg Flow, gfd
-- One Zone OOS 14.0 14.0 17.9 14.0 14.0 14.0 14.0 14.0-- All Zones in Service 7.0 7.0 15.6 7.0 7.0 7.0 7.0 7.0
- Flux @ Peak Flow, gfd-- One Zone OOS 17.8 17.7 23.0 18.1 17.8 17.7 18.0 17.7-- All Zones in Service 8.9 8.9 20.1 9.0 8.9 8.9 9.0 8.8
- Freeboard Check (from FB Check section below)-- At Peak Flow (AB or MZ OOS) OK OK OK OK OK OK OK OK
.. 1 AB and 1 MZ OOS OK OK OK OK OK OK OK OK-- At Inst. Max Flow (AB or MZ OOS) Overload Overload Overload Overload Overload Overload Overload Overload
.. 1 AB and 1 MZ OOS Overload Overload Overload Overload Overload Overload Overload Overloado Membrane Zone Dimensions - per Zone
- Number of cassettes accommodated 534 342 22 312 536 342 354 522- Dimensions Along Length of Cassette:
-- Zone inside dimension, ft * 134.4 109.2 19.5 100.8 134.4 109.2 109.2 134.4-- Number of Cassette positions * 17 13 2 12 17 13 13 17-- Free space provided [30-50] 32% 40% 37% 40% 32% 40% 40% 32%
- Dimensions Along Width of Cassette:-- Zone inside dimension, ft * 107.072 90.342 75 86.996 107.072 90.342 93.688 103.726-- Number of Cassette positions * 32 27 11 26 32 27 28 31-- Free space provided [30-50] 40% 40% 20% 40% 40% 40% 40% 40%
- Total Cassette Spaces per Membrane Zone 544 351 22 312 544 351 364 527- Side Water Depth at min. flow, ft * 8.7 8.7 11.9 8.7 8.7 8.7 8.7 8.7
-- Minimum cassette water cover * 1 1 1 1 1 1 1 1-- Cassette submergence 7.73 7.73 9.3 7.73 7.73 7.73 7.73 7.73-- Free depth below cassettes, ft 1 1 2.6 1 1 1 1 1
o Net Biological Reaction Volume- Cassette volume per Zone, cf 59,193 37,910 6,882 34,585 59,415 37,910 39,240 57,863- Total membrane zone volume, mil gal 1.88 1.29 1.04 1.15 1.88 1.29 1.34 1.82- Total volume occupied by cassettes, mil gal 0.89 0.57 0.41 0.52 0.89 0.57 0.59 0.87- Nominal Aer. Basin volume, mil gal 11.12 7.85 5.69 7.85 8.09 7.85 6.07 7.85- Available Biological Reaction Volume 10.24 7.29 6.32 7.34 7.20 7.29 5.48 6.99
o MLSS Relationships- Target MLSS in Membrane Zone, mg/L 3,500 2,500 10,000 2,500 3,500 2,500 5,500 4,500- Target MLSS in Reaction Zones, mg/L 7,000 7,000 8,000 7,000 7,000 7,000 7,000 7,000- Total Recycle Ratio required leaving Zone 7 0.29 0.29 4.00 0.29 0.29 0.29 0.29 0.29
-- MLR from Zone 7 (only if from Z7) 2.45 1.98 0.00 2.17 2.45 2.00 2.31 1.95
* Input Data Ch07-AppA.xls - Page 15 of 26
H:\Client\Riversid_SAOW\7472A00\Rpt\Volume 04\Ch07-AppA.pdf

== CONFIDENTIAL == NOT FOR DISTRIBUTION ===
CAROLLO ENGINEERS, PCW.O./CLIENT: 7472A.00 / CITY OF RIVERSIDEPROJECT: REGIONAL WATER QUALITY CONTROL PLANT - SUBJECT: PROCESS ANALYSIS AND MASS BALANCECalc by Date Time Chk by/Date FileName:CFP,NV 02/27/2008 1:50 PM Ch07-AppA.xlsBiotran05 v.1106
Setup BasisPlant 1 Plant 2 Combined Plant 1 Plant 2 Combined Plant 1 Plant 2 Combined Plant 1 Plant 2 Combined info
Annual Average Plant Flow, mgd * 32.0 20.0 52.0 32.0 20.0 52.0 32.0 20.0 52.0 22.0 30.0 52.0Design (Max-Month) Flow, mgd 35.5 22.2 57.7 35.5 22.2 57.7 35.5 22.2 57.7 24.4 33.3 57.7
Design Capacity (Conv. IFAS)-high SRTDesign Capacity (Conv. ASP)-high SRT Design Capacity (MBR) Design Capacity (EPT)
-- Qr/Q 0.00 0.00 4.00 0.00 0.00 0.00 0.00 0.00- Actual MLSS in Zone 6, mg/L 3,500 2,499 8,026 2,500 3,500 2,499 5,501 4,499
o Freeboard Check (Uses Main AB only)- Number of Basins that provide Freeboard 12 6 5 6 8 6 6 6- Basin surface area, each, sf 8,000 10,000 8,000 10,000 8,000 10,000 8,000 10,000- Total Freeboard provided, ft * 6 6 6 6 6 6 6 6
-- Min. liquid clearance below top of wall * 1 1 1 1 1 1 1 1-- Freeboard used for control * 1 1 1 1 1 1 1 1-- Freeboard available for accumulation 4 4 4 4 4 4 4 4
- Freeboard volume available, mil gal-- All Aeration Basins in service 2.872 1.795 1.197 1.795 1.915 1.795 1.436 1.795-- One Aeration Basin OOS 2.633 1.496 0.957 1.496 1.676 1.496 1.197 1.496
- Membrane capacity at peak flux, mgd-- All membranes in Service 101.08 64.73 65.29 59.06 101.45 64.73 67.01 98.80-- One cassette in cleaning 100.98 64.64 64.85 58.96 101.36 64.64 66.91 98.71-- One Membrane Zone OOS 50.54 32.37 57.13 29.53 50.73 32.37 33.50 49.40
o Peak Accumulation at Diurnal Peak Flow- Peak Influent Flow, mgd 49.46 31.55 47.99 29.33 49.57 31.48 33.07 47.92- Peak Flow duration, h * 4 4 4 4 4 4 4 4- All membranes in Service, Accum. mil gal 0.000 0.000 0.000 0.000 0.000 0.000 0.000 0.000
-- & All Aeration Basins in service.. Freeboard used, ft 0.00 0.00 0.00 0.00 0.00 0.00 0.00 0.00.. Excess flow to be diverted, gal/d 0 0 0 0 0 0 0 0
-- & One Aeration Basin OOS.. Freeboard used, ft 0.00 0.00 0.00 0.00 0.00 0.00 0.00 0.00.. Excess flow to be diverted, gal/d 0 0 0 0 0 0 0 0
- One cassette in cleaning, Accum. mil gal 0.000 0.000 0.000 0.000 0.000 0.000 0.000 0.000-- & All Aeration Basins in service
.. Freeboard used, ft 0.00 0.00 0.00 0.00 0.00 0.00 0.00 0.00
.. Excess flow to be diverted, gal/d 0 0 0 0 0 0 0 0-- & One Aeration Basin OOS
.. Freeboard used, ft 0.00 0.00 0.00 0.00 0.00 0.00 0.00 0.00
.. Excess flow to be diverted, gal/d 0 0 0 0 0 0 0 0- One Membrane Zone OOS, Accum. mil gal 0.000 0.000 0.000 0.000 0.000 0.000 0.000 0.000
-- & All Aeration Basins in service.. Freeboard used, ft 0.00 0.00 0.00 0.00 0.00 0.00 0.00 0.00.. Excess flow to be diverted, gal/d 0 0 0 0 0 0 0 0
-- & One Aeration Basin OOS.. Freeboard used, ft 0.00 0.00 0.00 0.00 0.00 0.00 0.00 0.00.. Excess flow to be diverted, gal/d 0 0 0 0 0 0 0 0
o Peak Accumulation at Max Instantaneous Flow- Peak Influent Flow, mgd 73.68 46.69 72.21 44.47 73.80 46.62 49.72 70.63- Peak Flow duration, h * 4 4 4 4 4 4 4 4- All membranes in Service, Accum. mil gal 0.000 0.000 1.153 0.000 0.000 0.000 0.000 0.000
-- & All Aeration Basins in service.. Freeboard used, ft 0.00 0.00 3.85 0.00 0.00 0.00 0.00 0.00.. Excess flow to be diverted, gal/d 0 0 0 0 0 0 0 0
-- & One Aeration Basin OOS.. Freeboard used, ft 0.00 0.00 4.00 0.00 0.00 0.00 0.00 0.00.. Excess flow to be diverted, gal/d 0 0 195,443 0 0 0 0 0
- One cassette in cleaning, Accum. mil gal 0.000 0.000 1.227 0.000 0.000 0.000 0.000 0.000-- & All Aeration Basins in service
.. Freeboard used, ft 0.00 0.00 4.00 0.00 0.00 0.00 0.00 0.00
.. Excess flow to be diverted, gal/d 0 0 30,474 0 0 0 0 0
* Input Data Ch07-AppA.xls - Page 16 of 26
H:\Client\Riversid_SAOW\7472A00\Rpt\Volume 04\Ch07-AppA.pdf

== CONFIDENTIAL == NOT FOR DISTRIBUTION ===
CAROLLO ENGINEERS, PCW.O./CLIENT: 7472A.00 / CITY OF RIVERSIDEPROJECT: REGIONAL WATER QUALITY CONTROL PLANT - SUBJECT: PROCESS ANALYSIS AND MASS BALANCECalc by Date Time Chk by/Date FileName:CFP,NV 02/27/2008 1:50 PM Ch07-AppA.xlsBiotran05 v.1106
Setup BasisPlant 1 Plant 2 Combined Plant 1 Plant 2 Combined Plant 1 Plant 2 Combined Plant 1 Plant 2 Combined info
Annual Average Plant Flow, mgd * 32.0 20.0 52.0 32.0 20.0 52.0 32.0 20.0 52.0 22.0 30.0 52.0Design (Max-Month) Flow, mgd 35.5 22.2 57.7 35.5 22.2 57.7 35.5 22.2 57.7 24.4 33.3 57.7
Design Capacity (Conv. IFAS)-high SRTDesign Capacity (Conv. ASP)-high SRT Design Capacity (MBR) Design Capacity (EPT)
-- & One Aeration Basin OOS.. Freeboard used, ft 0.00 0.00 4.00 0.00 0.00 0.00 0.00 0.00.. Excess flow to be diverted, gal/d 0 0 269,834 0 0 0 0 0
- One Membrane Zone OOS, Accum. mil gal 3.858 2.387 2.513 2.491 3.845 2.376 2.703 3.539-- & All Aeration Basins in service
.. Freeboard used, ft 4.00 4.00 4.00 4.00 4.00 4.00 4.00 4.00
.. Excess flow to be diverted, gal/d 985,244 592,210 1,316,371 695,658 1,930,252 580,406 1,267,106 1,743,497-- & One Aeration Basin OOS
.. Freeboard used, ft 4.00 4.00 4.00 4.00 4.00 4.00 4.00 4.00
.. Excess flow to be diverted, gal/d 1,224,604 891,410 1,555,731 994,858 2,169,612 879,606 1,506,466 2,042,697o Scrubbing Air Requirements
- Applied air per module, scfm 14.7 14.7 1.3 14.7 14.7 14.7 14.7 14.7-- Sufficient for Oxygen Demand? ( > ) More Ox reqd
- Number of modules - all Zones in serv 8,544 5,472 7,022 4,992 8,576 5,472 5,664 8,352- Air supply - all Zones in service, scfm 125,986 80,688 9,373 73,610 126,458 80,688 83,519 123,155- Air supply - one Zone OOS, scfm 62,993 40,344 8,202 36,805 63,229 40,344 41,760 61,578
o Oxygen Transfer Efficiency (Coarse Bubble)- Diffuser submergence, ft 7.7 7.7 9.3 7.7 7.7 7.7 7.7 7.7- Clean Water SOTE, est. 6.3 6.3 7.6 6.3 6.3 6.3 6.3 6.3- Equilibrium C*20 9.69 9.69 9.82 9.69 9.69 9.69 9.69 9.69
-- Adjusted C*20 7.91 7.91 8.01 7.91 7.91 7.91 7.91 7.91- OTE Multiplier 0.112 0.116 0.087 0.116 0.112 0.116 0.104 0.108- Minimum DO required, mg/L * 2.00 2.00 1.50 2.00 2.00 2.00 2.00 2.00- Membrane Zone D.O., mg/L 6.93 7.13 1.50 7.17 6.88 6.89 6.82 6.99- Site Conditions Adjustment Factor, F 0.11 0.09 0.57 0.09 0.11 0.12 0.11 0.10
= OTEMult x (C*20adj - C)- Est. Oxygen Transfer Efficiency, % 0.69 0.57 4.32 0.54 0.72 0.75 0.71 0.62
o D.O. Concentration without Air Supplement- Ox.Transfer=Biological Demand, lb/d 21,810 11,582 12,182 9,948 22,983 15,185 14,952 19,338- Resulting DO conc, mg/L 6.93 7.13 0.25 7.17 6.88 6.89 6.82 6.99
(All Zones in service) More Ox rqd!o Supplemental Oxygen required
- Max. (Biological) Ox. Demand, lb/d 21,810 11,582 12,182 9,948 22,983 15,185 14,952 19,338- Ox.Transferred from Mem. air, lb/d 21,814 11,584 10,220 9,950 22,987 15,188 14,955 19,342- Supplemental Ox requd in Membr zone, lb/d 0 0 1,962 0 0 0 0 0
o Aeration Diffusers in Membrane Zones- Total Floor Area in Membrane Zones, sf 28,781 19,731 11,700 17,538 28,781 19,731 20,461 27,882- Floor Area reserved for Cassettes 15,602 10,067 7,123 8,948 15,602 10,067 10,440 15,114- Available Free Floor Area, sf 13,179 9,664 4,577 8,590 13,179 9,664 10,022 12,767- Total MZ Floor Area fitted with Diffusers, sf * 0 0 0 0 0 0 0 0
o Scrubbing Blower Discharge pressure- Head, ft water
-- Submergence (min water level) 7.7 7.7 9.3 7.7 7.7 7.7 7.7 7.7-- Freeboard above min. op. level 5.0 5.0 5.0 5.0 5.0 5.0 5.0 5.0-- Diffuser head loss * 0.5 0.5 0.5 0.5 0.5 0.5 0.5 0.5-- Pipe & Valve friction * 1.0 1.0 1.0 1.0 1.0 1.0 1.0 1.0-- Total Head, ft 14.2 14.2 15.8 14.2 14.2 14.2 14.2 14.2Discharge pressure @ min. op. level, psig 4.0 4.0 4.7 4.0 4.0 4.0 4.0 4.0
- Discharge pressure @ pk freeboard, psig 6.2 6.2 6.8 6.2 6.2 6.2 6.2 6.2o Delivered Horsepower
- Max Operating Air Temp, C * 34 34 34 34 34 34 34 34- Barometric Pressure, psia 14.3 14.3 14.3 14.3 14.3 14.3 14.3 14.3- Blower Suction Pressure, psia 14.0 14.0 14.0 14.0 14.0 14.0 14.0 14.0- Daily Average Total Air, scfm 125,986 80,688 9,373 73,610 126,458 80,688 83,519 123,155
* Input Data Ch07-AppA.xls - Page 17 of 26
H:\Client\Riversid_SAOW\7472A00\Rpt\Volume 04\Ch07-AppA.pdf

== CONFIDENTIAL == NOT FOR DISTRIBUTION ===
CAROLLO ENGINEERS, PCW.O./CLIENT: 7472A.00 / CITY OF RIVERSIDEPROJECT: REGIONAL WATER QUALITY CONTROL PLANT - SUBJECT: PROCESS ANALYSIS AND MASS BALANCECalc by Date Time Chk by/Date FileName:CFP,NV 02/27/2008 1:50 PM Ch07-AppA.xlsBiotran05 v.1106
Setup BasisPlant 1 Plant 2 Combined Plant 1 Plant 2 Combined Plant 1 Plant 2 Combined Plant 1 Plant 2 Combined info
Annual Average Plant Flow, mgd * 32.0 20.0 52.0 32.0 20.0 52.0 32.0 20.0 52.0 22.0 30.0 52.0Design (Max-Month) Flow, mgd 35.5 22.2 57.7 35.5 22.2 57.7 35.5 22.2 57.7 24.4 33.3 57.7
Design Capacity (Conv. IFAS)-high SRTDesign Capacity (Conv. ASP)-high SRT Design Capacity (MBR) Design Capacity (EPT)
- Avg Delivered Horsepower, hp 2,351 1,506 200 1,374 2,360 1,506 1,558 2,298- Peak Freeboard Delivered hp 3,387 2,169 275 1,979 3,400 2,169 2,245 3,311
o Wire power required- Energy Efficiency, % * 61.0 61.0 61.0 61.0 61.0 61.0 61.0 61.0 Default- Wire power required, hp
-- Daily Average 3850 2470 330 2250 3870 2470 2550 3770-- Firm Installed 5550 3560 450 3240 5570 3560 3680 5430-- Daily Average, kW 2870 1840 240 1680 2880 1840 1900 2810-- Firm Installed, kW 4140 2650 340 2420 4150 2650 2740 4040
o Scrubbing Air Blowers Required- Number of Blowers (1 standby) * 3 3 9 3 3 3 3 3- Capacity, each, scfm 63,000 40,400 1,200 36,900 63,300 40,400 41,800 61,600- Firm Capacity (duty blowers), scfm 126,000 80,800 9,600 73,800 126,600 80,800 83,600 123,200- Blower Motor Size, each, hp 2780 1780 60 1630 2790 1780 1850 2720
SLUDGE RETURN AND WASTAGEo Wasting Method (see Process Layout)
- Waste Flow from RAS, Qw 0.350 0.369 0.000 0.322 0.222 0.213 0.210 0.459- Waste Flow from MLSS, Zone 7, Qmw 0.00 0.00 0.50 0.00 0.00 0.00 0.00 0.00
o Return Sludge- Qr/Q, fraction * 0.33 0.32 4.00 0.32 0.33 0.32 0.60 0.44- RAS flow to Aer Basin, Qr, mgd Average 13.01 7.99 151.33 7.27 13.01 7.91 15.66 16.87- RAS concentration, mg/L 13,648 9,936 10,000 9,954 13,781 10,122 14,411 14,342
o Sludge Wastage- Total Solids Wasted, lb/d 41,506 31,392 41,775 27,485 27,098 18,820 26,277 56,195- Adjustment for ESS:
-- Solids in Effluent, lb/d 1,618 830 0 756 1,623 828 1,073 1,265-- Solids in WAS, lb/d 39,888 30,562 70,449 41,775 26,728 68,503 25,476 17,992 43,467 25,204 54,929 80,133
- Concentration, mg/L 13,648 9,936 10,000 9,954 13,781 10,122 14,411 14,342- Organic N, lb/d 2,648 2,102 2,755 1,837 1,703 1,199 1,623 3,621- Flow Rate, mgd Average 0.350 0.369 0.719 0.501 0.322 0.823 0.222 0.213 0.435 0.210 0.459 0.669
o WAS Characteristics, mg/L- Wasting from - RAS RAS Zone 7 RAS RAS RAS RAS RAS- BOD 3,781 3,059 2,758 2,964 3,863 2,677 3,462 4,137- TSS 13,648 9,936 10,000 9,954 13,781 10,122 14,411 14,342- VSS 11,508 8,432 8,415 8,454 11,590 8,484 12,066 12,031- NH3-N 0.3 0.4 0.2 0.3 0.5 0.9 0.2 0.4- Organic-N 906.1 683.5 659.5 684.0 921.4 674.6 927.9 945.4- NO3-N 6.7 7.4 7.4 6.6 7.5 7.7 5.4 7.2- Alkalinity 141 139 139 142 139 140 146 140- Filterable ("soluble") BOD 1.0 1.2 1.1 1.1 1.1 1.1 1.0 1.3- Total soluble Organic N 2.3 2.4 2.3 2.3 2.3 2.4 2.3 2.4
o Recommended Installed Capacity- Return Sludge Pumps, gpm 27,170 17,530 69,190 15,960 27,160 17,370 18,010 26,650- WAS Pumps
-- Wasting operation, hr/day * 24 24 24 24 24 24 24 24 24 24 24 24-- Pump Capacity (2 x Qwas), gpm 490 520 1,000 700 450 1,150 310 300 610 300 640 930-- WAS Solids Peak Handling Capacity, lb/hr 3,330 2,550 5,880 3,490 2,230 5,710 2,130 1,500 3,630 2,110 4,580 6,680
SECONDARY EFFLUENTo Flow Rate
- Net Secondary Effluent, mgd 38.80 24.89 63.69 37.33 22.67 60.00 38.92 24.82 63.74 25.74 37.93 63.68o Secondary Effluent Quality
- BOD, mg/L 2 2 2.0 1 2 1.6 2 2 2.0 2 2 2.0 Estimate
* Input Data Ch07-AppA.xls - Page 18 of 26
H:\Client\Riversid_SAOW\7472A00\Rpt\Volume 04\Ch07-AppA.pdf

== CONFIDENTIAL == NOT FOR DISTRIBUTION ===
CAROLLO ENGINEERS, PCW.O./CLIENT: 7472A.00 / CITY OF RIVERSIDEPROJECT: REGIONAL WATER QUALITY CONTROL PLANT - SUBJECT: PROCESS ANALYSIS AND MASS BALANCECalc by Date Time Chk by/Date FileName:CFP,NV 02/27/2008 1:50 PM Ch07-AppA.xlsBiotran05 v.1106
Setup BasisPlant 1 Plant 2 Combined Plant 1 Plant 2 Combined Plant 1 Plant 2 Combined Plant 1 Plant 2 Combined info
Annual Average Plant Flow, mgd * 32.0 20.0 52.0 32.0 20.0 52.0 32.0 20.0 52.0 22.0 30.0 52.0Design (Max-Month) Flow, mgd 35.5 22.2 57.7 35.5 22.2 57.7 35.5 22.2 57.7 24.4 33.3 57.7
Design Capacity (Conv. IFAS)-high SRTDesign Capacity (Conv. ASP)-high SRT Design Capacity (MBR) Design Capacity (EPT)
- TSS (nominal), mg/L * 5 4 4.4 0 4 2.4 5 4 4.4 5 4 4.4 Default- VSS, mg/L 4.2 3.4 3.7 0.0 3.4 2.1 4.2 3.4 3.7 4.2 3.4 3.7- NH3-N, mg/L 0.3 0.4 0.3 0.2 0.3 0.3 0.5 0.9 0.7 0.2 0.4 0.3- Total Organic N, mg/L 2.7 2.7 2.7 2.3 2.6 2.5 2.7 2.6 2.6 2.6 2.7 2.7- NO3/NO2-N, mg/L 6.7 7.4 7.1 7.4 6.6 6.9 7.5 7.7 7.6 5.4 7.2 6.5- Alkalinity, mg/L 141 139 140 139 142 141 139 140 139 146 140 142- Soluble Organic N, mg/L 2.3 2.4 2.4 2.3 2.3 2.3 2.3 2.4 2.4 2.3 2.4 2.4- T.I.N., mg/L 7.0 7.8 7.5 7.6 6.9 7.2 8.0 8.6 8.3 5.6 7.7 6.8- Total N, mg/L 9.7 10.5 10.2 9.9 9.4 9.6 10.6 11.2 11.0 8.2 10.4 9.5
TERTIARY FILTRATION In Service In Service Plant 2 (conv) only In Service In Serviceo Tertiary Filtration in Service? (Y=1, N=0) * 1 1 1 1o Influent
- Flow, mgd-- Total 63.7 22.7 63.7 63.7
- BOD, total, mg/L 2.0 2.0 2.0 2.0- SS, total, mg/L 4.4 4.0 4.4 4.4
o Filter Area- Surface Area per Filter, sf * 200 200 200 200- Backwash - Continuous (0) or Intermittent (1)? * 0 0 0 0- Standby Units Provided * 2 2 2 2- Number of Filters
-- Existing * 16 16 16 16-- New * 0 0 0 0-- Total 16 16 16 16
- Number of Units in Service 14 14 14 14o Filter Loading
- Equalization provided? (Y=1, N=0) * 1 1 1 1- Peaking factor * 1.10 1.10 1.10 1.10 Default- Surface Area in Service, sf 2,800 2,800 2,800 2,800- Loading rate, gpm/sf 17.4 6.2 17.4 17.4
o Removal- SS Removal, % * 70 70 70 70 Default- SS removed, lb/d 1,634 529 1,635 1,634- BOD removed, lb/d 328 119 334 317
o Backwash Flow- Percent of Flow, % * 9 9 9 9 Cont BW- Backwash Flow, mgd 5.73 2.04 5.74 5.73
o Backwash Characteristics, mg/L- BOD 8 8 8 8- TSS 34 31 34 34- VSS 29 26 29 29- NH3-N 0.3 0.3 0.7 0.3- Organic-N 5 4 5 5- NO3-N 7.1 6.6 7.6 6.5- Alkalinity 140 142 139 142
o Net Flow to Disinfection, mgd- Undisinfected Plant Water Used * 0.00 0.00 0.00 0.00- To Disinfection 57.96 20.63 58.00 57.95
o Tertiary Effluent Quality, mg/L- BOD 1.4 1.4 1.4 1.4- SS 1.3 1.2 1.3 1.3- VSS, mg/L 1.1 1.0 1.1 1.1- NH3-N, mg/L 0.3 0.3 0.7 0.3
* Input Data Ch07-AppA.xls - Page 19 of 26
H:\Client\Riversid_SAOW\7472A00\Rpt\Volume 04\Ch07-AppA.pdf
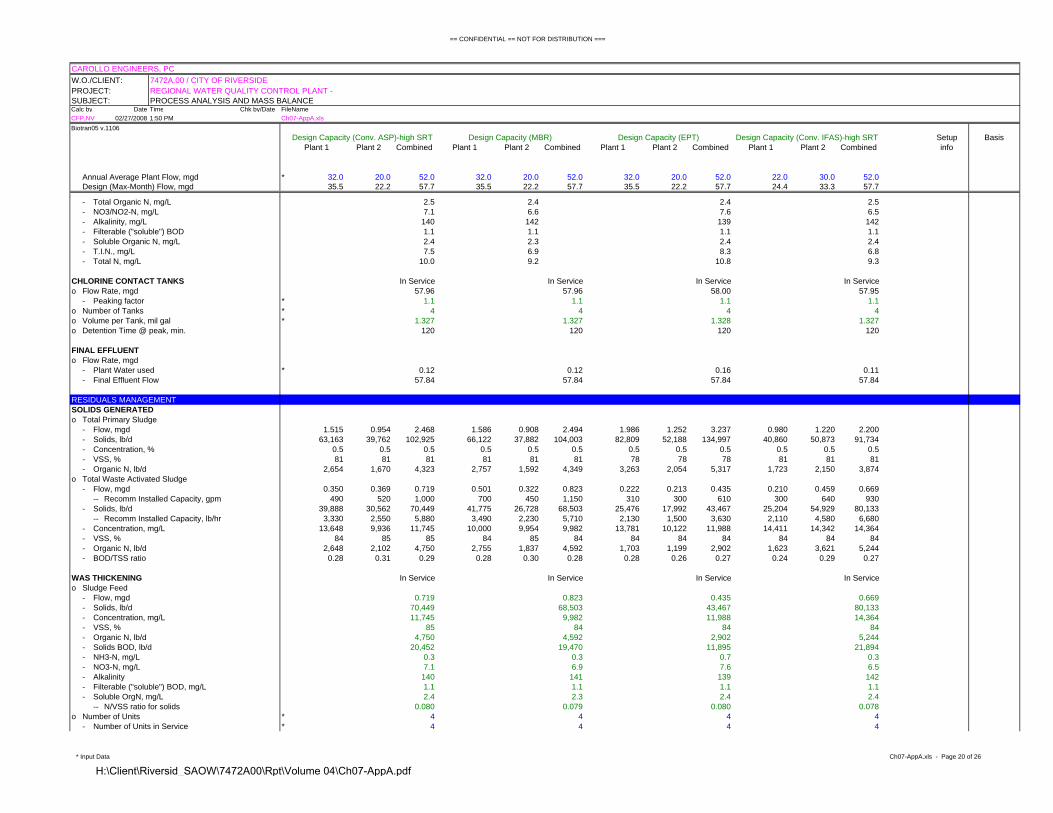
== CONFIDENTIAL == NOT FOR DISTRIBUTION ===
CAROLLO ENGINEERS, PCW.O./CLIENT: 7472A.00 / CITY OF RIVERSIDEPROJECT: REGIONAL WATER QUALITY CONTROL PLANT - SUBJECT: PROCESS ANALYSIS AND MASS BALANCECalc by Date Time Chk by/Date FileName:CFP,NV 02/27/2008 1:50 PM Ch07-AppA.xlsBiotran05 v.1106
Setup BasisPlant 1 Plant 2 Combined Plant 1 Plant 2 Combined Plant 1 Plant 2 Combined Plant 1 Plant 2 Combined info
Annual Average Plant Flow, mgd * 32.0 20.0 52.0 32.0 20.0 52.0 32.0 20.0 52.0 22.0 30.0 52.0Design (Max-Month) Flow, mgd 35.5 22.2 57.7 35.5 22.2 57.7 35.5 22.2 57.7 24.4 33.3 57.7
Design Capacity (Conv. IFAS)-high SRTDesign Capacity (Conv. ASP)-high SRT Design Capacity (MBR) Design Capacity (EPT)
- Total Organic N, mg/L 2.5 2.4 2.4 2.5- NO3/NO2-N, mg/L 7.1 6.6 7.6 6.5- Alkalinity, mg/L 140 142 139 142- Filterable ("soluble") BOD 1.1 1.1 1.1 1.1- Soluble Organic N, mg/L 2.4 2.3 2.4 2.4- T.I.N., mg/L 7.5 6.9 8.3 6.8- Total N, mg/L 10.0 9.2 10.8 9.3
CHLORINE CONTACT TANKS In Service In Service In Service In Serviceo Flow Rate, mgd 57.96 57.96 58.00 57.95
- Peaking factor * 1.1 1.1 1.1 1.1o Number of Tanks * 4 4 4 4o Volume per Tank, mil gal * 1.327 1.327 1.328 1.327o Detention Time @ peak, min. 120 120 120 120
FINAL EFFLUENTo Flow Rate, mgd
- Plant Water used * 0.12 0.12 0.16 0.11- Final Effluent Flow 57.84 57.84 57.84 57.84
RESIDUALS MANAGEMENTSOLIDS GENERATEDo Total Primary Sludge
- Flow, mgd 1.515 0.954 2.468 1.586 0.908 2.494 1.986 1.252 3.237 0.980 1.220 2.200- Solids, lb/d 63,163 39,762 102,925 66,122 37,882 104,003 82,809 52,188 134,997 40,860 50,873 91,734- Concentration, % 0.5 0.5 0.5 0.5 0.5 0.5 0.5 0.5 0.5 0.5 0.5 0.5- VSS, % 81 81 81 81 81 81 78 78 78 81 81 81- Organic N, lb/d 2,654 1,670 4,323 2,757 1,592 4,349 3,263 2,054 5,317 1,723 2,150 3,874
o Total Waste Activated Sludge- Flow, mgd 0.350 0.369 0.719 0.501 0.322 0.823 0.222 0.213 0.435 0.210 0.459 0.669
-- Recomm Installed Capacity, gpm 490 520 1,000 700 450 1,150 310 300 610 300 640 930- Solids, lb/d 39,888 30,562 70,449 41,775 26,728 68,503 25,476 17,992 43,467 25,204 54,929 80,133
-- Recomm Installed Capacity, lb/hr 3,330 2,550 5,880 3,490 2,230 5,710 2,130 1,500 3,630 2,110 4,580 6,680- Concentration, mg/L 13,648 9,936 11,745 10,000 9,954 9,982 13,781 10,122 11,988 14,411 14,342 14,364- VSS, % 84 85 85 84 85 84 84 84 84 84 84 84- Organic N, lb/d 2,648 2,102 4,750 2,755 1,837 4,592 1,703 1,199 2,902 1,623 3,621 5,244- BOD/TSS ratio 0.28 0.31 0.29 0.28 0.30 0.28 0.28 0.26 0.27 0.24 0.29 0.27
WAS THICKENING In Service In Service In Service In Serviceo Sludge Feed
- Flow, mgd 0.719 0.823 0.435 0.669- Solids, lb/d 70,449 68,503 43,467 80,133- Concentration, mg/L 11,745 9,982 11,988 14,364- VSS, % 85 84 84 84- Organic N, lb/d 4,750 4,592 2,902 5,244- Solids BOD, lb/d 20,452 19,470 11,895 21,894- NH3-N, mg/L 0.3 0.3 0.7 0.3- NO3-N, mg/L 7.1 6.9 7.6 6.5- Alkalinity 140 141 139 142- Filterable ("soluble") BOD, mg/L 1.1 1.1 1.1 1.1- Soluble OrgN, mg/L 2.4 2.3 2.4 2.4
-- N/VSS ratio for solids 0.080 0.079 0.080 0.078o Number of Units * 4 4 4 4
- Number of Units in Service * 4 4 4 4
* Input Data Ch07-AppA.xls - Page 20 of 26
H:\Client\Riversid_SAOW\7472A00\Rpt\Volume 04\Ch07-AppA.pdf

== CONFIDENTIAL == NOT FOR DISTRIBUTION ===
CAROLLO ENGINEERS, PCW.O./CLIENT: 7472A.00 / CITY OF RIVERSIDEPROJECT: REGIONAL WATER QUALITY CONTROL PLANT - SUBJECT: PROCESS ANALYSIS AND MASS BALANCECalc by Date Time Chk by/Date FileName:CFP,NV 02/27/2008 1:50 PM Ch07-AppA.xlsBiotran05 v.1106
Setup BasisPlant 1 Plant 2 Combined Plant 1 Plant 2 Combined Plant 1 Plant 2 Combined Plant 1 Plant 2 Combined info
Annual Average Plant Flow, mgd * 32.0 20.0 52.0 32.0 20.0 52.0 32.0 20.0 52.0 22.0 30.0 52.0Design (Max-Month) Flow, mgd 35.5 22.2 57.7 35.5 22.2 57.7 35.5 22.2 57.7 24.4 33.3 57.7
Design Capacity (Conv. IFAS)-high SRTDesign Capacity (Conv. ASP)-high SRT Design Capacity (MBR) Design Capacity (EPT)
- Diameter, ft * 37 37 37 37- Effective Area in Service, sf 3,959 3,959 3,959 3,959- Operating cycle, hr/week * 168 168 168 168 Default
o Hydraulic loading, gpm/sf 0.29 0.30 0.18 0.30o Solids Loading, lb/d-sf 17.8 17.3 11.0 20.2o Thickened Sludge
- Solids Capture, % * 95 95 95 95- Solids, lb/d 66,927 65,078 41,294 76,126- Percent Solids, % * 6.0 GBT 6.0 GBT 6.0 GBT 6.0 GBT- Volume, mgd 0.134 0.130 0.083 0.152- Volatile Solids, lb/d 56,588 54,960 34,681 63,820- Organic N, lb/d 4,516 4,365 2,759 4,985
o Underflow- Underflow solids, lb/d 3,522 3,425 2,173 4,007- Flow, mgd 0.585 0.693 0.352 0.517- Characteristics, mg/L
-- BOD 211 170 204 255-- TSS 721 593 740 930-- VSS 610 501 621 779-- NH3-N 0.3 0.3 0.7 0.3-- Organic-N 48 39 49 60-- NO3-N 7.1 6.9 7.6 6.5-- Alkalinity 140 141 139 142
ANAEROBIC DIGESTION In Service In Service In Service In Serviceo Digester Feed
- Flow, total, mgd 0.309 0.307 0.312 0.308- Solids, total, lb/d 154,413 153,481 156,042 154,100- Volatile Solids, total, lb/d 127,422 126,530 124,238 126,950- Organic N, total, lb/d 8,190 8,061 7,278 8,277
o - Anaerobic Digestion Type
o Acid Phased Anaerobic Digestion In-Service In-Service In-Service In-Serviceo FIRST SET OF DIGESTERS IN SERIESo Digester Size
- Smaller Size Units-- Number * 1 1 1 1-- Diameter, ft * 60 60 60 60-- SWD, ft * 28.5 28.5 28.5 28.5-- Volume per Digester, kcf 80.6 80.6 80.6 80.6-- Volume per Digester, mg 0.60 0.60 0.60 0.60
- Larger Size Units-- Number * 0 0 0 0-- Diameter, ft * 70 70 70 70-- SWD, ft * 29 29 29 29-- Volume per Digester, kcf 111.6 111.6 111.6 111.6-- Volume per Digester, mg 0.83 0.83 0.83 0.83
- Gross Volume, kcf-- All Units in Service 80.6 80.6 80.6 80.6
...Largest digester 80.6 80.6 80.6 80.6-- One Unit OOS 0.0 0.0 0.0 0.0
- Allowance for grit, percent * 5 5 5 5- Effective Volume, kcf
* Input Data Ch07-AppA.xls - Page 21 of 26
H:\Client\Riversid_SAOW\7472A00\Rpt\Volume 04\Ch07-AppA.pdf

== CONFIDENTIAL == NOT FOR DISTRIBUTION ===
CAROLLO ENGINEERS, PCW.O./CLIENT: 7472A.00 / CITY OF RIVERSIDEPROJECT: REGIONAL WATER QUALITY CONTROL PLANT - SUBJECT: PROCESS ANALYSIS AND MASS BALANCECalc by Date Time Chk by/Date FileName:CFP,NV 02/27/2008 1:50 PM Ch07-AppA.xlsBiotran05 v.1106
Setup BasisPlant 1 Plant 2 Combined Plant 1 Plant 2 Combined Plant 1 Plant 2 Combined Plant 1 Plant 2 Combined info
Annual Average Plant Flow, mgd * 32.0 20.0 52.0 32.0 20.0 52.0 32.0 20.0 52.0 22.0 30.0 52.0Design (Max-Month) Flow, mgd 35.5 22.2 57.7 35.5 22.2 57.7 35.5 22.2 57.7 24.4 33.3 57.7
Design Capacity (Conv. IFAS)-high SRTDesign Capacity (Conv. ASP)-high SRT Design Capacity (MBR) Design Capacity (EPT)
-- All Units in Service 77 77 77 77-- One Unit OOS 0 0 0 0
o Loading- VSS Loading, lb VSS/cf-d
-- All Units in Service 1.7 1.7 1.6 1.7-- One Unit OOS #DIV/0! #DIV/0! #DIV/0! #DIV/0!
- Detention Time, days-- All Units in Service 1.86 1.87 1.84 1.86-- One Unit OOS 0.0 0.0 0.0 0.0
o SECOND SET OF DIGESTERS IN SERIESo Digester Size
- Smaller Size Units-- Number * 2 2 2 2-- Diameter, ft * 90 90 90 90-- SWD, ft * 32 32 32 32-- Volume per Digester, kcf 203.6 203.6 203.6 203.6-- Volume per Digester, mg 1.52 1.52 1.52 1.52
- Larger Size Units-- Number * 1 1 1 1-- Diameter, ft * 88 88 88 88-- SWD, ft * 38 38 38 38-- Volume per Digester, kcf 231.1 231.1 231.1 231.1-- Volume per Digester, mg 1.73 1.73 1.73 1.73
- Gross Volume, kcf-- All Units in Service 638.3 638.3 638.3 638.3
...Largest digester 231.1 231.1 231.1 231.1-- One Unit OOS 407.2 407.2 407.2 407.2
- Allowance for grit, percent * 5 5 5 5- Effective Volume, kcf
-- All Units in Service 606 606 606 606-- One Unit OOS 387 387 387 387
o Loading- VSS Loading, lb VSS/cf-d
-- All Units in Service 0.21 0.2 0.2 0.2-- One Unit OOS 0.33 0.3 0.3 0.3
- Detention Time, days-- All Units in Service 14.70 14.79 14.54 14.73-- One Unit OOS 9.4 9.4 9.3 9.4
o Temperature, deg C * 35 35 35 35o THIRD SET OF DIGESTERS IN SERIESo Digester Size
- Smaller Size Units-- Number * 1 1 1 1-- Diameter, ft * 75 75 75 75-- SWD, ft * 32 32 32 32-- Volume per Digester, kcf 141.4 141.4 141.4 141.4-- Volume per Digester, mg 1.06 1.06 1.06 1.06
- Larger Size Units-- Number * 0 0 0 0-- Diameter, ft * 90 70 70 70-- SWD, ft * 29 29 29 29-- Volume per Digester, kcf 184.5 111.6 111.6 111.6-- Volume per Digester, mg 1.38 0.83 0.83 0.83
- Gross Volume, kcf
* Input Data Ch07-AppA.xls - Page 22 of 26
H:\Client\Riversid_SAOW\7472A00\Rpt\Volume 04\Ch07-AppA.pdf

== CONFIDENTIAL == NOT FOR DISTRIBUTION ===
CAROLLO ENGINEERS, PCW.O./CLIENT: 7472A.00 / CITY OF RIVERSIDEPROJECT: REGIONAL WATER QUALITY CONTROL PLANT - SUBJECT: PROCESS ANALYSIS AND MASS BALANCECalc by Date Time Chk by/Date FileName:CFP,NV 02/27/2008 1:50 PM Ch07-AppA.xlsBiotran05 v.1106
Setup BasisPlant 1 Plant 2 Combined Plant 1 Plant 2 Combined Plant 1 Plant 2 Combined Plant 1 Plant 2 Combined info
Annual Average Plant Flow, mgd * 32.0 20.0 52.0 32.0 20.0 52.0 32.0 20.0 52.0 22.0 30.0 52.0Design (Max-Month) Flow, mgd 35.5 22.2 57.7 35.5 22.2 57.7 35.5 22.2 57.7 24.4 33.3 57.7
Design Capacity (Conv. IFAS)-high SRTDesign Capacity (Conv. ASP)-high SRT Design Capacity (MBR) Design Capacity (EPT)
-- All Units in Service 141.4 141.4 141.4 141.4...Largest digester 141.4 141.4 141.4 141.4
-- One Unit OOS 0.0 0.0 0.0 0.0- Allowance for grit, percent * 5 5 5 5- Effective Volume, kcf
-- All Units in Service 134 134 134 134-- One Unit OOS 134 134 134 134
o Loading- VSS Loading, lb VSS/cf-d
-- All Units in Service 0.949 0.942 0.925 0.945-- One Unit OOS 0.949 0.942 0.925 0.945
- Detention Time, days-- All Units in Service 3.26 3.28 3.22 3.26-- One Unit OOS 3.3 3.3 3.2 3.3
o Digestion Summary- Temperature, deg C * 35 35 35 35- All units in service
-- Total Volume, mg 6.1 6.1 6.1 6.1-- Combined SRT, days 19.8 19.9 19.6 19.8
- Largest Unit out of service-- Largest Digester, mg 1.64 1.64 1.64 1.64-- Combined SRT, days 14.5 14.6 14.3 14.5
o Acid Phase Assumptions- Acid Phase Cut Off, days * 5 5 5 5- Additoinal biodegradability of WAS, % * 0 0 0 0
o VS Reduction for the First Set of Digests In Series- Acid Phase or Methane Phase? acid acid acid acid- Primary Sludge VSS, ppd 70,834 71,570 89,557 63,130
-- % Degradable * 71 71 67 71-- Inerts, ppd 20,224 20,441 29,491 18,027-- Degradable Solids, ppd 50,610 51,129 60,066 45,103-- VSS destruction % 27 27 25 27-- VS Destroyed, ppd 19,076 19,344 22,493 17,022
- WAS VSS, ppd 56,588 54,960 34,681 63,820-- Aeration Basin Aerobic SRT, days 7.2 7.9 9.2 8.2-- % Degradable 56 55 54 55-- Inerts, ppd 24,789 24,486 16,007 28,660-- Degradable Solids, ppd 31,799 30,474 18,674 35,160-- VSS destruction % 21 21 20 21-- VS Destroyed 11,986 11,530 6,993 13,269
- Total VSS destruction, % 24 24 24 24-- T * SRT (deg C*days) 65 65 64 65-- VSR check, % NA NA NA NA
- VSS destroyed, lb/d 26,989 26,544 25,050 26,395- Discharge Total Solids, lb/d 127,424 126,936 130,992 127,705- Discharge Volatile Solids, lb/d 100,433 99,986 99,188 100,555
-- TSS, % 5.0 5.0 5.0 5.0-- VSS, % 78.8 78.8 75.7 78.7
o Gas Production- cf/lb VSS destroyed * 4 4 4 4- Gas Production, kcf/d 108 106 100 106- BTU/cf * 130 130 130 130- MMBTU/hr 0.6 0.6 0.5 0.6
o VS Reduction for the Second Set of Digests In Series
* Input Data Ch07-AppA.xls - Page 23 of 26
H:\Client\Riversid_SAOW\7472A00\Rpt\Volume 04\Ch07-AppA.pdf

== CONFIDENTIAL == NOT FOR DISTRIBUTION ===
CAROLLO ENGINEERS, PCW.O./CLIENT: 7472A.00 / CITY OF RIVERSIDEPROJECT: REGIONAL WATER QUALITY CONTROL PLANT - SUBJECT: PROCESS ANALYSIS AND MASS BALANCECalc by Date Time Chk by/Date FileName:CFP,NV 02/27/2008 1:50 PM Ch07-AppA.xlsBiotran05 v.1106
Setup BasisPlant 1 Plant 2 Combined Plant 1 Plant 2 Combined Plant 1 Plant 2 Combined Plant 1 Plant 2 Combined info
Annual Average Plant Flow, mgd * 32.0 20.0 52.0 32.0 20.0 52.0 32.0 20.0 52.0 22.0 30.0 52.0Design (Max-Month) Flow, mgd 35.5 22.2 57.7 35.5 22.2 57.7 35.5 22.2 57.7 24.4 33.3 57.7
Design Capacity (Conv. IFAS)-high SRTDesign Capacity (Conv. ASP)-high SRT Design Capacity (MBR) Design Capacity (EPT)
- Acid Phase or Methane Phase? methane methane methane methane- Remaining Primary Sludge VSS, ppd 51,758 52,226 67,064 46,108
-- % Degradable 61 61 56 61-- VSS destruction % 50 50 46 50-- VS Destroyed 26,089 26,324 31,030 23,241
- Remaining WAS VSS, ppd 44,602 43,430 27,688 50,551-- % Degradable 44 44 42 43-- VSS destruction % 37 36 35 36-- VS Destroyed 16,392 15,690 9,647 18,117
- Total VSS destruction, % 42 42 41 41- VSS destroyed, lb/d 42,482 42,014 40,676 41,358- Discharge Total Solids, lb/d 84,942 84,923 90,316 86,347- Discharge Volatile Solids, lb/d 57,951 57,973 58,512 59,197
-- TSS, % 3.3 3.3 3.5 3.4-- VSS, % 68.2 68.3 64.8 68.6
o Gas Production- cf/lb VSS destroyed * 22 22 22 22- Gas Production, kcf/d 935 924 895 910- BTU/cf * 670 670 670 670- MMBTU/hr 26.1 25.8 25.0 25.4
o VS Reduction for the Third Set of Digests In Series- Acid Phase or Methane Phase? methane methane methane methane- Remaining Primary Sludge VSS, ppd 25,669 25,902 36,035 22,867
-- % Degradable 21 21 18 21-- VSS destruction % 11 11 9 11-- VS Destroyed 2,803 2,820 3,352 2,495
- Remaining WAS VSS, ppd 28210 27741 18042 32434-- % Degradable 12 12 11 12-- VSS destruction % 6 6 6 6-- VS Destroyed 175 171 194 150
- Total VSS destruction, % 5 5 6 4- VSS destroyed, lb/d 2,978 2,991 3,546 2,644- Discharge Total Solids, lb/d 81,964 81,932 86,770 83,703- Discharge Volatile Solids, lb/d 54,973 54,982 54,966 56,553
-- TSS, % 3.2 3.2 3.3 3.3-- VSS, % 67.1 67.1 63.3 67.6
o Gas Production- cf/lb VSS destroyed * 15 15 15 15- Gas Production, kcf/d 45 45 53 40- BTU/cf * 615 615 615 615- MMBTU/hr 1.1 1.1 1.4 1.0
o Digestion Summary- Total VSS destroyed, lb/day 72,449 71,548 69,272 70,397- Total VSS destruction, % 37 57 37 57 37 56 37 55- Temp * SRT 693 698 686 695- Total Gas Production, kcf/d 1087 1075 1048 1055
-- Overall rate, cf/lb VSS destroyed 15.0 15.0 15.1 15.0- Total Energy Production, mmBTU/hr 28 28 27 27
-- Overall rate, BTU/cf 614 614 616 614o Nitrogen in Dig Sludge Filtrate
- Assumed Sol OrgN in Digester effl, mg/L 5 5 5 5-- lb/d 12.9 12.79 13.00 12.84
- Org N/VSS (VSS of digester feed) in Digester Solids 0.064 0.064 0.058 0.065- VSS destroyed, lb/d 72,449 71,548 69,272 70,397
* Input Data Ch07-AppA.xls - Page 24 of 26
H:\Client\Riversid_SAOW\7472A00\Rpt\Volume 04\Ch07-AppA.pdf

== CONFIDENTIAL == NOT FOR DISTRIBUTION ===
CAROLLO ENGINEERS, PCW.O./CLIENT: 7472A.00 / CITY OF RIVERSIDEPROJECT: REGIONAL WATER QUALITY CONTROL PLANT - SUBJECT: PROCESS ANALYSIS AND MASS BALANCECalc by Date Time Chk by/Date FileName:CFP,NV 02/27/2008 1:50 PM Ch07-AppA.xlsBiotran05 v.1106
Setup BasisPlant 1 Plant 2 Combined Plant 1 Plant 2 Combined Plant 1 Plant 2 Combined Plant 1 Plant 2 Combined info
Annual Average Plant Flow, mgd * 32.0 20.0 52.0 32.0 20.0 52.0 32.0 20.0 52.0 22.0 30.0 52.0Design (Max-Month) Flow, mgd 35.5 22.2 57.7 35.5 22.2 57.7 35.5 22.2 57.7 24.4 33.3 57.7
Design Capacity (Conv. IFAS)-high SRTDesign Capacity (Conv. ASP)-high SRT Design Capacity (MBR) Design Capacity (EPT)
- Ammonia generated (organic N released), lb/d 4,650 4,551 4,051 4,583- Organic N taken up by struvite, lb/d 0 0 0 0- NH3 Concentration, mg/L 1,807 1,779 1,558 1,784- Alkalinity, mg/L 6,452 6,354 5,563 6,373
DEWATERING (Belt Presses) N.I.S. N.I.S. N.I.S. N.I.S.o Sludge Feed
- Flow rate, mgd * 0.309 0.307 0.312 0.308- Total Solids, lb/d * 81,964 81,932 86,770 83,703- Total VSS, lb/d * 54,973 54,982 54,966 56,553
o Number of Belt Presses (2m) * 0 0 0 0- Number of Units in Service * 0 0 0 0- Feed Rate, gpm per unit * 110 110 110 110 Default- Operating cycle
-- days/week * 6 6 6 6-- hours/day (calc) 0.0 0.0 0.0 0.0
o Sludge Cake- Capture, % * 90 90 90 90 Default- Concentration, % * 16.23 16.38 19.24 15.25 Default- Cake Solids, lb/d
-- Dry Solids, lb/d 81,964 81,932 86,770 83,703-- Wet Cake, tons/d N.I.S. N.I.S. N.I.S. N.I.S.
- Flow, mgd 0.309 0.307 0.312 0.308o Filtrate
- Filtrate Flow, mgd 0.000 0.000 0.000 0.000- Characteristics, mg/L
-- BOD * 700 700 700 700 Default-- TSS * 250 250 250 250 Default-- VSS 168 168 158 169-- NH3-N 1,807 1,779 1,558 1,784-- Organic-N 16 16 14 16-- NO3-N 0 0 0 0-- Alkalinity 5,414 5,394 5,196 5,303
o Wash Water- Wash water, mgd/mgd feed * 1.00 1.00 1.00 1.00 Default
-- Wash Water flow, mgd 0.000 0.000 0.000 0.000- Solids in Wash Water
-- Unrecovered Solids, lb/d 0 0 0 0-- Solids in Filtrate 0 0 0 0-- Solids in Wash Water, lb/d 0 0 0 0-- TSS in Wash Water, mg/L 0 0 0 0
- Characteristics, mg/L-- BOD 2 2 2 2-- TSS 0 0 0 0-- VSS 0 0 0 0-- NH3-N 0.0 0.0 0.2 0.0-- Organic-N 2 2 2 2-- NO3-N 7.1 6.9 7.6 6.5-- Alkalinity 140 141 139 142-- Filterable ("soluble") BOD 1.1 1.1 1.1 1.1-- Total soluble Organic N 2.4 2.3 2.4 2.4
o Combined Filtrate & Wash Water- Flow, mgd
-- Filtrate 0.000 0.000 0.000 0.000
* Input Data Ch07-AppA.xls - Page 25 of 26
H:\Client\Riversid_SAOW\7472A00\Rpt\Volume 04\Ch07-AppA.pdf

== CONFIDENTIAL == NOT FOR DISTRIBUTION ===
CAROLLO ENGINEERS, PCW.O./CLIENT: 7472A.00 / CITY OF RIVERSIDEPROJECT: REGIONAL WATER QUALITY CONTROL PLANT - SUBJECT: PROCESS ANALYSIS AND MASS BALANCECalc by Date Time Chk by/Date FileName:CFP,NV 02/27/2008 1:50 PM Ch07-AppA.xlsBiotran05 v.1106
Setup BasisPlant 1 Plant 2 Combined Plant 1 Plant 2 Combined Plant 1 Plant 2 Combined Plant 1 Plant 2 Combined info
Annual Average Plant Flow, mgd * 32.0 20.0 52.0 32.0 20.0 52.0 32.0 20.0 52.0 22.0 30.0 52.0Design (Max-Month) Flow, mgd 35.5 22.2 57.7 35.5 22.2 57.7 35.5 22.2 57.7 24.4 33.3 57.7
Design Capacity (Conv. IFAS)-high SRTDesign Capacity (Conv. ASP)-high SRT Design Capacity (MBR) Design Capacity (EPT)
-- Wash Water 0.000 0.000 0.000 0.000-- Total 0.000 0.000 0.000 0.000
- Characteristics, mg/L-- BOD 0 0 0 0-- TSS 0 0 0 0-- VSS 0 0 0 0-- NH3-N 0 0 0 0-- Organic-N 0 0 0 0-- NO3-N 0 0 0 0-- Alkalinity 0 0 0 0-- Filterable ("soluble") BOD 0 0 0 0-- Total soluble Organic N 0.0 0.0 0.0 0.0
CENTRIFUGE DEWATERING/THICKENING In Service In Service In Service In Service
o ApplicationAnaerobic Dig Dewat
Anaerobic Dig Dewat
Anaerobic Dig Dewat
Anaerobic Dig Dewat
o Sludge Feed- Flow Rate, mgd 0.309 0.307 0.312 0.308- TSS, % 3.18 3.20 3.34 3.26- Solids, lb/d 81,964 81,932 86,770 83,703
-- VSS fraction 0.67 0.67 0.63 0.68o Number of Centrifuges * 3 3 3 3
- Number of Units in Service 2 2 2 2- Feed Rate, gpm per unit * 250 250 250 250- Operating cycle
-- days/week * 6 6 6 6-- hours/day (calc) 12.0 11.9 12.1 12.0
o Chemical Dose- Ferric chloride, lb/ton * 0 0 0 0- Ferric chloride, lb/day 0 0 0 0- Polymer, lb/ton * 16 16 16 16- Polymer, lb/day 635 635 672 649- Chemical Sludge generated, lb/d 0 0 0 0
o Sludge Cake- Capture, % * 95 95 95 95 Default- Cake Solids, lb/d 77,866 77,836 82,432 79,518- Concentration, % * 24.9 25.0 27.5 23.6 Default- Flow, mgd 0.0374 0.0373 0.0360 0.0405
o Filtrate- Filtrate Flow, mgd 0.271 0.269 0.276 0.268- Characteristics, mg/L
-- BOD * 500 500 500 500 230 Default-- TSS 1,812 1,823 1,886 1,876 250-- VSS 1,215 1,224 1,195 1,267 208-- NH3-N * 1,807 1,779 1,558 1,784 23-- Organic-N * 83 83 75 88 14-- NO3-N * 0 0 0 0 0-- Alkalinity * 6,452 6,354 5,563 6,373 250-- Fpv, VSS fraction 0.67 0.67 0.63 0.68 0.83-- Fvu, Fraction VSS that is Unbiodeg 0.70 0.70 0.70 0.70 0.350-- D.O. Concentration, mg/L 0 0 0 0 1.0
* Input Data Ch07-AppA.xls - Page 26 of 26
H:\Client\Riversid_SAOW\7472A00\Rpt\Volume 04\Ch07-AppA.pdf
Related Documents