1

Welcome message from author
This document is posted to help you gain knowledge. Please leave a comment to let me know what you think about it! Share it to your friends and learn new things together.
Transcript

1
2

3
CONTENTS
Foreword
5
Executive Summary
6
Background
Purpose
The Global Context
What is waste prevention?
How is waste prevention encouraged?
From linear to circular
The time for action
Where to start?
Beyond the waste management sector
Principles for waste prevention
8
8
8
10
11
11
12
14
15
16
A lifecycle approach to waste prevention – Policy options
Managing Demand
Design
Resource Production/ Extraction
Manufacture
Retail and Packaging/Distribution
Use
End of Life
17
17
18
20
22
23
24
25
Priority measures for waste prevention – Summary
26
Implementing waste prevention
Leadership and policy integration
A review of incentive structures
Extended producer responsibility
Stimulating the market
27
27
28
29
30
Making waste prevention a reality
32
Annex
33

4
5
FOREWORD
The economic crisis of 2007 was a car crash in slow-motion; frustrating because nobody warned us and
the banks danced to the speculative tune. Now economists can calculate a much more dangerous
event that is being greeted with even less concern: our world is rapidly reaching a crisis in resource
availability – of water, energy, metals, phosphorous and food.
The Industrial Revolution allowed us to make technological progress in delivering resources. The
average price of thirty-three commodities (equally weighted) declined by 70 per cent (after inflation)
between 1900 and 2002. Then, abruptly and without any particular crisis, prices reversed and in ten
years the average commodity tripled to give back the advantage of the previous 100 years. It is
perhaps the most important “phase” change of modern times, yet it attracted, remarkably, little
attention or concern.
The causes are not hidden: there has been an explosion in population and consumption since 1800
and the birth of the ‘Hydrocarbon Age’. Global population increased from one billion to the seven
billion of today, tripling even in my lifetime. At the same time, consumption of hydrocarbons and some
metals increased one hundredfold.
Low-cost, high-grade coal, oil and natural gas – the backbone of the Industrial Revolution – will be a
distant memory by 2050. Much higher-cost remnants will still be available but they will not be able to
drive our growth, our population and, most critically, our food supply as before. Conventional food
production is desperately dependant on oil for insecticide, pesticide and fertiliser, and for
transportation over thousands of miles. Over the millennia, we have lost about one-third of our land,
turning it into desert and stone. We build new cities on our best river valley soil, which is replaceable
only with more marginal land and we build homes and grow food in deserts, pumping irreplaceable
underground water. We have no New Worlds or new Midwests to turn to.
But which politician has the nerve to talk about the necessary zero growth in population and physical
output? How do you persuade world leaders that 21st century problems cannot be fixed with 20th
century economics? We could solve all our problems if only we were the efficient, rational human
beings of standard economic theory and had politicians willing to think in the long-term interest of their
people rather than their own.
It will require brave political decisions to keep our own resource prices down. We need to stop
measuring success by the balance sheet and get a proper fix on our place in a world that is running on
empty.
Nick Reeves OBE
Executive Director
6
“UK businesses could save
more than £20bn per year by
simple steps to use resources
more efficiently”
– Defra
“Strong, quantifiable targets must be
accompanied by consistent
messaging across all parts of
government that tells the world that
the UK is open for green business”
– CBI
“The markets for critical resources
have always been political”
– Chatham House
“Moving towards a circular
economy could generate an
additional £600 million in social
value by 2020 in the UK”
– Sita
EXECUTIVE SUMMARY
We live on a finite planet and continuing with wasteful patterns of resource use is not an option. Even
the most conservative projections for global economic growth over the next decade suggest that
demand for oil, coal, iron ore and other natural resources will rise by at least a third. With a rising global
middle class, it will be necessary to separate the consumption
of goods and services from the consumption of energy and
material resources. A systematic and determined approach
to resource efficiency is required, supported by a society in
which management priorities are driven by where the
greatest resource value can be achieved as part of a
circular economy.
The UK economy is some way from a ‘closed loop’
economy. Around a quarter of our minerals and metals and
half of our biomass is imported. A significant amount of
waste is still sent to landfill, or sent abroad for treatment
rather than recovered for re-use in the UK. A greater focus
on resource efficiency and waste prevention in the
commercial and industrial waste sectors and the
anticipation of market-based, scarcity-driven price rises
would improve our competitiveness and play a greater part
in assisting our economic recovery, as well as making the
economy more resilient.
CIWEM considers waste prevention is not an end of life resource
issue and therefore needs action beyond the waste management
sector. Waste prevention involves measures taken before a
substance, material or product becomes a waste. As only 30
percent of our waste comes from consumers and 70 percent of
materials and energy is wasted during extraction and production1,
CIWEM believes the government should use the opportunity of the
waste prevention programme to look widely at resource issues. We
consider a whole life-cycle approach is required with a broader
look at buildings, processes and the wider issues of consumption.
This report takes a lifecycle approach to waste prevention.
We look at the stages of demand management, design,
resource extraction, manufacture, retail and distribution, use,
re-use and end of life and consider how to achieve the
principles of preserving natural capital, reducing externalities
and increasing efficiency for each. The various policy options
that are available to the government and included in the
England Waste Prevention Programme are described at
each stage of the lifecycle. A variety of voluntary, fiscal and
regulatory incentives are identified. We then summarise
which measures would provide ‘quick wins’ and ‘big wins’.
1 Ellen Macarthur foundation. 2012. Towards the circular economy volume 1

7
This report proposes that to progress waste prevention we need:
To understand that the economy is based on the environment and the materials it provides. The
government’s waste prevention programme for England needs to acknowledge that the efficient
and environmentally responsible use of materials should be independent of whether they are raw
materials, products or waste2. It needs to be more pragmatic, holistic and imaginative.
Leadership and policy integration
CIWEM believes that to make the UK’s economy and society one of the most resource efficient in
the world we need high profile cross-government action. Defra has been leading on waste
prevention policy but largely in isolation. Integration is essential if we are to achieve the estimated
£20bn per year that UK businesses could save by taking simple steps to use resources more
efficiently, from actions from the departments of DECC, DCLG, BIS and the Treasury. A commission-
type structure or Office for Resource Management should be set up to monitor the impact of
polices on resource use.
A review of incentive structures to drive sustainable behaviour
Fundamentally, our economy does not encourage sustainable behaviour, if anything it does the
reverse. By not properly accounting for environmental externalities, it is hard to prevent the over-
consumption and the depletion of scarce resources. CIWEM suggests using supplementary
indicators to measure success other than Gross Domestic Product, changing the activities that VAT is
charged upon and pricing externalities into decision making to reduce some of the drivers for mass
consumption.
Extended producer responsibility to drive more measures up the hierarchy
Currently businesses have the full authority to supply products with no environmental responsibility for
their impact. Responsibility has to lie with the inbound supply chain to internalise end of life
externalities as part of their design, materials, logistics and marketing or progress will not be made.
Most producer responsibility legislation has been aimed at designing for recycling and we need to
ensure that they are used to drive material efficiency. Public funding from the EU budget needs to
be prioritised to activities higher up the waste hierarchy.
To stimulate the market to cut out the least efficient products and develop new, more sustainable
ones
Both businesses and the Government have a role to make the sustainable option the default choice
for consumers. The Government can use various incentive structures such as minimum standards,
dynamic standards, voluntary labels, procurement standards and enhanced producer responsibility.
CIWEM advocates that we may also need standards for aspects of the designs of a product,
materials used within them and efficiency ratings. The greatest barrier to reuse is component
incompatibility so to ensure that products, components and systems retain materials within the
economy over several cycles of use, requires a standardised approach for each component.
CIWEM therefore calls on the Government to take action and provide a clear, consistent framework to
foster the change to a resource-efficient, circular economy.
The waste prevention strategy should not be overlooked. It is a clear opportunity to set us on a course
to a resource efficient, circular economy that will not only preserve the natural environment and our
supply of resources, but enable us to build a resilient and dynamic economy with strong international
competitiveness. Leading companies are showing that it can be done. We now need to translate this
ambition throughout the public sector to SMEs and to the wider public with a far more strategic
approach, led by the Government. If England is to compete on the global stage it must be brave,
ambitious and innovative enough to do things differently.
2 Imperial College. 2012. Waste and resource management paper 3 Ellen Macarthur foundation. 2012. Towards the circular economy volume 1

8
BACKGROUND
Purpose
The stated objective of the UK governments is to move towards a ‘zero waste’ economy. Whilst the
sentiment is welcome, CIWEM believes the concept of ‘zero waste’ to be unrealistic as it is difficult to
define and could be counterproductive by either setting apparently unattainable goals or focussing
effort at the wrong end of the supply chain. Instead, a systematic and determined approach to
resource efficiency is required, supported by a society in which management priorities are driven by
where the greatest resource value can be achieved as part of a circular economy.
The revised EU Waste Framework Directive requires all Member States to produce waste prevention
programmes by the end of 2013. We also have to achieve EU targets to recycle, compost or reuse 50%
of domestic waste and 70% of construction waste by 2020. As Scotland and Wales have already
published their waste prevention strategies, this report aims to assist in the production of England’s
waste prevention programme and also raise greater awareness that it is not solely an issue for the
waste management industry.
Waste prevention is key to the circular economy as it designs out waste. By looking at materials at the
beginning of the production process, there is the potential to prevent waste by influencing the design,
production and use stages which provides opportunities for business efficiency through the better use
of processes and resources. This report shows the potential for waste prevention across material
lifecycles, from extraction to disposal, in a bid to show that it is not a measure for the end-of-product-
life.
By tackling waste prevention we can take a holistic approach to:
o resource efficiency – material, labour and energy savings
o resource security – protection against price volatility and imbalances in supply, protection
against economic, social and geopolitical risk
o reducing environmental externalities – greenhouse gas emissions, water use, land use, energy
use, embodied carbon, toxicity and amenity from less need for virgin materials o improved national competitiveness – exporting knowledge on design and processes,
anticipating scarcity driven price rises
The Global Context
For years, technological, economic and social innovation has enabled us to minimise our labour input
into our industrial processes; yet this has usually required the use of more energy and more materials. To
reduce our reliance on fossil fuels, it is clear that we urgently need to decarbonise the energy system
and reduce our energy use; but we also need to look at our material inputs and manage materials
more effectively within the economy.
All the materials, metals, minerals, concrete and wood, all the fossil fuels we burn and all the land we
require to grow food and develop our economies put pressure on the environment and threaten the
security of supply. In 2010, 65 billion tonnes of raw materials entered the global economic system and
by 2020 this is expected to grow to about 82 billion tonnes3. Even the most conservative projections for
global economic growth over the next decade suggest that demand for oil, coal, iron ore and other
natural resources will rise by at least a third4. We live on a finite planet and continuing with wasteful
patterns of resource use is not an option.
If current trends continue, by 2050, the global population is expected to have grown by 30 percent to
around nine billion and people in developing and emerging economies will legitimately aspire to the
consumption levels of developed countries5. It is expected that in the next two decades, up to three
billion people will be added to the global middle class6 and its associated levels of affluence and
consumption of heating, lighting, cooling, hygiene and food.
3 Ellen Macarthur foundation. 2012. Towards the circular economy volume 1 4 McKinsey Global Institute. 2011. Resource revolution: Meeting the world’s energy, materials, food, and water needs 5 European Commission. 2011. Roadmap to a Resource Efficient Europe 6 McKinsey Quarterly. 2012. Mobilizing for a resource revolution

9
The increasing global demand for goods is leading to strains on supplies of some raw materials,
contributing to sustained high resource prices and enhancing geopolitical risk. Commodity prices are
currently at their most volatile since the oil shock of the 1970s7 (figure 1).
Figure 1. McKinsey Global Institute Commodity Price Index (years 1999-2001 = 100), 2011 8
In all years since 1990, the UK has imported more than it has exported. Our imports currently include a
quarter of our minerals and half of our biomass9. Technological developments such as electric car
batteries (lithium), solar energy (indium) and defence technologies are often tied to imported raw
materials and we are also facing risks to our supply of the basics for life: land, energy and water. Our
high rate of imports leaves us exposed to currency devaluation as our economy weakens and the
resource-rich nations take over in their industrial capacity.
Eventually domestic markets will force us to prevent waste, as resources become scarce and prices
drive choices. Nonetheless we are already beginning to see the limits of a linear economy. In some
industries, efficiency gains have already been achieved and no longer create a competitive
advantage. Agricultural productivity too is growing at a slower rate than ever. By strategically planning,
taking trade into account, critical resources can be recovered and reused within our economy,
reducing the need for virgin materials and increasing our resilience to price and supply volatility (figure
2).
Figure 2. The Circular Economy,
Ellen MacArthur Foundation, 2011
7 McKinsey. 2011. A new era for commodities 8 Methodology in: McKinsey. 2011. Resource Revolution 9 Church, C. 2012. Zero waste possibility or pipe dream. Defra presentation to CIWM conference

10
There are clear opportunities too; Defra estimates that UK businesses could save more than £20bn per
year by simple steps to use resources more efficiently10 and Sita have found that moving towards a
circular economy could generate an additional £600 million in social value (from community wellbeing
and cohesion) by 2020 in the UK11. The waste sector is in a unique position to become a major saver of
greenhouse gas emissions, so waste policy also needs to be integrated with our commitment to reduce
these by 80 percent by 2050 and to achieve 20 percent of our energy from renewables by 2020.
We live in an interconnected world with resources, energy and the movements of goods and in many
cases pollutants all being globally connected. Hazardous waste, pollutants and greenhouse gases all
harm the environment and its ability to restore itself. Yet waste and other environmental externalities are
often not reflected in prices and markets and often public policies cannot fully deal with competing
demands on strategic resources (such as minerals, land and water)12.
In the UK, responsibility for waste is devolved to the governments, but European Legislation (such as the
revised Waste Framework Directive, Landfill Directive, a range of "producer responsibility" directives on
specific waste streams and end of life vehicles) dominates the direction of waste and resource
management. Europe has become more efficient in managing material resources; but in absolute
terms the consumption of materials continues to rise and the overall trend in waste generation is
upwards13.
Waste prevention is not a new idea and has been at the top of the waste hierarchy as the most
environmentally sensitive option since its conception. However, we have seen little progress and have
tended to reward recycling, making it hard to think beyond it. Of the waste generated in Europe in
2010, only about 40 percent of that was reused, recycled, or composted and digested. This means that
around 60 percent is lost from the system.
As only 30 percent of our waste comes from consumers and the other 70 percent of wasted materials is
produced in the extraction and production phase14, CIWEM believes the Government should use the
opportunity of the waste prevention programme to look widely at resource issues. We consider a whole
life-cycle approach is required that takes into account energy and resource utilisation, in the
manufacture of goods and products, to prevent waste by better design, improved efficiency in
production and the introduction of a low waste culture.
CIWEM calls on the Government to take action and provide a clear, more central and consistent
framework to foster the change to a resource-efficient, circular economy that will not only preserve the
natural environment and our supply of resources, but enable us to build a resilient and dynamic
economy with strong international competitiveness.
What is waste prevention?
Waste prevention has been an objective of the EU Waste Framework Directive ever since it was agreed
in 1975 (see Annex 1 for further information). However, as it has been difficult to measure progress,
terminology surrounding it can be unclear and potentially misleading. We need to understand and
promote common, consistent use of the applicable terms to ensure the goals we seek are not clouded
by definitions that lack clarity, are ambiguous or potentially misleading. CIWEM considers that...
Waste prevention involves measures taken before a substance, material or product becomes a waste15.
It therefore includes reuse but not recycling or home composting.
It also includes reducing the hazardousness of waste.
10 Defra. 2012. Resource security action plan 11 SITA. 2012. Creating Social Value 12 European Commission. 2011. Roadmap to a Resource Efficient Europe 13 European Environment Agency. 2012. The European Environment State and Outlook, Natural resources & Waste 14 Ellen Macarthur foundation. 2012. Towards the circular economy volume 1 15 European Commission. 2008. Waste Framework Directive

11
How is waste prevention encouraged?
The waste hierarchy is the cornerstone of waste management. The Waste Framework Directive requires
that the hierarchy applies as the priority order in waste prevention and management legislation and
policy. It aims to extract the maximum practical benefits from products and to generate the minimum
amount of waste. The policy instruments that have been put in place to stimulate the waste hierarchy
in England are shown in figure 3. To date the majority have been focussed at the base.
Stages Includes
Landfill tax has been a major driver and has helped halve the amount of UK waste going to landfill
since 2000, but the current proportion of UK municipal waste going to landfill is still 49 percent,
compared to an EU-27 average of 37 percent. There are a number of incentive mechanisms to drive
recovery, but this is largely that of energy rather than materials. Defra claim that landfill tax indirectly
drives waste prevention16. It may, but it does not drive measures up the hierarchy. There is a lack of real
regulations or incentives tasked with driving waste minimisation and prevention at the top of the
hierarchy and it is largely left to voluntary agreements. This may explain why action has stalled in the
middle and recycling has become a focus of many waste minimisation and prevention strategies.
From linear to circular
Yet is the waste hierarchy still fit for purpose as ultimately it envisages a linear rather than circular
economy? The challenge is how to use the hierarchy to arrive at a meaningful circular economy that
balances demand, with resource and energy use to optimise the pattern of consumption.
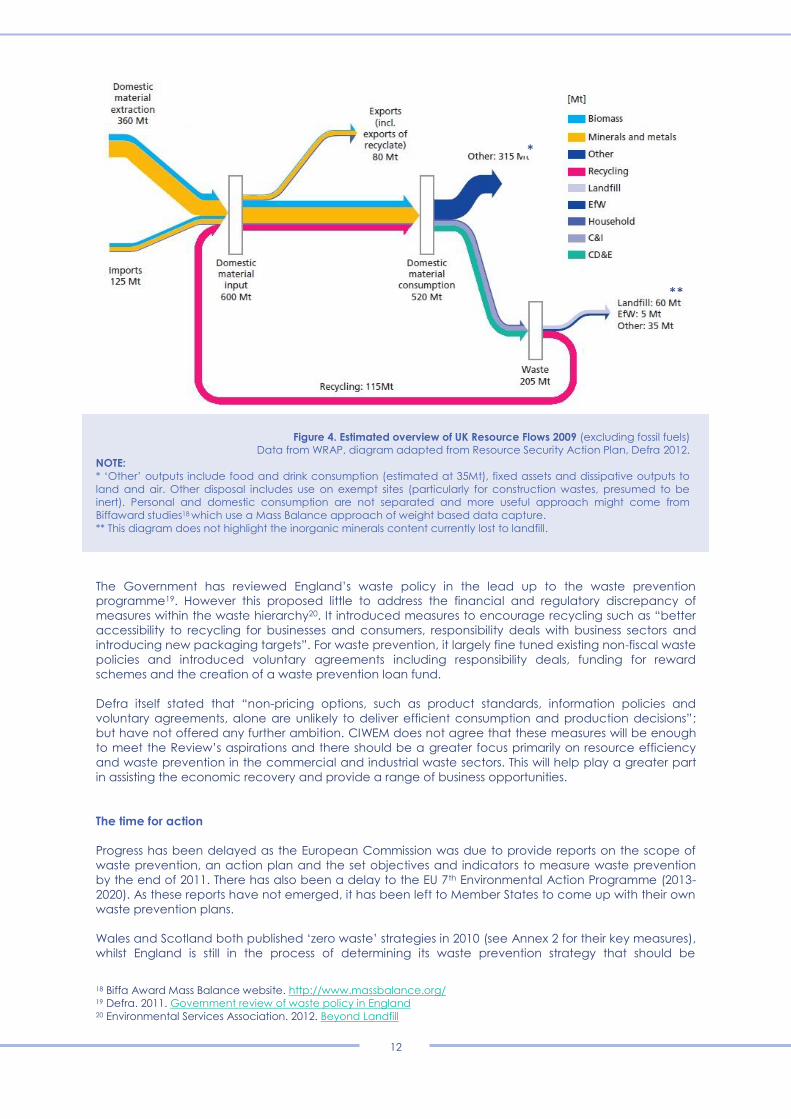
Figure 4 shows that the UK economy is some way from a ‘closed loop’ economy. Around a quarter of
our minerals and metals and half of our biomass is imported; the proportion of virgin materials entering
the UK economy is not sustainable over time. A significant amount of waste is still sent to landfill, or sent
abroad for treatment rather than recovered for re-use in the UK17.
16 Defra. 2011. The Economics of waste and waste policy 17 Defra. 2011. Resource Security Action Plan
Using material efficiently in design &
manufacture. Keeping products for longer;
re-use. Using less hazardous material
Checking, cleaning, repairing, refurbishing,
repair, whole items of spare parts
Turning waste into a new substance or
product. Includes composting if it meets
quality protocols
Anaerobic digestion, incineration with
energy recovery, gasification and pyrolysis
which produce energy (fuels, heat and
power) and materials from waste; some
backfilling operations
Landfill and incineration without energy
recovery
Responsibility deals with
business
Waste prevention loan fund
Export provisions under
WEEE
Packaging waste recovery
notes
MRF code of practice
Renewable Obligation
Certificates,
Feed in Tariffs, Renewable
Heat Incentive
PFI funds
Landfill tax, Landfill bans
Policy instruments (England)
Most sustainable
Least
sustainable
Figure 3. The Waste Hierarchy
Adapted from Defra Waste Review, 2011
Prevention
Preparing for re-use
Recycling
Other recovery
Disposal
12
Figure 4. Estimated overview of UK Resource Flows 2009 (excluding fossil fuels)
Data from WRAP, diagram adapted from Resource Security Action Plan, Defra 2012.
NOTE:
* ‘Other’ outputs include food and drink consumption (estimated at 35Mt), fixed assets and dissipative outputs to
land and air. Other disposal includes use on exempt sites (particularly for construction wastes, presumed to be
inert). Personal and domestic consumption are not separated and more useful approach might come from
Biffaward studies18 which use a Mass Balance approach of weight based data capture. ** This diagram does not highlight the inorganic minerals content currently lost to landfill.
The Government has reviewed England’s waste policy in the lead up to the waste prevention
programme19. However this proposed little to address the financial and regulatory discrepancy of
measures within the waste hierarchy20. It introduced measures to encourage recycling such as “better
accessibility to recycling for businesses and consumers, responsibility deals with business sectors and
introducing new packaging targets”. For waste prevention, it largely fine tuned existing non-fiscal waste
policies and introduced voluntary agreements including responsibility deals, funding for reward
schemes and the creation of a waste prevention loan fund.
Defra itself stated that “non-pricing options, such as product standards, information policies and
voluntary agreements, alone are unlikely to deliver efficient consumption and production decisions”;
but have not offered any further ambition. CIWEM does not agree that these measures will be enough
to meet the Review’s aspirations and there should be a greater focus primarily on resource efficiency
and waste prevention in the commercial and industrial waste sectors. This will help play a greater part
in assisting the economic recovery and provide a range of business opportunities.
The time for action
Progress has been delayed as the European Commission was due to provide reports on the scope of
waste prevention, an action plan and the set objectives and indicators to measure waste prevention
by the end of 2011. There has also been a delay to the EU 7th Environmental Action Programme (2013-
2020). As these reports have not emerged, it has been left to Member States to come up with their own
waste prevention plans.
Wales and Scotland both published ‘zero waste’ strategies in 2010 (see Annex 2 for their key measures),
whilst England is still in the process of determining its waste prevention strategy that should be
18 Biffa Award Mass Balance website. http://www.massbalance.org/ 19 Defra. 2011. Government review of waste policy in England 20 Environmental Services Association. 2012. Beyond Landfill
*
**
13
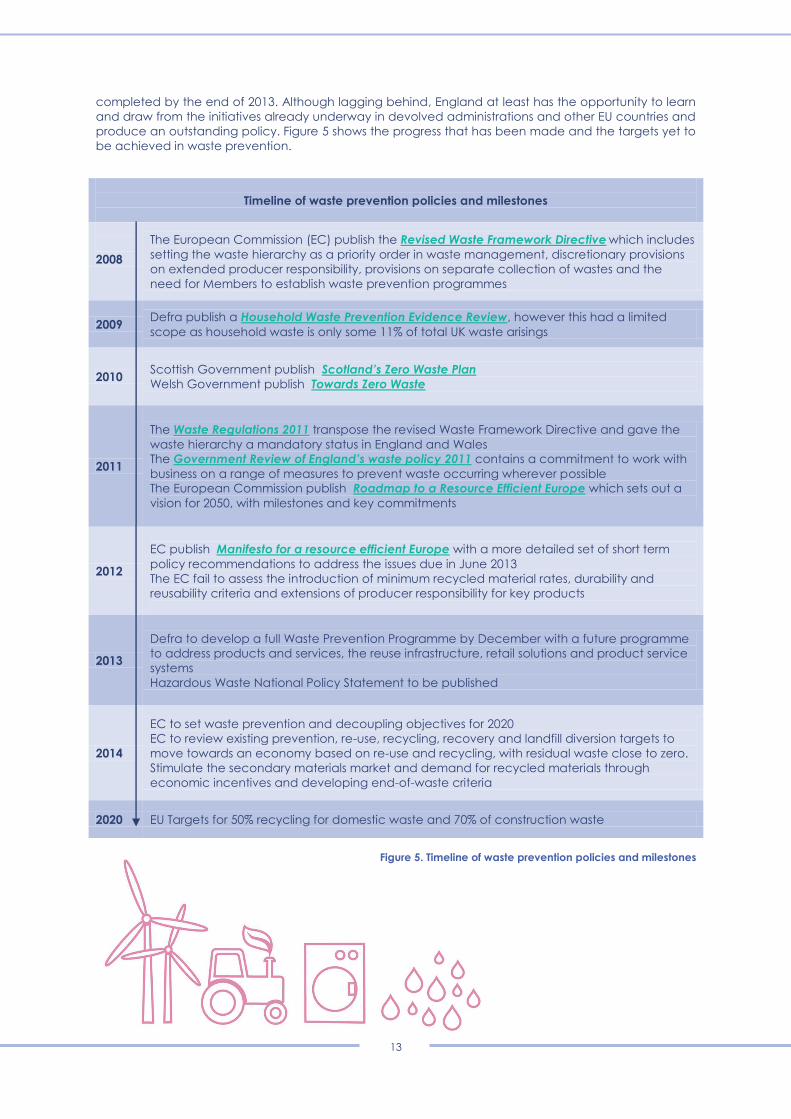
completed by the end of 2013. Although lagging behind, England at least has the opportunity to learn
and draw from the initiatives already underway in devolved administrations and other EU countries and
produce an outstanding policy. Figure 5 shows the progress that has been made and the targets yet to
be achieved in waste prevention.
Figure 5. Timeline of waste prevention policies and milestones
Timeline of waste prevention policies and milestones
2008
The European Commission (EC) publish the Revised Waste Framework Directive which includes
setting the waste hierarchy as a priority order in waste management, discretionary provisions
on extended producer responsibility, provisions on separate collection of wastes and the
need for Members to establish waste prevention programmes
2009 Defra publish a Household Waste Prevention Evidence Review, however this had a limited
scope as household waste is only some 11% of total UK waste arisings
2010 Scottish Government publish Scotland’s Zero Waste Plan
Welsh Government publish Towards Zero Waste
2011
The Waste Regulations 2011 transpose the revised Waste Framework Directive and gave the
waste hierarchy a mandatory status in England and Wales
The Government Review of England’s waste policy 2011 contains a commitment to work with
business on a range of measures to prevent waste occurring wherever possible
The European Commission publish Roadmap to a Resource Efficient Europe which sets out a
vision for 2050, with milestones and key commitments
2012
EC publish Manifesto for a resource efficient Europe with a more detailed set of short term
policy recommendations to address the issues due in June 2013
The EC fail to assess the introduction of minimum recycled material rates, durability and
reusability criteria and extensions of producer responsibility for key products
2013
Defra to develop a full Waste Prevention Programme by December with a future programme
to address products and services, the reuse infrastructure, retail solutions and product service
systems
Hazardous Waste National Policy Statement to be published
2014
EC to set waste prevention and decoupling objectives for 2020
EC to review existing prevention, re-use, recycling, recovery and landfill diversion targets to
move towards an economy based on re-use and recycling, with residual waste close to zero.
Stimulate the secondary materials market and demand for recycled materials through
economic incentives and developing end-of-waste criteria
2020 EU Targets for 50% recycling for domestic waste and 70% of construction waste
14
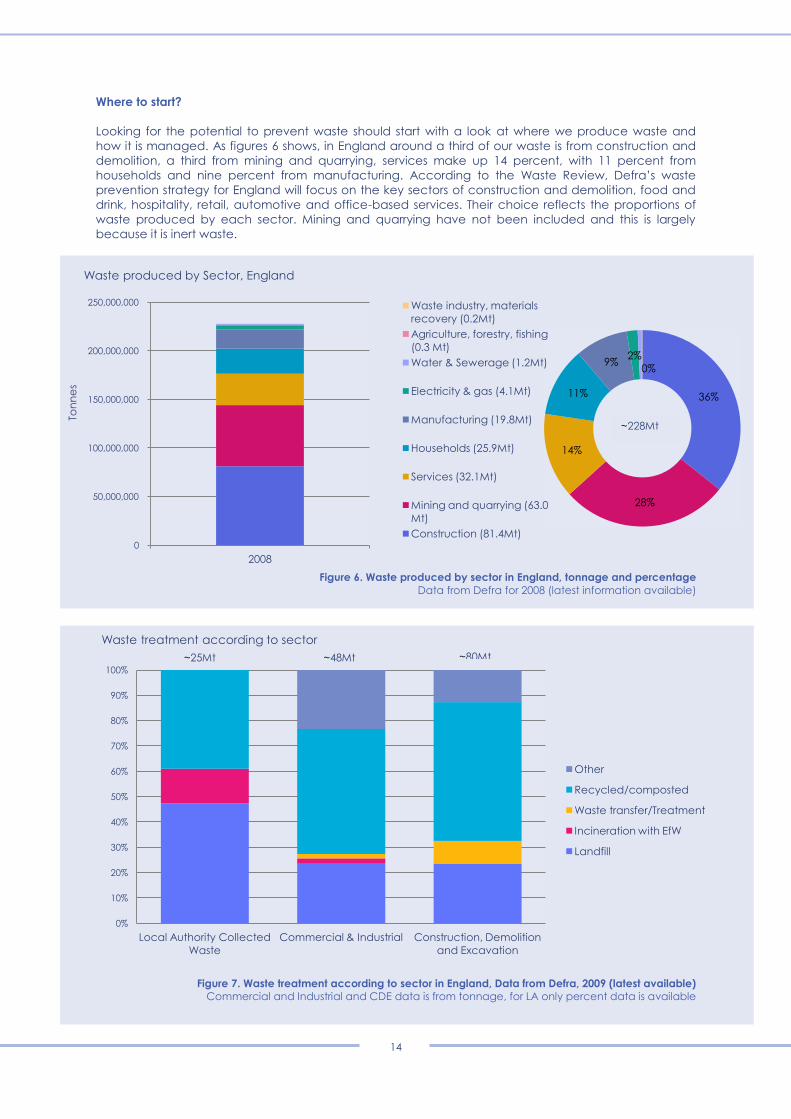
Where to start?
Looking for the potential to prevent waste should start with a look at where we produce waste and
how it is managed. As figures 6 shows, in England around a third of our waste is from construction and
demolition, a third from mining and quarrying, services make up 14 percent, with 11 percent from
households and nine percent from manufacturing. According to the Waste Review, Defra’s waste
prevention strategy for England will focus on the key sectors of construction and demolition, food and
drink, hospitality, retail, automotive and office-based services. Their choice reflects the proportions of
waste produced by each sector. Mining and quarrying have not been included and this is largely
because it is inert waste.
Figure 6. Waste produced by sector in England, tonnage and percentage
Data from Defra for 2008 (latest information available)
Figure 7. Waste treatment according to sector in England, Data from Defra, 2009 (latest available)
Commercial and Industrial and CDE data is from tonnage, for LA only percent data is available
0%
10%
20%
30%
40%
50%
60%
70%
80%
90%
100%
Local Authority Collected
Waste
Commercial & Industrial Construction, Demolition
and Excavation
Waste treatment according to sector
Other
Recycled/composted
Waste transfer/Treatment
Incineration with EfW
Landfill
36%
28%
14%
11%
9% 2%
0%
0
50,000,000
100,000,000
150,000,000
200,000,000
250,000,000
2008
Ton
ne
s
Waste produced by Sector, England
Waste industry, materials
recovery (0.2Mt)
Agriculture, forestry, fishing
(0.3 Mt)
Water & Sewerage (1.2Mt)
Electricity & gas (4.1Mt)
Manufacturing (19.8Mt)
Households (25.9Mt)
Services (32.1Mt)
Mining and quarrying (63.0
Mt)
Construction (81.4Mt)
~80Mt ~48Mt
~228Mt
~25Mt
15
Waste is collected, treated and recorded separately according to sector (figure 7). Measures to
prevent waste may be quite different for both the sectors that produce waste and those that collect
and treat it.
o Construction, demolition and excavation waste is largely separated on site, giving rise to more
potential for recycling and reuse.
o Municipal solid waste collected by local authorities poses greater problems as it includes the co-
disposal of assorted waste types21.
o Although smaller in volume there is a far higher proportion of household waste going to landfill
rather than that produced by commercial, industrial or construction sites so there is a greater scope
for prevention here.
o Commercial waste is likely to be similar to that from households but a major issue arises with small
and medium sized enterprises (SMEs) and their lack of understanding or resources to deal with waste
policy.
o Industrial waste may be more operational and/or include hazardous waste so there may be
opportunities for substitution of materials and increased materials efficiency.
In compiling these data it was found that different units, time periods and methods were used by
different bodies. There is a particular lack of good quality data in the commercial and industrial waste
sectors22. If effective measures are to be put in place we will need a consistent approach to the
collection and reporting of waste data across different bodies.
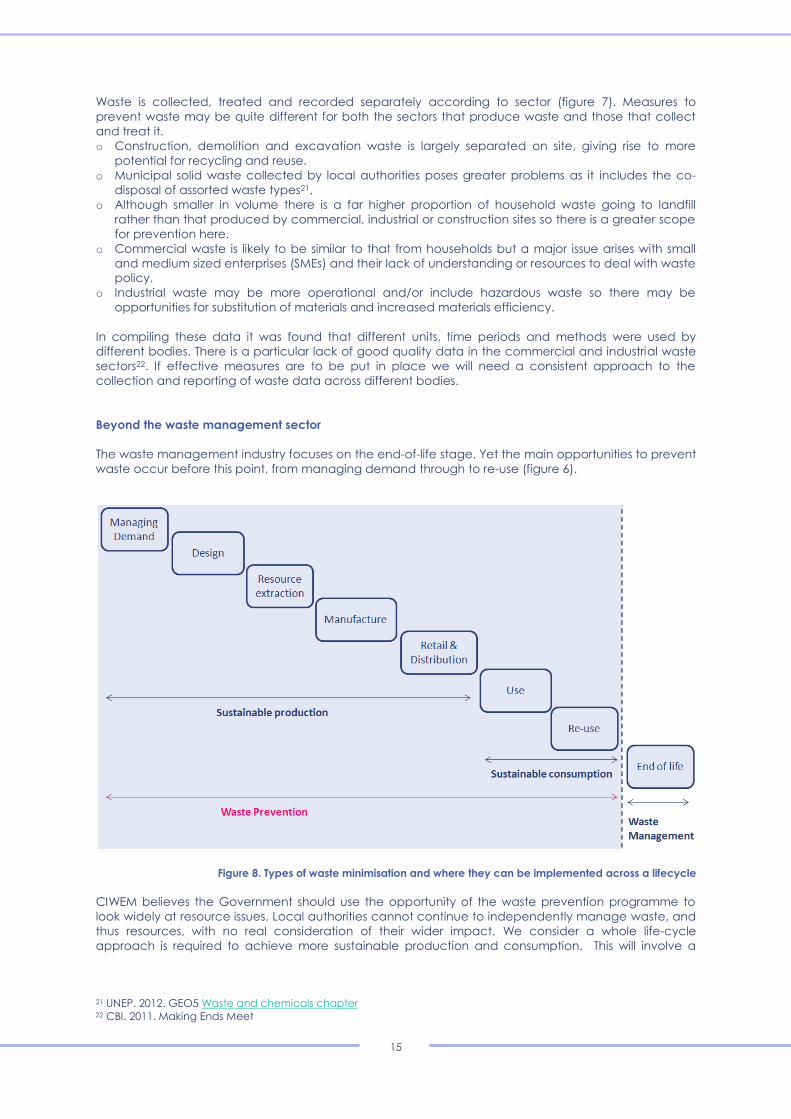
Beyond the waste management sector
The waste management industry focuses on the end-of-life stage. Yet the main opportunities to prevent
waste occur before this point, from managing demand through to re-use (figure 6).
Figure 8. Types of waste minimisation and where they can be implemented across a lifecycle
CIWEM believes the Government should use the opportunity of the waste prevention programme to
look widely at resource issues. Local authorities cannot continue to independently manage waste, and
thus resources, with no real consideration of their wider impact. We consider a whole life-cycle
approach is required to achieve more sustainable production and consumption. This will involve a
21 UNEP. 2012. GEO5 Waste and chemicals chapter 22 CBI. 2011. Making Ends Meet

16
variety of interventions involving different actors within the supply chain with the outcome of more
efficient and resilient business practice, making UK plc more competitive.
Principles for waste prevention
Do not repair what is not broken, do not remanufacture something that can be repaired, do not recycle
a product that can be remanufactured23.
Preserve natural capital
o Natural resources and healthy ecosystems are essential to all life and provide the
natural capital upon which humans depend. Reducing the demand for virgin
materials can contribute to the preservation of natural capital and is needed to
foster long-term sustainability.
Reduce externalities
o Reducing the negative impacts on the environment from pollutants to the air,
water and land.
o Removing carbon from the supply chain.
o Removing substances of very high concern (SVHCs) – those that are carcinogenic,
bioaccumulative, mutagenic or toxic - that have harmful impacts on human
health or the environment, through the substitution of materials or chemicals24.
Increase efficiency
o Energy efficiency – using less energy to provide the same services.
o Resource efficiency – a reduction in the quantity of resources employed to
produce goods and services. The Technology Strategy Board defines it as “the
optimal use of material resources across the lifecycle of a product.”25
o Materials efficiency – reducing the total requirement for material production and
processing. Distinguished from resource efficiency (where all resources are
measured with a single weight measure) and from product based approaches
(where it is unclear whether the improvement to a particular product has any
global significance)26.
The following pages outline specifically where waste prevention could be achieved at each point in
the life cycle. For a given product or service there may be a different stage where the greatest
potential lies. Within each stage a summary of potential policy instruments that the government may
wish to consider are included and these are later summarised into a priority order. The circular
economy approach tends to be applied to manufactured products, but here we take a wider look at
buildings, processes and the wider issues of consumption.
23 Stahel, W. 2010. Performance Economy. 24 OECD. 2012. Sustainable Materials Management Principles policy brief 25 Technology Strategy Board. 2009. Resource Efficiency Strategy 2009-12. 26 Allwood JM, Ashby MF, Gutowski TG, et al. (2011) Material efficiency: A white paper. Resources, Conservation and
Recycling 55: 362–381.

17
It is not a new idea that you may not
need to own a drill to make a hole. The
drill is the service that provides the hole
you are after. Therefore is there a need
for everyone to own a drill? The retailer
B&Q is rethinking its whole business
model and examining several options
including shifting from selling products to
leasing them. Leasing products rather
than selling them has also been
undertaken by companies for products
such as cars, phones, electricals, tyres
and carpets and has not threatened
their competitiveness.
Box 1
A LIFECYCLE APPROACH TO WASTE PREVENTION
Managing Demand
We are persuaded to spend money we don’t have on
things we don’t need to create impressions that won’t last
on people we don’t care about27.
Clearly the best way to prevent waste is not to produce it in
the first place by reducing demand. This may be quite
unpalatable in a recession where we should not be seen to
stifle innovation and economic growth. Market measures
do risk causing distortions, unintended consequences and
may even be challengeable as anticompetitive under EU
or global trade rules. But reducing demand needn’t
threaten the economy; job creation in service industries
and repair could offset job losses from declining
production. The creation of a real circular economy that
balances demand with resource and energy use to
optimise the pattern of consumption begins with taking a
look at how we use products and services (see box 1).
The move to leasing goods rather than selling them has been largely driven by innovative business first
movers. However Interface, (who sell the service of a floor covering rather than the product of a
carpet) changed its business model after 21 years, showing that existing companies can partake in the
circular economy. There is certainly more scope for UK plc to diversify, just as B&Q is doing.
The government needs to look at rebalancing economic levers.
- A circular economy is reliant on labour for remanufacture and less reliant on material extraction.
Taxing the consumption of non-renewable materials instead of labour would promote the local
reuse of goods and components and reinforce the competitiveness of the business models of the
circular economy28.
- We tax consumption through VAT, yet this is not always applied to encourage the most sustainable
behaviour. The obvious example of this is that VAT is only charged at five percent on energy,
regardless of its carbon intensity. Another is that no VAT is payable on new construction materials,
but for repairs and restoration the VAT rate is 20 percent. This is a major barrier to refurbishment
and re-use and may result in additional construction and demolition waste. Overall the
government’s income from VAT need not be affected, just the activities it is charged upon.
Policy options
- Redressing environmental taxes to drive sustainable behaviour, especially VAT
- Encouraging leasing and sharing business models expanding the UK’s service economy
- Labelling with accurate information, based on the life-cycle impacts and costs of resource use,
products to help guide consumer decisions.
- Controlling marketing, such as ‘buy one get one free’ that encourage excessive purchasing
- Supporting and advertising car-pooling schemes
- Looking at the potential for adding a carbon tax to advertisements
- Using supplementary indicators to GDP to measure success, such as well-being indicators that
would not incentivise consumption.
- Charging for service water management to incentivise sustainable drainage systems and reduce
the demand for large scale drainage infrastructure, as has been achieved in Philadelphia:
http://www.phillywatersheds.org
- Incentivising district heating to use much of the 60% of energy input to power stations that is
currently not used
- Increasing education, especially in schools, on the environmental impacts and resource
challenges of consumer culture
27 Jackson, T. 2010. An Economic Reality Check. 28 Stahel, W. 2011. Point of view: Taxation. Presented to the World Resource Forum in Davos on 20 September 2011

18
Box 2. Material efficiency contrasted with energy efficiency
(Allwood et al, 2011)
Box 2
Design
With a rising global population, it will be necessary to separate the consumption of goods and services
from the consumption of energy and material resources29. This is likely to require the use of industrial
ecology - the application of chemical engineering thinking to the economy, analysing the flows and
stocks of materials30. This will call for product design that both reduces embodied materials and enables
the dismantling and reuse of components. It may also involve the more intensive use of products. Box 2
shows the various options for preventing waste, either by reducing the actual quantities of material in a
design or by changing the design itself.
Materials Flow Analysis is a family of tools that can be used to assess the environmental impacts of a
product or service from its design to its disposal, the impacts of which may be beneficial or adverse.
Whether a product needs to be made more durable or designed for a shorter lifespan with easy
disassembly depends on where the most energy is used in its lifecycle.
Products where there is a great use of energy in the manufacture should be designed to be more
durable, by designing for life and including parts that can be repaired. The Dyson Ltd business model
encourages this and also provides more opportunity for jobs in servicing and repair. It is important to
design for the product in hand; items that are prone to changes in fashion or technology may not need
to be designed for as long. For example mobile phones have a design life of ten years but have an
average first use of eighteen months. Another issue is that many of our products, such as old phones,
come back into life via the export route in developing countries and we lose the associated resources.
In designing for a short life span (where the greatest energy use is not in the manufacture) there must
be a consideration of the need to design for dismantling and remanufacture. Research has shown that
for steel and aluminium, the greatest barrier to reuse is component incompatibility, i.e. different models
of domestic appliances and car parts using different components (see box 3)31.
29 Pearce, D. 1994. Sustainable Consumption through Economic Instruments. Government of Norway Symposium on
Sustainable Consumption, Oslo. 30 Clift, R and Allwood J. 2011. JCE v837. 31 Cooper D.R., Allwood, J.M. 2012. Reusing Aluminium and Steel Components at End of Product Life. Environmental
Science and Technology
19
Jaguar Land Rover is developing a new metal
alloy and a closed loop recycling process
which increases their use of recycled
aluminium. The new alloy tolerates higher levels
of impurities from previously disregarded
aluminium scrap castings. Developing the
closed loop recycling process also reduces
transport emissions because it uses materials
recycled in the UK, instead of importing
castings from a German supplier. These
projects, funded by the Technology Strategy
Board, aim to reduce aluminium waste and
develop the UK aluminium recycling
infrastructure by increasing the composition of
recycled aluminium used in vehicle
manufacture to 75%.
Box 3
The Royal Society of Arts launched The Great
Recovery32 project in 2012, looking at the role of
design and upstream issues for dismantling with
funding from the Technology Strategy Board of
£1.25m. This is exploring feasibility studies into the re-
design of products, components and systems to
retain material within the economy over several
cycles of use. This type of innovation support is
essential to change perspectives on design.
We need to design for reuse, and this includes
building design. The construction industry consumes
some 30% of the earth’s resources33. Approximately
one-fifth of all global steel is used to reinforce
concrete (210 Mt in 2008), which also presents a
major challenge for reuse, as it is difficult to recover
the steel bars without damaging them34. In a
construction project the design phase is the most
important to influence in order to reduce material inputs35. The Site Waste Management Plan process
should be started early in order to design out materials where possible and ensure they are reused on
site or recycled. Standards such as BREEAM have high specifications for the amount of waste that a site
is allowed to produce and have driven more sustainable behaviour in the construction industry.
Reducing the risk of products is essential to minimise their harmful effects after use. This can be
achieved through substitution, such as the replacement of solvent-based paints with water-based
paints. The recasting of the RoHS Directive36 will play a vital part in this by banning, placing on the EU
market, new electrical and electronic equipment containing more than the agreed levels of lead,
cadmium, mercury, hexavalent chromium, polybrominated biphenyl (PBB) and polybrominated
diphenyl ether (PBDE) flame retardants. It is important that BIS communicates these changes to
manufacturers, authorised representatives, importers and distributors.
Businesses seeking to minimise waste may find the following tools of use:
- WRAP Waste prevention loan fund which supports organisations to develop innovative business
models to reduce the products and resources consumed; and increasing re-use, repair and
recovery capacity, for electrical, textiles and furniture.
- Site Waste Management Plans and the CEEQUAL scheme – designing out waste in construction.
- Materials Flow Analysis use input/output tables and other tools such as lifecycle analysis to
quantify flows and stocks of materials and link these to environmental impacts.
- Material efficiency indicators are tools to monitor processes of de-linking or de-coupling of
resource use from economic growth37.
- The Cradle to Cradle framework addresses not only materials but also energy and water inputs.
Policy options
- Implementing a sufficiently high carbon price
- Mandating efficiency labelling on products
- Setting design codes to encourage reuse, for ease of dismantling or the specification of a
minimum incorporation of renewable content (for material efficiency)
- Encouraging development of new, more sustainable products (innovation support such as the
Technology Strategy Board and WRAP funds)
- Using procurement standards (BS 8903:2010) to influence resource efficiency in the supply chain
- Analysing “carbon intensity of production” vs “ease of recoverability” to identify where efforts
are needed
32 Royal Society of Arts. 2013. The Great Recovery 33 Balfour Beatty. 2011. Sustainability Report 34 Cooper D.R., Allwood, J.M. 2012. Reusing aluminium and steel components at end of product life. Environmental
Science and Technology 35 WRAP. 2012. Website: Designing out waste 36 European Commission. 2011. Restriction of the Use of Certain Hazardous Substances in Electrical and Electronic
Equipment Directive (2011/65/EU) 37 Sustainable Europe Research Institute. 2012. Material efficiency indicators
20
Resource Production/ Extraction
The extraction and processing of ores is where a large environmental impact lies (to create a tonne of
primary aluminium for example releases 13 tonnes of CO2). The energy used in refining and melting iron,
steel and aluminium is responsible for ten percent of the world’s CO2 emissions38.
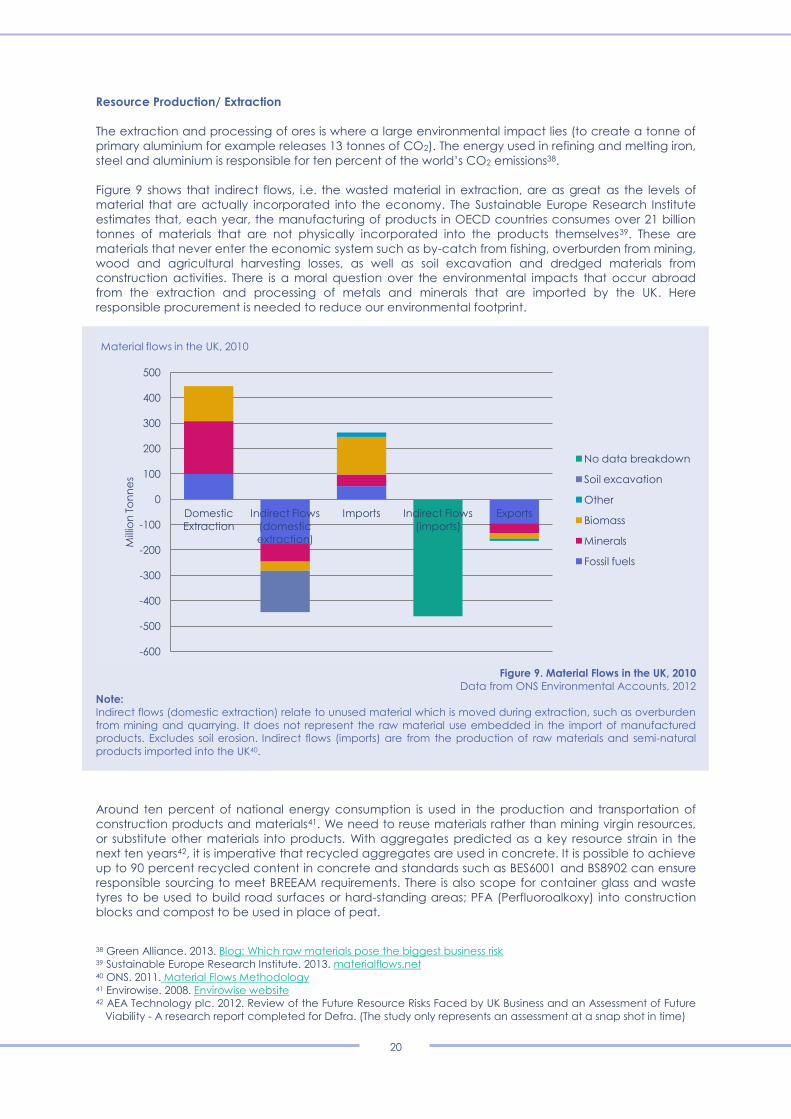
Figure 9 shows that indirect flows, i.e. the wasted material in extraction, are as great as the levels of
material that are actually incorporated into the economy. The Sustainable Europe Research Institute
estimates that, each year, the manufacturing of products in OECD countries consumes over 21 billion
tonnes of materials that are not physically incorporated into the products themselves39. These are
materials that never enter the economic system such as by-catch from fishing, overburden from mining,
wood and agricultural harvesting losses, as well as soil excavation and dredged materials from
construction activities. There is a moral question over the environmental impacts that occur abroad
from the extraction and processing of metals and minerals that are imported by the UK. Here
responsible procurement is needed to reduce our environmental footprint.
Figure 9. Material Flows in the UK, 2010
Data from ONS Environmental Accounts, 2012
Note:
Indirect flows (domestic extraction) relate to unused material which is moved during extraction, such as overburden
from mining and quarrying. It does not represent the raw material use embedded in the import of manufactured
products. Excludes soil erosion. Indirect flows (imports) are from the production of raw materials and semi-natural
products imported into the UK40.
Around ten percent of national energy consumption is used in the production and transportation of
construction products and materials41. We need to reuse materials rather than mining virgin resources,
or substitute other materials into products. With aggregates predicted as a key resource strain in the
next ten years42, it is imperative that recycled aggregates are used in concrete. It is possible to achieve
up to 90 percent recycled content in concrete and standards such as BES6001 and BS8902 can ensure
responsible sourcing to meet BREEAM requirements. There is also scope for container glass and waste
tyres to be used to build road surfaces or hard-standing areas; PFA (Perfluoroalkoxy) into construction
blocks and compost to be used in place of peat.
38 Green Alliance. 2013. Blog: Which raw materials pose the biggest business risk 39 Sustainable Europe Research Institute. 2013. materialflows.net 40 ONS. 2011. Material Flows Methodology 41 Envirowise. 2008. Envirowise website 42 AEA Technology plc. 2012. Review of the Future Resource Risks Faced by UK Business and an Assessment of Future
Viability - A research report completed for Defra. (The study only represents an assessment at a snap shot in time)
-600
-500
-400
-300
-200
-100
0
100
200
300
400
500
Domestic
Extraction
Indirect Flows
(domestic
extraction)
Imports Indirect Flows
(imports)
Exports
Mill
ion
To
nn
es
Material flows in the UK, 2010
No data breakdown
Soil excavation
Other
Biomass
Minerals
Fossil fuels

21
Sports brand Puma has published
Environmental Profit and Loss Accounts
which values its impacts at €145 million.
The supply chain is responsible for 94
percent or €137 million of its total
environmental impact, with only six
percent from Puma’s core operations
such as offices, warehouses, stores and
logistics. Over half (57 percent or €83
million) of all environmental impacts are
associated with the production of raw
materials including leather, cotton and
rubber. The analysis looked at the
impacts from land use, air pollution,
waste, water use and greenhouse gas
emissions. These costs will serve as an
initial metric for the company when
aiming to mitigate the footprint of their
operations and all supply chain levels.
Box 4
Which resources we use is also a key consideration. A research report43 completed for Defra concluded
that from the perspective of supply and demand, key resources at risk and the sectors using them are:
o Aggregates (40 years for crushed rock and 10 years for land sand and gravel) - construction and
civil engineering
o Fish – food and drink
o Indium – electronics, IT and solar energy
o Lithium (worldwide demand may exceed supply by
2020) – automotive and battery (hybrid and electric
vehicles)
o Phosphorus – agriculture
o Rare earth elements – automotive, chemical,
engineering and renewable energy
The point to note is that access to these resources will
affect technologies that we will rely on in the future for a
low carbon economy. Technologies such as electric
vehicles and wind turbines require rare earth elements for
high efficiency, permanent magnets. Alongside strategies
for their preservation, research is needed to ascertain if
there are elements that can be used or technology that
can substitute these essential resources. The potential for
substitution depends on the availability of material. Steel
and cement dominate industrial energy demand, but in
terms of performance and availability the only viable
substitutes are stone and wood. Yet these two materials
are considerably more difficult to use, so broadly there are
no significant opportunities for substituting bulk structural
materials44.
The Stockholm International Water Institute estimates that huge amounts of water, totalling 550 billion
cubic metres, are being used to grow crops that are never eaten45. Key efforts should be directed at
reducing vegetable and crop wastes at source. At present, whole fields of crops are being rejected by
major supermarkets who control 90 percent of the UK food sector, because they do not meet buyer’s
specifications. These ‘specifications’ stipulate the size, shape and skin finish of produce retailers
purchase and at what price. When the cost of lifting a crop exceeds its market value there is clearly a
problem with the grading system as set out in EU and DEFRA guidelines; these need to be reviewed.
Policy options
- Incentivising reuse so less virgin materials are used by pricing externalities
- Mandating extended environmental reporting for large businesses (box 4)
- Researching opportunities for substitution and sharing this knowledge
- Including the transportation of materials in Materials Flow Analysis/ Life cycle assessments
- Setting up a Government clearing house for secondary materials which links up buyers and
sellers; the buyers could receive a re-use credit which is then offset against corporation tax
- Ensuring that advice and support is available to help SMEs identify and improve their resource
efficiency and sustainable use of raw materials
- Extending producer responsibility directives to recover critical resources (see retail for further
information)
- Setting minimum standard for responsible sourcing schemes for aggregates, pre-cast concrete
and steel products in the UK - such as BES6001 and BS8902
- Reviewing grading systems in the grocery sector
- Greater use of the measure material productivity rather than GDP (calculated by dividing the
Gross Domestic Product in real terms by Domestic Material Consumption)
43 AEA Technology plc. 2012. Review of the Future Resource Risks Faced by UK Business and an Assessment of Future
Viability - A research report completed for Defra. (The study only represents an assessment at a snap shot in time) 44 Allwood, JM, Ashby MF, Gutowski, TG, Worrell E. 2013. Material efficiency: providing material services with less
material production. Philosophical Transactions of the Royal Society A 371 no. 1986 45 Lundqvist J, de Fraiture C and Molden D. 2008. Saving Water: From Field to Fork – Curbing Losses and Wastage in
the Food Chain. Stockholm International Water Institute Policy Brief

22
Manufacture
Manufacturing is an area where material and energy inputs, outputs and waste can more easily be
measured. The UK’s material productivity more than doubled between 1990 and 2010, as the quantity
of natural resources used by the economy fell in relation to the level of economic activity46. Though this
may be unrelated to manufacturing and there is still vast scope for improvement. By improving
resource efficiency, using material more effectively, using less energy and water, the government
estimates that UK businesses could save around up to £23bn a year47. Most of this (£18 bn) relates to
using raw materials more efficiently in manufacturing. Realising these savings would also cut UK
greenhouse gas emissions by 13 percent (90M tonnes CO2 equivalent).
Extending knowledge through supply chains, and abroad is also essential. Large businesses can use
their purchasing power to have a powerful influence over their suppliers to reduce environmental
impact and influence design (box 4 shows how 94 percent of Puma’s impacts are from within the
supply chain). The implementation of green procurement standards (eg. BS 8903) could have a large
impact on environmental externalities.
More circular use of resources is needed in the manufacturing process. The government funded
National Industrial Symbiosis Programme (NISP Network) is a good example of linking businesses in the
supply chain. It enables a company’s waste, water, energy or a by-product to be sold to another
where it may be a valuable resource48. Co-locating industries in strategic areas would be more
beneficial by utilising recovered material resources, water, heat and energy together on the same site.
The Enhanced Capital Allowances (ECA) scheme for energy-saving technologies encourages
businesses to invest in energy-saving plant or machinery
specified on the Energy Technology List (ETL). It allows
businesses to write off the entire cost of any green technology
included on the list against taxable profits. The list is managed
by the Carbon Trust and has assessed over 42,000 products
including boilers, lighting, refrigeration and motors.
Globally freshwater scarcity stands out as one of the most
pressing cross-cutting challenges49. Water footprinting is one
technique that may ensure that water intensive industries
locate in the most appropriate locations (box 5)50. Reducing
the overall water usage in the food and drink industry is
currently being achieved through the voluntary agreement
The Federation House Commitment51 (FHC) jointly managed by
The Food and Drink Federation and WRAP. This aims to reduce
water usage by 20 percent by 2020. Additional agreements
could be used in other sectors.
Policy options
- Powering energy intensive industries with low carbon electricity
- Requiring Local Authorities to set aside areas for industrial co-location within Local Plans
- Encouraging voluntary agreements to reduce water usage and increase water reuse in
manufacture and processing
- Using procurement standards (BS 8903:2010) to influence resources in the supply chain
- Exchanging information on routes to resource efficiency between partners in supply chains and
across sectors, including SMEs
- Supporting further Enhanced Capital Allowances
- Shifting taxation away from labour to environmental impacts
- Using water footprinting to decide where to locate manufacturing (box 5)
- Introducing a shadow price for water, similar to that of carbon
46 Office for National Statistics. 2012. UK Environmental Accounts 2012 47 Defra. 2012. Resource Security Action Plan 48 NISP Network Website 49 World Water Assessment Programme. 2009. UN World Water Development Report 3: Water in a Changing World 50 CIWEM. 2011. Water Footprinting policy position statement 51 Federation House Commitment
Balfour Beatty developed a suite of
water footprinting tools in 2011. Unlike
carbon, water is a local issue, with its
environmental impact being a function
of the volume of water used and its
water stress in a given area. The more
stressed a locality is in terms of its water
resources, the greater the impact will be.
Tools were developed for their offices
and projects sites, one based on the bill
of materials for construction projects
(embodied water) and another tool for
specific products.
Box 5

23
The Ellen MacArthur Foundation has modelled the
savings from keeping packaging in circulation for
longer. By shifting from disposable to reusable glass
bottles for beer would lower the cost of packaging,
processing, and distribution by approximately 20
per cent per hundred litres. While durability would
require a 34% increase in the amount of glass used
per bottle, this increase in material would be small
when compared to the savings that would be
achieved from being able to reuse such bottles up
to 30 times, as is currently achieved in Germany. A
cost reduction of 20 percent (from US$29 to $24 per
hundred litres of beer consumed) would be
possible in the UK.
Box 6
Retail and Packaging/ Distribution
Minimising the energy used in transport can be achieved by maximising the efficiency of shipments,
using alternative distribution methods and the closer sourcing and linking of supply chains. The retailer
IKEA uses rail for long distance transportation and flat-packing items reduces transport volume.
Over one million tonnes of mixed plastics packaging from households are disposed of in the UK each
year52. Packaging waste is often a cause for concern among consumers but there are instances, such
as food, where it is more sustainable to package the product to prevent damage, rather than throwing
a damaged product away. Food, drink and packaging waste in the UK supply chain is about 6.6Mt per
year and costs £5 billion. In the grocery sector the Courtauld Commitment is a voluntary responsibility
deal supported by the government and delivered by WRAP, aimed at improving resource efficiency
and reducing the carbon impact through the supply chain. It aims to reduce the carbon impact of
grocery packaging by ten percent. It is anticipated that Courtauld 3 will be launched in 2013.
The Packaging Recovery Note (PRN) system has
been the principal means through which the UK
has delivered compliance with the EU Packaging
Directive. It has delivered rapid improvements in
the UK’s recycling packaging performance with
over 60 percent of packaging recycled in 2010
across the UK53. However recycling is not the
same as preventing waste.
Extended producer responsibility could drive
more measures up the hierarchy. This is a strategy
where the manufacturer of the product is made
responsible for the entire life-cycle of the product
which may include its repair, re-use, disassembly
and recycling. This encourages more sustainable
design, less toxic components and more easily
recyclable parts54.
Producer responsibility has been implemented through regulation for some priority materials and has
been quite successful. The new WEEE Directive55 (Waste Electrical and Electronic Equipment) introduces
a collection target of 45 percent of electronic equipment sold that will apply from 2016 and, from 2019,
a target of 65 percent of equipment sold, or 85 percent of electronic waste generated. It is an
increasingly important waste stream to recover as it contains critical rare earth elements, gold and
silver, that can be reused. Once producers are bearing the cost, financial incentives will ensure that
they will find ways to design out the waste, which is true waste prevention at source.
Policy options
- Using procurement standards (BS 8903:2010) to influence resource efficiency and
transportation in the supply chain
- Optimising freight transport logistics by providing information on water and rail freight options
- Enhancing producer responsibility for sectors other than automotives and electricals
- Reducing VAT on second hand or refurbished products (particularly electricals)
- Extending voluntary agreements such as Courtauld Commitment to other sectors
- Reviewing specifications for plastic packaging for recovery as not all can be easily
reprocessed into polymers
- Supporting the development of smarter packaging solutions that can intelligently inform
consumers when a perishable item is nearing its shelf life
- Promoting reusable packaging suppliers as listed by WRAP
52 WRAP. 2012. Website: Mixed plastics packaging 53 Environmental Services Association. 2012. Beyond Landfill 54 European Commission. 2008. Waste Framework Directive 2008/98/ec 55 Directive 2012/19/EU of the European Parliament and of the Council of 4 July 2012 on waste electrical and
electronic equipment (WEEE)

24
Many businesses are moving their data
services to the ‘cloud’, but is this simply
outsourcing the environmental impact to
a service provider? New data centres are
being built at ever increasing scales and
with increased server density and greater
energy efficiency (compared to an in-
house server).
Research by Accenture shows that typical
carbon emission reductions are:
• More than 90 percent for small
deployments of about 100 users
• 60 to 90 percent for medium-sized
deployments of about 1,000 users
• 30 to 60 percent for large deployments
of about 10,000 users
Box 7. Accenture. 2010.
Cloud Computing and Sustainability
Use
Setting standards could drive the market to cut out the least sustainable products and influence
consumers to enact and invest in more sustainable ones. Most consumers simply expect the products
they buy to be sustainable. Eliminating the option to buy inferior quality products, or components with a
poor environmental or social record and using forward procurement to set standards above those
currently achievable can support new investment56.
Standards for energy and water efficiency for products can drive new technologies to be developed
and improve the environmental impacts during the ‘use’ stage. This is also true of building design
meeting standards, such as the Code for Sustainable Homes and BREEAM ratings that specify levels for
materials and their sourcing, insulation, daylight, natural ventilation, low carbon technologies and
water use.
The increased use of information technologies will
require more efficient technologies to decrease the
overall energy consumption of computation, storage
and communications57. Server virtualisation is a
technology that can partition one physical server into
multiple servers. Each of these virtual servers can run its
own operating system and applications and perform as
if it is an individual server. This makes is possible to make
a saving on energy use.
With the substantial move of many organisations data
storage to cloud-based systems (box 7), it will be less
easy to determine where the actual servers are located.
Preferred locations would be in cooler climate locations
where less cooling is required and where there are large
supplies of renewable energy e.g. Scandinavia. A
suitable NGO could be supported by the Government
to provide an accreditation of the best cloud server
providers and issue them with a Government energy-
efficient kite mark, just as we grade other electricals.
Almost half the food that is wasted in the UK is from within the household. The amount of household
food waste generated in the UK is far higher than other European countries (137kg/capita in the UK
compared to 93kg/capita in Germany and 46kg/capita in Italy)58 showing that there is significant
scope for improvement. WRAP’s Love Food Hate Waste Programme encourages voluntary reductions
in food waste. It was introduced in 2007 and has had some success with food waste generated by
English households falling by over 1 million tonnes between 2007 and 2010. However of the food that
was thrown away in 2010, 4.4 million tonnes (valued at £12 billion) were identified by WRAP as
preventable through simple measures including information provision, engagement of retailers, brands,
local authorities and householders and better planning. Wasted food also contributes to four percent
of the UK's total water footprint59.
Policy options
- Setting ever increasing targets for water and energy efficient products which could utilise the
already voluntary labelling schemes: Energy Saving Trust, EU Energy label, Energy star
- Introducing accreditation of the most energy efficient cloud server providers
- Mandating an increasing level of Code for Sustainable Homes or BREEAM for new buildings
- Increasing water reuse in domestic and commercial settings
- Continuing education campaigns on minimising food waste e.g. from WRAP with better
communication and more consistent messaging on product handling and storage for customers
56 Sustainable Development Commission. 2007. You are what you sell 57 Berl et al. 2010. Energy Efficient Cloud computing. The Computer Journal 53 p1045-1051 58 European Commission. 2010. Preparatory Study on Food Waste across EU 27. 59 WRAP. 2012. Love food hate waste
25
End of Life
By the time the end of life stage has been reached there are no longer opportunities for waste
prevention. However waste minimisation can still be achieved through recycling and recovery.
There is considerable scope for improvement in the logistics of the supply of goods and their end of life
collection, and where these can be better joined up. The waste prevention strategy should assess
opportunities for re-use hubs in cities and the potential for setting aside. Co-locating industries in
strategic areas would be more beneficial by utilising recovered material resources, water, heat and
energy together on the same site. This could build on the work of the National Industrial Symbiosis
Programme Network.
Local consumer to consumer networks and initiatives, such as FRN, Freegle and Freecycle60 have
proven to be successful, and could be enhanced by the government advertising their existence. There
is significant potential for third sector involvement in the breakdown and segregation of waste streams
and the fragmentation of large contracts to localised collection and treatment. This could create more
jobs through improved collection rates and end quality, as well as improved scope for community buy-
in.
In planning for new collection and treatment methodologies councils must be taking decisions that are
based on the holistic lifecycle of the particular material and with consideration of the linkages between
collection, processing, and reprocessing61. The Government’s strategy needs to look to the longer term
and where markets will go. Often when we develop new technologies for waste reduction and
recycling we allow as many facilities to set up as possible and this leads to oversupply and a crash in
recovered value. The Government may need to set a limit on plant capacity by licensing which could
be allocated on first served basis, or by auction, or by nil-value tendering. This will lift recovered material
values, decrease exports and close the UK loop.
Anaerobic digestion can be used to turn organic waste into a resource and is environmentally superior
to composting and recycling. Currently only 25 percent of English local authorities provide for separate
collection of food waste, with a further 25 percent collecting food mixed in with garden waste. There is
also greater scope for the co-digestion of sewage sludge and waste to produce biofertiliser and
biogas. Regulatory barriers currently inhibit co-digestion and an update to the Quality Protocol for
Anaerobic Digestate (PAS 110) needs to include provision for the use of biosolids (sewage sludge) as
feedstock62.
A strategy for the recovery of key nutrients such as phosphate from wastewater is necessary.
Phosphorus is an essential element to life. Scarcity will become a factor as demand for food increases.
China has acknowledged this risk and recently imposed a 135% export tariff on phosphate rock, though
the World Trade Organisation ruled against it. Defra noted that from the perspective of supply and
demand, phosphorus is a key resource at risk63 but this could be reduced to some extent by making
phosphate recovery a legal requirement64.
Policy options
- Using Carbon Reduction Commitment (CRC) allowances for recycling and reprocessing
activities
- Joining up the supply of goods and their end of life disposal collection in hubs
- Legally requiring wastewater recovery for phosphorus
- Using Green Investment Bank funds for anaerobic digesters
- Co-digesting biodegradable waste in sewage sludge digestors to create an alternative to
inorganic fertiliser
- Awareness raising on disposal of household hazardous waste
- Limiting recycling plant numbers by licensing
60 Further details at: http://frn.org.uk/ http://ilovefreegle.org/ http://www.uk.freecycle.org/ 61 National Waste and Resources Partnership Forum. Response to the LGA Local Waste Review 62 CIWEM. 2011. Policy Position Statement on Co-digestion 63 AEA Technology plc. 2012. Review of the Future Resource Risks Faced by UK Business and an Assessment of Future
Viability - A research report completed for Defra. (The study only represents an assessment at a snap shot in time) 64 CIWEM. 2012. Policy Position Statement on Phosphorus

26
PRIORITY MEASURES FOR WASTE PREVENTION
Easy wins Type of instrument
Extending producer responsibility directives to recover critical resources Legislative / Regulatory
Setting up a cloud computing accreditation scheme Information, subsidies
and incentives
Setting minimum standards for recycled content in concrete and building
materials
Certification and
standards
Reducing VAT on second hand or refurbished products (particularly
electricals) Taxes and charges
Increasing education, especially in schools, on the environmental impacts
and resource challenges of consumer culture. Information
Co-digesting biodegradable waste in sewage sludge digesters Regulatory
Big wins Type of instrument
Legally requiring wastewater recovery for phosphorus Regulatory/ permitting
Setting design codes to encourage reuse, for ease of dismantling or the
specification of a minimum incorporation of renewable content (for
material efficiency)
Certification and
standards
Changing DEFRA guidelines for fruit and vegetable specifications used by
food retailers, if necessary getting derogation from EU restrictions Legislative / Regulatory
Powering industry with low carbon electricity Subsidies and incentives
Mandating an increasing level of Code for Sustainable Homes or BREEAM
for new buildings
Certification and
standards
Redressing environmental taxes to drive sustainable behaviour, especially
VAT Taxes and charges
Pushing for harmonised European standards to improve recovery Standards and
certification
Implementing a sufficiently high carbon price Taxes and charges
Ensuring that advice and support is available to help SMEs identify and
improve their resource efficiency and sustainable use of raw materials
Information, research
and development
Shifting taxation away from labour to environmental impacts Taxes and charges
Incentivising district heating to use much of the 60% of energy input to
power stations that is currently not used Infrastructure
Figure 10. Priority measures for waste prevention
27
“Our customers increasingly expect
their infrastructure to be built and
maintained using materials with
minimal environmental impact over
the lifecycle and to have been
responsibly sourced. Being a leader
in the responsible sourcing of
materials helps differentiate our
business in the marketplace and
delivers lower cost projects by
selecting recycled and alternative
products in preference to primary
materials” – Balfour Beatty
“Half of Unilever’s raw materials come
from either farms or forests. We are
committed to sourcing sustainably all
our agricultural raw materials by 2020.
As well as protecting the planet’s
natural resources, sustainable
sourcing helps us to manage a core
business risk by ensuring security of
supply for the long term.” - Unilever
IMPLEMENTING WASTE PREVENTION
What will be needed?
Leadership and policy integration
The Government has a vital responsibility to lead and encourage responsible behaviour from the public
sector, businesses and individuals. It has the capacity to legislate, provide incentives and support
research and information sharing. As this report has shown, there has been a range of work undertaken
to research and improve resource efficiency, notably by WRAP and others. Yet there still seems to be a
great deal to be done to mainstream waste prevention. It is for the Government to clearly set this
objective and map, strategically, how to get there.
Although a cross-cutting issue, thus far, resource efficiency has been largely left in Defra’s remit. The
department estimates that UK businesses could save more than £20bn per year by taking simple steps
to use resources more efficiently, yet there appears to be little involvement from the departments of
DECC, BIS, DCLG and the Treasury who should all be key players and such a saving represents a
massive opportunity to improve the performance of UK plc. There seems to be a lack of urgency on the
issue from wider government, despite its desire to develop a stronger UK economy. From the outside BIS
is involved in waste prevention; however in practice their involvement appears far too limited. As
recently as last month it was revealed that a chief economist at DECC had gained support from the
Foreign Office, Defra and BIS for a “major review” of strains on renewable and non-renewable global
resources but the Treasury had vetoed such plans65. The more efficient management and sustainable
use of materials in the economy poses a great opportunity to boost the competitiveness of UK plc but
the Government, or at least the Treasury, seem blind to this.
Many manufacturers are worried about the potential impact on supply chains because of the rapid
industrialisation in other parts of the globe. A survey carries out by the EEF (a manufacturing group with
a quarter of UK manufacturing businesses as members) showed that access to raw materials was
named as the biggest concern for industry by 80 per cent of respondents and for one in three it was
their top business risk66. Other industrialised countries are allocating funding to recover materials, such
as Japan which has provided $500m for rare earths.
Currently, large businesses rather than the government are
leading the way. Following the work of the Ellen MacArthur
Foundation, the Circular Economy 100 group has been set up
with the aim to bring together 100 leading companies to
deliver $10bn economic benefit from circular initiatives. The
group includes large firms such as Coca-Cola, Ikea Group,
M&S, Vestas, Renault, National Grid and BT. The earlier
example of Puma and its Environmental Profit and Loss
Accounts shows that it is possible to look at how commercial
decisions affect environmental consequences elsewhere in
the world throughout the supply chain.
Both large and small companies are reliant on global supply
chains so ensuring they are sustainable is a business driver.
Large companies have the power to influence their supply
chains through sustainable procurement, in terms of both
contracts for goods and services, and can help improve the
cost of a new technology and mainstream more sustainable
products. They also have the resources to monitor, track and
reduce their impacts. However, UK plc comprises 90% SMEs
who may not have the knowledge or capacity to do this. This
will require more assistance from bodies such as WRAP.
Good governance will be needed to enable innovation of our socio-economic system and create the
platform for new business models such as the leasing models, service economies and industrial ecology
65 Financial Times. 2013. Treasury kills off environment study, March 3rd 2013 66 EEF. 2012. Executive Survey

28
as described previously. What this means in practice, is a strong lead from an imaginative government
that takes a clear view of the whole triple bottom line. Businesses will need to be encouraged to
diversify and consumers educated to understand and reduce their impacts. Local authorities will need
to understand the need for the co-location of industry, designing cities for reuse and the infrastructure
needed for the collection, refurbishment and distribution of products – and must be actively
encouraged to do so in a strategic way. We will also need a consistent approach to the collection and
reporting of waste data across different bodies if effective measures are to be put in place, perhaps a
system of weight based data capture within the Office for National Statistics framework.
The range of measures presented in this report show that there are a variety of policy instruments
available to the government, from voluntary agreements and information to taxes and charges. The
challenge will be to find the right mix of policies along the different life-cycle phases of materials. What
is clear is that policies must not be created in isolation and left in the green policy field. With resource
use affecting all stages of sustainable production and consumption, integration is essential.
Many of the recommendations suggest a regulatory or legislative review, such as the co-digestion of
biodegradable waste with sewage sludge and making it a legal requirement to recover phosphorus
from wastewater, both of which would reduce our reliance on inorganic fertilisers. Others will require
whole scale shifts of policy such as decarbonising the electricity grid and using district heating.
Defra claim they have done little to advance waste prevention “because of the often global nature of
the necessary interventions”67. Different departments within government often have conflicting policies
and there is no independent body to report on these areas of conflict and ways to resolve them. A
commission-type structure or Office for Resource Management could be set up to monitor the impact
of polices on resource use. Another way would be for departmental business plans to each include
policies and targets relating to resource use and materials management. These could then be assessed
in the business plan review process that assesses sustainability of plans.
Engagement between departments when compiling targets and policies is also essential. For example
waste and resource policy has the potential to save a significant amount of greenhouse gas emissions
so it urgently needs to be integrated with our commitment to reduce greenhouse gas emissions by 80
percent by 2050 and to achieve 20 percent of our energy from renewables by 2020. There also needs
to be more of an understanding that the economy is based on the environment and the materials it
provides. At present there appears to be a great deal of ignorance by some departments to the rate
of consumption and the finite nature of resources. This appears to run right to the top of Government.
By ensuring that resources are used more efficiently, we can create and protect tens of thousands of
jobs, minimise environmental degradation and help revitalise the economy.
A review of incentive structures to drive sustainable behaviour
Fundamentally our economy does not encourage sustainable behaviour. Our current economic model
of free markets (neo-liberal) is based on the need for year on year growth of the economy to support
monetary expansion and lending. Continuous growth is not possible in a finite system. This is often
exacerbated by conservative, unambitious policies which fail to recognise the interconnectedness of
the economy and the environment and the cost of externalities. There are finite limits to this model as
we reach environmental thresholds and population growth increases demand for energy, food, water
and increased wealth and living standards.
In essence, there is a requirement to move away from economic models which are based on
perpetual growth, based on consumption. Politically speaking this is an almost unimaginable challenge
as such principles are the foundations of all developed, 'western' economies. Yet as the results of
longitudinal studies of happiness or life satisfaction published by the Cabinet Office68 show, levels of
happiness rise with Gross Domestic Product (GDP) until basic needs are met, at which point increased
GDP no longer asserts a positive effect on happiness. It is the accretion of wealth and the belief that
acquisition and ownership relates to well being that needs to be challenged. A model built around
sharing ownership and increasing well-being rather than material wealth would be able to support the
population in a more sustainable way. Increased education, especially in schools is needed on the
environmental impacts and resource challenges of consumer culture.
67 Defra. 2011. The Economics of Waste and Waste Policy 68 Cabinet Office. 2002. Life satisfaction: The state of knowledge and implications for government

29
The existence of market failures leads us as consumers to make suboptimal choices. By not properly
accounting for environmental externalities, it is hard to prevent the over-consumption and the
depletion of scarce resources, especially those owned in common such as unpolluted air or fish in the
ocean. These market forces lead to an over production of waste. There are also market failures such as
that surrounding information ownership with investors fearing they will fail to capture the return of
investment on innovation because knowledge is free69.
Using supplementary indicators to measure success other than GDP would reduce the driver for mass
consumption. The European Commission proposes using resource productivity as a provisional lead
indicator, measured by the ratio of GDP to Domestic Material Consumption (expressed in Euro/tonne).
A higher ratio would indicate better performance, with growth consuming relatively fewer resources.
This would only capture the material resources and does not deal with other resources or the potential
shift of burden across countries70.
The Government needs to look at rebalancing economic levers to drive sustainable behaviour. The
present government is very anti-red tape, but with no new money available, there will need to be a
careful balancing act of fiscal and regulatory measures. Some suggest we should impose more taxes
on non-renewable sources of energy and materials and reduce the taxes on labour, as this is the
renewable resource.
We tax consumption through VAT, yet this is not always applied to encourage the most sustainable
behaviour. The obvious example of this is that VAT is only charged at five percent on energy, regardless
of its carbon intensity. VAT is payable on electronic publications but not paper publications,
encouraging resource use. Another is that no VAT is payable on new construction materials, but for
repairs and restoration the VAT rate is 20 percent. This is a major barrier to refurbishment and re-use and
may result in additional construction and demolition waste. CIWEM would also support a reduction of
VAT payable on second hand or refurbished products. Overall the government’s income from VAT
needn’t be affected, just the activities it is charged upon. Given the Government’s stated aim to
‘mainstream sustainability’, the continued existence of such perverse incentives is a concern.
Extended producer responsibility to be used to drive more measures up the waste hierarchy
This is where the manufacturer of the product is made responsible for the entire life-cycle of the
product which may include its repair, re-use, disassembly and recycling. Currently businesses have the
full authority to supply products with no environmental responsibility for their impact. Responsibility has
to lie with the inbound supply chain to internalise end of life externalities as part of their design,
materials, logistics and marketing or progress will not be made. Eventually producers will become
responsible as the cost of raw materials rises above the retrieval cost of products already in the market.
We need to ensure then, that businesses are in the position to facilitate this and that the collection
infrastructure is in place.
There is a need for a stable framework in which to allow for sustained investment in infrastructure. There
is a lack of clear policy on waste planning and this has led to inappropriate investment in handling and
treatment technologies. Public funding from the EU budget needs to be prioritised to activities higher
up the waste hierarchy (for example to re-use centres over waste disposal facilities). Currently most
investment is directed to energy from waste because of the potential for the Renewable Obligation,
feed-in-tariffs and Renewable Heat Incentive and this conflicts with the Waste Hierarchy. A higher and
stable carbon floor price could help drive measures up the hierarchy as it would account for the
carbon saved further up the hierarchy and not just subsidise energy production that is not in-line with
the overall carbon price. A carbon framework is needed to plan fiscal incentives and ensure that they
do not cancel each other out.
It is unfortunate that the European Commission has stalled on progress as their rhetoric has been far
more ambitious than that nationally. European end-of-life legislation is capable of driving materially
efficient strategies. When this is complete (it is due by the end of 2014), end of life criteria should help
define the course - as it is critical to know the point at which waste can legally be defined as having
been recycled. This is an important driver towards the segregated collection, handling and subsequent
treatment of waste. It will also be an important factor in infrastructure investment, which will create
69 ENDS. 2013. Igniting a business revolution March 2013 70 European Commission. 2011. Roadmap to a Resource Efficient Europe

30
As an illustration, the EU
‘A to G’ energy
efficiency ratings were
put in place in 1995 for
white goods. This had
little impact until 2001
when the Government’s
Energy Efficiency
Commitment 1 program
required electricity and
gas suppliers to assist
their customers to take
energy-efficiency
measures in their homes.
This encouraged
agreements between
retailers and energy
suppliers and moved the
price of ‘A’ rated
products into the
average consumer price
range (Figure 11).
opportunities for new companies into what is an established market. Harmonising waste policies across
the EU is important to avoid ‘leakage’, whereby waste is exported to exploit regulatory differences.
The EC Thematic Strategy on the Prevention and Recycling of Waste, 2005 has been interpreted by
several Member States as a push for recycling. This has been reinforced by a report on implementation,
commissioned by the Commission71, which when analysed closely shows that the Member States that
are ‘compliant’ (with recycling regulations) actually produce more waste per head of population than
the non-compliant ones. Hence recycling has got in the way of prevention in Europe in a significant
way. Most of the Producer Responsibility legislation is actually aimed at designing for recycling rather
than reuse when analysed closely. Several Directives are under review and it is essential that we ensure
that they are driving for material efficiency and more reuse.
Stimulating the market to cut out the least efficient products and develop new, more sustainable ones
As highlighted, this can be achieved through various incentive structures: minimum standards, dynamic
standards, voluntary labels, procurement standards and enhanced producer responsibility. Both
businesses and the Government have a role to make the sustainable option the default choice for
consumers (figure 11).
Figure 11. The effect of ratings on white goods,
Sustainable Development Commission, 2007
Minimum standards work by cutting out the least sustainable or efficient products and are particularly
important to initiate an industry wide change where there may be no existing market driver. In Japan,
the government has taken the lead. It announces minimum efficiency standards early and then backs
them with fines for any manufacturer or importer that does not conform. This has driven a virtuous circle
of innovation that has improved energy efficiency of new appliances and products by as much as
78%72.
Dynamic standards, where they are regularly tightened, can be used to drive continuous
improvements in performance such as energy or water efficiency. These work particularly well in
technologies that change quickly in time such as vehicles, electricals and entertainment systems. The
coherent labelling of products will also assist consumers in their purchasing choices.
The EU has already realised that transformation to a circular economy will need a policy framework
where conditions are predictable and take place in a less disruptive and costly way. CIWEM advocates
71 IEEP et al. 2010. Final Report - Supporting the Thematic Strategy on Waste Prevention and Recycling. 72 Sustainable Development Commission. 2007. You are what you sell.

31
that standards are required potentially for designs of a product, materials used and efficiency ratings.
These would need to be implemented at the EU level to ensure that our markets align and there is a
level playing field. Setting design codes to encourage reuse, for ease of dismantling or the specification
of a minimum incorporation of renewable content would increase material efficiency.
The greatest barrier to reuse is component incompatibility. To ensure that products, components and
systems retain materials within the economy over several cycles of use requires a standardised
approach for different components. Care would need to ensure innovation is not inhibited.
On the other hand we have to be careful that standards do not encourage waste. The fruit and
vegetable specifications as set out in EU and DEFRA guidelines and used by food retailers to stipulate
the size, shape and skin finish of produce is causing whole fields of crops to be rejected creating
organic waste and its associated wasted water and fertiliser. There is clearly a problem with the grading
system when the cost of lifting a crop exceeds its market value and this needs to be challenged by
DEFRA, if necessary getting derogation from EU restrictions.
A standardised approach would improve levels of material recovery. High quality recyclates are
needed within the UK for re-processing to ensure a high quality resource and maintain the potential for
export. Currently the range of polymers used in packaging is seen as a barrier to recycling such that
mixed plastics may in fact go for energy recovery. Coca cola has had to invest in the company ECO
plastics to increase UK PET bottle recycling so it has a domestically-sourced feedstock rather than
sourcing it from continental Europe.
For some materials there ought to be requirements for incorporation of recycled content, such as those
that are a predicted key resource strain73. With aggregates predicted to run out in the next ten years, it
is imperative that recycled aggregates are used in concrete. A minimum standard for recycled
content in concrete and building materials ought to be implemented to reduce our demand for virgin
materials and their associated processing.
73 AEA Technology plc. 2012. Review of the Future Resource Risks Faced by UK Business and an Assessment of Future
Viability - A research report completed for Defra.
32
MAKING WASTE PREVENTION A REALITY
It is expected that in the next two decades, up to three billion people will be added to the global
middle class; demand for oil, coal, iron ore and other natural resources will rise by at least a third in half
that time and the environmental impacts of materials production and processing, particularly those
related to energy, are rapidly becoming critical74,75,76. We will reach a point where the difficulty of
extracting new non-renewable resources significantly constrains our use of them and a rate at which
using renewable biomass is not biologically sustainable. By acknowledging this threat, reducing
demand and planning and acting strategically, we can recover and reuse critical resources within our
economy to increase our resilience in a resource constrained world.
The UK governments have responded with a stated aim to move towards a ‘zero waste’ economy.
Whilst the sentiment is welcome, CIWEM believes that the concept of ‘zero waste’ is unrealistic as it is
difficult to define and could be counterproductive by setting apparently unattainable goals. It is also a
diversion and could result in effort being focussed at the wrong end of the supply chain. Instead we
need the Government to acknowledge that the economy is based on the environment and the
material goods it provides and only an integrated and systematic approach to production and
consumption will reduce the total requirement for materials, energy and water.
CIWEM advocates that taking an integrated, life-cycle approach can help to achieve the principles of
waste prevention: preserving natural capital, reducing externalities and increasing efficiency across all
stages in the lifecycle. By looking at materials at the beginning of the production process, there is the
potential to prevent waste by design. This will involve a variety of interventions involving different actors
within the supply chain with the outcome of more efficient and resilient business practice, making UK
plc more competitive. We believe management priorities should be driven by where the greatest
resource value can be achieved as part of a circular economy and this relies on going beyond the
waste management sector.
The Government needs to not be afraid to ask more from business. Currently businesses have the full
authority to supply products with no environmental responsibility for their impact. Leading businesses
have shown that is it possible to undertake circular activities across the supply chain. The circular
economy, like energy security and resource efficiency all makes clear business sense. We now need to
translate and mainstream this ambition throughout the public sector to SMEs and to the wider public. If
England is to compete on the global stage it must be brave, ambitious and innovative enough to do
things differently. We need a far more strategic approach, led by the Government.
The waste prevention strategy should not be overlooked. It is a clear opportunity.
CIWEM calls on the Government to take action and provide a clear, consistent framework to foster the
change to a resource-efficient, circular economy that will not only preserve the natural environment
and our supply of resources, but enable us to build a resilient and dynamic economy with strong
international competitiveness.
74 McKinsey Quarterly. 2012. Mobilizing for a resource revolution 75 McKinsey Global Institute. 2011. Resource revolution: Meeting the world’s energy, materials, food & water needs 76 OECD. 2012. Sustainable Materials Management Green Growth Policy Brief.

33
ANNEX 1
Waste Framework Directive (2008/98/EC) Summary
The EU Waste Framework Directive lays down measures to protect the environment and human health
by preventing or reducing the adverse impacts of the generation and management of waste, and by
reducing the overall impacts of, and improving the efficiency of, resource use. Revisions to the Waste
Framework Directive (2008/98/EC) were adopted in December 2008 and will need to be implemented
by December 2010.
The revised Directive includes requirements for member states to:
- Apply the waste hierarchy in waste management legislation and policy.
- Promote the high quality recycling of waste materials as part of the overall aim to make the EU a
‘recycling society’.
- Ensure that separate collection is set up for at least the following: paper, metal, plastic and glass
by 2015.
- Prepare for reuse and the recycling of waste materials such as at least paper, metal, plastic and
glass from households shall be increased to a minimum of overall 50% by weight by 2020.
- Prepare for reuse, recycling and other material recovery of non-hazardous construction and
demolition waste shall be increased to a minimum of 70% by weight in 2020.
- Establish an integrated and adequate network of waste disposal installations and installations for
the recovery of mixed household waste.
- Ensure that waste management is carried out without endangering human health and without
harming the environment.
- Establish waste management plans.
- Establish Waste Prevention Programmes describing existing prevention measures, evaluating the
usefulness of other measures and determine benchmarks for measurement of adopted prevention
measures.
ANNEX 2
Key measures from Scotland and Wales’ waste prevention programmes
A Zero Waste Plan for Scotland
- A long term target of 70% recycling for all waste arising in Scotland by 2025
- Introduce regulatory reporting to improve data on resource use by the business sector
- Introduce progressive bans on the types of materials that may be disposed of in landfill, and
associated support measures, to ensure that no resources with a value for reuse or recycling are
sent to landfill by 2020
- Introduce a carbon metric for waste, to identify and prioritise the materials with the highest
environmental benefit for recycling
- Introduce regulations to drive separate collection and treatment of a range of resources in order
to maximise their reuse and recycling value,
- Introduce regulatory measures to support the delivery of landfill bans, by ensuring energy from
waste treatment is only used to recover value from resources that cannot offer greater
environmental and economic benefits through reuse or recycling.
- Review the success of measures to influence waste behaviours, including incentives, and from the
results of the review, encourage the development of schemes to drive reductions in waste and
improvements in recycling performance.
- Develop a tool to assist local authorities in identifying the infrastructure needed to collect, sort,
recycle and recover all waste in Scotland.
- Assess existing support and resources on waste management for education providers and develop
appropriate support and resources to integrate zero waste objectives into teaching and learning
from early years to tertiary education in the context of Curriculum for Excellence and sustainable
development education.

34
Wales – Towards zero waste
The Assembly Government proposes to set statutory recycling targets for municipal waste collected by
local authorities. All sectors in Wales will be recycling at least 70% of their waste by 2025 - this includes
businesses, households and the public sector. The construction sector will be expected to reuse and
recycle 90% of its wastes by 2025. This is an intermediate step on the way to the 2050 target to achieve
zero waste and live within our environmental limits.
Sector plans will:
- Consult on annual waste prevention targets of -1.2% for household waste, -1.2% for commercial
waste, -1.4% for construction and demolition waste, and around -1.4% for industrial waste (in each
case this will be a percentage of the 2007 baseline).
- Identify and develop markets within Wales for the recyclate and anaerobic digestion digestate.
- Identify the supply of high quality recyclate feedstock in Wales and ensure that the reprocessing
infrastructure and collection systems are designed to serve the requirements of the Welsh markets
as far as is practicable.
- Assess the infrastructure requirements arising from the recycling and waste management targets
across all sectors, and provide mechanisms for implementing them.
- Develop mechanisms for promoting closed loop recycling facilities in Wales.
- Develop mechanisms for promoting recycling facilities that accept recyclates depending on the
material they are rather than the sector they come from - to achieve economies of scale.
- Ensure capacity for residual waste treatment and the most sustainable type of residual waste
treatment.
- Ensure that the waste infrastructure in Wales is as sustainable as possible, and that facilities are
seen as valuable and desirable assets by the local communities that surround them.
- Food waste collected separately and managed in anaerobic digestion facilities to generate
valuable renewable energy and fertiliser.
- Strong markets for recyclates and the fertiliser produced from the anaerobic digestion of food
waste.

35

36
Back cover
Related Documents