Competition in wood waste: Inventory of policies and markets

Welcome message from author
This document is posted to help you gain knowledge. Please leave a comment to let me know what you think about it! Share it to your friends and learn new things together.
Transcript

Competition in wood waste: Inventory of policies and markets

Competition in wood waste: inventory of policies and markets [April 2013]
Page 2 of 55

Competition in wood waste: inventory of policies and markets [April 2013]
Pagina 3 van 55
Colophon
Date April 2013
Status Final version
This study was carried out in the framework of the Netherlands Programmes
Sustainable Biomass by
Name organisation SQ Consult
Contact person Jinke van Dam
Although this report has been put together with the greatest possible care, NL Agency does
not accept liability for possible errors.


Competition in wood waste: inventory of policies and markets [April 2013]
Page 5 of 55
Contact
Netherlands Programmes Sustainable Biomass
Ella Lammers
NL Agency
NL Energy and Climate Change
Croeselaan 15, 3521 BJ Utrecht
P.O. Box 8242, 3503 RE Utrecht
The Netherlands
Email: [email protected]
Phone: +31 - 88 - 602 2458
www.agentschapnl.nl/biomass
Organisation
SQ Consult
Postbus 8239
3503 RE Utrecht
The Netherlands
W: www.sqconsult.com

Competition in wood waste: inventory of policies and markets [April 2013]
Pagina 6 van 55
Index
1 Introduction ......................................................................................... 8
2 Consequences of EU Waste Framework Directive and national
interpretations .......................................................................................... 9
2.1 European legislation 9 2.1.1 EU Waste Framework Directive 9 2.1.2 EU Timber Regulation 10 2.1.3 EU Waste Shipments Legislation 11 2.1.4 Other relevant EU Directives 11
2.2 Netherlands 12 2.2.1 Legislation in the Netherlands 12 2.2.2 Waste or not 12 2.2.3 Trans-boundary imports/exports 13 2.2.4 Translation for wood waste for energy 13
2.3 Belgium 14 2.3.1 Flemish Regulation on Waste 14 2.3.2 Decree on Green Power (VREG) 15
2.4 United Kingdom (UK) 16 2.4.1 UK legislation on wood waste 16 2.4.2 What is waste? 17 2.4.3 UK legislation on imported pellets for energy 18 2.4.4 UK regulations pushing biomass and pellet supply and use 18
3 Trends in supply and demand and its market players ........................ 20
3.1 Europe 20 3.1.1 Trends in supply and trade of (clean) wood waste 20 3.1.2 Primary disposers of (clean) wood waste 22 3.1.3 Trends in markets, demand (and prices) of (clean) wood waste 24 3.1.4 Key drivers in demand (clean) wood waste 26
3.2 Netherlands 26 3.2.1 Trends in supply and trade of (clean) wood waste 26 3.2.2 Primary disposers of (clean) wood waste 27 3.2.3 Trends in markets, demand (and prices) of (clean) wood waste 29 3.2.4 Key drivers in demand (clean) wood waste 33
3.3 Belgium 34 3.3.1 Trends in supply and trade of (clean) wood waste 34 3.3.2 Primary disposers of (clean) wood waste 34 3.3.3 Trends in markets, demand (and prices) of (clean) wood waste 35 3.3.4 Key drivers in demand (clean) wood waste 39
3.4 United Kingdom UK 39

Competition in wood waste: inventory of policies and markets [April 2013]
Pagina 7 van 55
3.4.1 Trends in supply and trade of (clean) wood waste 39 3.4.2 Primary disposers of (clean) wood waste 40 3.4.3 Trends in demand (and prices) of (clean) wood waste 42 3.4.4 The conventional wood industry 45 3.4.5 Key drivers in demand (clean) wood waste 46
4 Cascading and impacts to the energy pellet industry ......................... 48
4.1 Place of wood waste in sustainability hierarchy 48
4.2 Place of wood pellets in sustainability hierarchy 49
4.3 Competition markets and indirect effects 49
4.4 Recommendations to mitigate indirect effects (NL Agency): 51 5 References ........................................................................................... 52

Competition in wood waste: inventory of policies and markets [April 2013]
Pagina 8 van 55
1 Introduction
The quality of recovered wood in different waste streams varies considerably and
different end uses can utilize different types depending on their technical and
commercial capabilities. Biomass facilities can consume a variety of different
biomass feedstock, including wood waste.
The EU Waste Framework Directive (2008/98/EC) prescribes a certain hierarchy of
wood waste use, in which the cascading should be envisaged: waste management
options are ranked in order of environmental preference with the first priority
being waste reduction. Recovering energy from waste is only appropriate for waste
that cannot be prevented, reused or recycled with less greenhouse gas emitted.
When further up-scaling the use of wood waste for energy, it is important to
understand the competition with other end-uses of wood waste, both from a
market and sustainability perspective.
This research will focus on the competition and use of wood waste (pellets), with a
focus on clean post-consumer wood, in the Netherlands and in close by EU
countries: the UK and Belgium.
This assignment is carried out under the Technical Assistance program to support
projects of the Global Sustainable Biomass Fund (‘Duurzame Biomassa Mondiaal’,
or DBM fund) and Sustainable Biomass Import Fund (‘Duurzame Biomassa Import’
or DBI fund).
This report is a public version of the original Technical Assistance report and
findings and conclusions are therefore generalized to share the information to a
wider group of stakeholders.
Chapter 2 will discuss the legislative framework of wood waste in Europe and in
the selected European countries. Chapter 3 will focus on the market developments
of wood waste in Europe, both from a supply and a demand perspective. Chapter
4 will finish the report with concluding remarks whether competition is visible in
the wood waste market, followed by recommendations on how sales of wood
waste pellets can be increased while avoiding negative indirect sustainability
effects to competitive markets.

Competition in wood waste: inventory of policies and markets [April 2013]
Pagina 9 van 55
2 Consequences of EU Waste Framework Directive and national
interpretations
2.1.1 European legislation
2.1.2 EU Waste Framework Directive
The EU Waste Framework Directive (2008/98/EC) prescribes a certain hierarchy of
wood waste use, in which cascading should be envisaged: waste management
options are ranked in order of environmental preference with the first priority
being waste reduction. The preferred waste hierarchy is shown in figure 1.
Figure 1: EU Waste hierarchy (WtERT, 2013)
2.1.2.1 Recovery and the R1 status
Illustrated by the figure above, recovering energy from waste is only appropriate
for waste that cannot be prevented, reused or recycled with less greenhouse gas
emitted. Under certain conditions, efficient waste to energy (WtE) plants can be
classified as energy recovery operations rather than waste disposal. This applies to
incineration facilities dedicated to the processing of municipal solid waste with the
energy efficiency equal to or higher than 60% (installations permitted and in
operation before 1 January 2009) or 65% (installations permitted after 31
December 2008). High energy efficient WtE plants can be assigned a R1 status,
which gives operators the opportunity to accept waste more easily from abroad as
competent authorities may only raise objections to waste shipments that are
destined for disposal.
2.1.2.2 What is waste?
Waste is officially defined in the EU Waste Framework Directive. It refers to any
substance or object, which the holder discards or intends or is required to discard.
In other words, waste does not have an intrinsic value any more. In Europe, waste
is classified under the so-called EURAL codes (Probos, 2007).
Article 2 of the Directive excludes animal carcasses and the following agricultural
waste from the EU Waste Framework Directive: faecal matter and other natural,
non-dangerous substances used in farming, where they are already covered by
other legislation. Since April 2012, this includes non-hazardous agricultural or
forestry material as straw.

Competition in wood waste: inventory of policies and markets [April 2013]
Pagina 10 van 55
The EU Waste Framework Directive does not apply to by-products or materials
that obtain a new status as product through end-of waste criteria.
2.1.2.3 By-product or waste?
A by-product is defined as a substance or object, resulting from a production
process, the primary aim of which is not the production of that item. Article 5 of
the EU Waste Framework Directive specifies that a by-product must meet the
following conditions:
Further use of the substance or object is certain;
The substance or object can be used directly without any further processing
other than normal industrial practice;
The substance or object is produced as an integral part of a production process;
Further use is lawful, i.e. the substance or object fulfils all relevant product,
environmental and health protection requirements for the specific use and will
not lead to overall adverse environmental or human health impacts.
On this basis, measures may be adopted to determine the criteria to be met for
specific substances or objects to be regarded as a by-product and not as waste.
2.1.2.4 Criteria for the end of classification of waste:
End-of-waste criteria specify when certain waste ceases to be waste and obtains
the status of a product (or a secondary raw material). According to the EU Waste
Framework Directive, a given waste may only cease to be a waste when:
The substance or object is commonly used for specific purposes;
A market or demand exists for such a substance or object;
The substance or object fulfils the technical requirements for the specific
purposes and meets the existing legislation and standards applicable to
products;
The use of the substance or object will not lead to overall adverse
environmental or human health impacts.
The concept of end-of-waste criteria implies that the waste material has reached a
stage of processing whereby it has an intrinsic value, so it is unlikely to be
discarded (the very definition of waste) and has been processed to a point at
which its use does not represent a risk to the environment.
Conclusion:
All European countries have translated the EU Waste Framework Directive into
national legislation following the basic requirements;
Post-consumer wood waste is considered a waste and therefore needs to follow
the waste hierarchy. Industrial timber residues are not waste;
The end-of-waste criteria seem to apply for imported energy pellets but this
needs to be evaluated from country to country.
2.1.3 EU Timber Regulation
Wood products are subject to the EU Timber Regulation (EUTR) since March 2013,
except for waste (EC, 2010). The waste exemption applies to: timber products of a
kind covered by the Annex, which are produced from material that has completed
its lifecycle and would otherwise have been discarded as waste.

Competition in wood waste: inventory of policies and markets [April 2013]
Pagina 11 van 55
The exemption does not apply to: by-products from a manufacturing process
involving material, which has not completed its lifecycle and would otherwise have
been discarded as waste.
Conclusions: Primary and secondary forest residues that are used for energy pellets fall
under the EUTR; this requires due diligence reporting;
Post-consumer wood waste does not fall under the EUTR.
2.1.4 EU Waste Shipments Legislation
This EU Regulation implements the Basel Convention on the control of trans-
boundary movements of hazardous wastes and their disposal, and the OECD
Decision on Control of cross-border movements of waste destined for recovery
operations. The EU has ratified the Basel Convention, whereas the US has adopted
it, but not yet ratified it. The Regulation applies to shipments of waste:
Between EU Member States, within the EU or with transit through third
countries;
Imported into the EU from third countries;
Exported from the EU to third countries;
In transit through the EU, on the way from and to third countries.
Wastes subject to notification under the Regulation are set out in the “Amber List”.
Wastes subject to information requirements are only set out in the “Green List”.
Wastes for which export is prohibited are listed separately. The Green List
procedure, only for non-hazardous wastes, may only be followed for waste:
That is mentioned on the Green list;
Goes to certain countries;
Are aimed for useful recovery.
The Annex III of the Green List mentions ”untreated cork and wood waste”, under
number B3050. This includes (EC, 2011):
Wood waste and scrap, whether or not agglomerated in logs, briquettes, pellets
or similar forms;
Cork waste: crushed, granulated or ground cork.
As a common understanding of correspondents it was agreed that wood waste
comprising of wood that has not been subject to any type of treatment, except
purely mechanical types of treatment such as cutting or chipping, can be
appropriately classified under entry B3050 (EC, 2007).
Conclusions:
The EU Waste Shipments Legislation only applies to waste products and not to
products.
In case non-hazardous wood waste is imported from OECD countries to the EU
(Green List), a mandatory notification is needed, when the waste is destined for
useful recovery (which includes energy as main use);
In case the energy products are not considered a waste, the Customs regulation
for products applies.
2.1.5 Other relevant EU Directives
There are various other EU Directives, which do not directly focus on wood waste
for energy recovery but may have affect on the demand of wood pellets within the
EU.

Competition in wood waste: inventory of policies and markets [April 2013]
Pagina 12 van 55
These are for example:
The RES Directive sets an overall EU target of 20% renewable energy in total
energy consumption by 2020, as well as a 10% share of renewable energy in
the transport sector. Solid biomass and forestry biomass are a major source for
bioenergy within the European Union to reach the targets;
The Large Combustion Plant Directive (LCP) has been implemented to reduce
acidifying pollutants, particles, and ozone precursors, emitted by combustion
plants. Emissions from – among others – NOx and SOx are bound to strict
limits. In case energy and heat plants using wood pellets for their generation
are forced to closure, due to NOx and SOx compliance issues, the demand from
these plants will be off the market.
2.2 Netherlands
2.2.1 Legislation in the Netherlands
The National Waste Plan (LAP) in the Netherlands prescribes how waste should be
dealt with in various sectors. Sector plan 36 discusses the wood sector. In terms
of quality, used wood waste is categorized as follows (LAP, 2010): A wood: unpainted and untreated wood;
B-wood: not falling under category A-or C, including painted, varnished and glued wood;
C-wood: impregnated wood, being treated timber where sometimes substances are used (pressurized) in order to extend the lifetime of the product.
The National Waste Plan (version November 2009 / May 2010) gives a minimum
standard for processing for all three categories (LAP, 2010). The minimum
standard for A (and B) wood, as of interest to this research, is recovery1.
Minimum recovery for A and B wood includes various options: Recovery of material2; Recovery of products;
Main use of waste as a fuel or other means to generate energy (based on R1 status).
The Netherlands gives no preference between the options (Afvaldesk, 2013).
The energy plant must have a permit to receive energy pellets of waste for useful
recovery (Afvaldesk, 2013).
2.2.2 Waste or not
The processing, use and transport of waste, is subject to specific rules and
licensing procedures. Jurisdiction and the EU Waste Framework Directive provide
criteria to determine whether one speaks about a waste product or about a by-
product or non-waste product (see section 2.1 for criteria). The question whether
a product is waste, or not, is at the end determined by the Province and
municipalities on a case-by-case basis.
The question till when timber keeps the status of waste is found in Jurisdiction:
the status only expires after the recovery has been completed. Thus: When after the application as raw material a new product was created; or
When after application as fuel, the generated heat / energy is utilized.
1 In Dutch: “Nuttige toepassing”
2 Note: Recycling (earlier in the waste hierarchy) only includes material recovery

Competition in wood waste: inventory of policies and markets [April 2013]
Pagina 13 van 55
One still speaks about waste, even when the waste timber is processed so that it
meets the requirements laid down by those who want to use timber for raw
material or fuel.
2.2.3 Trans-boundary imports/exports
When the material can receive the status of by-product or has received the end-
of-waste status according to the Netherlands, the imported or exported material
does no longer fall under the EU Waste Shipments Legislation (EVOA in
Netherlands). This rule is applied under the condition that the competent authority
in a foreign country considers as well that the material is no (longer) a waste
product. Consequently, the most stringent regime is applied (Afvaldesk, 2013).
Requirements on trans-boundary transport of wood waste are described under
section 2.1 of this report. In case a material is no longer waste (and thus a
product), the material falls under the Product Customs Regulations (Afvaldesk,
2013).
2.2.4 Translation for wood waste for energy
The procedure of criteria categorization for waste and end-of-waste criteria for
post-consumer waste is reflected in figure 2.
Figure 2: Criteria categorization and end-of waste criteria applied for post-consumer waste
(based on Senter Novem, 2005)
Complete recovery: Product is result of completed
process of recovery; Product has same characteristics
and properties as a raw material
Simple actions: Recovery of raw materials
(sorting); Grinding
Removal criteria waste?
Pellet = no
waste
Product: post-
consumer waste
Waste Criteria:
Disposal in reality
Have to dispose
Want to dispose
YES Classified as
WASTE
Conversion waste to energy
pellets outside EU
NO

Competition in wood waste: inventory of policies and markets [April 2013]
Pagina 14 van 55
Conclusions: Based on the value chain and the intended end-use of the material, an energy
pellet from post-consumer wood waste is likely to fall under the end-of-waste criteria and thus no longer considered waste;
This means that the energy pellet could be considered a product only under the condition that the exporting country shares the same view (and does not consider the energy pellet as waste either);
The Netherlands works on a case-by-case status. An individual project can check with EVOA for a final statement, that the material is not considered waste;
Post-consumer (clean) wood waste from within the Netherlands is waste until the moment of further processing. It should be destined for useful recovery, which includes both material recovery and energy use as main use;
In all cases, the energy plant receiving the feedstock should have the right permit, which allows the burning of certain types of feedstock.
2.3 Belgium
2.3.1 Flemish Regulation on Waste
The VLAREA (Flemish Regulation on Waste Prevention and Management)
implements most of the provisions of the Belgium Waste Decree. The waste policy
in Flanders is performed on the basis of different implementation plans. Biomass is
discussed in several of them, including the Implementation Plan on Wood (OVAM,
2010). The Implementation Plan on Wood 2004-20083 covers (OVAM, 2010): Secondary processing of wood waste (plate production, wood processing); Wood waste from the final processing: wood waste that is released during the
production of furniture, packaging, timber, joinery; Wood waste from businesses: construction and demolition wood, packaging,
furniture; Wood waste from households: construction and demolition wood, furniture,
garden wood such as wood fences or wood garden houses;
Wooden railway sleepers.
OVAM judges whether or not a substance is categorized as waste. The following
wood streams are not addressed in the Implementation Plan on Wood (OVAM,
2010): Short-rotation wood (wood grown for the purpose of energy): not regarded
waste; Residual wood released during logging and maintenance of forests: this is not
considered waste; Wood waste form primary processing: the wood waste from sawmills and
veneer companies that exploit their raw materials directly from the forest: this untreated wood should be defined as 'waste' but is not further discussed because there is no need for planning or actions for responsible further processing;
Green waste (including thinnings): covered under organic waste materials.
In addition, OVAM also prescribed to the VREG (see below) that wood pellets are
not considered waste either (ODE, 2010), provided they meet the DIN standard4,
the Önorm or the Belgian product standard (in development).
3 Implementation Plan is not renewed since 2008. Remains valid until a revision is published.
4 See for specifications: http://www.biomassenergy.gr/en/articles/technology/biomass/79-biomass-pellets-
specifications-and-quality-standards
Competition in wood waste: inventory of policies and markets [April 2013]
Pagina 15 van 55
It is recognized that biomass, as part of the renewable energy targets, offers a
large potential for energy production. It is also recognized that this places
(possibly) recycling of certain waste streams under strong pressure. VLAREA has
therefore included various restrictions on the burning of biomass (OVAM, 2010). It
is forbidden to process the following wastes for incineration in an establishment
that is located in a Flemish Region (OVAM, 2010): 1. Selectively collected streams that are eligible for material recycling. This
prohibition is not valid for the burning of the following wastes, provided they
have a caloric content > 11 500 kJ/kg, for the generation of renewable energy:
Vegetable waste from agriculture and forestry; Vegetable waste from the food industries; Fibrous vegetable waste from sorting, screening and washing the raw pulp
and paper production; Wood; Waste cork.
2. Unsorted industrial waste; unsorted household waste.
2.3.2 Decree on Green Power (VREG)
Article 5 of the Green Power Decree lists biomass as a renewable energy source to
receive green certificates. Green certificates are granted to restricted categories of
biomass (VREG, 2008) and coupled to receiving subsidies.
The following wood waste streams are eligible for green certificates in the Flemish
region (VREG, 2008): Short rotation wood: always entitled to green certificates; Wood / timber waste flows that are not used as industrial raw material, thus not
eligible for material recycling; Wood fraction in organic residue waste: only entitled to green certificates when
the installation has an energy recovery PEB (primary energy) of ≥ 35%; Any other timber flows: always entitled to green certificates.
These wood flows must be used in an installation where the urban and
environmental applications are submitted after June 1, 2007. Wood flows that are
industrial raw material can only receive green certificates if they are processed in
old installations or installations with no environmental license (which will not be
common practice).
In all cases, the energy plant must have the permit to use certain wood streams
for burning. Electricity production from wood waste will only receive green
certificates when its combustion is admitted according to the sectoral
implementation plan.
Wood flows that are not considered industrial raw material are consisting of
(VREG, 2008) bark, dust, fine pruning, twigs and trugs, all with size and diameter
specifications. In addition, other wood flows are not considered industrial raw
material in case Cobelpa and Fedustria declare that they are not used as industrial
raw material (derogation of legal conditions). Fedustria represents the textile,
woodworking and furniture industry’s companies. Cobelpa is the association of the
Belgian pulp, paper and board industries. Additionally, Fedustria has made an
agreement with electricity producers - and in particular with Electrabel - that a
guarantee must be given for the supply of wood from abroad that it does not come
from regions where the timber industry buys its raw materials. Nonetheless, price
competition has developed; see also section 3.3 of this report (De Standaard,
2010).

Competition in wood waste: inventory of policies and markets [April 2013]
Pagina 16 van 55
Applicants for Green Certificates have to proof, on the basis of an audit report,
that a particular timber flow falls under "wood flows that are not used as industrial
raw material". This is prepared by an accredited inspection body (VREG, 2008).
Thus, wood waste that is suitable as raw material for the production of e.g.
chipboard cannot be used to produce green electricity. De Standaard (2010)
mentions that only contaminated wood wastes are used for green electricity in
Flanders.
Conclusions: The destination of clean wood waste in Belgium is in principle raw material for
industry, unless it is not considered of use. Contaminated wood waste can be used for the energy market;
There is a negotiation with Fedustria and Copelba about the sourcing of material to avoid competition in resources;
Imported wood energy pellets are not considered waste in Belgium when they meet the DIN standard. This is the general norm for industrial pellets to place them on the market;
In all cases, the energy plant needs to have the right permits to burn wood
waste (or energy pellets).
2.4 United Kingdom (UK)
2.4.1 UK legislation on wood waste
The waste management hierarchy from the EU Waste Framework Directive was
transposed into UK law, through the Waste (England and Wales) Regulations in
2011. The hierarchy of waste management follows this order: prevention,
preparing for re-use, recycling, other recovery (e.g. energy recovery through
incineration and pellet production), and disposal (see also figure 1). Except for
lower grade wood waste, energy recovery is considered in this case a better
environmental option than recycling.
The legislation gives a differentiation for the suitability of disposal between grade
A wood waste, mixed grade wood waste (grade B), and lower grade wood waste
(grade C) (DEFRA, 2008). Concerning grade A wood – which is clean wood – the
hierarchy stated above is the most appropriate pathway to follow, as this wood
waste is highly suitable for recycling and energy recovery. Concerning mixed
grade wood, the suitability for recycling is medium, as is the energy recovery
suitability, but still the mentioned hierarchy may prevail.
Table 1: Suitability of methods of disposal for grades of wood waste. (DEFRA, 2008)
Grade Recycling Energy recovery Landfill
Grade A High High High
Mixed grade (B) Medium Medium High
Lower grade (C) Low Medium High
When collected and sorted, grade A wood waste shall go to higher value markets,
as agriculture for animal bedding, panel manufacturers, and any incineration

Competition in wood waste: inventory of policies and markets [April 2013]
Pagina 17 van 55
plants. Grade B wood waste shall go to panel manufacturers and WID (Waste
Incineration Directive) compliant incineration plants (PAS, 2012).
Recovering energy from wood waste, through burning, is covered in the Waste
Incineration Directive. Plants that only use clean wood (grade A) are exempted
from their requirements. Clean wood, exempted from WID’s requirements, should
be fully clean, covering both the feedstock and production processes (treatments).
Pallets are considered clean wood, even in case pallets get contaminated
unintentionally or accidentally. Contaminated wood – grade C in particular – can
be segregated and send to either a WID-approved plant for energy recovery or an
energy-from-waste plant approved by the Integrated Pollution Prevention and
Control (IPPC).
It is important to note that there are currently no penalties, nor incentives linked
to applying the hierarchy in UK legislation, except for the landfill tax – which
stimulates the uptake of wood waste in previous stages than landfill (DECC,
DEFRA, Environment Agency).
2.4.2 What is waste?
Wood waste (UK produced or imported) may be considered a waste, residue or
product, based on its source:
Wood waste, used for other purposes (e.g. pallets) first and then discarded, is
considered waste;
Branches, thinnings, sawdust (e.g. by-products), are considered residues (no
waste and no product);
Wood waste out of forest management (e.g. cut trees) for energy purposes
only, are considered products.
Pellets, produced out of wood waste may be considered a product, when the waste
is understood to have ceased to be waste (see end-of-waste criteria). DEFRA
provides guidance on the legal definition of waste (see figure 3). This figure shows
the questions from which it is decided whether waste (or pellets produced out of
waste) may be considered not waste anymore.
It must be stated that when energy plants wish to use pellets (either imported or
UK produced) for their generation, the sourcing of the feedstock needs to be
reported to the UK government (Ofgem) – as a sustainability check.

Competition in wood waste: inventory of policies and markets [April 2013]
Pagina 18 van 55
Figure 3: When does waste cease to be waste? (DEFRA, 2012)
2.4.3 UK legislation on imported pellets for energy
Based on personal consultation with the UK Environment Agency, imported pellets
that are produced out of wood waste, are still considered waste and hence need
prior written consent before being imported. This is achieved through (1) applying
with the relevant fee to the UK Environment Agency; (2) draw up contracts for
recovery of waste with the business in the UK that will receive and recover the
waste; (3) arrange assurance against liability for damage to third parties; and (4)
obtain all necessary permissions from the competent authorities in all countries
concerned.
2.4.4 UK regulations pushing biomass and pellet supply and use
Current regulations that push the uptake of biomass for electricity and heat
generation in the UK, include the following:
The Renewables Obligation (RO; introduced in 2002, revision in 2013): this
mechanism provides for an obligation to licensed electricity suppliers, to
generate a certain – increasing – amount of their electricity from renewable
sources. Generators receive saleable certificates (ROC) for their eligible
renewable electricity generated. This gives them the opportunity to receive a
premium, on to the electricity prices, when producing renewable electricity.

Competition in wood waste: inventory of policies and markets [April 2013]
Pagina 19 van 55
Non-compliance to the obligation results in a penalty – buy-out price – paid by
the generator;
Electricity Market Reform (introduced in 2012): this reform stimulates
investments in low carbon electricity generating technologies, through Contracts
of Difference that ensure predictable revenue streams, that in turn encourage
investments;
Feed-in Tariff (introduced in 2010): the FIT scheme applies to small-scale low
carbon electricity generation and use. It is a financial support on the
investments in low-carbon technologies;
Climate Change Levy (introduced in 2001, revision in 2013): provides for a tax
on energy produced (and indirectly on consumption) from fossil fuels. It
exempts energy generated out of renewable sources, such as wood pellets;
Renewable Heat Incentive (RHI) (introduced in 2001): implemented to support
the uptake of renewables, as pellets, in the generation of heat. The scheme
provides financial incentives to organizations. The government is also working
on the implementation of the RHI for households. The Renewable Heat Premium
Payment scheme provides financial support to investments in renewable heating
technologies – i.e. pushing the use of pellets for heating.
Conclusions:
Following consultation with the UK Environment Agency, imported pellets – that
are made out of wood waste – are still considered waste and need prior written
consent by the Environment Agency before imported;
The use of solid biomass (including waste and pellets) requires information
about the source of origin of the waste from a sustainability perspective;
The hierarchy used for (wood) waste management in the UK for grade A and B
follows the pathway of re-using, recycling, energy-recovery, to finally end up as
landfill;
Comparing wood waste use in the conventional wood industry with the use of
wood waste for wood pellets and energy recovery – with the knowledge that the
waste management hierarchy is not obliged through penalties/incentives – for
both A and B wood waste, energy recovery will need to compete with the
material recovery by the conventional industry (i.e. animal bedding and panel
manufacturing).

Competition in wood waste: inventory of policies and markets [April 2013]
Pagina 20 van 55
3 Trends in supply and demand and its market players
This chapter looks at the trends in demand and supply of the wood waste (pellets)
market in Europe, the Netherlands, Belgium and the UK, as well as the most
important business drivers, taking into account the major disposers and end-
users.
International timber statistics (UNECE, FAO, Eurostat) make a distinction between
used wood and industrial residue wood (Probos, 2007):
Residue wood involves clean material as sawdust, shavings, sawdust and a
stream of short wood;
Used wood is defined as wood that is released at the end of the lifetime of a
product. Used wood can be distinguished in three categories: A, B and C wood.
3.1 Europe
3.1.1 Trends in supply and trade of (clean) wood waste
Taken together, the EU-27 Member States plus Croatia, Norway and Turkey
generated some 2.6 billion tons of waste in 2008, or roughly 5.4 tons per person,
of which around 3.7 % is hazardous. In general, 32% of the waste generated in
the EEA countries is from construction and demolition activities.
Figure 4: Wood wastes (under category hazardous waste) from manufacture of wood and of
products of wood and cork5 in the EU-25 from 2004-2010 in tons (EUROSTAT)
Overall, and taking into account the limited data, the trend shows growing or
stabilizing amounts of hazardous and non-hazardous waste in the EU (EEA, 2012).
Part of the hazardous waste is wood waste – which is not clean. Figure 5 shows
that most of the hazardous wood waste in the European region is used for energy
recovery and incineration.
5 Except furniture; manufacture of articles of straw and plaiting materials

Competition in wood waste: inventory of policies and markets [April 2013]
Pagina 21 van 55
Figure 5: Treatment of wood waste (hazardous) in 2010 for EU-27. (Eurostat)
Based on empirical research from EUwood (2010), the total supply of post-
consumer wood waste in 2007 in the EU-27 is estimated to be 55.4 M m³ (M =
mega). EUwood (2010) shows regional differences regarding the potential volume
per capita:
Eastern and Southern European countries generate lower volumes of post-
consumer wood waste, compared to the other regions;
Also, Northern and Western European countries have a relatively high rate of
re-use of post-consumer wood compared to the other regions.
In 2007, 36 Mm³ post-consumer wood waste was used for panel production and
for energy. Thus, about two thirds of the generated post-consumer wood waste is
recovered. Table 2 shows that especially clean wood waste was recovered for
particleboard production (18.1 Mm³).
Table 2: Rates of supply, recovery and end-use of post consumer wood waste 2007. (EUwood,
2010)
Supply and end-use Volumes in M m3
Supply of post-consumer wood waste 55.4 55.4
Recovery rate
Destined for particle board production
Destined for energy use
36
18.1
16.9
Disposed volume of post-consumer wood waste
From which land-filled
20.4
17.5
In 2007, a third of the total generated post-consumer wood waste (20.4 Mm³)
was not used in the EU-27. In Eastern- and Southern European countries as well
as in UK and Ireland the majority of post-consumer wood waste, approximately
17.5 M m³, was landfilled. The Northern and Western European countries have a
higher rate of re-using post-consumer wood waste. The post-consumer wood
waste in these regions is used as a resource for the panel industry or other
material uses, or for the production of energy (EUwood, 2010).

Competition in wood waste: inventory of policies and markets [April 2013]
Pagina 22 van 55
Figure 6: Estimated trend of post-consumer wood potential (POT), use (USE) and disposal
(DIS) to 2030 based on scenario analysis. (EUwood, 2010)
EUwood (2010) estimates the potential, use and disposal of post-consumer wood
waste for different scenarios, to 2030. Based on these scenarios, the volume of
post-consumer wood waste, which is landfilled, is expected to decrease strongly
(figure 6)6. The quantity of wood waste that is recycled will increase in the future,
but the generated total volume of wood waste is not influenced by this (EUwood,
2010).
Non-hazardous wastes (including wood waste) can be traded between EU Member
States and imported into the EU without any prior notification procedure if they
are destined for recovery, see also section 2.1 of this report (EEA, 2012a). Trade
in wood waste has increased steeply. Since 2003, EU imports of wood waste have
exceeded exports (EEA, 2012a).
3.1.2 Primary disposers of (clean) wood waste
Post-consumer wood includes all kinds of wooden material that is available at the
end of its use as a wooden product. It mainly comprises packaging materials,
demolition wood, timber from building sites, and fractions of used wood from
residential (municipal waste), industrial and commercial activities. The primary
sources for post-consumer wood in Europe are (EUwood, 2010):
Municipal solid wood waste mainly from households;
Construction waste and demolition wood;
Fractions of used wood from industrial and commercial activities (primarily
packaging materials, including pallets).
The generation of construction and demolition wood waste is closely related to
economic activity in the construction sector (EEA, 2012). Historically, the
construction sector has been the primary catalyst for the demand of forest
products. UNECE mentions that the housing market in Europe and in the USA has
not yet shown any strong recovery from the housing crash of 2006 and the global
economic recession of 2008 (UNECE, 2012).
6 The EU Landfill Directive 1999 set targets for the quantity of biodegradable municipal waste (BMW) that each EU
member state can send to landfill

Competition in wood waste: inventory of policies and markets [April 2013]
Pagina 23 van 55
Industrial timber residues are not defined as waste. They are an important
resource for energy wood pellets and therefore shortly discussed here. Supply of
industrial residues is directly dependent on the input of raw material and the
output of products in the forest industries.
By-products from sawmills include e.g. chips, dust and slabs. Low-grade hardwood
is most often used for industrial applications including pallets. Overall market
conditions for European sawn hardwood deteriorated in the second half of 2011
and showed little improvement in the first half of 2012 (UNECE, 2012).
Some trends observed by (UNECE, 2012) for the roundwood, softwood and
hardwood market are:
Wood raw material market: removals of industrial roundwood in the UNECE
region increased by 2.4% in 2011. Since 2009, industrial roundwood harvests
have risen by 12%, a significant recovery after the more than 30% plunge that
occurred between 2007 and 2009 (UNECE, 2012);
Sawn softwood market: European sawmills continue to find themselves
squeezed between a persistently high raw material cost and depressed global
market prices for sawn wood (UNECE, 2012);
Soft hardwood market: stagnant low figures – compared to the situation before
the economic crisis.
Other industrial wood residues include wood residues from production of semi-
finished wood products as well as from further processing of manufactured wood
products (construction, furniture, etc.). Residues from semi-finished products
include residues from e.g. wood-based panels (fibre board, particle board, veneer
board). Figure 7 shows the shares of considered wood-based panels on production
and their share on the total volume of other industrial wood residues.
Figure 7: Volumes of other industrial wood residues in the wood-based panel industry
segments. (EUwood, 2010)
Residues from manufactured wood products come from the utilisation of sawn-
wood and wood-based panels in construction, furniture industry, packaging and
other processing of semi-finished wood products. Compared to production of semi-

Competition in wood waste: inventory of policies and markets [April 2013]
Pagina 24 van 55
finished wood products the share of wood residues from manufacturing processes
is higher (EUwood, 2010). The share of other industrial wood residues from
construction, furniture industry, packaging industry and other further processing
industry is shown in table 3.
Table 3: Shares of residues in further processing industry branches. (EUwood, 2010)
Industry branch Share in %
Construction 10.3
Furniture industry 18.4
Packaging industry 9.7
Other 13.0
UNECE mentions that 2011 and the first half of 2012 proved difficult for paper and
paperboard producers in all markets, as the recovery from the 2008 financial crisis
stalled. The wood fibre consumption by the European pulp industry remained
practically unchanged (+0.9%) in 2011 from the previous year. Approximately
20% of fibre consumed in Europe was imported (UNECE, 2012).
3.1.3 Trends in markets, demand (and prices) of (clean) wood waste
EEA (2012a) mentions that imports of wood waste are primarily driven by the
large demand of the particleboard industry for wood material, especially in Italy,
as well as by an increasing demand of biomass-fuelled power plants. Driven by
policies for renewable energies and landfill bans for wood, biomass-based power
plants seek fuel wood from sources outside national borders. Energy production
from solid biomass grew by more than 50% between 1995 and 2008, resulting in
competition for wood waste across Europe.
UNECE (2012) also mentions that the EU policies for renewable energy increased
competition, and thus prices, for wood fibre. Prices for wood energy feedstock
have increased. The Economist (2013) mentions that wood pellet prices rose from
$116 a tonne in August 2010 to $129 a tonne at the end of 2012. Prices for
hardwood from western Canada have risen by about 60% since the end of 2011.
Although the bioenergy sector business model does not include saw logs as a raw
material for power and heat generation, (UNECE, 2012) mentions that it is
impossible to isolate a new demand for a certain part of the quality gradient of the
fibre resource, as it causes a chain reaction throughout the total wood supply
system.
Particleboard and medium density fibre board are manufactured primarily from
wood residues from production of lumber and plywood. The board industry is
concerned that the availability of wood residues is not keeping pace with demand
and that the price is increasing. This has led some producers to look toward
alternative sources of fibre, such as agricultural waste products and wood and
paper waste (UNECE, 2012). Clearly, this is also an interesting resource for the
energy market.

Competition in wood waste: inventory of policies and markets [April 2013]
Pagina 25 van 55
The price rise movement in raw material for pulp production has taken place in
Europe since the end of 2009 for the majority of softwood and hardwood species.
The growing competition of “wood for energy” is also visible (UNECE, 2012).
3.1.3.1 The energy wood pellet market
The world production volume of wood pellets was about 14 million tons in 2010
with US, Canada and Scandinavia among the largest producers. Between 2008
and 2010, wood pellet production in the EU increased by 20.5% and was
estimated to meet about 81% of the EU demand for pellets. Wood pellet
manufacturing in the EU has grown every year, with exception of 2009 because of
the economic crisis (UNECE, 2012).
The countries that are most involved in the trading of industrial wood pellets
within the EU are (Pellcert, 2012):
Concerning users: Belgium, Netherlands, United Kingdom, Sweden and
Denmark;
Concerning suppliers: Germany, Lithuania, Estonia, Latvia, Portugal, Finland
and Sweden.
Figure 8: Major wood pellet markets in Europe in 2009 (kton). (Sikkema et al., 2011)
The balance of import and export of wood pellets gives an idea of the major
players in Europe. Figure 8 shows that both Belgium as well as the Netherlands
largely rely on the import of wood pellets to meet demand in the energy market
(Sikkema et al., 2011).
3.1.3.2 The conventional wood industry
Following the severe economic downturn, the wood-based panels industry has
been slowly returning to better market conditions. It continued to face significant
increases in the resin and energy cost, see figure 9 (UNECE, 2012).
The Economist (2013) mentions that about 20 large saw mills making
particleboard for the construction industry have closed in Europe during the past
five years. Higher wood prices are hurting pulp and paper companies, which are
already in bad shape: the production of paper and board in Europe remains almost
10% below its 2007 peak.

Competition in wood waste: inventory of policies and markets [April 2013]
Pagina 26 van 55
Figure 9: indices of primary input costs for wood-based panel production in Europe 2007-2011.
(UNECE, 2012)
3.1.4 Key drivers in demand (clean) wood waste
The two main drivers for particleboard production are the furniture industry and
the construction sector (UNECE, 2012). The housing market is not recovered from
the European recession. This, combined with high feedstock prices, puts pressure
on the timber industry.
The EU is the world’s largest market for wood energy, and imports of woody
feedstock continue to grow. The wood pellet market is growing strongly in Europe
due to incentives for biomass power and heat from local authorities (Pellcert,
2012).
Renewable energy policies result into growing demand for wood for energy. This
(amongst others) drives up the costs of woody feedstock resources – which puts
pressure on companies that use wood as an input. The woodworking
manufacturers feel that they are put at a disadvantage, with arguments related to
the incentives provided to the wood energy sector in order to meet EU renewable
energy targets (UNECE, 2012).
Conclusions:
Potential from wood waste is available, mainly due to diverting wood waste
from landfills to recovery;
There is an increasing demand for wood waste and energy pellets, mainly
driven by the energy sector (and related subsidies);
Meanwhile, the traditional timber industry is coping with slowly recovering
markets and increasing feedstock prices – wood waste being an interesting
alternative.
3.2 Netherlands
3.2.1 Trends in supply and trade of (clean) wood waste
Table 4 shows that the total estimated amount of used wood and residue wood in
2007 is estimated at 2,125 kton, of which 1,485 kton used wood. Although
production remained stable, there is a decrease in the export of used wood from

Competition in wood waste: inventory of policies and markets [April 2013]
Pagina 27 van 55
2007 and 2010. Besides this, there is a strong decrease in the import and
consumption of wood waste from the wood processing industry.
Table 4: Production and consumption data for used wood and wood waste from industry.
(Probos, 2010, 2011 and 2012)
Used wood A, B and C (in kton) Wood waste from wood
processing industry (in kton)
Year 2007 2010 2007 2011
Production 1485 1395 640 540
Import 70 80 1120 355
Export 1160 710 390 474
Consumption 395 765 1370 421
The production and consumption of roundwood in the Netherlands has recently
shown a recovery, after years of decrease. In the Netherlands, wood is mainly
destined for the paper and cardboard industry (48%), followed by sawn timber
(32%) and the board industry (16%) (Probos, 2012).
3.2.2 Primary disposers of (clean) wood waste
In the wood waste market a number of main "primary disposers" can be
distinguished. Only those are included in table 5, which represents a substantial
flow of used wood.
The industrial residue timber market is less complex than the market of used
wood. Around 20 wood fibre traders are active for the collection of residual wood
from the forest industry. This includes clean materials as wood shavings, sawdust,
wood dust and – as specific stream – short wood. Short wood is also often
indicated as used wood (A-wood) (Probos, 2007).
Within the residue wood category, one can distinguish between the residue wood
released by roundwood processors (also called "fresh" wood waste) and residue
wood originating from wood fibre companies (planing and joinery industry) - with
lower moisture content (12-15%) than fresh wood (Probos, 2007).
Fresh wood residues from wood processing companies:
The Netherlands had around 70 roundwood sawmills in 2007, which processed
around 587,000 m3 of roundwood (see table 7). This is 85% of the total
generated residue wood from this category.

Competition in wood waste: inventory of policies and markets [April 2013]
Pagina 28 van 55
Table 5: Primary disposers of used wood in the Netherlands. (Probos, 2007)
Disposers Waste types
Households Bulky household waste contains a considerable amount of wood. Often, this
wood is separated as A, B, and C timber and stored into separate containers.
This collection explains the growth in B timber waste of the recent years.
Enterprises (waste) This waste is generated by industry. Large companies often collect their waste
separately in separate containers. This leads to a considerable stream of A
timber (packaging timber and clean production wood from the wood
industry).
Construction and
demolition waste
In large construction and demolition projects, waste is selected and
separately removed. The containers often include separate A-and B-wood.
Smaller renovations often use mixed containers; sorting takes place partly
manually and partly mechanically further onwards. This often results in the
collection of mainly B-wood, virtually no A-and C-wood.
Trade, services and
government
This includes industrial waste from the office, retail and services sectors. This
is a broad waste stream and mixed collected. Wood that is available here is
mainly packaging timber (A-wood).
Table 6: Amount of industrial residue wood in 2003 (Probos) and 2005 and 2006 (CBS data;
Probos, 2007) in kton. Differences in trends partly explained by different data sources.
Sector 2003 2005 2006
Primary woodworking 290 39 29
Manufacture of veneer and chipboard materials - 3 8
Manufacture of carpentry 162 143 111
Manufacture of wooden containers 67 18 38
Manufacture of furniture 21 7 3
Manufacture of other products of wood 620 257 238
Dry wood waste collected by wood fibre companies:
In 2007, around 351,kton of dry industrial residue wood was collected in the
Netherlands (Probos, 2007), including mainly white sawdust and curl (48%) and
brown sawdust and curl (30%). In addition, 78.5 kton of industrial residue wood is
imported yearly to the Netherlands – mainly from Belgium and Germany. This
gives a total amount of 430 kton of collected residue wood for 2007 (Probos,
2007).

Competition in wood waste: inventory of policies and markets [April 2013]
Pagina 29 van 55
Table 7: Processed amount of roundwood and the amount of residue wood in 2007 (Probos,
2007). Figures are presented in tons residue wood with a moisture content of 50%.
Roundwood processors Processed
roundwood in m3
Residue wood
in ton
Percentage of
total
Sawmills 587.011 259.944 85%
Clog manufacturers 12.872 6.324 2%
Impregnated wood to extend lifetime 36.643 15.162 5%
Paper and cardboard industry 113.839 12.526 4%
Pile manufacturers 27.300 200 0%
Sawmills (tropical wood) 34.571 11.940 4%
Total 810.236 306.096
3.2.3 Trends in markets, demand (and prices) of (clean) wood waste
Figure 10 shows the market of used and industrial residue wood waste. Important
end-users of wood waste are the chipboard industry and the energy market.
Figure 10: Market of used wood and industrial residue wood. (Probos, 2007)

Competition in wood waste: inventory of policies and markets [April 2013]
Pagina 30 van 55
Figure 11: Flowchart of Dutch consumption A, B, C wood and residue wood in kton (A, B, C
wood: data are underlined, residue wood: data are italic). Based on data Probos (2007).
Figure 11 shows the numbers that are connected to the market of used wood in
the Netherlands, based on 2007 (Probos, 2007).
3.2.3.1 Used wood
Three main final consumers can be distinguished in the market for used wood (for
all categories) (Probos, 2007):
Chipboard industry: fully present abroad;
Energy companies: domestic and abroad;
Wood enterprises: charcoal producers, wood briquettes and pressed shaped
timber (especially pallets and pallet blocks). All need for their production clean,
untreated wood. This is ‘A wood’ or residual wood from the wood industry.
1160 kton of used wood was exported in 2007, decreasing to 710 kton in 2010.
Most of this used wood was exported to Germany, followed by Belgium. Figure 12
shows a continuing growing demand of used wood for the energy market in the
Netherlands since 2007. The consumption of used wood for materials is stable.
The energy market thus mainly drives the total growing consumption of used
wood.
Pallet producers have indicated in a report from Probos (2013) that they prefer to
use fresh and clean resources for their materials, being somewhat averse to the
use of used or waste wood.

Competition in wood waste: inventory of policies and markets [April 2013]
Pagina 31 van 55
Table 8: Export of used wood from the Netherlands in kton for the years 2005, 2006 and 2007
– divided into material use and energy use. (Probos, 2007)
Material use Energy use Material and energy use
Country 2005 2006 2007 2005 2006 2007 2005 2006 2007
Belgium 91 167 219 3 5 10 94 171 230
Germany 244 340 313 445 555 582 689 895 895
France 1 2 1 2
Italy 51 18 4 51 18 4
Sweden 47 52 31 47 52 31
UK 4 4
Total 391 527 536 495 612 623 886 1138 1160
Figure 12: Consumption of used wood in the Netherlands (Probos, 2012) and use for material
and energy.
3.2.3.2 Industrial residue wood
There is direct exchange in products from the fibre companies to the final
consumer, domestically and abroad. Sawdust and shavings go to the agricultural
industry, and also in small packages to consumers for pets. The chipboard
industry abroad buys sawdust and remainder pieces. There is an increasing supply
to power plants (Probos, 2007).
Fresh wood residues from wood processing companies:
Part (4%) of this residue wood waste from roundwood sawmills is used internally
for energy. The remainder of the volume is destined for other markets, mainly the
energy and chipboard industry.

Competition in wood waste: inventory of policies and markets [April 2013]
Pagina 32 van 55
Dry wood waste collected by wood fibre companies:
In total, 217 kton of residue wood (47% of the total) is used as fuel for energy
generation in 2007. The majority (85%) is pressed into pellets. A small part of the
residues is used for the chipboard industry, fully destined abroad (Probos, 2007).
Table 9: Destination final products from residue wood from wood processing industry 2007
(Probos, 2007). *Difference explained in the report because of data uncertainties.
Product Sale Netherlands (kton) Export (kton) Total (kton)
Litter 145,5 71 216,5
Energy 130 87 217
Chipboards - 28 28
Total 275,5 168 461,5*
3.2.3.3 The energy wood pellet market
The feedstock potential within the Netherlands for the production of wood pellets
(sawdust or shavings) from domestic industries is rather limited. Residues (waste)
from (re)-sawing processes of coniferous species (mostly spruce and pine) and
white deciduous species (mostly poplar) are fully dedicated to other destinations.
Such destinations are, for example, the particleboard industry in Belgium and the
extensive Dutch dairy sector (stable litter).
Table 10: Use of energy wood for renewable energy (excl. private stoves) in 2007 and 2011.
(Probos, 2012)
In ktons Fresh wood Industrial residue wood /
wood pellets (2011)
A, B and C wood
2007 2011 2007 2011 2007 2011
Production 425 500 340 130 755 985
Import 0 0 825 1270 0 80
Export 200 250 (estimation) 290 65 625 500
Consumption 225 250 875 1335 130 565
Wood pellets in the Netherlands are mainly used for co-firing and almost entirely
handled as bulk. The use of wood pellets has increased from 450 kton in 2006 to
790 kton in 2008. Other important biomass fuels were wood waste, agricultural
residues and various other waste streams. Figure 13 shows that the majority of
the consumed wood pellets are imported from abroad (IEA Bioenergy Task 40,
2010).

Competition in wood waste: inventory of policies and markets [April 2013]
Pagina 33 van 55
Figure 13: pellet flows in the Netherlands 2001-2008 (Utrecht University)
3.2.3.4 The conventional wood industry
Board consumption in the Netherlands has remained relatively constant in the last
years. Around 1240 km3 has been consumed in 2009, from which only 46 km3
has been produced within the country. In total, 1495 km3 of boards have been
exported and 302 km3 imported. Table 11 shows the most important trading
countries of chipboards and fibreboards: Germany and Belgium and, recently, the
UK.
Table 11: Important trading counties of boards (in %) for the Netherlands. (Probos, 2012)
Country of origin Country of destination
2009 2011 2009 2011
Germany 38 33 Germany 32 35
Belgium / LUX 31 32 Belgium / LUX 37 29
UK 10
3.2.4 Key drivers in demand (clean) wood waste
In the Netherlands, most of the co-firing plants still have access to the previous
subsidy scheme MEP, although these will end for most plants between 2012 and
2015. The government has, however, made clear intentions to consider a mandate
of co-firing on biomass at all existing coal fired power plants (new ones excluded).
This obligation would result in suppliers searching the market to find out where
they can find green energy most cost-effective and sustainably (Pelletcert, 2012).
The Dutch packaging and pallet industry processes annually more than 1 million
m3 of softwood to pallets, boxes, crates and industrial packaging. According to the
Dutch Packaging and Pallet Industry Association (EPV), the pallet industry is under
pressure from rising timber prices and lower volumes. The current crisis has
caused a decrease in demand for wooden pallets, boxes and packaging in 2013
(Houtwereld, 2013).
At this moment, the market conditions are not favourable for large-scale and more
high-quality recycling of recycled wood by waste companies and waste collectors

Competition in wood waste: inventory of policies and markets [April 2013]
Pagina 34 van 55
for the use of the conventional timber industry. Main reason is the high cost
(Probos, 2013).
EPV and the Platform ‘Wood in the Netherlands (PHN), have signed a Green Deal
with the government. In this Deal, the parties agree to stimulate the combustion
of wood waste on their production facilities and to remove potential obstacles for
this7.
The chipboard industry in the Netherlands is largely characterized by import and
export flows, with limited production within the country.
Conclusions:
There is an increasing demand for wood waste, mainly driven by the energy
sector;
Demand for wood pellets (largely imported) is increasing;
Consumption of wood waste for material use remains constant. One of the
largest markets, the chipboard industry, is mainly abroad;
The market conditions for the use of recycled wood for the conventional timber
industry are at this moment not favourable because of high costs.
3.3 Belgium
3.3.1 Trends in supply and trade of (clean) wood waste
Wood waste production in Belgium has slightly increased in the last years, while
wood packaging waste has remained fairly constant (see figure 14). Most of the
wood packaging waste (no quality defined) is used for energy. The trend in use for
recycling and energy goes hand in hand and its ratio distribution remains constant
over time.
Figure 14: Wood packaging waste production and recycling rates in Belgium. (Statistics Office,
2013)
3.3.2 Primary disposers of (clean) wood waste
Wood waste comes mainly from the following sectors (OVAM, 2010):
Primary processing (sawmills, veneer companies);
Secondary processing (furniture, sheet metal production);
7 See also: https://zoek.officielebekendmakingen.nl/stcrt-2012-16773.html

Competition in wood waste: inventory of policies and markets [April 2013]
Pagina 35 van 55
Households (furniture, demolition wood);
Businesses (packaging timber, construction and demolition wood).
Waste from households and businesses usually consist of a heterogeneous mass of
various wood wastes (OVAM, 2010).
Table 12: Wood waste production 2006 Flanders (OVAM, 2010) in tons.
1) Wood waste is also used by households themselves (estimates up to 100.000 tons), 2) OVAM
(2010) indicates that no large fluctuations are expected in numbers in the coming years.
2004 2005 20062
Industry 900.000 – 1.000.000
Primary processing 431.500 521.700 506.000
Companies excl wood sector 400.000-500.000
Households1 232.000 – 245.000
3.3.3 Trends in markets, demand (and prices) of (clean) wood waste
The wood waste market in Flanders has a strong international focus. Flanders
imports large quantities of wood, mainly for chipboard production. Imports and
exports of untreated wood fall under the Green list regime (see also 2.1 of this
report), which means that concrete information about these flows is missing
(OVAM, 2010). Figures 15 and 16 show the amounts of treated wood waste. This
is also imported in large quantities, mainly from the Netherlands, France and
Germany (OVAM, 2010).
In 2007, 6.187 tons of wood waste was imported from the Netherlands and France
for energy use in Flanders, while 204,509 tons were imported for recycling in the
chipboard industry. In 2008, 6834 tons of wood waste for energy recovery and
158.353 tons for recycling were imported (OVAM, 2010).
Figure 15: Import and export of treated wood waste for energy use. (OVAM, 2010) Import:
Blue, Export: Red.

Competition in wood waste: inventory of policies and markets [April 2013]
Pagina 36 van 55
Figure 16: Import and export of treated wood waste for material recycling. (OVAM, 2010)
Import: blue, Export: Red.
In 2007, 35.540 tons of wood waste was exported to Sweden, Germany and
France for energy recovery and 76.509 tons for recycling (Netherlands). In 2008,
40.761 tons of wood waste for energy recovery was exported – mainly to
Germany. In the same year, 53.962 tons of wood waste was exported for
recycling in the Netherlands and Germany (OVAM, 2010).
Table 13: Destinations of wood waste. (OVAM, 2010)
1) Secondary waste: results from the processing of waste. In other words: nature and
composition of waste has been changed by a pre-treatment method (recycling centers, waste
processors, etc.).
In kilo ton 2004 2005 2006
Total 1073.9 1343.0 1278.1
Deposit 1.5 0.3 1.8
Incineration 186.8 304.0 177.6
Recycling 457.5 492.2 558.1
Secondary raw material 1.9 0.6 0.6
Conditioning 426.2 545.9 540.0
Harmless 1051.9 1280.1 1221.6
Dangerous 22.0 62.9 56.5
Primary 799.4 926.7 813.9
Secondary 1) 274.5 416.3 464.2

Competition in wood waste: inventory of policies and markets [April 2013]
Pagina 37 van 55
The two most important markets for wood waste in Belgium are chipboard
production and energy recovery (OVAM, 2010). Curls and natural wood shavings
are used as raw material in the chipboard industry, or sold as litter to households
and farmers. Since a few years, this waste is increasingly used as a feedstock for
the production of pellets and briquettes (OVAM, 2010).
3.3.3.1 The energy wood pellet market
Total pellet consumption in Belgium in 2008 was 920,000 tons of which around
800,000 tons were industrial pellets consumed for power production. Electrabel
(GDF Suez) is the major consumer of industrial wood pellets in Belgium (Pellet
Atlas, 2009). Table 14 shows some examples of licensed installations for wood
incineration in Belgium.
Table 14: Some examples of licensed installations for wood incineration. (OVAM, 2010)
1) No waste product.
Name Source wood waste Ton/yr (max!)8
Electrabel Kluisbergen (Ruien) Wood dust 40.000
Electrabel Kluisbergen
(vergasser)
Wood chips
A/B wood
130.000
Electrabel Genk
(Langerlo)
Wood dust (incl. sludge and olive
pulp)
100.000
Electrabel, Gent Rodenhuize Wood pellets (import from Canada)
1)
400.000 (to 809.000 est.
in mid 2011)
Electrabel Kluisbergen Contaminated wood waste 150.000
The large-scale energy sector largely relies on pellet imports from Germany,
Eastern Europe and North America, and is expected to be growing significantly in
the next years. In addition to the industrial sector, there is also a significant
residential pellet heating market. This is in contrast to other industrial pellet
markets in the Netherlands and the UK (Pellet Atlas, 2009).
Wood waste was initially used mainly for energy recovery within the timber sector.
By stimulating the production of renewable energy, the incineration of wood waste
in Flanders has increased strongly.
8 Several of the renewable energy plants in Flanders are also licensed for other waste streams, so the actual
capacity will be filled with wood (waste) will be lower than the licensed capacity.
Competition in wood waste: inventory of policies and markets [April 2013]
Pagina 38 van 55
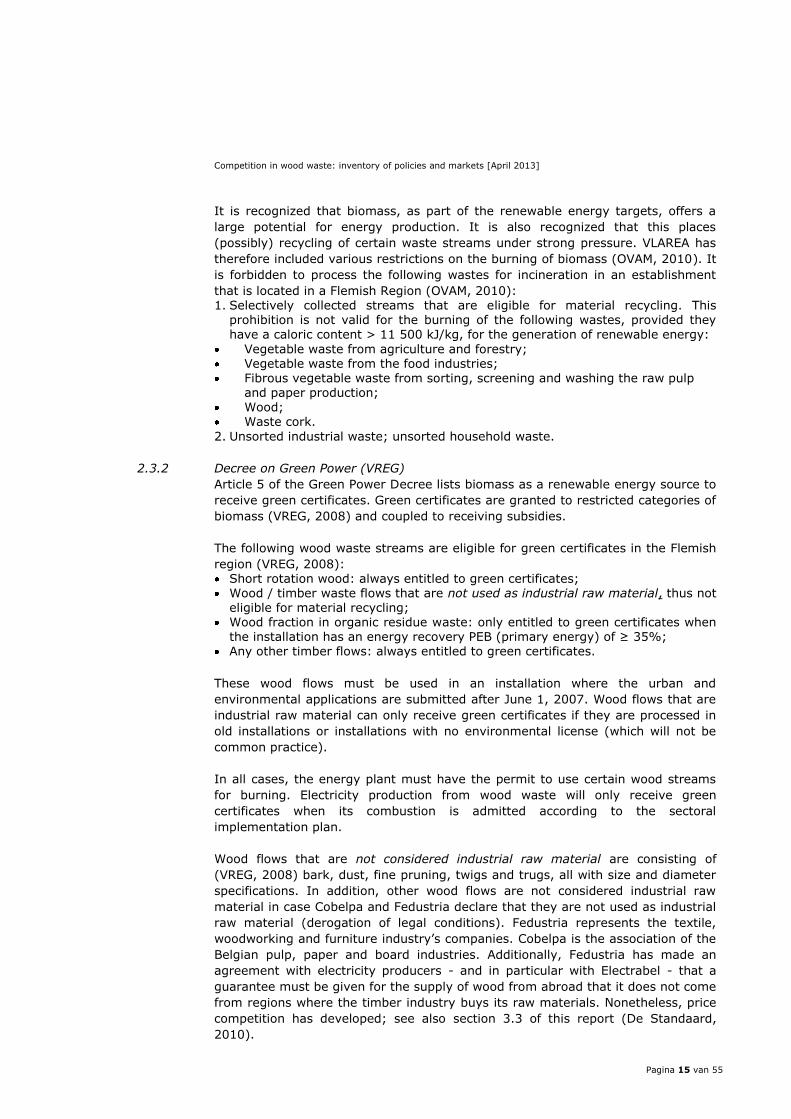
Figure 17: Destination of wood waste as energy source, in and outside Flanders. (OVAM, 2010)
Purple: households, green: abroad, yellow: other regions, light pink: horticulture, purple l.:
remaining industries.
3.3.3.2 The conventional wood industry
Fedustria indicates that good statistics about the availability of clean wood waste
are not present in Belgium. Clean wood waste is in principle used by chipboard
producers. This is about 500.000 dry ton in terms of consumption. In Flanders, the
cascade use of wood is closely followed. This means that 'clean wood waste'
should in principle be used for materials, rather than for energy applications
(Fedustria, 2013).
OVAM (2010) mentions three main chipboard producers in Flanders (Unilin, Spano
and Linopan). The sector gets about 30% of its recycling timber from Belgium,
which corresponds to an amount of approximately 240.000 tons / year (see also
table 15).
Table 15: Capacities (in tdm) of recycling wood and chipboard in Flanders. (OVAM, 2010)
Capacity recycling
wood (tdm)
Total processing
capacity (tdm)
Share of recycling
wood (%)
2003 405.000 1.247.000 33
2004 474.000 1.264.000 38
2005 492.000 1.239.000 40
2006 550.000 1.239.000 44
2007 600.000 1.200.000 50
2008 620.000 1.200.000 52
Experiences in Belgium (2010) learn that the particleboard industry has problems
to get enough wood waste at a competitive price, even during periods of

Competition in wood waste: inventory of policies and markets [April 2013]
Pagina 39 van 55
recession. The energy companies offer higher prices for wood waste. The price of
recyclable B-wood has increased by around 6 Euros in 2010 compared to the price
in late 2008 – indicating that the price is determined primarily by the customers in
the energy sector (OVAM, 2010).
De Standaard (2010) mentions that wood prices have increased in 2010 due to
subsidies for green energy. This happened despite legislation to avoid competition.
Electricity producers can pay more for wood than the conventional wood industry,
because of the subsidies they receive. Legislation (see 2.3) has not prevented that
the price for clean wood shows little or no difference with the price of
contaminated wood waste. According to Fedustria, this indicates for 2010 that still
a lot of the wood in Flanders, to be destined for wood processors, finds its way to
the electricity producers elsewhere in Europe. Besides this, the recovery rate of
industrial packaging pallets (mainly used for the traditional timber industry) was
decreasing – suspecting that a larger share of the wood is used to make
electricity.
3.3.4 Key drivers in demand (clean) wood waste
According to OVAM (2010), prices for wood waste strongly depend on the quality
of wood, availability, the economic situation and the prices for fossil fuels.
The Green Certificate Scheme in Belgium contributed to stimulating the demand
for solid biofuels, including pellets, for electricity generation by (co-) combustion.
Conclusions:
There is an international dimension of the wood waste industry (imports,
exports);
Despite legislation to avoid competition in demand of clean wood waste, the
wood processing industry has mentioned price increases for clean wood;
This, due to distorting effects of subsidies on renewable energy and growing
demand for woody feedstock.
3.4 United Kingdom UK
3.4.1 Trends in supply and trade of (clean) wood waste
In the UK, wood waste mainly comes from construction and demolition activities.
Various estimates put the number of wood waste generated in the UK at 5.1
million tons (Mt) in 2007 to 4.3/4.1 Mt in 2010. From this, 1.4 Mt was recovered in
2004, leaving a further 1.5 Mt of high-quality wood waste and two to three Mt of
low-quality wood waste for large commercial users and power generation. These
figures (based on 2004) exceeded the total estimated UK demand of 10.000 to
20.000 tons a year, for all uses except power generation.
Since the start of the recession, the number of companies using wood and
producing wood waste has fallen. These were mainly construction and furniture
companies. Recent data do, however, show signs of a rebound in production of
wood waste as of 2010 (WRAP, summer 2011).

Competition in wood waste: inventory of policies and markets [April 2013]
Pagina 40 van 55
Table 16: UK wood waste arising by source in 2007 and 2010. (DEFRA, 2012)
Source of wood waste WW production 2007 WW production
2010
Production change
Packaging 1.169 (Kt) 998 (Kt) 15%
Industrial 463 (Kt) 393 (Kt) 15%
Construction 1.184 (Kt) 854 (Kt) 28%
Demolition 1.138 (Kt) 1.068 (Kt) 6%
Local Authority Collected Waste 491 / 619 (Kt) 1.015 (Kt) 15% (increase)
Total 5.064 (Kt) 4.327 (Kt) 15%
Government policies have supported the supply and demand of wood waste (all
types) for energy recovery since 2002. Following this, for instance (and discussed
in more detail below), pellet production has increased by 12 times from 2005 to
2011.
Figure 18: Wood waste collection and recycling supply chain, UK. (PAS, 2012)
3.4.2 Primary disposers of (clean) wood waste
In 2010, total wood waste was amounted to be 4.1 to 4.3 Mt. Primary disposers of
wood waste in the UK are shown in figure 19 and further explained in this section.

Competition in wood waste: inventory of policies and markets [April 2013]
Pagina 41 van 55
Figure 19 Sources of post-consumer wood waste in UK. (WRAP, 2011)
Table 17: Rounded amounts of wood waste production from disposers; comparing 2009/2008
and 2011. (WRAP, 2009; WRAP, 2011; DEFRA, 2012)
Disposer WW production
(WRAP 2009)
WW production
(WRAP 2011)
WW production
change
Construction 1.2 Mt 1 Mt 0.2 Mt (decrease)
Demolition 0.1 Mt 1.1 Mt 1.0 Mt (increase)
Industrial 0.5 Mt 0.4 Mt 0.1 Mt (decrease)
Packaging 1.17 Mt 1.1 Mt 0.07 Mt (decrease)
The construction industry generated around 1.2 Mt of wood waste in 2009.
Wood waste mainly comes from consumed wood based panels and sawn wood.
Wood waste from this industry is estimated to have a recycle rate of 75-80%;
Demolition activities generated just over 100.000 tons of wood waste in 2009
while construction generated just over one Mt of wood waste. Wood waste from
this industry is often treated and estimated to have a recycle rate of 80-90%;
The industrial sector (furniture and joinery) generated nearly 0.5 Mt of wood
waste in 2009, 0.4 Mt in 2010, mainly coming from sawn wood (for joineries)
and particleboards and MDF (for furniture producers);
The packaging industry generated nearly 1.17 Mt of wood waste in 2009. This
wood waste mainly comes from domestic packaging manufacturing. It is
considered clean – i.e. from pallets – and is mainly used by panel board
manufacturers and for animal bedding. The great demand leaves little room left
for energy recovery out of this wood waste.

Competition in wood waste: inventory of policies and markets [April 2013]
Pagina 42 van 55
Table 18: Recovered wood suitability by end-uses. (WRAP, 2011)
End use Wood waste
stream
Wood waste
arising by waste
stream (in tons)
Proportion of
waste stream
suitable for end
use
Estimated total
wood waste
suitable for end
use
Agricultural and
horticultural use
Packaging 1.107.000 tons 100% 1.107.000 tons
Panel board Packaging 1.107.000 tons 40% 2.078.700 tons
Industrial 328.000 tons 60%
Construction 1.066.000 tons 60%
Demolition 1.066.000 tons 60%
Municipal 533.000 tons 30%
Biomass (energy) Packaging 1.107.000 tons 100% 4.100.000 tons
Industrial 328.000 tons
Construction 1.066.000 tons
Demolition 1.066.000 tons
Municipal 533.000 tons
Table 18 illustrates the suitability of different sources of wood waste, for different
end-uses. Although wood waste suitability is 100% for energy recovery, not 100%
is dedicated for this end-use, as energy recovery will need to compete with
conventional uses for the available wood waste.
3.4.3 Trends in demand (and prices) of (clean) wood waste
Until 2007, by far the largest consumers of wood waste were construction and
furniture industries, using panels produced out of recycled wood waste (see figure
20). This accounted for 58% of total demand. Since the recession started in 2008,
this demand has fallen – although there are signs of a rebound (WRAP, 2011).

Competition in wood waste: inventory of policies and markets [April 2013]
Pagina 43 van 55
Figure 20: Use of recovered wood by various industries. (WRAP, 2009)
Although use of recovered wood for panel manufacturing has slightly fallen, pellet
production from wood waste and dedicated biomass (using wood waste) was in
steep rise. Electricity generation from these resources was counted at 318 MW in
2008.
Agricultural use, in particular for animal bedding and equine surfaces, also has a
large share in the use of wood waste. It is estimated that even in the recession,
this demand remained fairly constant due to the depreciation of sterling and the
rise in prices of animal bedding from alternative material.
Market reforms from governmental policies to support the renewable energy
generation (such as the RO and RHI) in combination with increasing energy
demand, impact the demand from this sector on wood waste. Generated electricity
and heat from wood waste, i.e. pellets, has started to take off and is still climbing.
In the UK, wood pellets are primarily consumed by industry – e.g. large scale
biomass co-firing power plants. Households also consume wood pellets for
electricity production. Demand for pellets for heat generation is smaller although
this is increasing due to policy support (e.g. through the RHI, see also section 2.5
in this report). Overall, consumption of wood pellets in 2008 was counted at
176.000 tons, and 683.000 tons in 2010. Pellet demand specifically for heat
consumption is climbing from 50.000 tons in 2011 to an estimated 500.000 tons in
2015.
Figure 21 shows the trends and gap between high and lower grade wood waste
prices. The lower demand, and prices, of lower grade wood waste can be
explained by the costs associated with its processing, compared to higher-grade
wood waste. These costs may increase even further, due to governmental policies
such as the Landfill Tax and the Landfill Allowance Trading Scheme (LATS). Table
19 shows this comparison.

Competition in wood waste: inventory of policies and markets [April 2013]
Pagina 44 van 55
Figure 21: Prices of wood waste in £ for high (HG) and low grade (LG) wood waste, in averages
in December of each year – for wood waste delivered at recyclers.9
Wood waste prices (see figure 21) slightly increased between 2008 and 2011,
followed by a small decrease in 2012. This price drop was stronger for lower grade
wood waste, due to higher relative processing difficulties, than for higher-grade
wood waste. Fluctuations cannot be explained by one factor, being influenced by
changes in demand and supply, as well as price fluctuations.
It is expected that increased demand from the biomass energy sector and
domestic wood pellet production – which are financially supported by
governmental policies – may push back up prices for wood waste. The
conventional industry of panel manufacturing and end-uses as construction and
furniture manufacturing will hence have increasing difficulty to pay for their part of
wood waste (WRAP, 2011). The Economist (2013) mentioned recently that:
“Furniture-makers complain that competition from energy producers will lead to
the collapse of the mainstream British furniture-manufacturing base, unless the
subsidies are significantly reduced or removed”.
Table 19: Income/cost of disposal of wood, in UK. (DEFRA, 2008)
Grade Example methods of recovery
and disposal
Recovery/disposal cost/income
(per tonne)
Grade A Animal bedding, equestrian use,
panel board industry, garden
mulches
Potentially income of up to £150
Mixed grade Processed / sorted for use in
panel board industry
Cost of £5 to £30
Low grade Landfill Equivalent landfill cost (£35 to £45
in 2008), plus LATS cost (when
from MSW source)
3.4.3.1 The energy wood pellet market
Pellets within the UK are mainly produced out of sawdust, clean wood waste,
energy crops and forest thinnings. Growth from sawdust is considered to be
limited due to feedstock competition with animal bedding and furniture board
companies. Growth from forest thinnings is considered high in potential – among
9 Source: http://www.letsrecycle.com/prices/wood/wood-prices-archive/prices

Competition in wood waste: inventory of policies and markets [April 2013]
Pagina 45 van 55
other things, due to the incentive to grow through the Government’s Energy Crop
Scheme. For this feedstock, competition will exist between pellets and woodchips.
Since the implementation of governmental policies supporting bioenergy, pellet
production within the UK has increased from 25.000 tons/year in 2005 to 300.000
tons in 2011. Production capacity in this year was 480.000 tons. Within the EU,
the UK exports wood pellets to primarily Denmark (AEBIOM, 2012). Total exports
of wood pellets to Denmark developed from an increase until 2011 – from close to
1.7 Mt in 2008 to nearly 2.14 Mt in 2011; to a decrease between 2011 and 2012
(this latter being back at nearly 1.7 Mt) (Eurostat statistics). Pellet imports to the
UK, primarily from North America (Canada and the US), have been declining until
2010, after when the climb started to take off from slightly over 9.15 Mt in 2010
to over 16.2 Mt in 2012 (Eurostat statistics).
3.4.4 The conventional wood industry
Conventional industries using wood waste include:
Construction and furniture industry: wood waste is especially consumed for the
production of panels for these industries – as explained earlier, this demand is
declining;
Agriculture and farming: wood waste is consumed for this industry to produce in
particular animal bedding and equine surfaces – which is likely to remain the
same or slightly climbing, due to high prices of substitutes such as straw;
Converted coal power plants: wood waste is used for energy generation from
combustion – likely to decline due to reducing UK government support for
converted plants, while maintaining its support for new and dedicated biomass
plants.
Figure 22: Market segmentation of wood product types and consumption, 2010. (WRAP, 2011)
Figures 23 and 24 show the changing composition of end-uses of wood waste.
Recovery (i.e. re-using and recycling) from conventional wood industry is
remaining at same levels or declining, while incineration (i.e. energy recovery) is
rising.

Competition in wood waste: inventory of policies and markets [April 2013]
Pagina 46 van 55
Figure 23: Key markets for recovered wood waste. (DEFRA, 2012)
Figure 24: Recovered wood end-markets. (DEFRA, 2012)
3.4.5 Key drivers in demand (clean) wood waste
UK’s legislation supporting the energy from wood waste covers both the supply
and demand side of the chain. Policies are implemented to boost domestic supply
through the (New) Biomass Strategy (2007/2012) while grants are provided to
domestic industries and households to install pellet boilers/stoves for (own)
energy provision. Demand is also boosted through the RHI and the RO.
The use of wood waste as biomass is financially supported by the government
(through ROCs). Therefore, the biomass industry has a competitive advantage
compared to conventional industries to pay for the wood waste.
Another business driver – from both the government and the market – is the
increase in fossil fuel prices. Government policies are driving up the prices, e.g.
through the Climate Change Levy or the carbon price put on fossil fuels. Expected
price increases and the (increasing) volatility of fossil fuel prices are also pushing
the use of pellets. Wood pellets for energy and heat are already price compatible
with fossil fuels.
A primary barrier, caused by the increased demand and relative lower increased
supply, is the (potential) increase in wood waste prices. This will put an upward

Competition in wood waste: inventory of policies and markets [April 2013]
Pagina 47 van 55
pressure on the conventional industry’s place in the competition for this feedstock
– although it would create a competitive advantage for energy recovery from wood
waste.
Other, less influencing barriers, may include:
The decreasing value of ROCs, and coal fired plants closing down rather than
implementing the Large Plant Directive’s environmental reform requirements;
High investment costs are associated with the implementation of pellet boilers
or stoves; Grants through the RHI may take on this problem, but support needs
to be certain;
Concerning both a driver and barrier, is a policy possibly indirectly impacting
the wood waste and pellet demand. This is the LCP Directive, which may impact
the wood pellet market either negatively or positively (see also
section/paragraph 2.1 above).
Conclusions:
Wood waste production declined from 5.1 Mt in 2007 to about 4.2 Mt in 2010 –
decline was noted especially in construction and demolition industry;
Since implementation of governmental policies, production, consumption/use
and imports of wood pellets have increased, while exports have been declining;
Consumption of wood waste by the conventional industry is declining, while
consumption by the energy industry is increasing due to policy support for
energy recovery.

Competition in wood waste: inventory of policies and markets [April 2013]
Pagina 48 van 55
4 Cascading and impacts to the energy pellet industry
When further up-scaling the use of wood waste for energy, it is important to
understand the competition with other end-uses of wood waste, both from a
market, legislative and sustainability perspective. This report focuses on the
competition and use of wood waste (pellets) in the Netherlands and in close by EU
countries: UK and Belgium.
Wood waste comes from various sources. The construction and demolition sector
and the packaging industry are large suppliers. Wood waste has multiple end-
uses, largely determined by its grade of quality. Both A and B wood can be used
by the traditional timber sector, particularly for boards, and by the renewable
energy sector. Note that fresh wood (not considered a waste under the EU Waste
Directive) is also used for energy – especially for local applications on small scale.
It does not play a large role in the competition between the timber and large-scale
energy sector but does decrease pressure on total demand.
The traditional timber market is experiencing difficulties, slowly recovering from
the economic recession and the downturn in the housing market. Competition is
therefore fierce as the timber sector is dealing with lower demands, competition
from other international markets (e.g. Asia) and higher feedstock prices.
The wood energy market in Europe is – on the other hand - expanding strongly,
largely pushed by green energy policies in the European countries. Demand and
imports of wood pellets are growing strongly. At the same time, energy is also
increasingly recovered from wood waste. Wood demand in Europe for material
use, and to meet the renewable energy targets, is expected to increase further.
Both markets find their resources in competitive markets. Competition in demand
for wood waste is mentioned in the UK and in Belgium, both in terms of demand
and increasing prices. Competition is less visible in the Netherlands, also because
board production is not significantly present within the country.
Both the conventional timber markets and wood energy markets function in an
international dimension: resources and products are traded globally and extend
countries and European boundaries.
4.1 Place of wood waste in sustainability hierarchy
The EU Waste Framework Directive prescribes that clean wood waste (grade A) is
destined for useful recovery. Individual member states have translated the
Directive into their national legislation.
Wood waste (grade A and B) in the Netherlands can be destined for useful
recovery including material/product recovery and energy use as main use. No
distinction is made between these options;
The destination of clean wood waste in Belgium is raw material for industry,
unless the waste is not of use for the industry. Agreements are made with the
involved industry associations. Contaminated wood waste can be used for the
energy market;

Competition in wood waste: inventory of policies and markets [April 2013]
Pagina 49 van 55
Wood waste in the UK follows largely the EU waste management hierarchy.
Wood waste shall go to the highest useful end-uses. For higher-grade wood
waste (A) these are both material and energy recovery – agriculture for animal
bedding, panel manufacturers, and any incineration.
Belgium has stricter rules in waste hierarchy for clean wood than the Netherlands
or the UK, also through a stronger involvement of the board industry.
4.2 Place of wood pellets in sustainability hierarchy
The EU Waste Framework Directive gives end-of-waste criteria, meaning that a
product is no longer a waste when certain criteria are met. For example, the
product needs to have a market and a destined end-use.
Based on expert opinions and literature, imported wood pellets into Europe seem
to meet the end-of-waste criteria and are thus no longer considered waste in
Belgium and in the Netherlands. This is only under the condition that the exporting
country (USA in this case) agrees as well that the material is no longer a waste
product. This means that imported energy pellets fall under the Customs Product
Regulations and not under the Waste Regulations.
This does not seem to be the case in the UK, where imported pellets are still
considered waste according to personal consultation with the UK Environmental
Agency.
Given the different country approaches and found uncertainties under government
agencies, it is highly confirmed to receive a final assurance on the status of the
energy pellets from the responsible government agencies in the respective
countries.
Note that most of the imported energy pellets in Europe are made from timber
processing residues, which do not fall under the waste classification (unlike post-
consumer wood waste). Timber or forestry residues, also as feedstock for pellets,
do fall under the EU Timber Regulation.
In case energy pellets are produced domestically from post-consumer wood waste,
the story becomes slightly different:
The post-consumer wood waste does fall under the EU Waste Directive until the
material is converted to energy pellets (following the end-of-waste criteria);
This possibility is thus restricted in Belgium where the wood waste is in principle
first destined to the conventional timber market, unless it cannot be used by
this sector.
In all cases, it is required that the energy plant receiving the pellets or woody
feedstock has the correct permits and meets the country’s obligations.
4.3 Competition markets and indirect effects
The EU Waste Framework Directive gives a preference on the use of wood waste.
Clean wood waste is destined for useful recovery including material recovery or
energy use as main use (in the UK and NL and in Belgium under restrictions only),
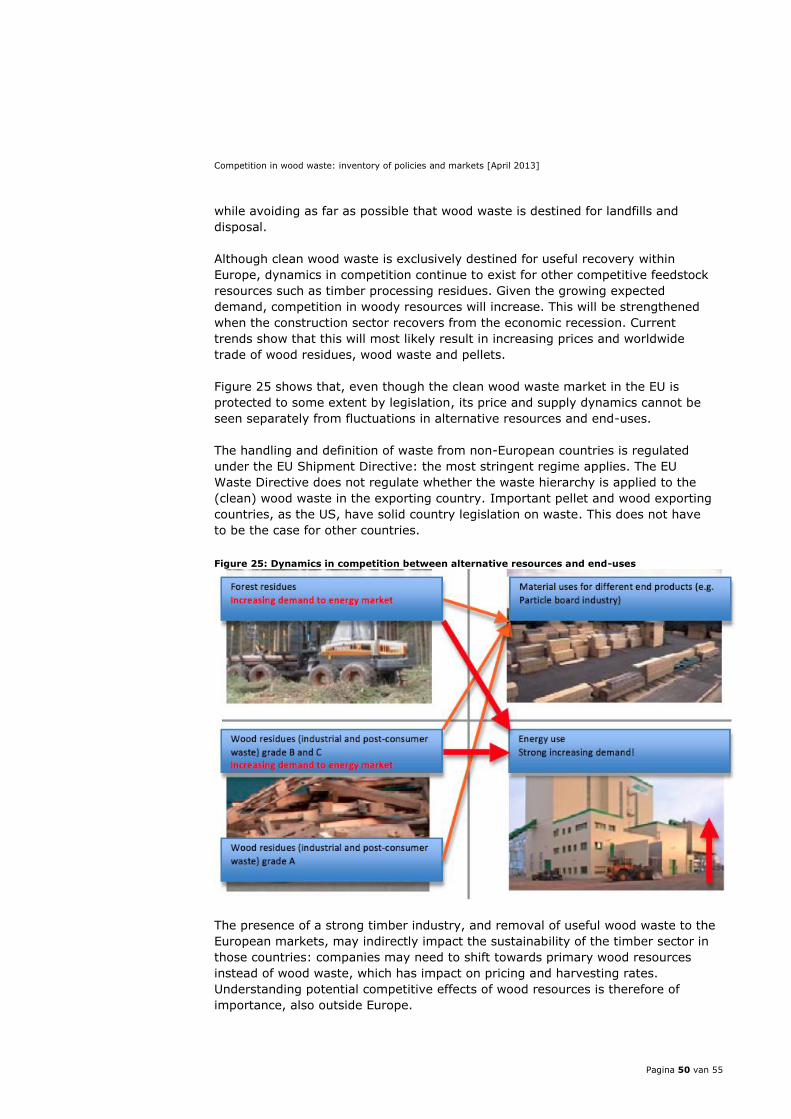
Competition in wood waste: inventory of policies and markets [April 2013]
Pagina 50 van 55
while avoiding as far as possible that wood waste is destined for landfills and
disposal.
Although clean wood waste is exclusively destined for useful recovery within
Europe, dynamics in competition continue to exist for other competitive feedstock
resources such as timber processing residues. Given the growing expected
demand, competition in woody resources will increase. This will be strengthened
when the construction sector recovers from the economic recession. Current
trends show that this will most likely result in increasing prices and worldwide
trade of wood residues, wood waste and pellets.
Figure 25 shows that, even though the clean wood waste market in the EU is
protected to some extent by legislation, its price and supply dynamics cannot be
seen separately from fluctuations in alternative resources and end-uses.
The handling and definition of waste from non-European countries is regulated
under the EU Shipment Directive: the most stringent regime applies. The EU
Waste Directive does not regulate whether the waste hierarchy is applied to the
(clean) wood waste in the exporting country. Important pellet and wood exporting
countries, as the US, have solid country legislation on waste. This does not have
to be the case for other countries.
Figure 25: Dynamics in competition between alternative resources and end-uses
The presence of a strong timber industry, and removal of useful wood waste to the
European markets, may indirectly impact the sustainability of the timber sector in
those countries: companies may need to shift towards primary wood resources
instead of wood waste, which has impact on pricing and harvesting rates.
Understanding potential competitive effects of wood resources is therefore of
importance, also outside Europe.

Competition in wood waste: inventory of policies and markets [April 2013]
Pagina 51 van 55
Of course, the opposite can also occur: earlier disposed wood waste in countries
can be destined for useful recovery.
Note that the mentioned possible indirect effects in this section are not specific for
wood waste. They are also visible at, for example, forest processing residues,
which are not covered by the EU Waste Framework Directive.
4.4 Recommendations to mitigate indirect effects (NL Agency):
Monitoring the impact of green energy policies in Europe on wood resources
demand and competition in prices and demand is key to steer negative
sustainability impacts;
Promoting waste hierarchy policies and recycling of wood. This is especially of
importance in wood producing countries;
Exploring the opportunities to further decrease the disposal of wood waste on
landfills through e.g. improvement of infrastructure and logistics;
Promote the possibilities of biomass cascading through biofineries. This option is
especially of interest for streams that are close to the biomass resource.
Biorefineries are preferably located close to industries that can use higher value
products as proteins and/or close to the energy plant;
Also promote the possibility of cascading of used wood for higher-value
purposes in the conventional timber industry, for example for the production of
furniture;
Stimulate cooperation between stakeholders to improve logistics in the
collection of used wood, which will benefit the availability and the collection
costs;
Stimulate companies to take measures to ensure that wood supplies from other
regions are truly sustainable, so that European demand (especially if it is large
scale) is not subject to excessive risk, and does not export Europe’s resource
demand to other, possibly more vulnerable, regions;
This can include a check of competition in the wood (waste) value chains for
energy at the source of origin. Certification schemes can play a role here.

Competition in wood waste: inventory of policies and markets [April 2013]
Pagina 52 van 55
5 References
AEBIOM (2012) ‘European Bioenergy Outlook 2012’
Afvaldesk (2013), Phone conversation with Ms. Jennifer van Dijk on 3 April 2013
Chartered Institution of Wastes Management (2012), Waste Hierarchy Guidance
Review 2012
CostGard on Climate Change Levy,
http://costgard.co.uk/climate_change_levy_ccl.html
DEFRA (2008), UK Government, Department for Environment, Food and Rural
Affairs, ‘Wood waste as a biomass fuel: Market information report’
DEFRA (2010), UK Government, Department for Environment, Food and Rural
Affairs, Environmental Permitting Guidance, The Waste Incineration Directive
DEFRA (2011), UK Government, Department for Environment, Food and Rural
Affairs, Guidance on applying the Waste Hierarchy
DEFRA (2012), UK Government, Department for Environment, Food and Rural
Affairs, ‘Wood Waste: A short review of recent research’
Deloitte on Climate Change Levy – Carbon price floor,
http://www.ukbudget.com/UKBudget2012/business/indirect-tax/ukbudget2012-
indirect-tax-climate-change-levy-carbon-price-floor.cfm
EC (2007), Correspondents' Guidelines No 5 on classification of wood waste
under entries B3050 or AC170,
http://ec.europa.eu/environment/waste/shipments/guidance.htm
EC (2010), Obligations of operators who place timber and timber products on
the market (EU Timber Regulation), Official Journal of the European Union
L295: p. 23-34, European Commission
EC (2011), Annex III Green List Waste,
http://www.ilent.nl/Images/Bijlage%20III%20EN_tcm334-334854.pdf
Economist (2013), The fuel of the future, Environmental lunacy in Europe,
published April 6, 2013, http://www.economist.com/news/business/21575771-
environmental-lunacy-europe-fuel-future
EEA (2012), Material resources and waste, 2012 Update – state and outlook
2010, European Environmental Agency
EEA (2012a), Movements of waste across the EU's internal and external
borders, EEA report 07/2012, European Environmental Agency
Energy Crops Company (2007), Wood Pellet Fuel Utilisation design guide
European Commission on Large Combustion Plants Directive,
http://ec.europa.eu/environment/air/pollutants/stationary/lcp/legislation.htm
Eurostat (2012), Eurostat Statistics, international trade (selection UK –
reporter; US – partner; wood pellet – product). Retrieved on April 4th 2012
Eversheds (2012), Energy Bill – Electricity Market Reform – Contracts for
Difference, http://cleanenergyblog.eversheds.com/all-briefings/energy-bill-
electricity-market-reform-contracts-for-difference/
Fedustria (2013), email communication with Mr. G Van Steertegem, Direction of
Fedustria, Association of textile, wood and furniture industry, Belgium
IEA Bioenergy Task 40 (2010), Country report the Netherlands in 2010
IEA Bioenergy Task 40 (2011) Global Wood Pellet Industry, Market and Trade
Study
Houtwereld (2013), EPV luidt noodklok houten pallets, nieuwsbrief mei 2013

Competition in wood waste: inventory of policies and markets [April 2013]
Pagina 53 van 55
ISCC (2013), System Basics Supplement for the certification of waste and
residues based liquid and gaseous biofuels, ISCC 13-01-31 V 1.0 EU DRAFT,
under public consultation
Laborelec GDF Suez (2012), Industrial Wood Pellets Report
Landelijk Afval Plan, sector 36 Hout (2010)
Letsrecycle.com on wood waste prices,
http://www.letsrecycle.com/prices/wood/wood-prices-archive/prices
ODE (2010), Biomassa-afval en het beleid daarover (wat brengt de toekomst?),
presentatie door F. van Gijzeghem, April 2010
OVAM (2010), Inventarisatie biomassa 2007-2008 (deel 2009) met potentieel
2020, Mechlen, April 2010
Parsons Brinckerhoff (2011), Continued Operation of ‘Opted-Out’ Large
Combustion Plants under the IED
PAS 111 (2012), Specification for the requirements and test methods for
processing wood waste, http://www.woodrecyclers.org/PAS111.pdf
Sikkema et al (2011), The European wood pellet markets: current status and
prospects for 2020, Biofuels, Bioprod. Bioref. 5:250–278 (2011) BIOFPR
Pellets Atlas (2009), National Energy Foundation. Pellet Market Country Report,
UK
Pellets Atlas, National Energy Foundation, English Handbook for Wood Pellet
Combustion, from website:
http://www.pelletsatlas.info/pelletsatlas_docs/showdoc.asp?id=090313124119&
type=doc&pdf=true
Probos (2009), De markt van gebruikt hout en resthout in 2007, by: N.A. Leek,
J.Oldenburger and A. Winterink
Probos (2012), Kerngegevens bos en hout in Nederland
Probos (2013), Inzetten op hergebruik van sloophout, rapport 2013 nr. 3
Province Gelderland (2010), Toolkit op Eigen Hout,
http://duurzameenergiegelderland.wing.nl/Thema's/Kennis-
_en_leertraject_Op_eigen_hout_2010
Senter Novem (2005), Afval of biomassa, een juridische onderbouwing
Standaard (2010), Houtbedrijven leggen de blok erop, article from 23 October
2010, http://www.standaard.be/artikel/detail.aspx?artikelid=3J318BA8
UK Government (2010), Environment Agency. Position Statement; The
environmental regulation of wood
UK Government (2011), Environmental Protection, England and Wales. The
Waste (England and Wales) Regulations 2011. Statutory Instruments
UK Government (2012), Department for Transport, Department of Energy and
Climate Change, Department for Environment, Food and Rural Affairs. UK
Bioenergy Strategy
UK Government (2013), Government sets out plans to cut emissions from heat,
https://www.gov.uk/government/news/government-sets-out-plans-to-cut-
emissions-from-heat
UK Government on Electricity Market Reform,
https://www.gov.uk/government/policies/maintaining-uk-energy-security--
2/supporting-pages/electricity-market-reform
UK Government on Renewables Obligation,
https://www.gov.uk/government/policies/increasing-the-use-of-low-carbon-
technologies/supporting-pages/the-renewables-obligation-ro
UK Government. Increasing the use of low-carbon technologies,
https://www.gov.uk/government/policies/increasing-the-use-of-low-carbon-
technologies

Competition in wood waste: inventory of policies and markets [April 2013]
Pagina 54 van 55
UNECE (2012), Forest Product Annual Markets Review 2011-2012, from UNECE
and FAO
VLAREMA (2012), Besluit van de Vlaamse Regering tot vaststelling van het
Vlaams reglement betreffende het duurzaam beheer van materiaalkringlopen en
afvalstoffen, April 2012
VREG (2008), Mededeling van de Vlaamse Reguleringsinstantie voor de
Elektriciteits- en Gasmarkt van 8 juli 2008, Gewijzigd op 2 juni 2009, MEDE-
2008-2
WRAP (2009), Wood Waste Market in the UK
WRAP (2011), Wood Waste Market Situation Report,
http://www.communitywoodrecycling.org.uk/images/WRAPApril2011.pdf
WRAP (2011), Market situation report: Realising the value of recovered wood,
summer 2011,
http://www2.wrap.org.uk/downloads/Wood_MSR_Final_Aug_2011.3c149444.11
101.pdf
WtERT (2013), information from website:
http://www.wtert.eu/default.asp?Menue=14&ShowDok=25

Competition in wood waste: inventory of policies and markets [April 2013]
Page 55 of 55
Related Documents