TRUCKEE MEADOWS COMMUNITY COLLEGE UNIVERSITY OF NEVADA, RENO WASHOE COUNTY SCHOOL DISTRICT Prepared By: Education Collaborative of Washoe County Joint Data Profile Committee August 2004 WASHOE K WASHOE K - - 16 16 DATA PROFILE DATA PROFILE

Welcome message from author
This document is posted to help you gain knowledge. Please leave a comment to let me know what you think about it! Share it to your friends and learn new things together.
Transcript

TRUCKEE MEADOWS COMMUNITY COLLEGEUNIVERSITY OF NEVADA, RENO
WASHOE COUNTY SCHOOL DISTRICT
Prepared By:Education Collaborative of Washoe CountyJoint Data Profile Committee
August 2004
WASHOE KWASHOE K--1616DATA PROFILEDATA PROFILE

1
DATA PROFILE COMMITTEEDATA PROFILE COMMITTEE
Washoe County School DistrictAnne Loring, WCSD Board of Trustees
Dotty Merrill, Senior Director, Public Policy, Accountability & Assessment
University of Nevada, Reno Bill Cathey, Vice Provost for Academic Affairs
Melisa Choroszy, Assistant VP for Records/Enrollment
Serge Herzog, Director of Institutional Analysis
John Mahaffy, Director of Assessment
Truckee Meadows Community CollegeElena Bubnova, Director of Institutional Research
University & Community College System of NevadaTyler Trevor, Assistant Vice Chancellor
Pat Casagranda, Assistant Director of Institutional Research
Nevada Department of EducationDenise Quon, Evaluation Consultant
Members:
2
DATA PROFILE COMMITTEEDATA PROFILE COMMITTEE
Washoe County School DistrictJennifer Crow, Program Services Coordinator
Jim Grace, Reporting Specialist
Kathy Butler, Student Accounting Assistant
Kathy Freeman, Consultant
University of Nevada, RenoVirginia Moore, Management Analyst III
Acknowledgment for Special Assistance in Preparing the 2004 Data Profile:

3
SummarySummary
For the past seven years, the University of Nevada, Reno; Truckee Meadows Community College; and the Washoe County School District have collaborated through the Education Collaborative of Washoe County to produce the Washoe K-16 Data Profile, formerly called the High School Data Profile. The Nevada Department of Education and the University and Community College System of Nevada have participated in this effort. The Data Profile is the collection and presentation of data about Washoe County School District high school students and the continuation of those graduates into the University of Nevada, Reno, and Truckee Meadows Community College. Through this effort, we hope to identify factors that can increase the success of our students as they proceed from high school to post-secondary education.
The Data Profile has expanded in scope each year. The 2002 edition reported a two-year increasing trend in the percentage of Washoe County School District graduates enrolled in remedial English and/or mathematics courses at both UNR and TMCC. Concern about this trend and its potential impact on students led to an increased focus on the remediation issue for the 2003 and 2004 editions of the Data Profile. An analysis of transcripts of 346 WCSD high school graduates in the Class of 2003 provides a comprehensive profile of students enrolled in remedial math at UNR and TMCC.
The Education Collaborative of Washoe County hopes that this and future issues of the Data Profilewill continue to help educators, parents, students, and our community better prepare our graduates for a successful transition into higher education and for continued success throughout their college careers.
Introduction

4
SummarySummarySummary of Data TrendsWCSD Graduates including the Class of 2003• The WCSD dropout rate continued its four-year decline to a record low of 2.8%. It again is
significantly lower than the statewide dropout rate in 2003 of 6.0%. The dropout rate for 10 of the 11 high schools open for the last five years was lower in 2003 than it had been in 1999. Since the 1999-2000 school year, the dropout rate has decreased significantly for all ethnic groups:
• From 6.5% to 3.5% for African Americans; • From 3.1% to 1.9% for Asian students; • From 9.1% to 4.7% for Hispanic students; • From 7.9% to 4.4% for Native Americans; • From 4.4% to 2.2% for White students.
In addition, the gap in dropout rates between White students and students of each of the other ethnic groups has narrowed significantly.
• Of those seniors with enough credits to graduate, 99.9% passed the Reading and Writing portions of the High School Proficiency Exam, and 96% passed the Math portion. The Class of 2003 was the first class required to meet the state standards under the Nevada Education Reform Act of 1997, the first to have to pass the HSPE aligned to these standards, and the first required to pass three credits in mathematics to graduate.
• Although the number of students taking the ACT and SAT has grown dramatically since 1999, the percentage of graduates taking these tests is significantly lower than it was in 1999.
• SAT math and verbal scores have risen 15 and 10 points respectively in the last two years. They have both risen significantly and steadily since 1999. WCSD ACT and SAT scores exceed those of both the state and the nation.

5
SummarySummaryWCSD Graduates including the Class of 2003 (continued)• The percentage of WCSD juniors and seniors enrolled in Advanced Placement courses has risen
by 33% since 1999, with most of the increase occurring since 2001. The percentage has increased at every high school open since 1999. The number of AP exam candidates has risen by 42% since 1999.
• Over one-third of the 2003 graduates at six high schools had taken at least one AP examination as a junior or senior.
• There has been almost a 50% increase in the percentage of high school students enrolled in advanced science courses (Chemistry and above) since 1999.
College Data: Washoe County School District Graduating Cohorts• At least 66% of WCSD 2003 graduates went on to higher education in the fall immediately
following graduation. This percentage exceeds the national average of 65%.• Over 80% of WCSD college-going graduates in 2003 attended either UNR or TMCC.• The percentage of WCSD graduates attending UNR and TMCC the following fall has increased
from 46% to 55% since 1999. The percentage attending UNR has risen from 25% to 30% in that same time period. The percentage attending TMCC has risen from 21% to 26% since 1999. There has been a 42% increase in the number of WCSD graduates going on to UNR and TMCC since 1999.
• The percentage of WCSD graduates enrolled in remedial classes at both UNR and TMCC was unchanged compared to the Class of 2002. The percentage at both institutions remains significantly higher for the Class of 2003 compared to the Class of 1999.
• Both the composite ACT and combined SAT scores for WCSD graduates attending UNR have increased for the Class of 2003 compared to the Class of 2002. The combined SAT scores for the WCSD Class of 2003 attending UNR represent a five-year high.

6
SummarySummaryCollege-Level Remediation in Mathematics at the University of Nevada, Reno and Truckee Meadows Community CollegeOf WCSD graduates enrolled as freshmen in college level remedial mathematics at TMCC in 2003:
• Eighty-eight percent were placed into remedial math classes based on their Accuplacer or ACT cut scores.
• Only 3% qualified for college-level math but self-selected remedial math. • Another 9% self-selected remedial math but had not taken the placement tests.
Of WCSD graduates enrolled as freshmen in college-level remedial mathematics in 2003:• Only 16% at UNR and only 2% at TMCC had taken four years of high school math including a
course beyond Algebra 3-4.• Only 35% at UNR and only 20% at TMCC had taken four years of high school math.• Fifteen percent at UNR and 56% at TMCC had not passed Algebra 3-4 or higher math courses
in high school.
Of WCSD graduates enrolled as freshmen in college-level remedial mathematics in 2003 and who passed Algebra 3-4 in high school:
• Sixty-one percent at UNR and 72% at TMCC had grades of C or lower in Algebra 3 and Algebra 4.
• The average cumulative math GPA in high school was 2.50 for UNR students and 2.38 for TMCC students.

7
SummarySummaryConclusions of 3-Year Review of Remediation Data for WCSD Graduates
Enrolled as Freshmen at UNR and TMCC• Over 70% of WCSD freshmen at UNR are not enrolled in remediation in English or math compared
to roughly 60% of freshmen at TMCC who are enrolled in remediation. In part, this reflects differing entrance requirements of the two institutions. Although encouragement of freshmen at TMCC to enroll in English and math their first year coupled with diligent use of placement tests may result in larger numbers of students enrolled in remedial classes, this still appears to contribute to increased persistence of these freshmen in their second and third semesters.
• The overwhelming majority (over 80%) of students enrolled in remedial English or math as freshmen are there because of their placement exam scores and not because of self-selection.
• Enrollment in high school mathematics beyond the level of Algebra 3-4 dramatically reduces the likelihood that a student will need math remediation in college. Enrollment in Advanced Placement English and mathematics courses in high school also appears to reduce the likelihood that a student will need remediation in those content areas in college.
• Students who need remedial math in college are characterized by generally not having taken four years of high school math, not having taken math beyond Algebra 3-4, and often not even having taken and passed Algebra 3-4.
• Those students enrolled in remedial math in college who had completed Algebra 3-4 in high school were generally students who earned a C grade or lower in Algebra 3-4. The average cumulative math GPA in high school of these students was 2.43.
8
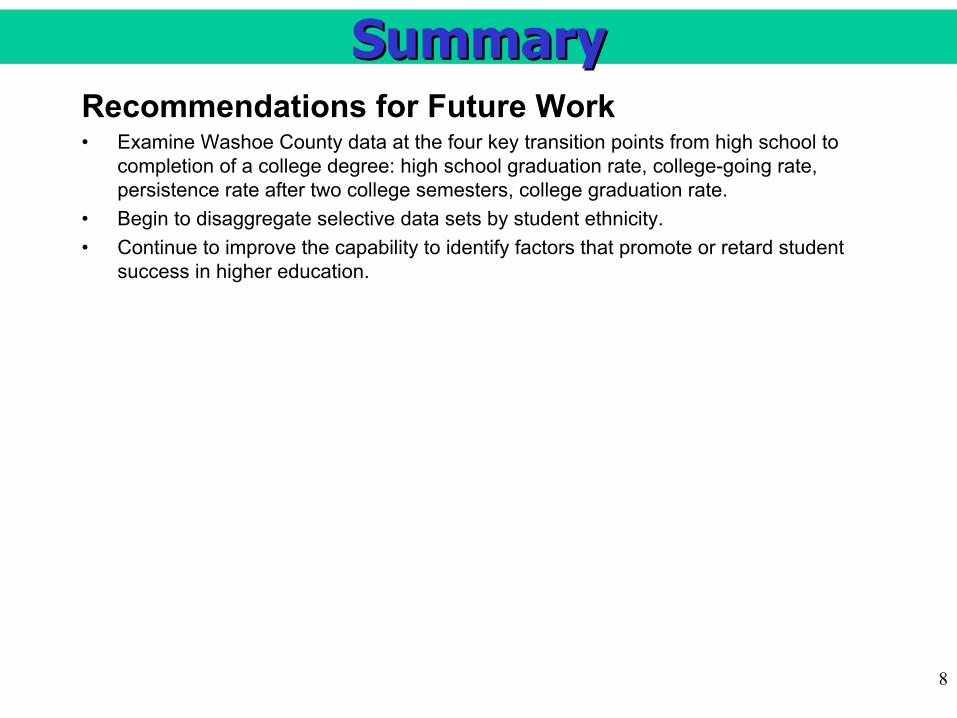
SummarySummaryRecommendations for Future Work• Examine Washoe County data at the four key transition points from high school to
completion of a college degree: high school graduation rate, college-going rate, persistence rate after two college semesters, college graduation rate.
• Begin to disaggregate selective data sets by student ethnicity.• Continue to improve the capability to identify factors that promote or retard student
success in higher education.

9
DATA PROFILE PROJECTDATA PROFILE PROJECT
First research completed in 1998• Tracking and analysis of 1997 WCSD graduating
cohort• Baseline data established• Comparisons made to state and national measures
Research continued through 2004• Tracking and analysis of 1998 through 2003 WCSD
graduating cohorts• Comparisons made to 1999 data, as well as state
and national measures
History of Data Profile Project

10
WCSD HIGH SCHOOLSWCSD HIGH SCHOOLS
Thirteen High Schools Included in Data Profile:
• Reno• Spanish Springs • Sparks• TMCC HS • Washoe • Wooster
• Galena• Gerlach• Hug• Incline• McQueen • North Valleys• ReedSome data may be limited for North Valleys & Spanish Springs high schools, which opened without a senior class in the 2001-02 school year.

11
REPORT CONTENTREPORT CONTENTAcademic Year ‘03
College Data
Summary
High School outcome measures for the class of 2003, with comparisons to 1999, 2000, 2001 and 2002 classes
College outcome measures for 2003, with comparisons to 1999, 2000, 2001, and 2002 graduates
Teachers Teaching Within Area of LicensureDropout RatesHSPE ScoresCollege Entrance ExamsCollege Prep
Measures
RecommendationsRecommendationsSummary of data & conclusionsSummary of data & conclusions
Capture RatesRemediation Persistence RatesCollege Entrance Exams

12
ACADEMIC YEAR 2003ACADEMIC YEAR 2003
Teachers Teaching within Area of LicensureDropout Rate: Percent of students in grades 9-12 who dropped out of school during the school yearHigh School Proficiency Exam: Percent of students passing each section of the state-mandated Nevada High School Proficiency ExamCollege Entrance Exams: Scores and participation rates on ACT and SAT examsCollege Preparatory Courses: Percent of students enrolling in Advanced Placement, advanced math (algebra 3 & above), and advanced science (chemistry & above)
Measures

13
99%99%99%
96%96%
90%
92%
94%
96%
98%
100%
1999 2000 2001 2002 2003
ACADEMIC YEAR 2003ACADEMIC YEAR 2003Washoe County School DistrictTeachers Teaching within Area of Licensure

14
ACADEMIC YEAR 2003ACADEMIC YEAR 2003
Nevada vs. WCSD
6.0%
7.8%
6.1%5.0%
6.3%7.3%
5.2%4.2%
3.4%2.8%
0%
2%
4%
6%
8%
10%
12%
1999 2000 2001 2002 2003
Nevada WCSD
Dropout Rates

15
ACADEMIC YEAR 2003ACADEMIC YEAR 2003Dropout Rates by High School
* Washoe HS is an alternative learning site
HIGH SCHOOLS 1998-99 1999-00 2000-01 2001-02 2002-03
Galena 1.8% 3.7% 1.1% 2.5% 1.9%Gerlach 6.3% 6.1% 2.7% 2.9% 0.0%Hug 11.0% 5.3% 5.9% 5.9% 7.2%Incline 1.6% 1.1% 0.7% 2.7% 1.2%McQueen 2.3% 2.1% 2.5% 1.7% 0.9%North Valleys 2.5% 2.5%Reed 4.3% 2.9% 2.7% 1.3% 1.8%Reno 2.6% 2.9% 2.8% 2.1% 1.7%Spanish Springs 1.3% 1.7%Sparks 9.5% 6.4% 1.4% 1.7% 1.9%TMCC HS 6.7% 6.1% 2.4% 2.4% 0.6%Washoe* 41.9% 34.5% 33.0% 26.2% 10.0%Wooster 6.9% 3.8% 3.6% 4.0% 5.2%WCSD Overall 7.3% 5.2% 4.2% 3.4% 2.8%
Not Open
Not Open

16
ACADEMIC YEAR 2003ACADEMIC YEAR 2003
6.5%
3.1%
9.1%7.9%
4.4%4.7%
1.9%
3.5%4.4%
2.2%0%
1%
2%
3%
4%
5%
6%
7%
8%
9%
10%
AfricanAmerican
Asian Hispanic NativeAmerican
White
Academic Year 2000 Academic Year 2003
Dropout Rates by Ethnicity Percent of Each Ethnic Group to Drop Out in One Year
Example: 2.2% of the White population dropped out in academic year 2003.

17
ACADEMIC YEAR 2003ACADEMIC YEAR 2003
2.7%5.4%
53.3%
34.2%
4.5%
0%
10%
20%
30%
40%
50%
60%
70%
African American Asian Hispanic Native American White
Dropout Rates by Ethnicity Percent of Total 9-12th Grade Dropouts
Example: 53.3% of WCSD dropouts are White.

18
Percentage of Credit-Sufficient Seniors Passing
96.0%
99.9% 99.9%
80.0
85.0
90.0
95.0
100.0
Reading Writing Math
WCSD Avg.
ACADEMIC YEAR 2003ACADEMIC YEAR 2003High School Proficiency Exam
Note: The above figures include Washoe High School. However, by NRS the WCSD average submitted for state accountability purposes does not include Washoe H.S.

19
Percentage of 1999-2003 Credit-Sufficient Seniors Passing*
99.398.8
97.3
99.399.2
96.2
99.9 99.9
97.7
99.7 99.9
96.596.0
99.999.9
94
95
96
97
98
99
100
Reading Writing Math
1999 Grads 2000 Grads 2001 Grads 2002 Grads 2003 Grads
ACADEMIC YEAR 2003ACADEMIC YEAR 2003High School Proficiency Exam
*Students in the Class of 2003 are the first who were taught the 1998 state standards, whose HSPE was aligned to the standards, and who were required to take three credits of math instead of two for graduation. The above figures include Washoe High School. Several corrections have been made for data from previous years.

20
ACADEMIC YEAR 2003ACADEMIC YEAR 2003HSPE by High School Percentage Passing (Reading)
Note: The above figures include Washoe High School. Several corrections have been made for data from previous years.
HIGH SCHOOLS 1999 2000 2001 2002 2003Galena 98.3% 100.0% 100.0% 100.0% 100.0%Gerlach 100.0% 100.0% 100.0% 100.0% 100.0%Hug 98.0% 97.1% 100.0% 99.0% 100.0%Incline 98.9% 100.0% 100.0% 100.0% 100.0%McQueen 99.4% 99.7% 100.0% 99.8% 100.0%North Valleys N/A N/A N/A N/A 100.0%Reed 99.5% 100.0% 100.0% 100.0% 100.0%Reno 99.4% 98.5% 100.0% 99.7% 100.0%Spanish Springs N/A N/A N/A N/A 100.0%Sparks 99.6% 99.6% 100.0% 98.9% 100.0%TMCC HS 100.0% 98.7% 100.0% 100.0% 100.0%Washoe 97.1% 92.7% 98.5% 100.0% 100.0%Wooster 96.7% 98.2% 100.0% 99.6% 98.9%WCSD AVG. 98.8% 99.2% 99.9% 99.7% 99.9%
Reading Test

21
ACADEMIC YEAR 2003ACADEMIC YEAR 2003HSPE by High School Percentage Passing (Writing)
Note: The above figures include Washoe High School. Several corrections have been made for data from previous years
HIGH SCHOOLS 1999 2000 2001 2002 2003Galena 99.3% 100.0% 99.6% 100.0% 99.7%Gerlach 100.0% 100.0% 100.0% 100.0% 100.0%Hug 98.4% 96.7% 100.0% 99.7% 100.0%Incline 100.0% 100.0% 100.0% 100.0% 100.0%McQueen 99.7% 99.7% 100.0% 100.0% 99.8%North Valleys N/A N/A N/A N/A 100.0%Reed 99.8% 100.0% 100.0% 100.0% 100.0%Reno 99.7% 99.1% 100.0% 99.7% 100.0%Spanish Springs N/A N/A N/A N/A 100.0%Sparks 99.3% 98.8% 100.0% 100.0% 99.5%TMCC HS 98.6% 100.0% 100.0% 100.0% 100.0%Washoe 98.5% 98.2% 95.5% 100.0% 100.0%Wooster 98.6% 98.7% 100.0% 99.6% 100.0%WCSD AVG. 99.3% 99.3% 99.9% 99.9% 99.9%
Writing Test

22
ACADEMIC YEAR 2003ACADEMIC YEAR 2003HSPE by High School Percentage Passing (Math)
NoteThe above figures include Washoe High School. Several corrections have been made for data from previous years.
HIGH SCHOOLS 1999 2000 2001 2002 2003Galena 99.0% 97.8% 97.8% 97.4% 97.3%Gerlach 100.0% 100.0% 100.0% 100.0% 100.0%Hug 95.3% 88.8% 97.9% 96.2% 93.5%Incline 100.0% 97.6% 97.8% 100.0% 97.6%McQueen 99.1% 97.7% 98.4% 97.3% 99.1%North Valleys N/A N/A N/A N/A 94.4%Reed 99.6% 98.1% 99.1% 97.4% 98.2%Reno 99.1% 97.0% 99.3% 99.4% 99.0%Spanish Springs N/A N/A N/A N/A 95.4%Sparks 95.5% 95.9% 96.1% 94.3% 93.4%TMCC HS 100.0% 98.7% 98.1% 99.2% 100.0%Washoe 79.4% 65.5% 86.6% 85.7% 87.8%Wooster 95.7% 94.6% 97.7% 91.8% 95.5%WCSD AVG. 97.3% 96.2% 97.7% 96.5% 96.0%
Math Test

23
ACADEMIC YEAR 2003ACADEMIC YEAR 2003ACT Math Scores
WCSD, Nevada and National Comparison
22.2 22.3
21.922.2 22.1
21.3 21.421.1 21.2 21.2
20.7 20.7 20.7 20.6 20.6
19.5
20.0
20.5
21.0
21.5
22.0
22.5
1999 2000 2001 2002 2003
WCSD Avg Nevada Avg National Avg
Note: ACT scores are reported on a scale from 1 to 36. For purposes of this comparison, the scale has been reduced to enhance visual discrimination.

24
ACADEMIC YEAR 2003ACADEMIC YEAR 2003ACT Math Scores by High School
‘-’ Denotes fewer than 5 students
HIGH SCHOOLS
1999 2000 2001 2002 2003Galena 21.7 23.2 22.2 22.1 21.6Gerlach - - - - -Hug 20.7 20.9 20.9 20.6 19.8Incline 22.2 22.1 21.3 21.6 24.5McQueen 24.4 23.6 23.3 23.3 23.7North Valleys N/A N/A N/A N/A 19.7Reed 22.1 21.7 21.1 21.7 22.0Reno 23.6 23.2 23.0 24.6 24.5Spanish Springs N/A N/A N/A N/A 20.2Sparks 20.0 20.1 20.4 19.9 20.5TMCC HS - - 22.4 20.8 -Washoe - - - - -Wooster 21.0 21.6 22.1 23.1 22.7WCSD AVG. 22.2 22.3 21.9 22.2 22.1
ACT Math Scores
25
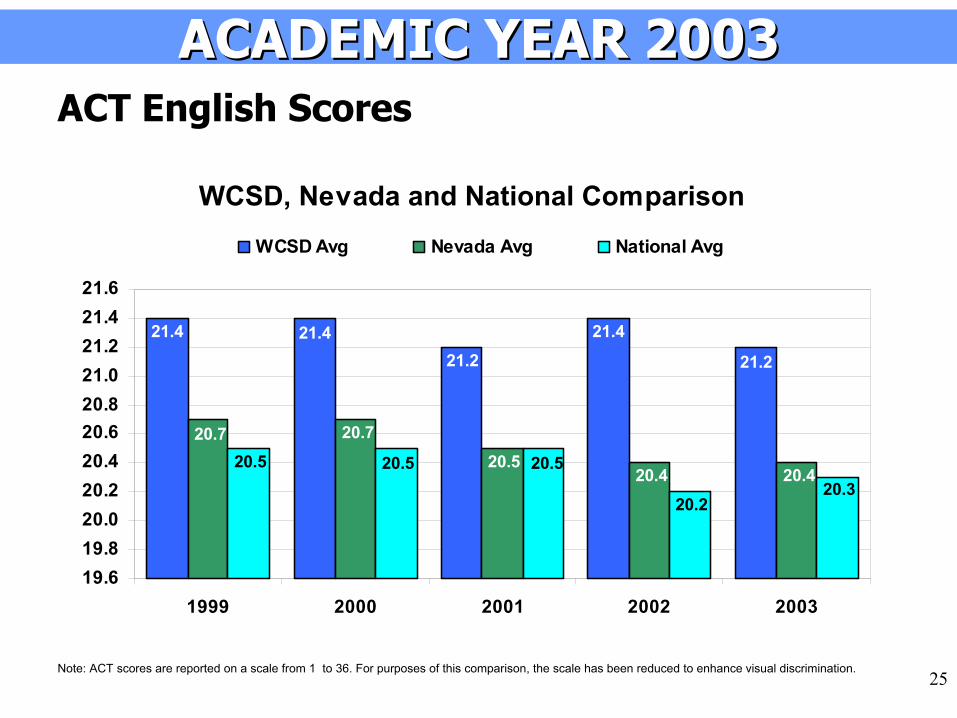
ACADEMIC YEAR 2003ACADEMIC YEAR 2003ACT English Scores
Note: ACT scores are reported on a scale from 1 to 36. For purposes of this comparison, the scale has been reduced to enhance visual discrimination.
WCSD, Nevada and National Comparison
21.2
21.421.2
21.421.4
20.420.420.5
20.720.7
20.320.2
20.520.520.5
19.619.820.020.220.420.620.821.021.221.421.6
1999 2000 2001 2002 2003
WCSD Avg Nevada Avg National Avg
26
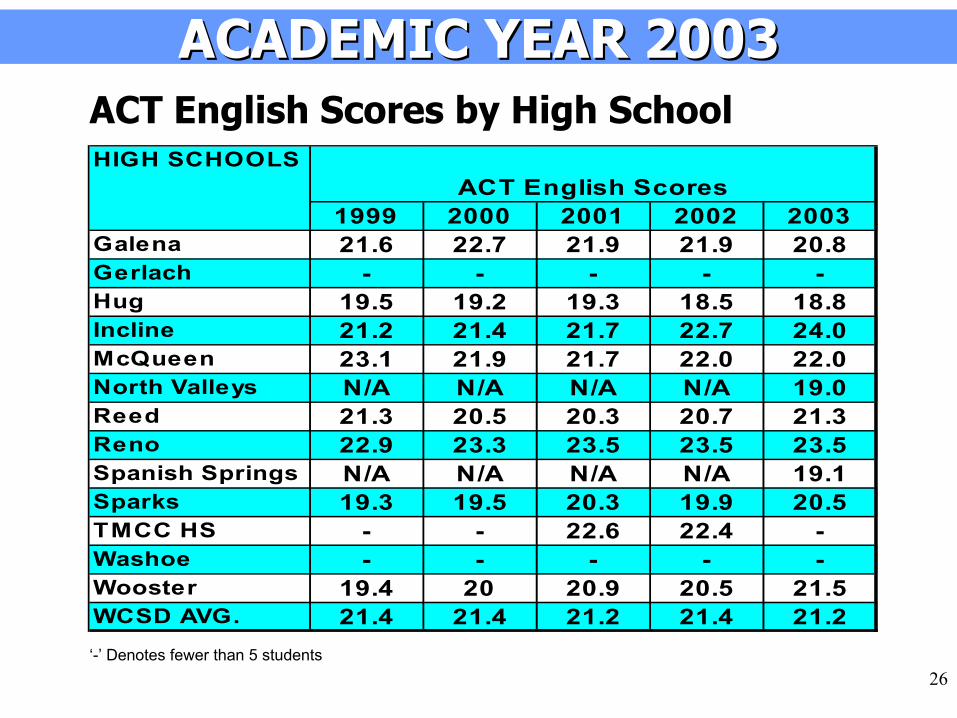
ACADEMIC YEAR 2003ACADEMIC YEAR 2003ACT English Scores by High School
‘-’ Denotes fewer than 5 students
HIGH SCHOOLS
1999 2000 2001 2002 2003Galena 21.6 22.7 21.9 21.9 20.8Gerlach - - - - -Hug 19.5 19.2 19.3 18.5 18.8Incline 21.2 21.4 21.7 22.7 24.0McQueen 23.1 21.9 21.7 22.0 22.0North Valleys N/A N/A N/A N/A 19.0Reed 21.3 20.5 20.3 20.7 21.3Reno 22.9 23.3 23.5 23.5 23.5Spanish Springs N/A N/A N/A N/A 19.1Sparks 19.3 19.5 20.3 19.9 20.5TMCC HS - - 22.6 22.4 -Washoe - - - - -Wooster 19.4 20 20.9 20.5 21.5WCSD AVG. 21.4 21.4 21.2 21.4 21.2
ACT English Scores

27
1185
1092
1166
1066
992
40%
42%
46%47%48%
850
900
950
1000
1050
1100
1150
1200
1999 2000 2001 2002 200336%
38%
40%
42%
44%
46%
48%
50%Total Tested Percentage of Graduates Tested
ACT Participation WCSD Graduates Taking ACT
ACADEMIC YEAR 2003ACADEMIC YEAR 2003

28
ACADEMIC YEAR 2003ACADEMIC YEAR 2003ACT Participation- WCSD Graduates Taking ACT by High School
*Total numbers are higher than sum of individual schools because Gerlach, TMCC, & Washoe do have some students who take the ACT, but fewer than 20 students were tested in some years.
Number % Number % Number % Number % Number %Galena 135 48% 185 60% 133 46% 178 46% 183 55%Gerlach - - - - - - - - - -Hug 53 22% 72 30% 92 32% 78 25% 48 24%Incline 49 54% 41 50% 31 33% 27 33% 35 42%McQueen 182 54% 206 59% 211 57% 228 55% 229 54%North Valleys N/A N/A N/A N/A N/A N/A N/A N/A 103 45%Reed 200 48% 215 50% 251 56% 225 49% 223 51%Reno 150 48% 147 46% 168 52% 137 43% 124 42%Spanish Springs N/A N/A N/A N/A N/A N/A N/A N/A 72 37%Sparks 124 47% 109 45% 138 48% 109 39% 66 36%TMCC HS - - - - 40 38% 37 30% - -Washoe - - - - - - - - - -Wooster 79 41% 72 32% 90 42% 64 28% 71 40%Total 992 48% 1066 47% 1166 46% 1092 40% 1185 42%
200320022000 2001HIGH SCHOOLS 1999

29
ACADEMIC YEAR 2003ACADEMIC YEAR 2003SAT Verbal Scores
WCSD, Nevada and National Comparison
524530 529
533539
512 510 509 509 510505 505 506 504
507
480
490
500
510
520
530
540
550
1999 2000 2001 2002 2003
WCSD Avg Nevada Avg National Avg
Note: SAT scale is 200-800, with 500 considered “average.”

30
ACADEMIC YEAR 2003ACADEMIC YEAR 2003SAT Verbal Scores by High School
Schools not reported had fewer than 20 students tested.
HIGH SCHOOLS
1999 2000 2001 2002 2003Galena 523 531 526 519 531Gerlach - - - - -Hug 507 500 515 479 -Incline 530 508 540 526 533McQueen 552 545 530 549 564North Valleys N/A N/A N/A N/A 486Reed 512 509 510 517 534Reno 541 558 549 559 558Spanish Springs N/A N/A N/A N/A 484Sparks 480 508 492 532 -TMCC HS - 514 580 571 559Washoe - - - - -Wooster 483 500 522 512 525WCSD AVG. 524 530 529 533 539
SAT Verbal Scores

31
ACADEMIC YEAR 2003ACADEMIC YEAR 2003SAT Math Scores
WCSD, Nevada and National Comparison
550544
535533530
517518515517517
519516514514
511
490
500
510
520
530
540
550
560
1999 2000 2001 2002 2003
WCSD Avg Nevada Avg Nat'l Avg
Note: SAT scale is 200-800, with 500 considered “average.”

32
ACADEMIC YEAR 2003ACADEMIC YEAR 2003SAT Math Scores by High School
Schools not reported had fewer than 20 students tested.
HIGH SCHOOLS
1999 2000 2001 2002 2003Galena 525 531 527 529 534Gerlach - - - - -Hug 501 498 523 522 -Incline 522 525 549 530 564McQueen 561 548 552 562 579North Valleys N/A N/A N/A N/A 511Reed 524 526 517 533 546Reno 545 552 546 560 566Spanish Springs N/A N/A N/A N/A 500Sparks 474 511 514 536 -TMCC HS - 520 549 551 550Washoe - - - - -Wooster 509 513 536 545 534WCSD AVG. 530 533 535 544 550
SAT Math Scores

33
ACADEMIC YEAR 2003ACADEMIC YEAR 2003
SAT Participation WCSD Graduates Taking SAT
903
858
810
870
817
38%
36%
32% 32%
32%
760780800820840
860880900920
1999 2000 2001 2002 200328%
30%
32%
34%
36%
38%
40%
Total Tested Percentage of Graduates Tested
34
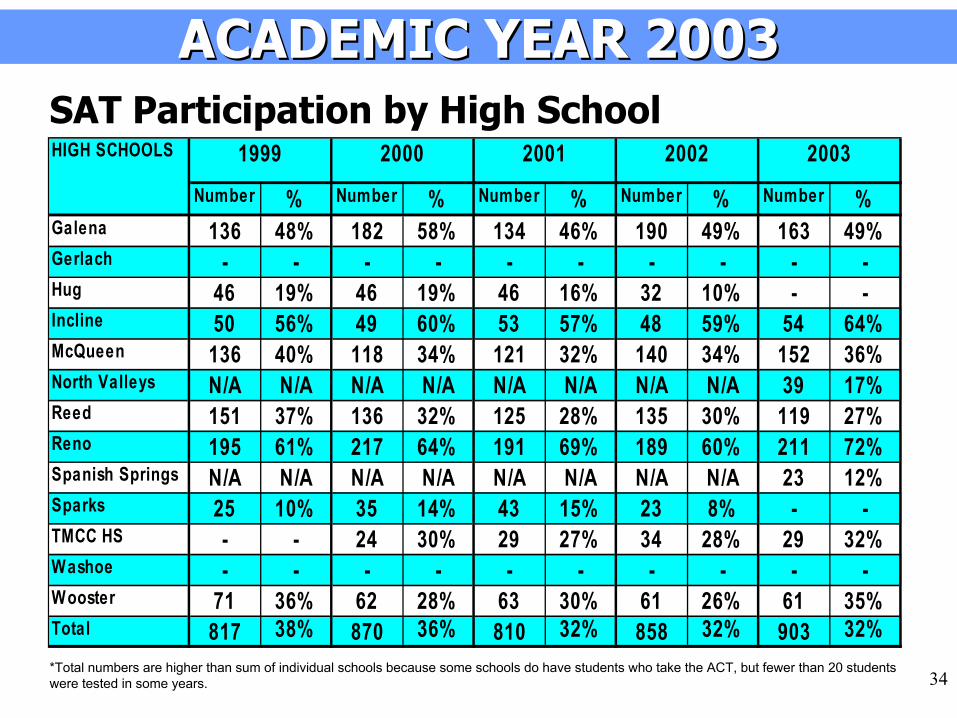
ACADEMIC YEAR 2003ACADEMIC YEAR 2003SAT Participation by High School
*Total numbers are higher than sum of individual schools because some schools do have students who take the ACT, but fewer than 20 students were tested in some years.
Number % Number % Number % Number % Number %Galena 136 48% 182 58% 134 46% 190 49% 163 49%Gerlach - - - - - - - - - -Hug 46 19% 46 19% 46 16% 32 10% - -Incline 50 56% 49 60% 53 57% 48 59% 54 64%McQueen 136 40% 118 34% 121 32% 140 34% 152 36%North Valleys N/A N/A N/A N/A N/A N/A N/A N/A 39 17%Reed 151 37% 136 32% 125 28% 135 30% 119 27%Reno 195 61% 217 64% 191 69% 189 60% 211 72%Spanish Springs N/A N/A N/A N/A N/A N/A N/A N/A 23 12%Sparks 25 10% 35 14% 43 15% 23 8% - -TMCC HS - - 24 30% 29 27% 34 28% 29 32%Washoe - - - - - - - - - -Wooster 71 36% 62 28% 63 30% 61 26% 61 35%Total 817 38% 870 36% 810 32% 858 32% 903 32%
HIGH SCHOOLS 1999 200320022000 2001

35
ACADEMIC YEAR 2003ACADEMIC YEAR 2003
Percent of WCSD Juniors and Seniors Enrolled in Advanced Placement Courses
15.5 16.1 16.019.2 20.7
0.0
5.0
10.0
15.0
20.0
25.0
30.0
1999 2000 2001 2002 2003Note: AP data updated and corrected since previous publications. Percent is based on the number of students eligible to take any AP exams. Previous data included a duplicate count for students enrolled in more than one subject area.
Enrollment in College Preparation Courses

36Note: Gerlach did not have any AP students in 2003. There are no AP classes offered at Washoe or TMCC. This was the first graduating class for North Valleys and Spanish Springs high schools.
ACADEMIC YEAR 2003ACADEMIC YEAR 2003Percentage of 2003 Graduates Who Took at Least 1 AP or IB Exam
as Juniors or Seniors
12.9
16
16.5
26.7
36.7
37.4
38.6
38.9
42.5
43.2
0 5 10 15 20 25 30 35 40 45 50
Hug
Sp.Springs
No. Valleys
Reed
Sparks
McQueen
Wooster
Galena
Reno
Incline
Percentage of Graduates Who Took AP or IB Exams

37
ACADEMIC YEAR 2003ACADEMIC YEAR 2003Enrollment in College Preparation Courses
Percent of all WCSD Students Enrolled in Advanced Math and Science Courses
30.4%
15.8%
33.8%
17.2%
32.8%
19.7%19.4%21.6%
23.6%22.5%
0.0%
5.0%
10.0%
15.0%
20.0%
25.0%
30.0%
35.0%
40.0%
Advanced Math (Algebra 3 and Above) Advanced Science (Chemistry andAbove)
1999 2000 2001 2002* 2003*
* Definition of Advanced Math changed from Geometry to Algebra 3 in the 2002 school year. Comparisons with previous years would therefore be invalid.

38
ACADEMIC YEAR 2003ACADEMIC YEAR 2003Enrollment in Advanced Placement Courses
Note: Several corrections have been made for data from previous years to eliminate duplicate counting of students taking more than one exam. AP courses are not offered at TMCC and Washoe high schools.
High Schools
1999 2000 2001 2002 2003 1999 2000 2001 2002 2003 1999 2000 2001 2002 2003Galena 715 737 774 746 785 151 185 188 205 235 21% 25% 24% 27% 30%Gerlach - - - 15 - - - - 3 0 N/A N/A N/A 20% N/AHug 791 902 831 519 385 68 66 62 34 41 9% 7% 7% 7% 11%Incline 206 209 188 174 177 42 50 53 51 48 20% 24% 28% 29% 27%McQueen 809 854 903 875 881 205 211 216 256 268 25% 25% 24% 29% 30%N. Valleys N/A N/A N/A 253 522 N/A N/A N/A 30 51 N/A N/A N/A 12% 10%Reed 1052 1086 1095 974 892 88 120 103 163 141 8% 11% 9% 17% 16%Reno 801 836 786 677 670 203 188 200 219 263 25% 22% 25% 32% 39%Sp. Springs N/A N/A N/A 252 503 N/A N/A N/A 11 37 N/A N/A N/A 4% 7%Sparks 701 719 805 545 383 51 63 68 110 91 7% 9% 8% 20% 24%TMCC HS - - - - - N/A N/A N/A N/A N/A N/A N/A N/A N/A N/AWashoe - - - - - N/A N/A N/A N/A N/A N/A N/A N/A N/A N/AWooster 588 625 631 508 495 67 77 76 74 71 11% 12% 12% 15% 14%WCSD 5663 5968 6013 5538 5693 875 959 967 1156 1246 15% 16% 16% 19% 21%
Juniors and Seniors Enrolled Number of AP Candidates Percentage of Juniors and Seniors Taking AP Exams

39
ACADEMIC YEAR 2003ACADEMIC YEAR 2003Enrollment in Advanced Math CoursesBased on Enrollment in Grades 9-12
Beginning in 2002, Advanced Math includes Algebra 3-4, Trigonometry, Pre-Calculus, Probability/ Statistics, AP Calculus, AP Statistics. Prior to 2002, Advanced Math also included Geometry and Formal Geometry.
High Schools
1999 2000 2001 2002 2003 1999 2000 2001 2002 2003 1999 2000 2001 2002 2003Galena 1562 1626 1706 1837 1935 586 727 712 443 564 38% 45% 42% 24% 29%Gerlach N/A N/A 37 35 28 N/A N/A 18 13 7 N/A N/A 49% 37% 25%Hug 1961 2072 2087 1313 1245 303 376 332 120 114 15% 18% 16% 9% 9%Incline 442 440 430 399 405 188 202 177 118 116 43% 46% 41% 30% 29%McQueen 1841 1973 2007 1955 1968 754 913 952 611 606 41% 46% 47% 31% 31%N. Valleys N/A N/A N/A 1373 1773 N/A N/A N/A 90 317 N/A N/A N/A 7% 18%Reed 2379 2461 2515 2217 2180 717 836 924 529 639 30% 34% 37% 24% 29%Reno 1723 1732 1722 1647 1726 806 879 825 556 598 47% 51% 48% 34% 35%Sp. Springs N/A N/A N/A 1184 1549 N/A N/A N/A 141 270 N/A N/A N/A 12% 17%Sparks 1780 1842 1952 1307 1195 457 510 524 193 161 26% 28% 27% 15% 13%TMCC HS 188 210 208 209 165 84 41 27 22 33 45% 51% 13% 11% 20%Washoe 589 647 656 542 519 30 - 9 - - 5% N/A 1% N/A N/AWooster 1431 1478 1519 1525 1532 305 401 370 176 221 21% 27% 24% 12% 14%WCSD 13896 14481 14839 15543 16220 4230 4899 4870 3012 3646 30% 34% 33% 19% 22%
Total Enrollment Number Enrolled in Advanced Math
Percentage Enrolled in Advanced Math

40
ACADEMIC YEAR 2003ACADEMIC YEAR 2003Enrollment in Advanced Science CoursesBased on Enrollment in Grades 9-12
Advanced Science includes Chemistry, Biochemistry, Human Biology, Human Anatomy and Physiology, Microbiology, Physics and AP Biology, Chemistry, Environmental Science, and Physics.
High Schools
1999 2000 2001 2002 2003 1999 2000 2001 2002 2003 1999 2000 2001 2002 2003Galena 1562 1626 1706 1837 1935 326 379 525 606 601 21% 23% 31% 33% 31%Gerlach N/A N/A 37 35 28 N/A N/A 11 7 9 N/A N/A 30% 20% 32%Hug 1961 2072 2087 1313 1245 142 184 219 161 170 7% 9% 10% 12% 14%Incline 442 440 430 399 405 57 86 79 89 87 13% 20% 18% 22% 21%McQueen 1841 1973 2007 1955 1968 374 419 497 555 554 20% 21% 25% 28% 28%N. Valleys N/A N/A N/A 1373 1773 N/A N/A N/A 202 427 N/A N/A N/A 15% 24%Reed 2379 2461 2515 2217 2180 360 470 461 523 589 15% 19% 18% 24% 27%Reno 1723 1732 1722 1647 1726 437 428 539 574 617 25% 25% 31% 35% 36%Sp. Springs N/A N/A N/A 1184 1549 N/A N/A N/A 171 366 N/A N/A N/A 14% 24%Sparks 1780 1842 1952 1307 1195 273 315 358 203 203 15% 17% 18% 16% 17%TMCC HS 188 210 208 209 165 - - - - - N/A N/A N/A N/A N/AWashoe 589 647 656 542 519 - - - - - N/A N/A N/A N/A N/AWooster 1431 1478 1519 1525 1532 222 201 237 271 206 16% 14% 16% 18% 13%WCSD 13896 14481 14839 15543 16220 2191 2493 2926 3362 3829 16% 17% 20% 22% 24%
Total Enrollment Number Enrolled in Advanced Science
Percentage Enrolled in Advanced Science

41
Capture Rate: The percentage of students enrolling at UNR/TMCC in the fall 2003 who graduated from a WCSD high school in spring 2003Remediation: Student enrollment in developmental English or math courses (intermediate algebra and below)
Persistence: The percent of a cohort that returns with each advancing semesterCollege Entrance Exams: SAT and ACT scores of WCSD graduates attending the University of Nevada, Reno.
Measures
COLLEGE DATACOLLEGE DATA

42
The tracking of WCSD high school graduates from high school to TMCC and UNR.
• 2002-03 Graduates = 2635 • 2001-02 Graduates = 2560• 2000-01 Graduates = 2429• 1999-00 Graduates = 2243• 1998-99 Graduates = 2227
Does not include Academy for Career Education and I Can Do Anything charter high schools or Washoe Adult high school.
COLLEGE DATACOLLEGE DATA
Cohort Analysis

43
COLLEGE DATACOLLEGE DATACollege-Going Rate
Definition: Enrollment of recent high school graduates in post-secondary education (as degree or non-degree seeking students) in the semester immediately following graduation from high school (note: national rate includes graduates from public & private high schools)Source: U.S. Census Bureau - Current Population Survey 2002, UCCSN February 2004 Remedial Report, WCSD Data Profile, National Student Clearinghouse
9.7%
54.6%
1.8%
48.3%
65.2%
0.0%
10.0%
20.0%
30.0%
40.0%
50.0%
60.0%
70.0%
National Fall 2002 UCCSN Fall 2003 WCSD Fall 2003
% o
f Gra
duat
es
Total
Out of state
Other NV colleges
UNR & TMCC

44
COLLEGE DATACOLLEGE DATACapture Rate of High School Cohort by UNR/TMCC
*Numbers may not total due to students co-enrolled at both institutions.
46%
21%25%
48%
19%
29%
50%
23%29%
51%
24%28%
55%
26%30%
0%
10%
20%
30%
40%
50%
60%
UNR TMCC Total
1999 2000 2001 2002 2003

45
COLLEGE DATACOLLEGE DATACombined Capture Rate (TMCC and UNR) by High School
% N % N % N % N % NGalena 47% 134 55% 168 57% 159 52% 196 61% 197Gerlach 33% 3 29% 2 42% 5 10% 1 67% 2Hug 37% 90 39% 83 43% 119 36% 107 42% 79Incline 27% 24 33% 26 26% 23 37% 30 30% 24McQueen 53% 180 55% 185 61% 225 60% 240 62% 260No Valleys 42% 91Reed 49% 202 49% 204 49% 217 51% 226 55% 237Reno 40% 128 46% 148 52% 167 51% 161 58% 170Span Spgs 51% 95Sparks 40% 101 44% 104 44% 121 47% 122 56% 95TMCC HS 51% 37 66% 51 62% 64 78% 95 80% 73Washoe 66% 35 78% 28 33% 29 77% 37 57% 37Wooster 48% 95 37% 78 52% 107 45% 94 48% 80Total 46% 1029 48% 1077 50% 1236 51% 1309 55% 1440
Fall 03Fall 01 Fall 02HIGH SCHOOLS
Fall 99 Fall 00
46
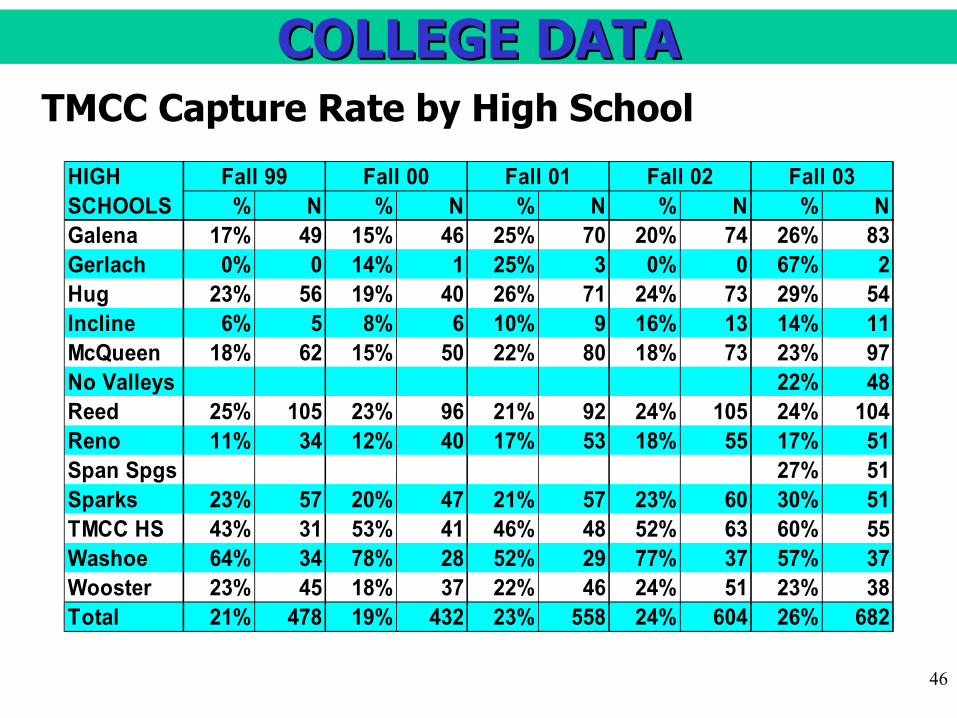
COLLEGE DATACOLLEGE DATATMCC Capture Rate by High School
% N % N % N % N % NGalena 17% 49 15% 46 25% 70 20% 74 26% 83Gerlach 0% 0 14% 1 25% 3 0% 0 67% 2Hug 23% 56 19% 40 26% 71 24% 73 29% 54Incline 6% 5 8% 6 10% 9 16% 13 14% 11McQueen 18% 62 15% 50 22% 80 18% 73 23% 97No Valleys 22% 48Reed 25% 105 23% 96 21% 92 24% 105 24% 104Reno 11% 34 12% 40 17% 53 18% 55 17% 51Span Spgs 27% 51Sparks 23% 57 20% 47 21% 57 23% 60 30% 51TMCC HS 43% 31 53% 41 46% 48 52% 63 60% 55Washoe 64% 34 78% 28 52% 29 77% 37 57% 37Wooster 23% 45 18% 37 22% 46 24% 51 23% 38Total 21% 478 19% 432 23% 558 24% 604 26% 682
Fall 03Fall 02Fall 01HIGH SCHOOLS
Fall 99 Fall 00

47
COLLEGE DATACOLLEGE DATAUNR Capture Rate by High School
% N % N % N % N % NGalena 30% 86 41% 126 33% 91 33% 125 37% 120Gerlach 33% 3 14% 1 17% 2 10% 1 0% 0Hug 14% 34 18% 43 18% 51 11% 34 13% 25Incline 21% 19 25% 20 17% 15 21% 17 16% 13McQueen 36% 122 41% 136 40% 148 43% 170 40% 169No Valleys 20% 43Reed 23% 97 27% 112 30% 131 28% 122 32% 137Reno 30% 94 34% 111 38% 120 34% 107 42% 123Span Spgs 24% 44Sparks 17% 44 25% 58 23% 65 24% 63 28% 47TMCC HS 8% 6 16% 12 18% 19 26% 32 30% 27Washoe 2% 1 0% 0 0% 0 0% 0 0% 0Wooster 25% 50 20% 41 30% 61 21% 44 25% 42Total 25% 556 29% 660 29% 703 28% 715 30% 790
Fall 03Fall 02Fall 01HIGH SCHOOLS
Fall 99 Fall 00

48
Remediation Rates of Recent Nevada High School Graduates Enrolling in the UCCSN - Fall 2003
(students enrolled in at least one remedial course in first semester of college immediately following high school graduation)
61%
43%
28%35%
0%
10%
20%
30%
40%
50%
60%
70%
NV High SchoolGraduates Enrolling in
NV Universities
WCSD GraduatesEnrolling at UNR
NV High SchoolGraduates Enrolling in
NV CommunityColleges
WCSD GraduatesEnrolling at TMCC
COLLEGE DATACOLLEGE DATARemediation
Source: UCCSN February 2004 Remedial Report, WCSD Data Profile

49
Percentage of WCSD Graduates Enrolled in a Remedial Course by Institution
18%
48%54%
21%29%
55%
28%
61%
28%
61%
0%
10%
20%
30%
40%
50%
60%
70%
UNR TMCC
Spring 99 Spring 00 Spring 01 Spring 02 Spring 03
COLLEGE DATACOLLEGE DATARemediation by Institution

50
COLLEGE DATACOLLEGE DATARemediation by High School (TMCC)
HIGH SCHOOLS % N % N % N % N % N
Galena 37% 18 39% 18 49% 34 65% 48 59% 49Gerlach 0% 0 100% 1 100% 3 0% 0 50% 1Hug 52% 29 63% 25 68% 48 59% 43 80% 43Incline 60% 3 100% 6 33% 3 77% 10 55% 6McQueen 52% 32 56% 28 47% 38 73% 53 60% 58No Valleys 71% 34Reed 54% 57 52% 50 59% 54 69% 72 63% 65Reno 32% 11 55% 22 47% 25 62% 34 47% 24Span Spgs 71% 36Sparks 61% 35 66% 31 68% 39 67% 40 65% 33TMCC HS 26% 8 15% 6 29% 14 24% 15 35% 19Washoe 53% 18 57% 16 62% 18 62% 23 57% 21Wooster 42% 19 84% 31 65% 30 59% 30 66% 25Total 48% 230 54% 234 55% 306 61% 368 61% 414
Fall 03Fall 02Fall 99 Fall 00 Fall 01

51
COLLEGE DATACOLLEGE DATARemediation by High School (UNR)
% N % N % N % N % N
Galena 20% 17 17% 22 29% 26 30% 38 28% 34Gerlach - - - - - - - - - -Hug 21% 7 28% 12 49% 25 47% 16 52% 13Incline 11% 2 30% 6 47% 7 41% 7 38% 5McQueen 16% 20 23% 31 26% 39 23% 39 24% 41No Valleys 30% 13Reed 12% 12 20% 22 30% 39 28% 34 28% 39Reno 20% 19 23% 26 26% 31 27% 29 21% 26Span Spgs 43% 19Sparks 18% 8 21% 12 23% 15 29% 18 28% 13TMCC HS 0% 0 17% 2 5% 1 6% 2 15% 4Washoe - - - - - - - - - -Wooster 30% 15 17% 7 30% 18 36% 16 29% 12Total 18% 100 21% 140 29% 201 28% 199 28% 219
Fall 03HIGH SCHOOLS
Fall 01 Fall 02Fall 99 Fall 00

52
• Nationally, 73.5% will return after 2 semesters at Universities and 55.8% at Community Colleges (2003, ACT Institutional Data Questionnaire).
• Nationally, 73.5% will return after 2 semesters at Universities and 55.8% at Community Colleges (2003, ACT Institutional Data Questionnaire).
COLLEGE DATACOLLEGE DATAPersistence Rates of WCSD Graduating Cohorts
Institution Percentage Returning After 1
Semester
Percentage Returning After 2
SemestersTMCC Spring 1999 Cohort 68% 55%Spring 2000 Cohort 70% 60%Spring 2001 Cohort 71% 56%Spring 2002 Cohort 74% 62%Spring 2003 Cohort 70% n/a UNRSpring 1999 Cohort 93% 82%Spring 2000 Cohort 90% 78%Spring 2001 Cohort 88% 78%Spring 2002 Cohort 91% 84%Spring 2003 Cohort 88% n/a

53
COLLEGE DATACOLLEGE DATAPersistence by High School at TMCC
Percentage Returning After One Semester (N = # returning)Percentage Returning After One Semester (N = # returning)
% N % N % N % N % NGalena 80% 39 65% 30 80% 56 77% 57 71% 59Gerlach - - 100% 1 33% 3 - - 100% 2Hug 79% 44 73% 29 68% 48 74% 54 65% 35Incline 60% 3 67% 4 78% 7 62% 8 55% 6McQueen 65% 40 78% 39 59% 47 73% 53 74% 72No Valleys 67% 32Reed 70% 73 74% 71 75% 69 77% 81 69% 72Reno 56% 19 70% 28 72% 38 80% 44 73% 37Span Spgs 69% 35Sparks 65% 37 72% 34 82% 47 73% 44 71% 36TMCC HS 81% 25 66% 27 75% 36 75% 47 73% 40Washoe 44% 15 61% 17 48% 14 57% 21 65% 24Wooster 67% 30 65% 24 65% 30 73% 37 74% 28Total 68% 325 70% 304 71% 395 74% 446 70% 478
Spring 03 Cohort
Spring 02 Cohort
HIGH SCHOOLS
Spring 99 Cohort
Spring 00 Cohort
Spring 01 Cohort

54
Percentage Returning After One Semester (N = # returning)Percentage Returning After One Semester (N = # returning)Percentage Returning After One Semester (N = # returning)
COLLEGE DATACOLLEGE DATAPersistence by High School at UNR
% N % N % N % N % N
Galena 97% 83 90% 113 92% 84 90% 112 89% 105Gerlach 100% 3 - - 100% 2 100% 1 - -Hug 94% 32 81% 35 84% 43 88% 30 84% 21Incline 95% 18 95% 19 93% 14 71% 12 77% 10McQueen 93% 113 91% 124 95% 140 95% 161 92% 158No Valleys 82% 36Reed 95% 92 89% 100 81% 106 90% 110 87% 123Reno 94% 88 91% 101 88% 106 96% 103 90% 111Span Spgs 86% 37Sparks 86% 38 88% 51 85% 55 92% 58 90% 43TMCC HS 83% 5 92% 11 89% 17 81% 26 78% 21Washoe - - - - - - - - - -Wooster 92% 46 93% 38 87% 53 86% 38 93% 38Total 93% 518 90% 592 88% 620 91% 651 88% 703
Spring 03 Cohort
Spring 02 Cohort
HIGH SCHOOLS Spring 99 Cohort
Spring 00 Cohort
Spring 01 Cohort

55
ACT Composite Scores of WCSD Graduating Cohorts Attending UNR
22.922.622.523.0 22.9
20
20.5
21
21.5
22
22.5
23
23.5
Spring 99Cohort
Spring 00Cohort
Spring 01Cohort
Spring 02Cohort
Spring 03Cohort
COLLEGE DATACOLLEGE DATAACT Scores

56
COLLEGE DATACOLLEGE DATASAT Scores
The Combined Verbal and Math SAT Scores of WCSD Graduating Cohorts Attending UNR
10911082
10621057
1069
1000101010201030104010501060107010801090
Spring 99Cohort
Spring 00Cohort
Spring 01Cohort
Spring 02Cohort
Spring 03Cohort
57
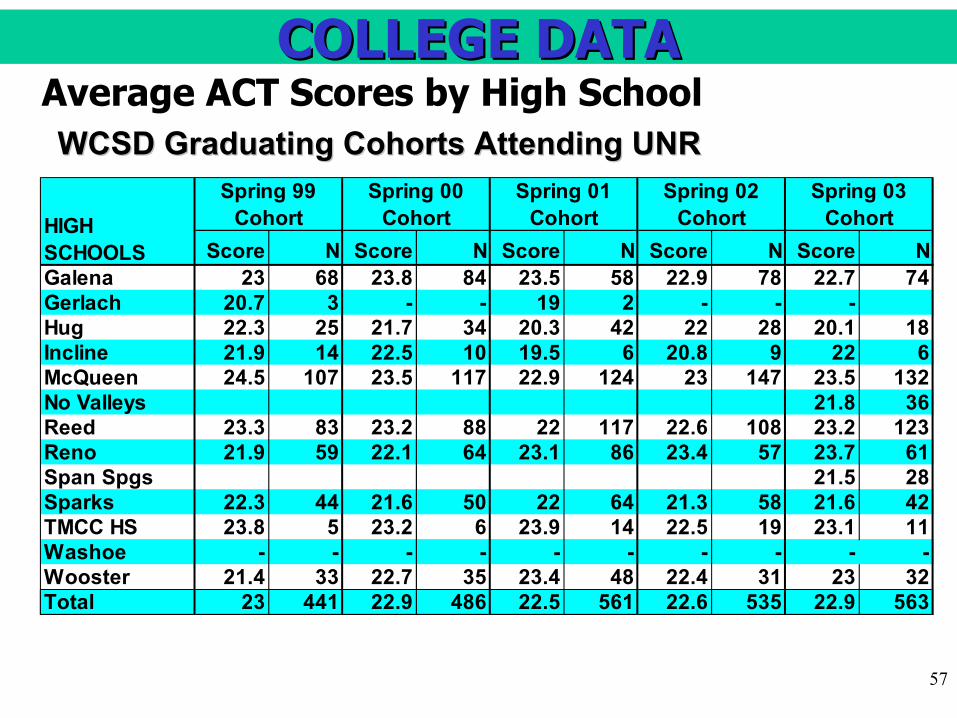
WCSD Graduating Cohorts Attending UNRWCSD Graduating Cohorts Attending UNRWCSD Graduating Cohorts Attending UNR
COLLEGE DATACOLLEGE DATAAverage ACT Scores by High School
Score N Score N Score N Score N Score NGalena 23 68 23.8 84 23.5 58 22.9 78 22.7 74Gerlach 20.7 3 - - 19 2 - - -Hug 22.3 25 21.7 34 20.3 42 22 28 20.1 18Incline 21.9 14 22.5 10 19.5 6 20.8 9 22 6McQueen 24.5 107 23.5 117 22.9 124 23 147 23.5 132No Valleys 21.8 36Reed 23.3 83 23.2 88 22 117 22.6 108 23.2 123Reno 21.9 59 22.1 64 23.1 86 23.4 57 23.7 61Span Spgs 21.5 28Sparks 22.3 44 21.6 50 22 64 21.3 58 21.6 42TMCC HS 23.8 5 23.2 6 23.9 14 22.5 19 23.1 11Washoe - - - - - - - - - -Wooster 21.4 33 22.7 35 23.4 48 22.4 31 23 32Total 23 441 22.9 486 22.5 561 22.6 535 22.9 563
Spring 03 Cohort
Spring 02 CohortHIGH
SCHOOLS
Spring 99 Cohort
Spring 00 Cohort
Spring 01 Cohort

58
WCSD Graduating Cohorts Attending UNRWCSD Graduating Cohorts Attending UNRWCSD Graduating Cohorts Attending UNR
COLLEGE DATACOLLEGE DATAAverage SAT Scores by High School
Score N Score N Score N Score N Score NGalena 1065 62 1099 86 1061 69 1062 93 1043 80Gerlach 990 2 - - 890 1 - - - -Hug 1095 18 1025 19 1053 19 992 12 1077 6Incline 1038 16 1008 16 1017 12 999 13 1034 13McQueen 1102 64 1115 68 1078 67 1113 76 1158 69No Valleys 1035 15Reed 1038 72 1058 68 1030 60 1058 74 1103 72Reno 1039 69 1053 87 1076 90 1095 85 1112 95Span Spgs 1024 22Sparks 1115 8 1030 24 1068 24 1127 13 1019 11TMCC HS 1127 3 1061 6 1133 7 1155 20 1140 13Washoe - - - - - - - - - -Wooster 1018 40 1039 24 1064 37 1098 31 1079 27Total 1057 354 1069 398 1062 386 1082 417 1091 423
Spring 03 Cohort
Spring 01 Cohort
Spring 02 Cohort
HIGH SCHOOLS
Spring 99 Cohort
Spring 00 Cohort

59
COLLEGE DATACOLLEGE DATAWCSD 2003 Graduates Enrolled in Remedial Math
at TMCC in 2003Method of Placement into Remedial Math at TMCC
Placed into remedial math based on Accuplacer or ACT scores. 88%Qualified for college-level math based on ACT or Accuplacer cut score but self-selected remedial math 3%Self-selected (no test taken) 9%
60
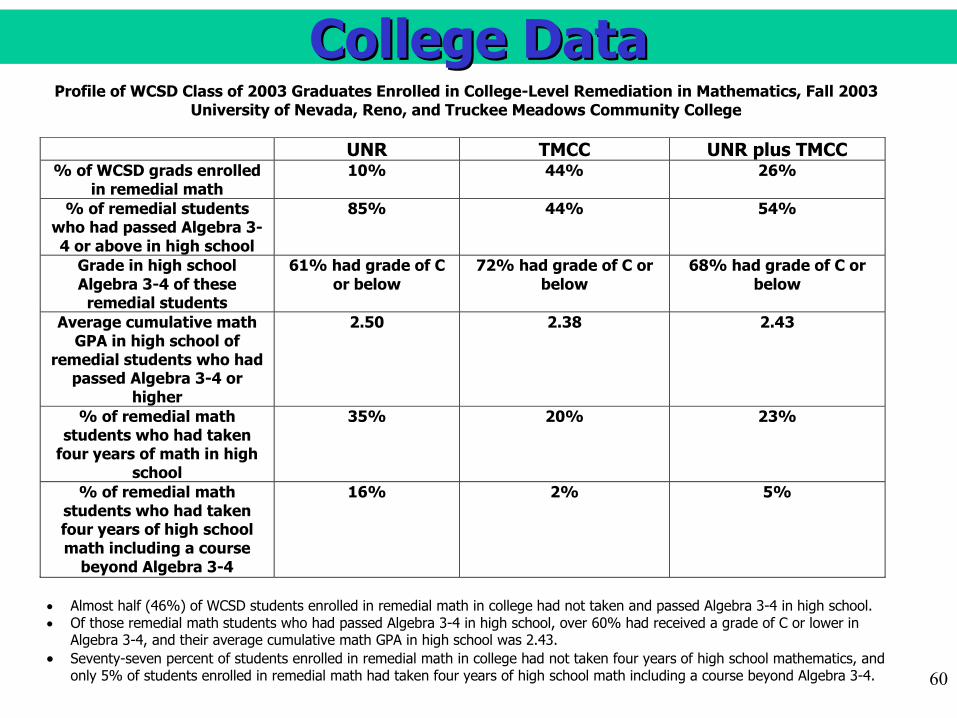
College DataCollege DataProfile of WCSD Class of 2003 Graduates Enrolled in College-Level Remediation in Mathematics, Fall 2003
University of Nevada, Reno, and Truckee Meadows Community College
UNR TMCC UNR plus TMCC % of WCSD grads enrolled
in remedial math 10% 44% 26%
% of remedial students who had passed Algebra 3-4 or above in high school
85% 44% 54%
Grade in high school Algebra 3-4 of these remedial students
61% had grade of C or below
72% had grade of C or below
68% had grade of C or below
Average cumulative math GPA in high school of
remedial students who had passed Algebra 3-4 or
higher
2.50 2.38 2.43
% of remedial math students who had taken
four years of math in high school
35% 20% 23%
% of remedial math students who had taken four years of high school math including a course
beyond Algebra 3-4
16% 2% 5%
• Almost half (46%) of WCSD students enrolled in remedial math in college had not taken and passed Algebra 3-4 in high school. • Of those remedial math students who had passed Algebra 3-4 in high school, over 60% had received a grade of C or lower in
Algebra 3-4, and their average cumulative math GPA in high school was 2.43. • Seventy-seven percent of students enrolled in remedial math in college had not taken four years of high school mathematics, and
only 5% of students enrolled in remedial math had taken four years of high school math including a course beyond Algebra 3-4.
61
SUMMARYSUMMARYSUMMARY
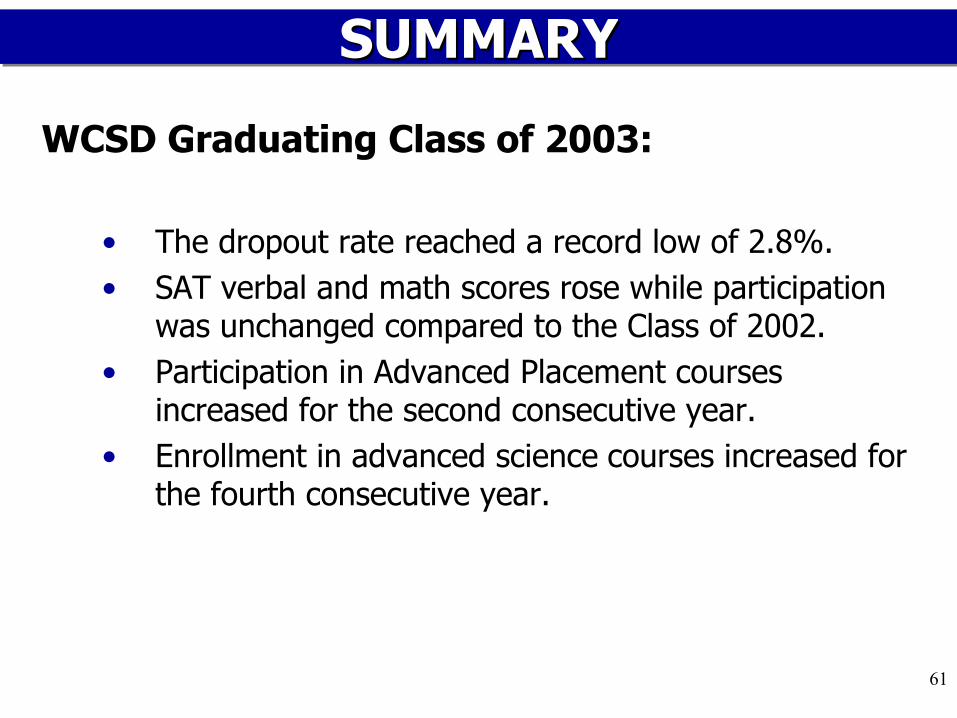
WCSD Graduating Class of 2003:
• The dropout rate reached a record low of 2.8%.• SAT verbal and math scores rose while participation
was unchanged compared to the Class of 2002. • Participation in Advanced Placement courses
increased for the second consecutive year.• Enrollment in advanced science courses increased for
the fourth consecutive year.
62
SUMMARYSUMMARY
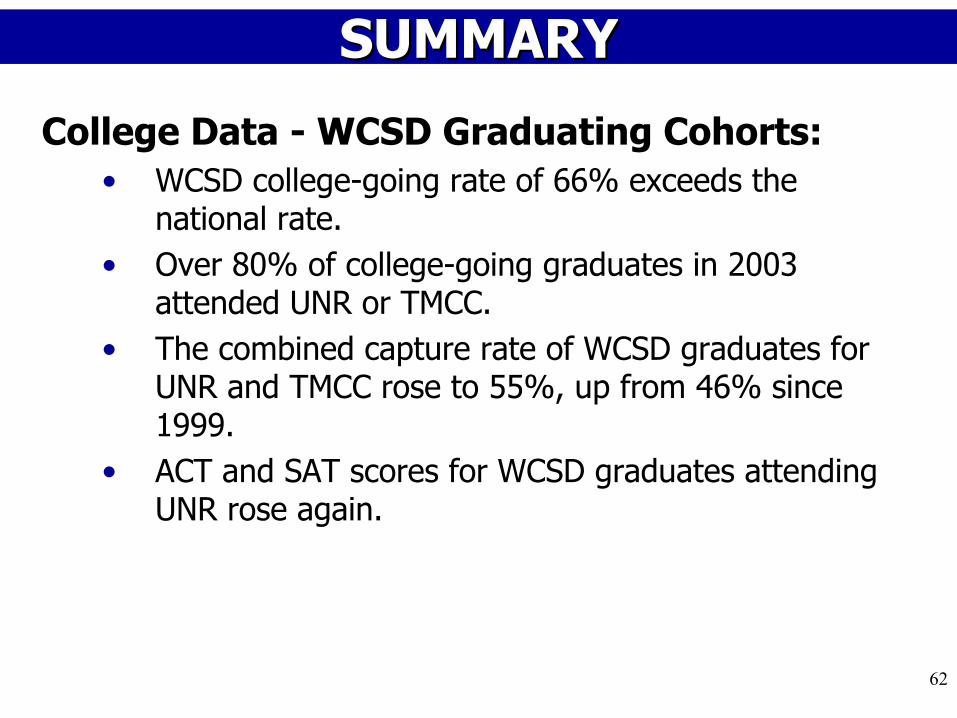
College Data - WCSD Graduating Cohorts:• WCSD college-going rate of 66% exceeds the
national rate. • Over 80% of college-going graduates in 2003
attended UNR or TMCC.• The combined capture rate of WCSD graduates for
UNR and TMCC rose to 55%, up from 46% since 1999.
• ACT and SAT scores for WCSD graduates attending UNR rose again.

63
SUMMARYSUMMARYMath Remediation at UNR and TMCC:
• Eighty-eight percent of WCSD graduates taking remedial math at TMCC are not there because of self-selection.• Twenty-six percent of WCSD 2003 graduates at UNR/TMCC took remedial math in fall 2003.• Fifty-four percent of WCSD graduates at UNR/TMCC taking remedial math had passed Algebra 3-4 or above in high school, but 68% earned C or lower.• Only 23% of WCSD graduates at UNR/TMCC taking remedial math took 4 years of high school math, only 5% going beyond Algebra 3-4.
64
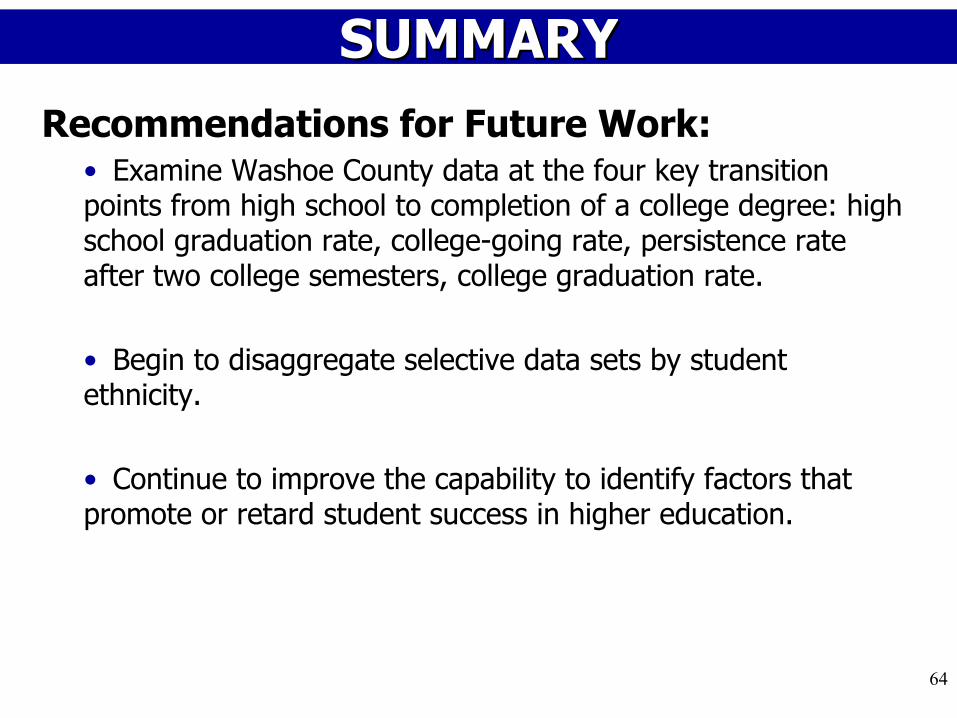
SUMMARYSUMMARYRecommendations for Future Work:
• Examine Washoe County data at the four key transition points from high school to completion of a college degree: high school graduation rate, college-going rate, persistence rate after two college semesters, college graduation rate.
• Begin to disaggregate selective data sets by student ethnicity.
• Continue to improve the capability to identify factors that promote or retard student success in higher education.
Related Documents