1 | Page Washington State Outdoor School Study Prepared by the Center for Economic and Business Research Authors: Bethany King Brianna Berkson Ellie Potts Jackson Lapinski Niki Crowe Tate Van Patten September 2021

Welcome message from author
This document is posted to help you gain knowledge. Please leave a comment to let me know what you think about it! Share it to your friends and learn new things together.
Transcript

1 | P a g e
Washington State Outdoor School Study Prepared by the Center for Economic and Business Research
Authors:
Bethany King
Brianna Berkson
Ellie Potts
Jackson Lapinski
Niki Crowe
Tate Van Patten
September 2021
2 | P a g e
Table of Contents
Table of Figures ............................................................................................................................................. 5
Table of Tables .............................................................................................................................................. 7
About the Authors ........................................................................................................................................ 8
Executive Summary ....................................................................................................................................... 9
Report Structure, Key Findings, and Recommendations ........................................................................ 10
Background on State Outdoor School Programs ................................................................................ 10
Outdoor School Landscape in Washington State ................................................................................ 11
Equity in Outdoor Education ............................................................................................................... 11
Outdoor School Best Practices and Benefits ....................................................................................... 12
Outdoor School in WA: Supply, Demand, and Cost ............................................................................ 12
Economic Impacts of Outdoor School ................................................................................................. 13
Expansion Opportunities and Partners ............................................................................................... 13
Policy and Funding Options ................................................................................................................ 14
Background on State Outdoor School Programs ........................................................................................ 15
Oregon .................................................................................................................................................... 15
Colorado .................................................................................................................................................. 16
New Mexico and Arizona ........................................................................................................................ 17
Alaska ...................................................................................................................................................... 17
Maine ...................................................................................................................................................... 18
California ................................................................................................................................................. 18
Outdoor School Landscape in Washington State........................................................................................ 19
Outdoor School Programs ....................................................................................................................... 20
Survey Results ..................................................................................................................................... 20
Program Discussion Groups ................................................................................................................ 20
Interviews of National Leaders in Outdoor Education ........................................................................ 21
Schools and School Districts ................................................................................................................... 22
Survey Results ..................................................................................................................................... 22
School Discussion Groups ................................................................................................................... 22
Equity in Outdoor Education ....................................................................................................................... 23
Distribution of Benefits ........................................................................................................................... 23
COVID-19 Impacts ................................................................................................................................... 25
Outdoor School Best Practices and Benefits............................................................................................... 26
Best Practices .......................................................................................................................................... 26
Benefits of Outdoor School Programs .................................................................................................... 27
3 | P a g e
Students .............................................................................................................................................. 27
Teachers and Schools .......................................................................................................................... 29
Outdoor Education Staff ..................................................................................................................... 29
Communities ....................................................................................................................................... 29
Outdoor School in WA: Supply, Demand, and Cost .................................................................................... 30
Demand and Annual Cost ....................................................................................................................... 30
Student Population Size ...................................................................................................................... 30
Per Student Costs ................................................................................................................................ 31
Student Participation Rate and Program Type ................................................................................... 32
Cost Modeling and Results .................................................................................................................. 34
Supply: Outdoor School Capacity ............................................................................................................ 34
Economic Impacts of Outdoor School ......................................................................................................... 37
Expansion Opportunities and Partners ....................................................................................................... 40
Expansion Within Current Providers ....................................................................................................... 40
Expansion Using State Parks and Other Facilities ................................................................................... 42
State Parks .......................................................................................................................................... 42
Department of Natural Resources ...................................................................................................... 46
Department of Fish and Wildlife ......................................................................................................... 47
Office of Superintendent of Public Instruction ....................................................................................... 48
Current Offerings ................................................................................................................................ 48
Short-Term Expansion ......................................................................................................................... 49
Long-Term Expansion and Goals ......................................................................................................... 49
Tribal Communities ................................................................................................................................. 50
Current Involvement ........................................................................................................................... 50
Potential Expansion ............................................................................................................................ 50
Other Expansion Partners ....................................................................................................................... 51
K-12 Educators .................................................................................................................................... 51
State Agencies ..................................................................................................................................... 52
Western Washington University (WWU) ............................................................................................ 52
Other Organizations ............................................................................................................................ 53
Foundations and Other Funding Partners .......................................................................................... 55
New Outdoor Education Programs ..................................................................................................... 56
Policy and Funding Options ........................................................................................................................ 57
Possible Outdoor Education Variations .................................................................................................. 57
Policy Design Considerations: Lessons from Oregon .............................................................................. 58
Career-Connected Learning .................................................................................................................... 59
Funding Strategies .................................................................................................................................. 62
Oregon Outdoor Education System .................................................................................................... 62

4 | P a g e
Washington State, No Child Left Inside .............................................................................................. 63
Other Examples ................................................................................................................................... 64
Recommendations ...................................................................................................................................... 65
Appendix A – Outdoor School Program Survey Results .............................................................................. 66
Program Attributes ................................................................................................................................. 66
Staff Attributes ........................................................................................................................................ 80
Program Capacity and Expansion Potential ............................................................................................ 83
Other Considerations .............................................................................................................................. 90
Benefits of Outdoor Education ............................................................................................................... 95
Appendix B – Outdoor School Program Discussion Groups ........................................................................ 99
Participant Background ........................................................................................................................... 99
Outdoor Education Attributes and Best Practices .................................................................................. 99
Expansion Planning ............................................................................................................................... 102
Equity and Accessibility ......................................................................................................................... 103
Appendix C – Interviews with National Leaders in Outdoor School ......................................................... 104
Outdoor Education Attributes and Best Practices ................................................................................ 105
Benefits of Outdoor Education ............................................................................................................. 107
Expansion Planning ............................................................................................................................... 108
Equity and Accessibility ......................................................................................................................... 108
Concluding Remarks.............................................................................................................................. 108
Appendix D – K-12 School and District Survey Results ............................................................................. 109
Respondent Background ....................................................................................................................... 109
Current Outdoor Education Offerings................................................................................................... 111
COVID-19 Impacts ................................................................................................................................. 128
Ideal Outdoor School Program ............................................................................................................. 130
Appendix E – K-12 School and District Discussion Groups ........................................................................ 142
Participant Background ......................................................................................................................... 142
Outdoor Education Program Attributes................................................................................................ 143
Expansion Planning ............................................................................................................................... 145
Equity and Accessibility ......................................................................................................................... 145
Benefits of Outdoor Education ............................................................................................................. 146

5 | P a g e
Table of Figures Figure 1: Washington State Workforce Development Areas ........................................................................ 9 Figure 2: Outdoor School Outcomes by Race ............................................................................................. 24 Figure 3: Outdoor School Improves/Develops Overall School Engagement .............................................. 28 Figure 4: Estimated Statewide Population of 5th OR 6th Grade Students ................................................... 31 Figure 5: Participation by Trip Length ......................................................................................................... 33 Figure 6: Participation by Trip Length and Scenario ................................................................................... 33 Figure 7: Statewide Cost by Scenario .......................................................................................................... 34 Figure 8: Estimated Statewide Outdoor Education Capacity Needed ........................................................ 36 Figure 9: Interest in Expansion.................................................................................................................... 40 Figure 10: Barriers to Expanding Capacity or Months of Operation ........................................................... 41 Figure 11: State Park ELCs and Interpretive Centers .................................................................................. 44 Figure 12: State Park Outdoor Amphitheater and Staff Capacity ............................................................... 45 Figure 13: Impact of Outdoor Education on Academics and SEL ................................................................ 60 Figure 14: Annual Spending on Outdoor Recreation Nationally................................................................. 61 Figure 15: Survey Respondents Offering vs. Not Offering Outdoor Education .......................................... 66 Figure 16: Types of Outdoor Education Program Offered (Day vs. Overnight) .......................................... 67 Figure 17: Number of Responses by County ............................................................................................... 68 Figure 18: Distribution of Responses by Workforce Development Area .................................................... 68 Figure 19: Prevalence of Dedicated Learning Lab Space ............................................................................ 70 Figure 20: Designated Learning Lab Space by Type .................................................................................... 71 Figure 21: Curriculum Provision by Program vs. Schools ............................................................................ 72 Figure 22: Academic Subjects Currently Offered ........................................................................................ 73 Figure 23: School-Led Programming Support ............................................................................................. 74 Figure 24: Activities Currently Offered ....................................................................................................... 75 Figure 25: Word cloud of “Other” Responses ............................................................................................. 75 Figure 26: Program Operations by Month .................................................................................................. 76 Figure 27: Willingness to Operate by Month and Program Type ............................................................... 78 Figure 28: Health and Safety Standards ...................................................................................................... 79 Figure 16: Staffing Structure ....................................................................................................................... 80 Figure 17: Educational, Training, or Certification Requirements for Staff ................................................. 80 Figure 18: Type of Requirements for Staff .................................................................................................. 81 Figure 19: Ease of Attracting and Retaining Staff ....................................................................................... 82 Figure 20: Total Daily Capacity by Region ................................................................................................... 83 Figure 21: Ability to host multiple groups simultaneously ......................................................................... 84 Figure 22: Gender Separation in Overnight Accommodations ................................................................... 86 Figure 23: Ability to Provide Meals ............................................................................................................. 86 Figure 24: Food Preparation and Dining Facilities Available ...................................................................... 87 Figure 25: Barriers to Expanding Months of Operation .............................................................................. 88 Figure 26: Interest in Expansion.................................................................................................................. 89 Figure 27: Best Practices Resources Word Cloud ....................................................................................... 90 Figure 28: Program Data Collection ............................................................................................................ 91 Figure 29: Languages Spoken by Staff ........................................................................................................ 91 Figure 30: Languages of Materials/Forms .................................................................................................. 92

6 | P a g e
Figure 31: Other Languages Offered for Printed Materials ........................................................................ 92 Figure 32: Physical, Mental, and Medical Needs Supported ...................................................................... 93 Figure 33: Special Camp Attributes ............................................................................................................. 94 Figure 34: Benefits for Students ................................................................................................................. 95 Figure 35: Benefits for Program Staff/ Volunteers ..................................................................................... 96 Figure 36: Benefit to Outdoor Education Organization .............................................................................. 97 Figure 37: Other Stakeholders and Benefits ............................................................................................... 98 Figure 38: Number of School Responses by County ................................................................................. 109 Figure 39: Share of responses by Workforce Development Area ............................................................. 109 Figure 40: Type of Institution .................................................................................................................... 110 Figure 41: Respondent’s Role ................................................................................................................... 110 Figure 42: Does school typically offer an outdoor education program .................................................... 111 Figure 43: Last time school offered an outdoor education program ....................................................... 111 Figure 44: Attendance of Residential vs. Day Programs and Typical Length ............................................ 112 Figure 45: What grade do students typically attend outdoor school? ..................................................... 113 Figure 46: Number of Times Students Attend Outdoor Education .......................................................... 113 Figure 47: Which Washington county is the outdoor program located in? ............................................. 114 Figure 48: How many students from your school attend outdoor school in a typical year? ................... 114 Figure 49: What percentage of eligible students choose to go to outdoor school in a typical year? ...... 115 Figure 50: Provider of Outdoor School Curriculum .................................................................................. 115 Figure 51: What subjects are typically taught during the outdoor education program ........................... 116 Figure 52: Availability of non-academic experiences ............................................................................... 117 Figure 53: Do students get to choose their activities and curriculum? .................................................... 118 Figure 54: Word Cloud - What students who do not participate do instead ........................................... 119 Figure 55: Reasons for Not Attending Outdoor School ............................................................................ 120 Figure 56: How Frequently Outdoor School Content is Referenced ........................................................ 120 Figure 57: Who provides outdoor school educators? .............................................................................. 121 Figure 58: Who provides outdoor school counsellors/chaperones? ........................................................ 121 Figure 59: What funding sources does your school use to pay for outdoor school? ............................... 123 Figure 60: Expected Family Contribution per Student .............................................................................. 124 Figure 61: Availability of scholarships ....................................................................................................... 124 Figure 62: Are students expected to provide their own supplies ............................................................. 125 Figure 63: Are there required items required that create barriers to students? ..................................... 125 Figure 64: Relative Importance of barriers affecting access to outdoor education ................................. 126 Figure 65: Collection of outcome data...................................................................................................... 127 Figure 66: Program Changes Due to COVID-19 ......................................................................................... 128 Figure 67: COVID-19 Impacts on Participation ......................................................................................... 128 Figure 68: Family Concerns During the COVID-19 Pandemic ................................................................... 129 Figure 69: Ideal Outdoor Education Grade Level ...................................................................................... 130 Figure 70: Ideal Outdoor Education Frequency ........................................................................................ 131 Figure 71: Preferred season for outdoor school ....................................................................................... 132 Figure 72: Preferred number of nights ..................................................................................................... 132 Figure 73: Anticipated Participation Rate ................................................................................................. 133 Figure 74: Ideal Curriculum Provider ........................................................................................................ 133

7 | P a g e
Figure 75: Preferred academic subjects.................................................................................................... 134 Figure 76: Preferred non-academic experiences ...................................................................................... 135 Figure 77: Preferred Customizability ........................................................................................................ 136 Figure 78: Who would you want to act as educators at outdoor school? ................................................ 137 Figure 79: Who would you want to act as camp counsellors? ................................................................. 137 Figure 80: Family Contributions ................................................................................................................ 138 Figure 81: Ranking of preferences for Outdoor education funding source .............................................. 138 Figure 82: Ways to ensure equitable access to outdoor school programs ............................................... 139
Table of Tables Table 1: Outdoor School Study Advisory Group ......................................................................................... 10 Table 2: Estimated Per Student Cost by Trip Length and Considering Overhead ....................................... 31 Table 3: 2022 Estimated Student Population and Estimated Existing Outdoor Education Capacity ......... 36 Table 4: Estimated Economic Impacts for Every $1 Million Spent on Outdoor Education/Recreation ..... 38 Table 5: Estimated Total Economic Impact for $1M Spent on Outdoor Education by Region ................... 38 Table 6: Estimated Total Economic Impacts by Outdoor School Scenario ................................................. 39 Table 2: Outdoor Education Type (Day vs. Overnight) by Region ............................................................... 67 Table 3: Number of Groups Supported by Group Size................................................................................ 69 Table 4: Number of Groups Supported by Region and Group Size ............................................................ 69 Table 5: Prevalence of Dedicated Learning Lab Space by Region ............................................................... 70 Table 6: Designated Learning Lab Space by Type and Region .................................................................... 71 Table 7: Curriculum Provision by Region and Program vs. Schools ............................................................ 72 Table 8: Number of Programs Offering Outdoor Education by Month and Region ................................... 77 Table 9: Estimated Per Student, Per Day Costs for Day and Residential Programs .................................... 79 Table 10: Maximum Capacity Distribution ................................................................................................. 83 Table 11: Minimum Capacity Distribution .................................................................................................. 84 Table 12: Average Tent, Cabin, or Dorm Capacity ...................................................................................... 85 Table 13: Maximum Overnight Capacity Distribution ................................................................................ 85 Table 14: Total Overnight Capacity by Region ............................................................................................ 85 Table 15: Dining Distribution by Capacity and Region ................................................................................ 87 Table 16: Total School Costs per Student ................................................................................................. 122 Table 17: Transportation Cost per Student .............................................................................................. 122 Table 18: Educator/Staff/Counsellor Cost per Student ............................................................................ 122 Table 19: Supplies Cost per Student ......................................................................................................... 123

8 | P a g e
About the Authors The Center for Economic and Business Research (CEBR) is an outreach center at Western Washington
University located within the College of Business and Economics. In addition to publishing the Puget
Sound Economic Forecaster, the Center connects the resources found throughout the University to
assist for-profit, non-profit, government agencies, quasi-government entities, and tribal communities in
gathering and analyzing useful data to respond to specific questions. We use a number of collaborative
approaches to help inform our clients so that they are better able to hold policy discussions and craft
decisions.
The Center employs students, staff, and faculty from across the University as well as outside resources
to meet the individual needs of those we work with. Our work is based on academic approaches and
rigor that not only provides a neutral analytical perspective but also provides applied learning
opportunities. We focus on developing collaborative relationships with our clients and not simply
delivering an end product.
The approaches we utilize are insightful, useful, and are all a part of the debate surrounding the topics
we explore; however, none are absolutely fail-safe. Data, by nature, is challenged by how it is collected
and how it is leveraged with other data sources. Following only one approach without deviation is ill-
advised. We provide a variety of insights within our work – not only on the topic at hand but also the
resources (data) that inform that topic.
We are always seeking opportunities to bring the strengths of Western Washington University to
fruition within our region. If you have a need for analysis work or comments on this report, we
encourage you to contact us at 360-650-3909 or by email at [email protected].
To learn more about CEBR visit us online at https://cebr.wwu.edu or follow us online through your
favorite social media stream.
facebook.com/westerncebr
twitter.com/PugetSoundEF
linkedin.com/company/wwu-center-for-economic-and-business-research
instagram.com/wwucebr
The Center for Economic and Business Research is directed by Hart Hodges, Ph.D. and James McCafferty.

9 | P a g e
Executive Summary The research presented within this report was conducted on behalf of the Washington State Legislature,
which requested that Western Washington University’s Center for Economic and Business Research
(CEBR):
Assess the feasibility and benefits of expanding outdoor residential school programs to equitably
serve either all fifth and sixth grade students, or only fifth or only sixth grade students statewide.
The study shall explore the equity concerns exacerbated by the COVID-19 pandemic in the areas
of outdoor recreation and outdoor learning experiences, with a focus on using physical activity
and exposure to natural settings as a strategy for improving health disparities and accelerating
learning for historically underserved populations. The study must also consider programs and
facilities at outdoor residential schools, youth camps, and state parks and assess the impact of
COVID-19 on these institutions, and recommend strategies to preserve and expand capacity for
outdoor school.
Before reading farther into this report, it is important to note that there is no standard term for type of
programs Washington State is interested exploring. In the literature, the terms outdoor school, outdoor
education, outdoor learning, environmental education, and environmental learning are all commonly
used. In some cases, “outdoor school” is used to specifically reference residential (overnight) outdoor
education. To account for the diverse needs of Washington students and best practices identified in the
literature, this report considers both residential and day programs. Throughout the report, the terms
“outdoor school” and “outdoor education” are used interchangeably to describe any program where
learning occurs outdoors, with a focus on multi-day programs.
Another important factor
to consider in this
research is the geographic
distribution of outdoor
education programs
(supply) relative to the
distribution of 5th or 6th
grade students (demand).
For this analysis, we
disaggregate data into
Washington State’s 12
Workforce Development
Areas (WFDAs). These
regions are designed to
capture typical workforce
commuting patterns. In
this study, it is assumed
that many schools looking
for outdoor education
programs will not
commute beyond their WFDA.
Figure 1: Washington State Workforce Development Areas
Source: Washington Workforce Training and Education Coordinating Board, https://www.wtb.wa.gov/planning-programs/regional-workforce-plans/

10 | P a g e
To guide the development of the research methodology and to help assure inclusion of programs, CEBR
assembled a group of 16 advisors from Washington State agencies, outdoor school advocacy
organizations, school districts, tribes, and outdoor education programs. These advisors provided
feedback on study methodology and survey development, as well as promoting the study within their
circles of influence.
Table 1: Outdoor School Study Advisory Group
Name Organization
Aliza Yair Washington State Department of Children Youth and Families
Cassie Anderson Camp Fire Snohomish County
Chase Buffington Cispus
David Troutt Nisqually Nation
Elizabeth Schmitz Washington State Office of Superintendent of Public Instruction
Ellen Ebert Washington State Office of Superintendent of Public Instruction
Greg Barker Association of Washington School Principals
John Haskin Islandwood
Jon Snyder Washington State Governor's Office
Karissa Lowe Cowlitz Tribe
Michele Branconier American Camp Association
Rex Burkholder We Win Strategy Group
Roberta McFarland Camp Waskowitz
Scott Seaman Association of Washington School Principals
Todd Graves Ridgefield School District
Trevor Greene Yakima School District
Report Structure, Key Findings, and Recommendations The report is organized to seven sections. Key findings and recommendations from each section are
summarized below. Note that grants for outdoor school are anticipated to be allocation based, not
competition based. Additionally, note that it is anticipated that each student would be able to attend
outdoor school once, either in 5th grade or 6th grade depending on the needs and preferences of the
school district. It is unlikely that 5th and 6th grade students would attend outdoor school together.
Background on State Outdoor School Programs
• The most established statewide outdoor school program is in Oregon
o The program was initially started in 1957, with updates more recently in 2016
o Oregon provides funding for all 5th or 6th grade students to attend a 3 to 5-day outdoor
school program
• Other states with some level of statewide coordination on outdoor education include Alaska,
Arizona, California, Colorado, Maine, and New Mexico

11 | P a g e
Outdoor School Landscape in Washington State
• Outdoor Education Programs
o Surveyed 86 outdoor education programs
▪ Representation from all 12 Workforce Development Areas
o Interest in expansion:
▪ 97% can expand their program or months of operation
▪ 91% have some level of interest in expansion
▪ 59% have a plan to expand, but need funding
o Barriers to expansion:
▪ Funding is a barrier for 87% of respondents
▪ Staff acquisition/retention is a barrier for 78% of respondents
▪ Facility constraints are a barrier for 73% of respondents
o A series of 5 discussion groups yielded insights into best practices, equity, and expansion
▪ Many of the findings from these groups were used to inform the “Expansion
Opportunities and Partners” section of this report
• Schools and School Districts
o Surveyed 161 schools (public/private), school districts, and homeschool organizations
▪ Representation from all 12 Workforce Development Areas
o Typical outdoor education offerings:
▪ 41% of respondents typically offer an outdoor education program
▪ 78% of these outdoor education programs are residential (overnight)
o Ideal outdoor education offerings:
▪ In an ideal world, 98% of respondents would like to offer outdoor education for
their students
▪ 79% would like to attend residential outdoor education
▪ 89% of respondents agree that providing funding to make outdoor education
free for all students is the best way to ensure equitable access
o Three discussion groups with principals and superintendents provided insight into the
benefits, equity, key attributes, and expansion of outdoor education
▪ Findings from these discussion groups helped to inform the recommendations
and partners included in the “Expansion Opportunities and Partners” section of
this report
Equity in Outdoor Education
• While all demographic groups report significant benefits from outdoor education programs,
students from disadvantaged backgrounds tend to benefit the most
o Benefits from outdoor education may spill over to help close achievement gaps and
achieve other lasting equity enhancing outcomes
• Access to outdoor school is not currently distributed equitably by race and income
• Universal access to state-funded outdoor education increases attendance by reducing financial
barriers to attendance

12 | P a g e
• Recommendation: Curriculum and camp environments should be designed to allow children
from all backgrounds and of all abilities to feel like they belong and to facilitate equitable
learning
• Washington State’s outdoor education capacity is threatened by closures due to COVID-19, thus
potentially exacerbating inequity with economic consequences for the rural economies
surrounding these programs
Outdoor School Best Practices and Benefits
• A variety of best practices for outdoor education were identified through surveys, discussion
groups, and literature reviews. Based on the literature, three key best practices stand out,
including the creation of:
o An environment purposed for exploration
o Strong connections and communication between outdoor education programs and the
communities they serve
o An emphasis on environmental stewardship among students
• The list of benefits for students who attend outdoor school is long; however, they can be
summarized in two categories – educational and SEL (social and emotional learning)
o These benefits have been shown to carry over to the classroom and persist long after
the student returns from their outdoor education experience
• In addition to students, many other groups benefit from outdoor education including:
o School teachers
o Outdoor education staff
o Communities surrounding outdoor education programs
Outdoor School in WA: Supply, Demand, and Cost
• We estimate that it would cost Washington State between $28 million (60% participation) and
$52 million (100% participation) annually to fund outdoor education for 5th or 6th grade students
o Uses per-student costs based on Oregon State University’s research and Oregon’s
threshold values for outdoor school funding
▪ Costs include provider fees, stipends/personnel expenses, program costs
incurred by the school, and unreimbursed transportation costs
o Assumes students can receive funding for 3-5 days and 0-4 nights of outdoor education
o Overall participation rate and distribution of students between overnight and daytime
programs are key factors in estimating total cost
▪ As a statewide program becomes more established, the total participation rate
is likely to increase along with participation in longer, residential programs
• Recommendation: Flexibility of funding is important, as transportation costs for outdoor
education can often be a significant barrier for schools

13 | P a g e
• To estimate whether there is sufficient outdoor school capacity in Washington State to support
all 5th or 6th grade students, we compare the outdoor education capacity reported by programs
within our survey to the regional population. Potential capacity shortages were identified in the
following Workforce Development Areas:
o Benton-Franklin
o Eastern
o Seattle-King
o Snohomish
o Southwest
o Spokane
Economic Impacts of Outdoor School
• The report also considers the economic impacts of outdoor school funding by comparing to
models:
o “Economic Analysis of Outdoor Recreation in Washington State” by Johnny Mojica and
Angela Fletcher at Earth Economics
o An economic impact analysis of the Recreational and Vacation Camps (Except
Campground) sector (NAICS 721214) using JobsEQ software
• Total sales/output economic impacts for every $1 million spent on outdoor school are estimated
between $1.65 million and $1.84 million
• Total employment impacts for every $1 million spent on outdoor school are estimated between
11.2 and 12.5 full time equivalents (FTE)
o Note that 8 of these FTEs represent a potentially approximate 16 full-time seasonal
outdoor school employees
Expansion Opportunities and Partners
• A key factor in a statewide expansion of outdoor education capacity is collaboration between
groups. Key players include:
o Current Outdoor Education Programs
o WA State Parks
o WA Department of Natural Resources
o WA Department of Fish and Wildlife
o WA Office of Superintendent of Public Instruction
o K-12 Educators
o Other State Agencies
o Western Washington University
o Other Outdoor Education and Community Groups
o Tribal Communities
o Foundations and Other Funding Partners
o New Outdoor Education Programs

14 | P a g e
• Recommendation: Fund at least one outdoor school program at a Washington State Parks and
Recreation (Parks), Department of Natural Resources (DNR), or Department of Fish and Wildlife
(WDFW) facility in each Educational Service District (ESD)
o This ensures equitable access for students in all geographic regions and offers high levels of
accessibility for students with disabilities
o Initially, Parks may just provide facilities while the school or school district provides
instruction, activities, and supervision; however, in the long term the goal would be to have
Parks staff involved in curriculum design and implementation
Policy and Funding Options
• While there is no right way to run a statewide outdoor school program, flexibility is crucial to
support the needs of all students and schools
o Areas for flexibility include duration (number of days), residential vs. day programs, and
learning outcomes
o Recommendation: Allow both residential and day programs ranging in length from 3-5 days
to be eligible for outdoor school funding
o Recommendation: Create a list of standard learning outcomes for outdoor school and
require that programs meet at least a certain number of outcomes to be eligible for funding
• Additional insights into policy design were gathered from Rita Bauer, Assistant to the Program
Leader at Oregon State University’s (OSU) Extension Service
o OSU’s Extension Service has overseen distribution of Oregon State’s outdoor school funding
to school districts since the 2017-2018 school year
• Outdoor education has strong connections to career-focused learning and the outdoor
recreation industry
o Research has shown outdoor education to benefit students in a variety of career-connected
disciplines (i.e. STEM, natural history, and sustainability) and skills (i.e. teamwork and
leadership)
• Funding strategies can include:
o Appropriations from the State general fund
o Appropriations from State lottery or other funds
o Interest on moneys in the fund
o Grants from various companies and nonprofits
o Donations (individual, foundations, associations)
o Recommendation: A key factor for the long-term success of a statewide outdoor school law
is sustainable and reliable funding. As such, appropriations from the general fund may not
be ideal because they are subject to fluctuations due to economic conditions.
• Recommendation: Washington State’s Recreation and Conservation Office (RCO), in
partnership with the Office of the Superintendent of Public Instruction (OSPI), may be well
positioned to administer funds for a statewide outdoor school grant given its experience
administering grants through the No Child Left Inside program. It is also recommended to
involve the Association of Washington School Principals within this process.

15 | P a g e
Background on State Outdoor School Programs There is a long history of outdoor school in the United States; however, few states have longstanding
statewide programs and substantial infrastructure to support them. In this section, we will consider
Oregon, Colorado, New Mexico, Arizona, Alaska, Maine, and California as case studies.
Note that for most statewide initiatives and programs, their costs per student are not publicly available.
It is also worthwhile considering program start-up and operational costs. For programs with publicly
available figures on funding, the numbers are included below. However, this is typically an annual figure
without breakdowns by cost type.
Oregon The Outdoor School program in Oregon was first established in 1957. It is geared towards serving 5th or
6th graders throughout the state. The program mostly consists of residential programs where the
students stay for between 3-5 nights. This time outdoors is packed with various learning experiences
that relate to and highlight the curriculum taught in traditional schools. One of their goals over the years
has been to make these outdoor schools inclusive, especially for children with specific needs who might
otherwise not be given outdoor school opportunities. An interesting trait of the Oregon program that is
not included in other statewide programs is its opportunities for high school students to volunteer as
counselors.
The original program had become too underfunded to reach Oregon’s outdoor school aspirations.
Through the efforts of the State Legislature, the State Lottery, and Oregon voters, Ballot Measure 99
was passed in 2016. This ballot measure secured long-term funding to help every student at the 5th or
6th grade level participate in an outdoor school program. This system of funding sets aside a minimum of
5.5 million dollars and a maximum of 22 million dollars from the state lottery ever year (adjusted
routinely for inflation over time) to allow for a reliable source of funds for outdoor school programs.
Outdoor school programs are not mandatory, but rather something that public and charter schools can
opt in. Private schools can also ask for Outdoor School funding from the Gray Family Foundation-
another collaborator looking to provide outdoor school for every student. Oregon State University’s
Extension Service department oversees the distribution of funds, as well as management, standards,
and support for outdoor schools across Oregon.
Sources:
“History of Oregon’s Outdoor School Law.” Friends of Outdoor School,
https://www.friendsofoutdoorschool.org/statewide-ods
“Lottery Dollars Support Outdoor School.” Oregon Lottery, https://www.oregonlottery.org/outdoor-school/
“Oregon Outdoor School Lottery Fund, Measure 99 (2016).” Ballotpedia,
https://ballotpedia.org/Oregon_Outdoor_School_Lottery_Fund,_Measure_99_%282016%29
Oregon State University: Extension Service Outdoor School, https://outdoorschool.oregonstate.edu

16 | P a g e
Colorado In Colorado, a statewide plan to implement outdoor education began in 2010 with the Colorado Kids
Outdoor Grant Program. From that piece of legislation, the State Board of Education was tasked with
designing a comprehensive outdoor education plan for the state’s youth that would lend itself to
increased environmental literacy in the coming generations. The plan (Colorado Environmental
Education Plan or CEEP) sought to incorporate and partner with pre-existing organizations,
communities, schools, business owners, and more to ensure long-term success.
A leadership council consisting of a variety of individuals and groups was created to implement CEEP. In
addition, there was representation from the Department of Education, the Department of Natural
Resources, and numerous other agencies that depend on and use the environment. Among other things,
CEEP has generated a wealth of writing linking school curriculum subjects to outdoor education.
The outdoor education network in Colorado is loosely organized and supported by the Colorado Alliance
for Environmental Education, a nonprofit organization. This organization helped to put together the
CEEP plan, which was created after prompting from the legislature. The CEEP plan has not resulted in a
government-sponsored or government-run program. Instead CEEP plays a supportive and collaborative
role working with the existing network of outdoor education providers, schools, families, and sponsors.
Environmental education has continued in Colorado on a case-by-case basis, with each school district
deciding what works in their situation.
Sources:
“About CAEE.” Colorado Alliance for Environmental Education, https://caee.org/about-caee
Colorado Department of Education and Department of Natural Resources. “Colorado Environmental Education
Plan: Leveraging Resources to Advance Environmental Literacy.” Colorado Department of Education, 2012,
https://cpw.state.co.us/Documents/Education/TeacherResources/CEEP/CEEP2012FINAL2.pdf
“Our Philosophy.” Colorado Outdoor Education Center, https://www.coec.info/our-philosophy.html

17 | P a g e
New Mexico and Arizona These two programs are not statewide and do not rely on government funding, yet they have impressive
coverage. Both the New Mexico (1991) and Arizona (1980) non-profit programs have existed for
multiple decades, with major updates to plans and goals within the past 5 years. The two programs
collaborate closely, since both EENM (Environmental Education of New Mexico) and AAEE (Arizona
Association for Environmental Education) work together with the Southwest Region of the USDA Forest
Service. This collaboration led to the founding of an umbrella organization: the State of Outdoor and
Environmental Learning (SOEL) which provides resources for environmental education providers,
catalogs the opportunities from the two state organizations (you can search for providers in either
state), offers resources for parents and educators, and much more. Their programs seek to integrate
environmental education with local K-12 educational curriculums.
New Mexico’s organization has a new, ambitious goals of having every child, at every grade level,
engage in some level of outdoor education every day. Both programs have a strong focus on working to
ensure equity for the children participating and provide extensive resources online outlining how they
are working towards being more equitable and inclusive. The programs embrace a wide variety of
outdoor education providers and do not have a set template for what qualifies as an outdoor school
program. They also welcome collaborations with local Native American tribes. Both programs are non-
profit organizations, so rely on funding from donations, fundraising, grants, etc.
Sources:
“EENM’s Vision, Mission, and Theory of Change.” Environmental Education of New Mexico,
https://eenm.org/about/
“The Arizona Environmental Education Certification Program.” Arizona Association for Environmental Education,
https://www.arizonaee.org/arizona-environmental-education-certification-program/
“The State of Outdoor and Environmental Learning.” Environmental Education of New Mexico,
https://public.tableau.com/app/profile/eileen.everett/viz/shared/MK793TYBH
Alaska Outdoor Education in Alaska has mostly been spearheaded by volunteers, with the main organization
being the Alaska Natural Resource and Outdoor Education Association that began in 1984. It is a
nonprofit that provides support and structure for educators, parents, and students. They also connect a
large network of providers across the state, thus making programs easy to find for schools, parents, and
students. This is quite an impressive organization and resource for Outdoor Education across Alaska.
Sources:
“Our Mission.” Alaska Natural Resource and Outdoor Education Association, https://www.anroe.net/about/

18 | P a g e
Maine There is currently no statewide program in Maine, but there are several advocacy groups and initiatives
that have surfaced recently. The Nature Based Education Consortium has several groups, one that
worked for climate education to be included in Maine’s Climate Council Action Plan. Currently, the same
group is working towards climate education legislation. A different advocacy group within the Nature
Based Consortium is focusing on telling the stories of BIPOC, LGBTQ+, and other marginalized
community members who have strong relationships with the outdoors.
While Maine does not have a statewide outdoor school program, there was a Joint Resolution passed
this year in the State Legislature recognizing the values of environmental education to better support
youth. Maine is not only prioritizing teaching students about the environment to foster environmental
awareness and compassion, but they also hope to teach about climate change to involve the next
generation in the conversation from an early age.
Sources:
“Climate Education Advocacy Working Group.” Nature Based Education Consortium,
https://www.nbeconsortium.com/climate-change-education
California In California, there is a very recent (2020) campaign to create outdoor education opportunities for
students at every grade level. This effort has a focus on equity — providing outdoor education for those
who can receive the most benefit from it and are simultaneously not likely to get the opportunity to
participate otherwise. While there is not an existing statewide program in California, it shares similar
goals to Washington State’s considerations for statewide outdoor education.
Sources:
California Statewide Outdoor Learning, https://www.californiasol.org/about

19 | P a g e
Outdoor School Landscape in Washington State Washington State has a long history with outdoor school and was a national leader in the movement in
the 1930s-1970s. The following timeline draws from research by Outdoor Schools Washington:1
1 “It All Began Here: Outdoor Schools in Washington State.” Outdoor Schools Washington, 2021, https://www.outdoorschoolswa.org
1939• First outdoor school in the United States is started near Ellensburg, WA
1940s-1950s
• Outdoor education programs run by Washington school districts are popular
1969• Washington Appoints the first Outdoor Environmental Education Supervisor
1970s• OSPI acquires and runs an outdoor education program through Cispus
1981
• OSPI delegates management of Cispus to the Washington School Principals' Education Foundation (WSPEF)
1980s-Present
• Statewide funding and support for outdoor school is inconsistent
• Outdoor school access is not equitable (only ~10% of students attend and tend to come from higher-income schools/districts)
• "Pursuant to RCW 28A.230.020 instruction about conservation, natural resources, and the environment shall be provided at all grade levels in an interdisciplinary manner through science, the social studies, the humanities, and other appropriate areas with an emphasis on solving the problems of human adaptation to the environment"
• Washington creates No Child Left Inside Grant
2021
• Washington provides the Washington School Principals' Education Foundation (WSPEF) with $10 million to send 20,000 students to outdoor school
• $4.5 million allocated to No Child Left Inside grants
• Legislature funds this study into the feasibility of state-funded outdoor school for all 5th or 6th grade students

20 | P a g e
Outdoor School Programs To better understand the outdoor school landscape in Washington, the Center for Economic and
Business Research at Western Washington University (CEBR) conducted both a quantitative survey of
outdoor education programs and a series of qualitative discussion groups. This research provides insight
into outdoor education capacity, distribution, best practices, programmatic offerings, benefits, equity,
and accessibility in Washington State.
Survey Results CEBR compiled a very broad contact list of potential outdoor education programs. These programs were
contacted weekly by email and twice by phone to remind them to participate in the survey. In addition,
the research was promoted by the American Camp Association (ACA), the Washington Outdoor School
Coalition (WOSC), and individual outdoor education programs. The survey ran from July 8th through
August 18th and gathered 124 responses.
The initial contact list was generated by both primary and secondary research, which knowingly
identifying organizations that may not offer programs. The desire was to cast a wide net to capture
information from any organization that self-identified its programming as outdoor education.
Throughout the study period additional organizations were added to the list as identified.
Of those who responded, 69 percent offer some form of outdoor education. In terms of expansion, the
most common barriers are funding and staff acquisition/retention. Over 90 percent of respondents are
willing to consider expansion either of their facility or of their months of operation. For more detailed
results, see Appendix A – Outdoor School Program Survey Results.
Program Discussion Groups To fully understand the diverse perspectives of outdoor education program stakeholders, discussion
groups were conducted during August and September of 2021. Survey participants were asked if they
would like to take part in discussion groups. Those who indicated interest were asked to sign up for two-
hour sessions to discuss their thoughts, feelings, and opinions about outdoor education.
A significant barrier to participation in this process was the timing of the research. For some providers
we requested their assistance at either a peak season (summer camps) or at the seasonal break
(dedicated outdoor education facilities) which greatly diminished their ability to participate in extended
research engagements such as a discussion group. Responses are shown in more detail in Appendix B –
Outdoor School Program Discussion Groups.

21 | P a g e
Interviews of National Leaders in Outdoor Education In addition to talking to outdoor education programs in Washington State, it was important to also
gather feedback from national leaders in the outdoor education field. Each interview covered topics
including best practices, the benefits of outdoor education, expansion planning, as well as equity and
accessibility. Detailed responses are shown in Appendix C – Interviews with National Leaders in Outdoor
School. Due to busy schedules, some interviewees were unable to provide input on some questions. The
three leaders interviewed were:
Ross Turner
Ross Turner is the president of Guided Discoveries, which offers residential outdoor education programs
at various locations within California and Virginia. He began his career as a high school science teacher
in the 1960s. Soon he realized the value of teaching science outdoors and began on a journey learning
about outdoor education programs. In 1978, Turner and his wife started a nonprofit outdoor education
program on Catalina Island in an old boarding school. Initially, they served high school students, but
later expanded to younger students. Now they have three locations that serve approximately 60,000
4th-9th grade students per year.
Tom Madeyski
Madeyski has worked since 1990 as the executive director for San Diego YMCA Camps. In the 1970s,
Madeyski worked for the YMCA in Pennsylvania as the organization began a push to offer programs
year-round. In some cases, this meant leasing out camp facilities to outdoor education providers who
were looking for residential options. In other cases, YMCA camps developed their own outdoor
education programs. He currently oversees the YMCA’s residential outdoor education programs for San
Diego.
Jane Sanborn
Jane Sanborn is co-chair of the American Camp Association’s National Government Relations
Committee, as well as the director of development at Sanborn Western Camps in Colorado and a board
member for the Colorado Outdoor Education Center (COEC). She has been involved in with summer
camps and outdoor education for more than 50 years. She described COEC as a pioneer in the realm of
summer camps that have developed and sustained successful residential outdoor education programs.

22 | P a g e
Schools and School Districts In addition to gathering data and input from outdoor education programs, the Center for Economic and
Business Research (CEBR) surveyed and conducted discussion groups with staff from public schools and
districts, private schools, and homeschool organizations. This research provides insight into pre-
pandemic outdoor education offerings by schools, COVID-19 impacts, and preferences for the future.
Survey Results CEBR received a contact list from the Association of Washington School Principals (AWSP) that included
school principals (K-12), school district superintendents, and educational service district (ESD)
superintendents. The list also included contact information for leadership in many private schools and
Bureau of Indian Education (BIE)/Tribal Schools. CEBR conducted additional research to add charter
schools, magnet schools, and homeschool organizations to the list.
Between August 2nd and September 7th, the survey gathered 161 responses. In addition to weekly email
reminders from CEBR, AWSP also promoted the research to their members. CEBR also called principals,
with a focus on schools serving 5th or 6th grade students in counties without completed survey
responses. Respondents represent all 12 Workforce Development Areas and all but 7 counties.
In typical years, 41 percent of respondents offer some form of outdoor education to their students – 63
percent in 5th grade and 42 percent in 6th grade. When asked, 98 percent of respondents reported that
they would like their students to participate in outdoor education at least once during their K-12
education. Data on responses to all survey questions are shown in Appendix D – K-12 School and District
Survey Results.
School Discussion Groups Survey participants were asked to participate in a discussion group to add more depth to the narrative
surrounding outdoor school. Respondents could choose from four dates throughout August and
September of 2021. Again, the timing of the research posed a significant barrier to participation. Most
educators were out of the office over the summer, and when they returned, they were busy planning for
school year, preparing COVID-19 precautions, and managing the first weeks of school. As such, most
survey respondents opted not to participate in further research and many who signed up for discussion
groups had last-minute issues at their schools which took precedence over the discussion groups.
Moving forward, participants would like to see student involvement in outdoor education expansion.
They also suggested that legislators visit an outdoor education program while students are there to see
the benefits for themselves. Detailed discussion group findings are presented in Appendix E – K-12
School and District Discussion Groups.

23 | P a g e
Equity in Outdoor Education Existing literature overwhelmingly supports the conclusion that Outdoor School promotes equity. While
those who benefit most from OE programs are the most historically disadvantaged, they often do not
have equal access to outdoor education. Increasing government funding can potentially help reduce
financial hurdles for students wishing to attend OE programs, thus providing more equitable access. A
further challenge will be restructuring programs and curriculums to affirm all identities, backgrounds,
and learning styles. Given the large benefits of outdoor school programs, it is essential that access to
and inclusivity of these programs is expanded.
Distribution of Benefits While literature has shown outdoor school has benefits for all students, the strongest benefits are
enjoyed by students from disadvantaged backgrounds. A study of outcomes in Oregon found Native
American students saw the largest benefits followed by Black and Hispanic students on an index of
overall social and academic outcomes, shown in the table below.2 The same study found female and
students reported greater benefits from outdoor school than male students. Students who require
behavioral supports were overwhelmingly (84 percent) reported by teachers as having been positively
impacted by outdoor education.
In the table below, outdoor school outcomes are compared by student race/ethnicity and gender. For
individual outcomes, demographics with above average positive impacts are shown in green. Note that
impacts are measured from 0 (No Impact) to 10 (Strong Impact). A result of 5 suggests that students
were “Somewhat” impacted with respect to the given outcome.
While the study suggests that some groups may benefit more than others, it is important to note that all
groups report somewhat (greater than 5) benefitting across all outcomes. Above average impacts were
seen across all 11 outcomes for American Indian/Native Alaskan students, as well as female students.
Other demographics commonly reporting above average benefits include students who identify as:
• Hawaiian/Pacific Islander (9)
• Hispanic (9)
• Mixed/Two or More Races (9)
• Black, not of Hispanic Descent (6)
While Asian, White (not of Hispanic descent), male, and non-binary students did not have reported
benefits that were above average, they are all still shown to benefit significantly from outdoor school.
The smallest benefit was seen by non-binary students with respect to “21st century skills” – 5.0 out of
10. The largest impacts were seen by American Indian/Native Alaskan students and female students
with respect to “environmental attitudes” – 8.9 out of 10.
2 Braun, Steven. “Outdoor School for All! Diverse Programming and Outcomes in Oregon 2018 Pilot
Study Evaluation” 2018. https://grayff.org/wp-content/uploads/2019/02/OSfA-Evaluation-highres-2.19.19.pdf

24 | P a g e
Figure 2: Outdoor School Outcomes by Race2
Average Student Race/Ethnicity Student Gender
Outcome Average American Indian/ Native
Alaskan
Asian Black, not of
Hispanic Descent
Hawaiian/ Pacific
Islander
Hispanic Mixed/Two or More
Races
Other White, not of
Hispanic Descent
Male Female Other or Non-
Binary
Overall Learning 7.7 7.9 7.3 7.9 8.3 8.3 7.9 7.4 7.5 7.4 8.1 7.7
(Environmental) learning 7.8 7.9 7.8 7.9 8.3 8.2 7.9 7.7 7.7 7.6 8.1 7.7
Interest/motivation to learn
6.4 7.1 6.1 6.2 6.3 6.0 6.7 6.5 6.2 6.1 6.7 6.0
Meaning/self-identity 7.2 7.7 6.9 7.3 7.3 7.6 7.5 7.1 7.0 6.7 7.6 6.8
Place connection (attachment)
7.8 8.6 7.2 6.7 6.7 8.0 8.0 7.8 7.7 7.3 8.3 7.3
Environmental attitudes 8.7 8.9 8.3 8.7 8.9 8.8 8.7 8.6 8.7 8.6 8.9 8.1
Self-efficacy 8.2 8.8 7.9 8.3 8.5 8.2 8.1 8.1 8.2 8.2 8.3 6.9
21st century skills 6.3 7.0 5.8 6.2 6.6 6.8 6.5 6.8 6.0 6.0 6.6 5.0
Actions: environmental stewardship (intentions)
7.2 7.8 7.0 7.0 7.6 7.5 7.6 7.4 7.0 6.7 7.6 6.9
Actions: cooperation/collaboration
7.1 7.6 6.9 7.2 7.6 7.6 7.4 7.4 6.7 6.7 7.4 6.3
Actions: school (positive behaviors)
7.0 7.8 6.9 7.5 7.6 7.5 7.6 7.0 6.6 6.6 7.5 5.4
Note: All groups benefitted from outdoor school (scores above 5). Green numbers represent above-average positive impacts.
Current access to outdoor education programs is not equally distributed. White students make up 70%
of outdoor school students despite making up only 49.7% of the population nationally.3 Nationally, only
3% of OE students are Black and just 7% are Latino.4Universalizing access to outdoor education has
positive implications for distributional equity. Oregon’s Measure 99 increased access to outdoor
education and reduced opportunity gaps, although specific qualitative data is not available.5 Washington
State has also made some inroads to increase access to outdoor School. Washington State was the first
state to license outdoor preschools, which resulted in increased equitability and access for students
because licensure brings state and local funds to subsidize low-income families’ enrollment.4 Increasing
access improves distributional justice (fewer students are unable to attend for financial reasons),
however curriculums must also be changed to create inclusive experiences for all.6
3 Children and Nature Network. “Connecting Youth to Outdoors With Equity”. Giving Compass,
https://givingcompass.org/article/working-toward-equity-and-inclusion-when-connecting-youth-to-the-outdoors/ 4 Deines, Tina. “The benefits of outdoor education aren’t accessible to all” HCN, 2/19/2021,
https://www.hcn.org/articles/education-the-benefits-of-outdoor-education-arent-accessible-to-all 5 “Oregon State University Equity, Diversity, and Inclusion Statement”. Oregon State University, November 2020,
https://outdoorschool.oregonstate.edu/equity-diversity-and-inclusion/equity-diversity-and-inclusion-statement/ 6 Warner, Robert and Dillenschneider, Cindy. “Universal Design of Instruction and Social Justice Education: Enhancing Equity in Outdoor Adventure Education” Journal of Outdoor Recreation, Dec 2019, https://www.researchgate.net/profile/Robert-Warner-

25 | P a g e
Work needs to be done to make outdoor education programs more inclusive. People of color may feel
out of place or that they ‘don’t belong’ in nature, especially when camps continue to have
disproportionately low minority attendance.4 Communitarian approaches to justice suggest OE program
curriculum should be restructured to acknowledge participant’s unique backgrounds.6 Ensuring that
curriculum affirms identity will be critical to student success. To improve DEI (Diversity, Equity, and
Inclusion) outcomes, camps should train workers on active listening, implicit bias, and culturally inclusive
language.7 Seemingly trivial microaggressions by staff can have the unintended effect of making some
campers feeling unwelcome or even unsafe. Even cabin names or some camp traditions can be offensive
if they are rooted in a racist legacy. While many camps have taken action in recent years to increase
focus on DEI, more work is needed, and it is important to try to maintain and accelerate efforts.
Universal Design of Instruction (UDI) can increase learning by providing information in a variety of
formats so different types of learners are all able to access curriculum equitably.6 By presenting content
in multiple formats, equitability is enhanced, and learning outcomes may improve.
COVID-19 Impacts Covid-19 threatens to shutter many outdoor camps across Washington state.8 Without additional
funding, it is uncertain whether infrastructure will remain for increased demand in future years. These
closures have disparate impacts and raise equity concerns. Seventy-four percent of communities of
color in the contiguous United States live in nature-deprived areas, compared with just 23 percent of
white communities.9 Given that many communities already have subpar access to greenspace, closing
camps could exacerbate existing inequities.8 The camps are also disproportionately in rural Washington,
which means many rural local economies that are struggling could be made worse off by a camp closure.
National data from the American camp association has found “an 85% drop in revenue, an 81% drop in
wages, a 79% drop in staff, and a 70% drop in overall participants for 2020.” To maintain future capacity
of outdoor education programs it is important to adopt policy to help struggling camps and prevent
unnecessary closures.
7/publication/337063819_Universal_Design_of_Instruction_and_Social_Justice_Education_Enhancing_Equity_in_Outdoor_Adventure_Education/links/5e73dc8b92851c35875985ef/Universal-Design-of-Instruction-and-Social-Justice-Education-Enhancing-Equity-in-Outdoor-Adventure-Education.pdf 7 Hale, Ingrid. “Understanding the Effectiveness of Diversity, Equity, and Inclusion Initiatives at Youth Summer Camps” School of Professional and Continuing Studies Nonprofit Studies Capstone Projects 14, 4/30/21, https://scholarship.richmond.edu/cgi/viewcontent.cgi?article=1013&context=spcs-nonprofitstudies-capstones 8 “Outdoor School & Covid-19” Outdoor School for All, https://outdoorschoolforall.com/outdoor-school-covid19 9 Rowland-Shea, Jenny and Doshi, Sahir. “The Nature Gap”. Center for American Progress, 07/21/21, https://www.americanprogress.org/issues/green/reports/2020/07/21/487787/the-nature-gap/
26 | P a g e
Outdoor School Best Practices and Benefits Utilizing the best practices of outdoor education can result in better outcomes and benefits to students,
staff, and community members. Formulating programs with good practices involves collaboration
between outdoor education providers, educators/schools, and community leaders to ensure success in
student learning and social objectives.
Best Practices Outdoor education throughout the United States is provided in various formats of curriculum. Practices
to create effective outdoor education learning spaces include:
• An environment purposed for exploration
• Strong connections and communication between outdoor education programs and the
communities they serve
• An emphasis on young environmental stewardship
According to Jim Parry, a leader in outdoor education at American Camp Association, “outdoor
education is most valid when it utilizes hands-on, cross-disciplinary, experience-oriented activities.”10
Rather than lectures, students learn through guided exploration where “in effect, they develop their
own outdoor science curriculum.”11 Students should use a variety of senses and learning strategies to
maximize active learning.12
Within the community, for programs to meet the needs and academic requirements of students,
communication between outdoor education programs and schools must be strong. This ensures
students are prepared to discover first-hand the concepts they were introduced to in the classroom, as
well as to build on what they learned in outdoor education back to the classroom afterward. Programs
that are local and community-oriented can better serve students by helping them understand their
land’s history, local indigenous knowledge, and environmental ethics and stewardship.13
Community ties can foster stronger outdoor education program organization and structure; however,
many programs are linked to a parent organization whose focus may not be outdoor education.14 These
close ties to an outdoor education program’s “parent” organization impede outdoor education’s
legitimacy, base, and the potential for outdoor education to expand in networking, conferences, sharing
resources and ideas.
10 Parry, Jim. “Raising the Bar: A Case for Quality Outdoor Education.” American Camp Association, Sept 2011, https://www.acacamps.org/resource-library/camping-magazine/raising-bar-case-quality-outdoor-education 11 Tringali, Melanie. “Outdoor Education.” National Institute for Student-Centered Education, May 2015, http://nisce.org/blog/best-practices/outdoor-education/ 12 “Outdoor and Environmental Education: Defining Terms, Objectives and Purposes, Instructional Methods, History and Status in the United States and Abroad.” State University, https://education.stateuniversity.com/pages/2305/Outdoor-Environmental-Education.html 13 Sabet, Michelle. “Current Trends and Tensions in Outdoor Education.” Brandon University Journal of Graduate Studies in Education, 2018, https://files.eric.ed.gov/fulltext/EJ1230274.pdf

27 | P a g e
Benefits of Outdoor School Programs The benefits of outdoor education are reaped in a
variety of sectors and groups. In this section we
will explore benefits to students who participate in
outdoor education, benefits to their teachers and
schools, benefits to outdoor education staff, and
benefits to the Washington community more
broadly.
Students Dr. Steven Braun, in collaboration with the Gray
Family Foundation and Oregon State University
identifies 12 key Environmental Education
Outcomes for the 21st Century (EE21) and find
significant positive impacts for students who
participate in outdoor school in Oregon:14
• Enjoyment: Positive emotions toward an experience
• Place Connection (Attachment): Appreciation and the development of personal relationships
and meaning with the physical location and its story
• (Environmental) Learning: Knowledge regarding the interconnectedness and interdependence
between human and environmental systems
• Interest in Learning (Motivation): Enhanced curiosity, as well as increased interest in learning
about science, the environment, or civic engagement
• 21st Century Skills: Critical thinking and problem-solving; communications; collaboration; and
creativity and innovation
• Meaning/Self Identity: Individual purpose and identity as well as positive character traits.
These may include a heightened sense of purpose, gratitude, and optimism
• Self-Efficacy: Individuals’ belief of their ability to use critical thinking to solve problems, make a
difference in their community, address environmental issues, and influence their environment
• Environmental Attitudes: Sensitivity, concern, and attitude toward the environment
• Action Orientation: Intentions to perform behaviors relevant to the program’s content or goals
• Actions – Environmental Stewardship (Intentions): Intentions to perform stewardship-related
behaviors
• Cooperative and Collaborative Actions: Cooperation and collaboration with others
• Actions – School (Positive Behaviors): Pay more attention and work harder in school
14 Braun, Steven. “Outdoor School for All! Diverse Programming and Outcomes in Oregon.” Oregon State University, 2018, https://grayff.org/wp-content/uploads/2019/02/OSfA-Evaluation-highres-2.19.19.pdf
“Outdoor education offers students an
opportunity to connect with nature…This
connection can serve both to help develop
an individual's sense of self as well as how
they connect to others and the earth.
Students practice skills to develop
perseverance and self-reliance while also
learning to become lifelong stewards of
the land.”
- An Outdoor Education Provider’s Response to
CEBR Survey Question, “What are the Key
Benefits of Outdoor Education?”

28 | P a g e
This research also finds that
many of the benefits of outdoor
education continue to be seen
when students return to their
classroom. For instance, 73
percent of teachers surveyed
reported that outdoor school
Moderately or Substantially
improved or developed their
students’ overall school
engagement.14 Within outdoor
school programs, curriculum can
be directly tied to Next
Generation Science Standards
(NGSS) and Common Core State
Standards (CCSS) to align with
and enhance students’
classroom curriculum.
Social benefits for students
include an increase in peer
connection, community,
motivation, culture, and
attitudes about school. 15 In
addition to hands-on learning,
students have more physical activity and development in outdoor learning spaces than indoor, fostering
confidence, self-awareness, and healthy habits.16 In some cases, outdoor exploration is used as
wilderness therapy for court-involved youth to “improve self-esteem, peer relationships, and
teamwork.”17 Providing outdoor exploration opportunities for all students can have similar therapeutic
effects and health benefits. Outdoor Education has also shown to increase physical activity and
positively impact physical development of youth. These benefits can be capitalized upon when outdoor
education programs collaborate with community exercise and physical activity centers.15
15 Becker, Michael. “5 Benefits of Outdoor Education.” Edutopia, April 2016, https://www.edutopia.org/blog/5-benefits-of-outdoor-education-michael-becker 16 Peacock, Jessica, April Bowling, Kevin Finn, and Kyle McInnis. “Use of Outdoor Education to Increase Physical Activity and Science Learning among Low-Income Children from Urban Schools.” American Journal of Health Education, 2021, https://www.tandfonline.com/doi/abs/10.1080/19325037.2021.1877222?journalCode=ujhe20& 17 “Wilderness Adventure Therapy for Court-Involved Youth.” Washington State Institute for Public Policy, 2019, https://www.wsipp.wa.gov/BenefitCost/Program/566
Figure 3: Outdoor School Improves/Develops Overall School Engagement
Source: Braun, Steven. “Outdoor School for All! Diverse Programming and
Outcomes in Oregon.” Oregon State University, 2018, https://grayff.org/wp-
content/uploads/2019/02/OSfA-Evaluation-highres-2.19.19.pdf
29 | P a g e
Teachers and Schools For schools, traditional outdoor education programs have their own trained staff and do not task K-12
teachers with developing and delivering outdoor education material that is outside of their training.18 In
addition, empirical evidence shows academic achievements in all subjects, critical thinking skills, GPAs,
graduation rates, engagement, and motivation increase as a result of outdoor education.19 This gives
teachers a better classroom experience and helps schools achieve their goals of helping students learn,
grow, and be successful.
Outdoor Education Staff Outdoor education staff should be trained in environmental literacy, basic ecological principles, and a
working knowledge of environmental issues. Staff can be trained through organizations such as North
American Association for Environmental Education (NAAEE), National Association for Interpretation
(NAI), Association for Challenge Course Technology, National Recreation and Park Association (NRPA),
and other programs.14 Educators can also find their own niche within an outdoor education program.
Organizations can staff educators to create cohesive programs that specialize in local environmental
flora and fauna, geology, and environmental phenomena, that are relevant to visiting schools.17
Students learn with a variety of senses in outdoor education, and benefits reaped by the educators
include teaching in their preferred methods that are not limited to a classroom. “Environmental and
out-door educators primarily advocate experiential (hands-on) learning strategies,” with “the
importance of contextual, direct, and unmediated experiences.”16 As discussed in CEBRs survey of
outdoor education programs, other benefits include career development, teaching experience, teaching
outdoors, and opportunities to use their subject matter knowledge.
Communities Outdoor education curriculum can include Indigenous perspectives and culture, local history, and local
industry (i.e. agriculture, logging, etc.), which benefits both students and the surrounding community.
In addition, outdoor education provides stable jobs and secondary economic impacts within the
community, as discussed later within this report. In the future, outdoor school could spur greater
involvement in outdoor recreation by traditionally underrepresented communities, thus leading to
better community health impacts, improved equity, and greater economic impacts.
18 Atencio, Matthew, et al. “The Place and Approach of Outdoor Learning Within a Holistic Curricular Agenda.” Journal of Adventure Education and Outdoor Learning, 2015, https://www.tandfonline.com/doi/abs/10.1080/14729679.2014.949807?journalCode=raol20 19 “Empirical Evidence Supporting Benefits of Outdoor School and Experiential Learning Programs.” Outdoor School For All, Feb 2015, http://grayff.org/wp-content/uploads/2013/10/Empirical-Evidence-Supporting-Benefits-of-Outdoor-School-and-Experiential-Learning-Programs_March-2015.pdf

30 | P a g e
Outdoor School in WA: Supply, Demand, and Cost For this analysis, we consider three models that look at different interactions between supply and
demand. For Washington State to fund outdoor school in the 2022-2023 school year, the Center for
Economic and Business Research at Western Washington University (CEBR) estimates the total cost to
be between $28 million and $52 million. This wide range of possibilities captures uncertainty
surrounding participation rates, per-student costs, program type (residential vs. day programs), and
program length.
Estimating the available capacity (supply) of outdoor education programs in Washington proves to be
more difficult than estimating demand or cost. While there are many factors that cannot be controlled
for, it is likely that there is not sufficient capacity among existing outdoor education programs to serve
all Washington 5th or 6th grade students. This highlights the need for expansion partners, which will be
discussed in more detail later in this report.
Demand and Annual Cost The total annual cost for Washington State to fund outdoor school during the 2022-2023 school year is
estimated to be between $28 million and $52 million. Key assumptions influencing the statewide cost of
such a program include:
• Size of the student population
• Per student costs
• Student participation rate
• Outdoor school program type and length
To account for uncertainty, three scenarios were developed with increasing participation rates
corresponding to increasing statewide costs. In the years following the approval of such a statewide
program, it can be assumed that schools and families will be more comfortable having students
participate in outdoor school and they may shift toward wanting to participate in longer, residential
programs.
Many assumptions used in this modeling were informed by the expertise of Rita Bauer, Assistant to the
Outdoor School Program Leader for Oregon’s statewide program. While Washington’s experience will
likely be different, its neighbor to the south currently provides the best-case study in per-student costs,
participation rates, and administrative considerations.
Student Population Size With respect to Oregon’s outdoor school law, Bauer notes that it “does not directly address the funding
of private/home schooled students, and, by not addressing them, makes access to outdoor school funds
difficult these students.” For this modeling, we choose to look at all children in Washington State,
rather than limit the scope to only students in public school. Using 2019 public school enrollment, as
reported by OSPI, it is estimated that approximately 90-92 percent of 5th and 6th grade students were
enrolled in public school prior to the pandemic.

31 | P a g e
Rather than restricting funding to
only 5th or only 6th grade students,
we assume a scenario where every
student receives state funding to
attend outdoor school once – either
in 5th or 6th grade. This provides
more flexibility for schools and
school districts to decide when their
students are ready for the
experience. It also gives smaller
schools to attend outdoor school
every other year and to combine
their 5th and 6th grade classes. In
general, it is assumed that 5th and 6th grade students would not attend outdoor school together
Washington State’s Office of Financial Management (OFM) provides population forecasts by age group
(1-year brackets).20 We assume maximum attendance to be the average of the 10, 11, and 12 age
brackets – reflecting the fact that each student receives funding once, either in 5th or 6th grade.
Per Student Costs To estimate per-student costs, we
begin with Oregon’s thresholds for
outdoor school funding during the
2019-2020, 2020-2021, and 2021-
2022 school years.21 While
schools can request more or less
funding, these values are
estimated by Oregon State
University (OSU) Extension
Service’s Outdoor School team to
cover the four main categories of
outdoor school expenses –
provider fees, stipends/personnel
expenses, program costs incurred
by the school, and unreimbursed
transportation costs – in most cases. Rita Bauer estimates that OSU’s annual administrative costs to
facilitate the program are approximately 4 percent of total costs and operational expenses average 7
20 “State Population Forecast.” Washington State Office of Financial Management, 2020, https://ofm.wa.gov/washington-data-research/population-demographics/population-forecasts-and-projections/state-population-forecast 21 “Frequently Asked Questions (FAQs).” Oregon State University Extension Service: Outdoor School, https://outdoorschool.oregonstate.edu/district-representatives/frequently-asked-questions-faqs/
Figure 4: Estimated Statewide Population of 5th OR 6th Grade Students
80,000
85,000
90,000
95,000
100,000
105,000
20
20
20
21
20
22
20
23
20
24
20
25
20
26
20
27
20
28
20
29
20
30
20
31
20
32
20
33
20
34
20
35
20
36
20
37
20
38
20
39
20
40
Estimated Statewide Population: 5th or 6th Grade
Table 2: Estimated Per Student Cost by Trip Length and Considering Overhead
WA Forecasted (Per Student, Per Trip Cost)
2022-2023 2025-2026 2028-2029 2031-2032
3 Day $175 $203 $226 $243
4 Day $342 $396 $442 $475
5 Day $375 $434 $484 $520
3 Day/2 Night $439 $508 $567 $609
4 Day/3 Night $498 $577 $643 $691
5 Day/4 Night $621 $719 $802 $862
WA Forecasted (Per Student, Per Trip Cost + Program Overhead)
2022-2023 2025-2026 2028-2029 2031-2032
3 Day $194 $225 $251 $270
4 Day $380 $440 $491 $527
5 Day $416 $482 $537 $577
3 Day/2 Night $487 $564 $629 $676
4 Day/3 Night $553 $640 $714 $767
5 Day/4 Night $690 $798 $890 $957
32 | P a g e
percent of total costs. OSU has conducted extensive research into the fully-burdened costs of outdoor
school and updates their thresholds annually based on their research and the data collection.
We begin to estimate per-student costs in Washington using OSU’s threshold values and increasing costs
by 1.6 percent to account for differences in the cost of living.22 The other factor to consider is annual
cost increases. Between the 2020-2021 and 2021-2022 school years, OSU increased threshold costs by
approximately 6 percent. Our modeling assumes a similar growth rate for the 2022-2023 school year,
with the growth rate declining linearly to 2 percent in 2031-2032. The 2 percent growth rate reflects
inflation and assumes that by this point most outdoor education programs understand their fully
burdened costs, have expanded sufficiently to meet demand, are operating efficiently, and are able to
capitalize on their economies of scale.
While CEBR’s surveys of schools and outdoor education programs asked for cost estimates, the resulting
data is not usable for this analysis. Some schools and programs report total group costs while others
report per-student costs; some report total program costs while others report daily or hourly rates; and
others reported that costs vary depending on a variety of factors. As such, no comparisons can be made
between the survey data and the threshold values used in this analysis.
Student Participation Rate and Program Type Pre-pandemic, Bauer estimates that approximately 81 percent of students (an average of 5th and 6th
grade) participated in outdoor education and that 95 percent of those who participate were in a
residential outdoor education program. For Washington State, we consider 3 scenarios:
• Low Participation/Cost: This scenario may be more representative of the early years of a
statewide program, with capacity restrictions and community hesitation leading to low
participation and high utilization of day programs. Based on CEBR’s survey of schools in
Washington, 41 percent of respondents typically offer some form of outdoor education. While
there is likely self-selection bias in terms of the schools that chose to participate in the survey, if
Washington were to remove the financial barrier and have expansion partners promote outdoor
education, reaching 60 percent participation within the first few years appears to be feasible.
o Participation Rate: 60%
o Participant Breakdown: 70% residential and 30% day programs
• Mid Participation/Cost: This scenario is loosely modeled after Oregon’s pre-pandemic
participation rate, as well as our survey of schools and school districts which found that 21% of
respondents prefer a non-residential program.
o Participation Rate: 80%
o Participant Breakdown: 80% residential and 20% day programs
22 “Cost of Living Index.” The Council for Community and Economic Research, 2021, https://www.coli.org

33 | P a g e
• High Participation/Cost: This scenario assumes full participation and a distribution of
residential and non-residential participation similar to Oregon’s program.
o Participation Rate: 100%
o Participant Breakdown: 90% residential and 10% day programs
In terms of trip length, it was assumed
that many schools would want to start
with shorter trips; however, over time
Washington may see growing comfort
with the program and schools opting
for longer trips. From the perspective
of a residential outdoor education
program, they would be most inclined
to offer 3-day, 2-night programs or 5-
day, 4-night programs to use their
space most efficiently and
productively. A 3/2 program allows
them to fit two groups (Monday-
Wednesday and Wednesday-Friday)
per week and a 5/4 program also
maximizes weekly “heads-in-beds”
revenue.
Combining the assumptions and scenarios, we find the following distribution of students across program
types and lengths. This distribution is then used to calculate an average cost per day that can be used to
estimate total statewide costs for each scenario.
Figure 6: Participation by Trip Length and Scenario
40%
10%
2%6%
23%
4%
15%20%
9%
2%6%
35%
6%
22%
0%6%
1%4%
50%
9%
32%
0%
10%
20%
30%
40%
50%
60%
% None 3 Day 4 Day 5 Day 3 Day/2 Night 4 Day/3 Night 5 Day/4 Night
Distribution of Students by Scenario and Trip Length
Low Mid High
Figure 5: Participation by Trip Length
55%
10%
35%
55%
10%
35%
0%
10%
20%
30%
40%
50%
60%
3 Day 4 Day 5 Day
Distribution of Students by Trip Type and Length
% of Day Only % of Residential

34 | P a g e
Cost Modeling and Results The three scenarios show initial costs between $28 million and $52 million, growing annually with the
student population and per-student costs. As time goes on, it is likely that Washington would progress
from a Low/Mid scenario to a Mid/High scenario as more schools choose to participate and opt for
longer, residential programs.
Figure 7: Statewide Cost by Scenario
Supply: Outdoor School Capacity To fully understand the outdoor education capacity available
statewide would require a variety of datapoints that are not
currently available. Instead, we rely on reported capacity
within our survey of programs. Factors not accounted for
include:
• Existing outdoor education programs that did not
respond to the survey or report their maximum capacity
• Facilities including summer only camps, private church
camps, and other private facilities that do not currently
offer outdoor education, but could easily expand into
their shoulder seasons
• Potential expansion through Washington State Parks,
Department of Natural Resources, or Department of
Fish and Wildlife
• Other users competing for existing capacity
• Class sizes smaller than the reported maximum capacity
will lead to underutilization
2022-2023 2025-2026 2028-2029 2031-2032
Low Scenario $28,293,629 $33,241,753 $36,710,306 $37,042,368
Mid Scenario $39,868,550 $46,840,951 $51,728,488 $52,196,396
High Scenario $52,515,326 $61,699,454 $68,137,377 $68,753,711
$25
$30
$35
$40
$45
$50
$55
$60
$65
$70
$75
Mill
ion
s
Statewide Cost by Scenario ($ in millions)
Estimated New Capacity Needed
(i.e. Number of Beds)
Statewide
643 Beds = 6-10 New Programs
Potential Locations
• Benton-Franklin/Eastern
• Eastern/Spokane
• Seattle-King/Snohomish
• Southwest

35 | P a g e
Looking only at maximum capacity reported by existing outdoor education programs through CEBR’s
survey, we find a statewide maximum daily capacity of 6,560. This capacity is distributed throughout 11
of 12 Workforce Development Areas and encompasses both daytime and residential programs of
various lengths.
To estimate the ability of this capacity to support all 5th or 6th grade students, the estimated student
population is divided by the weighted total capacity. Capacity is weighted by 1.5 to estimate the
maximum number of students who could be supported in each week – assuming half will participate in
5-day programs and half will participate in 3-day programs. The fourth column in the table below
represents the number of weeks of full capacity needed to serve all 5th or 6th grade students, and the
final column represents additional capacity needed (red) by region.
Statewide, Washington is estimated to need an additional 643 slots of capacity. Each slot of capacity
can be thought of as a bed at a residential outdoor school program. This extra capacity could be met
with 6-10 new outdoor education programs distributed throughout the state. Partners could include:
• Washington State Parks
• Washington Department of Natural Resources (DNR)
• Washington Department of Fish and Wildlife (WDFW)
• Existing overnight facilities (i.e. summer only camps, private church camps, and other private
groups with suitable residential facilities)
• Brand new private/nonprofit outdoor education programs
For example, in the Snohomish Workforce Development Area, it is estimated that the average 5th or 6th
grade student population in 2022 will be approximately 11,425. Based on survey responses, the
maximum daily capacity of existing outdoor education programs in this region is 783 students. Of this
capacity, there are 300 slots of reported residential capacity, 73 slots of reported day-program capacity,
and 410 slots among programs that offer both day-based and residential programs. If half of students
attend 3-day programs and half attend 5-day programs, it would take 10 weeks of full-capacity
operations for every 5th or 6th grade student in the Snohomish region to attend outdoor school. An
additional capacity of 63 students is needed to serve all students through 9 weeks of maximum-capacity
operation.
Due to weather, holidays, testing, competition for space, and class sizes less than the program’s
maximum capacity, regions in need of 10 weeks or more of maximum capacity operation are flagged in
red. The Benton-Franklin (0 capacity), Southwest (93 weeks), Seattle-King (20 weeks), Spokane (13
weeks), and Snohomish (10 weeks) regions may all have insufficient existing capacity. It is also worth
noting that the Eastern region is large, and capacity was only reported in Pend Oreille County (the
northeast corner of Washington). Residential outdoor education capacity is also limited in many
regions.
Another factor influencing capacity needs is the seasonal preference of schools and school districts.
Among those surveyed, 59 percent of respondents want their students to attend outdoor school in
Spring, compared to only 34 percent who would prefer Fall. This has the potential to strain regional
capacity in some months and leave beds empty in others. Discussion group feedback suggest both times
of year benefit students, with Fall helping to develop year-long relationships and learning and Spring
acting as a celebration and means of tying together classroom content from the year.

36 | P a g e
Table 3: 2022 Estimated Student Population and Estimated Existing Outdoor Education Capacity
2022 Estimated Student Population and Estimated Existing Outdoor Education Capacity
Population Total Capacity
Weeks Needed at Full Capacity
Estimated Excess (+) and Needed (-) Capacity
Benton-Franklin 4,972 0 N//A -368
Eastern 2,442 420 4 239
North Central 3,849 380 7 95
Northwest 5,476 920 4 514
Olympic 4,284 620 5 303
Pacific Mountain 6,664 520 9 26
Seattle-King 25,092 841 20 -1,018
Snohomish 11,425 783 10 -63
South Central 5,358 598 6 201
Southwest 8,386 60 93 -561
Spokane 6,775 340 13 -162
Tacoma-Pierce 12,519 1,078 8 151
Total 97,240 6,560 10 -643
In 2022, Washington State is estimated to need enough outdoor education program capacity to support
approximately 7,239 students at a time – assumes all eligible students participate. Capacity needs are
expected to vary with the student population. The forecasted population declines in the next decade
lead to falling capacity needs through 2031; however, by from 2031 to 2040 the population is expected
to grow strongly. Capacity needs in 2040 are estimated at approximately 7,272 students daily.
Figure 8: Estimated Statewide Outdoor Education Capacity Needed
6.0
6.2
6.4
6.6
6.8
7.0
7.2
7.4
7.6
2022 2023 2024 2025 2026 2027 2028 2029 2030 2031 2032 2033 2034 2035 2036 2037 2038 2039 2040
Tho
usa
nd
s
Estimated Statewide Outdoor Education Capacity Needed

37 | P a g e
Economic Impacts of Outdoor School Economic impact analyses are an important tool used to make decisions. However, they are often
misused, overestimated, or generally misunderstood. An economic impact analysis measures the ripple
effects of an action taken by a government, industry, household, or other entity. The impacts include
output (production), employment, labor income, and can also include state, local, and federal taxes.
Within each category, impacts can be categorized as:
• Direct – Initial change in demand (spending and jobs supported)
o Money spent directly on outdoor school, as well as the additional employment that will
be needed to meet that demand
• Indirect – Changes in spending throughout the supply chain due to a change in demand
o Increased demand for food, gear, and supplies by outdoor school programs, which
ripples through their suppliers and down the supply chain
• Induced – Changes in spending that result when households see a change in their income
o If increased demand for outdoor education led to programs hiring more people or
promoting them from part-time to full-time positions, induced effects could include the
increased spending of the staff on meals at restaurants, as well as other goods and
services
Note that economic impact analyses do not consider opportunity costs (the benefits of alternative
investment opportunities), environmental costs/benefits, or social costs/benefits. Another commonly
ignored issue with economic impact analyses is crowding out. For example, if the city hires an
accountant from somewhere else within the region, the economic impact analysis does not consider
that the accountant was already employed elsewhere in the region doing another meaningful job. This
can lead to overcounting an economic impact.
Economic impact analysis is a helpful tool, but it is important to keep in mind its limitations. The analysis
is highly dependent on the data quality and its user. Impact analysis does not account for all possible
outcomes and should be considered a maximum of the possible economic benefits to the region.
To estimate the economic impacts of funding outdoor school for all 5th or 6th grade students, we
compare analysis from two sources:
• “Economic Analysis of Outdoor Recreation in Washington State” by Johnny Mojica and Angela
Fletcher at Earth Economics23
• An economic impact analysis of the Recreational and Vacation Camps (Except Campground)
sector (NAICS 721214) using JobsEQ software
Note that both of these impact analyses look at industries that are somewhat related to outdoor school;
however, neither is able to provide a narrow focus on the economic impacts of outdoor education. It is
also worth keeping in mind that outdoor school is seasonal and the direct effect of employment likely
does not represent new year-round jobs. Rather some programs with robust summer programs may be
able to begin employing more of their staff year-round. This means that a direct effect of 1 full-time
23 Mojica, Johnny, and Angela Fletcher. “Economic Analysis of Outdoor Recreation in Washington State.” Earth Economics, 2020, https://rco.wa.gov/wp-content/uploads/2020/07/EconomicReportOutdoorRecreation2020.pdf
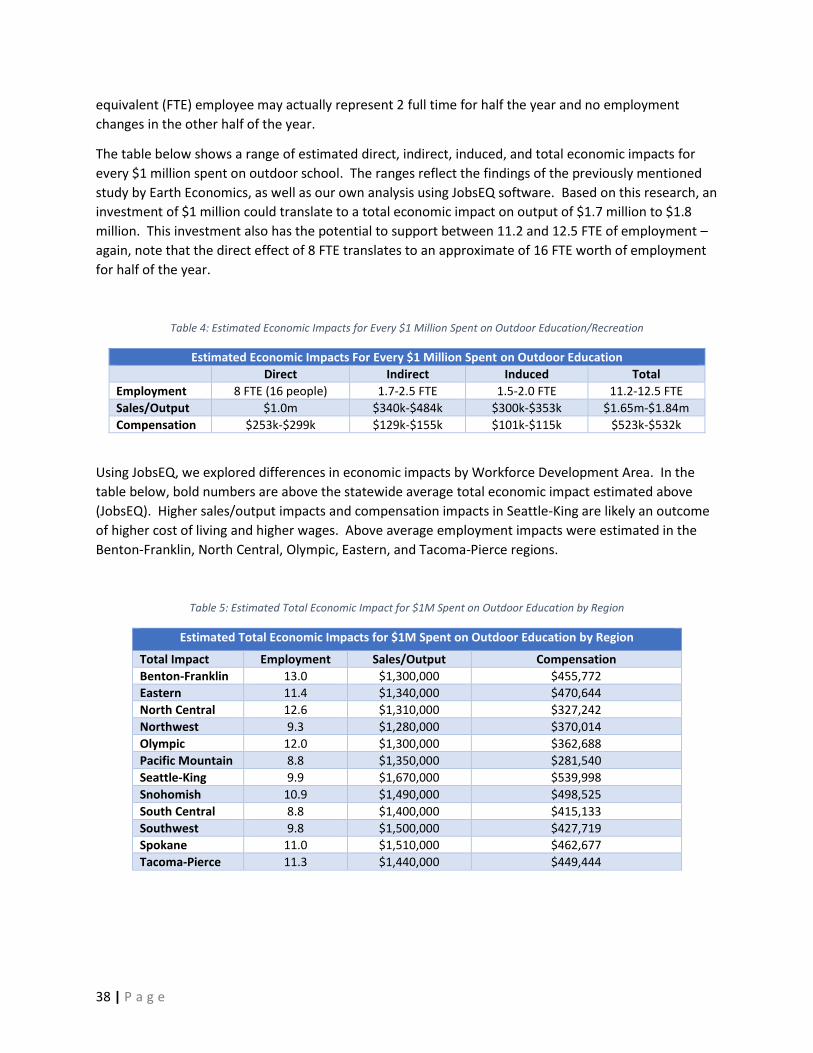
38 | P a g e
equivalent (FTE) employee may actually represent 2 full time for half the year and no employment
changes in the other half of the year.
The table below shows a range of estimated direct, indirect, induced, and total economic impacts for
every $1 million spent on outdoor school. The ranges reflect the findings of the previously mentioned
study by Earth Economics, as well as our own analysis using JobsEQ software. Based on this research, an
investment of $1 million could translate to a total economic impact on output of $1.7 million to $1.8
million. This investment also has the potential to support between 11.2 and 12.5 FTE of employment –
again, note that the direct effect of 8 FTE translates to an approximate of 16 FTE worth of employment
for half of the year.
Table 4: Estimated Economic Impacts for Every $1 Million Spent on Outdoor Education/Recreation
Estimated Economic Impacts For Every $1 Million Spent on Outdoor Education
Direct Indirect Induced Total
Employment 8 FTE (16 people) 1.7-2.5 FTE 1.5-2.0 FTE 11.2-12.5 FTE
Sales/Output $1.0m $340k-$484k $300k-$353k $1.65m-$1.84m
Compensation $253k-$299k $129k-$155k $101k-$115k $523k-$532k
Using JobsEQ, we explored differences in economic impacts by Workforce Development Area. In the
table below, bold numbers are above the statewide average total economic impact estimated above
(JobsEQ). Higher sales/output impacts and compensation impacts in Seattle-King are likely an outcome
of higher cost of living and higher wages. Above average employment impacts were estimated in the
Benton-Franklin, North Central, Olympic, Eastern, and Tacoma-Pierce regions.
Table 5: Estimated Total Economic Impact for $1M Spent on Outdoor Education by Region
Estimated Total Economic Impacts for $1M Spent on Outdoor Education by Region
Total Impact Employment Sales/Output Compensation
Benton-Franklin 13.0 $1,300,000 $455,772
Eastern 11.4 $1,340,000 $470,644
North Central 12.6 $1,310,000 $327,242
Northwest 9.3 $1,280,000 $370,014
Olympic 12.0 $1,300,000 $362,688
Pacific Mountain 8.8 $1,350,000 $281,540
Seattle-King 9.9 $1,670,000 $539,998
Snohomish 10.9 $1,490,000 $498,525
South Central 8.8 $1,400,000 $415,133
Southwest 9.8 $1,500,000 $427,719
Spokane 11.0 $1,510,000 $462,677
Tacoma-Pierce 11.3 $1,440,000 $449,444

39 | P a g e
The findings on the economic impact of a $1 million investment can be scaled to model other levels of
investment. Given the three scenarios discussed previously in the supply and demand model, total
economic output associated with statewide outdoor school funding could range from $47 million to $96
million, with between 315 and 629 FTE worth of employment being supported.
Table 6: Estimated Total Economic Impacts by Outdoor School Scenario
Estimated Total Economic Impacts by Outdoor School Scenario
Scenario (2022-2023)
State Investment
Total Employment Impact Total Sales/ Output Impact
Total Compensation Impact
Low $28,152,943 315-339 FTE (541-550 people) $46.5m-$51.7m $14.7m-$15.0m
Mid $39,670,308 444-477 FTE (762-775 people) $65.5m-$72.9m $20.8m-$21.1m
High $52,254,199 585-629 FTE (1,003-1,022 people) $86.2m-$96.0m $27.4m-$27.8m
In Oregon, the Grays Family Foundation estimated that their statewide outdoor school program would
generate more than 600 FTE jobs and 27 million dollars of income on an annual basis.24 This is similar to
the estimated economic impacts associated with the high attendance/cost scenario in Washington
State.
24 Robin Hahnel, REPORT ON THE ECONOMIC IMPACTS OF A STATE WIDE OUTDOOR EDUCATION PROGRAM IN OREGON, https://grayff.org/wp-content/uploads/2018/05/EconomicImpacts_OutdoorEducation.pdf
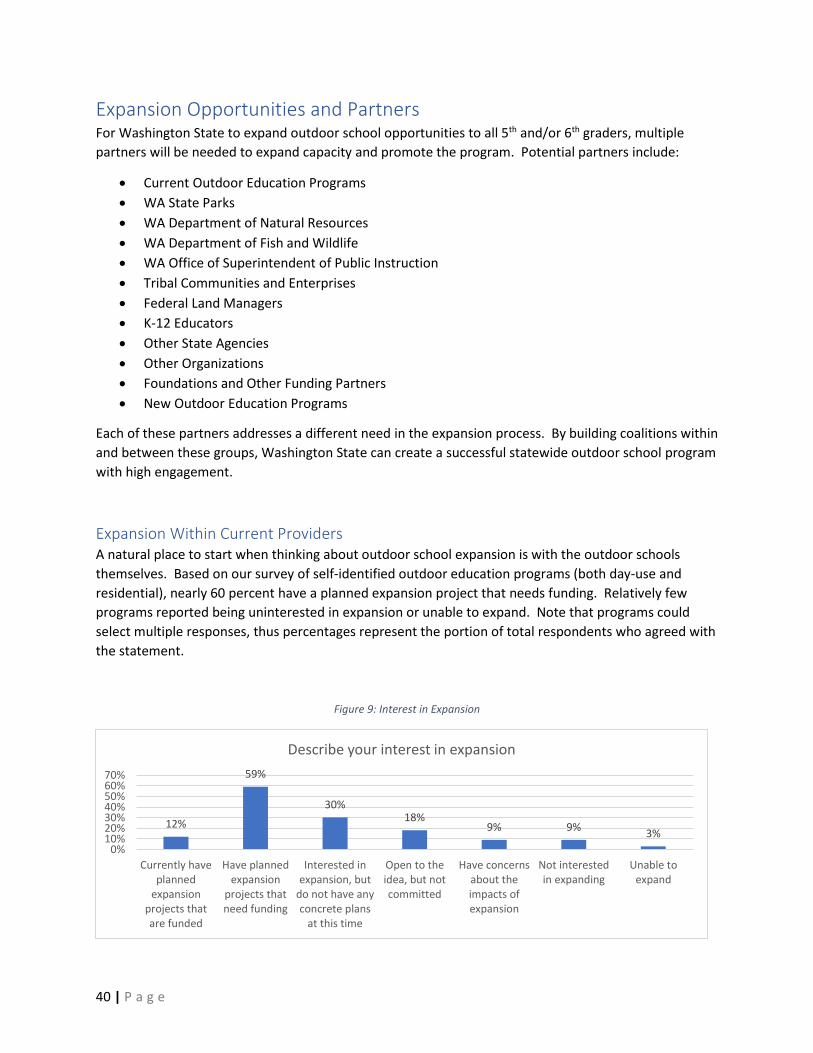
40 | P a g e
Expansion Opportunities and Partners For Washington State to expand outdoor school opportunities to all 5th and/or 6th graders, multiple
partners will be needed to expand capacity and promote the program. Potential partners include:
• Current Outdoor Education Programs
• WA State Parks
• WA Department of Natural Resources
• WA Department of Fish and Wildlife
• WA Office of Superintendent of Public Instruction
• Tribal Communities and Enterprises
• Federal Land Managers
• K-12 Educators
• Other State Agencies
• Other Organizations
• Foundations and Other Funding Partners
• New Outdoor Education Programs
Each of these partners addresses a different need in the expansion process. By building coalitions within
and between these groups, Washington State can create a successful statewide outdoor school program
with high engagement.
Expansion Within Current Providers A natural place to start when thinking about outdoor school expansion is with the outdoor schools
themselves. Based on our survey of self-identified outdoor education programs (both day-use and
residential), nearly 60 percent have a planned expansion project that needs funding. Relatively few
programs reported being uninterested in expansion or unable to expand. Note that programs could
select multiple responses, thus percentages represent the portion of total respondents who agreed with
the statement.
Figure 9: Interest in Expansion
12%
59%
30%18%
9% 9%3%
0%10%20%30%40%50%60%70%
Currently haveplanned
expansionprojects thatare funded
Have plannedexpansion
projects thatneed funding
Interested inexpansion, but
do not have anyconcrete plans
at this time
Open to theidea, but notcommitted
Have concernsabout theimpacts ofexpansion
Not interestedin expanding
Unable toexpand
Describe your interest in expansion

41 | P a g e
Current outdoor education providers were also asked about the greatest barriers to expanding their
capacity or months of operation. Overall, 87 percent of respondents indicated that funding posed a
barrier to expansion. Funding was followed by, attracting and retaining staff (78 percent), facility size
(73 percent), and other factors (73 percent).
Ultimately, the data suggests that there is a strong willingness among current outdoor education
programs to expand their facilities, capacity, or months of operations. To facilitate this expansion,
however, there are significant funding and staffing barriers that will need to be addressed.
Figure 10: Barriers to Expanding Capacity or Months of Operation
42% 41%
22%27%
13%
27%
31%42%
49% 38%
29%
18%
27%
17%
29%35%
58% 55%
0%
10%
20%
30%
40%
50%
60%
70%
80%
90%
100%
Winterization orseasonal
structures
Expanding use inshoulder seasons
Staffing (attractingor retaining)
Facility size orlimitations to
existing facility
Funding forexpansion
Other
Ranking of barriers to expanding capacity or months of operation
Not a Barrier Slight Barrier Significant Barrier

42 | P a g e
Expansion Using State Parks and Other Facilities Another option for outdoor education expansion is to fund programs through the Washington State
Parks Department (Parks), Department of Natural Resources (DNR), and Department of Fish and Wildlife
(WDFW). All three of these departments are looking for opportunities to offer more educational
opportunities for students; however, they lack the funding to start and sustain an outdoor education
program. While DNR and WDFW are best suited to day programs, Parks has the potential to also offer
residential outdoor education.
State Parks To learn about the current outdoor education offerings by the Washington State Parks Department
(Parks), as well as the potential for expansion, we interviewed Ryan Karlson (Interpretive Program
Manager) and Owen Rowe (Policy and Governmental Affairs Director). As shown below, Parks has a
long history of providing outdoor education for K-12 students. However, since the 1950’s and 1960’s
these programs have been scaled back significantly.
To build a robust residential program in the future, Parks will need funding to improve their overnight
accommodations and for staff capacity to organize and run the programs. Parks could support both
residential and day programs as they have in the past depending on site availability and public school
needs. Under current capacity, these programs would be best suited to off-peak months (October
through March) when there is greater availability of overnight options. The locations of Parks facilities
lend themselves to supporting students in more rural communities, although there are opportunities in
more urbanized areas as well.
Current Utilization and Offerings
Currently, State Parks does not have a robust K-12 outdoor education program. However, they do have
suitable overnight accommodations, educational facilities, and expertise to host a variety of programs as
needed:
• Day programs with interpretive staff at Environmental Learning Centers and Interpretive Centers
• Teachers providing education with some facilitation by park rangers for a day
• School use without Parks staff (day-use and overnight-use) including at urban parks
• Junior Ranger and Youth Programs25
• An outdoor preschool facilitated by another organization
25 Washington State Parks. “Junior Ranger and Youth Programs.” Washington State Parks, https://parks.state.wa.us/917/Junior-Ranger-Program.
1950s-1960s: Residential Youth Programs
1970s-1980s: Partnerships with OSPI for School-
Year Programming
1990s: Funding Cut, Partnership
with DNR
2000s-Present: No Centralized K-12
Programming

43 | P a g e
• The Fort Worden Lifelong Learning Center26
• Cama Beach State Park cabins
• Online educational programming
Expanding Outdoor Education
When thinking about expansion, a few factors must be considered including funding, staff, geography,
facilities, and availability. Within the department, K-12 outreach and education is a State Parks and
Recreation Commission goal.
In terms of funding, both Karlson and Rowe highlighted the importance of sustainability, stability, and
focus. They highlighted the role of Discover Pass Program in providing Parks with steady and predictable
revenue when allocations from the state fluctuate. In contrast, No Child Left Inside grants have
provided funding for individual outdoor education experiences – which often involve visits to state parks
– but not the stable funding needed to make infrastructural improvements, maintain dedicated staff
capacity, or develop a Parks-run outdoor education program.
Parks currently has an interpretive staff of 20 FTE that are dispersed across the state, as well as park
rangers who may be able to facilitate more limited outdoor education programs and interpretation. To
support more a dedicated outdoor education program – especially a residential program or programs
with minimal school-led instruction – would require an increase in dedicated staff capacity.
Coordination with the Office of Superintendent of Public Instruction (OSPI) would likely be necessary to
help develop relevant curriculum and to assist Parks in developing relationships with public schools.
The geographic distribution of Parks facilities also must be taken into consideration, especially those
with Interpretive Centers, Environmental Learning Centers (ELCs), and overnight options. While this
may make Parks programs less accessible to some students, they may be a good option for students in
more rural communities. However, there are also opportunities in more urbanized areas including Dash
Point, Lake Sammamish, Saltwater, Millersylvania, and Riverside State Parks
Looking at the overnight facilities, Parks has everything from campsites to yurts, cabins, and barracks.
Most sites have flushing toilets, and some have kitchens and indoor eating areas. Some locations need
investments to prepare them for visitors or make them usable in all seasons. For school groups, staying
at one of these locations can be very cost-effective with Retreat Centers costing $13-$15 per person per
day. Depending on the location, the Retreat Centers can accommodate 12-269 people.
Availability is also a major consideration. State Parks are very busy during the late spring and summer,
with reservations filling up 9 months or more in advance. To avoid this concern, residential outdoor
education programs are currently better suited to the off-peak season – October to March – considering
limitations of individual facilities and reservation policies. Karlson acknowledges that April and May
have the potential to be critical months for outdoor education, which may mean that Parks would “need
to look at reservation policy options to accommodate an outdoor youth education focus.”
26 Fort Worden Foundation. “The Lifelong Learning Center.” Fort Worden Foundation, https://fortwordenfoundation.org/the-lifelong-learning-center/.

44 | P a g e
Figure 11: State Park ELCs and Interpretive Centers

45 | P a g e
Figure 12: State Park Outdoor Amphitheater and Staff Capacity

46 | P a g e
Department of Natural Resources The following information comes from an interview with Doug Kennedy, a Strategic Advisor with the
Washington State Department of Natural Resources (DNR). While DNR does not currently have staff
dedicated to outdoor education, many employees are passionate about their field of study and have
helped with past outdoor education offerings. The biggest barrier to offering more outdoor education is
a lack of funding for staff to design and administer these programs.
To begin offering outdoor education, Kennedy suggests funding 1-2 full-time staff positions and one
half-time position to pay other staff who want to help develop a curriculum or lead a program. This plan
would cost between $240,000 and $420,000 per year. Because DNR’s campsites are not reservable,
schools would need to find lodging elsewhere. DNR would not charge education providers for
participating in agency-organized outdoor education program.
Current Utilization and Offerings
Although DNR does not traditionally offer outdoor education, agency staff have collaborated with
various education providers on an ad hoc basis. Two examples include:
• DNR geologists working with the Olympia School District to deliver lessons to middle school
science classes.
• Hosting 12 high school students from the Highline School District for one day as part of a 6-week
outdoor education program. Highline School District, the Pacific Education Institute and the
Mountains to Sound Greenway organized and paid for the program. For the first five weeks,
students lived at home. In the final week, students stayed at Camp Waskowitz. During their
time at the Raging River State Forest, DNR staff taught the students about trail maintenance and
outdoor career opportunities.
Expanding Outdoor Education
DNR has access to approximately 3 million acres of land that varies in accessibility, proximity to
populated areas, and land purpose. These sites can accommodate a variety of group sizes, depending
on the location. However, DNR does not currently have staff resources to organize, prioritize, and help
deliver outdoor education content. DNR also does not traditionally allow reservations in advance for its
campsites. Many campsites have bathrooms and other facilities. Camping on DNR lands would require
participants to bring their own tent and gear.
While some of these barriers, including overnight accommodations, cannot be mitigated, Kennedy is
currently in the process of seeking funding for 1.5 FTE staff to be dedicated to outdoor education
programming. This would include one full-time staff person to oversee the program and half-time
funding to pay other staff for time spent contributing to the program. Funding 1.5 FTE staff is
anticipated to cost approximately $240,000 per year; however, to create a more robust program with
2.5 FTE staff the annual cost would be approximately $420,000.

47 | P a g e
Department of Fish and Wildlife To learn more about outdoor education opportunities with the Washington Department of Fish and
Wildlife (WDFW), we interviewed Rachel Blomker (Communications Manager), Leia Althauser
(Environmental Education Coordinator), and Matthew Trenda (Lands Data and Outreach Specialist) from
WDFW. This team has been closely involved in the implementation of WDFW’s strategic plan, which has
a near-term goal to “create and promote education opportunities in WDFW wildlife areas, in urban
centers, and on school grounds.”27
Going forward, WDFW is best suited to day-use for outdoor education due to the nature of their
camping areas. Depending on available funding for additional staff, WDFW has the potential to develop
in-person day programs for K-12 students. Currently, WDFW is focusing on providing online lesson plans
and field trip kits for teachers.
Current Utilization and Offerings
While WDFW does not currently have formal, in-person outdoor education opportunities for K-12
students, WDFW staff have created online resources and occasionally work with schools to create day
programs. Examples include:
• Wild Washington: Provides “wildlife-themed curriculum for elementary, middle school, and
high school students.”28 These lesson plans are designed to be used in the classroom and are
adaptable for distance learning.
• Career Connections: WDFW staff host video-based Q&A sessions with students to highlight
career paths in the natural resources field.
• In April 2021, the North Central Educational Service District worked with WDFW to create a one-
day outdoor education program for 60 fifth-grade students.29 Funding for this program was
provided by the ClimeTime Provisio.
Expanding Outdoor Education
WDFW currently has multiple outdoor education efforts in progress to align with the department’s
strategic plan. Outdoor education efforts range from multi-agency dataset coordination to developing
field trip kits for wildlife areas and hatcheries. WDFW’s land is likely better suited to day programs;
however, if students live nearby, they could use the land for multiple days in a row.
The biggest hurdle for WDFW when expanding outdoor education offerings is staffing. For additional
online resources, programming, and field trip kits, would only need 1-2 new positions. However, if
WDFW were to offer more in-person programming, they would need a significantly larger staff. The
only expected costs for students in these programs would be transportation and supplies.
27 “WDFW 25-Year Strategic Plan.” Washington Department of Fish and Wildlife, November 2020, https://wdfw.wa.gov/publications/02149 28 “Wild Washington Program.” Washington Department of Fish and Wildlife, https://wdfw.wa.gov/get-involved/environmental-education-curriculum 29 “Connecting Kids to Nature through Hands-On Learning.” Washington Department of Fish and Wildlife, 29 June 2021, https://wdfw.medium.com/connecting-kids-to-nature-through-hands-on-learning-757ce9296b3e

48 | P a g e
Office of Superintendent of Public Instruction Given the proposed role of outdoor school in K-12 curriculum, it is important to gather input from OSPI
regarding their role in outdoor education expansion. For this, we reached out to:
• Jenny Plaja (Assistant Director, Government Relations)
• Ellen Ebert (Assistant Director, Secondary Education and Pathway Preparation)
• Shelly Milne (Director, Elementary Education and Early Learning)
• Elizabeth Schmitz (Program Supervisor, Environment and Sustainability Education)
• Kimberley Astle (Associate Director, Elementary Science Content)
• Ken Turner (Program Supervisor, Health and Physical Education)
• Gretchen Stahr-Breunig (Kindergarten Transitions Specialist)
Looking toward outdoor school expansion, OSPI has the potential to add value in a variety of capacities.
From a curriculum perspective, OSPI can assist outdoor school programs in developing curriculum that
meets state learning standards and outcomes. OSPI is also well positioned to provide outreach,
encouragement, and information on the benefits of outdoor education to school districts, schools, and
teachers. Additionally, OSPI may be able to work collaboratively with the Recreation and Conservation
Office (RCO) to distribute potential outdoor school funding.
Current Offerings OSPI has a long history of involvement in supporting environmental, sustainability, and science-based
learning for K-12 students. Key roles include:
• Supporting the development of content integration through the lens of environment and
sustainability, as well as providing professional development to educators in formal, informal,
and nonformal education fields
o Updating the Washington Environmental and Sustainability Literacy Plan (Fall 2021)30
o Providing funding for development of outdoor learning spaces and/or green play spaces
o FieldSTEM© Contract Management:
▪ Career connected learning with a focus on natural resources, environmental,
and agricultural fields
o Bilingual Environmental Education Contract Management:
▪ Supporting culturally relevant, community connected science learning designed
to support migrant and bilingual students
• Managing the ClimeTime proviso – several grantees provide outdoor learning technical support
• Contracting with WSPEF to support counseling in outdoor school
• Advertising unique physical education (PE) and health programs at schools
30 “Environmental and Sustainability Literacy Plan.” WA Office of Superintendent of Public Instruction, https://www.k12.wa.us/student-success/resources-subject-area/environment-sustainability/environmental-and-sustainability-literacy-plan

49 | P a g e
• Authoring a “Considerations for Outdoor Learning”31 document to provide guidance and
learning outcomes for schools and outdoor education programs
• Promoting awareness of elementary science standards and the importance of equitable access
Short-Term Expansion If Washington were to expand funding for outdoor school, OSPI can assist in a wide array of promotion,
curriculum development, and professional development roles:
• Recruit rural and high Free and Reduced Price Lunch schools to attend outdoor school programs
• Support educational school districts, schools, outdoor school programs, and staff with
professional development and development of standards-aligned resources
• Support the development of resources for review and addition to the Washington Open
Educational Resources Commons
• Provide resources that demonstrate the benefits of outdoor and nature-based learning
• Assist outdoor school programs and school districts with professional development and
development of standards-aligned resources and curricula
Long-Term Expansion and Goals Over a longer timeframe, OSPI is looking for opportunities to promote equity and career-connected
learning, as well as:
• Support and develop more cross content between outdoor education programs and schools
• Develop ESD-level plans to get 5th/6th graders to outdoor school in each region
• Build equity and opportunities for high school and college students to gain entry to career
connected learning through outdoor school
• Make connections to Career and Technical Education Learning Pathways and Career Clusters
• Support diversity in outdoor school leadership positions
• Assist in long term planning and development of outdoor school funding and resourcing
31 Schmitz, Elizabeth, Gretchen Stahr Breunig, and Ken Turner. “Considerations for Outdoor Learning.” WA Office of Superintendent of Public Instruction, https://www.k12.wa.us/sites/default/files/public/healthfitness/pubdocs/Outdoor%20Learning%20Considerations%20Document_v4-12-17-2020.pdf

50 | P a g e
Tribal Communities A number of tribal communities exist throughout Washington State with a wide variety of involvement
in outdoor education and capacity to become more involved. To learn more about the role that tribal
communities would like to play in outdoor education and curriculum development, we reached out to
Hanford McCloud and Nathan Reynolds. McCloud is a member of the Nisqually Tribe’s tribal council, as
well as an artist and educator. Reynolds recently became the executive director of the Opal Creek
Ancient Forest Center, an outdoor school in Oregon. Previously, he served as the Director of Cultural
Resources for the Cowlitz Tribe.
From these conversations, there appears to be an interest among many tribes to be involved in outdoor
education expansion. While this involvement will likely look different between tribes, it may include
standardized curriculum development, collaboration with local outdoor schools, traveling teachers, or
the development of their own outdoor schools. Funding and close partnerships will be important.
Current Involvement Reynolds emphasized the importance of realizing that every tribe is different, both with respect to what
cultural or environmental education they currently offer and what they may be willing to expand to in
the future. He notes that there is significant support for outdoor education with the Cowlitz Tribe, as
evidenced by their significant donations to Outdoor School for All.
Turning to the Nisqually Tribe, McCloud discussed a variety of outdoor education involvement including:
• Multigenerational trips for tribe members to Cispus to learn about the area and history
• Presentations at local schools focusing on Nisqually culture and art
• Day programs for local schools at their Culture Center focus on Nisqually history, culture, and art
Potential Expansion Reynolds noted that participation in outdoor education expansion will look different depending on the
tribe. Some may choose not to participate, others may focus their efforts on members of their tribe,
and others may be willing to develop their own outdoor school programs or assist existing programs. In
Oregon, he notes that the state provides funding for tribes to develop curriculum to be used in K-12
education (see SB13). Similar funding in Washington could compensate tribes for their contributions, as
well as provide locally relevant curriculum to schools and outdoor education programs. For programs
looking to incorporate more indigenous culture, history, and knowledge into their outdoor school,
Reynolds suggests building strong, ongoing, and mutually beneficial relationships with their local tribe.
McCloud explained that the Nisqually Tribe is interested in being involved in the expansion of outdoor
education opportunities and has funds for outdoor education opportunities within the tribe. Looking
toward the future, he would like to see more place-based learning and involvement from tribes. One
model he proposed is to have representatives from tribes act as traveling teachers who could facilitate
lessons at different outdoor school programs within their historical lands. He is also interested in
offering overnight outdoor education at the Culture Center and would like to see all tribes develop their
own day programs or multi-day programs for outdoor and cultural education.

51 | P a g e
Other Expansion Partners Looking beyond existing outdoor educators, there are many resources within the state that could aid in
a successful expansion plan. From additional capacity, to promotion, accessibility, networking, and staff
training, each group has an important role to play.
K-12 Educators Throughout the discussion groups with schools and outdoor education programs, there was a common
theme: students only go to outdoor school when educators see the value in the experience and are
passionate about making it happen. Even with statewide funding, it will be crucial to engage staff in all
areas of the K-12 education system.
• Educational Service Districts (ESDs)
o Outreach and promotion of outdoor education opportunities
o Provide information on funding and the benefits of outdoor education
o Maintain a list of all outdoor school providers within their region
o There is some precedent of a regional government building a residential camp and then
outsourcing operations to a different organization32 or potentially operating it through
an ESD or large school district33
• School Districts
o Outreach and promotion of outdoor education opportunities
o Provide information on funding and the benefits of outdoor education
• Schools and Teachers
o Building support for outdoor school among staff, parents, and students
o Offering outdoor education opportunities
• Other K-12 Organizations
o Promoting the benefits of outdoor education and connecting schools who have not
offered outdoor education before with more experienced schools
▪ Association of Washington School Principals (AWSP)
• Washington School Principals’ Education Foundation (WSPEF) is
currently administering $10 million from Washington State to expand
access to outdoor education
▪ Washington Association of School Administrators (WASA)
▪ Washington Science Teachers Association (WSTA)
▪ Washington State Parent Teacher Association (WSPTA)
32 “Our Story.” YMCA Collin County Adventure Camp, http://collincountyadventurecamp.org/our-story/ 33 “Camp Waskowitz History.” Highline Public Schools, https://www.highlineschools.org/academic-programs/waskowitz-outdoor-education/history

52 | P a g e
State Agencies In addition to Parks, DNR, and WDFW, other state agencies are well positioned to assist in expanding
outdoor education access. Potential collaborators include:
• Washington State Recreation and Conservation Office (RCO)
o Potential to administer funds in partnership with OSPI, similar to their work with the No
Child Left Inside grant34
• Washington State Department of Commerce
o Provide funding to support business planning services for outdoor education programs
• Washington State Office of the Attorney General
o Assisting schools and school districts in understanding how to approach risk
management and liability concerns in outdoor education
Western Washington University (WWU) In conducting this research, we have heard multiple needs from both schools and outdoor education
providers that have high value but no logical home within either universe. In looking at other states and
considering Washington State’s landscape, these are areas where Western Washington University could
provide extensive value within the Outdoor Education space, if requested by the legislature. Potential
offerings are provided here in summary form, with the expectation that a more thorough discussion
would define operational specifics and lead to the development of relevant decision packages.
Western Washington University has strong existing connections within both the outdoor education and
public education spaces through programs and efforts by multiple colleges and initiatives. For example,
an overwhelming number of outdoor education providers report that much of their curriculum has been
developed by Western students either acting as staff or interns.
Potential outdoor education expansion programming and support through Western Washington
University could include:
• May be able to host an annual conference for outdoor education programs and schools to
network and discuss curriculum, best practices, and expansion
• Create and maintain a central communications platform for outdoor educators to share
information, best practices, and other related information
• Create and maintain a state-wide university student experiential education program that
provides trained students for 1-week immersive experiences as naturalists to programs to assist
with staffing needs
• Planning to develop a website with an interactive map of all outdoor education programs in
Washington State
• Can offer business planning services for outdoor education programs
• Potential for outdoor school programs or the state to use WWU’s Woodring College of
Education and Huxley College of the Environment as consultants for outdoor education
34 “No Child Left Inside.” Washington State Recreation and Conservation Office, https://rco.wa.gov/grant/no-child-left-inside/

53 | P a g e
curriculum development. The goal would be to tie the lesson plans to statewide learning
outcomes and Next Generation Science Standards (NGSS)
• WWU may also be able to explore the feasibility of a mobile outdoor school program that could
be brought to schools with limited access to established outdoor schools that have trained
naturalists or outdoor education teachers.
• Potential to design and implement a statewide outcomes study for students who participate in
outdoor education
• Develop a masters degree in Recreation Management and Leadership for the preparation of
master outdoor educators, program planners, and program managers. The emerging outdoor
education workforce in Washington State will require the sustained development of these
professionals
Other Organizations While by no means an exhaustive list of all organizations that can act as expansion partners, the
following groups are representative of different services that will be needed to support a statewide
outdoor school initiative.
First, one common barrier to expansion is attracting and retaining qualified staff. The following two
groups are actively working to train teachers within K-12 schools and outdoor schools:
• Pacific Education Institute (PEI)35
o An organization in Washington State working with K-12 teachers to help them
incorporate outdoor education into their curriculum
o Aligned with WA educational goals, Common Core State Standards (CCSS), and Next
Generation Science Standards (NGSS)
o Could help teachers include short outdoor education lessons in more grades and
throughout the year
o Would prepare teachers to lead lessons in a multi-day, offsite outdoor education
program for 5th/6th graders at a state park or camp facility
o Outdoor education programs could also work with PEI to train staff and develop lesson
plans
• BEETLES36
o Provides a variety of training opportunities, lesson plans, and activities for outdoor
education
o Geared toward training environmental educators at residential programs, but also
suitable for K-12 teachers looking to incorporate outdoor education into their
curriculum throughout the year
35 “Our Story.” Pacific Education Institute, https://pacificeducationinstitute.org/story/ 36 “About Us.” BEETLES, http://beetlesproject.org/about/

54 | P a g e
The next expansion topic to consider is accessibility. Currently, many outdoor education facilities are
not able to support the needs of students with physical disabilities. If Washington State wants to offer
outdoor school to all students, the expansion effort will have to consider accessibility:
• Outdoors for All37
o Outdoors for All has over 850 volunteers who assist with running outdoor activities –
hiking, skiing, rock climbing, kayaking, snowshoeing, etc. – that are able to support
individuals with disabilities
o With funding, Outdoors for All could act as consultants and perform accessibility audits
of outdoor school programs
▪ Focusing on making the whole experience more accessible rather than just one
building
o Many outdoor school programs may not have the funds or demand needed to purchase
specialized equipment, giving Outdoors for All the opportunity to rent out equipment as
needed or provide staff/volunteers trained to meet the student’s needs (i.e. ASL or
behavioral support)
Coordination and collaboration between programs and schools will also be crucial to a successful
expansion of outdoor school. A few key organizations include:
• Oregon State University (OSU) Extension Service: Outdoor School38
o Provides a wide array of research and tools for schools and outdoor education programs
o Many outdoor education programs may not understand their fully burdened costs
which can lead to financial distress. OSU created a report39 and customizable financial
model40 to help programs better understand their costs
• American Camp Association (ACA)41
o Provides networking opportunities, best practices, safety guidelines, and accreditation
for youth camps
o May be able to connect WA camps interested into expanding their shoulder-season
offerings to include outdoor education programs
• North American Association for Environmental Education (NAAEE)42
o A professional organization for environmental educators across a variety of sectors
including K-12 teachers and outdoor education staff
o They offer an annual conference, promote best practices, offer professional
development opportunities, and advocate for environmental education
37 “Who We Are.” Outdoors for All, https://outdoorsforall.org/about-us/who-we-are/ 38 Oregon State University Extension Service: Outdoor School, https://outdoorschool.oregonstate.edu 39 Lindberg, Andy. “Outdoor School Cost Model Report.” Oregon State University Extension Service: Outdoor School, https://oregonstate.app.box.com/s/aygkq86lk3g1gns9xbke33bw89udogxv 40 Lindberg, Andy. “Outdoor School Cost Model Report Worksheet.” Oregon State University Extension Service: Outdoor School, https://oregonstate.app.box.com/s/f6zmmv1e3j4ro4aku2p3k5s2vcdt64x9 41 “Who We Are.” American Camp Association, https://www.acacamps.org/about 42 “About Us.” North American Association for Environmental Education, https://naaee.org/about-us

55 | P a g e
o Washington Educators for Environment, Equity, and Economy (also known as E3
Washington) is the local branch of NAAEE and provides similar opportunities throughout
the state43
• Association of Nature Center Administrators (ANCA)44
o Brings together leadership from nature and environmental learning centers throughout
the United States to network and share insights into management within the field
o Residential Environmental Learning Centers (RELC) Summit: biennial summit for leaders
of RELC programs45
• Outdoor Schools Washington
o Works with the Washington Outdoor School Consortium (WOSC)46
o Act as a statewide advocate for outdoor school, similar to Friends of Outdoor School in
Oregon
• Other Organizations
o Trust for Public Land
o Nature Conservancy
o Washington Environmental Council
Another need identified through this research is partnership with communities and aligned
organizations in Washington State, including:
• Communities of Color • Migrant Communities • Rural Communities
Foundations and Other Funding Partners In Oregon, the state’s outdoor school funding partially comes from donations. Washington may also
benefit from donations to a statewide program; however, donations may be more impactful at
individual outdoor schools. For instance, outdoor education programs surveyed in this research
indicated that funding was a significant barrier to expansion.
Foundations and other potential funding partners could engage with existing outdoor education
programs for targeted expansion efforts that increase capacity. There should be a specific focus on
targeting those expansion efforts that offer the highest return on investment in terms of total additional
program enrollment space or additional program space for underserved geographies or students
(including students with disabilities).
• Russell Family Foundation • Seattle Community Foundation
• Soil and Water Conservation Districts • Utilities
• Local Businesses • Other Foundations
• Hunting/Fishing Organizations • Agriculture or Timber Groups
43 “Who We Are.” E3 Washington, http://www.e3washington.org/who-we-are ("Who We Are ("Who We Are 44 “About ANCA.” Association of Nature Center Administrators, https://www.natctr.org/about 45 “Residential Environmental Learning Center Summit.” Association of Nature Center Administrators, https://natctr.org/events/relc 46 “Consortium.” Outdoor School For All, https://outdoorschoolforall.com/consortium
56 | P a g e
New Outdoor Education Programs To have sufficient outdoor school capacity for all 5th and/or 6th graders in Washington will likely require
new programs starting in the coming years. This growth can come from two places:
• Facilities with residential capacity but no outdoor education program
o Some summer only camps, private church camps, and other private facilities could
support outdoor school; however, they are not currently offering outdoor education
o These groups could develop their own outdoor education program or rent out their
facilities to other programs or schools
o Barriers include funding, staff, curriculum development, and winterization
• Brand new programs
o An increase in demand would encourage new entrants into the Washington outdoor
school field
o These new programs may use public land for day programs
o To create new residential outdoor education programs would require significant start-
up costs for both capital and staff

57 | P a g e
Policy and Funding Options This section will show different variations of outdoor schools along with recommendations on policy
design that would be beneficial in starting a state-wide program. The section will also give evidence on
the connection between outdoor education and career focused learning. Lastly, the section will share
possible funding options to start a statewide program in Washington state. Note that funding for
schools would likely be accessed through an allocation process rather than a competitive grant writing
process.
Possible Outdoor Education Variations There are thousands of different outdoor schools throughout the United States. These programs
operate in different locations, have different trip lengths, and practice different learning techniques –
thus there is no universal definition of what outdoor school should look like. Outdoor schools can be
operated in woodlands, wetlands, zoos, farms, parks, or other outdoor areas. They also can be tailored
to specific age groups or all age groups, and the programs can be run for multiple days with sleeping
arrangements or just as a day program. The curriculum is also different between outdoor schools. Below
are a few examples of outdoor school structures that are available through different outdoor schools.
Oregon’s Statewide Program provides funding for every fifth or sixth grader to attend outdoor school for
one week, four nights (Mon-Fri school days). However, some schools in Oregon choose to send their
students for a shorter amount of time. Other outdoor school programs last for three days, two nights.
Using the cost analysis above, the three-day option is clearly less expensive to fund since the costs are
on a per student basis.
There are some outdoor schools in Washington that offer overnight accommodations for the students
and some that act as a day camp where the students stay for most of the day, leave, and come back the
next morning. There are also many outdoor schools that have religious affiliations; however, many of
these locations can offer their facilities and programming without religious content.
This leads into the next topic of how the teachers and counselors are managed. Some outdoor schools
employ their own teachers and counselors, and some require teachers from the elementary/middle
school to teach and watch over the students. If the fifth and sixth graders stay the night, some outdoor
schools have high school camp counselors to stay with the fifth and sixth graders to maintain safety.
There are many different variations of how outdoor schools can be organized. To start a state-wide
program, it is important to acknowledge that not every outdoor school experience will look the same.
One option would be to delegate certain outdoor school organizations to the different counties in
Washington and allow the schools to choose from a list of outdoor school options within the county list.
A more flexible option would be to provide the funding and allow the schools to choose any outdoor
school experience that meets certain minimum educational and programmatical criteria.

58 | P a g e
Policy Design Considerations: Lessons from Oregon Given Oregon’s long history with outdoor school, robust program, and proximity to Washington, there is
much to be learned. For this, we reached out to Rita Bauer, Assistant to Outdoor School Program
Leader. Bauer works with Oregon State University’s Extension Service to administer funds to school
districts participating in outdoor school. Through this process, she has seen first-hand what has worked
well with the law and what other states could improve upon.
Thinking about the design of Oregon’s outdoor school law, what has worked well?
“Our law was written to allow the decisions/planning of curricula, program length, and program location
at a school/district level. This allows for the best experience based on student need. By using the
phrase ‘all students’, the law requires us to focus time and attention on the inclusion aspect of Outdoor
School. Our funds provide for an Outreach and Inclusion Coordinator who continues to look at what
obstacles could prevent a safe and fulfilling experience for every student. Our funds permit us to
support improvements to Equity, Diversity, Inclusion (EDI) in outdoor school, which could include
purchasing a beach wheelchair, ensuring a gender-neutral bathroom is available, and training staff in
EDI. The law was also well written in that, combined with Measure 99 (the voter ballot initiative that
funds outdoor school with lottery dollars) it provides adequate funding for our statewide program. It
tends to be less subject to cuts and reallocations that often impact programs funded by the state’s
general fund.”
What snags have you come across?
• “Our law does not directly address the funding of private/home schooled students, and, by not
addressing them, makes access to outdoor school funds difficult these students.”
• “The broadness of providing funding for both 5th or 6th grade prevents accurate calculations of
participation and tracking of participation. In some districts, 5th and 6th graders are in the same
school but in other districts they are divided between Elementary and Middle Schools.”
• “There is no stated requirement for how to prioritize funding with our program. So, if in a given
year, our requests for funding exceed our budgeted funds, we ask out Advisory Committee to
recommend how we might manage this/what we might fund.”
• “We are also looking at the ‘consecutive’ program length/format requirement. Currently, a
standard outdoor school program must be at least 3 consecutive days (minimum, non-
residential) and up to 6-days, 5-nights. We’re reviewing this to determine, long-term, what
program lengths/formats can be funded as participation increases and more districts move
toward longer (more costly) outdoor school programs.”
• “There is still hesitancy by some districts to allow high school junior leaders to participate. In
many programs, these youth are essential to the success of the program, and we have early data
that show these students benefit tremendously from this experience. Some administrators see
the service of high school students at outdoor school as an absence from school, rather than as
a beneficial/alternative school experience.”

59 | P a g e
For a state trying to create a similar program, what words of wisdom do you have in terms of policy
design?
“We have found it essential to have a strong coalition of support, in our case, two non-profits that help
us advocate for the program (Friends of Outdoor School and The Gray Family Foundation). Together
they fund statewide advocacy efforts and provide a full-time lobbying firm to help ensure continuous
funding and support by elected officials. This has been monumental to our success, even in times of
budget cuts, we have maintained full funding. I would also say it is beneficial to have the program home
outside of the department of education. In our case, we were able to leverage the reach and expertise
of the Oregon State University Extension Service while operating with the full support the University
provides. This allowed us to be nimble and quick but exist within a working ecosystem.”
Career-Connected Learning There are many literary examples of how outdoor education is closely connected with career focused
learning. Both the physical and mental experience of outdoor education opens the youth’s minds to
educational areas such as science and environmental studies that exceeds what could be gained through
textbook learning. These educational areas pave a path to new career opportunities as well as a variety
of paths to continue education beyond elementary and high school. Below are examples found in
literacy research showing the correlation between outdoor education and career focused learning.
The Outdoor School For All 2019 evaluation report done by Oregon State University shows empirical
evidence of the connection between academic performance and outdoor school experiences.47 Teacher
responses from 113 different public and independent schools shows that outdoor school has a positive
influence on students’ academic performance in STEM, natural history, sustainability, and
environmental education. Below are two charts showing the degree of improvement in academic
performance teachers saw in their students after their outdoor school experience.
The same study done by Oregon State University also reports that outdoor school develops critical,
creative thinking and strategic thinking skills as well as teamwork and leadership skills that can be used
throughout their future career.48Below are the charts showing how much outdoor school helps students
develop these skills. 80% of teachers saw moderate or substantial improvement to their students’
teamwork skills and 70% of teachers saw moderate or substantial improvement to their students critical
thinking skills.
47 Braun, Steven. “Outdoor School for All! Diverse Programming and Outcomes in Oregon: 2019 Evaluation Report.” Oregon State University, 2019, https://oregonstate.app.box.com/s/7j7epv3e8i1e5e53u9apxrdstxq9p3bx 48 2019 Evaluation Report, Outdoor School for All-Oregon State University, 2018-2019, https://oregonstate.app.box.com/s/7j7epv3e8i1e5e53u9apxrdstxq9p3bx

60 | P a g e
Figure 13: Impact of Outdoor Education on Academics and SEL
Science, STEM, & Natural History Sustainability/Environmental
Teamwork Skills Critical Thinking Skills
Source: Braun, Steven. “Outdoor School for All! Diverse Programming and Outcomes in Oregon: 2019 Evaluation Report.”
Oregon State University, 2019, https://oregonstate.app.box.com/s/7j7epv3e8i1e5e53u9apxrdstxq9p3bx
A literary review done by Outdoor School For All on the benefits of outdoor school and experiential
learning programs states that students who participate in outdoor school gain future employment skills
and interest in natural resource careers through outdoor education:
“The National Environmental Education and Training Foundation (NEETF) and North American
Association of Environmental Education (NAAEE) (2001) report notes that environmental education
programs allow students to gain skills and abilities needed to be successful in the job market. While
undertaking different projects in their communities, students learn problem-solving, communication
and decision-making skills, and also develop the ability to work in groups.” 49
49 Empirical Evidence Supporting Benefits of Outdoor School and Experiential Learning Programs, Outdoor School for All, February 2015, http://grayff.org/wp-content/uploads/2013/10/Empirical-Evidence-Supporting-Benefits-of-Outdoor-School-and-Experiential-Learning-Programs_March-2015.pdf

61 | P a g e
Outdoor education allows fifth and six graders to gain interest in different scientific career paths. An
outdoor education research project done on Nowlin Environmental Science Magnet Middle School in
Missouri found that about 45 percent of students reported that they learned about career opportunities
in the field of environmental science through participation in the program. Furthermore, 23 to 30
percent of students in grades 6- 8 said that they are thinking about a career in an environmental field. 50
Another factor to consider when looking at the connection between outdoor education and career
focused learning is the growth in the outdoor recreation economy. The Outdoor Recreation Economy
report done by the Outdoor Industry Association shows that there are 7.6 million American jobs in
outdoor recreation.51 There is also $887 billion in consumer spending in America in the outdoor
recreation sector. To give some perspective, below is a graph of different economic sectors compared to
the outdoor recreation industry. Outdoor Education provides an opportunity to introduce students to
potential career paths within this large and growing industry.
Figure 14: Annual Spending on Outdoor Recreation Nationally
Source: The Outdoor Recreation Economy, Outdoor Industry Association, 2017, https://outdoorindustry.org/wp-
content/uploads/2017/04/OIA_RecEconomy_FINAL_Single.pdf
50 Empirical Evidence Supporting Benefits of Outdoor School and Experiential Learning Programs, Outdoor School for All, February 2015, http://grayff.org/wp-content/uploads/2013/10/Empirical-Evidence-Supporting-Benefits-of-Outdoor-School-and-Experiential-Learning-Programs_March-2015.pdf 51 The Outdoor Recreation Economy, Outdoor Industry Association, 2017, https://outdoorindustry.org/wp-content/uploads/2017/04/OIA_RecEconomy_FINAL_Single.pdf

62 | P a g e
Funding Strategies The next step is to consider how to fund a statewide outdoor education program. Turning to the
literature, there are multiple examples of how outdoor education programs are funded including:
Oregon’s statewide outdoor school program, Washington’s No Child Left Inside Grant, Hawaii’s No Child
Left Inside Grant, and New Mexico’s Outdoor Equity Fund. Based on this review, common funding
options include:
• Appropriations from state general funds
• Grants from various companies and nonprofits
• Appropriations from state lottery funds
• Donations (individual, foundations, associations)
• Interest on moneys in the fund
Again, it is important to note that statewide outdoor school funding in Washington would likely be
allocation based rather than competitive. In other words, any school or school district that requests
outdoor school funding would be given the requested funds – within certain parameters set by the
state. This eliminates any barriers associated with the competitive grant writing process and ensures
equitable access to outdoor school.
Oregon Outdoor Education System According to Friends of Outdoor School, “On November 8, 2016, Oregon voters passed Ballot Measure
99, authorizing funds from the state lottery to provide all fifth- or sixth-grade students in Oregon access
to a week of Outdoor School.” 52 Measure 99 paved the way for the funding of the Outdoor School Law,
which was passed by the Oregon Legislature in 2015. Measure 99 created the Outdoor School Education
Fund which is housed within the State Treasury and is separate from the State of Oregon’s General
Fund. 53Moneys in the fund consist of donations, moneys transferred from the Oregon State Lottery,
investment earnings on received moneys, and other amounts deposited from any other source.
“Each fiscal quarter of the biennium, funds are allocated from the Administrative Services Economic
Development Fund to the Outdoor School Education Fund of an amount equal or less than four percent
of the moneys transferred from the Oregon State Lottery Fund in the fiscal quarter or $5.5 million
annually, but not to exceed $22 million annually, adjusted annually pursuant to the Consumer Price
Index.”53 moneys in the fund are appropriated to Oregon States University Extension Service to support,
administer, and fund any outdoor educational programs for Oregon K-12 children. Any money remaining
in the fund after providing the fifth and six grade students an outdoor education experience may be
used by Oregon State University Extension Service to develop additional outdoor education programs.53
In 2016, the average cost of a week-long outdoor school program per student was $278 according to
research done the Gray Family Foundation. Also in 2016, Oregon had 43,782 students enrolled in sixth
grade. Providing every sixth-grade student with outdoor school in the state costs roughly $12.2 million,
52Statewide Outdoor School Program, Friends of Outdoor School, 2018, https://www.friendsofoutdoorschool.org/statewide-ods 53 Act to Create the Outdoor School Education Fund, October 2015, http://oregonvotes.org/irr/2016/067text.pdf

63 | P a g e
which falls between the $5.5 million - $22 million provided by the Oregon State Lottery.54 According to
the Oregon State University Extension Service Outdoor School Annual Report for 2019-2020, the total
amount spent for in person outdoor school was $4.3 million and the total amount spent to provide
alternate programs was $3.7 million, totaling to roughly $8 million.
Washington State, No Child Left Inside According to Washington State Parks and Recreation Commission, “In 2007 the Washington State
Legislature HB 1677 directed the Washington State Parks and Recreation Commission (Commission) to
establish an outdoor education and recreation grant program to provide a large number of under-served
students with quality opportunities to directly experience the natural world.”55 “The budget provided
$1.5 million in funds to implement No Child Left Inside. In 2008, using criteria agreed upon by a 23-
member advisory committee, the Commission awarded $1.36 million in grant funds to 26 grant
recipients (“grantees”) whose programs brought under-served, at-risk students to the outdoors for
education and recreation experiences.”55
The funding for the Outdoor Education and Recreation Grant program comes from general tax dollars
from Washington State’s general fund. 56 There are three funding categories for the grant program
ranging from $5,000 to $150,000.56 In May of 2021, Washington State Governor, Jay Inslee announced
that $4.5 million will be awarded to the Washington State Parks and Recreation Commission to fund No
Child Left Inside (NCLI) grants. 57
One option to start a state-wide outdoor education system for all 5th or 6th grade students in
Washington is to combine the funding with NCLI. Another option would be to keep the two programs
separate but have the Recreation and Conservation Office (RCO) administer both grant programs given
its experience with NCLI.
OSPI and AWSP will also likely play a role in the flow of outdoor school funds. Grants are expected to
follow an allocation process as opposed to a competitive application process. Both OSPI and AWSP are
well positioned to encourage schools and districts to participate, as well as to assist in the distribution of
outdoor school funding.
54 CITIZEN INITIATIVE TO FUND STATEWIDE OUTDOOR SCHOOL PROGRAM, West Multnomah Soil & Water Conservation District, August 2016, https://wmswcd.org/wp-content/uploads/2016/09/WMSWCD-Outdoor-School-Discussion-Paper.pdf 55 No Child Left Inside Outdoor Education and Recreation Grant Program, Washington State Parks & Recreation Commission, https://parks.state.wa.us/DocumentCenter/View/6008/NCLI-Final-Report-2009-10-02 56 No Child Left Inside, Washington State Recreation and Conservation Office, 2021, https://rco.wa.gov/grant/no-child-left-inside/ 57 Governor Announces $4.5 Million in Grants to Get Kids Outside, Washington State Recreation and Conservation Office, May 25,2021, https://rco.wa.gov/2021/05/25/inslee-announces-4-5-million-in-grants-to-get-kids-outside/

64 | P a g e
Other Examples Like Washington, the State of Hawaii has a No Child Left Inside Grant to “provide resources and support
to public agencies, private organizations, and individuals in establishing and maintaining outdoor
education and recreation programs for children”58 The grants are established within the treasury of the
State’s special fund. The funding for the No Child Left Inside special fund comes from gifts/donations
and moneys appropriated from general revenues of the State of Hawaii.
In 2019, New Mexico created the Outdoor Equity Fund to provide youth in New Mexico with outdoor
education grants. The money in the fund is managed and delegated by New Mexico’s Outdoor
Recreation Division. $1.5 million is appropriated from the State’s general fund to the economic
development department for expenditure in the fiscal year for the operation of the New Mexico
Outdoor Recreation Division.59 Similar to Hawaii and Washington’s programs, donations and grants from
outside sources are also sources of funding.
58 S.B. NO. 507, The Senate Thirty-First Legislature State of Hawaii, Jan 22, 2021, https://www.capitol.hawaii.gov/session2021/bills/SB507_.PDF 59 54TH LEGISLATURE - STATE OF NEW MEXICO - FIRST SESSION, 2019 https://www.nmlegis.gov/Sessions/19%20Regular/bills/senate/SB0462COS.pdf

65 | P a g e
Recommendations 1. Curriculum and camp environments should be designed to allow children from all backgrounds
and of all abilities to feel like they belong and to facilitate equitable learning
2. Flexibility of funding is important, as transportation costs for outdoor education can often be a
significant barrier for schools
3. Fund at least one outdoor school program at a Washington State Parks and Recreation (Parks),
Department of Natural Resources (DNR), or Department of Fish and Wildlife (WDFW) facility in
each Educational Service District (ESD)
a. This ensures equitable access for students in all geographic regions and offers high
levels of accessibility for students with disabilities
b. Initially, Parks may just provide facilities while the school or school district provides
instruction, activities, and supervision; however, in the long term the goal would be to
have Parks staff involved in curriculum design and implementation
4. Allow both residential and day programs ranging in length from 3-5 days to be eligible for
outdoor school funding
5. Create a list of standard learning outcomes for outdoor school and require that programs meet
at least a certain number of outcomes to be eligible for funding
6. A key factor for the long-term success of a statewide outdoor school law is sustainable and
reliable funding. As such, appropriations from the general fund may not be ideal because they
are subject to fluctuations due to economic conditions.
7. Washington State’s Recreation and Conservation Office (RCO), in partnership with the Office of
the Superintendent of Public Instruction (OSPI), may be well positioned to administer funds for a
statewide outdoor school grant given its experience administering grants through the No Child
Left Inside program. It is also recommended to involve the Association of Washington School
Principals within this process.

66 | P a g e
Appendix A – Outdoor School Program Survey Results
Program Attributes
Do you offer outdoor education programs? (n=124)
Out of the 124 programs that responded to the survey, 86 currently offer some form of outdoor
education. Respondents who do not offer outdoor education were directed to the end of the survey
and did not answer any additional questions. A high negative response to this question was expected
because of the methodological design to seek organizations that might self-identify outdoor education
alignments.
Figure 15: Survey Respondents Offering vs. Not Offering Outdoor Education
69%
31%
Do you offer outdoor education programs?
Yes No

67 | P a g e
Which types of outdoor education programs do you offer? (n=83)
Most respondents (55 percent) offer both day and residential programs. Daytime-only programs were
also common (29 percent), while residential-only programs were the least prevalent (16 percent).
Figure 16: Types of Outdoor Education Program Offered (Day vs. Overnight)
Every region had at least one outdoor education provider respond to the survey; however, most
responses were concentrated in the Seattle-King (16), Snohomish (12), and Northwest (10) regions. This
density cluster is not unexpected given the general population distribution of the state.
Table 7: Outdoor Education Type (Day vs. Overnight) by Region
Day programs
Residential (overnight) programs
Both day programs and residential programs
Total
Benton-Franklin 1 0 0 1
Eastern 0 0 2 2
North Central 1 1 3 5
Northwest 4 3 3 10
Olympic 1 3 2 6
Pacific Mountain 0 1 2 3
Seattle-King 6 0 10 16
Snohomish 3 2 7 12
South Central 3 2 2 7
Southwest 0 0 1 1
Spokane 2 0 1 3
Tacoma-Pierce 1 1 6 8
Total 22 13 40 75
29%
16%
55%
Which types of outdoor education programs do you offer?
Day programs Residential (overnight) programs Both day programs and residential programs

68 | P a g e
In thinking about where you offer your outdoor education program, please select which county your
outdoor education program is located in. (n=75)
While the survey did reach outdoor education programs in all 12 workforce development areas, many
counties were not represented. This is especially notable in Eastern Washington and likely suggests a
lack of established outdoor education programs rather than simply a lack of survey respondents. In the
Benton-Franklin Workforce Development Area, only one program responded to the survey, and they did
not respond to most questions.
Figure 17: Number of Responses by County
Figure 18: Distribution of Responses by Workforce Development Area
1%
1%
3%
4%
5%
7%
8%
9%
11%
13%
16%
21%
0% 5% 10% 15% 20% 25%
Benton-Franklin
Southwest
Eastern
Pacific Mountain
Spokane
North Central
Olympic
South Central
Tacoma-Pierce
Northwest
Snohomish
Seattle-King
Number of Responses by Workforce Development Area

69 | P a g e
Please tell us more about the size of your educational facilities that your program offers for instructional
programs (n=59)
Note that for this question “groups” do not necessarily represent different schools, but rather the
potential division of students from a single school into learning groups of different sizes. For programs
that offer small-group activities, they reported being able to support an average of 9 groups at a time;
however, this could range from 1 to 40 groups depending on the program. As group size increases,
facilities can support fewer groups at a time. The average program that offers mid-size group education
can serve 5 groups at a time, and for large groups the average drops to 3.
It is important to note that while a program may be able to support 9 small groups, 5 mid-size groups,
and 3 large groups, the numbers should not be added. This program likely could not support 17 groups
of varying sizes at once, rather it would reach its maximum capacity at either 9 small groups, 5 mid-size
groups, or 3 large groups.
Table 8: Number of Groups Supported by Group Size
Smallest # Groups Largest # Groups Average # Groups
Small Groups (<15) 1 40 9
Mid-Size Groups (15-40) 1 30 5
Large Groups (>40) 1 20 3
The following table shows the maximum number of groups that can be accommodated by region and
group size. Again, it is important not to sum across columns but rather to consider them individually.
Also note that not all programs offer instruction for all group sizes.
Table 9: Number of Groups Supported by Region and Group Size
Total Small Groups (<15) Total Mid-Size Groups (15-40) Total Large Groups (>40)
Benton-Franklin 0 0 0
Eastern 42 31 21
North Central 7 3 3
Northwest 49 33 10
Olympic 48 31 19
Pacific Mountain 15 8 4
Seattle-King 50 13 8
Snohomish 88 42 21
South Central 45 28 7
Southwest 4 2 1
Spokane 22 4 4
Tacoma-Pierce 67 36 21
Total 437 231 119

70 | P a g e
Does your program offer designated learning lab space(s) for outdoor education groups? (n=73)
Responses to this question are relatively evenly distributed between answer choices. This may in part
be due to some confusion with the wording of the question. Respondents who selected No or N/A may
not have lab activities or may not have a set location or group of locations where they run lab activities.
Figure 19: Prevalence of Dedicated Learning Lab Space
Table 10: Prevalence of Dedicated Learning Lab Space by Region
Yes No N/A
Benton-Franklin 0 0 0
Eastern 2 0 0
North Central 0 2 3
Northwest 5 3 2
Olympic 2 2 1
Pacific Mountain 2 0 1
Seattle-King 4 5 5
Snohomish 3 5 4
South Central 2 1 4
Southwest 0 1 0
Spokane 1 3 0
Tacoma-Pierce 5 2 1
Total 26 24 21
37%
34%
29%
Does your program offer designated learning lab space(s) for outdoor education groups?
Yes No N/A
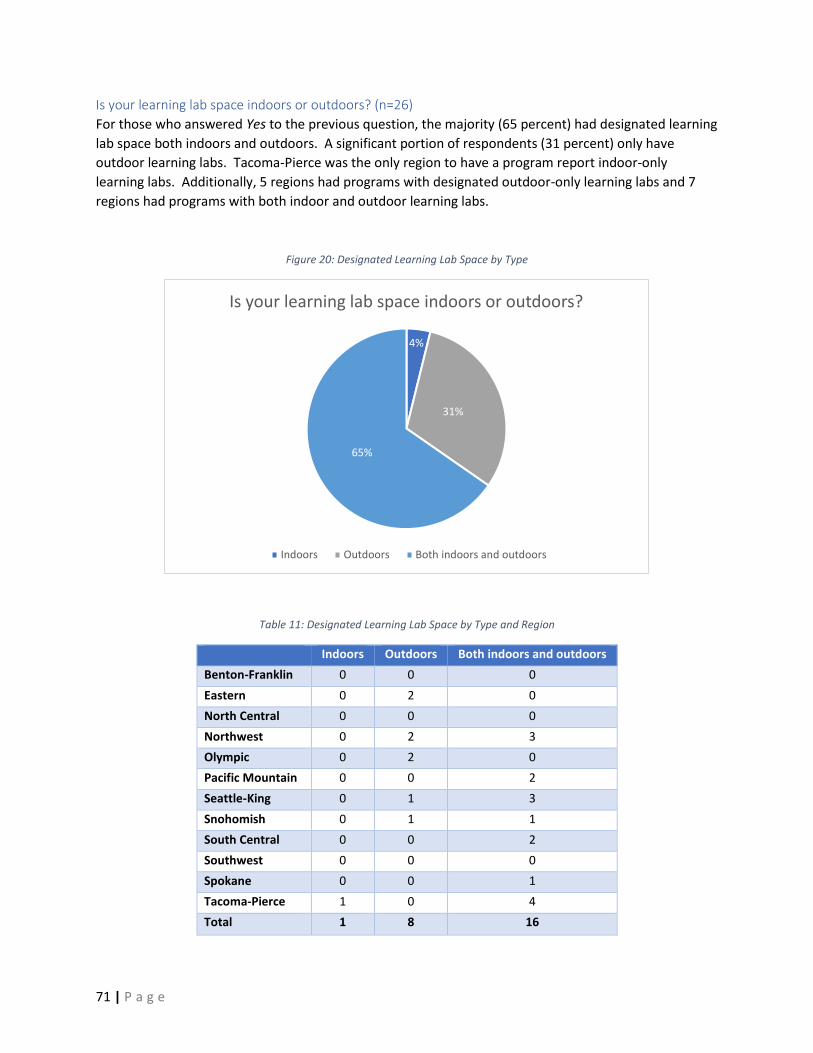
71 | P a g e
Is your learning lab space indoors or outdoors? (n=26)
For those who answered Yes to the previous question, the majority (65 percent) had designated learning
lab space both indoors and outdoors. A significant portion of respondents (31 percent) only have
outdoor learning labs. Tacoma-Pierce was the only region to have a program report indoor-only
learning labs. Additionally, 5 regions had programs with designated outdoor-only learning labs and 7
regions had programs with both indoor and outdoor learning labs.
Figure 20: Designated Learning Lab Space by Type
Table 11: Designated Learning Lab Space by Type and Region
Indoors Outdoors Both indoors and outdoors
Benton-Franklin 0 0 0
Eastern 0 2 0
North Central 0 0 0
Northwest 0 2 3
Olympic 0 2 0
Pacific Mountain 0 0 2
Seattle-King 0 1 3
Snohomish 0 1 1
South Central 0 0 2
Southwest 0 0 0
Spokane 0 0 1
Tacoma-Pierce 1 0 4
Total 1 8 16
4%
31%
65%
Is your learning lab space indoors or outdoors?
Indoors Outdoors Both indoors and outdoors

72 | P a g e
Do you provide outdoor education curriculum? (n=71)
Most outdoor education programs (73 percent) provide their own curriculum either independently or in
collaboration with the school attending their program. Only 7 percent require the school or district to
provide all outdoor education curriculum. The remaining 20 percent chose Other and elaborated on
how they offer curriculum alone or in partnership with schools.
Figure 21: Curriculum Provision by Program vs. Schools
Table 12: Curriculum Provision by Region and Program vs. Schools
Yes, we provide all outdoor education curriculum
Yes, we work collaboratively with the school or district
No, the school or district provides all outdoor education curriculum
Other, please explain
Benton-Franklin 0 0 0 0
Eastern 1 1 0 0
North Central 0 2 1 2
Northwest 3 4 0 3
Olympic 3 1 0 1
Pacific Mountain 1 2 0 0
Seattle-King 5 3 2 3
Snohomish 6 3 0 2
South Central 2 3 1 1
Southwest 1 0 0 0
Spokane 2 0 1 1
Tacoma-Pierce 4 3 0 1
Total 28 22 5 14
39%
34%
7%
20%
Do you provide outdoor education curriculum?
Yes, we provide all outdoor educationcurriculum
Yes, we work collaboratively with theschool or district
No, the school or district provides alloutdoor education curriculum
Other, please explain

73 | P a g e
Please tell us more about the academic programs you provide or can support:
What academic subjects does your program offer? (n=57)
The most commonly offered academic subjects are environmental awareness (86 percent),
teamwork/leadership (81 percent), health/fitness (75 percent), social and emotional learning (75
percent), and biology/ecology (75 percent). While math, history/social studies, music, and
English/language arts were less likely to be currently offered, most programs would be willing to offer
the subjects in the future. Other responses included life or survival skills, an interdisciplinary curriculum,
and other location or program-specific topics.
Figure 22: Academic Subjects Currently Offered
28%
30%
30%
36%
61%
66%
75%
75%
75%
81%
86%
87%
40%
37%
49%
42%
28%
28%
19%
19%
23%
16%
12%
7%
33%
33%
21%
22%
11%
6%
6%
6%
2%
4%
2%
7%
0% 10% 20% 30% 40% 50% 60% 70% 80% 90% 100%
English/language arts
Math
History/social studies
Music
Earth science
Art
Biology/ecology
Social and emotional learning (SEL)
Health/fitness
Teamwork/leadership (i.e. ropes course)
Environmental awareness
Other
What academic subjects does your program offer?
We currently offer this Willing/able to offer in the future Unwilling/unable to offer in the future
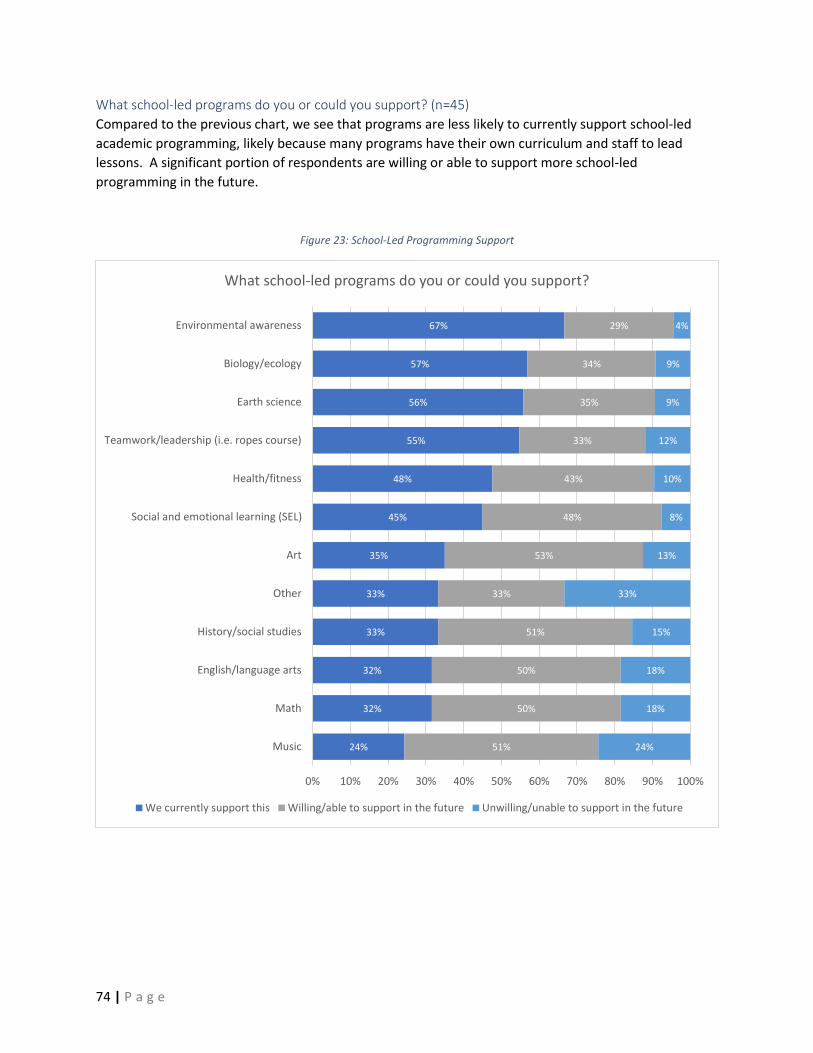
74 | P a g e
What school-led programs do you or could you support? (n=45)
Compared to the previous chart, we see that programs are less likely to currently support school-led
academic programming, likely because many programs have their own curriculum and staff to lead
lessons. A significant portion of respondents are willing or able to support more school-led
programming in the future.
Figure 23: School-Led Programming Support
24%
32%
32%
33%
33%
35%
45%
48%
55%
56%
57%
67%
51%
50%
50%
51%
33%
53%
48%
43%
33%
35%
34%
29%
24%
18%
18%
15%
33%
13%
8%
10%
12%
9%
9%
4%
0% 10% 20% 30% 40% 50% 60% 70% 80% 90% 100%
Music
Math
English/language arts
History/social studies
Other
Art
Social and emotional learning (SEL)
Health/fitness
Teamwork/leadership (i.e. ropes course)
Earth science
Biology/ecology
Environmental awareness
What school-led programs do you or could you support?
We currently support this Willing/able to support in the future Unwilling/unable to support in the future

75 | P a g e
Which other activities does your program provide? Please select all that apply (n=68)
Over half of respondents include hiking (88 percent), crafts (78 percent), sports/games (65 percent), and
archery (56 percent) in their outdoor education programs. Among Other responses, survival skills, first
aid, and other outdoor recreation activities are common.
Figure 24: Activities Currently Offered
Figure 25: Word cloud of “Other” Responses
10%15%
21%24%
28%32%34%
44%44%
56%65%
78%88%
0% 10% 20% 30% 40% 50% 60% 70% 80% 90% 100%
Horseback ridingBiking
Skiing/snowshoeing/other winter activitiesYoga
Rock climbingOther, please specify
Ropes courseSwimming
Boating/rowing/canoeingArchery
Sports/gamesCrafts
Hiking/camping
Which other activities does your program provide?

76 | P a g e
We would like to better understand your program's operating schedule for offering outdoor education
programs. For each month below, please indicate if you currently offer programs in that month, would be
interested in expanding your program to that month, or would be unable/unwilling to offer programs in
that month. Programs here could be either residential or day programs (n=68)
The greatest number of programs are operating in the summer months, with over 50 percent of
respondents operating in every month but December and January. Even in the winter months, at least
70 percent of respondents have the potential to operate.
Figure 26: Program Operations by Month
45%
50%
62%
69%
67%
78%
69%
64%
69%
65%
52%
44%
24%
23%
24%
24%
22%
10%
9%
12%
22%
23%
26%
27%
30%
27%
14%
7%
10%
12%
22%
24%
9%
12%
23%
29%
0% 10% 20% 30% 40% 50% 60% 70% 80% 90% 100%
January
February
March
April
May
June
July
August
September
October
November
December
Current Operations
Currently offer Willing to offer Would not offer

77 | P a g e
Below is a summary of the number of outdoor education programs operating throughout the year in
each region. The largest variability in operating programs is seen in Snohomish, which has 10
respondents operating in April, June, and September, but only 4 operating in January. The Eastern and
Southwest regions reported constant capacity throughout the year.
Table 13: Number of Programs Offering Outdoor Education by Month and Region
Number of Providers Currently Offering or Willing to Offer Outdoor Education
January February March April May June July August September October November December
Benton-Franklin
0 0 0 0 0 0 0 0 0 0 0 0
Eastern 2 2 2 2 2 2 2 2 2 2 2 2
North Central
4 4 4 4 3 4 4 3 4 4 3 4
Northwest 4 4 6 8 8 8 5 5 8 6 5 5
Olympic 4 4 4 4 4 4 3 3 4 4 4 4
Pacific Mountain
3 3 3 3 3 2 2 2 3 3 3 3
Seattle-King
9 9 11 10 10 11 11 11 9 9 8 10
Snohomish 4 6 9 10 9 10 8 8 10 9 7 5
South Central
4 4 5 7 7 6 6 6 7 7 6 4
Southwest 1 1 1 1 1 1 1 1 1 1 1 1
Spokane 3 3 3 3 3 2 2 2 3 2 3 3
Tacoma-Pierce
7 7 7 8 8 8 6 6 8 8 8 6
Total 45 47 55 60 58 58 50 49 59 55 50 47

78 | P a g e
In thinking about the previous question, can you tell us if you would be willing to offer a residential or day
program in each month? If you could offer either residential or day, please select both (n=68)
Looking at the trend of programs not willing to operate, there is a clear “W” shape. This suggests that
the winter months (December through February) are not suitable for over 20 percent of respondents –
likely a result of winterization needs, accessibility of roads, and general weather incompatibility. June
through August also show a peak in programs being unwilling to offer outdoor education. This is likely a
result of many programs running summer camps during this period, which are far more profitable for
the program than outdoor school. Across the majority of months, there are more programs willing to
offer daytime outdoor education compared to the number willing to offer residential outdoor
education.
Figure 27: Willingness to Operate by Month and Program Type
24%
15%
10%
6%
24%
22%
15%
6%
6%
10%
21%
26%
63%
67%
70%
74%
49%
49%
65%
75%
74%
73%
67%
65%
34%
51%
55%
62%
49%
51%
58%
60%
59%
46%
37%
32%
0% 10% 20% 30% 40% 50% 60% 70% 80%
December
November
October
September
August
July
June
May
April
March
February
January
Willingness to Operate
Residential program Day program Unable to operate/offer outdoor school

79 | P a g e
We would like to understand your current fee structure for outdoor education programs. In thinking
about student participants, what are your fees per day (including meals) for residential and day
programs? If you charge different rates based on the length of the experience, please use an average
rate. Do not include scholarships or other discounts. (n=59)
Data reported in the survey was not easily standardized. Some respondents reported multi-day rates
and others reported hourly rates, some included food costs and others did not, and some explained that
their rate structures are complex and vary depending on a variety of factors. After attempting to
standardize the data, the average cost per study, per day is estimated to be $40 for day programs and
$95 for residential programs
Table 14: Estimated Per Student, Per Day Costs for Day and Residential Programs
Day Program Cost (per student, per day) Residential Program Cost (per student, per day)
Minimum Maximum Average Minimum Maximum Average
$0 $83 $40 $0 $354 $95
Outdoor education rate structures can be complicated and rely on a variety of factors. If there is anything
you want to expand on about the costs associated with you program, we would love to hear more in the
comment box below: (n=44)
Programs noted a variety of factors that impact their pricing, including trip length, number of
participants, staff needed, and provision of food or supplies.
Programs may be regulated or voluntarily
conform to regulations from a variety of
agencies and organizations. In thinking
about your program, which of the
following provide you with health and
safety standards? (select all that apply)
(n=62)
Nearly 80 percent of programs utilize
county health departments for health
and safety standards. Other common
resources or regulators include the
American Camp Association (48 percent)
and state agreements (44 percent).
Other responses include the CDC,
Washington State Department of Health,
parent organization guidelines (i.e.
YMCA, Boy Scouts, a university, etc.),
and school district guidelines.
Figure 28: Health and Safety Standards
79%
48%
44%
32%
31%
26%
16%
6%
0% 20% 40% 60% 80% 100%
County health department
American Camp Association (ACA)
State agreement
Other (please explain)
City health department
Federal agreement
Department of Children Youth andFamilies (DCYF)
Tribal agreement
Health and Safety Standards

80 | P a g e
Staff Attributes
In thinking about your outdoor education programs, does your staff work weekly as needed or are they
hired for a full season? Do you bring in volunteers, or is everyone on your outdoor education team in a
paid position? Feel free to select multiple answer choices to reflect all types of staff involved in your
outdoor education programs. (n=66)
Most commonly, programs reported having seasonal paid staff (70 percent); however, seasonal
volunteers (50 percent) and weekly paid staff (41 percent) were common. Other (paid) positions were
most commonly reported to be year-round staff and Other (volunteer) positions were short-term or
provided by outside organization (i.e. AmeriCorps).
Figure 29: Staffing Structure
When looking for staff, do you have any requirements for certifications, training, or education? (n=64)
Most programs surveyed (81 percent) require their staff to have some form of certification, training, or
educational background.
Figure 30: Educational, Training, or Certification Requirements for Staff
70%
50%41%
29% 24% 21%
0%
20%
40%
60%
80%
Seasonal (paid) Seasonal(volunteer)
Weekly (paid) Other (paid) Weekly(volunteer)
Other (volunteer)
Staff Type
81%
19%
Special requirements for staff
Yes No

81 | P a g e
Does your program require outdoor education staff to have any specific certifications or training? (select
all that apply) (n=51)
Of those who selected Yes in the previous question, CPR/First Aid certification was most likely to be
required of all staff (63 percent). For those who responded Other - Education, common responses
included Wilderness First Aid or Wilderness First Responder certification, years of experience in outdoor
education or working with children, Mental Health First Aid certification, and masters or PhD
requirements for some staff.
Figure 31: Type of Requirements for Staff
2%
8%
8%
38%
63%
63%
50%
33%
20%
24%
33%
15%
9%
16%
29%
19%
2%
4%
39%
43%
43%
19%
2%
19%
0% 10% 20% 30% 40% 50% 60% 70% 80% 90% 100%
Lifeguard/boat guard
Challenge Course
Bachelor's Degree
Other - Education:
CPR/First Aid
Other
Staff Requirements
Required for all staff Required for some positions Preferred, but not required Not required

82 | P a g e
The COVID-19 pandemic has made acquiring and retaining staff unusually difficult. For this question,
think about your experiences with staffing pre-pandemic and your expectations post-pandemic. If your
program had an increase in schools wanting to attend, how easily could you attract and retain the staff to
support these additional participants? (n=64)
Overall, respondents reported finding it easier to retain staff than to attract new staff. Attracting new
staff was reported to be somewhat or very difficult for 46 percent of respondents. In comparison, only
27 percent of respondents indicated that retaining staff would be difficult.
Figure 32: Ease of Attracting and Retaining Staff
6%
13%
17%
38%
30%
23%
33%
27%
13%
0%
0% 10% 20% 30% 40% 50% 60% 70% 80% 90% 100%
Attracting new staff
Retaining current staff for additional hours/weeks/seasons
Ease of Attracting and Retaining Staff
Very Easy Somewhat Easy Neutral Somewhat Difficult Very Difficult
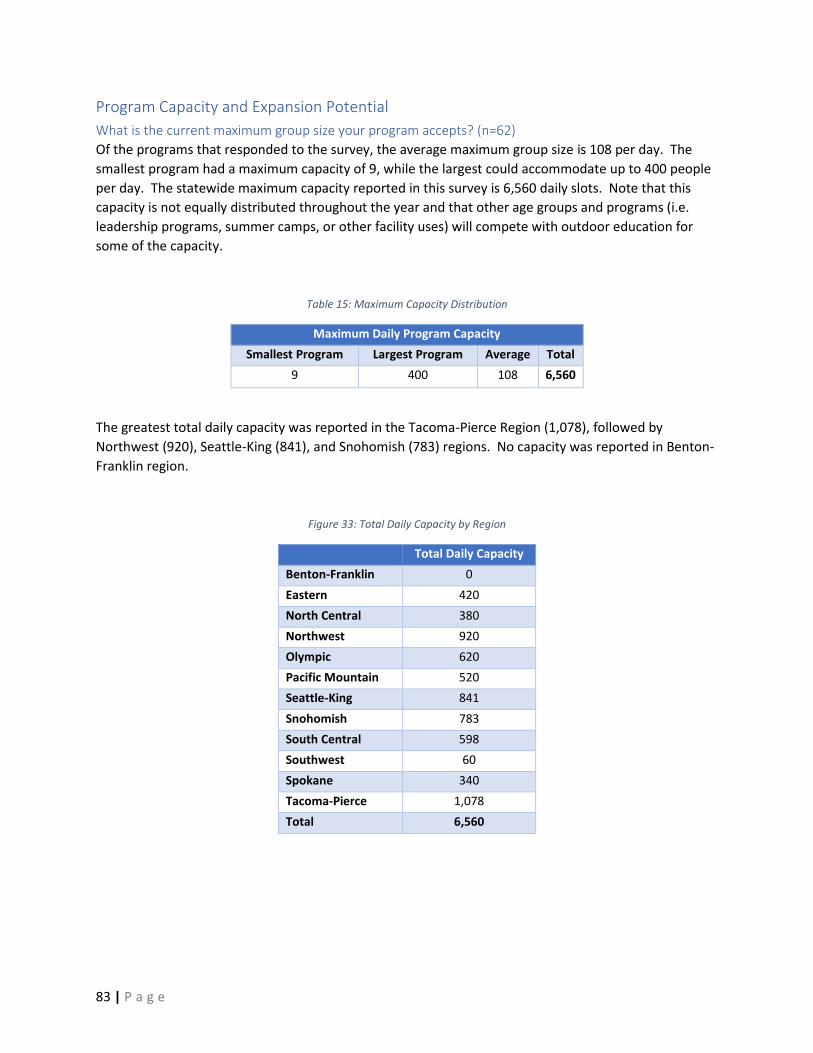
83 | P a g e
Program Capacity and Expansion Potential
What is the current maximum group size your program accepts? (n=62)
Of the programs that responded to the survey, the average maximum group size is 108 per day. The
smallest program had a maximum capacity of 9, while the largest could accommodate up to 400 people
per day. The statewide maximum capacity reported in this survey is 6,560 daily slots. Note that this
capacity is not equally distributed throughout the year and that other age groups and programs (i.e.
leadership programs, summer camps, or other facility uses) will compete with outdoor education for
some of the capacity.
Table 15: Maximum Capacity Distribution
Maximum Daily Program Capacity
Smallest Program Largest Program Average Total
9 400 108 6,560
The greatest total daily capacity was reported in the Tacoma-Pierce Region (1,078), followed by
Northwest (920), Seattle-King (841), and Snohomish (783) regions. No capacity was reported in Benton-
Franklin region.
Figure 33: Total Daily Capacity by Region
Total Daily Capacity
Benton-Franklin 0
Eastern 420
North Central 380
Northwest 920
Olympic 620
Pacific Mountain 520
Seattle-King 841
Snohomish 783
South Central 598
Southwest 60
Spokane 340
Tacoma-Pierce 1,078
Total 6,560

84 | P a g e
What is the current minimum group size your program accepts? (n=60)
Respondents have minimum group size requirements ranging from 1 student to 50, with the average
being a minimum group size of 11.
Table 16: Minimum Capacity Distribution
Minimum Program Capacity
Smallest Program Largest Program Average
1 50 11
Is your program able to host multiple outdoor education groups at the same time? (n=65)
Overall, 71 percent or respondents reported being able to host more than one outdoor education group
at a time. It can be assumed that the sum of the groups would not exceed the maximum group size (i.e.
two groups of 50 or one group of 100).
Figure 34: Ability to host multiple groups simultaneously
71%
29%
Is your program able to host multiple outdoor education groups at the same time?
Yes No

85 | P a g e
Thinking about your residential programs, what is the average size of your sleeping accommodations (i.e.
the average number of beds per cabin) (n=45)
Average sleeping accommodations ranged from 1-person tents to 200-bed dorms.
Table 17: Average Tent, Cabin, or Dorm Capacity
Average Cabin/Tent/Dorm Capacity
Smallest Program Largest Program Average
1 200 20
What is the total capacity for your sleeping accommodations (i.e. total number of beds -- this may be
greater than or less than your program capacity). (n=45)
The average residential program can house 169 people; however, capacity ranges from 8 to 700
depending on the program. Total overnight capacity in Washington exceeds total program capacity,
potentially suggesting room for expansion. The same pattern is not true of all regions – for example, the
maximum overnight capacity for Spokane is 9 people, based on the programs responding to this survey.
Table 18: Maximum Overnight Capacity Distribution
Maximum Program Overnight Capacity
Smallest Program Largest Program Average Total
8 700 169 7,436
Table 19: Total Overnight Capacity by Region
Total Overnight Capacity
Benton-Franklin 0
Eastern 130
North Central 806
Northwest 1,058
Olympic 808
Pacific Mountain 850
Seattle-King 527
Snohomish 1,046
South Central 744
Southwest 26
Spokane 9
Tacoma-Pierce 1,432
Total 7,436
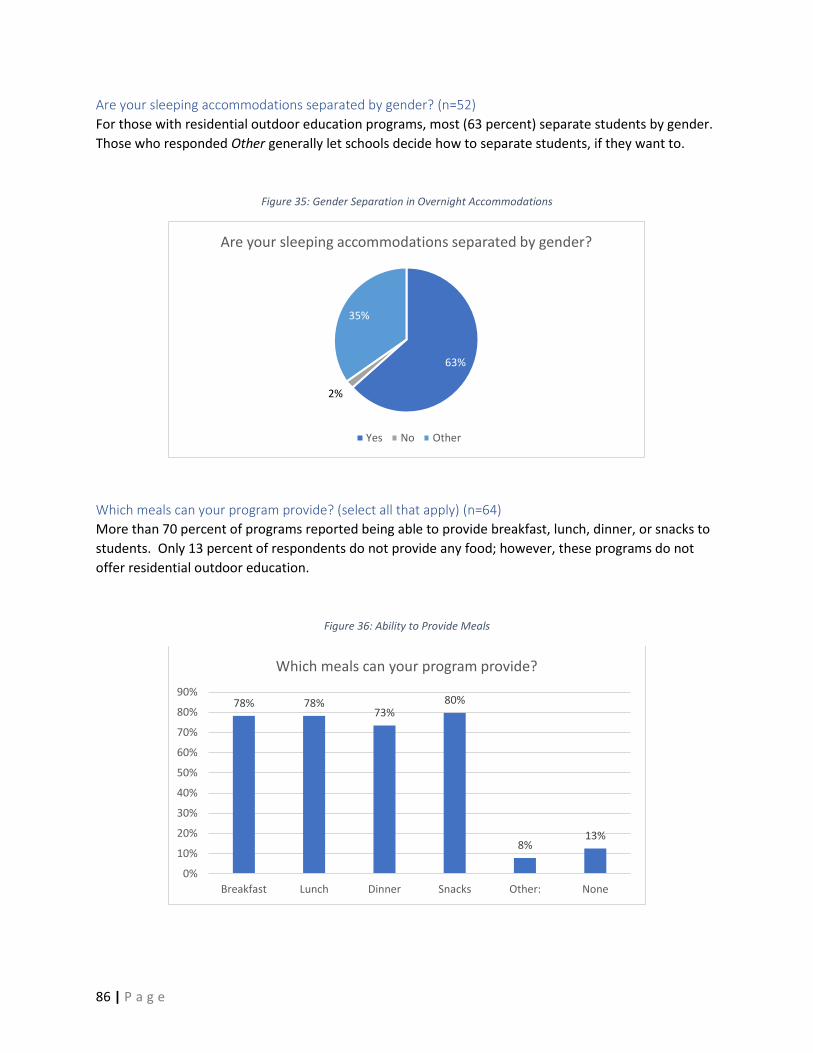
86 | P a g e
Are your sleeping accommodations separated by gender? (n=52)
For those with residential outdoor education programs, most (63 percent) separate students by gender.
Those who responded Other generally let schools decide how to separate students, if they want to.
Figure 35: Gender Separation in Overnight Accommodations
Which meals can your program provide? (select all that apply) (n=64)
More than 70 percent of programs reported being able to provide breakfast, lunch, dinner, or snacks to
students. Only 13 percent of respondents do not provide any food; however, these programs do not
offer residential outdoor education.
Figure 36: Ability to Provide Meals
63%
2%
35%
Are your sleeping accommodations separated by gender?
Yes No Other
78% 78%73%
80%
8%13%
0%
10%
20%
30%
40%
50%
60%
70%
80%
90%
Breakfast Lunch Dinner Snacks Other: None
Which meals can your program provide?

87 | P a g e
Please tell us a bit more about your food-preparation and dining capacity (select all that apply) (n=56)
For those who provide food, 75 percent have dining halls or commercial kitchens and 75 percent have
outdoor cooking options. Other responses include small kitchens and food from vendors or the school.
Figure 37: Food Preparation and Dining Facilities Available
Dining halls tend were able to serve 190
people, on average; however, capacity
by program ranged from 30 to 500. The
total statewide capacity reported
through the survey is 6,078.
For outdoor dining, the average capacity
reported was 132, with individual
program capacity from 12 to 400.
Statewide, respondents reported a
capacity of 3,174 – slightly more than
half of the statewide dining hall capacity.
Two regions have no dining capacity
reported within the survey: Benton-
Franklin and Spokane. The Southwest
region has a reported dining hall capacity
of 80 people, but no reported outdoor
dining.
75% 75%
16%
0%
20%
40%
60%
80%
Dining hall/commercial kitchen(please enter total capacity)
Outdoor, small groups -- camp fire,barbecue, etc. (please enter total
capacity)
Other:
What type of food preparation facility(s) do you offer?
Table 20: Dining Distribution by Capacity and Region
Maximum Dining Hall Capacity
Smallest Program Largest Program Average Total
30 500 190 6,078
Maximum Outdoor Dining Capacity
Smallest Program Largest Program Average Total
12 400 132 3,174
Total Capacity Dining Hall Outdoor Dining
Benton-Franklin 0 0
Eastern 200 100
North Central 375 210
Northwest 688 480
Olympic 817 192
Pacific Mountain 800 130
Seattle-King 200 200
Snohomish 960 498
South Central 694 364
Southwest 80 0
Spokane 0 0
Tacoma-Pierce 1,264 1,000
Total 6,078 3,174

88 | P a g e
Please rank how significant the following barriers are to increasing your capacity or months of operation:
(n=63)
The greatest barriers to expansion are funding (87 percent), staffing (78 percent), and facility limitations
(72 percent). Expanding shoulder season use (59 percent) and winterization (58 percent) were also
barriers to more than half of respondents. Other barriers include water rights, avalanche risks, zoning,
and support in the surrounding community.
Figure 38: Barriers to Expanding Months of Operation
42% 41%
22%27%
13%
27%
31%42%
49% 38%
29%
18%
27%17%
29%35%
58% 55%
0%
10%
20%
30%
40%
50%
60%
70%
80%
90%
100%
Winterization orseasonal
structures
Expanding use inshoulder seasons
Staffing (attractingor retaining)
Facility size orlimitations to
existing facility
Funding forexpansion
Other
Ranking of barriers to expanding capacity or months of operation
Not a Barrier Slight Barrier Significant Barrier
89 | P a g e
We would like to understand your overall interest in potentially expanding your facility or program to
accommodate more children each year. Which of the following best describes your interest in
expansion? (select all that apply) (n=66)
Respondents were able to select more than one answer choice, therefore column totals should not be
added together. More than half of respondents (59 percent) have an expansion project planned but are
lacking funding. Only 3 percent of respondents are unable to expand and 9 percent are unwilling to
expand.
Figure 39: Interest in Expansion
12%
59%
30%
18%
9% 9%
3%
0%
10%
20%
30%
40%
50%
60%
70%
Currently haveplanned
expansionprojects thatare funded
Have plannedexpansion
projects thatneed funding
Interested inexpansion, but
do not have anyconcrete plans
at this time
Open to theidea, but notcommitted
Have concernsabout theimpacts ofexpansion
Not interestedin expanding
Unable toexpand
Describe your interest in expansion

90 | P a g e
Other Considerations
In thinking about best practices for outdoor education, can you tell us your top resources that provide
this guidance for you? (n=47)
Many programs look to online resources and peers for guidance. Commonly cited national resources
include the American Camp Association (ACA), BEETLES, and program-specific organizations (i.e. Boy
Scouts, YMCA, religious organizations, universities).
Figure 40: Best Practices Resources Word Cloud
91 | P a g e
Do you collect any data on educational or other outcomes for children who participate in your program?
(select all that apply) (n=60)
Most respondents (75 percent) survey their participants, with most data collection happening at the end
of the program (38 percent). Other responses include surveying teachers, inconsistent survey
implementation, and informal feedback.
Figure 41: Program Data Collection
In terms of academic and other activities, what languages are spoken by staff? (select all that apply)
(n=64)
All programs have staff who speak English and 30 percent of the programs have staff who speak
Spanish. Programs that responded Other tend to have international staff, with languages varying by
year.
Figure 42: Languages Spoken by Staff
25%
28%
30%
38%
0% 5% 10% 15% 20% 25% 30% 35% 40% 45%
No
Yes, we provide a survey after the students depart
Yes, other:
Yes, we provide an exit survey conducted at the end of ourprogram
Do you collect any data on educational or other outcomes for children who participate in your program?
100%
30%
17%
0%
20%
40%
60%
80%
100%
English Spanish Other
Languages Spoken by Staff

92 | P a g e
If requested, do you provide printed materials (i.e. health forms, consent forms, program overviews) in
languages other than English? (n=61)
More than half (54 percent) of respondents offer their printed materials in a language other than
English. Of those who do offer materials in other languages, 64 percent offer material in Spanish, 7
percent in Mandarin, and 7 percent in Russian.
Figure 43: Languages of Materials/Forms
Figure 44: Other Languages Offered for Printed Materials
54%
46%
Do you provide printed materials in languages other than English?
Yes (please list languages) No
7%
7%
14%
64%
Russian
Mandarin
Other
Spanish
0% 10% 20% 30% 40% 50% 60% 70%
Form Languges Offered

93 | P a g e
Please select all physical, mental, and medical needs your program can support: (n=57)
Of those programs that are able to support special needs, 77 percent are able to provide some level of
physical accommodations, 51 percent offer behavioral support, and 46 percent offer mental health
support. Support for specialized medical needs was the least common among respondents (25 percent).
Those who responded Other generally rely on assistance from schools in supporting students with
special needs.
Figure 45: Physical, Mental, and Medical Needs Supported
Over the past few years, have you had any requests for dietary, physical, or other accommodations that
you could not reasonably meet? If so, please tell us more about the requests and what you would need
to be able to meet a similar request in the future. (n=43)
Common struggles include:
• The physical terrain or built facilities
• Staff who are not trained to support specific needs
• Insufficient staff to provide 1:1 support
• Some dietary needs cannot be met, so students will bring their own food
77%
51%
46%
37%
25%
0%
10%
20%
30%
40%
50%
60%
70%
80%
90%
Physicalaccommodations for a
disability
Behavioral support Mental health support Other: Specialized medicalsupport
Physical, Mental and Medical Needs Supported

94 | P a g e
Please tell us more about any other special attributes of your program that we may not have captured
within the survey (i.e. marine-focused, agriculture-focused, specialties, etc.) (n=48)
Throughout responses, there is a focus on place-based learning. This can relate to the local
environment, tribes, or industry. In the word cloud below, common references include environmental
and marine science, communities, adventure, and the Salish Sea.
Figure 46: Special Camp Attributes
95 | P a g e
Benefits of Outdoor Education
First, what do you think are the key benefits of outdoor education for students? (n=49)
The key benefits for students fall into two broad categories: academics and SEL (social and emotional
learning). One respondent summarized the general consensus well (lightly edited):
• SEL: self-esteem, peer relations, leadership, self-control
• Improved academic engagement, confidence, and achievement
o Especially for students who do not traditionally thrive in the classroom
• Improved physical and mental health
• Environmental awareness and stewardship
Figure 47: Benefits for Students

96 | P a g e
Second, please tell us a bit more about the key benefits of your program for your staff/volunteers: (n=47)
When asked about the benefits to outdoor education staff, respondents tended to focus on intangible
benefits rather than tradition employment benefits including wages, health insurance, etc. Common
responses include:
• Getting to do enjoyable/rewarding work
• Gathering teaching experience
• Benefits of working in a natural environment
• Interacting with a diverse group of students
Figure 48: Benefits for Program Staff/ Volunteers

97 | P a g e
Third, what is the benefit of providing outdoor education to your overall organization? (n=45)
Many respondents report that outdoor education aligns with their mission or helps to expand their
brand image within the community. For many, outdoor education allows them to expand into shoulder
seasons or to weekday use, thus increasing revenues and supporting more stable employment.
Respondents also mention benefits to students, staff, and their local community.
Figure 49: Benefit to Outdoor Education Organization

98 | P a g e
Please use the space below to identify any other stakeholder groups who you believe receive primary or
secondary benefits from students attending outdoor education programs: (n=36)
Respondents report that outdoor education’s benefits spread far beyond the students at an outdoor
education program. Through these programs and the lessons students learn benefits are also seen by:
• The environment and industries that rely on it
• Families of participants
• Schools and teachers
• Local economies
• Donors and community partners
• The broader Washington community
Figure 50: Other Stakeholders and Benefits

99 | P a g e
Appendix B – Outdoor School Program Discussion Groups
Participant Background Let’s start with introductions. Can you tell us your name and a bit about your experience in the
outdoor education field? Where do you all work now? What types of programs do you offer?
In all, 13 people participated in discussion groups representing 12 different camps. Five discussion
sections were held, each of which had 1-3 participants. Program stakeholders were well-represented in
terms of geography. Stakeholders were also well represented in terms of the types of camps offered.
While many participants represented residential programs, we also heard from day programs and
representatives that do not currently run an outdoor school program.
The participating outdoor program stakeholders were a mix of men and women. The demographics of
the research participant group is not necessarily representative of the demographics of the US
population; therefore, we must be mindful that underrepresented groups (Black, Indigenous, and
People of Color) were not heard in these discussions. The lack of representation highlights the need for
more diversity in the outdoor recreation space. Nonetheless, discussion groups provided meaningful
insight into a number of topics related to outdoor education.
Outdoor Education Attributes and Best Practices When you hear the term outdoor education, I am interested in what comes to mind in terms of
activities, academics, location, and duration. Let’s take each one separately with some quick
responses:
Activities
Many of the participants listed activities that were not included in the survey that they took previously.
Program stakeholders listed non-academic activities and emphasized outdoor skills. Some activities
mentioned were survival skills, plant identification, camping, and hiking.
Academics
In terms of academics, the participants noted hands-on experiences and interdisciplinary learning. Some
participants mentioned “science” generally, while many mentioned more specific disciplines such a
geology or biolog
Location
A commonly used phrase was “place-based.” This term was applied to many other aspects of outdoor
education, meaning that activities and curriculum were dependent on the physical location of the site.
Many participants emphasized the importance of regional biomes (i.e., marine, volcanoes, forests).
Others said that outdoor education can be anywhere from the schoolyard to a local or National Park.

100 | P a g e
Duration
The greatest source of disagreement was in the duration of outdoor education. Many of the differences
of opinion were surrounding the age of the children participating. Several participants agreed that a full
5-day experience is important, though the most common answer was “3 days, 2 nights.”
Given your experience in the field, I’m interested in hearing more about best practices are most
important when running an outdoor education program. Again, let’s break this apart into smaller
questions.
What age or grade level is best suited to this type of program?
Many participants said that older children (late middle school age) are best suited for outdoor
education. They noted challenges with extracurricular activities with high school students. Though, some
preferred working with high school students. Some said that students below third grade struggle with
homesickness and cited difficulties with parents allowing younger children to attend an overnight trip.
Participants also noted that 5th/6th grade students have the least amount of extra-curricular conflicts
that could prevent them from attending.
Are there any best practices with respect to months or seasons of operation?
There were some differences between groups in response to this question with no clear consensus.
Some focused on weather, saying that May-October is the best time of year to ensure the best activities.
Many also emphasized that the best time of year depends on the specific camp/region.
Other participants reflected on the best time of year for the students academically. Some said that the
end of the school year (June) was the best time because it is a celebration of the end of school or that
the beginning of the school year (September) is best as a kick-off trip to get to know each other. Others
said that June is the worst time because students are ‘checked out’ and ready for summer vacation or
that September is the worst time because students aren’t yet comfortable with their classmates.
What about the role of outdoor education staff vs. school staff or volunteers?
Most participants had similar roles for different staff members and volunteers. Most groups had full-
time staff do most teaching and leading activities while school staff and volunteers act as chaperones
and handle behavior management. Only one participating program used the school’s teachers to
provide curriculum. Some participants utilized college or high school students as additional staff. Several
participants said that they have difficulties retaining staff and finding staff from diverse backgrounds.
The key takeaway from our discussions is that each program and school has found a balance of staff and
volunteers that match with their underlying values and fiscal/operational constraints.
What guides your curriculum design?
Many participants said that their curriculum evolved over time as they gained experience. Many also
said that they used the pandemic to update their curriculum. One source that many participants

101 | P a g e
mentioned was BEETLES60, a curriculum developed by UC Berkeley, several others also used guidance
from other universities. Project Learning Tree was also mentioned as an important source of outdoor
curriculum. Some participants also said that they adapt curriculum based on the district or teacher’s
desired outcomes.
Many programs reported leveraging the use of internship programs from Western Washington
University to create custom curriculum for their facility.
Are there any organizations you look to for guidance?
All research groups shared similar organizations that they look to for guidance. Some of the
commonly mentioned organizations were as follows:
• Association of Nature Center Administrators (ANCA)
• Department of Children, Youth, and Families (DCYF)
• National Outdoor Leadership School (NOLS)
• American Camp Association (ACA)
When thinking about operating an outdoor education program, what liability issues are most important
to consider? What are some best practices in this area?
While many participants noted the importance of background checks and first aid training, an
unexpected liability issue was fire risk. A few participants discussed the rising expense of fire insurance
and the threat that forest fires pose to camps.
The length of programs can vary. In your opinion, how many days would the ideal outdoor education
program be?
Many participants agreed that 3 days and 2 nights is an ideal amount of time for outdoor education for
fifth and sixth grade students. Several people stated that four to five days is necessary for the students
to settle in and be comfortable in nature. Others said that 2 weeks was best. The participants agreed
that the ‘ideal’ length of time depends on the age of the students.
Several participants noted the importance of day programs. These programs can be at minimum just a
few hours and may be a good alternative to residential programs for certain groups.
60 Better Environmental Education, Teaching, Learning & Expertise Sharing

102 | P a g e
Expansion Planning If Washington State were to provide funding so that all 5th and/or 6th graders in the state could go to a
multi-day outdoor education program, do you think there is enough capacity among existing providers
to meet that need?
Almost all participants agreed that there is not enough capacity currently to ensure every 5th or 6th grade
student in Washington receives outdoor education.
If Washington needs to expand the number of available outdoor education slots, where would that
expansion come from? Existing programs? New programs? Government run/operated facilities?
Participants offered a number of solutions, but overwhelmingly agreed that expanding outdoor
education would require a mix of expanding existing camps and funding new ones. Several participants
said that assistance hiring more staff at existing camps would be a good way to expand capacity. Many
agreed that much of the new capacity would have to come from new camps.
What barriers do you see to expanding the capacity of outdoor education in WA?
We expected most participants to mention funding as a significant barrier, and they did. However, many
participants cited lack of support from schools and districts as the main barrier. Several participants said
that having strong support from the district, school, or community members is what keeps outdoor
education as a priority in education. A few participants also noted the barriers from other groups due to
the potentially high costs to expanding outdoor programs which they may fear would result in higher
taxes.
What would help lower those barriers?
The consensus among participants was that people need to know that outdoor school is important.
Several participants said that they have just a few strong supporters at the school or district while many
teachers and parents feel that outdoor school is not valuable. Raising awareness of the importance of
outdoor education was frequently cited as a good way to reduce barriers.
What partners and organizations within Washington are best suited to helping the state turn an outdoor
education expansion plan into action?
Many participants mentioned the same organizations that they look to for guidance (ANCA, ACA, etc.).
Several others noted public land managers such as the Department of Natural Resources, the National
Parks Service, and Washington State Parks. A few also suggested building better relationships with Tribal
governments across the state. Some participants cited their relationships with universities as potential
partners in helping the state develop a plan to expand outdoor education.

103 | P a g e
Equity and Accessibility I want to next talk about equity and accessibility – two different things but connected. When you
think about outdoor education programs in general and your program specifically, what do you notice
in terms of equity and accessibility?
Many participants cited accessibility as a major issue that they struggle to better address. While many of
the participants had strategies to accommodate physical disabilities, several participants did not feel
that they were doing enough to support students with disabilities.
How have you noticed the COVID-19 pandemic impacting equity or accessibility?
With the pandemic shutting down many camps, most participants said that the pandemic worsened
equity and accessibility. However, a few said that the pandemic improved some aspects of equity and
accessibility because they were able to bring outdoor content to the students in the form of virtual tours
or remote presentations, including students who may not be able to attend outdoor school normally.
What would be most helpful in addressing these equity disparities?
While many participants said that increasing funding and scholarships for disadvantaged students would
be helpful, a significant barrier revolved around cultural issues. For example, many Hispanic/Latinx
families do not allow their children to attend outdoor school because of a variety of cultural barriers.
The participants proposed that informing parents of the benefits of outdoor education would help
reduce this barrier. Another proposed solution was to offer an ‘open house’ so that parents could see
where their children would be staying.
Many of the participants said that they struggle with attracting and retaining BIPOC staff members. They
claimed that increasing the diversity of their staff would likely make BIPOC students and their families
feel more comfortable. However, they also recognize this issue as pervasive in the outdoor community
and that the long-term solution to attracting more BIPOC staff may start with getting BIPOC students
into outdoor school.
How do you see accessibility being better supported in the Washington outdoor education landscape?
One solution posed to address accessibility was a state-funded supply of accessibility equipment that
camps could use as-needed. Other participants suggested uniform guidelines to help with accessibility or
increased funding to make their facilities more accessible.
Do you incorporate equity, diversity, inclusion, and accessibility topics in your curriculum?
All participants either said that they already incorporate these topics or that they are working on
including these topics in their curriculum.

104 | P a g e
Appendix C – Interviews with National Leaders in Outdoor School In addition to talking to outdoor education programs in Washington State, it was important to also
gather feedback from national leaders in the outdoor education field. Each interview covered topics
including best practices, the benefits of outdoor education, expansion planning, as well as equity and
accessibility. Due to busy schedules, some interviewees were unable to provide input on some
questions. The three leaders interviewed were:
Ross Turner
Ross Turner is the president of Guided Discoveries, which offers residential outdoor education programs
at various locations within California and Virginia. He began his career as a high school science teacher
in the 1960s. Soon he realized the value of teaching science outdoors and began on a journey learning
about outdoor education programs. In 1978, Turner and his wife started a nonprofit outdoor education
program on Catalina Island in an old boarding school. Initially, they served high school students, but
later expanded to younger students. Now they have three locations that serve approximately 60,000
4th-9th grade students per year.
Tom Madeyski
Madeyski has worked since 1990 as the executive director for San Diego YMCA Camps. In the 1970s,
Madeyski worked for the YMCA in Pennsylvania as the organization began a push to offer programs
year-round. In some cases, this meant leasing out camp facilities to outdoor education providers who
were looking for residential options. In other cases, YMCA camps developed their own outdoor
education programs. He currently oversees the YMCA’s residential outdoor education programs for San
Diego.
Jane Sanborn
Jane Sanborn is co-chair of the American Camp Association’s National Government Relations
Committee, as well as the director of development at Sanborn Western Camps in Colorado and a board
member for the Colorado Outdoor Education Center (COEC). She has been involved in with summer
camps and outdoor education for more than 50 years. She described COEC as a pioneer in the realm of
summer camps that have developed and sustained successful residential outdoor education programs.

105 | P a g e
Outdoor Education Attributes and Best Practices Each interviewee was asked to list a few key terms that come to mind when thinking about outdoor
education through the lens of activities, academics, and location.
Activities
• Turner: Social and emotional learning (SEL), collaboration, brainstorming, creativity, fun, team
work, snorkeling, hiking, rock climbing, experiments, experiences, ropes course
• Sanborn: Experiential, takes place outdoors, role playing, environmental focus
Academics
• Turner: Activities and academics are closely related
• Sanborn: Outdoors, engaging students in a different way of learning that involves physical
movement, best practices from Children and Nature and brain-based learning
Location: When Are Multi-Day Nonresidential Programs Viable?
• Turner: Mobile, multi-day programs are well suited to situations where schools do not have
nearby residential options or have a large population of students or families who are
uncomfortable being away from home over night. These programs can utilize local parks and
tailor their programs to local needs.
• Sanborn: Some schools that come to her outdoor education program travel over 3 hours. She
has also seen programs effectively use city parks and other local resources. The most important
factor for her is that the learning happens outdoors.
The next set of questions centered around best practices for outdoor education programs:
Age/Grade Level
All three interviewees agreed that 5th and 6th grade is the norm for residential outdoor education in the
United States. Children at this age are likely comfortable being away from home for multiple days, have
relatively few extracurricular commitments, and are still curious and willing to learn. They all agreed
that residential outdoor education can be tailored to both older and younger children.
Role of Outdoor Education Staff vs. School Staff or Volunteers
The programs Turner, Madeyski, and Sanborn have worked with all have trained staff to run lessons and
activities. Where they differ is the role of school staff and volunteers. For Turner, the only role of
chaperones from schools is to monitor children while they are not involved in a lesson or activity. In
Madeyski’s camps, he has had bad experiences using high school counselors and parent chaperones to
manage students overnight. As a result, his staff take turns sleeping in the cabins to keep an eye on
students. Sanborn, on the other hand, has had immense success using high school counselors in her
outdoor education programs. She sees this as a leadership opportunity for the high school students and
has school teachers work with them to monitor children. She also avoids having parent chaperones.

106 | P a g e
Curriculum Design and Resources
• Turner: Curriculum design is a collaborative and ever-evolving process that draws inspiration
from staff and teachers. Other potential resources for curriculum design include the North
American Association of Environmental Educators (NAAEE), the National Science Foundation,
and collaborations with local schools, organizations, and community leaders.
• Sanborn: Good outdoor education curriculum is experiential and draws from local history,
native culture, and natural resources. She notes that there are many resources available online
for both outdoor education and youth camp curriculums. She has found that “the more camp-
like engagement we can get in OE [outdoor education], the more engaged students are and the
more they learn.” Jan also follows Colorado K-12 guidelines to align with classroom curriculum.
• Madeyski: There should be an emphasis on connecting outdoor education curriculum to state
frameworks for key subjects. Two key factors to consider are the needs of local schools and
how to deliver the material in an outdoor setting. Because lessons are repeated with every
group, the program only needs a handful of hours of lessons and activities.
Liability and Risk Management
• Turner: He stresses the importance of ensuring safety for both students and facilities. This
comes from thorough research, ACA guidelines, staff training, and proper insurance. On the
topic of insurance, Turner highlighted the difficulty many outdoor education facilities are having
finding insurers willing to offer them fire insurance.
• Madeyski: When it comes to liability and risk management, there is “lots of it.” Two factors
that he thinks can be underappreciated are fire insurance and the risk of not charging enough to
cover the program’s fully burdened costs. His annual fire insurance costs increased from
$100,000 one year to $600,000 the next. This ties into the concerns surrounding fully burdened
costs. With labor and insurance costs risking, programs risk financial distress if they do not fully
understand their costs and how much they need to charge to break even. One common model
is to break even or operate at a deficit during the school year and charge higher rates for
summer camps to compensate.
• Sanborn: She noted that programs and schools should be communicating to understand how
they are sharing risks and liabilities.
Program Duration
• Madeyski: He has worked with organizations offering everything from 2-day/1-night programs
to 5-day/4-night programs – which are “the envy of all.” From his experience, 2-day trips do not
support relationship building or the same level of learning as longer programs. For 3-day trips,
he finds that students are just getting to a “good point” when they are sent home, whereas 5-
day programs can continue to build on that momentum. He cautions residential programs
against offering day programs because of transportation risks and rates that will not be
sufficient to cover the program’s fully burdened costs. For organizations without residential
facilities, he thinks it possible to run a successful program “from a curriculum perspective.”
107 | P a g e
• Sanborn: While she has experience working with programs of varying length, she prefers 4- and
5-day trips to make the school’s travel time worth it. She has seen day programs run
successfully; however, she emphasized the importance of having at least 3 full days outdoors.
Benefits of Outdoor Education Next, the national experts were asked about the benefits of outdoor education to students and other
groups:
Students
• Madeyski: He notes that outdoor education provides access to the outdoors for students who
may have limited opportunities to do so before. In addition, he sees that outdoor education
helps students develop through social and emotional learning (SEL), as well as discovering that
what they learn in class can be “real,” “fun,” and “cool.” From his experience, “Kids who don’t
shine in the classroom do shine in outdoor education.” He has found that outdoor education
also leads students to build an affinity and love for the natural world.
• Sanborn: She points to the many benefits of outdoor education that have been documented in
research including SEL benefits, physical activity’s ties brain-based education, and greater
engagement by students. She stated that children spending time outdoors is “as critical as good
nourishment and sleep.” As we emerge from the pandemic, she sees outdoor education as an
opportunity for students to “be kids again” and “heal” from the past year in safe way.
Other Groups
• Madeyski:
o Program Benefits: gets rid of a summer camp’s shoulder season, provides stable
employment for staff, generates stable revenue, and appeals to a more diverse
population than summer camps
o Local Community: outdoor education has positive economic impacts for the
communities near the program
• Sanborn:
o School Staff: benefit from seeing their students in a new light and the behavioral
differences that arise in the outdoor setting
o Outdoor Education Staff: get to do work that they enjoy and know they are making a
difference for the students they teach

108 | P a g e
Expansion Planning Both Sanborn and Madeyski noted that start-up costs can pose a significant barrier for new programs.
In some cases, they have seen municipalities, counties, or large school districts build their own
residential facility and then either operate it with their own staff or bring in an outside organization like
the YMCA. Similarly, summer camps with underutilized shoulder seasons can expand into outdoor
education and employ their staff year-round or outsource to another organization.
Equity and Accessibility As Sanborn explained, “you don’t make any money in outdoor ed.” Rather, the goal is for every student
who wants to come to be able to come. Programs offset these losses through charging higher rates for
summer camp. The San Diego YMCA is the “most diverse camping program in the country,” according to
Madeyski. This is achieved through years spent developing good relationships and trust with local
schools and communities. The YMCA has found that it has the most success when it partners with
trusted grassroots organizations who will than talk to the community and help then see the benefits of
outdoor education.
In terms of physical accessibility, Madeyski has found that “if you have enough resources and your
facilities aren’t a huge obstacle, then [making your program more accessible] is manageable.” In other
words, the biggest barrier to accessibility comes from infrastructure and the land where you operate. If
that is reasonably accessible, then it is just a matter of purchasing the right equipment (i.e. an all-terrain
wheelchair) – which can be expensive, but less so than remodeling a building.
Concluding Remarks • Madeyski: He is excited that the public is beginning to recognize the benefits of outdoor
education for children – “the stewards of tomorrow” – and hopes to see the momentum
continue to other states.
• Sanborn: During the pandemic, she has seen many schools have success teaching students
outside and she hopes that this practice will continue after the pandemic as well with a renewed
focus on incorporating physical activity into learning. She also hopes to see more collaboration
between outdoor education programs in the future.

109 | P a g e
Appendix D – K-12 School and District Survey Results
Respondent Background
Which county is your school located in? (n=166)
The survey received responses
from at least on school in all
counties except: Columbia,
Ferry, Garfield, Pacific, Pend
Oreille, Skamania, and
Wahkiakum. The distribution
of responses is similar to the
distribution of Washington
State’s population; however,
there are relatively few
responses from King County.
All 12 Workforce
Development Areas are
represented within the
sample.
Figure 52: Share of responses by Workforce Development Area
2%
4%
5%
5%
6%
7%
8%
9%
11%
12%
14%
14%
0% 2% 4% 6% 8% 10% 12% 14% 16%
Benton-Franklin
Spokane
Seattle-King
Eastern
Olympic
North Central
South Central
Southwest
Tacoma-Pierce
Snohomish
Northwest
Pacific Mountain
Responses by Workforce Development Area
Figure 51: Number of School Responses by County

110 | P a g e
What type of institution? (n=170)
Most respondents (97 percent) represent the public K-12 school system. Other respondents represent
private schools, homeschool organizations, skills centers, and online schools.
Figure 53: Type of Institution
What is your role at this institution? (n=170)
For the most part, school principals (74 percent) responded to the survey – an outcome of the contact
list used to promote the survey. District administrators (14 percent), other school administrators (9
percent), and teachers/educators (1 percent) also responded to the survey. Other responses include a
school counsellor, secretary, and advocacy chair.
Figure 54: Respondent’s Role
0%
0%
0%
1%
1%
1%
97%
0% 20% 40% 60% 80% 100% 120%
Charter School
Magnet School
BIE or other Tribal School
Home School organization
Private School
Other, please specify
Public School
Type of Institution
74%
14%9%
2% 1%0%
10%
20%
30%
40%
50%
60%
70%
80%
Principal District administrator Other schooladministrator
Other, please specify Teacher/educator
What is Your Role at this Institution
111 | P a g e
Current Outdoor Education Offerings
Does your school typically offer an outdoor education program? (n= 167)
Of those who responded to the survey, 41 percent typically offer outdoor education for their students.
The remaining 59 percent of respondents skipped the following series of questions and were directed to
the “

112 | P a g e
Ideal Outdoor School Program” set of questions.
Figure 55: Does school typically offer an outdoor education program
When was the last time your school offered an outdoor education program? (n=63)
Most respondents (84 percent) last offered outdoor education prior to the COVID-19 pandemic. For
those attending outdoor education more recently, 2 percent went in the winter months of 2020-2021
and 14 percent went in spring 2021.
Figure 56: Last time school offered an outdoor education program
41%
59%
Does your school typically offer an outdoor education program?
Yes No
14%
2%0%0%0%
13%
27%
0%
32%
2%2%2%
6%
0%0%2%
0%
5%
10%
15%
20%
25%
30%
35%
When was the last time your school offered an outdoor education program?

113 | P a g e
Is your school's outdoor program usually overnight? (n=63)
Most respondents (78 percent) typically attend a residential (overnight) outdoor education program.
The remaining 22 percent can be assumed to attend daytime-only programs. Of those who attend a
residential program, most stay for 2 nights (58 percent); however, 3 night (20 percent) and 4 night (18
percent) programs are also popular.
Figure 57: Attendance of Residential vs. Day Programs and Typical Length
78%
22%
0%
10%
20%
30%
40%
50%
60%
70%
80%
90%
Yes No
Is your school's outdoor program usually overnight?
4%
58%
20%18%
0%
10%
20%
30%
40%
50%
60%
70%
1 2 3 4
Typical Nights at Outdoor School

114 | P a g e
What grade do students typically attend outdoor school? Please select all that apply (n=62)
Some respondents have students attend outdoor school in multiple grade levels; however, the most
common are 5th grade (63 percent) or 6th grade (42 percent).
Figure 58: What grade do students typically attend outdoor school?
How many times during a student's K-12 education would you say they can expect to attend outdoor
education? (n=63)
Most respondents have students participate in outdoor education once (56 percent). The definition of
outdoor education and outdoor school was intentionally not provided within the survey in order to
capture all activities the respondent considers to fit the category. For those indicating that students
attend outdoor education more than 3 times, most report regular activities including day trips,
involvement in the school garden, and other field experiences.
Figure 59: Number of Times Students Attend Outdoor Education
16% 18%
63%
42%
23%
0%
20%
40%
60%
80%
Before 4th grade 4th grade 5th grade 6th grade After 6th grade
What grade do students typically attend outdoor school?
2%
56%
22%
8%13%
0%
10%
20%
30%
40%
50%
60%
Never Once Twice Three times More than three times,please specify
How many times during a student's K-12 education would you say they can expect to attend outdoor education?

115 | P a g e
Which Washington county is the outdoor program located in? (n=62)
Most programs are concentrated in Western Washington, with many counties in Eastern Washington
having no representation. The greatest number of respondents reporting that they attend outdoor
school in Lewis County – likely at Cispus, an outdoor education program owned by the Association of
Washington School Principals (AWSP). Note that two respondents reported attending outdoor school
outside of Washington, one in Oregon and one in Idaho.
Figure 60: Which Washington county is the outdoor program located in?
How many students from your school attend outdoor school in a typical year? (n=56)
The following chart is primarily a reflection of school size. The greatest number of respondents (34
percent) represent schools where 51-100 students attend outdoor school annually. Many of those
reporting outdoor school attendance by more than 200 students represent school districts rather than
individual schools.
Figure 61: How many students from your school attend outdoor school in a typical year?
0%7% 7%
21%
34%
18%13%
0%
10%
20%
30%
40%
0-10 11-20 21-30 31-50 51-100 101-200 More than 200,please provide
an estimate
How many students from your school attend outdoor school in a typical year?

116 | P a g e
What percentage of eligible students choose to go to outdoor school in a typical year? (n=56)
In general, respondents have high attendance for outdoor school programs. Respondents with
attendance greater than 75 percent make up the majority (84 percent) of responses.
Figure 62: What percentage of eligible students choose to go to outdoor school in a typical year?
Who provides the outdoor school curriculum? If multiple groups collaborate, please select all who
provide curriculum. (n=56)
The most common curriculum providers are the outdoor program (59 percent) and the school (55
percent), with many respondents (23 percent) relying on a collaboration between the two groups.
Other collaborators include nonprofits, museums, and high school students.
Figure 63: Provider of Outdoor School Curriculum
2%5%
9%
84%
0%
10%
20%
30%
40%
50%
60%
70%
80%
90%
0-25% 26-50% 51-75% 76-100%
What percentage of eligible students choose to go to outdoor school in a typical year?
55%59%
9% 11%
0%
10%
20%
30%
40%
50%
60%
70%
School Outdoor program District Other, please specify
Who Provides Outdoor School Curriculum? (select all)

117 | P a g e
What subjects are typically taught during the outdoor education program? Please select all that apply
(n=55)
The most commonly taught subjects include environmental awareness (91 percent), biology/ecology (84
percent), earth science (73 percent), and social and emotional learning (51 percent). This reflects a
strong focus on science, while other subjects including art (38 percent), history (33 percent), math (25
percent), and music (13 percent) are less widely represented.
Figure 64: What subjects are typically taught during the outdoor education program
2%
13%
25%
29%
33%
38%
49%
51%
73%
84%
91%
0% 10% 20% 30% 40% 50% 60% 70% 80% 90% 100%
Other, please specify
Music
Math
English/language arts
History/social studies
Art
Health/fitness
Social and emotional learning (SEL)
Earth science
Biology/ecology
Environmental awareness
What subjects are typically taught during the outdoor education program? Please select all that apply

118 | P a g e
What non-academic experiences are provided at outdoor school? Please select all that apply (n=53)
In terms of activities, the most common are hiking/camping (85 percent), sports/games (66 percent),
and crafts (60 percent). Other activities are dependent on the type of facility, location, and staff.
Interestingly, in the previous question only 38 percent reported students learning about art, while here
the percentage participating in a program with crafts is 60 percent. This may reflect a disconnect
between what respondents consider to be academic and non-academic.
Figure 65: Availability of non-academic experiences
6%
6%
9%
9%
13%
15%
19%
28%
42%
60%
66%
85%
0% 10% 20% 30% 40% 50% 60% 70% 80% 90%
Horseback riding
Yoga
Skiing/snowshoeing/other winter activities
Biking
Rock climbing
Other, please specify
Swimming
Archery
Boating/rowing/canoeing
Crafts
Sports/games
Hiking/camping
What non-academic experiences are provided at outdoor school? Please select all that apply

119 | P a g e
When planning your outdoor education experience with your provider, how much control do you have
regarding the content and schedule? (n=56)
Respondents were asked to express their control over content and schedule on a scale of 1 (no control)
to 10 (complete control). On average, respondents had more control over content (6.8 out of 10) than
scheduling (6.0 out of 10), but in both cases the average suggest relatively high levels of control.
Do students get to choose their activities and curriculum? (n=56)
Most respondents (75 percent) report that all students have the same curriculum and participate in the
same activities. Where there is flexibility, it generally takes the form of students choosing what
activities to participate in (20 percent).
Figure 66: Do students get to choose their activities and curriculum?
2%4%
20%
75%
0%
10%
20%
30%
40%
50%
60%
70%
80%
Students choose theircurriculum, but participate in
the same activities
Yes, students choose theirown activities and
curriculum
Students choose their ownactivities, but receive the
same curriculum
No, all students receive thesame experience
Do students get to choose their activities and curriculum?

120 | P a g e
For students who choose not to attend outdoor school, what do they do while their peers are outdoor
school? (n=51)
The majority of respondents explained that students who do not go to the outdoor education program
attend school or are given at-home assignments instead.
Figure 67: Word Cloud - What students who do not participate do instead
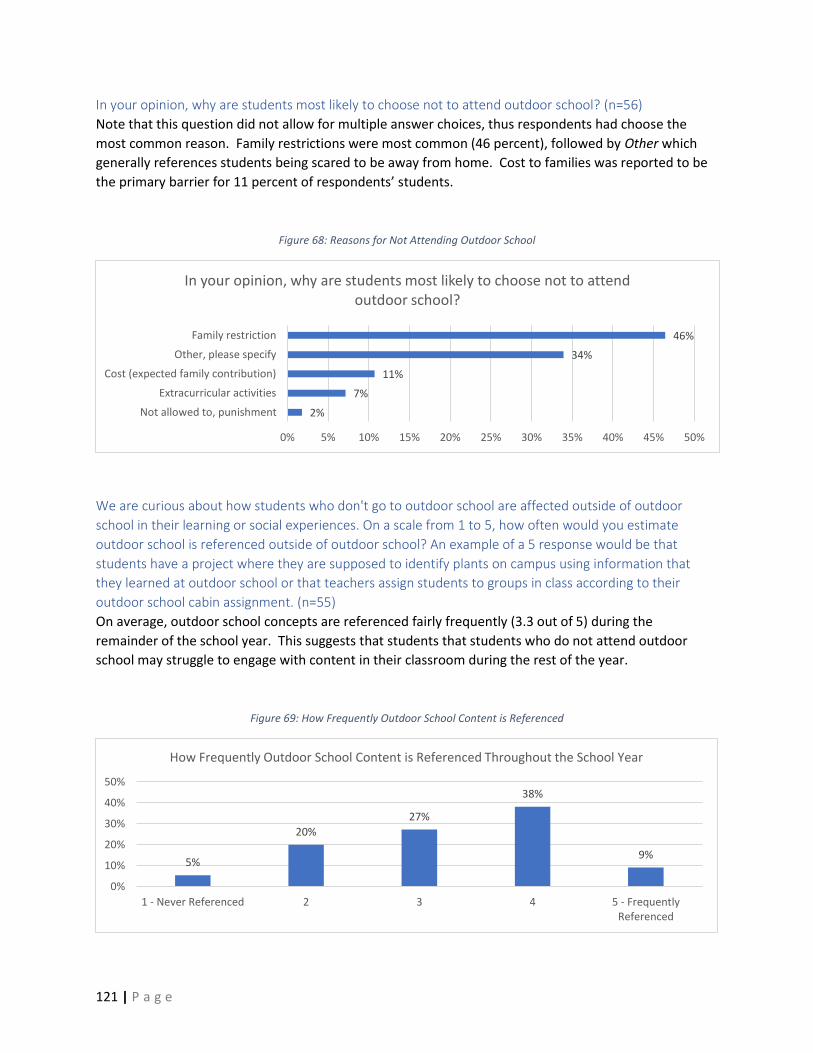
121 | P a g e
In your opinion, why are students most likely to choose not to attend outdoor school? (n=56)
Note that this question did not allow for multiple answer choices, thus respondents had choose the
most common reason. Family restrictions were most common (46 percent), followed by Other which
generally references students being scared to be away from home. Cost to families was reported to be
the primary barrier for 11 percent of respondents’ students.
Figure 68: Reasons for Not Attending Outdoor School
We are curious about how students who don't go to outdoor school are affected outside of outdoor
school in their learning or social experiences. On a scale from 1 to 5, how often would you estimate
outdoor school is referenced outside of outdoor school? An example of a 5 response would be that
students have a project where they are supposed to identify plants on campus using information that
they learned at outdoor school or that teachers assign students to groups in class according to their
outdoor school cabin assignment. (n=55)
On average, outdoor school concepts are referenced fairly frequently (3.3 out of 5) during the
remainder of the school year. This suggests that students that students who do not attend outdoor
school may struggle to engage with content in their classroom during the rest of the year.
Figure 69: How Frequently Outdoor School Content is Referenced
2%
7%
11%
34%
46%
0% 5% 10% 15% 20% 25% 30% 35% 40% 45% 50%
Not allowed to, punishment
Extracurricular activities
Cost (expected family contribution)
Other, please specify
Family restriction
In your opinion, why are students most likely to choose not to attend outdoor school?
5%
20%
27%
38%
9%
0%
10%
20%
30%
40%
50%
1 - Never Referenced 2 3 4 5 - FrequentlyReferenced
How Frequently Outdoor School Content is Referenced Throughout the School Year

122 | P a g e
Who provides outdoor school educators? Please select all that apply (n=55)
School-provided educators (64 percent) and outdoor education program-provided educators (60
percent) are both common. Overall, 29 percent of respondents indicated that both school and program
staff are involved in teaching students at outdoor school.
Figure 70: Who provides outdoor school educators?
Who provides outdoor school counsellors/chaperones? Please select all that apply (n=54)
School counsellors are the most common chaperones (76 percent), followed by parents (41 percent),
high school or college students (30 percent), and outdoor school staff (19 percent). Half of respondents
reported relying of a combination of the four categories.
Figure 71: Who provides outdoor school counsellors/chaperones?
15%
60%
64%
0% 10% 20% 30% 40% 50% 60% 70%
We collaborate with a local high school or college whoprovides educators
The outdoor program provides educators
We provide outdoor school educators
Who provides outdoor school educators? Please select all that apply
19%
30%
41%
76%
0% 10% 20% 30% 40% 50% 60% 70% 80%
The outdoor program provides counsellors/chaperones
We collaborate with a local high school or college whoprovides counsellors/chaperones
Parents act as counsellors/chaperones
We provide outdoor school counsellors/chaperones
Who provides outdoor school counsellors/chaperones? Please select all that apply

123 | P a g e
How much does the school pay in a typical year for students to attend outdoor school? (n=41)
Many programs were unsure of their costs or reported that other groups including their school district
or PTA/PTO pay for outdoor school. Estimates of total school cost were divided by the estimated
number of students attending (see earlier survey question). Total cost per student averaged $195 and
ranged from $1 to $1,600. Note that respondents define outdoor school in many ways – traditional
residential outdoor education, field trips, school gardens, student outdoor clubs, and high school
outdoor recreation classes – which helps to explain the variability in cost per student.
Table 21: Total School Costs per Student
School Cost per Student
Minimum Average Maximum
$1 $195 $1,600
Regardless of who pays, what is the total cost for transportation to and from outdoor school? For
example, even if families pay for bussing, what is the total cost of bussing? (n=37)
Given the variability in how schools approach outdoor education, per student transportation costs range
from $0 to $333. The average transportation cost per student is $46. Similar to the previous question,
many respondents were unsure of their costs.
Table 22: Transportation Cost per Student
Transportation Cost per Student
Minimum Average Maximum
$0 $46 $333
Regardless of who pays, what is the total cost to the school for educators/staff/counsellors? Please do not
include regular teacher salaries, but please do include any additional payments that teachers receive for
teaching outdoor school. (n=37)
Looking at educator/staff/counsellor costs, we find a range of $0 to $149 per student with an average of
$31. Again, costs depend on the type of program and whether teachers/staff/counsellors receive
compensation for being involved in the program.
Table 23: Educator/Staff/Counsellor Cost per Student
Educator/Staff/Counsellor Cost per Student
Minimum Average Maximum
$0 $31 $149

124 | P a g e
Regardless of who pays, what is the total cost to the school for outdoor school supplies? (n=39)
Outdoor school supply costs average $24 per student; however, we again find a large variation in costs
depending on the type of program. Many report receiving donations for students who are unable to pay
for their own supplies (i.e. sleeping bag, hiking boots, rain jacket).
Table 24: Supplies Cost per Student
Supplies Cost per Student
Minimum Average Maximum
$0 $24 $400
What funding sources does your school use to pay for outdoor school? Please select all that apply (n=138)
Among survey respondents, district funds were most commonly used for outdoor school (73 percent).
Family contributions (49 percent), school-wide fundraising (44 percent), grants (38 percent), and
class/student fundraising (33 percent) are also common. Other responses include school budgets and
private donors.
Figure 72: What funding sources does your school use to pay for outdoor school?
73%
49%
44%
38%
33%
15%
0%
10%
20%
30%
40%
50%
60%
70%
80%
District funds Families contributefor their individual
student
PTA/PTO or otherschool-wide
fundraising eventsor donation
Grants Class or student-raised funds
Other, pleasespecify
What funding sources does your school use to pay for outdoor school? Please select all that apply

125 | P a g e
In general what is the typical amount a family is expected to contribute to participate in an outdoor
education program beyond what is covered by the school, fundraising or other external sources? (We
understand that some families may receive scholarships or other funding to cover this amount on a case-
by-case basis.) (n=48)
Nearly half of respondents (48 percent) report that there are no direct costs to families for students
attending outdoor school. Other respondents reported per-student costs ranging from $10 to $300,
with 23 percent falling in the $51 to $100 range.
Figure 73: Expected Family Contribution per Student
Other than offering fundraising opportunities (if you do), does your school offer scholarships for students
to attend outdoor school who would otherwise not be able to afford it? (n= 52)
Overall, 69 percent of respondents provide scholarships to students while 31 percent do not. All but
one respondent who selected No generally have $0 per student costs, therefore there is no need for
additional scholarships.
Figure 74: Availability of scholarships
*Note: All “No” responses are from schools that offer outdoor education to all students for free
48%
13%
23%
10%
4%
2%
0% 10% 20% 30% 40% 50% 60%
$0
$1-$50
$50-$100
$100-$150
$150-$200
$300
Expected Family Contribution
69%
31%
0%
20%
40%
60%
80%
Yes No
Does your school offer scholarships for students to attend outdoor school?*

126 | P a g e
Are students expected to provide their own supplies for outdoor school? (i.e. sleeping bag, flashlight, etc.)
(n=55)
Most respondents (87 percent) require students to provide their own supplies for outdoor school. This
could pose a financial barrier for some students, thus exacerbating equity issues.
Figure 75: Are students expected to provide their own supplies
Are there items required that create barriers to students? (n=49)
For respondents who require students to bring certain supplies, 63 percent report that required items
do not create a barrier for students.
Figure 76: Are there required items required that create barriers to students?
87%
13%
0%
20%
40%
60%
80%
100%
Yes No
Are students expected to provide their own supplies for outdoor school? (i.e. sleeping bag, flashlight, etc.)
37%
63%
0%
10%
20%
30%
40%
50%
60%
70%
Yes No
Are there required items required that create barriers to students?

127 | P a g e
We are interested in knowing which required items create barriers to students. Please specify in the box
below which supplies are commonly needed. (n=17)
This question was only shown to respondents who indicated that required items can be a barrier for
students. Common items include sleeping bags, as well as shoes and clothes suitable for the outdoors.
To the best of your knowledge, what is the average cost to a teacher who provides outdoor education?
Please include any costs for transportation, supplies, and childcare that are not covered by the school.
(n=48)
Costs to teachers average $60; however, 68 percent had $0 expected cost. Many respondents were
unsure of the cost to teachers, especially for child care. Others mentioned costs that cannot be
quantified: “The greater cost to staff is their personal time away from their families and home
responsibilities.”
Think about the different barriers that you know prevent students from accessing outdoor education.
Barriers may make it more difficult for a student to participate or prevent them from participating all
together. Please use the sliders to evaluate to what extent each of these factors prevents students from
accessing outdoor school. (n=44)
On this scale, 0 = Not a Barrier and 10 = Significant Barrier. In general, most barriers were considered to
be fairly minimal. Other barriers are larger because respondents only mentioned other barriers if they
viewed them as significant. These other barriers include transportation, fund raising, and children being
uncomfortable away from home.
Figure 77: Relative Importance of barriers affecting access to outdoor education
2.5
2.6
2.6
2.9
3.1
3.2
3.4
3.5
6.5
0.0 1.0 2.0 3.0 4.0 5.0 6.0 7.0 8.0 9.0 10.0
Other accommodations (religious, dietary, etc.)
Extracurricular obligations
Costs
Access to required supplies
Accommodations for students with disabilities
Mental health/self-esteem
Family/cultural pressure
Concerns about safety
Other, please specify
Relative Importance of barriers affecting access to outdoor education

128 | P a g e
Do you collect any information or data about students' experiences, feelings, or outcomes from receiving
outdoor education? Please select all that apply (n=50)
The majority of respondents (56 percent) do not track student outcomes for those participating in
outdoor education. Among respondents who do survey students, most data is collected immediately
after the outdoor school program.
Figure 78: Collection of outcome data
2%4%
8%
30%
56%
0%
10%
20%
30%
40%
50%
60%
Yes, by surveyingseveral years after
they attend outdoorschool
Yes, by analyzingcorrelation between
outdoor education andeducation outcomes
like grades, graduationrates, suspensions, etc.
Other, please specifyYes, by surveyingimmediately after theyattend outdoor school
No
Do you collect any information or data about students' experiences, feelings, or outcomes from receiving outdoor education?

129 | P a g e
COVID-19 Impacts
Did your school offer students an outdoor education experience during the COVID-19 pandemic (March
2020-present)? (n=150)
Note that this question was shown to both respondents who typically offer outdoor education and those
who do not. In comparison to the 41 percent of respondents who typically have students attend
outdoor education, only 19 percent participated in some form of outdoor education during the
pandemic.
Figure 79: Program Changes Due to COVID-19
How did the COVID-19 pandemic affect the percentage of students that participated in outdoor
education? (n=25)
For those who did provide outdoor education during the pandemic, attendance varied. A significant
number of respondents (44 percent) had lower than usual participation; however, the remaining 56
percent had similar or greater participation.
Figure 80: COVID-19 Impacts on Participation
81%
0%
19%
0%
20%
40%
60%
80%
100%
No Yes, exactly as prior to the pandemic Yes, with some changes. Pleasespecify the changes
Did your school offer students an outdoor education experience during the COVID-19 pandemic (March 2020-present)?
44%
36%
20%
0%
10%
20%
30%
40%
50%
A smaller percentage ofstudents participated
About the same number ofstudents participated
A larger percentage ofstudents participated
How did the COVID-19 pandemic affect the percentage of students that participated in outdoor education?

130 | P a g e
What was the main concern from families about students participating in outdoor school during the
pandemic (regardless of if the student participated)? (n=22)
Primary concerns were commonly related to the COVID-19 pandemic (45 percent). Other responses
included closed facilities and less prioritization of outdoor education by parents and staff.
Figure 81: Family Concerns During the COVID-19 Pandemic
Please describe anything else you would like us to know about how the COVID-19 pandemic affected your
school's outdoor education experience (n=11)
Two respondents reported never having offered outdoor education. Other responses include:
• We were unable to offer our experience at all.
• We were effected mostly by the outside/governmental restrictions
• We want to provide an outdoor classroom and also areas that students can learn outside.
• We had to significantly reduce the number of experiences that we offered.
• We had a monthly outdoor learning program just started in the fall of 2019. It went away
during the pandemic. We are looking to bring it back this year.
• The teachers adapted their curriculum to an on site outdoor education experience. All 5th
graders participated, and in some instances teachers from other grade levels assisted. Parent
feedback was positive.
• Students asked for outdoor picnic tables so that they could eat outdoors - they were
purchased. They viewed this as a safer alternative to eating inside.
• It was cancelled for two years.
• Bus riding was a challenge with social distancing.
5%
5%
5%
41%
45%
0% 5% 10% 15% 20% 25% 30% 35% 40% 45% 50%
Costs
Concerns about safety
Family/cultural pressure
Other, please specify
COVID-19 pandemic
Family Concerns

131 | P a g e
Ideal Outdoor School Program In this section, we compare respondents’ ideal outdoor school attributes (Ideal) to those reported
earlier by respondents who typically offer outdoor education (Typical). Ideal program responses come
from schools with and without a history of offering outdoor education to students.
What grade level(s) would you want to attend outdoor school? Please select all that apply (n=124)
In an ideal world, respondents would like to see more outdoor education across all grade levels than is
typical (among schools that offer some outdoor education). The one exception is for 5th grade, where 62
percent of all respondents would like to see students participate in outdoor education and 63 percent of
respondents who typically offer outdoor education have 5th grade students attend. Overall, this suggests
that many schools would like to see outdoor education – both day programs (on and off campus) and
residential programs – incorporated multiple times throughout a students K-12 education.
Figure 82: Ideal Outdoor Education Grade Level
24%
35%
62% 63%
40%
16%18%
63%
42%
23%
0%
10%
20%
30%
40%
50%
60%
70%
Before 4th grade 4th grade 5th grade 6th grade After 6th grade
What grade level(s) would you want to attend outdoor school?
Ideal Typical
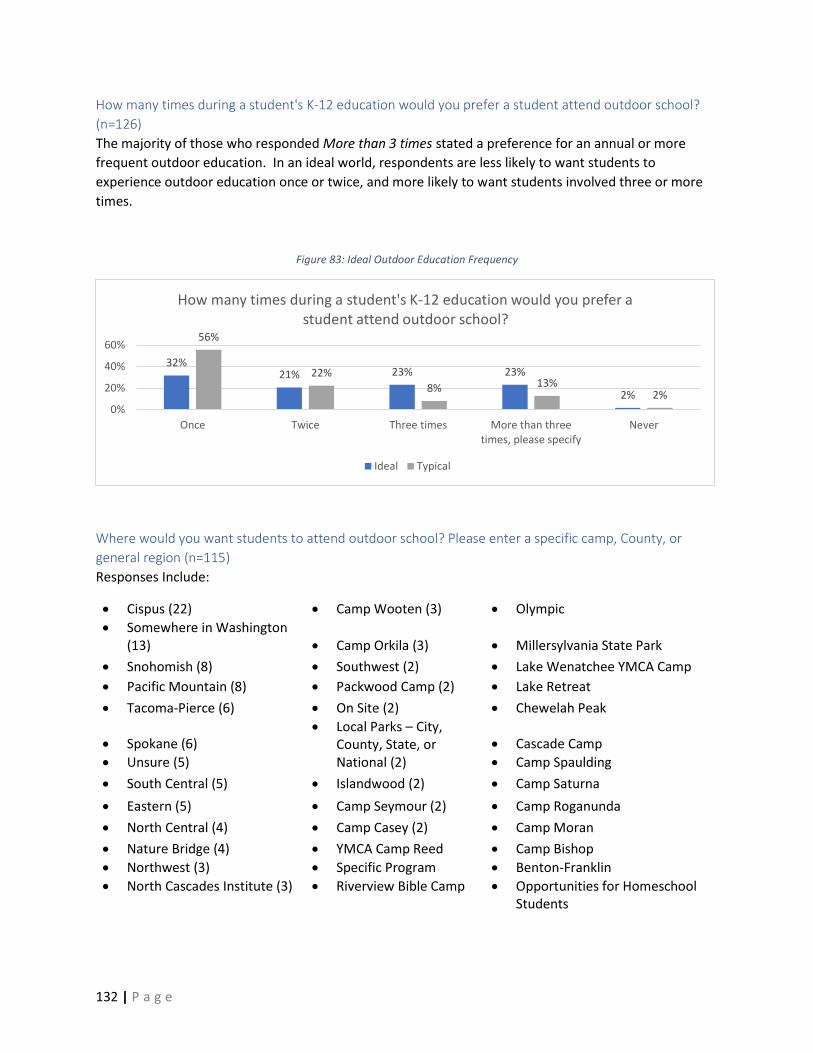
132 | P a g e
How many times during a student's K-12 education would you prefer a student attend outdoor school?
(n=126)
The majority of those who responded More than 3 times stated a preference for an annual or more
frequent outdoor education. In an ideal world, respondents are less likely to want students to
experience outdoor education once or twice, and more likely to want students involved three or more
times.
Figure 83: Ideal Outdoor Education Frequency
Where would you want students to attend outdoor school? Please enter a specific camp, County, or
general region (n=115)
Responses Include:
• Cispus (22) • Camp Wooten (3) • Olympic
• Somewhere in Washington (13) • Camp Orkila (3) • Millersylvania State Park
• Snohomish (8) • Southwest (2) • Lake Wenatchee YMCA Camp
• Pacific Mountain (8) • Packwood Camp (2) • Lake Retreat
• Tacoma-Pierce (6) • On Site (2) • Chewelah Peak
• Spokane (6)
• Unsure (5)
• Local Parks – City, County, State, or National (2)
• Cascade Camp
• Camp Spaulding
• South Central (5) • Islandwood (2) • Camp Saturna
• Eastern (5) • Camp Seymour (2) • Camp Roganunda
• North Central (4) • Camp Casey (2) • Camp Moran
• Nature Bridge (4) • YMCA Camp Reed • Camp Bishop
• Northwest (3)
• North Cascades Institute (3)
• Specific Program
• Riverview Bible Camp
• Benton-Franklin
• Opportunities for Homeschool Students
32%21% 23% 23%
2%
56%
22%
8% 13%2%
0%
20%
40%
60%
Once Twice Three times More than threetimes, please specify
Never
How many times during a student's K-12 education would you prefer a student attend outdoor school?
Ideal Typical

133 | P a g e
What time of year would you want students to attend outdoor school? (n=124)
The most popular times for outdoor education are Spring (59 percent) and Fall (34 percent). This is
likely a reflection of two factors: weather and the academic year.
Figure 84: Preferred season for outdoor school
How many nights would you prefer students attend outdoor school? (n= 123)
Compared to the typical offerings of respondents who attend outdoor school, the ideal program is more
likely to be 1 night, 3 nights, or 4 nights. The ideal program is less likely to be 2 nights. Approximately
21 percent of respondents prefer a non-residential program.
Figure 85: Preferred number of nights
34%
1%
59%
6%
What time of year would you want students to attend outdoor school?
Fall
Winter
Spring
Summer
21%
7%
36%
19% 17%
1%
22%
3%
45%
16% 14%
0%0%
10%20%30%40%50%
0, studentswouldn't stay
overnight
1 2 3 4 (full week) More than a fullweek
How many nights would you prefer students attend outdoor school?
Ideal Typical

134 | P a g e
What percentage of eligible students do you think would attend outdoor school if there were no cost
barriers? Keep in mind that there may still be other barriers. (n=113)
The majority (68 percent) of respondents expect over 90 percent of students to participate in outdoor
school if it was offered. A total of 92 percent of respondents expect attendance of 70 percent or more.
Figure 86: Anticipated Participation Rate
Who would you want to provide outdoor education curriculum? Please select all that apply. (n=123)
In comparison to the typical distribution of curriculum duties reported earlier in the survey, respondents
are far more likely to prefer that their outdoor school program (79 percent vs. 59 percent) or school
district (26 percent vs. 9 percent) provides curriculum. Respondents are less likely to want curriculum
responsibilities to fall on schools, compared to what is typical (44 percent vs. 55 percent). Other
collaborators include: universities/university students, educational service districts (ESDs), OSPI,
community organizations, and tribes.
Figure 87: Ideal Curriculum Provider
49%
19%
7%12%
5%2% 0% 2% 0% 2% 0% 0% 0% 0% 0% 2% 0% 0% 2% 0%
0%
10%
20%
30%
40%
50%
60%
Anticipated Participation Rate
44%
79%
26%9%
55% 59%
9% 11%
0%
50%
100%
Schools Outdoor school provider District Other, please specify
Who would you want to provide outdoor education curriculum? Please select all that apply.
Ideal Typical

135 | P a g e
What subject(s) would you want to be the focus of the outdoor education program? Please select all that
apply (n=123)
In general, respondents are more likely to want to see each subject incorporated into outdoor education
than is typical. The largest gap between ideal and typical offerings is for social and emotional learning
(SEL). A total of 84 percent of respondents want SEL to be a focus in outdoor education, while only 51
percent of respondents who attend outdoor education report that SEL is a focus of the program.
Figure 88: Preferred academic subjects
2%
29%
13%
25%
33%
38%
49%
73%
51%
84%
#N/A
91%
3%
34%
39%
41%
46%
62%
63%
84%
84%
85%
89%
96%
0% 20% 40% 60% 80% 100% 120%
Other, please specify
English/language arts
Music
Math
History/social studies
Art
Health/fitness
Earth sciences
Social and emotional learning (SEL)
Biology/ecology
Teamwork/leadership (i.e. ropes course)
Environmental awareness
What subject(s) would you want to be the focus of the outdoor education program? Please select all that apply
Ideal Typical

136 | P a g e
Which non-academic experiences would you want to be provided at outdoor school? Please select all that
apply (n=124)
Similar to academics, respondents want to see a greater variety of non-academic experiences than was
reported by schools who typically attend outdoor education.
Figure 89: Preferred non-academic experiences
15%
9%
6%
9%
6%
13%
19%
28%
42%
60%
66%
#N/A
85%
6%
23%
25%
33%
37%
40%
43%
52%
57%
72%
73%
81%
93%
0% 10% 20% 30% 40% 50% 60% 70% 80% 90% 100%
Other, please specify
Skiing/snowshoeing/other winter activities
Horseback riding
Biking
Yoga
Rock climbing
Swimming
Archery
Boating/rowing/canoeing
Crafts
Sports/games
Ropes course
Hiking/camping
Which non-academic experiences would you want to be provided at outdoor school? Please select all that apply
Ideal Typical
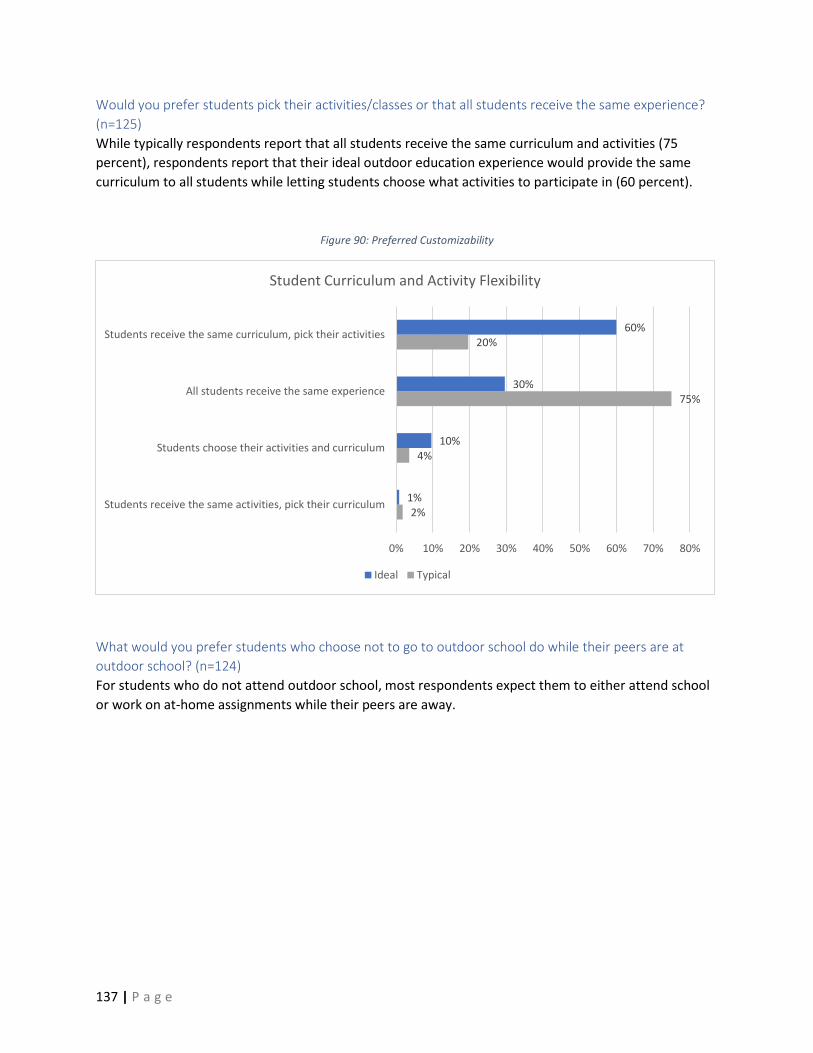
137 | P a g e
Would you prefer students pick their activities/classes or that all students receive the same experience?
(n=125)
While typically respondents report that all students receive the same curriculum and activities (75
percent), respondents report that their ideal outdoor education experience would provide the same
curriculum to all students while letting students choose what activities to participate in (60 percent).
Figure 90: Preferred Customizability
What would you prefer students who choose not to go to outdoor school do while their peers are at
outdoor school? (n=124)
For students who do not attend outdoor school, most respondents expect them to either attend school
or work on at-home assignments while their peers are away.
2%
4%
75%
20%
1%
10%
30%
60%
0% 10% 20% 30% 40% 50% 60% 70% 80%
Students receive the same activities, pick their curriculum
Students choose their activities and curriculum
All students receive the same experience
Students receive the same curriculum, pick their activities
Student Curriculum and Activity Flexibility
Ideal Typical

138 | P a g e
Who would you want to act as educators at outdoor school? (n=124)
The majority of respondents (60 percent) would like schools and outdoor education program staff to
share teaching duties. Approximately ¼ of respondents (26 percent) would like outdoor school staff to
be fully responsible for teaching and 12 percent would like schools to be fully responsible for teaching in
an outdoor school setting.
Figure 91: Who would you want to act as educators at outdoor school?
Who would you want to act as camp counsellors? (n=125)
Between school staff (26 percent), outdoor education program staff (24 percent), college students (19
percent), and high school students (18 percent), there is no clear preference for who should act as
chaperones/camp counsellors. Other responses generally reference a combination of the available
options. Note that parents are only the preferred option for 4 percent of respondents.
Figure 92: Who would you want to act as camp counsellors?
60%
26%
12%
2%
0%
10%
20%
30%
40%
50%
60%
70%
Collaboration of both Outdoor program-providededucators
School-provided educators Other, please specify
Who would you want to act as educators at outdoor school?
4%
10%
18%
19%
24%
26%
0% 5% 10% 15% 20% 25% 30%
Parents
Other, please specify
High school students
College or university students
Outdoor program-provided counsellors
School staff/faculty
Who would you want to act as camp counsellors?
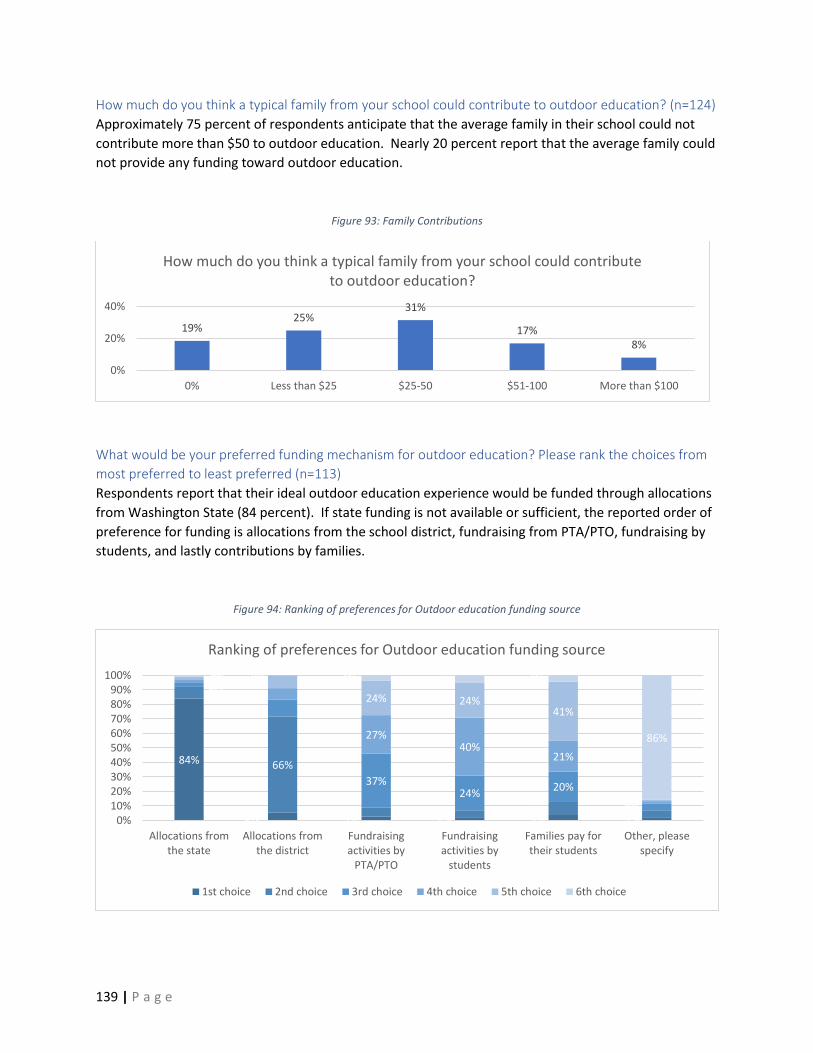
139 | P a g e
How much do you think a typical family from your school could contribute to outdoor education? (n=124)
Approximately 75 percent of respondents anticipate that the average family in their school could not
contribute more than $50 to outdoor education. Nearly 20 percent report that the average family could
not provide any funding toward outdoor education.
Figure 93: Family Contributions
What would be your preferred funding mechanism for outdoor education? Please rank the choices from
most preferred to least preferred (n=113)
Respondents report that their ideal outdoor education experience would be funded through allocations
from Washington State (84 percent). If state funding is not available or sufficient, the reported order of
preference for funding is allocations from the school district, fundraising from PTA/PTO, fundraising by
students, and lastly contributions by families.
Figure 94: Ranking of preferences for Outdoor education funding source
19%25%
31%
17%8%
0%
20%
40%
0% Less than $25 $25-50 $51-100 More than $100
How much do you think a typical family from your school could contribute to outdoor education?
84%
5% 3% 2% 4% 2%
8%
66%
6% 5% 9% 5%
3%
12%
37%24%
20%
4%
3%8%
27%40%
21%
2%
2% 9%
24% 24%41%
1%
1% 0% 4% 5% 4%
86%
0%10%20%30%40%50%60%70%80%90%
100%
Allocations fromthe state
Allocations fromthe district
Fundraisingactivities by
PTA/PTO
Fundraisingactivities by
students
Families pay fortheir students
Other, pleasespecify
Ranking of preferences for Outdoor education funding source
1st choice 2nd choice 3rd choice 4th choice 5th choice 6th choice

140 | P a g e
What do you think would be the best way to ensure students have equitable access to outdoor school?
Please pick 3 (n=124)
Respondents identify eliminating financial barriers (89 percent) as the best way to ensure equitable
access to outdoor education. Other best practices for ensuring equitable access include providing
information to parents on outdoor school benefits (44 percent), providing students with supplies (41
percent), and increasing accessibility for students with disabilities (40 percent).
Figure 95: Ways to ensure equitable access to outdoor school programs
2%
4%
5%
8%
11%
21%
27%
30%
40%
41%
44%
89%
0% 10% 20% 30% 40% 50% 60% 70% 80% 90% 100%
Outdoor education further from the school
Other, please specify
More academic opportunities
More non-academic opportunities
Higher standards for safety
Collaboration with community to avoid extracurricular conflicts
Outdoor education closer to the school
Flexibility of programs (choice of activities, number of days, etc.)
Increase accessibility for students with disabilities
Provide supplies required for outdoor school (sleeping bags,hiking boots, etc.)
More information for families about the benefits of outdoorschool
Funding so that families don't have to pay
What do you think would be the best way to ensure students have equitable access to outdoor school? Please pick 3.

141 | P a g e
What else would you like us to know about increasing accessibility and equity for outdoor education
programs? (n=38)
Responses are as follows:
• Minimize any safety concerns • How can we support this?
• Many of the students at my school have never had an experience being in nature. They benefit from the time learning in this environment, the relationships they build with others, and the self-confidence they gain from being away from home for 4 days and 3 three nights.
• Our outdoor experience is completely home grown and is not connected with a Outdoor School Facility. We believe that allows our teachers and staff to specifically tailor the experience with the academic standards being taught in the classroom through field work and adventure.
• Losing Chewelah Peak as a venue and the personnel attached to that program has been horrible. Our students have been negatively impacted by that loss.
• I believe outdoor experiences every year (but especially transition years-6th and 9th) would dramatically alter the school experience both students and staff in a positive way.
• Let's move beyond "Outdoor Education" to "Education Outdoors." At Alternative high schools like ours, the issue is not WHAT to teach but the venue in which to teach it differently. We need access to facilities that are not dominated by "the haves," as [redacted] is with ASL and student leadership groups. We need places we can book, that provide activities, and that will be open to our agenda.
• For me, I would want to just get the students to the outdoor school and have the curriculum, activities, etc all ready for us. We are so busy with the day to day activities that we don't have time to help set up the curriculum for outdoor school. I'm SOOO excited about this idea but the thought of creating the curriculum and activities is overwhelming.
• It would be great if it could tie into our science curriculum, thereby meeting some of the standards that would be "missed" during those days away from the school building.
• If it is considered an essential academic experience as part of a fully funded public education, we should not be charging extra for families to have their students attend.
• In elementary school, grade level will dictate what type of experience is appropriate. Overnight trips would not be appropriate for our youngest students but our older students could go for up to three days.
• Families who do not speak English or who have never let their child sleep over in another location will need a lot of prepared information and assurance to feel comfortable. Videos? Q&A? Forum to ask questions directly? Etc.
• I want to learn about the potential of funding to "catch up" the two grade bands that missed out on this opportunity as 6th graders
• Funding to help pay for outdoor-educators, rather than depending on teachers to do more/extra work to provide the outdoor school.
• I think it's unfortunate that the bigger districts won't access this because of red tape.
• have Muslim representation in communication materials
• Each region of Washington has outdoor activities that are popular, whether it be fishing, shooting, hunting, river rafting, sailing, camping, hiking, ATV use, etc. Each opportunity should be celebrated and supported by the tax dollars collected by our government.
• Not all outdoor programs are equal. [redacted] has a fully functional facility and experience, on the other hand, [redacted] is unsafe, unkept, and the Camp employees are less knowledgeable (as an example).

142 | P a g e
• collaborate with the state ESD to develop standards based credit opportunities for high school students that are interdisciplinary. Provide extended opportunities for students to earn pathway credits toward graduation in a standards based model. Provide opportunities to attend that don't conflict with traditional school schedules (ex: over winter or spring break, during the summer, one weekend a month)
• Providing all camp information, registration, fundraising, communication in a families native language with ample opportunity to "preview" camp (videos, pictures, virtual camp walk throughs) so families understand this experience. Our families from Central America have shared it is not "culturally expected" for their children to stay away from home. Maybe day camp is an option instead of an all or none expectation.
• Are there programs available for elementary students at this time? If so, what is the cost to families? Is transportation available?
• We have accessed Chewelah Peak with 4th and 8th graders in the past. It is now closed. This limits our opportunities.
• Are there diverse districts that are still making this happen? I would like to learn from them.
• Our students, staff and parents love the outdoor education experience.
• We live in a region with many outdoor opportunities. Our students need access to structured outdoor activities so that they continue to choose healthy outdoor options for recreation.
• We believe that the outdoor education piece is essential for growth, both emotional and educational. We have seen camp change students lives on so many levels. It is something that has benefitted many of our students.
• We are a small community with no PTA/PTO and a high poverty so fundraising by students is extremely difficult as well.
• Viable options for students who choose not to participate if the program is during the school year.
• This is why I would want it to be available to all students. Students who already attend a camp don't need it as much as the students who do not have other opportunities to attend.
• These programs are incredibly important for the development of our students and for equity of opportunity for all, should be fully funded by the state and/or district.
• This is a great idea if we can keep it local. We have issues with enough bus drivers.
• Our summer program ran an outdoor program this year. (Skagit Safari)
• This experience is powerful for students • Provide language supports for English learners
• The biggest barrier currently is funding. We are piloting a program at Cascade Camp that we hope to be able to grow.
• Promoting the benefits of outdoor education and how it provides a more well-rounded learning opportunity for students.
• Our school is over 50% Native American. A strong emphasis on Native American ways of experiencing the outdoors would be a benefit.
• Clear goals for the time

143 | P a g e
Appendix E – K-12 School and District Discussion Groups
Participant Background Let’s start with introductions. Can you tell us your name and a bit about where you work?
In total, there were 8 participants who attended a discussion group. While the sample is small, the
participants represent a variety of perspectives and geographies – at least one person from every major
area of the state participated. The groups included superintendents, principals, and teachers who could
speak to the outdoor education opportunities happening at their school or in their district. Some
participants came from districts with established outdoor education traditions, while others were
interested in starting an outdoor education tradition.
The timing of this research was a barrier to further engagement. We solicited feedback from late August
to mid-September – the busiest time of year for school staff. More than 50% of those agreeing to speak
with us were unable to follow-through on the commitment due to emerging issues at their school.
Before the pandemic, what types of outdoor education opportunities were you providing to students,
if any? At what grade levels? Where?
Prior to the pandemic, those with outdoor education traditions tend to involve multiple grade levels.
For younger students, day trips were common – hikes, visits to hatcheries, and other outdoor activities.
For older students, multi-day residential outdoor education is more common. One high school offers
outdoor recreation classes for students.
The pandemic was obviously a big disruption for schools. What do you think students lost out on by
not having outdoor education this year?
Schools with outdoor education traditions view them as a “rite of passage” that students missed during
the pandemic. Many participants also note the mental health impacts of remote school and less time
outdoors. From the perspective of teachers, outdoor education provides a chance to “get to see kids
shine who don’t usually get to shine.” Many children who struggle in the classroom will “blow
[teachers] away” in an outdoor education setting.
Post-pandemic, are you expecting any changes to how you approach outdoor education for your
students?
Participants agreed that, if anything, the pandemic will lead to more outdoor education and activities in
schools because they realize it is safer than being indoors. Many reported that their lunch period is now
outside, and many teachers are choosing to hold their classes outdoors. Some schools are considering
building gardens or greenhouses on campus to facilitate more outdoor education. In terms of
traditional residential outdoor education, participants see this as a way to get students excited about
returning to school and learning.

144 | P a g e
Outdoor Education Program Attributes When you hear the term outdoor education, I am interested in what comes to mind in terms of
activities, academics, location, and duration. Let’s take each one separately with some quick
responses:
Activities
Commonly mentioned activities include outdoor recreation (i.e. hiking, rock climbing, survival skills,
kayaking) and games or crafts that involve creativity and are geared toward social and emotional
learning (SEL).
Academics
In terms of academics, science was the most mentioned academic subject. The specific discipline –
biology, marine science, geology – varied depending on the resources available. While there was a focus
on science, discussion participants are looking for interdisciplinary learning that incorporates multiple
subjects as well as social and emotional learning (SEL). Another aspect of academics that participants
valued was place-based learning, which could include the local environment, local history, indigenous
history and culture, and regional industry topics (i.e. agriculture, logging, fishing).
Location
Participants generally agreed that outdoor education can happen in a variety of settings – local parks
(city, state, or national), tribal land, and traditional outdoor school facilities. Most participants are
looking for something close to home, but away from major cities.
Duration (max/min)
Answers range from a class period to a multi-day program, and even year-round outdoor education.
Ultimately, the consensus was that any time outdoors is beneficial to students, but longer experiences
and more frequent experiences are better.
Time to bring out my magic wand… If you could design your ideal outdoor education program for your
students, what would it be? Again, let’s break this apart into smaller questions.
What age or grade level would you want to participate?
Most participants would like to see more outdoor education built into every grade, with the duration,
location, and lessons varying based on student age. In terms of residential outdoor education, 5th or 6th
grade was the consensus. Participants note that at this age students are transitioning to middle school,
are comfortable being away from home, and have relatively few extracurricular activities that would
prevent them from being out of town for a few days. Some participants would like to see more
involvement of high school students as chaperones or mentors at outdoor school.

145 | P a g e
Is there a time of year that would be ideal or off limits?
The biggest factors limiting scheduling are school schedules – holidays, testing, semester start/end dates
– and weather. Participants focused in on two seasons for outdoor education: fall and spring. They
reported that fall is ideal for relationship building and setting the tone for the rest of the year. Spring,
on the other hand, gives students the opportunity to circle back to what they learned that year, solidify
existing relationships, and celebrate the end of the year.
Would you prefer a residential/overnight experience or a multi-day only program?
Participants prefer residential programs but acknowledge that day programs may be better suited to
other age groups or specific situations where there are barriers keeping students from attending a
residential program. Depending on the school, preferences for residential program length range from 2
to 4 nights. For day programs, most participants would prefer to scatter multiple days throughout the
school year rather than having them be consecutive.
What about the role of outdoor education staff vs. school staff or volunteers?
In general, discussion participants are looking for an outdoor education program with staff who teach
lessons and facilitate activities; however, some schools have a tradition of having their teachers lead
lessons. In terms of school staff and volunteers, most participants agree that they will be responsible for
some behavior management and act as chaperones.
What are you looking for in terms of curriculum?
Many participants are looking for curriculum that ties back to what students are learning in the
classroom and state learning standards. Some are looking to be able to customize curriculum (i.e. the
program has multiple lesson plans to choose from) and others are looking for more of a focus social and
emotional learning (SEL).
Unfortunately, I don’t have a magic wand… Which brings us to barriers:
What are the biggest barriers or factors you have to consider when deciding whether or not to offer
outdoor education to your students?
Common barriers included cost, risk management/liability, and teachers or parents who do not see the
value in outdoor education. As one participant notes, “money isn’t an issue, it’s priorities.” In other
words, schools have money, but they prioritize other funding needs over outdoor education. If outdoor
education is a priority for schools and families, and there is funding dedicated to outdoor education,
many of these barriers can be reduced.

146 | P a g e
What about for your students? What gets in the way of them attending an outdoor education program?
(prompt: money, supplies/equipment, family patterns)
Participants generally see cost, family, and historic inequity as factors keeping students out of outdoor
education. By removing any financial barrier and making outdoor school available to all, more students
will be able to participate and there will be fewer equity issues.
Expansion Planning If Washington State were to provide funding so that all 5th and/or 6th graders in the state could go to a
multi-day outdoor education program, do you think there is enough capacity among existing providers
to meet that need? (Prompt: Do you know where you would go? How would you find a program if
needed?)
Responses were mixed, with some respondents knowing of vacancies at residential facilities (with or
without dedicated outdoor education staff) and others not knowing of enough capacity to support all
5th/6th grade students. Outside of the outdoor education programs participants are familiar with, they
were unsure where to look for additional options and would welcome some type of matching tool.
What partners and organizations within WA are best suited to helping the state turn an outdoor
education expansion plan into action?
Common partners include tribes, the Association of Washington School Principals (AWSP), the
Washington Association of School Administrators (WASA), and students.
Equity and Accessibility I want to next talk about equity and accessibility – two different things but connected. When you
think about outdoor education programs and your own students body, what do you notice in terms of
equity and accessibility?
In terms of equity, many participants noted that removing financial barriers is necessary to ensure
students from all backgrounds have the opportunity to attend outdoor education. If they ask for family
contributions or fund raising, all participants explained that they provide scholarships and gear to
students who are facing a financial barrier. One participant noted that outdoor education can
counteract historical inequity if all children are given the opportunity to participate in outdoor
recreation – an activity historically associated with upper middle class, White households. Participants
have found that accessibility can be a barrier for some students with disabilities; however, they have
generally found ways to include all students for at least part of the outdoor education experience.
How do you see accessibility being better supported in the Washington outdoor education landscape?
Most participants agree that it is important to focus on what students can do, rather than what they
cannot do. For students with disabilities, participants would generally rely on school staff for advice on
how to best support students during outdoor school.

147 | P a g e
Benefits of Outdoor Education When you think about outdoor education programs, who benefits? What are those benefits?
Students
Benefits include improved equity, connectedness with people and the natural world, interdisciplinary
learning, physical and mental health improvement, social and emotional learning (SEL), and greater
academic engagement.
Staff
Participants have seen outdoor education benefit teachers by providing them with a chance to connect
with students and see them in a different setting. These relationships and insights can then be built
upon through the remainder of the school year.
Local Community
Participants reflect that outdoor education teaches the next generation about the importance of natural
systems and how they benefit the local community and its industries.
Related Documents