WASHINGTON STATE BOARD FOR COMMUNITY AND TECHNICAL COLLEGES STUDENT LISTENING WEB STUDENT LISTENING WEB SURVEY SURVEY

WASHINGTON STATE BOARD FOR COMMUNITY AND TECHNICAL COLLEGES STUDENT LISTENING WEB SURVEY.
Dec 14, 2015
Welcome message from author
This document is posted to help you gain knowledge. Please leave a comment to let me know what you think about it! Share it to your friends and learn new things together.
Transcript

WASHINGTON STATEBOARD FOR COMMUNITY AND
TECHNICAL COLLEGES
STUDENT LISTENING WEB SURVEYSTUDENT LISTENING WEB SURVEY

Project Objective
For the purpose of better understanding students’ satisfaction with Washington State’s community
and technical colleges
and
To establish a benchmark for student opinions of and experiences with the community and
technical colleges of Washington State

I. Student Satisfaction
II. Attendance and Ambition
III.College Choice
IV.Tuition and Financial Aid
V. Technology
VI.Campus Climate
Areas of Investigation

Methodology
•Web Survey
•Live between October 23 and December 17, 2007
•Survey sample provided by the State Board for Community and Technical Colleges
•209,723 total contacts; 186,415 email invitations and 23,308 postcards
•3,419 completed interviews; +/- 1.67% margin of error
•Ten geographic regions
•Statewide quotas established by gender, age, and ethnicity

Geographic Distribution
Region Community & Technical Colleges/DistrictsStudent
PopulationSample Size
Margin of Error
Region 1 Seattle 54,049 449 4.61
Region 2 Cascadia, Edmonds, Shoreline 35,378 341 5.28
Region 3 Bellevue, Lake Washington 41,636 401 4.87
Region 4 Green River, Highline, Renton 56,488 401 4.87
Region 5 Bellingham, Everett, Skagit Valley, Whatcom 49,110 377 5.03
Region 6 Pierce, Tacoma, Bates, Clover Park 74,587 430 4.71
Region 7Grays Harbor, Olympic, Peninsula, South Puget Sound
43,508 284 5.80
Region 8 Centralia, Clark, Lower Columbia 40,672 251 6.17
Region 9Big Bend, Columbia Basin, Walla Walla, Wenatchee Valley, Yakima Valley
45,139 219 6.60
Region 10 Spokane 39,746 266 5.99

Participant ProfileStudent Characteristics
Survey Respondents(N=3419)
All WA State Comm. & Tech. College Students
Currently EnrolledSuccessful CompletersOther Former Attendees
59%24%17%
~~
Enrollment StatusFull-Time (> 12 credits)Part-Time/Not for Credit (<12 credits)
46%54%
37%63%
Educational GoalsAcademic TransferAssociates DegreeJob Skills TrainingBasic Skills
Goal47%19%17%2%
Enrollment65%
~21%13%
40%~
46%12%
GenderMaleFemale
39%61%
42%58%
AgeUnder 2020-2425-2930-3435 and older
15%27%17%12%29%
20%26%14%10%30%
EthnicityWhite/CaucasianPeople of Color
75%25%
67%33%
Students with Disabilities 6%* 4.5%
*Use services for students with disabilities sometimes/often

Student SatisfactionStudent Satisfaction

Q9. Please rate your overall experience with (college currently attending/most recently attended) using a scale of 1 to 10, with 1 being Poor and 10 being Excellent.
Total
(N=3419)
Currently Enrolled and Successful Completers(n=2827)
Others not attending(n=592)
(10) Excellent 19% 20% 18%
(7-9) Good 67% 68% 62%
(5-6) Neutral 10% 9% 12%
(1-4) Fair/Poor 3% 3% 8%
Average experience 8.03 8.11 7.65
Overall Satisfaction
•According to the most recent Community College Survey of Student Engagement data, 30% of students nation-wide consider their entire educational experience Excellent, 56% consider it Good, 14% say Fair or Poor.
•Consistent experiences statewide; few significant differences exist between regions.
•“Engaged students”, those attending full-time and utilizing student services are significantly more satisfied than others.

Q27. Using a scale of 1 to 10, how likely are you to recommend (college currently attending/most recently attended) to an associate, family member, friend or other acquaintance?
(N=3419)
Promoter (9-10) 54%
Neutral (7-8) 33%
Detractor (1-6) 13%
(10) Very Likely 39%
(7-9) Likely 48%
(5-6) Neutral 7%
(2-4) Unlikely 4%
(1) Not at all Likely 2%
Average confidence 8.27
Net Promoter *
•According to the most recent Community College Survey of Student Engagement data, 94% of students nation-wide say they would recommend their college to a friend or family member.
•Loyalty is consistent statewide; few significant differences exist between regions.
•Age and ethnicity appear to drive loyalty.
•“Engaged students”, those attending full-time and utilizing student support services, are stronger advocates.
* The Net Promoter Score is a management tool developed by Fred Reichheld to gauge the loyalty of customer relations. While many companies have adopted the method, it has not been unanimously hailed as the single most reliable indicator. However, it can serve as a strong indicator of student loyalty. The Net Promoter moves the focus away from short-term impact and toward the long-term value of student relationships.

Attendance and AmbitionsAttendance and Ambitions

Q1. Did you begin college at (college currently attending/most recently attended)?
Currently Enrolled
(n=2024)
Successful Completers
(n=803)
Former Attendees(n=1395)
Yes 61% 47% 44%
No 39% 53% 56%
•“Engaged students” are most likely to have begun their education at community/technical college. Those students who are under 25 years old, attending full-time, with academic ambitions. They are reliant upon student support services, financial aid, and are involved in extracurricular activities.
•Regionally, Seattle and Eastside residents are least likely to have started their education at their community/technical college.

Q3. What was the primary reason you had to take a break from attending (college currently attending/most recently attended)?
Currently Enrolled(n=463)
Successful Completers
(n=803)
Others Formerly Enrolled(n=592)
Transfer to 4-year college or university 5% 54%
Completed the degree/certificate program
5% 46%
Working/change in employment 22% 30%
Lack of finances 17% 19%
Change in family status 12% 8%
I wasn’t ready for school 11% 4%
Healthcare concerns 9% 5%
Caring for dependents 7% 6%
One time class/personal enrichment 2% 7%
Dissatisfied with the experience 2% 6%
Q2. Have you ever had to take a break from attending (college currently attending)?
(n=1240)
Yes 37%
No 63%
•Women and students between the ages of 25 and 34 are significantly more likely than their peers to have to take a break from attending.
•The “engaged student” is significantly less likely to have taken a break in their studies
•Full-time, academic transfer students are among the least likely to have to take a break in their studies.
•Also unlikely to have to interrupt their studies are financially dependent students.
•Most students not currently enrolled have successfully met their educational goals.
•Those currently enrolled who have had to take a break have most likely done so because of a change in circumstance.
•Regionally, reasons for taking a break differ slightly.
•Reasons for taking a break from attending college appear to differ by age and ethnicity.
•Among current students, those who personally contribute to the cost of their education in combination with financial assistance are most affected by a lack of finances.

Q5. What influenced your decision to return to college at (college currently attending)?
(n=1174)
Career change/update job skills/job related training 18%
Specific program/field of study (non-nursing) 15%
Location/Proximity to home 15%
To finish/complete my degree 9%
Change in life circumstances 9%
Cost/affordability/financial aid/tuition assistance 8%
Quality of instruction/teachers/reputation of the school or program 7%
To transfer to a 4-year college or university 6%
Nursing program 6%
To obtain a degree 5%
•Regionally, students are motivated to return to college for different reasons:
•Seattle, North King, and Eastside students are most often influenced by a specific program and more often influenced by the quality of instruction and reputation of the school than others statewide
•South King County students are most often influenced by location
•NW Washington students are most likely to return to school to update job skills
•Spokane students are significantly more influence by cost and the availability of tuition assistance than others and least influenced by location
•Students ages 25 and older are most influenced by a change in career and ambitions towards a specific field of study, significantly more so than their younger counterparts.
•Students aspiring towards academic transfer are most likely to shop for location, affordability, and quality of instruction or reputation of the school/program, while degree-track and job skills students are looking for the availability of a specific program.

Q25. Are you concerned that any of the following changes in circumstance might affect your ability to achieve your primary educational goal at (college currently attending/most recently attended)?
(n=2024)CCSSE
Somewhat/Likely/Very Likely
None/I do not anticipate having to take a break 49% ~
Lack of finances 35% 67%
Working/change in employment 23% 59%
Caring for dependents 8% 51%
Feeling unsupported 8% ~
Change in family status 8% ~
Healthcare concerns 7% ~
Access to adequate transportation 6% ~
Under-prepared academically 5% 42%
•Significantly, students between the ages of 25 and 34 are more concerned about an interruption in their studies than other students; these students are most concerned about a potential lack of finances, a change of employment, and caring for dependents.
•Students who have taken a break before are significantly more likely to have concerns about their ability to meet their educational goals.
•55% of academic transfer students are concerned about an interruption in their studies; they are most concerned by finances.
•53% of service dependent students are concerned with circumstances affecting their educational ambitions, compared to only 39% of independent students; students who utilize support services are significantly more concerned with finances

College ChoiceCollege Choice

Q13. What one reason most influenced your decision to go to (college currently attending/most recently attended) rather than another institution? Q14. What other reasons influenced your decision to go to (college currently attending/most recently attended)?
Overall(N=3419)
Primary Reason
(N=3419)
Other Reason(N=3419)
Location/proximity/close to home or work 66% 35% 30%
Cost/affordability 42% 6% 36%
To transfer to a 4-year college or university 38% 8% 30%
Specific field of study/program offered 33% 15% 18%
Flexible scheduling/convenient class times 30% 4% 26%
To obtain a 2-year Associates degree 29% 4% 25%
Quality of education 23% 3% 20%
Reputation of the school 20% 4% 17%
Availability of online or hybrid classes 17% 5% 13%
•Location is most influential in remote, rural regions of the state.
•Cost/affordability does not vary by sources contributing to education costs as a primary reason for college choice; as a secondary factor of influence, students relying on personal income/savings are significantly more likely to consider the cost than those relying on other sources.
•Quality of education and the reputation of the school play a more significant role in the North King County and Eastside regions.
•“Engaged students” are significantly influenced by location and academic transfer, while independent, non-academic students are significantly influenced by the availability of a specific field of study.

Location as Influencing College Choiceby region

Cost/Affordability as Influencing College Choiceby source for educational costs

Reputation as Influencing College Choiceby region

Q15b. And how did you choose (college currently attending/most recently attended) for that field of study?
(n=1028)
Quality of instruction/teachers/reputation of school or program 34%
Location/Proximity to home 24%
Availability of classes/program 16%
Only school in my area that offers my field of study 10%
Cost/Affordability 8%
Able to transfer to another school 5%
Day and time classes offered 5%
Q15a. You mentioned that you chose (college currently attending/most recently attended) because of a specific field of study or program. What was the field of study?
(n=1083)
Nursing 16%
Computer Science/Programming/IT/Web Design/Software Engineering 9%

Q16 Was your current/most recent college your first choice?
Q18b. What influenced your decision to attend (college currently attending/most recently attended) over that institution?
(n=486)
Location/Proximity to home 35%
Cost/Affordability 21%
Availability of classes/program 19%
Entrance requirements/not accepted at other school/not accepted as fast 9%
Day and time classes offered 8%
Quality of instruction/teachers/reputation of school or program 7%
Classes offered online/distance learning 5%
•90% of Promoters say their community/technical college was their first choice, compared to 83% of Neutrals and 68% of Detractors.
•Geography impacts the influence of location.
•Service dependent students are significantly more concerned with location and affordability, while independent students are influenced by flexibility, including the availability of classes, the day and time classes are offered, and access to online learning.

Tuition and Financial AidTuition and Financial Aid

Q23. Which of the following sources contribute to your education costs at (college currently attending/ most recently attended)?
(N=3419)CCSSEE
Minor/Major Source
Personal income or savings 58% 68%
Financial aid and ScholarshipsFinancial Aid
32%Scholarships
11% 44%
Family contributions 29% 47%
Student loans (bank, etc.) 18% 27%
Employer contributions 13% 16%
Other public agency funds 8% 12%
•Financial sources significantly differ geographically.
•Current students and successful completers are less reliant upon personal income/savings than other former students.
•Age also affects how students pay for their education; younger students are more reliant upon tuition assistance.
•Full-time, academic, and service dependent students are also significantly more reliant upon sources other than personal income.
•Among current students, a majority of service dependent students rely solely on sources other than personal income/savings.

Financial Sourcesby region

Q19-21. Using a five-point scale, with 1 being Not at all Important and 5 being Very Important, to what degree did each of the following influence your decisions about college before enrolling?
Tuition costsAvailability of financial aid
Availability of scholarships
(n=3223) (n=3174) (n=3111)
Important (4-5) 56% 44% 25%
Neutral (3) 16% 10% 14%
Unimportant (1-2) 28% 46% 61%
Average (mean) rating 3.48 2.93 2.31

Q22. When considering education costs before enrolling in college, which of the following expenses did you consider in addition to tuition? (N=3419)

Q24. Using a five-point scale, how adequate is financial aid when it comes to covering the costs of your education at (college currently attending/most recently attended)?
Percentage(N=3419)
Adequate (4-5) 40
Neutral (3) 25
Inadequate (1-2) 35
Average 3.04
•Service dependent, full-time, and academic minded students are significantly more concerned with tuition costs and the availability of tuition assistance than their counterparts. In complement, these same students are most satisfied with the adequacy of financial aid.
•Regionally, Seattle, North King County, and Eastside students are least satisfied with financial aid.
•Nearly half of Promoters consider financial aid Adequate, compared to only 21% of Detractors.
•Students who rely solely on sources of income other than their own are significantly more satisfied with financial aid. 53% say it is Adequate, compared to only 16% who rely solely on personal income/savings and 38% who pay for their education costs with both personal income and other sources.

TechnologyTechnology

Q35. When registering for classes, do you prefer to do so…? (N=3419)
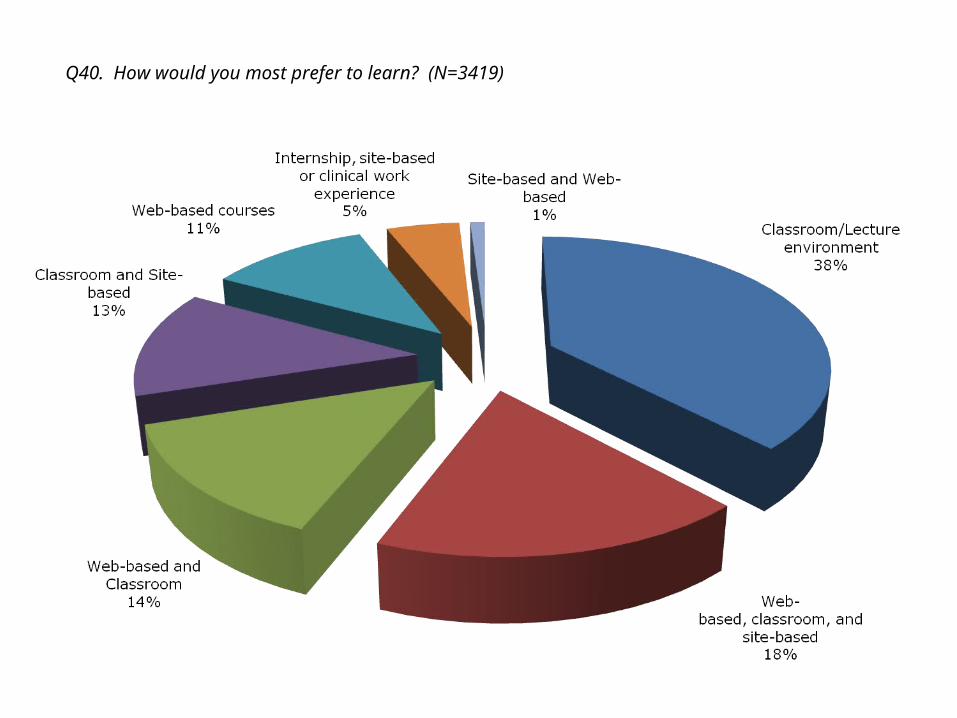
Q40. How would you most prefer to learn? (N=3419)

Q37. Is that with the college you are currently attending/most recently attended? (n=924)
Q36. Are you currently enrolled in online learning? (N=3419)
•Enrollment in online learning differs regionally.
•Online enrollment also varies by educational goal and course load.
•Students who have not taken a break in their studies are more likely to be taking online courses than those who have had an interruption.
•Interestingly, students with children in the home are significantly more likely to be enrolled in online learning.
•99% of students currently enrolled in online learning who have not interrupted their studies are taking their web-based classes with the college they are currently attending or most recently attended.
•Students enrolled in online learning are more loyal to their current/most recent institution based upon their dependency on student services.
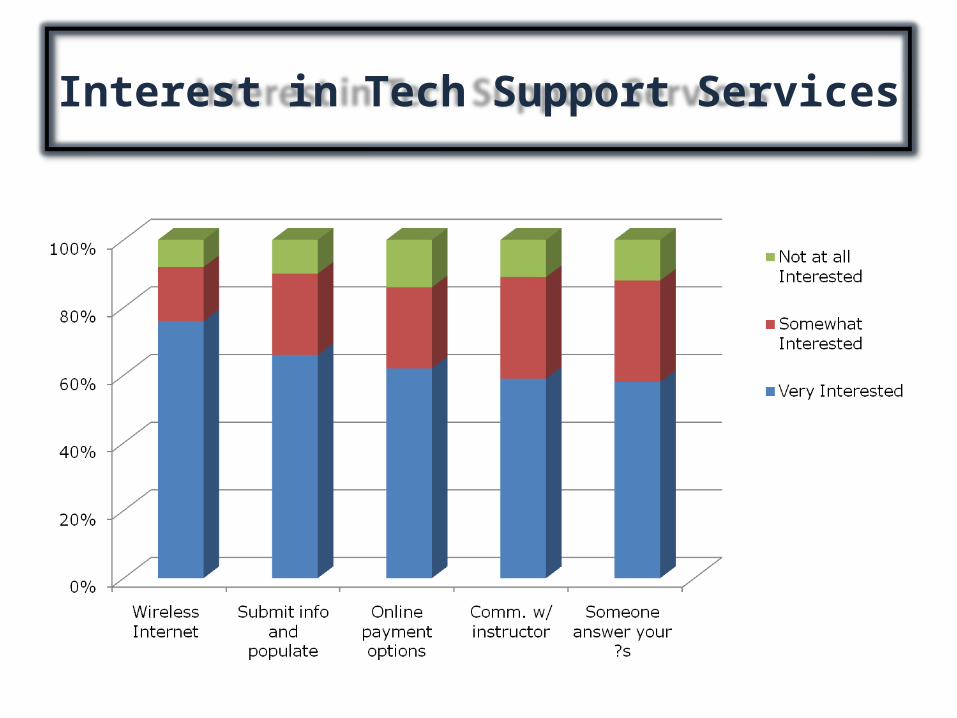
Interest in Tech Support Services

Interest in Tech Support Services

Interest in Tech Support Services

Campus ClimateCampus Climate

Q26. How would you describe the campus climate at the college you are currently attending/most recently attended?
Average (Mean) Rating
(n=varies)
Yes/Very(n=varies)
No/Not At All(n=varies)
Accepted for who you are 4.35 85% 4%
Feel safe and secure on campus 4.30 84% 5%
Treated with dignity 4.24 82% 4%
Feel respected 4.16 79% 6%
Made to feel welcome 4.12 77% 6%
Feel encouraged 4.02 72% 9%
Feel supported 3.98 71% 9%
Feel challenged academically 3.91 71% 12%
Feel cared for 3.89 67% 11%
Able to express student concerns or complaints 3.88 67% 12%
Kept informed 3.81 65% 12%
Feel a sense of belonging 3.79 64% 15%
•Satisfaction with the campus climate varies by current enrollment status, whether students have taken a break in their studies, age, and dependency on student services.

Campus Climateby Dependency on Support Services
(1 to 5 scale; with 1 being Not at all and 5 being Very)

Campus Climateby Net Promoter status

Student Services

Q28. On average, how often do you utilize each of the following services at the college you attend/most recently attended?
“Often/Sometimes”(N=3419)
“Rarely/Never”(N=3419)
Library services 57% 42%
Computer labs 56% 44%
Academic advising/planning 50% 49%
Financial aid advising 29% 70%
Skills labs (writing, math, etc.) 25% 74%
Tutoring 21% 78%
Career counseling 19% 80%
Personal counseling services 13% 86%
Job placement services 9% 90%
Multicultural student services 8% 91%
Services to students with disabilities 6% 93%
Childcare 3% 94%
•Usage of student support services varies by current enrollment status, whether students have taken a break in their studies, educational goal, and course load.

Use of Support Servicesby whether student has had to interrupt their studies

Use of Support Servicesby course load

Satisfaction with Support Services Personnel

Satisfaction with most used Support Services

Satisfaction with least used Support Services

Extracurricular Activities

Q31. What is your involvement in the following extracurricular activities at the college you currently attend/most recently attended?
“Participate in or attend”(N=3419)
Clubs and organizations 15%
Artist and lecture series 14%
Performing arts 10%
Phi Theta Kappa 10%
Visual arts 9%
Social activities 9%
Athletics 5%
Student government 5%
Student newspaper 5%
Q30. What role do extracurricular activities play in your educational experience?
•Students under age 25 are most involved and value extracurricular activities.
•Students involved in extracurricular activities are significantly less likely to have taken a break in their studies.
•Full-time, academic transfer, and dependent students are the most participatory.

ConclusionsConclusions
Related Documents