Washington Regional Haze Reasonably Available Control Technology Analysis for Pulp and Paper Mills November 2016 Publication no. 16-02-023

Welcome message from author
This document is posted to help you gain knowledge. Please leave a comment to let me know what you think about it! Share it to your friends and learn new things together.
Transcript
Washington Regional Haze Reasonably Available Control Technology Analysis for Pulp and Paper Mills
November 2016 Publication no. 16-02-023
Publication and Contact Information
This report is available on the Department of Ecology’s website at https://fortress.wa.gov/ecy/publications/SummaryPages/1602023.html For more information contact: Air Quality Program P.O. Box 47600 Olympia, WA 98504-7600
Phone: 360-407-6800
Washington State Department of Ecology - www.ecy.wa.gov
o Headquarters, Olympia 360-407-6000
o Northwest Regional Office, Bellevue 425-649-7000
o Southwest Regional Office, Olympia 360-407-6300
o Central Regional Office, Yakima 509-575-2490
o Eastern Regional Office, Spokane 509-329-3400 For special accommodations or documents in alternate format, call (360) 407-6800, 711 (relay service), or 877-833-6341 (TTY).
Washington Regional Haze RACT Analysis for Pulp and Paper Mills
By Gary Huitsing
Air Quality Program Washington State Department of Ecology
Olympia, Washington
i
Table of Contents
Page
List of Figures and Tables.................................................................................................. iii Figures.......................................................................................................................... iii Tables ........................................................................................................................... iii
Acknowledgements ..............................................................................................................v
Abstract/Executive Summary ............................................................................................ vi
Acronyms, Abbreviations, and Terms .............................................................................. vii
1. Overview ...............................................................................................................1 1.1. Background ......................................................................................................1 1.2. RACT in Washington State .............................................................................4
1.2.1. RACT implementation in Washington State ...........................................5 1.3. Source impacts on visibility .............................................................................6
2. Availability of Additional Controls .......................................................................7
3. Demonstrated Emission Limits for Recovery Furnaces and Lime Kilns ............14 3.1. Demonstrated PM emission limits for recovery furnaces and lime kilns ......14 3.2. Demonstrated SO2 emission limits for recovery furnaces and lime kilns .....20 3.3. Demonstrated NOX emission limits for recovery furnaces and lime kilns ....27
4. Estimated Emission Reductions Achievable .......................................................33 4.1. Estimated emission reductions achievable (by facility) .................................33
4.1.1. PTPC estimated emission reductions .....................................................34 4.1.2. WestRock estimated emission reductions ..............................................37 4.1.3. Weyerhaeuser estimated emission reductions .......................................40 4.1.4. GP Camas estimated emission reductions .............................................42 4.1.5. KapStone estimated emission reductions...............................................45 4.1.6. Boise White Wallula estimated emission reductions .............................51 4.1.7. Cosmo estimated emission reductions ...................................................54 4.1.8. Graymont estimated emission reductions ..............................................55
4.2. Estimated emission reductions for recovery furnaces achievable (cumulative data) ...........................................................................................56 4.3. Estimated emission reductions for lime kilns achievable (cumulative data) .59 4.4. Discussion of estimated potential emission reductions .................................61
4.4.1. ......... Discussion of estimated potential emission reductions for recovery furnaces ..................................................................................................61
4.4.2. Discussion of estimated potential emission reductions for lime kilns ...63
5. Impacts of Controls on Visibility ........................................................................64 5.1. Impacts of pulp and paper mills on visibility (BART modeling analysis) ....64 5.2. Impacts of pulp and paper mills on visibility (RACT modeling analysis) ....66
5.2.1. Modeling results.....................................................................................67 5.2.2. Additional modeling scenarios ..............................................................68
ii
6. Estimated Costs ...................................................................................................69 6.1. Capital and operating costs ............................................................................69
7. Conclusions .........................................................................................................73 7.1. PTPC conclusions ..........................................................................................74 7.2. WestRock conclusions ...................................................................................74 7.3. Weyerhaeuser conclusions .............................................................................74 7.4. GP Camas conclusions ...................................................................................74 7.5. KapStone conclusions ....................................................................................74 7.6. Boise White Wallula Mill conclusions ..........................................................74 7.7. Cosmo specialty fiber mill conclusions .........................................................75 7.8. Graymont lime kiln conclusions ....................................................................75
Appendices .........................................................................................................................76
Appendix A. Unit Conversions and Permit Limit Information ........................................77
Appendix B. Facility Operating and Emissions Data .....................................................109
Appendix C. WSU Report ..............................................................................................134
Appendix D. Cost Estimates ...........................................................................................171
iii
List of Figures and Tables Page
Figures Figure 1. Class I areas in Washington State .................................................................................. 3
Figure 2. Estimated potential PM emission reductions for recovery furnaces ............................ 57
Figure 3. Estimated potential SO2 emission reductions for recovery furnaces ............................ 57
Figure 4. Estimated potential NOX emission reductions for recovery furnaces .......................... 58
Figure 5. Estimated potential PM emission reductions for lime kilns ......................................... 60
Figure 6. Estimated potential SO2 emission reductions for lime kilns ........................................ 60
Figure 7. Estimated potential NOX emission reductions for lime kilns ....................................... 61
Tables Table 1. Washington State Chemical Pulp and Paper Mills .......................................................... 2
Table 2. Mandatory Federal Class I Areas in Washington State1 .................................................. 3
Table 3. PM Control Technologies Available for Recovery Furnaces and Lime Kilns ................ 7
Table 4. SO2 Control Technologies Available for Recovery Furnaces and Lime Kilns ............... 9
Table 5. NOX Control Technologies Available for Recovery Furnaces and Lime Kilns ............ 10
Table 6. Demonstrated PM Emission Limits at Recovery Furnaces ........................................... 15
Table 7. Demonstrated PM Emission Limits at Lime Kilns ........................................................ 18
Table 8. SO2 Emission Limits1 Demonstrated at Recovery Furnaces ......................................... 20
Table 9. SO2 Emission Limits1 Demonstrated at Lime Kilns ...................................................... 24
Table 10. NOX Emission Limits1 Demonstrated at Recovery Furnaces ...................................... 27
Table 11. NOX Emission Limits1 Demonstrated at Lime Kilns ................................................... 30
Table 12. PTPC RF Emission Reductions ................................................................................... 35
Table 13. PTPC Lime Kiln Emission Reductions ....................................................................... 36
Table 14. WestRock Recovery Furnace (No. 4) Emission Reductions ....................................... 37
Table 15. WestRock Lime Kiln (No. 1) Emission Reductions .................................................... 38
Table 16. WestRock Lime Kiln (No. 2) Emission Reductions .................................................... 39
Table 17. Weyerhaeuser Recovery Furnace (No. 10) Emission Reductions ............................... 40
iv
Table 18. Weyerhaeuser Lime Kiln (No. 4) Emission Reductions.............................................. 41
Table 19. GP Camas Recovery Furnace (No. 3) Emission Reductions ....................................... 42
Table 20. GP Camas Recovery Furnace (No. 4) Emission Reductions ....................................... 43
Table 21. GP Camas Lime Kiln (No. 4) Emission Reductions ................................................... 44
Table 22. KapStone Recovery Furnace (No. 18) Emission Reductions ...................................... 45
Table 23. KapStone Recovery Furnace (No. 19) Emission Reductions ...................................... 46
Table 24. KapStone Recovery Furnace (No. 22) Emission Reductions ...................................... 47
Table 25. KapStone Lime Kiln (No. 3) Emission Reductions ..................................................... 48
Table 26. KapStone Lime Kiln (No. 4) Emission Reductions ..................................................... 49
Table 27. KapStone Lime Kiln (No. 5) Emission Reductions ..................................................... 50
Table 28. Boise White Wallula Recovery Furnace (No. 2) Emission Reductions ...................... 51
Table 29. Boise White Wallula Recovery Furnace (No. 3) Emission Reductions ...................... 52
Table 30. Boise White Wallula Lime Kiln Emission Reductions ............................................... 53
Table 31. Cosmo Recovery Furnace Emission Reductions ......................................................... 54
Table 32. Graymont Calcining Lime Kiln (CLK) Emission Reductions ..................................... 55
Table 33. Tons of Potential Pollutant Reduction Based on Proposed RACT Limit Options for Recovery Furnaces ........................................................................................................................ 56
Table 34. Tons of Potential Pollutant Reduction Based on Proposed RACT Limit Options for Lime Kilns .................................................................................................................................... 59
Table 35. Visibility Modeling Results: 22nd Highest Delta dv, 2003–2005 (98th Percentile) ... 65
Table 36. Visibility Modeling Results: 8th Highest Delta dv, (98th Percentile) ......................... 67
Table 37. Recovery Furnace Estimated Control Costs ................................................................ 69
Table 38. Lime Kiln Estimated Control Costs ............................................................................. 72
v
Acknowledgements The authors of this report would like to thank the following individuals for their contribution and assistance in preparing this RACT analysis:
• Brian Lamb, Washington State University • Ravi Vikram, Washington State University • Serena Chung, Washington State University • Joseph Vaughan, Washington State University • Steven J. Gorg, Minnesota Pollution Control Agency (MPCA) • Eric Kennedy, Maine Department of Environmental Protection (MDEP) • Gerry Pade, Puget Sound Clean Air Agency (PSCAA) • Brian Renninger, Puget Sound Clean Air Agency (PSCAA) • Ann Ingram, Lockheed Martin, EPA Contractor, Info Clearinghouse for Inventories &
Emissions Factors (CHIEF) Help Desk Supporting EPA's Measurement Policy Group
The Principle Contributors from Ecology’s Staff were:
• Gary Huitsing, Environmental Engineer • Alan Newman, Environmental Engineer • Ranil Dhammapala, Acting Science & Engineering Manager (3/14/2015–8/31/2015),
Atmospheric Scientist • Clint Bowman, Air Dispersion Modeler (through 8/31/2016) • Anya Caudill, Acting Rules and Planning Unit Manager (through 1/31/2016) • Jeff Johnston, Science & Engineering Manager (through 3/13/2015)
The following Ecology staff also made significant contributions:
• Tina Ebio, Administrative Assistant • Stephanie Ogle, Waste to Resources Industrial Pulp and Paper Unit Supervisor • Shingo Yamazaki, Waste to Resources Industrial Pulp and Paper • Ha Tran, Waste to Resources Industrial Pulp and Paper • Teddy Le, Waste to Resources Pulp and Paper Unit Supervisor (through 5/31/2016) • Robert Carruthers, Waste to Resources Industrial Pulp and Paper • Nancy Lowe, Waste to Resources Industrial Pulp and Paper (through 5/31/2016) • Marc Heffner, Waste to Resources Industrial Pulp and Paper (through 6/30/2013) • Nancy Pritchett, Program Development Section Manager • Rich Hibbard, Environmental Engineer, Program Development Section (through 6/30/2016) • Bob Burmark, Environmental Engineer, Science & Engineering Section (through 4/1/2016) • Marc Crooks, Environmental Engineer • Sally Otterson, Emission Inventory • Farren Herron-Thorpe, Emission Inventory • Stephanie Summers, Emission Inventory • Donna Seegmueller, Admin Services - Records/Library • Carol Johnston, Agency Ops
vi
Abstract/Executive Summary This report is a follow-up as required in the 2010 Washington Regional Haze State Implementation Plan. Ecology evaluated emission controls applicable to recovery processes at pulp mills. This report also analyzed visibility improvement in federal Class I areas (national parks and certain wilderness areas) that might occur if additional emission controls were required at pulp mills. Ecology performed the following:
• Evaluated emission limitations and control technologies used worldwide on pulp mills (recovery furnaces/boilers and lime kilns). We found several promising add-on control technologies. We also looked at emission limits in Washington and found that some emission limits were less protective compared to other pulp mills in Washington and in other states.
• Analyzed revised emission limits for each pulp mill.
• Provided achievable visibility improvements based on the revised emission rates. Modeling indicates that if Reasonably Available Control Technology (RACT – additional air pollution controls) were required, visibility would potentially be improved at the Alpine Lakes and Goat Rocks Wildernesses (0.13 deciview and 0.12 deciview, respectively). No other Class I area showed a cumulative improvement of more than 0.1 deciview.
Ecology concluded that the actual emission reductions from the individual pulp mills and the industry as a whole would be relatively costly to implement and visibility improvements in the federal Class I areas would not be observable. We do not recommend further work to evaluate or require additional air pollution controls for pulp mills in Washington.
vii
Acronyms, Abbreviations, and Terms
A Stack Area
Acf Actual Stack Gas Flow Rate
ACFM Actual Cubic Feet per Minute
acfs Actual Cubic Feet per Second
ADT Air Dried Pulp
AIRNOW Non-IMPROVE sites; a website which provide visual depictions of current and forecast air quality nationwide.
AIRPACT AIRPACT is a computerized system for predicting air quality (AQ) for the immediate future of one to three days for ID, OR and WA.
An Sample Nozzle Cross Section
APTI Air Pollution Training Institute
ATM Atmosphere (unit of pressure)
BACT Best Available Control Technology
BART Best Available Retrofit Technology
BAT Best Available Techniques in the [Kraft] Pulp and Paper Industry, December 2001, European Commission. BATs are not permit limits, but are based on guidance documents called BREFs (BAT Reference document)
BLS Black Liquor Solids
BPT Best Practical Treatment
Bray Rayleigh Extinction Coefficient
BREF BAT Reference document
Btu British thermal unit
Bws Stack Gas Moisture Fraction
CAA Clean Air Act
CaCO3 Calcium Carbonate
CALMET California Meteorological Model; a diagnostic 3-dimensional meteorological model
CALPUFF California Puff Model; an air quality dispersion model
CAMx Comprehensive Air Quality Model with Extensions
CEMS Continuous Emissions Monitoring Systems
viii
CFR Code of Federal Regulations
CM Coarse Matter
CM Coarse Matter
CMAQ Community Multi-Scale Air Quality Model
CO Carbon Monoxide
COGO1 Local Air Monitor Site Abbreviation for Columbia River Gorge at Mt Zion
CORI1 Local Air Monitor Site Abbreviation for Columbia River Gorge at Wishram
Cp Pitot tube calibration coefficient
D Diameter of stack
DBA Doing Business As
Delta dv Change in deciview
dH Meter Orifice Pressure
dP Differential Pressure
dP Stack Gas Velocity Head
dP^.5 Stack Gas Velocity Head
dv Deciview; a measure of light extinction
EC Elemental Carbon
EGF Electrified Gravel Bed Filter
EI Emission Inventory
EPA Environmental Protection Agency
ESP Electrostatic Precipitator
F1 Conversion Factor
F2 Conversion Factor
F3 Conversion Factor
F4 Conversion Factor
F5 Conversion Factor
FB Fractional Bias
FE Fractional Error
FGD Flue Gas Desulferization
ix
FIP Federal Implementation Plan
FLM Federal Land Manager
FNA Formerly Known As
FS Forest Service
ft2 Square Feet
g Gram
GED Good Equipment Design
GPM Gallons Per Minute
gr/dscf Grains per dry standard cubic feet
H20/gm H20 per gram
H202 Hydrogen Peroxide
H2S Hydrogen Sulfide
HAP Hazardous Air Pollutant
HAPs Hazardous Air Pollutants
HERB High Energy Recovery Boiler
HG Mercury
Ht Stack Height
HVLC High Volume Low Concentration
I Isokinetic percent
ICCP Integrated Pollution Prevention Control (ICCP), a reference document on Best Available Techniques [BAT] in the [kraft] Pulp and Paper Industry, December 2001, European Commission
IMPROVE Interagency Monitoring of Protected Visual Environments
in Inches
Kg Kilogram
Kp Pitot tube constant
KPa Kilo Pascal
Kraft Type of chemical pulp and paper mill processes using sulfate. Can be divided into three areas: the making of pulp, recovery of cooking materials, the bleaching of pulp
LAER Lowest Achievable Emission Rate
x
Lb/hr Pounds per hour
Lbmol Pound Mole
LCPD Large Combustion Plant Directive of the European Commission.
LEA Low Excess Air
LK Lime Kiln
LKEU Lime Kiln Emission Unit
LNB Low NOX Burner
M3 Cubic Meters
MACT Maximum Achievable Control Technology
MCIP Meteorology-Chemistry Interface Processor
Md Stack Gas Mole weight dry
Mf Mass of particulate: filter
MFB Mean Fractional Bias
MFE Mean Fractional Error
mg milligram
mg/dscf Milligrams per dry standard cubic feet
MH20 MW of water
MM Million
Mm-1 Inverse mega meter; a measure of particle extinction
MM5 Meteorological Mesoscale 5
Mn Mass of particulate: combined samples
MORA1 Local Air Monitor Site Abbreviation for Mt. Rainier National Park
Mp Mass of particulate: probe wash
Ms Stack Gas Mole weight wet
MW Megawatt
MW Molecular Weight
N2 Nitrogen
N/A Not Applicable or Not Available
NCAC North Carolina Administrative Code
xi
NCASI National Council of Air and Stream Improvement
NCG Non Condensable Gases
NESHAP National Emission Standards for Hazardous Air Pollutants
NG Natural Gas
NH3 Ammonia
(NH4)2SO4 Ammonium Sulfate
NH4 Ammonium
Nm3 Newton – Meters cubed
NO Nitric oxide
NO2 Nitrogen dioxide
NO3 Ammonium Nitrate or NH4NO3
NOCA1 Local Air Monitor Site Abbreviation for Glacier Peak Wilderness and North Cascades National Park
NOX Nitrogen Oxides
NPS National Park Service
NSCR Non-Selective Catalytic Reduction
NSPS New Source Performance Standards
NSR New Source Review
NW AIRQUEST A virtual air quality science center made up of various air quality agencies, tribes, and universities of the Pacific Northwest
NWCAA Northwest Clean Air Agency
O&M Operations and Maintenance
O/R Oxidation/Reduction
O2 Oxygen
O3 Ozone
OBS Observed
OC Organic Carbon
OLYM1 Local Air Monitor Site Abbreviation for Olympic National Park
OM Organic Matter
OMC Organic Mass Carbon
xii
Pa Pascal
Pa Pressure (stack)
PAN Peroxyacetylnitrate
PASA1 Local Air Monitor Site Abbreviation for Pasayten Wilderness
Pbar Pressure (barometric)
PCT Proper Combustion Techniques
PICs Products of Incomplete Combustion
PKA Previously Known As
PM Particulate Matter
PM10 Coarse Particle Matter or Particulate Matter; with an aerodynamic diameter of 10 micrometers or less
PM2.5 Fine Particles or Particulate Matter; with an aerodynamic diameter of 2.5 micrometers or less
PNW Pacific Northwest
POA Primary Organic Aerosol
ppm parts per million
ppmv parts per million by volume
ppmvd parts per million by dry volume
PRP Preliminary Reasonable Progress
PSAT Particulate Matter Source Apportionment Technology
PSCAA Puget Sound Clean Air Agency
PSD Prevention of Significant Deterioration
Pstd Pressure at STP
PTPC Port Townsend Paper Company
Qstd Dry Stack gas flow rate at STP
R Ideal gas constant
RACT Reasonably Available Control Technology
RAVI Reasonably Attributable Visibility Impairment
RF Recovery Furnace
RFEU Recovery Furnace Emission Unit
xiii
RH Regional Haze
RHR Regional Haze Rule
RMC WRAP’s Regional Modeling Center
RPG Reasonable Progress Goal
RRF Relative Response Factors
S Content Sulfur Content
sat vap press Saturation Vapor Pressure
SBws Saturation Moisture Fraction at STP
SCFM Standard Cubic Feet per Minute
SCR Selective Catalytic Reduction
SIP State Implementation Plan
SMOKE Sparse Matrix Operator Kernel Emissions
SNCR Selective Non-Catalytic Reduction
SNPA1 Local Air Monitor Site Abbreviation for Alpine Lakes Wilderness
SO2 Sulfur Dioxide
SO4 Ammonium Sulfate or (NH4)2SO4
SOIL Fine Soil
SOX Sulfur Oxides
STP Standard Temperature and Pressure
Sulfite chemical pulp and paper process
Similar to Kraft process except that sulfurous acid is used as cooking chemicals instead of sodium hydroxide and sodium sulfide, and a cooking buffer of bisulfite is used with one of four bases (ammonium, calcium, magnesium, or sodium).
Tabs Temperature absolute
TAPs Toxic Air Pollutants
TCaO/day Tons Calcium Oxide per Day
Tm Dry Gas Meter Temperature
TPH Tons Per Hour
TPY Tons Per Year
TRS Total Reduced Sulfur
xiv
Ts Stack gas temp
TSP Total Suspended Particulate
Tstd Temperature at STP
USDA U.S. Department of Agriculture
USDA – FS U.S. Department of Agriculture – Forest Service
USDI U.S. Department of the Interior
USDI – FWS U.S. Department of the Interior – Fish & Wildlife Service
USDI – NPS U.S. Department of the Interior – National Park Service
USGS U.S. Geological Survey
UW University of Washington
Vi Impinger 1
VIEWS Visibility Information Exchange Web System
Vii Impinger 2
Viii Impinger 3
Visibility SIP Visibility Protection
Viv Impinger 4
Vm Sample Volume from meter
Vmstd Sample Volume
VOC Volatile Organic Content
Vs Stack Gas Velocity
Vw Total Water Volume Condensed
Vwstd Total Water Volume Condensed at STP
WA Washington
WAC Washington Administrative Code
WEP Weighted Emissions Potential
WESP Wet Electrostatic Precipitator
WESTAR Western States Air Resources Council
WHPA1 Local Air Monitor Site Abbreviation for Goat Rocks Wilderness and Mt. Adams Wilderness areas
xv
WHR Wet Heat Recovery
WRAP Western Regional Air Partnership
WRF Smoke SMAQ
Weather Research and Forecasting Model Sparse Matrix Operator Kernel Emissions (SMOKE) Modeling System Satellite-Assisted Management Of Air Quality
WSU Washington State University
Y Dry Gas Meter Calibration factor
1
1. Overview
1.1. Background This Reasonably Available Control Technology (RACT) analysis addressing regional haze (RH), is prepared to fulfill a commitment in the Washington State Department of Ecology (Ecology) Regional Haze State Implementation Plan (SIP) prepared in December of 2010. Ecology was required to prepare a RH SIP as part of EPA’s phase II 1999 visibility rules called the Regional Haze Rule (RHR). This rule focuses on improving visibility in mandatory Class I federal areas. These lands are identified in the Clean Air Act Amendments of 1977, and afforded the highest level of protection from air pollutants. There are 156 of these Class I areas nationwide and include national parks, wilderness areas, and wildlife refuges. All other federal lands in the nation are designated as Class II areas. Washington’s eight mandatory federal Class I areas are shown in Figure 1 and listed in Table 2. One element of the RHR required the state to include a Four-Factor Analysis of emission reduction potential from non-Best Available Retrofit Technology (BART) sources to be used in developing the Reasonable Progress Goals (RPGs) for each Class I area. The four factors to be considered in these analyses are: • Cost of compliance • Time necessary for compliance • Energy and non-air quality impacts of compliance • Remaining useful life of any potential affected sources Ecology and the Western Regional Air Partnership (WRAP) developed analyses for point sources of pollutants in Washington to meet the Four-Factor Analysis requirement for non-BART sources in the RHR. This analysis and its result were included in the state’s RH SIP. The analyses in the RH SIP identified specific industries including “pulp and paper and wood products” (pulp & paper mills), as significant emitters of pollutants known to contribute to RH and that have opportunities for emission reductions that could improve visibility in Class I areas. The pollutants emitted by the pulp and paper and wood products industry in Washington includes sulfur dioxide (SO2) and oxides of nitrogen (NOX) (including nitric oxide (NO) and nitrogen dioxide (NO2) compounds), volatile organic compounds (VOCs), and directly emitted particulate matter (PM). These air pollutants contribute to RH in the following ways: • Both SO2 and NOX gases can form sulfate and nitrate particulate matter, which, as with
particulate matter in general, impair visibility. • VOCs can either condense to form PM or can react with NOX.
2
• NOX is a precursor chemical for peroxyacetyl nitrate (PAN), which is a secondary pollutant present in photochemical smog.
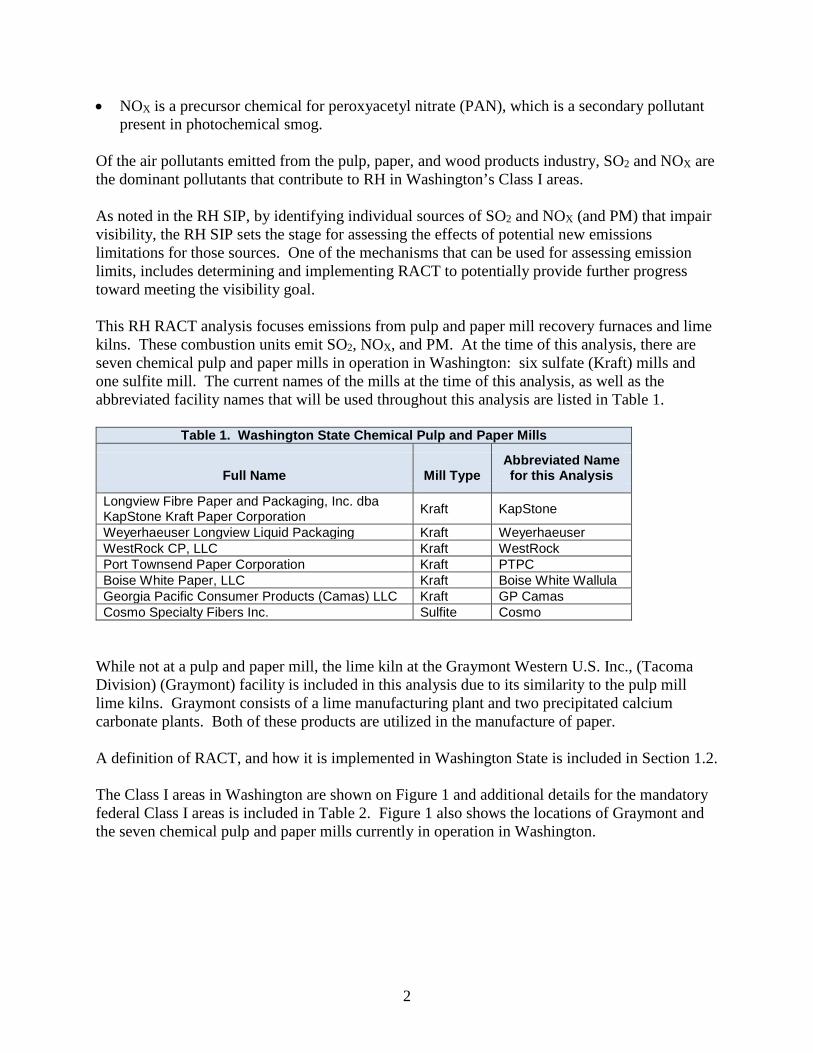
Of the air pollutants emitted from the pulp, paper, and wood products industry, SO2 and NOX are the dominant pollutants that contribute to RH in Washington’s Class I areas. As noted in the RH SIP, by identifying individual sources of SO2 and NOX (and PM) that impair visibility, the RH SIP sets the stage for assessing the effects of potential new emissions limitations for those sources. One of the mechanisms that can be used for assessing emission limits, includes determining and implementing RACT to potentially provide further progress toward meeting the visibility goal. This RH RACT analysis focuses emissions from pulp and paper mill recovery furnaces and lime kilns. These combustion units emit SO2, NOX, and PM. At the time of this analysis, there are seven chemical pulp and paper mills in operation in Washington: six sulfate (Kraft) mills and one sulfite mill. The current names of the mills at the time of this analysis, as well as the abbreviated facility names that will be used throughout this analysis are listed in Table 1.
Table 1. Washington State Chemical Pulp and Paper Mills
Full Name Mill Type Abbreviated Name for this Analysis
Longview Fibre Paper and Packaging, Inc. dba KapStone Kraft Paper Corporation Kraft KapStone
Weyerhaeuser Longview Liquid Packaging Kraft Weyerhaeuser WestRock CP, LLC Kraft WestRock Port Townsend Paper Corporation Kraft PTPC Boise White Paper, LLC Kraft Boise White Wallula Georgia Pacific Consumer Products (Camas) LLC Kraft GP Camas Cosmo Specialty Fibers Inc. Sulfite Cosmo
While not at a pulp and paper mill, the lime kiln at the Graymont Western U.S. Inc., (Tacoma Division) (Graymont) facility is included in this analysis due to its similarity to the pulp mill lime kilns. Graymont consists of a lime manufacturing plant and two precipitated calcium carbonate plants. Both of these products are utilized in the manufacture of paper. A definition of RACT, and how it is implemented in Washington State is included in Section 1.2. The Class I areas in Washington are shown on Figure 1 and additional details for the mandatory federal Class I areas is included in Table 2. Figure 1 also shows the locations of Graymont and the seven chemical pulp and paper mills currently in operation in Washington.
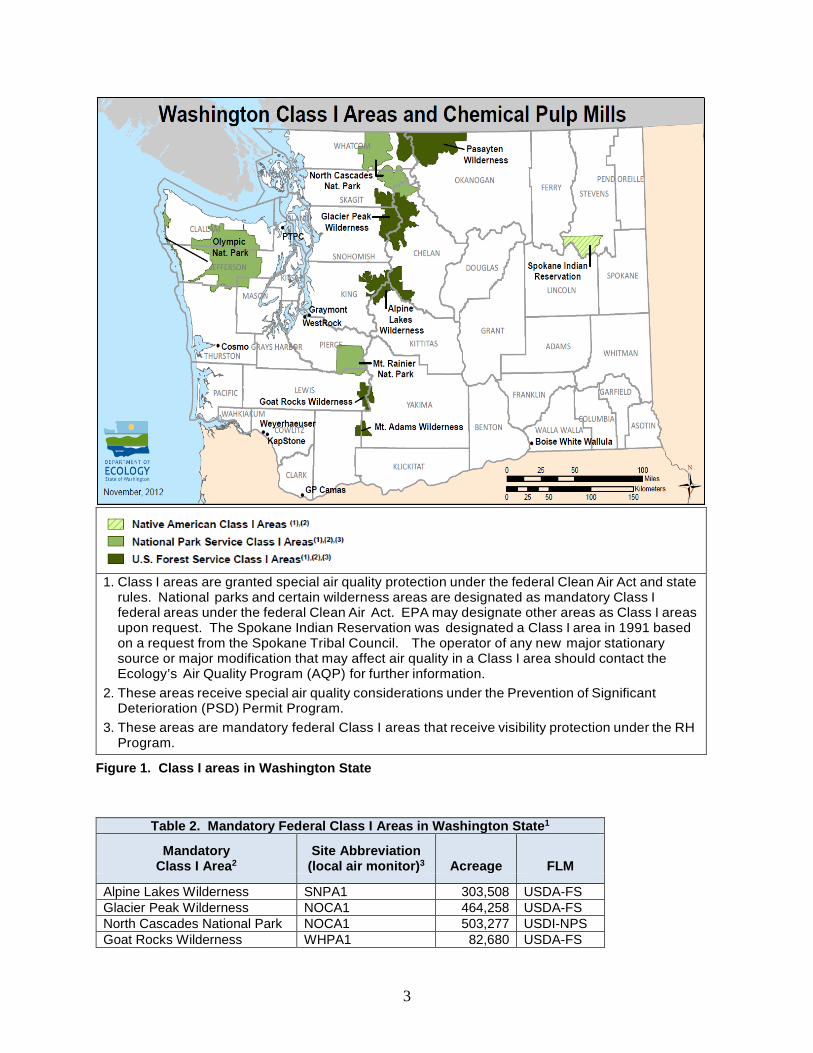
3
1. Class I areas are granted special air quality protection under the federal Clean Air Act and state
rules. National parks and certain wilderness areas are designated as mandatory Class I federal areas under the federal Clean Air Act. EPA may designate other areas as Class I areas upon request. The Spokane Indian Reservation was designated a Class I area in 1991 based on a request from the Spokane Tribal Council. The operator of any new major stationary source or major modification that may affect air quality in a Class I area should contact the Ecology’s Air Quality Program (AQP) for further information.
2. These areas receive special air quality considerations under the Prevention of Significant Deterioration (PSD) Permit Program.
3. These areas are mandatory federal Class I areas that receive visibility protection under the RH Program.
Figure 1. Class I areas in Washington State
Table 2. Mandatory Federal Class I Areas in Washington State1 Mandatory
Class I Area2 Site Abbreviation
(local air monitor)3 Acreage FLM
Alpine Lakes Wilderness SNPA1 303,508 USDA-FS Glacier Peak Wilderness NOCA1 464,258 USDA-FS North Cascades National Park NOCA1 503,277 USDI-NPS Goat Rocks Wilderness WHPA1 82,680 USDA-FS
4
Table 2. Mandatory Federal Class I Areas in Washington State1 Mandatory
Class I Area2 Site Abbreviation
(local air monitor)3 Acreage FLM
Mt. Adams Wilderness WHPA1 32,356 USDA-FS Mt. Rainier National Park MORA1 235,239 USDI-NPS Pasayten Wilderness PASA1 505,524 USDA-FS Olympic National Park OLYM1 892,578 USDI-NPS Total Acres 3,019,420 1 The USFS is the federal land manager for national wildlife refuges. However, of
the 23 national wildlife refuges in Washington State, none of them are part of the group of 21 national wildlife refuges located throughout the other 49 states, which are designated as Class I areas. <http://www.fws.gov/refuges/refugeLocatorMaps/washington.html> and <http://www.fws.gov/refuges/AirQuality/areas.html>
2 Columbia River Gorge, managed by the forest service, is not a Class I area, but is included in regional haze considerations by request of the FLMs. Another Class I area in the state, the Spokane Indian Reservation, is not included in this table because it is not a mandatory Class I area.
3 The two monitoring sites near the Columbia River Gorge are at Wishram and Mt. Zion and are referred to as CORI1 and COGO1, respectively.
1.2. RACT in Washington State RACT is defined in the Revised Code of Washington (RCW) 70.94.030(20) as:
“…the lowest emission limit that a particular source or source category is capable of meeting by the application of control technology that is reasonably available considering technological and economic feasibility. RACT is determined on a case-by-case basis for an individual source or source category taking into account:
• The impact of the source upon air quality, • The availability of additional controls, • The emission reduction to be achieved by additional controls, • The impact of additional controls on air quality, and • The capital and operating costs of the additional controls.
RACT requirements for a source or source category shall be adopted only after notice and opportunity for comment are afforded.”
While RACT, the acronym, includes the words “control technology,” RACT is defined in RCW 70.94.030(20) as an “emission limit” based on the application of additional controls. Other states and the federal Clean Air Act (CAA) may implement RACT differently from the state of Washington (such as limiting it to nonattainment areas). As noted in the RH SIP, however, “a provision of Washington’s CAA (RCW 70.94.154) requires existing sources to use
5
RACT.” This requirement then applies to existing sources in attainment areas, nonattainment, and unclassifiable areas. RACT is implemented in Washington State according to the process described in Section 1.2.1, which lists verbatim key portions from RCW 70.94.154.
1.2.1. RACT implementation in Washington State RCW 70.94.154 contains the implementing provisions for the RACT process in Washington. Specific to determining RACT, this section of law says:
(1) RACT as defined in RCW 70.94.030 is required for existing sources except as otherwise provided in RCW 70.94.331(9). (2) RACT for each source category containing three or more sources shall be determined by rule except as provided in subsection (3) of this section. (3) Source-specific RACT determinations may be performed under any of the following circumstances: (a) As authorized by RCW 70.94.153; (b) When required by the federal clean air act; (c) For sources in source categories containing fewer than three sources; (d) When an air quality problem, for which the source is a contributor, justifies a source-specific RACT determination prior to development of a categorical RACT rule; or (e) When a source-specific RACT determination is needed to address either specific air quality problems for which the source is a significant contributor or source-specific economic concerns.
RCW 70.94.154(5) contains additional procedural requirements to be followed when determining RACT.
(5) In determining RACT, ecology and local authorities shall utilize the factors set forth in RCW 70.94.030 and shall consider RACT determinations and guidance made by the federal environmental protection agency, other states and local authorities for similar sources, and other relevant factors. In establishing or revising RACT requirements, ecology and local authorities shall address, where practicable, all air contaminants deemed to be of concern for that source or source category.
Although there are some similarities between a RACT analysis and a Best Available Control Technology (BACT) analysis, the two analyses are defined differently. Per RCW 70.94.030(6), BACT means “an emission limitation based on the maximum degree of reduction for each air pollutant subject to regulation under this chapter emitted from or that results from any new or modified stationary source, that the permitting authority, on a case-by-case basis, taking into account energy, environmental, and economic impacts and other costs, determines is achievable for such a source or modification through application of production processes and available methods, systems, and techniques, including fuel cleaning, clean fuels, or treatment or innovative
6
fuel combustion techniques for control of each such a pollutant. In no event shall application of BACT result in emissions of any pollutants that will exceed the emissions allowed by any applicable standard under 40 C.F.R. Part 60 [NSPS] and Part 61 [NESHAP], as they existed on July 25, 1993, or their later enactments as adopted by reference by the director by rule.” The RACT process includes an economic component that is generally less stringent than BACT in that it applies a reasonableness test for the application of emission limitations based on specific control technologies to a group of existing separate sources constructed of varying age. In contrast, BACT addresses the cost and removal efficiency of emission controls to be included in the construction of new or modified sources. The RACT economic analysis looks at the costs of adding or replacing controls on existing equipment. We determined and ranked potential emission limitations reflecting the capabilities of different control technologies using a BACT-style approach. This approach provided helpful information to assess potential RACT options for addressing RH. In assessing what constitutes “reasonable” for this RACT analysis, Ecology performed both a quantitative and qualitative analysis. Specifically, a quantitative review of RH impacts using a top-level emission limit allowed Ecology to perform a qualitative analysis of less stringent emission limits as presented in Chapters 4 and 5 of this analysis.
1.3. Source impacts on visibility This RH RACT analysis is organized as follows: • Chapter 2 reviews the availability of additional control options for recovery furnaces and
lime kilns at pulp and paper mills. • Chapter 3 presents demonstrated emission limits for recovery furnaces and lime kilns in
Washington State, other states, Canada, and Europe. • Chapter 4 documents a comparison of emission reductions and lower emission limits
demonstrated to be reasonably available at pulp and paper mills. • Chapter 5 documents modeling analyses which estimate impacts of pulp mills upon visibility
in Washington Class I areas (and also on Class I areas in surrounding states and provinces), before and after implementing additional controls.
• Chapter 6 provides a survey of general estimated capital and operating costs of the additional
controls. • Chapter 7 presents conclusions of this RH RACT analysis considering the information
presented in Chapters 1 through 6.
7
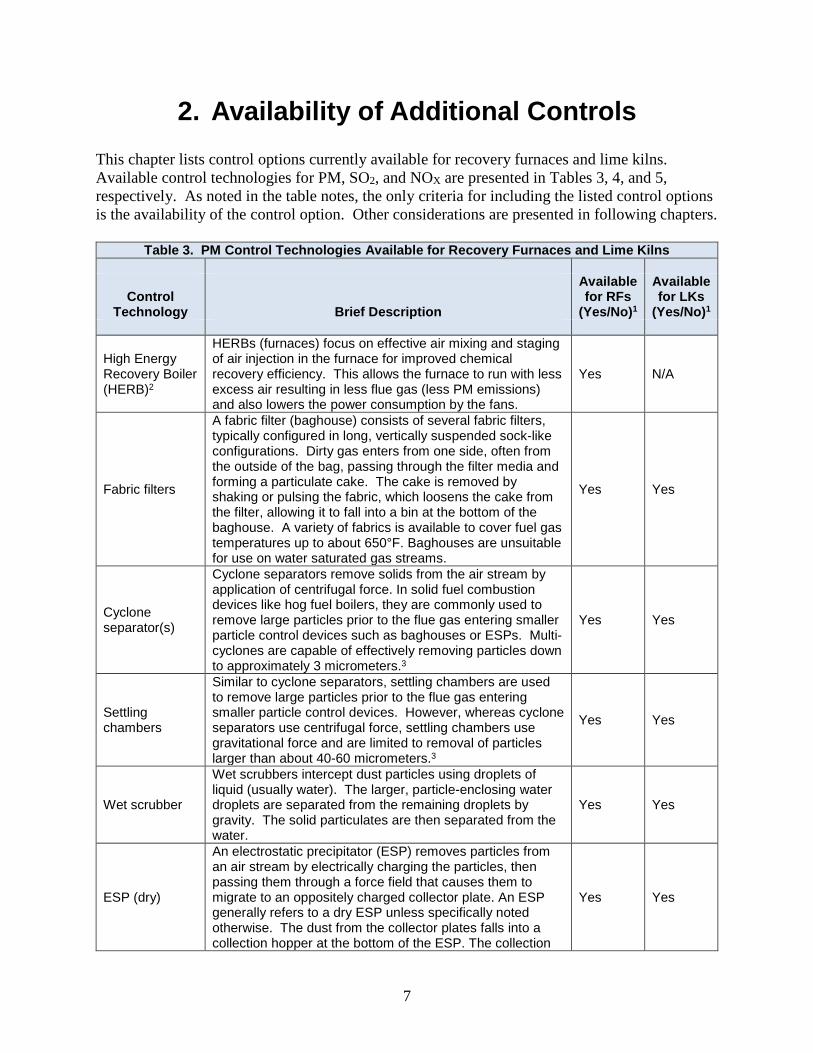
2. Availability of Additional Controls This chapter lists control options currently available for recovery furnaces and lime kilns. Available control technologies for PM, SO2, and NOX are presented in Tables 3, 4, and 5, respectively. As noted in the table notes, the only criteria for including the listed control options is the availability of the control option. Other considerations are presented in following chapters.
Table 3. PM Control Technologies Available for Recovery Furnaces and Lime Kilns
Control Technology Brief Description
Available for RFs
(Yes/No)1
Available for LKs
(Yes/No)1
High Energy Recovery Boiler (HERB)2
HERBs (furnaces) focus on effective air mixing and staging of air injection in the furnace for improved chemical recovery efficiency. This allows the furnace to run with less excess air resulting in less flue gas (less PM emissions) and also lowers the power consumption by the fans.
Yes N/A
Fabric filters
A fabric filter (baghouse) consists of several fabric filters, typically configured in long, vertically suspended sock-like configurations. Dirty gas enters from one side, often from the outside of the bag, passing through the filter media and forming a particulate cake. The cake is removed by shaking or pulsing the fabric, which loosens the cake from the filter, allowing it to fall into a bin at the bottom of the baghouse. A variety of fabrics is available to cover fuel gas temperatures up to about 650°F. Baghouses are unsuitable for use on water saturated gas streams.
Yes Yes
Cyclone separator(s)
Cyclone separators remove solids from the air stream by application of centrifugal force. In solid fuel combustion devices like hog fuel boilers, they are commonly used to remove large particles prior to the flue gas entering smaller particle control devices such as baghouses or ESPs. Multi-cyclones are capable of effectively removing particles down to approximately 3 micrometers.3
Yes Yes
Settling chambers
Similar to cyclone separators, settling chambers are used to remove large particles prior to the flue gas entering smaller particle control devices. However, whereas cyclone separators use centrifugal force, settling chambers use gravitational force and are limited to removal of particles larger than about 40-60 micrometers.3
Yes Yes
Wet scrubber
Wet scrubbers intercept dust particles using droplets of liquid (usually water). The larger, particle-enclosing water droplets are separated from the remaining droplets by gravity. The solid particulates are then separated from the water.
Yes Yes
ESP (dry)
An electrostatic precipitator (ESP) removes particles from an air stream by electrically charging the particles, then passing them through a force field that causes them to migrate to an oppositely charged collector plate. An ESP generally refers to a dry ESP unless specifically noted otherwise. The dust from the collector plates falls into a collection hopper at the bottom of the ESP. The collection
Yes Yes
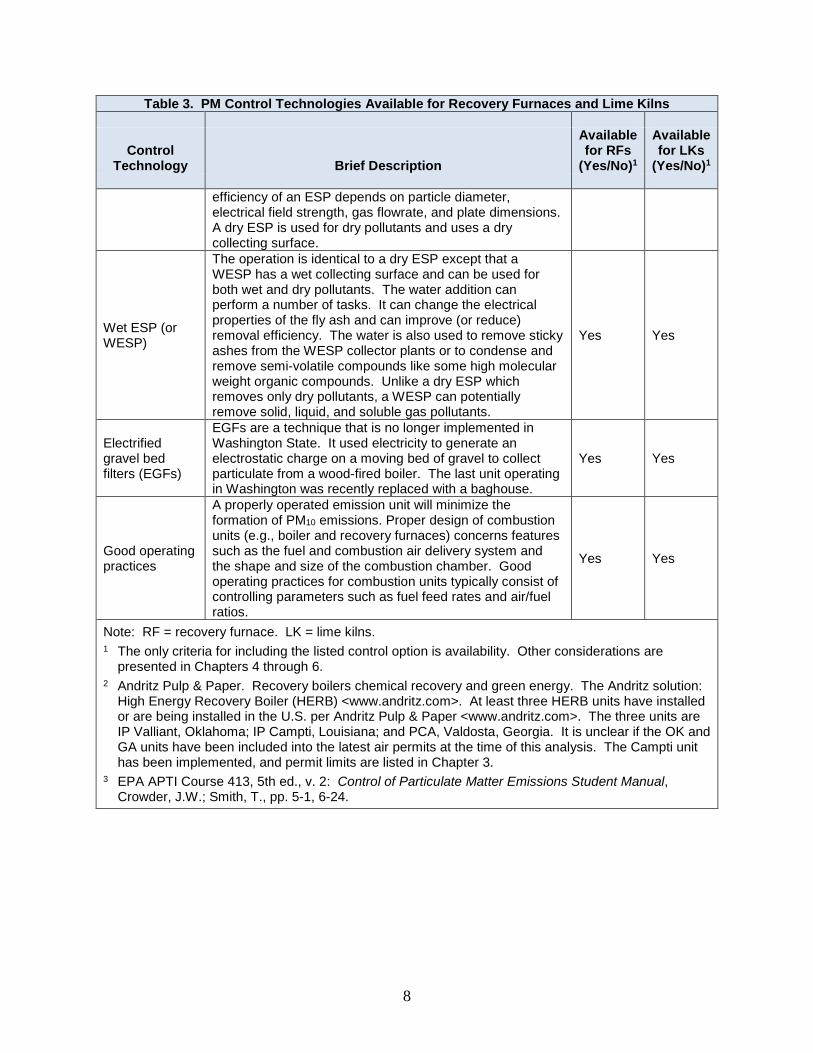
8
Table 3. PM Control Technologies Available for Recovery Furnaces and Lime Kilns
Control Technology Brief Description
Available for RFs
(Yes/No)1
Available for LKs
(Yes/No)1
efficiency of an ESP depends on particle diameter, electrical field strength, gas flowrate, and plate dimensions. A dry ESP is used for dry pollutants and uses a dry collecting surface.
Wet ESP (or WESP)
The operation is identical to a dry ESP except that a WESP has a wet collecting surface and can be used for both wet and dry pollutants. The water addition can perform a number of tasks. It can change the electrical properties of the fly ash and can improve (or reduce) removal efficiency. The water is also used to remove sticky ashes from the WESP collector plants or to condense and remove semi-volatile compounds like some high molecular weight organic compounds. Unlike a dry ESP which removes only dry pollutants, a WESP can potentially remove solid, liquid, and soluble gas pollutants.
Yes Yes
Electrified gravel bed filters (EGFs)
EGFs are a technique that is no longer implemented in Washington State. It used electricity to generate an electrostatic charge on a moving bed of gravel to collect particulate from a wood-fired boiler. The last unit operating in Washington was recently replaced with a baghouse.
Yes Yes
Good operating practices
A properly operated emission unit will minimize the formation of PM10 emissions. Proper design of combustion units (e.g., boiler and recovery furnaces) concerns features such as the fuel and combustion air delivery system and the shape and size of the combustion chamber. Good operating practices for combustion units typically consist of controlling parameters such as fuel feed rates and air/fuel ratios.
Yes Yes
Note: RF = recovery furnace. LK = lime kilns. 1 The only criteria for including the listed control option is availability. Other considerations are
presented in Chapters 4 through 6. 2 Andritz Pulp & Paper. Recovery boilers chemical recovery and green energy. The Andritz solution:
High Energy Recovery Boiler (HERB) <www.andritz.com>. At least three HERB units have installed or are being installed in the U.S. per Andritz Pulp & Paper <www.andritz.com>. The three units are IP Valliant, Oklahoma; IP Campti, Louisiana; and PCA, Valdosta, Georgia. It is unclear if the OK and GA units have been included into the latest air permits at the time of this analysis. The Campti unit has been implemented, and permit limits are listed in Chapter 3.
3 EPA APTI Course 413, 5th ed., v. 2: Control of Particulate Matter Emissions Student Manual, Crowder, J.W.; Smith, T., pp. 5-1, 6-24.
9
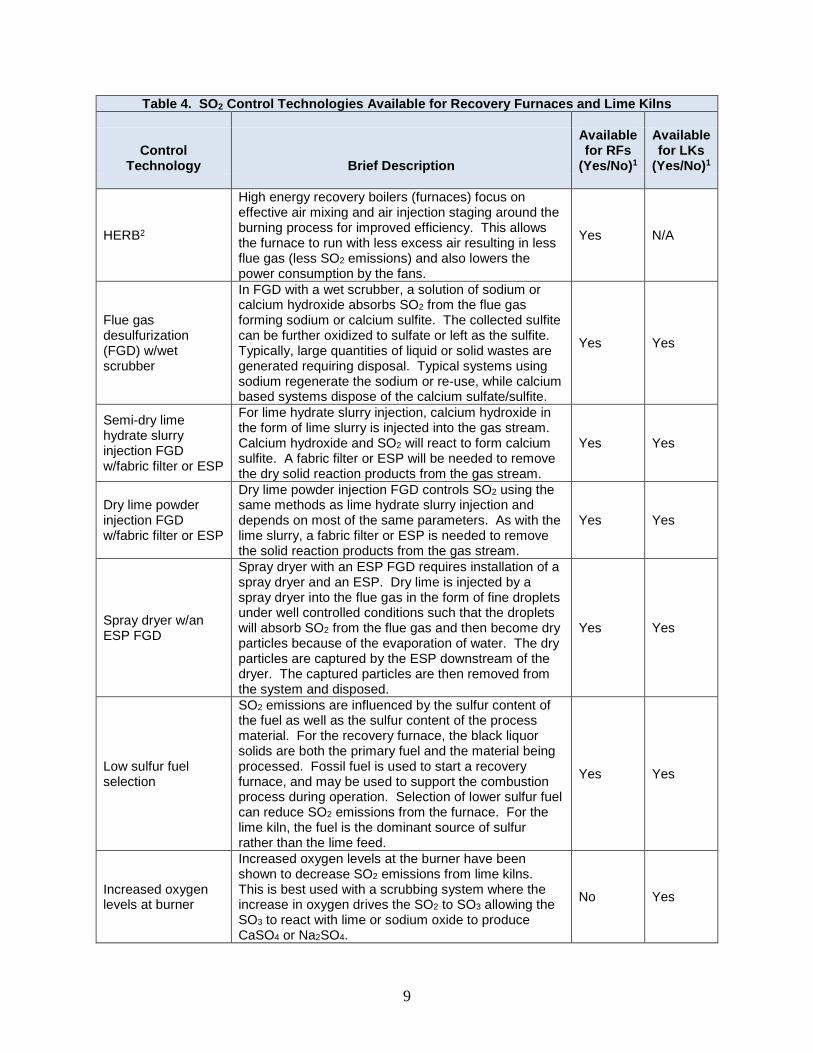
Table 4. SO2 Control Technologies Available for Recovery Furnaces and Lime Kilns
Control Technology Brief Description
Available for RFs
(Yes/No)1
Available for LKs
(Yes/No)1
HERB2
High energy recovery boilers (furnaces) focus on effective air mixing and air injection staging around the burning process for improved efficiency. This allows the furnace to run with less excess air resulting in less flue gas (less SO2 emissions) and also lowers the power consumption by the fans.
Yes N/A
Flue gas desulfurization (FGD) w/wet scrubber
In FGD with a wet scrubber, a solution of sodium or calcium hydroxide absorbs SO2 from the flue gas forming sodium or calcium sulfite. The collected sulfite can be further oxidized to sulfate or left as the sulfite. Typically, large quantities of liquid or solid wastes are generated requiring disposal. Typical systems using sodium regenerate the sodium or re-use, while calcium based systems dispose of the calcium sulfate/sulfite.
Yes Yes
Semi-dry lime hydrate slurry injection FGD w/fabric filter or ESP
For lime hydrate slurry injection, calcium hydroxide in the form of lime slurry is injected into the gas stream. Calcium hydroxide and SO2 will react to form calcium sulfite. A fabric filter or ESP will be needed to remove the dry solid reaction products from the gas stream.
Yes Yes
Dry lime powder injection FGD w/fabric filter or ESP
Dry lime powder injection FGD controls SO2 using the same methods as lime hydrate slurry injection and depends on most of the same parameters. As with the lime slurry, a fabric filter or ESP is needed to remove the solid reaction products from the gas stream.
Yes Yes
Spray dryer w/an ESP FGD
Spray dryer with an ESP FGD requires installation of a spray dryer and an ESP. Dry lime is injected by a spray dryer into the flue gas in the form of fine droplets under well controlled conditions such that the droplets will absorb SO2 from the flue gas and then become dry particles because of the evaporation of water. The dry particles are captured by the ESP downstream of the dryer. The captured particles are then removed from the system and disposed.
Yes Yes
Low sulfur fuel selection
SO2 emissions are influenced by the sulfur content of the fuel as well as the sulfur content of the process material. For the recovery furnace, the black liquor solids are both the primary fuel and the material being processed. Fossil fuel is used to start a recovery furnace, and may be used to support the combustion process during operation. Selection of lower sulfur fuel can reduce SO2 emissions from the furnace. For the lime kiln, the fuel is the dominant source of sulfur rather than the lime feed.
Yes Yes
Increased oxygen levels at burner
Increased oxygen levels at the burner have been shown to decrease SO2 emissions from lime kilns. This is best used with a scrubbing system where the increase in oxygen drives the SO2 to SO3 allowing the SO3 to react with lime or sodium oxide to produce CaSO4 or Na2SO4.
No Yes
10
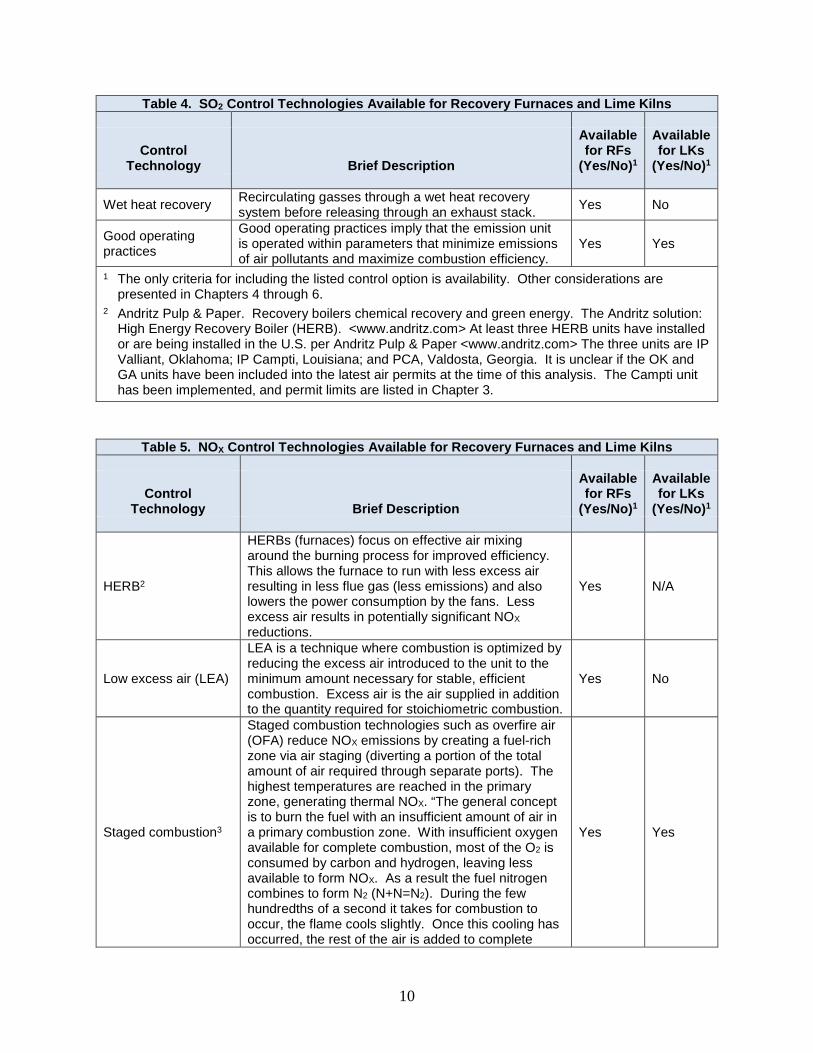
Table 4. SO2 Control Technologies Available for Recovery Furnaces and Lime Kilns
Control Technology Brief Description
Available for RFs
(Yes/No)1
Available for LKs
(Yes/No)1
Wet heat recovery Recirculating gasses through a wet heat recovery system before releasing through an exhaust stack. Yes No
Good operating practices
Good operating practices imply that the emission unit is operated within parameters that minimize emissions of air pollutants and maximize combustion efficiency.
Yes Yes
1 The only criteria for including the listed control option is availability. Other considerations are presented in Chapters 4 through 6.
2 Andritz Pulp & Paper. Recovery boilers chemical recovery and green energy. The Andritz solution: High Energy Recovery Boiler (HERB). <www.andritz.com> At least three HERB units have installed or are being installed in the U.S. per Andritz Pulp & Paper <www.andritz.com> The three units are IP Valliant, Oklahoma; IP Campti, Louisiana; and PCA, Valdosta, Georgia. It is unclear if the OK and GA units have been included into the latest air permits at the time of this analysis. The Campti unit has been implemented, and permit limits are listed in Chapter 3.
Table 5. NOX Control Technologies Available for Recovery Furnaces and Lime Kilns
Control Technology Brief Description
Available for RFs
(Yes/No)1
Available for LKs
(Yes/No)1
HERB2
HERBs (furnaces) focus on effective air mixing around the burning process for improved efficiency. This allows the furnace to run with less excess air resulting in less flue gas (less emissions) and also lowers the power consumption by the fans. Less excess air results in potentially significant NOX reductions.
Yes N/A
Low excess air (LEA)
LEA is a technique where combustion is optimized by reducing the excess air introduced to the unit to the minimum amount necessary for stable, efficient combustion. Excess air is the air supplied in addition to the quantity required for stoichiometric combustion.
Yes No
Staged combustion3
Staged combustion technologies such as overfire air (OFA) reduce NOX emissions by creating a fuel-rich zone via air staging (diverting a portion of the total amount of air required through separate ports). The highest temperatures are reached in the primary zone, generating thermal NOX. “The general concept is to burn the fuel with an insufficient amount of air in a primary combustion zone. With insufficient oxygen available for complete combustion, most of the O2 is consumed by carbon and hydrogen, leaving less available to form NOX. As a result the fuel nitrogen combines to form N2 (N+N=N2). During the few hundredths of a second it takes for combustion to occur, the flame cools slightly. Once this cooling has occurred, the rest of the air is added to complete
Yes Yes
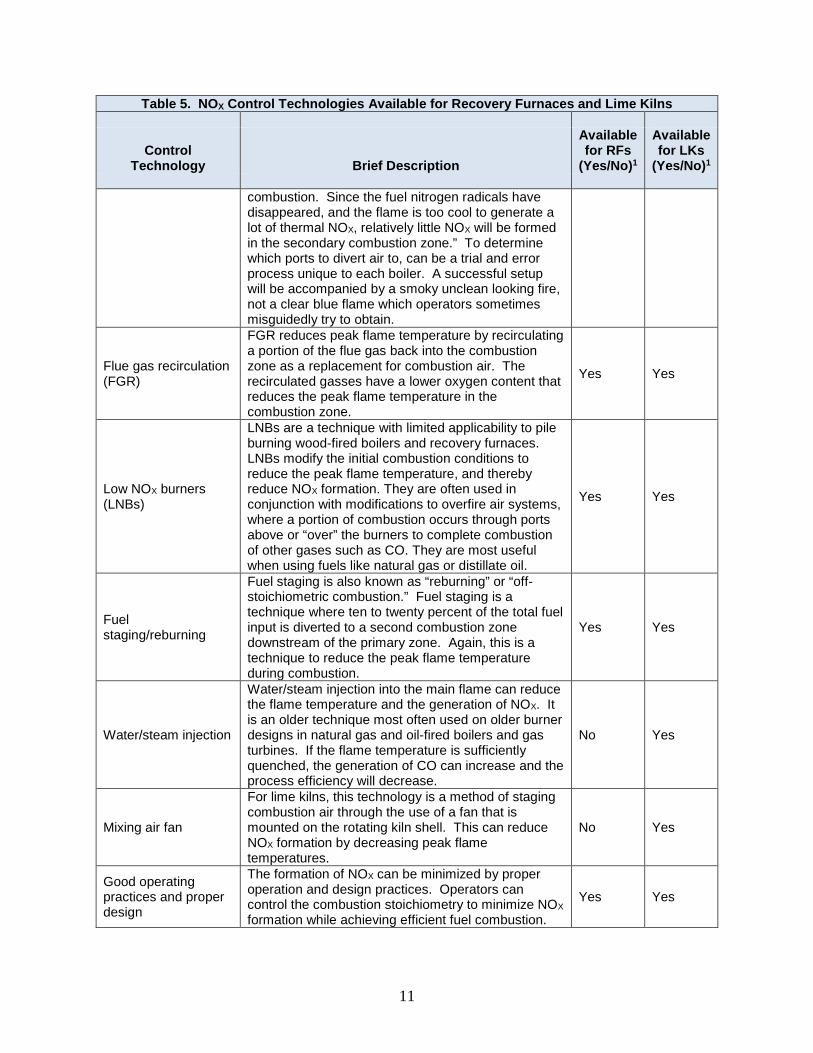
11
Table 5. NOX Control Technologies Available for Recovery Furnaces and Lime Kilns
Control Technology Brief Description
Available for RFs
(Yes/No)1
Available for LKs
(Yes/No)1
combustion. Since the fuel nitrogen radicals have disappeared, and the flame is too cool to generate a lot of thermal NOX, relatively little NOX will be formed in the secondary combustion zone.” To determine which ports to divert air to, can be a trial and error process unique to each boiler. A successful setup will be accompanied by a smoky unclean looking fire, not a clear blue flame which operators sometimes misguidedly try to obtain.
Flue gas recirculation (FGR)
FGR reduces peak flame temperature by recirculating a portion of the flue gas back into the combustion zone as a replacement for combustion air. The recirculated gasses have a lower oxygen content that reduces the peak flame temperature in the combustion zone.
Yes Yes
Low NOX burners (LNBs)
LNBs are a technique with limited applicability to pile burning wood-fired boilers and recovery furnaces. LNBs modify the initial combustion conditions to reduce the peak flame temperature, and thereby reduce NOX formation. They are often used in conjunction with modifications to overfire air systems, where a portion of combustion occurs through ports above or “over” the burners to complete combustion of other gases such as CO. They are most useful when using fuels like natural gas or distillate oil.
Yes Yes
Fuel staging/reburning
Fuel staging is also known as “reburning” or “off-stoichiometric combustion.” Fuel staging is a technique where ten to twenty percent of the total fuel input is diverted to a second combustion zone downstream of the primary zone. Again, this is a technique to reduce the peak flame temperature during combustion.
Yes Yes
Water/steam injection
Water/steam injection into the main flame can reduce the flame temperature and the generation of NOX. It is an older technique most often used on older burner designs in natural gas and oil-fired boilers and gas turbines. If the flame temperature is sufficiently quenched, the generation of CO can increase and the process efficiency will decrease.
No Yes
Mixing air fan
For lime kilns, this technology is a method of staging combustion air through the use of a fan that is mounted on the rotating kiln shell. This can reduce NOX formation by decreasing peak flame temperatures.
No Yes
Good operating practices and proper design
The formation of NOX can be minimized by proper operation and design practices. Operators can control the combustion stoichiometry to minimize NOX formation while achieving efficient fuel combustion.
Yes Yes
12
Table 5. NOX Control Technologies Available for Recovery Furnaces and Lime Kilns
Control Technology Brief Description
Available for RFs
(Yes/No)1
Available for LKs
(Yes/No)1
This is the most basic combustion modification technique available.
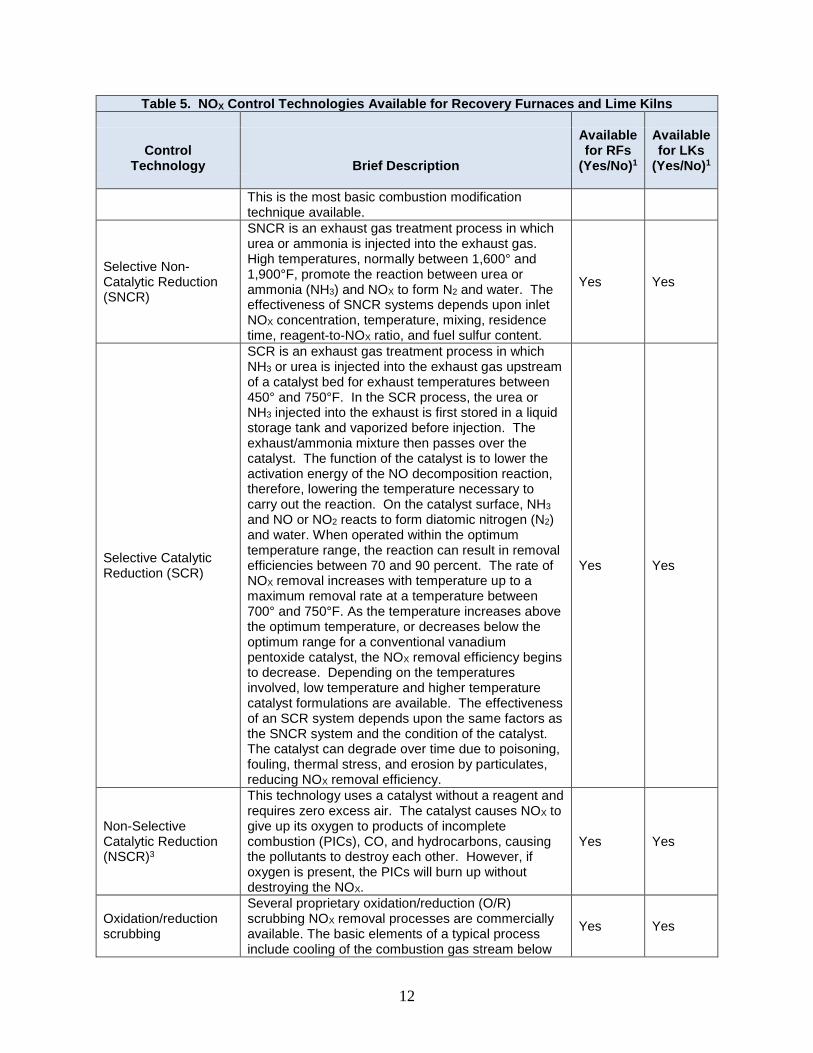
Selective Non-Catalytic Reduction (SNCR)
SNCR is an exhaust gas treatment process in which urea or ammonia is injected into the exhaust gas. High temperatures, normally between 1,600° and 1,900°F, promote the reaction between urea or ammonia (NH3) and NOX to form N2 and water. The effectiveness of SNCR systems depends upon inlet NOX concentration, temperature, mixing, residence time, reagent-to-NOX ratio, and fuel sulfur content.
Yes Yes
Selective Catalytic Reduction (SCR)
SCR is an exhaust gas treatment process in which NH3 or urea is injected into the exhaust gas upstream of a catalyst bed for exhaust temperatures between 450° and 750°F. In the SCR process, the urea or NH3 injected into the exhaust is first stored in a liquid storage tank and vaporized before injection. The exhaust/ammonia mixture then passes over the catalyst. The function of the catalyst is to lower the activation energy of the NO decomposition reaction, therefore, lowering the temperature necessary to carry out the reaction. On the catalyst surface, NH3 and NO or NO2 reacts to form diatomic nitrogen (N2) and water. When operated within the optimum temperature range, the reaction can result in removal efficiencies between 70 and 90 percent. The rate of NOX removal increases with temperature up to a maximum removal rate at a temperature between 700° and 750°F. As the temperature increases above the optimum temperature, or decreases below the optimum range for a conventional vanadium pentoxide catalyst, the NOX removal efficiency begins to decrease. Depending on the temperatures involved, low temperature and higher temperature catalyst formulations are available. The effectiveness of an SCR system depends upon the same factors as the SNCR system and the condition of the catalyst. The catalyst can degrade over time due to poisoning, fouling, thermal stress, and erosion by particulates, reducing NOX removal efficiency.
Yes Yes
Non-Selective Catalytic Reduction (NSCR)3
This technology uses a catalyst without a reagent and requires zero excess air. The catalyst causes NOX to give up its oxygen to products of incomplete combustion (PICs), CO, and hydrocarbons, causing the pollutants to destroy each other. However, if oxygen is present, the PICs will burn up without destroying the NOX.
Yes Yes
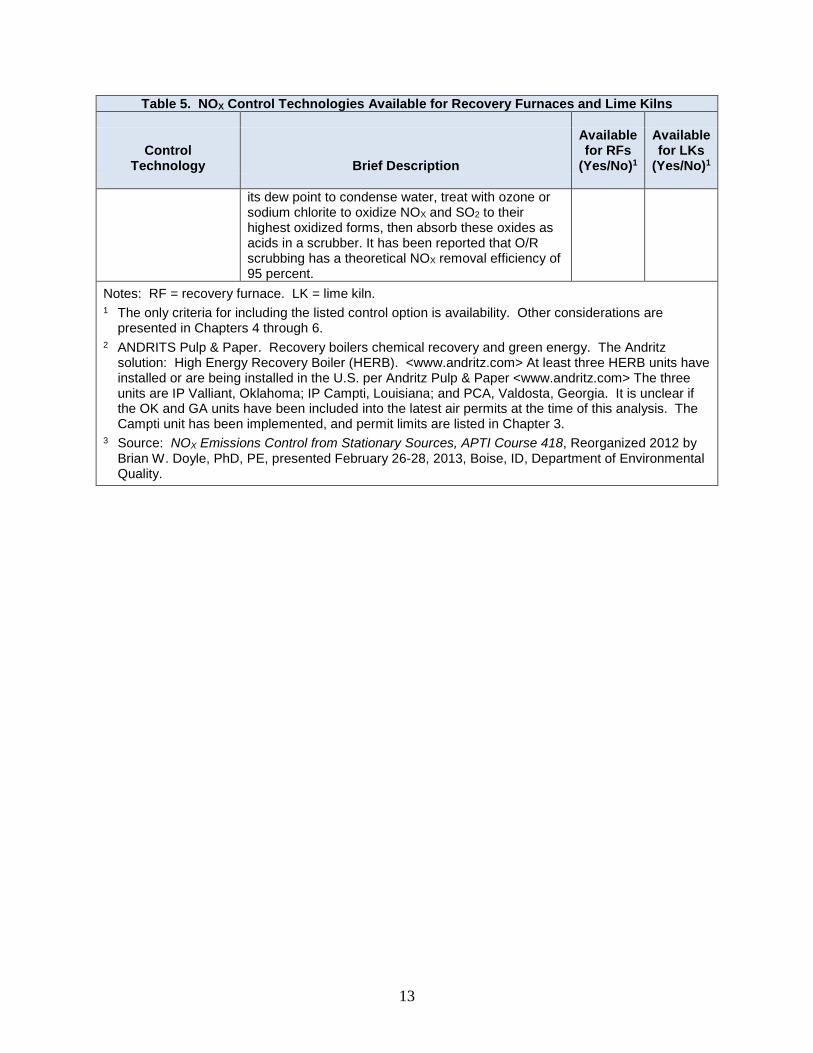
Oxidation/reduction scrubbing
Several proprietary oxidation/reduction (O/R) scrubbing NOX removal processes are commercially available. The basic elements of a typical process include cooling of the combustion gas stream below
Yes Yes
13
Table 5. NOX Control Technologies Available for Recovery Furnaces and Lime Kilns
Control Technology Brief Description
Available for RFs
(Yes/No)1
Available for LKs
(Yes/No)1
its dew point to condense water, treat with ozone or sodium chlorite to oxidize NOX and SO2 to their highest oxidized forms, then absorb these oxides as acids in a scrubber. It has been reported that O/R scrubbing has a theoretical NOX removal efficiency of 95 percent.
Notes: RF = recovery furnace. LK = lime kiln. 1 The only criteria for including the listed control option is availability. Other considerations are
presented in Chapters 4 through 6. 2 ANDRITS Pulp & Paper. Recovery boilers chemical recovery and green energy. The Andritz
solution: High Energy Recovery Boiler (HERB). <www.andritz.com> At least three HERB units have installed or are being installed in the U.S. per Andritz Pulp & Paper <www.andritz.com> The three units are IP Valliant, Oklahoma; IP Campti, Louisiana; and PCA, Valdosta, Georgia. It is unclear if the OK and GA units have been included into the latest air permits at the time of this analysis. The Campti unit has been implemented, and permit limits are listed in Chapter 3.
3 Source: NOX Emissions Control from Stationary Sources, APTI Course 418, Reorganized 2012 by Brian W. Doyle, PhD, PE, presented February 26-28, 2013, Boise, ID, Department of Environmental Quality.
14
3. Demonstrated Emission Limits for Recovery Furnaces and Lime Kilns
This chapter presents a survey of demonstrated emission limits for recovery furnaces and lime kilns at existing mills in Washington State. The emission limits are presented in Sections 3.1–3.3, and provide a basis for estimating the potential emission reductions presented in Chapter 4. April 14, 2014, New Source Performance Standards (NSPS) applicable to U.S. Kraft mill recovery furnaces and lime kilns equipped with electrostatic precipitators (ESPs) are also listed in the tables of Sections 3.1–3.3. The provisions for RACT analysis provided in Sections 1.2 and 1.3 do not restrict consideration of emission limits that are being achieved to only those pulp and paper mills in Washington State. Therefore, while this survey emphasized emission limits that have been demonstrated in Washington State, it also includes information about various pulp and paper mills in other states and also in Canada and Europe. This survey does not include all pulp and paper mills currently in operation, but provides a general framework for emission limits that are being achieved by the individual mills listed based on facility permit information and technical support documents. During this analysis some mills may have discontinued operations or have changed names. This analysis has tried to provide the latest information and includes updated name changes or mill closure information where known. Concentration based limits in grains per dry standard cubic feet (gr/dscf) and also parts per million (ppm), where provided, were used to compare emission limits between facilities. In some cases, Ecology had to convert units for facilities that use different units. European Kraft pulp and paper mill information was obtained from the Integrated Pollution Prevention Control (ICCP) Reference Document on Best Available Techniques [BAT] in the [Kraft] Pulp and Paper Industry, December 2001, European Commission. As noted in the ICCP report, “a direct comparison of the emission levels between countries is difficult due to uncertainties in the basis of data (lack of harmonization in the methods of analysis and calculating emissions).” Unit conversions that Ecology estimated from BAT information, are approximately similar to BAT unit conversions performed by the National Council of Air and Stream Improvement (NCASI). Unit conversion calculations and facility permit limits are provided in Appendix A.
3.1. Demonstrated PM emission limits for recovery furnaces and lime kilns
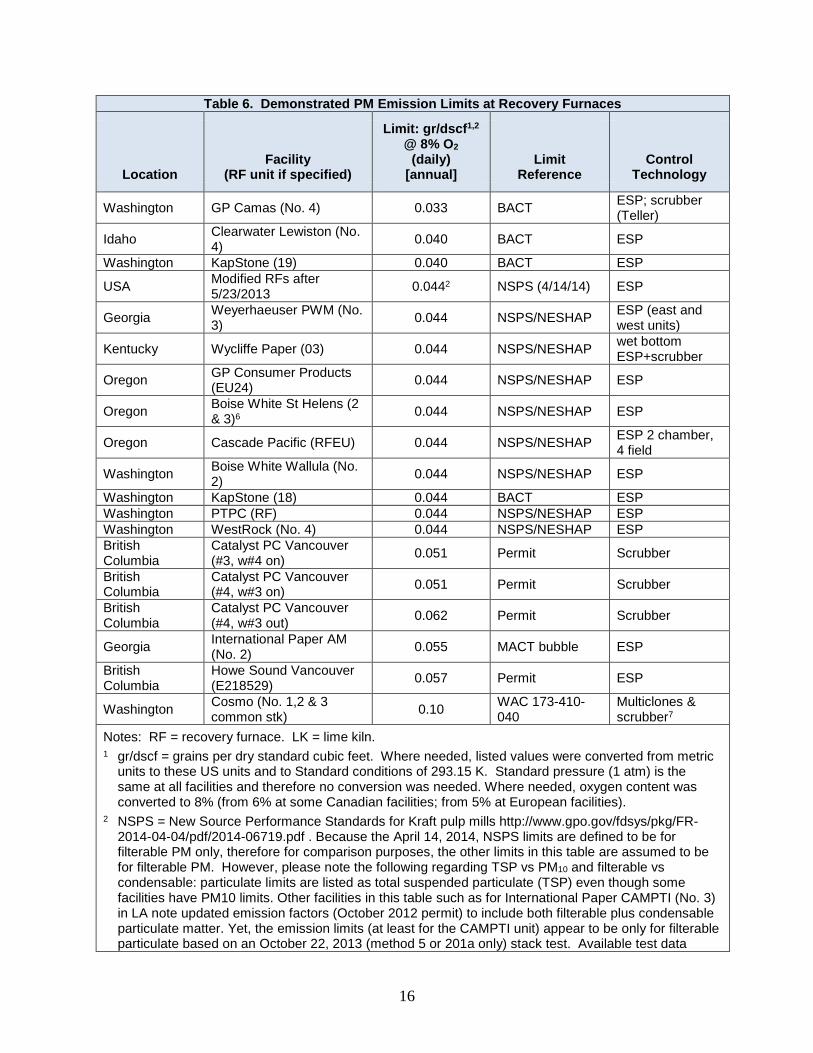
Table 6 provides a survey of demonstrated recovery furnace emission limits in Washington State and at randomly selected facilities in the U.S., Canada, and Europe. Canadian and European units have been converted to the listed unit for each limit. In most cases it is not known if the units in Section 3.1 are new, rebuilt, or modified, but information is provided where known. If a limit is required by a rule, the rule is listed under the column titled “Limit Reference.”
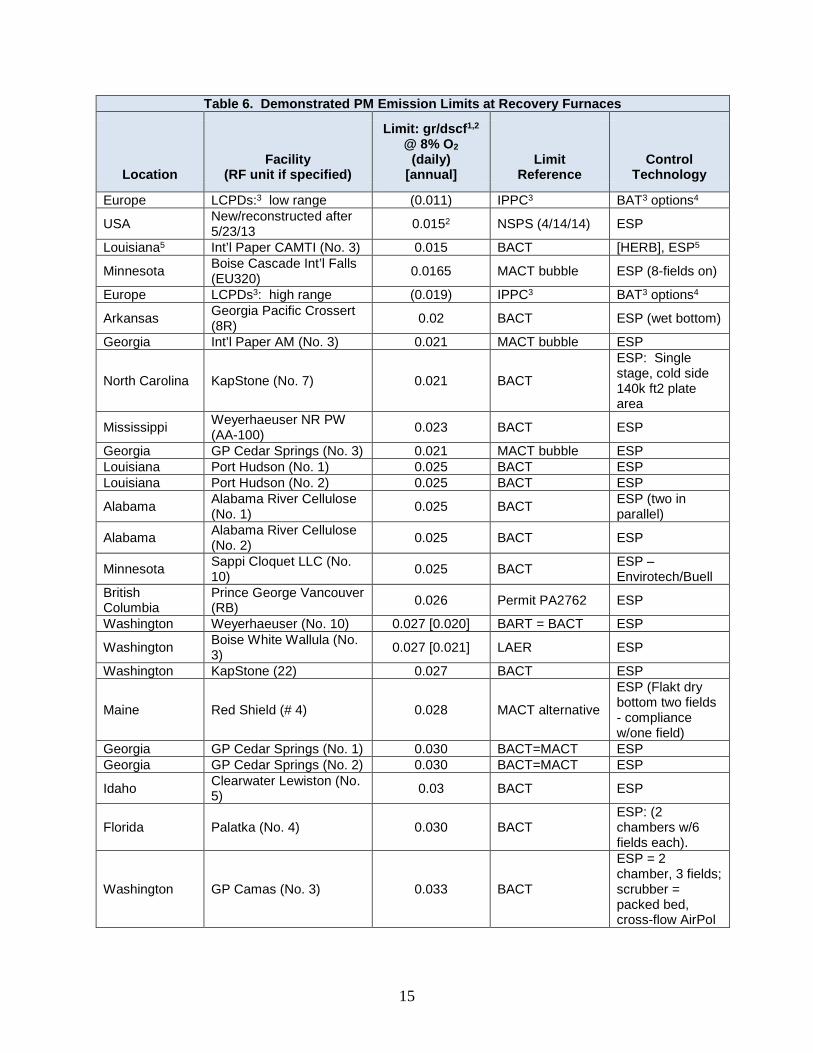
15
Table 6. Demonstrated PM Emission Limits at Recovery Furnaces
Location Facility
(RF unit if specified)
Limit: gr/dscf1,2 @ 8% O2
(daily) [annual]
Limit Reference
Control Technology
Europe LCPDs:3 low range (0.011) IPPC3 BAT3 options4
USA New/reconstructed after 5/23/13 0.0152 NSPS (4/14/14) ESP
Louisiana5 Int’l Paper CAMTI (No. 3) 0.015 BACT [HERB], ESP5
Minnesota Boise Cascade Int’l Falls (EU320) 0.0165 MACT bubble ESP (8-fields on)
Europe LCPDs3: high range (0.019) IPPC3 BAT3 options4
Arkansas Georgia Pacific Crossert (8R) 0.02 BACT ESP (wet bottom)
Georgia Int’l Paper AM (No. 3) 0.021 MACT bubble ESP
North Carolina KapStone (No. 7) 0.021 BACT
ESP: Single stage, cold side 140k ft2 plate area
Mississippi Weyerhaeuser NR PW (AA-100) 0.023 BACT ESP
Georgia GP Cedar Springs (No. 3) 0.021 MACT bubble ESP Louisiana Port Hudson (No. 1) 0.025 BACT ESP Louisiana Port Hudson (No. 2) 0.025 BACT ESP
Alabama Alabama River Cellulose (No. 1) 0.025 BACT ESP (two in
parallel)
Alabama Alabama River Cellulose (No. 2) 0.025 BACT ESP
Minnesota Sappi Cloquet LLC (No. 10) 0.025 BACT ESP –
Envirotech/Buell British Columbia
Prince George Vancouver (RB) 0.026 Permit PA2762 ESP
Washington Weyerhaeuser (No. 10) 0.027 [0.020] BART = BACT ESP
Washington Boise White Wallula (No. 3) 0.027 [0.021] LAER ESP
Washington KapStone (22) 0.027 BACT ESP
Maine Red Shield (# 4) 0.028 MACT alternative
ESP (Flakt dry bottom two fields - compliance w/one field)
Georgia GP Cedar Springs (No. 1) 0.030 BACT=MACT ESP Georgia GP Cedar Springs (No. 2) 0.030 BACT=MACT ESP
Idaho Clearwater Lewiston (No. 5) 0.03 BACT ESP
Florida Palatka (No. 4) 0.030 BACT ESP: (2 chambers w/6 fields each).
Washington GP Camas (No. 3) 0.033 BACT
ESP = 2 chamber, 3 fields; scrubber = packed bed, cross-flow AirPol
16
Table 6. Demonstrated PM Emission Limits at Recovery Furnaces
Location Facility
(RF unit if specified)
Limit: gr/dscf1,2 @ 8% O2
(daily) [annual]
Limit Reference
Control Technology
Washington GP Camas (No. 4) 0.033 BACT ESP; scrubber
(Teller)
Idaho Clearwater Lewiston (No. 4) 0.040 BACT ESP
Washington KapStone (19) 0.040 BACT ESP
USA Modified RFs after 5/23/2013 0.0442 NSPS (4/14/14) ESP
Georgia Weyerhaeuser PWM (No. 3) 0.044 NSPS/NESHAP ESP (east and
west units)
Kentucky Wycliffe Paper (03) 0.044 NSPS/NESHAP wet bottom ESP+scrubber
Oregon GP Consumer Products (EU24) 0.044 NSPS/NESHAP ESP
Oregon Boise White St Helens (2 & 3)6 0.044 NSPS/NESHAP ESP
Oregon Cascade Pacific (RFEU) 0.044 NSPS/NESHAP ESP 2 chamber, 4 field
Washington Boise White Wallula (No. 2) 0.044 NSPS/NESHAP ESP
Washington KapStone (18) 0.044 BACT ESP Washington PTPC (RF) 0.044 NSPS/NESHAP ESP Washington WestRock (No. 4) 0.044 NSPS/NESHAP ESP British Columbia
Catalyst PC Vancouver (#3, w#4 on) 0.051 Permit Scrubber
British Columbia
Catalyst PC Vancouver (#4, w#3 on) 0.051 Permit Scrubber
British Columbia
Catalyst PC Vancouver (#4, w#3 out) 0.062 Permit Scrubber
Georgia International Paper AM (No. 2) 0.055 MACT bubble ESP
British Columbia
Howe Sound Vancouver (E218529) 0.057 Permit ESP
Washington Cosmo (No. 1,2 & 3 common stk) 0.10 WAC 173-410-
040 Multiclones & scrubber7
Notes: RF = recovery furnace. LK = lime kiln. 1 gr/dscf = grains per dry standard cubic feet. Where needed, listed values were converted from metric
units to these US units and to Standard conditions of 293.15 K. Standard pressure (1 atm) is the same at all facilities and therefore no conversion was needed. Where needed, oxygen content was converted to 8% (from 6% at some Canadian facilities; from 5% at European facilities).
2 NSPS = New Source Performance Standards for Kraft pulp mills http://www.gpo.gov/fdsys/pkg/FR-2014-04-04/pdf/2014-06719.pdf . Because the April 14, 2014, NSPS limits are defined to be for filterable PM only, therefore for comparison purposes, the other limits in this table are assumed to be for filterable PM. However, please note the following regarding TSP vs PM10 and filterable vs condensable: particulate limits are listed as total suspended particulate (TSP) even though some facilities have PM10 limits. Other facilities in this table such as for International Paper CAMPTI (No. 3) in LA note updated emission factors (October 2012 permit) to include both filterable plus condensable particulate matter. Yet, the emission limits (at least for the CAMPTI unit) appear to be only for filterable particulate based on an October 22, 2013 (method 5 or 201a only) stack test. Available test data
17
Table 6. Demonstrated PM Emission Limits at Recovery Furnaces
Location Facility
(RF unit if specified)
Limit: gr/dscf1,2 @ 8% O2
(daily) [annual]
Limit Reference
Control Technology
showing compliance for the Boise Cascade Int'l Falls, MN (EU320) limit included both filterable and condensable particulate matter.
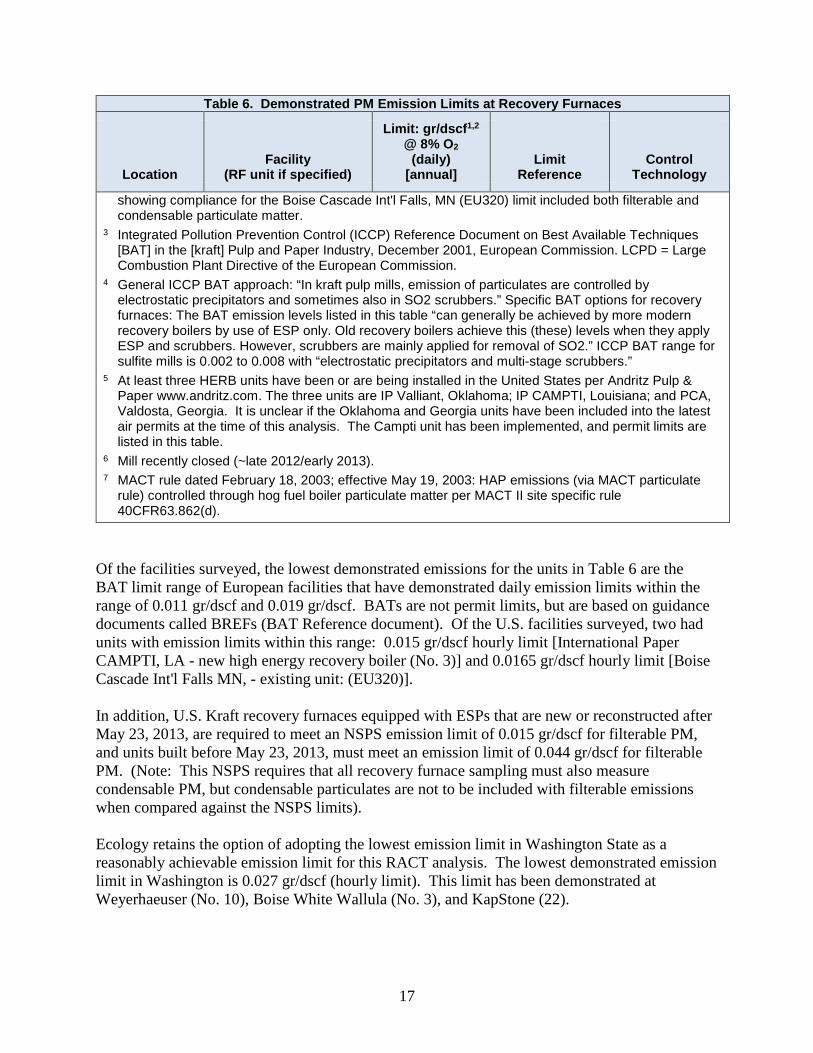
3 Integrated Pollution Prevention Control (ICCP) Reference Document on Best Available Techniques [BAT] in the [kraft] Pulp and Paper Industry, December 2001, European Commission. LCPD = Large Combustion Plant Directive of the European Commission.
4 General ICCP BAT approach: “In kraft pulp mills, emission of particulates are controlled by electrostatic precipitators and sometimes also in SO2 scrubbers.” Specific BAT options for recovery furnaces: The BAT emission levels listed in this table “can generally be achieved by more modern recovery boilers by use of ESP only. Old recovery boilers achieve this (these) levels when they apply ESP and scrubbers. However, scrubbers are mainly applied for removal of SO2.” ICCP BAT range for sulfite mills is 0.002 to 0.008 with “electrostatic precipitators and multi-stage scrubbers.”
5 At least three HERB units have been or are being installed in the United States per Andritz Pulp & Paper www.andritz.com. The three units are IP Valliant, Oklahoma; IP CAMPTI, Louisiana; and PCA, Valdosta, Georgia. It is unclear if the Oklahoma and Georgia units have been included into the latest air permits at the time of this analysis. The Campti unit has been implemented, and permit limits are listed in this table.
6 Mill recently closed (~late 2012/early 2013). 7 MACT rule dated February 18, 2003; effective May 19, 2003: HAP emissions (via MACT particulate
rule) controlled through hog fuel boiler particulate matter per MACT II site specific rule 40CFR63.862(d).
Of the facilities surveyed, the lowest demonstrated emissions for the units in Table 6 are the BAT limit range of European facilities that have demonstrated daily emission limits within the range of 0.011 gr/dscf and 0.019 gr/dscf. BATs are not permit limits, but are based on guidance documents called BREFs (BAT Reference document). Of the U.S. facilities surveyed, two had units with emission limits within this range: 0.015 gr/dscf hourly limit [International Paper CAMPTI, LA - new high energy recovery boiler (No. 3)] and 0.0165 gr/dscf hourly limit [Boise Cascade Int'l Falls MN, - existing unit: (EU320)]. In addition, U.S. Kraft recovery furnaces equipped with ESPs that are new or reconstructed after May 23, 2013, are required to meet an NSPS emission limit of 0.015 gr/dscf for filterable PM, and units built before May 23, 2013, must meet an emission limit of 0.044 gr/dscf for filterable PM. (Note: This NSPS requires that all recovery furnace sampling must also measure condensable PM, but condensable particulates are not to be included with filterable emissions when compared against the NSPS limits). Ecology retains the option of adopting the lowest emission limit in Washington State as a reasonably achievable emission limit for this RACT analysis. The lowest demonstrated emission limit in Washington is 0.027 gr/dscf (hourly limit). This limit has been demonstrated at Weyerhaeuser (No. 10), Boise White Wallula (No. 3), and KapStone (22).
18
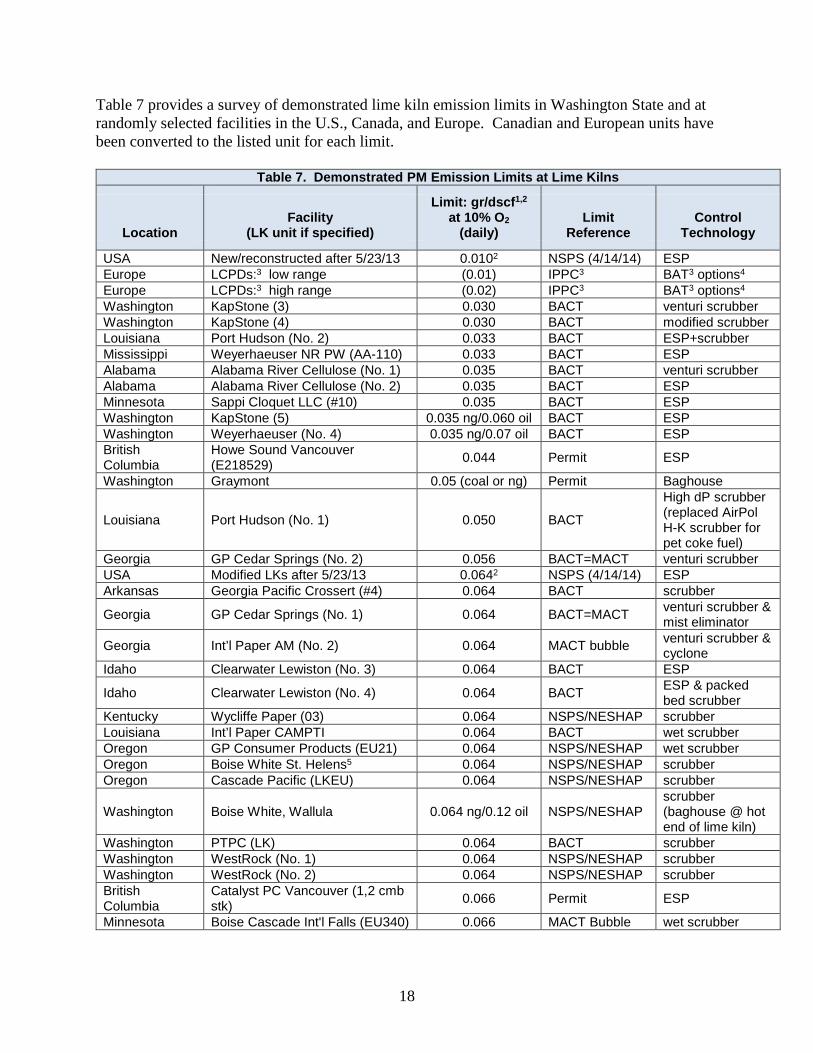
Table 7 provides a survey of demonstrated lime kiln emission limits in Washington State and at randomly selected facilities in the U.S., Canada, and Europe. Canadian and European units have been converted to the listed unit for each limit.
Table 7. Demonstrated PM Emission Limits at Lime Kilns
Location Facility
(LK unit if specified)
Limit: gr/dscf1,2 at 10% O2
(daily) Limit
Reference Control
Technology
USA New/reconstructed after 5/23/13 0.0102 NSPS (4/14/14) ESP Europe LCPDs:3 low range (0.01) IPPC3 BAT3 options4 Europe LCPDs:3 high range (0.02) IPPC3 BAT3 options4 Washington KapStone (3) 0.030 BACT venturi scrubber Washington KapStone (4) 0.030 BACT modified scrubber Louisiana Port Hudson (No. 2) 0.033 BACT ESP+scrubber Mississippi Weyerhaeuser NR PW (AA-110) 0.033 BACT ESP Alabama Alabama River Cellulose (No. 1) 0.035 BACT venturi scrubber Alabama Alabama River Cellulose (No. 2) 0.035 BACT ESP Minnesota Sappi Cloquet LLC (#10) 0.035 BACT ESP Washington KapStone (5) 0.035 ng/0.060 oil BACT ESP Washington Weyerhaeuser (No. 4) 0.035 ng/0.07 oil BACT ESP British Columbia
Howe Sound Vancouver (E218529) 0.044 Permit ESP
Washington Graymont 0.05 (coal or ng) Permit Baghouse
Louisiana Port Hudson (No. 1) 0.050 BACT
High dP scrubber (replaced AirPol H-K scrubber for pet coke fuel)
Georgia GP Cedar Springs (No. 2) 0.056 BACT=MACT venturi scrubber USA Modified LKs after 5/23/13 0.0642 NSPS (4/14/14) ESP Arkansas Georgia Pacific Crossert (#4) 0.064 BACT scrubber
Georgia GP Cedar Springs (No. 1) 0.064 BACT=MACT venturi scrubber & mist eliminator
Georgia Int’l Paper AM (No. 2) 0.064 MACT bubble venturi scrubber & cyclone
Idaho Clearwater Lewiston (No. 3) 0.064 BACT ESP
Idaho Clearwater Lewiston (No. 4) 0.064 BACT ESP & packed bed scrubber
Kentucky Wycliffe Paper (03) 0.064 NSPS/NESHAP scrubber Louisiana Int’l Paper CAMPTI 0.064 BACT wet scrubber Oregon GP Consumer Products (EU21) 0.064 NSPS/NESHAP wet scrubber Oregon Boise White St. Helens5 0.064 NSPS/NESHAP scrubber Oregon Cascade Pacific (LKEU) 0.064 NSPS/NESHAP scrubber
Washington Boise White, Wallula 0.064 ng/0.12 oil NSPS/NESHAP scrubber (baghouse @ hot end of lime kiln)
Washington PTPC (LK) 0.064 BACT scrubber Washington WestRock (No. 1) 0.064 NSPS/NESHAP scrubber Washington WestRock (No. 2) 0.064 NSPS/NESHAP scrubber British Columbia
Catalyst PC Vancouver (1,2 cmb stk) 0.066 Permit ESP
Minnesota Boise Cascade Int'l Falls (EU340) 0.066 MACT Bubble wet scrubber
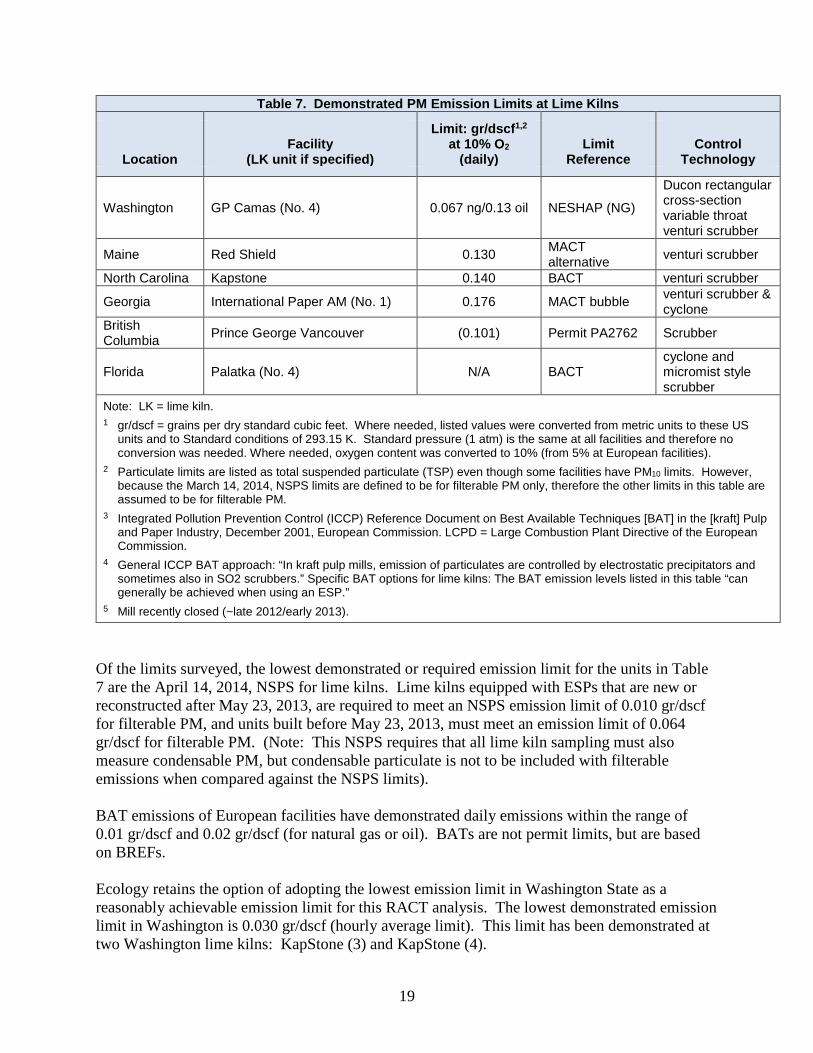
19
Table 7. Demonstrated PM Emission Limits at Lime Kilns
Location Facility
(LK unit if specified)
Limit: gr/dscf1,2 at 10% O2
(daily) Limit
Reference Control
Technology
Washington GP Camas (No. 4) 0.067 ng/0.13 oil NESHAP (NG)
Ducon rectangular cross-section variable throat venturi scrubber
Maine Red Shield 0.130 MACT alternative venturi scrubber
North Carolina Kapstone 0.140 BACT venturi scrubber
Georgia International Paper AM (No. 1) 0.176 MACT bubble venturi scrubber & cyclone
British Columbia Prince George Vancouver (0.101) Permit PA2762 Scrubber
Florida Palatka (No. 4) N/A BACT cyclone and micromist style scrubber
Note: LK = lime kiln. 1 gr/dscf = grains per dry standard cubic feet. Where needed, listed values were converted from metric units to these US
units and to Standard conditions of 293.15 K. Standard pressure (1 atm) is the same at all facilities and therefore no conversion was needed. Where needed, oxygen content was converted to 10% (from 5% at European facilities).
2 Particulate limits are listed as total suspended particulate (TSP) even though some facilities have PM10 limits. However, because the March 14, 2014, NSPS limits are defined to be for filterable PM only, therefore the other limits in this table are assumed to be for filterable PM.
3 Integrated Pollution Prevention Control (ICCP) Reference Document on Best Available Techniques [BAT] in the [kraft] Pulp and Paper Industry, December 2001, European Commission. LCPD = Large Combustion Plant Directive of the European Commission.
4 General ICCP BAT approach: “In kraft pulp mills, emission of particulates are controlled by electrostatic precipitators and sometimes also in SO2 scrubbers.” Specific BAT options for lime kilns: The BAT emission levels listed in this table “can generally be achieved when using an ESP.”
5 Mill recently closed (~late 2012/early 2013).
Of the limits surveyed, the lowest demonstrated or required emission limit for the units in Table 7 are the April 14, 2014, NSPS for lime kilns. Lime kilns equipped with ESPs that are new or reconstructed after May 23, 2013, are required to meet an NSPS emission limit of 0.010 gr/dscf for filterable PM, and units built before May 23, 2013, must meet an emission limit of 0.064 gr/dscf for filterable PM. (Note: This NSPS requires that all lime kiln sampling must also measure condensable PM, but condensable particulate is not to be included with filterable emissions when compared against the NSPS limits). BAT emissions of European facilities have demonstrated daily emissions within the range of 0.01 gr/dscf and 0.02 gr/dscf (for natural gas or oil). BATs are not permit limits, but are based on BREFs. Ecology retains the option of adopting the lowest emission limit in Washington State as a reasonably achievable emission limit for this RACT analysis. The lowest demonstrated emission limit in Washington is 0.030 gr/dscf (hourly average limit). This limit has been demonstrated at two Washington lime kilns: KapStone (3) and KapStone (4).
20
3.2. Demonstrated SO2 emission limits for recovery furnaces and lime kilns
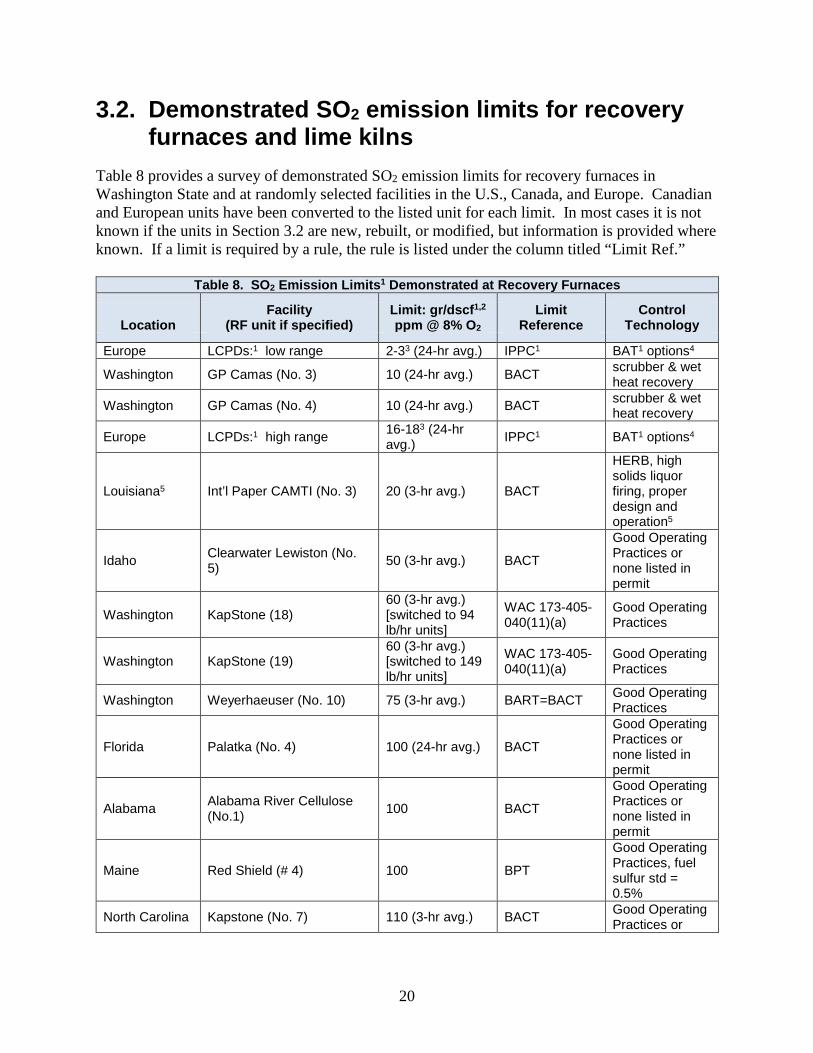
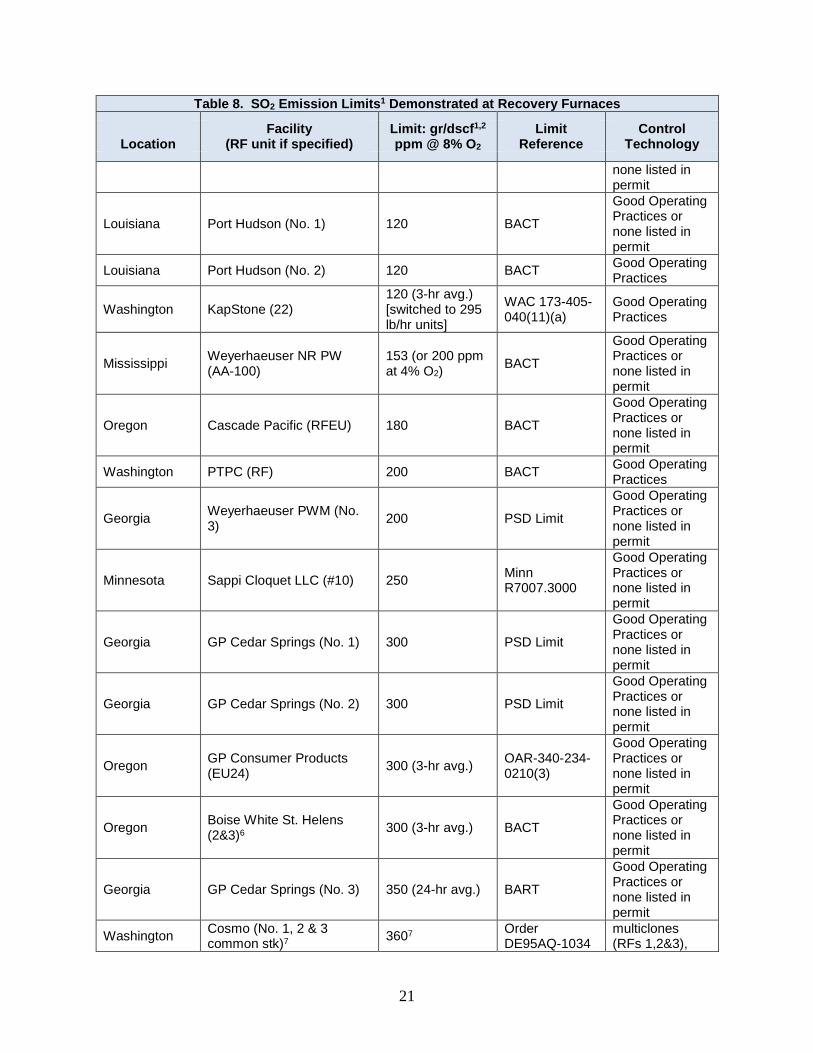
Table 8 provides a survey of demonstrated SO2 emission limits for recovery furnaces in Washington State and at randomly selected facilities in the U.S., Canada, and Europe. Canadian and European units have been converted to the listed unit for each limit. In most cases it is not known if the units in Section 3.2 are new, rebuilt, or modified, but information is provided where known. If a limit is required by a rule, the rule is listed under the column titled “Limit Ref.”
Table 8. SO2 Emission Limits1 Demonstrated at Recovery Furnaces
Location Facility
(RF unit if specified) Limit: gr/dscf1,2 ppm @ 8% O2
Limit Reference
Control Technology
Europe LCPDs:1 low range 2-33 (24-hr avg.) IPPC1 BAT1 options4
Washington GP Camas (No. 3) 10 (24-hr avg.) BACT scrubber & wet heat recovery
Washington GP Camas (No. 4) 10 (24-hr avg.) BACT scrubber & wet heat recovery
Europe LCPDs:1 high range 16-183 (24-hr avg.) IPPC1 BAT1 options4
Louisiana5 Int’l Paper CAMTI (No. 3) 20 (3-hr avg.) BACT
HERB, high solids liquor firing, proper design and operation5
Idaho Clearwater Lewiston (No. 5) 50 (3-hr avg.) BACT
Good Operating Practices or none listed in permit
Washington KapStone (18) 60 (3-hr avg.) [switched to 94 lb/hr units]
WAC 173-405-040(11)(a)
Good Operating Practices
Washington KapStone (19) 60 (3-hr avg.) [switched to 149 lb/hr units]
WAC 173-405-040(11)(a)
Good Operating Practices
Washington Weyerhaeuser (No. 10) 75 (3-hr avg.) BART=BACT Good Operating Practices
Florida Palatka (No. 4) 100 (24-hr avg.) BACT
Good Operating Practices or none listed in permit
Alabama Alabama River Cellulose (No.1) 100 BACT
Good Operating Practices or none listed in permit
Maine Red Shield (# 4) 100 BPT
Good Operating Practices, fuel sulfur std = 0.5%
North Carolina Kapstone (No. 7) 110 (3-hr avg.) BACT Good Operating Practices or
21
Table 8. SO2 Emission Limits1 Demonstrated at Recovery Furnaces
Location Facility
(RF unit if specified) Limit: gr/dscf1,2 ppm @ 8% O2
Limit Reference
Control Technology
none listed in permit
Louisiana Port Hudson (No. 1) 120 BACT
Good Operating Practices or none listed in permit
Louisiana Port Hudson (No. 2) 120 BACT Good Operating Practices
Washington KapStone (22) 120 (3-hr avg.) [switched to 295 lb/hr units]
WAC 173-405-040(11)(a)
Good Operating Practices
Mississippi Weyerhaeuser NR PW (AA-100)
153 (or 200 ppm at 4% O2) BACT
Good Operating Practices or none listed in permit
Oregon Cascade Pacific (RFEU) 180 BACT
Good Operating Practices or none listed in permit
Washington PTPC (RF) 200 BACT Good Operating Practices
Georgia Weyerhaeuser PWM (No. 3) 200 PSD Limit
Good Operating Practices or none listed in permit
Minnesota Sappi Cloquet LLC (#10) 250 Minn R7007.3000
Good Operating Practices or none listed in permit
Georgia GP Cedar Springs (No. 1) 300 PSD Limit
Good Operating Practices or none listed in permit
Georgia GP Cedar Springs (No. 2) 300 PSD Limit
Good Operating Practices or none listed in permit
Oregon GP Consumer Products (EU24) 300 (3-hr avg.) OAR-340-234-
0210(3)
Good Operating Practices or none listed in permit
Oregon Boise White St. Helens (2&3)6 300 (3-hr avg.) BACT
Good Operating Practices or none listed in permit
Georgia GP Cedar Springs (No. 3) 350 (24-hr avg.) BART
Good Operating Practices or none listed in permit
Washington Cosmo (No. 1, 2 & 3 common stk)7 3607 Order
DE95AQ-1034 multiclones (RFs 1,2&3),
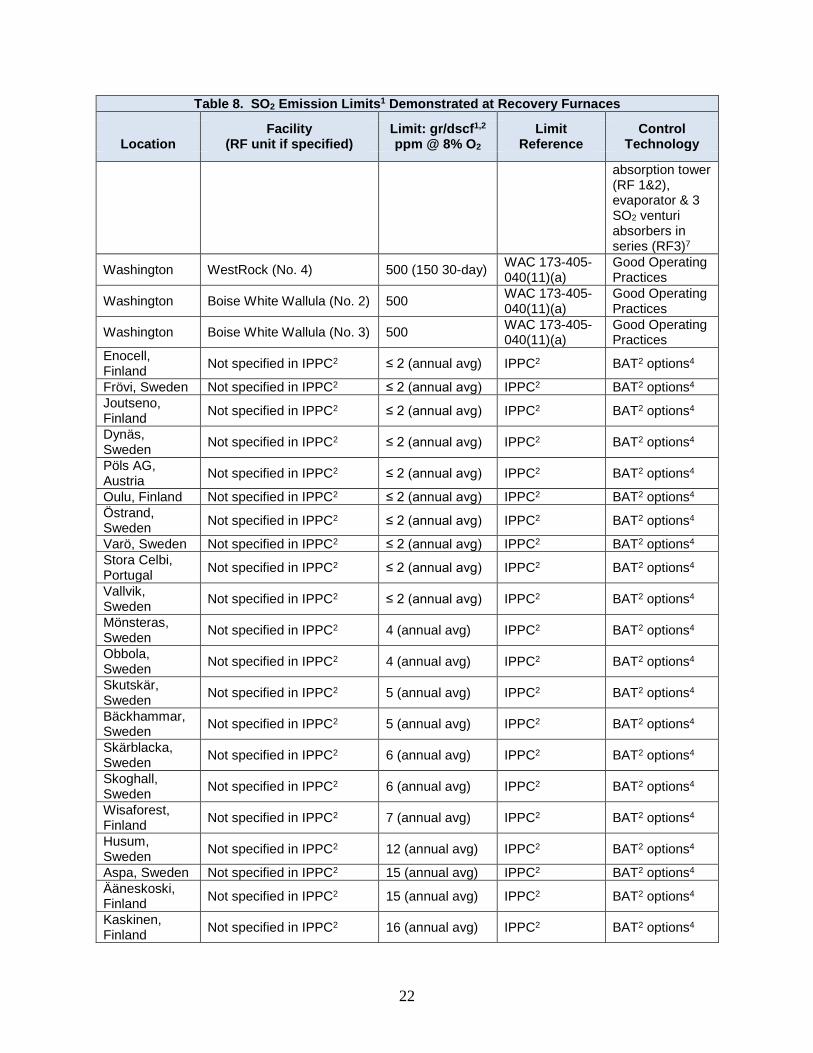
22
Table 8. SO2 Emission Limits1 Demonstrated at Recovery Furnaces
Location Facility
(RF unit if specified) Limit: gr/dscf1,2 ppm @ 8% O2
Limit Reference
Control Technology
absorption tower (RF 1&2), evaporator & 3 SO2 venturi absorbers in series (RF3)7
Washington WestRock (No. 4) 500 (150 30-day) WAC 173-405-040(11)(a)
Good Operating Practices
Washington Boise White Wallula (No. 2) 500 WAC 173-405-040(11)(a)
Good Operating Practices
Washington Boise White Wallula (No. 3) 500 WAC 173-405-040(11)(a)
Good Operating Practices
Enocell, Finland Not specified in IPPC2 ≤ 2 (annual avg) IPPC2 BAT2 options4
Frövi, Sweden Not specified in IPPC2 ≤ 2 (annual avg) IPPC2 BAT2 options4 Joutseno, Finland Not specified in IPPC2 ≤ 2 (annual avg) IPPC2 BAT2 options4
Dynäs, Sweden Not specified in IPPC2 ≤ 2 (annual avg) IPPC2 BAT2 options4
Pöls AG, Austria Not specified in IPPC2 ≤ 2 (annual avg) IPPC2 BAT2 options4
Oulu, Finland Not specified in IPPC2 ≤ 2 (annual avg) IPPC2 BAT2 options4 Östrand, Sweden Not specified in IPPC2 ≤ 2 (annual avg) IPPC2 BAT2 options4
Varö, Sweden Not specified in IPPC2 ≤ 2 (annual avg) IPPC2 BAT2 options4 Stora Celbi, Portugal Not specified in IPPC2 ≤ 2 (annual avg) IPPC2 BAT2 options4
Vallvik, Sweden Not specified in IPPC2 ≤ 2 (annual avg) IPPC2 BAT2 options4
Mönsteras, Sweden Not specified in IPPC2 4 (annual avg) IPPC2 BAT2 options4
Obbola, Sweden Not specified in IPPC2 4 (annual avg) IPPC2 BAT2 options4
Skutskär, Sweden Not specified in IPPC2 5 (annual avg) IPPC2 BAT2 options4
Bäckhammar, Sweden Not specified in IPPC2 5 (annual avg) IPPC2 BAT2 options4
Skärblacka, Sweden Not specified in IPPC2 6 (annual avg) IPPC2 BAT2 options4
Skoghall, Sweden Not specified in IPPC2 6 (annual avg) IPPC2 BAT2 options4
Wisaforest, Finland Not specified in IPPC2 7 (annual avg) IPPC2 BAT2 options4
Husum, Sweden Not specified in IPPC2 12 (annual avg) IPPC2 BAT2 options4
Aspa, Sweden Not specified in IPPC2 15 (annual avg) IPPC2 BAT2 options4 Ääneskoski, Finland Not specified in IPPC2 15 (annual avg) IPPC2 BAT2 options4
Kaskinen, Finland Not specified in IPPC2 16 (annual avg) IPPC2 BAT2 options4
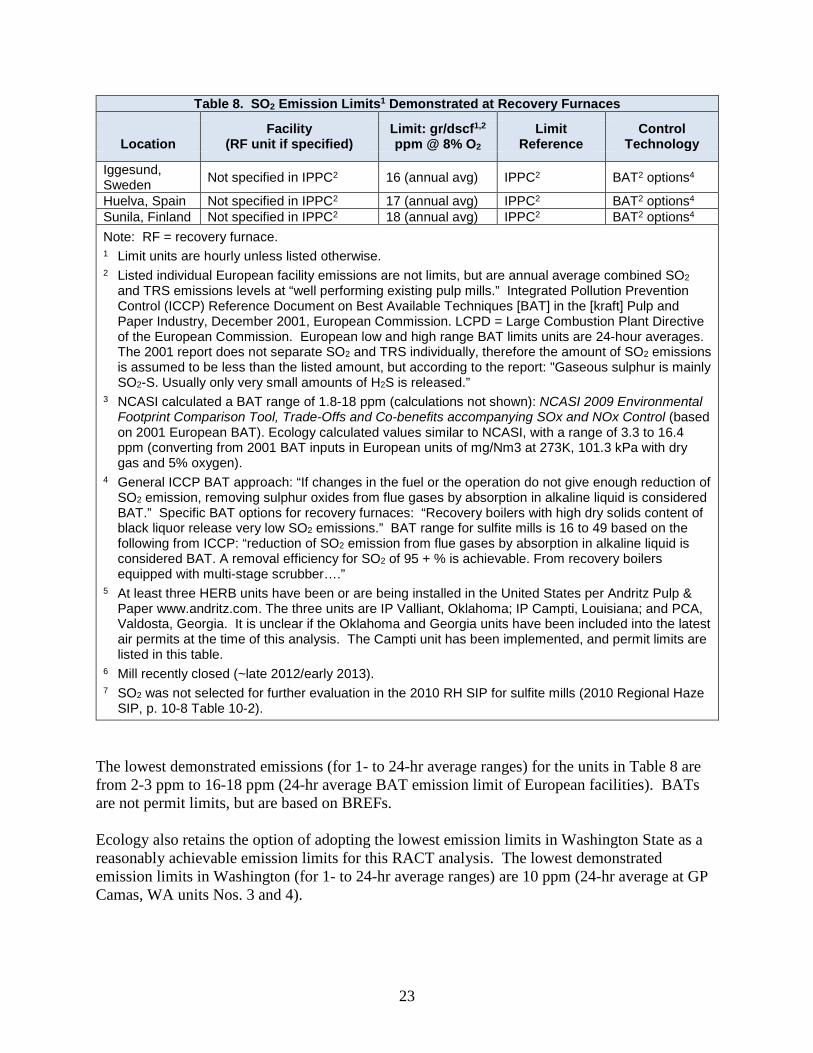
23
Table 8. SO2 Emission Limits1 Demonstrated at Recovery Furnaces
Location Facility
(RF unit if specified) Limit: gr/dscf1,2 ppm @ 8% O2
Limit Reference
Control Technology
Iggesund, Sweden Not specified in IPPC2 16 (annual avg) IPPC2 BAT2 options4
Huelva, Spain Not specified in IPPC2 17 (annual avg) IPPC2 BAT2 options4 Sunila, Finland Not specified in IPPC2 18 (annual avg) IPPC2 BAT2 options4 Note: RF = recovery furnace. 1 Limit units are hourly unless listed otherwise. 2 Listed individual European facility emissions are not limits, but are annual average combined SO2
and TRS emissions levels at “well performing existing pulp mills.” Integrated Pollution Prevention Control (ICCP) Reference Document on Best Available Techniques [BAT] in the [kraft] Pulp and Paper Industry, December 2001, European Commission. LCPD = Large Combustion Plant Directive of the European Commission. European low and high range BAT limits units are 24-hour averages. The 2001 report does not separate SO2 and TRS individually, therefore the amount of SO2 emissions is assumed to be less than the listed amount, but according to the report: "Gaseous sulphur is mainly SO2-S. Usually only very small amounts of H2S is released.”
3 NCASI calculated a BAT range of 1.8-18 ppm (calculations not shown): NCASI 2009 Environmental Footprint Comparison Tool, Trade-Offs and Co-benefits accompanying SOx and NOx Control (based on 2001 European BAT). Ecology calculated values similar to NCASI, with a range of 3.3 to 16.4 ppm (converting from 2001 BAT inputs in European units of mg/Nm3 at 273K, 101.3 kPa with dry gas and 5% oxygen).
4 General ICCP BAT approach: “If changes in the fuel or the operation do not give enough reduction of SO2 emission, removing sulphur oxides from flue gases by absorption in alkaline liquid is considered BAT.” Specific BAT options for recovery furnaces: “Recovery boilers with high dry solids content of black liquor release very low SO2 emissions.” BAT range for sulfite mills is 16 to 49 based on the following from ICCP: “reduction of SO2 emission from flue gases by absorption in alkaline liquid is considered BAT. A removal efficiency for SO2 of 95 + % is achievable. From recovery boilers equipped with multi-stage scrubber….”
5 At least three HERB units have been or are being installed in the United States per Andritz Pulp & Paper www.andritz.com. The three units are IP Valliant, Oklahoma; IP Campti, Louisiana; and PCA, Valdosta, Georgia. It is unclear if the Oklahoma and Georgia units have been included into the latest air permits at the time of this analysis. The Campti unit has been implemented, and permit limits are listed in this table.
6 Mill recently closed (~late 2012/early 2013). 7 SO2 was not selected for further evaluation in the 2010 RH SIP for sulfite mills (2010 Regional Haze
SIP, p. 10-8 Table 10-2). The lowest demonstrated emissions (for 1- to 24-hr average ranges) for the units in Table 8 are from 2-3 ppm to 16-18 ppm (24-hr average BAT emission limit of European facilities). BATs are not permit limits, but are based on BREFs. Ecology also retains the option of adopting the lowest emission limits in Washington State as a reasonably achievable emission limits for this RACT analysis. The lowest demonstrated emission limits in Washington (for 1- to 24-hr average ranges) are 10 ppm (24-hr average at GP Camas, WA units Nos. 3 and 4).
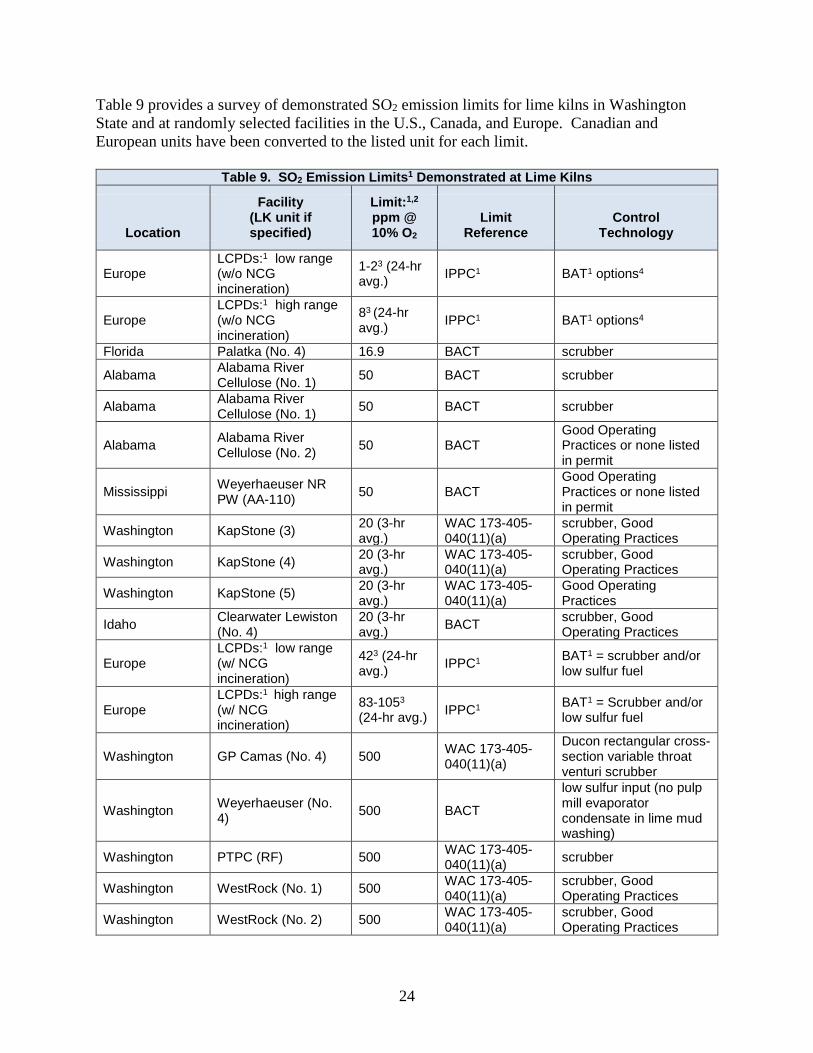
24
Table 9 provides a survey of demonstrated SO2 emission limits for lime kilns in Washington State and at randomly selected facilities in the U.S., Canada, and Europe. Canadian and European units have been converted to the listed unit for each limit.
Table 9. SO2 Emission Limits1 Demonstrated at Lime Kilns
Location
Facility (LK unit if specified)
Limit:1,2 ppm @ 10% O2
Limit Reference
Control Technology
Europe LCPDs:1 low range (w/o NCG incineration)
1-23 (24-hr avg.) IPPC1 BAT1 options4
Europe LCPDs:1 high range (w/o NCG incineration)
83 (24-hr avg.) IPPC1 BAT1 options4
Florida Palatka (No. 4) 16.9 BACT scrubber
Alabama Alabama River Cellulose (No. 1) 50 BACT scrubber
Alabama Alabama River Cellulose (No. 1) 50 BACT scrubber
Alabama Alabama River Cellulose (No. 2) 50 BACT
Good Operating Practices or none listed in permit
Mississippi Weyerhaeuser NR PW (AA-110) 50 BACT
Good Operating Practices or none listed in permit
Washington KapStone (3) 20 (3-hr avg.)
WAC 173-405-040(11)(a)
scrubber, Good Operating Practices
Washington KapStone (4) 20 (3-hr avg.)
WAC 173-405-040(11)(a)
scrubber, Good Operating Practices
Washington KapStone (5) 20 (3-hr avg.)
WAC 173-405-040(11)(a)
Good Operating Practices
Idaho Clearwater Lewiston (No. 4)
20 (3-hr avg.) BACT scrubber, Good
Operating Practices
Europe LCPDs:1 low range (w/ NCG incineration)
423 (24-hr avg.) IPPC1 BAT1 = scrubber and/or
low sulfur fuel
Europe LCPDs:1 high range (w/ NCG incineration)
83-1053
(24-hr avg.) IPPC1 BAT1 = Scrubber and/or low sulfur fuel
Washington GP Camas (No. 4) 500 WAC 173-405-040(11)(a)
Ducon rectangular cross-section variable throat venturi scrubber
Washington Weyerhaeuser (No. 4) 500 BACT
low sulfur input (no pulp mill evaporator condensate in lime mud washing)
Washington PTPC (RF) 500 WAC 173-405-040(11)(a) scrubber
Washington WestRock (No. 1) 500 WAC 173-405-040(11)(a)
scrubber, Good Operating Practices
Washington WestRock (No. 2) 500 WAC 173-405-040(11)(a)
scrubber, Good Operating Practices
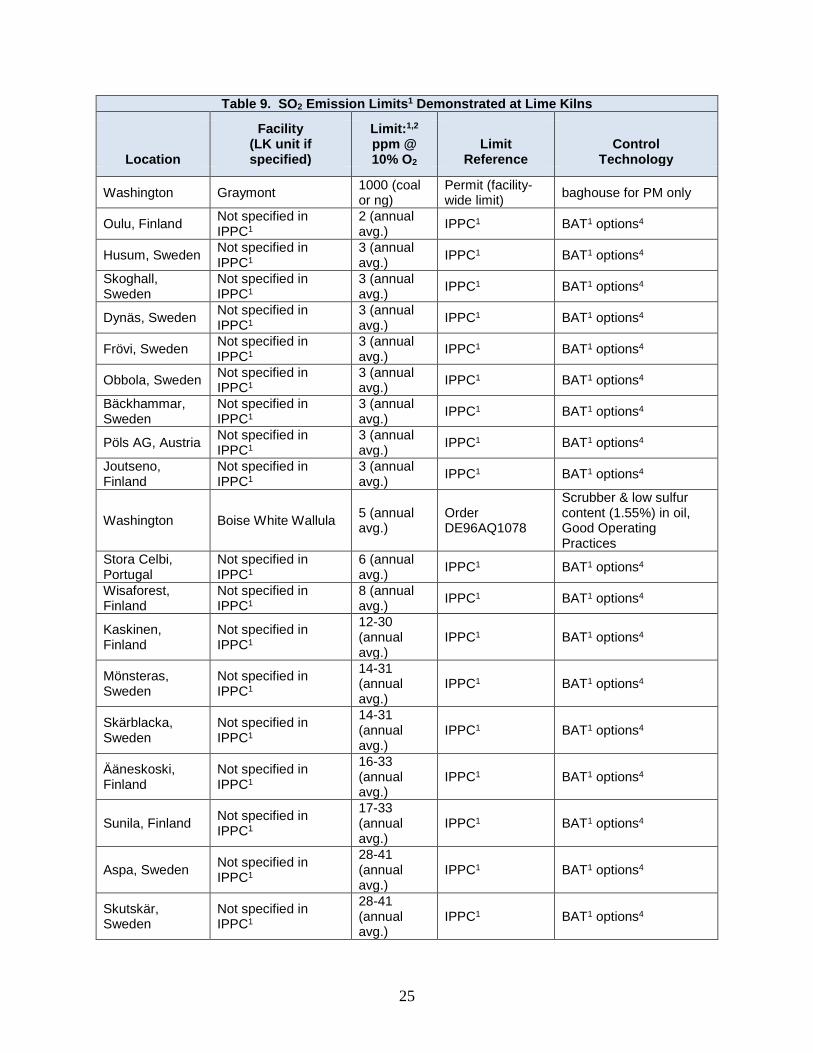
25
Table 9. SO2 Emission Limits1 Demonstrated at Lime Kilns
Location
Facility (LK unit if specified)
Limit:1,2 ppm @ 10% O2
Limit Reference
Control Technology
Washington Graymont 1000 (coal
or ng) Permit (facility-wide limit) baghouse for PM only
Oulu, Finland Not specified in IPPC1
2 (annual avg.) IPPC1 BAT1 options4
Husum, Sweden Not specified in IPPC1
3 (annual avg.) IPPC1 BAT1 options4
Skoghall, Sweden
Not specified in IPPC1
3 (annual avg.) IPPC1 BAT1 options4
Dynäs, Sweden Not specified in IPPC1
3 (annual avg.) IPPC1 BAT1 options4
Frövi, Sweden Not specified in IPPC1
3 (annual avg.) IPPC1 BAT1 options4
Obbola, Sweden Not specified in IPPC1
3 (annual avg.) IPPC1 BAT1 options4
Bäckhammar, Sweden
Not specified in IPPC1
3 (annual avg.) IPPC1 BAT1 options4
Pöls AG, Austria Not specified in IPPC1
3 (annual avg.) IPPC1 BAT1 options4
Joutseno, Finland
Not specified in IPPC1
3 (annual avg.) IPPC1 BAT1 options4
Washington Boise White Wallula 5 (annual avg.)
Order DE96AQ1078
Scrubber & low sulfur content (1.55%) in oil, Good Operating Practices
Stora Celbi, Portugal
Not specified in IPPC1
6 (annual avg.) IPPC1 BAT1 options4
Wisaforest, Finland
Not specified in IPPC1
8 (annual avg.) IPPC1 BAT1 options4
Kaskinen, Finland
Not specified in IPPC1
12-30 (annual avg.)
IPPC1 BAT1 options4
Mönsteras, Sweden
Not specified in IPPC1
14-31 (annual avg.)
IPPC1 BAT1 options4
Skärblacka, Sweden
Not specified in IPPC1
14-31 (annual avg.)
IPPC1 BAT1 options4
Ääneskoski, Finland
Not specified in IPPC1
16-33 (annual avg.)
IPPC1 BAT1 options4
Sunila, Finland Not specified in IPPC1
17-33 (annual avg.)
IPPC1 BAT1 options4
Aspa, Sweden Not specified in IPPC1
28-41 (annual avg.)
IPPC1 BAT1 options4
Skutskär, Sweden
Not specified in IPPC1
28-41 (annual avg.)
IPPC1 BAT1 options4
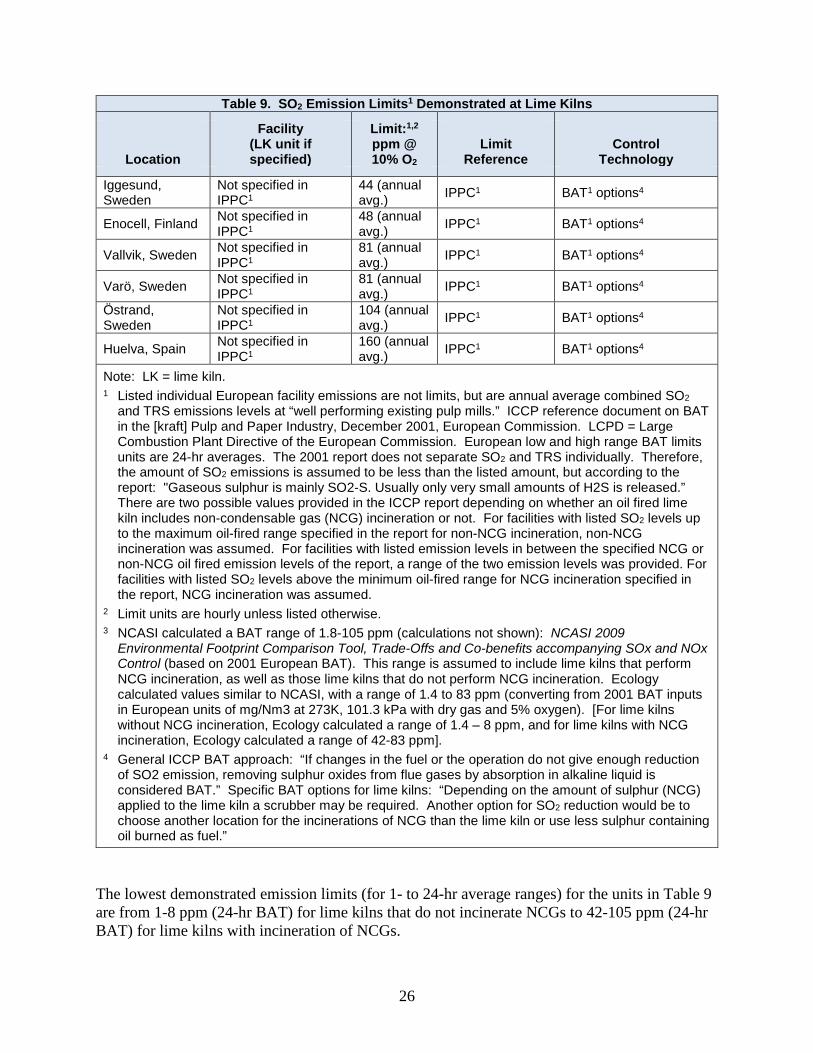
26
Table 9. SO2 Emission Limits1 Demonstrated at Lime Kilns
Location
Facility (LK unit if specified)
Limit:1,2 ppm @ 10% O2
Limit Reference
Control Technology
Iggesund, Sweden
Not specified in IPPC1
44 (annual avg.) IPPC1 BAT1 options4
Enocell, Finland Not specified in IPPC1
48 (annual avg.) IPPC1 BAT1 options4
Vallvik, Sweden Not specified in IPPC1
81 (annual avg.) IPPC1 BAT1 options4
Varö, Sweden Not specified in IPPC1
81 (annual avg.) IPPC1 BAT1 options4
Östrand, Sweden
Not specified in IPPC1
104 (annual avg.) IPPC1 BAT1 options4
Huelva, Spain Not specified in IPPC1
160 (annual avg.) IPPC1 BAT1 options4
Note: LK = lime kiln. 1 Listed individual European facility emissions are not limits, but are annual average combined SO2
and TRS emissions levels at “well performing existing pulp mills.” ICCP reference document on BAT in the [kraft] Pulp and Paper Industry, December 2001, European Commission. LCPD = Large Combustion Plant Directive of the European Commission. European low and high range BAT limits units are 24-hr averages. The 2001 report does not separate SO2 and TRS individually. Therefore, the amount of SO2 emissions is assumed to be less than the listed amount, but according to the report: "Gaseous sulphur is mainly SO2-S. Usually only very small amounts of H2S is released.” There are two possible values provided in the ICCP report depending on whether an oil fired lime kiln includes non-condensable gas (NCG) incineration or not. For facilities with listed SO2 levels up to the maximum oil-fired range specified in the report for non-NCG incineration, non-NCG incineration was assumed. For facilities with listed emission levels in between the specified NCG or non-NCG oil fired emission levels of the report, a range of the two emission levels was provided. For facilities with listed SO2 levels above the minimum oil-fired range for NCG incineration specified in the report, NCG incineration was assumed.
2 Limit units are hourly unless listed otherwise. 3 NCASI calculated a BAT range of 1.8-105 ppm (calculations not shown): NCASI 2009
Environmental Footprint Comparison Tool, Trade-Offs and Co-benefits accompanying SOx and NOx Control (based on 2001 European BAT). This range is assumed to include lime kilns that perform NCG incineration, as well as those lime kilns that do not perform NCG incineration. Ecology calculated values similar to NCASI, with a range of 1.4 to 83 ppm (converting from 2001 BAT inputs in European units of mg/Nm3 at 273K, 101.3 kPa with dry gas and 5% oxygen). [For lime kilns without NCG incineration, Ecology calculated a range of 1.4 – 8 ppm, and for lime kilns with NCG incineration, Ecology calculated a range of 42-83 ppm].
4 General ICCP BAT approach: “If changes in the fuel or the operation do not give enough reduction of SO2 emission, removing sulphur oxides from flue gases by absorption in alkaline liquid is considered BAT.” Specific BAT options for lime kilns: “Depending on the amount of sulphur (NCG) applied to the lime kiln a scrubber may be required. Another option for SO2 reduction would be to choose another location for the incinerations of NCG than the lime kiln or use less sulphur containing oil burned as fuel.”
The lowest demonstrated emission limits (for 1- to 24-hr average ranges) for the units in Table 9 are from 1-8 ppm (24-hr BAT) for lime kilns that do not incinerate NCGs to 42-105 ppm (24-hr BAT) for lime kilns with incineration of NCGs.
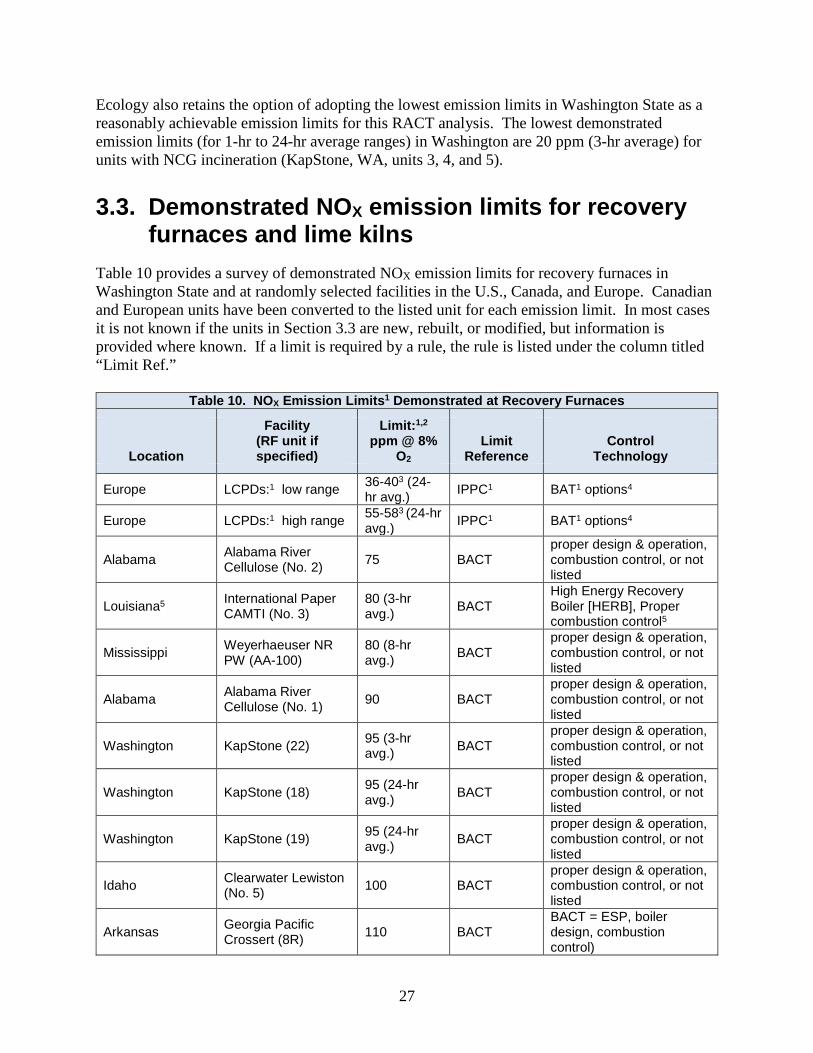
27
Ecology also retains the option of adopting the lowest emission limits in Washington State as a reasonably achievable emission limits for this RACT analysis. The lowest demonstrated emission limits (for 1-hr to 24-hr average ranges) in Washington are 20 ppm (3-hr average) for units with NCG incineration (KapStone, WA, units 3, 4, and 5).
3.3. Demonstrated NOX emission limits for recovery furnaces and lime kilns
Table 10 provides a survey of demonstrated NOX emission limits for recovery furnaces in Washington State and at randomly selected facilities in the U.S., Canada, and Europe. Canadian and European units have been converted to the listed unit for each emission limit. In most cases it is not known if the units in Section 3.3 are new, rebuilt, or modified, but information is provided where known. If a limit is required by a rule, the rule is listed under the column titled “Limit Ref.”
Table 10. NOX Emission Limits1 Demonstrated at Recovery Furnaces
Location
Facility (RF unit if specified)
Limit:1,2 ppm @ 8%
O2 Limit
Reference Control
Technology
Europe LCPDs:1 low range 36-403 (24-hr avg.) IPPC1 BAT1 options4
Europe LCPDs:1 high range 55-583 (24-hr avg.) IPPC1 BAT1 options4
Alabama Alabama River Cellulose (No. 2) 75 BACT
proper design & operation, combustion control, or not listed
Louisiana5 International Paper CAMTI (No. 3)
80 (3-hr avg.) BACT
High Energy Recovery Boiler [HERB], Proper combustion control5
Mississippi Weyerhaeuser NR PW (AA-100)
80 (8-hr avg.) BACT
proper design & operation, combustion control, or not listed
Alabama Alabama River Cellulose (No. 1) 90 BACT
proper design & operation, combustion control, or not listed
Washington KapStone (22) 95 (3-hr avg.) BACT
proper design & operation, combustion control, or not listed
Washington KapStone (18) 95 (24-hr avg.) BACT
proper design & operation, combustion control, or not listed
Washington KapStone (19) 95 (24-hr avg.) BACT
proper design & operation, combustion control, or not listed
Idaho Clearwater Lewiston (No. 5) 100 BACT
proper design & operation, combustion control, or not listed
Arkansas Georgia Pacific Crossert (8R) 110 BACT
BACT = ESP, boiler design, combustion control)
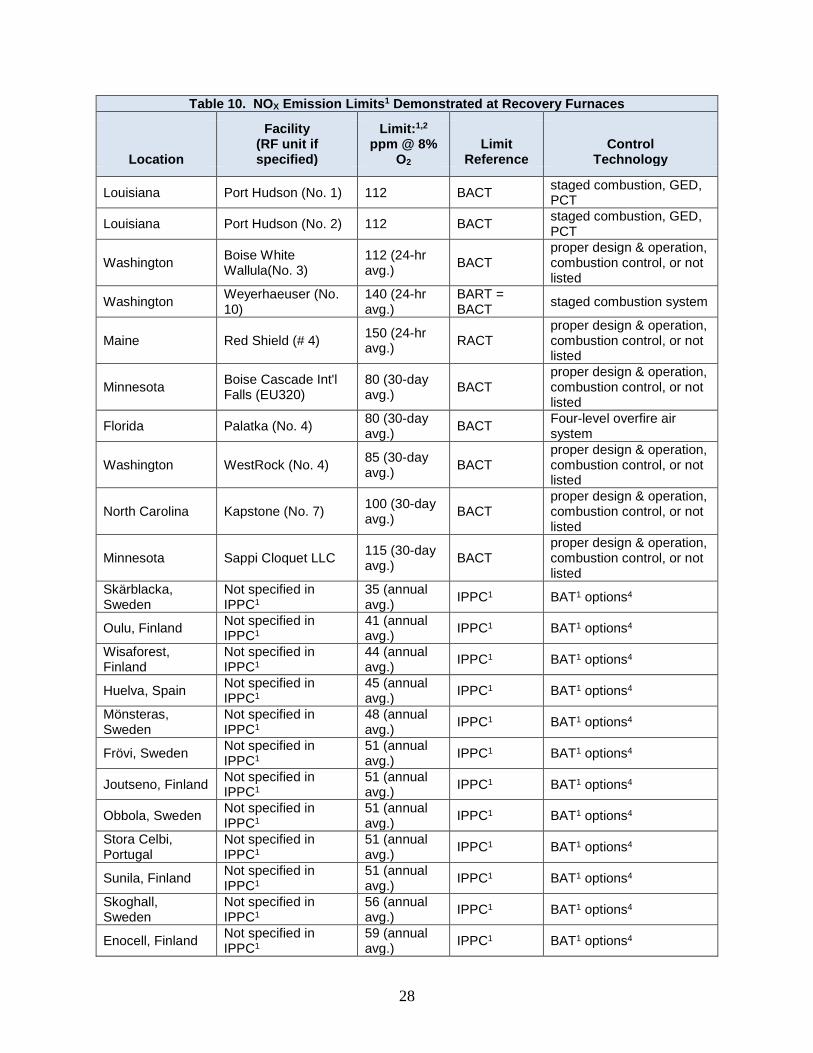
28
Table 10. NOX Emission Limits1 Demonstrated at Recovery Furnaces
Location
Facility (RF unit if specified)
Limit:1,2 ppm @ 8%
O2 Limit
Reference Control
Technology
Louisiana Port Hudson (No. 1) 112 BACT staged combustion, GED, PCT
Louisiana Port Hudson (No. 2) 112 BACT staged combustion, GED, PCT
Washington Boise White Wallula(No. 3)
112 (24-hr avg.) BACT
proper design & operation, combustion control, or not listed
Washington Weyerhaeuser (No. 10)
140 (24-hr avg.)
BART = BACT staged combustion system
Maine Red Shield (# 4) 150 (24-hr avg.) RACT
proper design & operation, combustion control, or not listed
Minnesota Boise Cascade Int'l Falls (EU320)
80 (30-day avg.) BACT
proper design & operation, combustion control, or not listed
Florida Palatka (No. 4) 80 (30-day avg.) BACT Four-level overfire air
system
Washington WestRock (No. 4) 85 (30-day avg.) BACT
proper design & operation, combustion control, or not listed
North Carolina Kapstone (No. 7) 100 (30-day avg.) BACT
proper design & operation, combustion control, or not listed
Minnesota Sappi Cloquet LLC 115 (30-day avg.) BACT
proper design & operation, combustion control, or not listed
Skärblacka, Sweden
Not specified in IPPC1
35 (annual avg.) IPPC1 BAT1 options4
Oulu, Finland Not specified in IPPC1
41 (annual avg.) IPPC1 BAT1 options4
Wisaforest, Finland
Not specified in IPPC1
44 (annual avg.) IPPC1 BAT1 options4
Huelva, Spain Not specified in IPPC1
45 (annual avg.) IPPC1 BAT1 options4
Mönsteras, Sweden
Not specified in IPPC1
48 (annual avg.) IPPC1 BAT1 options4
Frövi, Sweden Not specified in IPPC1
51 (annual avg.) IPPC1 BAT1 options4
Joutseno, Finland Not specified in IPPC1
51 (annual avg.) IPPC1 BAT1 options4
Obbola, Sweden Not specified in IPPC1
51 (annual avg.) IPPC1 BAT1 options4
Stora Celbi, Portugal
Not specified in IPPC1
51 (annual avg.) IPPC1 BAT1 options4
Sunila, Finland Not specified in IPPC1
51 (annual avg.) IPPC1 BAT1 options4
Skoghall, Sweden
Not specified in IPPC1
56 (annual avg.) IPPC1 BAT1 options4
Enocell, Finland Not specified in IPPC1
59 (annual avg.) IPPC1 BAT1 options4
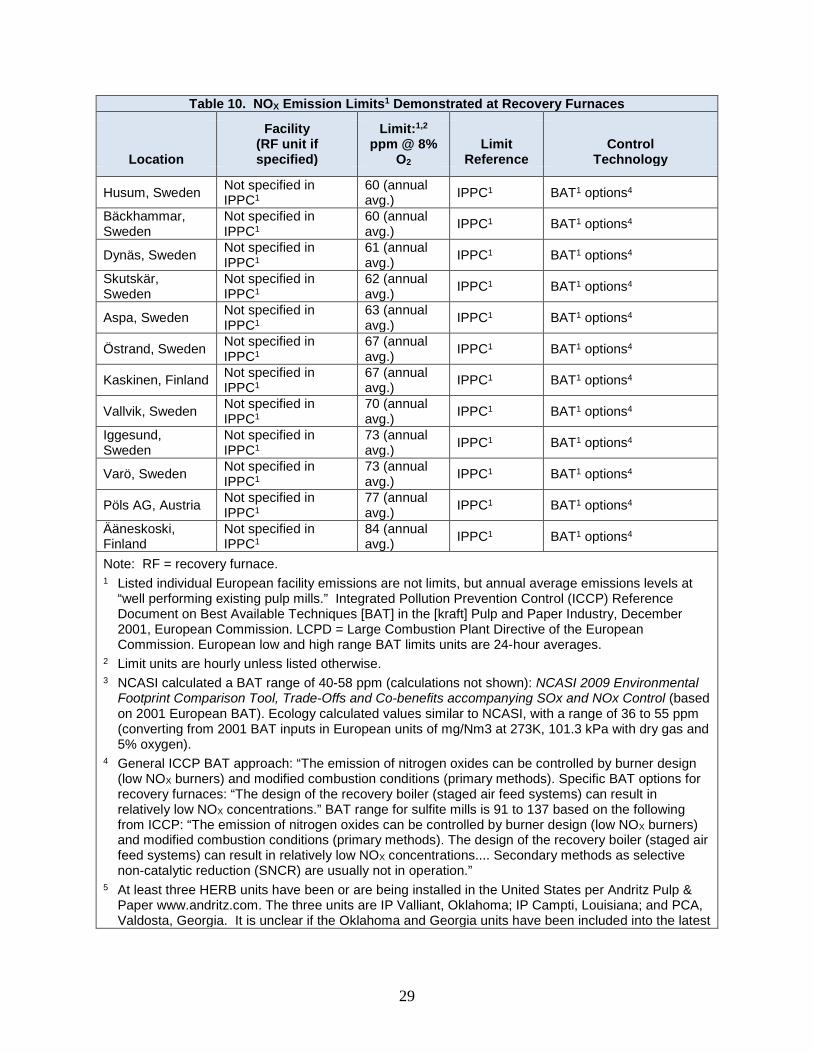
29
Table 10. NOX Emission Limits1 Demonstrated at Recovery Furnaces
Location
Facility (RF unit if specified)
Limit:1,2 ppm @ 8%
O2 Limit
Reference Control
Technology
Husum, Sweden Not specified in IPPC1
60 (annual avg.) IPPC1 BAT1 options4
Bäckhammar, Sweden
Not specified in IPPC1
60 (annual avg.) IPPC1 BAT1 options4
Dynäs, Sweden Not specified in IPPC1
61 (annual avg.) IPPC1 BAT1 options4
Skutskär, Sweden
Not specified in IPPC1
62 (annual avg.) IPPC1 BAT1 options4
Aspa, Sweden Not specified in IPPC1
63 (annual avg.) IPPC1 BAT1 options4
Östrand, Sweden Not specified in IPPC1
67 (annual avg.) IPPC1 BAT1 options4
Kaskinen, Finland Not specified in IPPC1
67 (annual avg.) IPPC1 BAT1 options4
Vallvik, Sweden Not specified in IPPC1
70 (annual avg.) IPPC1 BAT1 options4
Iggesund, Sweden
Not specified in IPPC1
73 (annual avg.) IPPC1 BAT1 options4
Varö, Sweden Not specified in IPPC1
73 (annual avg.) IPPC1 BAT1 options4
Pöls AG, Austria Not specified in IPPC1
77 (annual avg.) IPPC1 BAT1 options4
Ääneskoski, Finland
Not specified in IPPC1
84 (annual avg.) IPPC1 BAT1 options4
Note: RF = recovery furnace. 1 Listed individual European facility emissions are not limits, but annual average emissions levels at
“well performing existing pulp mills.” Integrated Pollution Prevention Control (ICCP) Reference Document on Best Available Techniques [BAT] in the [kraft] Pulp and Paper Industry, December 2001, European Commission. LCPD = Large Combustion Plant Directive of the European Commission. European low and high range BAT limits units are 24-hour averages.
2 Limit units are hourly unless listed otherwise. 3 NCASI calculated a BAT range of 40-58 ppm (calculations not shown): NCASI 2009 Environmental
Footprint Comparison Tool, Trade-Offs and Co-benefits accompanying SOx and NOx Control (based on 2001 European BAT). Ecology calculated values similar to NCASI, with a range of 36 to 55 ppm (converting from 2001 BAT inputs in European units of mg/Nm3 at 273K, 101.3 kPa with dry gas and 5% oxygen).
4 General ICCP BAT approach: “The emission of nitrogen oxides can be controlled by burner design (low NOX burners) and modified combustion conditions (primary methods). Specific BAT options for recovery furnaces: “The design of the recovery boiler (staged air feed systems) can result in relatively low NOX concentrations.” BAT range for sulfite mills is 91 to 137 based on the following from ICCP: “The emission of nitrogen oxides can be controlled by burner design (low NOX burners) and modified combustion conditions (primary methods). The design of the recovery boiler (staged air feed systems) can result in relatively low NOX concentrations.... Secondary methods as selective non-catalytic reduction (SNCR) are usually not in operation.”
5 At least three HERB units have been or are being installed in the United States per Andritz Pulp & Paper www.andritz.com. The three units are IP Valliant, Oklahoma; IP Campti, Louisiana; and PCA, Valdosta, Georgia. It is unclear if the Oklahoma and Georgia units have been included into the latest
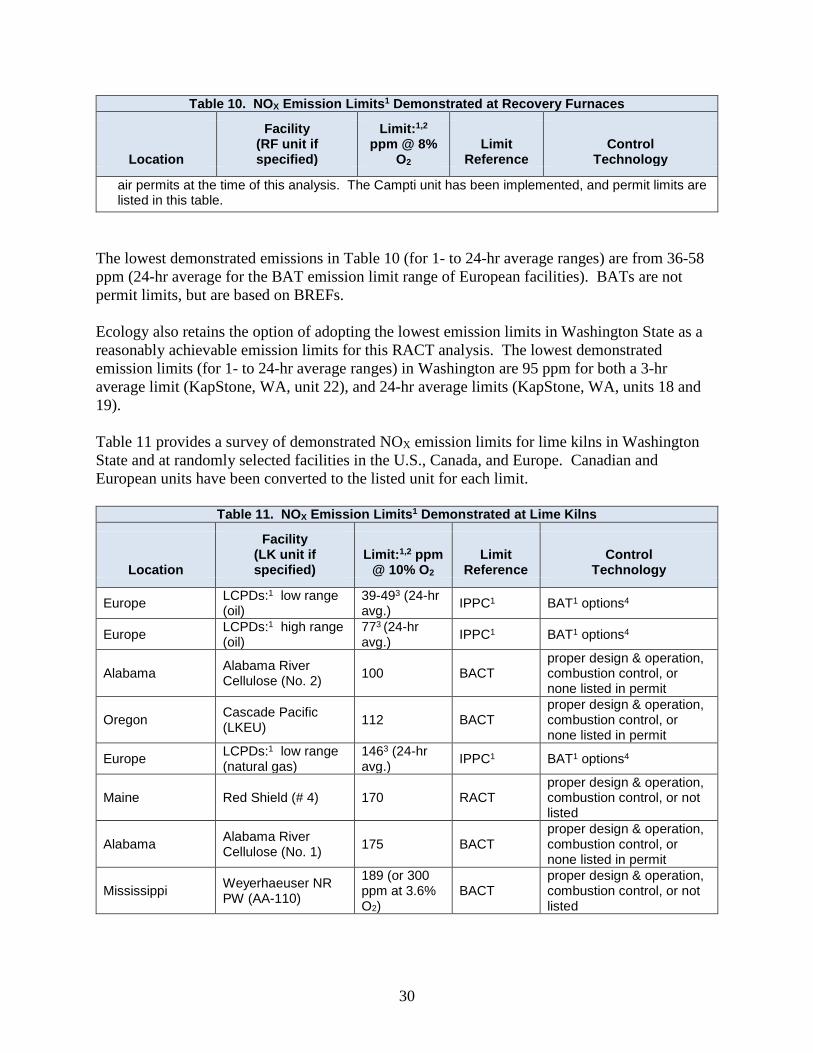
30
Table 10. NOX Emission Limits1 Demonstrated at Recovery Furnaces
Location
Facility (RF unit if specified)
Limit:1,2 ppm @ 8%
O2 Limit
Reference Control
Technology
air permits at the time of this analysis. The Campti unit has been implemented, and permit limits are listed in this table.
The lowest demonstrated emissions in Table 10 (for 1- to 24-hr average ranges) are from 36-58 ppm (24-hr average for the BAT emission limit range of European facilities). BATs are not permit limits, but are based on BREFs. Ecology also retains the option of adopting the lowest emission limits in Washington State as a reasonably achievable emission limits for this RACT analysis. The lowest demonstrated emission limits (for 1- to 24-hr average ranges) in Washington are 95 ppm for both a 3-hr average limit (KapStone, WA, unit 22), and 24-hr average limits (KapStone, WA, units 18 and 19). Table 11 provides a survey of demonstrated NOX emission limits for lime kilns in Washington State and at randomly selected facilities in the U.S., Canada, and Europe. Canadian and European units have been converted to the listed unit for each limit.
Table 11. NOX Emission Limits1 Demonstrated at Lime Kilns
Location
Facility (LK unit if specified)
Limit:1,2 ppm @ 10% O2
Limit Reference
Control Technology
Europe LCPDs:1 low range
(oil) 39-493 (24-hr avg.) IPPC1 BAT1 options4
Europe LCPDs:1 high range (oil)
773 (24-hr avg.) IPPC1 BAT1 options4
Alabama Alabama River Cellulose (No. 2) 100 BACT
proper design & operation, combustion control, or none listed in permit
Oregon Cascade Pacific (LKEU) 112 BACT
proper design & operation, combustion control, or none listed in permit
Europe LCPDs:1 low range (natural gas)
1463 (24-hr avg.) IPPC1 BAT1 options4
Maine Red Shield (# 4) 170 RACT proper design & operation, combustion control, or not listed
Alabama Alabama River Cellulose (No. 1) 175 BACT
proper design & operation, combustion control, or none listed in permit
Mississippi Weyerhaeuser NR PW (AA-110)
189 (or 300 ppm at 3.6% O2)
BACT proper design & operation, combustion control, or not listed
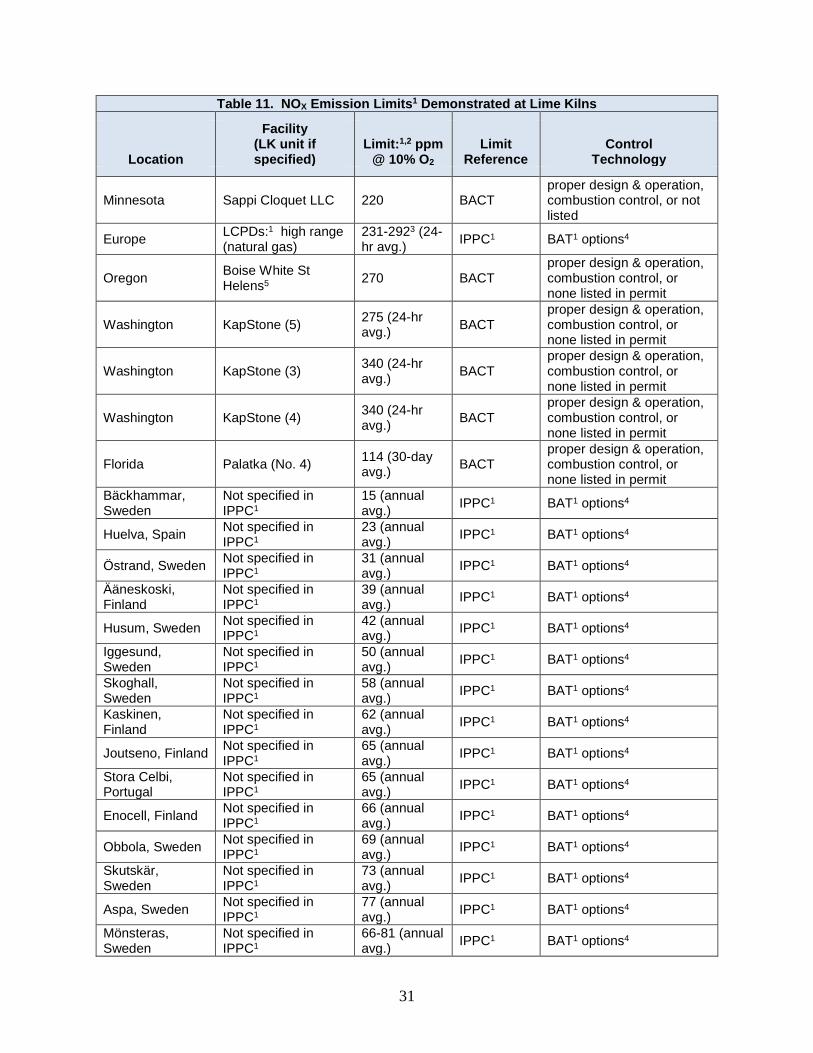
31
Table 11. NOX Emission Limits1 Demonstrated at Lime Kilns
Location
Facility (LK unit if specified)
Limit:1,2 ppm @ 10% O2
Limit Reference
Control Technology
Minnesota Sappi Cloquet LLC 220 BACT proper design & operation, combustion control, or not listed
Europe LCPDs:1 high range (natural gas)
231-2923 (24-hr avg.) IPPC1 BAT1 options4
Oregon Boise White St Helens5 270 BACT
proper design & operation, combustion control, or none listed in permit
Washington KapStone (5) 275 (24-hr avg.) BACT
proper design & operation, combustion control, or none listed in permit
Washington KapStone (3) 340 (24-hr avg.) BACT
proper design & operation, combustion control, or none listed in permit
Washington KapStone (4) 340 (24-hr avg.) BACT
proper design & operation, combustion control, or none listed in permit
Florida Palatka (No. 4) 114 (30-day avg.) BACT
proper design & operation, combustion control, or none listed in permit
Bäckhammar, Sweden
Not specified in IPPC1
15 (annual avg.) IPPC1 BAT1 options4
Huelva, Spain Not specified in IPPC1
23 (annual avg.) IPPC1 BAT1 options4
Östrand, Sweden Not specified in IPPC1
31 (annual avg.) IPPC1 BAT1 options4
Ääneskoski, Finland
Not specified in IPPC1
39 (annual avg.) IPPC1 BAT1 options4
Husum, Sweden Not specified in IPPC1
42 (annual avg.) IPPC1 BAT1 options4
Iggesund, Sweden
Not specified in IPPC1
50 (annual avg.) IPPC1 BAT1 options4
Skoghall, Sweden
Not specified in IPPC1
58 (annual avg.) IPPC1 BAT1 options4
Kaskinen, Finland
Not specified in IPPC1
62 (annual avg.) IPPC1 BAT1 options4
Joutseno, Finland Not specified in IPPC1
65 (annual avg.) IPPC1 BAT1 options4
Stora Celbi, Portugal
Not specified in IPPC1
65 (annual avg.) IPPC1 BAT1 options4
Enocell, Finland Not specified in IPPC1
66 (annual avg.) IPPC1 BAT1 options4
Obbola, Sweden Not specified in IPPC1
69 (annual avg.) IPPC1 BAT1 options4
Skutskär, Sweden
Not specified in IPPC1
73 (annual avg.) IPPC1 BAT1 options4
Aspa, Sweden Not specified in IPPC1
77 (annual avg.) IPPC1 BAT1 options4
Mönsteras, Sweden
Not specified in IPPC1
66-81 (annual avg.) IPPC1 BAT1 options4
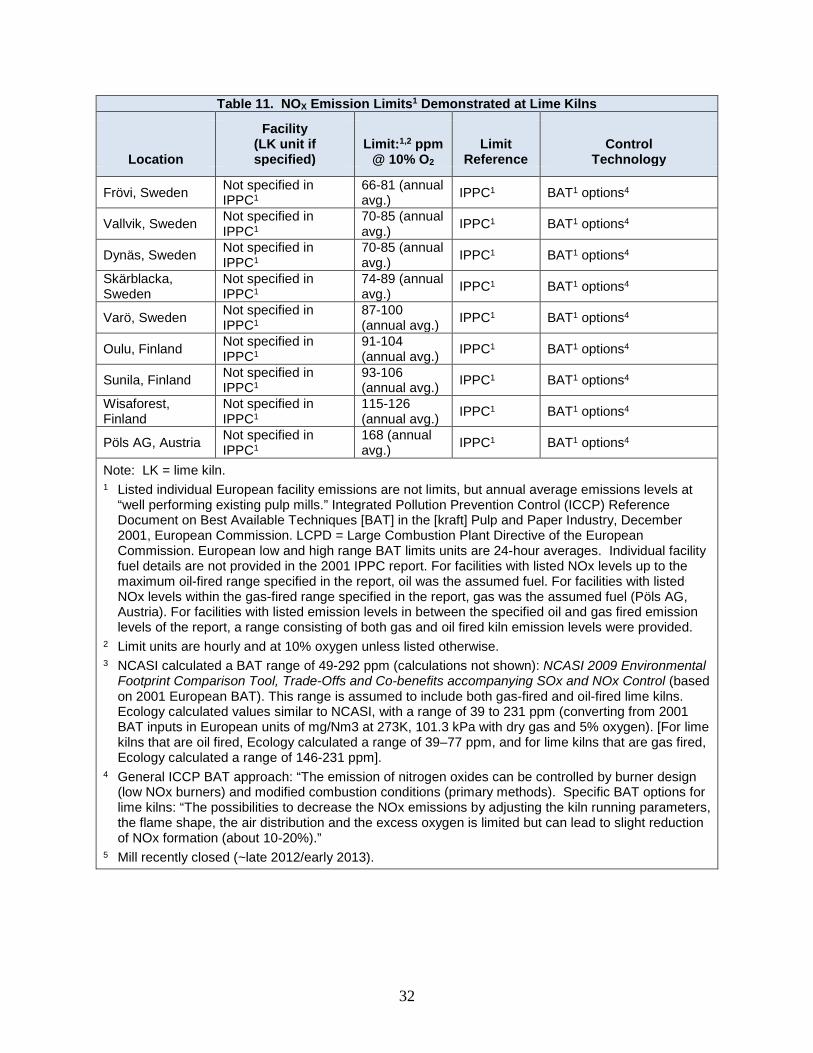
32
Table 11. NOX Emission Limits1 Demonstrated at Lime Kilns
Location
Facility (LK unit if specified)
Limit:1,2 ppm @ 10% O2
Limit Reference
Control Technology
Frövi, Sweden Not specified in
IPPC1 66-81 (annual avg.) IPPC1 BAT1 options4
Vallvik, Sweden Not specified in IPPC1
70-85 (annual avg.) IPPC1 BAT1 options4
Dynäs, Sweden Not specified in IPPC1
70-85 (annual avg.) IPPC1 BAT1 options4
Skärblacka, Sweden
Not specified in IPPC1
74-89 (annual avg.) IPPC1 BAT1 options4
Varö, Sweden Not specified in IPPC1
87-100 (annual avg.) IPPC1 BAT1 options4
Oulu, Finland Not specified in IPPC1
91-104 (annual avg.) IPPC1 BAT1 options4
Sunila, Finland Not specified in IPPC1
93-106 (annual avg.) IPPC1 BAT1 options4
Wisaforest, Finland
Not specified in IPPC1
115-126 (annual avg.) IPPC1 BAT1 options4
Pöls AG, Austria Not specified in IPPC1
168 (annual avg.) IPPC1 BAT1 options4
Note: LK = lime kiln. 1 Listed individual European facility emissions are not limits, but annual average emissions levels at
“well performing existing pulp mills.” Integrated Pollution Prevention Control (ICCP) Reference Document on Best Available Techniques [BAT] in the [kraft] Pulp and Paper Industry, December 2001, European Commission. LCPD = Large Combustion Plant Directive of the European Commission. European low and high range BAT limits units are 24-hour averages. Individual facility fuel details are not provided in the 2001 IPPC report. For facilities with listed NOx levels up to the maximum oil-fired range specified in the report, oil was the assumed fuel. For facilities with listed NOx levels within the gas-fired range specified in the report, gas was the assumed fuel (Pöls AG, Austria). For facilities with listed emission levels in between the specified oil and gas fired emission levels of the report, a range consisting of both gas and oil fired kiln emission levels were provided.
2 Limit units are hourly and at 10% oxygen unless listed otherwise. 3 NCASI calculated a BAT range of 49-292 ppm (calculations not shown): NCASI 2009 Environmental
Footprint Comparison Tool, Trade-Offs and Co-benefits accompanying SOx and NOx Control (based on 2001 European BAT). This range is assumed to include both gas-fired and oil-fired lime kilns. Ecology calculated values similar to NCASI, with a range of 39 to 231 ppm (converting from 2001 BAT inputs in European units of mg/Nm3 at 273K, 101.3 kPa with dry gas and 5% oxygen). [For lime kilns that are oil fired, Ecology calculated a range of 39–77 ppm, and for lime kilns that are gas fired, Ecology calculated a range of 146-231 ppm].
4 General ICCP BAT approach: “The emission of nitrogen oxides can be controlled by burner design (low NOx burners) and modified combustion conditions (primary methods). Specific BAT options for lime kilns: “The possibilities to decrease the NOx emissions by adjusting the kiln running parameters, the flame shape, the air distribution and the excess oxygen is limited but can lead to slight reduction of NOx formation (about 10-20%).”
5 Mill recently closed (~late 2012/early 2013).
33
The lowest demonstrated emissions (for 1- to 24-hr average ranges) for the units in Table 11 are 39-77 ppm for oil-fired kilns and 146-292 ppm BAT range for gas-fired kilns (24-hour average for the BAT emission limit range of European facilities). BATs are not permit limits, but are based on BREFs. Ecology also retains the option of adopting the lowest emission limits in Washington State as reasonably achievable emission limits for this RACT analysis. The lowest demonstrated emission limits in Washington are 275 ppm (24-hr average limit at KapStone, WA, unit 5; unit uses oil and/or natural gas).
4. Estimated Emission Reductions Achievable This section presents emission reductions that are estimated to be achieved for potential SO2, NOX, and PM RACT limits. Ecology interprets “reasonably available” control technology as defined in Section 1.2, to mean those control technologies that are currently demonstrating compliance with the SO2, NOX, and PM emission limits in Sections 3.1–3.3. There may be other control technologies listed in Chapter 2 which are capable of meeting the emission limits in Sections 3.1–3.3, but have not been demonstrated in practice. Potential emission reductions achievable using control technologies that have not been demonstrated in practice are not estimated as part of this RACT analysis.
4.1. Estimated emission reductions achievable (by facility)
In order to compare emission limits between facilities, units were converted to the extent possible given available facility information because some facility permits do not provide emission limits in comparable units. Concentration based limits in gr/dscf and also ppm, where provided, were used to compare emission limits between facilities. In addition, for Washington State pulp mills, recovery furnace and lime kiln compliance tests were compared to facility emission limits and also to potential RACT emission limits in order to estimated potential reductions from RACT options. Unit conversion and permit limit information is provided in Appendix A. Facility operating and emission information is provided in Appendix B and was the basis from which the estimated emission reductions listed in this chapter were calculated. Estimated emission reductions are the difference between multi-year average annual emissions and the multi-year average annual emissions multiplied by the ratio of emission at the proposed RACT limit to measured emissions (if available) or calculated emissions (if measured emissions not available). This approach included the occasional need to convert mass per time units obtained from emission inventory data into concentration based limits for comparison purposes when compliance test results were unavailable. However, as noted in Section 5.2, the specific average pulp mill emission reductions from this section that are considered as RACT options in Chapter 5, are based on multi-year measured (compliance test) data, not on calculated data. For calculated data, multi-year average annual emission inventory units of tons per year (TPY) were
34
divided by multi-year average annual flow rate units of dry standard cubic feet per minute to provide concentration-based units. This RACT analysis assumed emission limits with averaging times of 24 hours or less, are to an extent, comparable. For example: a daily (24-hr) limit would need to meet a similar 1-hr or 3-hr limit (etc.) most of the time in order to meet the daily limit. Limits based on averaging periods over 24 hours long were avoided. For example: although the recovery furnace at WestRock has a 150 ppm SO2 limit for a 30-day rolling average, that facility’s 1-hr 500 ppm SO2 limit was used for similarly shorter averaging period comparison purposes instead. Recovery furnaces can experience short duration spikes in SO2 ppm levels and, as a result, some facilities have difficulty meeting short-term recovery furnace concentration emissions limits. One facility in Washington State, KapStone, switched from 3-hr average SO2 concentration based permit limits of 60 ppm (RFs 18 & 19) to mass emission rate permit limits. However, the facility in Washington State with the lowest permitted recovery furnace SO2 concentration based emission limit (10 ppm at GP Camas), consistently meets that limit, which is based on a 24-hr averaging period. In addition, the facility in Washington State with the next lowest recovery furnace SO2 concentration based emission limit (75 ppm at Weyerhaeuser), demonstrates compliance with that limit, which is based on a 3-hr averaging period, and constitutes Ecology’s BART determination for that unit per the RH SIP (p. L-374). It should be noted that the 75 ppm SO2 limit listed in that facility’s air operating permit is for conditions when supplemental oil is not used; or, if it is used, the black liquour solids (BLS) firing rate must be greater than 150,000 lb/hr. This RACT analysis was based on a snapshot of emission inventories between approximately 2003 and 2011 depending on available data and facility operations (i.e., Cosmo did not operate from 2007–2010). Specific facility details may have changed since 2011. For example, at the KapStone facility, this analysis was based on emission inventory information for three recovery furnaces (RF18, RF19, and RF22). However, based on information from Ecology’s Industrial Section which manages compliance at pulp mills, it appears that RF18 has not been operated continuously since 2012, but as a possible backup recovery furnace while RF19 is being modified. Eventually it will be permanently shut down under Notice of Construction (NOC) Order 8429. It is required to be shut down once RF19 is placed into operation after it is modified. By including all three recovery furnaces, this RACT analysis conservatively overestimates emission reductions for that facility. Estimated emission reductions for each individual pulp mill in Washington State are provided in the following subsections. Recovery furnace HERB limits are not included for consideration below because there are currently no HERB units in operation in Washington State.
4.1.1. PTPC estimated emission reductions PTPC, located in Port Townsend, WA, operates a Kraft pulp and paper mill that manufactures unbleached Kraft pulp, Kraft papers, and lightweight linerboard. Emissions and estimated emission reductions are presented in Tables 12 and 13.
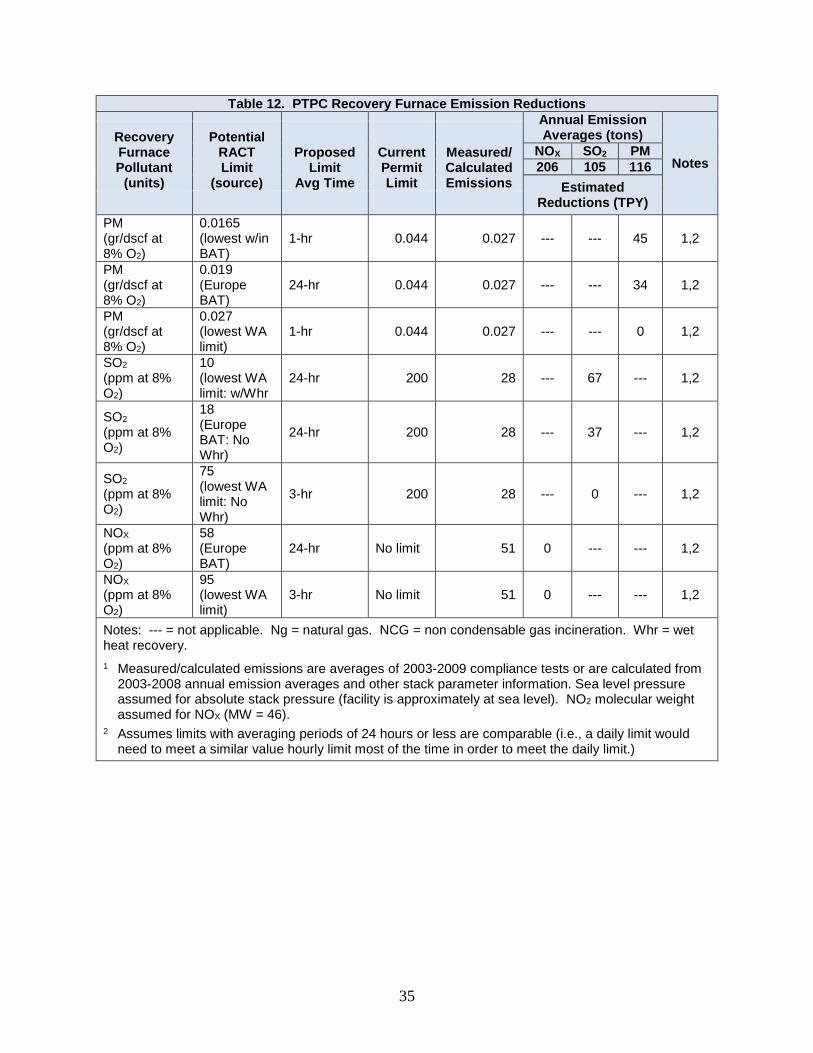
35
Table 12. PTPC Recovery Furnace Emission Reductions Annual Emission
Averages (tons)
Notes
Recovery Furnace Pollutant
(units)
Potential RACT Limit
(source)
Proposed Limit
Avg Time
Current Permit Limit
Measured/ Calculated Emissions
NOX SO2 PM 206 105 116
Estimated Reductions (TPY)
PM (gr/dscf at 8% O2)
0.0165 (lowest w/in BAT)
1-hr 0.044 0.027 --- --- 45 1,2
PM (gr/dscf at 8% O2)
0.019 (Europe BAT)
24-hr 0.044 0.027 --- --- 34 1,2
PM (gr/dscf at 8% O2)
0.027 (lowest WA limit)
1-hr 0.044 0.027 --- --- 0 1,2
SO2 (ppm at 8% O2)
10 (lowest WA limit: w/Whr
24-hr 200 28 --- 67 --- 1,2
SO2 (ppm at 8% O2)
18 (Europe BAT: No Whr)
24-hr 200 28 --- 37 --- 1,2
SO2 (ppm at 8% O2)
75 (lowest WA limit: No Whr)
3-hr 200 28 --- 0 --- 1,2
NOX (ppm at 8% O2)
58 (Europe BAT)
24-hr No limit 51 0 --- --- 1,2
NOX (ppm at 8% O2)
95 (lowest WA limit)
3-hr No limit 51 0 --- --- 1,2
Notes: --- = not applicable. Ng = natural gas. NCG = non condensable gas incineration. Whr = wet heat recovery. 1 Measured/calculated emissions are averages of 2003-2009 compliance tests or are calculated from
2003-2008 annual emission averages and other stack parameter information. Sea level pressure assumed for absolute stack pressure (facility is approximately at sea level). NO2 molecular weight assumed for NOX (MW = 46).
2 Assumes limits with averaging periods of 24 hours or less are comparable (i.e., a daily limit would need to meet a similar value hourly limit most of the time in order to meet the daily limit.)
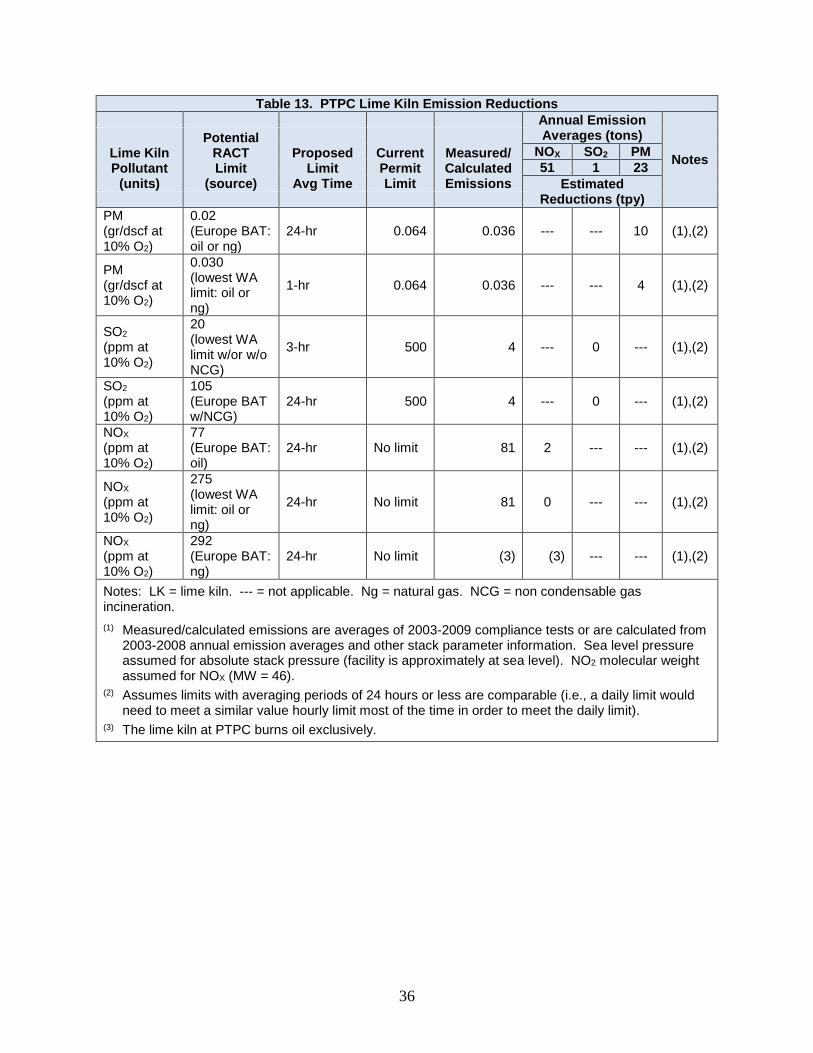
36
Table 13. PTPC Lime Kiln Emission Reductions Annual Emission
Averages (tons)
Notes Lime Kiln Pollutant
(units)
Potential RACT Limit
(source)
Proposed Limit
Avg Time
Current Permit Limit
Measured/ Calculated Emissions
NOX SO2 PM 51 1 23
Estimated Reductions (tpy)
PM (gr/dscf at 10% O2)
0.02 (Europe BAT: oil or ng)
24-hr 0.064 0.036 --- --- 10 (1),(2)
PM (gr/dscf at 10% O2)
0.030 (lowest WA limit: oil or ng)
1-hr 0.064 0.036 --- --- 4 (1),(2)
SO2 (ppm at 10% O2)
20 (lowest WA limit w/or w/o NCG)
3-hr 500 4 --- 0 --- (1),(2)
SO2 (ppm at 10% O2)
105 (Europe BAT w/NCG)
24-hr 500 4 --- 0 --- (1),(2)
NOX (ppm at 10% O2)
77 (Europe BAT: oil)
24-hr No limit 81 2 --- --- (1),(2)
NOX (ppm at 10% O2)
275 (lowest WA limit: oil or ng)
24-hr No limit 81 0 --- --- (1),(2)
NOX (ppm at 10% O2)
292 (Europe BAT: ng)
24-hr No limit (3) (3) --- --- (1),(2)
Notes: LK = lime kiln. --- = not applicable. Ng = natural gas. NCG = non condensable gas incineration. (1) Measured/calculated emissions are averages of 2003-2009 compliance tests or are calculated from
2003-2008 annual emission averages and other stack parameter information. Sea level pressure assumed for absolute stack pressure (facility is approximately at sea level). NO2 molecular weight assumed for NOX (MW = 46).
(2) Assumes limits with averaging periods of 24 hours or less are comparable (i.e., a daily limit would need to meet a similar value hourly limit most of the time in order to meet the daily limit).
(3) The lime kiln at PTPC burns oil exclusively.
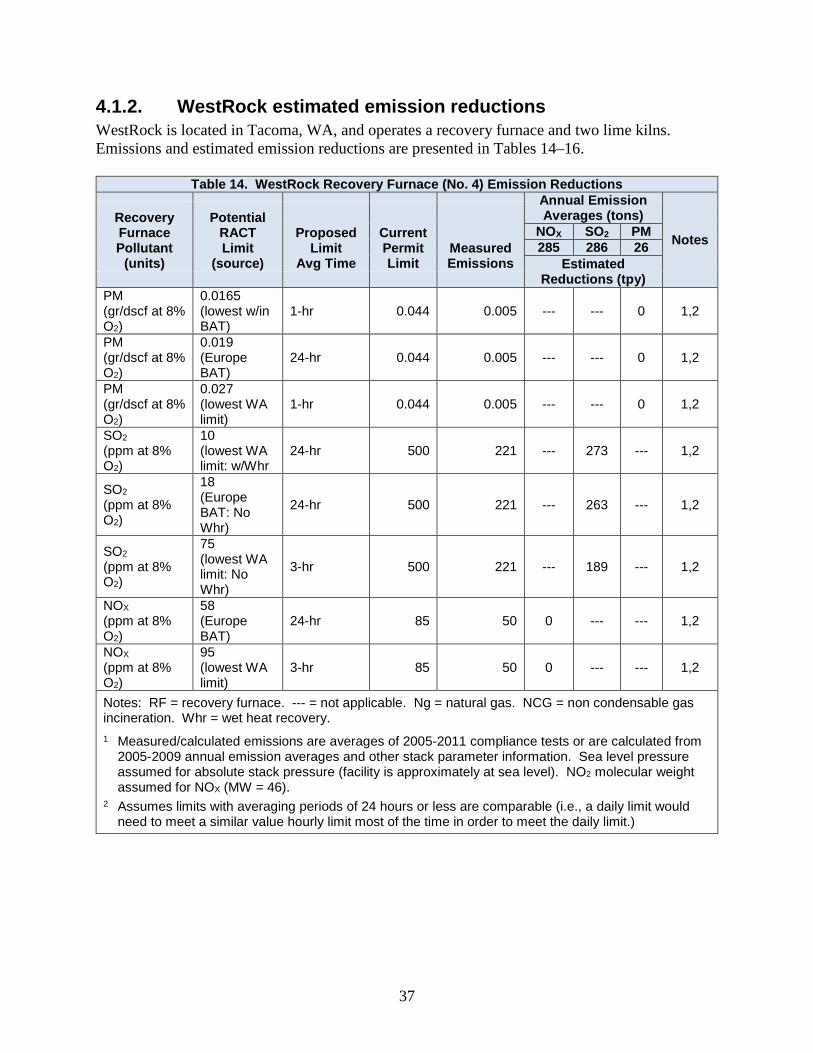
37
4.1.2. WestRock estimated emission reductions WestRock is located in Tacoma, WA, and operates a recovery furnace and two lime kilns. Emissions and estimated emission reductions are presented in Tables 14–16.
Table 14. WestRock Recovery Furnace (No. 4) Emission Reductions Annual Emission
Averages (tons)
Notes Recovery Furnace Pollutant
(units)
Potential RACT Limit
(source)
Proposed Limit
Avg Time
Current Permit Limit
Measured Emissions
NOX SO2 PM 285 286 26
Estimated Reductions (tpy)
PM (gr/dscf at 8% O2)
0.0165 (lowest w/in BAT)
1-hr 0.044 0.005 --- --- 0 1,2
PM (gr/dscf at 8% O2)
0.019 (Europe BAT)
24-hr 0.044 0.005 --- --- 0 1,2
PM (gr/dscf at 8% O2)
0.027 (lowest WA limit)
1-hr 0.044 0.005 --- --- 0 1,2
SO2 (ppm at 8% O2)
10 (lowest WA limit: w/Whr
24-hr 500 221 --- 273 --- 1,2
SO2 (ppm at 8% O2)
18 (Europe BAT: No Whr)
24-hr 500 221 --- 263 --- 1,2
SO2 (ppm at 8% O2)
75 (lowest WA limit: No Whr)
3-hr 500 221 --- 189 --- 1,2
NOX (ppm at 8% O2)
58 (Europe BAT)
24-hr 85 50 0 --- --- 1,2
NOX (ppm at 8% O2)
95 (lowest WA limit)
3-hr 85 50 0 --- --- 1,2
Notes: RF = recovery furnace. --- = not applicable. Ng = natural gas. NCG = non condensable gas incineration. Whr = wet heat recovery. 1 Measured/calculated emissions are averages of 2005-2011 compliance tests or are calculated from
2005-2009 annual emission averages and other stack parameter information. Sea level pressure assumed for absolute stack pressure (facility is approximately at sea level). NO2 molecular weight assumed for NOX (MW = 46).
2 Assumes limits with averaging periods of 24 hours or less are comparable (i.e., a daily limit would need to meet a similar value hourly limit most of the time in order to meet the daily limit.)
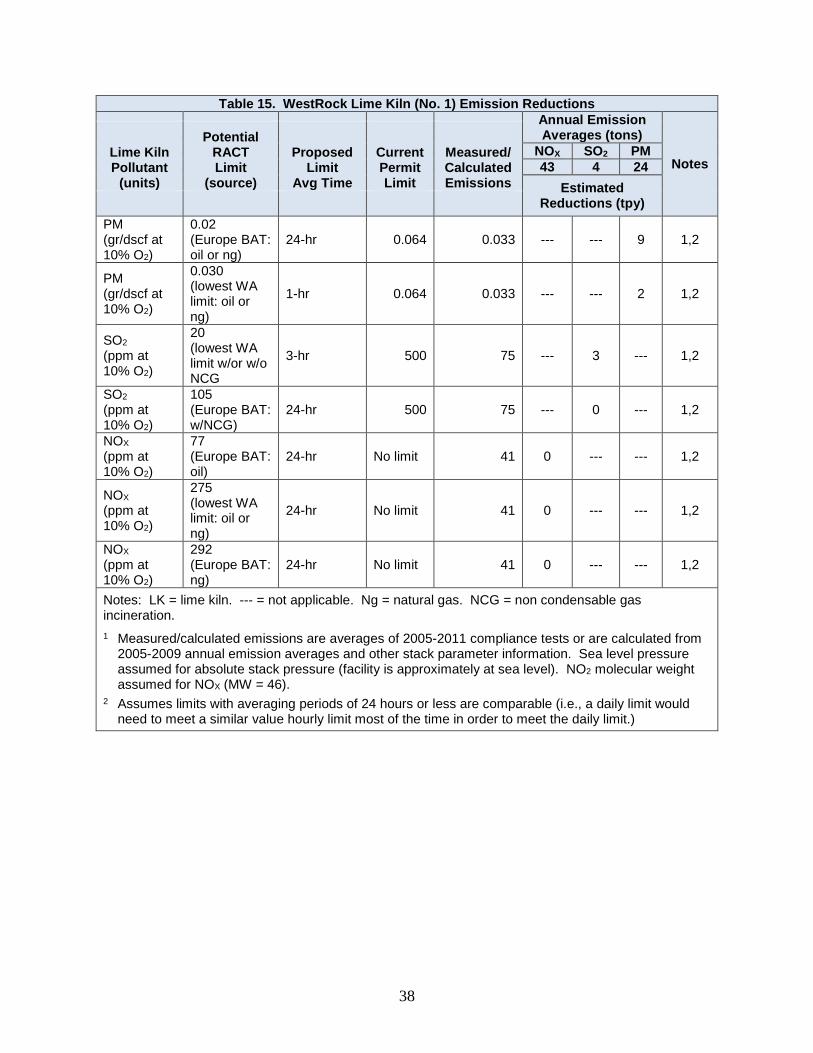
38
Table 15. WestRock Lime Kiln (No. 1) Emission Reductions Annual Emission
Averages (tons)
Notes Lime Kiln Pollutant
(units)
Potential RACT Limit
(source)
Proposed Limit
Avg Time
Current Permit Limit
Measured/ Calculated Emissions
NOX SO2 PM 43 4 24
Estimated Reductions (tpy)
PM (gr/dscf at 10% O2)
0.02 (Europe BAT: oil or ng)
24-hr 0.064 0.033 --- --- 9 1,2
PM (gr/dscf at 10% O2)
0.030 (lowest WA limit: oil or ng)
1-hr 0.064 0.033 --- --- 2 1,2
SO2 (ppm at 10% O2)
20 (lowest WA limit w/or w/o NCG
3-hr 500 75 --- 3 --- 1,2
SO2 (ppm at 10% O2)
105 (Europe BAT: w/NCG)
24-hr 500 75 --- 0 --- 1,2
NOX (ppm at 10% O2)
77 (Europe BAT: oil)
24-hr No limit 41 0 --- --- 1,2
NOX (ppm at 10% O2)
275 (lowest WA limit: oil or ng)
24-hr No limit 41 0 --- --- 1,2
NOX (ppm at 10% O2)
292 (Europe BAT: ng)
24-hr No limit 41 0 --- --- 1,2
Notes: LK = lime kiln. --- = not applicable. Ng = natural gas. NCG = non condensable gas incineration. 1 Measured/calculated emissions are averages of 2005-2011 compliance tests or are calculated from
2005-2009 annual emission averages and other stack parameter information. Sea level pressure assumed for absolute stack pressure (facility is approximately at sea level). NO2 molecular weight assumed for NOX (MW = 46).
2 Assumes limits with averaging periods of 24 hours or less are comparable (i.e., a daily limit would need to meet a similar value hourly limit most of the time in order to meet the daily limit.)

39
Table 16. WestRock Lime Kiln (No. 2) Emission Reductions Annual Emission
Averages (tons)
Notes Lime Kiln Pollutant
(units)
Potential RACT Limit
(source)
Proposed Limit
Avg Time
Current Permit Limit
Measured/ Calculated Emissions
NOX SO2 PM 2 1 5
Estimated Reductions (tpy)
PM (gr/dscf at 10% O2)
0.02 (Europe BAT: oil or ng)
24-hr 0.064 0.042 --- --- 3 1,2
PM (gr/dscf at 10% O2)
0.030 (lowest WA limit: oil or ng)
1-hr 0.064 0.042 --- --- 1 1,2
SO2 (ppm at 10% O2)
20 (lowest WA limit w/or w/o NCG
3-hr 500 73 --- 1 --- 1,2
SO2 (ppm at 10% O2)
105 (Europe BAT: w/NCG)
24-hr 500 73 --- 0 --- 1,2
NOX (ppm at 10% O2)
77 (Europe BAT: oil)
24-hr No limit 6 0 --- --- 1,2
NOX (ppm at 10% O2)
275 (lowest WA limit: oil or ng)
24-hr No limit 6 0 --- --- 1,2
NOX (ppm at 10% O2)
292 (Europe BAT: ng)
24-hr No limit 6 0 --- --- 1,2
Notes: LK = lime kiln. --- = not applicable. Ng = natural gas. NCG = non condensable gas incineration. 1 Measured/calculated emissions are averages of 2005-2011 compliance tests or are calculated from
2005-2009 annual emission averages and other stack parameter information. Sea level pressure assumed for absolute stack pressure (facility is approximately at sea level). NO2 molecular weight assumed for NOX (MW = 46).
2 Assumes limits with averaging periods of 24 hours or less are comparable (i.e., a daily limit would need to meet a similar value hourly limit most of the time in order to meet the daily limit.)
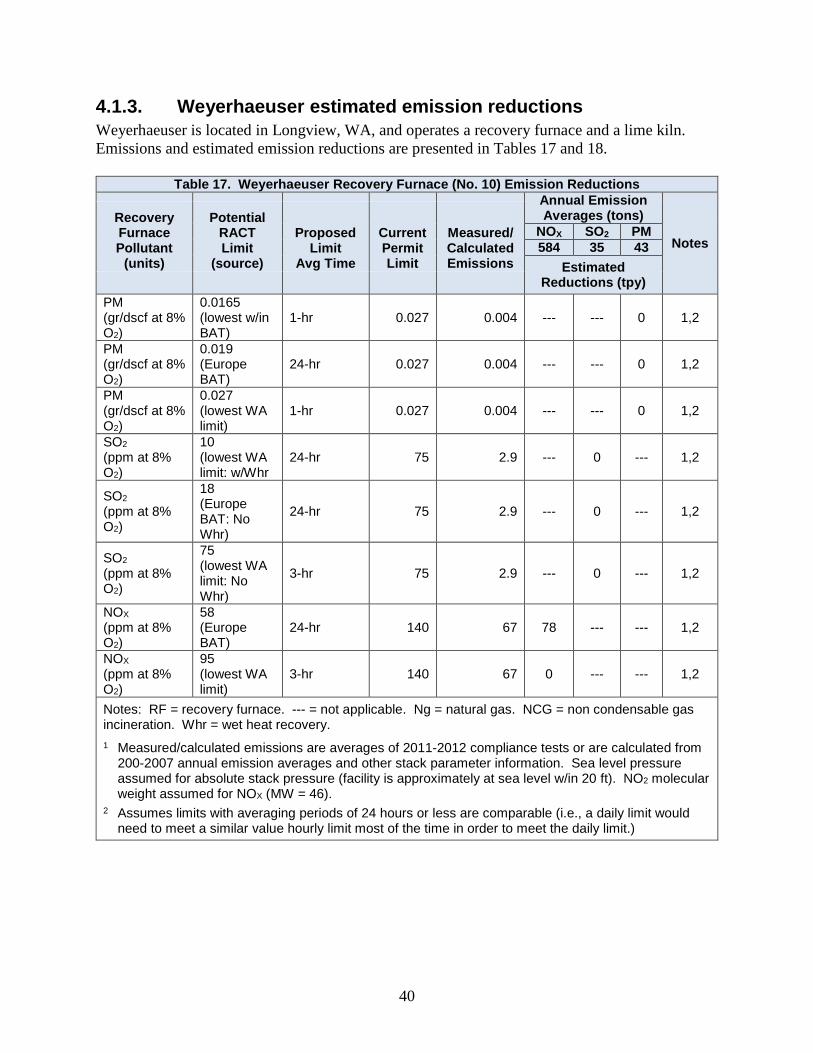
40
4.1.3. Weyerhaeuser estimated emission reductions Weyerhaeuser is located in Longview, WA, and operates a recovery furnace and a lime kiln. Emissions and estimated emission reductions are presented in Tables 17 and 18.
Table 17. Weyerhaeuser Recovery Furnace (No. 10) Emission Reductions Annual Emission
Averages (tons)
Notes
Recovery Furnace Pollutant
(units)
Potential RACT Limit
(source)
Proposed Limit
Avg Time
Current Permit Limit
Measured/ Calculated Emissions
NOX SO2 PM 584 35 43
Estimated Reductions (tpy)
PM (gr/dscf at 8% O2)
0.0165 (lowest w/in BAT)
1-hr 0.027 0.004 --- --- 0 1,2
PM (gr/dscf at 8% O2)
0.019 (Europe BAT)
24-hr 0.027 0.004 --- --- 0 1,2
PM (gr/dscf at 8% O2)
0.027 (lowest WA limit)
1-hr 0.027 0.004 --- --- 0 1,2
SO2 (ppm at 8% O2)
10 (lowest WA limit: w/Whr
24-hr 75 2.9 --- 0 --- 1,2
SO2 (ppm at 8% O2)
18 (Europe BAT: No Whr)
24-hr 75 2.9 --- 0 --- 1,2
SO2 (ppm at 8% O2)
75 (lowest WA limit: No Whr)
3-hr 75 2.9 --- 0 --- 1,2
NOX (ppm at 8% O2)
58 (Europe BAT)
24-hr 140 67 78 --- --- 1,2
NOX (ppm at 8% O2)
95 (lowest WA limit)
3-hr 140 67 0 --- --- 1,2
Notes: RF = recovery furnace. --- = not applicable. Ng = natural gas. NCG = non condensable gas incineration. Whr = wet heat recovery. 1 Measured/calculated emissions are averages of 2011-2012 compliance tests or are calculated from
200-2007 annual emission averages and other stack parameter information. Sea level pressure assumed for absolute stack pressure (facility is approximately at sea level w/in 20 ft). NO2 molecular weight assumed for NOX (MW = 46).
2 Assumes limits with averaging periods of 24 hours or less are comparable (i.e., a daily limit would need to meet a similar value hourly limit most of the time in order to meet the daily limit.)
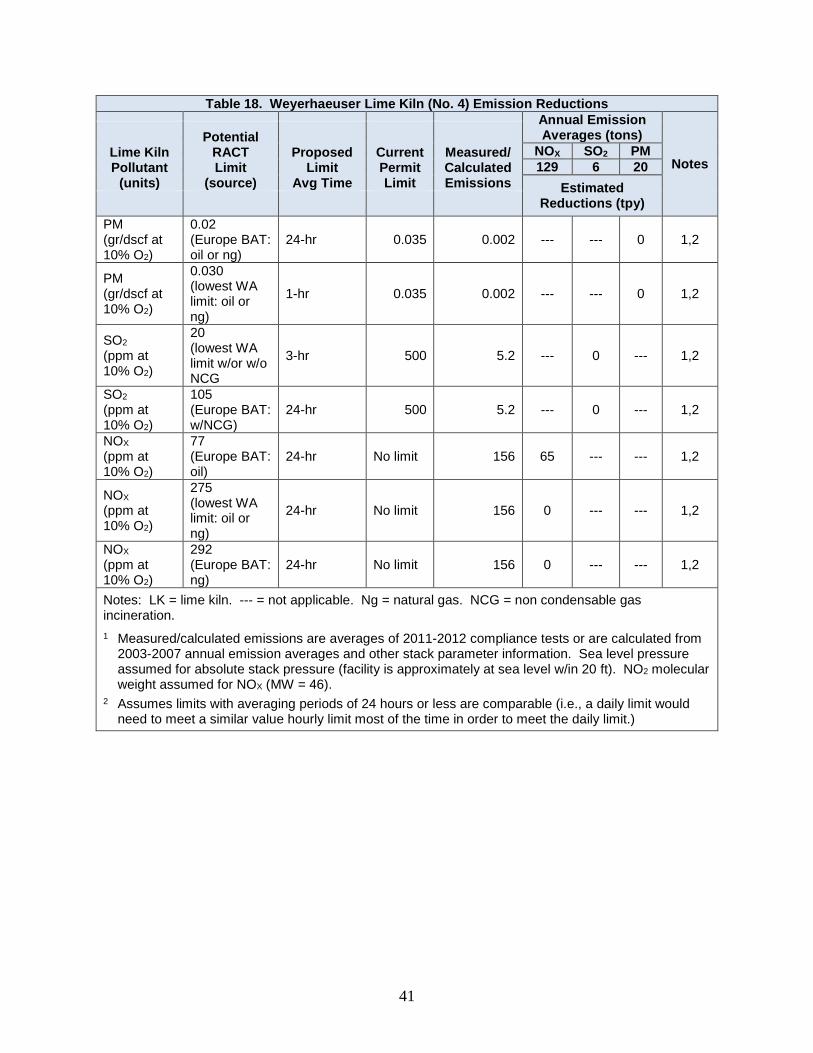
41
Table 18. Weyerhaeuser Lime Kiln (No. 4) Emission Reductions Annual Emission
Averages (tons)
Notes Lime Kiln Pollutant
(units)
Potential RACT Limit
(source)
Proposed Limit
Avg Time
Current Permit Limit
Measured/ Calculated Emissions
NOX SO2 PM 129 6 20
Estimated Reductions (tpy)
PM (gr/dscf at 10% O2)
0.02 (Europe BAT: oil or ng)
24-hr 0.035 0.002 --- --- 0 1,2
PM (gr/dscf at 10% O2)
0.030 (lowest WA limit: oil or ng)
1-hr 0.035 0.002 --- --- 0 1,2
SO2 (ppm at 10% O2)
20 (lowest WA limit w/or w/o NCG
3-hr 500 5.2 --- 0 --- 1,2
SO2 (ppm at 10% O2)
105 (Europe BAT: w/NCG)
24-hr 500 5.2 --- 0 --- 1,2
NOX (ppm at 10% O2)
77 (Europe BAT: oil)
24-hr No limit 156 65 --- --- 1,2
NOX (ppm at 10% O2)
275 (lowest WA limit: oil or ng)
24-hr No limit 156 0 --- --- 1,2
NOX (ppm at 10% O2)
292 (Europe BAT: ng)
24-hr No limit 156 0 --- --- 1,2
Notes: LK = lime kiln. --- = not applicable. Ng = natural gas. NCG = non condensable gas incineration. 1 Measured/calculated emissions are averages of 2011-2012 compliance tests or are calculated from
2003-2007 annual emission averages and other stack parameter information. Sea level pressure assumed for absolute stack pressure (facility is approximately at sea level w/in 20 ft). NO2 molecular weight assumed for NOX (MW = 46).
2 Assumes limits with averaging periods of 24 hours or less are comparable (i.e., a daily limit would need to meet a similar value hourly limit most of the time in order to meet the daily limit.)
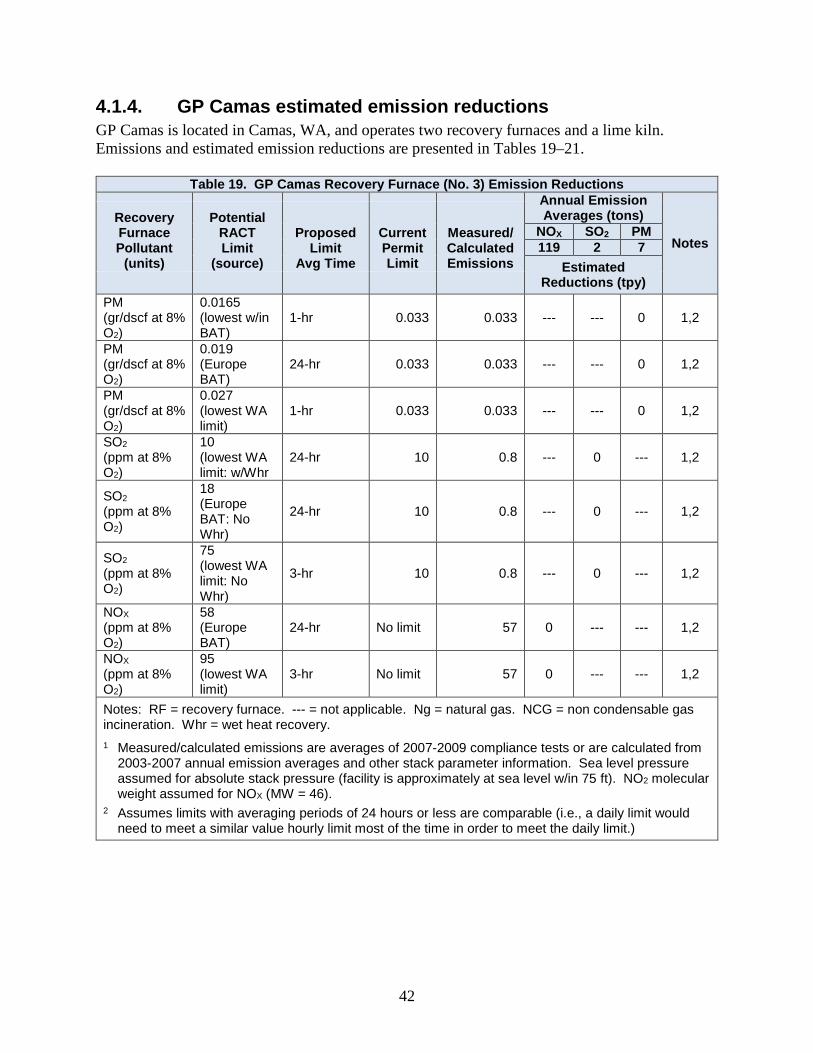
42
4.1.4. GP Camas estimated emission reductions GP Camas is located in Camas, WA, and operates two recovery furnaces and a lime kiln. Emissions and estimated emission reductions are presented in Tables 19–21.
Table 19. GP Camas Recovery Furnace (No. 3) Emission Reductions Annual Emission
Averages (tons)
Notes
Recovery Furnace Pollutant
(units)
Potential RACT Limit
(source)
Proposed Limit
Avg Time
Current Permit Limit
Measured/ Calculated Emissions
NOX SO2 PM 119 2 7
Estimated Reductions (tpy)
PM (gr/dscf at 8% O2)
0.0165 (lowest w/in BAT)
1-hr 0.033 0.033 --- --- 0 1,2
PM (gr/dscf at 8% O2)
0.019 (Europe BAT)
24-hr 0.033 0.033 --- --- 0 1,2
PM (gr/dscf at 8% O2)
0.027 (lowest WA limit)
1-hr 0.033 0.033 --- --- 0 1,2
SO2 (ppm at 8% O2)
10 (lowest WA limit: w/Whr
24-hr 10 0.8 --- 0 --- 1,2
SO2 (ppm at 8% O2)
18 (Europe BAT: No Whr)
24-hr 10 0.8 --- 0 --- 1,2
SO2 (ppm at 8% O2)
75 (lowest WA limit: No Whr)
3-hr 10 0.8 --- 0 --- 1,2
NOX (ppm at 8% O2)
58 (Europe BAT)
24-hr No limit 57 0 --- --- 1,2
NOX (ppm at 8% O2)
95 (lowest WA limit)
3-hr No limit 57 0 --- --- 1,2
Notes: RF = recovery furnace. --- = not applicable. Ng = natural gas. NCG = non condensable gas incineration. Whr = wet heat recovery. 1 Measured/calculated emissions are averages of 2007-2009 compliance tests or are calculated from
2003-2007 annual emission averages and other stack parameter information. Sea level pressure assumed for absolute stack pressure (facility is approximately at sea level w/in 75 ft). NO2 molecular weight assumed for NOX (MW = 46).
2 Assumes limits with averaging periods of 24 hours or less are comparable (i.e., a daily limit would need to meet a similar value hourly limit most of the time in order to meet the daily limit.)
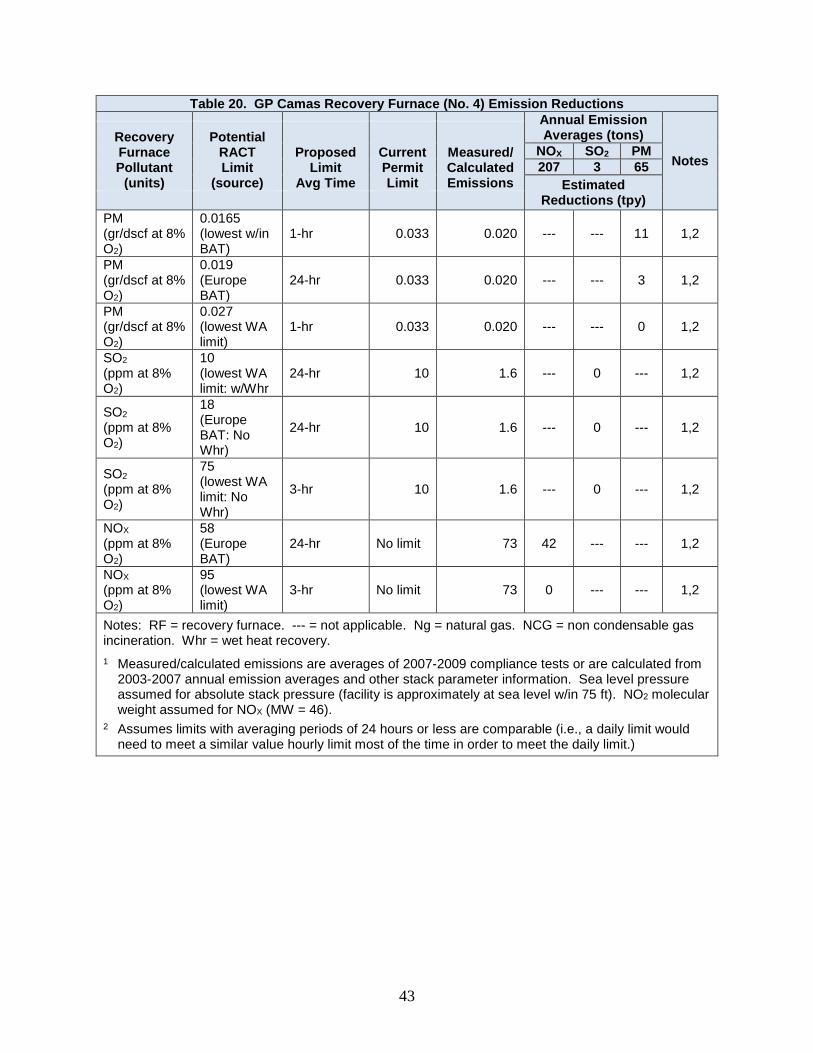
43
Table 20. GP Camas Recovery Furnace (No. 4) Emission Reductions Annual Emission
Averages (tons)
Notes
Recovery Furnace Pollutant
(units)
Potential RACT Limit
(source)
Proposed Limit
Avg Time
Current Permit Limit
Measured/ Calculated Emissions
NOX SO2 PM 207 3 65
Estimated Reductions (tpy)
PM (gr/dscf at 8% O2)
0.0165 (lowest w/in BAT)
1-hr 0.033 0.020 --- --- 11 1,2
PM (gr/dscf at 8% O2)
0.019 (Europe BAT)
24-hr 0.033 0.020 --- --- 3 1,2
PM (gr/dscf at 8% O2)
0.027 (lowest WA limit)
1-hr 0.033 0.020 --- --- 0 1,2
SO2 (ppm at 8% O2)
10 (lowest WA limit: w/Whr
24-hr 10 1.6 --- 0 --- 1,2
SO2 (ppm at 8% O2)
18 (Europe BAT: No Whr)
24-hr 10 1.6 --- 0 --- 1,2
SO2 (ppm at 8% O2)
75 (lowest WA limit: No Whr)
3-hr 10 1.6 --- 0 --- 1,2
NOX (ppm at 8% O2)
58 (Europe BAT)
24-hr No limit 73 42 --- --- 1,2
NOX (ppm at 8% O2)
95 (lowest WA limit)
3-hr No limit 73 0 --- --- 1,2
Notes: RF = recovery furnace. --- = not applicable. Ng = natural gas. NCG = non condensable gas incineration. Whr = wet heat recovery. 1 Measured/calculated emissions are averages of 2007-2009 compliance tests or are calculated from
2003-2007 annual emission averages and other stack parameter information. Sea level pressure assumed for absolute stack pressure (facility is approximately at sea level w/in 75 ft). NO2 molecular weight assumed for NOX (MW = 46).
2 Assumes limits with averaging periods of 24 hours or less are comparable (i.e., a daily limit would need to meet a similar value hourly limit most of the time in order to meet the daily limit.)
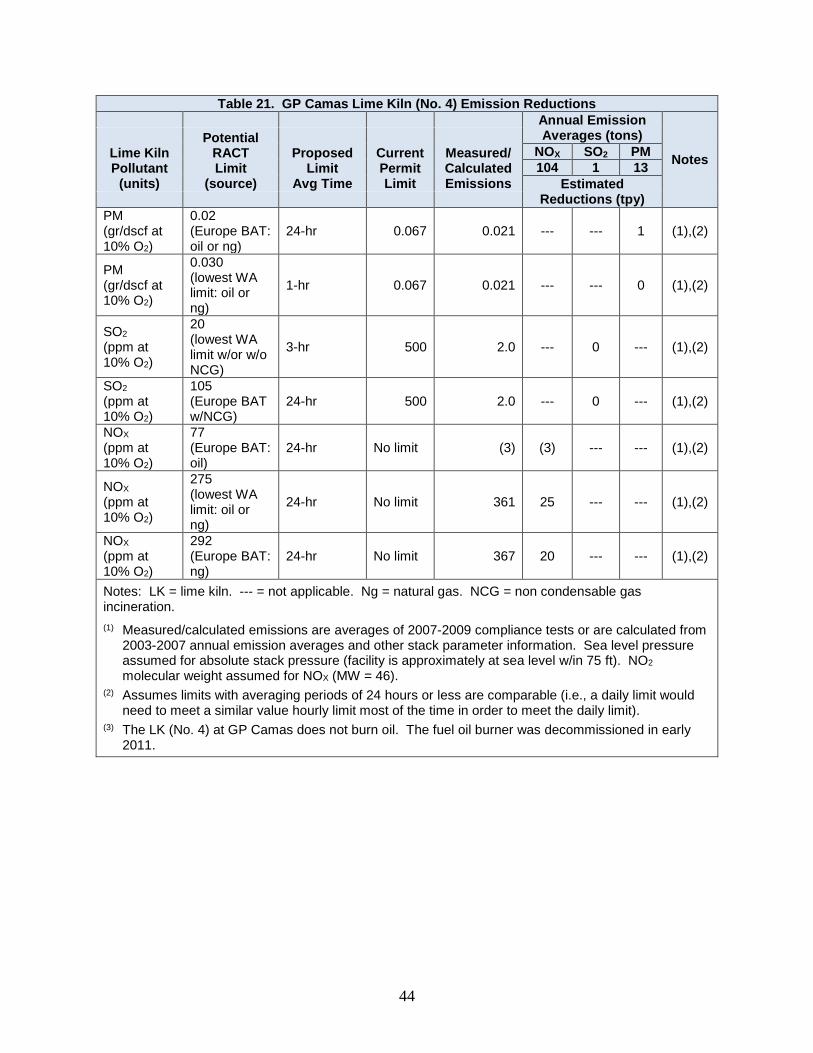
44
Table 21. GP Camas Lime Kiln (No. 4) Emission Reductions Annual Emission
Averages (tons)
Notes Lime Kiln Pollutant
(units)
Potential RACT Limit
(source)
Proposed Limit
Avg Time
Current Permit Limit
Measured/ Calculated Emissions
NOX SO2 PM 104 1 13
Estimated Reductions (tpy)
PM (gr/dscf at 10% O2)
0.02 (Europe BAT: oil or ng)
24-hr 0.067 0.021 --- --- 1 (1),(2)
PM (gr/dscf at 10% O2)
0.030 (lowest WA limit: oil or ng)
1-hr 0.067 0.021 --- --- 0 (1),(2)
SO2 (ppm at 10% O2)
20 (lowest WA limit w/or w/o NCG)
3-hr 500 2.0 --- 0 --- (1),(2)
SO2 (ppm at 10% O2)
105 (Europe BAT w/NCG)
24-hr 500 2.0 --- 0 --- (1),(2)
NOX (ppm at 10% O2)
77 (Europe BAT: oil)
24-hr No limit (3) (3) --- --- (1),(2)
NOX (ppm at 10% O2)
275 (lowest WA limit: oil or ng)
24-hr No limit 361 25 --- --- (1),(2)
NOX (ppm at 10% O2)
292 (Europe BAT: ng)
24-hr No limit 367 20 --- --- (1),(2)
Notes: LK = lime kiln. --- = not applicable. Ng = natural gas. NCG = non condensable gas incineration. (1) Measured/calculated emissions are averages of 2007-2009 compliance tests or are calculated from
2003-2007 annual emission averages and other stack parameter information. Sea level pressure assumed for absolute stack pressure (facility is approximately at sea level w/in 75 ft). NO2 molecular weight assumed for NOX (MW = 46).
(2) Assumes limits with averaging periods of 24 hours or less are comparable (i.e., a daily limit would need to meet a similar value hourly limit most of the time in order to meet the daily limit).
(3) The LK (No. 4) at GP Camas does not burn oil. The fuel oil burner was decommissioned in early 2011.
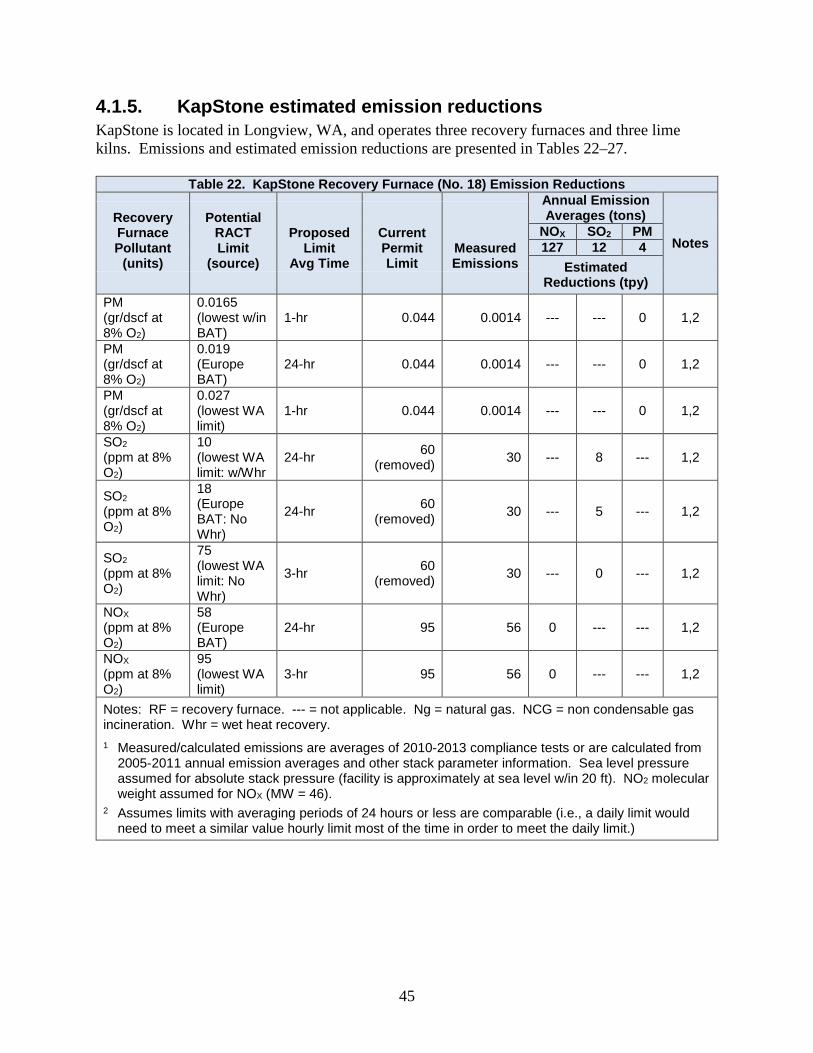
45
4.1.5. KapStone estimated emission reductions KapStone is located in Longview, WA, and operates three recovery furnaces and three lime kilns. Emissions and estimated emission reductions are presented in Tables 22–27.
Table 22. KapStone Recovery Furnace (No. 18) Emission Reductions Annual Emission
Averages (tons)
Notes
Recovery Furnace Pollutant
(units)
Potential RACT Limit
(source)
Proposed Limit
Avg Time
Current Permit Limit
Measured Emissions
NOX SO2 PM 127 12 4
Estimated Reductions (tpy)
PM (gr/dscf at 8% O2)
0.0165 (lowest w/in BAT)
1-hr 0.044 0.0014 --- --- 0 1,2
PM (gr/dscf at 8% O2)
0.019 (Europe BAT)
24-hr 0.044 0.0014 --- --- 0 1,2
PM (gr/dscf at 8% O2)
0.027 (lowest WA limit)
1-hr 0.044 0.0014 --- --- 0 1,2
SO2 (ppm at 8% O2)
10 (lowest WA limit: w/Whr
24-hr 60 (removed) 30 --- 8 --- 1,2
SO2 (ppm at 8% O2)
18 (Europe BAT: No Whr)
24-hr 60 (removed) 30 --- 5 --- 1,2
SO2 (ppm at 8% O2)
75 (lowest WA limit: No Whr)
3-hr 60 (removed) 30 --- 0 --- 1,2
NOX (ppm at 8% O2)
58 (Europe BAT)
24-hr 95 56 0 --- --- 1,2
NOX (ppm at 8% O2)
95 (lowest WA limit)
3-hr 95 56 0 --- --- 1,2
Notes: RF = recovery furnace. --- = not applicable. Ng = natural gas. NCG = non condensable gas incineration. Whr = wet heat recovery. 1 Measured/calculated emissions are averages of 2010-2013 compliance tests or are calculated from
2005-2011 annual emission averages and other stack parameter information. Sea level pressure assumed for absolute stack pressure (facility is approximately at sea level w/in 20 ft). NO2 molecular weight assumed for NOX (MW = 46).
2 Assumes limits with averaging periods of 24 hours or less are comparable (i.e., a daily limit would need to meet a similar value hourly limit most of the time in order to meet the daily limit.)
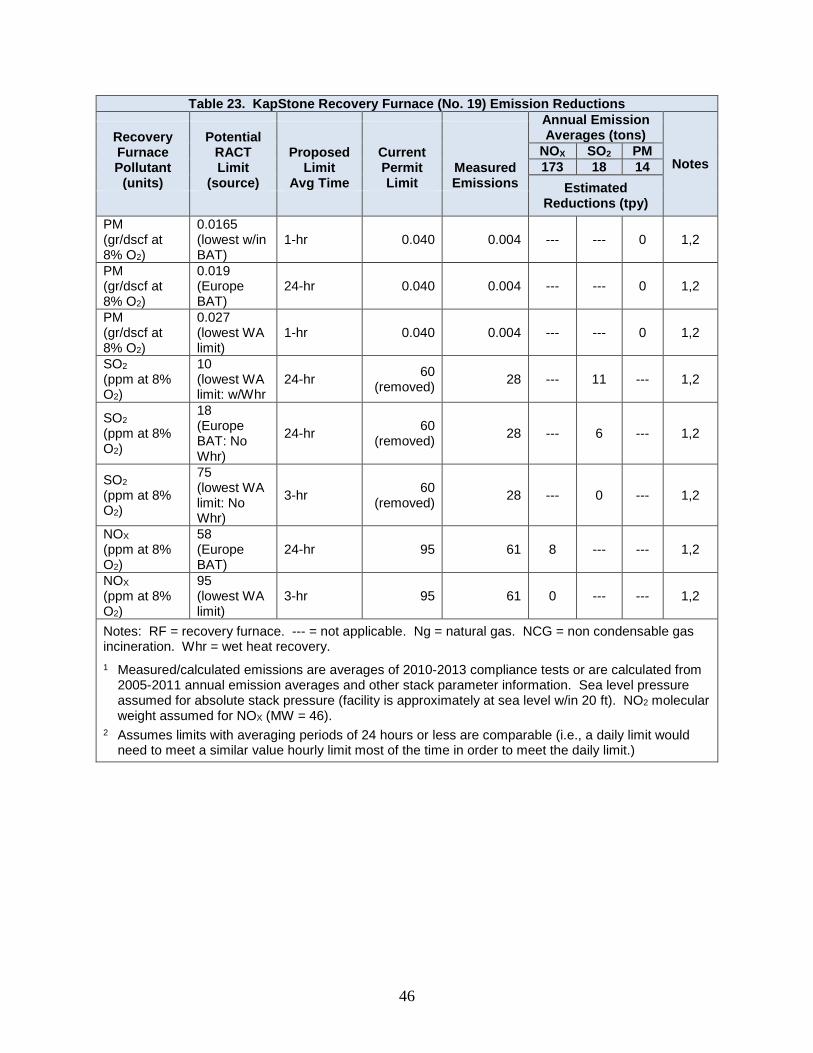
46
Table 23. KapStone Recovery Furnace (No. 19) Emission Reductions Annual Emission
Averages (tons)
Notes
Recovery Furnace Pollutant
(units)
Potential RACT Limit
(source)
Proposed Limit
Avg Time
Current Permit Limit
Measured Emissions
NOX SO2 PM 173 18 14
Estimated Reductions (tpy)
PM (gr/dscf at 8% O2)
0.0165 (lowest w/in BAT)
1-hr 0.040 0.004 --- --- 0 1,2
PM (gr/dscf at 8% O2)
0.019 (Europe BAT)
24-hr 0.040 0.004 --- --- 0 1,2
PM (gr/dscf at 8% O2)
0.027 (lowest WA limit)
1-hr 0.040 0.004 --- --- 0 1,2
SO2 (ppm at 8% O2)
10 (lowest WA limit: w/Whr
24-hr 60 (removed) 28 --- 11 --- 1,2
SO2 (ppm at 8% O2)
18 (Europe BAT: No Whr)
24-hr 60 (removed) 28 --- 6 --- 1,2
SO2 (ppm at 8% O2)
75 (lowest WA limit: No Whr)
3-hr 60 (removed) 28 --- 0 --- 1,2
NOX (ppm at 8% O2)
58 (Europe BAT)
24-hr 95 61 8 --- --- 1,2
NOX (ppm at 8% O2)
95 (lowest WA limit)
3-hr 95 61 0 --- --- 1,2
Notes: RF = recovery furnace. --- = not applicable. Ng = natural gas. NCG = non condensable gas incineration. Whr = wet heat recovery. 1 Measured/calculated emissions are averages of 2010-2013 compliance tests or are calculated from
2005-2011 annual emission averages and other stack parameter information. Sea level pressure assumed for absolute stack pressure (facility is approximately at sea level w/in 20 ft). NO2 molecular weight assumed for NOX (MW = 46).
2 Assumes limits with averaging periods of 24 hours or less are comparable (i.e., a daily limit would need to meet a similar value hourly limit most of the time in order to meet the daily limit.)

47
Table 24. KapStone Recovery Furnace (No. 22) Emission Reductions Annual Emission
Averages (tons)
Notes
Recovery Furnace Pollutant
(units)
Potential RACT Limit
(source)
Proposed Limit
Avg Time
Current Permit Limit
Measured Emissions
NOX SO2 PM 268 60 8
Estimated Reductions (tpy)
PM (gr/dscf at 8% O2)
0.0165 (lowest w/in BAT)
1-hr 0.027 0.001 --- --- 0 1,2
PM (gr/dscf at 8% O2)
0.019 (Europe BAT)
24-hr 0.027 0.001 --- --- 0 1,2
PM (gr/dscf at 8% O2)
0.027 (lowest WA limit)
1-hr 0.027 0.001 --- --- 0 1,2
SO2 (ppm at 8% O2)
10 (lowest WA limit: w/Whr
24-hr 120 (removed) 86 --- 53 --- 1,2
SO2 (ppm at 8% O2)
18 (Europe BAT: No Whr)
24-hr 120 (removed) 86 --- 47 --- 1,2
SO2 (ppm at 8% O2)
75 (lowest WA limit: No Whr)
3-hr 120 (removed) 86 --- 8 --- 1,2
NOX (ppm at 8% O2)
58 (Europe BAT)
24-hr 95 66 32 --- --- 1,2
NOX (ppm at 8% O2)
95 (lowest WA limit)
3-hr 95 66 0 --- --- 1,2
Notes: RF = recovery furnace. --- = not applicable. Ng = natural gas. NCG = non condensable gas incineration. Whr = wet heat recovery. 1 Measured/calculated emissions are averages of 2010-2013 compliance tests or are calculated from
2005-2011 annual emission averages and other stack parameter information. Sea level pressure assumed for absolute stack pressure (facility is approximately at sea level w/in 20 ft). NO2 molecular weight assumed for NOX (MW = 46).
2 Assumes limits with averaging periods of 24 hours or less are comparable (i.e., a daily limit would need to meet a similar value hourly limit most of the time in order to meet the daily limit.)
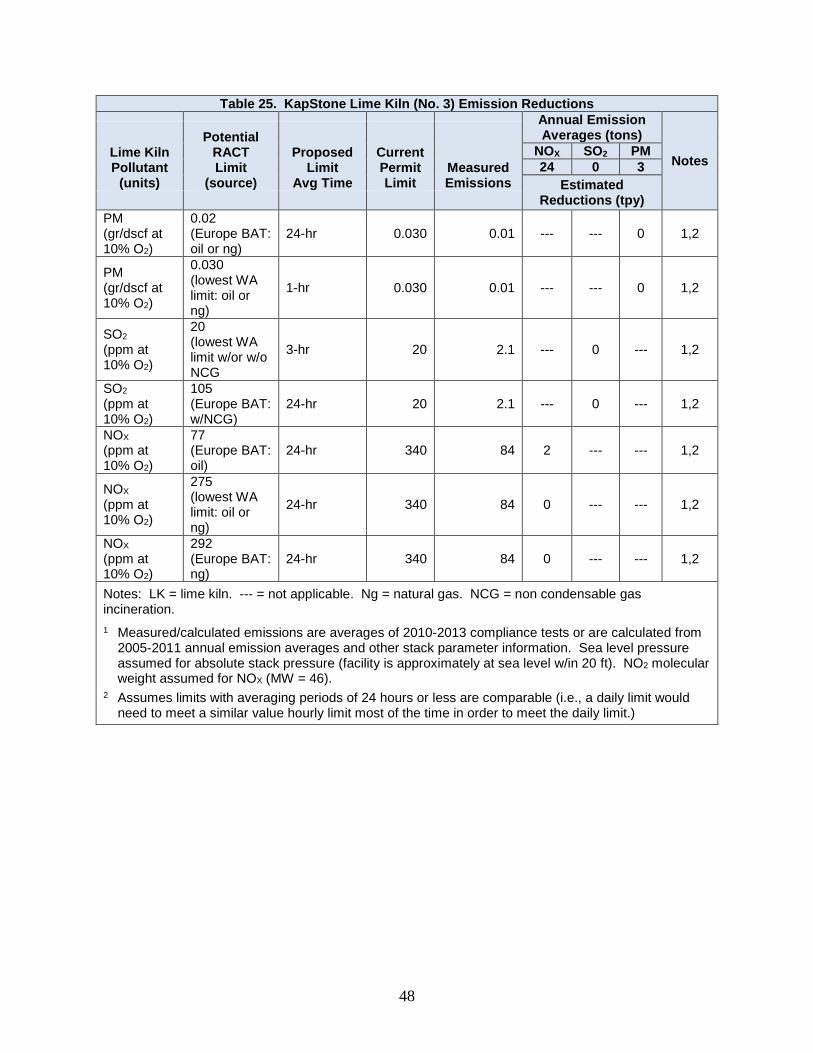
48
Table 25. KapStone Lime Kiln (No. 3) Emission Reductions Annual Emission
Averages (tons)
Notes Lime Kiln Pollutant
(units)
Potential RACT Limit
(source)
Proposed Limit
Avg Time
Current Permit Limit
Measured Emissions
NOX SO2 PM 24 0 3
Estimated Reductions (tpy)
PM (gr/dscf at 10% O2)
0.02 (Europe BAT: oil or ng)
24-hr 0.030 0.01 --- --- 0 1,2
PM (gr/dscf at 10% O2)
0.030 (lowest WA limit: oil or ng)
1-hr 0.030 0.01 --- --- 0 1,2
SO2 (ppm at 10% O2)
20 (lowest WA limit w/or w/o NCG
3-hr 20 2.1 --- 0 --- 1,2
SO2 (ppm at 10% O2)
105 (Europe BAT: w/NCG)
24-hr 20 2.1 --- 0 --- 1,2
NOX (ppm at 10% O2)
77 (Europe BAT: oil)
24-hr 340 84 2 --- --- 1,2
NOX (ppm at 10% O2)
275 (lowest WA limit: oil or ng)
24-hr 340 84 0 --- --- 1,2
NOX (ppm at 10% O2)
292 (Europe BAT: ng)
24-hr 340 84 0 --- --- 1,2
Notes: LK = lime kiln. --- = not applicable. Ng = natural gas. NCG = non condensable gas incineration. 1 Measured/calculated emissions are averages of 2010-2013 compliance tests or are calculated from
2005-2011 annual emission averages and other stack parameter information. Sea level pressure assumed for absolute stack pressure (facility is approximately at sea level w/in 20 ft). NO2 molecular weight assumed for NOX (MW = 46).
2 Assumes limits with averaging periods of 24 hours or less are comparable (i.e., a daily limit would need to meet a similar value hourly limit most of the time in order to meet the daily limit.)
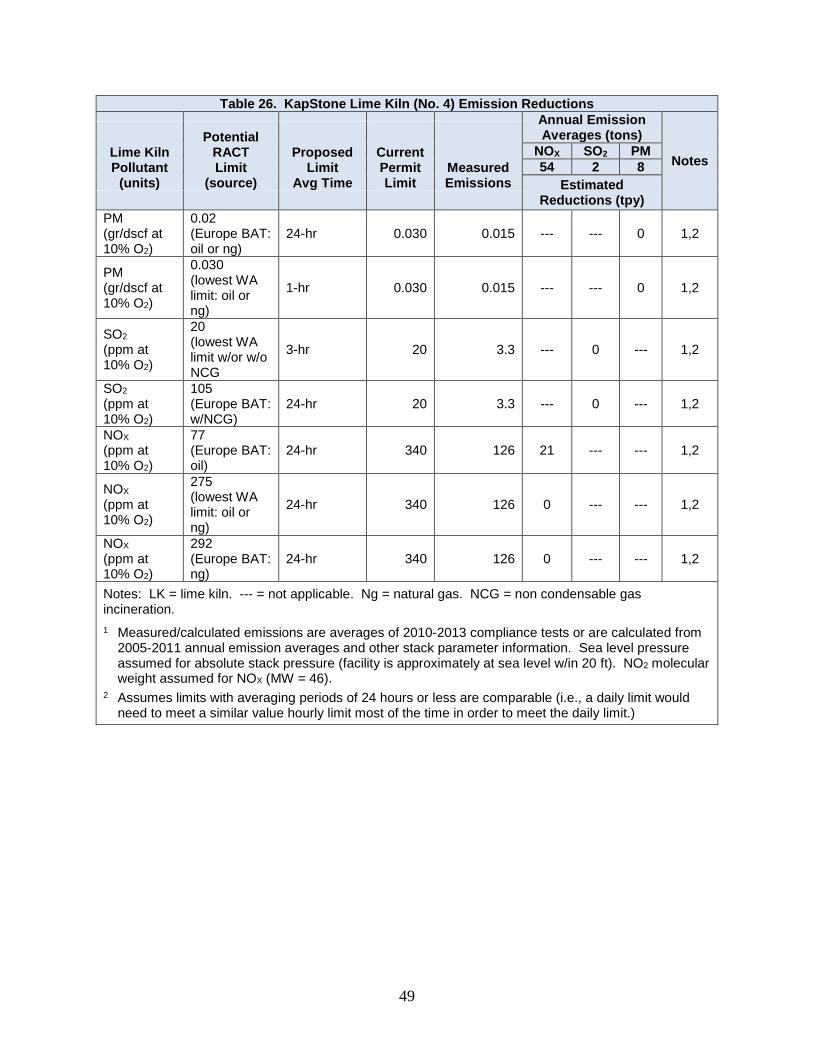
49
Table 26. KapStone Lime Kiln (No. 4) Emission Reductions Annual Emission
Averages (tons)
Notes Lime Kiln Pollutant
(units)
Potential RACT Limit
(source)
Proposed Limit
Avg Time
Current Permit Limit
Measured Emissions
NOX SO2 PM 54 2 8
Estimated Reductions (tpy)
PM (gr/dscf at 10% O2)
0.02 (Europe BAT: oil or ng)
24-hr 0.030 0.015 --- --- 0 1,2
PM (gr/dscf at 10% O2)
0.030 (lowest WA limit: oil or ng)
1-hr 0.030 0.015 --- --- 0 1,2
SO2 (ppm at 10% O2)
20 (lowest WA limit w/or w/o NCG
3-hr 20 3.3 --- 0 --- 1,2
SO2 (ppm at 10% O2)
105 (Europe BAT: w/NCG)
24-hr 20 3.3 --- 0 --- 1,2
NOX (ppm at 10% O2)
77 (Europe BAT: oil)
24-hr 340 126 21 --- --- 1,2
NOX (ppm at 10% O2)
275 (lowest WA limit: oil or ng)
24-hr 340 126 0 --- --- 1,2
NOX (ppm at 10% O2)
292 (Europe BAT: ng)
24-hr 340 126 0 --- --- 1,2
Notes: LK = lime kiln. --- = not applicable. Ng = natural gas. NCG = non condensable gas incineration. 1 Measured/calculated emissions are averages of 2010-2013 compliance tests or are calculated from
2005-2011 annual emission averages and other stack parameter information. Sea level pressure assumed for absolute stack pressure (facility is approximately at sea level w/in 20 ft). NO2 molecular weight assumed for NOX (MW = 46).
2 Assumes limits with averaging periods of 24 hours or less are comparable (i.e., a daily limit would need to meet a similar value hourly limit most of the time in order to meet the daily limit.)
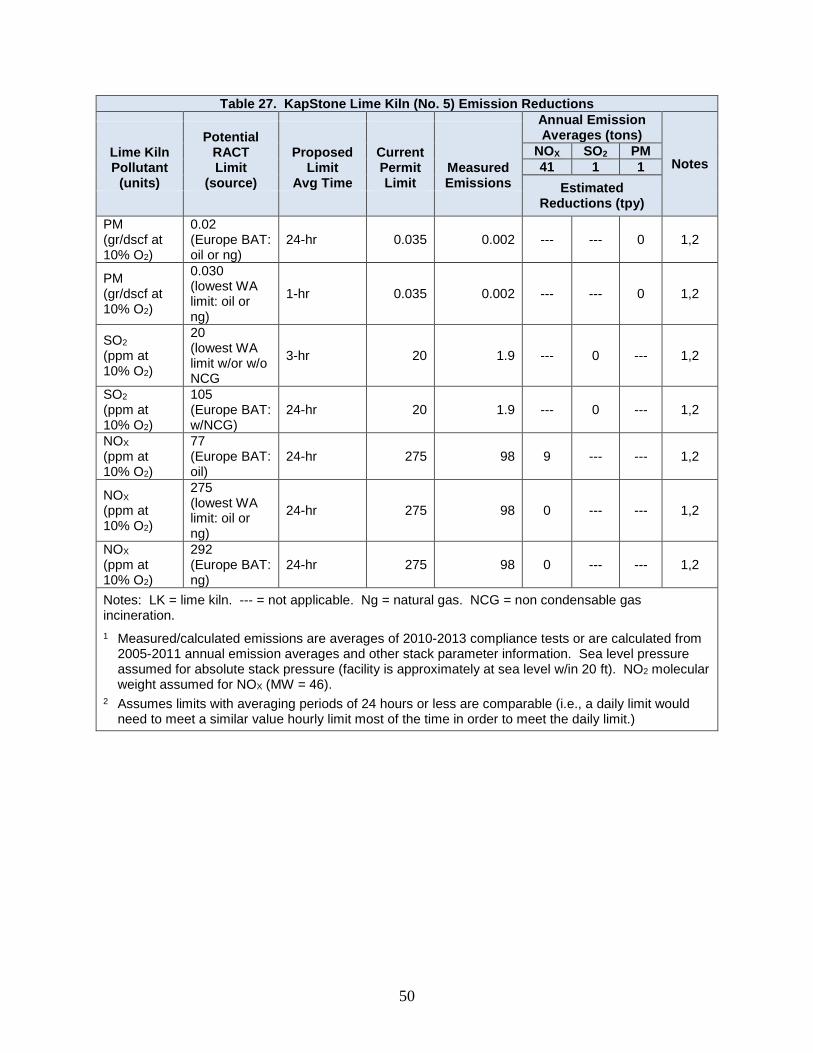
50
Table 27. KapStone Lime Kiln (No. 5) Emission Reductions Annual Emission
Averages (tons)
Notes Lime Kiln Pollutant
(units)
Potential RACT Limit
(source)
Proposed Limit
Avg Time
Current Permit Limit
Measured Emissions
NOX SO2 PM 41 1 1
Estimated Reductions (tpy)
PM (gr/dscf at 10% O2)
0.02 (Europe BAT: oil or ng)
24-hr 0.035 0.002 --- --- 0 1,2
PM (gr/dscf at 10% O2)
0.030 (lowest WA limit: oil or ng)
1-hr 0.035 0.002 --- --- 0 1,2
SO2 (ppm at 10% O2)
20 (lowest WA limit w/or w/o NCG
3-hr 20 1.9 --- 0 --- 1,2
SO2 (ppm at 10% O2)
105 (Europe BAT: w/NCG)
24-hr 20 1.9 --- 0 --- 1,2
NOX (ppm at 10% O2)
77 (Europe BAT: oil)
24-hr 275 98 9 --- --- 1,2
NOX (ppm at 10% O2)
275 (lowest WA limit: oil or ng)
24-hr 275 98 0 --- --- 1,2
NOX (ppm at 10% O2)
292 (Europe BAT: ng)
24-hr 275 98 0 --- --- 1,2
Notes: LK = lime kiln. --- = not applicable. Ng = natural gas. NCG = non condensable gas incineration. 1 Measured/calculated emissions are averages of 2010-2013 compliance tests or are calculated from
2005-2011 annual emission averages and other stack parameter information. Sea level pressure assumed for absolute stack pressure (facility is approximately at sea level w/in 20 ft). NO2 molecular weight assumed for NOX (MW = 46).
2 Assumes limits with averaging periods of 24 hours or less are comparable (i.e., a daily limit would need to meet a similar value hourly limit most of the time in order to meet the daily limit.)
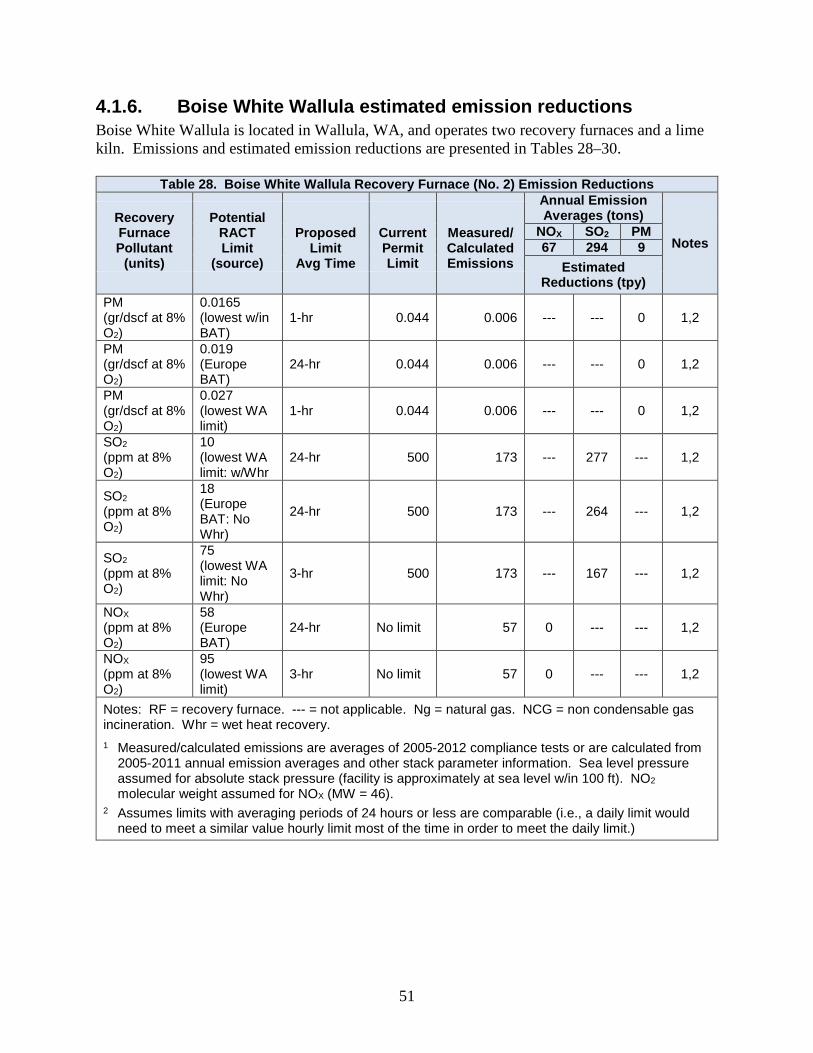
51
4.1.6. Boise White Wallula estimated emission reductions Boise White Wallula is located in Wallula, WA, and operates two recovery furnaces and a lime kiln. Emissions and estimated emission reductions are presented in Tables 28–30.
Table 28. Boise White Wallula Recovery Furnace (No. 2) Emission Reductions Annual Emission
Averages (tons)
Notes
Recovery Furnace Pollutant
(units)
Potential RACT Limit
(source)
Proposed Limit
Avg Time
Current Permit Limit
Measured/ Calculated Emissions
NOX SO2 PM 67 294 9
Estimated Reductions (tpy)
PM (gr/dscf at 8% O2)
0.0165 (lowest w/in BAT)
1-hr 0.044 0.006 --- --- 0 1,2
PM (gr/dscf at 8% O2)
0.019 (Europe BAT)
24-hr 0.044 0.006 --- --- 0 1,2
PM (gr/dscf at 8% O2)
0.027 (lowest WA limit)
1-hr 0.044 0.006 --- --- 0 1,2
SO2 (ppm at 8% O2)
10 (lowest WA limit: w/Whr
24-hr 500 173 --- 277 --- 1,2
SO2 (ppm at 8% O2)
18 (Europe BAT: No Whr)
24-hr 500 173 --- 264 --- 1,2
SO2 (ppm at 8% O2)
75 (lowest WA limit: No Whr)
3-hr 500 173 --- 167 --- 1,2
NOX (ppm at 8% O2)
58 (Europe BAT)
24-hr No limit 57 0 --- --- 1,2
NOX (ppm at 8% O2)
95 (lowest WA limit)
3-hr No limit 57 0 --- --- 1,2
Notes: RF = recovery furnace. --- = not applicable. Ng = natural gas. NCG = non condensable gas incineration. Whr = wet heat recovery. 1 Measured/calculated emissions are averages of 2005-2012 compliance tests or are calculated from
2005-2011 annual emission averages and other stack parameter information. Sea level pressure assumed for absolute stack pressure (facility is approximately at sea level w/in 100 ft). NO2 molecular weight assumed for NOX (MW = 46).
2 Assumes limits with averaging periods of 24 hours or less are comparable (i.e., a daily limit would need to meet a similar value hourly limit most of the time in order to meet the daily limit.)

52
Table 29. Boise White Wallula Recovery Furnace (No. 3) Emission Reductions Annual Emission
Averages (tons)
Notes
Recovery Furnace Pollutant
(units)
Potential RACT Limit
(source)
Proposed Limit
Avg Time
Current Permit Limit
Measured Emissions
NOX SO2 PM 285 496 15
Estimated Reductions (tpy)
PM (gr/dscf at 8% O2)
0.0165 (lowest w/in BAT)
1-hr 0.027 0.003 --- --- 0 1,2
PM (gr/dscf at 8% O2)
0.019 (Europe BAT)
24-hr 0.027 0.003 --- --- 0 1,2
PM (gr/dscf at 8% O2)
0.027 (lowest WA limit)
1-hr 0.027 0.003 --- --- 0 1,2
SO2 (ppm at 8% O2)
10 (lowest WA limit: w/Whr
24-hr 500 49 --- 395 --- 1,2
SO2 (ppm at 8% O2)
18 (Europe BAT: No Whr)
24-hr 500 49 --- 314 --- 1,2
SO2 (ppm at 8% O2)
75 (lowest WA limit: No Whr)
3-hr 500 49 --- 0 --- 1,2
NOX (ppm at 8% O2)
58 (Europe BAT)
24-hr 112 61 14 --- --- 1,2
NOX (ppm at 8% O2)
95 (lowest WA limit)
3-hr 112 61 0 --- --- 1,2
Notes: RF = recovery furnace. --- = not applicable. Ng = natural gas. NCG = non condensable gas incineration. Whr = wet heat recovery. 1 Measured/calculated emissions are averages of 2005-2012 compliance tests or are calculated from
2005-2011 annual emission averages and other stack parameter information. Sea level pressure assumed for absolute stack pressure (facility is approximately at sea level w/in 100 ft). NO2 molecular weight assumed for NOX (MW = 46).
2 Assumes limits with averaging periods of 24 hours or less are comparable (i.e., a daily limit would need to meet a similar value hourly limit most of the time in order to meet the daily limit.)
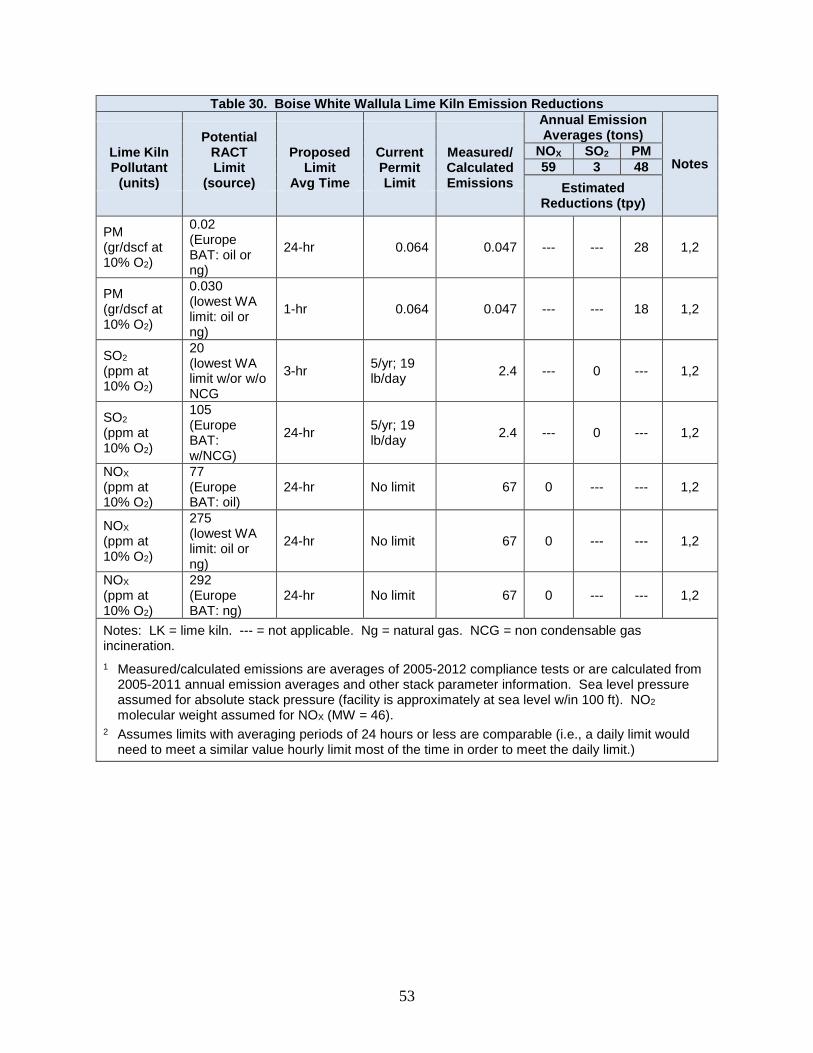
53
Table 30. Boise White Wallula Lime Kiln Emission Reductions Annual Emission
Averages (tons)
Notes Lime Kiln Pollutant
(units)
Potential RACT Limit
(source)
Proposed Limit
Avg Time
Current Permit Limit
Measured/ Calculated Emissions
NOX SO2 PM 59 3 48
Estimated Reductions (tpy)
PM (gr/dscf at 10% O2)
0.02 (Europe BAT: oil or ng)
24-hr 0.064 0.047 --- --- 28 1,2
PM (gr/dscf at 10% O2)
0.030 (lowest WA limit: oil or ng)
1-hr 0.064 0.047 --- --- 18 1,2
SO2 (ppm at 10% O2)
20 (lowest WA limit w/or w/o NCG
3-hr 5/yr; 19 lb/day 2.4 --- 0 --- 1,2
SO2 (ppm at 10% O2)
105 (Europe BAT: w/NCG)
24-hr 5/yr; 19 lb/day 2.4 --- 0 --- 1,2
NOX (ppm at 10% O2)
77 (Europe BAT: oil)
24-hr No limit 67 0 --- --- 1,2
NOX (ppm at 10% O2)
275 (lowest WA limit: oil or ng)
24-hr No limit 67 0 --- --- 1,2
NOX (ppm at 10% O2)
292 (Europe BAT: ng)
24-hr No limit 67 0 --- --- 1,2
Notes: LK = lime kiln. --- = not applicable. Ng = natural gas. NCG = non condensable gas incineration. 1 Measured/calculated emissions are averages of 2005-2012 compliance tests or are calculated from
2005-2011 annual emission averages and other stack parameter information. Sea level pressure assumed for absolute stack pressure (facility is approximately at sea level w/in 100 ft). NO2 molecular weight assumed for NOX (MW = 46).
2 Assumes limits with averaging periods of 24 hours or less are comparable (i.e., a daily limit would need to meet a similar value hourly limit most of the time in order to meet the daily limit.)
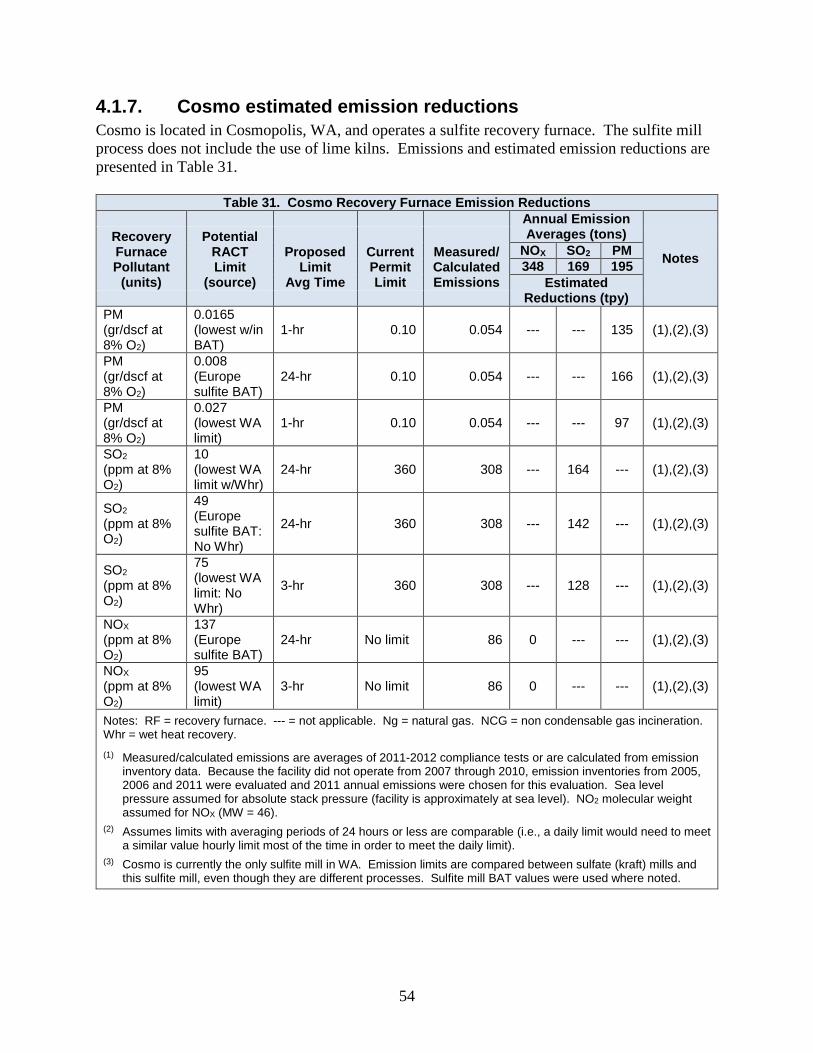
54
4.1.7. Cosmo estimated emission reductions Cosmo is located in Cosmopolis, WA, and operates a sulfite recovery furnace. The sulfite mill process does not include the use of lime kilns. Emissions and estimated emission reductions are presented in Table 31.
Table 31. Cosmo Recovery Furnace Emission Reductions Annual Emission
Averages (tons)
Notes Recovery Furnace Pollutant
(units)
Potential RACT Limit
(source)
Proposed Limit
Avg Time
Current Permit Limit
Measured/ Calculated Emissions
NOX SO2 PM 348 169 195
Estimated Reductions (tpy)
PM (gr/dscf at 8% O2)
0.0165 (lowest w/in BAT)
1-hr 0.10 0.054 --- --- 135 (1),(2),(3)
PM (gr/dscf at 8% O2)
0.008 (Europe sulfite BAT)
24-hr 0.10 0.054 --- --- 166 (1),(2),(3)
PM (gr/dscf at 8% O2)
0.027 (lowest WA limit)
1-hr 0.10 0.054 --- --- 97 (1),(2),(3)
SO2 (ppm at 8% O2)
10 (lowest WA limit w/Whr)
24-hr 360 308 --- 164 --- (1),(2),(3)
SO2 (ppm at 8% O2)
49 (Europe sulfite BAT: No Whr)
24-hr 360 308 --- 142 --- (1),(2),(3)
SO2 (ppm at 8% O2)
75 (lowest WA limit: No Whr)
3-hr 360 308 --- 128 --- (1),(2),(3)
NOX (ppm at 8% O2)
137 (Europe sulfite BAT)
24-hr No limit 86 0 --- --- (1),(2),(3)
NOX (ppm at 8% O2)
95 (lowest WA limit)
3-hr No limit 86 0 --- --- (1),(2),(3)
Notes: RF = recovery furnace. --- = not applicable. Ng = natural gas. NCG = non condensable gas incineration. Whr = wet heat recovery. (1) Measured/calculated emissions are averages of 2011-2012 compliance tests or are calculated from emission
inventory data. Because the facility did not operate from 2007 through 2010, emission inventories from 2005, 2006 and 2011 were evaluated and 2011 annual emissions were chosen for this evaluation. Sea level pressure assumed for absolute stack pressure (facility is approximately at sea level). NO2 molecular weight assumed for NOX (MW = 46).
(2) Assumes limits with averaging periods of 24 hours or less are comparable (i.e., a daily limit would need to meet a similar value hourly limit most of the time in order to meet the daily limit).
(3) Cosmo is currently the only sulfite mill in WA. Emission limits are compared between sulfate (kraft) mills and this sulfite mill, even though they are different processes. Sulfite mill BAT values were used where noted.
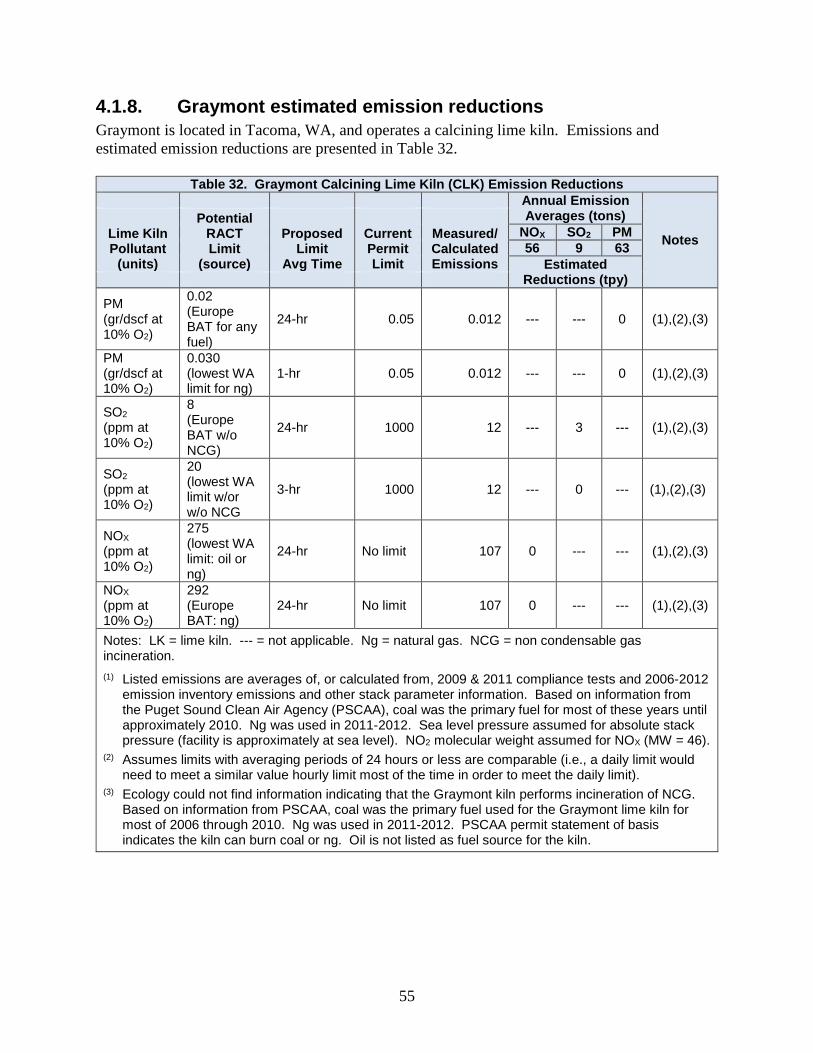
55
4.1.8. Graymont estimated emission reductions Graymont is located in Tacoma, WA, and operates a calcining lime kiln. Emissions and estimated emission reductions are presented in Table 32.
Table 32. Graymont Calcining Lime Kiln (CLK) Emission Reductions Annual Emission
Averages (tons)
Notes Lime Kiln Pollutant
(units)
Potential RACT Limit
(source)
Proposed Limit
Avg Time
Current Permit Limit
Measured/ Calculated Emissions
NOX SO2 PM 56 9 63
Estimated Reductions (tpy)
PM (gr/dscf at 10% O2)
0.02 (Europe BAT for any fuel)
24-hr 0.05 0.012 --- --- 0 (1),(2),(3)
PM (gr/dscf at 10% O2)
0.030 (lowest WA limit for ng)
1-hr 0.05 0.012 --- --- 0 (1),(2),(3)
SO2 (ppm at 10% O2)
8 (Europe BAT w/o NCG)
24-hr 1000 12 --- 3 --- (1),(2),(3)
SO2 (ppm at 10% O2)
20 (lowest WA limit w/or w/o NCG
3-hr 1000 12 --- 0 --- (1),(2),(3)
NOX (ppm at 10% O2)
275 (lowest WA limit: oil or ng)
24-hr No limit 107 0 --- --- (1),(2),(3)
NOX (ppm at 10% O2)
292 (Europe BAT: ng)
24-hr No limit 107 0 --- --- (1),(2),(3)
Notes: LK = lime kiln. --- = not applicable. Ng = natural gas. NCG = non condensable gas incineration. (1) Listed emissions are averages of, or calculated from, 2009 & 2011 compliance tests and 2006-2012
emission inventory emissions and other stack parameter information. Based on information from the Puget Sound Clean Air Agency (PSCAA), coal was the primary fuel for most of these years until approximately 2010. Ng was used in 2011-2012. Sea level pressure assumed for absolute stack pressure (facility is approximately at sea level). NO2 molecular weight assumed for NOX (MW = 46).
(2) Assumes limits with averaging periods of 24 hours or less are comparable (i.e., a daily limit would need to meet a similar value hourly limit most of the time in order to meet the daily limit).
(3) Ecology could not find information indicating that the Graymont kiln performs incineration of NCG. Based on information from PSCAA, coal was the primary fuel used for the Graymont lime kiln for most of 2006 through 2010. Ng was used in 2011-2012. PSCAA permit statement of basis indicates the kiln can burn coal or ng. Oil is not listed as fuel source for the kiln.
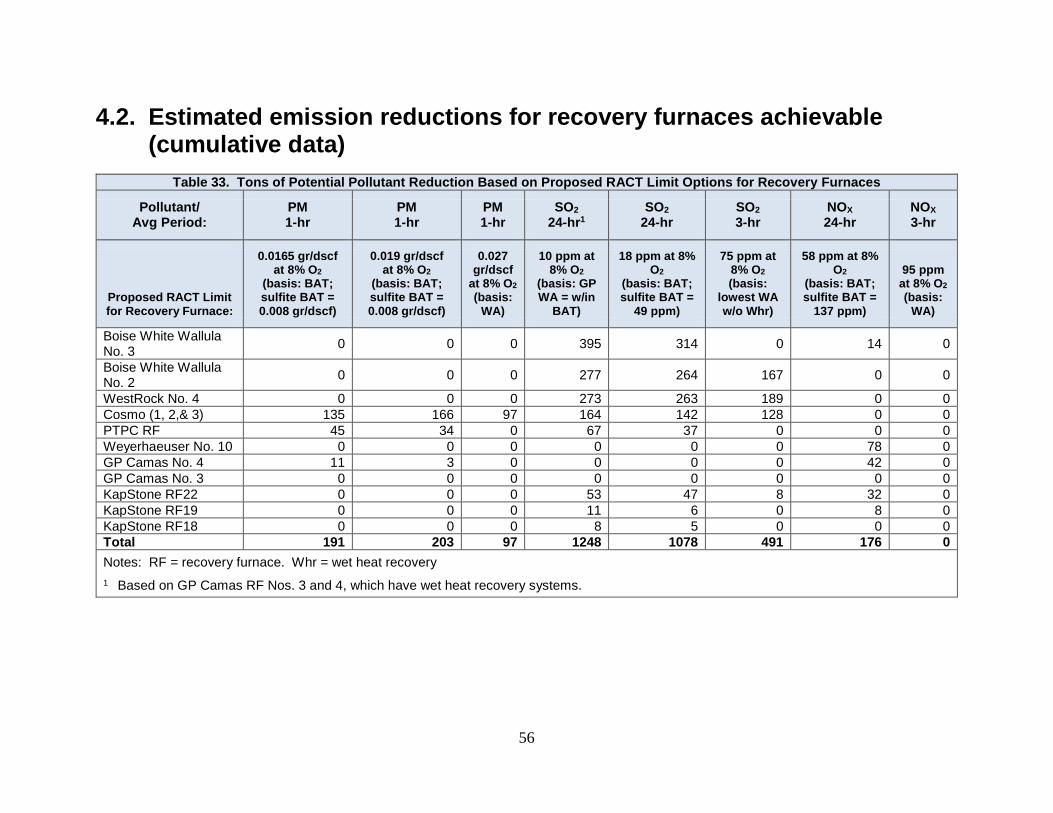
56
4.2. Estimated emission reductions for recovery furnaces achievable (cumulative data)
Table 33. Tons of Potential Pollutant Reduction Based on Proposed RACT Limit Options for Recovery Furnaces Pollutant/
Avg Period: PM 1-hr
PM 1-hr
PM 1-hr
SO2 24-hr1
SO2 24-hr
SO2 3-hr
NOX 24-hr
NOX 3-hr
Proposed RACT Limit for Recovery Furnace:
0.0165 gr/dscf at 8% O2
(basis: BAT; sulfite BAT = 0.008 gr/dscf)
0.019 gr/dscf at 8% O2
(basis: BAT; sulfite BAT = 0.008 gr/dscf)
0.027 gr/dscf
at 8% O2 (basis:
WA)
10 ppm at 8% O2
(basis: GP WA = w/in
BAT)
18 ppm at 8% O2
(basis: BAT; sulfite BAT =
49 ppm)
75 ppm at 8% O2 (basis:
lowest WA w/o Whr)
58 ppm at 8% O2
(basis: BAT; sulfite BAT =
137 ppm)
95 ppm at 8% O2 (basis:
WA)
Boise White Wallula No. 3 0 0 0 395 314 0 14 0
Boise White Wallula No. 2 0 0 0 277 264 167 0 0
WestRock No. 4 0 0 0 273 263 189 0 0 Cosmo (1, 2,& 3) 135 166 97 164 142 128 0 0 PTPC RF 45 34 0 67 37 0 0 0 Weyerhaeuser No. 10 0 0 0 0 0 0 78 0 GP Camas No. 4 11 3 0 0 0 0 42 0 GP Camas No. 3 0 0 0 0 0 0 0 0 KapStone RF22 0 0 0 53 47 8 32 0 KapStone RF19 0 0 0 11 6 0 8 0 KapStone RF18 0 0 0 8 5 0 0 0 Total 191 203 97 1248 1078 491 176 0 Notes: RF = recovery furnace. Whr = wet heat recovery 1 Based on GP Camas RF Nos. 3 and 4, which have wet heat recovery systems.
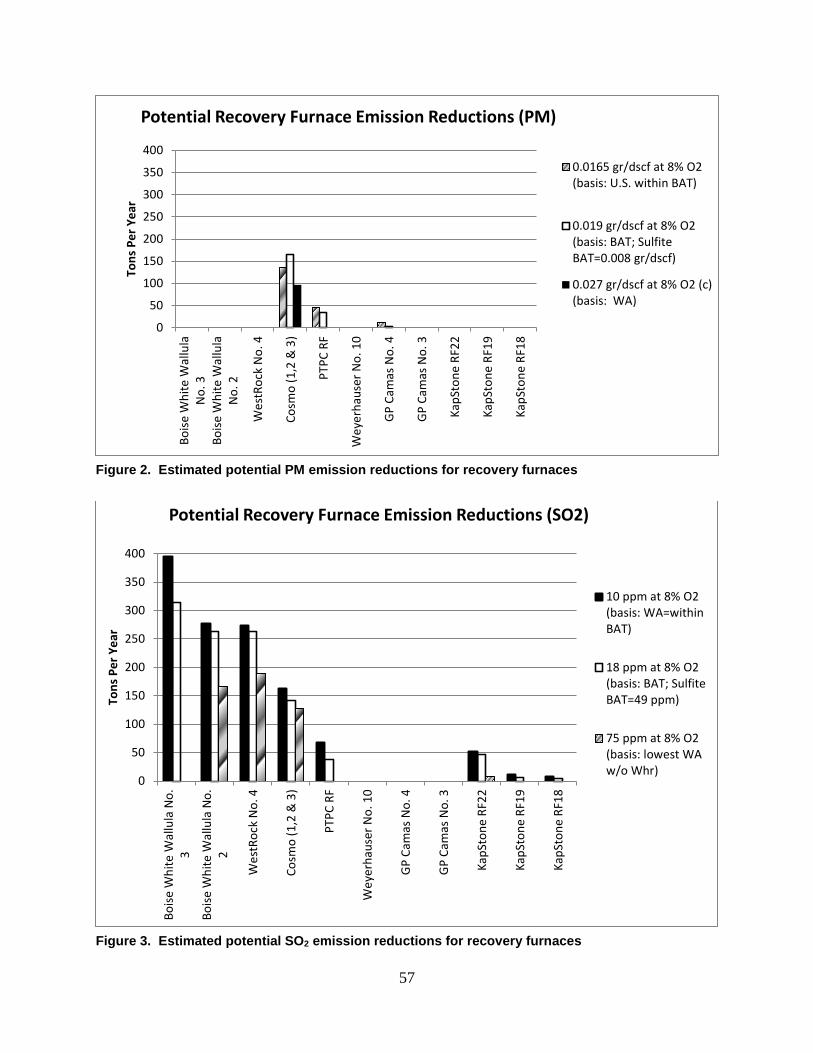
57
Figure 2. Estimated potential PM emission reductions for recovery furnaces
Figure 3. Estimated potential SO2 emission reductions for recovery furnaces
0
50
100
150
200
250
300
350
400
Boise
Whi
te W
allu
laN
o. 3
Boise
Whi
te W
allu
laN
o. 2
Wes
tRoc
k N
o. 4
Cosm
o (1
,2 &
3)
PTPC
RF
Wey
erha
user
No.
10
GP
Cam
as N
o. 4
GP
Cam
as N
o. 3
KapS
tone
RF2
2
KapS
tone
RF1
9
KapS
tone
RF1
8
Tons
Per
Yea
rPotential Recovery Furnace Emission Reductions (PM)
0.0165 gr/dscf at 8% O2(basis: U.S. within BAT)
0.019 gr/dscf at 8% O2(basis: BAT; SulfiteBAT=0.008 gr/dscf)
0.027 gr/dscf at 8% O2 (c)(basis: WA)
0
50
100
150
200
250
300
350
400
Boise
Whi
te W
allu
la N
o.3
Boise
Whi
te W
allu
la N
o.2
Wes
tRoc
k N
o. 4
Cosm
o (1
,2 &
3)
PTPC
RF
Wey
erha
user
No.
10
GP
Cam
as N
o. 4
GP
Cam
as N
o. 3
KapS
tone
RF2
2
KapS
tone
RF1
9
KapS
tone
RF1
8
Tons
Per
Yea
r
Potential Recovery Furnace Emission Reductions (SO2)
10 ppm at 8% O2(basis: WA=withinBAT)
18 ppm at 8% O2(basis: BAT; SulfiteBAT=49 ppm)
75 ppm at 8% O2(basis: lowest WAw/o Whr)
58
Figure 4. Estimated potential NOX emission reductions for recovery furnaces
0
50
100
150
200
250
300
350
400
Boise
Whi
te W
allu
la N
o.3
Boise
Whi
te W
allu
la N
o.2
Wes
tRoc
k N
o. 4
Cosm
o (1
,2 &
3)
PTPC
RF
Wey
erha
user
No.
10
GP
Cam
as N
o. 4
GP
Cam
as N
o. 3
KapS
tone
RF2
2
KapS
tone
RF1
9
KapS
tone
RF1
8
Tons
Per
Yea
rPotential Recovery Furnace Emission Reductions (NOx)
58 ppm at 8% O2(basis: BAT; sulfiteBAT=137ppm)
95 ppm at 8% O2(basis: WA)
59
4.3. Estimated emission reductions for lime kilns achievable (cumulative data)
Table 34. Tons of Potential Pollutant Reduction Based on Proposed RACT Limit Options for Lime Kilns
Pollutant/ Avg Period:
PM (ng or oil)
24-hr
PM (ng or oil)
24-hr
SO2 (w/o NCG)
24-hr
SO2 (w/or w/o
NCG) 3-hr
SO2 (w/NCG)
24-hr
NOX (oil)
24-hr
NOX (ng or oil)
24-hr
NOX (gas) 24-hr
Proposed RACT Limit for Lime Kiln:
0.02 gr/dscf at 10% O2
(basis: BAT (ng or oil))
0.030 gr/dscf at 10% O2
(basis: WA)
8 ppm at 10% O2
(basis: BAT w/o NCG)
20 ppm at 10% O2
(basis: GP WA = w/in BAT w/or w/o NCG)
105 ppm at 10% O2
(basis: BAT w/NCG)
77 ppm at 10% O2
(basis: BAT (oil))
275 ppm at 10% O2
(basis: WA w/oil or ng)
292 ppm at 10% O2
(basis: BAT (ng))
Boise White Wallula LK(1) 28 18 N/A 0 0 0 0 0 WestRock No. 1(1) 9 2 N/A 3 0 0 0 0 WestRock No. 2(1) 3 1 N/A 1 0 0 0 0 PTPC LK(2) 10 4 N/A 0 0 2 0 N/A Weyerhaeuser No. 4(1) 0 0 N/A 0 0 65 0 0 GP Camas No. 4(3) 1 0 N/A 0 0 N/A(3) 25 20 KapStone LK3(1) 0 0 N/A 0 0 2 0 0 KapStone LK4(1) 0 0 N/A 0 0 21 0 0 KapStone LK5(1) 0 0 N/A 0 0 9 0 0 Graymont CLK No. 1(4) 0 0 3 0 N/A(5) N/A(4) 0 0 Total 51 25 3 4 0 99 25 20 Notes: LK = lime kiln. N/A = not applicable or information not available or not found. NCG = non condensable gas incineration. (1) Ecology found information indicating that the facility has the capability to burn oil or gas in the Lime Kilns. (2) The LK at PTPC burns oil exclusively. (3) The LK (No. 4) at GP Camas does not burn oil. The fuel oil burner was decommissioned in early 2011. (4) Based on information from PSCAA, coal was the primary fuel used for the Graymont lime kiln for most of 2006 through 2010. Natural gas was
used in 2011-2012. PSCAA permit statement of basis indicates the kiln can burn coal or natural gas. Oil is not listed as fuel source for the kiln. (5) Ecology could not find information indicating that the Graymont kiln performs incineration of NCG.
60
Figure 5. Estimated potential PM emission reductions for lime kilns
Figure 6. Estimated potential SO2 emission reductions for lime kilns
0
50
100
150
200
250
300
350
400
Boise
Whi
te W
allu
la L
K (e
)
Wes
tRoc
k N
o.1
(e)
Wes
tRoc
k N
o.2
(e)
PTPC
LK
(c)
Wey
erha
user
#4
(e)
GP
Cam
as N
o.4
(b)
KapS
tone
LK3
(e)
KapS
tone
LK4
(e)
KapS
tone
LK5
(e)
Gra
ymon
t CLK
#1
(d)
Tons
Per
Yea
rPotential Lime Kiln Emission Reductions (PM)
0.02 gr/dscf at 10% O2(basis: BAT (ng or oil))
0.030 gr/dscf at 10% O2(basis: WA)
0
50
100
150
200
250
300
350
400
Boise
Whi
te W
allu
la L
K(e
)
Wes
tRoc
k N
o.1
(e)
Wes
tRoc
k N
o.2
(e)
PTPC
LK
(c)
Wey
erha
user
#4
(e)
GP
Cam
as N
o.4
(b)
KapS
tone
LK3
(e)
KapS
tone
LK4
(e)
KapS
tone
LK5
(e)
Gra
ymon
t CLK
#1
(d)
Tons
Per
Yea
r
Potential Lime Kiln Emission Reductions (SO2)
20 ppm at 10% O2(basis: WA=withinBAT w/wo NCG)
105 ppm at 10% O2(basis: BAT w/NCG)
8 ppm at 10% O2(basis: BAT w/o NCG)
61
Figure 7. Estimated potential NOX emission reductions for lime kilns
4.4. Discussion of estimated potential emission reductions
This section discusses the potential of adopting the various emission levels presented in Sections 4.1–4.3. An evaluation of the potential actual emissions reductions possible if the option were to be implemented is given based on the calculations presented in Sections 4.2 and 4.3.
4.4.1. Discussion of estimated potential emission reductions for recovery furnaces
Based on the estimated potential emission reductions summarized in Sections 4.2 and 4.3, Ecology makes the following observations regarding the benefits of adopting these limits, and if further consideration is warranted: • PM:
o According to Table 6, an HERB unit RF (No. 3), at the International Paper CAMTI facility in Louisiana, achieves an emission limit of 0.015 gr/dscf (at 8% O2), which is
0
50
100
150
200
250
300
350
400
Boise
Whi
te W
allu
la L
K (e
)
Wes
tRoc
k N
o.1
(e)
Wes
tRoc
k N
o.2
(e)
PTPC
LK
(c)
Wey
erha
user
#4
(e)
GP
Cam
as N
o.4
(b)
KapS
tone
LK3
(e)
KapS
tone
LK4
(e)
KapS
tone
LK5
(e)
Gra
ymon
t CLK
#1
(d)
Tons
Per
Yea
rPotential Lime Kiln Emission Reductions (NOx)
77 ppm at 10% O2(basis: BAT (oil))
275 ppm at 10%O2(WA: oil or ng)
292 ppm at 10%O2(basis: BAT (ng))
62
within European BAT ranges. Implementing the HERB process on an existing recovery furnace would be a significant reconstruction of the furnace. There are currently no HERB units in Washington State and the technology is not considered further.
o The other U.S. facility in Table 6 with emissions within European BAT ranges uses an ESP. According to Table 33 (and Figure 2), the potential benefit of adopting an emission limit of 0.0165 grains/dscf (at 8% O2) would provide an estimated 191 tpy of pollutant reduction. This limit is based on the use of an ESP with eight fields online versus the more common ESP configuration with two or three fields online. The facility with this control technology implemented it as part of a MACT cumulative emission rate limit alternative covering three emission units (recovery boiler, lime kiln, smelt dissolving tank) as described in 40 CFR 862(a)(1). No recovery furnace controlled by an 8-field ESP is currently operating in Washington State.
o According to Table 33 (and Figure 2), adopting an emission limit of 0.019 grains/dscf (at 8% O2) would provide an estimated 203 tpy of pollutant reduction. This limit is the upper limit range of the European BAT PM limits for recovery furnaces. [Note: a sulfite BACT limit of 0.008 grains/dscf (at 8% O2) was used for emission reductions estimates for Washington’s sulfite mill (Cosmo)].
o According to Table 33 (and Figure 2), the potential benefit of adopting an emission limit of 0.027 grains/dscf (at 8% O2) would provide an estimated 97 tpy of PM reduction. This limit is currently demonstrated at three recovery furnaces in Washington State. This limit and control technology can be considered reasonable to adopt for the other recovery furnaces in Washington. This limit is considered for further analysis.
• SO2:
o According to Table 33 (and Figure 3), the potential benefit of adopting an emission limit of 10 ppm (at 8% O2), would provide an estimated 1,248 tpy of pollutant reduction, primarily from one facility. The potential pollutant reductions achievable from adopting this limit, provides the greatest estimated pollutant reduction for the proposed recovery furnaces emission limits in Table 33. Based on the potential benefit of implementing this limit, and because this limit has already been demonstrated at two recovery furnaces in Washington State, this limit is considered for further analysis.
o According to Table 33 (and Figure 3), the potential benefit of adopting an emission limit of 18 ppm (at 8% O2), would provide an estimated 1,078 tpy of pollutant reduction. This limit is the upper limit range of the European BAT SO2 limits for recovery furnaces. [Note: a sulfite BAT limit of 49 ppm (at 8% O2) was used for emission reductions estimates for Washington’s sulfite mill (Cosmo)]. These BAT limits have not been, but could be implemented in Washington State.
o According to Table 33 (and Figure 3), the potential benefit of adopting an emission limit of 75 ppm (at 8% O2), would provide an estimated 491 TPY of pollutant reduction. Based on the potential benefit of implementing this limit, and because this
63
limit has already been demonstrated at a recovery furnace in Washington State, this limit is considered for further analysis.
• NOX: o According to Table 33 (and Figure 4), the potential benefit of adopting an emission
limit of 58 ppm (at 8% O2), would provide an estimated 176 TPY of pollutant reduction. This limit is the upper limit range of the European BAT NOX limits for recovery furnaces. [Note: a sulfite BAT limit of 137 ppm (at 8% O2) was used for emission reductions estimates for Washington’s sulfite mill (Cosmo)]. These BAT limits have not been implemented in Washington State.
o According to Table 33 (and Figure 4), the potential benefit of adopting an emission limit of 95 ppm (at 8% O2), would not provide pollutant reductions based on how recovery furnaces in Washington operated their units during the emission inventory evaluated as part of this analysis. However, adopting this limit could lower the potential to emit levels at some of these facilities, and therefore could be considered for further analysis. This limit has been implemented at three recovery furnaces in Washington State with limit averaging periods of three to 24 hours.
4.4.2. Discussion of estimated potential emission reductions for lime kilns
Based on the estimated potential emission reductions presented in this chapter, Ecology makes the following observations regarding the benefits of adopting these limits, and if further consideration is warranted: • PM:
o According to Table 34 (and Figure 5), the potential benefit of adopting an emission limit of 0.02 grains/dscf (at 10% O2) would provide an estimated 51 TPY of pollutant reduction. This limit is the upper limit range of the European BAT PM limits for lime kilns. This specific limit has not been implemented in Washington State.
o According to Table 34 (and Figure 5), the potential benefit of adopting an emission limit of 0.030 grains/dscf (at 10% O2) would provide an estimated 25 TPY of pollutant reduction. This limit has been implemented at two lime kilns in Washington State. Adopting this limit could lower the potential to emit levels at other lime kilns in Washington State, and therefore could be considered for further analysis.
• SO2:
o According to Table 34 (and Figure 6), the potential benefit of adopting an emission limit of 8 ppm (at 10% O2) would provide an estimated 3 TPY of pollutant reduction. This limit is the upper limit range of the European BAT PM limits for lime kilns that do not incinerate NCGs. This specific limit has not been implemented in Washington State.
o According to Table 34 (and Figure 6), the potential benefit of adopting an emission limit of 20 ppm (at 10% O2) would provide an estimated 4 TPY of pollutant
64
reduction. This limit has been implemented at three lime kilns in Washington State, and is therefore considered for further analysis.
o According to Table 34 (and Figure 6), the potential benefit of adopting an emission limit of 105 ppm (at 10% O2) would not provide pollutant reductions bases on how lime kilns in Washington operated their units during the emission inventory evaluated as part of this analysis.
• NOX:
o According to Table 34 (and Figure 7), the potential benefit of adopting an emission limit of 77 ppm (at 10% O2), would provide an estimated 99 TPY of pollutant reduction. This limit is the upper limit range of the European BAT NOX limits for lime kilns that use fuel oil. This specific limit has not been implemented in Washington State.
o According to Table 34 (and Figure 7), the potential benefit of adopting an emission limit of 275 ppm (at 10% O2), would provide an estimated 25 TPY of pollutant reduction. This limit has been implemented at one lime kiln in Washington State, which can use either oil or natural gas fuel. Adopting this limit could lower the potential to emit levels at other lime kilns in Washington State, and therefore could be considered for further analysis.
o According to Table 34 (and Figure 7), the potential benefit of adopting an emission limit of 292 ppm (at 10% O2), would provide an estimated 20 TPY of pollutant reduction. This limit is the upper limit range of the European BAT NOX limits for lime kilns that use natural gas. Not all lime kilns in Washington have access to natural gas. This specific limit has not been implemented in Washington State.
5. Impacts of Controls on Visibility The impacts of additional controls are presented in the following subsections. A previous similar study (BART modeling analysis) is included below in Section 5.1 as background information, as it was used in the 2010 RH SIP. Section 5.2 concludes with more current impacts analysis modeling results using the emission reduction estimates in Section 4 of this analysis.
5.1. Impacts of pulp and paper mills on visibility (BART modeling analysis)
This section addresses the impact of pulp and paper mill sources upon visibility in Class I areas in Washington State. Details describing how visibility is measured using units of dv was provided in the RH SIP. Available visibility modeling results from Chapter 11 of the RHSIP BART analysis, performed for five of the seven pulp mills, is provided in Table 35. The other facilities evaluated and modeled for this RACT review did not meet one or more of the technical criteria to require
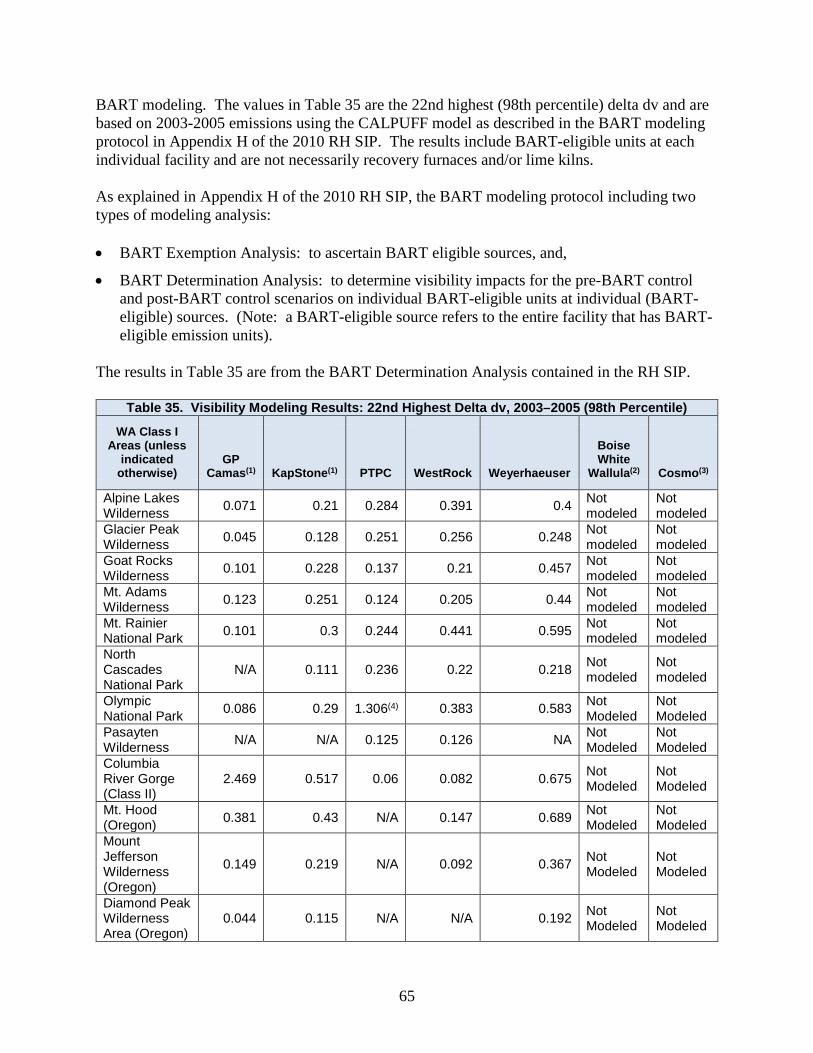
65
BART modeling. The values in Table 35 are the 22nd highest (98th percentile) delta dv and are based on 2003-2005 emissions using the CALPUFF model as described in the BART modeling protocol in Appendix H of the 2010 RH SIP. The results include BART-eligible units at each individual facility and are not necessarily recovery furnaces and/or lime kilns. As explained in Appendix H of the 2010 RH SIP, the BART modeling protocol including two types of modeling analysis: • BART Exemption Analysis: to ascertain BART eligible sources, and,
• BART Determination Analysis: to determine visibility impacts for the pre-BART control and post-BART control scenarios on individual BART-eligible units at individual (BART-eligible) sources. (Note: a BART-eligible source refers to the entire facility that has BART- eligible emission units).
The results in Table 35 are from the BART Determination Analysis contained in the RH SIP.
Table 35. Visibility Modeling Results: 22nd Highest Delta dv, 2003–2005 (98th Percentile)
WA Class I Areas (unless
indicated otherwise)
GP Camas(1) KapStone(1) PTPC WestRock Weyerhaeuser
Boise White
Wallula(2) Cosmo(3)
Alpine Lakes Wilderness 0.071 0.21 0.284 0.391 0.4 Not
modeled Not modeled
Glacier Peak Wilderness 0.045 0.128 0.251 0.256 0.248 Not
modeled Not modeled
Goat Rocks Wilderness 0.101 0.228 0.137 0.21 0.457 Not
modeled Not modeled
Mt. Adams Wilderness 0.123 0.251 0.124 0.205 0.44 Not
modeled Not modeled
Mt. Rainier National Park 0.101 0.3 0.244 0.441 0.595 Not
modeled Not modeled
North Cascades National Park
N/A 0.111 0.236 0.22 0.218 Not modeled
Not modeled
Olympic National Park 0.086 0.29 1.306(4) 0.383 0.583 Not
Modeled Not Modeled
Pasayten Wilderness N/A N/A 0.125 0.126 NA Not
Modeled Not Modeled
Columbia River Gorge (Class II)
2.469 0.517 0.06 0.082 0.675 Not Modeled
Not Modeled
Mt. Hood (Oregon) 0.381 0.43 N/A 0.147 0.689 Not
Modeled Not Modeled
Mount Jefferson Wilderness (Oregon)
0.149 0.219 N/A 0.092 0.367 Not Modeled
Not Modeled
Diamond Peak Wilderness Area (Oregon)
0.044 0.115 N/A N/A 0.192 Not Modeled
Not Modeled
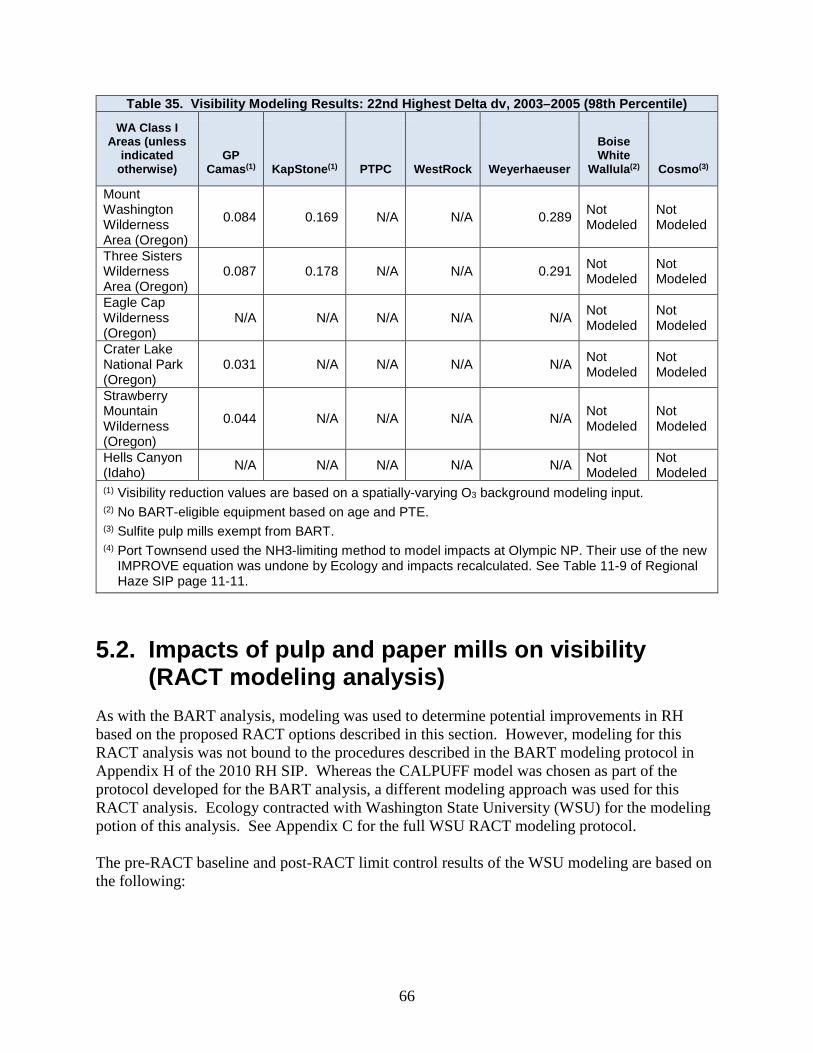
66
Table 35. Visibility Modeling Results: 22nd Highest Delta dv, 2003–2005 (98th Percentile)
WA Class I Areas (unless
indicated otherwise)
GP Camas(1) KapStone(1) PTPC WestRock Weyerhaeuser
Boise White
Wallula(2) Cosmo(3)
Mount Washington Wilderness Area (Oregon)
0.084 0.169 N/A N/A 0.289 Not Modeled
Not Modeled
Three Sisters Wilderness Area (Oregon)
0.087 0.178 N/A N/A 0.291 Not Modeled
Not Modeled
Eagle Cap Wilderness (Oregon)
N/A N/A N/A N/A N/A Not Modeled
Not Modeled
Crater Lake National Park (Oregon)
0.031 N/A N/A N/A N/A Not Modeled
Not Modeled
Strawberry Mountain Wilderness (Oregon)
0.044 N/A N/A N/A N/A Not Modeled
Not Modeled
Hells Canyon (Idaho) N/A N/A N/A N/A N/A Not
Modeled Not Modeled
(1) Visibility reduction values are based on a spatially-varying O3 background modeling input. (2) No BART-eligible equipment based on age and PTE. (3) Sulfite pulp mills exempt from BART. (4) Port Townsend used the NH3-limiting method to model impacts at Olympic NP. Their use of the new
IMPROVE equation was undone by Ecology and impacts recalculated. See Table 11-9 of Regional Haze SIP page 11-11.
5.2. Impacts of pulp and paper mills on visibility (RACT modeling analysis)
As with the BART analysis, modeling was used to determine potential improvements in RH based on the proposed RACT options described in this section. However, modeling for this RACT analysis was not bound to the procedures described in the BART modeling protocol in Appendix H of the 2010 RH SIP. Whereas the CALPUFF model was chosen as part of the protocol developed for the BART analysis, a different modeling approach was used for this RACT analysis. Ecology contracted with Washington State University (WSU) for the modeling potion of this analysis. See Appendix C for the full WSU RACT modeling protocol. The pre-RACT baseline and post-RACT limit control results of the WSU modeling are based on the following:
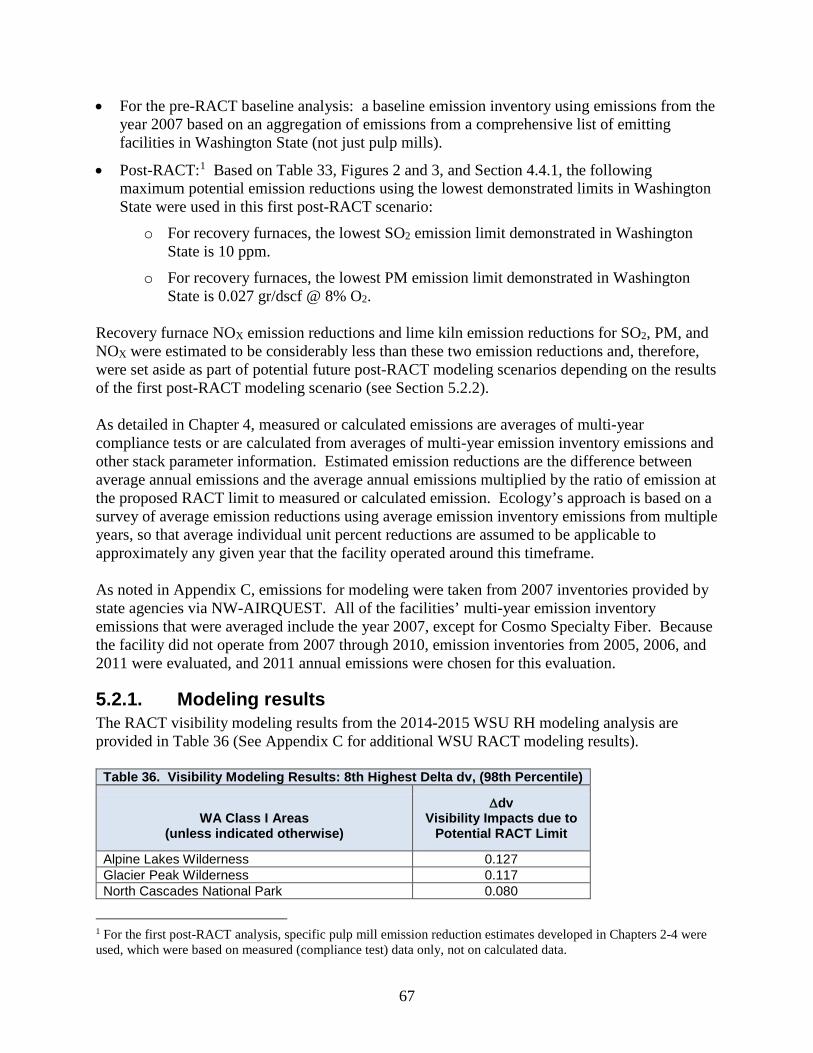
67
• For the pre-RACT baseline analysis: a baseline emission inventory using emissions from the year 2007 based on an aggregation of emissions from a comprehensive list of emitting facilities in Washington State (not just pulp mills).
• Post-RACT:1 Based on Table 33, Figures 2 and 3, and Section 4.4.1, the following maximum potential emission reductions using the lowest demonstrated limits in Washington State were used in this first post-RACT scenario:
o For recovery furnaces, the lowest SO2 emission limit demonstrated in Washington State is 10 ppm.
o For recovery furnaces, the lowest PM emission limit demonstrated in Washington State is 0.027 gr/dscf @ 8% O2.
Recovery furnace NOX emission reductions and lime kiln emission reductions for SO2, PM, and NOX were estimated to be considerably less than these two emission reductions and, therefore, were set aside as part of potential future post-RACT modeling scenarios depending on the results of the first post-RACT modeling scenario (see Section 5.2.2). As detailed in Chapter 4, measured or calculated emissions are averages of multi-year compliance tests or are calculated from averages of multi-year emission inventory emissions and other stack parameter information. Estimated emission reductions are the difference between average annual emissions and the average annual emissions multiplied by the ratio of emission at the proposed RACT limit to measured or calculated emission. Ecology’s approach is based on a survey of average emission reductions using average emission inventory emissions from multiple years, so that average individual unit percent reductions are assumed to be applicable to approximately any given year that the facility operated around this timeframe. As noted in Appendix C, emissions for modeling were taken from 2007 inventories provided by state agencies via NW-AIRQUEST. All of the facilities’ multi-year emission inventory emissions that were averaged include the year 2007, except for Cosmo Specialty Fiber. Because the facility did not operate from 2007 through 2010, emission inventories from 2005, 2006, and 2011 were evaluated, and 2011 annual emissions were chosen for this evaluation.
5.2.1. Modeling results The RACT visibility modeling results from the 2014-2015 WSU RH modeling analysis are provided in Table 36 (See Appendix C for additional WSU RACT modeling results).
Table 36. Visibility Modeling Results: 8th Highest Delta dv, (98th Percentile)
WA Class I Areas (unless indicated otherwise)
∆dv Visibility Impacts due to
Potential RACT Limit
Alpine Lakes Wilderness 0.127 Glacier Peak Wilderness 0.117 North Cascades National Park 0.080
1 For the first post-RACT analysis, specific pulp mill emission reduction estimates developed in Chapters 2-4 were used, which were based on measured (compliance test) data only, not on calculated data.
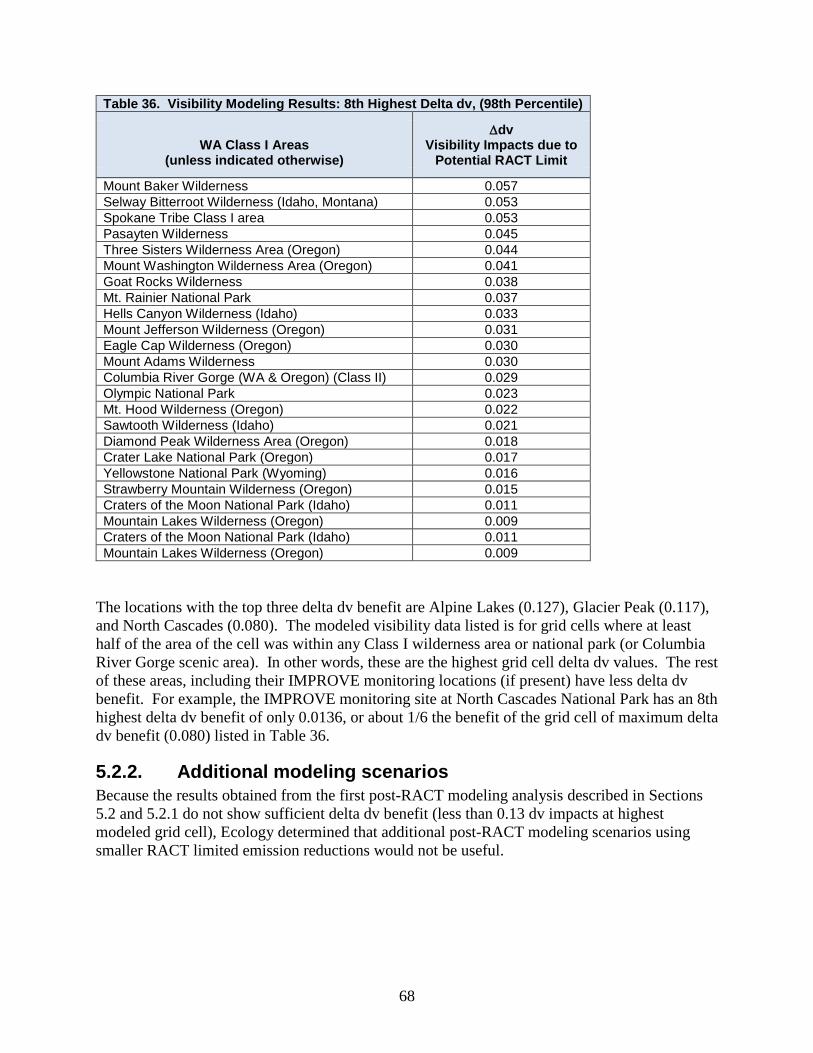
68
Table 36. Visibility Modeling Results: 8th Highest Delta dv, (98th Percentile)
WA Class I Areas (unless indicated otherwise)
∆dv Visibility Impacts due to
Potential RACT Limit
Mount Baker Wilderness 0.057 Selway Bitterroot Wilderness (Idaho, Montana) 0.053 Spokane Tribe Class I area 0.053 Pasayten Wilderness 0.045 Three Sisters Wilderness Area (Oregon) 0.044 Mount Washington Wilderness Area (Oregon) 0.041 Goat Rocks Wilderness 0.038 Mt. Rainier National Park 0.037 Hells Canyon Wilderness (Idaho) 0.033 Mount Jefferson Wilderness (Oregon) 0.031 Eagle Cap Wilderness (Oregon) 0.030 Mount Adams Wilderness 0.030 Columbia River Gorge (WA & Oregon) (Class II) 0.029 Olympic National Park 0.023 Mt. Hood Wilderness (Oregon) 0.022 Sawtooth Wilderness (Idaho) 0.021 Diamond Peak Wilderness Area (Oregon) 0.018 Crater Lake National Park (Oregon) 0.017 Yellowstone National Park (Wyoming) 0.016 Strawberry Mountain Wilderness (Oregon) 0.015 Craters of the Moon National Park (Idaho) 0.011 Mountain Lakes Wilderness (Oregon) 0.009 Craters of the Moon National Park (Idaho) 0.011 Mountain Lakes Wilderness (Oregon) 0.009
The locations with the top three delta dv benefit are Alpine Lakes (0.127), Glacier Peak (0.117), and North Cascades (0.080). The modeled visibility data listed is for grid cells where at least half of the area of the cell was within any Class I wilderness area or national park (or Columbia River Gorge scenic area). In other words, these are the highest grid cell delta dv values. The rest of these areas, including their IMPROVE monitoring locations (if present) have less delta dv benefit. For example, the IMPROVE monitoring site at North Cascades National Park has an 8th highest delta dv benefit of only 0.0136, or about 1/6 the benefit of the grid cell of maximum delta dv benefit (0.080) listed in Table 36.
5.2.2. Additional modeling scenarios Because the results obtained from the first post-RACT modeling analysis described in Sections 5.2 and 5.2.1 do not show sufficient delta dv benefit (less than 0.13 dv impacts at highest modeled grid cell), Ecology determined that additional post-RACT modeling scenarios using smaller RACT limited emission reductions would not be useful.
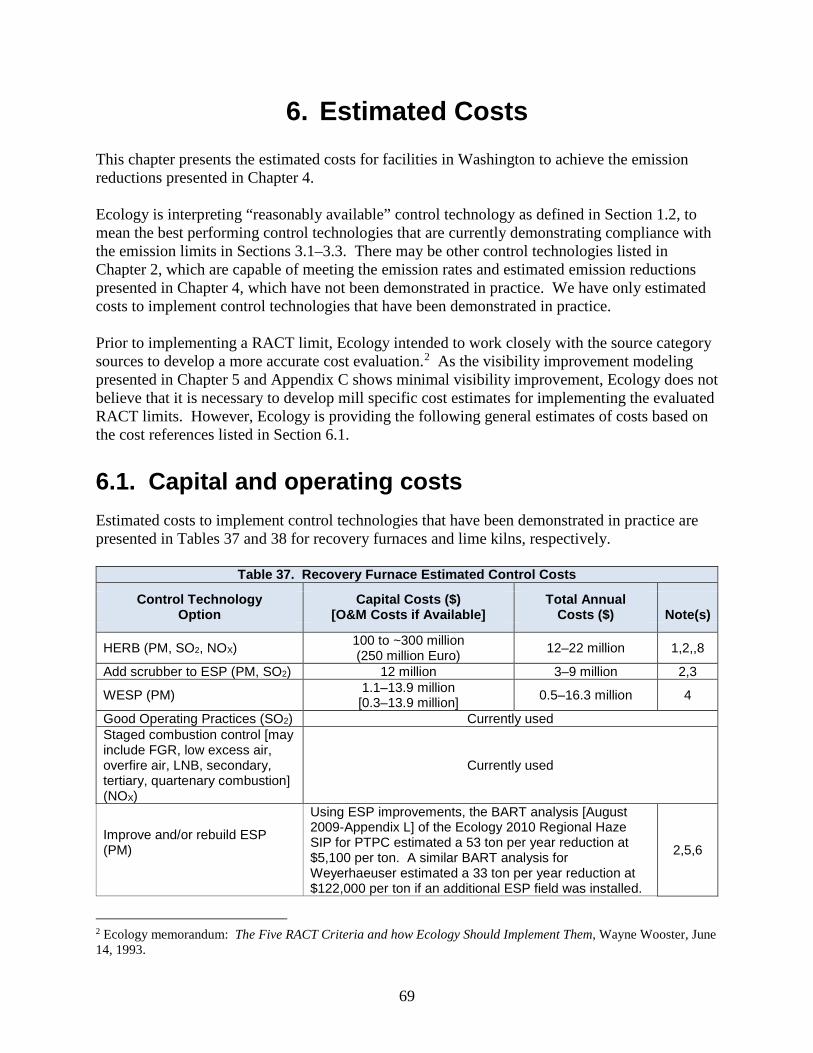
69
6. Estimated Costs This chapter presents the estimated costs for facilities in Washington to achieve the emission reductions presented in Chapter 4. Ecology is interpreting “reasonably available” control technology as defined in Section 1.2, to mean the best performing control technologies that are currently demonstrating compliance with the emission limits in Sections 3.1–3.3. There may be other control technologies listed in Chapter 2, which are capable of meeting the emission rates and estimated emission reductions presented in Chapter 4, which have not been demonstrated in practice. We have only estimated costs to implement control technologies that have been demonstrated in practice. Prior to implementing a RACT limit, Ecology intended to work closely with the source category sources to develop a more accurate cost evaluation.2 As the visibility improvement modeling presented in Chapter 5 and Appendix C shows minimal visibility improvement, Ecology does not believe that it is necessary to develop mill specific cost estimates for implementing the evaluated RACT limits. However, Ecology is providing the following general estimates of costs based on the cost references listed in Section 6.1.
6.1. Capital and operating costs Estimated costs to implement control technologies that have been demonstrated in practice are presented in Tables 37 and 38 for recovery furnaces and lime kilns, respectively.
Table 37. Recovery Furnace Estimated Control Costs Control Technology
Option Capital Costs ($)
[O&M Costs if Available] Total Annual
Costs ($) Note(s)
HERB (PM, SO2, NOX) 100 to ~300 million (250 million Euro) 12–22 million 1,2,,8
Add scrubber to ESP (PM, SO2) 12 million 3–9 million 2,3
WESP (PM) 1.1–13.9 million [0.3–13.9 million] 0.5–16.3 million 4
Good Operating Practices (SO2) Currently used Staged combustion control [may include FGR, low excess air, overfire air, LNB, secondary, tertiary, quartenary combustion] (NOX)
Currently used
Improve and/or rebuild ESP (PM)
Using ESP improvements, the BART analysis [August 2009-Appendix L] of the Ecology 2010 Regional Haze SIP for PTPC estimated a 53 ton per year reduction at $5,100 per ton. A similar BART analysis for Weyerhaeuser estimated a 33 ton per year reduction at $122,000 per ton if an additional ESP field was installed.
2,5,6
2 Ecology memorandum: The Five RACT Criteria and how Ecology Should Implement Them, Wayne Wooster, June 14, 1993.
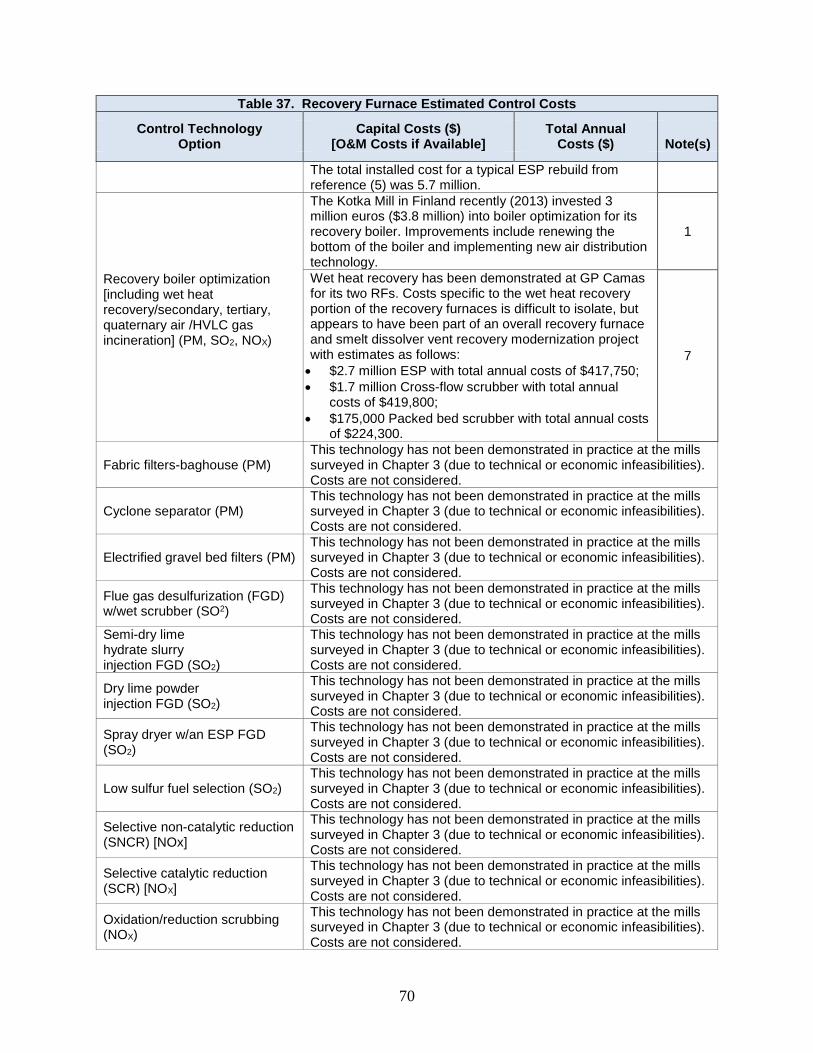
70
Table 37. Recovery Furnace Estimated Control Costs Control Technology
Option Capital Costs ($)
[O&M Costs if Available] Total Annual
Costs ($) Note(s)
The total installed cost for a typical ESP rebuild from reference (5) was 5.7 million.
Recovery boiler optimization [including wet heat recovery/secondary, tertiary, quaternary air /HVLC gas incineration] (PM, SO2, NOX)
The Kotka Mill in Finland recently (2013) invested 3 million euros ($3.8 million) into boiler optimization for its recovery boiler. Improvements include renewing the bottom of the boiler and implementing new air distribution technology.
1
Wet heat recovery has been demonstrated at GP Camas for its two RFs. Costs specific to the wet heat recovery portion of the recovery furnaces is difficult to isolate, but appears to have been part of an overall recovery furnace and smelt dissolver vent recovery modernization project with estimates as follows: • $2.7 million ESP with total annual costs of $417,750; • $1.7 million Cross-flow scrubber with total annual
costs of $419,800; • $175,000 Packed bed scrubber with total annual costs
of $224,300.
7
Fabric filters-baghouse (PM) This technology has not been demonstrated in practice at the mills surveyed in Chapter 3 (due to technical or economic infeasibilities). Costs are not considered.
Cyclone separator (PM) This technology has not been demonstrated in practice at the mills surveyed in Chapter 3 (due to technical or economic infeasibilities). Costs are not considered.
Electrified gravel bed filters (PM) This technology has not been demonstrated in practice at the mills surveyed in Chapter 3 (due to technical or economic infeasibilities). Costs are not considered.
Flue gas desulfurization (FGD) w/wet scrubber (SO2)
This technology has not been demonstrated in practice at the mills surveyed in Chapter 3 (due to technical or economic infeasibilities). Costs are not considered.
Semi-dry lime hydrate slurry injection FGD (SO2)
This technology has not been demonstrated in practice at the mills surveyed in Chapter 3 (due to technical or economic infeasibilities). Costs are not considered.
Dry lime powder injection FGD (SO2)
This technology has not been demonstrated in practice at the mills surveyed in Chapter 3 (due to technical or economic infeasibilities). Costs are not considered.
Spray dryer w/an ESP FGD (SO2)
This technology has not been demonstrated in practice at the mills surveyed in Chapter 3 (due to technical or economic infeasibilities). Costs are not considered.
Low sulfur fuel selection (SO2) This technology has not been demonstrated in practice at the mills surveyed in Chapter 3 (due to technical or economic infeasibilities). Costs are not considered.
Selective non-catalytic reduction (SNCR) [NOx]
This technology has not been demonstrated in practice at the mills surveyed in Chapter 3 (due to technical or economic infeasibilities). Costs are not considered.
Selective catalytic reduction (SCR) [NOX]
This technology has not been demonstrated in practice at the mills surveyed in Chapter 3 (due to technical or economic infeasibilities). Costs are not considered.
Oxidation/reduction scrubbing (NOX)
This technology has not been demonstrated in practice at the mills surveyed in Chapter 3 (due to technical or economic infeasibilities). Costs are not considered.
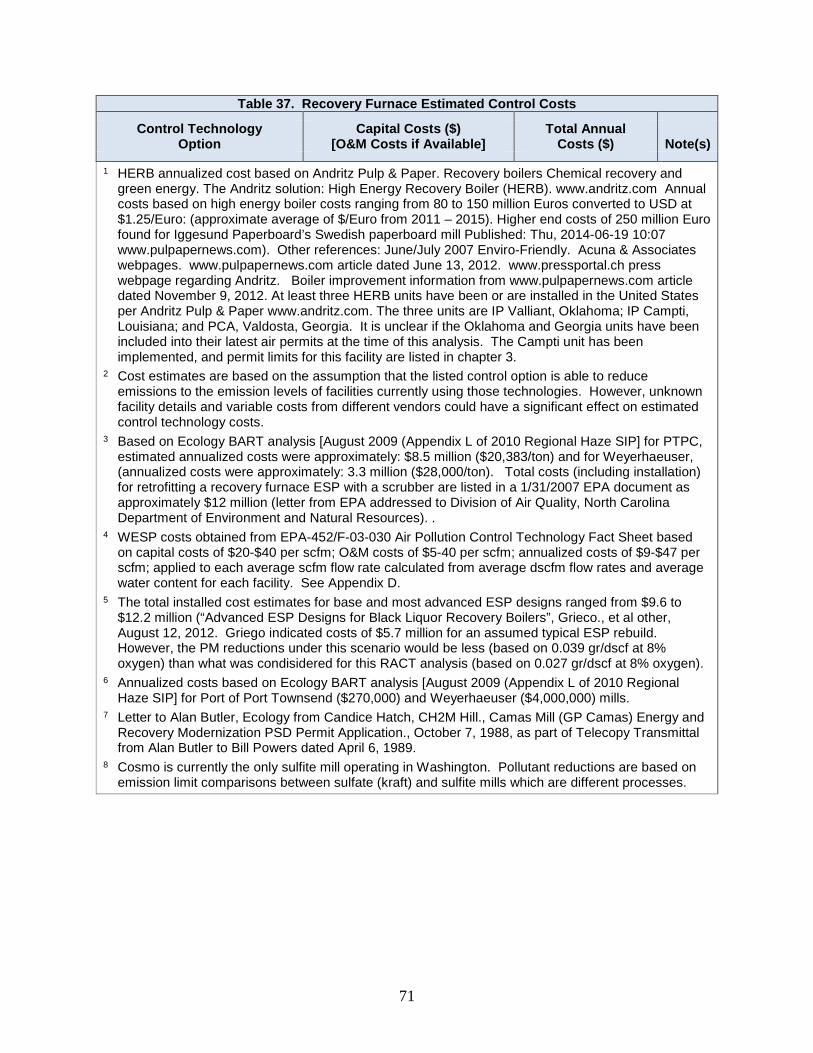
71
Table 37. Recovery Furnace Estimated Control Costs Control Technology
Option Capital Costs ($)
[O&M Costs if Available] Total Annual
Costs ($) Note(s)
1 HERB annualized cost based on Andritz Pulp & Paper. Recovery boilers Chemical recovery and green energy. The Andritz solution: High Energy Recovery Boiler (HERB). www.andritz.com Annual costs based on high energy boiler costs ranging from 80 to 150 million Euros converted to USD at $1.25/Euro: (approximate average of $/Euro from 2011 – 2015). Higher end costs of 250 million Euro found for Iggesund Paperboard’s Swedish paperboard mill Published: Thu, 2014-06-19 10:07 www.pulpapernews.com). Other references: June/July 2007 Enviro-Friendly. Acuna & Associates webpages. www.pulpapernews.com article dated June 13, 2012. www.pressportal.ch press webpage regarding Andritz. Boiler improvement information from www.pulpapernews.com article dated November 9, 2012. At least three HERB units have been or are installed in the United States per Andritz Pulp & Paper www.andritz.com. The three units are IP Valliant, Oklahoma; IP Campti, Louisiana; and PCA, Valdosta, Georgia. It is unclear if the Oklahoma and Georgia units have been included into their latest air permits at the time of this analysis. The Campti unit has been implemented, and permit limits for this facility are listed in chapter 3.
2 Cost estimates are based on the assumption that the listed control option is able to reduce emissions to the emission levels of facilities currently using those technologies. However, unknown facility details and variable costs from different vendors could have a significant effect on estimated control technology costs.
3 Based on Ecology BART analysis [August 2009 (Appendix L of 2010 Regional Haze SIP] for PTPC, estimated annualized costs were approximately: $8.5 million ($20,383/ton) and for Weyerhaeuser, (annualized costs were approximately: 3.3 million ($28,000/ton). Total costs (including installation) for retrofitting a recovery furnace ESP with a scrubber are listed in a 1/31/2007 EPA document as approximately $12 million (letter from EPA addressed to Division of Air Quality, North Carolina Department of Environment and Natural Resources). .
4 WESP costs obtained from EPA-452/F-03-030 Air Pollution Control Technology Fact Sheet based on capital costs of $20-$40 per scfm; O&M costs of $5-40 per scfm; annualized costs of $9-$47 per scfm; applied to each average scfm flow rate calculated from average dscfm flow rates and average water content for each facility. See Appendix D.
5 The total installed cost estimates for base and most advanced ESP designs ranged from $9.6 to $12.2 million (“Advanced ESP Designs for Black Liquor Recovery Boilers”, Grieco., et al other, August 12, 2012. Griego indicated costs of $5.7 million for an assumed typical ESP rebuild. However, the PM reductions under this scenario would be less (based on 0.039 gr/dscf at 8% oxygen) than what was condisidered for this RACT analysis (based on 0.027 gr/dscf at 8% oxygen).
6 Annualized costs based on Ecology BART analysis [August 2009 (Appendix L of 2010 Regional Haze SIP] for Port of Port Townsend ($270,000) and Weyerhaeuser ($4,000,000) mills.
7 Letter to Alan Butler, Ecology from Candice Hatch, CH2M Hill., Camas Mill (GP Camas) Energy and Recovery Modernization PSD Permit Application., October 7, 1988, as part of Telecopy Transmittal from Alan Butler to Bill Powers dated April 6, 1989.
8 Cosmo is currently the only sulfite mill operating in Washington. Pollutant reductions are based on emission limit comparisons between sulfate (kraft) and sulfite mills which are different processes.
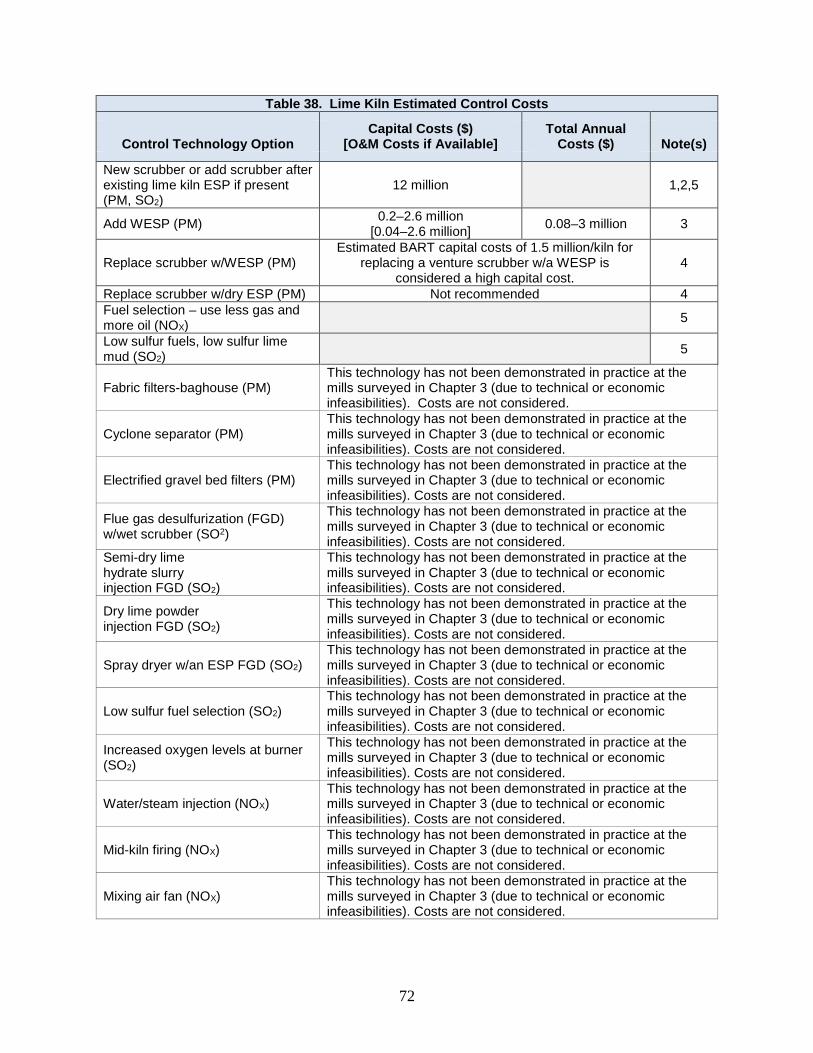
72
Table 38. Lime Kiln Estimated Control Costs
Control Technology Option Capital Costs ($)
[O&M Costs if Available] Total Annual
Costs ($) Note(s)
New scrubber or add scrubber after existing lime kiln ESP if present (PM, SO2)
12 million 1,2,5
Add WESP (PM) 0.2–2.6 million [0.04–2.6 million] 0.08–3 million 3
Replace scrubber w/WESP (PM) Estimated BART capital costs of 1.5 million/kiln for
replacing a venture scrubber w/a WESP is considered a high capital cost.
4
Replace scrubber w/dry ESP (PM) Not recommended 4 Fuel selection – use less gas and more oil (NOX) 5
Low sulfur fuels, low sulfur lime mud (SO2) 5
Fabric filters-baghouse (PM) This technology has not been demonstrated in practice at the mills surveyed in Chapter 3 (due to technical or economic infeasibilities). Costs are not considered.
Cyclone separator (PM) This technology has not been demonstrated in practice at the mills surveyed in Chapter 3 (due to technical or economic infeasibilities). Costs are not considered.
Electrified gravel bed filters (PM) This technology has not been demonstrated in practice at the mills surveyed in Chapter 3 (due to technical or economic infeasibilities). Costs are not considered.
Flue gas desulfurization (FGD) w/wet scrubber (SO2)
This technology has not been demonstrated in practice at the mills surveyed in Chapter 3 (due to technical or economic infeasibilities). Costs are not considered.
Semi-dry lime hydrate slurry injection FGD (SO2)
This technology has not been demonstrated in practice at the mills surveyed in Chapter 3 (due to technical or economic infeasibilities). Costs are not considered.
Dry lime powder injection FGD (SO2)
This technology has not been demonstrated in practice at the mills surveyed in Chapter 3 (due to technical or economic infeasibilities). Costs are not considered.
Spray dryer w/an ESP FGD (SO2) This technology has not been demonstrated in practice at the mills surveyed in Chapter 3 (due to technical or economic infeasibilities). Costs are not considered.
Low sulfur fuel selection (SO2) This technology has not been demonstrated in practice at the mills surveyed in Chapter 3 (due to technical or economic infeasibilities). Costs are not considered.
Increased oxygen levels at burner (SO2)
This technology has not been demonstrated in practice at the mills surveyed in Chapter 3 (due to technical or economic infeasibilities). Costs are not considered.
Water/steam injection (NOX) This technology has not been demonstrated in practice at the mills surveyed in Chapter 3 (due to technical or economic infeasibilities). Costs are not considered.
Mid-kiln firing (NOX) This technology has not been demonstrated in practice at the mills surveyed in Chapter 3 (due to technical or economic infeasibilities). Costs are not considered.
Mixing air fan (NOX) This technology has not been demonstrated in practice at the mills surveyed in Chapter 3 (due to technical or economic infeasibilities). Costs are not considered.
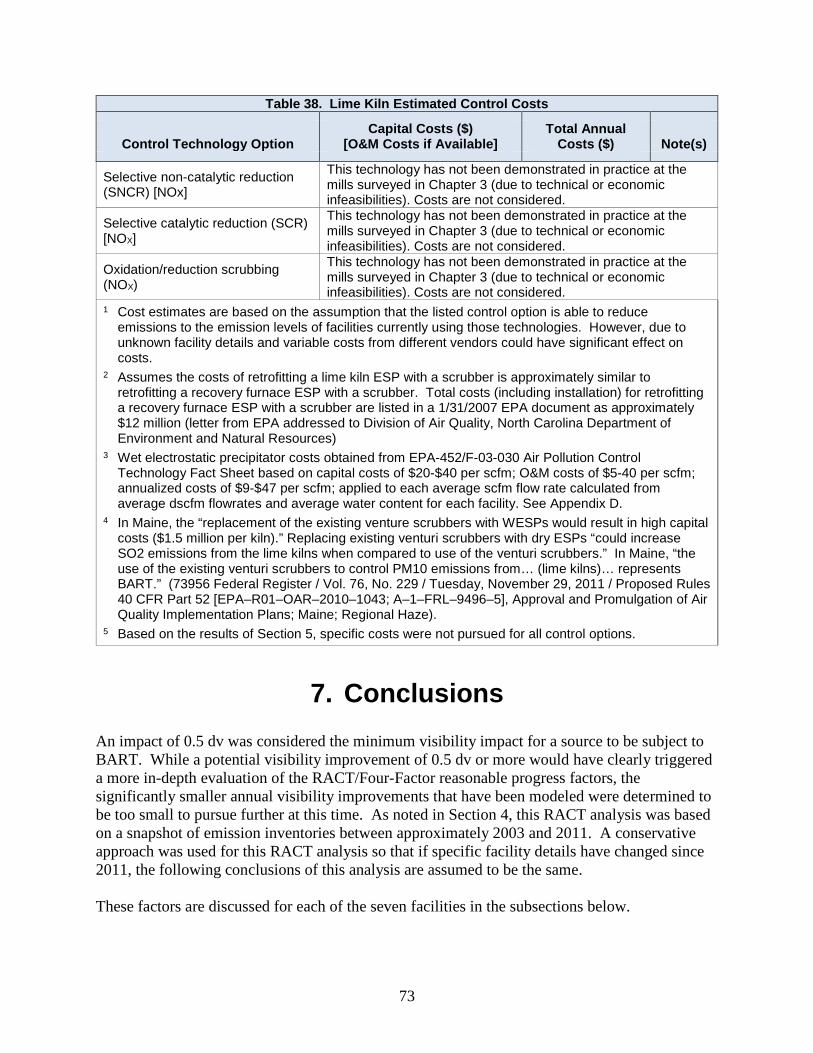
73
Table 38. Lime Kiln Estimated Control Costs
Control Technology Option Capital Costs ($)
[O&M Costs if Available] Total Annual
Costs ($) Note(s)
Selective non-catalytic reduction (SNCR) [NOx]
This technology has not been demonstrated in practice at the mills surveyed in Chapter 3 (due to technical or economic infeasibilities). Costs are not considered.
Selective catalytic reduction (SCR) [NOX]
This technology has not been demonstrated in practice at the mills surveyed in Chapter 3 (due to technical or economic infeasibilities). Costs are not considered.
Oxidation/reduction scrubbing (NOX)
This technology has not been demonstrated in practice at the mills surveyed in Chapter 3 (due to technical or economic infeasibilities). Costs are not considered.
1 Cost estimates are based on the assumption that the listed control option is able to reduce emissions to the emission levels of facilities currently using those technologies. However, due to unknown facility details and variable costs from different vendors could have significant effect on costs.
2 Assumes the costs of retrofitting a lime kiln ESP with a scrubber is approximately similar to retrofitting a recovery furnace ESP with a scrubber. Total costs (including installation) for retrofitting a recovery furnace ESP with a scrubber are listed in a 1/31/2007 EPA document as approximately $12 million (letter from EPA addressed to Division of Air Quality, North Carolina Department of Environment and Natural Resources)
3 Wet electrostatic precipitator costs obtained from EPA-452/F-03-030 Air Pollution Control Technology Fact Sheet based on capital costs of $20-$40 per scfm; O&M costs of $5-40 per scfm; annualized costs of $9-$47 per scfm; applied to each average scfm flow rate calculated from average dscfm flowrates and average water content for each facility. See Appendix D.
4 In Maine, the “replacement of the existing venture scrubbers with WESPs would result in high capital costs ($1.5 million per kiln).” Replacing existing venturi scrubbers with dry ESPs “could increase SO2 emissions from the lime kilns when compared to use of the venturi scrubbers.” In Maine, “the use of the existing venturi scrubbers to control PM10 emissions from… (lime kilns)… represents BART.” (73956 Federal Register / Vol. 76, No. 229 / Tuesday, November 29, 2011 / Proposed Rules 40 CFR Part 52 [EPA–R01–OAR–2010–1043; A–1–FRL–9496–5], Approval and Promulgation of Air Quality Implementation Plans; Maine; Regional Haze).
5 Based on the results of Section 5, specific costs were not pursued for all control options.
7. Conclusions An impact of 0.5 dv was considered the minimum visibility impact for a source to be subject to BART. While a potential visibility improvement of 0.5 dv or more would have clearly triggered a more in-depth evaluation of the RACT/Four-Factor reasonable progress factors, the significantly smaller annual visibility improvements that have been modeled were determined to be too small to pursue further at this time. As noted in Section 4, this RACT analysis was based on a snapshot of emission inventories between approximately 2003 and 2011. A conservative approach was used for this RACT analysis so that if specific facility details have changed since 2011, the following conclusions of this analysis are assumed to be the same. These factors are discussed for each of the seven facilities in the subsections below.
74
7.1. PTPC conclusions Based on the modeling results presented in Chapter 5 and Appendix C, Ecology is not proposing that PTPC adopt the potential RACT limits considered in Chapter 4. Ecology believes that the potential visibility improvements are too minimal to justify the cost of implementing these RACT limits. Other RACT requirements are not being considered at this time.
7.2. WestRock conclusions Based on the modeling results presented in Chapter 5 and Appendix C, Ecology is not proposing that WestRock adopt the potential RACT limits considered Chapter 4. Ecology believes that the potential visibility improvements are too minimal to justify the cost of implementing these RACT limits. Other RACT requirements are not being considered at this time.
7.3. Weyerhaeuser conclusions Based on the modeling results presented in Chapter 5 and Appendix C, Ecology is not proposing that Weyerhaeuser adopt the potential RACT limits considered Chapter 4. Ecology believes that the potential visibility improvements are too minimal to justify the cost of implementing these RACT limits. Other RACT requirements are not being considered at this time.
7.4. GP Camas conclusions Based on the modeling results presented in Chapter 5 and Appendix C, Ecology is not proposing that GP Camas adopt the potential RACT limits considered Chapter 4. Ecology believes that the potential visibility improvements are too minimal to justify the cost of implementing these RACT limits. Other RACT requirements are not being considered at this time.
7.5. KapStone conclusions Based on the modeling results presented in Chapter 5 and Appendix C, Ecology is not proposing that KapStone adopt the potential RACT limits considered in Chapter 4. Ecology believes that the potential visibility improvements are too minimal to justify the cost of implementing these RACT limits. Other RACT requirements are not being considered at this time.
7.6. Boise White Wallula Mill conclusions Based on the modeling results presented in Chapter 5 and Appendix C, Ecology is not proposing that Boise White Wallula adopt the potential RACT limits considered in Chapter 4. Ecology believes that the potential visibility improvements are too minimal to justify the cost of implementing these RACT limits. Other RACT requirements are not being considered at this time.
75
7.7. Cosmo specialty fiber mill conclusions Based on the modeling results presented in Chapter 5 and Appendix C, Ecology is not proposing that Cosmo adopt the potential RACT limits considered in Chapter 4. Ecology believes that the potential visibility improvements are too minimal to justify the cost of implementing these RACT limits. Other RACT requirements are not being considered at this time.
7.8. Graymont lime kiln conclusions Based on the modeling results presented in Chapter 5 and Appendix C, Ecology is not proposing that the Graymont lime kiln adopt the potential RACT limits considered in Chapter 4. Ecology believes that the potential visibility improvements are too minimal to justify the cost of implementing these RACT limits. Other RACT requirements are not being considered at this time.

76
Appendices

77
Appendix A. Unit Conversions and Permit Limit Information
78
Section A-1 Unit Conversions
Recovery Furnace Particulate Matter Unit Conversions
Location Facility (RF Unit if specified) Limit A: gr/dscf
(at 8% O2)
Limit B: Daily avg: gr/dscf (at 8% O2)
Flow range (m3/Adt)
mg/dscm (at 8% O2)
mg/dscm (at 6% O2)
mg/Nm3 (at5%O2)
kg TSP/ ADt m3/min
Europe LCPDsb: low range NA 0.011 7000-9000 26 30 0.2 USA New/reconstructed after 5/23/2013 0.015 Louisiana (e) International Paper CAMTI (No. 3) 0.015 Minnesota Boise Cascade Int'l Falls (EU320) 0.0165 Europe LCPDsb: high range NA 0.019 7000-9000 44 50 0.5 Arkansas Georgia Pacific Crossert (8R) 0.02 Georgia International Paper AM (No. 3) 0.021 North Carolina Kapstone (No. 7) 0.021 Mississippi Weyerhaeuser NR PW (AA-100) 0.023 Georgia GP Cedar Springs (No. 3) 0.024 Louisiana Port Hudson (No. 1) 0.025 Louisiana Port Hudson (No. 2) 0.025 Alabama Alabama River Cellulose (No. 1) 0.025 Alabama Alabama River Cellulose (No. 2) 0.025 Minnesota Sappi Cloquet LLC (#10) 0.025 British
Prince George Vancouver (RB) 0.026 60 5550
Washington Weyerhaeuser (No. 10) 0.027 Washington Boise White Wallula (No. 3) 0.027 Washington Kapstone (22) 0.027 Maine Red Shield (# 4) 0.028 Georgia GP Cedar Springs (No. 1) 0.030 Georgia GP Cedar Springs (No. 2) 0.030 Idaho Clearwater Lewiston (No. 5) 0.03 Florida Palatka (No. 4) 0.030 Washington GP Camas (No. 3) 0.033 75 Washington GP Camas (No. 4) 0.033 75 Idaho Clearwater Lewiston (No. 4) 0.040 Washington Kapstone (19) 0.040 USA Modified RFs after 5/23/2013 0.044 Georgia Weyerhaeuser PWM (No. 3) 0.044 0.10 Kentucky Wycliffe Paper (03) 0.044 Oregon GP Consumer Products (EU24) 0.044 Oregon Boise White St Helens (2 & 3) 0.044 Oregon Cascade Pacific (RFEU) 0.044 Washington Boise White Wallula (No. 2) 0.044 Washington Kapstone (18) 0.044 Washington PTPC (RF) 0.044 Washington WestRock (No. 4) 0.044 British
Catalyst PC Vancouver (#3, w#4 on) 0.051 117 135 7000
British
Catalyst PC Vancouver (#4, w#3 on) 0.051 117 135 7000 British
Catalyst PC Vancouver (#4, w#3 out) 0.062 143 165 9000
Georgia International Paper AM (No. 2) 0.055 British
Howe Sound Vancouver (E218529) 0.057 130 150 5950
Washington Cosmo (No. 1,2 & 3 common stk) 0.10 Europe (sulphite) LCPDs* for Paper Sector (low range) NA 0.002 6000-7000 4 5 0.02
Europe (sulphite) LCPDs* for Paper Sector (high range) NA 0.008 6000-7000 17 20 0.15
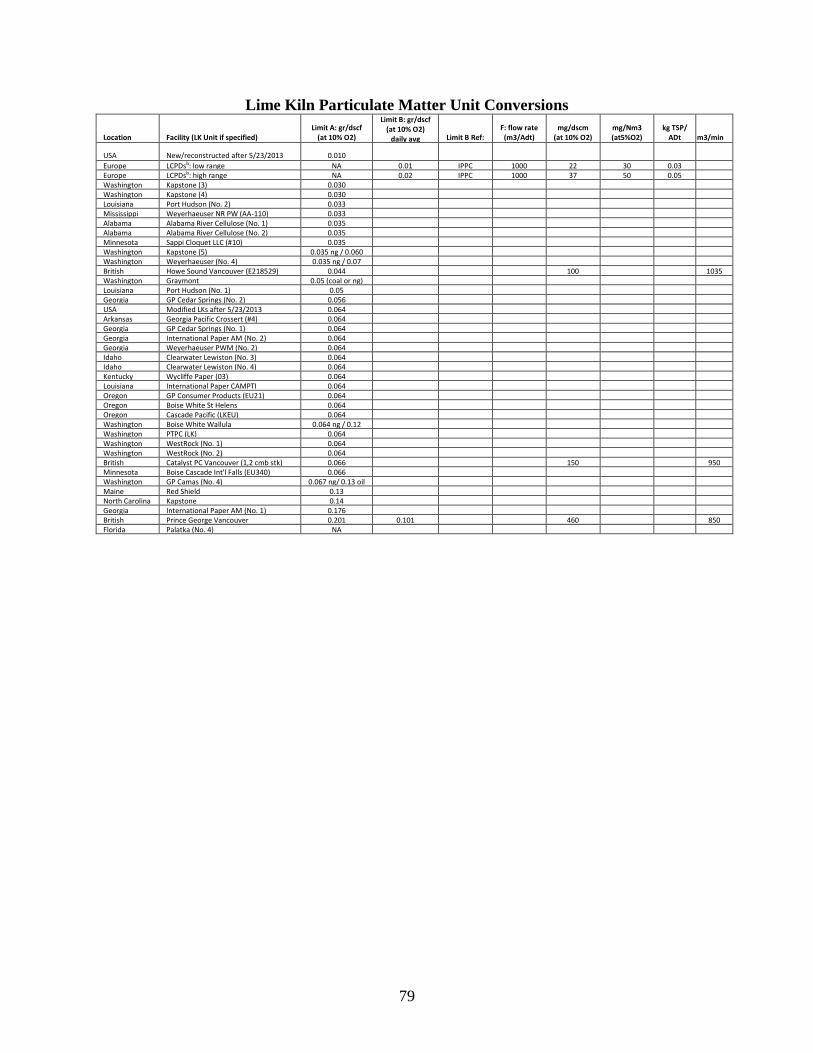
79
Lime Kiln Particulate Matter Unit Conversions
Location Facility (LK Unit if specified) Limit A: gr/dscf
(at 10% O2)
Limit B: gr/dscf (at 10% O2)
daily avg Limit B Ref: F: flow rate (m3/Adt)
mg/dscm (at 10% O2)
mg/Nm3 (at5%O2)
kg TSP/ ADt m3/min
USA New/reconstructed after 5/23/2013 0.010 Europe LCPDsb: low range NA 0.01 IPPC 1000 22 30 0.03 Europe LCPDsb: high range NA 0.02 IPPC 1000 37 50 0.05 Washington Kapstone (3) 0.030 Washington Kapstone (4) 0.030 Louisiana Port Hudson (No. 2) 0.033 Mississippi Weyerhaeuser NR PW (AA-110) 0.033 Alabama Alabama River Cellulose (No. 1) 0.035 Alabama Alabama River Cellulose (No. 2) 0.035 Minnesota Sappi Cloquet LLC (#10) 0.035 Washington Kapstone (5) 0.035 ng / 0.060
Washington Weyerhaeuser (No. 4) 0.035 ng / 0.07
British
Howe Sound Vancouver (E218529) 0.044 100 1035
Washington Graymont 0.05 (coal or ng) Louisiana Port Hudson (No. 1) 0.05 Georgia GP Cedar Springs (No. 2) 0.056 USA Modified LKs after 5/23/2013 0.064 Arkansas Georgia Pacific Crossert (#4) 0.064 Georgia GP Cedar Springs (No. 1) 0.064 Georgia International Paper AM (No. 2) 0.064 Georgia Weyerhaeuser PWM (No. 2) 0.064 Idaho Clearwater Lewiston (No. 3) 0.064 Idaho Clearwater Lewiston (No. 4) 0.064 Kentucky Wycliffe Paper (03) 0.064 Louisiana International Paper CAMPTI 0.064 Oregon GP Consumer Products (EU21) 0.064 Oregon Boise White St Helens 0.064 Oregon Cascade Pacific (LKEU) 0.064 Washington Boise White Wallula 0.064 ng / 0.12
Washington PTPC (LK) 0.064 Washington WestRock (No. 1) 0.064 Washington WestRock (No. 2) 0.064 British
Catalyst PC Vancouver (1,2 cmb stk) 0.066 150 950
Minnesota Boise Cascade Int'l Falls (EU340) 0.066 Washington GP Camas (No. 4) 0.067 ng/ 0.13 oil Maine Red Shield 0.13 North Carolina Kapstone 0.14 Georgia International Paper AM (No. 1) 0.176 British
Prince George Vancouver 0.201 0.101 460 850
Florida Palatka (No. 4) NA
80
Recovery Furnace SO2 Unit Conversions
Location Facility (RF Unit if specified) Limit A: ppm (at 8% O2)
Limit C: 24-hr avg ppm (at 8% O2)
Limit E: Annual ppm (at 8% O2)
mg/dscm (at 8% O2)
mg/Nm3 (at5%O2)
kg S/ ADt
Europe LCPDsb: low range 3.3 (24-hr avg) 3.3 9 10 0.1 Washington GP Camas (No. 3) 10 (24-hr avg) 10 Washington GP Camas (No. 4) 10 (24-hr avg) 10 Europe LCPDsb: high range 16 (24-hr avg) 16.4 44 50 0.4 Louisiana International Paper CAMTI (No. 3) 20 (3-hr avg) Idaho Clearwater Lewiston (No. 5) 50 (3-hr avg)
Washington Kapstone (18) 60 (3-hr avg) [switched to lb/hr
units]
Washington Kapstone (19) 60 (3-hr avg) [switched to lb/hr
units] Washington Weyerhaeuser (No. 10) 75 (3-hr avg) Florida Palatka (No. 4) 100 (24-hr avg) Alabama Alabama River Cellulose (No.1) 100 Alabama Alabama River Cellulose (No.2) 100 Maine Red Shield (# 4) 100 North Carolina Kapstone (No. 7) 110 (3-hr avg) 75 Louisiana Port Hudson (No. 1) 120 Louisiana Port Hudson (No. 2) 120
Washington Kapstone (22) 120 (3-hr avg) [switched to lb/hr
units] Mississippi Weyerhaeuser NR PW (AA-100) 153 Oregon Cascade Pacific (RFEU) 180 Washington PTPC (RF) 200 Georgia Weyerhaeuser PWM (No. 3) 200 Minnesota Sappi Cloquet LLC (#10) 250 Georgia GP Cedar Springs (No. 1) 300 Georgia GP Cedar Springs (No. 2) 300 Oregon GP Consumer Products (EU24) 300 (3-hr avg) 300 Oregon Boise White St Helens (2&3) 300 (3-hr avg) 300 Georgia GP Cedar Springs (No. 3) 350 (24-hr avg) 350 Washington Cosmo (No. 1,2 & 3 common stk) (c) 360 (c) Washington WestRock (No. 4) 500 (150 30-day) Washington Boise White Wallula (No. 2) 500 Washington Boise White Wallula (No. 3) 500 Enocell, Finland Not specified in IPPCb ≤ 2 (annual avg) 0.1 0.21 0.24 (a) Frövi, Sweden Not specified in IPPCb ≤ 2 (annual avg) 0.2 0.6 0.7 (a) Joutseno, Finland Not specified in IPPCb ≤ 2 (annual avg) 0.5 1.3 1.5 (a) Dynäs, Sweden Not specified in IPPCb ≤ 2 (annual avg) 0.7 1.7 2.0 (a) Pöls AG, Austria Not specified in IPPCb ≤ 2 (annual avg) 0.7 1.7 2.0 (a) Oulu, Finland Not specified in IPPCb ≤ 2 (annual avg) 0.9 2.4 2.8 (a) Östrand, Sweden Not specified in IPPCb ≤ 2 (annual avg) 1.5 4.1 4.7 (a) Varö, Sweden Not specified in IPPCb ≤ 2 (annual avg) 1.5 4.1 4.7 (a) Stora Celbi, Portugal Not specified in IPPCb ≤ 2 (annual avg) 1.5 4.1 4.7 (a) Vallvik, Sweden Not specified in IPPCb ≤ 2 (annual avg) 2.0 5.2 6.0 (a) Mönsteras, Sweden Not specified in IPPCb 4 (annual avg) 3.7 9.9 11.3 (a) Obbola, Sweden Not specified in IPPCb 4 (annual avg) 3.7 9.9 11.3 (a) Skutskär, Sweden Not specified in IPPCb 5 (annual avg) 5.0 13.4 15.3 (a) Bäckhammar,
Not specified in IPPCb 5 (annual avg) 5.0 13.4 15.3 (a)
Skärblacka, Sweden Not specified in IPPCb 6 (annual avg) 6.3 16.8 19.3 (a) Skoghall, Sweden Not specified in IPPCb 6 (annual avg) 6.3 16.8 19.3 (a) Wisaforest, Finland Not specified in IPPCb 7 (annual avg) 6.7 17.8 20.4 (a) Husum, Sweden Not specified in IPPCb 12 (annual avg) 12.0 31.9 36.7 (a) Aspa, Sweden Not specified in IPPCb 15 (annual avg) 14.6 38.9 44.7 (a) Ääneskoski, Finland Not specified in IPPCb 15 (annual avg) 15.5 41.2 47.3 (a) Kaskinen, Finland Not specified in IPPCb 16 (annual avg) 16.0 42.6 48.9 (a) Iggesund, Sweden Not specified in IPPCb 16 (annual avg) 16.4 43.6 50.0 (a) Huelva, Spain Not specified in IPPCb 17 (annual avg) 16.8 44.7 51.3 (a) Sunila, Finland Not specified in IPPCb 18 (annual avg) 17.8 47.4 54.4 (a) British Columbia Prince George Vancouver (RB) 11 30 Minnesota Boise Cascade Int'l Falls (EU320) NA Arkansas Georgia Pacific Crossert (8R) NA Georgia International Paper AM (No. 3) NA Georgia International Paper AM (No. 2) NA Idaho Clearwater Lewiston (No. 4) NA Kentucky Wycliffe Paper (03) NA British Columbia Catalyst PC Vancouver (#3, w#4 on) "as specified in S content of fuel
British Columbia Catalyst PC Vancouver (#4, w#3 on) "as specified in S content of fuel
British Columbia Catalyst PC Vancouver (#4, w#3 out) "as specified in S content of fuel
British Columbia Howe Sound Vancouver (E218529) NA Europe (sulphite) LCPDs* for Paper Sector (low range) 16 (24-hr avg) 16.4 44 50 0.3 Europe (sulphite) LCPDs* for Paper Sector (high range) 49 (24-hr avg) 49.1 131 150 1.0 Notes: (a) See European Mills Summary
81
Lime Kiln SO2 Unit Conversions
Location Facility (LK Unit if specified) Limit A: ppm (at 10% O2)
Oil fired w/o NCG:
Limit C:ppm 24-
hr avg
Oil fired wNCG: Limit
C:ppm 24-hr avg
Oil fired w/o NCG: Limit D: Annual ppm (at 10% O2)
Oil fired w NCG: Limit D: Annual ppm (at 10% O2)
Oil fired w/o NCG: g/dscm (at
10% O2) Europe LCPDsb: low range (w/o NCG incineration) 1.4 (24-hr avg) 1.4 4 Europe LCPDsb: high range (w/o NCG incineration) 8 (24-hr avg) 8.3 22 Florida Palatka (No. 4) 16.9 Alabama Alabama River Cellulose (No. 1) 50 Alabama Alabama River Cellulose (No. 2) 50 Mississippi Weyerhaeuser NR PW (AA-110) 50 Washington Kapstone (3) 20 (3-hr avg) Washington Kapstone (4) 20 (3-hr avg) Washington Kapstone (5) 20 (3-hr avg) Idaho Clearwater Lewiston (No. 4) 20 (3-hr avg) Europe LCPDsb: low range (w/ NCG incineration) 42 (24-hr avg) 41.5 Europe LCPDsb: high range (w/ NCG incineration) 83 (24-hr avg) 83.0 Washington GP Camas (No. 4) 500 Washington Weyerhaeuser (No. 4) 500 Washington PTPC (RF) 500 Washington WestRock (No. 1) 500 Washington WestRock (No. 2) 500 Washington Graymont 1000 (coal or ng) Oulu, Finland Not specified in IPPCb 2 (annual avg) 2 22 4.4 Husum,
Not specified in IPPCb 3 (annual avg) 3 23 7.4
Skoghall,
Not specified in IPPCb 3 (annual avg) 3 23 7.4 Dynäs,
Not specified in IPPCb 3 (annual avg) 3 23 7.4
Frövi, Sweden Not specified in IPPCb 3 (annual avg) 3 23 7.4 Obbola,
Not specified in IPPCb 3 (annual avg) 3 23 7.4
Bäckhammar,
Not specified in IPPCb 3 (annual avg) 3 23 7.4 Pöls AG,
Not specified in IPPCb 3 (annual avg) 3 23 7.4
Joutseno,
Not specified in IPPCb 3 (annual avg) 3 23 8.8 Washington Boise White Wallula 5 (annual avg) Stora Celbi,
Not specified in IPPCb 6 (annual avg) 6 25 14.7
Wisaforest,
Not specified in IPPCb 8 (annual avg) 8 27 22.1 Kaskinen,
Not specified in IPPCb 12-30 (annual avg) 12 30 32.4
Mönsteras,
Not specified in IPPCb 14-31 (annual avg) 14 31 36.8 Skärblacka,
Not specified in IPPCb 14-31 (annual avg) 14 31 36.8
Ääneskoski,
Not specified in IPPCb 16-33 (annual avg) 16 33 43.5 Sunila, Finland Not specified in IPPCb 17-33 (annual avg) 17 33 44.9 Aspa, Sweden Not specified in IPPCb 28-41 (annual avg) 28 41 73.7 Skutskär,
Not specified in IPPCb 28-41 (annual avg) 28 41 73.7
Iggesund,
Not specified in IPPCb 44 (annual avg) 30 44 81.0 Enocell,
Not specified in IPPCb 48 (annual avg) 37 48 98.0
Vallvik,
Not specified in IPPCb 81 (annual avg) 80 81 213.7 Varö, Sweden Not specified in IPPCb 81 (annual avg) 80 81 213.7 Östrand,
Not specified in IPPCb 104 (annual avg) 111 104 294.7
Huelva, Spain Not specified in IPPCb 160 (annual avg) 185 160 493.6 Louisiana International Paper CAMTI (No. 3) NA Minnesota Boise Cascade Int'l Falls (EU320) NA North Carolina Kapstone (No. 7) NA British
Prince George Vancouver (RB) NA
Maine Red Shield (# 4) NA Louisiana Port Hudson (No. 1) NA Louisiana Port Hudson (No. 2) NA Minnesota Sappi Cloquet LLC NA Georgia GP Cedar Springs (No. 1) NA Georgia GP Cedar Springs (No. 2) NA Oregon Cascade Pacific (LKEU) TBD per permit Arkansas Georgia Pacific Crossert (#4) NA Georgia Weyerhaeuser PWM (No. 2) NA Georgia International Paper AM (No. 1) NA Georgia International Paper AM (No. 2) NA Idaho Clearwater Lewiston (No. 3) NA Kentucky Wycliffe Paper (03) NA Oregon GP Consumer Products (EU21) NA Oregon Boise White St Helens NA British Columbia Catalyst PC Vancouver (#3, w#4 on)
"as specified in S content of fuel reg"
British Columbia Catalyst PC Vancouver (#4, w#3 on)
"as specified in S content of fuel reg"
British Columbia Catalyst PC Vancouver (#4, w#3 out)
"as specified in S content of fuel reg"
British
Howe Sound Vancouver (E218529) NA Notes: (a) See European Mills Summary
82
Lime Kiln SO2 Unit Conversions (Continued)
Location Facility (LK Unit if specified) Limit A: ppm (at
10% O2)
Oil fired w NCG: g/dscm (at 10% O2)
Oil fired w/o NCG:
mg/Nm3 (at5%O2)
Oil fired w/o NCG: kg S/
ADt
Oil fired w NCG: mg/Nmc
(at5%O2)
Oil fired w NCG:
kg S/ ADt
Europe LCPDsb: low range (w/o NCG incineration) 1.4(24-hr avg) 5 0.005 ---
Europe LCPDsb: high range (w/o NCG
8 (24-hr avg) 30 0.03 --- Florida Palatka (No. 4) 16.9 Alabama Alabama River Cellulose (No. 1) 50 Alabama Alabama River Cellulose (No. 2) 50 Mississippi Weyerhaeuser NR PW (AA-110) 50 Washington Kapstone (3) 20 (3-hr avg) Washington Kapstone (4) 20 (3-hr avg) Washington Kapstone (5) 20 (3-hr avg) Idaho Clearwater Lewiston (No. 4) 20 (3-hr avg) Europe LCPDsb: low range (w/ NCG
42 (24-hr avg) 111 --- 150 0.1
Europe LCPDsb: high range (w/ NCG
83 (24-hr avg) 221 --- 300 0.3 Washington GP Camas (No. 4) 500 Washington Weyerhaeuser (No. 4) 500 Washington PTPC (RF) 500 Washington WestRock (No. 1) 500 Washington WestRock (No. 2) 500 Washington Graymont 1000 (coal or ng) Oulu, Finland Not specified in IPPCb 2 (annual avg) 58.6 6.0 (a) 79.5 (a) Husum,
Not specified in IPPCb 3 (annual avg) 60.8 10.0 (a) 82.5 (a)
Skoghall,
Not specified in IPPCb 3 (annual avg) 60.8 10.0 (a) 82.5 (a) Dynäs,
Not specified in IPPCb 3 (annual avg) 60.8 10.0 (a) 82.5 (a)
Frövi, Sweden Not specified in IPPCb 3 (annual avg) 60.8 10.0 (a) 82.5 (a) Obbola,
Not specified in IPPCb 3 (annual avg) 60.8 10.0 (a) 82.5 (a)
Bäckhammar,
Not specified in IPPCb 3 (annual avg) 60.8 10.0 (a) 82.5 (a) Pöls AG,
Not specified in IPPCb 3 (annual avg) 60.8 10.0 (a) 82.5 (a)
Joutseno,
Not specified in IPPCb 3 (annual avg) 61.9 12.0 (a) 84.0 (a) Washington Boise White Wallula 5 (annual avg) (a) (a) Stora Celbi,
Not specified in IPPCb 6 (annual avg) 66.3 20.0 (a) 90.0 (a)
Wisaforest,
Not specified in IPPCb 8 (annual avg) 71.8 30.0 (a) 97.5 (a) Kaskinen,
Not specified in IPPCb 12-30 (annual avg) 79.6 44.0 (a) 108.0 (a)
Mönsteras,
Not specified in IPPCb 14-31 (annual avg) 82.9 50.0 (a) 112.5 (a) Skärblacka,
Not specified in IPPCb 14-31 (annual avg) 82.9 50.0 (a) 112.5 (a)
Ääneskoski,
Not specified in IPPCb 16-33 (annual avg) 87.9 59.0 (a) 119.3 (a) Sunila,
Not specified in IPPCb 17-33 (annual avg) 89.0 61.0 (a) 120.8 (a)
Aspa, Sweden Not specified in IPPCb 28-41 (annual avg) 110.5 100.0 (a) 150.0 (a) Skutskär,
Not specified in IPPCb 28-41 (annual avg) 110.5 100.0 (a) 150.0 (a)
Iggesund,
Not specified in IPPCb 44 (annual avg) 116.0 110.0 (a) 157.5 (a) Enocell,
Not specified in IPPCb 48 (annual avg) 128.8 133.0 (a) 174.8 (a)
Vallvik,
Not specified in IPPCb 81 (annual avg) 215.5 290.0 (a) 292.5 (a) Varö, Sweden Not specified in IPPCb 81 (annual avg) 215.5 290.0 (a) 292.5 (a) Östrand,
Not specified in IPPCb 104 (annual avg) 276.3 400.0 (a) 375.0 (a)
Huelva, Spain Not specified in IPPCb 160 (annual avg) 425.5 670.0 (a) 577.5 (a) Louisiana International Paper CAMTI (No. 3) NA Minnesota Boise Cascade Int'l Falls (EU320) NA North Carolina Kapstone (No. 7) NA British
Prince George Vancouver (RB) NA
Maine Red Shield (# 4) NA Louisiana Port Hudson (No. 1) NA Louisiana Port Hudson (No. 2) NA Minnesota Sappi Cloquet LLC NA Georgia GP Cedar Springs (No. 1) NA Georgia GP Cedar Springs (No. 2) NA Oregon Cascade Pacific (LKEU) TBD per permit Arkansas Georgia Pacific Crossert (#4) NA Georgia Weyerhaeuser PWM (No. 2) NA Georgia International Paper AM (No. 1) NA Georgia International Paper AM (No. 2) NA Idaho Clearwater Lewiston (No. 3) NA Kentucky Wycliffe Paper (03) NA Oregon GP Consumer Products (EU21) NA Oregon Boise White St Helens NA
British Columbia Catalyst PC Vancouver (#3, w#4 on)
"as specified in S content of fuel reg"
British Columbia Catalyst PC Vancouver (#4, w#3 on)
"as specified in S content of fuel reg"
British Columbia Catalyst PC Vancouver (#4, w#3 out)
"as specified in S content of fuel reg"
British
Howe Sound Vancouver (E218529) NA Notes: (a) See European Mills Summary
83
Recovery Furnace NOx Unit Conversions Location Facility (RF Unit if specified)
Limit A: ppmd (at 8% O2)
Limit C: 24-hr avg: ppm (at 8% O2)
Annual ppm (@8%O2)
mg/dscm (at 8% O2)
mg/Nm3 (at5%O2)
kg NOx/ ADt
Europe LCPDsb: low range 36 (24-hr avg) 36 70 80 0.7 Europe LCPDsb: high range 55 (24-hr avg) 55 105 120 1.1 Alabama Alabama River Cellulose (No. 2) 75 Louisiana International Paper CAMTI (No. 3) 80 (3-hr avg) Mississippi Weyerhaeuser NR PW (AA-100) 80 (8-hr avg) Alabama Alabama River Cellulose (No. 1) 90 Washington Kapstone (22) 95 (3-hr avg) Washington Kapstone (18) 95 (24-hr avg) 95 Washington Kapstone (19) 95 (24-hr avg) 95 Idaho Clearwater Lewiston (No. 5) 100 Arkansas Georgia Pacific Crossert (8R) 110 Louisiana Port Hudson (No. 1) 112 Louisiana Port Hudson (No. 2) 112 Washington Boise White Wallula (No. 3) 112 (24-hr avg) 112 Washington Weyerhaeuser (No. 10) 140 (24-hr avg) 140 Maine Red Shield (# 4) 150 (24-hr avg) Minnesota Boise Cascade Int'l Falls (EU320) 80 (30-day avg) Florida Palatka (No. 4) 80 (30-day avg) Washington WestRock (No. 4) 85 (30-day avg) North Carolina Kapstone (No. 7) 100 (30-day avg) Minnesota Sappi Cloquet LLC 115 (30-day avg) Skärblacka, Sweden Not specified in IPPCb 35 (annual avg) 35 66 76 (a) Oulu, Finland Not specified in IPPCb 41 (annual avg) 41 79 91 (a) Wisaforest, Finland Not specified in IPPCb 44 (annual avg) 44 84 96.4 (a) Huelva, Spain Not specified in IPPCb 45 (annual avg) 45 85 98 (a) Mönsteras, Sweden Not specified in IPPCb 48 (annual avg) 48 91 105 (a) Frövi, Sweden Not specified in IPPCb 51 (annual avg) 51 97 111 (a) Joutseno, Finland Not specified in IPPCb 51 (annual avg) 51 97 111.3 (a) Obbola, Sweden Not specified in IPPCb 51 (annual avg) 51 98 112 (a) Stora Celbi, Portugal Not specified in IPPCb 51 (annual avg) 51 98 112 (a) Sunila, Finland Not specified in IPPCb 51 (annual avg) 51 98 112.9 (a) Skoghall, Sweden Not specified in IPPCb 56 (annual avg) 56 108 124 (a) Enocell, Finland Not specified in IPPCb 59 (annual avg) 59 112 128.6 (a) Husum, Sweden Not specified in IPPCb 60 (annual avg) 60 114 131 (a) Bäckhammar,
Not specified in IPPCb 60 (annual avg) 60 115 132 (a)
Dynäs, Sweden Not specified in IPPCb 61 (annual avg) 61 117 134 (a) Skutskär, Sweden Not specified in IPPCb 62 (annual avg) 62 119 136 (a) Aspa, Sweden Not specified in IPPCb 63 (annual avg) 63 121 139 (a) Östrand, Sweden Not specified in IPPCb 67 (annual avg) 67 127 146 (a) Kaskinen, Finland Not specified in IPPCb 67 (annual avg) 67 128 146.6 (a) Vallvik, Sweden Not specified in IPPCb 70 (annual avg) 70 134 154 (a) Iggesund, Sweden Not specified in IPPCb 73 (annual avg) 73 139 160 (a) Varö, Sweden Not specified in IPPCb 73 (annual avg) 73 140 161 (a) Pöls AG, Austria Not specified in IPPCb 77 (annual avg) 77 148 170 (a) Ääneskoski, Finland Not specified in IPPCb 84 (annual avg) 84 161 184.8 (a) Georgia GP Cedar Springs (No. 1) NA Georgia GP Cedar Springs (No. 2) NA Georgia GP Cedar Springs (No. 3) NA Georgia International Paper AM (No. 2) NA Georgia International Paper AM (No. 3) NA Georgia Weyerhaeuser PWM (No. 3) NA Idaho Clearwater Lewiston (No. 4) NA Kentucky Wycliffe Paper (03) NA Oregon Cascade Pacific (RFEU) TBD per permit Oregon GP Consumer Products (EU24) No limit in permit Oregon Boise White St Helens (2&3) No limit in permit Washington Boise White Wallula (No. 2) NA Washington Cosmo (No. 1,2 & 3 common stk) NA Washington GP Camas (No. 3) NA Washington GP Camas (No. 4) NA Washington PTPC (RF) NA British Columbia Catalyst PC Vancouver (#3, w#4 on) NA British Columbia Catalyst PC Vancouver (#4, w#3 on) NA British Columbia Catalyst PC Vancouver (#4, w#3 out) NA British Columbia Howe Sound Vancouver (E218529) NA British Columbia Prince George Vancouver (RB) 11.3 30 Europe-sulphite LCPDsb: low range 91 (24-hr avg) 91 174 200 1.0 Europe-sulphite LCPDsb: high range 137 (24-hr avg) 137 261 300 2.0 Notes: (a) See European Mills Summary
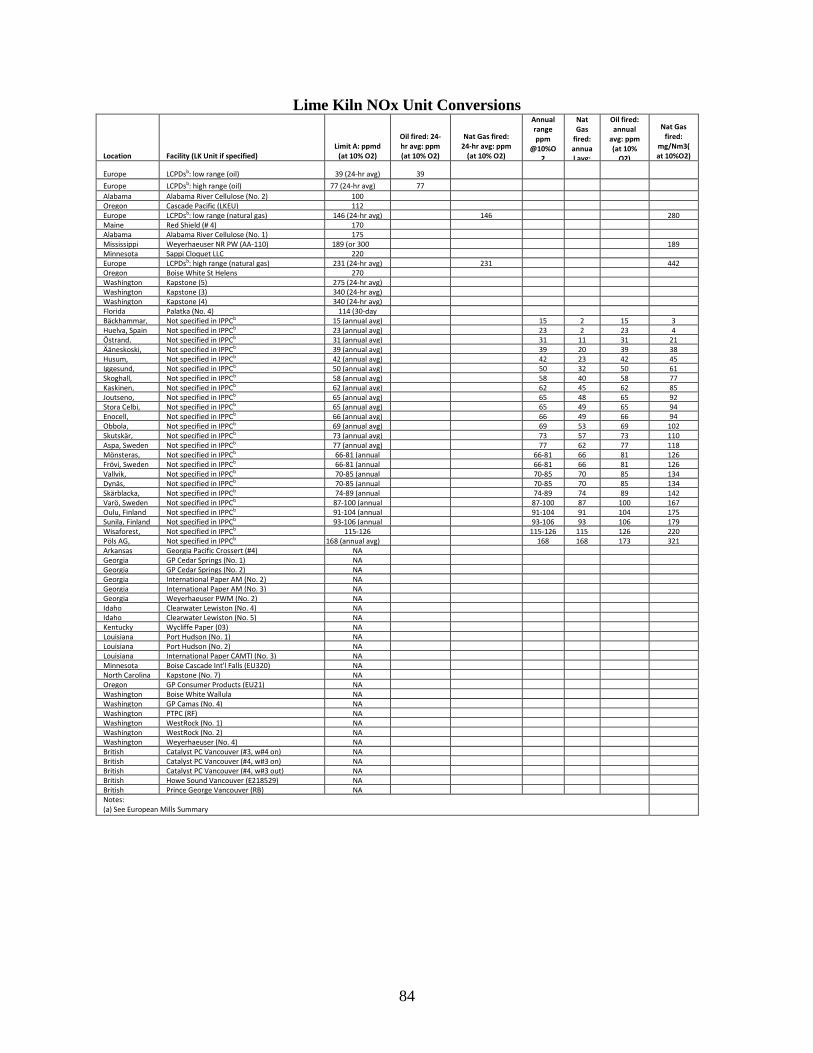
84
Lime Kiln NOx Unit Conversions
Location Facility (LK Unit if specified) Limit A: ppmd
(at 10% O2)
Oil fired: 24-hr avg: ppm (at 10% O2)
Nat Gas fired: 24-hr avg: ppm
(at 10% O2)
Annual range ppm
@10%O2
Nat Gas
fired: annual avg:
Oil fired: annual
avg: ppm (at 10%
O2)
Nat Gas fired:
mg/Nm3(at 10%O2)
Europe LCPDsb: low range (oil) 39 (24-hr avg) 39 Europe LCPDsb: high range (oil) 77 (24-hr avg) 77 Alabama Alabama River Cellulose (No. 2) 100 Oregon Cascade Pacific (LKEU) 112 Europe LCPDsb: low range (natural gas) 146 (24-hr avg) 146 280 Maine Red Shield (# 4) 170 Alabama Alabama River Cellulose (No. 1) 175 Mississippi Weyerhaeuser NR PW (AA-110) 189 (or 300
189 Minnesota Sappi Cloquet LLC 220 Europe LCPDsb: high range (natural gas) 231 (24-hr avg) 231 442 Oregon Boise White St Helens 270 Washington Kapstone (5) 275 (24-hr avg) Washington Kapstone (3) 340 (24-hr avg) Washington Kapstone (4) 340 (24-hr avg) Florida Palatka (No. 4) 114 (30-day
Bäckhammar,
Not specified in IPPCb 15 (annual avg) 15 2 15 3 Huelva, Spain Not specified in IPPCb 23 (annual avg) 23 2 23 4 Östrand,
Not specified in IPPCb 31 (annual avg) 31 11 31 21
Ääneskoski,
Not specified in IPPCb 39 (annual avg) 39 20 39 38 Husum,
Not specified in IPPCb 42 (annual avg) 42 23 42 45
Iggesund,
Not specified in IPPCb 50 (annual avg) 50 32 50 61 Skoghall,
Not specified in IPPCb 58 (annual avg) 58 40 58 77
Kaskinen,
Not specified in IPPCb 62 (annual avg) 62 45 62 85 Joutseno,
Not specified in IPPCb 65 (annual avg) 65 48 65 92
Stora Celbi,
Not specified in IPPCb 65 (annual avg) 65 49 65 94 Enocell,
Not specified in IPPCb 66 (annual avg) 66 49 66 94
Obbola,
Not specified in IPPCb 69 (annual avg) 69 53 69 102 Skutskär,
Not specified in IPPCb 73 (annual avg) 73 57 73 110
Aspa, Sweden Not specified in IPPCb 77 (annual avg) 77 62 77 118 Mönsteras,
Not specified in IPPCb 66-81 (annual
66-81 66 81 126
Frövi, Sweden Not specified in IPPCb 66-81 (annual
66-81 66 81 126 Vallvik,
Not specified in IPPCb 70-85 (annual
70-85 70 85 134
Dynäs,
Not specified in IPPCb 70-85 (annual
70-85 70 85 134 Skärblacka,
Not specified in IPPCb 74-89 (annual
74-89 74 89 142
Varö, Sweden Not specified in IPPCb 87-100 (annual
87-100 87 100 167 Oulu, Finland Not specified in IPPCb 91-104 (annual
91-104 91 104 175
Sunila, Finland Not specified in IPPCb 93-106 (annual
93-106 93 106 179 Wisaforest,
Not specified in IPPCb 115-126
115-126 115 126 220
Pöls AG,
Not specified in IPPCb 168 (annual avg) 168 168 173 321 Arkansas Georgia Pacific Crossert (#4) NA Georgia GP Cedar Springs (No. 1) NA Georgia GP Cedar Springs (No. 2) NA Georgia International Paper AM (No. 2) NA Georgia International Paper AM (No. 3) NA Georgia Weyerhaeuser PWM (No. 2) NA Idaho Clearwater Lewiston (No. 4) NA Idaho Clearwater Lewiston (No. 5) NA Kentucky Wycliffe Paper (03) NA Louisiana Port Hudson (No. 1) NA Louisiana Port Hudson (No. 2) NA Louisiana International Paper CAMTI (No. 3) NA Minnesota Boise Cascade Int'l Falls (EU320) NA North Carolina Kapstone (No. 7) NA Oregon GP Consumer Products (EU21) NA Washington Boise White Wallula NA Washington GP Camas (No. 4) NA Washington PTPC (RF) NA Washington WestRock (No. 1) NA Washington WestRock (No. 2) NA Washington Weyerhaeuser (No. 4) NA British
Catalyst PC Vancouver (#3, w#4 on) NA
British
Catalyst PC Vancouver (#4, w#3 on) NA British
Catalyst PC Vancouver (#4, w#3 out) NA
British
Howe Sound Vancouver (E218529) NA British
Prince George Vancouver (RB) NA
Notes: (a) See European Mills Summary
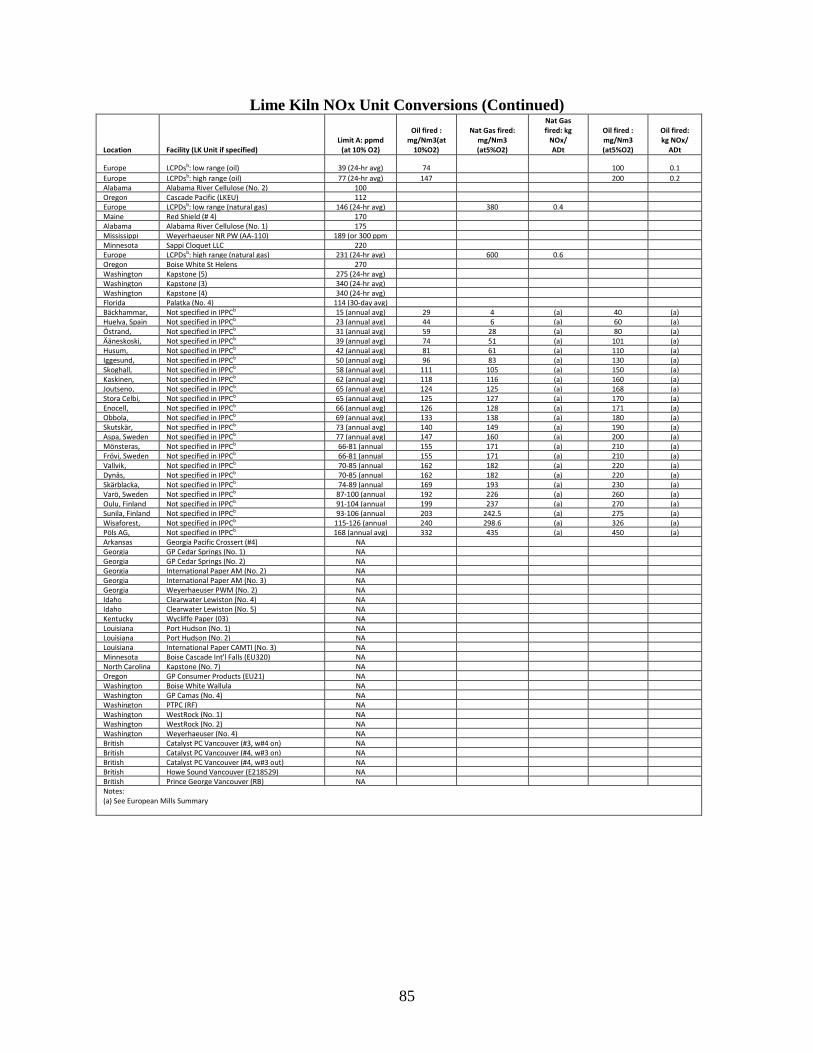
85
Lime Kiln NOx Unit Conversions (Continued)
Location Facility (LK Unit if specified) Limit A: ppmd
(at 10% O2)
Oil fired : mg/Nm3(at
10%O2)
Nat Gas fired: mg/Nm3 (at5%O2)
Nat Gas fired: kg
NOx/ ADt
Oil fired : mg/Nm3 (at5%O2)
Oil fired: kg NOx/
ADt
Europe LCPDsb: low range (oil) 39 (24-hr avg) 74 100 0.1 Europe LCPDsb: high range (oil) 77 (24-hr avg) 147 200 0.2 Alabama Alabama River Cellulose (No. 2) 100 Oregon Cascade Pacific (LKEU) 112 Europe LCPDsb: low range (natural gas) 146 (24-hr avg) 380 0.4 Maine Red Shield (# 4) 170 Alabama Alabama River Cellulose (No. 1) 175 Mississippi Weyerhaeuser NR PW (AA-110) 189 (or 300 ppm
Minnesota Sappi Cloquet LLC 220 Europe LCPDsb: high range (natural gas) 231 (24-hr avg) 600 0.6 Oregon Boise White St Helens 270 Washington Kapstone (5) 275 (24-hr avg) Washington Kapstone (3) 340 (24-hr avg) Washington Kapstone (4) 340 (24-hr avg) Florida Palatka (No. 4) 114 (30-day avg) Bäckhammar,
Not specified in IPPCb 15 (annual avg) 29 4 (a) 40 (a)
Huelva, Spain Not specified in IPPCb 23 (annual avg) 44 6 (a) 60 (a) Östrand,
Not specified in IPPCb 31 (annual avg) 59 28 (a) 80 (a)
Ääneskoski,
Not specified in IPPCb 39 (annual avg) 74 51 (a) 101 (a) Husum,
Not specified in IPPCb 42 (annual avg) 81 61 (a) 110 (a)
Iggesund,
Not specified in IPPCb 50 (annual avg) 96 83 (a) 130 (a) Skoghall,
Not specified in IPPCb 58 (annual avg) 111 105 (a) 150 (a)
Kaskinen,
Not specified in IPPCb 62 (annual avg) 118 116 (a) 160 (a) Joutseno,
Not specified in IPPCb 65 (annual avg) 124 125 (a) 168 (a)
Stora Celbi,
Not specified in IPPCb 65 (annual avg) 125 127 (a) 170 (a) Enocell,
Not specified in IPPCb 66 (annual avg) 126 128 (a) 171 (a)
Obbola,
Not specified in IPPCb 69 (annual avg) 133 138 (a) 180 (a) Skutskär,
Not specified in IPPCb 73 (annual avg) 140 149 (a) 190 (a)
Aspa, Sweden Not specified in IPPCb 77 (annual avg) 147 160 (a) 200 (a) Mönsteras,
Not specified in IPPCb 66-81 (annual
155 171 (a) 210 (a)
Frövi, Sweden Not specified in IPPCb 66-81 (annual
155 171 (a) 210 (a) Vallvik,
Not specified in IPPCb 70-85 (annual
162 182 (a) 220 (a)
Dynäs,
Not specified in IPPCb 70-85 (annual
162 182 (a) 220 (a) Skärblacka,
Not specified in IPPCb 74-89 (annual
169 193 (a) 230 (a)
Varö, Sweden Not specified in IPPCb 87-100 (annual
192 226 (a) 260 (a) Oulu, Finland Not specified in IPPCb 91-104 (annual
199 237 (a) 270 (a)
Sunila, Finland Not specified in IPPCb 93-106 (annual
203 242.5 (a) 275 (a) Wisaforest,
Not specified in IPPCb 115-126 (annual
240 298.6 (a) 326 (a)
Pöls AG,
Not specified in IPPCb 168 (annual avg) 332 435 (a) 450 (a) Arkansas Georgia Pacific Crossert (#4) NA Georgia GP Cedar Springs (No. 1) NA Georgia GP Cedar Springs (No. 2) NA Georgia International Paper AM (No. 2) NA Georgia International Paper AM (No. 3) NA Georgia Weyerhaeuser PWM (No. 2) NA Idaho Clearwater Lewiston (No. 4) NA Idaho Clearwater Lewiston (No. 5) NA Kentucky Wycliffe Paper (03) NA Louisiana Port Hudson (No. 1) NA Louisiana Port Hudson (No. 2) NA Louisiana International Paper CAMTI (No. 3) NA Minnesota Boise Cascade Int'l Falls (EU320) NA North Carolina Kapstone (No. 7) NA Oregon GP Consumer Products (EU21) NA Washington Boise White Wallula NA Washington GP Camas (No. 4) NA Washington PTPC (RF) NA Washington WestRock (No. 1) NA Washington WestRock (No. 2) NA Washington Weyerhaeuser (No. 4) NA British
Catalyst PC Vancouver (#3, w#4 on) NA
British
Catalyst PC Vancouver (#4, w#3 on) NA British
Catalyst PC Vancouver (#4, w#3 out) NA
British
Howe Sound Vancouver (E218529) NA British
Prince George Vancouver (RB) NA
Notes: (a) See European Mills Summary
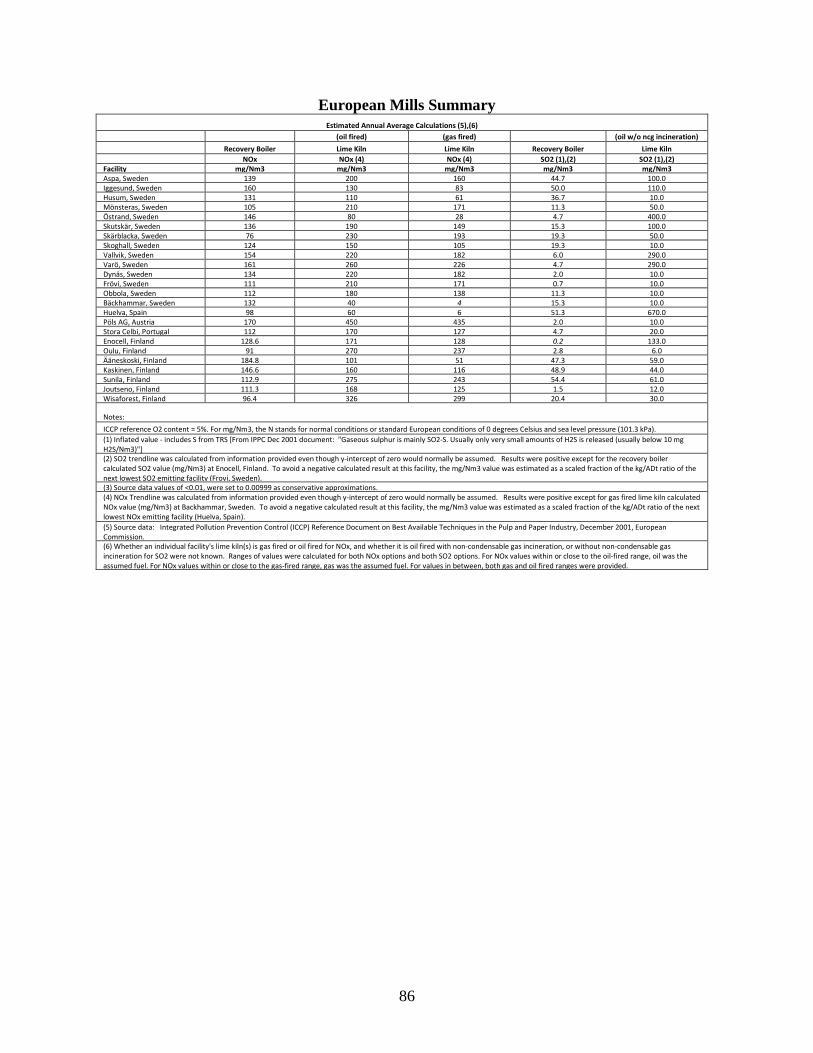
86
European Mills Summary Estimated Annual Average Calculations (5),(6)
(oil fired) (gas fired) (oil w/o ncg incineration) Recovery Boiler Lime Kiln Lime Kiln Recovery Boiler Lime Kiln NOx NOx (4) NOx (4) SO2 (1),(2) SO2 (1),(2) Facility mg/Nm3 mg/Nm3 mg/Nm3 mg/Nm3 mg/Nm3 Aspa, Sweden 139 200 160 44.7 100.0 Iggesund, Sweden 160 130 83 50.0 110.0 Husum, Sweden 131 110 61 36.7 10.0 Mönsteras, Sweden 105 210 171 11.3 50.0 Östrand, Sweden 146 80 28 4.7 400.0 Skutskär, Sweden 136 190 149 15.3 100.0 Skärblacka, Sweden 76 230 193 19.3 50.0 Skoghall, Sweden 124 150 105 19.3 10.0 Vallvik, Sweden 154 220 182 6.0 290.0 Varö, Sweden 161 260 226 4.7 290.0 Dynäs, Sweden 134 220 182 2.0 10.0 Frövi, Sweden 111 210 171 0.7 10.0 Obbola, Sweden 112 180 138 11.3 10.0 Bäckhammar, Sweden 132 40 4 15.3 10.0 Huelva, Spain 98 60 6 51.3 670.0 Pöls AG, Austria 170 450 435 2.0 10.0 Stora Celbi, Portugal 112 170 127 4.7 20.0 Enocell, Finland 128.6 171 128 0.2 133.0 Oulu, Finland 91 270 237 2.8 6.0 Ääneskoski, Finland 184.8 101 51 47.3 59.0 Kaskinen, Finland 146.6 160 116 48.9 44.0 Sunila, Finland 112.9 275 243 54.4 61.0 Joutseno, Finland 111.3 168 125 1.5 12.0 Wisaforest, Finland 96.4 326 299 20.4 30.0
Notes: ICCP reference O2 content = 5%. For mg/Nm3, the N stands for normal conditions or standard European conditions of 0 degrees Celsius and sea level pressure (101.3 kPa). (1) Inflated value - includes S from TRS [From IPPC Dec 2001 document: "Gaseous sulphur is mainly SO2-S. Usually only very small amounts of H2S is released (usually below 10 mg H2S/Nm3)"] (2) SO2 trendline was calculated from information provided even though y-intercept of zero would normally be assumed. Results were positive except for the recovery boiler calculated SO2 value (mg/Nm3) at Enocell, Finland. To avoid a negative calculated result at this facility, the mg/Nm3 value was estimated as a scaled fraction of the kg/ADt ratio of the next lowest SO2 emitting facility (Frovi, Sweden). (3) Source data values of <0.01, were set to 0.00999 as conservative approximations. (4) NOx Trendline was calculated from information provided even though y-intercept of zero would normally be assumed. Results were positive except for gas fired lime kiln calculated NOx value (mg/Nm3) at Backhammar, Sweden. To avoid a negative calculated result at this facility, the mg/Nm3 value was estimated as a scaled fraction of the kg/ADt ratio of the next lowest NOx emitting facility (Huelva, Spain). (5) Source data: Integrated Pollution Prevention Control (ICCP) Reference Document on Best Available Techniques in the Pulp and Paper Industry, December 2001, European Commission. (6) Whether an individual facility's lime kiln(s) is gas fired or oil fired for NOx, and whether it is oil fired with non-condensable gas incineration, or without non-condensable gas incineration for SO2 were not known. Ranges of values were calculated for both NOx options and both SO2 options. For NOx values within or close to the oil-fired range, oil was the assumed fuel. For NOx values within or close to the gas-fired range, gas was the assumed fuel. For values in between, both gas and oil fired ranges were provided.
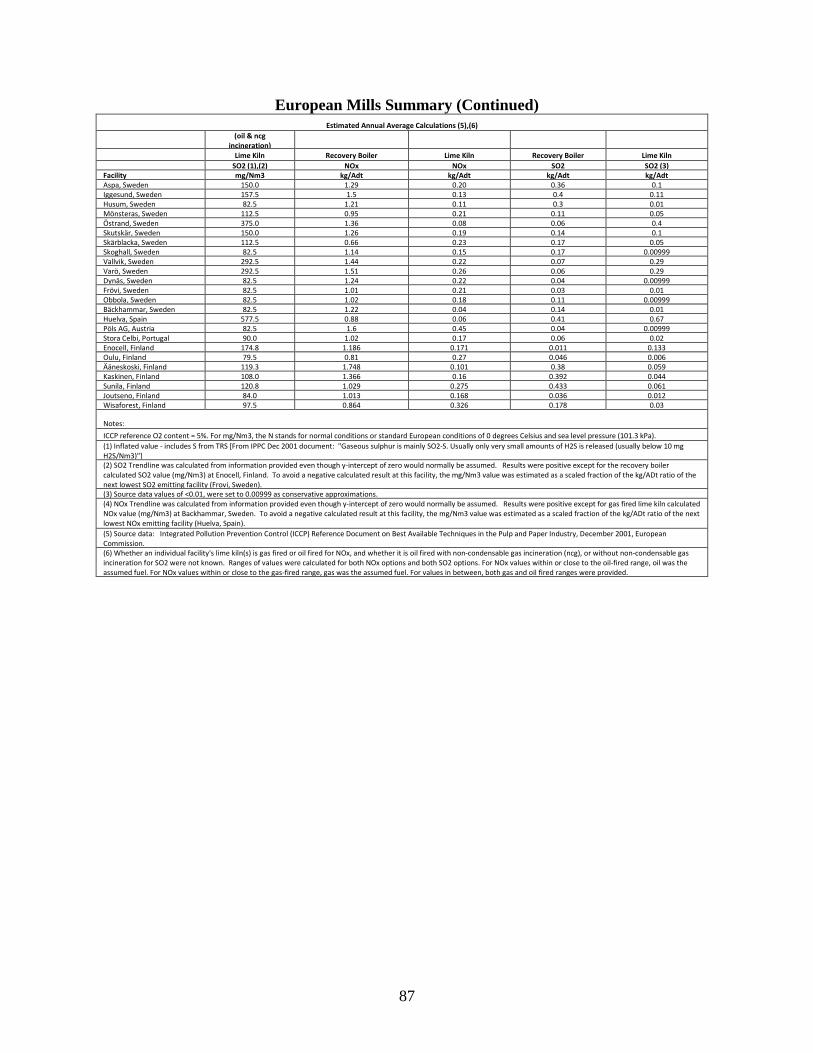
87
European Mills Summary (Continued) Estimated Annual Average Calculations (5),(6)
(oil & ncg
incineration) Lime Kiln Recovery Boiler Lime Kiln Recovery Boiler Lime Kiln SO2 (1),(2) NOx NOx SO2 SO2 (3) Facility mg/Nm3 kg/Adt kg/Adt kg/Adt kg/Adt Aspa, Sweden 150.0 1.29 0.20 0.36 0.1 Iggesund, Sweden 157.5 1.5 0.13 0.4 0.11 Husum, Sweden 82.5 1.21 0.11 0.3 0.01 Mönsteras, Sweden 112.5 0.95 0.21 0.11 0.05 Östrand, Sweden 375.0 1.36 0.08 0.06 0.4 Skutskär, Sweden 150.0 1.26 0.19 0.14 0.1 Skärblacka, Sweden 112.5 0.66 0.23 0.17 0.05 Skoghall, Sweden 82.5 1.14 0.15 0.17 0.00999 Vallvik, Sweden 292.5 1.44 0.22 0.07 0.29 Varö, Sweden 292.5 1.51 0.26 0.06 0.29 Dynäs, Sweden 82.5 1.24 0.22 0.04 0.00999 Frövi, Sweden 82.5 1.01 0.21 0.03 0.01 Obbola, Sweden 82.5 1.02 0.18 0.11 0.00999 Bäckhammar, Sweden 82.5 1.22 0.04 0.14 0.01 Huelva, Spain 577.5 0.88 0.06 0.41 0.67 Pöls AG, Austria 82.5 1.6 0.45 0.04 0.00999 Stora Celbi, Portugal 90.0 1.02 0.17 0.06 0.02 Enocell, Finland 174.8 1.186 0.171 0.011 0.133 Oulu, Finland 79.5 0.81 0.27 0.046 0.006 Ääneskoski, Finland 119.3 1.748 0.101 0.38 0.059 Kaskinen, Finland 108.0 1.366 0.16 0.392 0.044 Sunila, Finland 120.8 1.029 0.275 0.433 0.061 Joutseno, Finland 84.0 1.013 0.168 0.036 0.012 Wisaforest, Finland 97.5 0.864 0.326 0.178 0.03
Notes: ICCP reference O2 content = 5%. For mg/Nm3, the N stands for normal conditions or standard European conditions of 0 degrees Celsius and sea level pressure (101.3 kPa). (1) Inflated value - includes S from TRS [From IPPC Dec 2001 document: "Gaseous sulphur is mainly SO2-S. Usually only very small amounts of H2S is released (usually below 10 mg H2S/Nm3)"] (2) SO2 Trendline was calculated from information provided even though y-intercept of zero would normally be assumed. Results were positive except for the recovery boiler calculated SO2 value (mg/Nm3) at Enocell, Finland. To avoid a negative calculated result at this facility, the mg/Nm3 value was estimated as a scaled fraction of the kg/ADt ratio of the next lowest SO2 emitting facility (Frovi, Sweden). (3) Source data values of <0.01, were set to 0.00999 as conservative approximations. (4) NOx Trendline was calculated from information provided even though y-intercept of zero would normally be assumed. Results were positive except for gas fired lime kiln calculated NOx value (mg/Nm3) at Backhammar, Sweden. To avoid a negative calculated result at this facility, the mg/Nm3 value was estimated as a scaled fraction of the kg/ADt ratio of the next lowest NOx emitting facility (Huelva, Spain). (5) Source data: Integrated Pollution Prevention Control (ICCP) Reference Document on Best Available Techniques in the Pulp and Paper Industry, December 2001, European Commission. (6) Whether an individual facility's lime kiln(s) is gas fired or oil fired for NOx, and whether it is oil fired with non-condensable gas incineration (ncg), or without non-condensable gas incineration for SO2 were not known. Ranges of values were calculated for both NOx options and both SO2 options. For NOx values within or close to the oil-fired range, oil was the assumed fuel. For NOx values within or close to the gas-fired range, gas was the assumed fuel. For values in between, both gas and oil fired ranges were provided.
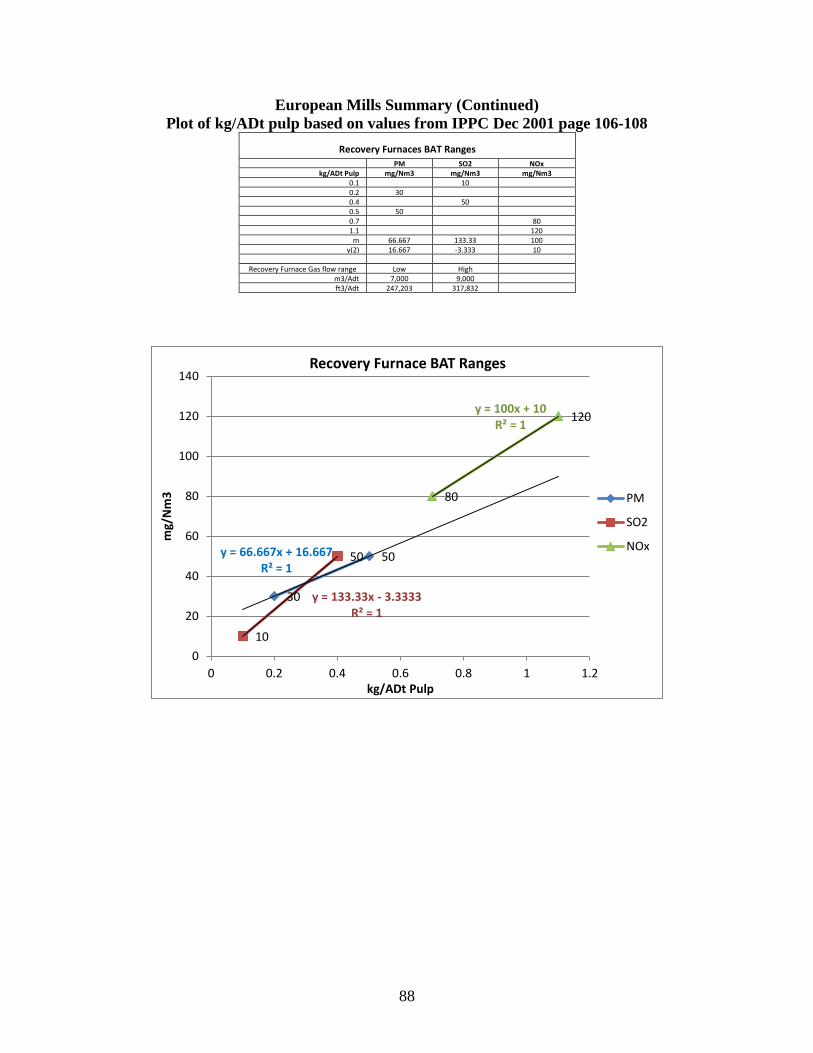
88
European Mills Summary (Continued) Plot of kg/ADt pulp based on values from IPPC Dec 2001 page 106-108
Recovery Furnaces BAT Ranges
PM SO2 NOx kg/ADt Pulp mg/Nm3 mg/Nm3 mg/Nm3
0.1 10 0.2 30 0.4 50 0.5 50 0.7 80 1.1 120
m 66.667 133.33 100 y(2) 16.667 -3.333 10
Recovery Furnace Gas flow range Low High m3/Adt 7,000 9,000 ft3/Adt 247,203 317,832
30
50
10
50
80
120
y = 66.667x + 16.667R² = 1
y = 133.33x - 3.3333R² = 1
y = 100x + 10R² = 1
0
20
40
60
80
100
120
140
0 0.2 0.4 0.6 0.8 1 1.2
mg/
Nm
3
kg/ADt Pulp
Recovery Furnace BAT Ranges
PM
SO2
NOx
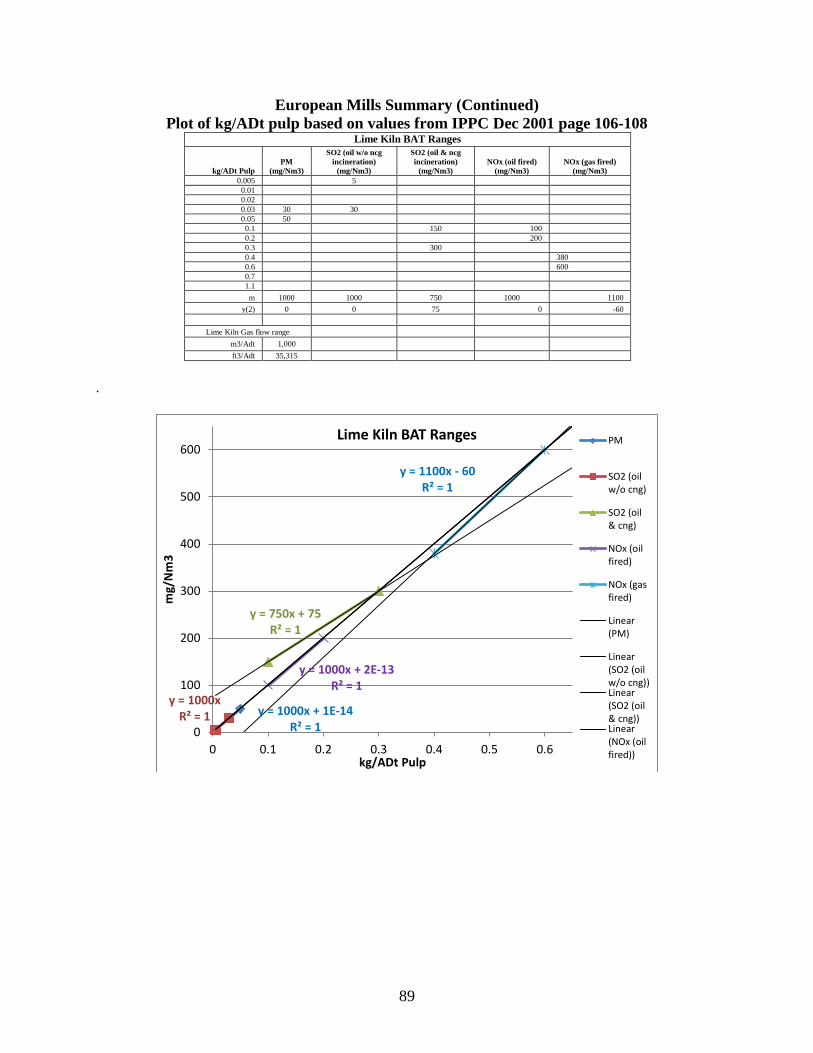
89
European Mills Summary (Continued) Plot of kg/ADt pulp based on values from IPPC Dec 2001 page 106-108
Lime Kiln BAT Ranges
kg/ADt Pulp PM
(mg/Nm3)
SO2 (oil w/o ncg incineration)
(mg/Nm3)
SO2 (oil & ncg incineration)
(mg/Nm3) NOx (oil fired)
(mg/Nm3) NOx (gas fired)
(mg/Nm3) 0.005 5 0.01 0.02 0.03 30 30 0.05 50 0.1 150 100 0.2 200 0.3 300 0.4 380 0.6 600 0.7 1.1 m 1000 1000 750 1000 1100
y(2) 0 0 75 0 -60
Lime Kiln Gas flow range m3/Adt 1,000 ft3/Adt 35,315
.
y = 1000xR² = 1 y = 1000x + 1E-14
R² = 1
y = 750x + 75R² = 1
y = 1000x + 2E-13R² = 1
y = 1100x - 60R² = 1
0
100
200
300
400
500
600
0 0.1 0.2 0.3 0.4 0.5 0.6
mg/
Nm
3
kg/ADt Pulp
Lime Kiln BAT Ranges PM
SO2 (oilw/o cng)
SO2 (oil& cng)
NOx (oilfired)
NOx (gasfired)
Linear(PM)
Linear(SO2 (oilw/o cng))Linear(SO2 (oil& cng))Linear(NOx (oilfired))
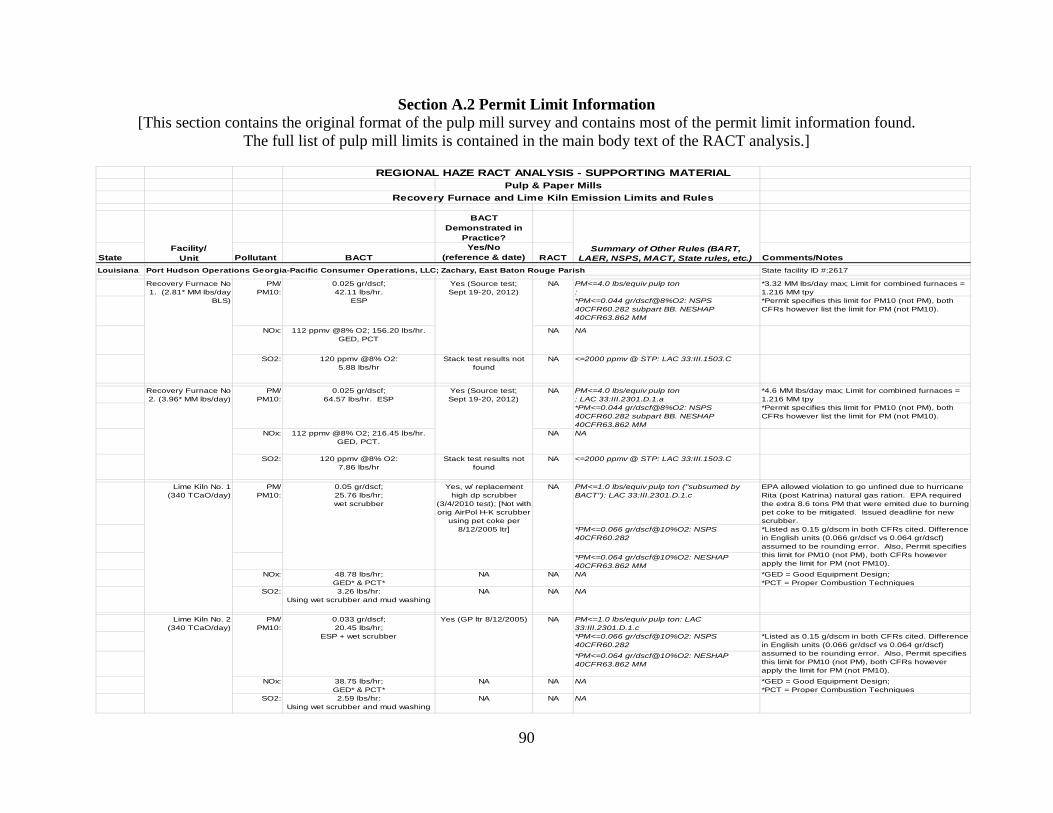
90
Section A.2 Permit Limit Information [This section contains the original format of the pulp mill survey and contains most of the permit limit information found.
The full list of pulp mill limits is contained in the main body text of the RACT analysis.]
REGIONAL HAZE RACT ANALYSIS - SUPPORTING MATERIALPulp & Paper Mills
Recovery Furnace and Lime Kiln Emission Limits and Rules
BACT Demonstrated in
Practice?
State Pollutant BACTYes/No
(reference & date) RACT Comments/NotesLouisiana Port Hudson Operations Georgia-Pacific Consumer Operations, LLC; Zachary, East Baton Rouge Parish State facility ID #:2617
PM<=4.0 lbs/equiv pulp ton:
*3.32 MM lbs/day max; Limit for combined furnaces = 1.216 MM tpy
*PM<=0.044 gr/dscf@8%O2: NSPS 40CFR60.282 subpart BB. NESHAP 40CFR63.862 MM
*Permit specifies this limit for PM10 (not PM), both CFRs however list the limit for PM (not PM10).
NOx: 112 ppmv @8% O2; 156.20 lbs/hr. GED, PCT
NA NA
SO2: 120 ppmv @8% O2: 5.88 lbs/hr
Stack test results not found
NA <=2000 ppmv @ STP: LAC 33:III.1503.C
PM<=4.0 lbs/equiv pulp ton : LAC 33:III.2301.D.1.a
*4.6 MM lbs/day max; Limit for combined furnaces = 1.216 MM tpy
*PM<=0.044 gr/dscf@8%O2: NSPS 40CFR60.282 subpart BB. NESHAP 40CFR63.862 MM
*Permit specifies this limit for PM10 (not PM), both CFRs however list the limit for PM (not PM10).
NOx: 112 ppmv @8% O2; 216.45 lbs/hr. GED, PCT.
NA NA
SO2: 120 ppmv @8% O2: 7.86 lbs/hr
Stack test results not found
NA <=2000 ppmv @ STP: LAC 33:III.1503.C
PM<=1.0 lbs/equiv pulp ton ("subsumed by BACT"): LAC 33:III.2301.D.1.c
EPA allowed violation to go unfined due to hurricane Rita (post Katrina) natural gas ration. EPA required the extra 8.6 tons PM that were emited due to burning pet coke to be mitigated. Issued deadline for new scrubber.
*PM<=0.066 gr/dscf@10%O2: NSPS 40CFR60.282
*PM<=0.064 gr/dscf@10%O2: NESHAP 40CFR63.862 MM
NOx: 48.78 lbs/hr; GED* & PCT*
NA NA NA *GED = Good Equipment Design;*PCT = Proper Combustion Techniques
SO2: 3.26 lbs/hr: Using wet scrubber and mud washing
NA NA NA
PM<=1.0 lbs/equiv pulp ton: LAC 33:III.2301.D.1.c*PM<=0.066 gr/dscf@10%O2: NSPS 40CFR60.282 *PM<=0.064 gr/dscf@10%O2: NESHAP 40CFR63.862 MM
NOx: 38.75 lbs/hr; GED* & PCT*
NA NA NA *GED = Good Equipment Design;*PCT = Proper Combustion Techniques
SO2: 2.59 lbs/hr: Using wet scrubber and mud washing
NA NA NA
NA0.05 gr/dscf; 25.76 lbs/hr; wet scrubber
PM/PM10:
Yes, w/ replacement high dp scrubber
(3/4/2010 test); [Not with orig AirPol H-K scrubber
using pet coke per 8/12/2005 ltr]
NA
Facility/Unit
*Listed as 0.15 g/dscm in both CFRs cited. Difference in English units (0.066 gr/dscf vs 0.064 gr/dscf) assumed to be rounding error. Also, Permit specifies this limit for PM10 (not PM), both CFRs however apply the limit for PM (not PM10).
*Listed as 0.15 g/dscm in both CFRs cited. Difference in English units (0.066 gr/dscf vs 0.064 gr/dscf) assumed to be rounding error. Also, Permit specifies this limit for PM10 (not PM), both CFRs however apply the limit for PM (not PM10).
Yes (GP ltr 8/12/2005)PM/PM10:
0.033 gr/dscf; 20.45 lbs/hr;
ESP + wet scrubber
NAYes (Source test; Sept 19-20, 2012)
0.025 gr/dscf; 64.57 lbs/hr. ESP
PM/PM10:
Recovery Furnace No 2. (3.96* MM lbs/day)
NA0.025 gr/dscf; 42.11 lbs/hr.
ESP
PM/PM10:
Yes (Source test; Sept 19-20, 2012)
Lime Kiln No. 2 (340 TCaO/day)
Lime Kiln No. 1 (340 TCaO/day)
Recovery Furnace No 1. (2.81* MM lbs/day
BLS)
Summary of Other Rules (BART, LAER, NSPS, MACT, State rules, etc.)
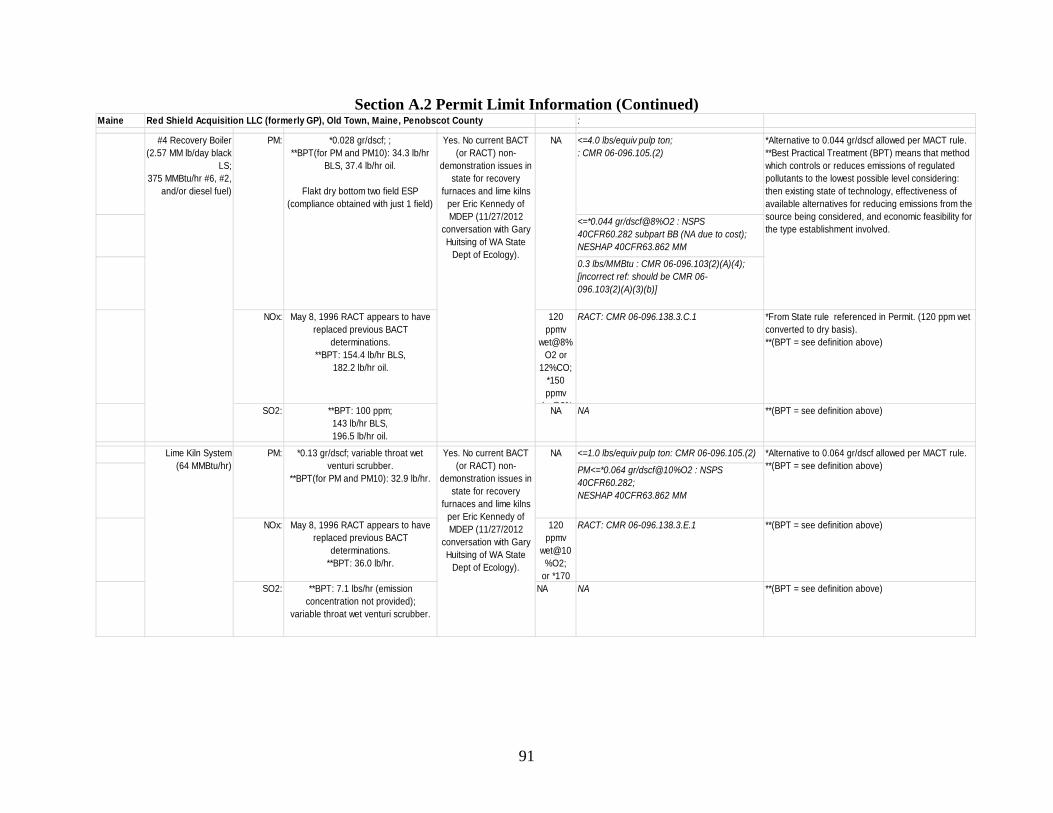
91
Section A.2 Permit Limit Information (Continued)
Maine Red Shield Acquisition LLC (formerly GP), Old Town, Maine, Penobscot County : : <=4.0 lbs/equiv pulp ton; : CMR 06-096.105.(2)
<=*0.044 gr/dscf@8%O2 : NSPS 40CFR60.282 subpart BB (NA due to cost); NESHAP 40CFR63.862 MM
0.3 lbs/MMBtu : CMR 06-096.103(2)(A)(4); [incorrect ref: should be CMR 06-096.103(2)(A)(3)(b)]
NOx: May 8, 1996 RACT appears to have replaced previous BACT
determinations. **BPT: 154.4 lb/hr BLS,
182.2 lb/hr oil.
120 ppmv
wet@8%O2 or
12%CO;*150 ppmv
d @8%
RACT: CMR 06-096.138.3.C.1 *From State rule referenced in Permit. (120 ppm wet converted to dry basis). **(BPT = see definition above)
SO2: **BPT: 100 ppm;143 lb/hr BLS, 196.5 lb/hr oil.
NA NA **(BPT = see definition above)
<=1.0 lbs/equiv pulp ton: CMR 06-096.105.(2)
PM<=*0.064 gr/dscf@10%O2 : NSPS 40CFR60.282; NESHAP 40CFR63.862 MM
NOx: May 8, 1996 RACT appears to have replaced previous BACT
determinations. **BPT: 36.0 lb/hr.
120 ppmv
wet@10%O2;
or *170
RACT: CMR 06-096.138.3.E.1 **(BPT = see definition above)
SO2: **BPT: 7.1 lbs/hr (emission concentration not provided);
variable throat wet venturi scrubber.
NA NA **(BPT = see definition above)
Yes. No current BACT (or RACT) non-
demonstration issues in state for recovery
furnaces and lime kilns per Eric Kennedy of MDEP (11/27/2012
conversation with Gary Huitsing of WA State
Dept of Ecology).
Yes. No current BACT (or RACT) non-
demonstration issues in state for recovery
furnaces and lime kilns per Eric Kennedy of MDEP (11/27/2012
conversation with Gary Huitsing of WA State
Dept of Ecology).
#4 Recovery Boiler (2.57 MM lb/day black
LS; 375 MMBtu/hr #6, #2,
and/or diesel fuel)
Lime Kiln System (64 MMBtu/hr)
PM: *0.028 gr/dscf; ; **BPT(for PM and PM10): 34.3 lb/hr
BLS, 37.4 lb/hr oil.
Flakt dry bottom two field ESP (compliance obtained with just 1 field)
NA
*Alternative to 0.064 gr/dscf allowed per MACT rule. **(BPT = see definition above)
*Alternative to 0.044 gr/dscf allowed per MACT rule. **Best Practical Treatment (BPT) means that method which controls or reduces emissions of regulated pollutants to the lowest possible level considering: then existing state of technology, effectiveness of available alternatives for reducing emissions from the source being considered, and economic feasibility for the type establishment involved.
PM: *0.13 gr/dscf; variable throat wet venturi scrubber.
**BPT(for PM and PM10): 32.9 lb/hr.
NA
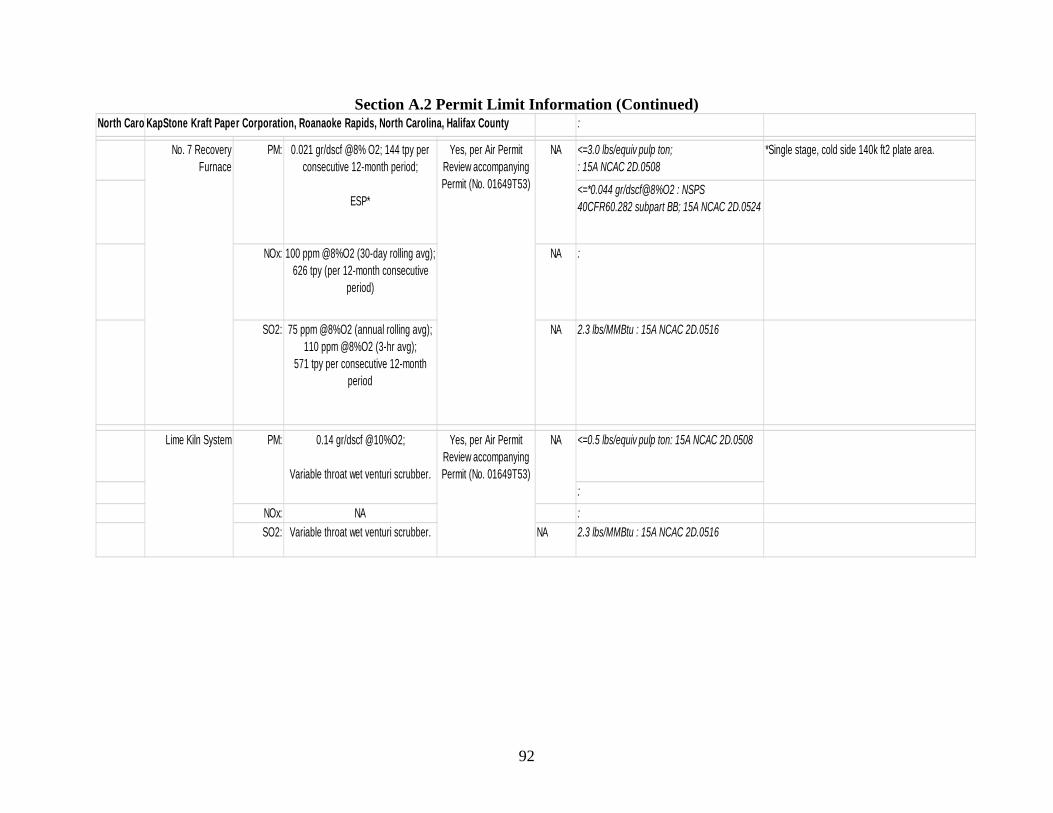
92
Section A.2 Permit Limit Information (Continued)
North Caro KapStone Kraft Paper Corporation, Roanaoke Rapids, North Carolina, Halifax County :
<=3.0 lbs/equiv pulp ton; : 15A NCAC 2D.0508
*Single stage, cold side 140k ft2 plate area.
<=*0.044 gr/dscf@8%O2 : NSPS 40CFR60.282 subpart BB; 15A NCAC 2D.0524
NOx: 100 ppm @8%O2 (30-day rolling avg); 626 tpy (per 12-month consecutive
period)
NA :
SO2: 75 ppm @8%O2 (annual rolling avg);110 ppm @8%O2 (3-hr avg);
571 tpy per consecutive 12-month period
NA 2.3 lbs/MMBtu : 15A NCAC 2D.0516
<=0.5 lbs/equiv pulp ton: 15A NCAC 2D.0508
: NOx: NA : SO2: Variable throat wet venturi scrubber. NA 2.3 lbs/MMBtu : 15A NCAC 2D.0516
No. 7 Recovery Furnace
PM: 0.021 gr/dscf @8% O2; 144 tpy per consecutive 12-month period;
ESP*
Yes, per Air Permit Review accompanying Permit (No. 01649T53)
NA
Lime Kiln System PM: 0.14 gr/dscf @10%O2;
Variable throat wet venturi scrubber.
Yes, per Air Permit Review accompanying Permit (No. 01649T53)
NA
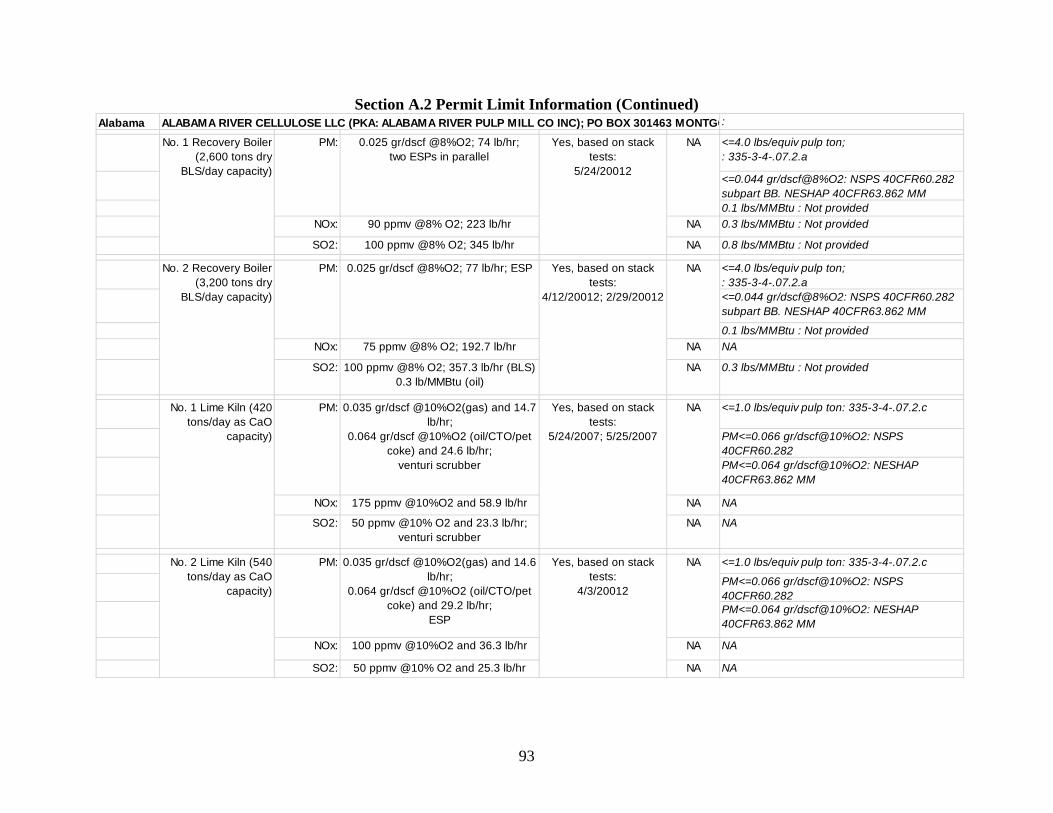
93
Section A.2 Permit Limit Information (Continued)
Alabama ALABAMA RIVER CELLULOSE LLC (PKA: ALABAMA RIVER PULP MILL CO INC); PO BOX 301463 MONTGO : <=4.0 lbs/equiv pulp ton;
: 335-3-4-.07.2.a
<=0.044 gr/dscf@8%O2: NSPS 40CFR60.282 subpart BB. NESHAP 40CFR63.862 MM 0.1 lbs/MMBtu : Not provided
NOx: 90 ppmv @8% O2; 223 lb/hr NA 0.3 lbs/MMBtu : Not provided
SO2: 100 ppmv @8% O2; 345 lb/hr NA 0.8 lbs/MMBtu : Not provided: <=4.0 lbs/equiv pulp ton; : 335-3-4-.07.2.a<=0.044 gr/dscf@8%O2: NSPS 40CFR60.282 subpart BB. NESHAP 40CFR63.862 MM
0.1 lbs/MMBtu : Not providedNOx: 75 ppmv @8% O2; 192.7 lb/hr NA NA
SO2: 100 ppmv @8% O2; 357.3 lb/hr (BLS) 0.3 lb/MMBtu (oil)
NA 0.3 lbs/MMBtu : Not provided
<=1.0 lbs/equiv pulp ton: 335-3-4-.07.2.c
PM<=0.066 gr/dscf@10%O2: NSPS 40CFR60.282 PM<=0.064 gr/dscf@10%O2: NESHAP 40CFR63.862 MM
NOx: 175 ppmv @10%O2 and 58.9 lb/hr NA NA
SO2: 50 ppmv @10% O2 and 23.3 lb/hr; venturi scrubber
NA NA
<=1.0 lbs/equiv pulp ton: 335-3-4-.07.2.c
PM<=0.066 gr/dscf@10%O2: NSPS 40CFR60.282 PM<=0.064 gr/dscf@10%O2: NESHAP 40CFR63.862 MM
NOx: 100 ppmv @10%O2 and 36.3 lb/hr NA NA
SO2: 50 ppmv @10% O2 and 25.3 lb/hr NA NA
Yes, based on stack tests:
4/3/20012
No. 2 Lime Kiln (540 tons/day as CaO
capacity)
PM: 0.035 gr/dscf @10%O2(gas) and 14.6 lb/hr;
0.064 gr/dscf @10%O2 (oil/CTO/pet coke) and 29.2 lb/hr;
ESP
NA
No. 1 Recovery Boiler (2,600 tons dry
BLS/day capacity)
PM: NA
No. 1 Lime Kiln (420 tons/day as CaO
capacity)
0.035 gr/dscf @10%O2(gas) and 14.7 lb/hr;
0.064 gr/dscf @10%O2 (oil/CTO/pet coke) and 24.6 lb/hr;
venturi scrubber
NA
NA
Yes, based on stack tests:
5/24/20012
Yes, based on stack tests:
4/12/20012; 2/29/20012
Yes, based on stack tests:
5/24/2007; 5/25/2007
PM:
No. 2 Recovery Boiler (3,200 tons dry
BLS/day capacity)
PM: 0.025 gr/dscf @8%O2; 77 lb/hr; ESP
0.025 gr/dscf @8%O2; 74 lb/hr; two ESPs in parallel
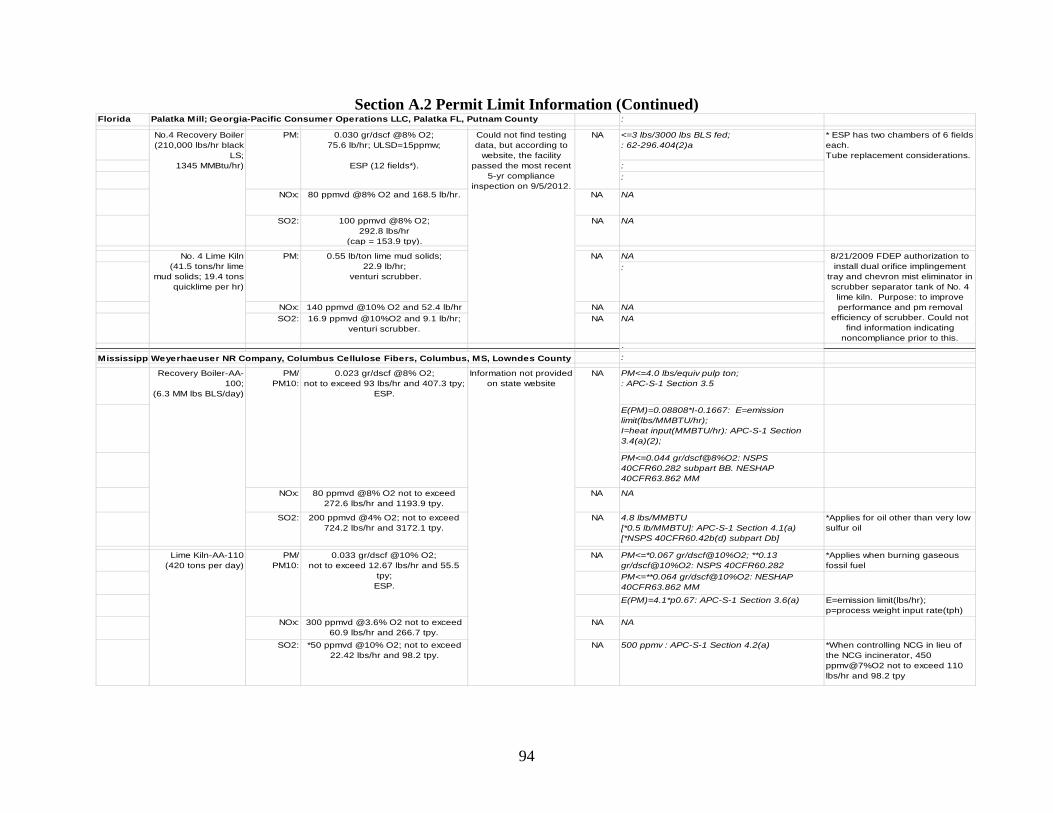
94
Section A.2 Permit Limit Information (Continued)
Florida Palatka Mill; Georgia-Pacific Consumer Operations LLC, Palatka FL, Putnam County : <=3 lbs/3000 lbs BLS fed;
: 62-296.404(2)a
: :
NOx: 80 ppmvd @8% O2 and 168.5 lb/hr. NA NA
SO2: 100 ppmvd @8% O2;292.8 lbs/hr
(cap = 153.9 tpy).
NA NA
: NA:
NOx: 140 ppmvd @10% O2 and 52.4 lb/hr NA NASO2: 16.9 ppmvd @10%O2 and 9.1 lb/hr;
venturi scrubber.NA NA
: MississippiWeyerhaeuser NR Company, Columbus Cellulose Fibers, Columbus, MS, Lowndes County : : PM<=4.0 lbs/equiv pulp ton; : APC-S-1 Section 3.5
E(PM)=0.08808*I-0.1667: E=emission limit(lbs/MMBTU/hr); I=heat input(MMBTU/hr): APC-S-1 Section 3.4(a)(2);
PM<=0.044 gr/dscf@8%O2: NSPS 40CFR60.282 subpart BB. NESHAP 40CFR63.862 MM
NOx: 80 ppmvd @8% O2 not to exceed 272.6 lbs/hr and 1193.9 tpy.
NA NA
SO2: 200 ppmvd @4% O2; not to exceed 724.2 lbs/hr and 3172.1 tpy.
NA 4.8 lbs/MMBTU [*0.5 lb/MMBTU]: APC-S-1 Section 4.1(a) [*NSPS 40CFR60.42b(d) subpart Db]
*Applies for oil other than very low sulfur oil
NA PM<=*0.067 gr/dscf@10%O2; **0.13 gr/dscf@10%O2: NSPS 40CFR60.282
*Applies when burning gaseous fossil fuel
PM<=**0.064 gr/dscf@10%O2: NESHAP 40CFR63.862 MM E(PM)=4.1*p0.67: APC-S-1 Section 3.6(a) E=emission limit(lbs/hr);
p=process weight input rate(tph)NOx: 300 ppmvd @3.6% O2 not to exceed
60.9 lbs/hr and 266.7 tpy.NA NA
SO2: *50 ppmvd @10% O2; not to exceed 22.42 lbs/hr and 98.2 tpy.
NA 500 ppmv : APC-S-1 Section 4.2(a) *When controlling NCG in lieu of the NCG incinerator, 450 ppmv@7%O2 not to exceed 110 lbs/hr and 98.2 tpy
NA
Lime Kiln-AA-110(420 tons per day)
PM/PM10:
0.033 gr/dscf @10% O2; not to exceed 12.67 lbs/hr and 55.5
tpy; ESP.
Recovery Boiler-AA-100;
(6.3 MM lbs BLS/day)
PM/PM10:
0.023 gr/dscf @8% O2; not to exceed 93 lbs/hr and 407.3 tpy;
ESP.
Information not provided on state website
* ESP has two chambers of 6 fields each. Tube replacement considerations.
No. 4 Lime Kiln(41.5 tons/hr lime
mud solids; 19.4 tons quicklime per hr)
PM: 0.55 lb/ton lime mud solids; 22.9 lb/hr;
venturi scrubber.
NA
No.4 Recovery Boiler (210,000 lbs/hr black
LS; 1345 MMBtu/hr)
PM: 0.030 gr/dscf @8% O2; 75.6 lb/hr; ULSD=15ppmw;
ESP (12 fields*).
NACould not find testing data, but according to
website, the facility passed the most recent
5-yr compliance inspection on 9/5/2012.
8/21/2009 FDEP authorization to install dual orifice implingement
tray and chevron mist eliminator in scrubber separator tank of No. 4
lime kiln. Purpose: to improve performance and pm removal
efficiency of scrubber. Could not find information indicating
noncompliance prior to this.
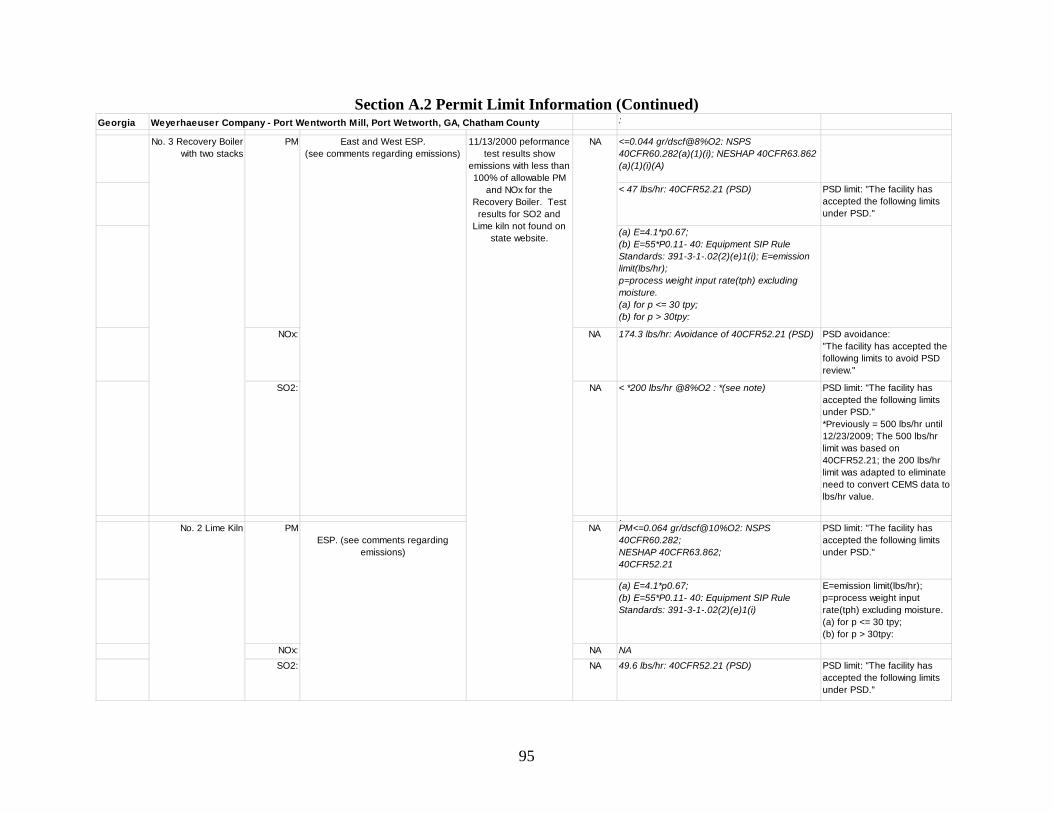
95
Section A.2 Permit Limit Information (Continued)
Georgia Weyerhaeuser Company - Port Wentworth Mill, Port Wetworth, GA, Chatham County :
: <=0.044 gr/dscf@8%O2: NSPS 40CFR60.282(a)(1)(i); NESHAP 40CFR63.862 (a)(1)(i)(A)
< 47 lbs/hr: 40CFR52.21 (PSD) PSD limit: "The facility has accepted the following limits under PSD."
(a) E=4.1*p0.67;(b) E=55*P0.11- 40: Equipment SIP Rule Standards: 391-3-1-.02(2)(e)1(i); E=emission limit(lbs/hr); p=process weight input rate(tph) excluding moisture. (a) for p <= 30 tpy; (b) for p > 30tpy:
NOx: NA 174.3 lbs/hr: Avoidance of 40CFR52.21 (PSD) PSD avoidance: "The facility has accepted the following limits to avoid PSD review."
SO2: NA < *200 lbs/hr @8%O2 : *(see note) PSD limit: "The facility has accepted the following limits under PSD." *Previously = 500 lbs/hr until 12/23/2009; The 500 lbs/hr limit was based on 40CFR52.21; the 200 lbs/hr limit was adapted to eliminate need to convert CEMS data to lbs/hr value.
: NA PM<=0.064 gr/dscf@10%O2: NSPS 40CFR60.282; NESHAP 40CFR63.862; 40CFR52.21
PSD limit: "The facility has accepted the following limits under PSD."
(a) E=4.1*p0.67;(b) E=55*P0.11- 40: Equipment SIP Rule Standards: 391-3-1-.02(2)(e)1(i)
E=emission limit(lbs/hr); p=process weight input rate(tph) excluding moisture. (a) for p <= 30 tpy; (b) for p > 30tpy:
NOx: NA NASO2: NA 49.6 lbs/hr: 40CFR52.21 (PSD) PSD limit: "The facility has
accepted the following limits under PSD."
East and West ESP. (see comments regarding emissions)
ESP. (see comments regarding emissions)
No. 3 Recovery Boiler with two stacks
PM 11/13/2000 peformance test results show
emissions with less than 100% of allowable PM
and NOx for the Recovery Boiler. Test
results for SO2 and Lime kiln not found on
state website.
NA
No. 2 Lime Kiln PM
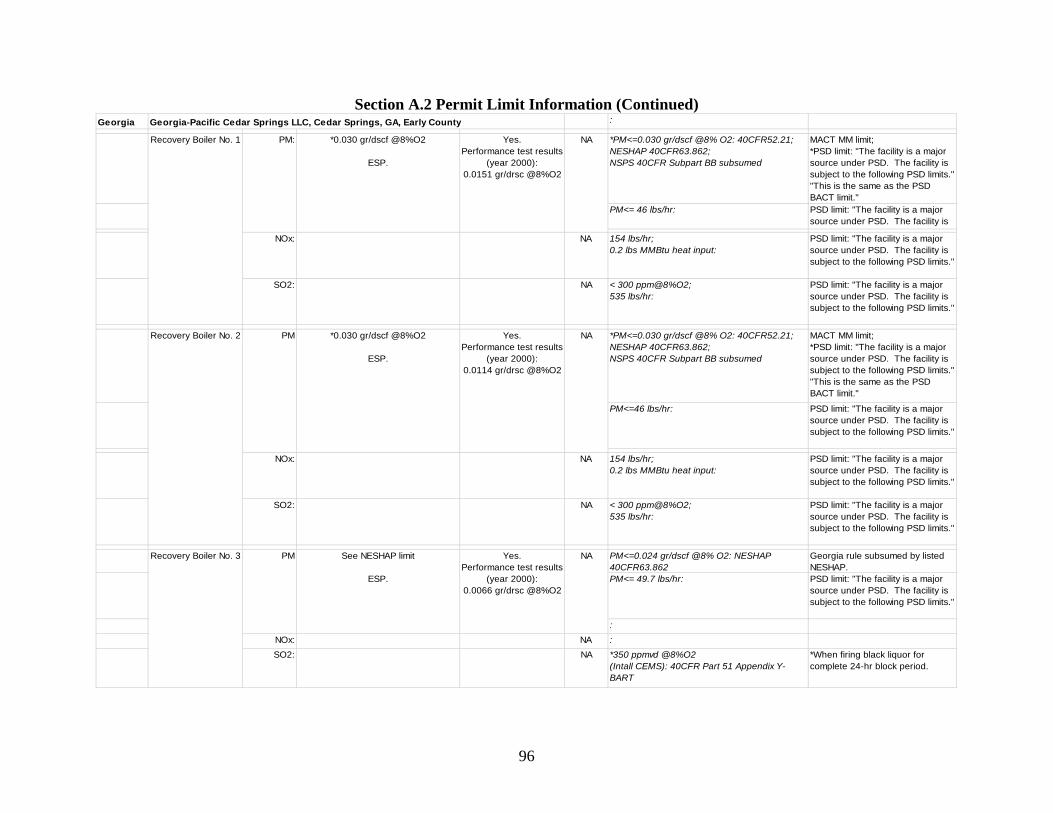
96
Section A.2 Permit Limit Information (Continued)
Georgia Georgia-Pacific Cedar Springs LLC, Cedar Springs, GA, Early County :
*PM<=0.030 gr/dscf @8% O2: 40CFR52.21;NESHAP 40CFR63.862; NSPS 40CFR Subpart BB subsumed
MACT MM limit; *PSD limit: "The facility is a major source under PSD. The facility is subject to the following PSD limits." "This is the same as the PSD BACT limit."
PM<= 46 lbs/hr: PSD limit: "The facility is a major source under PSD. The facility is
bj h f ll i PSD li i " NOx: NA 154 lbs/hr; 0.2 lbs MMBtu heat input:
PSD limit: "The facility is a major source under PSD. The facility is subject to the following PSD limits."
SO2: NA < 300 ppm@8%O2; 535 lbs/hr:
PSD limit: "The facility is a major source under PSD. The facility is subject to the following PSD limits."
*PM<=0.030 gr/dscf @8% O2: 40CFR52.21;NESHAP 40CFR63.862; NSPS 40CFR Subpart BB subsumed
MACT MM limit; *PSD limit: "The facility is a major source under PSD. The facility is subject to the following PSD limits." "This is the same as the PSD BACT limit."
PM<=46 lbs/hr: PSD limit: "The facility is a major source under PSD. The facility is subject to the following PSD limits."
NOx: NA 154 lbs/hr; 0.2 lbs MMBtu heat input:
PSD limit: "The facility is a major source under PSD. The facility is subject to the following PSD limits."
SO2: NA < 300 ppm@8%O2; 535 lbs/hr:
PSD limit: "The facility is a major source under PSD. The facility is subject to the following PSD limits."
PM<=0.024 gr/dscf @8% O2: NESHAP 40CFR63.862
Georgia rule subsumed by listed NESHAP.
PM<= 49.7 lbs/hr: PSD limit: "The facility is a major source under PSD. The facility is subject to the following PSD limits."
: NOx: NA : SO2: NA *350 ppmvd @8%O2
(Intall CEMS): 40CFR Part 51 Appendix Y- BART
*When firing black liquor for complete 24-hr block period.
Recovery Boiler No. 1 PM: NAYes. Performance test results
(year 2000): 0.0151 gr/drsc @8%O2
*0.030 gr/dscf @8%O2
ESP.
*0.030 gr/dscf @8%O2
ESP.
See NESHAP limit
ESP.
Recovery Boiler No. 3 PM
Recovery Boiler No. 2 PM NA
NA
Yes. Performance test results
(year 2000): 0.0114 gr/drsc @8%O2
Yes. Performance test results
(year 2000): 0.0066 gr/drsc @8%O2
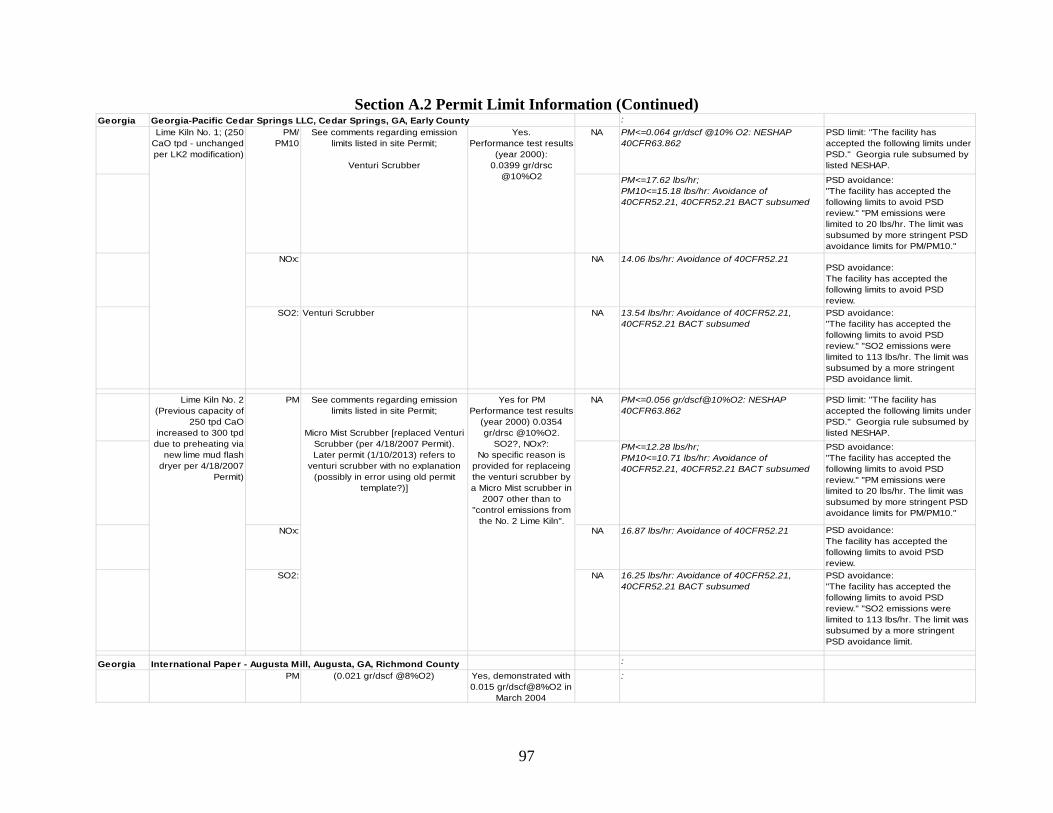
97
Section A.2 Permit Limit Information (Continued)
Georgia Georgia-Pacific Cedar Springs LLC, Cedar Springs, GA, Early County : NA PM<=0.064 gr/dscf @10% O2: NESHAP
40CFR63.862PSD limit: "The facility has accepted the following limits under PSD." Georgia rule subsumed by listed NESHAP.
PM<=17.62 lbs/hr; PM10<=15.18 lbs/hr: Avoidance of 40CFR52.21, 40CFR52.21 BACT subsumed
PSD avoidance: "The facility has accepted the following limits to avoid PSD review." "PM emissions were limited to 20 lbs/hr. The limit was subsumed by more stringent PSD avoidance limits for PM/PM10."
NOx: NA 14.06 lbs/hr: Avoidance of 40CFR52.21PSD avoidance: The facility has accepted the following limits to avoid PSD review.
SO2: Venturi Scrubber NA 13.54 lbs/hr: Avoidance of 40CFR52.21, 40CFR52.21 BACT subsumed
PSD avoidance: "The facility has accepted the following limits to avoid PSD review." "SO2 emissions were limited to 113 lbs/hr. The limit was subsumed by a more stringent PSD avoidance limit.
: NA PM<=0.056 gr/dscf@10%O2: NESHAP 40CFR63.862
PSD limit: "The facility has accepted the following limits under PSD." Georgia rule subsumed by listed NESHAP.
PM<=12.28 lbs/hr; PM10<=10.71 lbs/hr: Avoidance of 40CFR52.21, 40CFR52.21 BACT subsumed
PSD avoidance: "The facility has accepted the following limits to avoid PSD review." "PM emissions were limited to 20 lbs/hr. The limit was subsumed by more stringent PSD avoidance limits for PM/PM10."
NOx: NA 16.87 lbs/hr: Avoidance of 40CFR52.21 PSD avoidance: The facility has accepted the following limits to avoid PSD review.
SO2: NA 16.25 lbs/hr: Avoidance of 40CFR52.21, 40CFR52.21 BACT subsumed
PSD avoidance: "The facility has accepted the following limits to avoid PSD review." "SO2 emissions were limited to 113 lbs/hr. The limit was subsumed by a more stringent PSD avoidance limit.
Georgia International Paper - Augusta Mill, Augusta, GA, Richmond County :
PM (0.021 gr/dscf @8%O2) Yes, demonstrated with 0.015 gr/dscf@8%O2 in
March 2004
:
Lime Kiln No. 2 (Previous capacity of
250 tpd CaO increased to 300 tpd
due to preheating via new lime mud flash
dryer per 4/18/2007 Permit)
PM See comments regarding emission limits listed in site Permit;
Micro Mist Scrubber [replaced Venturi Scrubber (per 4/18/2007 Permit). Later permit (1/10/2013) refers to
venturi scrubber with no explanation (possibly in error using old permit
template?)]
Lime Kiln No. 1; (250 CaO tpd - unchanged per LK2 modification)
PM/PM10
Yes for PM Performance test results
(year 2000) 0.0354 gr/drsc @10%O2.
SO2?, NOx?:No specific reason is
provided for replaceing the venturi scrubber by a Micro Mist scrubber in
2007 other than to "control emissions from
the No. 2 Lime Kiln".
See comments regarding emission limits listed in site Permit;
Venturi Scrubber
Yes. Performance test results
(year 2000): 0.0399 gr/drsc
@10%O2
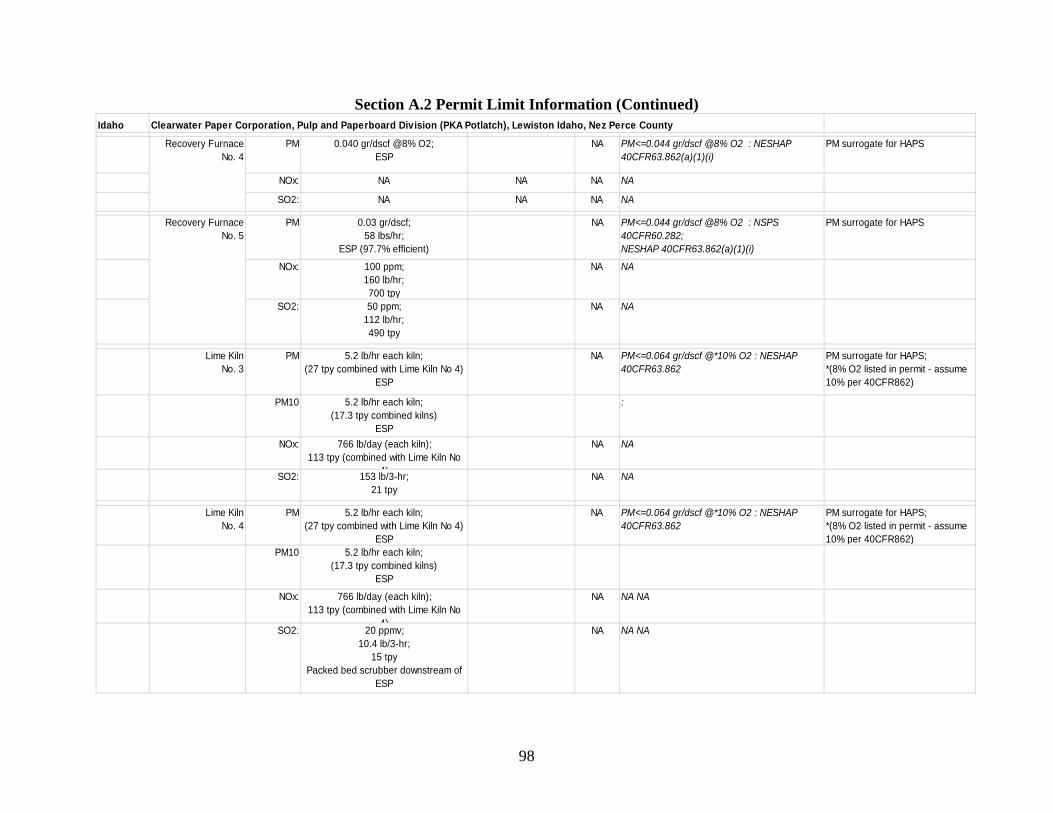
98
Section A.2 Permit Limit Information (Continued)
Idaho PM 0.040 gr/dscf @8% O2;
ESPNA PM<=0.044 gr/dscf @8% O2 : NESHAP
40CFR63.862(a)(1)(i)PM surrogate for HAPS
NOx: NA NA NA NA
SO2: NA NA NA NA
PM 0.03 gr/dscf; 58 lbs/hr;
ESP (97.7% efficient)
NA PM<=0.044 gr/dscf @8% O2 : NSPS 40CFR60.282; NESHAP 40CFR63.862(a)(1)(i)
PM surrogate for HAPS
NOx: 100 ppm; 160 lb/hr; 700 tpy
NA NA
SO2: 50 ppm; 112 lb/hr; 490 tpy
NA NA
Lime Kiln No. 3
PM 5.2 lb/hr each kiln;(27 tpy combined with Lime Kiln No 4)
ESP
NA PM<=0.064 gr/dscf @*10% O2 : NESHAP 40CFR63.862
PM surrogate for HAPS;*(8% O2 listed in permit - assume 10% per 40CFR862)
PM10 5.2 lb/hr each kiln;(17.3 tpy combined kilns)
ESP
:
NOx: 766 lb/day (each kiln); 113 tpy (combined with Lime Kiln No
4)
NA NA
SO2: 153 lb/3-hr; 21 tpy
NA NA
Lime Kiln No. 4
PM 5.2 lb/hr each kiln;(27 tpy combined with Lime Kiln No 4)
ESP
NA PM<=0.064 gr/dscf @*10% O2 : NESHAP 40CFR63.862
PM surrogate for HAPS;*(8% O2 listed in permit - assume 10% per 40CFR862)
PM10 5.2 lb/hr each kiln;(17.3 tpy combined kilns)
ESP
NOx: 766 lb/day (each kiln); 113 tpy (combined with Lime Kiln No
4)
NA NA NA
SO2: 20 ppmv; 10.4 lb/3-hr;
15 tpy Packed bed scrubber downstream of
ESP
NA NA NA
Clearwater Paper Corporation, Pulp and Paperboard Division (PKA Potlatch), Lewiston Idaho, Nez Perce County
Recovery Furnace No. 5
Recovery Furnace No. 4
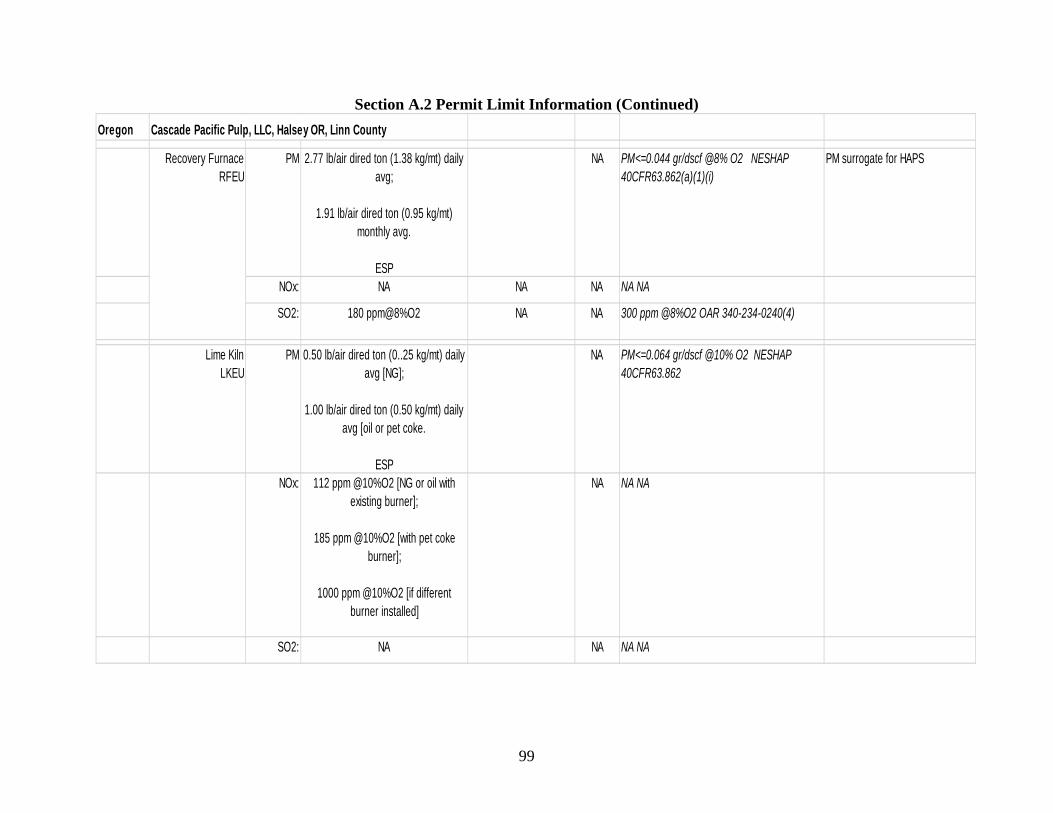
99
Section A.2 Permit Limit Information (Continued)
Oregon Cascade Pacific Pulp, LLC, Halsey OR, Linn County
PM 2.77 lb/air dired ton (1.38 kg/mt) daily avg;
1.91 lb/air dired ton (0.95 kg/mt) monthly avg.
ESP
NA PM<=0.044 gr/dscf @8% O2 NESHAP 40CFR63.862(a)(1)(i)
PM surrogate for HAPS
NOx: NA NA NA NA NA
SO2: 180 ppm@8%O2 NA NA 300 ppm @8%O2 OAR 340-234-0240(4)
Lime Kiln LKEU
PM 0.50 lb/air dired ton (0..25 kg/mt) daily avg [NG];
1.00 lb/air dired ton (0.50 kg/mt) daily avg [oil or pet coke.
ESP
NA PM<=0.064 gr/dscf @10% O2 NESHAP 40CFR63.862
NOx: 112 ppm @10%O2 [NG or oil with existing burner];
185 ppm @10%O2 [with pet coke burner];
1000 ppm @10%O2 [if different burner installed]
NA NA NA
SO2: NA NA NA NA
Recovery Furnace RFEU
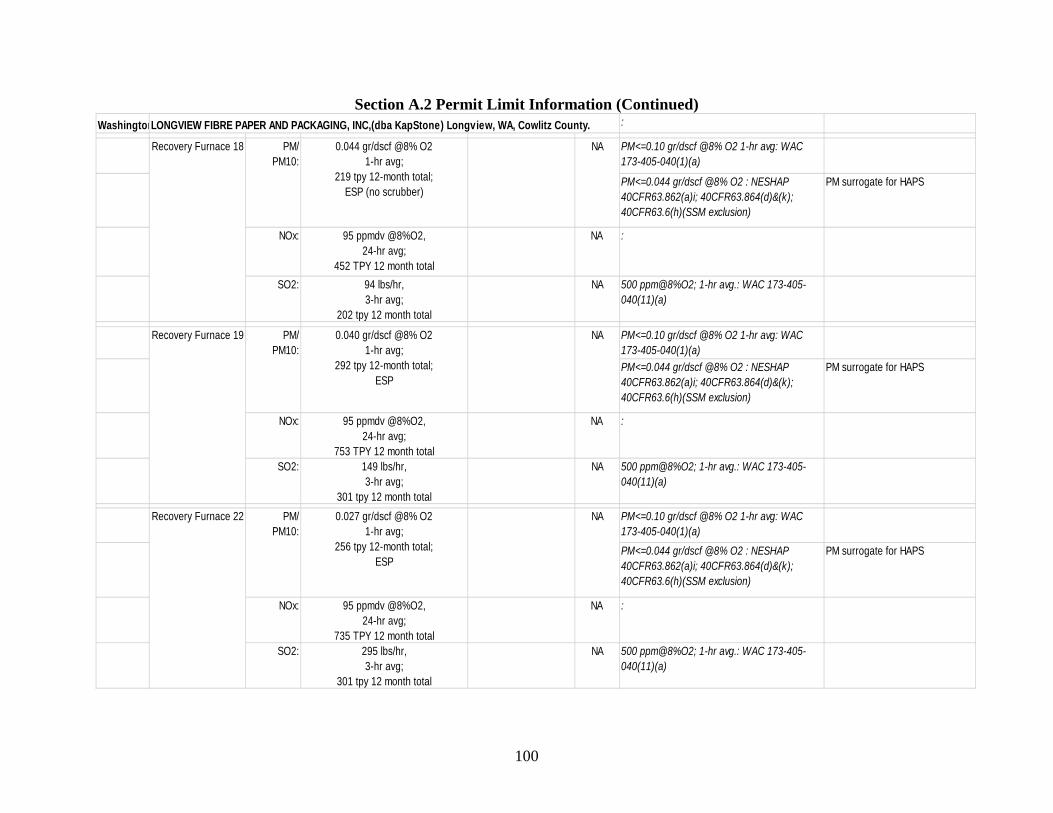
100
Section A.2 Permit Limit Information (Continued)
WashingtonLONGVIEW FIBRE PAPER AND PACKAGING, INC,(dba KapStone) Longview, WA, Cowlitz County. : PM<=0.10 gr/dscf @8% O2 1-hr avg: WAC
173-405-040(1)(a)
PM<=0.044 gr/dscf @8% O2 : NESHAP 40CFR63.862(a)i; 40CFR63.864(d)&(k); 40CFR63.6(h)(SSM exclusion)
PM surrogate for HAPS
NOx: 95 ppmdv @8%O2, 24-hr avg;
452 TPY 12 month total
NA :
SO2: 94 lbs/hr, 3-hr avg;
202 tpy 12 month total
NA 500 ppm@8%O2; 1-hr avg.: WAC 173-405-040(11)(a)
PM<=0.10 gr/dscf @8% O2 1-hr avg: WAC 173-405-040(1)(a)PM<=0.044 gr/dscf @8% O2 : NESHAP 40CFR63.862(a)i; 40CFR63.864(d)&(k); 40CFR63.6(h)(SSM exclusion)
PM surrogate for HAPS
NOx: 95 ppmdv @8%O2, 24-hr avg;
753 TPY 12 month total
NA :
SO2: 149 lbs/hr, 3-hr avg;
301 tpy 12 month total
NA 500 ppm@8%O2; 1-hr avg.: WAC 173-405-040(11)(a)
PM<=0.10 gr/dscf @8% O2 1-hr avg: WAC 173-405-040(1)(a)PM<=0.044 gr/dscf @8% O2 : NESHAP 40CFR63.862(a)i; 40CFR63.864(d)&(k); 40CFR63.6(h)(SSM exclusion)
PM surrogate for HAPS
NOx: 95 ppmdv @8%O2, 24-hr avg;
735 TPY 12 month total
NA :
SO2: 295 lbs/hr, 3-hr avg;
301 tpy 12 month total
NA 500 ppm@8%O2; 1-hr avg.: WAC 173-405-040(11)(a)
Recovery Furnace 18 PM/PM10:
0.044 gr/dscf @8% O2 1-hr avg;
219 tpy 12-month total;ESP (no scrubber)
NA
Recovery Furnace 19 PM/PM10:
PM/PM10:
0.027 gr/dscf @8% O2 1-hr avg;
256 tpy 12-month total;ESP
Recovery Furnace 22 NA
0.040 gr/dscf @8% O2 1-hr avg;
292 tpy 12-month total;ESP
NA
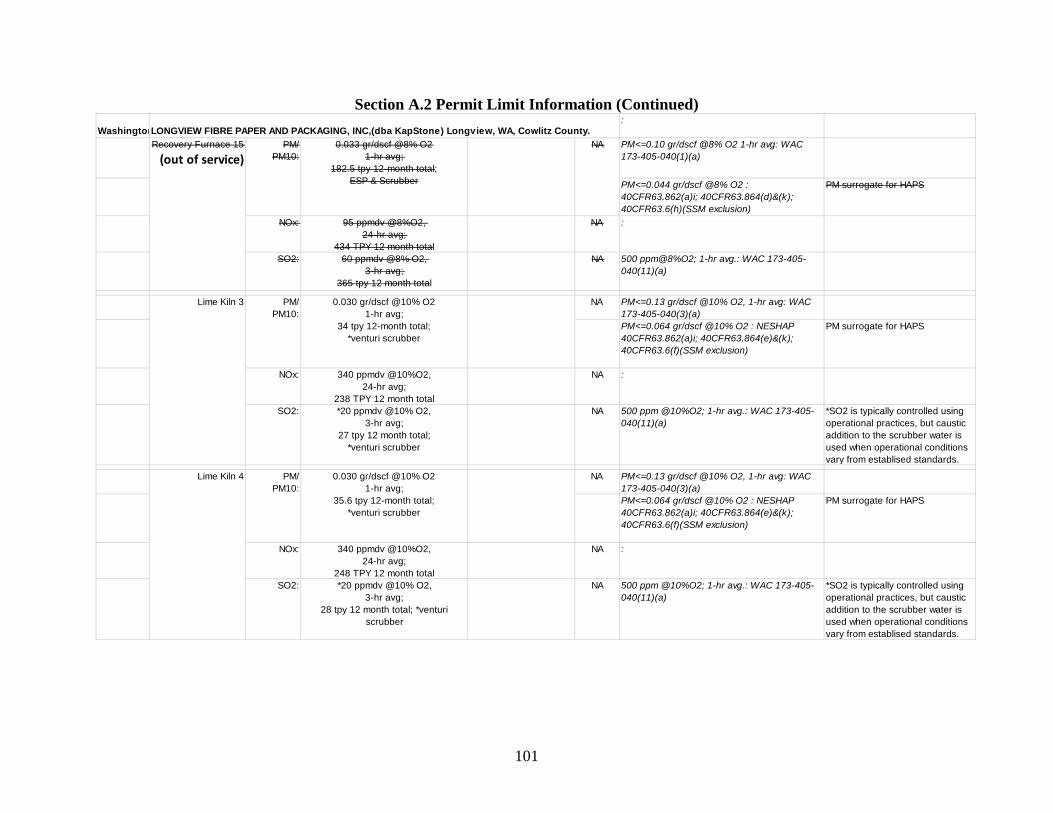
101
Section A.2 Permit Limit Information (Continued)
WashingtonLONGVIEW FIBRE PAPER AND PACKAGING, INC,(dba KapStone) Longview, WA, Cowlitz County.:
PM<=0.10 gr/dscf @8% O2 1-hr avg: WAC 173-405-040(1)(a)
PM<=0.044 gr/dscf @8% O2 : 40CFR63.862(a)i; 40CFR63.864(d)&(k); 40CFR63.6(h)(SSM exclusion)
PM surrogate for HAPS
NOx: 95 ppmdv @8%O2, 24-hr avg;
434 TPY 12 month total
NA :
SO2: 60 ppmdv @8% O2, 3-hr avg;
365 tpy 12 month total
NA 500 ppm@8%O2; 1-hr avg.: WAC 173-405-040(11)(a)
: NA PM<=0.13 gr/dscf @10% O2, 1-hr avg: WAC 173-405-040(3)(a)PM<=0.064 gr/dscf @10% O2 : NESHAP 40CFR63.862(a)i; 40CFR63.864(e)&(k); 40CFR63.6(f)(SSM exclusion)
PM surrogate for HAPS
NOx: 340 ppmdv @10%O2, 24-hr avg;
238 TPY 12 month total
NA :
SO2: *20 ppmdv @10% O2, 3-hr avg;
27 tpy 12 month total;*venturi scrubber
NA 500 ppm @10%O2; 1-hr avg.: WAC 173-405-040(11)(a)
*SO2 is typically controlled using operational practices, but caustic addition to the scrubber water is used when operational conditions vary from establised standards.
: NA PM<=0.13 gr/dscf @10% O2, 1-hr avg: WAC 173-405-040(3)(a)PM<=0.064 gr/dscf @10% O2 : NESHAP 40CFR63.862(a)i; 40CFR63.864(e)&(k); 40CFR63.6(f)(SSM exclusion)
PM surrogate for HAPS
NOx: 340 ppmdv @10%O2, 24-hr avg;
248 TPY 12 month total
NA :
SO2: *20 ppmdv @10% O2, 3-hr avg;
28 tpy 12 month total; *venturi scrubber
NA 500 ppm @10%O2; 1-hr avg.: WAC 173-405-040(11)(a)
*SO2 is typically controlled using operational practices, but caustic addition to the scrubber water is used when operational conditions vary from establised standards.
Recovery Furnace 15
(out of service)PM/
PM10:0.033 gr/dscf @8% O2
1-hr avg; 182.5 tpy 12-month total;
ESP & Scrubber
NA
Lime Kiln 3 PM/PM10:
0.030 gr/dscf @10% O2 1-hr avg;
34 tpy 12-month total;*venturi scrubber
Lime Kiln 4 PM/PM10:
0.030 gr/dscf @10% O2 1-hr avg;
35.6 tpy 12-month total;*venturi scrubber
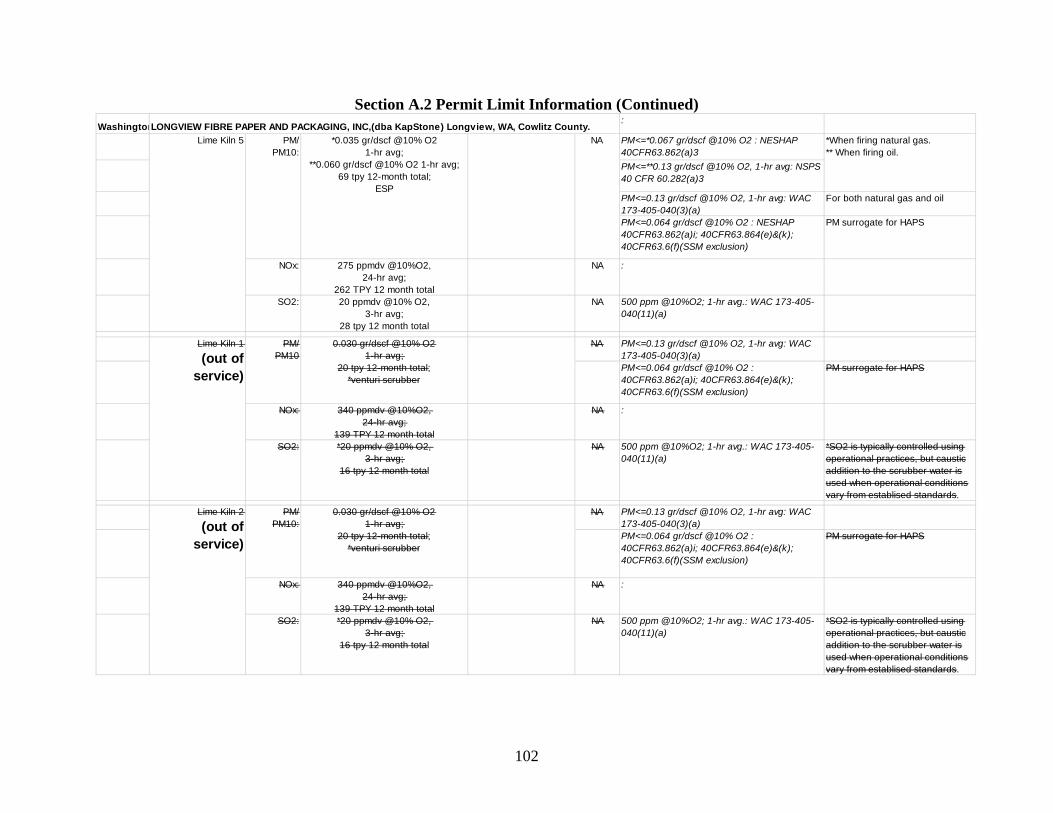
102
Section A.2 Permit Limit Information (Continued)
WashingtonLONGVIEW FIBRE PAPER AND PACKAGING, INC,(dba KapStone) Longview, WA, Cowlitz County.:
PM<=*0.067 gr/dscf @10% O2 : NESHAP 40CFR63.862(a)3PM<=**0.13 gr/dscf @10% O2, 1-hr avg: NSPS 40 CFR 60.282(a)3
PM<=0.13 gr/dscf @10% O2, 1-hr avg: WAC 173-405-040(3)(a)
For both natural gas and oil
PM<=0.064 gr/dscf @10% O2 : NESHAP 40CFR63.862(a)i; 40CFR63.864(e)&(k); 40CFR63.6(f)(SSM exclusion)
PM surrogate for HAPS
NOx: 275 ppmdv @10%O2, 24-hr avg;
262 TPY 12 month total
NA :
SO2: 20 ppmdv @10% O2, 3-hr avg;
28 tpy 12 month total
NA 500 ppm @10%O2; 1-hr avg.: WAC 173-405-040(11)(a)
: NA PM<=0.13 gr/dscf @10% O2, 1-hr avg: WAC 173-405-040(3)(a)PM<=0.064 gr/dscf @10% O2 : 40CFR63.862(a)i; 40CFR63.864(e)&(k); 40CFR63.6(f)(SSM exclusion)
PM surrogate for HAPS
NOx: 340 ppmdv @10%O2, 24-hr avg;
139 TPY 12 month total
NA :
SO2: *20 ppmdv @10% O2, 3-hr avg;
16 tpy 12 month total
NA 500 ppm @10%O2; 1-hr avg.: WAC 173-405-040(11)(a)
*SO2 is typically controlled using operational practices, but caustic addition to the scrubber water is used when operational conditions vary from establised standards.
NA PM<=0.13 gr/dscf @10% O2, 1-hr avg: WAC 173-405-040(3)(a)PM<=0.064 gr/dscf @10% O2 : 40CFR63.862(a)i; 40CFR63.864(e)&(k); 40CFR63.6(f)(SSM exclusion)
PM surrogate for HAPS
NOx: 340 ppmdv @10%O2, 24-hr avg;
139 TPY 12 month total
NA :
SO2: *20 ppmdv @10% O2, 3-hr avg;
16 tpy 12 month total
NA 500 ppm @10%O2; 1-hr avg.: WAC 173-405-040(11)(a)
*SO2 is typically controlled using operational practices, but caustic addition to the scrubber water is used when operational conditions vary from establised standards.
*When firing natural gas.** When firing oil.
NA
Lime Kiln 1
(out of service)
PM/PM10
0.030 gr/dscf @10% O2 1-hr avg;
20 tpy 12-month total;*venturi scrubber
Lime Kiln 2
(out of service)
PM/PM10:
0.030 gr/dscf @10% O2 1-hr avg;
20 tpy 12-month total;*venturi scrubber
Lime Kiln 5 PM/PM10:
*0.035 gr/dscf @10% O2 1-hr avg;
**0.060 gr/dscf @10% O2 1-hr avg; 69 tpy 12-month total;
ESP
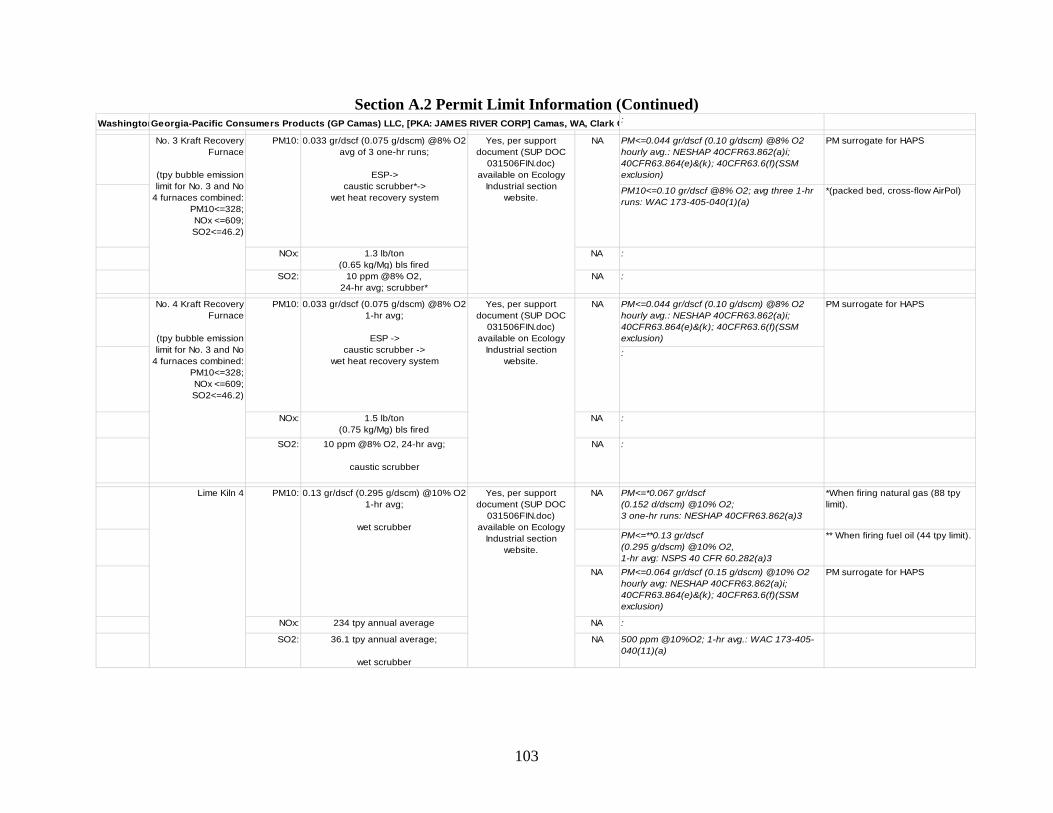
103
Section A.2 Permit Limit Information (Continued)
WashingtonGeorgia-Pacific Consumers Products (GP Camas) LLC, [PKA: JAMES RIVER CORP] Camas, WA, Clark C :
: PM<=0.044 gr/dscf (0.10 g/dscm) @8% O2 hourly avg.: NESHAP 40CFR63.862(a)i; 40CFR63.864(e)&(k); 40CFR63.6(f)(SSM exclusion)
PM surrogate for HAPS
PM10<=0.10 gr/dscf @8% O2; avg three 1-hr runs: WAC 173-405-040(1)(a)
*(packed bed, cross-flow AirPol)
NOx: 1.3 lb/ton (0.65 kg/Mg) bls fired
NA :
SO2: 10 ppm @8% O2, 24-hr avg; scrubber*
NA :
: PM<=0.044 gr/dscf (0.10 g/dscm) @8% O2 hourly avg.: NESHAP 40CFR63.862(a)i; 40CFR63.864(e)&(k); 40CFR63.6(f)(SSM exclusion):
NOx: 1.5 lb/ton (0.75 kg/Mg) bls fired
NA :
SO2: 10 ppm @8% O2, 24-hr avg;
caustic scrubber
NA :
NA PM<=*0.067 gr/dscf (0.152 d/dscm) @10% O2; 3 one-hr runs: NESHAP 40CFR63.862(a)3
*When firing natural gas (88 tpy limit).
PM<=**0.13 gr/dscf (0.295 g/dscm) @10% O2, 1-hr avg: NSPS 40 CFR 60.282(a)3
** When firing fuel oil (44 tpy limit).
NA PM<=0.064 gr/dscf (0.15 g/dscm) @10% O2 hourly avg: NESHAP 40CFR63.862(a)i; 40CFR63.864(e)&(k); 40CFR63.6(f)(SSM exclusion)
PM surrogate for HAPS
NOx: 234 tpy annual average NA :
SO2: 36.1 tpy annual average;
wet scrubber
NA 500 ppm @10%O2; 1-hr avg.: WAC 173-405-040(11)(a)
PM surrogate for HAPSNA
Yes, per support document (SUP DOC
031506FIN.doc) available on Ecology
Industrial section website.
Yes, per support document (SUP DOC
031506FIN.doc) available on Ecology
Industrial section website.
NA
Lime Kiln 4 PM10: 0.13 gr/dscf (0.295 g/dscm) @10% O2 1-hr avg;
wet scrubber
No. 3 Kraft Recovery Furnace
(tpy bubble emission limit for No. 3 and No
4 furnaces combined: PM10<=328; NOx <=609; SO2<=46.2)
PM10: 0.033 gr/dscf (0.075 g/dscm) @8% O2 avg of 3 one-hr runs;
ESP->caustic scrubber*->
wet heat recovery system
Yes, per support document (SUP DOC
031506FIN.doc) available on Ecology
Industrial section website.
No. 4 Kraft Recovery Furnace
(tpy bubble emission limit for No. 3 and No
4 furnaces combined: PM10<=328; NOx <=609; SO2<=46.2)
PM10: 0.033 gr/dscf (0.075 g/dscm) @8% O2 1-hr avg;
ESP ->caustic scrubber ->
wet heat recovery system
104
Section A.2 Permit Limit Information (Continued)
WashingtonCosmo Specialty Fibers, Inc. (Cosmo) [Previously owned by Weyerhaeuser], Cosmopolis, WA, Grays :
: 0.10 gr/dscf @8% O2;: WAC 173-410-040(2)(a); andOrder DE 95AQ-1034 (Attachment B)
*<=10.0 lbs/hr (4.535 kg/hr) : 40CFR63.862(d) (MACT rule dated February 18, 2003; effective May 19, 2003)
*Special site specific MACT rule for PM (as a surrogate for HAPS). PM is controlled through hog fuel boiler instead of recovery furnace
NOx: NA NA :
NA 800 ppm hrly avg.: WAC 173-410-040(d); 40CFR64; and WAC 173-401-615(4)
NA 360 ppm hrly avg.: Order DE 95AQ-1034 (Attachment B)
: : WashingtonPort Townsend Paper Corporation (PTPC), Port Townsend, WA, Jefferson County :
0.08 gr/dscf @8% O2; 1-hr avg: Order 2892-05AQ; and 40 CFR 64.6 (c) for CAM0.10 gr/dscf @8% O2;: WAC 173-405-040
PM<=0.044 gr/dscf @8% O2 hourly avg.: NESHAP 40CFR63.862
PM surrogate for HAPS
NOx: NA NA :
SO2: 200 ppm @8%O2 1-hr avg. Yes. Multiple source tests per support
document (PTSUPA20.DOC)
NA 500 ppm hrly avg.: WAC 173-410-040
:
Lime Kiln
0.13 gr/dscf @10% 02; 1-hr avg.: WAC 173-405-040; and 40 CFR 64.6 (c) for CAMPM<=0.064 gr/dscf @10% O2 hourly avg.: 40CFR63.862
PM surrogate for HAPS
NOx: NA NA :
SO2: (See Summary of Other Rules)
Venturi Scrubber
Yes. Multiple source tests per support
document (PTSUPA20.DOC)
NA 500 ppm hrly avg.: WAC 173-410-040
*Recovery Boilers No. 1 and 2, flow from multicyclone to an absorption tower; *Recovery Boiler No. 3 flows from multicyclone to dual-purpose cooler/cyclone evaporator, and three venturi SO2 absorbers in
i
Recovery Furnace PM: (See Summary of Other Rules)
ESP
Yes. Multiple source tests per support
document (PTSUPA20.DOC)
NA
Recovery Boilers No. 1, 2, and 3 (common
stack)
PM: (See Summary of Other Rules)
multi-cyclones*
Yes, per permit support document (No. 000080-9) available on Ecology
Industrial section website.
NA
SO2: (See Summary of Other Rules)
Absorption tower/venturi absorbers*
PM: (See Summary of Other Rules)
Venturi Scrubber
Yes. Multiple source tests per support
document (PTSUPA20.DOC)
NA
105
Section A.2 Permit Limit Information (Continued)
WashingtonWestRock, Tacoma, WA, Pierce County :
0.10 gr/dscf @8% O2;: WAC 173-405-040
PM<=0.044 gr/dscf @8% O2 hourly avg.: NESHAP 40CFR63.862
PM surrogate for HAPS
NOx: 85 ppm @8% O2, 30-day rolling avg; 515 tpy as 12-month rolling avg.
NA :
SO2: 150 ppm @8%O2, 30-day rolling avg;669 tons /yr as 12-month rolling avg.
NA 500 ppm hrly avg.: WAC 173-410-040
: Lime Kilns #s 1 & 2.
0.13 gr/dscf @10% 02; 1-hr avg.: WAC 173-405-040PM<=0.064 gr/dscf @10% O2 hourly avg.: NESHAP 40CFR63.862
PM surrogate for HAPS
NOx: NA NA :
SO2: (See Summary of Other Rules); Scrubber
NA 500 ppm hrly avg.: WAC 173-410-040
PM: (See Summary of Other Rules)
Scrubber
Yes, avg of three tests on 7/27/04 and 8/9/04
NA
Recovery Furnace # 4.
(669 tpy as 12-month rolling avg)
PM: (See Summary of Other Rules)
ESP
NA
106
Section A.2 Permit Limit Information (Continued)
WashingtonWeyerhaeuser Longview, WA, Cowlitz County :
: Same as BACT limits: BART = "Current BACT limits in PSD 92-03, Ammendment 4"
PM<=0.10 gr/dscf @8% O2; avg of three 1-hr runs: WAC 173-405-040
PM<=0.044 gr/dscf @8% O2 hourly avg.: NESHAP 40CFR63.862
PM surrogate for HAPS
NOx: 140 ppm @ 8% O2, 24 hr avg; 1179 tpy annual avg
NA Same as BACT limit: BART = "Current BACT limit in PSD 92-03, Ammendment 4"
: WAC 173-410-040
Same as BACT limit: BART = "Current BACT limit in PSD 92-03, Ammendment 4"
Quote from WA State Regional Haze SIP, Dec 2010 (p.L-374)
NA 1000 ppm hrly avg. (when firing oil): WAC 173-410-040(11)(b)
*586 tpy + 0.036 tpy for each hr of NCG incinerator operation. The combined total not to exceed 884 tpy.
Lime Kiln
PM<=*0.067 gr/dscf @10% O2 : NESHAP 40CFR63.862(a)3; WAC173-405-040
*When firing natural gas.
PM<=**0.13 gr/dscf @10% O2, 1-hr avg: NSPS 40 CFR 60.282(a)3
**For liquid fossil fuel
PM<=0.064 gr/dscf @10% O2 : NESHAP 40CFR63.862
PM surrogate for HAPS
NOx: NA NA NA
SO2: NA NA 500 ppm @10%O2; 1-hr avg.: WAC 173-405-040(11)(a)
75 ppm @8%O2, 3 hr avg (when not using suppl oil or when using suppl oil and BLS firing rate >150,000 lbs/hr); 500 ppm 3-hr avg (when BLS firing
rate <120,000 lbs/hr and firing suppl oil); 586 tpy*
PM *0.035 gr/dscf @10% O2 (gas fired); 0.07 gr/dscf @10% O2 (oil fired);
ESP
NA
Recovery Furnace # 10.
PM/PM10:
0.027 gr/dscf @8% O2 avg of three 1-hr runs; 0.020 gr/dscf @8% annually;
252 tpy;
ESP
NA
SO2:
107
Section A.2 Permit Limit Information (Continued)
WashingtoBoise White Wallula, WA, Walla Walla County :
: PM<=0.1 gr/dscf @8% O2 avg three 1-hr tests: WAC 173-400-091
PM<=0.044 gr/dscf @8% O2 : NESHAP 40CFR63.862(a)(1)(i)
PM surrogate for HAPS
PM<=75 tpy; PM10<=63 tpy PM10 (12-month rolling avg);: Order No. DE 02AQ91S-5019;
NOx: NA NA NA
500 ppm@8%O2; 1-hr avg.: WAC 173-405-040(11)(a)
NA 585 tpy 12-month rolling avg.: Order No. DE 02AQ91S-5019; WAC 173-400-091
: 0.027 gr/dscf @8% O2 avg of three 1-hr runs; 0.021 gr/dscf @8% annually; 186 tpy; : LAER for state non-attainment area NSR (per WAC 173-400-112)
PM<=0.1 gr/dscf @8% O2 avg three 1-hr tests: WAC 173-405-040
PM<=0.044 gr/dscf @8% O2 : NESHAP 40CFR63.862(a)(1)(i)
PM surrogate for HAPS
NOx: 112 ppmvd @ 8% O2, daily avg; 825 tpy
NA NA
SO2: *1301 12 month rolling annual avg 500 ppm@8%O2; 1-hr avg.: WAC 173-405-040(11)(a)
*PSD condition as BACT avoidance limit.
No. 3 Recovery Furnace
PM/PM10:
See Summary of Other Rules (LAER)
ESP
Yes for Particulate (multiple years of data per support document file name: "1/7/2005 Boise Cascade AOP
Fact Sheet.doc")
NA
No. 2 Recovery Furnace
PM 0.044 gr/dscf @8% O2 1-hr avg;
476 lbs/day rolling annual avg;
ESP
Yes for Particulate (multiple years of data per support document file name: "1/7/2005 Boise Cascade AOP
Fact Sheet.doc")
NA
SO2: 5424 lbs/day rolling annual avg
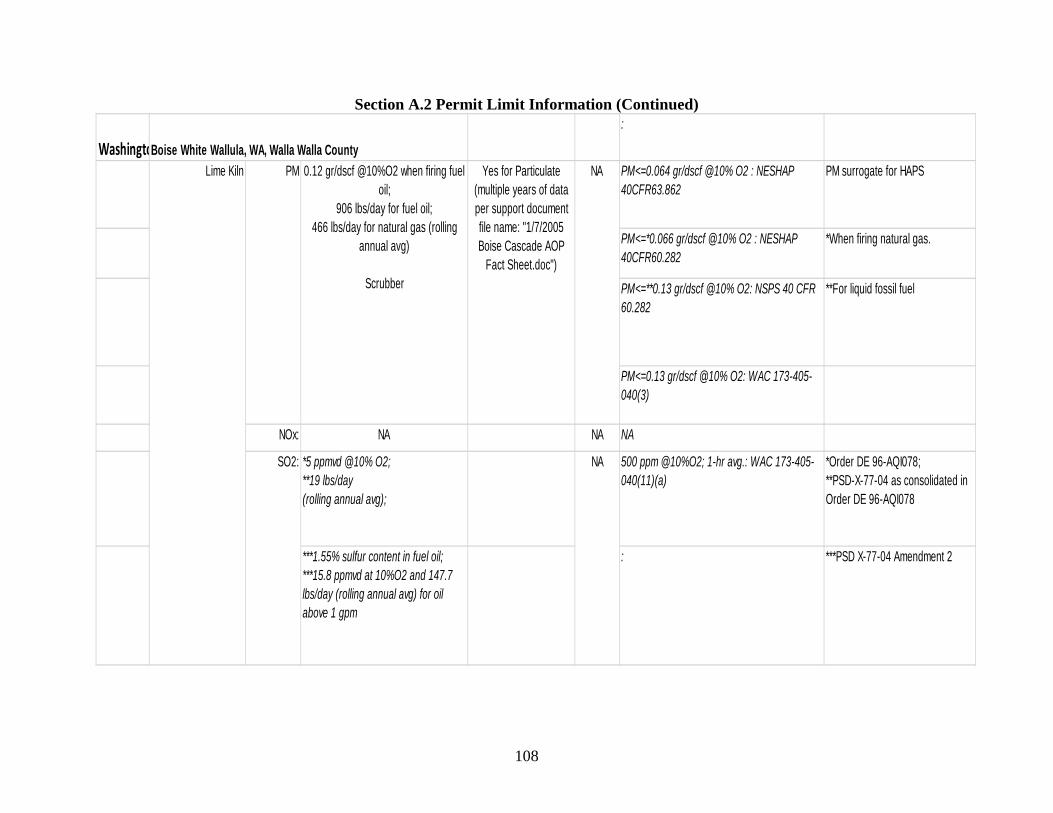
108
Section A.2 Permit Limit Information (Continued)
WashingtoBoise White Wallula, WA, Walla Walla County
:
PM<=0.064 gr/dscf @10% O2 : NESHAP 40CFR63.862
PM surrogate for HAPS
PM<=*0.066 gr/dscf @10% O2 : NESHAP 40CFR60.282
*When firing natural gas.
PM<=**0.13 gr/dscf @10% O2: NSPS 40 CFR 60.282
**For liquid fossil fuel
PM<=0.13 gr/dscf @10% O2: WAC 173-405-040(3)
NOx: NA NA NA
*5 ppmvd @10% O2; **19 lbs/day (rolling annual avg);
500 ppm @10%O2; 1-hr avg.: WAC 173-405-040(11)(a)
*Order DE 96-AQI078; **PSD-X-77-04 as consolidated in Order DE 96-AQI078
***1.55% sulfur content in fuel oil; ***15.8 ppmvd at 10%O2 and 147.7 lbs/day (rolling annual avg) for oil above 1 gpm
: ***PSD X-77-04 Amendment 2
SO2:
Lime Kiln
NA
PM 0.12 gr/dscf @10%O2 when firing fuel oil;
906 lbs/day for fuel oil;466 lbs/day for natural gas (rolling
annual avg)
Scrubber
Yes for Particulate (multiple years of data per support document file name: "1/7/2005 Boise Cascade AOP
Fact Sheet.doc")
NA
109
Appendix B. Facility Operating and Emissions Data
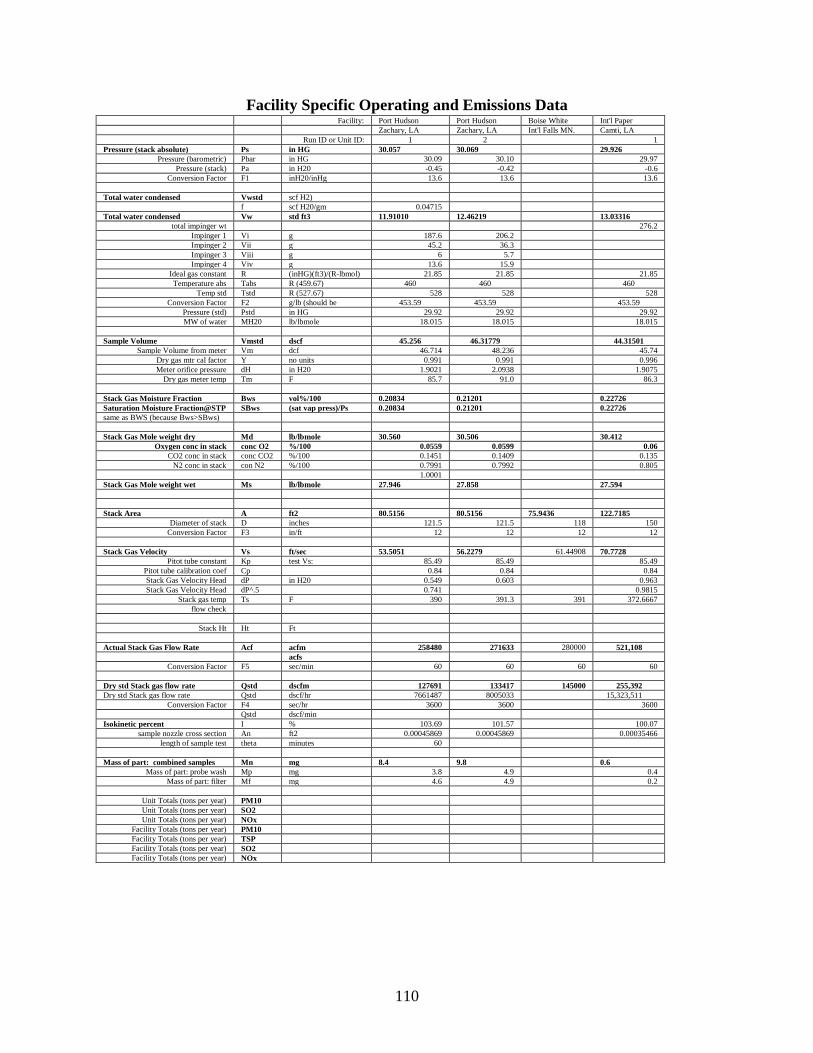
110
Facility Specific Operating and Emissions Data
Facility: Port Hudson Port Hudson Boise White Int'l Paper Zachary, LA Zachary, LA Int'l Falls MN. Camti, LA Run ID or Unit ID: 1 2 1 Pressure (stack absolute) Ps in HG 30.057 30.069 29.926
Pressure (barometric) Pbar in HG 30.09 30.10 29.97 Pressure (stack) Pa in H20 -0.45 -0.42 -0.6
Conversion Factor F1 inH20/inHg 13.6 13.6 13.6
Total water condensed Vwstd scf H2) f scf H20/gm 0.04715 Total water condensed Vw std ft3 11.91010 12.46219 13.03316
total impinger wt 276.2 Impinger 1 Vi g 187.6 206.2 Impinger 2 Vii g 45.2 36.3 Impinger 3 Viii g 6 5.7 Impinger 4 Viv g 13.6 15.9
Ideal gas constant R (inHG)(ft3)/(R-lbmol) 21.85 21.85 21.85 Temperature abs Tabs R (459.67) 460 460 460
Temp std Tstd R (527.67) 528 528 528 Conversion Factor F2 g/lb (should be
453.59 453.59 453.59
Pressure (std) Pstd in HG 29.92 29.92 29.92 MW of water MH20 lb/lbmole 18.015 18.015 18.015
Sample Volume Vmstd dscf 45.256 46.31779 44.31501
Sample Volume from meter Vm dcf 46.714 48.236 45.74 Dry gas mtr cal factor Y no units 0.991 0.991 0.996 Meter orifice pressure dH in H20 1.9021 2.0938 1.9075
Dry gas meter temp Tm F 85.7 91.0 86.3 Stack Gas Moisture Fraction Bws vol%/100 0.20834 0.21201 0.22726 Saturation Moisture Fraction@STP SBws (sat vap press)/Ps 0.20834 0.21201 0.22726 same as BWS (because Bws>SBws)
Stack Gas Mole weight dry Md lb/lbmole 30.560 30.506 30.412
Oxygen conc in stack conc O2 %/100 0.0559 0.0599 0.06 CO2 conc in stack conc CO2 %/100 0.1451 0.1409 0.135
N2 conc in stack con N2 %/100 0.7991 0.7992 0.805 1.0001 Stack Gas Mole weight wet Ms lb/lbmole 27.946 27.858 27.594 Stack Area A ft2 80.5156 80.5156 75.9436 122.7185
Diameter of stack D inches 121.5 121.5 118 150 Conversion Factor F3 in/ft 12 12 12 12
Stack Gas Velocity Vs ft/sec 53.5051 56.2279 61.44908 70.7728
Pitot tube constant Kp test Vs: 85.49 85.49 85.49 Pitot tube calibration coef Cp 0.84 0.84 0.84 Stack Gas Velocity Head dP in H20 0.549 0.603 0.963 Stack Gas Velocity Head dP^.5 0.741 0.9815
Stack gas temp Ts F 390 391.3 391 372.6667 flow check
Stack Ht Ht Ft
Actual Stack Gas Flow Rate Acf acfm 258480 271633 280000 521,108 acfs
Conversion Factor F5 sec/min 60 60 60 60 Dry std Stack gas flow rate Qstd dscfm 127691 133417 145000 255,392 Dry std Stack gas flow rate Qstd dscf/hr 7661487 8005033 15,323,511
Conversion Factor F4 sec/hr 3600 3600 3600 Qstd dscf/min Isokinetic percent I % 103.69 101.57 100.07
sample nozzle cross section An ft2 0.00045869 0.00045869 0.00035466 length of sample test theta minutes 60
Mass of part: combined samples Mn mg 8.4 9.8 0.6
Mass of part: probe wash Mp mg 3.8 4.9 0.4 Mass of part: filter Mf mg 4.6 4.9 0.2
Unit Totals (tons per year) PM10 Unit Totals (tons per year) SO2 Unit Totals (tons per year) NOx
Facility Totals (tons per year) PM10 Facility Totals (tons per year) TSP Facility Totals (tons per year) SO2 Facility Totals (tons per year) NOx

111
Facility Specific Operating and Emissions Data (PTPC) Facility: PTPC PTPC PTPC PTPC PTPC PTPC PTPC 2003 2004 2005 2006 2007 2008 2003-
Run ID or Unit ID: RF RF RF RF RF RF Avg Pressure (stack absolute) Ps in HG 29.92 29.92 29.92 29.92 29.92 29.92 29.92
Pressure (barometric) Pbar in HG Pressure (stack) Pa in H20
Conversion Factor F1 inH20/inHg
Total water condensed Vwstd scf H2) f scf H20/gm Total water condensed Vw std ft3
total impinger wt Impinger 1 Vi g Impinger 2 Vii g Impinger 3 Viii g Impinger 4 Viv g
Ideal gas constant R (inHG)(ft3)/(R-
Temperature abs Tabs R (459.67) 460 460 460 460 460 460
Temp std Tstd R (527.67) 528 528 528 528 528 528 Conversion Factor F2 g/lb (should be
Pressure (std) Pstd in HG 29.92 29.92 29.92 29.92 29.92 29.92 MW of water MH20 lb/lbmole 18.015 18.015 18.015 18.015 18.015 18.015
Sample Volume Vmstd dscf
Sample Volume from meter Vm dcf Dry gas mtr cal factor Y no units Meter orifice pressure dH in H20
Dry gas meter temp Tm F Stack Gas Moisture Fraction Bws vol%/100 0.17 0.19 0.18 0.17 0.18 0.18 0.1783 Saturation Moisture Fraction@STP SBws (sat vap press)/Ps same as BWS (because Bws>SBws)
Stack Gas Mole weight dry Md lb/lbmole 29.867 29.675 30.035 29.879 29.651 29.771 AVG
Oxygen conc in stack conc O2 %/100 0.112 0.128 0.098 0.111 0.13 0.12 0.1165 CO2 conc in stack conc CO2 %/100 0.088 0.072 0.102 0.089 0.07 0.08
N2 conc in stack con N2 %/100 0.8 0.8 0.8 0.8 0.8 0.8 Stack Gas Mole weight wet Ms lb/lbmole 27.852 27.460 27.872 27.862 27.556 27.655 Stack Area A ft2 63.6173 63.6173 63.6173 63.6173 63.6173 63.6173
Diameter of stack D inches 108 108 108 108 108 108 Conversion Factor F3 in/ft 12 12 12 12 12 12
Stack Gas Velocity Vs ft/sec 78.1706 85.3982 96.2632 90.7615 89.5197 70.9399
Pitot tube constant Kp test Vs: Pitot tube calibration coef Cp Stack Gas Velocity Head dP in H20 Stack Gas Velocity Head dP^.5 AVG
Stack gas temp Ts F 317 334 371 309 313 302 324 flow check 298,380 325,968 367,440
Stack Ht Ht Ft
Actual Stack Gas Flow Rate Acf acfm 298380 325968 367440 346440 341700 270780 325118 acfs 4973 5432.8 6124 5774 5695 4513
Converstion Factor F5 sec/min 60 60 60 60 60 60 AVG Dry std Stack gas flow rate Qstd dscfm 168,291 175,579 191,440 197,430
179664
Dry std Stack gas flow rate Qstd dscf/hr 10,097,456 10,534,760 11,486,413
11,483,24
9,231,253 Conversion Factor F4 sec/hr 3600 3600 3600 3600 3600 3600
Qstd dscf/min Isokinetic percent I %
sample nozzle cross section An ft2 length of sample test theta minutes
Mass of part: combined samples Mn mg
Mass of part: probe wash Mp mg Mass of part: filter Mf mg
AVG Unit Totals (tons per year) PM10 100 75 150 144 139 85 116
Unit Totals (tons per year) SO2 106 102 196 195 26 4 105 Unit Totals (tons per year) NOx 178 176 193 185 264 242 206
Facility Totals (tons per year) PM10 331 301 333 346 340 292 324 Facility Totals (tons per year) TSP 515 478 514 589 580 512 531 Facility Totals (tons per year) SO2 351 349 410 287 123 50 262 Facility Totals (tons per year) NOx 516 544 581 551 565 519 546

112
Facility Specific Operating and Emissions Data (PTPC - Continued) Facility: PTPC PTPC PTPC PTPC PTPC PTPC PTPC 2003 2004 2005 2006 2007 2008 2003-
Run ID or Unit ID: LK LK LK LK LK LK LK Avg Pressure (stack absolute) Ps in HG 29.92 29.92 29.92 29.92 29.92 29.92
Pressure (barometric) Pbar in HG Pressure (stack) Pa in H20
Conversion Factor F1 inH20/inHg
Total water condensed Vwstd scf H2) f scf H20/gm Total water condensed Vw std ft3
total impinger wt Impinger 1 Vi g Impinger 2 Vii g Impinger 3 Viii g Impinger 4 Viv g
Ideal gas constant R (inHG)(ft3)/(R-lbmol) Temperature abs Tabs R (459.67) 460 460 460 460 460 460
Temp std Tstd R (527.67) 528 528 528 528 528 528 Conversion Factor F2 g/lb (should be
Pressure (std) Pstd in HG 29.92 29.92 29.92 29.92 29.92 29.92 MW of water MH20 lb/lbmole 18.015 18.015 18.015 18.015 18.015 18.015
Sample Volume Vmstd dscf
Sample Volume from meter Vm dcf Dry gas mtr cal factor Y no units Meter orifice pressure dH in H20
Dry gas meter temp Tm F Stack Gas Moisture Fraction Bws vol%/100 0.26 0.26 0.29 0.27 0.28 0.29 0.275 Saturation Moisture Fraction@STP SBws (sat vap press)/Ps same as BWS (because Bws>SBws)
Stack Gas Mole weight dry Md lb/lbmole 30.131 30.119 30.179 30.264 30.348 30.492 AVG
Oxygen conc in stack conc O2 %/100 0.09 0.091 0.086 0.079 0.072 0.06 0.07967 CO2 conc in stack conc CO2 %/100 0.11 0.109 0.114 0.121 0.128 0.14
N2 conc in stack con N2 %/100 0.8 0.8 0.8 0.8 0.8 0.8 Stack Gas Mole weight wet Ms lb/lbmole 26.981 26.972 26.652 26.956 26.894 26.873 Stack Area A ft2 28.2743 28.2743 28.2743 28.2743 28.2743 28.2743
Diameter of stack D inches 72 72 72 72 72 72 Conversion Factor F3 in/ft 12 12 12 12 12 12
Stack Gas Velocity Vs ft/sec 17.6131 15.8448 15.8801 15.3850 16.8704 15.5618
Pitot tube constant Kp test Vs: Pitot tube calibration coef Cp Stack Gas Velocity Head dP in H20 Stack Gas Velocity Head dP^.5 AVG
Stack gas temp Ts F 156 155 155 153 155 155 155 flow check 29,880 26,880 26,940 26,100 28,620 6,400
Stack Ht Ht Ft
Actual Stack Gas Flow Rate Acf acfm 29880 26880 26940 26100 28620 26400
acfs 498 448 449 435 477 440 Converstion Factor F5 sec/min 60 60 60 60 60 60
AVG Dry std Stack gas flow rate Qstd dscfm 18,952 17,077 16,422 16,411 17,691
Dry std Stack gas flow rate Qstd dscf/hr 1,137,147 1,024,639 985,294 84,664 1,061,481
Conversion Factor F4 sec/hr 3600 3600 3600 3600 3600 3600
Qstd dscf/min Isokinetic percent I %
sample nozzle cross section An ft2 length of sample test theta minutes
Mass of part: combined samples Mn mg
Mass of part: probe wash Mp mg Mass of part: filter Mf mg
AVG Unit Totals (tons per year) PM10 27 27 20 26 15 23 23 Unit Totals (tons per year) SO2 1 2 2 1 1 1 1 Unit Totals (tons per year) NOx 59 59 64 62 34 30 51
Facility Totals (tons per year) PM10 331 301 333 346 340 292 324 Facility Totals (tons per year) TSP 515 478 514 589 580 512 531 Facility Totals (tons per year) SO2 351 349 410 287 123 50 262 Facility Totals (tons per year) NOx 516 544 581 551 565 519 546

113
Facility Specific Operating and Emissions Data (WestRock) Facility: WestRock WestRock WestRock WestRock WestRock WestRock 2005 2006 2007 2008 2009 2005-2009
Run ID or Unit ID: rf rf rf rf rf RF AVG Pressure (stack absolute) Ps in HG 29.92 29.92 29.92 29.92 29.92
Pressure (barometric) Pbar in HG Pressure (stack) Pa in H20
Conversion Factor F1 inH20/inHg
Total water condensed Vwstd scf H2) f scf H20/gm Total water condensed Vw std ft3
total impinger wt Impinger 1 Vi g Impinger 2 Vii g Impinger 3 Viii g Impinger 4 Viv g
Ideal gas constant R (inHG)(ft3)/(R-lbmol) Temperature abs Tabs R (459.67) 460 460 460 460 460
Temp std Tstd R (527.67) 528 528 528 528 528 Conversion Factor F2 g/lb (should be
Pressure (std) Pstd in HG 29.92 29.92 29.92 29.92 29.92 MW of water MH20 lb/lbmole 18.015 18.015 18.015 18.015 18.015
Sample Volume Vmstd dscf
Sample Volume from meter Vm dcf Dry gas mtr cal factor Y no units Meter orifice pressure dH in H20
Dry gas meter temp Tm F Stack Gas Moisture Fraction Bws vol%/100 0.247 0.228 0.25 0.229 0.231 0.237 Saturation Moisture Fraction@STP SBws (sat vap press)/Ps same as BWS (because Bws>SBws)
Stack Gas Mole weight dry Md lb/lbmole 30.480 30.396 30.516 30.516 30.300 AVG
Oxygen conc in stack conc O2 %/100 0.061 0.068 0.058 0.058 0.076 0.0642 CO2 conc in stack conc CO2 %/100 0.139 0.132 0.142 0.142 0.124
N2 conc in stack con N2 %/100 0.8 0.8 0.8 0.8 0.8 Stack Gas Mole weight wet Ms lb/lbmole 27.401 27.573 27.391 27.653 27.462 Stack Area A ft2 153.9380 153.9380 153.9380 153.9380 153.9380
Diameter of stack D inches 168 168 168 168 168 Conversion Factor F3 in/ft 12 12 12 12 12
Stack Gas Velocity Vs ft/sec 37.3592 37.2358 38.5740 35.2739 37.9179
Pitot tube constant Kp test Vs: Pitot tube calibration coef Cp Stack Gas Velocity Head dP in H20 Stack Gas Velocity Head dP^.5 AVG
Stack gas temp Ts F 377 378 383 388 372 380 flow check 345,060 343,920 356,280 325,800 350,220
Stack Ht Ht Ft
Actual Stack Gas Flow Rate Acf acfm 345060 343920 356280 325800 350220 344,256 acfs 5751 5732 5938 5430 5837
Converstion Factor F5 sec/min 60 60 60 60 60 AVG Dry std Stack gas flow rate Qstd dscfm 163,907 167,288 167,363 156,402 170,914 165,175 Dry std Stack gas flow rate Qstd dscf/hr 9,834,433 10,037,276 10,041,77
9,384,146 10,254,84
Conversion Factor F4 sec/hr 3600 3600 3600 3600 3600 Qstd dscf/min Isokinetic percent I %
sample nozzle cross section An ft2 length of sample test theta minutes
Mass of part: combined samples Mn mg
Mass of part: probe wash Mp mg Mass of part: filter Mf mg
AVG Unit Totals (tons per year) PM10 13 23 46 29 19 26 Unit Totals (tons per year) SO2 293 238 400 390 110 286 Unit Totals (tons per year) NOx 291 294 281 303 257 285
Facility Totals (tons per year) PM10 103 75 117 87 76 92 Facility Totals (tons per year) TSP 121 94 147 105 87 111 Facility Totals (tons per year) SO2 378 503 693 635 319 506 Facility Totals (tons per year) NOx 610 743 708 684 808 711

114
Facility Specific Operating and Emissions Data (WestRock - Continued) Facility: WestRock WestRock WestRock WestRock WestRock WestRock 2005 2006 2007 2008 2009 2005-2009 Run ID or Unit ID: lk 1 lk1 lk 1 lk 1 lk 1 LK 1 Avg Pressure (stack absolute) Ps in HG 29.92 29.92 29.92 29.92 29.92
Pressure (barometric) Pbar in HG Pressure (stack) Pa in H20
Conversion Factor F1 inH20/inHg
Total water condensed Vwstd scf H2) f scf H20/gm Total water condensed Vw std ft3
total impinger wt Impinger 1 Vi g Impinger 2 Vii g Impinger 3 Viii g Impinger 4 Viv g
Ideal gas constant R (inHG)(ft3)/(R-lbmol) Temperature abs Tabs R (459.67) 460 460 460 460 460
Temp std Tstd R (527.67) 528 528 528 528 528 Conversion Factor F2 g/lb (should be
Pressure (std) Pstd in HG 29.92 29.92 29.92 29.92 29.92 MW of water MH20 lb/lbmole 18.015 18.015 18.015 18.015 18.015
Sample Volume Vmstd dscf
Sample Volume from meter Vm dcf Dry gas mtr cal factor Y no units Meter orifice pressure dH in H20
Dry gas meter temp Tm F Stack Gas Moisture Fraction Bws vol%/100 0.291 0.346 0.284 0.345 0.346 0.322 Saturation Moisture Fraction@STP SBws (sat vap press)/Ps same as BWS (because Bws>SBws)
Stack Gas Mole weight dry Md lb/lbmole 30.900 30.696 30.612 30.636 30.384 AVG
Oxygen conc in stack conc O2 %/100 0.026 0.043 0.05 0.048 0.069 0.0472 CO2 conc in stack conc CO2 %/100 0.174 0.157 0.15 0.152 0.131
N2 conc in stack con N2 %/100 0.8 0.8 0.8 0.8 0.8 Stack Gas Mole weight wet Ms lb/lbmole 27.151 26.308 27.034 26.282 26.104 Stack Area A ft2 12.5664 12.5664 12.5664 12.5664 12.5664
Diameter of stack D inches 48 48 48 48 48 Conversion Factor F3 in/ft 12 12 12 12 12
Stack Gas Velocity Vs ft/sec 48.3035 55.4655 47.1894 48.5423 56.3408
Pitot tube constant Kp test Vs: Pitot tube calibration coef Cp Stack Gas Velocity Head dP in H20 Stack Gas Velocity Head dP^.5 AVG
Stack gas temp Ts F 157 162 158 156 162 159 flow check 36,420 41,820 35,580 36,600 42,480 AVG
Stack Ht Ht Ft
Actual Stack Gas Flow Rate Acf acfm 36420 41820 35580 36600 42480 38580 acfs 607 697 593 610 708
Converstion Factor F5 sec/min 60 60 60 60 60 AVG Dry std Stack gas flow rate Qstd dscfm 22,097 23,217 21,765 20,548 23,583 22,242 Dry std Stack gas flow rate Qstd dscf/hr 1,325,825 1,393,017 1,305,917 1,232,897 1,415,002
Conversion Factor F4 sec/hr 3600 3600 3600 3600 3600 Qstd dscf/min Isokinetic percent I %
sample nozzle cross section An ft2 length of sample test theta minutes
Mass of part: combined samples Mn mg
Mass of part: probe wash Mp mg Mass of part: filter Mf mg
AVG Unit Totals (tons per year) PM10 30 19 28 22 19 23.6 Unit Totals (tons per year) SO2 1 3 1 5 8 3.6 Unit Totals (tons per year) NOx 42 42 39 37 54 42.8
Facility Totals (tons per year) PM10 103 75 117 87 76 92 Facility Totals (tons per year) TSP 121 94 147 105 87 111 Facility Totals (tons per year) SO2 378 503 693 635 319 506 Facility Totals (tons per year) NOx 610 743 708 684 808 711
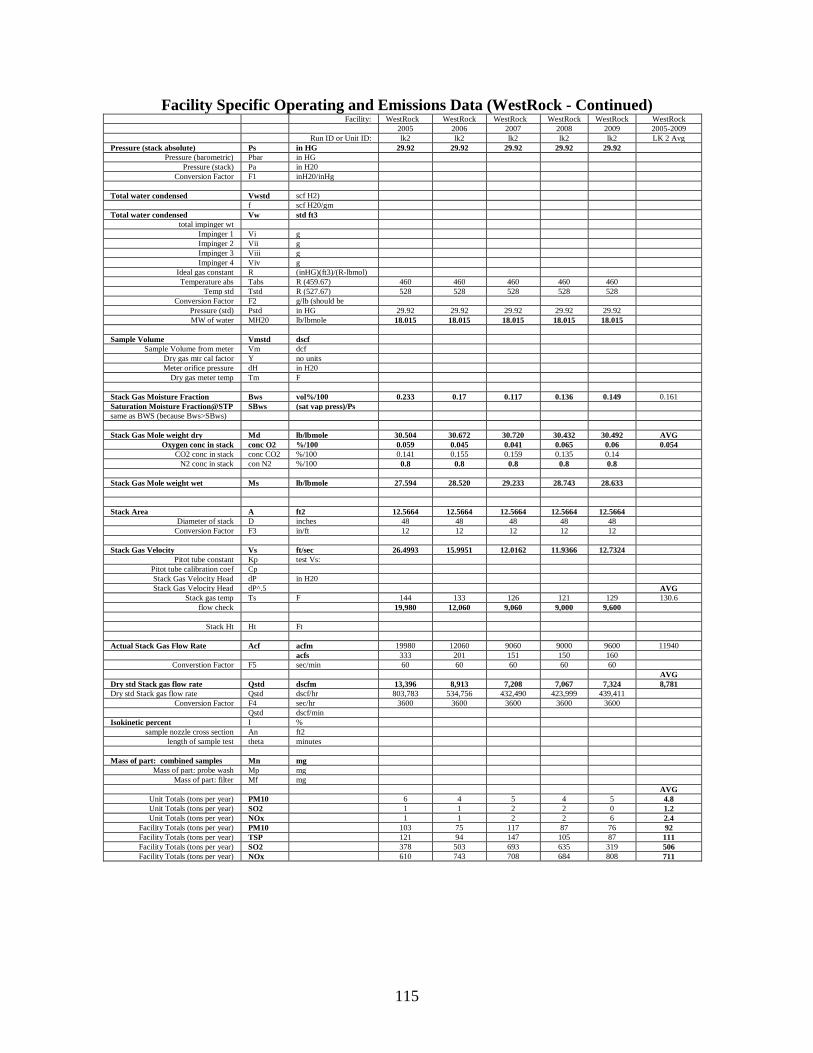
115
Facility Specific Operating and Emissions Data (WestRock - Continued) Facility: WestRock WestRock WestRock WestRock WestRock WestRock 2005 2006 2007 2008 2009 2005-2009 Run ID or Unit ID: lk2 lk2 lk2 lk2 lk2 LK 2 Avg Pressure (stack absolute) Ps in HG 29.92 29.92 29.92 29.92 29.92
Pressure (barometric) Pbar in HG Pressure (stack) Pa in H20
Conversion Factor F1 inH20/inHg
Total water condensed Vwstd scf H2) f scf H20/gm Total water condensed Vw std ft3
total impinger wt Impinger 1 Vi g Impinger 2 Vii g Impinger 3 Viii g Impinger 4 Viv g
Ideal gas constant R (inHG)(ft3)/(R-lbmol) Temperature abs Tabs R (459.67) 460 460 460 460 460
Temp std Tstd R (527.67) 528 528 528 528 528 Conversion Factor F2 g/lb (should be
Pressure (std) Pstd in HG 29.92 29.92 29.92 29.92 29.92 MW of water MH20 lb/lbmole 18.015 18.015 18.015 18.015 18.015
Sample Volume Vmstd dscf
Sample Volume from meter Vm dcf Dry gas mtr cal factor Y no units Meter orifice pressure dH in H20
Dry gas meter temp Tm F Stack Gas Moisture Fraction Bws vol%/100 0.233 0.17 0.117 0.136 0.149 0.161 Saturation Moisture Fraction@STP SBws (sat vap press)/Ps same as BWS (because Bws>SBws)
Stack Gas Mole weight dry Md lb/lbmole 30.504 30.672 30.720 30.432 30.492 AVG
Oxygen conc in stack conc O2 %/100 0.059 0.045 0.041 0.065 0.06 0.054 CO2 conc in stack conc CO2 %/100 0.141 0.155 0.159 0.135 0.14
N2 conc in stack con N2 %/100 0.8 0.8 0.8 0.8 0.8 Stack Gas Mole weight wet Ms lb/lbmole 27.594 28.520 29.233 28.743 28.633 Stack Area A ft2 12.5664 12.5664 12.5664 12.5664 12.5664
Diameter of stack D inches 48 48 48 48 48 Conversion Factor F3 in/ft 12 12 12 12 12
Stack Gas Velocity Vs ft/sec 26.4993 15.9951 12.0162 11.9366 12.7324
Pitot tube constant Kp test Vs: Pitot tube calibration coef Cp Stack Gas Velocity Head dP in H20 Stack Gas Velocity Head dP^.5 AVG
Stack gas temp Ts F 144 133 126 121 129 130.6 flow check 19,980 12,060 9,060 9,000 9,600
Stack Ht Ht Ft
Actual Stack Gas Flow Rate Acf acfm 19980 12060 9060 9000 9600 11940 acfs 333 201 151 150 160
Converstion Factor F5 sec/min 60 60 60 60 60 AVG Dry std Stack gas flow rate Qstd dscfm 13,396 8,913 7,208 7,067 7,324 8,781 Dry std Stack gas flow rate Qstd dscf/hr 803,783 534,756 432,490 423,999 439,411
Conversion Factor F4 sec/hr 3600 3600 3600 3600 3600 Qstd dscf/min Isokinetic percent I %
sample nozzle cross section An ft2 length of sample test theta minutes
Mass of part: combined samples Mn mg
Mass of part: probe wash Mp mg Mass of part: filter Mf mg
AVG Unit Totals (tons per year) PM10 6 4 5 4 5 4.8 Unit Totals (tons per year) SO2 1 1 2 2 0 1.2 Unit Totals (tons per year) NOx 1 1 2 2 6 2.4
Facility Totals (tons per year) PM10 103 75 117 87 76 92 Facility Totals (tons per year) TSP 121 94 147 105 87 111 Facility Totals (tons per year) SO2 378 503 693 635 319 506 Facility Totals (tons per year) NOx 610 743 708 684 808 711

116
Facility Specific Operating and Emissions Data (Weyerhaeuser) Facility: Weyerhaeus
Weyerhaeus Weyerhaeus Weyerh Weyerhae Weyerhaeus
2003 2004 2005 2006 2007 2003-2007 Run ID or Unit ID: rf rf rf rf rf RF Avg Pressure (stack absolute) Ps in HG 29.92 29.92 29.92 29.92 29.92
Pressure (barometric) Pbar in HG Pressure (stack) Pa in H20
Conversion Factor F1 inH20/inHg
Total water condensed Vwstd scf H2) f scf H20/gm Total water condensed Vw std ft3
total impinger wt Impinger 1 Vi g Impinger 2 Vii g Impinger 3 Viii g Impinger 4 Viv g
Ideal gas constant R (inHG)(ft3)/(R-lbmol) Temperature abs Tabs R (459.67) 460 460 460 460 460
Temp std Tstd R (527.67) 528 528 528 528 528 Conversion Factor F2 g/lb (should be
Pressure (std) Pstd in HG 29.92 29.92 29.92 29.92 29.92 MW of water MH20 lb/lbmole 18.015 18.015 18.015 18.015 18.015
Sample Volume Vmstd dscf
Sample Volume from meter Vm dcf Dry gas mtr cal factor Y no units Meter orifice pressure dH in H20
Dry gas meter temp Tm F Stack Gas Moisture Fraction Bws vol%/100 0.29 0.28 0.26 0.28 0.2775 0.2775 Saturation Moisture Fraction@STP SBws (sat vap press)/Ps same as BWS (because Bws>SBws)
Stack Gas Mole weight dry Md lb/lbmole 30.372 30.492 30.312 30.504 30.420 AVG
Oxygen conc in stack conc O2 %/100 0.07 0.06 0.075 0.059 0.066 0.0660 CO2 conc in stack conc CO2 %/100 0.13 0.14 0.125 0.141 0.134
N2 conc in stack con N2 %/100 0.8 0.8 0.8 0.8 0.8 Stack Gas Mole weight wet Ms lb/lbmole Stack Area A ft2 153.9380 153.9380 153.9380 153.938
153.9380
Diameter of stack D inches 168 168 168 168 168 Conversion Factor F3 in/ft 12 12 12 12 12
Stack Gas Velocity Vs ft/sec 58.6859 55.4314 55.5613 63.3956 63.5300
Pitot tube constant Kp test Vs: Pitot tube calibration coef Cp Stack Gas Velocity Head dP in H20 Stack Gas Velocity Head dP^.5 AVG
Stack gas temp Ts F 362 357 373 387 388 373 flow check 542,040 511,980 513,180 585,540 586,781
Stack Ht Ht Ft
Actual Stack Gas Flow Rate Acf acfm 542040 511980 513180 585540 586800 547,908 acfs 9034 8533 8553 9759 9780
Converstion Factor F5 sec/min 60 60 60 60 60 AVG Dry std Stack gas flow rate Qstd dscfm 247,202 238,230 240,708 262,809 263,968 250,583 Dry std Stack gas flow rate Qstd dscf/hr 14,832,114 14,293,830 14,442,475 15,768,
15,838,10
Conversion Factor F4 sec/hr 3600 3600 3600 3600 3600 Qstd dscf/min Isokinetic percent I %
sample nozzle cross section An ft2 length of sample test theta minutes
Mass of part: combined samples Mn mg
Mass of part: probe wash Mp mg Mass of part: filter Mf mg
AVG Unit Totals (tons per year) PM10 50 45 32 50 40 43 Unit Totals (tons per year) SO2 26 20 50 42 38 35 Unit Totals (tons per year) NOx 627 541 483 601 666 584
Facility Totals (tons per year) PM10 279 196 173 191 89 186 Facility Totals (tons per year) TSP 375 278 244 211 na 277 Facility Totals (tons per year) SO2 967 1047 854 719 775 872 Facility Totals (tons per year) NOx 2487 2069 1959 2057 2630 2,240

117
Facility Specific Operating and Emissions Data (Weyerhaeuser - Continued) Facility: Weyerhaeus Weyerhaeus Weyerhaeus Weyerh Weyerhae Weyerhaeus 2003 2004 2005 2006 2007 2003-2007 Run ID or Unit ID: lk lk lk lk lk LK Avg Pressure (stack absolute) Ps in HG 29.92 29.92 29.92 29.92 29.92
Pressure (barometric) Pbar in HG Pressure (stack) Pa in H20
Conversion Factor F1 inH20/inHg
Total water condensed Vwstd scf H2) f scf H20/gm Total water condensed Vw std ft3
total impinger wt Impinger 1 Vi g Impinger 2 Vii g Impinger 3 Viii g Impinger 4 Viv g
Ideal gas constant R (inHG)(ft3)/(R-lbmol) Temperature abs Tabs R (459.67) 460 460 460 460 460
Temp std Tstd R (527.67) 528 528 528 528 528 Conversion Factor F2 g/lb (should be
Pressure (std) Pstd in HG 29.92 29.92 29.92 29.92 29.92 MW of water MH20 lb/lbmole 18.015 18.015 18.015 18.015 18.015
Sample Volume Vmstd dscf
Sample Volume from meter Vm dcf Dry gas mtr cal factor Y no units Meter orifice pressure dH in H20
Dry gas meter temp Tm F Stack Gas Moisture Fraction Bws vol%/100 0.29 0.3 0.3 0.31 0.3 0.3 Saturation Moisture Fraction@STP SBws (sat vap press)/Ps same as BWS (because Bws>SBws)
Stack Gas Mole weight dry Md lb/lbmole 30.252 30.252 30.011 30.252 30.191 AVG
Oxygen conc in stack conc O2 %/100 0.08 0.08 0.1 0.08 0.085 0.0850 CO2 conc in stack conc CO2 %/100 0.12 0.12 0.1 0.12 0.115
N2 conc in stack con N2 %/100 0.8 0.8 0.8 0.8 0.8 Stack Gas Mole weight wet Ms lb/lbmole Stack Area A ft2 12.5664 12.5664 12.5664 12.5664 12.5664
Diameter of stack D inches 48 48 48 48 48 Conversion Factor F3 in/ft 12 12 12 12 12
Stack Gas Velocity Vs ft/sec 41.1416 94.2993 67.8000 74.3254 75.6000
Pitot tube constant Kp test Vs: Pitot tube calibration coef Cp Stack Gas Velocity Head dP in H20 Stack Gas Velocity Head dP^.5 AVG
Stack gas temp Ts F 388 396 380 390 391 389 flow check 31,020 71,100 51,120 56,040 57,001
Stack Ht Ht Ft
Actual Stack Gas Flow Rate Acf acfm 31020 71100 51120 56040 57000 53,256 acfs 517 1185 852 934 950
Converstion Factor F5 sec/min 60 60 60 60 60 AVG Dry std Stack gas flow rate Qstd dscfm 13,713 30,699 22,493 24,019 24,756 23,136 Dry std Stack gas flow rate Qstd dscf/hr 822,791 1,841,955 1,349,568 1,441,1
1,485,377
Conversion Factor F4 sec/hr 3600 3600 3600 3600 3600 Qstd dscf/min Isokinetic percent I %
sample nozzle cross section An ft2 length of sample test theta minutes
Mass of part: combined samples Mn mg
Mass of part: probe wash Mp mg Mass of part: filter Mf mg
AVG Unit Totals (tons per year) PM10 88 2 1 9 1 20 Unit Totals (tons per year) SO2 3 4 12 7 4 6 Unit Totals (tons per year) NOx 104 100 158 147 135 129
Facility Totals (tons per year) PM10 279 196 173 191 89 186 Facility Totals (tons per year) TSP 375 278 244 211 na 277 Facility Totals (tons per year) SO2 967 1047 854 719 775 872 Facility Totals (tons per year) NOx 2487 2069 1959 2057 2630 2,240
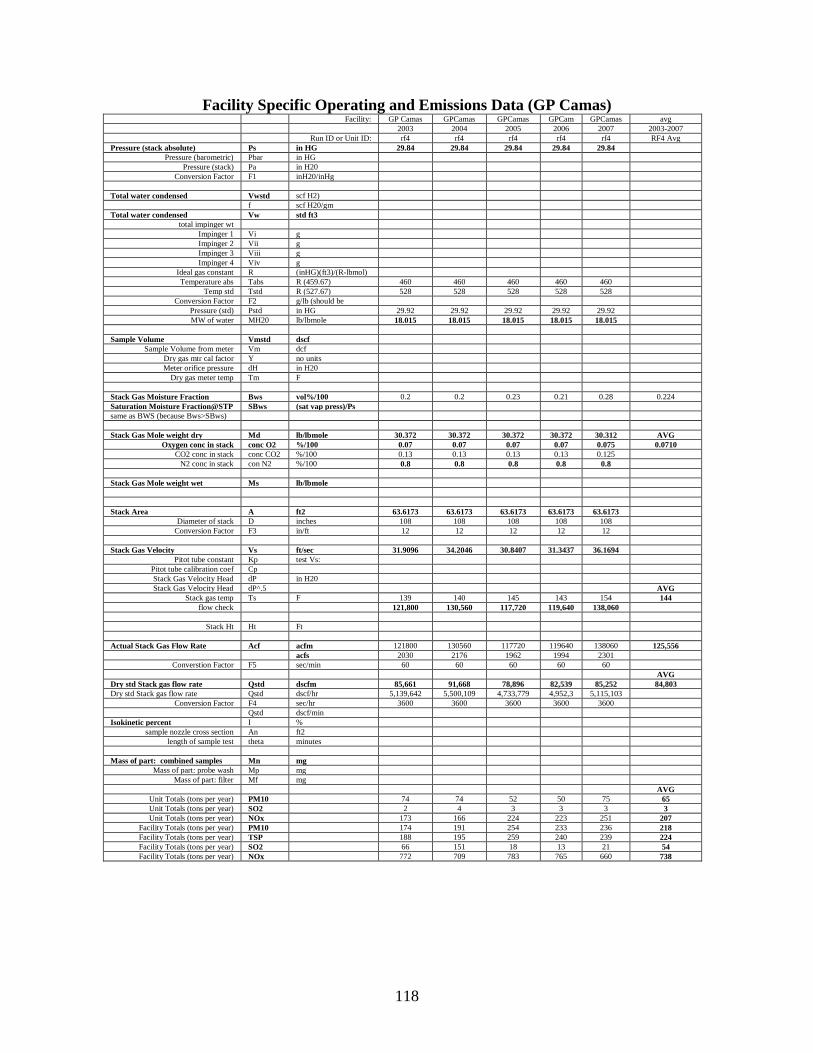
118
Facility Specific Operating and Emissions Data (GP Camas) Facility: GP Camas GPCamas GPCamas GPCam
GPCamas avg
2003 2004 2005 2006 2007 2003-2007 Run ID or Unit ID: rf4 rf4 rf4 rf4 rf4 RF4 Avg Pressure (stack absolute) Ps in HG 29.84 29.84 29.84 29.84 29.84
Pressure (barometric) Pbar in HG Pressure (stack) Pa in H20
Conversion Factor F1 inH20/inHg
Total water condensed Vwstd scf H2) f scf H20/gm Total water condensed Vw std ft3
total impinger wt Impinger 1 Vi g Impinger 2 Vii g Impinger 3 Viii g Impinger 4 Viv g
Ideal gas constant R (inHG)(ft3)/(R-lbmol) Temperature abs Tabs R (459.67) 460 460 460 460 460
Temp std Tstd R (527.67) 528 528 528 528 528 Conversion Factor F2 g/lb (should be
Pressure (std) Pstd in HG 29.92 29.92 29.92 29.92 29.92 MW of water MH20 lb/lbmole 18.015 18.015 18.015 18.015 18.015
Sample Volume Vmstd dscf
Sample Volume from meter Vm dcf Dry gas mtr cal factor Y no units Meter orifice pressure dH in H20
Dry gas meter temp Tm F Stack Gas Moisture Fraction Bws vol%/100 0.2 0.2 0.23 0.21 0.28 0.224 Saturation Moisture Fraction@STP SBws (sat vap press)/Ps same as BWS (because Bws>SBws)
Stack Gas Mole weight dry Md lb/lbmole 30.372 30.372 30.372 30.372 30.312 AVG
Oxygen conc in stack conc O2 %/100 0.07 0.07 0.07 0.07 0.075 0.0710 CO2 conc in stack conc CO2 %/100 0.13 0.13 0.13 0.13 0.125
N2 conc in stack con N2 %/100 0.8 0.8 0.8 0.8 0.8 Stack Gas Mole weight wet Ms lb/lbmole Stack Area A ft2 63.6173 63.6173 63.6173 63.6173 63.6173
Diameter of stack D inches 108 108 108 108 108 Conversion Factor F3 in/ft 12 12 12 12 12
Stack Gas Velocity Vs ft/sec 31.9096 34.2046 30.8407 31.3437 36.1694
Pitot tube constant Kp test Vs: Pitot tube calibration coef Cp Stack Gas Velocity Head dP in H20 Stack Gas Velocity Head dP^.5 AVG
Stack gas temp Ts F 139 140 145 143 154 144 flow check 121,800 130,560 117,720 119,640 138,060
Stack Ht Ht Ft
Actual Stack Gas Flow Rate Acf acfm 121800 130560 117720 119640 138060 125,556 acfs 2030 2176 1962 1994 2301
Converstion Factor F5 sec/min 60 60 60 60 60 AVG Dry std Stack gas flow rate Qstd dscfm 85,661 91,668 78,896 82,539 85,252 84,803 Dry std Stack gas flow rate Qstd dscf/hr 5,139,642 5,500,109 4,733,779 4,952,3
5,115,103
Conversion Factor F4 sec/hr 3600 3600 3600 3600 3600 Qstd dscf/min Isokinetic percent I %
sample nozzle cross section An ft2 length of sample test theta minutes
Mass of part: combined samples Mn mg
Mass of part: probe wash Mp mg Mass of part: filter Mf mg
AVG Unit Totals (tons per year) PM10 74 74 52 50 75 65 Unit Totals (tons per year) SO2 2 4 3 3 3 3 Unit Totals (tons per year) NOx 173 166 224 223 251 207
Facility Totals (tons per year) PM10 174 191 254 233 236 218 Facility Totals (tons per year) TSP 188 195 259 240 239 224 Facility Totals (tons per year) SO2 66 151 18 13 21 54 Facility Totals (tons per year) NOx 772 709 783 765 660 738

119
Facility Specific Operating and Emissions Data (GP Camas - Continued) Facility: GP Camas GP Camas GP Camas GPCam
GPCamas avg
2003 2004 2005 2006 2007 2003-2007 Run ID or Unit ID: rf3 rf3 rf3 rf3 rf3 RF3 Avg Pressure (stack absolute) Ps in HG 29.84 29.84 29.84 29.84 29.84
Pressure (barometric) Pbar in HG Pressure (stack) Pa in H20
Conversion Factor F1 inH20/inHg
Total water condensed Vwstd scf H2) f scf H20/gm Total water condensed Vw std ft3
total impinger wt Impinger 1 Vi g Impinger 2 Vii g Impinger 3 Viii g Impinger 4 Viv g
Ideal gas constant R (inHG)(ft3)/(R-lbmol) Temperature abs Tabs R (459.67) 460 460 460 460 460
Temp std Tstd R (527.67) 528 528 528 528 528 Conversion Factor F2 g/lb (should be
Pressure (std) Pstd in HG 29.92 29.92 29.92 29.92 29.92 MW of water MH20 lb/lbmole 18.015 18.015 18.015 18.015 18.015
Sample Volume Vmstd dscf
Sample Volume from meter Vm dcf Dry gas mtr cal factor Y no units Meter orifice pressure dH in H20
Dry gas meter temp Tm F Stack Gas Moisture Fraction Bws vol%/100 0.22 0.18 0.21 0.2 0.19 0.2 Saturation Moisture Fraction@STP SBws (sat vap press)/Ps same as BWS (because Bws>SBws)
avg of
Stack Gas Mole weight dry Md lb/lbmole 30.504 30.492 30.492 30.492 30.540 AVG Oxygen conc in stack conc O2 %/100 na 0.06 0.06 0.06 0.056 0.0590
CO2 conc in stack conc CO2 %/100 na 0.14 0.14 0.14 0.144 N2 conc in stack con N2 %/100 0.8 0.8 0.8 0.8 0.8
Stack Gas Mole weight wet Ms lb/lbmole Stack Area A ft2 63.6173 63.6173 63.6173 63.6173 63.6173
Diameter of stack D inches 108 108 108 108 108 Conversion Factor F3 in/ft 12 12 12 12 12
Stack Gas Velocity Vs ft/sec 22.1638 25.3076 19.8531 19.5702 19.1300
Pitot tube constant Kp test Vs: Pitot tube calibration coef Cp Stack Gas Velocity Head dP in H20 Stack Gas Velocity Head dP^.5 AVG
Stack gas temp Ts F 143 136 144 141 137 140 flow check 84,600 96,600 75,780 74,700 73,020
Stack Ht Ht Ft
Actual Stack Gas Flow Rate Acf acfm 84600 96600 75780 74700 73020 80,940 acfs 1410 1610 1263 1245 1217
Converstion Factor F5 sec/min 60 60 60 60 60 AVG Dry std Stack gas flow rate Qstd dscfm 57,626 69,987 52,193 52,361 52,170 56,867 Dry std Stack gas flow rate Qstd dscf/hr 3,457,563 4,199,205 3,131,606 3,141,6
3,130,220
Conversion Factor F4 sec/hr 3600 3600 3600 3600 3600 Qstd dscf/min Isokinetic percent I %
sample nozzle cross section An ft2 length of sample test theta minutes
Mass of part: combined samples Mn mg
Mass of part: probe wash Mp mg Mass of part: filter Mf mg
AVG Unit Totals (tons per year) PM10 8 8 9 5 3 7 Unit Totals (tons per year) SO2 2 2 3 2 2 2 Unit Totals (tons per year) NOx 138 140 157 102 58 119
Facility Totals (tons per year) PM10 174 191 254 233 236 218 Facility Totals (tons per year) TSP 188 195 259 240 239 224 Facility Totals (tons per year) SO2 66 151 18 13 21 54 Facility Totals (tons per year) NOx 772 709 783 765 660 738

120
Facility Specific Operating and Emissions Data (GP Camas - Continued) Facility: GP Camas GP Camas GP Camas GPCam
GPCamas avg
2003 2004 2005 2006 2007 2003-2007 Run ID or Unit ID: lk lk lk lk lk LK Avg Pressure (stack absolute) Ps in HG 29.84 29.84 29.84 29.84 29.84
Pressure (barometric) Pbar in HG Pressure (stack) Pa in H20
Conversion Factor F1 inH20/inHg
Total water condensed Vwstd scf H2) f scf H20/gm Total water condensed Vw std ft3
total impinger wt Impinger 1 Vi g Impinger 2 Vii g Impinger 3 Viii g Impinger 4 Viv g
Ideal gas constant R (inHG)(ft3)/(R-lbmol) Temperature abs Tabs R (459.67) 460 460 460 460 460
Temp std Tstd R (527.67) 528 528 528 528 528 Conversion Factor F2 g/lb (should be
Pressure (std) Pstd in HG 29.92 29.92 29.92 29.92 29.92 MW of water MH20 lb/lbmole 18.015 18.015 18.015 18.015 18.015
Sample Volume Vmstd dscf
Sample Volume from meter Vm dcf Dry gas mtr cal factor Y no units Meter orifice pressure dH in H20
Dry gas meter temp Tm F Stack Gas Moisture Fraction Bws vol%/100 0.35 0.32 0.39 0.4 0.41 0.374 Saturation Moisture Fraction@STP SBws (sat vap press)/Ps same as BWS (because Bws>SBws)
Stack Gas Mole weight dry Md lb/lbmole 30.732 30.852 30.852 30.852 30.996 AVG
Oxygen conc in stack conc O2 %/100 0.04 0.03 0.03 0.03 0.018 0.0296 CO2 conc in stack conc CO2 %/100 0.16 0.17 0.17 0.17 0.182
N2 conc in stack con N2 %/100 0.8 0.8 0.8 0.8 0.8 Stack Gas Mole weight wet Ms lb/lbmole Stack Area A ft2 19.6350 19.6350 19.6350 19.6350 19.6350
Diameter of stack D inches 60 60 60 60 60 Conversion Factor F3 in/ft 12 12 12 12 12
Stack Gas Velocity Vs ft/sec 9.7276 11.0517 9.4729 7.7413 5.8569
Pitot tube constant Kp test Vs: Pitot tube calibration coef Cp Stack Gas Velocity Head dP in H20 Stack Gas Velocity Head dP^.5 AVG
Stack gas temp Ts F 149 150 160 159 158 155 flow check 11,460 13,020 11,160 9,120 6,900
Stack Ht Ht Ft
Actual Stack Gas Flow Rate Acf acfm 11460 13020 11160 9120 6900 10,332 acfs 191 217 186 152 115
Converstion Factor F5 sec/min 60 60 60 60 60 AVG Dry std Stack gas flow rate Qstd dscfm 6,441 7,643 5,782 4,655 3,469 5,598 Dry std Stack gas flow rate Qstd dscf/hr 386,459 458,577 346,916 279,304 208,130
Conversion Factor F4 sec/hr 3600 3600 3600 3600 3600 Qstd dscf/min Isokinetic percent I %
sample nozzle cross section An ft2 length of sample test theta minutes
Mass of part: combined samples Mn mg
Mass of part: probe wash Mp mg Mass of part: filter Mf mg
AVG Unit Totals (tons per year) PM10 17 15 18 8 8 13 Unit Totals (tons per year) SO2 0 1 1 1 1 1 Unit Totals (tons per year) NOx 83 77 150 132 79 104
Facility Totals (tons per year) PM10 174 191 254 233 236 218 Facility Totals (tons per year) TSP 188 195 259 240 239 224 Facility Totals (tons per year) SO2 66 151 18 13 21 54 Facility Totals (tons per year) NOx 772 709 783 765 660 738

121
Facility Specific Operating and Emissions Data (KapStone) Facility: KaptS KaptSto KaptSto KaptStone KaptStone KaptStone KaptSton KaptSton 2005 2006 2007 2008 2009 2010 2011 2005-
Run ID or Unit ID: rf 18 rf 18 rf 18 rf 18 rf 18 rf 18 rf 18 RF 18 avg Pressure (stack absolute) Ps in HG 29.92 29.92 29.92 29.92 29.92 29.92 29.92
Pressure (barometric) Pbar in HG Pressure (stack) Pa in H20
Conversion Factor F1 inH20/inHg
Total water condensed Vwst
scf H2) f scf H20/gm Total water condensed Vw std ft3
total impinger wt Impinger 1 Vi g Impinger 2 Vii g Impinger 3 Viii g Impinger 4 Viv g
Ideal gas constant R (inHG)(ft3)/(R-lbmol) Temperature abs Tabs R (459.67) 460 460 460 460 460 460 460
Temp std Tstd R (527.67) 528 528 528 528 528 528 528 Conversion Factor F2 g/lb (should be
Pressure (std) Pstd in HG 29.92 29.92 29.92 29.92 29.92 29.92 29.92 MW of water MH20 lb/lbmole 18.01
18.015 18.015 18.015 18.015 18.015 18.015
Sample Volume Vmst
dscf
Sample Volume from meter Vm dcf Dry gas mtr cal factor Y no units Meter orifice pressure dH in H20
Dry gas meter temp Tm F Stack Gas Moisture Fraction Bws vol%/100 0.254 0.283 0.312 0.271 na 0.244 0.255 0.26983 Saturation Moisture
SBws (sat vap press)/Ps
same as BWS (because
Stack Gas Mole weight dry Md lb/lbmole 30.19
30.215 30.155 30.095 30.011 30.071 AVG
Oxygen conc in stack conc
%/100 0.085 0.083 0.088 0.093 na 0.1 0.095 0.0907 CO2 conc in stack conc
%/100 0.115 0.117 0.112 0.107 0.1 0.105
N2 conc in stack con
%/100 0.8 0.8 0.8 0.8 0.8 0.8 0.8 Stack Gas Mole weight wet Ms lb/lbmole Stack Area A ft2 103.8
103.868
103.868
103.8689 103.8689 103.8689
Diameter of stack D inches 138 138 138 138 138 138 138 Conversion Factor F3 in/ft 12 12 12 12 12 12 12
Stack Gas Velocity Vs ft/sec 44.08
44.4118 41.1576 49.6395 48.8789 44.9028
Pitot tube constant Kp test Vs: Pitot tube calibration coef Cp Stack Gas Velocity Head dP in H20 Stack Gas Velocity Head dP^.5 AVG
Stack gas temp Ts F 243 256 244 247 na 206 237 239 flow check 274,7
276,780 256,500 309,360 304,620 279,840
Stack Ht Ht Ft 214
Actual Stack Gas Flow Rate Acf acfm 27474
276780 256500 309360 na 304620 279840 283,640
acfs 4579 4613 4275 5156 na 5077 4664 Converstion Factor F5 sec/min 60 60 60 60 60 60 60
AVG Dry std Stack gas flow rate Qstd dscfm 153,9
146,344 132,354 168,425 na 182,574 157,931 156,927
Dry std Stack gas flow rate Qstd dscf/hr 9,236,
8,780,6
7,941,2
10,105,492 na 10,954,465 9,475,856 Conversion Factor F4 sec/hr 3600 3600 3600 3600 3600 3600 3600
Qstd dscf/min Isokinetic percent I %
sample nozzle cross section An ft2 length of sample test theta minutes
Mass of part: combined
Mn mg
Mass of part: probe wash Mp mg Mass of part: filter Mf mg
AVG Unit Totals (tons per year) PM10 3 2 3 6 na 4 6 4 Unit Totals (tons per year) SO2 17 12 10 9 na 12 13 12 Unit Totals (tons per year) NOx 125 132 159 141 na 72 132 127
Facility Totals (tons per year) PM10 163 121 114 76 81 87 81 103 Facility Totals (tons per year) TSP 176 132 119 81 86 91 85 110 Facility Totals (tons per year) SO2 239 274 275 281 201 239 202 244 Facility Totals (tons per year) NOx 1493 1541 1488 1440 1164 1301 1372 1,400

122
Facility Specific Operating and Emissions Data (KapStone - Continued) Facility: KaptS KaptSto KaptSto KaptStone KaptStone KaptStone KaptSton KaptSton 2005 2006 2007 2008 2009 2010 2011 2005-
Run ID or Unit ID: rf19 rf19 rf19 rf19 rf19 rf19 rf19 RF 19 avg Pressure (stack absolute) Ps in HG 29.92 29.92 29.92 29.92 29.92 29.92 29.92
Pressure (barometric) Pbar in HG Pressure (stack) Pa in H20
Conversion Factor F1 inH20/inHg
Total water condensed Vwst
scf H2) f scf H20/gm Total water condensed Vw std ft3
total impinger wt Impinger 1 Vi g Impinger 2 Vii g Impinger 3 Viii g Impinger 4 Viv g
Ideal gas constant R (inHG)(ft3)/(R-lbmol) Temperature abs Tabs R (459.67) 460 460 460 460 460 460 460
Temp std Tstd R (527.67) 528 528 528 528 528 528 528 Conversion Factor F2 g/lb (should be
Pressure (std) Pstd in HG 29.92 29.92 29.92 29.92 29.92 29.92 29.92 MW of water MH20 lb/lbmole 18.01
18.015 18.015 18.015 18.015 18.015 18.015
Sample Volume Vmst
dscf
Sample Volume from meter Vm dcf Dry gas mtr cal factor Y no units Meter orifice pressure dH in H20
Dry gas meter temp Tm F Stack Gas Moisture Fraction Bws vol%/100 0.287 0.287 0.281 0.297 0.265 0.249 0.265 0.27586 Saturation Moisture
SBws (sat vap press)/Ps
same as BWS (because
Stack Gas Mole weight dry Md lb/lbmole 30.31
30.312 30.240 30.215 30.131 30.095 30.095 AVG
Oxygen conc in stack conc
%/100 0.075 0.075 0.081 0.083 0.09 0.093 0.093 0.0843 CO2 conc in stack conc
%/100 0.125 0.125 0.119 0.117 0.11 0.107 0.107
N2 conc in stack con
%/100 0.8 0.8 0.8 0.8 0.8 0.8 0.8 Stack Gas Mole weight wet Ms lb/lbmole Stack Area A ft2 143.1
143.138
143.138
143.1388 143.1388 143.1388 143.1388
Diameter of stack D inches 162 162 162 162 162 162 162 Conversion Factor F3 in/ft 12 12 12 12 12 12 12
Stack Gas Velocity Vs ft/sec 36.85
37.2436 39.8424 45.4664 40.6598 42.6858 41.4982
Pitot tube constant Kp test Vs: Pitot tube calibration coef Cp Stack Gas Velocity Head dP in H20 Stack Gas Velocity Head dP^.5 AVG
Stack gas temp Ts F 246 247 251 253 242 255 229 246 flow check 316,5
319,860 342,180 390,480 349,200 366,600 356,400
Stack Ht Ht Ft 198
Actual Stack Gas Flow Rate Acf acfm 31650
319860 342180 390480 349200 366600 356400 348,746
acfs 5275 5331 5703 6508 5820 6110 5940 Converstion Factor F5 sec/min 60 60 60 60 60 60 60
AVG Dry std Stack gas flow rate Qstd dscfm 168,7
170,319 182,704 203,282 193,045 203,311 200,743 188,882
Dry std Stack gas flow rate Qstd dscf/hr 10,12
10,219,
10,962,
12,196,908 11,582,695 12,198,643 12,044,56
Conversion Factor F4 sec/hr 3600 3600 3600 3600 3600 3600 3600
Qstd dscf/min Isokinetic percent I %
sample nozzle cross section An ft2 length of sample test theta minutes
Mass of part: combined
Mn mg
Mass of part: probe wash Mp mg Mass of part: filter Mf mg
AVG Unit Totals (tons per year) PM10 10 33 13 6 16 11 6 14 Unit Totals (tons per year) SO2 9 15 6 20 41 20 14 18 Unit Totals (tons per year) NOx 302 182 137 61 172 182 173 173
Facility Totals (tons per year) PM10 163 121 114 76 81 87 81 103 Facility Totals (tons per year) TSP 176 132 119 81 86 91 85 110 Facility Totals (tons per year) SO2 239 274 275 281 201 239 202 244 Facility Totals (tons per year) NOx 1493 1541 1488 1440 1164 1301 1372 1,400

123
Facility Specific Operating and Emissions Data (KapStone - Continued) Facility: KaptS KaptSto KaptSto KaptStone KaptStone KaptStone KaptSton KaptSton 2005 2006 2007 2008 2009 2010 2011 2005-
Run ID or Unit ID: rf22 rf22 rf22 rf22 rf22 rf22 rf22 RF 22 avg Pressure (stack absolute) Ps in HG 29.92 29.92 29.92 29.92 29.92 29.92 29.92
Pressure (barometric) Pbar in HG Pressure (stack) Pa in H20
Conversion Factor F1 inH20/inHg
Total water condensed Vwst
scf H2) f scf H20/gm Total water condensed Vw std ft3
total impinger wt Impinger 1 Vi g Impinger 2 Vii g Impinger 3 Viii g Impinger 4 Viv g
Ideal gas constant R (inHG)(ft3)/(R-lbmol) Temperature abs Tabs R (459.67) 460 460 460 460 460 460 460
Temp std Tstd R (527.67) 528 528 528 528 528 528 528 Conversion Factor F2 g/lb (should be
Pressure (std) Pstd in HG 29.92 29.92 29.92 29.92 29.92 29.92 29.92 MW of water MH20 lb/lbmole 18.01
18.015 18.015 18.015 18.015 18.015 18.015
Sample Volume Vmst
dscf
Sample Volume from meter Vm dcf Dry gas mtr cal factor Y no units Meter orifice pressure dH in H20
Dry gas meter temp Tm F Stack Gas Moisture Fraction Bws vol%/100 0.242 0.218 0.223 0.211 0.21 0.226 0.203 0.219 Saturation Moisture
SBws (sat vap press)/Ps
same as BWS (because
Stack Gas Mole weight dry Md lb/lbmole 30.45
30.360 30.276 30.372 30.468 30.480 30.348 AVG
Oxygen conc in stack conc
%/100 0.063 0.071 0.078 0.07 0.062 0.061 0.072 0.0681 CO2 conc in stack conc
%/100 0.137 0.129 0.122 0.13 0.138 0.139 0.128
N2 conc in stack con
%/100 0.8 0.8 0.8 0.8 0.8 0.8 0.8 Stack Gas Mole weight wet Ms lb/lbmole Stack Area A ft2 103.8
103.868
103.868
103.8689 103.8689 103.8689 103.8689
Diameter of stack D inches 138 138 138 138 138 138 138 Conversion Factor F3 in/ft 12 12 12 12 12 12 12
Stack Gas Velocity Vs ft/sec 47.82
43.3335 47.6273 46.1736 50.7563 44.1518 47.3674
Pitot tube constant Kp test Vs: Pitot tube calibration coef Cp Stack Gas Velocity Head dP in H20 Stack Gas Velocity Head dP^.5 AVG
Stack gas temp Ts F 271 267 264 281 291 572 341 327 flow check 298,0
270,060 296,820 287,760 316,320 275,160 295,200
Stack Ht Ht Ft 246
Actual Stack Gas Flow Rate Acf acfm 29808
270060 296820 287760 316320 275160 295200 291,343
acfs 4968 4501 4947 4796 5272 4586 4920 Converstion Factor F5 sec/min 60 60 60 60 60 60 60
AVG Dry std Stack gas flow rate Qstd dscfm 163,1
153,379 168,194 161,779 175,690 108,963 155,087 155,185
Dry std Stack gas flow rate Qstd dscf/hr 9,791,
9,202,7
10,091,
9,706,762 10,541,417 6,537,802 9,305,235 Conversion Factor F4 sec/hr 3600 3600 3600 3600 3600 3600 3600
Qstd dscf/min Isokinetic percent I %
sample nozzle cross section An ft2 length of sample test theta minutes
Mass of part: combined
Mn mg
Mass of part: probe wash Mp mg Mass of part: filter Mf mg
AVG Unit Totals (tons per year) PM10 11 4 5 8 13 8 5 8 Unit Totals (tons per year) SO2 58 53 47 60 48 87 66 60 Unit Totals (tons per year) NOx 245 242 251 274 280 297 288 268
Facility Totals (tons per year) PM10 163 121 114 76 81 87 81 103 Facility Totals (tons per year) TSP 176 132 119 81 86 91 85 110 Facility Totals (tons per year) SO2 239 274 275 281 201 239 202 244 Facility Totals (tons per year) NOx 1493 1541 1488 1440 1164 1301 1372 1,400

124
Facility Specific Operating and Emissions Data (KapStone - Continued) Facility: KaptS KaptSto KaptSto KaptStone KaptStone KaptStone KaptSton KaptSton 2005 2006 2007 2008 2009 2010 2011 2005-
Run ID or Unit ID: lk3 lk3 lk3 lk3 lk3 lk3 lk3 LK 3 avg Pressure (stack absolute) Ps in HG 29.92 29.92 29.92 29.92 29.92 29.92 29.92
Pressure (barometric) Pbar in HG Pressure (stack) Pa in H20
Conversion Factor F1 inH20/inHg
Total water condensed Vwst
scf H2) f scf H20/gm Total water condensed Vw std ft3
total impinger wt Impinger 1 Vi g Impinger 2 Vii g Impinger 3 Viii g Impinger 4 Viv g
Ideal gas constant R (inHG)(ft3)/(R-lbmol) Temperature abs Tabs R (459.67) 460 460 460 460 460 460 460
Temp std Tstd R (527.67) 528 528 528 528 528 528 528 Conversion Factor F2 g/lb (should be
Pressure (std) Pstd in HG 29.92 29.92 29.92 29.92 29.92 29.92 29.92 MW of water MH20 lb/lbmole 18.01
18.015 18.015 18.015 18.015 18.015 18.015
Sample Volume Vmst
dscf
Sample Volume from meter Vm dcf Dry gas mtr cal factor Y no units Meter orifice pressure dH in H20
Dry gas meter temp Tm F Stack Gas Moisture Fraction Bws vol%/100 0.252 0.265 0.296 0.273 0.256 0.165 0.221 0.2469 Saturation Moisture
SBws (sat vap press)/Ps
same as BWS (because
Stack Gas Mole weight dry Md lb/lbmole 30.11
30.360 30.360 30.179 29.867 29.963 30.107 AVG
Oxygen conc in stack conc
%/100 0.091 0.071 0.071 0.086 0.112 0.104 0.092 0.0896 CO2 conc in stack conc
%/100 0.109 0.129 0.129 0.114 0.088 0.096 0.108
N2 conc in stack con
%/100 0.8 0.8 0.8 0.8 0.8 0.8 0.8 Stack Gas Mole weight wet Ms lb/lbmole Stack Area A ft2 28.27
28.2743 28.2743 28.2743 28.2743 28.2743 28.2743
Diameter of stack D inches 72 72 72 72 72 72 72 Conversion Factor F3 in/ft 12 12 12 12 12 12 12
Stack Gas Velocity Vs ft/sec 14.96
10.9640 12.3080 12.5202 14.1117 13.0507 11.3884
Pitot tube constant Kp test Vs: Pitot tube calibration coef Cp Stack Gas Velocity Head dP in H20 Stack Gas Velocity Head dP^.5 AVG
Stack gas temp Ts F 149 148 155 153 151 135 148 148 flow check 25,38
18,600 20,880 21,240 23,940 22,140 19,320
Stack Ht Ht Ft
Actual Stack Gas Flow Rate Acf acfm 25380 18600 20880 21240 23940 22140 19320 21,643 acfs 423 310 348 354 399 369 322
Converstion Factor F5 sec/min 60 60 60 60 60 60 60 AVG Dry std Stack gas flow rate Qstd dscfm 16,45
11,872 12,620 13,300 15,392 16,405 13,070 14,160
Dry std Stack gas flow rate Qstd dscf/hr 987,5
712,331 757,205 798,020 923,509 984,311 784,199 Conversion Factor F4 sec/hr 3600 3600 3600 3600 3600 3600 3600
Qstd dscf/min Isokinetic percent I %
sample nozzle cross section An ft2 length of sample test theta minutes
Mass of part: combined
Mn mg
Mass of part: probe wash Mp mg Mass of part: filter Mf mg
AVG Unit Totals (tons per year) PM10 13 2 2 3 2 2 0 3 Unit Totals (tons per year) SO2 1 1 0 0 0 0 0 0 Unit Totals (tons per year) NOx 54 56 12 21 12 8 3 24
Facility Totals (tons per year) PM10 163 121 114 76 81 87 81 103 Facility Totals (tons per year) TSP 176 132 119 81 86 91 85 110 Facility Totals (tons per year) SO2 239 274 275 281 201 239 202 244 Facility Totals (tons per year) NOx 1493 1541 1488 1440 1164 1301 1372 1,400

125
Facility Specific Operating and Emissions Data (KapStone - Continued) Facility: KaptS KaptSto KaptSto KaptStone KaptStone KaptStone KaptSton KaptSton 2005 2006 2007 2008 2009 2010 2011 2005-
Run ID or Unit ID: lk4 lk4 lk4 lk4 lk4 lk4 lk4 LK 4 avg Pressure (stack absolute) Ps in HG 29.92 29.92 29.92 29.92 29.92 29.92 29.92
Pressure (barometric) Pbar in HG Pressure (stack) Pa in H20
Conversion Factor F1 inH20/inHg
Total water condensed Vwst
scf H2) f scf H20/gm Total water condensed Vw std ft3
total impinger wt Impinger 1 Vi g Impinger 2 Vii g Impinger 3 Viii g Impinger 4 Viv g
Ideal gas constant R (inHG)(ft3)/(R-lbmol) Temperature abs Tabs R (459.67) 460 460 460 460 460 460 460
Temp std Tstd R (527.67) 528 528 528 528 528 528 528 Conversion Factor F2 g/lb (should be
Pressure (std) Pstd in HG 29.92 29.92 29.92 29.92 29.92 29.92 29.92 MW of water MH20 lb/lbmole 18.01
18.015 18.015 18.015 18.015 18.015 18.015
Sample Volume Vmst
dscf
Sample Volume from meter Vm dcf Dry gas mtr cal factor Y no units Meter orifice pressure dH in H20
Dry gas meter temp Tm F Stack Gas Moisture Fraction Bws vol%/100 0.243 0.226 0.225 0.224 0.148 0.209 0.186 0.2087 Saturation Moisture
SBws (sat vap press)/Ps
same as BWS (because
Stack Gas Mole weight dry Md lb/lbmole 30.67
30.552 30.504 30.576 30.360 30.540 30.660 AVG
Oxygen conc in stack conc
%/100 0.045 0.055 0.059 0.053 0.071 0.056 0.046 0.0550 CO2 conc in stack conc
%/100 0.155 0.145 0.141 0.147 0.129 0.144 0.154
N2 conc in stack con
%/100 0.8 0.8 0.8 0.8 0.8 0.8 0.8 Stack Gas Mole weight wet Ms lb/lbmole Stack Area A ft2 38.48
38.4845 38.4845 38.4845 38.4845 38.4845 38.4845
Diameter of stack D inches 84 84 84 84 84 84 84 Conversion Factor F3 in/ft 12 12 12 12 12 12 12
Stack Gas Velocity Vs ft/sec 8.938
8.0292 9.0166 9.3804 8.7048 8.8347 8.2111
Pitot tube constant Kp test Vs: Pitot tube calibration coef Cp Stack Gas Velocity Head dP in H20 Stack Gas Velocity Head dP^.5 AVG
Stack gas temp Ts F 140 141 140 140 124 139 136 137 flow check 20,64
18,540 20,820 21,660 20,100 20,400 18,960
Stack Ht Ht Ft
Actual Stack Gas Flow Rate Acf acfm 20640 18540 20820 21660 20100 20400 18960 20,160 acfs 344 309 347 361 335 340 316
Converstion Factor F5 sec/min 60 60 60 60 60 60 60 AVG Dry std Stack gas flow rate Qstd dscfm 13,75
12,607 14,199 14,791 15,483 14,224 13,673 14,104
Dry std Stack gas flow rate Qstd dscf/hr 824,9
756,417 851,954 887,471 928,983 853,424 820,355 Conversion Factor F4 sec/hr 3600 3600 3600 3600 3600 3600 3600
Qstd dscf/min Isokinetic percent I %
sample nozzle cross section An ft2 length of sample test theta minutes
Mass of part: combined
Mn mg
Mass of part: probe wash Mp mg Mass of part: filter Mf mg
AVG Unit Totals (tons per year) PM10 8 6 13 7 4 8 12 8 Unit Totals (tons per year) SO2 3 4 1 1 1 1 1 2 Unit Totals (tons per year) NOx 30 82 74 34 37 51 70 54
Facility Totals (tons per year) PM10 163 121 114 76 81 87 81 103 Facility Totals (tons per year) TSP 176 132 119 81 86 91 85 110 Facility Totals (tons per year) SO2 239 274 275 281 201 239 202 244 Facility Totals (tons per year) NOx 1493 1541 1488 1440 1164 1301 1372 1,400
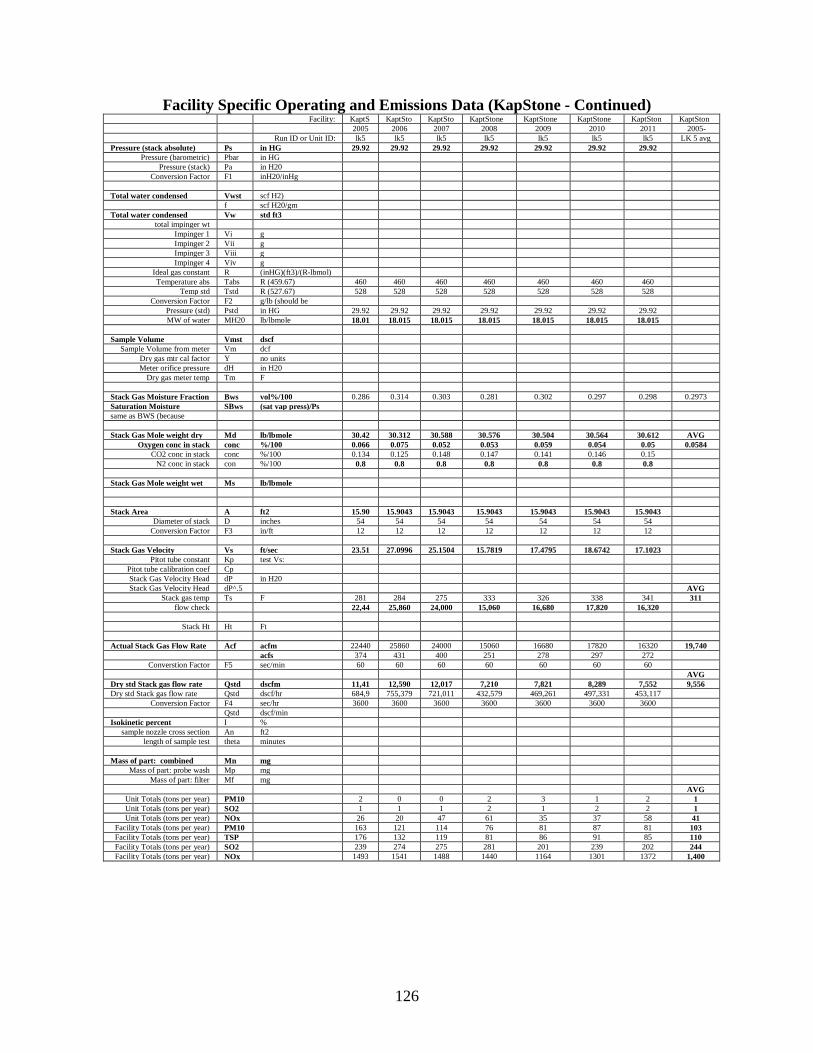
126
Facility Specific Operating and Emissions Data (KapStone - Continued) Facility: KaptS KaptSto KaptSto KaptStone KaptStone KaptStone KaptSton KaptSton 2005 2006 2007 2008 2009 2010 2011 2005-
Run ID or Unit ID: lk5 lk5 lk5 lk5 lk5 lk5 lk5 LK 5 avg Pressure (stack absolute) Ps in HG 29.92 29.92 29.92 29.92 29.92 29.92 29.92
Pressure (barometric) Pbar in HG Pressure (stack) Pa in H20
Conversion Factor F1 inH20/inHg
Total water condensed Vwst
scf H2) f scf H20/gm Total water condensed Vw std ft3
total impinger wt Impinger 1 Vi g Impinger 2 Vii g Impinger 3 Viii g Impinger 4 Viv g
Ideal gas constant R (inHG)(ft3)/(R-lbmol) Temperature abs Tabs R (459.67) 460 460 460 460 460 460 460
Temp std Tstd R (527.67) 528 528 528 528 528 528 528 Conversion Factor F2 g/lb (should be
Pressure (std) Pstd in HG 29.92 29.92 29.92 29.92 29.92 29.92 29.92 MW of water MH20 lb/lbmole 18.01
18.015 18.015 18.015 18.015 18.015 18.015
Sample Volume Vmst
dscf
Sample Volume from meter Vm dcf Dry gas mtr cal factor Y no units Meter orifice pressure dH in H20
Dry gas meter temp Tm F Stack Gas Moisture Fraction Bws vol%/100 0.286 0.314 0.303 0.281 0.302 0.297 0.298 0.2973 Saturation Moisture
SBws (sat vap press)/Ps
same as BWS (because
Stack Gas Mole weight dry Md lb/lbmole 30.42
30.312 30.588 30.576 30.504 30.564 30.612 AVG
Oxygen conc in stack conc
%/100 0.066 0.075 0.052 0.053 0.059 0.054 0.05 0.0584 CO2 conc in stack conc
%/100 0.134 0.125 0.148 0.147 0.141 0.146 0.15
N2 conc in stack con
%/100 0.8 0.8 0.8 0.8 0.8 0.8 0.8 Stack Gas Mole weight wet Ms lb/lbmole Stack Area A ft2 15.90
15.9043 15.9043 15.9043 15.9043 15.9043 15.9043
Diameter of stack D inches 54 54 54 54 54 54 54 Conversion Factor F3 in/ft 12 12 12 12 12 12 12
Stack Gas Velocity Vs ft/sec 23.51
27.0996 25.1504 15.7819 17.4795 18.6742 17.1023
Pitot tube constant Kp test Vs: Pitot tube calibration coef Cp Stack Gas Velocity Head dP in H20 Stack Gas Velocity Head dP^.5 AVG
Stack gas temp Ts F 281 284 275 333 326 338 341 311 flow check 22,44
25,860 24,000 15,060 16,680 17,820 16,320
Stack Ht Ht Ft
Actual Stack Gas Flow Rate Acf acfm 22440 25860 24000 15060 16680 17820 16320 19,740 acfs 374 431 400 251 278 297 272
Converstion Factor F5 sec/min 60 60 60 60 60 60 60 AVG Dry std Stack gas flow rate Qstd dscfm 11,41
12,590 12,017 7,210 7,821 8,289 7,552 9,556
Dry std Stack gas flow rate Qstd dscf/hr 684,9
755,379 721,011 432,579 469,261 497,331 453,117 Conversion Factor F4 sec/hr 3600 3600 3600 3600 3600 3600 3600
Qstd dscf/min Isokinetic percent I %
sample nozzle cross section An ft2 length of sample test theta minutes
Mass of part: combined
Mn mg
Mass of part: probe wash Mp mg Mass of part: filter Mf mg
AVG Unit Totals (tons per year) PM10 2 0 0 2 3 1 2 1 Unit Totals (tons per year) SO2 1 1 1 2 1 2 2 1 Unit Totals (tons per year) NOx 26 20 47 61 35 37 58 41
Facility Totals (tons per year) PM10 163 121 114 76 81 87 81 103 Facility Totals (tons per year) TSP 176 132 119 81 86 91 85 110 Facility Totals (tons per year) SO2 239 274 275 281 201 239 202 244 Facility Totals (tons per year) NOx 1493 1541 1488 1440 1164 1301 1372 1,400

127
Facility Specific Operating and Emissions Data (Boise While Wallula) Facility: Boise
Boise Boise Boise Boise Boise Boise Boise 2005 2006 2007 2008 2009 2010 2011 2005-
Run ID or Unit ID: rf2 rf2 rf2 rf2 rf2 rf2 rf2 Rf2 avg Pressure (stack absolute) Ps in HG 29.92 29.92 29.92 29.92 29.92 29.92 29.92
Pressure (barometric) Pbar in HG Pressure (stack) Pa in H20
Conversion Factor F1 inH20/inHg
Total water condensed Vwst
scf H2) f scf H20/gm Total water condensed Vw std ft3
total impinger wt Impinger 1 Vi g Impinger 2 Vii g Impinger 3 Viii g Impinger 4 Viv g
Ideal gas constant R (inHG)(ft3)/(R-lbmol) Temperature abs Tabs R (459.67) 460 460 460 460 460 460 460
Temp std Tstd R (527.67) 528 528 528 528 528 528 528 Conversion Factor F2 g/lb (should be
Pressure (std) Pstd in HG 29.92 29.92 29.92 29.92 29.92 29.92 29.92 MW of water MH20 lb/lbmole 18.01
18.015 18.015 18.015 18.015 18.015 18.015
Sample Volume Vmst
dscf
Sample Volume from meter Vm dcf Dry gas mtr cal factor Y no units Meter orifice pressure dH in H20
Dry gas meter temp Tm F Stack Gas Moisture Fraction Bws vol%/100 0.222 0.251 0.267 0.246 0.237 0.23 0.253 0.2437 Saturation Moisture
SBws (sat vap press)/Ps
same as BWS (because
Stack Gas Mole weight dry Md lb/lbmole 29.98
30.119 30.011 30.059 29.867 29.975 30.191 AVG
Oxygen conc in stack conc
%/100 0.102 0.091 0.1 0.096 0.112 0.103 0.085 0.0984 CO2 conc in stack conc
%/100 0.098 0.109 0.1 0.104 0.088 0.097 0.115
N2 conc in stack con
%/100 0.8 0.8 0.8 0.8 0.8 0.8 0.8 Stack Gas Mole weight wet Ms lb/lbmole Stack Area A ft2 62.21
62.2114 62.2114 62.2114 62.2114 62.2114 62.2114
Diameter of stack D inches 106.8 106.8 106.8 106.8 106.8 106.8 106.8 Conversion Factor F3 in/ft 12 12 12 12 12 12 12
Stack Gas Velocity Vs ft/sec 23.25
21.2501 22.4396 22.4235 22.4557 24.3846 25.1883
Pitot tube constant Kp test Vs: Pitot tube calibration coef Cp Stack Gas Velocity Head dP in H20 Stack Gas Velocity Head dP^.5 AVG
Stack gas temp Ts F 327 333 283 305 335 342 344 324 flow check 86,82
79,320 83,760 83,700 83,820 91,020 94,020
Stack Ht Ht Ft
Actual Stack Gas Flow Rate Acf acfm 86820 79320 83760 83700 83820 91020 94020 86,066 acfs 1447 1322 1396 1395 1397 1517 1567
Converstion Factor F5 sec/min 60 60 60 60 60 60 60 AVG Dry std Stack gas flow rate Qstd dscfm 45,31
39,557 43,630 43,558 42,476 46,141 46,123 43,829
Dry std Stack gas flow rate Qstd dscf/hr 2,719,
2,373,4
2,617,8
2,613,488 2,548,533 2,768,461 2,767,387 Conversion Factor F4 sec/hr 3600 3600 3600 3600 3600 3600 3600
Qstd dscf/min Isokinetic percent I %
sample nozzle cross section An ft2 length of sample test theta minutes
Mass of part: combined
Mn mg
Mass of part: probe wash Mp mg Mass of part: filter Mf mg
AVG Unit Totals (tons per year) PM10 20 8 6 7 10 10 5 9 Unit Totals (tons per year) SO2 255 239 268 358 255 332 352 294 Unit Totals (tons per year) NOx 65 64 63 73 59 74 71 67
Facility Totals (tons per year) PM10 213 218 184 157 131 131 127 166 Facility Totals (tons per year) TSP 295 300 270 227 156 156 149 222 Facility Totals (tons per year) SO2 793 1247 684 780 713 802 793 830 Facility Totals (tons per year) NOx 764 778 771 1073 841 859 861 850

128
Facility Specific Operating and Emissions Data (Boise While Wallula - Continued) Facility: Boise Boise Boise Boise Boise Boise Boise Boise 2005 2006 2007 2008 2009 2010 2011 2005-
Run ID or Unit ID: rf3 rf3 rf3 rf3 rf3 rf3 rf3 Rf3 avg Pressure (stack absolute) Ps in HG 29.92 29.92 29.92 29.92 29.92 29.92 29.92
Pressure (barometric) Pbar in HG Pressure (stack) Pa in H20
Conversion Factor F1 inH20/inHg
Total water condensed Vwst
scf H2) f scf H20/gm Total water condensed Vw std ft3
total impinger wt Impinger 1 Vi g Impinger 2 Vii g Impinger 3 Viii g Impinger 4 Viv g
Ideal gas constant R (inHG)(ft3)/(R-lbmol) Temperature abs Tabs R (459.67) 460 460 460 460 460 460 460
Temp std Tstd R (527.67) 528 528 528 528 528 528 528 Conversion Factor F2 g/lb (should be
Pressure (std) Pstd in HG 29.92 29.92 29.92 29.92 29.92 29.92 29.92 MW of water MH20 lb/lbmole 18.01
18.015 18.015 18.015 18.015 18.015 18.015
Sample Volume Vmst
dscf
Sample Volume from meter Vm dcf Dry gas mtr cal factor Y no units Meter orifice pressure dH in H20
Dry gas meter temp Tm F Stack Gas Moisture Fraction Bws vol%/100 0.223 0.246 0.239 0.24 0.247 0.245 0.238 0.239714
Saturation Moisture
SBws (sat vap press)/Ps same as BWS (because
Stack Gas Mole weight dry Md lb/lbmole 30.44
30.444 30.324 30.456 30.456 30.540 30.624 AVG
Oxygen conc in stack conc
%/100 0.064 0.064 0.074 0.063 0.063 0.056 0.049 0.0619 CO2 conc in stack conc
%/100 0.136 0.136 0.126 0.137 0.137 0.144 0.151
N2 conc in stack con
%/100 0.8 0.8 0.8 0.8 0.8 0.8 0.8 Stack Gas Mole weight wet Ms lb/lbmole Stack Area A ft2 132.7
132.732
132.732
132.7323 132.7323 132.7323 132.7323
Diameter of stack D inches 156 156 156 156 156 156 156 Conversion Factor F3 in/ft 12 12 12 12 12 12 12
Stack Gas Velocity Vs ft/sec 40.41
39.6512 40.7964 42.0696 43.9531 24.3874 42.3032
Pitot tube constant Kp test Vs: Pitot tube calibration coef Cp Stack Gas Velocity Head dP in H20 Stack Gas Velocity Head dP^.5 AVG
Stack gas temp Ts F 357 365 358 382 409 394 401 381 flow check 321,8
315,780 324,900 335,040 350,040 194,220 336,900
Stack Ht Ht Ft
Actual Stack Gas Flow Rate Acf acfm 32184
315780 324900 335040 350040 194220 336900 311,246
acfs 5364 5263 5415 5584 5834 3237 5615 Converstion Factor F5 sec/min 60 60 60 60 60 60 60
AVG Dry std Stack gas flow rate Qstd dscfm 161,6
152,383 159,593 159,673 160,150 90,660 157,430 148,786
Dry std Stack gas flow rate Qstd dscf/hr 9,696,
9,142,9
9,575,6
9,580,393 9,608,997 5,439,616 9,445,784 Conversion Factor F4 sec/hr 3600 3600 3600 3600 3600 3600 3600
Qstd dscf/min Isokinetic percent I %
sample nozzle cross section An ft2 length of sample test theta minutes
Mass of part: combined
Mn mg
Mass of part: probe wash Mp mg Mass of part: filter Mf mg
AVG Unit Totals (tons per year) PM10 29 13 12 12 12 14 12 15 Unit Totals (tons per year) SO2 506 968 333 374 428 441 420 496 Unit Totals (tons per year) NOx 286 274 244 294 297 306 292 285
Facility Totals (tons per year) PM10 213 218 184 157 131 131 127 166 Facility Totals (tons per year) TSP 295 300 270 227 156 156 149 222 Facility Totals (tons per year) SO2 793 1247 684 780 713 802 793 830 Facility Totals (tons per year) NOx 764 778 771 1073 841 859 861 850
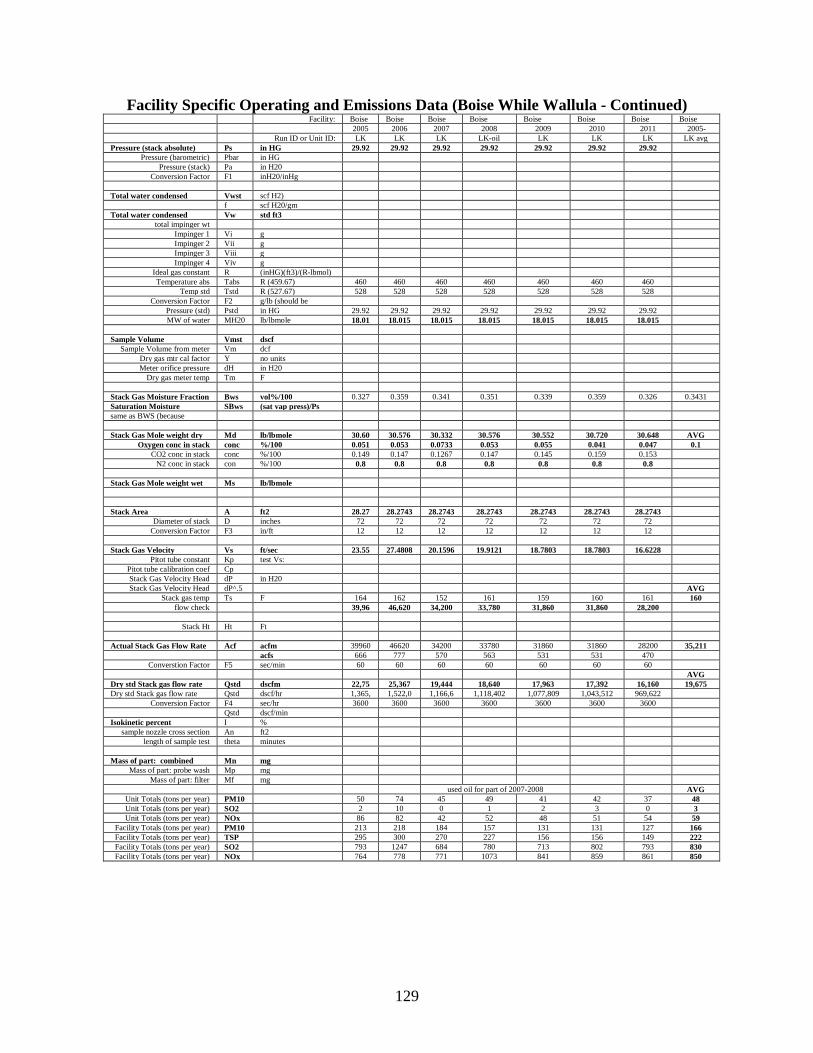
129
Facility Specific Operating and Emissions Data (Boise While Wallula - Continued) Facility: Boise Boise Boise Boise Boise Boise Boise Boise 2005 2006 2007 2008 2009 2010 2011 2005-
Run ID or Unit ID: LK LK LK LK-oil LK LK LK LK avg Pressure (stack absolute) Ps in HG 29.92 29.92 29.92 29.92 29.92 29.92 29.92
Pressure (barometric) Pbar in HG Pressure (stack) Pa in H20
Conversion Factor F1 inH20/inHg
Total water condensed Vwst
scf H2) f scf H20/gm Total water condensed Vw std ft3
total impinger wt Impinger 1 Vi g Impinger 2 Vii g Impinger 3 Viii g Impinger 4 Viv g
Ideal gas constant R (inHG)(ft3)/(R-lbmol) Temperature abs Tabs R (459.67) 460 460 460 460 460 460 460
Temp std Tstd R (527.67) 528 528 528 528 528 528 528 Conversion Factor F2 g/lb (should be
Pressure (std) Pstd in HG 29.92 29.92 29.92 29.92 29.92 29.92 29.92 MW of water MH20 lb/lbmole 18.01
18.015 18.015 18.015 18.015 18.015 18.015
Sample Volume Vmst
dscf
Sample Volume from meter Vm dcf Dry gas mtr cal factor Y no units Meter orifice pressure dH in H20
Dry gas meter temp Tm F Stack Gas Moisture Fraction Bws vol%/100 0.327 0.359 0.341 0.351 0.339 0.359 0.326 0.3431 Saturation Moisture
SBws (sat vap press)/Ps
same as BWS (because
Stack Gas Mole weight dry Md lb/lbmole 30.60
30.576 30.332 30.576 30.552 30.720 30.648 AVG
Oxygen conc in stack conc
%/100 0.051 0.053 0.0733 0.053 0.055 0.041 0.047 0.1 CO2 conc in stack conc
%/100 0.149 0.147 0.1267 0.147 0.145 0.159 0.153
N2 conc in stack con
%/100 0.8 0.8 0.8 0.8 0.8 0.8 0.8 Stack Gas Mole weight wet Ms lb/lbmole Stack Area A ft2 28.27
28.2743 28.2743 28.2743 28.2743 28.2743 28.2743
Diameter of stack D inches 72 72 72 72 72 72 72 Conversion Factor F3 in/ft 12 12 12 12 12 12 12
Stack Gas Velocity Vs ft/sec 23.55
27.4808 20.1596 19.9121 18.7803 18.7803 16.6228
Pitot tube constant Kp test Vs: Pitot tube calibration coef Cp Stack Gas Velocity Head dP in H20 Stack Gas Velocity Head dP^.5 AVG
Stack gas temp Ts F 164 162 152 161 159 160 161 160 flow check 39,96
46,620 34,200 33,780 31,860 31,860 28,200
Stack Ht Ht Ft
Actual Stack Gas Flow Rate Acf acfm 39960 46620 34200 33780 31860 31860 28200 35,211 acfs 666 777 570 563 531 531 470
Converstion Factor F5 sec/min 60 60 60 60 60 60 60 AVG Dry std Stack gas flow rate Qstd dscfm 22,75
25,367 19,444 18,640 17,963 17,392 16,160 19,675
Dry std Stack gas flow rate Qstd dscf/hr 1,365,
1,522,0
1,166,6
1,118,402 1,077,809 1,043,512 969,622 Conversion Factor F4 sec/hr 3600 3600 3600 3600 3600 3600 3600
Qstd dscf/min Isokinetic percent I %
sample nozzle cross section An ft2 length of sample test theta minutes
Mass of part: combined
Mn mg
Mass of part: probe wash Mp mg Mass of part: filter Mf mg
used oil for part of 2007-2008 AVG Unit Totals (tons per year) PM10 50 74 45 49 41 42 37 48 Unit Totals (tons per year) SO2 2 10 0 1 2 3 0 3 Unit Totals (tons per year) NOx 86 82 42 52 48 51 54 59
Facility Totals (tons per year) PM10 213 218 184 157 131 131 127 166 Facility Totals (tons per year) TSP 295 300 270 227 156 156 149 222 Facility Totals (tons per year) SO2 793 1247 684 780 713 802 793 830 Facility Totals (tons per year) NOx 764 778 771 1073 841 859 861 850
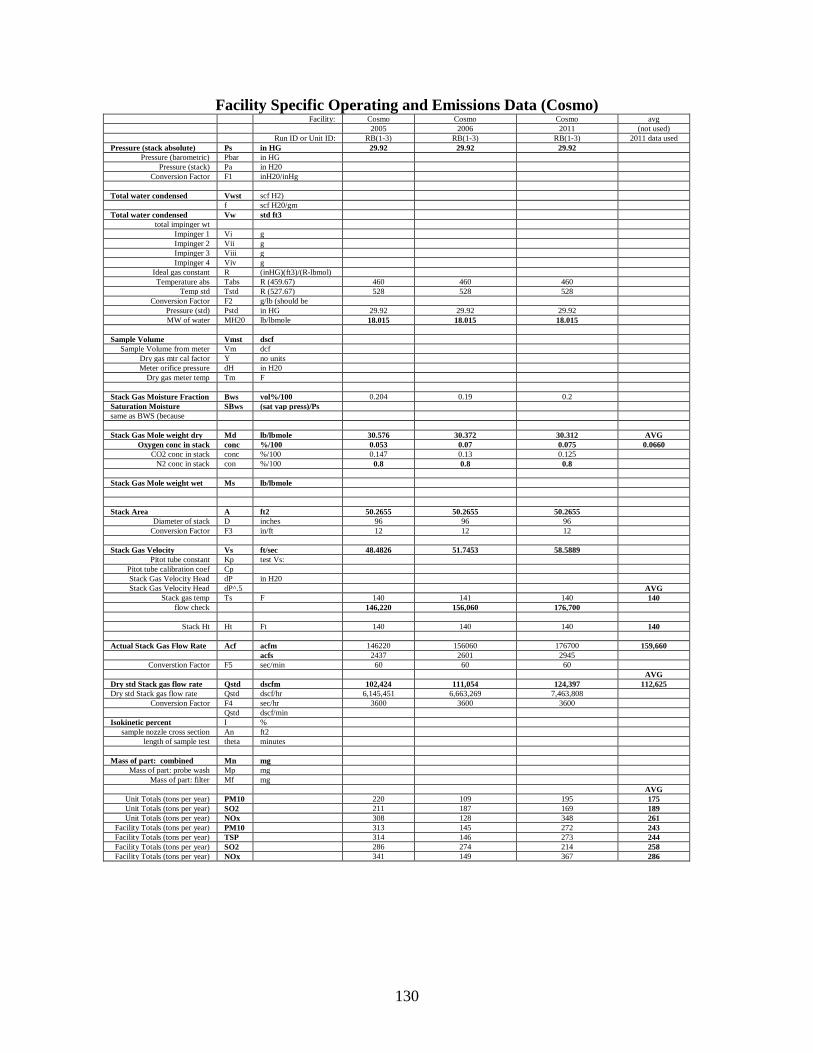
130
Facility Specific Operating and Emissions Data (Cosmo) Facility: Cosmo Cosmo Cosmo avg 2005 2006 2011 (not used) Run ID or Unit ID: RB(1-3) RB(1-3) RB(1-3) 2011 data used Pressure (stack absolute) Ps in HG 29.92 29.92 29.92
Pressure (barometric) Pbar in HG Pressure (stack) Pa in H20
Conversion Factor F1 inH20/inHg
Total water condensed Vwst
scf H2) f scf H20/gm Total water condensed Vw std ft3
total impinger wt Impinger 1 Vi g Impinger 2 Vii g Impinger 3 Viii g Impinger 4 Viv g
Ideal gas constant R (inHG)(ft3)/(R-lbmol) Temperature abs Tabs R (459.67) 460 460 460
Temp std Tstd R (527.67) 528 528 528 Conversion Factor F2 g/lb (should be
Pressure (std) Pstd in HG 29.92 29.92 29.92 MW of water MH20 lb/lbmole 18.015 18.015 18.015
Sample Volume Vmst
dscf
Sample Volume from meter Vm dcf Dry gas mtr cal factor Y no units Meter orifice pressure dH in H20
Dry gas meter temp Tm F Stack Gas Moisture Fraction Bws vol%/100 0.204 0.19 0.2 Saturation Moisture
SBws (sat vap press)/Ps
same as BWS (because
Stack Gas Mole weight dry Md lb/lbmole 30.576 30.372 30.312 AVG
Oxygen conc in stack conc
%/100 0.053 0.07 0.075 0.0660 CO2 conc in stack conc
%/100 0.147 0.13 0.125
N2 conc in stack con
%/100 0.8 0.8 0.8 Stack Gas Mole weight wet Ms lb/lbmole Stack Area A ft2 50.2655 50.2655 50.2655
Diameter of stack D inches 96 96 96 Conversion Factor F3 in/ft 12 12 12
Stack Gas Velocity Vs ft/sec 48.4826 51.7453 58.5889
Pitot tube constant Kp test Vs: Pitot tube calibration coef Cp Stack Gas Velocity Head dP in H20 Stack Gas Velocity Head dP^.5 AVG
Stack gas temp Ts F 140 141 140 140 flow check 146,220 156,060 176,700
Stack Ht Ht Ft 140 140 140 140
Actual Stack Gas Flow Rate Acf acfm 146220 156060 176700 159,660 acfs 2437 2601 2945
Converstion Factor F5 sec/min 60 60 60 AVG Dry std Stack gas flow rate Qstd dscfm 102,424 111,054 124,397 112,625 Dry std Stack gas flow rate Qstd dscf/hr 6,145,451 6,663,269 7,463,808
Conversion Factor F4 sec/hr 3600 3600 3600 Qstd dscf/min Isokinetic percent I %
sample nozzle cross section An ft2 length of sample test theta minutes
Mass of part: combined
Mn mg
Mass of part: probe wash Mp mg Mass of part: filter Mf mg
AVG Unit Totals (tons per year) PM10 220 109 195 175 Unit Totals (tons per year) SO2 211 187 169 189 Unit Totals (tons per year) NOx 308 128 348 261
Facility Totals (tons per year) PM10 313 145 272 243 Facility Totals (tons per year) TSP 314 146 273 244 Facility Totals (tons per year) SO2 286 274 214 258 Facility Totals (tons per year) NOx 341 149 367 286
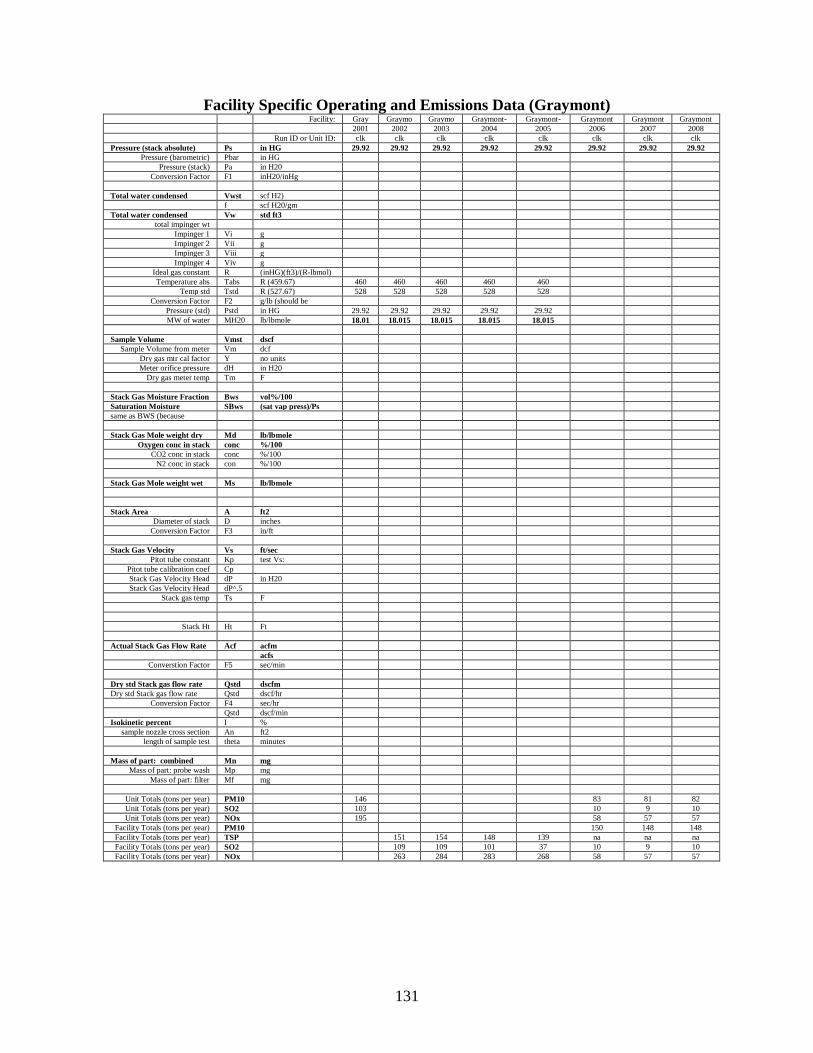
131
Facility Specific Operating and Emissions Data (Graymont) Facility: Gray
Graymo
Graymo
Graymont-
Graymont-
Graymont Graymont Graymont 2001 2002 2003 2004 2005 2006 2007 2008 Run ID or Unit ID: clk clk clk clk clk clk clk clk Pressure (stack absolute) Ps in HG 29.92 29.92 29.92 29.92 29.92 29.92 29.92 29.92
Pressure (barometric) Pbar in HG Pressure (stack) Pa in H20
Conversion Factor F1 inH20/inHg
Total water condensed Vwst
scf H2) f scf H20/gm Total water condensed Vw std ft3
total impinger wt Impinger 1 Vi g Impinger 2 Vii g Impinger 3 Viii g Impinger 4 Viv g
Ideal gas constant R (inHG)(ft3)/(R-lbmol) Temperature abs Tabs R (459.67) 460 460 460 460 460
Temp std Tstd R (527.67) 528 528 528 528 528 Conversion Factor F2 g/lb (should be
Pressure (std) Pstd in HG 29.92 29.92 29.92 29.92 29.92 MW of water MH20 lb/lbmole 18.01
18.015 18.015 18.015 18.015
Sample Volume Vmst
dscf
Sample Volume from meter Vm dcf Dry gas mtr cal factor Y no units Meter orifice pressure dH in H20
Dry gas meter temp Tm F Stack Gas Moisture Fraction Bws vol%/100 Saturation Moisture
SBws (sat vap press)/Ps
same as BWS (because
Stack Gas Mole weight dry Md lb/lbmole
Oxygen conc in stack conc
%/100 CO2 conc in stack conc
%/100
N2 conc in stack con
%/100 Stack Gas Mole weight wet Ms lb/lbmole Stack Area A ft2
Diameter of stack D inches Conversion Factor F3 in/ft
Stack Gas Velocity Vs ft/sec
Pitot tube constant Kp test Vs: Pitot tube calibration coef Cp Stack Gas Velocity Head dP in H20 Stack Gas Velocity Head dP^.5
Stack gas temp Ts F
Stack Ht Ht Ft
Actual Stack Gas Flow Rate Acf acfm acfs
Converstion Factor F5 sec/min Dry std Stack gas flow rate Qstd dscfm Dry std Stack gas flow rate Qstd dscf/hr
Conversion Factor F4 sec/hr Qstd dscf/min Isokinetic percent I %
sample nozzle cross section An ft2 length of sample test theta minutes
Mass of part: combined
Mn mg
Mass of part: probe wash Mp mg Mass of part: filter Mf mg
Unit Totals (tons per year) PM10 146 83 81 82 Unit Totals (tons per year) SO2 103 10 9 10 Unit Totals (tons per year) NOx 195 58 57 57
Facility Totals (tons per year) PM10 150 148 148 Facility Totals (tons per year) TSP 151 154 148 139 na na na Facility Totals (tons per year) SO2 109 109 101 37 10 9 10 Facility Totals (tons per year) NOx 263 284 283 268 58 57 57
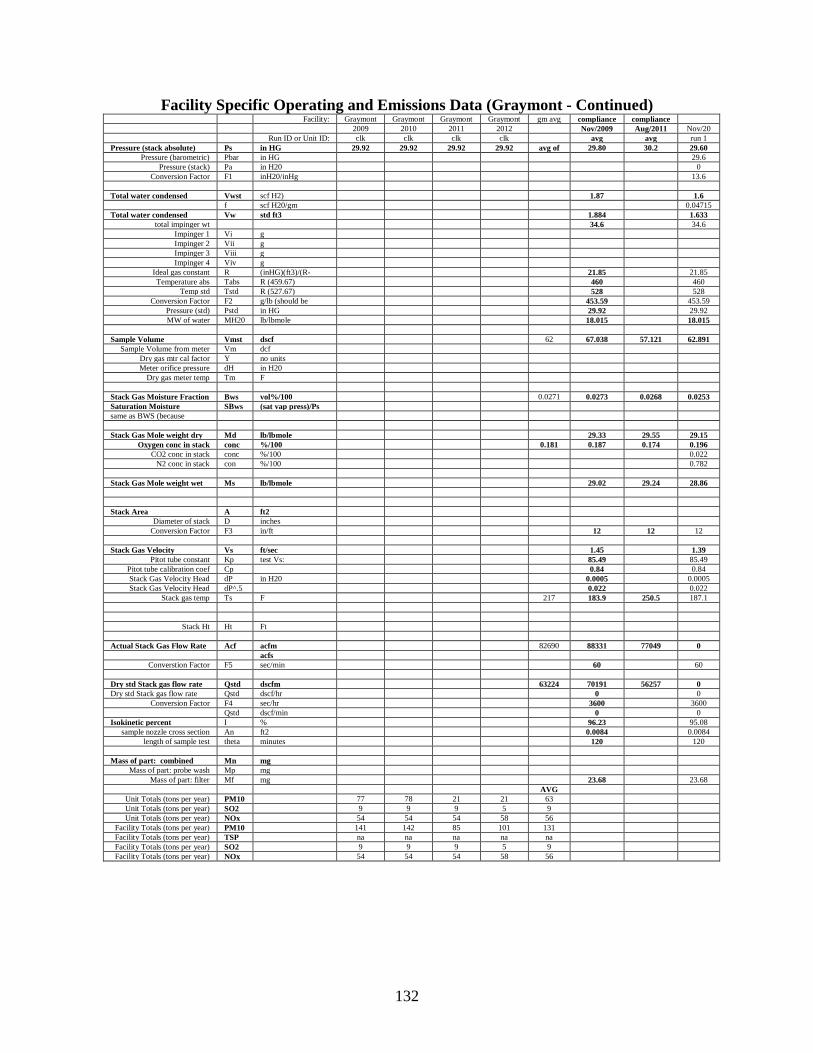
132
Facility Specific Operating and Emissions Data (Graymont - Continued) Facility: Graymont Graymont Graymont Graymont gm avg compliance
compliance
2009 2010 2011 2012 Nov/2009 Aug/2011 Nov/20 Run ID or Unit ID: clk clk clk clk avg avg run 1
Pressure (stack absolute) Ps in HG 29.92 29.92 29.92 29.92 avg of
29.80 30.2 29.60 Pressure (barometric) Pbar in HG 29.6
Pressure (stack) Pa in H20 0 Conversion Factor F1 inH20/inHg 13.6
Total water condensed Vwst
scf H2) 1.87 1.6
f scf H20/gm 0.04715 Total water condensed Vw std ft3 1.884 1.633
total impinger wt 34.6 34.6 Impinger 1 Vi g Impinger 2 Vii g Impinger 3 Viii g Impinger 4 Viv g
Ideal gas constant R (inHG)(ft3)/(R-
21.85 21.85 Temperature abs Tabs R (459.67) 460 460
Temp std Tstd R (527.67) 528 528 Conversion Factor F2 g/lb (should be
453.59 453.59
Pressure (std) Pstd in HG 29.92 29.92 MW of water MH20 lb/lbmole 18.015 18.015
Sample Volume Vmst
dscf 62 67.038 57.121 62.891
Sample Volume from meter Vm dcf Dry gas mtr cal factor Y no units Meter orifice pressure dH in H20
Dry gas meter temp Tm F Stack Gas Moisture Fraction Bws vol%/100 0.0271 0.0273 0.0268 0.0253 Saturation Moisture
SBws (sat vap press)/Ps
same as BWS (because
Stack Gas Mole weight dry Md lb/lbmole 29.33 29.55 29.15
Oxygen conc in stack conc
%/100 0.181 0.187 0.174 0.196 CO2 conc in stack conc
%/100 0.022
N2 conc in stack con
%/100 0.782 Stack Gas Mole weight wet Ms lb/lbmole 29.02 29.24 28.86 Stack Area A ft2
Diameter of stack D inches Conversion Factor F3 in/ft 12 12 12
Stack Gas Velocity Vs ft/sec 1.45 1.39
Pitot tube constant Kp test Vs: 85.49 85.49 Pitot tube calibration coef Cp 0.84 0.84 Stack Gas Velocity Head dP in H20 0.0005 0.0005 Stack Gas Velocity Head dP^.5 0.022 0.022
Stack gas temp Ts F 217 183.9 250.5 187.1
Stack Ht Ht Ft
Actual Stack Gas Flow Rate Acf acfm 82690 88331 77049 0 acfs
Converstion Factor F5 sec/min 60 60 Dry std Stack gas flow rate Qstd dscfm 63224 70191 56257 0 Dry std Stack gas flow rate Qstd dscf/hr 0 0
Conversion Factor F4 sec/hr 3600 3600 Qstd dscf/min 0 0 Isokinetic percent I % 96.23 95.08
sample nozzle cross section An ft2 0.0084 0.0084 length of sample test theta minutes 120 120
Mass of part: combined
Mn mg
Mass of part: probe wash Mp mg Mass of part: filter Mf mg 23.68 23.68
AVG Unit Totals (tons per year) PM10 77 78 21 21 63 Unit Totals (tons per year) SO2 9 9 9 5 9 Unit Totals (tons per year) NOx 54 54 54 58 56
Facility Totals (tons per year) PM10 141 142 85 101 131 Facility Totals (tons per year) TSP na na na na na Facility Totals (tons per year) SO2 9 9 9 5 9 Facility Totals (tons per year) NOx 54 54 54 58 56
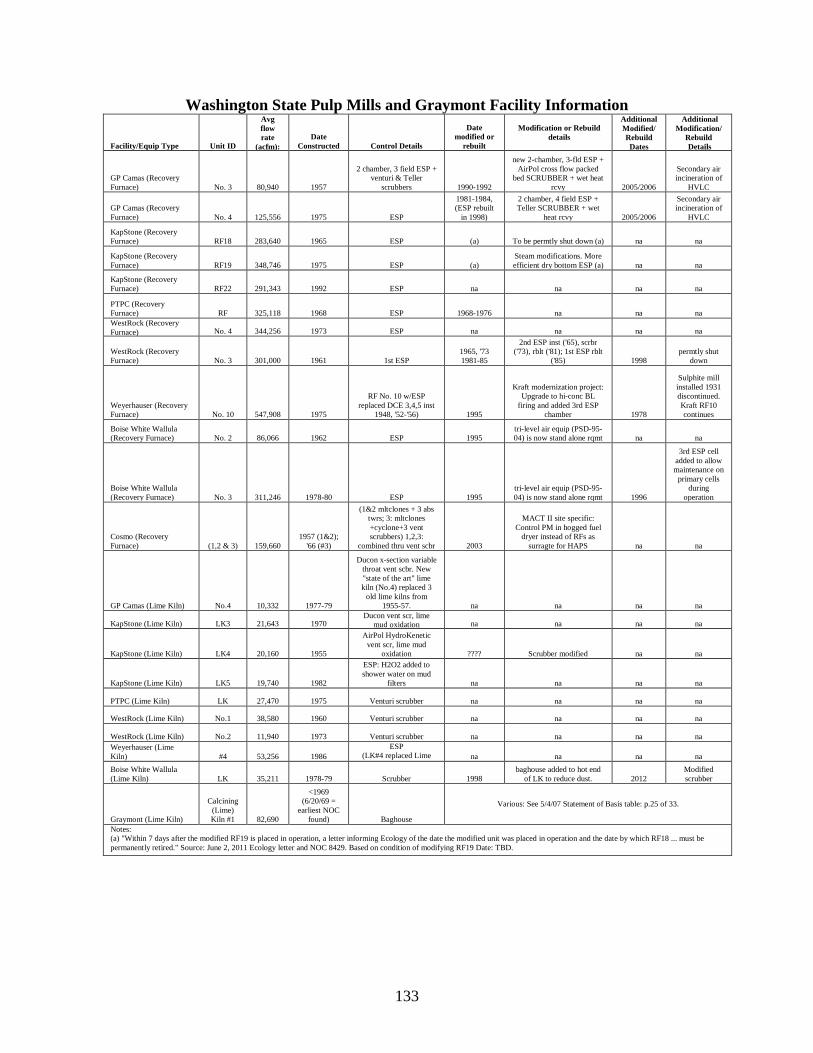
133
Washington State Pulp Mills and Graymont Facility Information
Facility/Equip Type Unit ID
Avg flow rate
(acfm): Date
Constructed Control Details
Date modified or
rebuilt
Modification or Rebuild details
Additional Modified/ Rebuild Dates
Additional Modification/
Rebuild Details
GP Camas (Recovery Furnace) No. 3 80,940 1957
2 chamber, 3 field ESP + venturi & Teller
scrubbers 1990-1992
new 2-chamber, 3-fld ESP + AirPol cross flow packed
bed SCRUBBER + wet heat rcvy 2005/2006
Secondary air incineration of
HVLC
GP Camas (Recovery Furnace) No. 4 125,556 1975 ESP
1981-1984, (ESP rebuilt
in 1998)
2 chamber, 4 field ESP + Teller SCRUBBER + wet
heat rcvy 2005/2006
Secondary air incineration of
HVLC
KapStone (Recovery Furnace) RF18 283,640 1965 ESP (a) To be permtly shut down (a) na na
KapStone (Recovery Furnace) RF19 348,746 1975 ESP (a)
Steam modifications. More efficient dry bottom ESP (a) na na
KapStone (Recovery Furnace) RF22 291,343 1992 ESP na na na na
PTPC (Recovery Furnace) RF 325,118 1968 ESP 1968-1976 na na na WestRock (Recovery Furnace) No. 4 344,256 1973 ESP na na na na
WestRock (Recovery Furnace) No. 3 301,000 1961 1st ESP
1965, '73 1981-85
2nd ESP inst ('65), scrbr ('73), rblt ('81); 1st ESP rblt
('85) 1998 permtly shut
down
Weyerhauser (Recovery Furnace) No. 10 547,908 1975
RF No. 10 w/ESP replaced DCE 3,4,5 inst
1948, '52-'56) 1995
Kraft modernization project: Upgrade to hi-conc BL
firing and added 3rd ESP chamber 1978
Sulphite mill installed 1931 discontinued. Kraft RF10 continues
Boise White Wallula (Recovery Furnace) No. 2 86,066 1962 ESP 1995
tri-level air equip (PSD-95-04) is now stand alone rqmt na na
Boise White Wallula (Recovery Furnace) No. 3 311,246 1978-80 ESP 1995
tri-level air equip (PSD-95-04) is now stand alone rqmt 1996
3rd ESP cell added to allow maintenance on
primary cells during
operation
Cosmo (Recovery Furnace) (1,2 & 3) 159,660
1957 (1&2); '66 (#3)
(1&2 mltclones + 3 abs twrs; 3: mltclones +cyclone+3 vent scrubbers) 1,2,3:
combined thru vent scbr 2003
MACT II site specific: Control PM in hogged fuel
dryer instead of RFs as surragte for HAPS na na
GP Camas (Lime Kiln) No.4 10,332 1977-79
Ducon x-section variable throat vent scbr. New "state of the art" lime kiln (No.4) replaced 3
old lime kilns from 1955-57. na na na na
KapStone (Lime Kiln) LK3 21,643 1970 Ducon vent scr, lime
mud oxidation na na na na
KapStone (Lime Kiln) LK4 20,160 1955
AirPol HydroKenetic vent scr, lime mud
oxidation ???? Scrubber modified na na
KapStone (Lime Kiln) LK5 19,740 1982
ESP: H2O2 added to shower water on mud
filters na na na na
PTPC (Lime Kiln) LK 27,470 1975 Venturi scrubber na na na na
WestRock (Lime Kiln) No.1 38,580 1960 Venturi scrubber na na na na
WestRock (Lime Kiln) No.2 11,940 1973 Venturi scrubber na na na na Weyerhauser (Lime Kiln) #4 53,256 1986
ESP (LK#4 replaced Lime
na na na na
Boise White Wallula (Lime Kiln) LK 35,211 1978-79 Scrubber 1998
baghouse added to hot end of LK to reduce dust. 2012
Modified scrubber
Graymont (Lime Kiln)
Calcining (Lime) Kiln #1 82,690
<1969 (6/20/69 =
earliest NOC found) Baghouse
Various: See 5/4/07 Statement of Basis table: p.25 of 33.
Notes: (a) "Within 7 days after the modified RF19 is placed in operation, a letter informing Ecology of the date the modified unit was placed in operation and the date by which RF18 ... must be permanently retired." Source: June 2, 2011 Ecology letter and NOC 8429. Based on condition of modifying RF19 Date: TBD.

134
Appendix C. WSU Report
135
136
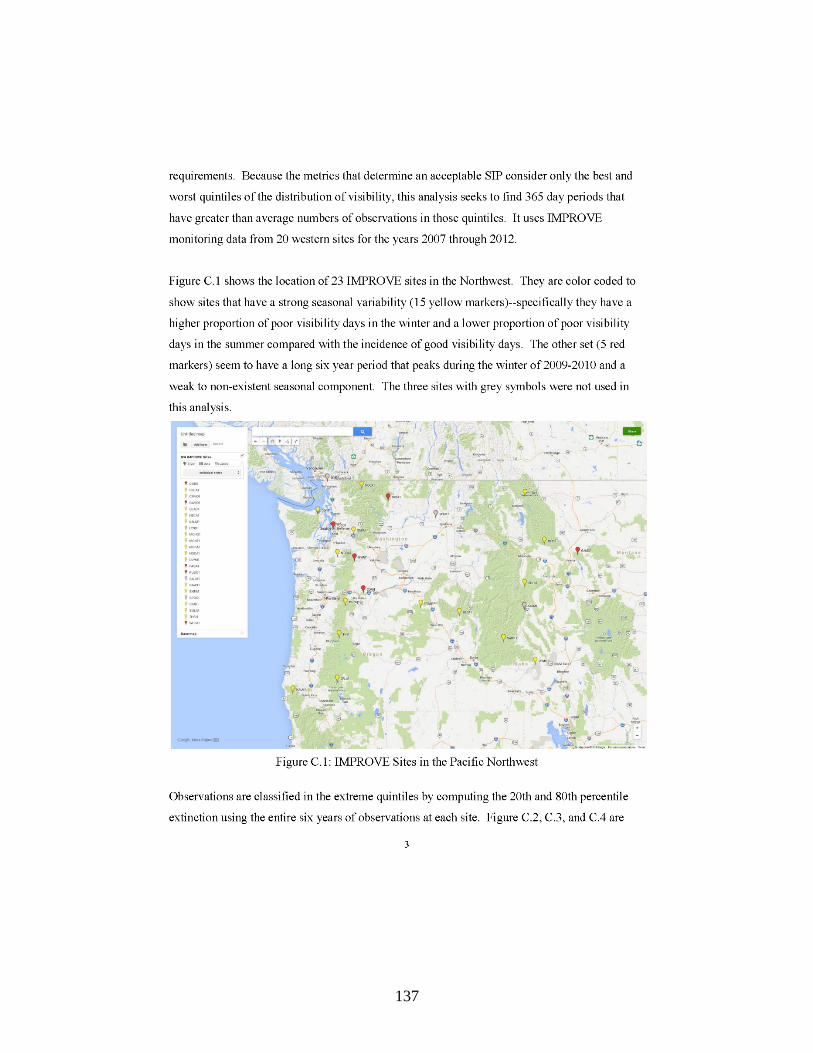
137
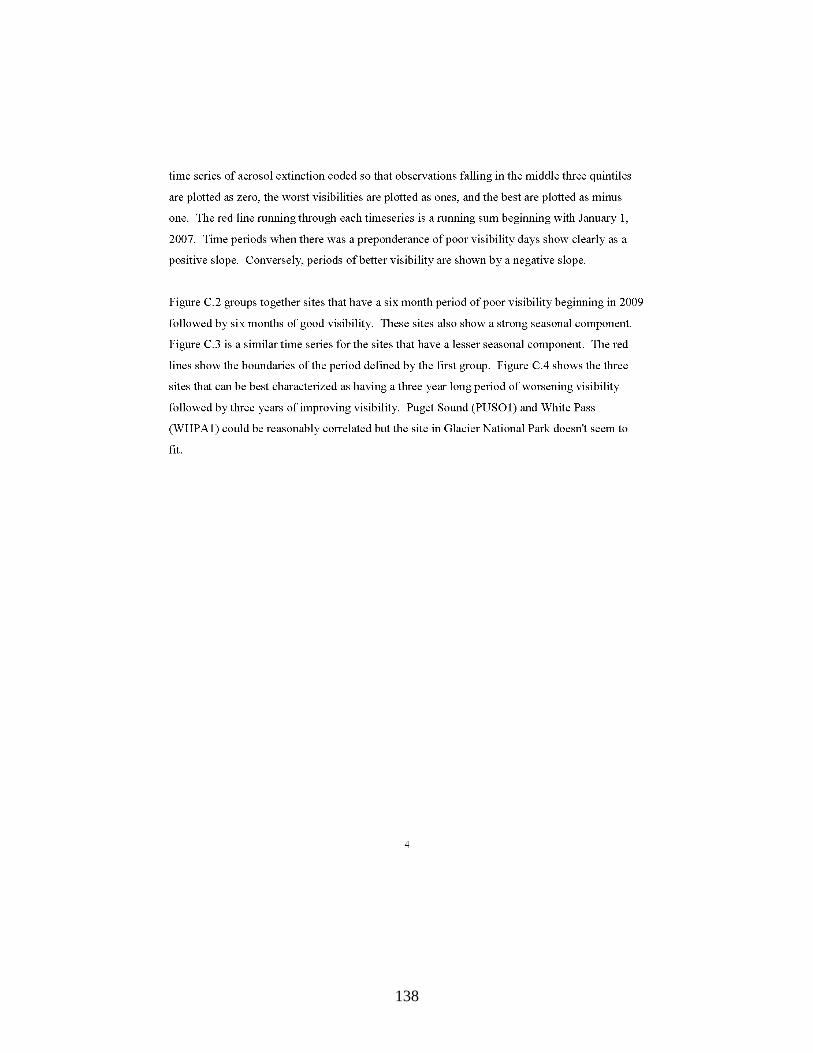
138
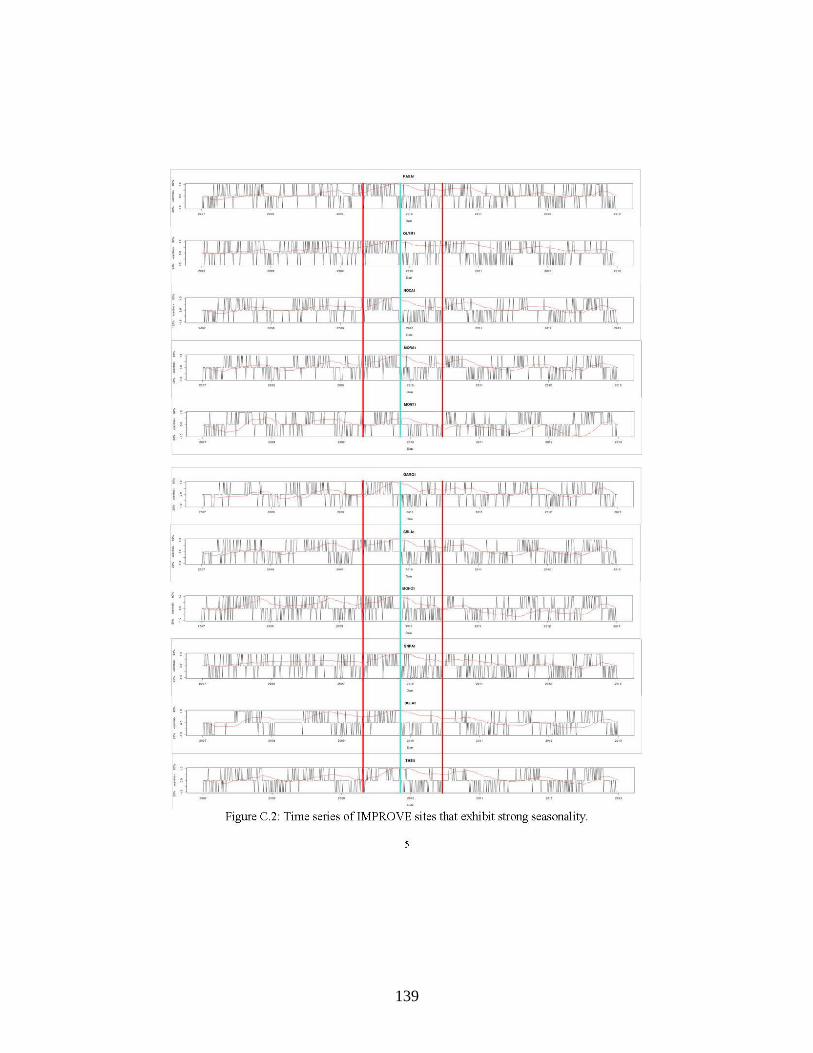
139
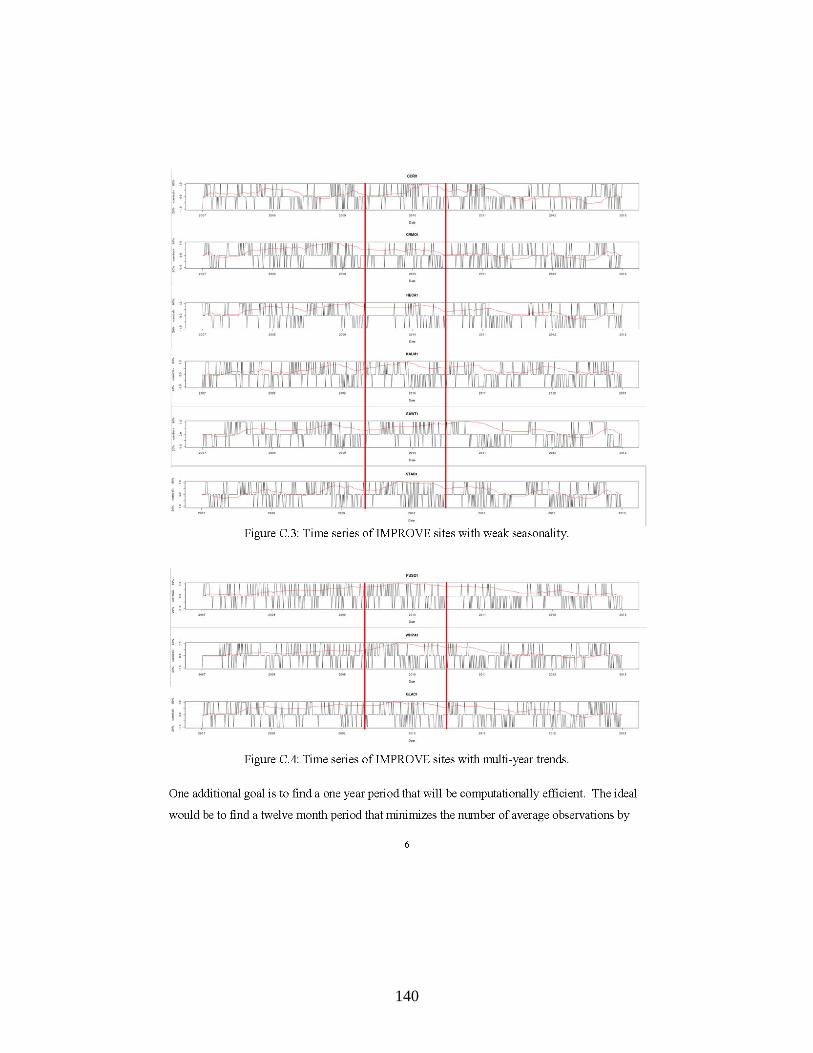
140
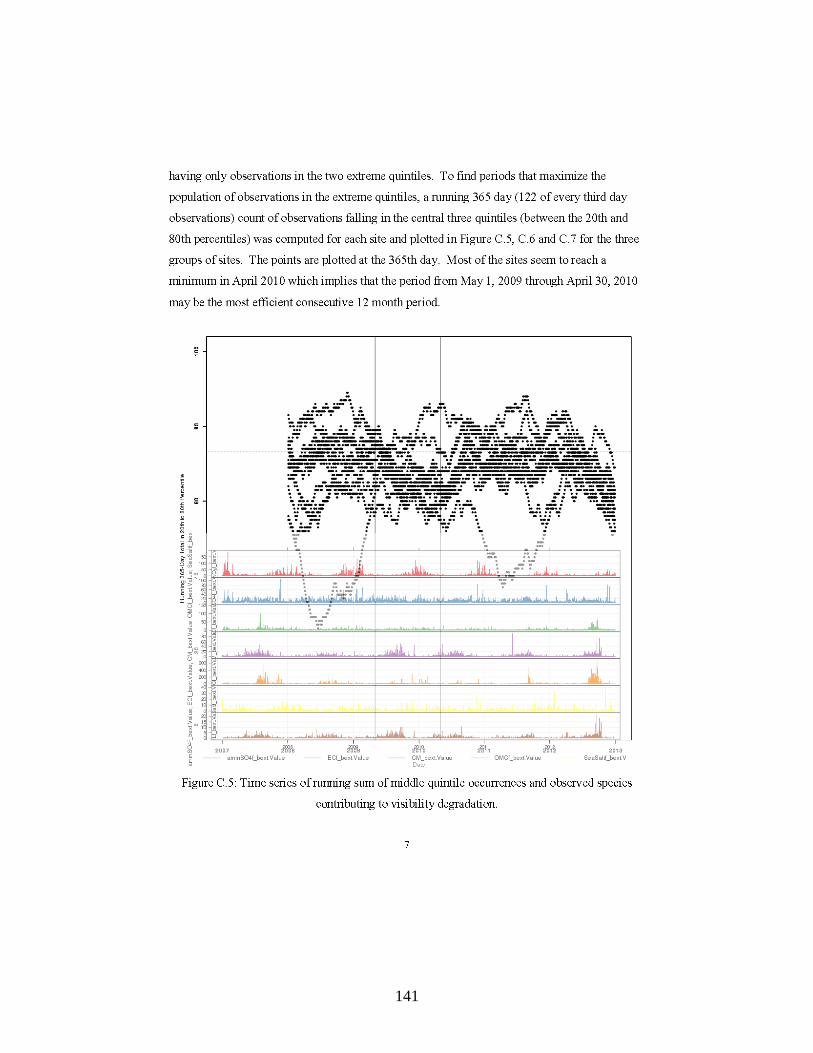
141
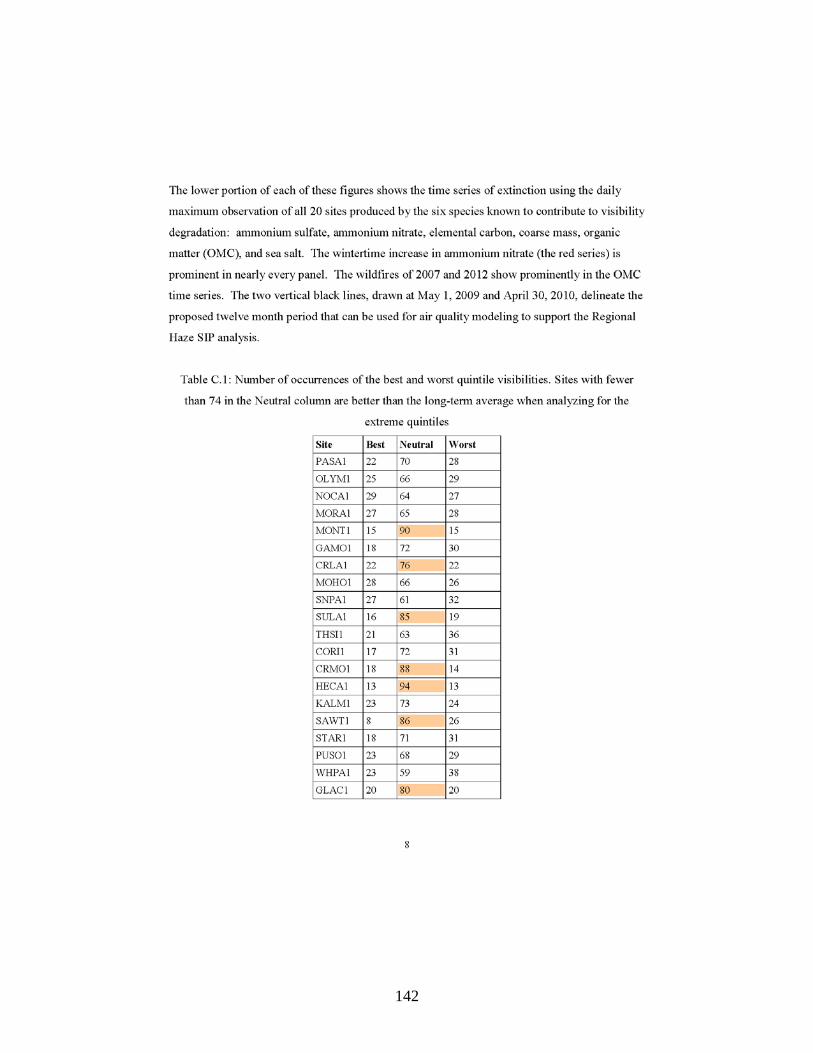
142
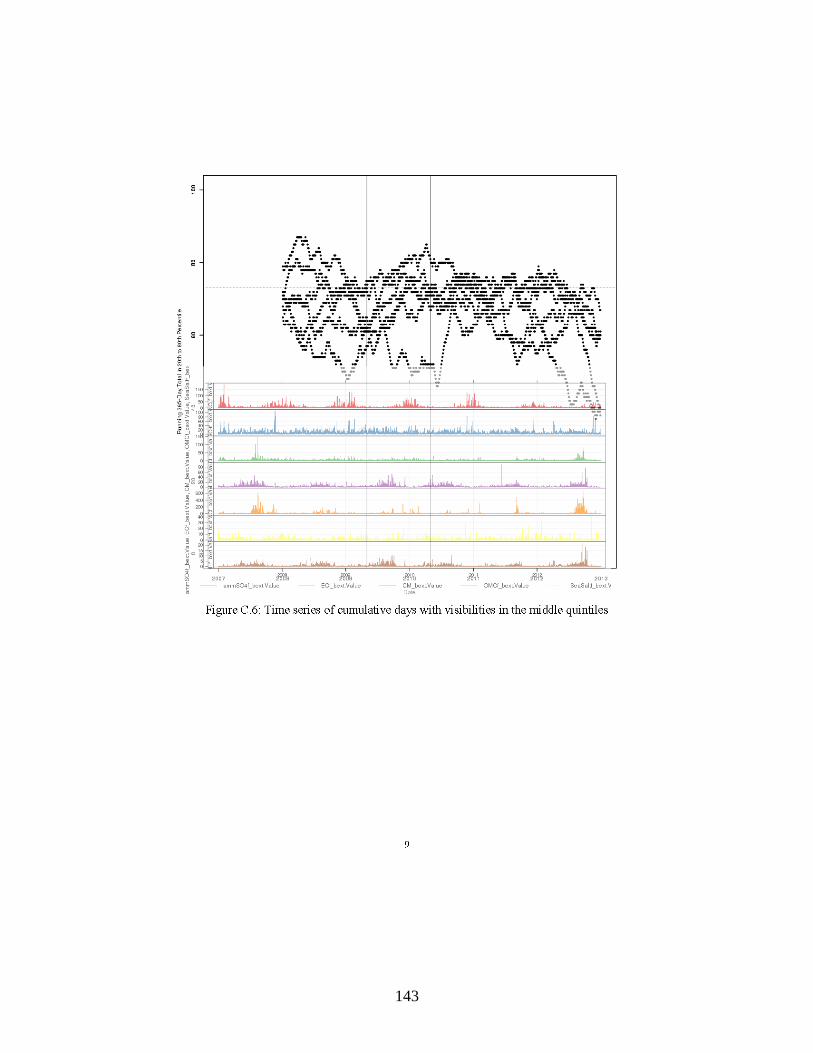
143
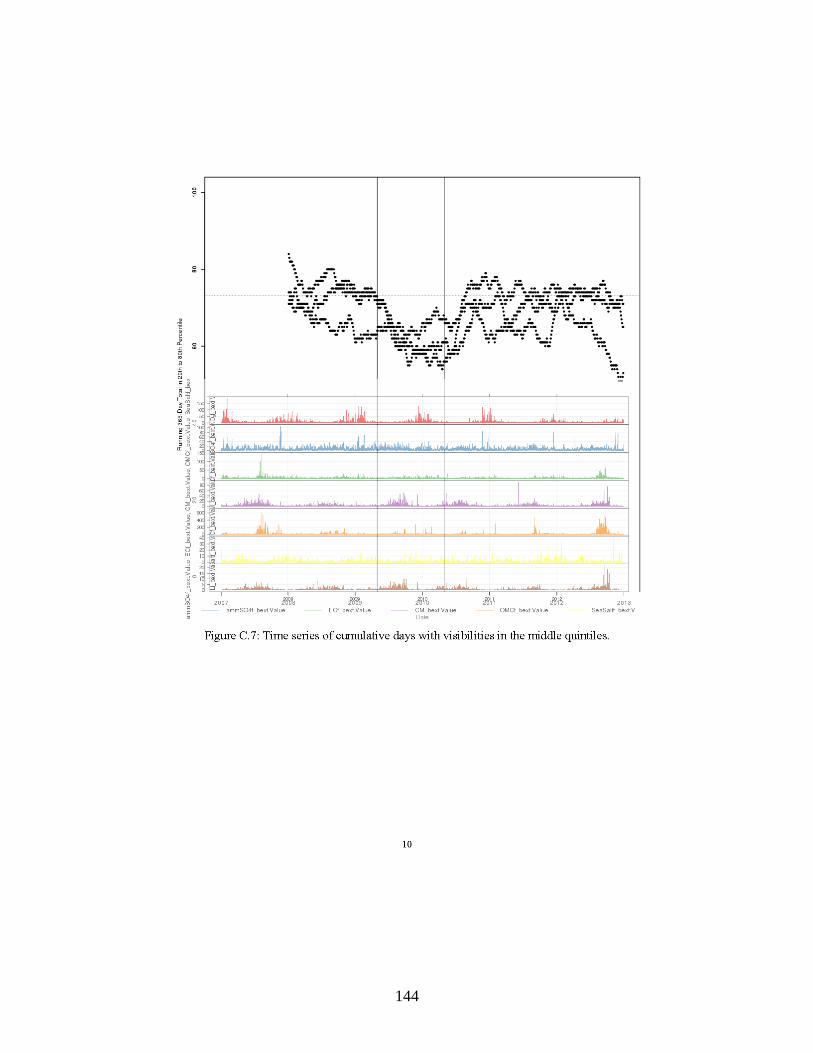
144
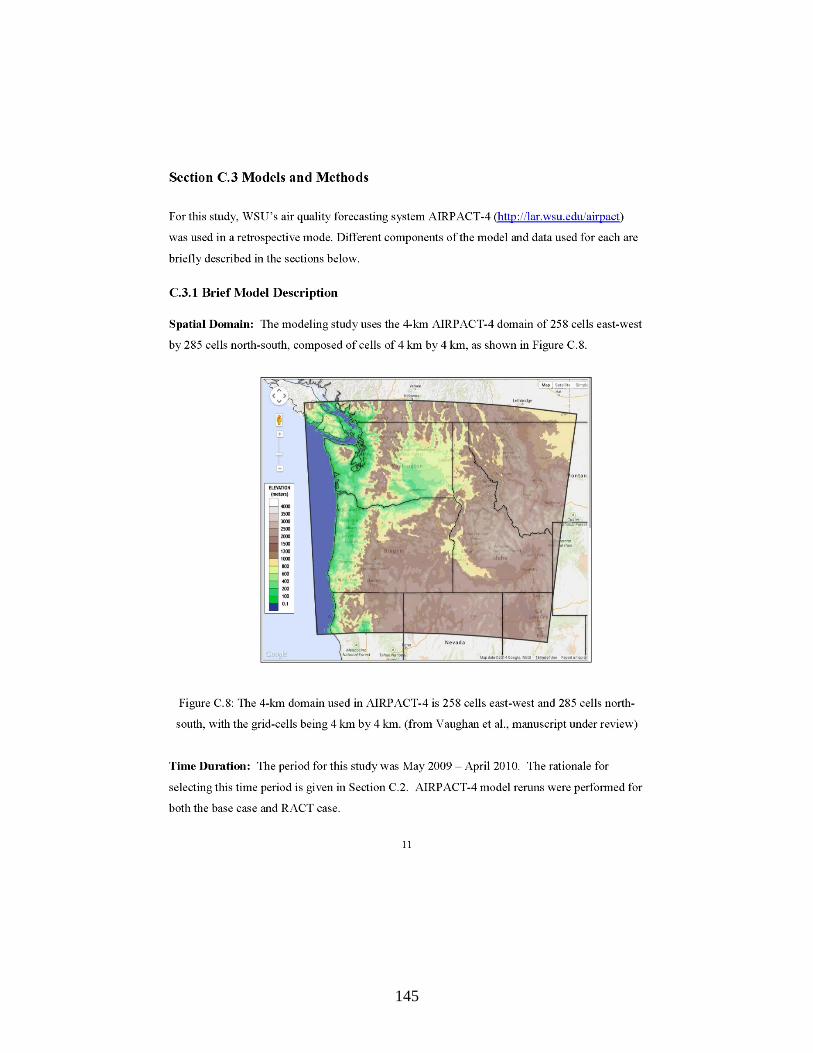
145
146
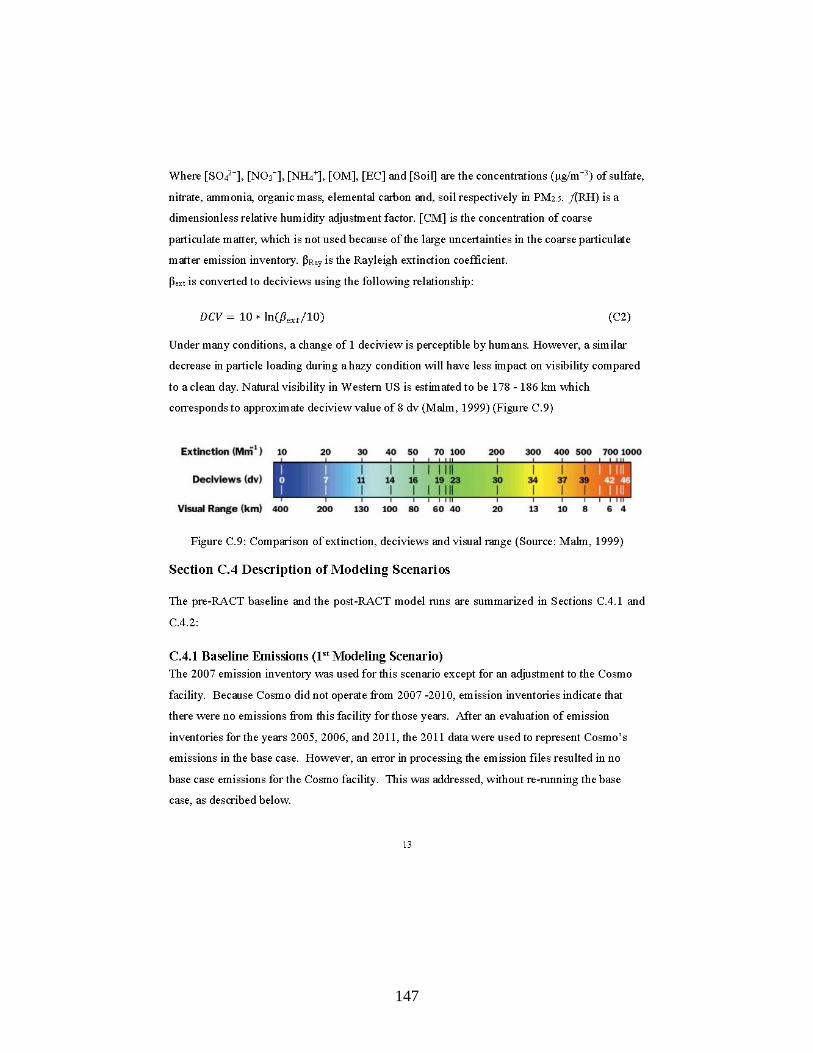
147
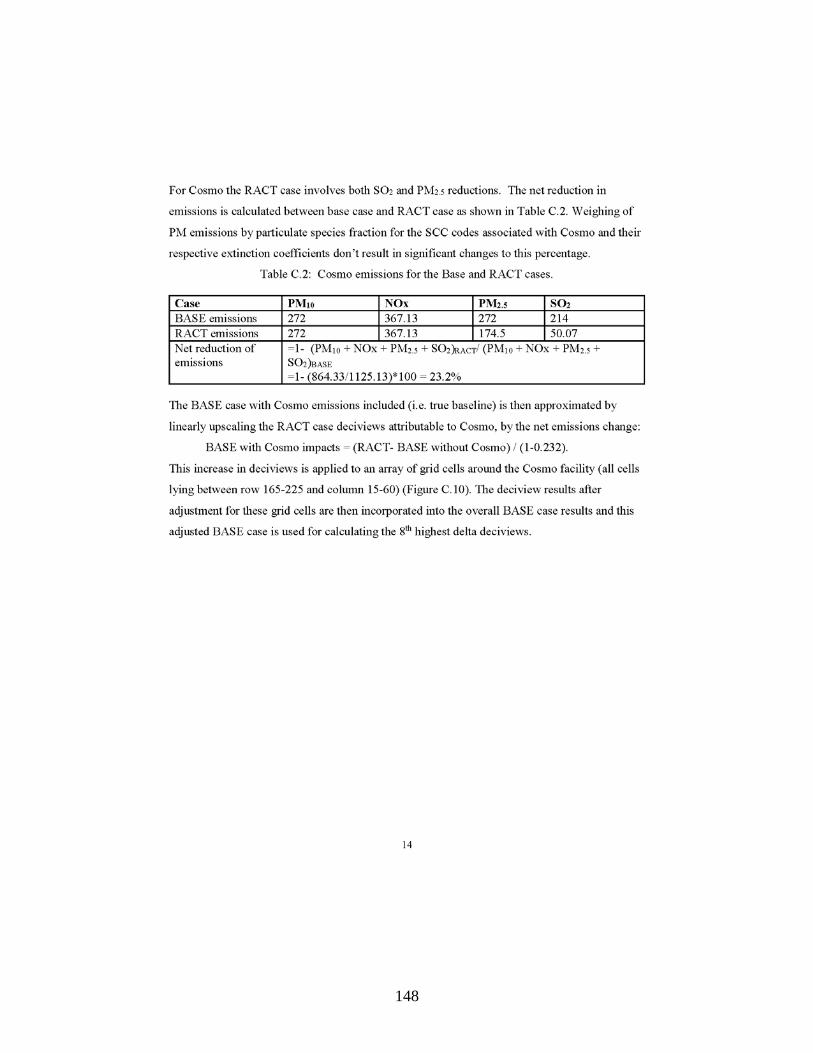
148
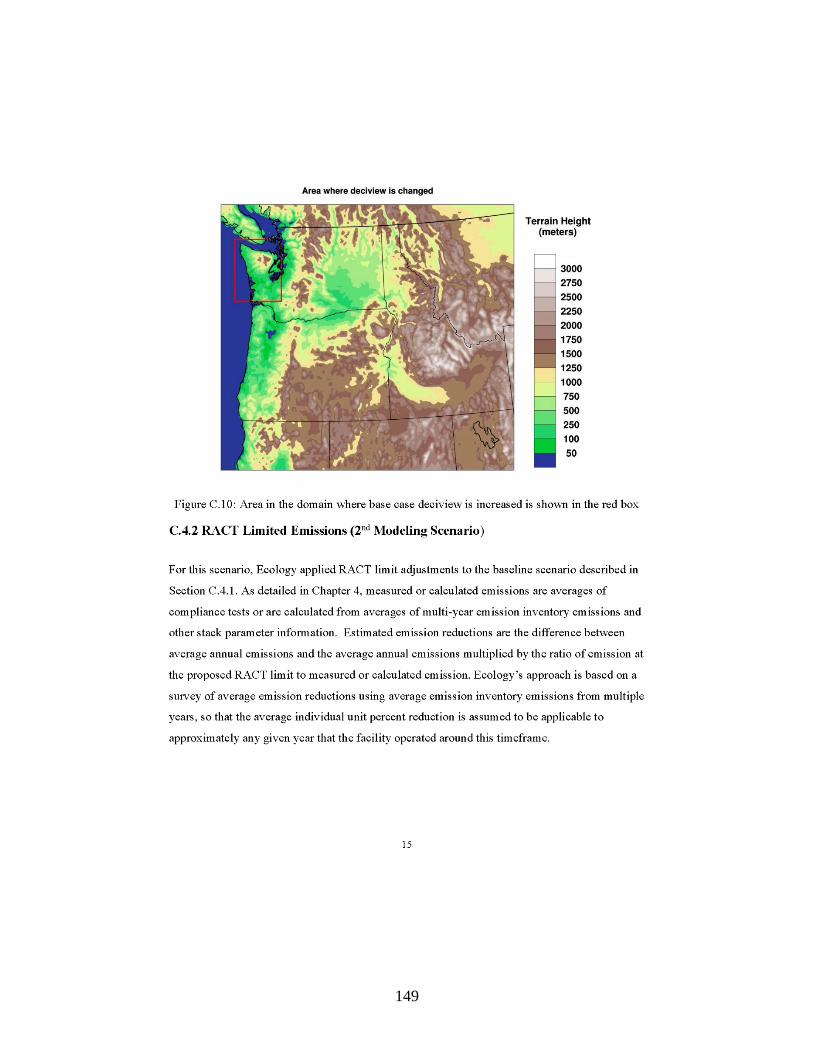
149
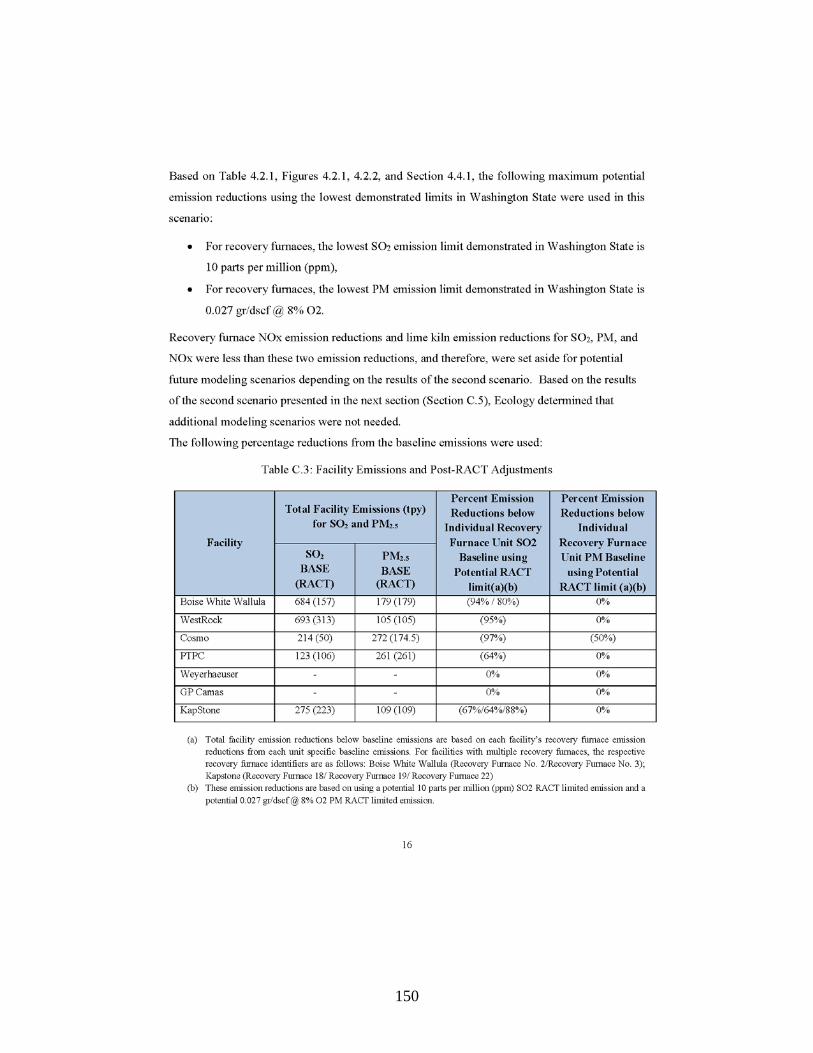
150
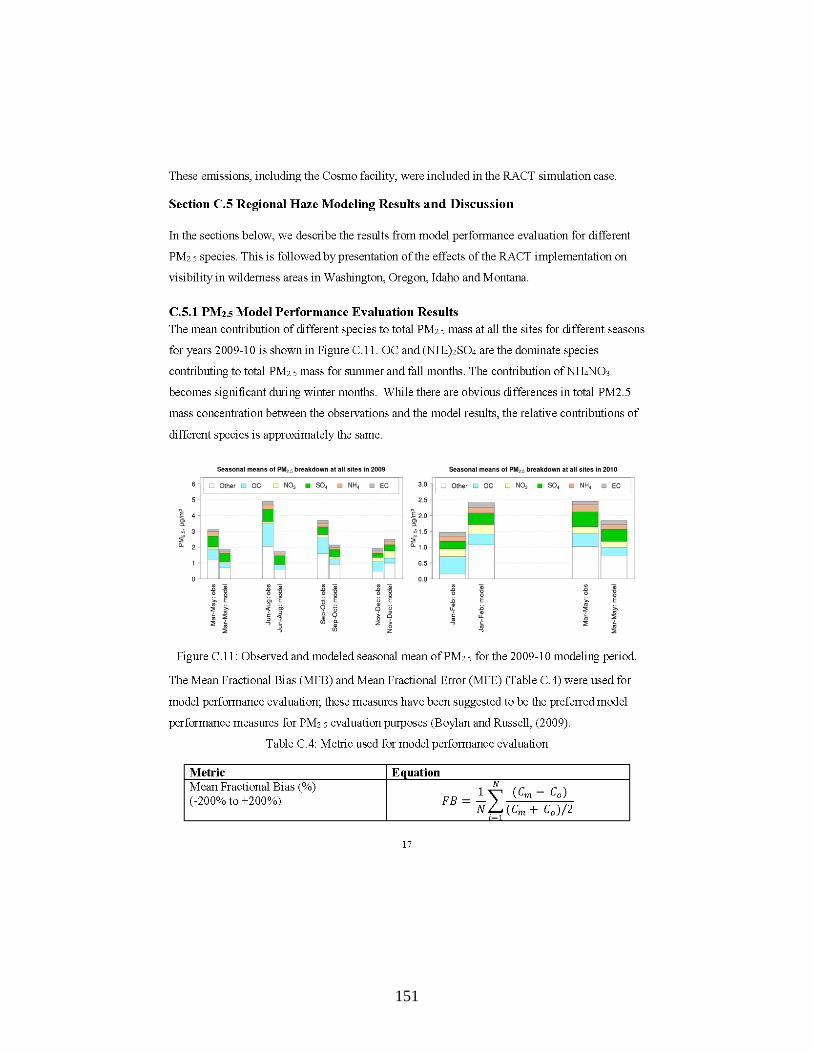
151
152
153
154
155
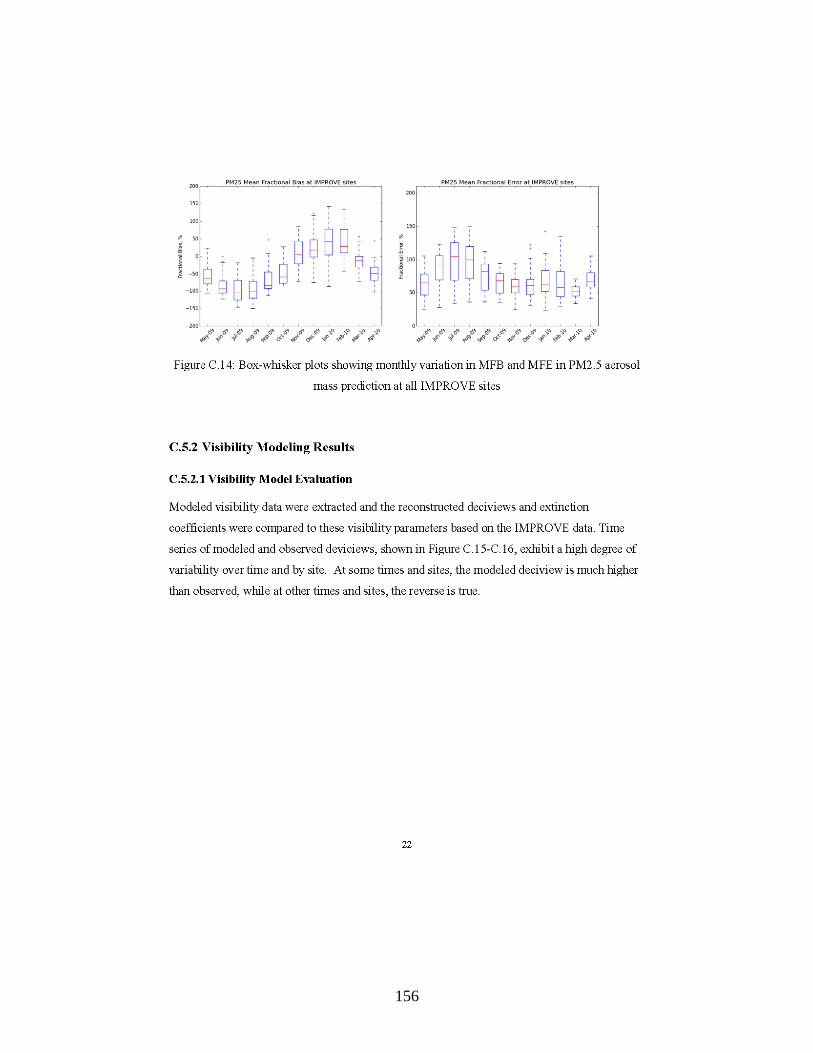
156
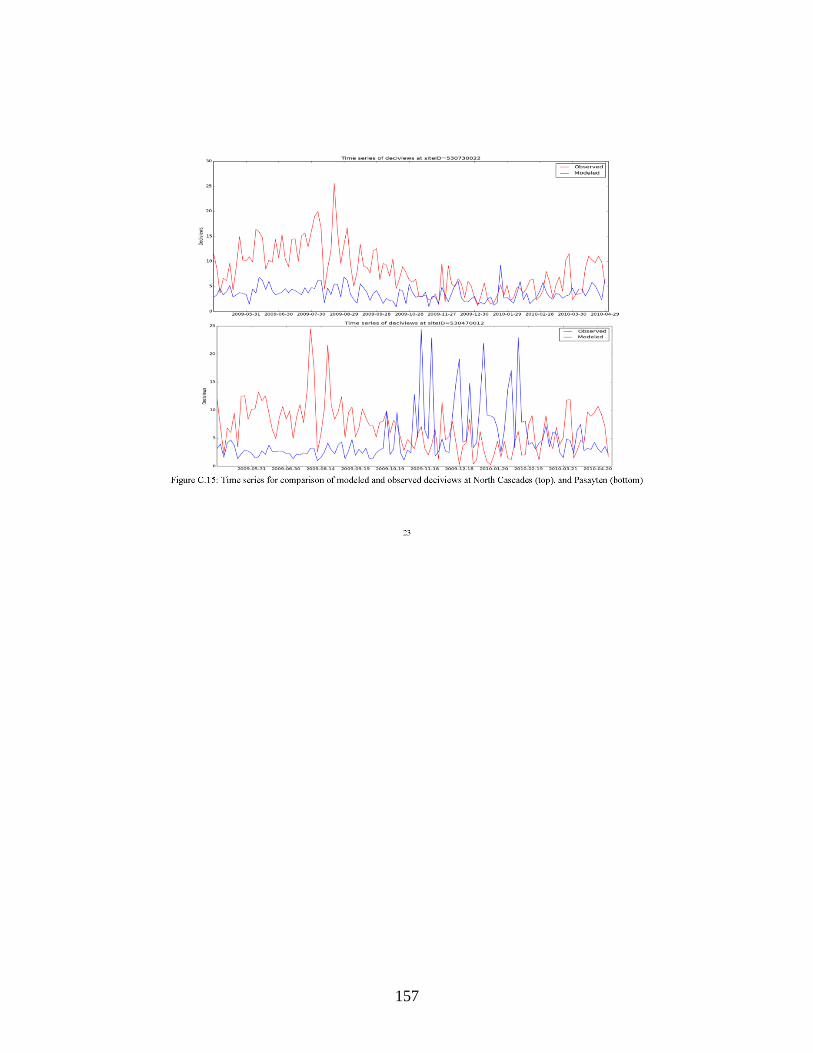
157
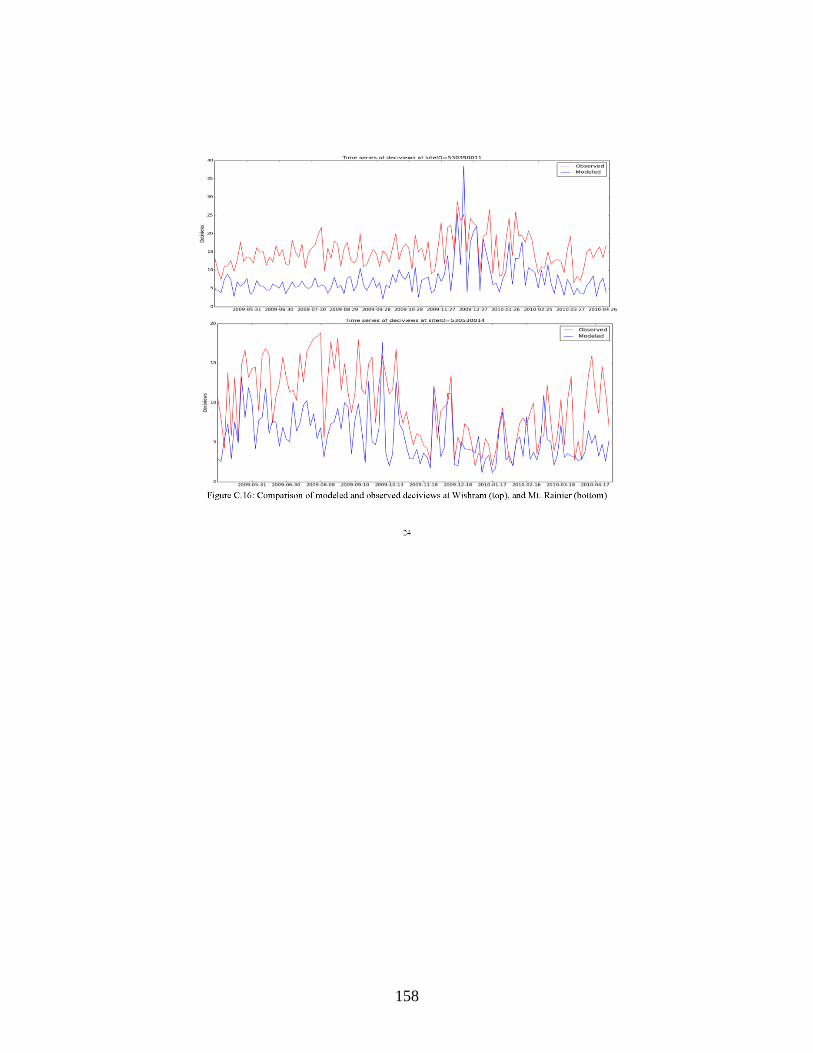
158
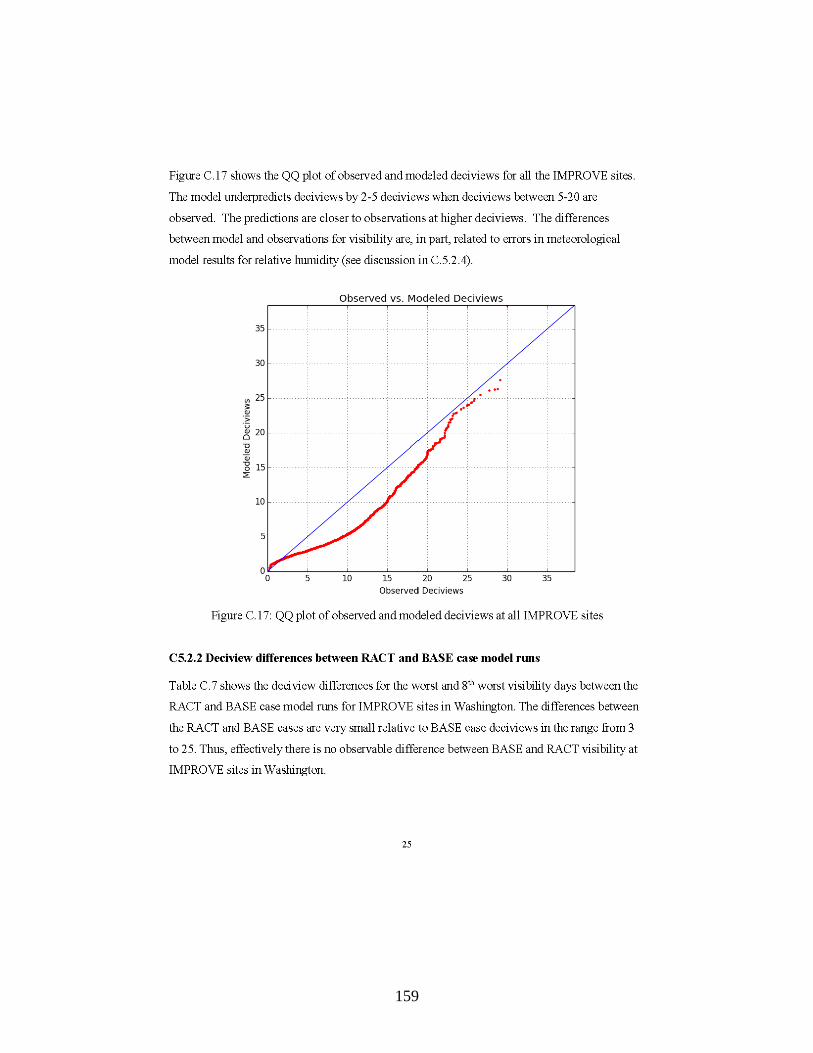
159
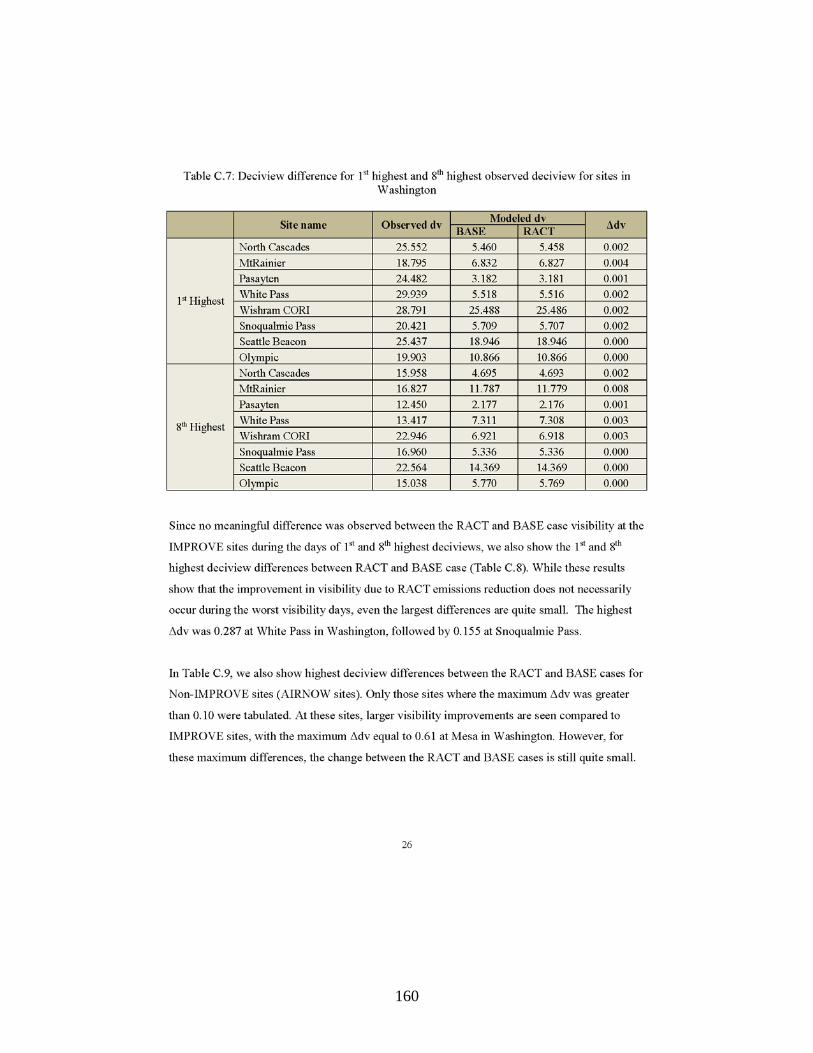
160
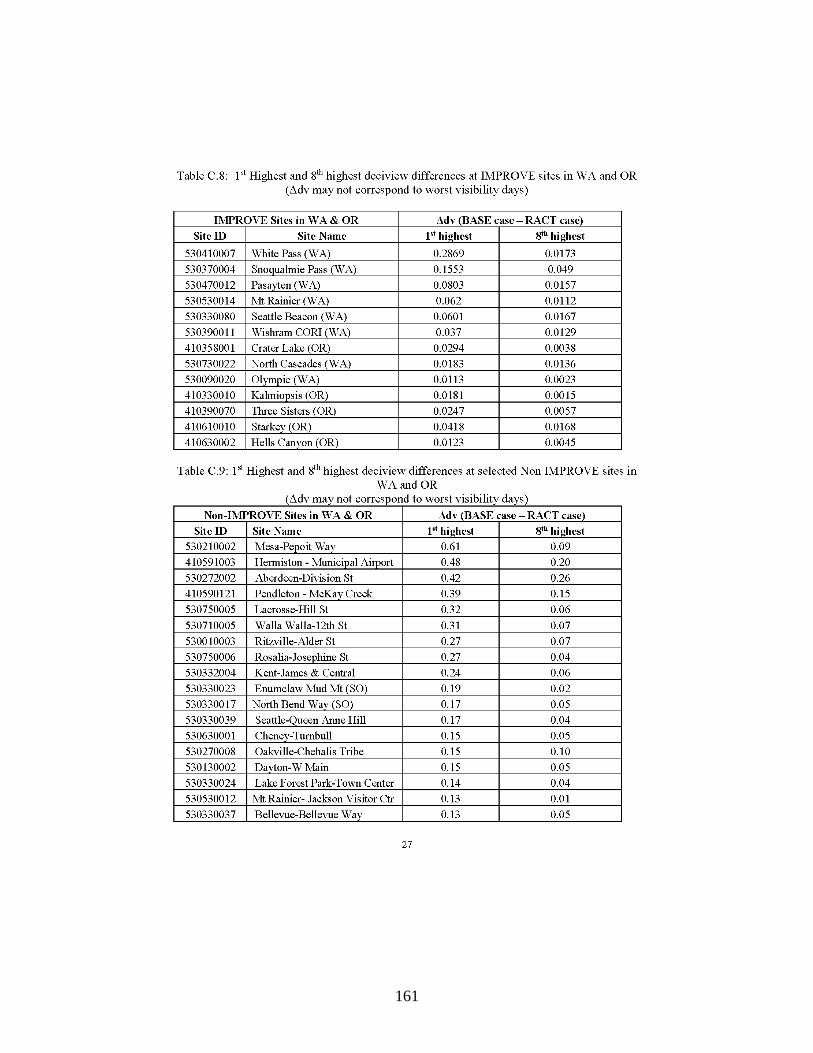
161
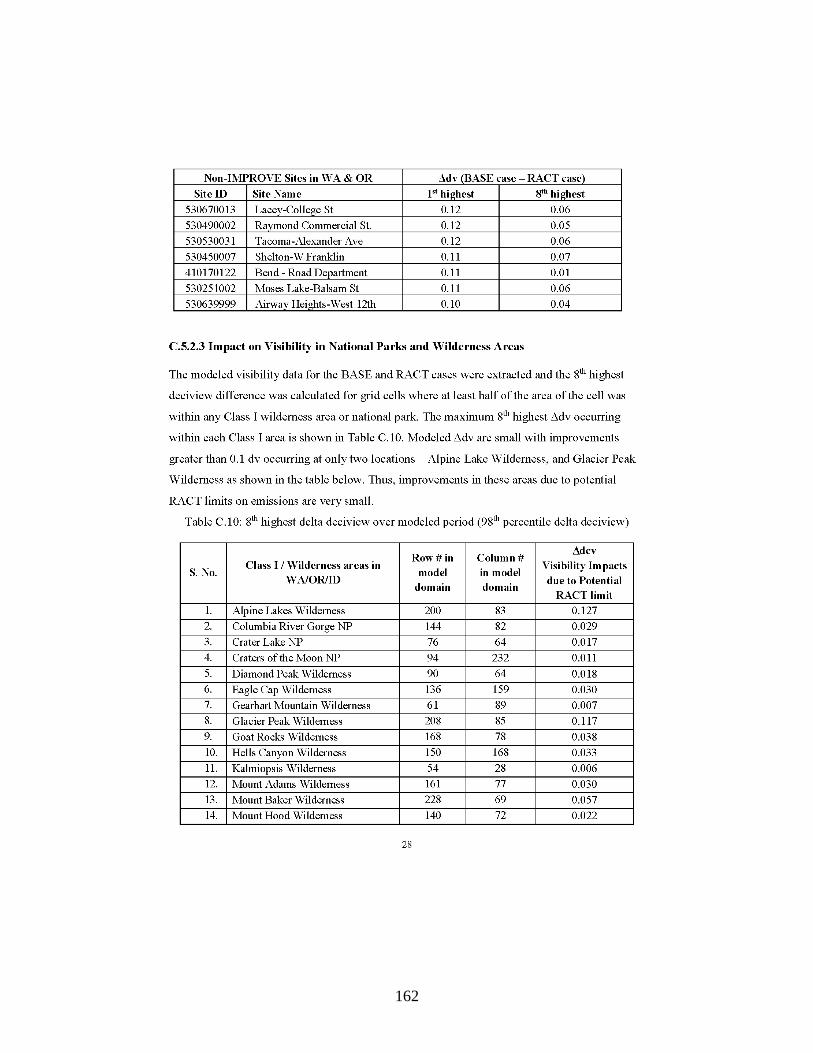
162
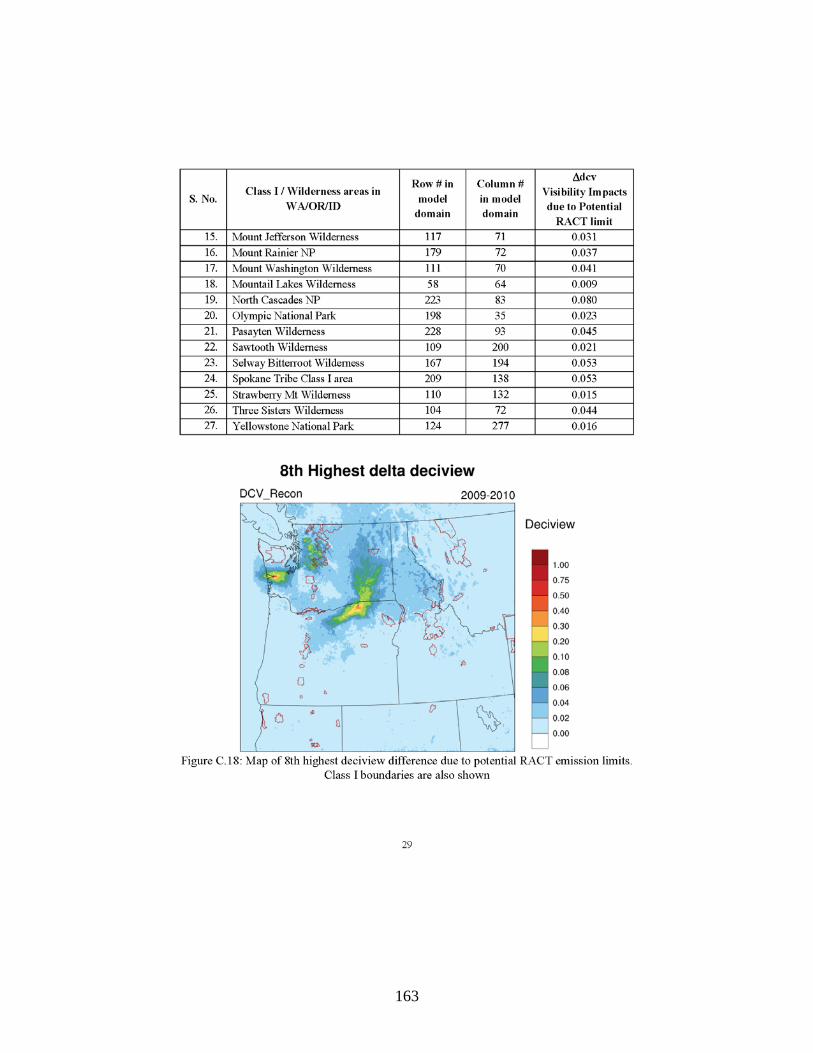
163
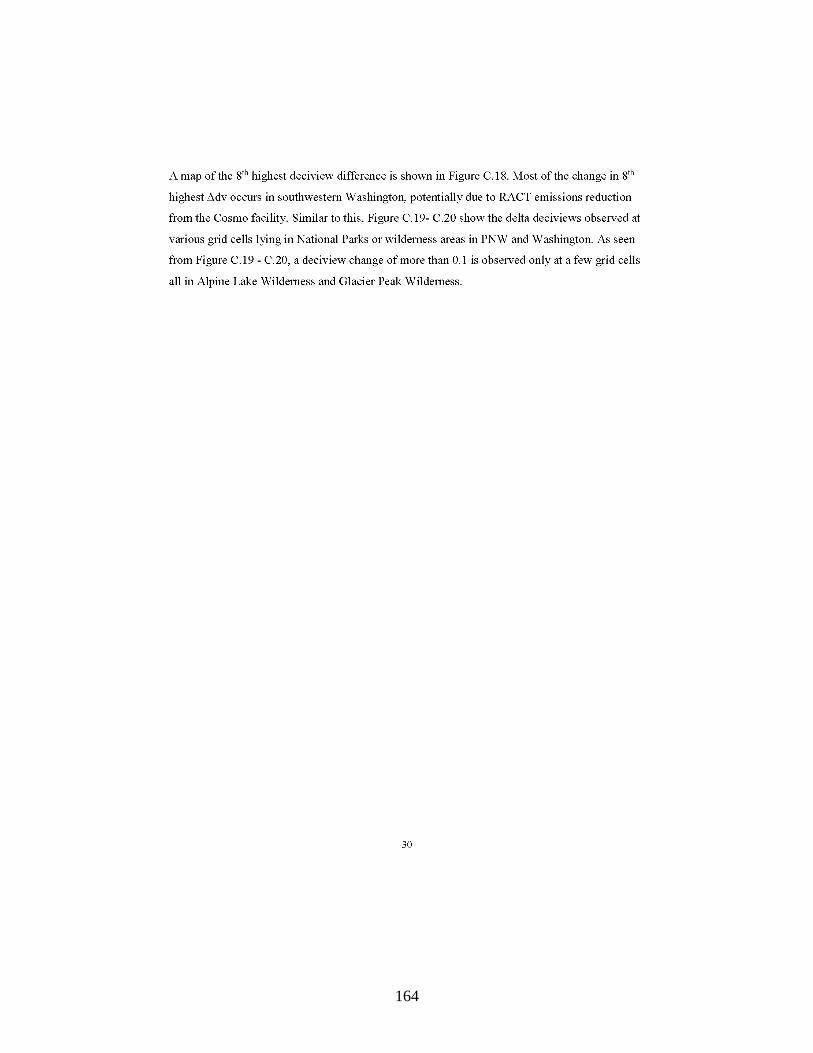
164
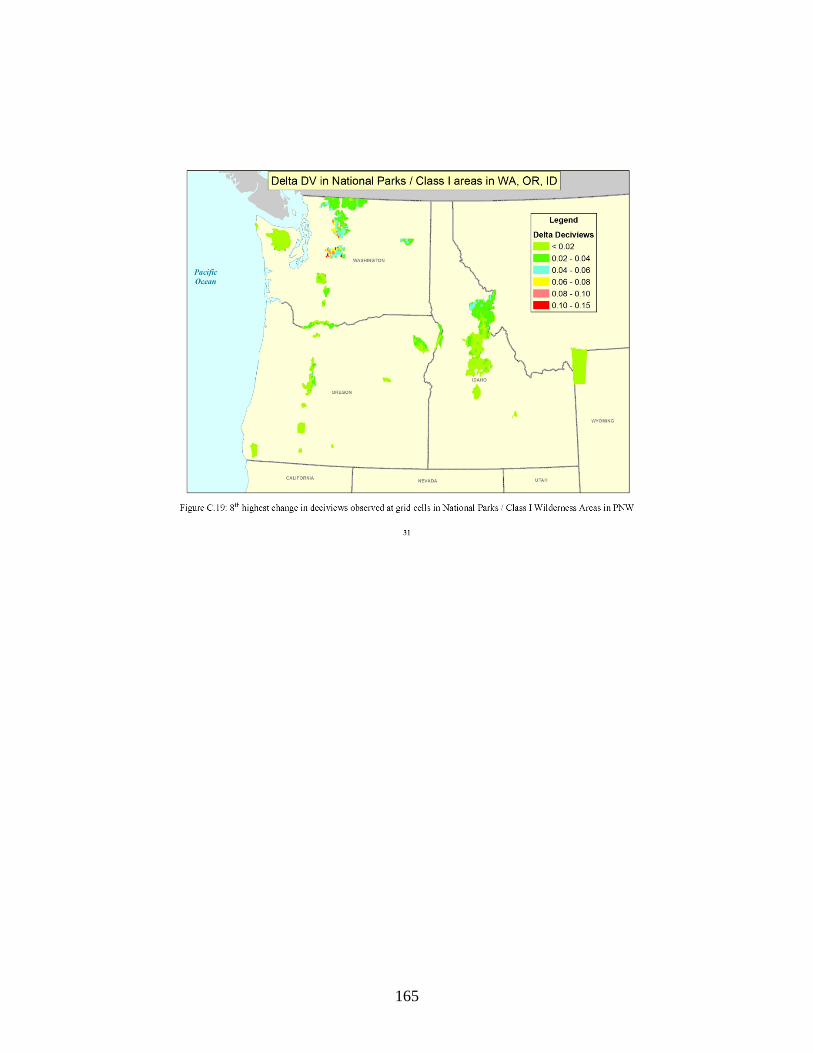
165
166
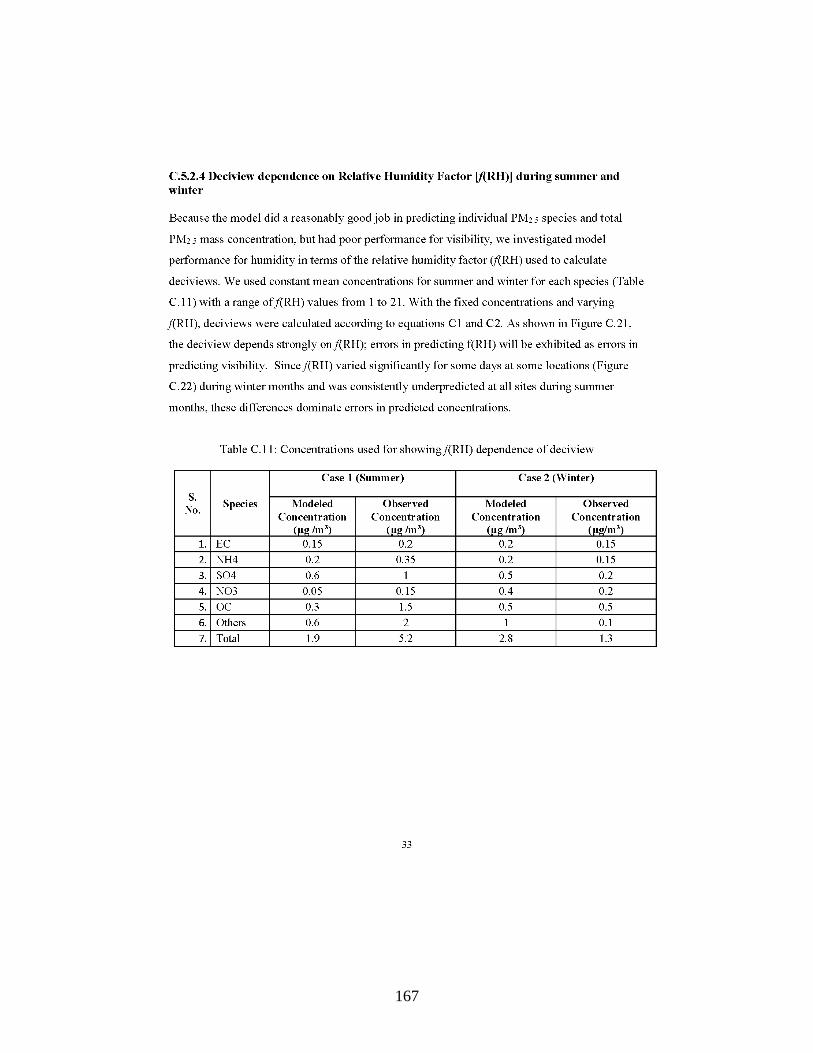
167
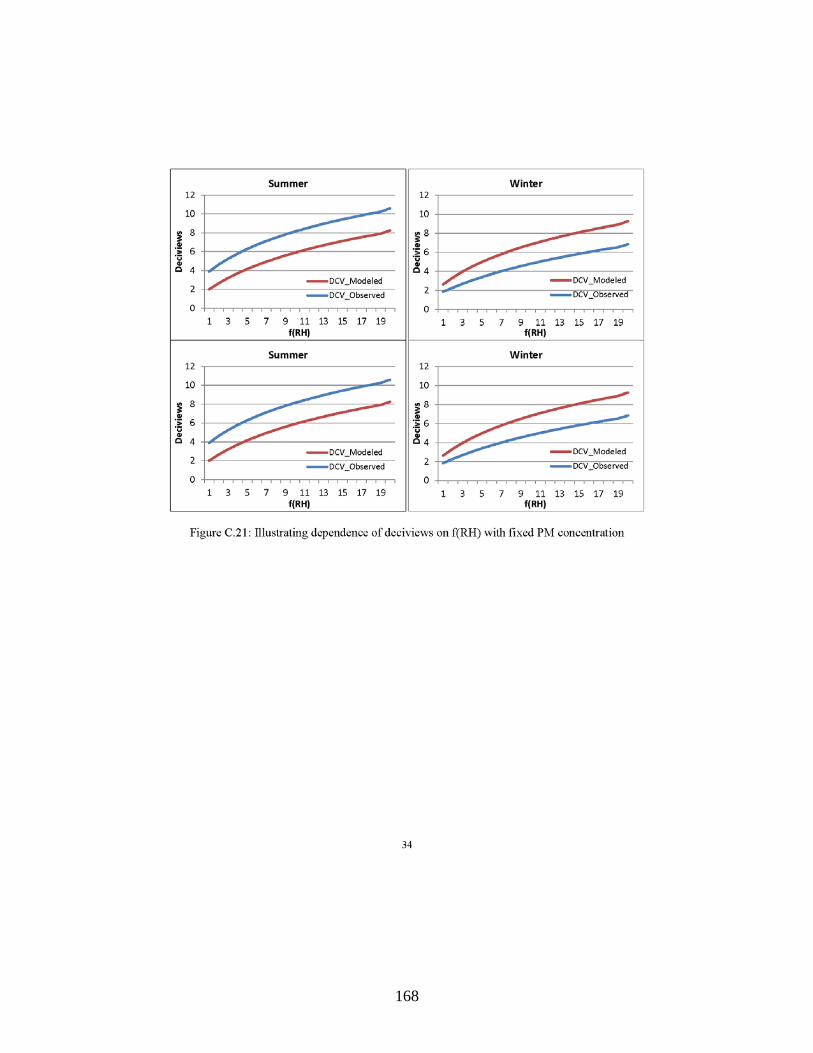
168
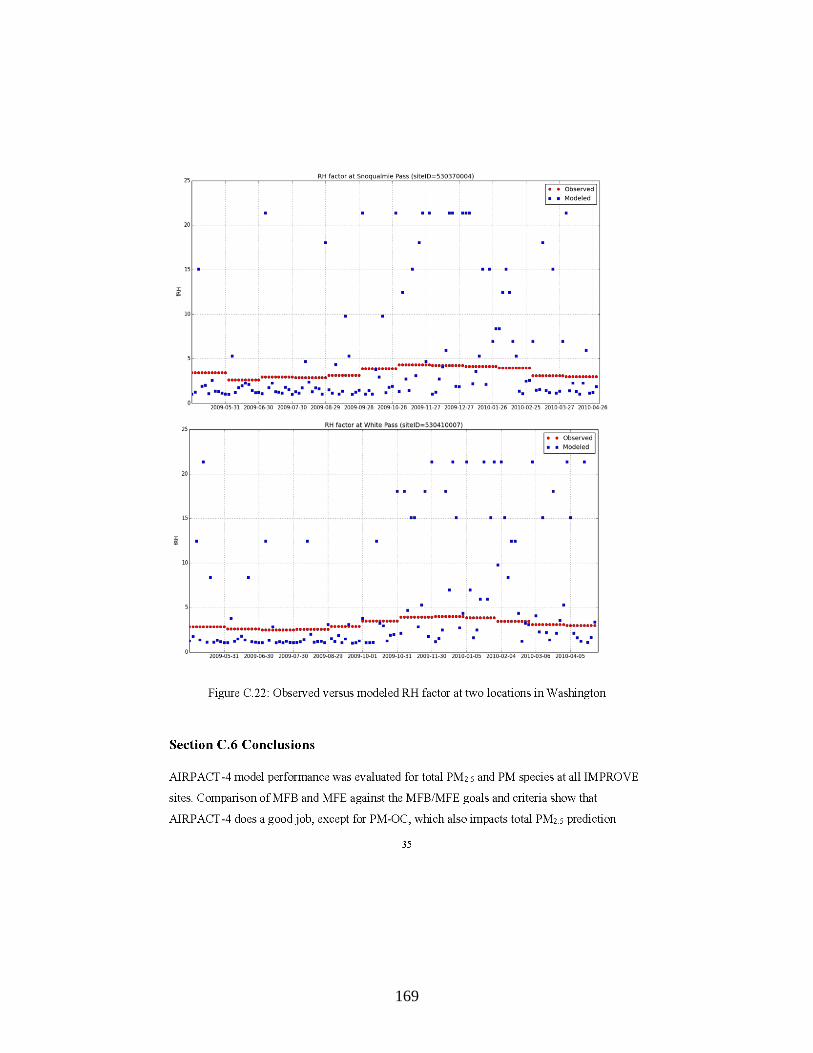
169
170

171
Appendix D. Cost Estimates
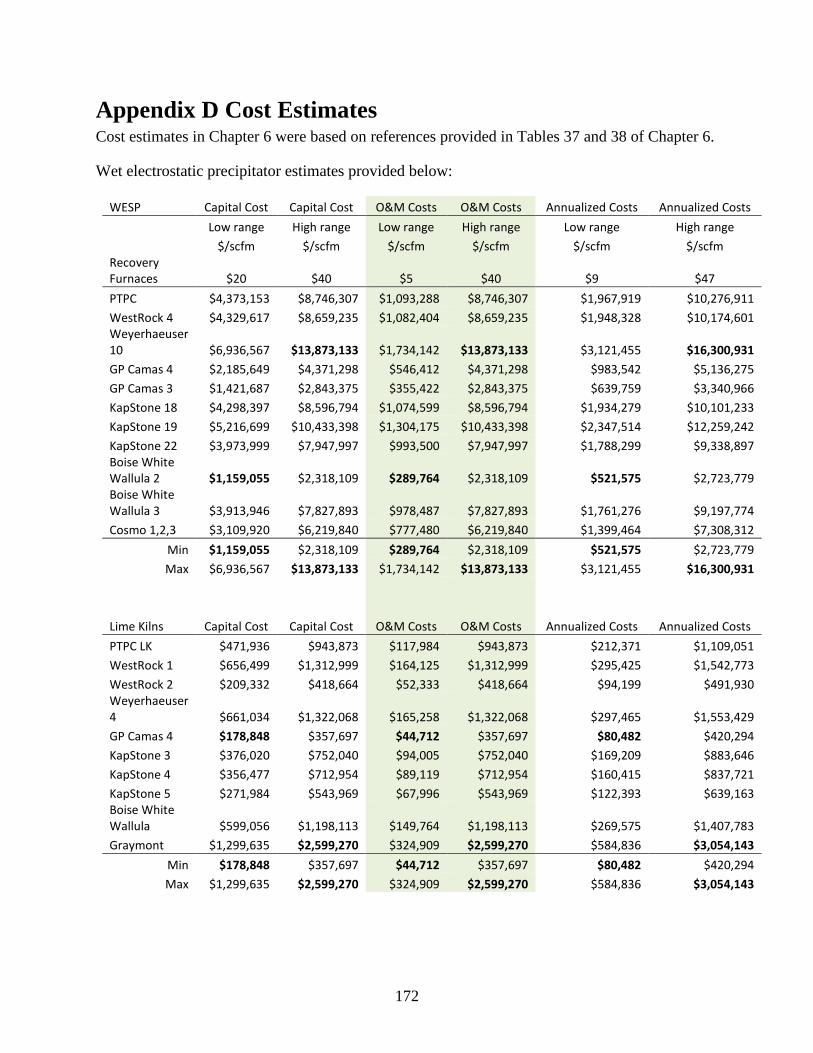
172
Appendix D Cost Estimates Cost estimates in Chapter 6 were based on references provided in Tables 37 and 38 of Chapter 6.
Wet electrostatic precipitator estimates provided below:
WESP Capital Cost Capital Cost O&M Costs O&M Costs Annualized Costs Annualized Costs
Low range High range Low range High range Low range High range
$/scfm $/scfm $/scfm $/scfm $/scfm $/scfm Recovery Furnaces $20 $40 $5 $40 $9 $47 PTPC $4,373,153 $8,746,307 $1,093,288 $8,746,307 $1,967,919 $10,276,911 WestRock 4 $4,329,617 $8,659,235 $1,082,404 $8,659,235 $1,948,328 $10,174,601 Weyerhaeuser 10 $6,936,567 $13,873,133 $1,734,142 $13,873,133 $3,121,455 $16,300,931 GP Camas 4 $2,185,649 $4,371,298 $546,412 $4,371,298 $983,542 $5,136,275 GP Camas 3 $1,421,687 $2,843,375 $355,422 $2,843,375 $639,759 $3,340,966 KapStone 18 $4,298,397 $8,596,794 $1,074,599 $8,596,794 $1,934,279 $10,101,233 KapStone 19 $5,216,699 $10,433,398 $1,304,175 $10,433,398 $2,347,514 $12,259,242 KapStone 22 $3,973,999 $7,947,997 $993,500 $7,947,997 $1,788,299 $9,338,897 Boise White Wallula 2 $1,159,055 $2,318,109 $289,764 $2,318,109 $521,575 $2,723,779 Boise White Wallula 3 $3,913,946 $7,827,893 $978,487 $7,827,893 $1,761,276 $9,197,774 Cosmo 1,2,3 $3,109,920 $6,219,840 $777,480 $6,219,840 $1,399,464 $7,308,312
Min $1,159,055 $2,318,109 $289,764 $2,318,109 $521,575 $2,723,779 Max $6,936,567 $13,873,133 $1,734,142 $13,873,133 $3,121,455 $16,300,931
Lime Kilns Capital Cost Capital Cost O&M Costs O&M Costs Annualized Costs Annualized Costs PTPC LK $471,936 $943,873 $117,984 $943,873 $212,371 $1,109,051 WestRock 1 $656,499 $1,312,999 $164,125 $1,312,999 $295,425 $1,542,773 WestRock 2 $209,332 $418,664 $52,333 $418,664 $94,199 $491,930 Weyerhaeuser 4 $661,034 $1,322,068 $165,258 $1,322,068 $297,465 $1,553,429 GP Camas 4 $178,848 $357,697 $44,712 $357,697 $80,482 $420,294 KapStone 3 $376,020 $752,040 $94,005 $752,040 $169,209 $883,646 KapStone 4 $356,477 $712,954 $89,119 $712,954 $160,415 $837,721 KapStone 5 $271,984 $543,969 $67,996 $543,969 $122,393 $639,163 Boise White Wallula $599,056 $1,198,113 $149,764 $1,198,113 $269,575 $1,407,783 Graymont $1,299,635 $2,599,270 $324,909 $2,599,270 $584,836 $3,054,143
Min $178,848 $357,697 $44,712 $357,697 $80,482 $420,294 Max $1,299,635 $2,599,270 $324,909 $2,599,270 $584,836 $3,054,143
Related Documents


