W AREHOUSING S TRATEGIES : L OCATION O PERATIONS A UTOMATION David K. Teeple Director of Client Services Dennis Heppner Manager

Welcome message from author
This document is posted to help you gain knowledge. Please leave a comment to let me know what you think about it! Share it to your friends and learn new things together.
Transcript
WAREHOUSING STRATEGIES:LOCATION
OPERATIONS
AUTOMATION
David K. TeepleDirector of Client Services
Dennis HeppnerManager

-1-1
It’s all about location, location, location…
-2-2
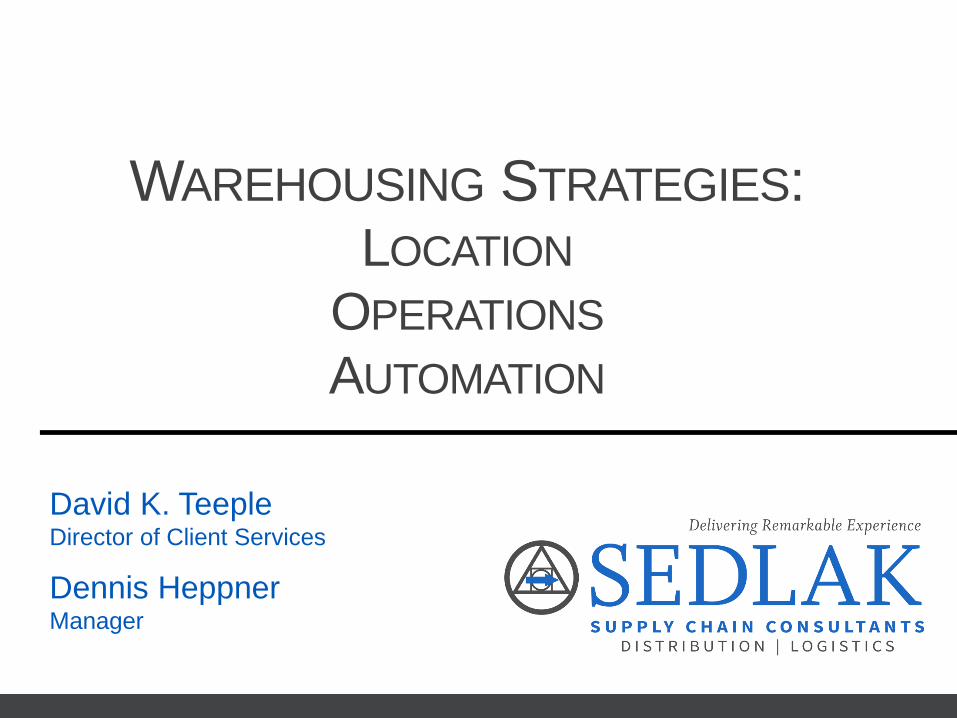
Greater Customer Demands
Competition Positioning and Evolution
Transportation Cost and Availability
Tax and Duty Changes (Especially International)
Raw Material Availability and Cost Fluctuations
Greater Focus and Opportunity in Emerging Markets
Political Upheaval
Labor Laws and Agreements
Weather Disruptions
SUPPLY CHAIN – EXTERNAL INFLUENCERS
-3-3
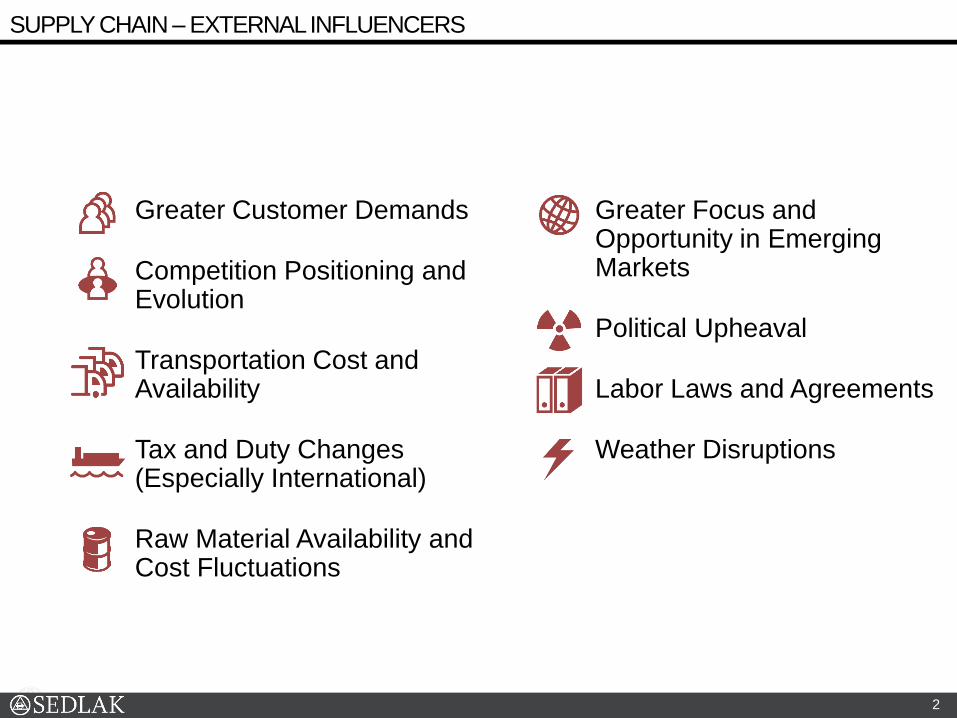
SKU Proliferation
Shortened Product Lifecycles
Evolving Business Channels (Growth of Ecommerce, Desire for Omni-channel)
Procurement Changes (On/Off Shoring, Order Qty.)
Aging Infrastructure
Fulfillment Strategy or Inventory Deployment Initiatives
Change in Other Business Strategy
Mergers and Acquisitions
Spinoffs
SUPPLY CHAIN – INTERNAL INFLUENCERS
-4-4
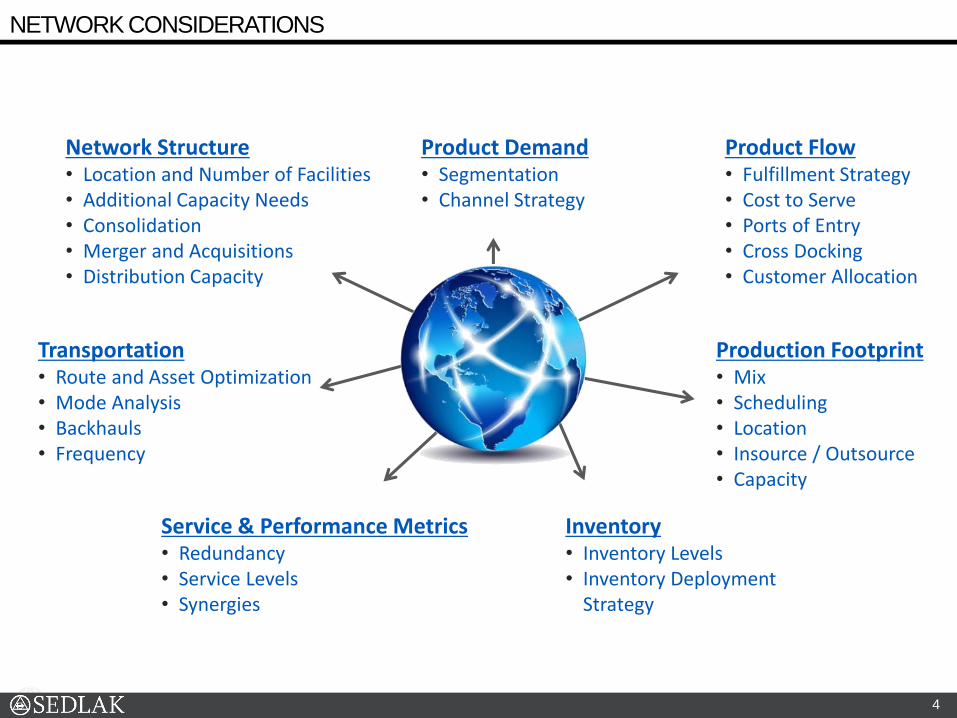
Network Structure• Location and Number of Facilities• Additional Capacity Needs• Consolidation• Merger and Acquisitions• Distribution Capacity
Inventory• Inventory Levels• Inventory Deployment
Strategy
Production Footprint• Mix• Scheduling• Location• Insource / Outsource• Capacity
Transportation• Route and Asset Optimization• Mode Analysis• Backhauls• Frequency
Product Demand• Segmentation• Channel Strategy
Product Flow• Fulfillment Strategy• Cost to Serve• Ports of Entry• Cross Docking• Customer Allocation
Service & Performance Metrics• Redundancy• Service Levels• Synergies
NETWORK CONSIDERATIONS
-5-5
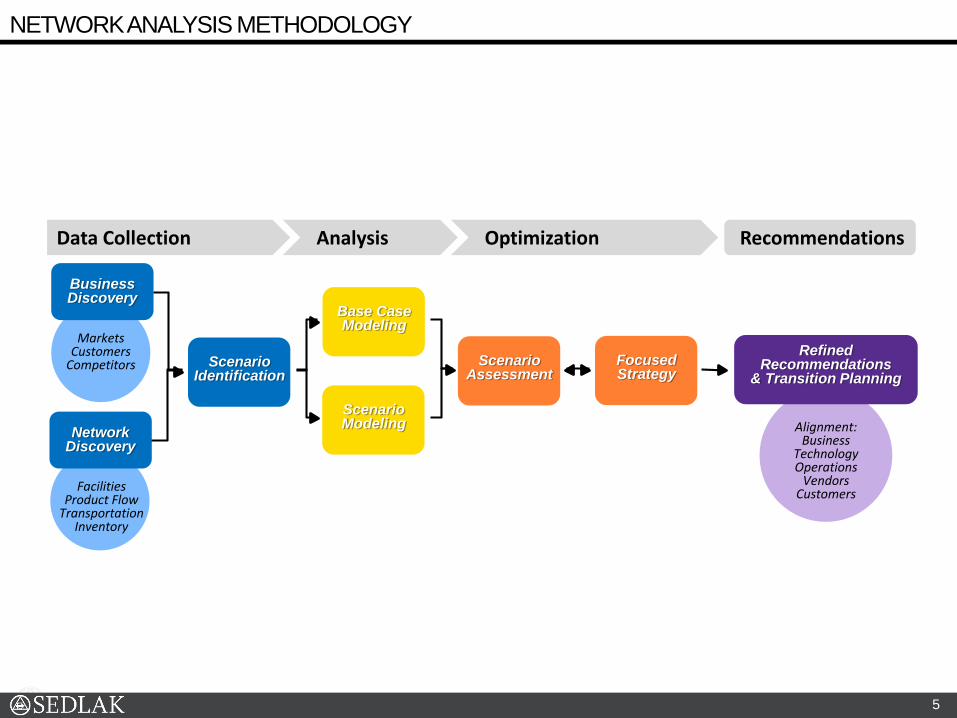
NETWORK ANALYSIS METHODOLOGY
Alignment:Business
TechnologyOperations
VendorsCustomers
4
Data Collection
MarketsCustomers
Competitors Scenario Identification
FacilitiesProduct Flow
TransportationInventory
NetworkDiscovery
BusinessDiscovery
Base Case Modeling
ScenarioModeling
Analysis
Scenario Assessment
Focused Strategy
Optimization Recommendations
Refined Recommendations
& Transition Planning

-6-6
Transportation Optimization
Inventory DeploymentFacility Design
Network Structure
Examples of Targets of
Optimization:
• Service Level
• Cost to Serve
• Consolidation / Expansion
• Leverage current assets, with considerations for potential design changes at each facility
• More mature supply chains tend to benefit from this approach, rather than a “greenfield” design strategy
• For high capital networks in mature markets – in-depth facility reviews are crucial to optimize the network
• Must be based on actual budgets, timelines, risks, expectations, roadblocks, etc.
AN INTEGRATED APPROACH IS CRITICAL
-7-7
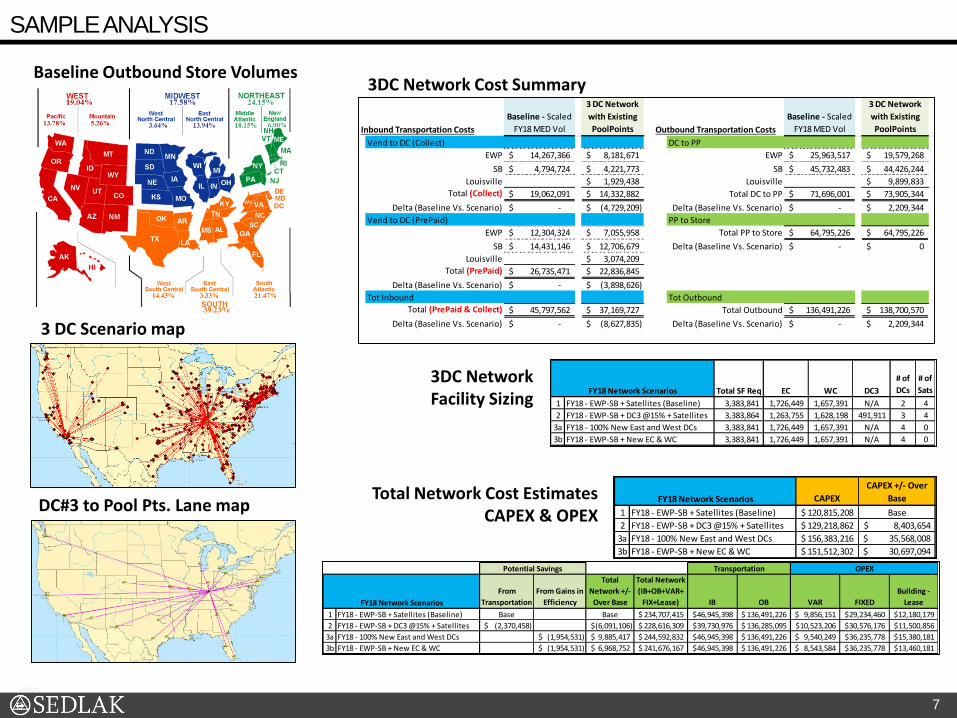
Inbound Transportation Costs
Baseline - Scaled
FY18 MED Vol
3 DC Network
with Existing
PoolPoints Outbound Transportation Costs
Baseline - Scaled
FY18 MED Vol
3 DC Network
with Existing
PoolPoints Total Transportation Costs
Baseline - Scaled
FY18 MED Vol
3 DC Network
with Existing
PoolPoints
Vend to DC (Collect) DC to PP Tot IB and OB
EWP 14,267,366$ 8,181,671$ EWP 25,963,517$ 19,579,268$ Total IB and OB (Collect ONLY) 155,553,317$ 153,033,452$
SB 4,794,724$ 4,221,773$ SB 45,732,483$ 44,426,244$ Delta (Baseline Vs. Scenario) -$ (2,519,865)$
Louisville 1,929,438$ Louisville 9,899,833$
Total (Collect) 19,062,091$ 14,332,882$ Total DC to PP 71,696,001$ 73,905,344$ Total IB and OB (Collect + PrePaid) 182,288,788$ 175,870,297$
Delta (Baseline Vs. Scenario) -$ (4,729,209)$ Delta (Baseline Vs. Scenario) -$ 2,209,344$ Delta (Baseline Vs. Scenario) -$ (6,418,491)$
Vend to DC (PrePaid) PP to Store Flow Summary (Lbs.)
EWP 12,304,324$ 7,055,958$ Total PP to Store 64,795,226$ 64,795,226$ EWP 283,601,419 211,945,023
SB 14,431,146$ 12,706,679$ Delta (Baseline Vs. Scenario) -$ 0$ SB 284,131,161 273,288,949
Louisville 3,074,209$ Louisville 82,498,609
Total (PrePaid) 26,735,471$ 22,836,845$ Total Flow 567,732,580 567,732,580
Delta (Baseline Vs. Scenario) -$ (3,898,626)$ Service Distance (Miles)
Tot Inbound Tot Outbound Vend to DC EWP 562,355 252,490
Total (PrePaid & Collect) 45,797,562$ 37,169,727$ Total Outbound 136,491,226$ 138,700,570$ SB 540,592 287,823
Delta (Baseline Vs. Scenario) -$ (8,627,835)$ Delta (Baseline Vs. Scenario) -$ 2,209,344$ Louisville 246,204
Total Distance 1,102,947 786,517
Total SF Req EC WC DC3
# of
DCs
# of
Sats
1 FY18 - EWP-SB + Satellites (Baseline) 3,383,841 1,726,449 1,657,391 N/A 2 4
2 FY18 - EWP-SB + DC3 @15% + Satellites 3,383,864 1,263,755 1,628,198 491,911 3 4
3a FY18 - 100% New East and West DCs 3,383,841 1,726,449 1,657,391 N/A 4 0
3b FY18 - EWP-SB + New EC & WC 3,383,841 1,726,449 1,657,391 N/A 4 0
FY18 Network Scenarios
CAPEX
CAPEX +/- Over
Base
1 FY18 - EWP-SB + Satellites (Baseline) 120,815,208$ Base
2 FY18 - EWP-SB + DC3 @15% + Satellites 129,218,862$ 8,403,654$
3a FY18 - 100% New East and West DCs 156,383,216$ 35,568,008$
3b FY18 - EWP-SB + New EC & WC 151,512,302$ 30,697,094$
FY18 Network Scenarios
From
Transportation
From Gains in
Efficiency
Total
Network +/-
Over Base
Total Network
(IB+OB+VAR+
FIX+Lease) IB OB VAR FIXED
Building -
Lease
1 FY18 - EWP-SB + Satellites (Baseline) Base Base 234,707,415$ 46,945,398$ 136,491,226$ 9,856,151$ 29,234,460$ 12,180,179$
2 FY18 - EWP-SB + DC3 @15% + Satellites (2,370,458)$ (6,091,106)$ 228,616,309$ 39,730,976$ 136,285,095$ 10,523,206$ 30,576,176$ 11,500,856$
3a FY18 - 100% New East and West DCs (1,954,531)$ 9,885,417$ 244,592,832$ 46,945,398$ 136,491,226$ 9,540,249$ 36,235,778$ 15,380,181$
3b FY18 - EWP-SB + New EC & WC (1,954,531)$ 6,968,752$ 241,676,167$ 46,945,398$ 136,491,226$ 8,543,584$ 36,235,778$ 13,460,181$
Potential Savings OPEX
FY18 Network Scenarios
Transportation
Total Network Cost Estimates CAPEX & OPEX
DC#3 to Pool Pts. Lane map
3DC Network Cost SummaryBaseline Outbound Store Volumes
3DC Network Facility Sizing
3 DC Scenario map
SAMPLE ANALYSIS
-8-8
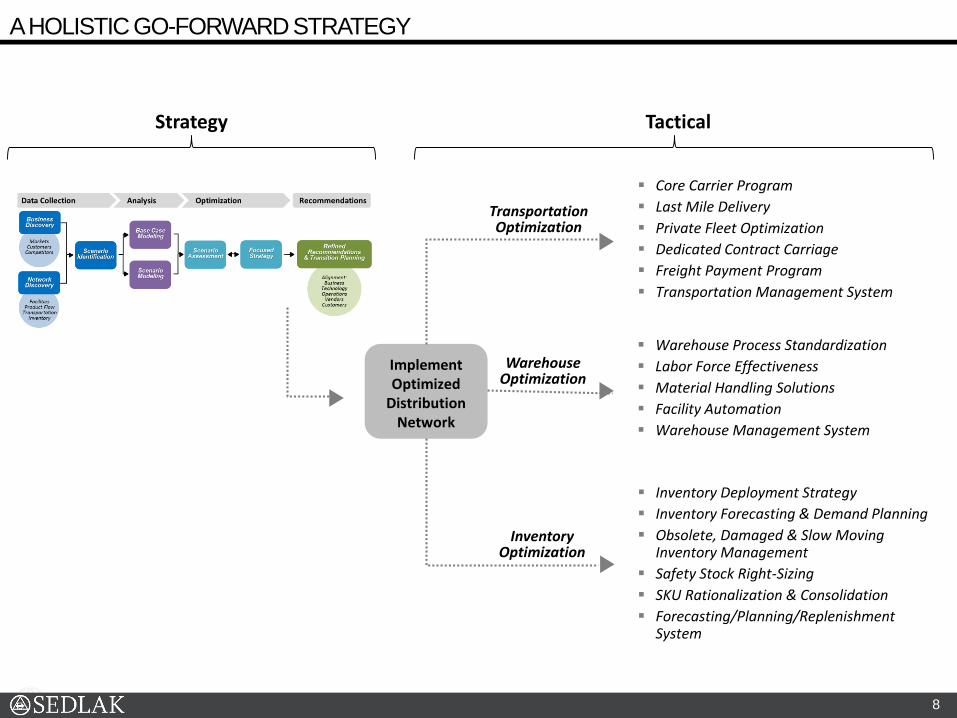
A HOLISTIC GO-FORWARD STRATEGY
Core Carrier Program
Last Mile Delivery
Private Fleet Optimization
Dedicated Contract Carriage
Freight Payment Program
Transportation Management System
Warehouse Process Standardization
Labor Force Effectiveness
Material Handling Solutions
Facility Automation
Warehouse Management System
Inventory Deployment Strategy
Inventory Forecasting & Demand Planning
Obsolete, Damaged & Slow Moving Inventory Management
Safety Stock Right-Sizing
SKU Rationalization & Consolidation
Forecasting/Planning/Replenishment System
Implement Optimized
Distribution Network
Strategy Tactical
Transportation Optimization
WarehouseOptimization
InventoryOptimization

-9-9
Supply Chains are Faced with Mounting Internal and External Pressures
Key Steps to Design your Future Supply Chain:
► Determine Your Future Supply Chain Needs
► Develop Alternatives How to Best Accomplish
► Model the Scenarios
► Finalize the Business Case for the Solution
New Technologies Make it Easier than Ever to:
► Visualize
► Evaluate Scenarios
► Conduct Sensitivity Tests
► Simulate Future Network
Tools are Only as Powerful as the Inputs and Those Driving the Analysis
KEY TAKEAWAYS

-10-10
…and then you need to make it work.

-11-11
WAREHOUSE DESIGN & OPERATIONS
The key to good warehouse design is the integration of these factors to create a single, well-functioning system
Operations Optimization
Process Focus
Design Impact
Smooth Flow
Maximize
effectiveness of
1) production
process
2) human capital
Ensure smooth flow of
work, material and
information through
the system
Good design is process-
oriented and builds from
the inside out
Consider how
layout and
design will
impact how the
work is done
-12-12
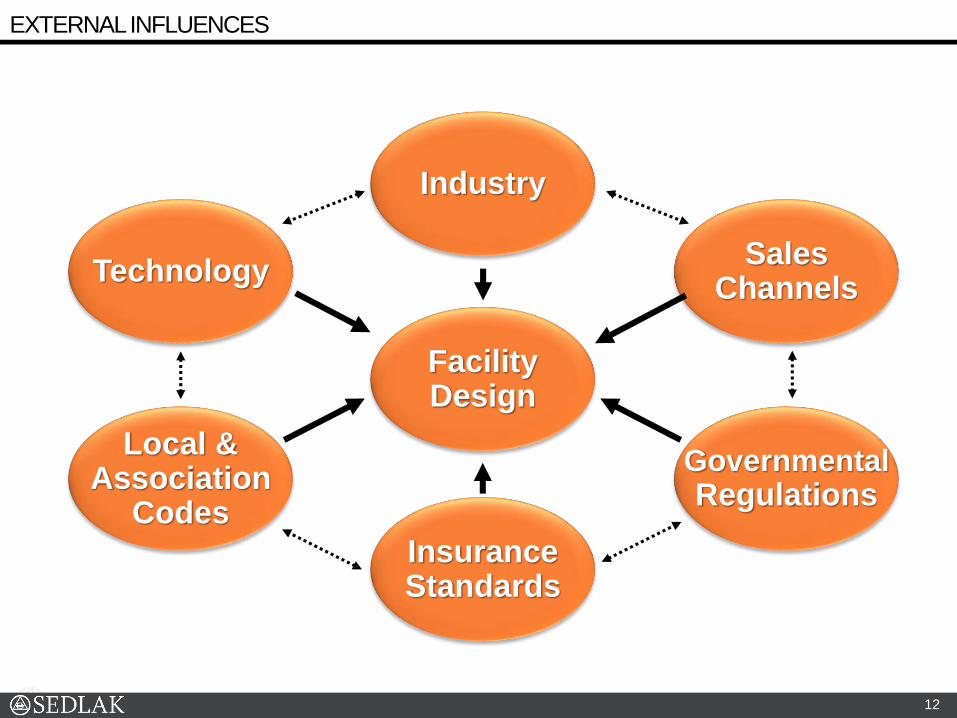
Technology
GovernmentalRegulations
SalesChannels
InsuranceStandards
Industry
FacilityDesign
Local &Association
Codes
EXTERNAL INFLUENCES
-13-13
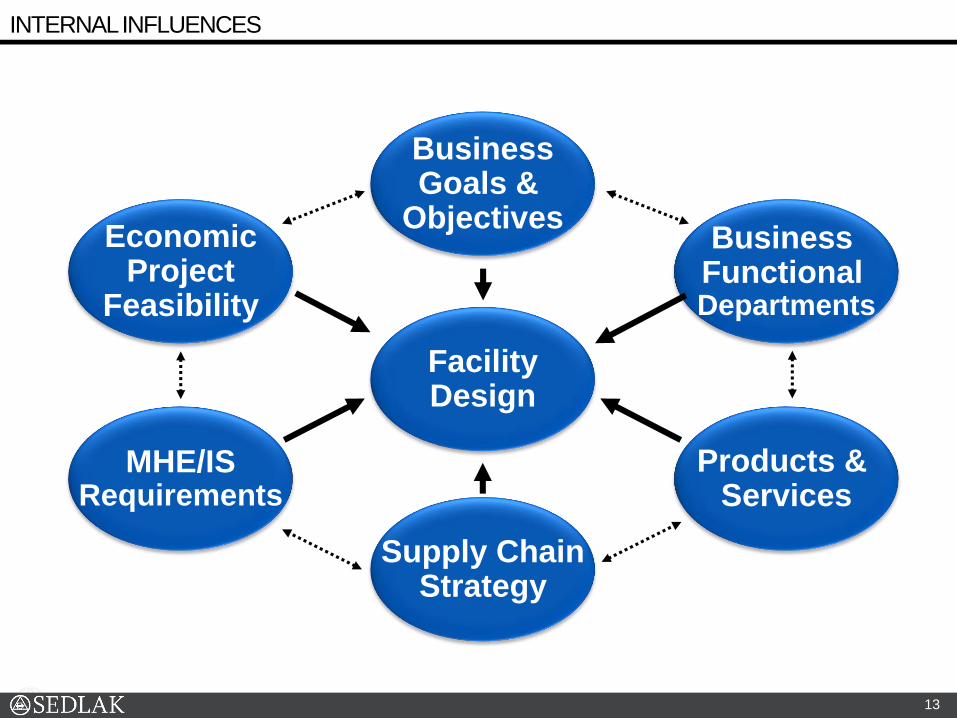
EconomicProject
Feasibility
Products & Services
Business Functional Departments
Supply ChainStrategy
BusinessGoals &
Objectives
FacilityDesign
MHE/ISRequirements
INTERNAL INFLUENCES

-14-14
DESIGN CRITERIA : THE FOUNDATION OF ANY DESIGN
Base year plus 5 years of projections
Data collection
► develop questionnaires
► observe current processes
► management interviews
Current information system
Current labor budgets
Goals & objectives of new facility

-15-15
DESIGN CRITERIA
Business Projections & Forecasts
► revenues
► annual units, cartons & pallets handled
► peak SKUs & inventory levels
► peak to average ratio
► utilization factors
Strategic Business Growth Plan
► acquisition
► new product lines
► brand marketing
► additional distribution channels

-16-16
DESIGN CRITERIA
-17-17
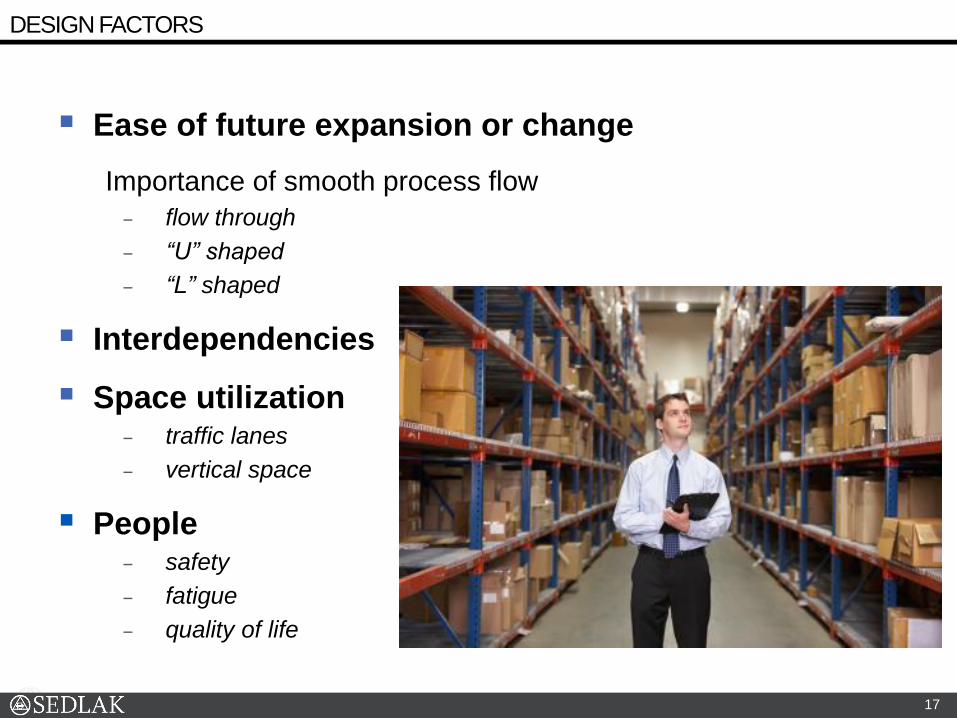
DESIGN FACTORS
Ease of future expansion or change
Importance of smooth process flow
‒ flow through
‒ “U” shaped
‒ “L” shaped
Interdependencies
Space utilization‒ traffic lanes
‒ vertical space
People‒ safety
‒ fatigue
‒ quality of life

-18-18
Concept Side-by-Side ComparisonReserve Storage #1 #2 #3 #4
38'-0" Conventional 65'-0" Highbay 65'-0" Highbay 65'-0" Highbay
Order Picker and
Turret TruckTurret Truck Stacker Crane
AS/RS
Mini-Load and
Unit-LoadREQUIREMENTS
Total Inventory Units - Peak 18,473,011 18,473,011 18,473,011 18,473,011
Storage Pallets - Peak @ 70% Utilization 14,147 14,147 14,147 14,147
Storage Cases - Peak @ 85% Utilization 318,918 318,918 318,918 318,918
BUILDING COST
Total Area Required (sq. ft.) 263,902 160,683 147,142 110,886
Bldg Construction Capital Cost $17,153,604 $17,675,096 $16,185,631 $12,197,510
Annualized Building Cost (Purchase) $857,680 $883,755 $809,282 $609,876
Utilities Cost $1,002,826 $610,594 $559,140 $421,369
Total Building Costs $1,860,506 $1,494,349 $1,368,422 $1,031,244
Rank: Bldg Cost (1 = Best) 3 4 2 1
LABOR COST (Based on average volumes)
Total FTEs 28.0 28.0 20.6 2.2
Fully Loaded Annual Wage Costs $1,347,346 $1,347,346 $994,200 $104,415
Rank: Labor Cost (1 = Best) 3 3 2 1
LABOR + UTILITIES COST
Annual Labor + Annual Utilities $2,350,172 $1,957,940 $1,553,340 $525,783
Rank: Labor + Utilities Cost (1 = Best) 4 3 2 1
EQUIPMENT COST
Total Equipment Costs $5,099,622 $9,055,449 $10,796,631 $15,974,435
Annualized Equipment Costs $509,962 $905,545 $1,079,663 $1,597,443
Rank: Equipment Cost (1 = Best) 1 2 3 4
PAYBACK ANALYSIS
Total Capital Cost $22,253,225 $26,730,545 $26,982,261 $28,171,945
Total Capital Cost Rank 1 2 3 4
Labor + Utilities Costs vs. Baseline Concept $0 -$392,232 -$796,832 -$1,824,389
Incremental Capital Cost vs. Baseline Concept $0 $4,477,319 $4,729,036 $5,918,719
Payback vs. Baseline Concept Base 11.4 5.9 3.2
TOTAL ANNUALIZED COST
Total Annualized Cost - Labor, Util, Building, MHE $3,717,814 $3,747,240 $3,442,285 $2,733,102
Total Annualized Cost Rank 3 4 2 1
CONCEPTUAL DESIGN
Identify appropriate material handling concepts
Automation
Develop equipment costs per concept
Develop square footage required per concept
Develop building costs per concept
Estimate labor based on productivity per concept
Evaluate above on an annualized basis

-19-19
TRENDS DRIVING AUTOMATED SOLUTIONS
Shortage of labor
Need for speed and accuracy
Ability to respond to seasonal spikes in throughput
Real time control of inventory and order fulfillment status
Productivity levels
Space utilization
Multi-channel operations

-20-20
SOME TYPES OF AUTOMATION
Conveyor Systems
Sortation Systems
Goods-to Person
ASRS
Automated Guided
Vehicles (AGVs)
Robotics

-21-21
LAYOUT DEVELOPMENT
Develop block layouts
Test out various options
Determine the cost factors and the intangibles
Seek input from key stakeholders including maintenance.
Equip for the short term but understand what the design year looks like

-22-22
QUESTIONS?
-23-23
THANK YOU!
22901 MILLCREEK BLVD. SUITE 600 CLEVELAND, OH 44122-5724
216.206.4700 216.206.4848 (FAX) JASEDLAK.COM
DAVID K. TEEPLE
DIRECTOR OF CLIENT SERVICES
216.206.4752
DENNIS HEPPNER
MANAGER
216.206.4764
Related Documents