Walt Petersen and Kevin Knupp UAH/ESSC November 7, 2007 [email protected] UAH THOR Center Radar Infrastructure: Exploring QPE Algorithm Development for Operational Support of TVA River Management KBMX RSA 68 km KGWX UAH/NSSTC THOR Center and Hazardous Weather Testbed MIPS/NSSTC ARMOR KHTX 75 DD lobe 1 km Res. 1.5 km Res. LMA 100-500 m LMA Antenna NEXRAD ARMOR MIPS Profiler MAX ? MAX Outline •Objectives for TVA-UAH interaction •Radar QPE Problem, Dual-pol solution •Brief overview of dual-pol •How do we improve QPE •UAH/NSSTC infrastructure •Simple example •data processing/flow •Rainfall algorithm •Where we are: Example products •The future •Appendix: BREAM

Walt Petersen and Kevin Knupp UAH/ESSC November 7, 2007 [email protected] UAH THOR Center Radar Infrastructure: Exploring QPE Algorithm Development.
Dec 17, 2015
Welcome message from author
This document is posted to help you gain knowledge. Please leave a comment to let me know what you think about it! Share it to your friends and learn new things together.
Transcript
Walt Petersen and Kevin Knupp UAH/ESSC
November 7, 2007
UAH THOR Center Radar Infrastructure: Exploring QPE Algorithm Development for Operational Support of TVA River Management
KBMX
RSA
68 km
KGWX
UAH/NSSTC THOR Center and Hazardous Weather Testbed
MIPS/NSSTC
ARMOR
KHTX
75
DD lobe
1 km Res.
1.5 km Res.
LMA 100-500 m
LMA Antenna
NEXRAD
ARMOR
MIPS Profiler
MAX ?
MAX
Outline• Objectives for TVA-UAH interaction• Radar QPE Problem, Dual-pol solution
• Brief overview of dual-pol• How do we improve QPE
• UAH/NSSTC infrastructure• Simple example• data processing/flow• Rainfall algorithm
• Where we are: Example products• The future• Appendix: BREAM
24 Hour Rain Totals July 6, 2007
0
0.5
1
1.5
2
2.5
3
3.5
4
4.5
0 0.5 1 1.5 2 2.5 3 3.5 4 4.5
Rain Gauge (inches)
Rad
ar (
inch
es)
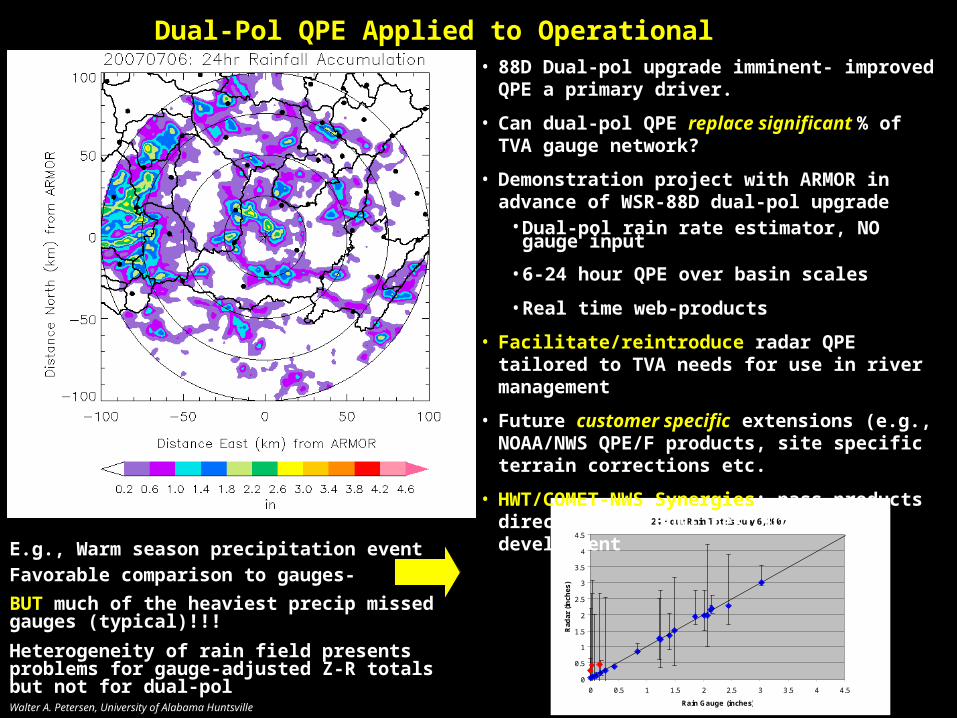
• 88D Dual-pol upgrade imminent- improved QPE a primary driver.
• Can dual-pol QPE replace significant % of TVA gauge network?
• Demonstration project with ARMOR in advance of WSR-88D dual-pol upgrade
• Dual-pol rain rate estimator, NO gauge input
• 6-24 hour QPE over basin scales
• Real time web-products
• Facilitate/reintroduce radar QPE tailored to TVA needs for use in river management
• Future customer specific extensions (e.g., NOAA/NWS QPE/F products, site specific terrain corrections etc.
• HWT/COMET-NWS Synergies: pass products direct to WFO HUN- test utility, development
E.g., Warm season precipitation event Favorable comparison to gauges-
BUT much of the heaviest precip missed gauges (typical)!!!
Heterogeneity of rain field presents problems for gauge-adjusted Z-R totals but not for dual-pol
Dual-Pol QPE Applied to Operational Hydrology
Walter A. Petersen, University of Alabama Huntsville
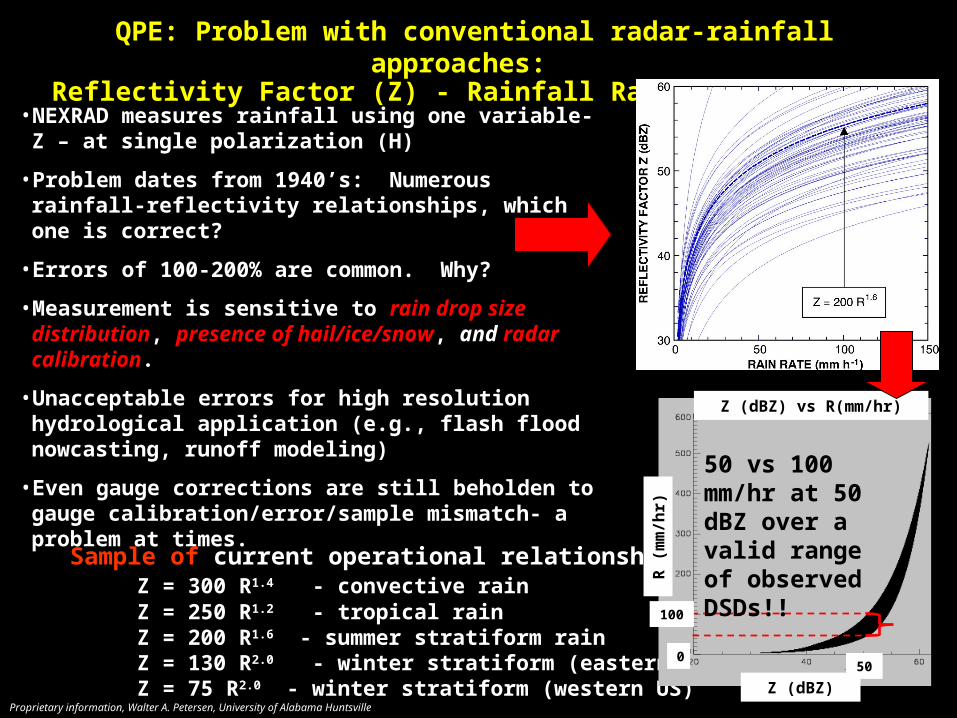
QPE: Problem with conventional radar-rainfall approaches: Reflectivity Factor (Z) - Rainfall Rate (R) Relations
Sample of current operational relationships:Z = 300 R1.4 - convective rain Z = 250 R1.2 - tropical rain
Z = 200 R1.6 - summer stratiform rainZ = 130 R2.0 - winter stratiform (eastern US)Z = 75 R2.0 - winter stratiform (western US)
• NEXRAD measures rainfall using one variable- Z – at single polarization (H)
• Problem dates from 1940’s: Numerous rainfall-reflectivity relationships, which one is correct?
• Errors of 100-200% are common. Why?
• Measurement is sensitive to rain drop size distribution, presence of hail/ice/snow, and radar calibration.
• Unacceptable errors for high resolution hydrological application (e.g., flash flood nowcasting, runoff modeling)
• Even gauge corrections are still beholden to gauge calibration/error/sample mismatch- a problem at times.
Z (dBZ)
R (
mm
/hr)
Z (dBZ) vs R(mm/hr)
50 vs 100 mm/hr at 50 dBZ over a valid range of observed DSDs!!
0
100
50
Proprietary information, Walter A. Petersen, University of Alabama Huntsville

Polarimetric Radar Variables1. Reflectivity factor Z at horizontal polarization
- Measure of drop size and concentration;
• most sensitive to SIZE (D6)
2. Differential reflectivity ZDR
- Measure of median drop diameter→ SIZE/SHAPE
- Useful for rain / hail / snow discrimination→ SIZE/SHAPE
3. Differential phase ΦDP (Specific Differential Phase- KDP)
- Measure of content and size→ NUMBER/SHAPE
- Immune to radar miscalibration, attenuation, and partial beam blockage
4. Copolar-correlation coefficient ρhv
- Indicator of mixed precipitation → SHAPE/PHASE/CANTING (Depolarization)
- Useful for identifying non-meteorological scatterers
U.S. Research
NCAR
NSSL
CSU
NASA
UND
NOAA ESRL
UMASS
UAH ARMOR
Operational:
NEXRAD, TV
Advantages: Obtain a better description of particle types and shapes in a given volume of space
• More accurate rain rates (improved QPE)
• Hydrometeor ID and non-meteorological scatterers
• Consistent calibration
U.S. BroadcastHuntsvilleNew YorkHoustonChicagoTampa
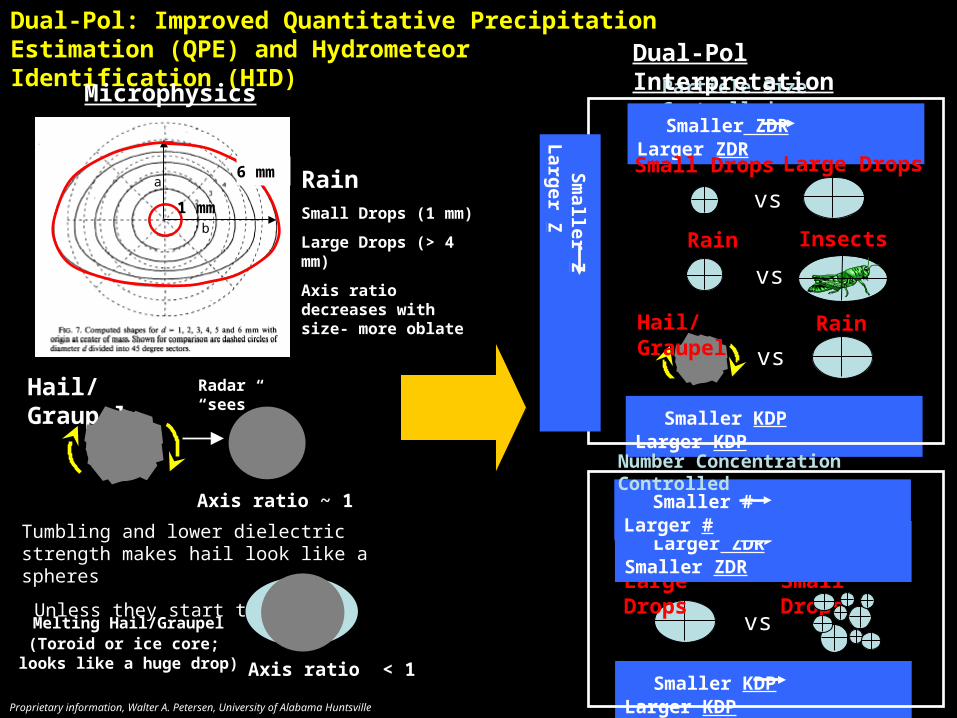
Dual-Pol: Improved Quantitative Precipitation Estimation (QPE) and Hydrometeor Identification (HID)
Radar “sees”
Tumbling and lower dielectric strength makes hail look like a spheres
Unless they start to melt…
Hail/Graupel
Melting Hail/Graupel(Toroid or ice core;
looks like a huge drop)
a
b
1 mm
6 mm
Axis ratio ~ 1
Axis ratio < 1
RainSmall Drops (1 mm)
Large Drops (> 4 mm)
Axis ratio decreases with size- more oblate
Particle-Size Controlled
Smaller ZDR Larger ZDR
Smaller KDP Larger KDP
vs
vs
InsectsRain
vs
Hail/Graupel Rain
Small Drops Large Drops
Sm
aller Z
Larg
er Z
Small Drops
vs
Large Drops
Smaller KDP Larger KDP
Larger ZDR Smaller ZDR
Smaller # Larger #
Number Concentration Controlled
Microphysics
Dual-Pol Interpretation
Proprietary information, Walter A. Petersen, University of Alabama Huntsville
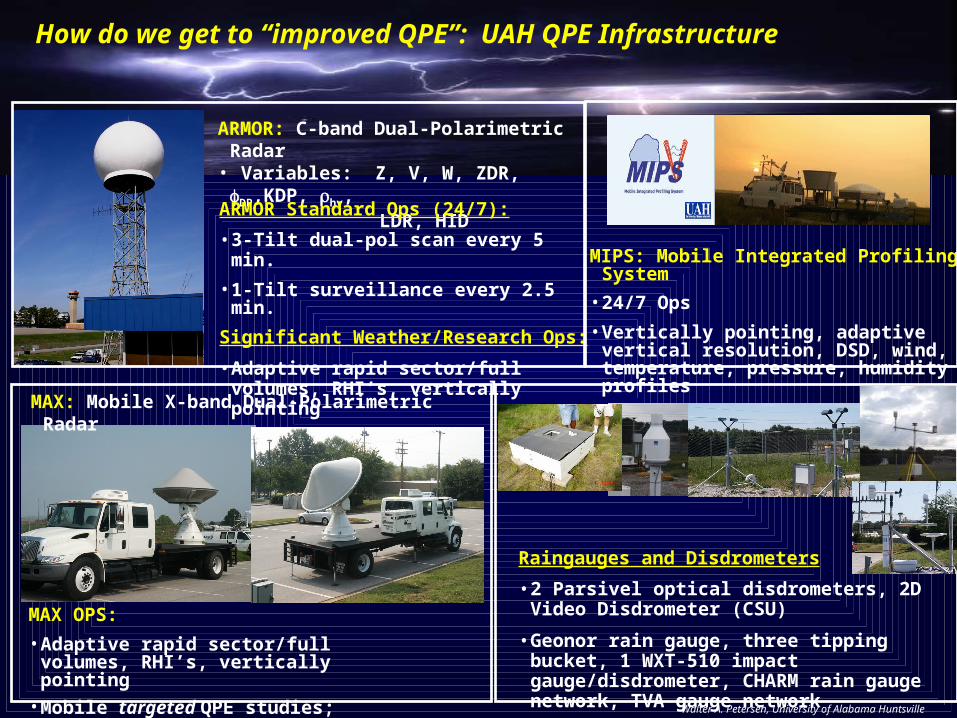
How do we get to “improved QPE”: UAH QPE Infrastructure
Walter A. Petersen, University of Alabama Huntsville
MAX: Mobile X-band Dual-Polarimetric Radar
MAX OPS:
• Adaptive rapid sector/full volumes, RHI’s, vertically pointing
• Mobile targeted QPE studies; severe wx
Raingauges and Disdrometers
• 2 Parsivel optical disdrometers, 2D Video Disdrometer (CSU)
• Geonor rain gauge, three tipping bucket, 1 WXT-510 impact gauge/disdrometer, CHARM rain gauge network, TVA gauge network
ARMOR: C-band Dual-Polarimetric Radar• Variables: Z, V, W, ZDR, DP,KDP, hv,
LDR, HID
ARMOR Standard Ops (24/7):
• 3-Tilt dual-pol scan every 5 min.
• 1-Tilt surveillance every 2.5 min.
Significant Weather/Research Ops:
• Adaptive rapid sector/full volumes, RHI’s, vertically pointing
MIPS: Mobile Integrated Profiling System
• 24/7 Ops
• Vertically pointing, adaptive vertical resolution, DSD, wind, temperature, pressure, humidity profiles
HID Z hv
ZDR KDP DP
Drizzle
Lt. Rain
Mod. Rain
Heavy Rain
Hail
Hail/Rain
Small Hail
Rain/Sm. Hail
Dry Snow
Wet Snow
Cloud
Ice Crys.
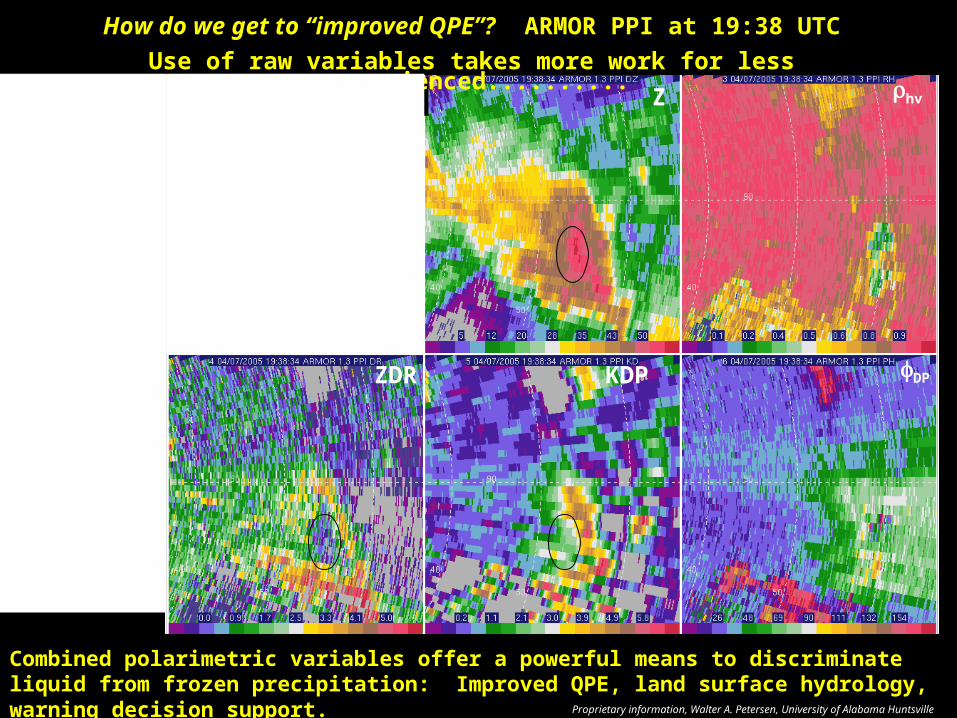
How do we get to “improved QPE”? ARMOR PPI at 19:38 UTC
Use of raw variables takes more work for less experienced..........
Combined polarimetric variables offer a powerful means to discriminate liquid from frozen precipitation: Improved QPE, land surface hydrology, warning decision support.
Proprietary information, Walter A. Petersen, University of Alabama Huntsville
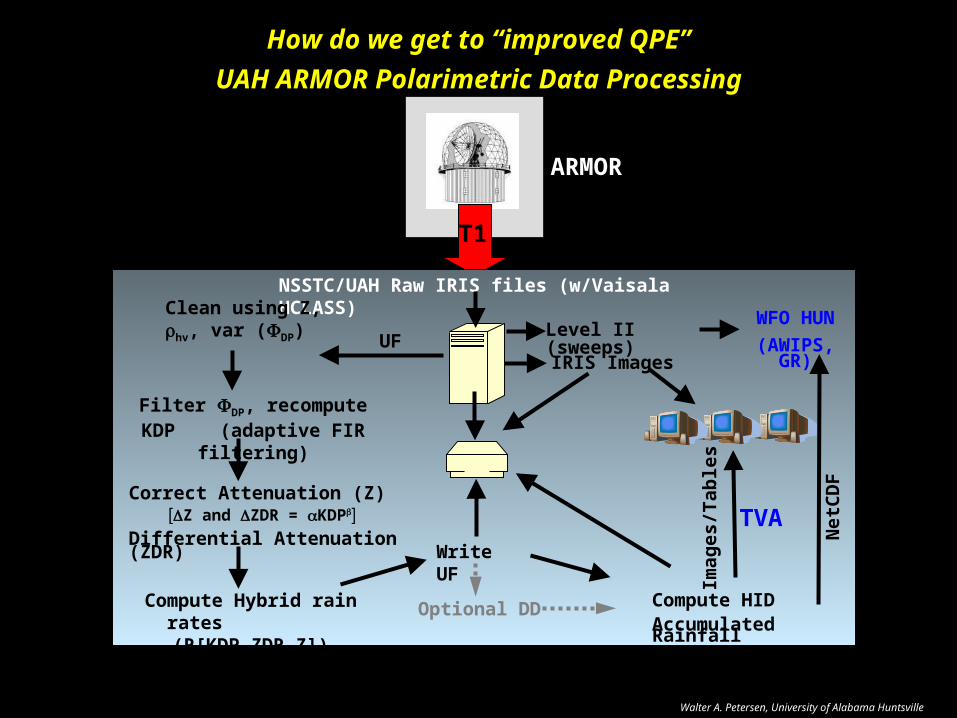
How do we get to “improved QPE”
UAH ARMOR Polarimetric Data Processing
Walter A. Petersen, University of Alabama Huntsville
NSSTC/UAH Raw IRIS files (w/Vaisala HCLASS)
IRIS Images
Clean using Z, hv, var (DP)
Correct Attenuation (Z) Z and ZDR = KDPDifferential Attenuation (ZDR)
Filter DP, recompute KDP (adaptive FIR filtering)
Compute Hybrid rain rates (R[KDP,ZDR,Z])
Write UF
Compute HID Accumulated Rainfall
Imag
es/T
able
s
Optional DD
Level II (sweeps)WFO HUN
(AWIPS, GR)UF
TVA
Net
CD
F
ARMOR
T1
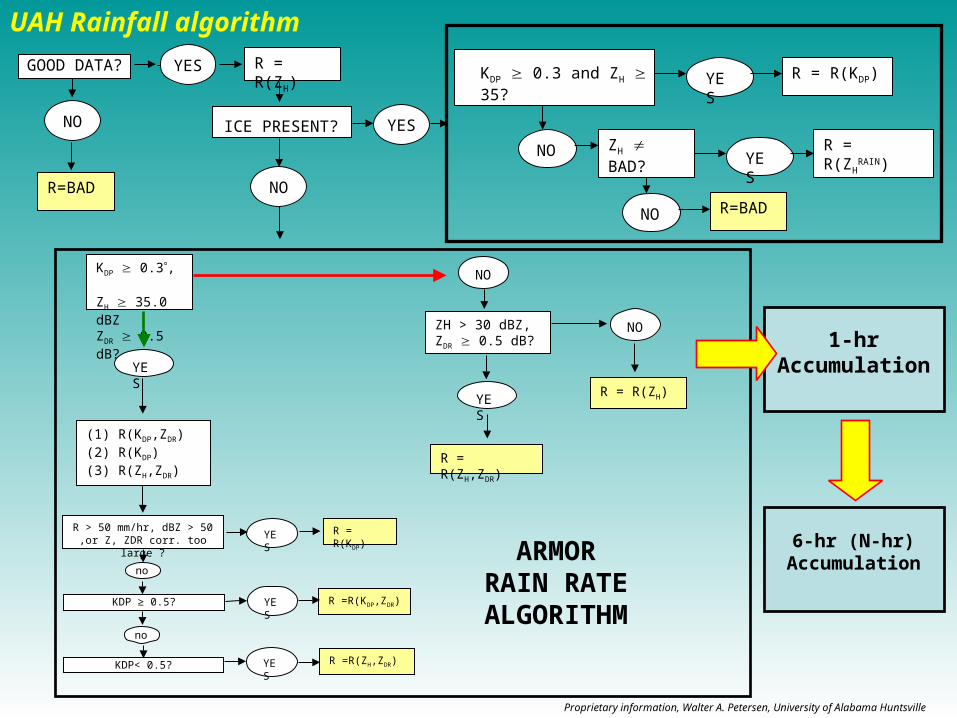
ICE PRESENT?
NO
YES
KDP 0.3 and ZH 35? R = R(KDP)YES
NO
ZH BAD? YE
S
R = R(ZHRAIN)
R=BADNO
KDP 0.3, ZH 35.0 dBZZDR 0.5 dB?
YES
R > 50 mm/hr, dBZ > 50 ,or Z, ZDR corr. too large ?
ZH > 30 dBZ, ZDR 0.5 dB?
R = R(ZH,ZDR)
R = R(ZH)
ARMORRAIN RATE
ALGORITHM
(1) R(KDP,ZDR)(2) R(KDP)(3) R(ZH,ZDR)
R = R(ZH)GOOD DATA? YES
NO
R=BAD
KDP ≥ 0.5?
KDP< 0.5?
YES
R = R(KDP)
YES
R =R(KDP,ZDR)
YES
R =R(ZH,ZDR)
no
no
NO
YES
NO
UAH Rainfall algorithm
Proprietary information, Walter A. Petersen, University of Alabama Huntsville
1-hrAccumulation
6-hr (N-hr)Accumulation

Product Access: http://www.nsstc.uah.edu/ARMOR/webimage
Products
• All dual-pol variables for first 3 sweep elevations
• Hydrometeor types (fuzzy and table based)
• Rainfall 1-hour (image)
• Rainfall 6-hour (image)
• 6-hour TVA basin rain statistics (text)
Operational
• Current image
• Last 10 image and 3-hour loops
• Scan comparisons between variables
• Automatic updating
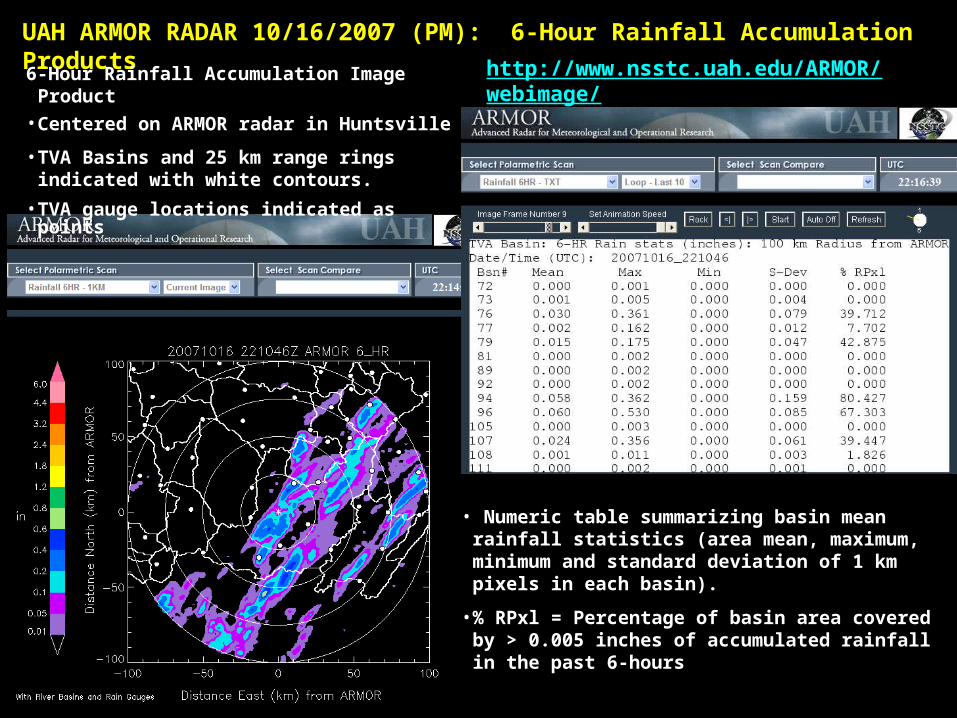
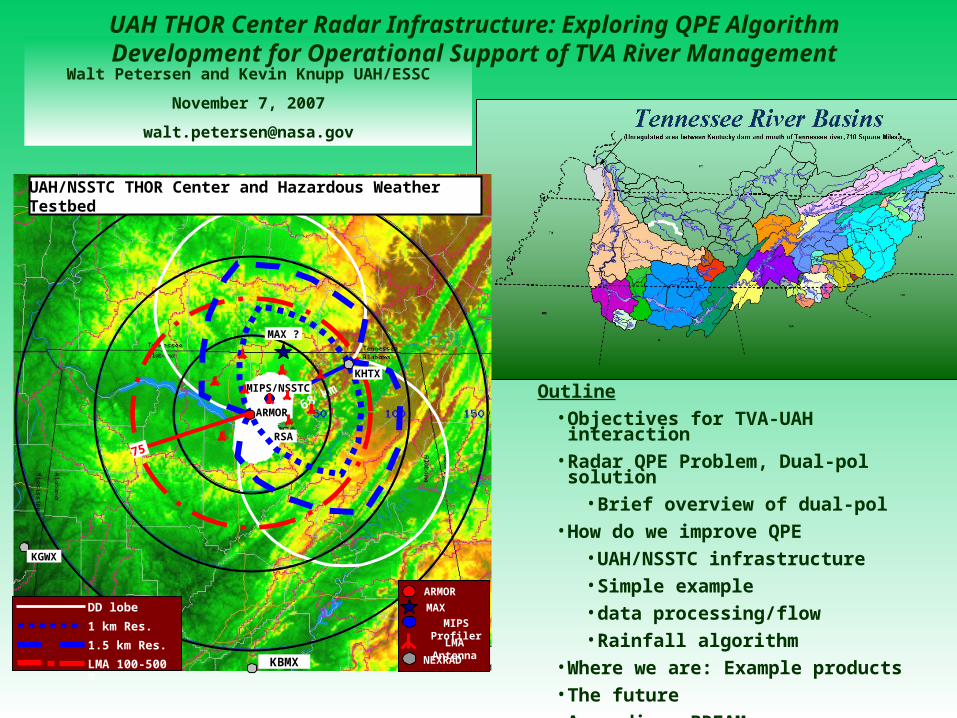
UAH ARMOR RADAR 10/16/2007 (PM): 6-Hour Rainfall Accumulation Products
6-Hour Rainfall Accumulation Image Product
• Centered on ARMOR radar in Huntsville
• TVA Basins and 25 km range rings indicated with white contours.
• TVA gauge locations indicated as points
• Numeric table summarizing basin mean rainfall statistics (area mean, maximum, minimum and standard deviation of 1 km pixels in each basin).
• % RPxl = Percentage of basin area covered by > 0.005 inches of accumulated rainfall in the past 6-hours
http://www.nsstc.uah.edu/ARMOR/webimage/
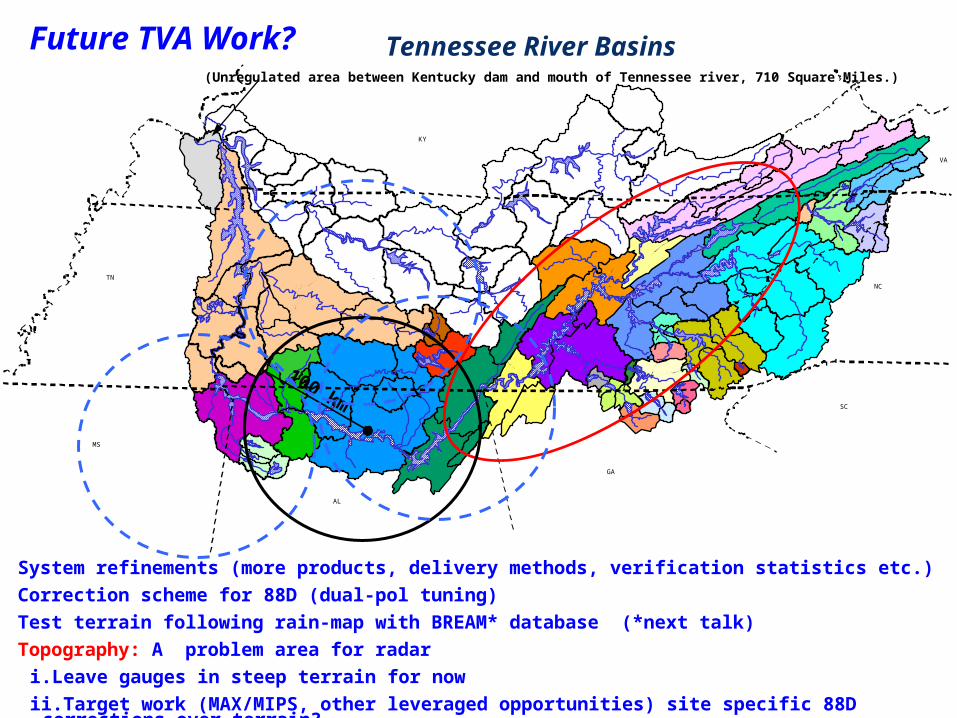
Tennessee River Basins
MS
AL
GA
NC
KY
TN
VA
SC
(Unregulated area between Kentucky dam and mouth of Tennessee river, 710 Square Miles.)
System refinements (more products, delivery methods, verification statistics etc.)
Correction scheme for 88D (dual-pol tuning)
Test terrain following rain-map with BREAM* database (*next talk)
Topography: A problem area for radar
i.Leave gauges in steep terrain for now
ii.Target work (MAX/MIPS, other leveraged opportunities) site specific 88D corrections over terrain?
100 km
Future TVA Work?

ROCKCASTLE AT BILLOWS 0.713 in. 0.027 in. 0.059 in. 0.367 in. 0.042 in. 0.000 in.
WOLF CREEK LOCAL 0.504 in. 0.003 in. 0.069 in. 0.141 in. 0.029 in. 0.003 in.
MOUTH OF OH TO BARKLEY DAM 0.000 in. 0.000 in. 0.000 in. 0.000 in. 0.000 in. 0.000 in.
LAUREL R @ MUNICIPAL DAM @ CORBIN 0.255 in. 0.011 in. 0.035 in. 0.304 in. 0.068 in. 0.002 in.
DOVER TO BARKLEY 0.000 in. 0.000 in. 0.003 in. 0.002 in. 0.000 in. 0.000 in.
MOUTH OF TN TO KY DAM 0.000 in. 0.000 in. 0.000 in. 0.007 in. 0.000 in. 0.000 in.
CUMB AB WILLIAMSBURG 0.074 in. 0.071 in. 0.090 in. 0.306 in. 0.111 in. 0.089 in.
NORTH FORK HOLSTON RIVER NEAR GATE CITY 0.003 in. 0.873 in. 0.000 in. 0.774 in. 0.557 in. 0.603 in.
CADIZ TO MOUTH 0.000 in. 0.000 in. 0.000 in. 0.000 in. 0.000 in. 0.000 in.
CLINCH RIVER ABOVE TAZEWELL 0.021 in. 0.801 in. 0.026 in. 0.422 in. 0.331 in. 0.527 in.
. . . . . . .
. . . . . . .
Future: Test Utility of High-Resolution SPC WRF BASIN SPECIFIC QPF?
Related Documents