Social Capital, Structural Holes and the Formation of an Industry Network Gordon Walker • Bruce Kogut • Weijian Shan Cox School of Business, Southem Methodist University, Dallas, Texas 75275 The Wharton School, University of Pennsylvania, Philadelphia, Pennsylvania 19104 /. P. Morgan, Hong Kong T his paper is of interest because of its comparison of social capital theory and structural hole theory in explaining network formation. The paper demonstrates, in the case of biotechnology start-ups, that network formation and industry growth are significantly influenced by the develop- nient and nurturing of social capital. The paper raises several important implications: structural hole theory may apply more to networks of market transactions than to networks of cooperative relationships, and that the study of the structure of interfirm collaborations over time requires an analysis of the network as a whole. Arie Y. Lewin Abstract The formation of a network is determined by the opposition of two forces. The first is the reproduction of network structure as a general social resource for network members. The second is the alteration of network structure by en- trepreneurs for their own benefit. The idea of reproduction is a conventional one in organizational sociology but has taken on increased importance due to the work of Bourdieu and Coieman. In contrast, Burt stresses the entrepreneurship of individual agents in exploiting structural holes that lie between constrained positions. Though complementary, the theories of social capital and structural holes have fundamen- tally different implications for network formation. This paper investigates these theories by examining empir- ically the formation of the interorganizational network among biotechnology firms. We propose that network structure de- termines the frequency with which a new biotechnology firm (or startup) establishes new relationships. Network structure indicates both where social capital is distributed in the indus- try and where opportunities for entrepreneurial action are located. The reproduction of network structure depends on how startups value social capital compared to these opportu- nities. The critical test is, consequently, whether new rela- tionships reproduce or alter the inherited network structure. We find strong support for the power of social capital in reproducing the network over time. (Social Network; Social Capital; Structural Holes; Net- work Formation; Biotechnology) Introduction There is a fundamental conflict in the formation of a network. On the one hand, there are powerful forces toward the reproduction of dense regions of relation- ships. Reproduction is powerful because it is based upon the accumulation of social capital that requires the maintenance of and reinvestment in the structure of prevailing relationships. Yet, it is exactly this princi- ple of conservation that generates the opportunities for entrepreneurial actors to bridge these regions and alter the structure of the network. The formation of interfirm networks is a critical point of contention between otherwise complementary views of network structure. For Pierre Bourdieu (1980) and James Coieman (1990a), a network tends toward the reproduction of an inherited pattern of relation- ships due to the value to the individual in preserving social capital. The notion of social capital implies a strategy of maintaining the structure of existing rela- tionships. To Bourdieu, "social capital is the sum of the resources, actual or virtual, that accrue to an individual or a group by virtue of possessing a durable network of more or less institutionalized relationships of mutual acquaintance and recognition" (Bourdieu and Waequant 1992, p. 119). Similarly, Coieman notes that an advantage of modern society is that organiza- tions provide stability, even if people are mobile. "The 1047-7039/97/0802/0109/$05.00 Copyright © 1997. Institute for Operations Research and the Management Sciences ORGANIZATION SCIENCE/VOI. 8, No. 2, March-April 1997 109

Welcome message from author
This document is posted to help you gain knowledge. Please leave a comment to let me know what you think about it! Share it to your friends and learn new things together.
Transcript

Social Capital, Structural Holes and theFormation of an Industry Network
Gordon Walker • Bruce Kogut • Weijian ShanCox School of Business, Southem Methodist University, Dallas, Texas 75275
The Wharton School, University of Pennsylvania, Philadelphia, Pennsylvania 19104/ . P. Morgan, Hong Kong
This paper is of interest because of its comparison of social capital theory and structural holetheory in explaining network formation. The paper demonstrates, in the case of biotechnology
start-ups, that network formation and industry growth are significantly influenced by the develop-nient and nurturing of social capital. The paper raises several important implications: structural holetheory may apply more to networks of market transactions than to networks of cooperativerelationships, and that the study of the structure of interfirm collaborations over time requires ananalysis of the network as a whole.
Arie Y. Lewin
AbstractThe formation of a network is determined by the oppositionof two forces. The first is the reproduction of networkstructure as a general social resource for network members.The second is the alteration of network structure by en-trepreneurs for their own benefit. The idea of reproductionis a conventional one in organizational sociology but hastaken on increased importance due to the work of Bourdieuand Coieman. In contrast, Burt stresses the entrepreneurshipof individual agents in exploiting structural holes that liebetween constrained positions. Though complementary, thetheories of social capital and structural holes have fundamen-tally different implications for network formation.
This paper investigates these theories by examining empir-ically the formation of the interorganizational network amongbiotechnology firms. We propose that network structure de-termines the frequency with which a new biotechnology firm(or startup) establishes new relationships. Network structureindicates both where social capital is distributed in the indus-try and where opportunities for entrepreneurial action arelocated. The reproduction of network structure depends onhow startups value social capital compared to these opportu-nities. The critical test is, consequently, whether new rela-tionships reproduce or alter the inherited network structure.We find strong support for the power of social capital inreproducing the network over time.(Social Network; Social Capital; Structural Holes; Net-work Formation; Biotechnology)
IntroductionThere is a fundamental conflict in the formation of anetwork. On the one hand, there are powerful forcestoward the reproduction of dense regions of relation-ships. Reproduction is powerful because it is basedupon the accumulation of social capital that requiresthe maintenance of and reinvestment in the structureof prevailing relationships. Yet, it is exactly this princi-ple of conservation that generates the opportunities forentrepreneurial actors to bridge these regions and alterthe structure of the network.
The formation of interfirm networks is a criticalpoint of contention between otherwise complementaryviews of network structure. For Pierre Bourdieu (1980)and James Coieman (1990a), a network tends towardthe reproduction of an inherited pattern of relation-ships due to the value to the individual in preservingsocial capital. The notion of social capital implies astrategy of maintaining the structure of existing rela-tionships. To Bourdieu, "social capital is the sum ofthe resources, actual or virtual, that accrue to anindividual or a group by virtue of possessing a durablenetwork of more or less institutionalized relationshipsof mutual acquaintance and recognition" (Bourdieuand Waequant 1992, p. 119). Similarly, Coieman notesthat an advantage of modern society is that organiza-tions provide stability, even if people are mobile. "The
1047-7039/97/0802/0109/$05.00Copyright © 1997. Institute for Operations Researchand the Management Sciences ORGANIZATION SCIENCE/VOI. 8, No. 2, March-April 1997 109

GORDON WALKER, BRUCE KOGUT AND WEIJIAN SHAN Formation of an Industry Network
social invention of organizations," he notes, "havingpositions rather than persons as elements of the struc-ture has provided one form of social capital that canmaintain stability in the face of instability of individu-als" (Coieman 1990b, p. 320). Similarly, firms may tendtoward the reproduction of existing interfirm relation-ships to maintain the value of their inherited socialcapital.
Ronald Burt (1992) has a different view of the con-servative tendency of networks toward reproduction.To him, the emphasis should be placed on the opportu-nities for entrepreneurs to exploit the "struc-tural holes" between dense pockets of relationships inthe network. It is exactly the structural constraints onwhat people know and can control, created by theinheritance of past relationships, that presents theopportunities for brokers. These brokers seek out part-ners with whom they can form unique, or "nonredun-dant," relationships that bring new information and thepossibility of negotiating between competing groups.Through forming these new and unique relationships,entrepreneurs transform network structure.
The theories of social capital and structural holeshave important implications for understanding the for-mation of relational networks in high growth, tech-nology-intensive industries. In these industries, theextensive innovative activities of small firms (Bound etal. 1984, Acs and Audretsch 1989) push out industryboundaries into new subfields and increase the level ofcompetition in traditional markets. However, opportu-nities for cooperation are created by unintendedspillovers and intended agreements. Organizations arealso related through their members' professional con-nections, joint suppliers and customers, and industryassociations. These commonalities may be sources ofinformation about competitor behavior, new technolog-ical developments, and other industry trends. However,formal agreements are the most salient and reliableindicator of resource and information sharing betweenfirms and the origin of information regarding a firm'scooperative strategy. This information is critical forfuture decisions regarding cooperation for product de-velopment and commercialization.
The emergence of the network of formal cooperativeagreements influences the course of industry growthand innovation. A swelling network of cooperativeagreements may provide a positive externality to whichpotential investors respond (Hagedoorn and Schaken-raad 1992). Also, since poorly positioned firms mayhave access to less than adequate resources to achievetheir economic goals, the network may act as a selec-
tion mechanism, culling out some firms on the basis oftheir partners' weakness.
Early in the history of an industry, social capitalamong firms is low, and yet it is critical for the identifi-cation and acquisition of new relationships. Rapid in-dustry growth aggravates this problem of acquiringvalid information on other firms. In this early period,firms enter relationships according to their differencesin need and capabiUty, and these relationships initial-ize the network (Kogut et al. 1994). In biotechnology,for example, small startups have extensive expertise intechnological innovation but lack resources in market-ing and distribution possessed by large incumbents.Cooperation between a startup and incumbent giveseach access to a resource necessary for productcommercialization. Variation in firm-level attributes,especially the effective management of interfirm coop-eration, contributes to network growth. But this contri-bution is partial. As an unintended outcome of theircooperative strategies, firms build the network thatserves as a map for future association.
Network formation occurs as new relationships byincumbent firms or startups exploit the opportunitiesinherent in the network, reinforcing the existing net-work structure or reshaping it (Galaskiewicz andWasserman 1981, Marsden 1985, Kogut et al. 1994).Two types of opportunity drive the process of networkformation. First, network structure is a vehicle forinducing cooperation through the development of so-cial capital. Firms draw upon network structure as asystem-level resource to facilitate the governance oftheir relationships. Second, however, gaps in the pat-tern of information flows reflect potentially profitableopportunities for establishing connections between un-linked firms (Burt 1992). These opportunities stimulateentrepreneurial action to broker different segments ofthe industry.
The relative advantages and risks of inducing coop-eration and exploiting brokering opportunities have animportant implication for network formation. Thestructural conditions inducing cooperation free re-sources for the establishment of new relationships thatin turn strengthen the structure as a useful system forcontrolling noncooperative behavior. If the structure isreinforced by new relationships, early patterns of coop-eration should persist, resulting in a path dependenceanalogous to the imprinting effect on an industry of theera in which it was formed (Stinchcombe 1965). How-ever, if some firms have specific capabilities for infor-mation arbitrage, they may choose to broker relation-ships between organizations in different regions of the
110 ORGANIZATION SCIENCE/VO1. 8, No. 2, March-April 1997

GORDON WALKER, BRUCE KOGUT AND WEIJIAN SHAN Formation of an Industry Network
network. In this case, the existing structure is notstrengthened but repeatedly reshaped. The early pat-tern of relationships is blurred as more organizationsare linked together.
To address these issues, we examine network forma-tion in terms of its structural development, positingnetwork structure as a social fact interacting with firm-level behavior over time. Our theory below followsmost closely recent developments in structural sociol-ogy, especially the ideas of Coieman (1990) and Burt(1992). The tests of our propositions on data from thebiotechnology industry show strong support for thisapproach to analyzing the process of network forma-tion.
TheorySocial CapitalSocial capital is a means of enforcing norms of behav-ior among of individual or corporate actors and thusacts as a constraint, as well as a resource. Successfulcooperation cannot be achieved in interorganizationalrelationships without constraints on the partners toperform according to each other's expectations. Theseconstraints allow firms to risk greater investment with apartner in a relationship that would otherwise be hin-dered by the threat of opportunism. Lower levels ofconstraint are associated with difficulties in findinginformation about current or potential partners andtherefore impede effective cooperation. Because coop-eration is less frequent, network and consequently in-dustry growth are hindered.
The network serves an important function in thedevelopment of social constraint directing informationflows in the building and maintaining of social capital.Consider two extreme examples of network structure.If all firms in an industry had relationships with eachother, interfirm information flows would lead quicklyto established norms of cooperation. In such a densenetwork, information on deviant behavior would bereadily disseminated and the behavior sanctioned.Firms in this industry would benefit equally from thenetwork as a reputation building mechanism. Coieman(1992; see also Loury 1977, Bourdieu 1980) character-izes the extreme case of a fully connected network as"closed." Members of closed networks are connectedto each other. In a closed network, firms as institu-tional actors have access to social capital, a resourcethat helps the development of norms for acceptablebehavior and the diffusion of information about behav-ior. As the predictability of behavior is increased in asystem that is already connected, self-seeking oppor-
tunism is constrained and cooperation enabled.At the other extreme is an "open" network. Firms in
open networks have no social capital on which to rely.If firms are not connected to each other extensively,norms regarding cooperation are more difficult toachieve, and information on behavior in relationshipsdiffuses more slowly. Without relationships that deter-mine behavior and carry information, firms are lessable to identify or control opportunism. In support ofthis conjecture, Raub and Weesie (1990) use a Pris-oner's Dilemma framework to show that a firm embed-ded in a closed network is constrained to be morecooperative than a comparable firm embedded in anopen network. Similarly, Granovetter (1985) argues,through extensive examples, that embeddedness indense networks leads to effective interfirm coopera-tion.
However, a common result of research on interfirmnetwork structure is that it is neither uniformly densenor sparse (Knoke and Rogers 1978, Van de Ven et al.1979, Nohria and Garcia-Pont 1991). The structure isuneven, composed of regions that are more or lessfilled with relationships. The positions firms occupy inthe network are embedded in these regions. Somefirms occupy positions that are embedded in regionsfilled with relationships, indicating a high level of avail-able social capital, but other positions are located inregions with few relationships, suggesting a low socialcapital. In such a complex network, the degree of socialcapital available to a firm is thus determined by itsposition in the network structure.
A central premise of the present paper is that socialcapital influences how the network forms. Networkformation proceeds through the establishment of newrelationships, building on the base of existing interfirmties. Managing these ties requires ongoing attentionand resources, of which organizations have only limitedamounts. Social capital is thus a valuable additionalasset for managing interorganizational relationshipssince it constrains a firm's partners to be more cooper-ative. Firms with less social capital are more vulnerableto opportunistic behavior and less able to build anenduring history of effective cooperative behavior withtheir partners over time. They, therefore, are requiredto expend greater time and effort monitoring the rela-tionship. In contrast, the more social capital availableto a firm, the fewer resources it needs to manageexisting relationships and the more resources it can useto establish new ones. Coieman explains:
Social capital is defined by its function. It is not a single entitybut a variety of different entities, with two elements in com-
ORGANIZATION SCIENCE/VOI. 8, No. 2, March-April 1997 111

GORDON WALKER, BRUCE KOGUT AND WEUIAN SHAN Formation of an Industry Network
mon: they all consist of some aspect of social structures, andthey facilitate certain actions of actors—whether persons orcorporate actors—within the structure (Coieman 1988,p. S98).
In the present study, the social structure is theinterorganizational network. The amount of social cap-ital depends on the firm's position in the networkstructure. The action facilitated by this structure is theformation of new relationships. These arguments leadto the central proposition that firms in network posi-tions with higher social capital are likely to have morerelationships with new partners in the following timeperiod.
An important question follows: how do a firm's newcooperative relationships affect the social capital avail-able to it? If social capital improves cooperation, thenit seems likely that firms would seek partners that aremore rather than less constrained by network struc-ture. That is, firms should try to increase the socialcapital available to them through the new relationshipsthey establish. Thus, the value of social capital moti-vates firms to reproduce the existing network structure,building the social capital available to them.
The amount of social capital that can be increasedby new relationships should be related to the baseamount. Mayhew and Levinger (1976) show that net-work density tends to attenuate as the network growslarger. Thus, firms that begin a year with high socialcapital cannot improve their network positions as muchas those firms that are structurally less advantaged.Therefore, the more social capital available to a firm,the less the firm can increase it through forming newrelationships.
Structural HolesBurt (1992) presents an alternative to the social capitalargument. Emphasizing the importance of open ratherthan closed networks, he argues that the network posi-tions associated with the highest economic return liebetween not within dense regions of relationships. Hecalls these sparse regions structural holes. Structuralholes present opportunities for brokering informationflows among firms. These opportunities have greatereconomic payoffs because the broker's information ad-vantage creates the potential for arbitrage in marketsfor goods and services.
Burt assumes that partner selection, more than so-cial capital, determines effective cooperation betweenfirms (Burt 1992, p. 16). Burt's argument subtly weavesbetween normative implications and positive theory.He places more emphasis than Bourdieu or Coieman
on the strategic action of entrepreneurs. In Burt's view,the benefits of increasing social constraint from estab-lishing relationships in closed regions of the networkare offset by a reduction in independence. Firms withrelationships in open networks have greater latitude intheir cooperative strategies. These firms have highereconomic gains because they are most able to parlaytheir superior, i.e., less redundant, information intoincreasing their control. Burt (1992, p. 37) argues:
The higher the proportion of relationships enhanced by struc-tural holes, the more likely and able the entrepreneurialplayer, and so the more likely it is that the player's invest-ments are in high-yield relationships. The result is a higheraggregate rate of return on investments.
Structural hole theory therefore raises the problemof free-riding on the public good of social capital. Overtime, firms will seek to exploit the holes between theislands of social capital in which relationships are em-bedded. As a result, the social capital available to anentrepreneur should decrease as the firm forms newrelationships.
In each year, new relationships change networkstructure. Firms are much more likely to experiencethese changes as they happen, rather than all at onceat the end of each year. If structural constraint repre-sents social capital, the change in structure shoulddetermine the resources available to a firm to formnew relationships. From Coieman and Bourdieu's per-spective, increasing social capital in a period shouldenable more relationships. Alternatively, if, as Burtasserts, trust is determined only by careful partnerselection, increases in social capital should have noeffect on the number of new relationships. The argu-ments regarding network formation from both the so-cial capital and structural hole perspectives are set outas propositions in Figure 1.
Control VariablesWe test these propositions against the view that onlyorganizational attributes determine interfirm coopera-tion. Since firms with similar attributes may occupy thesame network position (Burt 1992, chapter 5), control-ling for these attributes makes the analysis of networkformation more robust. We identify five control vari-ables: firm size, firm experience in cooperating withother firms, public offering of the firm's equity, theconcentration of the firm's partners across global re-gions, and the average number of relationships of thefirm's partners. The last two of these variables might beviewed more properly as partner characteristics. How-
112 ORGANIZATION SCIENCE/VOI. 8, No. 2, March-April 1997

GORDON WALKER, BRUCE KOGUT AND WEIJIAN SHAN Formation of an Industry Network
Figure 1 List of Propositions Deveioped in the ThieorySection and Their Tests
Social Capital Perspective Tests of Propositions
1. Firms with higher sociai cap-ital are likely to have morerelationships with new partnersin the following time period.
2. The more relationships afirm forms, the more lii<eiy itssocial capital will increase.
3. The more social capital atthe beginning of a time period,the iower the increase in socialcapitai in the next time period.
4. The more a firm's socialcapital increases over a timeperiod, the more relationshipsit should have during this timeperiod.
Structural Hoie Perspective
Regression of new relation-ships on social capital (for in-cumbent and entering part-ners), see Tabie 6.
Regression of change in socialcapitai on new relationships(for incumbents and enteringpartners), see Table 7.
Regression of change in sociaicapital on level of social capitalin the previous time period,see Table 7.
Regression of new reiation-ships (for incumbent and enter-ing partners) on change in so-cial capital, see Tabie 6.
5. The more relationships afirm forms in a year, the moreits social capitai shouid de-crease.
6. Lack of empirical support forProposition 4 above would beconsistent with the StructuralHoie Perspective.
Regression of change in sociaicapital on new relationships(for incumbents and enteringpartners), see Table 7.
Regression of new reiation-ships (for incumbent and enter-ing partners) on change in so-cial capitai, see Tabie 6.
ever, sinee they are aggregated by firm, they are in-eiuded as firm-ievei eontrois.
Firm size is a measure of a firm's eapaeity to eooper-ate and a measure of its eapaeity to do without eooper-ation. Whereas Shan (1990) found a negative relation-ship between size and eooperation, Boyies (1969) andPoweii and Brantiey (1991) found that the frequency ofeooperative reiationships more than proportionaiiy riseswith size. Whether this differenee rises from a noniin-earity in the assoeiation between size and the fre-queney of eooperation is partiy addressed beiow.
Firm experience with eooperation, represented asthe number of reiationships it has established, presentsa simiiar set of issues. The more reiationships a firmhas, the more it shouid know about how to managethem and so the iess eostly it shouid be to form newreiationships. On the other hand, the iower ineremen-
tai iearning from new reiationships may attenuate theirformation. Again, we address this potentiai noniinear-ity in our analysis.
The effeet of issuing pubiie equity on interfirm eoop-eration aiso has an ambiguous interpretation. First, apubiie offering is one form of getting resourees. As apubiieiy heid corporation, an entrepreneurial startupean probabiy go to the eapitai markets to finaneeprojeets, thereby decreasing the need to eooperate forthis purpose. However, going pubiie may also be anindieator of the iegitimaey of the firm and signai astrong position in the network. Firms with higher Iegiti-maey are iikeiy to attract more partners for eooperativeventures.
Regional concentration represents how a firm's part-ners are distributed aeross three major giobai regions:United States, Europe, and Japan. As Hofstede et ai.(1990) have shown, nationai euitures have a signifieantimpaet on work behavior. Managing partners aerossdifferent regions shouid therefore be a more eomplexand diffieuit task than managing partners from thesame region. The higher the eoneentration, the morepartners from a singie region are represented in thefirm's organization set and the iess diffieuit its task ofmanaging them.
The experienee of an organization's partners in in-terfirm agreements may infiuenee its tendency to eoop-erate. The more agreements a firm's partners currentlyhave, the more iikeiy they are to be embedded ineiosed regions of the network and therefore to beeonstrained from aeting opportunistieaiiy (see Baker1991). However, partners with more reiationships mayaiso be iess dependent on the firm for its information,goods and serviees, reieasing normative pressures forequitabie behavior. Partner experienee may thereforeeither heighten or dampen the firm's tendency to eoop-erate.
Finaiiy, in studying the reproduction of networkstrueture, it is important to differentiate between reia-tionships with partners entering the network and reia-tionships with partners aiready in the network. Thefirst are eaiied entering partners and the seeond in-eumbent partners. Spiitting partners in this way pro-vides a robust test of the soeiai eapitai argument. Inthe broadest sense, soeiai eapitai reieases resourees tofirms for further eooperation whether the firm engagespartners that are new to the network or aiready net-work members. A narrower view of soeiai eapital sug-gests that soeiai eapitai theory applies to network for-mation oniy for reiationships with network ineumbents.If this is the ease, future researeh must eonsider net-
OROANIZATION SCIENOE/VOI. 8, No. 2, March-April 1997 113
GORDON WALKER, BRUCE KOGUT AND WEIJIAN SHAN Formation of an Industry Network
work incumbency as a moderator of social capital'seffect.
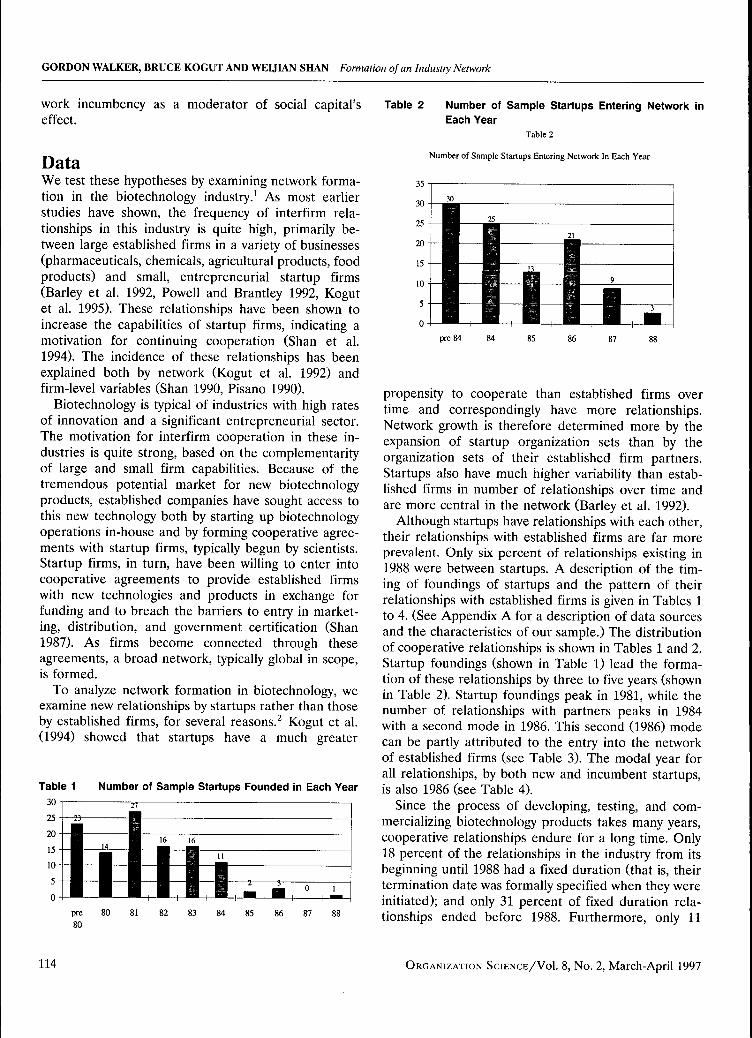
DataWe test these hypotheses by examining network forma-tion in the biotechnology industry.' As most earlierstudies have shown, the frequency of interfirm rela-tionships in this industry is quite high, primarily be-tween large established firms in a variety of businesses(pharmaceuticals, chemicals, agricultural products, foodproducts) and small, entrepreneurial startup firms(Barley et al. 1992, Powell and Brantley 1992, Kogutet al. 1995). These relationships have been shown toincrease the capabilities of startup firms, indicating amotivation for continuing cooperation (Shan et al.1994). The incidence of these relationships has beenexplained both by network (Kogut et al. 1992) andfirm-level variables (Shan 1990, Pisano 1990).
Biotechnology is typical of industries with high ratesof innovation and a significant entrepreneurial sector.The motivation for interfirm cooperation in these in-dustries is quite strong, based on the complementarityof large and small firm capabihties. Because of thetremendous potential market for new biotechnologyproducts, established companies have sought access tothis new technology both by starting up biotechnologyoperations in-house and by forming cooperative agree-ments with startup firms, typically begun by scientists.Startup firms, in turn, have been willing to enter intocooperative agreements to provide established firmswith new technologies and products in exchange forfunding and to breach the barriers to entry in market-ing, distribution, and government certification (Shan1987). As firms become connected through theseagreements, a broad network, typically global in scope,is formed.
To analyze network formation in biotechnology, weexamine new relationships by startups rather than thoseby established firms, for several reasons.^ Kogut et al.(1994) showed that startups have a much greater
Table 1 Number of Sample Startups Founded in Each Year
Table 2 Number of Sample Startups Entering Network inEach Year
Table 2
Number of Sample Startups Entering Network In Each Year
pre 80 81 82 83 84 85 86 87
pre 84 84 85 86 87
propensity to cooperate than established firms overtime and correspondingly have more relationships.Network growth is therefore determined more by theexpansion of startup organization sets than by theorganization sets of their established firm partners.Startups also have much higher variability than estab-lished firms in number of relationships over time andare more central in the network (Barley et al. 1992).
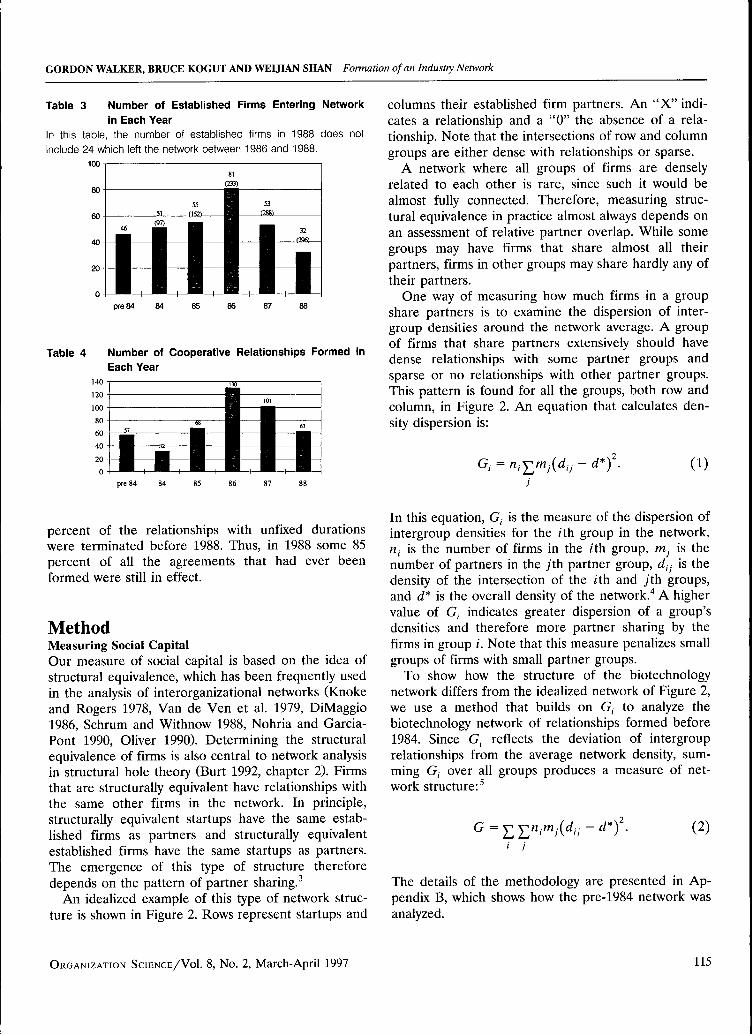
Although startups have relationships with each other,their relationships with established firms are far moreprevalent. Only six percent of relationships existing in1988 were between startups. A description of the tim-ing of foundings of startups and the pattern of theirrelationships with established firms is given in Tables 1to 4. (See Appendix A for a description of data sourcesand the characteristics of our sample.) The distributionof cooperative relationships is shown in Tables 1 and 2.Startup foundings (shown in Table 1) lead the forma-tion of these relationships by three to five years (shownin Table 2). Startup foundings peak in 1981, while thenumber of relationships with partners peaks in 1984with a second mode in 1986. This second (1986) modecan be partly attributed to the entry into the networkof established firms (see Table 3). The modal year forall relationships, by both new and incumbent startups,is also 1986 (see Table 4).
Since the process of developing, testing, and com-mercializing biotechnology products takes many years,cooperative relationships endure for a long time. Only18 percent of the relationships in the industry from itsbeginning until 1988 had a fixed duration (that is, theirtermination date was formally specified when they wereinitiated); and only 31 percent of fixed duration rela-tionships ended before 1988. Furthermore, only 11
114 ORGANIZATION SCIENCE/VOI. 8, No. 2, March-April 1997
GORDON WALKER, BRUCE KOGUT AND WEUIAN SHAN Formation of an Industry Network
Table 3 Number of Established Firms Entering Networi<in Each Year
In this table, the number of established firms in 1988 does notineiude 24 which left the network between 1986 and 1988.
100-
55
46 ^H ^ H
81(233)
1i53
f288)
^ B 32— H (296)
Hpre 84 84 85 86 87 88
Tabie 4 Number of Cooperative Reiationships Formed inEach Year
columns their established firm partners. An "X" indi-cates a relationship and a "0" the absence of a rela-tionship. Note that the intersections of row and columngroups are either dense with relationships or sparse.
A network where all groups of firms are denselyrelated to each other is rare, since such it would bealmost fully connected. Therefore, measuring struc-tural equivalence in practice almost always depends onan assessment of relative partner overlap. While somegroups may have firms that share almost all theirpartners, firms in other groups may share hardly any oftheir partners.
One way of measuring how much firms in a groupshare partners is to examine the dispersion of inter-group densities around the network average. A groupof firms that share partners extensively should havedense relationships with some partner groups andsparse or no relationships with other partner groups.This pattern is found for all the groups, both row andcolumn, in Figure 2. An equation that calculates den-sity dispersion is:
G, = ni ij - d*f (1)pre 84
percent of the relationships with unfixed durationswere terminated before 1988. Thus, in 1988 some 85percent of all the agreements that had ever beenformed were still in effect.
MethodMeasuring Social CapitalOur measure of social capital is based on the idea ofstructural equivalence, which has been frequently usedin the analysis of interorganizational networks (Knokeand Rogers 1978, Van de Ven et al. 1979, DiMaggio1986, Schrum and Withnow 1988, Nohria and Garcia-Pont 1990, Oliver 1990). Determining the structuralequivalence of firms is also central to network analysisin structural hole theory (Burt 1992, chapter 2). Firmsthat are structurally equivalent have relationships withthe same other firms in the network. In principle,structurally equivalent startups have the same estab-lished firms as partners and structurally equivalentestablished firms have the same startups as partners.The emergence of this type of structure thereforedepends on the pattern of partner sharing.^
An idealized example of this type of network struc-ture is shown in Figure 2. Rows represent startups and
In this equation, G, is the measure of the dispersion ofintergroup densities for the ith group in the network,rt, is the number of firms in the /th group, mj is thenumber of partners in the 7th partner group, dij is thedensity of the intersection of the /th and yth groups,and d* is the overall density of the network."* A highervalue of G, indicates greater dispersion of a group'sdensities and therefore more partner sharing by thefirms in group /. Note that this measure penalizes smallgroups of firms with small partner groups.
To show how the structure of the biotechnologynetwork differs from the idealized network of Figure 2,we use a method that builds on G, to analyze thebiotechnology network of relationships formed before1984. Since G, reflects the deviation of intergrouprelationships from the average network density, sum-ming G, over all groups produces a measure of net-work structure:^
(2)' ;
The details of the methodology are presented in Ap-pendix B, which shows how the pre-1984 network wasanalyzed.
ORGANIZATION SCIENCE/VOL 8, No. 2, March-April 1997 115

GORDON WALKER, BRUCE KOGUT AND WEUIAN SHAN Formation of an Industry Network
Figure 2 An Idealized Networit Structure Based on Structural Equivalence
Partners
Startups
Group 1
Group 2
Group 3
Group 4
Group 1
XXXOOXXX
xxxxooxxoxxxxoxx
ooooooooooooooooooooooooooooooooo
ooooooooooooooooooooooooooooooooo
ooooooooooooooooooooooooooooooooo
Group 2
ooooooooooooooooooooooooooooooooooxxxxxxoooxxxxoxxxxoxxxoxxxoxxx
ooooooooooooooooooooooooooooooooo
ooooooooooooooooooooooooooooooooo
Group 3
ooooooooooooooooooooooooooooooooo
ooooooooooooooooooooooooooooooooo
ooxxxxxxxxxxxxxoxxxxxoxoxoxxoxxxx
ooooooooooooooooooooooooooooooooo
Group 4
oooooooooooooooooooooooooooooo
xxxxxxxooxxoxxoxxxoxxxxxxoxxox
oooooooooooooooooooooooooooooo
xxxxxoxooxxxoxxoxxxooxxxxoxxox
Figure 3a shows the partitioned raw data. There arefour startup groups and six partner groups. Group Ihas the largest number of firms, which have relation-ships predominantly with partner groups A, B, and C.Because the number of relationships Group I has witheach of the partner groups is much smaller than thenumber of possible relationships, the densities of theseintergroup relationships are quite low (see Figure 3b).Unlike Group I, Groups II, III and IV are denselyrelated to their partner groups. Group II contains onlyone firm, the only startup to have agreements withGroup E. Furthermore, this firm has only one otherrelationship in the network, with a partner in Group F.Finally, both Groups III and IV are composed ofseveral startups that have established relationships withGroups D and F, respectively.
Only a few firms contribute significantly to the struc-ture of biotechnology network. To demonstrate this, wedivide Equation (1) by Equation (2) to get a measure ofeach group's percentage contribution to network struc-ture. This variable, bounded by zero and one, repre-sents the dispersion of startup group densities normal-ized by a measure of how structured the network is in atime period.
Startup groups in the network occupy distinct posi-tions which vary in their social capital. A group's con-tribution to network structure in a time period indi-cates how tightly packed are its relationships withpartners. Higher density means greater partner sharingwithin a startup group, creating a stronger focal pointfor conversation.^ Startups in groups with higher con-tributions have greater social capital available to them.^If a group's contribution to network structure increases
with new relationships, we assume that startups havechosen partners so that social capital is increased.However, increased social capital also means increasedsocial constraint. Following Burt's argument (Burt 1982,p. 57), if startups are searching for lower social con-straint, the startup group's contribution to networkstructure should decline over time.
Testing the PropositionsAlthough structurally equivalent startups that occupythe same position will have the same amount of socialcapital, they will differ in the number of relationshipsthey establish in each year and in the control variables.We therefore designed the empirical tests at the firmlevel, consistent with the way they are stated, over eachpair of years from 1984 to 1988. The data are pooledcross-sections of year pairs from 1984 to 1988; e.g.,1984-1985. Dummy variables for each year pair areincluded to correct for time-period effects.
We use several regression techniques: negative bino-mial, two-stage least squares and generalized leastsquares regression. Like Poisson regression, the nega-tive binomial model treats the dependent variable as acount variable but allows for a direct measure of het-erogeneity (see Cameron and Trivedi 1986). Estimatingheterogeneity not only relaxes the stringent Poissonassumption of equal mean and variance in the errorterm but also accounts for omitted variable bias.
However, the negative binomial model does not cor-rect for the potential bias due to the simultaneity ofnew relationships and change in social capital overtime. To make this correction, we assume that the
116 ORGANIZATION SCIENCE/VOL 8, No. 2, March-April 1997

GORDON WALKER, BRUCE KOGUT AND WEUIAN SHAN Formation of an Industry Network
Figure 3A Partitioned Raw Data for 1983 Networic
Partner Groups
StartupGroups
A B C D E FOOOOOOOOOOOOOOOOOOO #00 #00X00 .OOOOO •OOOOOO.OOOOOOOOOOXOOOOOOOOOOOOOOOOO .00 .OOOOO .OOOOO .oooooo.ooooooooooooooxooooooooooooo .oo .xoooo .OOOOO .oooooo.ooooooooooooooooooooooooooxo .oo .OOOOO .00000 .oooooo.ooooooooooooooooooooooooooox .oo .OOOOO .OOOOO .oooooo.ooooooooooooxooooooooooooooo .00 .oooxx .OOOOO .oooooo.oooooooooooooooxxooooooooooo .ox .OOOOO .OOOOO .oooooo.oooooooooooooooooxoooooooooo .oo .OOOOO .OOOOO .oooooo.oooooooooooooxoooooooooooooo .oo .OOOOO .OOOOO .oooooo.ooooooooo
I ooooooooooooooooooo .00 .OOOOO .OOOOO .oooooo.oooooxoooooooooooooooooooooo .xo .OOOOO .OOOOO .oooooo.oooooooooooooooooooxoooooooo .oo .OOOOO .OOOOO .oooooo.oooooooooXOOOOOOOOOOOOOOOOOO . OO .OOOOO .OOOOO . OOOOOO. OOOOOOOOOooooooooooooooooooo .OX .OOOOO .OOOOO . OOOOOO. OOOOOOOOOooxoooooooooooooooo .oo .OOOOO .OOOOO .oooooo.oooooxoooooooooooooooxooxooo .oo .oxooo .OOOOO .oooooo.ooooooooooooooooooxooooooooo .00 .OOOOO .OOOOO .oooooo.oooooooooOOOOOOOOOOOOOXOOOOO .oo .OOOOO .OOOOO .oooooo.oooooooooooooooooooooooooooo .xo .OOOOO .OOOOO .oooooo.oooooooooooooooooooooooooxoo .oo .OOOOO .OOOOO .oooooo.oooooooooOOOOOOOOOOOXOOOOOOO .00 .OOOOO .OOOOO .000000.ooooooooo
II ooooooooooooooooooo .oo .OOOOO .OOOOO .XXXXXX.XOOOOOOOOooooooooooooooooooo .oo .OOOOO .oxxxo .oooooo.ooooooooo
III ooooooooooooooooooo .00 .OOOOO .xxoox .oooooo.oooooooooooooooooooooooooooo .00 .OOOOO .00000 .oooooo.xoxoxoooo
IV ooooooooooooooooooo .oo .OOOOO .OOOOO .oooooo.xxoooxxooooooooooooooooooooo .oo .OOOOO .OOOOO .oooooo.xoooxooooooooooooooooooooooo .00 .OOOOO .OOOOO .oooooo.oooxoxooxooooooooooooooooooo .00 .OOOOO .OOOOO .oooooo.oooxoxoxo
Figure 3B Density iVIatrix of 1983 Networic
InmIV
A.05000
B.09000
C.05000
D00.60
E0100
F.01.110.33
dependent variable is not a count but continuous anduse two-stage least squares. Generalized least squarespermits corrections for serial correlation in the errorterm and unobserved firm-level effects. Figure 1 showshow these regressions test the propositions based onthe theories of social capital and structural holes.
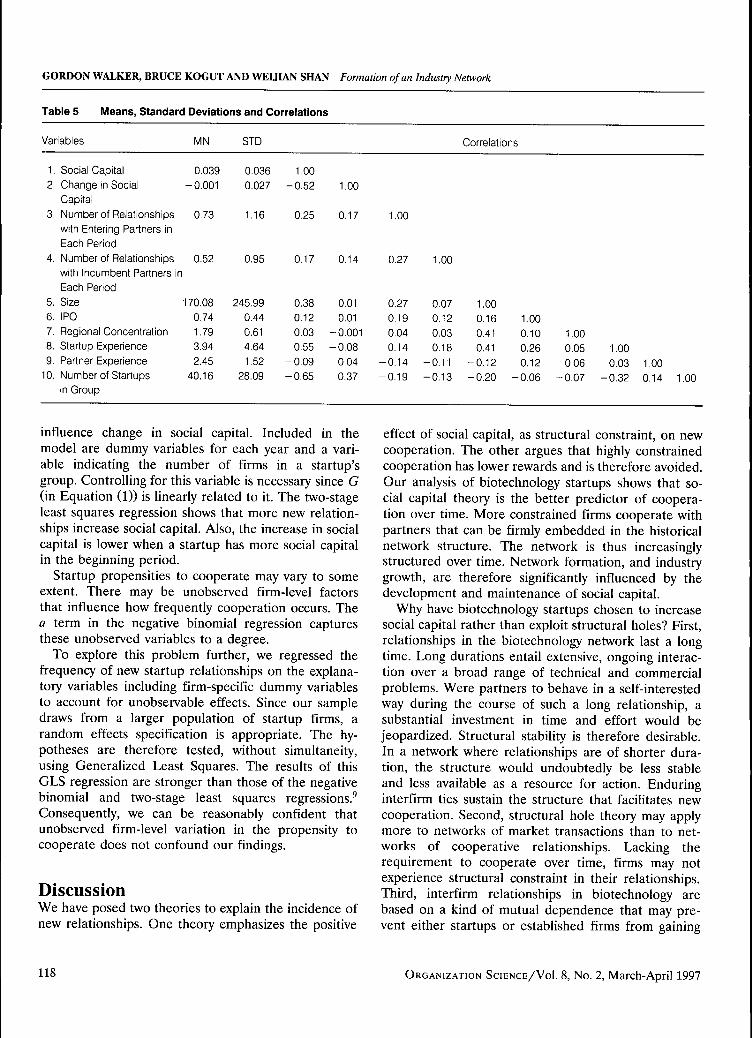
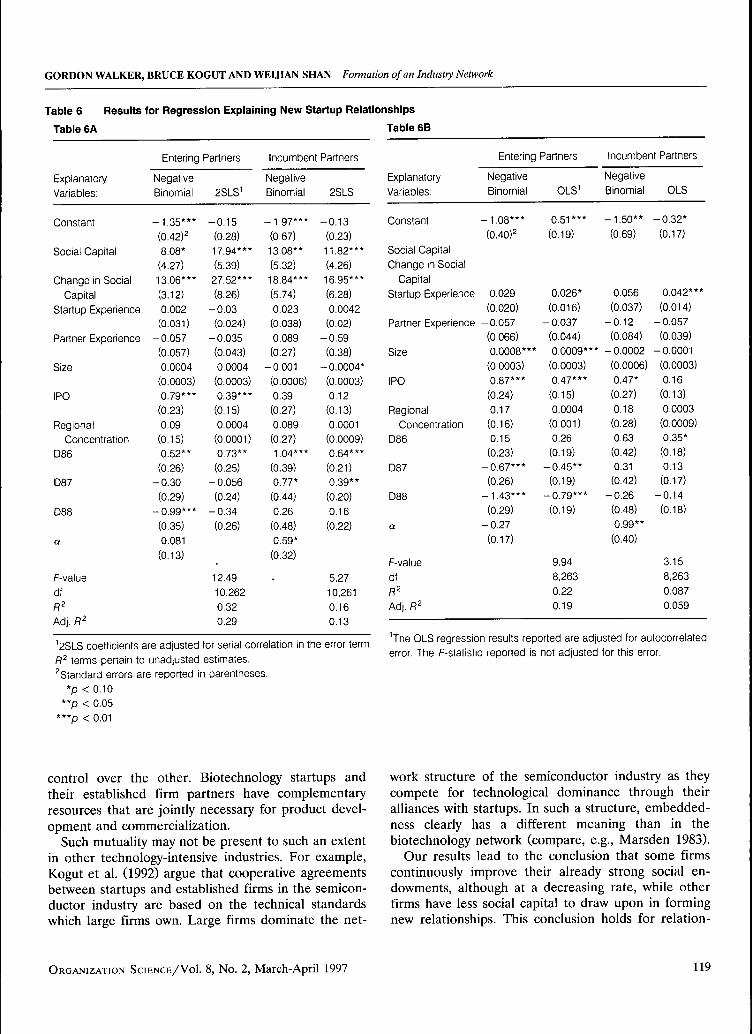
ResultsTable 5 shows the means, standard deviations andcorrelations among the variables, and Table 6 presentsthe findings for the regressions. Five of the explanatoryvariables have consistent results: the social capital and
change in social capital, startup experience, partnerexperience, and public offering (IPO). Both networkvariables explain the frequency of new relationshipsstrongly, as social capital theory predicts. Interestingly,neither startup nor partner experience has an effect onnew relationships, controlling for the network vari-ables.̂ This finding shows that new relationships arenot explained by how many relationships a startup orits partner has, but how the relationships are dis-tributed across partner groups. Public offering has apositive, significant effect on establishing relationshipswith entering partners but no influence on relation-ships with ineumbents.
The results for startup size and regional concentra-tion are not as clear. Neither has an effect for incum-bent partners. However, for entering partners, the re-sults for the two techniques differ in significance butnot in sign.
Table 7 reports the results of testing whether socialcapital and the number of new startup relationships
ORGANIZATION SCIENCE/VOL 8, No. 2, March-April 1997 117
GORDON WALKER, BRUCE KOGUT AND WEIJIAN SHAN Formation of an Industry Network
Table 5 Means, Standard Deviations and Correlations
Variables
1, Social Capital2. Change in Social
Capital3, Number of Relationships
with Entering Partners inEach Period
4, Number of Relationshipswith Incumbent PartnersEach Period
5. Size6, IPO7. Regional Concentration8. Startup Experience9, Partner Experience
10. Number of Startupsin Group
MN
0.039-0,001
0,73
0,52in
170,080,741,793,942,45
40,16
STD
0,0360,027
1.16
0,95
245,990,440,614,641.52
28,09
1,00-0,52
0.25
0,17
0.380,120,030,55
-0,09-0,65
1,00
0,17
0,14
0.010,01
-0,001-0,08
0.040.37
1,00
0.27
0,270,190,040,14
-0,14-0,19
1,00
0,070,120,030,18
-0,11-0,13
Correlations
1.000.16 1,000,41 0,10 1,000,41 0,26 0,05
-0,12 0.12 0,06-0,20 -0.06 -0,07
1,000,03 1.00
-0,32 0.14 1,00
influence change in social capital. Included in themodel are dummy variables for each year and a vari-able indicating the number of firms in a startup'sgroup. Controlling for this variable is necessary since G(in Equation (1)) is linearly related to it. The two-stageleast squares regression shows that more new relation-ships increase social capital. Also, the increase in socialcapital is lower when a startup has more social capitalin the beginning period.
Startup propensities to cooperate may vary to someextent. There may be unobserved firm-level factorsthat influence how frequently cooperation occurs. Thea term in the negative binomial regression capturesthese unobserved variables to a degree.
To explore this problem further, we regressed thefrequency of new startup relationships on the explana-tory variables including firm-specific dummy variablesto account for unobservable effects. Since our sampledraws from a larger population of startup firms, arandom effects specification is appropriate. The hy-potheses are therefore tested, without simultaneity,using Generalized Least Squares. The results of thisGLS regression are stronger than those of the negativebinomial and two-stage least squares regressions.'Consequently, we can be reasonably confident thatunobserved firm-level variation in the propensity tocooperate does not confound our findings.
DiscussionWe have posed two theories to explain the incidence ofnew relationships. One theory emphasizes the positive
effect of social capital, as structural constraint, on newcooperation. The other argues that highly constrainedcooperation has lower rewards and is therefore avoided.Our analysis of biotechnology startups shows that so-cial capital theory is the better predictor of coopera-tion over time. More constrained firms cooperate withpartners that can be firmly embedded in the historicalnetwork structure. The network is thus increasinglystructured over time. Network formation, and industrygrowth, are therefore significantly influenced by thedevelopment and maintenance of social capital.
Why have biotechnology startups chosen to increasesocial capital rather than exploit structural holes? First,relationships in the biotechnology network last a longtime. Long durations entail extensive, ongoing interac-tion over a broad range of technical and commercialproblems. Were partners to behave in a self-interestedway during the course of such a long relationship, asubstantial investment in time and effort would bejeopardized. Structural stability is therefore desirable.In a network where relationships are of shorter dura-tion, the structure would undoubtedly be less stableand less available as a resource for action. Enduringinterfirm ties sustain the structure that facilitates newcooperation. Second, structural hole theory may applymore to networks of market transactions than to net-works of cooperative relationships. Lacking therequirement to cooperate over time, firms may notexperience structural constraint in their relationships.Third, interfirm relationships in biotechnology arebased on a kind of mutual dependence that may pre-vent either startups or established firms from gaining
118 ORGANIZATION SCIENCE/VOI. 8, No. 2, March-April 1997
GORDON WALKER, BRUCE KOGUT AND WEUIAN SHAN Formation of an Industry Network
Table 6 Results for Regression Explaining New Startup Relationships
Tabie 6A
ExplanatoryVariables:
Constant
Social Capital
Change in SocialCapital
Startup Experience
Partner Experience
Size
IPO
RegionalConcentration
D86
D87
D88
a
F-valuedfR'
Adj, R^
Entering Partners
NegativeBinomial
-1,35***(0,42)28,08*(4,27)13,06***(3,12)0,002(0,031)
-0.057(0,057)0,0004(0,0003)0,79***(0,23)0,09(0,15)0,52**(0,26)
-0,30(0,29)
-0,99***(0,35)0,081(0.13)
2SLS^
-0,15(0,28)17,94***(5,39)27,52***(8,26)
-0,03(0,024)
-0,035(0,043)0.0004(0,0003)0,39***(0,15)0.0004(0,0001)0.73**(0,25)
-0.056(0,24)
-0,34(0,26)
12,4910,2620,32
0,29
Incumbent Partners
NegativeBinomial
-1,97***(0.67)13,08**(5,32)18,84***(5,74)0,023(0.038)0,089(0,27)
-0,001(0,0006)0,39(0,27)0,089(0,27)1.04***
(0,39)0,77*(0,44)0,26(0,48)0,59*(0,32)
.
2SLS
-0,13(0,23)11,82***(4,26)16,95***(6,28)0,0042(0,02)
-0.59(0,38)
-0,0004*(0.0003)0.12(0,13)0,0001(0,0009)0.64***(0,21)0,39**(0,20)0,16(0,22)
5,2710,2610,16
0,13
Tabie 6B
ExplanatoryVariables:
Constant
Social CapitalChange in Social
CapitalStartup Experience
Partner Experience
Size
IPO
RegionalConcentration
D86
D87
D88
a
F-valuedffl2Adj, R2
Entering
NegativeBinomial
-1,08***(0,40)2
0,029(0,020)
-0,057(0.066)0,0008***(0.0003)0,87***(0,24)0.17(0,16)0,15(0.23)
-0.67***(0,26)
-1,43***(0,29)
-0,27(0,17)
Partners
OLS'
0,51***(0,19)
0,026*(0,016)
-0,037(0,044)0,0009***(0.0003)0,47***(0,15)0,0004(0,001)0,26(0.19)
-0,45**(0.19)
-0,79***(0,19)
9,948,2630,220,19
Incumbent Partners
NegativeBinomial
-1,50**(0,69)
0,056(0.037)
-0,12(0.084)
-0,0002(0,0006)0,47*(0.27)0.18(0.28)0,63(0,42)0,31(0,42)
-0.26(0.48)0,99**(0,40)
OLS
-0,32*(0,17)
0,042***(0,014)
-0.057(0,039)
-0,0001(0,0003)0,16(0,13)0.0003(0.0009)0,35*(0,18)0,13(0,17)
-0.14(0,18)
3,158,2630,0870,059
^2SLS coefficients are adjusted for serial correlation in the error term,R^ terms pertain to unadjusted estimates,^Standard errors are reported in parentheses.
*p < 0,10**p < 0.05
***p < 0,01
error. The F-statistic reported is not adjusted for this error.
control over the other. Biotechnology startups andtheir established firm partners have complementaryresources that are jointly necessary for product devel-opment and commercialization.
Such mutuality may not be present to such an extentin other technology-intensive industries. For example,Kogut et al. (1992) argue that cooperative agreementsbetween startups and established firms in the semicon-ductor industry are based on the technical standardswhich large firms own. Large firms dominate the net-
work structure of the semiconductor industry as theycompete for technological dominance through theiralliances with startups. In such a structure, embedded-ness clearly has a different meaning than in thebiotechnology network (compare, e.g., Marsden 1983).
Our results lead to the conclusion that some firmscontinuously improve their already strong social en-dowments, although at a decreasing rate, while otherfirms have less social capital to draw upon in formingnew relationships. This conclusion holds for relation-
ORGANIZATION SCIENCE/VOI. 8, No. 2, March-April 1997 119

GORDON WALKER, BRUCE KOGUT AND WEUIAN SHAN Formation of an Industry Network
Table 6C
ExplanatoryVariables:
Constant
Social Capital
Change in SocialCapital
D86
D87
D88
a
F-valuedffl2Adj, fl2
Entering
NegativeBinomial
-0,94***(0.26)11,91***(2,34)17,22***(3,41)0,72***(0,25)
-0,1(0,28)
-0,80**(0,32)
-0,24(0.16)
'The 2SLS regression resultslated error. The I
Partners
2SLS'
0,15(0.18)14,75***(1.97)21,14***(2,66)0,69***(0,19)
-0,095(0,19)
-0,42**(0,19)
22,935,2660,300,29
reported an
Incumbent manners
NegativeBinomial
-1,87***(0,39)12,17***(3,73)18,16***(5,003)1,12***
(0,38)0,75*(0,38)0,27(0,41)0,75**(0.34)
i adjusted•̂ -Statistic reported is not adjusted for
2SLS
-0,13(0,16)9,62***(1.77)13,09***(2.38)0.60***(0.17)0.36**(0.17)0,10(0,17)
9.825,2660.160.14
for autocorre-this error.
Table 7 Results of Two-stage Least Squares Regression
on Change in Sociai
ExplanatoryVariables:
Constant
Number of StartupRelationships with
Entering PartnersNumber of StartupRelationships withIncumbent PartnersExisting SocialCapitalNumber of Startupsin GroupD86
D87
D88
*p < 0,10**p < 0.05
***p < 0.01
Capitai
Dependent Variable:Change
0,0043(0.0054)0.018***(0.0038)
-0,44***(0,056)0,0001*(0,00007)
-0,025***(0.0054)
-0,0047(0,0051)0,0018(0,0054)
in Social Capital
0,0049(0,0077)
0.036***(0.017)
- 0 . 4 1 * * *(0,086)0,0003**(0,0001)
-0,037***(0.010)
-0,023***(0.009)
-0.014*(0,0075)
ships with both incumbent and newly-entering part-ners, indicating that the effect of network structure onforming new relationships is not moderated by partnerincumbency. Although the results for network forma-tion are similar for both incumbent and entering part-ners, these partner types differ in two important ways.First, entering partners tend to establish relationshipswith startups whose equity is publicly traded while thechoice of incumbents does not depend on the charac-teristics of individual startups. IPO (Initial Public Of-fering) appears to signal organizational legitimacy toentering firms rather than represent a source of poten-tial startup capital substituting for a partner's financialresources. A second difference between incumbent andentering partners is in the time trends. For relation-ships with entering firms, the signs on the year dummyvariables turn from negative to positive to negativeover the four years. Relationships with entering part-ners decline in the later years simply because there arefewer firms coming into the network. But, as shown inTable 4, the trend for incumbent partners remainspositive, though declining in the later years. Whenthere are fewer entrants, incumbent partners attractmore attention.
Path Dependence in NetworkFormation.The firms in the industry recreate a stable networkstructure whose foundation was laid at an early pointin the industry's history. Firms' early partner choicesthus have a significant impact on the course of futurecooperation. To examine this conjecture, we analyzeand compare the network structures from 1984 to 1988.Examining structural equivalence over time indicateshow much network structure is altered by, networkgrowth through entry and new relationships amongincumbents.
Table 8 presents cross-tabulations showing whetherpairs of firms remained structurally equivalent ornonequivalent from one year to the next. Entries onthe main diagonal in each table indicate persistence.To assess whether these entries are larger than theoff-diagonal entries, we calculated the cross-productratio for each table. The cross-product ratio is a com-monly used statistic for estimating the degree of associ-ation between two variables (see Agresti 1984,p. 15). A cross-product ratio of zero indicates no asso-ciation between the variables, and values of the ratio
120 ORGANIZATION SCIENCE/VOI. 8, No. 2, March-April 1997

GORDON WALKER, BRUCE KOGUT AND WEUIAN SHAN Formation of an Industry Network
Table 8 Structural
1, Startups
Str, eq.
1983Not. Str, eq.
Str, eq.
1986Not, Str. eq.
2, Established Firms
Str. eq.
1983Not. Str, eq.
Str, eq.
1986Not, Str, eq.
Equivalence of Organizations over Time
1984
Str, eq. Not Str, eq.
52*
4
190
189
Log cross productratio = 2.56
Std, error = 0,531987
Str, eq. Not. Str, eq.
1162
426
1067
1261
Log cross productratio = 1,17
Std. error = 0,07
1984
Str, eq. Not, Str. eq.
56
15
187
111
Log cross productratio = 2,74
Std, error = 0.031987
Str, eq. Not, Str, eq.
339
784
1097
24808
Log cross productratio = 2,28
Std, error = 0,03
Str. eq.
1984Not, Str, eq.
Str, eq.
1987Not. Str, eq.
Str. eq.
1984Not. Str. eq.
Str, eq.
1987Not, Str, eq.
1985
Str, eq. Not, Str, eq.
189
605
99
592
Log cross product
ratio = 0,62
Std, error = 0.14
1988
Str, eq. Not. Str, eq.
1609
903
519
1722
Log cross productratio = 1,78
Std, error = 0,07
1985
Str, eq. Not. Str, eq.
141
187
270
4058
Log cross productratio = 2.43
Std. error = 0,131988
Str, eq. Not, Str, eq.
368
971
1561
37855
Log cross productratio = 2,22
Std, error = 0,07
Str. eq.
1985Not. Str, eq.
Str, eq.
1985Not, Str, eq.
1986
Str, eq. Not, Str, eq.
917
270
528
631
Log cross productratio = 1,40
Std. error = 0,09
1986
Str. eq. Not, Str, eq.
257
377
651
10190
Log cross productratio = 2,47
Std, error = 0.09
*Entries in cells are pairs of organizations
greater than one imply a positive relationship. Becausethe logarithm of the cross-product ratio is less skewedthan the ratio itself, we use the log of the ratio to testfor structural persistence (Wickens 1989, pp. 218-222).These log ratios are all positive and strongly signifi-cantly different from zero for both startups and part-ners. Except for the 1983-1984 period, the tables showthat once a pair of startups are structurally equivalent,the odds are significant that they will continue to be so.Furthermore, the reverse is also generally true: if apair of startups are not structurally equivalent, they arelikely to remain this way.
Predicting partner groups over time depends mostlyon the persistence of structural dissimilarity, however.
Between 1987 and 1988, for example, the odds that apair of partners will continue to be structurally equiva-lent are roughly one to five (368/1561), while the oddsthat they will remain structurally nonequivalent areroughly forty to one (37855/971). The reason for thispattern is the large number of entering partners rela-tive to partners already in the network.
The structural development of the industry, based onthe building and reinforcement of social capital, offersa simple insight into the rigidity of organizational forms.Since an organization depends on the resources avail-able in its network, organizational inertia may be lessan inherent property of organizations than a product ofthe organization's position in a rigid network. The
ORGANIZATION SCIENCE/VOI. 8, No. 2, March-April 1997 121
GORDON WALKER, BRUCE KOGUT AND WEIJIAN SHAN Formation of an Industry Network
persistence of these positions, as shown in Table 8,suggests that a startup's characteristics may endurebecause of structural conditions (see Shan et al. 1994).
ConclusionSocial capital, as outlined by Coieman and Bourdieu, isa powerful concept for understanding how interfirmnetworks in emerging industries are formed. It is im-portant to note that network formation need not leadtowards an optimal structure for innovation or productcommercialization.'" Although there is evidence thatinterfirm cooperation and startup patent activity arerelated (Shan et al. 1994), the local benefits of partnersharing may not be distributed so that the most pro-ductive and useful technological advances are commer-cialized successfully.
The importance of network formation for interfirmcooperation has important consequences for organiza-tion theory. Taking the transaction as the unit ofanalysis is inadequate to capture the structural effectswe have identified. The study of interfirm cooperativeagreements over time requires an analysis of the net-work as a whole.
The persistence of network structure has subtle im-plications for entrepreneurial behavior. Structural per-sistence does not imply that firms are equally situatedto exploit profitable opportunities for cooperation. Be-cause the structure is relatively inert, brokering posi-tions are established early in the history of the net-work. In fact, if structure did not persist, all firmswould be potential brokers but with few enduringopportunities. Given the relative fixity of brokeringpositions, the kind of entrepreneurship Burt proposes,as the exploitation of structural holes, should be espe-cially profitable. An intriguing hypothesis is that thepursuit of these rewards explains the current wave ofmergers and acquisitions among biotechnology firms.
The persistence of the past is welcomed if alterna-tive futures look less promising, especially scenarioswith free-rider or prisoner-dilemma problems. But so-cial capital can also be associated with encumberingcommitments that impede competition and change. Ifbiotechnology firms could rewrite their histories ofcooperation, few would be surprised that an alternativepath of network formation would emerge. It is this gapbetween the desired and the actual that expresses mostclearly the idea that structure both enables and con-strains entrepreneurial ambitions.
AcknowledgmentThis research was supported through a grant from AT & T adminis-tered under the auspices of the Reginald H. Jones Center. We wouldlike to acknowledge the helpful comments of Arthur Stinchcombe.
Appendix A
Data Sources
The primary source of data is BIOSCAN (1988, 1989), a commercialdirectory of biotechnology firms, published and updated quarterly byORYX Press, Inc. Because it has generally been considered the mostcomprehensive compendium of information on relationships in theindustry, any relationship listed in BIOSCAN is included in oursample. However, because BIOSCAN may have omitted some rela-tionships terminated before 1988, we collected data from the threeother sources: (1) a proprietary database obtained from a leadingbiotechnology firm (called the "black volumes'!) in 1986; (2) adatabase developed by the North Carolina Biotechnology Center,based on published announcements of cooperative agreements; and(3) a direct mail survey of and telephone interviews with startups.
Because these latter three sources had neither BIOSCAN's his-tory of direct contact with startups and their partners nor its depth ofinformation about agreements, we relied less on their data. Weadded an agreement if it appeared in at least two of these sources.We found 46 relationships in this category. As they do not appear inthe 1988 BIOSCAN directory, we assumed that these relationshipshad been terminated before 1988; the network analysis for 1988therefore excluded them.
All startups in the final sample were independent businessesspecializing in the commercialization of biotechnology products.Their portfolio of products must include diagnostic or therapeuticPharmaceuticals. The agreements consisted of joint ventures, licens-ing, and long term contracts between startups and their partners.Powell and Brantley (1992) found that different types of relation-ships—e.g., licensing, joint venture, research and development lim-ited partnership—were not statistically related to how much firmsengaged in cooperative agreements. Consequently, the network weanalyze contains these types of relationship together. Since onlyfirms that have engaged in at least one agreement can contribute tonetwork structure, startups without relationships are excluded fromthe sample.
Application of these criteria produced a sample of 114 startupsthat had cooperative agreements before 1989. These startups dif-fered in their time of entry into the network, as Table 2 shows.Thirteen have agreements only with universities, government agen-cies and research institutes. (Many of these relationships representlicenses of the original patents stemming from university research.)We dropped these startups from the sample in order to retain agroup of partners whose interests were clearly commercial. Whereasuniversity ties are important for the initial licensing and subsequentconsulting services, our focus is on the structuring of relationshipsamong commercial partners."
Appendix B
Operationalization of Measures of Network StructureWe analyzed the asymmetric matrix of cooperative relationships withCONCOR, a network analysis algorithm (Breiger et al. 1975) thathas been used frequently in interorganizational research (Knoke andRogers 1978, Van de Ven et al. 1979, DiMaggio 1986, Schrum andWithnow 1988). The usual practice of applying CONCOR (see
122 ORGANIZATION SCIENCE/VOL 8, No. 2, March-April 1997

GORDON WALKER, BRUCE KOGUT AND WEUIAN SHAN Formation of an Industry Network
Arabie et al. 1978) is to dichotomize the full set of network members;then to split these two groups separately; then to split these results;and so on until either (1) a desired number of groups are obtained or(2) groups are obtained with a specific number of members. We usedthe following rules for applying CONCOR to both startups and theirpartners: (1) groups with fewer than 10 members were not split; and(2) when splitting a group produced a singleton subgroup, the groupwas kept whole. We followed this practice separately for both thestartups (rows) and their partners (columns) of the matrix of relation-ships. The purpose of these rules is to avoid groups with small sizesthat are inappropriate relative to the size of the network (see Walker1985).
Although CONCOR's results at the two-group level have beenbenchmarked against an optimality criterion (Noma and Smith 1985),the results of subsequent splitting have not been evaluated. Becauseof potential variation in decision rules for subsequent splits of thedata, different results may be achieved for the same data set. Toaddress this problem, we applied a second algorithm to the partitionof network members produced by CONCOR. This algorithm, calledCALCOPT, reallocates network members from group to group in thepartition if the shift in group membership improves a target functionconsistent with Lorrain and White's (1971) original definition ofstructural equivalence. This target function is Equation (2). ThusCALCOPT reallocates network members from one group to anotherif the move increases the dispersion of densities in the densitymatrix. CALCOPT evaluates the CONCOR row partition and thenthe column partition iteratively until no reassignment improves thetarget function.
CONCOR and CALCOPT were applied to each year of data from1984 to 1988. The data for each year are all cooperative relationshipsthat were established between the startups and their partners up tothat year minus any relationships that were terminated during thatyear. For example, the 1985 network includes the 1984 network plusall agreements begun between 1984 and 1985 minus terminatedrelationships. Thus five separate networks, one for each year, wereanalyzed to identify (1) groups of structurally equivalent startups andgroups of structurally equivalent partners and (2) the pattern ofintergroup densities used to measure social capital.
EndnotesBiotechnology includes all techniques for manipulating micro-
organisms. In 1973 Cohen and Boyer perfected genetic engineeringmethods, an advance that enabled the reproduction of a gene inbacteria. In 1975, Cesar Millstein and Georges Kohler producedmonoclonal antibodies using hybridoma technology; and in 1976DNA sequencing was discovered and the first working synthetic genedeveloped. These discoveries laid the technological base for the"new biotechnology."^Our definition of interfirm cooperative relationships is inclusive.For our purposes a cooperative relationship may be organized asequity or nonequity joint ventures, licensing, marketing or distribu-tion agreements, or research and development limited partnerships(see Appendix A). Further, we define a relationship between firmsrather than between projects so that new relationships entail newpartners rather than old partners attached to new projects. Thisdefinition coincides with our focus on network formation, ratherthan the evolution of a single interfirm relationship.
We do not observe the actual communication of information regard-ing partner behavior among startups. However, conversations withboard members of startup firms confirm that such communication isquite common (Hamilton 1992)."* Density is defined as: k/mn, where k is the number of actualrelationships a group of n structurally equivalent startups and agroup of m structurally equivalent partners. The densities of eachintersection can be calculated to form a density matrix. This matrix isthe basis for the construction of a blockmodel, a binary matrixrepresenting relations among groups of structurally equivalent firmsin the network (White et al. 1976, Arabie et al. 1978). Blockmodelstypically are constructed only for symmetric networks—i.e., networksthat are formed by relationships between only one type of firm, say,startups. Consequently, we do not develop a eonventional block-model for our data.This function has been used to analyze sparse networks in a number
of studies (Boorman and Levitt 1983, Walker 1985, 1988) whichfound it to have strong construct and predictive validity.^See endnote 3.This measure of soeial capital is structural, consistent with Coleman's
(1990) usage and arguments. Alternative measures based on at-tributes of specific interfirm relationships may be useful when globalnetwork data are not available (see Baker 1990).*To test whether the effect of startup experience on new startuprelationships might be quadratic, we included experience^ in theequation, without significant results. We made the same test forstartup size, also without significant results.The GLS results are not shown and are available from the authors
on request.'"For different perspectives on this topic see Baker (1987) andDelany (1988)."See Barley et al. (1992) on the sparseness of the university/NBFdensity matrix, as well as a breakdown of agreements by type (e.g.,licensing, joint venture).
ReferencesAcs, Z. and D. B. Audretsch (1989), "Entrepreneurial Strategy and
the Presence of Small Firms," Small Business Economics, 1, 3,193-213.
Agresti, A. (1984), Analysis of Categorical Data, New York: JohnWiley.
Arabie, P., S. A. Boorman, and P. R. Levitt (1978), "ConstructingBlockmodels: How and Why," loumal of Mathematical Psychol-ogy, 17, 21-63.
BIOSCAN (1988, 1989), Phoenix, AZ: Oryx Press.Baker, W. (1984), "The Social Structure of a National Securities
Market," American Joumal of Sociology, 89, 775-811.
(1990), "Market Networks and Corporate Behavior,"/Imen'ca/iJoumal of Sociology, 96, 589-625.
Barley, S. R., J. Freeman, and R. C. Hybels (1992), "StrategicAlliances in Commercial Biotechnology," in N. Nohria and R. G.Eccles (Eds.), Networks and Organization, Cambridge, MA:Harvard Business School Press.
Boorman, S. A. and P. R. Levitt (1983), "Blockmodelling ComplexStatutes: Mapping Techniques Based on Combinatorial Opti-
ORGANIZATION SCIENCE/VOI. 8, No. 2, March-April 1997 123

GORDON WALKER, BRUCE KOGUT AND WEIJIAN SHAN Formation of an Industry Network
mization for Analyzing Economic Legislation and Its StressPoints over Time," Economic Letters, 13-19.
Bound, J., C. Cummins, Z. Griiiches, B. H. Hall, and A. Jaffe (1984),"Who Does R & D and Who Patents?," in Z. Griiiches (Ed.),R&D, Patents, and Productivity, 21-54, Chicago, IL: Universityof Chicago Press.
Bourdieu, P. (1980), "Le Capital Sociale: Notes Provisaires," ^ c t o rfela Recherche en Sciences Sociales, 3, 2-3 .
and L. Waequant (1992), An Invitation to Reflexive Sociology,
Chicago, IL: University of Chicago Press.
Boyles, S. E. (1968), "Estimate of the Number and Size Distributionof Domestic Joint Subsidiaries," Antitrust Law and Economics
Review, 1, 81-92.
Breiger, R. L., S. A. Boorman, and P. Arabie (1975), "An Algorithmfor Clustering Relational Data, with Applications to Social Net-work Analysis and Comparison with Multidimensional Scaling,"Joumal of Mathematical Psychology, 12, 326-383.
Burt, R. L. (1980), "Models of Network Structure," Annual Review of
Sociology, 6, 79-141.
(1987), "Social Contagion and Innovation, Cohesion versusStructural Equivalence," American Joumal of Sociology, 92,1287-1335.
(1992), Structural Holes, Cambridge, MA: Harvard UniversityPress.
Calhoun, C. (1993), Bourdieu: Critical Perspectives, C. Calhoun,E. Lipuma, and M. M. Postone (Eds.), Cambridge, UK: PolityPress.
Cameron, A. and P. Trivedi (1986), "Econometric Models Based onCount Data: Comparisons and Applications of Some Estimators,"Joumat of Applied Econometrics, 1.
Clark, K., W. B. Chew, and T. Fujimoto (1987), "Product Develop-ment in the World Auto Industry," Brookings Papers on Eco-
nomic Activity, 3, 729-782.Coieman, J. (1990a), "Social Capital in the Creation of Human
Capital," American Joumal of Sociology, 94, S95-S120.
(1990b), Foundations of Social Theory, Cambridge, MA:Harvard University Press.
Delany, J. (1988), "Social Networks and Efficient Resource Alloca-tion: Computer Models of Job Vacancy Allocation throughContacts," in B. Wellman and S. Berkowitz (Eds.), Social Struc-
ture: A Network Approach, Cambridge, UK: Cambridge Univer-sity Press.
DiMaggio, P. and W. W. Powell (1983), "The Iron Cage Revisited:Institutional Isomorphism and Collective Rationality in Organi-zation Fields," American Sociological Review, 43, 147-160.
DiMaggio, Paul (1986), "Structural Analysis of Organizational Fields:A Blockmodel Approach," Research in Organizational Behavior,
8, 335-370.Doz, Y. (1988), "Technology Partnerships Between Larger and
Smaller Firms: Some Critical Issues," in F. Contractor andP. Lorange (Eds.), Cooperative Strategies in Intemational Business,
317-338, Lexington, MA: Lexington Books.Evan, W. M. (1972), "An Organization-set Model of Interorganiza-
tional Relations," in M. Tuite, R. Chisolm and M. Radnor(Eds.), Interorganizational Decision-Making, 181-200, Chicago,IL: Aldine.
Fruen, M. (1989), "Cooperative Structure and Competitive Strate-gies: The Japanese Enterprise System," UnpublishedManuscript, INSEAD.
Galaskiewicz, J. and S. Wasserman (1981), "A Dynamic Study ofChange in a Regional Corporate Network," American Sociologi-
cal Review, 46, 475-484.
Grabher, G. (1988), De-Industrialisierung oder Neo-Industrialisierung?,Berlin, Germany: Wissenschaftszentrum Berlin fur Sozial-forschung.
Granovetter, M. (1985), "Economic Action and Social Structure: TheProblem of Embeddedness," American Joumal of Sociology, 78,1360-1380.
Hagedoorn, J. and J. Schakenraad (1992), "Leading Companies andNetworks of Strategic Alliances in Information Technologies,"Research Policy, 21, 163-190.
Herrigel, G. (1991), "The Politics of Large Firm Relations withIndustrial Districts: A Collision of Organizational Fields inBaden Wurtemberg," in Country Competitiveness, B. Kogut (Ed.),London, UK: MacMillan.
Hofstede, G., B. Neujien, D. Daval Ohayv, and G. Sanders (1990),"Measuring Organizational Culture: A Oualitative and Ouanti-tative Study Across Twenty Cases," Administrative Science Quar-
terly, 3, 286-316.
Judge, G., W. E. Griffiths, R. C. Carter, H. Lutkepohl, and T.-C. Lee(1985), The Theory and Practice of Econometrics, New York:Wiley.
Knoke, D. and D. L. Rogers (1978), "A Blockmodel Analysis ofInterorganizational Networks," Social Science Research, 64,28-52.
Kogut, B. (1991), "Joint Ventures and the Option to Expand andAcquire," Management Science, 37, 19-33.
, W. Shan, and G. Walker (1994), "Knowledge in the Networkand the Network as Knowledge," in G. Grabher (Ed.), TheEmbedded Firm, London, UK: Routledge.
, G. Walker and D.-J. Kim (1995), "Cooperation and EntryInduction as a Function of Technological Rivalry," ResearchPolicy.
, , W. Shan, and D.-J. Kim (1995), "Platform Technologiesand National Industrial Networks," in J. Hagedoorn (Ed.), TheIntemationalization of Corporate Technology Strategies.
Lorrain, F. and H. C. White (1971), "Structural Equivalence ofIndividuals in Social Networks," Joumal of Mathematical Sociol-ogy, 1, 49-80.
Loury, G. (1977), "A Dynamic Theory of Racial Income Differences,"in P. A. Wallace and A. Le Mund (Eds.), Women, Minorities, andEmployment Discrimination, Lexington, MA: Lexington Books.
Mansfield, E. (1988), "The Speed and Cost of Industrial Innovationin Japan and the U.S.: External vs. Internal Technology," Man-agement Science, 34, 10, 1157-1168.
Marsden, P. V. (1983), "Restricted Access in Networks and Modelsof Power," American Joumat of Sociology, 88, 4, 686-717.
Mayhew, B. H. and R. L. Levinger (1976), "Size and the Density ofInteraction in Human Aggregates," American Joumal of Sociol-ogy, 82, 86-110.
124 ORGANIZATION SCIENCE/VOI. 8, No. 2, March-April 1997

GORDON WALKER, BRUCE KOGUT AND WEIJIAN SHAN Formation of an Industry Network
Meyer, J. W. and B. Rowan (1977), "Institutionalized Organizations:
Formal Structure as Myth and Ceremony," American Joumal of
Sociology, 83, 340-363.
Nohria, N. and C. Garcia-Pont (1991), "Global Strategic Linkages
and Industry Structure," Strategic Management Joumal, 12,
105-124.
Noma, E. and D. R. Smith (1985), "Benchmarks for the Blocking of
Sociometric Data," Psychological Bulletin, 97, 583-591.
Office of Technology Assessment (1984), Commercial Biotechnology,
An Intemational Analysis, U.S. Congress.
Oliver, C. (1988), "The Collective Strategy Framework: An Applica-
tion to Competing Predictions of Isomorphism," Administrative
Science Quarterly, 24, 405-424.
Pisano, G. (1990), "The R & D Boundaries of the Firm: An Empiri-
cal Analysis," Administrative Science Quarterly, 35, 153-176.
(1991), "The Governance of Innovation: Vertical Integration
and Collaborative Arrangements in the Biotechnology Industry,"
Research Policy, 20, 237-250.
Powell, W. W. and P. Brantley (1992), "Competitive Cooperation in
Biotechnology: Learning through Networks?," in N. Nohria and
R. G. Eccles (Eds.), Networks and Organization, Cambridge,
MA: Harvard Business School Press.
Raub, W. and J. Weesie (1990), "Reputation and Efficiency in Social
Institutions: An Example of Network Effects," American Joumal
of Sociology, 96, 626-654.
Scherer, F. M. (1986), Innovation and Growth: Schumpeterian Perspec-
tives, Cambridge, MA: MIT Press.
Schrum, W. and R. Withnow (1988), "Reputational Status of Organi-
zations in Technical SysXems," American Joumal of Sociology, 93,
882-912.
Sehumpeter, J. A. (1934), The Theory of Economic Development,
Cambridge: MA: Harvard University Press.
Shan, W. (1987), "Technological Change and Strategic Cooperation:
Evidence from Commercialization of Biotechnology," Ph.D. Dis-
sertation, University of California, Berkeley.
(1990), "An Empirical Analysis of Organizational Strategies by
Entrepreneurial High-technology Firms," Strategic Management
Joumal, 11, 129-139.
, G. Walker, and B. Kogut (1994), "Interfirm Cooperation and
Startup Innovation in the Biotechnology Industry," Strategic
Management Joumal, 15, 5, 387-394.
Stinchcombe, A. L. (1965), "Social Structure and Organizations," in
J. G. March (Ed.), Handbook of Organizations, 142-193, Chicago,
IL: Rand McNally.
Teece, D. (1988), "Capturing Value from Technological Innovation:
Integration, Strategic Partnering and Licensing Decisions," In-
terfaces, 18, 46-61.
Van de Ven, A., G. Walker, and J. Liston (1979), "Coordination
Patterns within an Interorganizational Network," Human Rela-
tions, 32, 19-36.
Walker, G. (1985), "Network Position and Cognition in a Computer
Software Firm," Administrative Science Quarterly, 30, 103-130.
(1988), "Network Analysis for Interorganizational Cooperative
Relationships," in F. Contractor and P. Lorange (Eds.), Coopera-
tive Strategies in Intemational Business, Lexington, MA: Lexing-
ton Books.
White, H., S. A. Boorman, and R. Breiger (1976), "Social Structure
from Multiple Networks, I, Blockmodels of Roles and Positions,"
American Joumal of Sociology, 81, 730-780.
Wickens, T. D. (1989), Multiway Contingency Tables Analysis for the
Social Sciences, Hillsdale, NJ: Lawrence Eribaum.
Accepted by Arie Y. Lewin; received February 1995. This paper has been with the authors for two revisions.
ORGANIZATION SCIENCE/VOI. 8, No. 2, March-April 1997 125

Related Documents