Working Paper No. ZU-WP 2010-002 Wages in the United Arab Emirates Dr. Qingxia Tong

Welcome message from author
This document is posted to help you gain knowledge. Please leave a comment to let me know what you think about it! Share it to your friends and learn new things together.
Transcript

Working Paper No. ZU-WP 2010-002
Wages in the United Arab Emirates
Dr. Qingxia Tong

Views presented in this working paper are those of the authors and do not necessarily represent views of Zayed University
© 2017 Zayed University. All rights reserved.

WAGES IN THE UNITED ARAB EMIRATES
JULY 2010
Dr. Qingxia Tong
Assistant Professor
Zayed University
This work has been supported technically and financially by the UAE Ministry of Labor

2
Wages in the United Arab Emirates
Introduction
Wage and salaries are the main part of labor costs for employers and main source of income for
the employed. They are crucial information in business decision making and policy making. In
an increasingly globalized world economy where capital, know-how, and talents are more mobile
than ever before, wages and salaries are not immune to the impact of globalization and
international competition. Workers compete not only with their fellow workers on domestic
labor markets for better jobs and better pay, but also compete with foreign workers in foreign
countries or with migrant workers who have come to the host countries for work. International
competition has the tendency of driving down the gap of labor costs along certain dimensions but
exacerbates the gap along other dimensions. As a result, wages reflect not only the supply and
demand on domestic markets but on international markets as well, especially for countries with
an open labor market.
This paper analyzes wages in the United Arab Emirates (UAE). A small, open and fast-
growing economy, the UAE presents an interesting case with regard to its labor economics. This
is an emerging economy staffed primarily by foreign workers, with rather narrow industrial
focuses mainly in the energy and service sectors but thin in manufacturing and technology
sectors. This is also a transitional economy that tries to diversify away from hydrocarbon-based
to non-hydrocarbon-based economic growth. One of the main constraints during the transition is
the scarcity of skilled knowledge workers from the local population while there are abundant
supply of imported unskilled foreign workers. By analyzing the size and distribution of wages
across economic sectors, this paper sheds light on labor conditions and labor market dynamics in
this country. The analyses in the paper are built on two data sources: Dubai Economic Council’s
2008 labor force survey, and the Ministry of Labor’s Wage Protection System (WPS) data base.

3
I. The 2008 Labor Force Survey
The 2008 labor force survey is a representative household survey of the UAE population, using
geographic sampling technique but excluding labors living in labor camps. For every household
sampled, researchers investigated the employment status for every adult member of that
household, generating a sample of 22,416 employed people from 9,654 households. We analyze
the annual salaries received by these people and the length of their work time by breaking down
the data by respondents’ age, gender, education, skill levels, industries, sectors, place of work
and nationalities. After that, we run a regression analysis of the effects of these factors on
salaries and working hours. Finally, we study the effects of skills and education on salaries and
working time in different industries and in different emirates. The gender inequality in pay and
benefits is also analyzed at the end.
Overall, there is a huge variation of salaries, benefits and length of work time among
workers in the UAE. While a small portion of high-skilled workers, i.e. professionals and
managers, enjoy internationally competitive pay, the majority of workforce are low-skill, low-
paid, making on average one-sixth of salaries the former group is making. Salaries and benefits
also differ widely across age, gender, education, industries, sectors, emirates, and workers’
nationalities. Salaries paid in kind are around 13% of salaries paid in cash, and vary significantly
like the latter do. The two types of salaries are positively correlated at a statistically significant
level. The number of working hours on the other hand has a negative correlation with salaries:
the higher the salaries, the fewer hours of work. While the payoff of education and skills are
strong and significant, their effects on salaries, benefits and working hours also depend on the
industries and emirates the workers are working in. Female workers are making significantly less
than male workers, but the gender gap is worse for high-skill and high-education women than for
the low-skill and low-education ones.

4
1. Summary statistics
Table 1 shows that annual employee salaries in the UAE are not symmetrically distributed. Low-
paid workers make as little as AED 1,320 during 2008 whilst the highest-paid workers make
5454 times more than the former. The presence of high-income workers have skewed up the
average annual salaries: the mean salary number reaches as high as AED 90K, but the median
salary is around AED 39K only. Cash salaries are the main part of the overall salaries ranging
around AED 36K (median); the rest are salaries paid in kind. The majority of the workforce,
however, do not receive any in-kind benefits (median: 0). On average, workers work for 52 hours
(mean) per week in the UAE. A small number of respondents have also reported overtime work
in the week preceding the survey. If we divide the total annual salary by the total number of
working hours in a year (in median term), we get an estimate of effective working hour wage
(EWHW) at AED 15.625/hour. (From now on, we use median numbers in the analysis unless
otherwise specified.)
EWHG = Annual salary/(N of weekly working hours * 52 weeks) = 39,000/(48*52) = 15.625
Table 1: Summary statistics of annual salaries in the UAE (2008 Labor force survey)1
Annual salary for paid employees
Annual cash salary
Annual in-kind salary
% of In-kind vs..cash salary
Number of weekly working hours
Overtime work hours last week
N 22416 22416 22416 22416 23539 648
Mean 90484 82609 7870 0.135 52 8.0
Median 39000 36000 0 0 48 7.0
Std. Deviation 136772 127614 23238 0.215 15 4.4
Skewness 8.136 9.126 7.424 2.504 1.701 3.184
Minimum 1320 1320 0 0 2 .0
Maximum 7200000 7200000 600000 2.57 168 60.0
1 The sample has been weighted to generate the statistics reported in this and other tables in the paper.

5
Geographically, workers’ salaries differ significantly from some emirates to others. The
Emirate of Dubai has the highest annual salaries on average (52K), followed by the Emirates of
Abu Dhabi (42K) and Sharjah (30K). The Emirate of Ras Al Khaimah has by far the lowest
salaries on average (13K). The difference between the highest and lowest pay is striking for such
a small country. The other three northern emirates, Ajman, Umm El Quawain, and Fujeirah, have
similar salary levels ranging from 18K to 20K in 2008, and their differences are not statistically
significant. In terms of the structure of salaries, the Emirate of Fujeirah stands out for having the
highest level of in-kind benefits than the others (AED 3600/year). In terms of the length of work,
five of the seven emirates, except for Ras Al Khaimah and Fujeirah, have reported average
working hours of 48 per week. The median chi-square statistics at the bottom of the table shows
cross-emirate differences in salaries, benefits and working time are statistically significant.
Table 2: The median salaries and working hours across 7 emirates
Emirates N Annual salary
Salary in cash
Salary in kind
N Working hours
Dubai 7012 52,800 48,000 2,400 7435 48
Abu Dhabi 8229 42,000 42,000 0 8429 48
Sharjah 2954 30,000 24,000 1,200 3211 48
Ajman 870 20,400 18,000 600 967 48
Umm El Quawain 476 18,000 18,000 0 500 48
Ras Al Khaimah 1765 13,440 12,000 0 1849 54
Fujeirah 1092 18,000 14,400 3,600 1118 54
Chi-Square 1132.495 1042.823 2530.023 654.209
Asymp. Sig. .000 .000 .000 .000
The salaries differ a lot between the public and private sectors too. Compared to the AED
36K/year in the private sector, government jobs pay much higher salaries. The median salaries at
the federal government are above AED 188K in 2008; local government jobs (AED 84K/year)
pay significantly less than the federal government does, but still three times the median salaries
in the private sector. The number of weekly working hours are also significantly less in the
public sector (40h/week) than in the private sector (48h/week). Jobs that receive the lowest pay

6
(AED 10K) but require the longest working hours (70h/week) are those working in the private
households such as maids and servants.
Table 3: The median salaries and working hours in public and private sectors in the UAE
N Annual salary Salary in cash
Salary in kind
N Working hours
Federal government 3224 188,868 180,000 0 3224 40
Local government 3574 84,000 78,000 2,400 3574 40
Joined sector 968 120,000 120,000 0 972 45
Private sector 10313 36,000 36,000 0 11376 48
Foreign sector 267 120,000 120,000 2,400 267 45
Without establishment 128 13,200 10,800 3,000 175 63
Private household 3910 10,800 8,400 900 3910 70
Chi-Square 6146.463 6116.186 302.552 6073.703
Asymp. Sig. .000 .000 .000 .000
Not so surprisingly, female workers in general are making significantly less than male
counterparts at work. In the UAE, the median salaries for female workers are around AED 24K
but 42K for male workers. The average number of working hours also tends to be longer for
women than for men.
Table 4: The median salaries and working hours for male and female workers
N Annual salary Salary in cash Salary in kind N Working hours
Female 6033 24000 24000 600 6112 48 (mean: 57)
Male 16383 42000 36000 0 17418 48 (mean: 51)
Chi-Square 95.397 62.985 5.911 109.875
Asymp. Sig. .000 .000 .015 .000

7
Young workers below the age 40 dominate the UAE workforce. The median annual
salaries are AED 31K for workers between 15-39, AED 66K for those between 40-59, and AED
120K for those above 60. The median number of working hours is the same for all three age
groups, but the mean number decreases as age increases.
Table 5: The median salaries and working hours for workers in different age groups
N Annual salary
Salary in cash
Salary in kind N Working hours
Age 15-39 16040 31,200 30,000 0 16444 48 (mean: 53)
Age 40-59 6039 66,000 60,000 0 6624 48 (mean: 51)
Age 60 & above 337 120,000 120,000 0 462 48 (mean: 48)
Chi-Square 943.309 975.813 22.071 71.551
Asymp. Sig. .000 .000 .000 .000
The payoff of education for workers in the UAE is significant. One-fifth of the labor
force are illiterate and their median salaries are around AED 14K. Another one-fifth of the labor
force have finished primary education and receive a median salary of AED 19K in 2008. The
salaries more than doubled for workers who manage to finish a secondary education, reaching
AED 48K per year. For the rest 30% of the workers who have a university degree, their median
annual salaries are as high as AED 120K. The length of working time decreases consistently as
the education level increases.
Table 6: The median salaries and working hours for workers at different education levels
Education N Annual salary
Salary in cash Salary in kind N Working hours
Illiterate 4032 14400 12000 840 4116 56
Primary 5001 19200 16800 1200 5216 54
Secondary 6524 48000 42000 0 6885 48
University 6859 120000 111000 0 7313 45
Chi-Square 11958.538 11796.559 172.769 3020.925
Asymp. Sig. .000 .000 .000 .000

8
While education provides a proxy for the value of labor, skills are what labor markets
care about most in the end. Unskilled labors doing elementary jobs earn a median salary of AED
18K only in 2008. The bulk of the labor force are low-skilled clerks, service workers and
craftsmen, making AED 24K a year. By contrast, the skilled workers like professionals and
managers earn from AED 84K to 144K.
Table 7: The median salaries and working hours for workers at different skill levels
Skill N Annual salary
Salary in cash
Salary in kind N Working hours
Elementary 1885 18000 14400 2400 1892 48
Clerk/Services/Crafts 11428 24000 19200 0 11648 54
Semi-professional 3008 84000 72000 0 3046 48
Senior-professional 4900 144000 127458 0 5749 48
Chi-Square 11272.078 11522.927 270.580 2737.355
Asymp. Sig. .000 .000 .000 .000
Industry-wise, we once again find significant cross-group differences. Mining (AED
192K) , finance (120K) and real estate (103K) have the highest paid jobs, while agriculture
(12K), housework (12K), construction (33K), and manufacturing (39K) are among the lowest
paid industries.
Table 8: The median salaries and working hours in different industries
Industry N Annual salary
Salary in cash
Salary in kind
N Working hours
Agro fishery 829 12,000 9,600 0 843 60
Mining 485 192,000 156,000 0 487 40
Manufacturing 1442 39,600 36,000 0 1607 48
Utilities & Energy 284 84,000 72,000 0 291 40
Construction 2222 33,758 30,000 0 2385 48
Trade and Repair Services 2546 42,000 36,000 996 3009 48
Hotels and Restaurants 559 20,400 15,600 2,400 584 56
Logistics 1505 48,000 42,382 0 1584 48

9
Financial Services 757 120,000 114,000 0 766 45
Housing and rent services 5298 103,200 96,000 697 5411 42
Education 1341 96,000 84,000 0 1350 40
Health & Social services 632 96,000 84,000 0 646 45
Other services 4486 12,000 9,600 960 4535 70
Chi-Square 6806.180 6667.894 343.175 6127.033
Asymp. Sig. .000 .000 .000 .000
Workers in the UAE come from diverse nationalities, and the differences in their salaries
and working hours are striking. Western and Emirati workers are paid way above the national
average, at AED 312K and 216K respectively, followed by GCC nationals (78K) and non-GCC
Arab workers (72K). Asian workers are paid the least and work the longest hours.
Table 9: The median salary and working hours for workers from different nationalities
N Annual salary
Salary in cash
Salary in kind N Working hours
Emirati 4754 216,000 204,000 0 4891 40
Other GCC nationals 130 78,000 72,000 0 142 40
Non-GCC MENA 3247 72,000 70,800 0 3619 48
Rest of Africa 1059 20,400 18,000 986 1089 54
Asian tigers 1072 10,704 8,400 1,200 1087 70
Bang, Ind, Pak, Phi 10954 25,200 24,000 1,200 11427 48
Western (EU, USA, etc)
445 312,000 273,332 12,000 481 40
Rest of Asia 533 21,600 18,000 1,200 556 49
Chi-Square 5619.296 5931.184 672.350 2266.775
Asymp. Sig. .000 .000 .000 .000
2. OLS regressions
To estimate the effects of above-mentioned socioeconomic factors on salaries, benefits and
working hours, we run a set of OLS regressions and report the results in Table 10. Gender is
confirmed to have a negative impact on salaries for female workers, both cash and non-cash

10
salaries, but not on the hours of work. Similarly, age is found to have a negative impact on
salaries for young workers, but no impact on the length of work. The positive effects of
education and skills on pay are strong and significant, especially for the highest-paid jobs.
Workers with a university degree makes nearly 39K more a year than those with a secondary
degree; and high-skilled managers and professionals make 78K more than low-skilled clerks and
craftsmen. The gaps decrease as one moves down the ladder of education and skills. This is also
the case for the number of working hours.
Using housing services as the reference group, we find that mining industry has the
highest pay amongst all industries, followed by housing and financial services. A large part of
the pay premium in the mining industry consists of in-kind benefits. Energy and health services
are two other industries that have above-average non-cash benefits. One notable finding is that
jobs in education pay significantly worse after we control for everything else, despite the fact
that average salaries are fairly high in that industry. In terms of hours of work, agriculture and
hospitality have longer hours than the others while educational jobs enjoy shorter time at work.
The previous finding that salaries differ across emirates has been confirmed by the
regression results. What is interesting is, after controlling for other factors, Abu Dhabi, instead of
Dubai, turns out to be the one that pays the highest salaries, and workers in Dubai work the
longest hours. In terms of benefits, jobs in Abu Dhabi, Sharjah, and Fujeirah pay higher than
those in Dubai do.
The regressions also confirm a well-known fact that government jobs pay much better
than private sector jobs and have shorter time of work as well. Everything else being equal,
however, it is the foreign sector and joined sector that have the highest pay, rather than the
federal and local governments.

11
Given the above findings, it may not be surprising to find out that western expatriate
workers are by far the highest paid, followed by the UAE nationals. Workers from Bangladesh,
India, Pakistan and Philippine are the lowest paid, and as noted earlier, they are also the majority
of labor force in the UAE. In terms of hours of work, nationals from the UAE, GCC and western
countries work significantly less than the others.
Table 10: The OLS regression results
Annual salary Salary in cash Salary in kind Working hours
b p b p b p b p
Female -32821.2 0.000 -28901.4 0.000 -3919.51 0.000 -0.19455 0.386
Age (Base: 15-39)
Age 40-59 29925.79 0.000 27160.88 0.000 2760.022 0.000 -0.01473 0.928
Age above 60 34171.74 0.000 26865.64 0.000 7312.502 0.000 0.001613 0.998
Education (Base: University & above)
Illiterate -56658.1 0.000 -52148.7 0.000 -4513.33 0.000 4.705634 0.000
Primary -48814.3 0.000 -45250.9 0.000 -3566.87 0.000 4.327806 0.000
Secondary -38983 0.000 -36174.2 0.000 -2809.72 0.000 1.938932 0.000
Skill (Base: clerk/servicework/crafts)
Elementary -14686.2 0.000 -14321.6 0.000 -362.573 0.435 -1.01771 0.000
Semi-professional 26629 0.000 23933.19 0.000 2697.135 0.000 -2.20088 0.000
Senior/Professional 78059.97 0.000 69618.75 0.000 8429.834 0.000 -2.16236 0.000
Industry (Base: Housing & rent services)
Agro Fishery -21547.8 0.000 -21019.2 0.000 -533.722 0.509 4.118544 0.000
Mining 51289.07 0.000 29764.19 0.000 21508.14 0.000 -0.64152 0.229
Manufacturing -13889 0.000 -13568.2 0.000 -316.912 0.604 0.904441 0.007
Utilities & energy -10110.4 0.080 -12772.5 0.019 2671.145 0.032 -2.10312 0.002
Construction -14662.1 0.000 -14287.8 0.000 -368.33 0.500 -0.3558 0.233
Trade & repair services -21334.9 0.000 -20444.9 0.000 -891.662 0.095 2.263911 0.000
Hotels & restaurants -27528 0.000 -28144.4 0.000 618.3871 0.412 5.721446 0.000
Logistics & transport -13700.8 0.000 -11678.3 0.000 -2020.61 0.000 2.589806 0.000
Financial services -713.886 0.854 773.0596 0.834 -1483.39 0.078 -1.27249 0.006
Education -60088 0.000 -57454.8 0.000 -2620 0.000 -4.39591 0.000
Health and social services -11960.8 0.003 -15070.2 0.000 3106.712 0.000 0.489964 0.303
Other services -15001.8 0.000 -14854.2 0.000 -143.427 0.864 4.526709 0.000
Industry not defined -11498.4 0.757 -22649.6 0.519 11166.15 0.165 5.755659 0.190
Emirate (Base: Dubai)
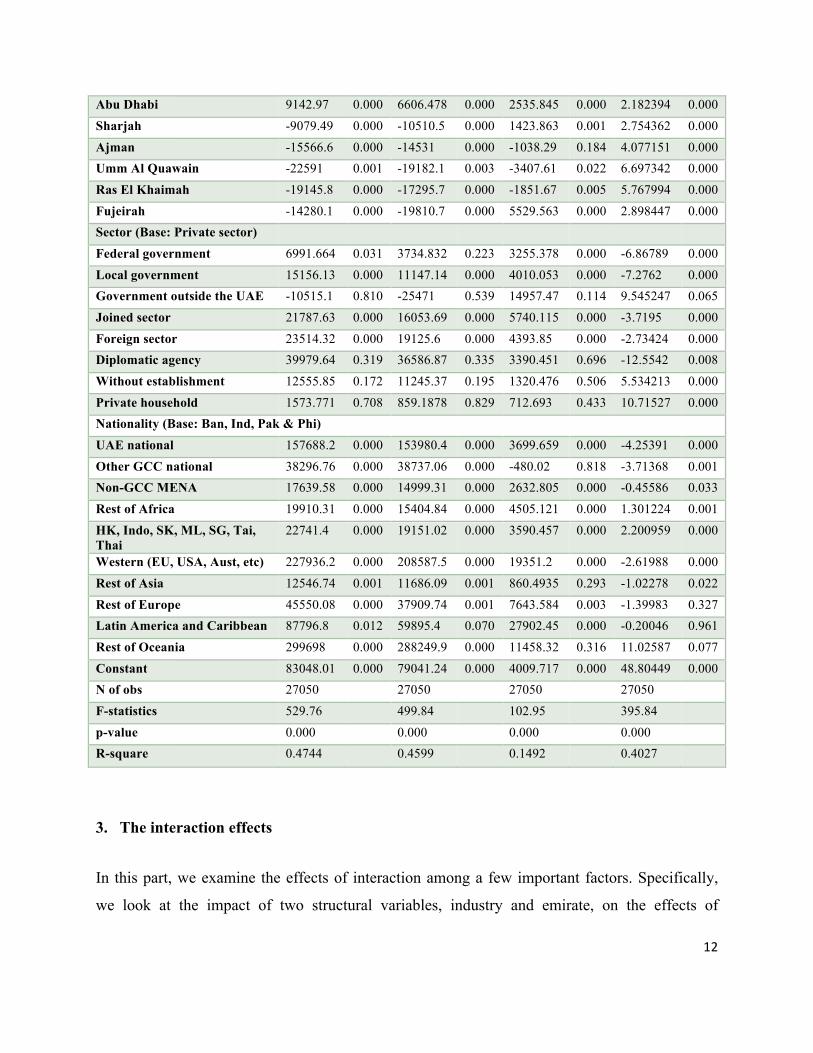
12
Abu Dhabi 9142.97 0.000 6606.478 0.000 2535.845 0.000 2.182394 0.000
Sharjah -9079.49 0.000 -10510.5 0.000 1423.863 0.001 2.754362 0.000
Ajman -15566.6 0.000 -14531 0.000 -1038.29 0.184 4.077151 0.000
Umm Al Quawain -22591 0.001 -19182.1 0.003 -3407.61 0.022 6.697342 0.000
Ras El Khaimah -19145.8 0.000 -17295.7 0.000 -1851.67 0.005 5.767994 0.000
Fujeirah -14280.1 0.000 -19810.7 0.000 5529.563 0.000 2.898447 0.000
Sector (Base: Private sector)
Federal government 6991.664 0.031 3734.832 0.223 3255.378 0.000 -6.86789 0.000
Local government 15156.13 0.000 11147.14 0.000 4010.053 0.000 -7.2762 0.000
Government outside the UAE -10515.1 0.810 -25471 0.539 14957.47 0.114 9.545247 0.065
Joined sector 21787.63 0.000 16053.69 0.000 5740.115 0.000 -3.7195 0.000
Foreign sector 23514.32 0.000 19125.6 0.000 4393.85 0.000 -2.73424 0.000
Diplomatic agency 39979.64 0.319 36586.87 0.335 3390.451 0.696 -12.5542 0.008
Without establishment 12555.85 0.172 11245.37 0.195 1320.476 0.506 5.534213 0.000
Private household 1573.771 0.708 859.1878 0.829 712.693 0.433 10.71527 0.000
Nationality (Base: Ban, Ind, Pak & Phi)
UAE national 157688.2 0.000 153980.4 0.000 3699.659 0.000 -4.25391 0.000
Other GCC national 38296.76 0.000 38737.06 0.000 -480.02 0.818 -3.71368 0.001
Non-GCC MENA 17639.58 0.000 14999.31 0.000 2632.805 0.000 -0.45586 0.033
Rest of Africa 19910.31 0.000 15404.84 0.000 4505.121 0.000 1.301224 0.001
HK, Indo, SK, ML, SG, Tai, Thai
22741.4 0.000 19151.02 0.000 3590.457 0.000 2.200959 0.000
Western (EU, USA, Aust, etc) 227936.2 0.000 208587.5 0.000 19351.2 0.000 -2.61988 0.000
Rest of Asia 12546.74 0.001 11686.09 0.001 860.4935 0.293 -1.02278 0.022
Rest of Europe 45550.08 0.000 37909.74 0.001 7643.584 0.003 -1.39983 0.327
Latin America and Caribbean 87796.8 0.012 59895.4 0.070 27902.45 0.000 -0.20046 0.961
Rest of Oceania 299698 0.000 288249.9 0.000 11458.32 0.316 11.02587 0.077
Constant 83048.01 0.000 79041.24 0.000 4009.717 0.000 48.80449 0.000
N of obs 27050 27050 27050 27050
F-statistics 529.76 499.84 102.95 395.84
p-value 0.000 0.000 0.000 0.000
R-square 0.4744 0.4599 0.1492 0.4027
3. The interaction effects
In this part, we examine the effects of interaction among a few important factors. Specifically,
we look at the impact of two structural variables, industry and emirate, on the effects of

13
individual merits, i.e. skills and education, on job pay. On an efficient job market, we would
expect to see meritocratic pay play a more important role in pay determination as supply and
demand would drive out any inefficiency caused by unsound segmentation of labor markets. Of
course, labor markets are never perfect: wages could be sticky, mobility could be undercut by
contracts or regulations, and skills could be difficult to transfer from one job to another, and so
on. Hence, we add a number of interaction variables to the previous regression models, and
report the results of these interaction effects below.
Note that in Table 11, the location of jobs make a lot more differences for high-skill
workers than for low-skill ones. Senior managers and professionals receive higher pays for their
skills if they are working Abu Dhabi than in Dubai, and subsequently, those in Dubai earn more
than those in the other five Emirates. This is not the case for lower-skill workers. Although
semi-professionals also receive a higher pay in Abu Dhabi than in Dubai, the differences
between Dubai and the other five Emirates disappear. For unskilled labors, the difference
between working in Dubai and Abu Dhabi disappear too, but Sharjah appears to offer a higher
pay for elementary jobs than in Dubai.
Table 11: The effects of interaction between skills and emirates
Annual salary Salary in cash Salary in kind Working hours
Elementary/Abu Dhabi 7075.79 7087.20 -6.81 -0.69
Elementary/Sharjah 12277.85* 13518.62* -1236.72 4.904***
Elementary/Ajman 5479.61 6078.64 -594.99 4.17
Elementary/UAQ 9790.39 10782.96 -993.86 -10.08***
Elementary/RAK 6580.97 6648.92 -65.00 0.82
Elementary/Fujeirah 13434.94 17148.50 -3711.12 1.72
Semi-professional/A.D 12984.02** 8380.20* 4606.979*** -2.083***
Semi-professional/Sharjah -4225.54 -3571.62 -647.84 -3.442***
Semi-professional/Ajman -20592.27 -17528.04 -3058.46 -5.656***
Semi-professional/UAQ -19364.70 -12557.52 -6804.22 -7.49**
Semi-professional/RAK -18991.06 -13543.75 -5445.083* -6.925***

14
Semi-professional/Fujeirah -10531.73 -21925.37 11397.85*** 0.48
Senior professional/A.D. 34151.7*** 18347.17*** 15797.14*** -0.81
Senior professional/Sharjah -30299.65*** -30939.47*** 617.59 -2.204***
Senior professional/Ajman -54398.64*** -50368.63*** -4021.40 -3.208**
Senior professional/UAQ -52898.49* -44074.38* -8820.43 -5.504*
Senior professional/RAK -58832.89*** -52993.62*** -5849.954** -3.947***
Senior professional/Fujeirah -60755.92*** -67371.22*** 6622.789** 0.43
Similarly, industry matters more for high-skilled workers than for low-skilled ones.
Being in the mining industry increases the salaries of senior professionals and managers by over
54K, while being in the education industry decreases them by over 73K, compared to those
working in the real estate sector. The effects of industry on the relationship between salaries and
skills decrease for low-skilled jobs. For elementary jobs, industry makes almost no differences to
the payoff of skills, except for the agriculture and construction industry. In terms of the length of
work, the interaction effects between skills and industry are relatively more even. Certain
industries such as agriculture, hospitality, and logistics tend to shorten the hours of work for
workers at all skill levels. Some other industries have no impact on the effect of skills on
working hours, and still others have some impact at one or two skill levels. Note that elementary
jobs in education industry tend to have significantly longer hours.
Table 12: The effects of interaction between skills and industries
Annual salary
Salary in cash
Salary in kind
Working hours
Elementary/Agro fishery 18445.58* 20317.77** -1,876.02 -4.297***
Elementary/Mining -710.67 2,116.44 -2,829.03 -2.40
Elementary/Manufacturing 15,940.55 14,917.07 1,022.09 -2.514*
Elementary/Utilities & energy -4,093.32 326.50 -4,422.78 3.76
Elementary/Construction 17827.38** 19263.01** -1,439.86 -0.34
Elementary/Trade & repair 15,360.56 17902.61* -2,544.14 -2.76*
Elementary/Hotels & restaurant 14,941.93 18,334.79 -3,396.40 -7.83***
Elementary/Logistics 10,199.55 11,604.24 -1,407.19 -3.147**
Elementary/Financial services 442.41 3,785.58 -3,345.73 1.30
Elementary/Education -4,435.02 -1,359.89 -3,078.92 5.103903**

15
Elementary/Health & social services 17,494.02 20,516.67 -3,021.22 -5.365*
Elementary/Other services 9,934.93 13265.15* -3332.83* -6.663***
Semi-professional/Agro fishery -48866.65* -47116.37* -1,753.85 -7.270**
Semi-professional/Mining 9,669.65 -2,227.10 11891.82*** 0.92
Semi professional/Manufacturing -18897.1* -17692.88* -1,209.56 -1.32
Semi professional/Utilities & energy -25,862.41 -26,891.17 1,020.40 2.76
Semi professional/Construction -13,733.22 -13181.31* -559.33 0.67
Semi professional/Trade & repair -21692.07*** -18487.46** -3211.148* -0.89
Semi professional/Hotels & restaurant -39733.57** -35853.16** -3,885.91 -4.750**
Semi professional/Logistics -12,212.89 -8,898.31 -3318.843* -3.013**
Semi professional/Financial services -8,383.23 -6,742.70 -1,647.77 0.97
Semi professional/Education -28937.03* -32154.19** 3,210.38 -2.21
Semi professional/Health & social services -9,407.76 -12,868.72 3,458.73 0.27
Semi professional/Other services -33221.99** -27038.46** -6187.532** -3.233**
Semi professional/Industry not defined -53,894.45 -55,391.74 1,485.70 -6.82
Senior-professional/Agro fishery -28,843.06 -27,675.48 -1,533.34 -8.595**
Senior-professional/Mining 54627.11*** 29795.17** 24792.29*** -1.49
Senior-professional/Manufacturing -6,561.04 -7,035.76 482.00 -0.83
Senior-professional/Utilities & energy 24,290.69 8,283.34 16010.98*** 1.22
Senior-professional/Construction -18404.94** -16796.53** -1,603.02 0.66
Senior-professional/Trade & repair -38068.11*** -32644.68*** -5445.132*** -2.759***
Senior professional/Hotels & restaurant -57595.7*** -57680.12*** 68.03 -6.605***
Senior professional/Logistics -16802.66* -13027.24* -3768.079* -2.814***
Senior-professional/Financial services 25323.23** 24473.4** 855.07 0.77
Senior-professional/Education -75312.01*** -72775.35*** -2,528.42 -1.90
Senior-professional/Health & social services
-2,630.38 -8,865.37 6225.304* 2.33
Senior-professional/Other services -524.91 1,909.79 -2,425.02 -5.840***
Senior-professional/Industry not defined 31,013.04 22,349.14 8,667.93 -4.17
In Table 13 and 14, we present the interaction effects between education and emirates,
and the interaction effects between education and industry. Generally speaking, people with low
education (illiterate and primary) are more affected by the place of work and the industry in
terms of their salaries and working hours. Working in Abu Dhabi, instead of in Dubai, tend to
drive down the pay of workers without a university degree, while working in the other five
emirates tend to drive up the pay of these workers, compared to those in Dubai. The impact of
location appear stronger at the lower echelon of the educational ladder.

16
Industry-wise, construction, trade, hospitality, and logistics all have a positive effect on
the pay at different educational levels. The education industry itself benefits workers with a
primary or secondary education, but not illiterate workers. Agriculture on the other hand benefits
workers with below secondary education, not above. In terms of working time, the interaction
effects mostly occur at the illiterate and primary education levels. For workers with a higher
education, the location or industry of their jobs do not have major impact on the hours of work.
Table 13: The effects of interaction between education and Emirates
Annual Salaries Salaries in cash Salaries in kind Working hours
Illiterate/Abu Dhabi -23765.33*** -12104.9** -11659.4*** 2.138***
Illiterate/Sharjah 33387.31*** 34047.83*** -641.4283 8.786***
Illiterate/Ajman 56915.16*** 51315.3*** 5598.605* 4.497**
Illiterate/UAQ 57443.81* 47986.44* 9452.887 5.612
Illiterate/RAK 57823.3*** 51835.34*** 5985.422** 8.593***
Illiterate/Fujeirah 55505.1*** 66125.78*** -10625.67*** -0.1337953
Primary/Abu Dhabi -19750.14*** -8147.956* -11600.47*** 3.065***
Primary/Sharjah 33322.22*** 33241.93*** 90.8934 2.965***
Primary/Ajman 59729.98*** 54169.48*** 5546.239* 5.436***
Primary/UAQ 57973.14** 49580.51* 8387.551 6.289*
Primary/RAK 55110.01*** 49120.81*** 5984.574** 4.268***
Primary/Fujeirah 54395.57*** 64339.96*** -9951.462*** 2.225
Secondary/Abu Dhabi -11366.41** -2135.061 -9229.675*** -0.3643778
Secondary/Sharjah 20854.09*** 20685.63*** 188.2298 -0.294394
Secondary/Ajman 46877.66*** 42687.75*** 4186.956 -2.196628
Secondary/UAQ 38912.65 33675.28 5235.96 2.419642
Secondary/RAK 38208.24*** 35178.7*** 3017.567 1.84636
Secondary/Fujeirah 33999.6** 38224.59*** -4237.198 -0.3613634
Table 14: The effects of interaction between education and skills
Annual salaries Salaries in cash Salaries in kind Working hours
Illiterate/Agro fishery 64279.28** 66260.89** -1999.091 5.303*
Illiterate/Mining -56218.13 -22443.89 -33738.32*** 1.654586

17
Illiterate/Manufacturing 22339.61** 22348.6** -9.570288 3.727***
Illiterate/Utilities & energy -25090.2 -9891.924 -15200.02** -3.59205
Illiterate/Construction 35941.25*** 34360.47*** 1577.535 -2.206**
Illiterate/Trade & repair 45190.74*** 41889.31*** 3319.181* 5.031***
Illiterate/Hotels & restaurant 60238.25*** 61735.88*** -1492.238 1.722081
Illiterate/Logistics 26317.19** 23549.57** 2768.678 4.383***
Illiterate/Financial services -20550.66 -13262.43 -7289.504 -1.56188
Illiterate/Education 37540.16 40092.65* -2559.202 9.154***
Illiterate/Health & social services 10014.77 18317.13 -8290.068 -6.313*
Illiterate/Other services 25898.32** 24267.17** 1630.703 2.480*
Illiterate/Industry not defined -41877.77 -17856.54 -24015.34 4.060521
Primary/Agro fishery 63580.81** 63500.22** 79.03987 6.732**
Primary/Mining -52267.54** -25792.45 -26432.76*** 6.264**
Primary/Manufacturing 24513.63** 22744.47** 1766.832 0.4240913
Primary/Utilities & energy -7815.994 4560.826 -12372.85*** -4.356*
Primary/Construction 34919.27*** 31246.22*** 3674.531** -0.8569136
Primary/Trade & repair 43697.82*** 38196.9*** 5522.251*** 3.554***
Primary/Hotels & restaurant 66358.87*** 61022.67*** 5346.095* 1.218224
Primary/Logistics 21507.24** 17812.02** 3701.891* 0.0817609
Primary/Financial services 21578.46 13582.64 8001.341 -3.711827
Primary/Education 67895.07*** 67181.67*** 710.8387 3.130*
Primary/Health & social services 8240.525 10806.56 -2542.5 -3.2135
Primary/Other services 22703.55** 18735.97* 3970.924* 0.7088686
Secondary/Agro fishery 39716.76 42397.9 -2691.63 4.871074
Secondary/Mining -935.4054 6940.713 -7847.944*** 2.296*
Secondary/Manufacturing 10125.52 8897.987 1221.84 -0.8991908
Secondary/Utilities & energy -34645.04* -21271.88 -13378.26*** 2.17746
Secondary/Construction 17950.05** 14005.02* 3936.575** -0.3487736
Secondary/Trade & repair 25092.78*** 20458.46*** 4645.584*** 2.343***
Secondary/Hotels & restaurant 44436.41*** 41560.67*** 2869.259 1.769816
Secondary/Logistics 3699.302 1442.328 2246.564 1.670*
Secondary/Financial services -15124.69 -18989.9* 3862.592* -1.214389
Secondary/Education 45399.91*** 45867.27*** -476.9907 1.351996
Secondary/Health & social services 14681.73 16964.58* -2275.354 -1.757973
Secondary/Other services 2493.061 -1081.119 3566.721* 1.653465
Secondary/Industry not defined -9963.278 -1934.747 -8024.584 4.568905

18
Finally, we examine the issue of gender discrimination by adding an interaction between
gender and skills, and an interaction between gender and education. We find that gender gaps in
salaries are enlarged for female workers with higher skills, but high-skill women also work
shorter hours. Female workers doing elementary jobs do not receive significantly more or less
salaries than their male counterparts, but they do appear to work longer hours. Female workers
without a university degree actually enjoy a salary advantage over their male counterparts, but
some of them have to work longer.
Table 15: The effects of interaction between gender and skills & education
Annual salary Salary in cash Salary in kind Working hours
Female/Elementary 17183.590 16998.300 184.747 4.373**
Female/Semi-professional -19577.68*** -17446.85*** -2132.33* -2.732***
Female/Senior professional -57887.01*** -49056.61*** -8820.164*** -2.095***
Female/Illiterate 50716.91*** 45098.96*** 5615.122*** 6.503***
Female/Primary 42023.12*** 36573.99*** 5444.558*** 3.505***
Female/Secondary 29043.58*** 25224.85*** 3810.796*** 0.307

19
II. The Ministry of Labor’s 2010 WPS Data Set
The 2008 Labor Force Survey excludes workers living in labor camps, who are a major part of
the labor force. Hence, the labor costs obtained in the survey overestimate the average salaries in
the UAE. To correct for that, we analyze another source of data on wages obtained from the
Ministry of Labor Wage Protection System and Administrative Database in March, 2010.
Starting from 2010, the MOL has requested all private sector businesses in the UAE to
pay their workers electronically via a monitored bank transfer payment system, and the policy
has been first implemented in large establishments and gradually expanded to all firms, big or
small. The MOL salary data analyzed in this paper contain the information of 1.7 million private
sector employees, including their contract salaries and real salaries made through the payment
system in March 2010. The total number of observations (workers) in our sample is 1,765,570,
and the total number of establishments is 16,110.
Compared to the labor force survey, the MOL data have the following advantages:
• The size of the data set is much greater than the survey data
• The data set contains the most accurate real salary information made by employers to
employees
• The data set covers all private sector workers, including those living in the labor
camps
• The data set include workers’ contract salary information based on the year of
contract signed, thus providing longitudinal information of wages in the UAE

20
The downsides of the MOL data are the following:
• The data set excludes public sector employees and employees working in free zones
and private households
• The salary data included in this study are not a random sample of the population, as
large companies are more likely to participate in the electronic payment system than
the small ones. In the sample, 90% of workers are working in companies that hire
more than 50 employees, while the percentage in the population is 64%.
• While companies enrolled in the electronic payment system are supposed to pay all
their employees electronically, in actuality only 80% of employees in these firms
received salaries via the system. The reason why firms paid 20% employees outside
the system and how this would affect our costs of labor estimates are not clear at this
moment.
Table 16: Distribution of firm sizes in the sample & population
Size MOL Sample, 2010
Nationwide, 2008
N of firms % N of employees % N of firms % N of employees %
1 145 0.9% 157 0.01 50,335 19.39 50,335 1.23
4 - 2 713 4.4% 1,828 0.10 103,271 39.79 295,399 7.24
9 - 5 1194 7.4% 6,785 0.38 53,891 20.76 347,492 8.52
49 - 10 7613 47.3% 161,455 9.14 42,668 16.44 844,498 20.70
99 - 50 3115 19.3% 176,894 10.02 5,477 2.11 379,942 9.31
499 - 100 2595 16.1% 446,170 25.27 3,093 1.19 631,583 15.48
999 - 500 389 2.4% 219,532 12.43 407 0.16 287,044 7.04
+ 1000 346 2.1% 752,868 42.64 394 0.15 1,243,160 30.47
Total 16110 100.0% 1,765,689 100.00 259,536 100 4,079,453 100
Keeping the differences in mind, we do a similar set of analysis for the MOL data. We
first summarize the wage information in different categories, and then break them down
according to workers’ age, gender, education, skills, occupation, industrial sectors, firm sizes and

21
work places. After that, we run a set of regressions to identify important factors in the size of
wages and their longitudinal trends.
1. Summary Statistics
Compared to the labor force survey, the average wages found in the MOL data set are
significantly lower, after including labor camp workers. The median real salary is only AED
17,767 per year, compared to the AED 39,000 in previous section. The median contract salary is
even lower, at around AED 10,800 per year. The discrepancies between the contract salary and
real salary may be attributed to overtime pay, bonus, cash allowance, refund, and so on. On
average, the real salaries are 1.67 times the contract salaries. Like in the labor force survey, the
distributions of salaries are skewed, with 75% of workers made less than AED 40K and 1%
made more than AED 450K each year. This is illustrated very clear in Figure 1.
Table 17: Average Salaries in the MOL data
Total Obs Mean Median Std. Dev. Min Max
Contract basic salary 1,752,398 1,837 750 4,031 0 600,850
Contract total salary 1,743,804 2,622 900 5,704 0 900,750
Monthly fixed income 1,760,563 3,537 1,287 10,740 0 3,372,312
Monthly allowance 1,761,731 433 0 7,231 0 5,273,844
Monthly total income 1,760,454 3,970 1,509 13,125 0 5,273,844
Yearly fixed income 1,760,563 41,646 15,153 126,450 0 39,700,000
Yearly allowance 1,761,731 5,093 0 85,136 0 62,100,000
Yearly total income 1,760,454 46,746 17,767 154,540 0 62,100,000

22
Figure 1: Cumulative distribution of total monthly salary
The gender composition is extremely unbalanced. Female workers are only 7% of the
total workforce. The actual participation of female workers might be higher if we take into
account women working in public sectors and in private households. On average, female workers
make AED 2500 more than male workers do each month, but that appears to result from better
human capitals that female workers have over their male counterparts. For example, over 80% of
female workers have a high school degree compared to 40% of male workers. After we control
for education, the average salaries for women tend to be smaller than men.

23
Table 18: Median salaries across gender.
Gender N Contract basic salary
Contract total salary
Monthly fixed income
Monthly total income
Yearly fixed income
Yearly total income
Male 1,636,253 750 840 1,217 1,450 14,329 17,073
Female 116,145 2,000 3,250 3,800 4,030 44,742 47,450 Chi^2 significance
0.000 0.000 0.000 0.000 0.000 0.000
The workforce is very young; over 75% of workers are below the age 40. Elderly workers
make significantly more than young workers.
Table 19: Median salaries across age groups.
Age N Contract basic salary
Contract total salary
Monthly fixed income
Monthly total income
Yearly fixed income
Yearly total income
Young (15-39) 1,328,786 700 800 1,150 1,342 13,540 15,800
Middle (40-59) 412,020 1,000 1,300 2,000 2,420 23,548 28,493
Elderly (>60) 11,592 3,767 5,000 6,470 7,269 76,179 85,592
Chi^2 significance 0.000 0.000 0.000 0.000 0.000 0.000
The general educational levels of the workforce are low; 30% of workers are either
illiterate or receive elementary education only; another 60% of workers finished preparatory or
secondary education. Only around 13% of workers have completed post-secondary education.
The payoff of education is significant, however. Workers with a university degree make five
times more than those with a high school degree on average. If we group workers into two
groups: unskilled (high-school education & below) and skilled (post high-school), then the
skilled workers make nearly seven times more than unskilled ones on average.

24
Table 20: Median salaries across educational levels
Education N Contract basic salary
Contract total salary
Monthly fixed income
Monthly total income
Yearly fixed income
Yearly total income
Illiterate 8,304 300 600 840 1,092 9,895 12,859
Read & write 362,433 600 750 1,055 1,233 12,421 14,517
Elementary 133,256 600 741 995 1,141 11,715 13,434
Preparatory 451,247 700 780 1,007 1,200 11,856 14,129
High-school 520,732 900 1,024 1,517 1,850 17,872 21,782
Post high school 26,327 3,000 4,500 5,900 6,400 69,467 75,360
University 177,089 4,500 7,000 8,716 9,500 102,623 111,854
Above university 9,079 7,500 12,400 14,408 15,418 169,649 181,540
Chi^2 significance 0.000 0.000 0.000 0.000 0.000 0.000
The skill levels of workers can be approximated by their occupations as well. As the table
below shows, managers make 16 times more than low-skill workers.
Table 21: Median salaries across occupation
Occupation N Contract basic salary
Contract total salary
Monthly fixed income
Monthly total income
Yearly fixed income
Yearly total income
Low-skill workers 1,348,769 650 750 1,050 1,241 12,362 14,611
Semi-professional 210,498 2,000 3,092 3,600 4,000 42,387 47,096
Professionals 159,946 4,000 6,500 8,000 8,680 94,193 102,200
Managers 33,164 10,800 16,500 18,626 20,000 219,312 235,483
Chi^2 significance 0.000 0.000 0.000 0.000 0.000 0.000
Like other GCC countries, the UAE is known for its reliance on foreign labors for
economic development. Most foreign labors come from South Asia, particularly, India, Pakistan
and Bangladeshi. In this sample, workers from these three countries constitute 76% of the total
workforce. The UAE nationals constitute a minority group in the population and their
employment in the private sector is miniscule. Not surprisingly, the average salary of Emirati
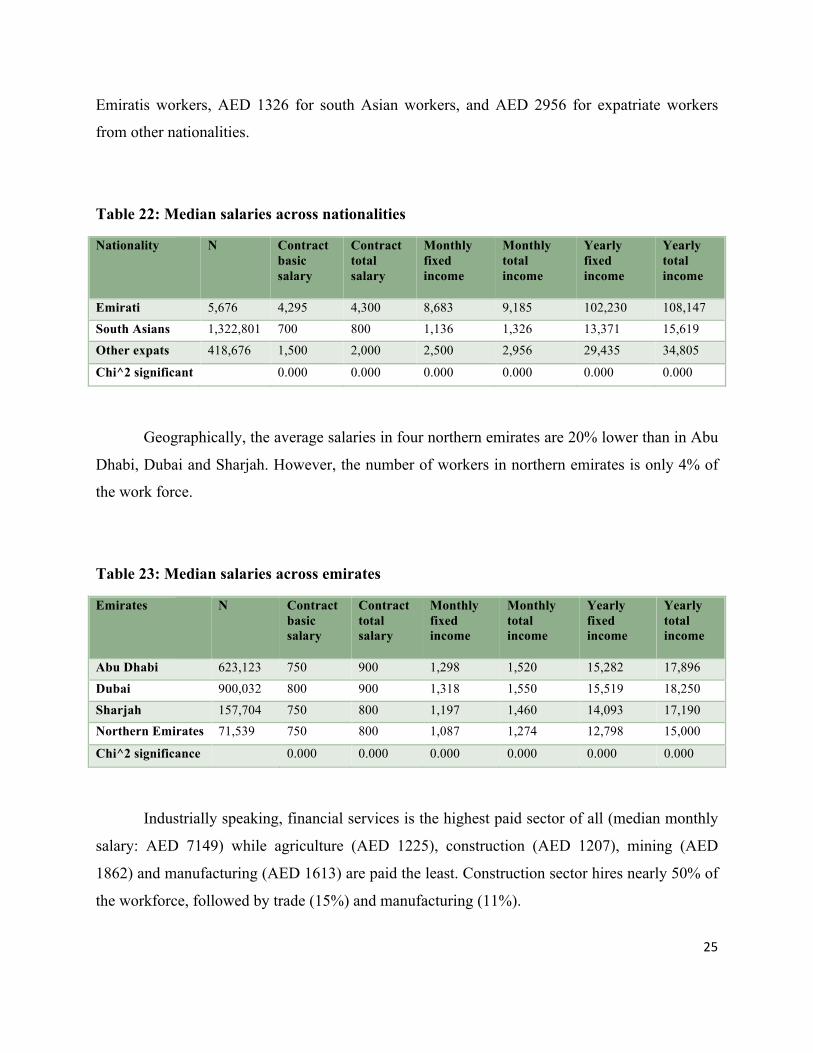
workers is significantly higher than expatriates. The median monthly salary is AED 9185 for
25
Emiratis workers, AED 1326 for south Asian workers, and AED 2956 for expatriate workers
from other nationalities.
Table 22: Median salaries across nationalities
Nationality N Contract basic salary
Contract total salary
Monthly fixed income
Monthly total income
Yearly fixed income
Yearly total income
Emirati 5,676 4,295 4,300 8,683 9,185 102,230 108,147
South Asians 1,322,801 700 800 1,136 1,326 13,371 15,619
Other expats 418,676 1,500 2,000 2,500 2,956 29,435 34,805
Chi^2 significant 0.000 0.000 0.000 0.000 0.000 0.000
Geographically, the average salaries in four northern emirates are 20% lower than in Abu
Dhabi, Dubai and Sharjah. However, the number of workers in northern emirates is only 4% of
the work force.
Table 23: Median salaries across emirates
Emirates N Contract basic salary
Contract total salary
Monthly fixed income
Monthly total income
Yearly fixed income
Yearly total income
Abu Dhabi 623,123 750 900 1,298 1,520 15,282 17,896
Dubai 900,032 800 900 1,318 1,550 15,519 18,250
Sharjah 157,704 750 800 1,197 1,460 14,093 17,190
Northern Emirates 71,539 750 800 1,087 1,274 12,798 15,000
Chi^2 significance 0.000 0.000 0.000 0.000 0.000 0.000
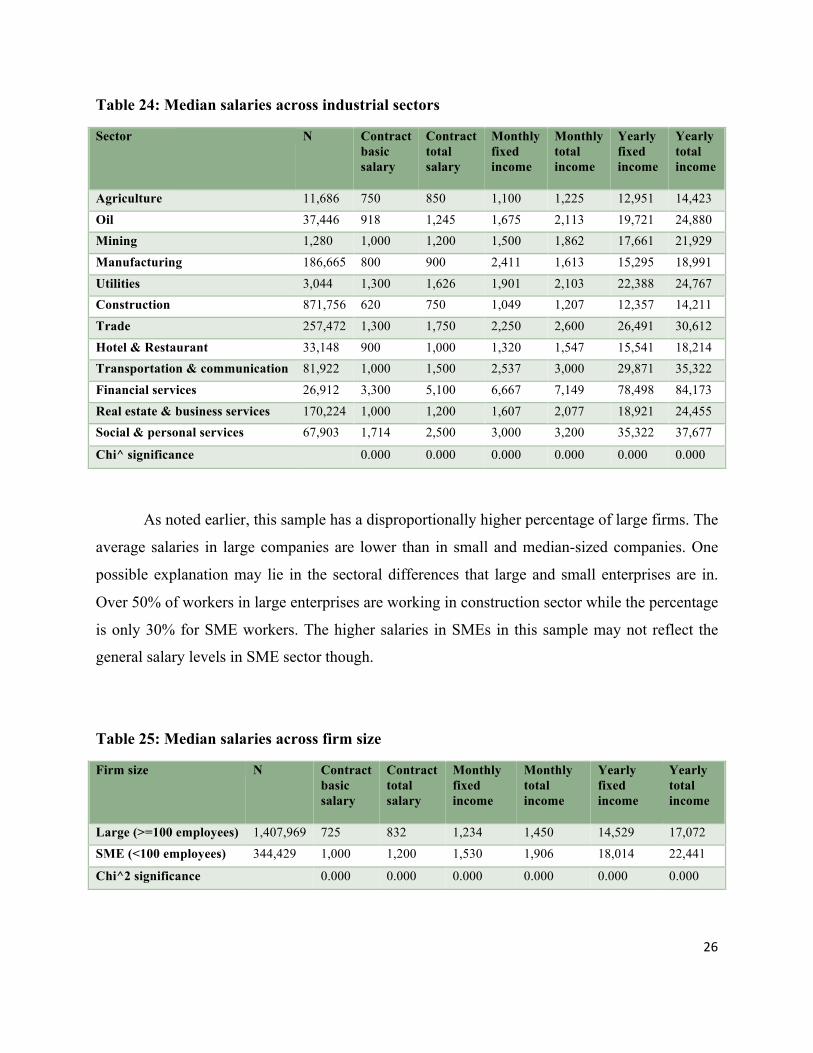
Industrially speaking, financial services is the highest paid sector of all (median monthly
salary: AED 7149) while agriculture (AED 1225), construction (AED 1207), mining (AED
1862) and manufacturing (AED 1613) are paid the least. Construction sector hires nearly 50% of
the workforce, followed by trade (15%) and manufacturing (11%).
26
Table 24: Median salaries across industrial sectors
Sector N Contract basic salary
Contract total salary
Monthly fixed income
Monthly total income
Yearly fixed income
Yearly total income
Agriculture 11,686 750 850 1,100 1,225 12,951 14,423
Oil 37,446 918 1,245 1,675 2,113 19,721 24,880
Mining 1,280 1,000 1,200 1,500 1,862 17,661 21,929
Manufacturing 186,665 800 900 2,411 1,613 15,295 18,991
Utilities 3,044 1,300 1,626 1,901 2,103 22,388 24,767
Construction 871,756 620 750 1,049 1,207 12,357 14,211
Trade 257,472 1,300 1,750 2,250 2,600 26,491 30,612
Hotel & Restaurant 33,148 900 1,000 1,320 1,547 15,541 18,214
Transportation & communication 81,922 1,000 1,500 2,537 3,000 29,871 35,322
Financial services 26,912 3,300 5,100 6,667 7,149 78,498 84,173
Real estate & business services 170,224 1,000 1,200 1,607 2,077 18,921 24,455
Social & personal services 67,903 1,714 2,500 3,000 3,200 35,322 37,677
Chi^ significance 0.000 0.000 0.000 0.000 0.000 0.000
As noted earlier, this sample has a disproportionally higher percentage of large firms. The
average salaries in large companies are lower than in small and median-sized companies. One
possible explanation may lie in the sectoral differences that large and small enterprises are in.
Over 50% of workers in large enterprises are working in construction sector while the percentage
is only 30% for SME workers. The higher salaries in SMEs in this sample may not reflect the
general salary levels in SME sector though.
Table 25: Median salaries across firm size
Firm size N Contract basic salary
Contract total salary
Monthly fixed income
Monthly total income
Yearly fixed income
Yearly total income
Large (>=100 employees) 1,407,969 725 832 1,234 1,450 14,529 17,072
SME (<100 employees) 344,429 1,000 1,200 1,530 1,906 18,014 22,441
Chi^2 significance 0.000 0.000 0.000 0.000 0.000 0.000

27
In terms of tenure, 65% of workers joined their companies less than three years ago.
While contract salaries are lower for those with long tenure, their actual salaries are higher than
workers with less than three year service. The high salary levels for “New hire” is misleading, as
it reflects the average salaries of workers coming to the UAE in the first three months of 2010.
Table 26: Median salaries across tenure
Tenure N Contract basic salary
Contract total salary
Monthly fixed income
Monthly total income
Yearly fixed income
Yearly total income
New hire 20,001 1,500 2,000 2,000 2,250 23,548 26,491
Junior (1-3 year) 1,116,806 800 900 1,195 1,374 14,078 16,177
Senior (> 3 years) 615,591 702 800 1,500 1,789 17,661 21,064
Chi^2 significance 0.000 0.000 0.000 0.000 0.000 0.000
Finally, the longitudinal trends of labor costs are of enormous interests to us. Although
we do not have the real salary information across years in the data set, we do have contract salary
information in different years2. Figure 9 shows that nominal contract salary had been stable at
around AED 800 per month for up to 2008, and started to rise in 2009. This change may result
from a change in the labor force after the financial crisis struck the UAE. Before 2009, the
percentage of unskilled workers is around 80% of the workforce. In 2009, the percentage
dropped to 72%, and the total number of contracts signed decreased from a peak of 512,709 in
2008 to 348,656 too, as a lot of construction projects came to a halt. The green line on Figure 2
shows that average salaries for skilled workers started to rise sharply in 2006, while salaries of
unskilled workers stayed stable till lately.
2 The contract salary information may be biased, though, as workers who have left their jobs before the sample was drawn from MOL’s WPS system are not included. In other words, our contract salary data do not reflect the influence of labor attrition over the past. However, the effects, if there are, are likely to be downwardly influencing our estimate of contract salaries.

28
Figure 2: Change of salaries across years
2. Regression analysis
In this part, we run four OLS regressions of salaries on workers’ personal characteristics by
controlling for companies they are working for. The model fits quite well with contract salaries.
All personal characteristics are found to have significant impact on salaries. Specifically, female
workers, junior workers, workers with low education or low skills are making signficantly less
than their counterparts. Age has a curvalinear relationship with salaries in that salaries tend to
decrease first and then increase with age at around 20. The UAE nationals receive significantly
more salaries in payment than expatriates do, but not in terms of contract salaries. Tenure has a
postive relationship with real salaries too.
500
2,500
4,500
6,500
8,500
10,500 Total Unskilled Skilled

29
Table 27: Regressions of individual workers’ monthly salaries
Total real salary Fixed real salary Total contract Salary Basic contract
Salary
b p b p
b p b p
Age -89.9 0.000 -94.6 0.000 Age at contract -120.9 0.000 -101.2 0.000
Age^2 2.4 0.000 2.4 0.000 Age at contract ^2 2.9 0.000 2.2 0.000
Tenure 94.1 0.000 68.5 0.000
Education (Base group: secondary) Education (Base group: secondary)
Illiterate -1382.1 0.000 -1392.0 0.000 Illiterate -500.3 0.000 -434.7 0.000 Read & write -686.8 0.000 -709.4 0.000
Read & write -525.9 0.000 -366.3 0.000
Elementary -640.4 0.000 -636.0 0.000 Elementary -436.5 0.000 -306.4 0.000 Preparatory -388.8 0.000 -428.1 0.000 Preparatory -387.9 0.000 -269.6 0.000 Post high school 338.5 0.000 136.7 0.018
Post high school 391.8 0.000 252.3 0.000
University 2807.0 0.000 2490.8 0.000 University 2,000.8 0.000 1251.1 0.000 Above university 5620.5 0.000 5272.6 0.000
Above university 4,886.8 0.000 2934.5 0.000
Female -1836.5 0.000 -1623.5 0.000 Female -1,129.0 0.000 -823.3 0.000
Occupation (Base group: low-skill) Occupation (Base group: low-skill) Semi-professional 1734.6 0.000 1564.8 0.000
Semi-professional 1,364.0 0.000 917.3 0.000
Professional 4399.8 0.000 4108.3 0.000 Professional 3,199.5 0.000 2074.2 0.000
Manager 14913.6 0.000 13379.6 0.000 Manager 11,581.2 0.000 7762.7 0.000
Region (Base group: South Asia) Region (Base group: South Asia)
East Asia 275.5 0.000 244.1 0. 000 East Asia 152.5 0.000 181.1 0.000
GCC 2499.9 0.242 1911.1 0.234 GCC 554.5 0.815 -2634.3 0.124
MENA 2525.2 0.000 2185.0 0.000 MENA 1,582.9 0.000 1038.9 0.000
OECD 16461.4 0.000 15258.9 0.000 OECD 13,630.6 0.000 10255.6 0.000
Rest Asia 1083.6 0.000 1032.1 0.000 Rest of Asia 832.4 0.000 648.7 0.000
Africa 904.7 0.000 734.6 0.000 Africa 640.7 0.000 506.7 0.000
UAE 6954.1 0.000 7102.7 0.000 UAE 497.3 0.712 315.1 0.746
Company No (absorbed, 16085 categories) Company No (absorbed, 16048 categories)
Contract Year (absorbed, 20 categories)
N of obs 1,687,923
1,688,029
N of obs 1,646,436
1,654,167
F statistics 9185***
13494***
F statistics 31010***
28295***
R square 0.286 0.385 R square 0.659 0.642

30
Again, women are found to make significantly less than men do and the gap increases as
one moves up the occupational levels. Female managers are paid 8K less per month than male
managers are on average. Similarly, on the educational ladder, it is women with higher education
that suffer more in salaries than their male counterparts. Low-educated women on the other hand
are paid slightly better than low-educated men.
Table 28. The effects of interaction between gender and occupation & education
Interaction Total real salary Fixed real salary Interaction Total contract
Salary Basic contract Salary
b p b p
b p b p
Female/Semi-professional -1207.9 0.000 -1033.8 0.000
Female/Semi-professional -791.7 0.000 -597.2 0.000
Female /Professional -4502.7 0.000 -4009.5 0.000
Female /Professional -2786.8 0.000 -1916.2 0.000
Female /Manager -8292.4 0.000 -7887.4 0.000
Female/ Manager -5626.9 0.000 -4279.5 0.000
Female /Iliterate -739.4 0.593 -581.6 0.576
Female/ Iliterate -368.9 0.386 -228.6 0.457
Female /read & write 323.7 0.030 213.0 0.057
Female /read & write 216.0 0.000 222.9 0.000
Female /elementary 460.6 0.066 334.3 0.076
Female /elementary 228.6 0.003 198.8 0.000
Female /preparatory 491.2 0.000 411.9 0.000
Female /preparatory 316.3 0.000 208.8 0.000
Female/post-secondary -2110.1 0.000 -1972.4 0.000
Female/post-secondary -1440.0 0.000 -901.8 0.000
Female /university -4187.9 0.000 -3821.1 0.000
Female /university -2665.6 0.000 -1810.5 0.000
Female/above university -5388.6 0.000 -5332.0 0.000
Female/above university -2868.1 0.000 -2180.9 0.000
Secondly, we calculate the median salary payments for each company, and regress them
on firm characteristics such as average age and tenure of workers, number of female workers,
31
number of national workers, number of skilled workers, total number of workers, as well as
firms’ location and industrial sector.
Similarly, for contract salaries, we create a panel data set by calculating the median
contract salaries for each company in each contract year, and then regress them on a number of
company characteristics using a random-effect model.
The results confirm the previous findings about lower salary levels for female workers,
and higher salary level for skilled workers and Emirati workers. However, opposite to the
previous results, we find that average tenure of workers have a negative impact on salaries, the
reason for which might have to do with the age of companies instead of employee turnover or
retention. Like in previous models, we fit a non-linear model to the relationship between average
age and median salaries. Upon examinations of the shape of the curves, we find that the
relationships are better fit with positive linear models. For reporting purpose, we keep the
quadratic term of age in the models. In terms of the size of businesses, large companies tend to
offer smaller salaries. In terms of location, salaries in Dubai appear to be higher than other
emirates except for Abu Dhabi. Industry-wise, financial services sector is confirmed to be the
highest paid one while construction and hospitality sectors are among the lowest.

32
Table 29: Regressions of companies' median salaries
Real total salary Real fixed salary Contract total salary
Contract basic salary
Coef. p Coef. p Coef. p Coef. p
Average age 810.20 0.000 668.72 0.000 -20.74 0.168 -51.42 0.000
Average age^2 -4.41 0.000 -2.98 0.002 2.49 0.000 2.30 0.000
N of female workers -9.05 0.000 -8.99 0.000 -16.01 0.000 -11.03 0.000
N of local workers 29.84 0.004 32.04 0.001 -645.11 0.651 -429.38 0.672
N of skilled workers 16.57 0.000 16.23 0.000 23.84 0.000 11.91 0.000
Average tenure -690.35 0.000 -656.50 0.000
N of employees -0.77 0.000 -0.72 0.000 -0.26 0.000 -0.18 0.000
Emirates (Base group: Dubai)
Abu Dhabi -121.90 0.204 -103.09 0.253 -98.78 0.149 -21.87 0.670
Sharjah -698.84 0.000 -610.37 0.000 -1006.25 0.000 -677.26 0.000
RAK -1280.06 0.000 -1162.70 0.000 -1503.32 0.000 -1011.58 0.000
Ajman -901.14 0.000 -803.60 0.000 -1160.90 0.000 -802.62 0.000
Fujeriah -1267.10 0.000 -1137.98 0.000 -1254.85 0.000 -734.59 0.000
UAQ -1128.88 0.030 -871.60 0.075 -1160.35 0.004 -797.32 0.005
Sector (Base group: construction)
Agriculture 691.46 0.326 719.77 0.277 743.45 0.130 491.63 0.182
Oil 2077.46 0.000 1843.76 0.000 1759.44 0.000 1270.16 0.000
Mining 398.61 0.746 323.36 0.780 572.42 0.521 523.98 0.429
Manufacturing 183.64 0.197 131.73 0.326 -78.28 0.438 -40.45 0.592
Utilities 1756.73 0.039 1740.08 0.030 1462.20 0.015 821.34 0.068
Trade 1902.60 0.000 1769.06 0.000 1292.88 0.000 818.20 0.000
Hotel & Restaurant 508.66 0.011 507.40 0.007 -317.95 0.027 -208.97 0.052
Transportation & communication
448.50 0.019 491.25 0.006 724.88 0.000 463.59 0.000
Financial services 6485.52 0.000 6200.42 0.000 5759.47 0.000 3679.72 0.000
Real estate & business services
4940.49 0.000 4630.13 0.000 4790.72 0.000 3250.69 0.000
Social & personal services 827.52 0.000 970.01 0.000 1354.05 0.000 836.58 0.000
Constant -17385.53 0.000 -14822.53 0.000 230.37 0.390 840.92 0.000
N of observations 16118 16118.00 84929.00 85510.00
N of groups 16075.00 16082.00
F statistics 213.46 213.52
Wald statistics 9992.00 9361.00
P value 0.000 0.000 0.000 0.000
R square (overall) 0.2415 0.2415 0.1981 0.1779

33
Conclusion
Combining above analyses, we obtain a good and comprehensive picture of wages in the UAE.
Overall, the defining characteristics of UAE’s wage system is its high level of inequality and
segmentation across various sections of the economy. The primary reason for the high income
inequality lies in the high diversity of human capitals in the labor force measured in terms of
education, occupations, skills, age, tenure, and so on. The payoff of education and occupational
skills are significantly huge in the country when the vast majority of low-skill, low-education
labors in construction sector earn on average AED 1000 per month and managers in the finance
sector make an average monthly salary at above AED 33K. Factors that are unrelated to human
capitals but government policies are important too. The wage gaps between public and private
sectors as we have found out in the labor force survey are significant enough to suggest the
presence of stratified labor markets for government employees versus non-government
employees. Policies such as the Emiratization program grant special employment and wage
protection to the UAE nationals, the effectiveness of which is demonstrated in our wage analysis.
Wages are not equally distributed across emirates either: wages in Dubai and Abu Dhabi are
significantly higher than in the other smaller northern emirates, reflecting different levels of
development and/or resourcefulness in the federation. Meanwhile, the gender unbalance in the
workforce is exacerbated by gender inequality in wages too. Female employees tend to make
significantly less than male employees do, especially at the high end of female labor force.
Related Documents