Studies 5/2009 Determinants of functional income distribution in OECD countries Studie im Auftrag der Hans-Böckler-Stiftung Bearbeiter: Prof. Dr. Engelbert Stockhammer September 2009 Hans-Böckler-Straße 39 D-40476 Düsseldorf Germany Phone: +49-211-7778-331 [email protected] http://www.imk-boeckler.de

Welcome message from author
This document is posted to help you gain knowledge. Please leave a comment to let me know what you think about it! Share it to your friends and learn new things together.
Transcript

Studies
5/2009
Determinants of functional income distribution in OECD countries
Studie im Auftrag der Hans-Böckler-Stiftung
Bearbeiter: Prof. Dr. Engelbert Stockhammer
September 2009
Hans-Böckler-Straße 39 D-40476 Düsseldorf Germany Phone: +49-211-7778-331 [email protected] http://www.imk-boeckler.de

1
Determinants of functional income distribution in OECD countries
Studie für das IMK
Version 2.1 Sept 7, 2009
Engelbert Stockhammer
Wirtschaftuniversität Wien
Abstract
Wage shares have fallen substantially over the past 25 years. In the Euro area the (adjusted)
wage share declined by almost ten percentage points. Recently, there has been a renewed
interest in the determinants of functional income distribution. IMF (2007a) and EC (2007)
find that technological change has been the main cause of the decline in the wage share and
that globalization has been a secondary cause. This study, firstly, tries to replicate these
studies to investigate the robustness of their findings. Secondly, the estimated wage share
equation is extended to allow for distributional effects of financial globalization and for
different effects of union density according to social security system. We find that the
estimations on which the conclusions of IMF and EC are based suffer from serious
econometric problems and that their findings are not robust. In particular, the effect of
technological change is often not statistically significant. Globalization (in production),
however, has a robust effect. Results from the extended model suggest economically
important (and mostly statistically significant) effects of financial globalization and of union
density of non-Ghent countries. However, overall the results are sensitive to the specification
and the estimation method.

2
Table of contents
1 Introduction ........................................................................................................................ 3 2 Theoretical background. Different theories and key arguments in the recent debate ........ 5
2.1 Different theories of income distribution and the muddy waters of the medium-run open economy ........................................................................................................................ 5 2.2 The NAIRU model as general medium-run framework............................................. 9 2.3 Key arguments in the recent debate ......................................................................... 11
2.3.1 Technological change....................................................................................... 11 2.3.2 Globalization .................................................................................................... 12 2.3.3 Bargaining power ............................................................................................. 14 2.3.4 Financialization ................................................................................................ 14
2.4 The standard explanation and an extension.............................................................. 15 3 The recent empirical literature on the determinants of functional income distribution ... 18
3.1 IMF (2007a) ............................................................................................................. 18 3.2 EC (2007) ................................................................................................................. 22 3.3 Other neoclassical studies ........................................................................................ 25 3.4 Other studies on changes in income distribution ..................................................... 28 3.5 Wrapping up: What’s missing in the IMF and EC studies?..................................... 30
4 The determinants of functional income distribution. A panel analysis............................ 32 4.1 Variable definitions and data sources....................................................................... 33 4.2 Time series properties .............................................................................................. 33 4.3 Econometric method ................................................................................................ 35 4.4 Replicating the standard model ................................................................................ 37
4.4.1 Replicating the standard model with annual data............................................. 37 4.4.2 Replicating the standard model with non-overlapping 5 year averages........... 39 4.4.3 Conclusion for the replication of the standard model ...................................... 42
4.5 A more general specification.................................................................................... 42 4.5.1 Variable definitions .......................................................................................... 44 4.5.2 Estimations with non-overlapping 5-year averages ......................................... 44 4.5.3 Estimation with annual data ............................................................................. 47
4.6 Economic significance: contributions to the change in the wage share ................... 49 4.7 Limitations of the present study and open questions ............................................... 50
5 Conclusion / summary...................................................................................................... 52 6 References ........................................................................................................................ 54 7 Appendix .......................................................................................................................... 57 Acknowledgements The author is grateful to Özlem Onaran, Paul Ramskogler, Simon Sturn, Till van Treeck, and Klara Zwickl for helpful comments and suggestions. All mistakes are, however, the author’s.

3
1 Introduction
In the last quarter century dramatic changes in income distribution have taken place. This
refers to the personal distribution of income as well as to the functional distribution of
income. Distribution has become more polarized in most OECD countries (OECD 2008), with
the very top income groups increasing their income shares substantially in the Anglo Saxon
countries, in particular in the USA (Piketty and Saez 2003, 2007). Wage shares have fallen in
virtually all OECD countries, with decreases typically being more pronounced in continental
European countries (and Japan) than in the Anglo-Saxon countries. In the Euro area the
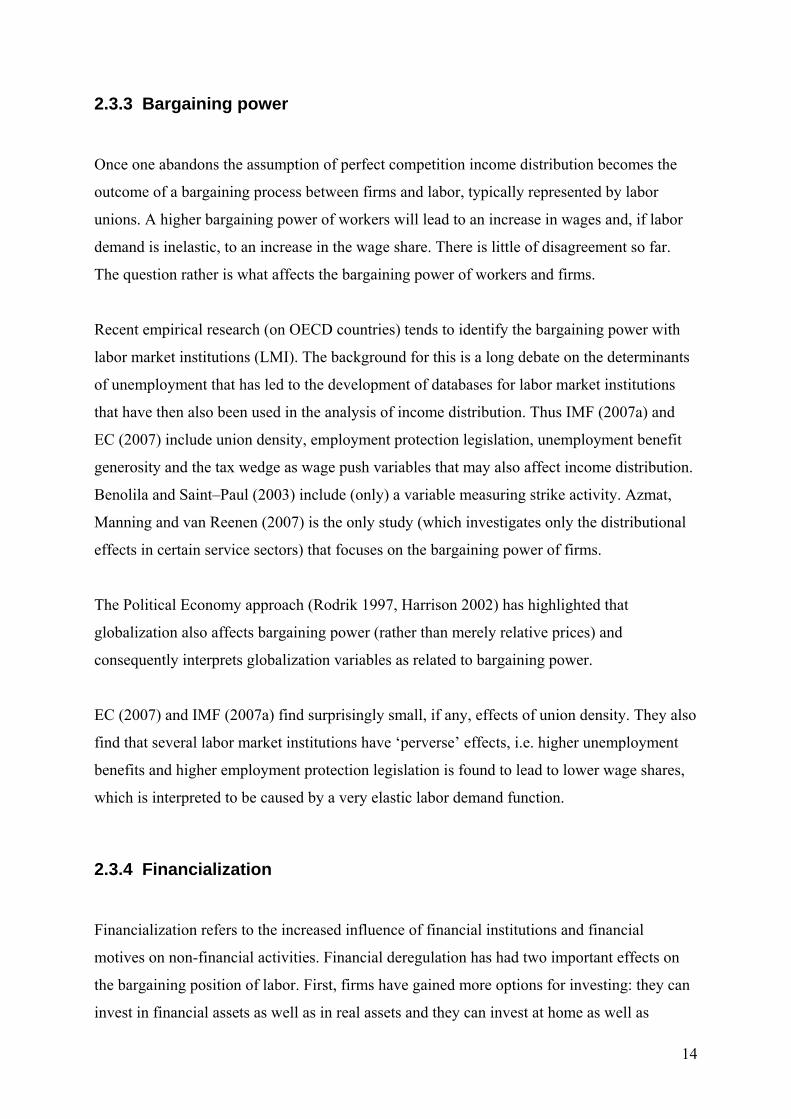
(adjusted) wage share has fallen from 72.5 in 1982 to 63.3% in 2007 (Fig. 1). Overall, real
wage growth has clearly lagged behind productivity growth since around 1980. This
constitutes a major historical change as wage shares had been stable or increasing in the
postwar era.
Figure 1. Adjusted wage shares in the Euro area, the USA and Japan, 1960-2007
Adjusted wage shares in the Euro area, the USA and Japan
60
65
70
75
80
85
1960
1962
1964
1966
1968
1970
1972
1974
1976
1978
1980
1982
1984
1986
1988
1990
1992
1994
1996
1998
2000
2002
2004
2006
Euro area (12 countries)United StatesJapan
Source: AMECO
4
This has led, in the past few years, to a renewed interest in the determinants of the distribution
of income, with main economic research institutions such as the OECD and the IMF
publishing studies on these issues. OECD (2008) documents changes in personal income
distribution. IMF (2007a) and EC (2007) deal with changes in functional income distribution
and OECD (2007) investigates the wage elasticity of the labor demand function. The main
findings of IMF (2007a) and EC (2007) are that technological change has been the main cause
of changes in functional income distribution, that globalization (of trade and production) has
also played an important role and, finally, that changes in labor market institutions have
played a minor role.
This study will, firstly, assess the validity of the findings of the EC and the IMF by replicating
their estimations. In doing so, we will investigate the robustness of the results by performing
panel analysis with different specifications such as fixed effects model, first-differences
models and specifications with (non-overlapping) five-year averages. Secondly, we will
extend the standard approach by including additional variables. In particular we will include a
variable for financial globalization and we will allow for different effects of union density in
countries belonging to the Ghent-system of unemployment insurance. Thirdly we will make
use of the NAIRU theory that suggests that the same structural variable should determine
income distribution as well as unemployment and also estimate the unemployment equation.
This allows for the explicit investigation of some arguments that involve indirect effects of,
for example, labour market institutions on income distribution via changes in unemployment.
The paper is structured as follows. Section 2 presents the theoretical background of the study
by highlighting differences between the neoclassical, New Keynesian, Post Keynesian and
Marxian theory of distribution as well as the NAIRU model. This section also reviews the key
determinants of functional income distribution that have been highlighted in the literature.
Section 3 offers a detailed review of the recent empirical literature on the issue, in particular
two important studies of the IMF and the EC that serve as a reference point for the following
empirical investigation. Section 4 presents the empirical results. First, the studies of the IMF
and the EC are replicated. It turns out that some key findings are not robust. Then an
extension of the model is tested that includes a variable for financial globalization and for the
countries of the Ghent system. Section 5 concludes.

5
2 Theoretical background. Different theories and key arguments in the recent debate
This section will provide the theoretical background for the empirical analysis. It will, in
section 2.1, compare the different explanations of income distribution in different schools of
thoughts. This will highlight that while differences are clear-cut in long-run growth theories
of neoclassical, Keynesian and Marxian origin, these differences get blurred in the medium-
run, once capacity utilization is flexible and in an open-economy setting. Section 2.2 presents
the NAIRU model as a general medium term model that synthesizes insights from different
theories and thus serves as a pragmatic framework for our empirical analysis that is consistent
with all three theoretical approaches. Section 2.3 presents the main factors for changes in
income distribution that have been highlighted in recent debates. Section 2.4 wraps up by
presenting graphically the standard explanation of the determinants of the wage share and our
extension that will both be explored empirically in section 4.
2.1 Different theories of income distribution and the muddy waters
of the medium-run open economy
It may be tempting to associate particular schools of thought in economics with particular
explanations of the distribution of income: in neoclassical economics distribution is basically
determined by technology and preferences, in Keynesian/Kaldorian economics it is effective
demand and in Marxian economics it is class struggle. Unfortunately these results are
obtained only in the highly restrictive setting a long-run equilibrium of a closed economy
characterized by full capacity utilization. Moreover, some streams within Keynesian
economics, in particular Kaleckians and Fundamentalist Post Keynesians, question the
usefulness of this definition of the long run. Clearly, such a framework is hardly applicable
for the task at hand, that is, the investigation of medium-run changes in income distribution
when capacity is often underutilized, economies have been rapidly opening up in the process
of globalization and there has been a strong decline of labor unions. We will thus present the
different theories and highlight different streams within these theories and the ambiguities that
arise in a medium-run analysis with variable capacity utilization and market power in open
economies.
6
The dominant theories in economics are based on one version or another of neoclassical
theory. We define neoclassical theory as one where individuals are rational and selfish and
markets are clearing.1 The starting point of the neoclassical analysis of distribution is
typically the assumption of full capacity utilization and the clearing of markets. Therefore,
presumably this is a long-run equilibrium. Income distribution is then determined by
technology and preferences. The marginal product of labor which is given by available
technology determines the labor demand curve and preferences determine the labor supply
curve. The wage share will then exclusively depend on the parameters of the production
function. EC (2007) offers a formal discussion of the effects of technological change in the
context of a CES production function.
For neoclassical theory giving up the assumption of full capacity utilization has grave
consequences, because it is not straightforward that wages should equal the marginal product
of labor. If capacity utilization is less than optimal, the marginal product of labor is not a
useful reference point any more. The effective marginal product of labor will depend on
demand, while the technical (full-capacity) marginal product of labor may be irrelevant for
the firm.
Neoclassical economics has gone through substantial modifications.2 We may distinguish two
streams. The New Classical version and its incarnation of the real business cycle theory insist
on instantaneous market clearing and assume that the labor market is in full-employment
equilibrium all the time. This version of neoclassical economics is starkly unrealistic and has
1 See Stockhammer and Ramskogler (2009) for a discussion of what constitutes mainstream economics today. 2 David Colander (2000) even declared the “death of neoclassical economics”. The 1970s witnessed the
Monetarist counterrevolution and a succession of reformulations of New Classical macroeconomics in the form
of monetarism, the theory of rational expectations and the real business cycle theory. The lasting effect of these
theoretical developments was not so much the acceptance of a particular claim (such as the neutrality of money),
but a methodological revolution that since requires mainstream macroeconomics to built on strict
microfoundations, usually understood to be resting on optimizing behaviour of selfish individuals. In the course
of the 1980s two streams of modern neoclassical macroeconomics emerged. While the New Classical tradition,
such as the real business cycle theory, adhered to the Walrasian concept of market clearing, the New Keynesian
tradition uses optimizing assumptions and transaction costs or the assumption of asymmetric information to
justify nominal or real rigidities in the short run.

7
little new to offer in terms of the theory of income distribution. As markets are always in
equilibrium, income distribution has to be determined, again, by technology.
The New Keynesian stream provides microfoundations for non-clearing markets and has given
rise to a rich literature on the role of institutions in the determination of unemployment and of
growth. Recent contributions in this tradition are usually based on some version of a
bargaining or NAIRU model. Implicitly or explicitly market power on the side of workers (or
unions) and/or firm is recognized. As the bargaining power of both sides will depend on the
institutional setting, this has fuelled interest in the institutional determinants of unemployment
and, to a lesser extent, income distribution.
The Keynesian theory is distinct from the New Keynesians theory as the former is not
anchored in some concept of equilibrium unemployment. Keynes rejected the notion of
rationality3 and instead highlighted the role of fundamental uncertainty and the importance of
socio-psychological phenomena. The focus of his analysis has been on the short-run
determinants of output and employment. Investment is driving demand; demand is driving
employment and prices. Keynes rejected the notion that wage flexibility could cure
unemployment (Keynes 1937). As wage contracts are normally written in nominal terms, it is
nominal wages that could be cut. There is no way of reducing real wages. In a recession a
nominal wage cut would easily translate into price cuts and end up in a deflationary spiral,
though Keynes also carefully listed potentially expansionary effects of a reduction in prices.
Real wages, in Keynes’ analysis, are an ex post outcome of economic activity, not a choice
variable.4
An open economy setting leads to modifications of Keynes’ argument. Domestic prices will
become less responsive to (domestic) wages and (domestic) demand. In the extreme case
where domestic firms are international price takers, nominal wage changes would have no 3 Keynes emphasized that social and consequently economic processes are not deterministic, but historically
open. Therefore individual can never have sufficient information to form ‘rational’ expectations, because the
future is not sufficiently determined (Lawson 1985). 4 In the General Theory Keynes (1936) accepted the notion of a decreasing marginal product of labour. Thus
there is a negative relationship between employment and real wages, but the causality is running from aggregate
demand, which determines the level of employment to the marginal product of labour and the real wage, not
from wages to employment. However Keynes later revised his position on this, realizing that this argument
implies pro-cyclical real wages, which is not generally the case.
8
effect on prices what so ever. Depending on the degree of openness, the modifications for the
Keynesian theory of income distribution may be severe.
In the Post Keynesian growth models à la Robinson and Kaldor income distribution is
determined by the animal spirits of entrepreneurs. This is because of the so-called Cambridge
savings equations, which assumes that the savings propensity out of capital income is larger
than that of wage income. Note that this theory has a direct empirical prediction in our
context: it predicts that there is a negative correlation between the rate of capital accumulation
and the wage share. As technology as well as bargaining power plays no role in this theory, an
exogenous increase in the profit rate does not make sense in this framework.
In the Kaleckian approach functional income distribution is at the very core of the analysis.
While the analysis of the goods market and the principle of effective demand are similar,
Kalecki assumed that firms have the power to set prices and prices would react little to
changes in demand. Income distribution would then not be an ex-post outcome, strongly
determined by effective demand, but would be rather stable. The degree of monopoly power
would determine income distribution. The determinants of the degree of monopoly power are
not perfectly clear in Kalecki. While Kalecki (1954) claimed that the organizational strength
of workers would affect monopoly power, it is not clear how. In particular, one would expect
an increase in the organizational strength of labor to translate into an increase in money wages
first and rather than into a direct decrease of the mark up.
More formally, Kalecki assumed (similar to Keynes) that a wage increase would be passed on
to prices. He assumed that prices would not be responsive to demand and he assumed a
procyclical labor productivity (due to overhead costs). Again, these propositions will be
watered down in an open-economy setting. Due to international competition the ability of
firms to pass on domestic wage increases will be limited. Consequently, changes in
(domestic) money wages will have effects on income distribution.
In Marxian theories income distribution crucially depends on the relative power relations in
class struggle. Distribution is understood to be determined prior to circulation in the sphere of
production. In a simple Marxian macro model (such as that by Goodwin 1967), the wage
share is a negative function of unemployment. Unemployment will negatively depend on
output. Demand will negatively depend on the wage share as profits are reinvested in the

9
Marxian theory. The Marxian theory has direct implications for the relation between the wage
share and capital accumulation.
To sum up, while differences are clear-cut in long-run growth version of neoclassical,
Keynesian and Marxian theories, these differences get blurred in more realistic medium-run
setting, where capacity utilization is flexible and the economy is open. Thus the different
economic paradigms highlight different driving forces for income distribution – for
neoclassical economics it is technology and preferences, for Keynesian in the Marxian theory
and the (autonomous) expenditures of capitalists, for Marxists, the relative balance of power
in class struggle in the Post Keynesian theory, and for Kaleckian the degree of monopoly
power of firms – but the respective theoretical models are sensitive to their assumptions. The
following section will present the NAIRU model as a general medium-term model that
synthesizes insights from different theories and thus serves as a pragmatic framework for our
empirical analysis that incorporates insights from all three theoretical approaches.
2.2 The NAIRU model as general medium-run framework
Much of the modern macroeconomic literature is based explicitly or implicitly on some kind
of a NAIRU or bargaining model. While the NAIRU model is usually associated with a
particular interpretation, namely that the NAIRU is exogenous, Stockhammer (2008) argues
that the NAIRU theory, broadly understood, is consistent with different interpretations. In
particular, New Keynesian, Post Keynesian and Marxian theories suggest different closures
with respect to the demand function and with respect to the question of whether the NAIRU is
exogenous or endogenous. The standard interpretation is the New Keynesian interpretation
which assumes no effect of income distribution on demand and an exogenous NAIRU. The
Post Keynesian (Kaleckian) interpretation assumes a wage-led demand regime, a positive
effect of inflation on demand (at least over some relevant region of moderate inflation rates)
and an endogenous NAIRU. The Marxian theory assumes a profit-led demand regime and an
endogenous NAIRU. The following presentation does therefore not imply any particular
closure, but is understood as a general framework.
At the core the NAIRU model consists of a wage bargaining curve and a price setting curve.
Wage bargainers will set wages (W) based on the bargaining strength of workers (ZW), on the
10
expected price level (PE), and on the unemployment rate (U). If prices and labor productivity
deviate from their expected levels, wages adjust imperfectly.
W = W(u, PE, Zw) (1)
Prices will depend on various determinants of the price setting power of firms (ZF), on
expected wages (WE), on the (technical) marginal product of labor (MPL), which will itself
depend on technology (t) and on the available capital stock (K).5
P = P(W, MPL(t, K), ZF) (2)
Changes in actual unemployment are then decomposed into changes in the NAIRU and
deviations of actual unemployment from the NAIRU, which are (assuming adaptive
expectations) proxied by the change in inflation.
ut = f(∆P) + u* (3)
u* = F(t, K, Zw, ZF) (4)
For any equilibrium (NAIRU) rate of unemployment there is a corresponding level of wages:
W* = g(t, Zw, ZF) (5)
Note that one implication of this approach is that in a reduced-form setting the equilibrium
wage and the equilibrium unemployment depend on the same set of variables, which is
apparent from equations 4 and 5.
As the wage share (WS) is by definition equal to wages times employment divided by nominal
output (WS = W.N/P.Y), there will be a unique wage share corresponding to the NAIRU and
its associated wage level.
WS* = h(t, Zw, ZF) (6) 5 Rowthorn (1999a, 1999b) has shown that the medium-run NAIRU depends on the capital stock if the elasticity
of substitution of less than unity as empirical studies suggest.

11
The NAIRU theory is a general framework in that it does not detail the factors that will
influence the bargaining power of workers and the price setting power of firms. Key
differences in the empirical applications of the theory lie in how these factors are
implemented.
2.3 Key arguments in the recent debate
The recent debate on the determinants of functional income distribution has focused on the
relative impact of technological change, globalization and changes in bargaining power
between capital and labor. This section will present the key arguments in terms of how these
factors are considered to affect income distribution, how these factors have been proxied in
empirical research and what the main findings have been. Finally, the section will also draw
attention to another factor, financialization, that has so far been neglected.
2.3.1 Technological change
Of course in a world of complete markets, perfect competition, full employment and well
behaved aggregate production functions, income shares are determined by technology.
However, none of these assumptions is likely to hold in the real world. Nonetheless, the basic
neoclassical argument still carries a lot of weight in the present debate. It is argued that since
the early 1980s, technological change has become capital augmenting rather than labor
augmenting (which it used to be in the postwar era). Consequently wage shares have been
falling. A more sophisticated version of the technological change story is that of skill-biased
technological change. Computers and other ICT (information and communication
technology)-capital are complements to high-skilled labor and a substitute to low-skilled
labor. As the use of ICT-capital increased, the demand for high-skilled labor increased and
that of low-skilled labor decreased, which came with rising (falling) wages for high (low)-
skilled workers. It so happens that the wage share overall is falling.
Empirically technological change has been proxied by time trends, capital-labor ratios and
ICT capital (and combinations of these). Ellis and Smith (2007) for example use a time trend
and Guscina (2006) uses a time trend after 1985. Needless to say, a time trend will only
convince a believer of the effect of technological change: as we know that wage shares have a

12
declining trend, it is hardly surprising that time trends do have an effect on the wage share.
Benolila and Saint-Paul (2003) use the capital-labor ratio, IMF (2007a) and EC (2007) use the
capital-labor ratio and ICT capital. This makes more sense. However, while common in the
literature, it is not straightforward to interpret the capital-labor ratio as a technologically
determined variable. The argument presumes that the capital stock has changed because of
changes in available technology or because of a change in relative prices of capital and labor.
From a Keynesian point of view, the capital stock is the outcome of investment decisions
driven by animal spirits. The capital-labor ratio will thus be not caused by a change in
technology, but by a change of investor sentiment. It will, however, embody technological
change as entrepreneurs will typically use the latest technology available. Thus it is not a
priori clear whether the changes in the capital-labor ratio can be interpreted as a proxy for
(autonomous) changes in technology. The use of ICT-capital is a less ambiguous proxy for
technological change as it reflects implemented technological change independent of the
motives of its implementation.
The literature typically finds strong effects of technological change on income distribution.
For example IMF (2007a) finds that technological change has been the most important cause
for the decline in wage shares. Many studies use rather strong wording. EC (2007) concludes
that ”for the period for which the data is available (i.e. from the mid-1980s to early 2000s),
the estimation results clearly indicate that technological progress made the largest
contribution to the fall in the aggregate labour income share” (EC 2007, 260).
2.3.2 Globalization
In recent debates the role of globalization features prominently in empirical analysis. The
standard trade theory argument is built on the Stolper and Samuelson (1941) Theorem, which
states that the abundant factor will gain. For northern countries, supposedly, this is capital
whereas labor is abundant in developing countries such as China and India that have recently
entered the global economy. Globalization is thus supposed to benefit capital in the north and
labor in the south.
However, things are more complicated than Stolper-Samuleson suggest. The Stolper-
Samuelson theorem assumes that neither capital nor labor is mobile; its effects take place
through trade. However, the recent period of globalization has been marked by an increase in

13
capital mobility. “If capital can travel across borders, the implications of the theorem weaken
substantially” (EC 2007, 45). Moreover, classical international trade theory is unable to
explain the actual pattern of trade, which takes place mostly among developed countries.
According to standard trade theory it is not obvious why North-North trade should affect
income distribution (assuming that relative factor prices are similar). Second, labor is not a
homogenous input. While unskilled labor (in the North) may loose from globalization, skilled
labor may indeed gain.6 If so, it is a priori not clear how the total wage share in the North
should be affected.
The Political Economy of Trade approach argues that even trade among similar countries may
affect income distribution. Rodrik (1997) argues that trade liberalization benefits the more
mobile factor, which will typically be capital. Unlike the Stolper-Samuelson approach,
Rodrik’s argument is set in a bargaining framework. The change in distribution takes place
because of a redistribution of rents, not because the equalization of factor costs. Moreover, in
the Stolper-Samlueson theorem one would expect distribution to change after production has
been relocated. Epstein and Burke (2001), based on a bargaining model, argues that due to
threat effects redistribution can take place without changes in production locations.
In empirical research (trade) openness, i.e. imports plus exports compared to GDP, is the most
commonly used indicator for globalization (used by EC 2007, Rodrik 1997, Harrison 2002).
IMF (2007a) offers several measures of globalization including the terms of trade and
measures of offshoring and immigration. Harrison (2002) and Rodrik (1998) also use
measures of capital account liberalization.
While there are differences in the theoretical arguments the empirical assessment is rather
clear. Basically all studies find substantial effects of globalization on functional income
distribution. For example IMF (2007a) concludes “globalization is one of several factors that
have acted to reduce the share of income accruing to labor in advanced economies” (IMF
2007a, 161).
6 Modern models in trade theory use different types, i.e. skill-levels, and allow for intermediate goods. The
effects of globalization in these models become more complicated and less easily tractable.
14
2.3.3 Bargaining power
Once one abandons the assumption of perfect competition income distribution becomes the
outcome of a bargaining process between firms and labor, typically represented by labor
unions. A higher bargaining power of workers will lead to an increase in wages and, if labor
demand is inelastic, to an increase in the wage share. There is little of disagreement so far.
The question rather is what affects the bargaining power of workers and firms.
Recent empirical research (on OECD countries) tends to identify the bargaining power with
labor market institutions (LMI). The background for this is a long debate on the determinants
of unemployment that has led to the development of databases for labor market institutions
that have then also been used in the analysis of income distribution. Thus IMF (2007a) and
EC (2007) include union density, employment protection legislation, unemployment benefit
generosity and the tax wedge as wage push variables that may also affect income distribution.
Benolila and Saint–Paul (2003) include (only) a variable measuring strike activity. Azmat,
Manning and van Reenen (2007) is the only study (which investigates only the distributional
effects in certain service sectors) that focuses on the bargaining power of firms.
The Political Economy approach (Rodrik 1997, Harrison 2002) has highlighted that
globalization also affects bargaining power (rather than merely relative prices) and
consequently interprets globalization variables as related to bargaining power.
EC (2007) and IMF (2007a) find surprisingly small, if any, effects of union density. They also
find that several labor market institutions have ‘perverse’ effects, i.e. higher unemployment
benefits and higher employment protection legislation is found to lead to lower wage shares,
which is interpreted to be caused by a very elastic labor demand function.
2.3.4 Financialization
Financialization refers to the increased influence of financial institutions and financial
motives on non-financial activities. Financial deregulation has had two important effects on
the bargaining position of labor. First, firms have gained more options for investing: they can
invest in financial assets as well as in real assets and they can invest at home as well as
15
abroad. They have gained mobility in terms of the geographical location as well as in term of
the content of investment. Second, it has empowered shareholders relative to workers. The
development of a market for corporate control has aligned management’s interest to that of
shareholders (Lazonick and O’Sullivan 2000, Stockhammer 2004). Rossmann (2009)
illustrates this with reference to private equity funds, which buy firms by way of debt that is
transferred to the firm. The surplus is siphoned to the private equity fund through dividend
payments or fees. The restructured firms then are heavily burdened with servicing their debt
and have little alternative to pursuing an aggressive cost-cutting strategy. For countries, where
data is available, the increase in dividend payout is well documented (Duménil and Lévy
2001, 2004). Epstein and Powers (2003) document the increasing income share of rentiers.
Unfortunately there is no single measure of financialization. It encompasses several
dimensions like internal (domestic) financial deregulation and external (international)
financial deregulation (“financial globalization”) as well as changes in corporate governance.
So far econometric studies on changes in functional income distribution in OECD countries
have not included financialization variables. Studies on developed as well as developing
countries have included variables of financial globalization. Rodrik (1998) and Harrison
(2002) have included measures of capital controls and capital mobility. ILO (2008) argues
that financial globalization has contributed to the decline in the wage share, but does not
provide econometric evidence. Remarkably, IMF (2007b) in a study on personal income
distribution within countries has included foreign direct investment (FDI) stocks.7
2.4 The standard explanation and an extension
The NAIRU theory gives a reduced-form distribution function in which income distribution is
determined by various factors effecting bargaining power and by technology. As discussed in
the previous section the recent (empirical) literature has focused on the relative impact of
technological change, globalization and changes in bargaining power between capital and
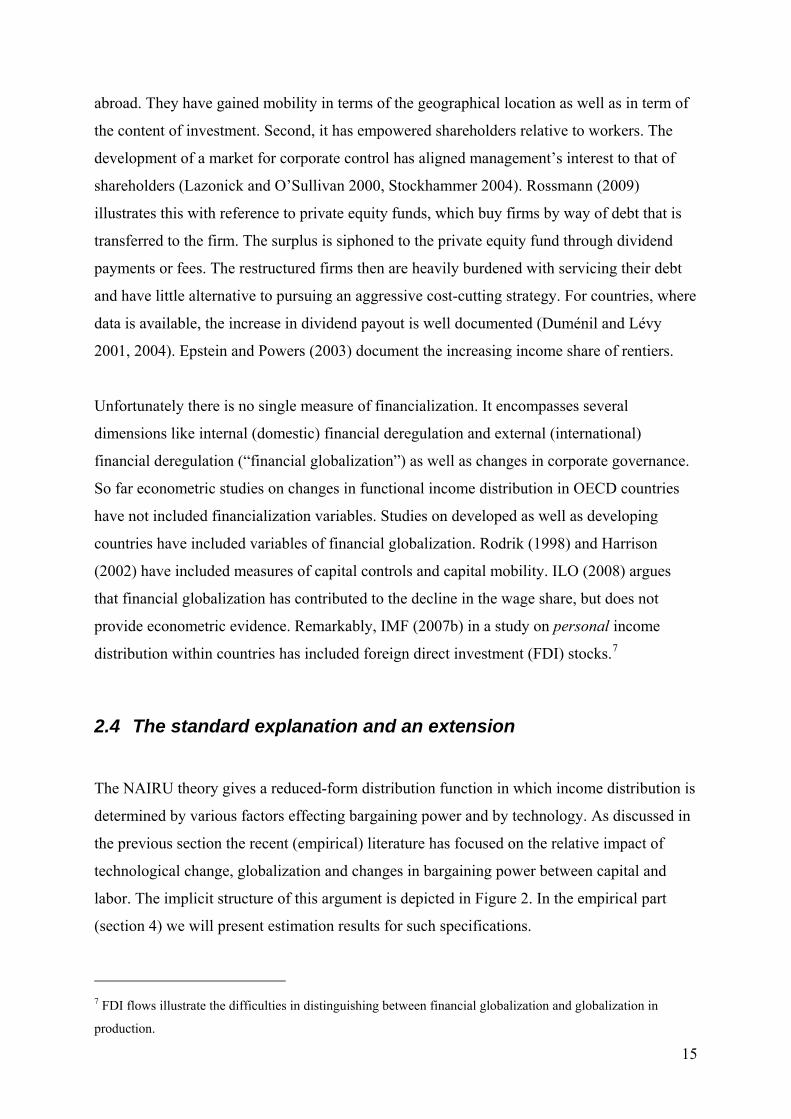
labor. The implicit structure of this argument is depicted in Figure 2. In the empirical part
(section 4) we will present estimation results for such specifications.
7 FDI flows illustrate the difficulties in distinguishing between financial globalization and globalization in
production.
16
Figure 2. The standard explanatory factors of functional income distribution
In Figure 2 the circles for technological change, globalization and bargaining power overlap.
This reflects the difficulties in empirically distinguishing between these phenomena. These
problems are in part for conceptual reasons, in part they are due to the empirical proxies. In
many cases the distinction is difficult even at the conceptual level. For example without the
development of modern communication technologies international production networks
would not be feasible. As highlighted earlier, there are also ambiguities in the interpretation of
globalization: has it changed economic fundamentals or merely the bargaining positions of
labor and capital? It is thus important to keep in mind these problems of identification when
interpreting empirical results as the empirical proxies will usually only partially capture the
variable they are supposed to measure.
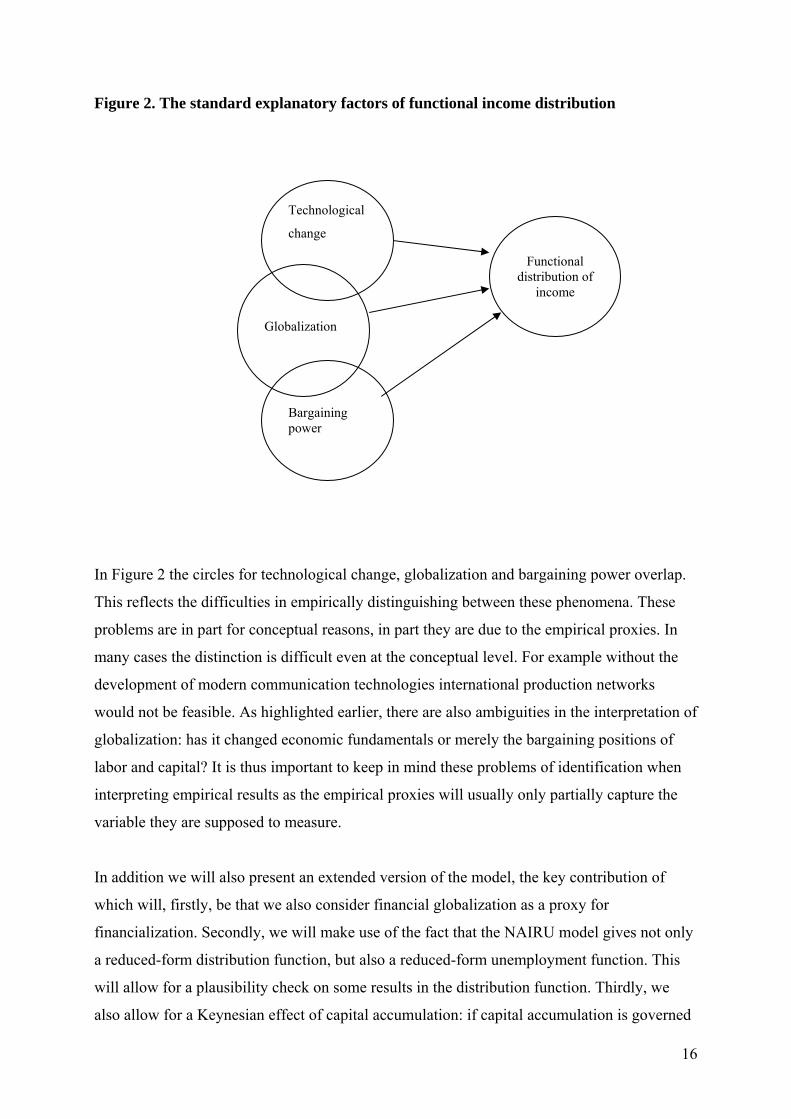
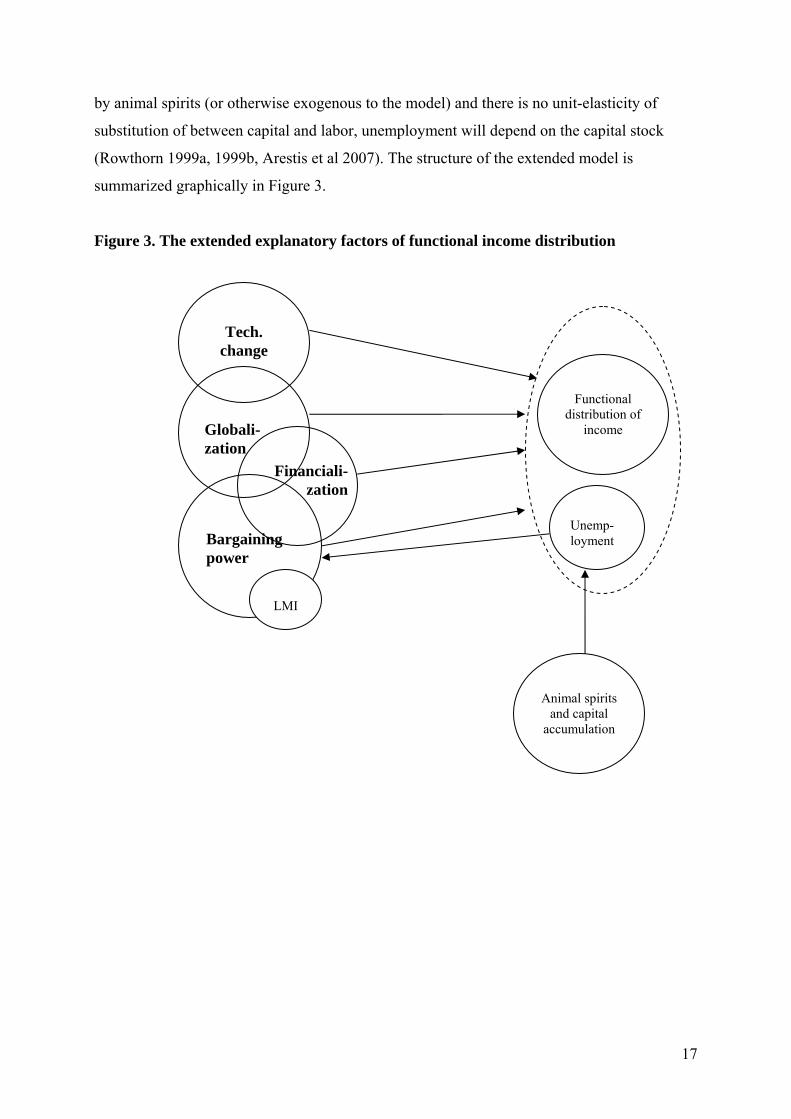
In addition we will also present an extended version of the model, the key contribution of
which will, firstly, be that we also consider financial globalization as a proxy for
financialization. Secondly, we will make use of the fact that the NAIRU model gives not only
a reduced-form distribution function, but also a reduced-form unemployment function. This
will allow for a plausibility check on some results in the distribution function. Thirdly, we
also allow for a Keynesian effect of capital accumulation: if capital accumulation is governed
Technological
change
Globalization
Bargaining power
Functional
distribution of income
17
by animal spirits (or otherwise exogenous to the model) and there is no unit-elasticity of
substitution of between capital and labor, unemployment will depend on the capital stock
(Rowthorn 1999a, 1999b, Arestis et al 2007). The structure of the extended model is
summarized graphically in Figure 3.
Figure 3. The extended explanatory factors of functional income distribution
Tech.
change
Globali-zation
Bargaining power
Functional
distribution of income
LMI
Unemp-loyment
Animal spirits
and capital accumulation
Financiali-
zation
18
3 The recent empirical literature on the determinants of functional income distribution
While income distribution has been a rather neglected research area by mainstream economic
policy institutions, from 2007 onwards several high profile studies have appeared, for
example IMF (2007a, 2007b) in the World Economic Outlook and EC (2007) in Employment
in Europe; the OECD has published related studies on the effects of globalization (OECD
2007) and on personal income distribution (OECD 2008). This section will summarize IMF
(2007a) and EC (2007) in detail, because these are directly comparable to the following
empirical investigation and then provide a brief survey of other related empirical literature.
3.1 IMF (2007a)
IMF (2007a) is probably the most prominent mainstream analysis of the determinants and
changes in functional income distribution. It concludes that “globalization is one of several
factors that have acted to reduce the share of income accruing to labor in advanced
economies, although rapid technological change has had a bigger impact, especially in
unskilled sectors” (IMF 2007a, 161).
IMF (2007a) uses a panel of 18 OECD countries with annual data for the period 1983-2002 to
analyze the effects of globalization, changes in technology, labor market institutions. The
study is most careful in discussing the effects of globalization, with indicators for offshoring,
relative import and export prices and immigration. As far as technology is concerned the text
highlights the role of ICT capital stock, but the econometric analysis also contains the capital-
labor ratio. After including a richer set of LMI variables, the study includes union density and
the tax wedge.
The analysis is carried out mostly by a sectoral fixed effects panel estimation with one
instrumental variable estimator reported as robustness check for the baseline specification.8
There are no period fixed effects included.
8 The text is not clear which variables were instrumented and how they were instrumented.

19
Table 1 summarizes the regression results of IMF (2007a). It finds statistically significant
effects of ICT capital, mixed results on the labor-capital ratio negative effects of various
globalization variables and negative effects the tax wedge and of unemployment benefits.
Some comments are necessary. First, the table reports no diagnostic statistic for
autocorrelation. While the standard errors used are robust to autocorrelation (and
heteroscedasticity), there is no indication that the coefficient estimates themselves are. Indeed,
attempts to replicate similar (i.e. simplified versions with the same dependent variable)
estimations will indicate rather serious autocorrelation problems (with DW values below 1;
see section 4.4).
Table 1. Wage share regression of IMF (2007a)
Source: IMF (2007a): Table 5.2

20
Second, the study notes that “The coefficients on the ICT capital stock, its square, and
offshoring become statistically insignificant when time effects are included” (IMF 2007a,
188). Rather than concluding that these non-robust effects should be interpreted with caution,
the IMF asserts that “This is not surprising since time effects are often used in empirical
studies to capture the effect of worldwide technological progress and other broad global
trends” (IMF 2007a, 188). This is a strange statement; it effectively says: because time effects
are often interpreted to capture technological progress in the absence of proper variables
controlling for technological progress, it is no problem that a supposedly better variable for
technological progress becomes statistically insignificant once time effects are allowed for. If
time effect were indeed capturing technological progress, they (not the genuine technological
progress variables!) should become statistically insignificant once variables for technological
progress are controlled for.9 Moreover, in our context many variables suffer from
measurement problems, thus there is no reason to exclude the possibility that time effects
capture changes unrelated to technology.
Third, ICT capital is the only variable that is included in non-linear form. EC (2007) as well
as own attempts to replicate the results suggest that ICT capital has no statistically significant
effect if included in standard form. While there is some justification for the non-linear form
(IMF 2007a, 187) it is hardly conclusive. In particular one could argue that the more
widespread the use of computers becomes the more it is likely to also substitute high skilled
labor. More importantly, one would expect several other variables also to have non-linear
effects. No tests of these and its effects on the robustness of the effects of ICT capital are
reported.
The IMF then proceeds by calculating the contributions to changes in the labor share based on
these regression results (see Figure 4). This clearly indicates that technological change has by
far had the strongest relative effect on the wage share, that effects of globalization are also
substantial and the effects of labor market institutions are minor (and go in different directions
in different countries). Several comments are in place. First, IMF (2007a) is not entirely clear
9 In purely technical terms it could be argued that, if time effects and technological change variables are highly
correlated, this inflates standard errors so that both variables may become insignificant. In any case, it ought to
serve as a warning against bold interpretations.

21
on whether changes in the capital-labor ratio are counted as technological change. The IMF’s
interpretation of Figure 4 only mentions ICT capital.
Figure 4. Contributions to the change in the wage share according to IMF (2007a)
Source: IMF 2007a, Figure 5.12
22
Second, offshoring makes up a substantial part of the effects of globalization. However, its
effect is not robust to the inclusion of time effects.
The analysis then is extended by analyzing the high skilled and the low skilled wage share.
These wage shares are defined with respect to high and low skill sectors, not with respect to
the skill level of workers. This is important as the so-defined low skill wage share is declining
because the employment share of these sectors is declining. The regression analysis is then
performed on the wage shares in skilled and unskilled sectors separately.10 This finds that
globalization has had a strong negative effect on skilled labor and technological change a
weaker and also negative effect. The first is said to be consistent with the outsourcing in the
skilled sector. Nothing is said about the composition of these effects. In particular, a large part
of the negative effect of globalization on skilled wage share seems to come from immigration.
Immigration consistently has a substantially higher (by a factor of 3!) coefficient than in the
regression for the unskilled wage share.
Last but not least, technological change has a negative effect on the skilled wage share. It is
not clear how this is consistent with the IMF’s overall story.11 Moreover, the unskilled wage
share has experienced negative effects from technological change and minor effects from
globalization.
3.2 EC (2007)
EC (2007) is another prominent study on the determinants of the changes in functional
income distribution. The study is based on a panel of annual data for 13 OECD countries from
1983 to 2002. It is similar in spirit to IMF (2007a); its focus is on the effects on different skill
levels.12 Its measure of globalization is rather crude (openness) and it uses more LMI
10 For enlightening critical comments on the IMF’s analysis of the high-skill and low-skill sectors see Onaran
(2008, 5). 11 The largest effect on the skilled wage share is the employment shift between sectors (Fig. 5.13 in IMF 2007).
Presumably the IMF’s defence would be that this shift also captures technological change. 12 Being based on the KLEMS dataset, it is able to use a measure of the wage share of high-skilled, medium-
skilled and low-skilled workers (rather than sectors).
23
variables and the OECD measure for product market regulation (PMR) in eight services
sectors.
The estimations are performed with a standard panel estimator with sectoral fixed effects. A
footnote reports a robustness check with an instrumental variable estimator. There are no time
effects included and the output gap is included as a cyclical variable. No diagnostic statistics
are reported and autocorrelation is not discussed as a potential problem.
EC (2007) notes that “openness of the economy (…) affects both rents in the goods market
and bargaining power in the labour market” (EC 2007, 255), but stops short of concluding that
the expected sign of openness is a priori indeterminate.
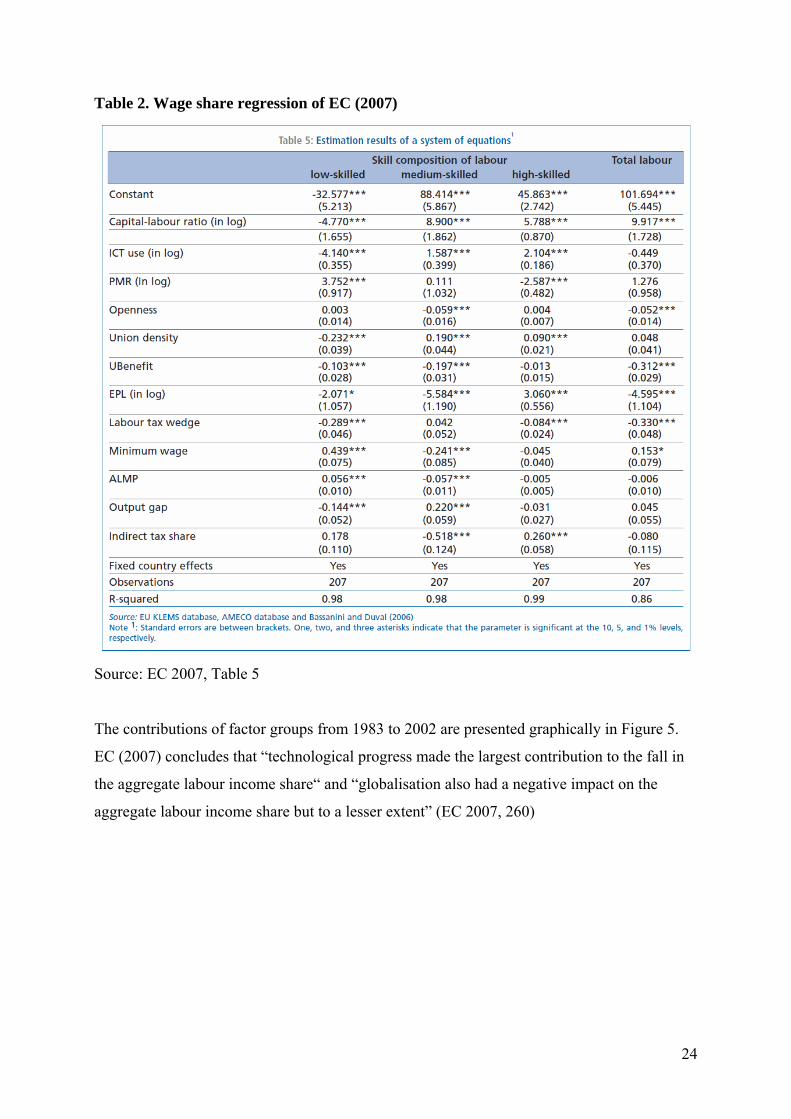
Table 2 gives the main regression results of EC (2007). Looking at the effects on the total
wage share, we note that the capital-labor ratio has a positive effect and openness has a
negative effect. ICT (per employee) and PMR have no statistically significant effects. Among
the LMI variables, unemployment benefits, employment protection legislation and the tax
wedge have negative effects and minimum wages have a positive effect. Unemployment
benefits, active labor market policies as well as ICT have no statistically significant effect.
Several of the variables that have no effect on the total wage share, however, do have effects
on different skill groups.
Again we notice the absence of a discussion of the issue of autocorrelation. Similar
estimations, i.e. with the same dependent variable and similar, but not identical set of
explanatory variables, did indicate serious autocorrelation problems (see section 4.4).
24
Table 2. Wage share regression of EC (2007)
Source: EC 2007, Table 5
The contributions of factor groups from 1983 to 2002 are presented graphically in Figure 5.
EC (2007) concludes that “technological progress made the largest contribution to the fall in
the aggregate labour income share“ and “globalisation also had a negative impact on the
aggregate labour income share but to a lesser extent” (EC 2007, 260)

25
Figure 5. Contributions to the change in the wage share according to EC(2007)
Source: EC 2007, Chart 15
It also notes that the “loss was unevenly spread over the different skill types as the high-
skilled workers were able to increase their share while the low-skilled workers lost income
share as a result of technological progress“. (EC 2007, 260) And ”globalisation also had a
negative impact (…) primarily on the medium-skilled workers” (EC 2007, 260)
Regarding LMI, EC (2007) argues that labor demand from low-skilled workers is elastic
whereas that of high and medium-skilled workers is inelastic. Therefore an increase in LMI
and thus the bargaining power of low-skilled workers will decrease their wage share because
the employment effect dominates the wage effect. Moreover, low-skilled workers are
substitutes of capital and medium/high-skilled workers are complements of capital.
3.3 Other neoclassical studies
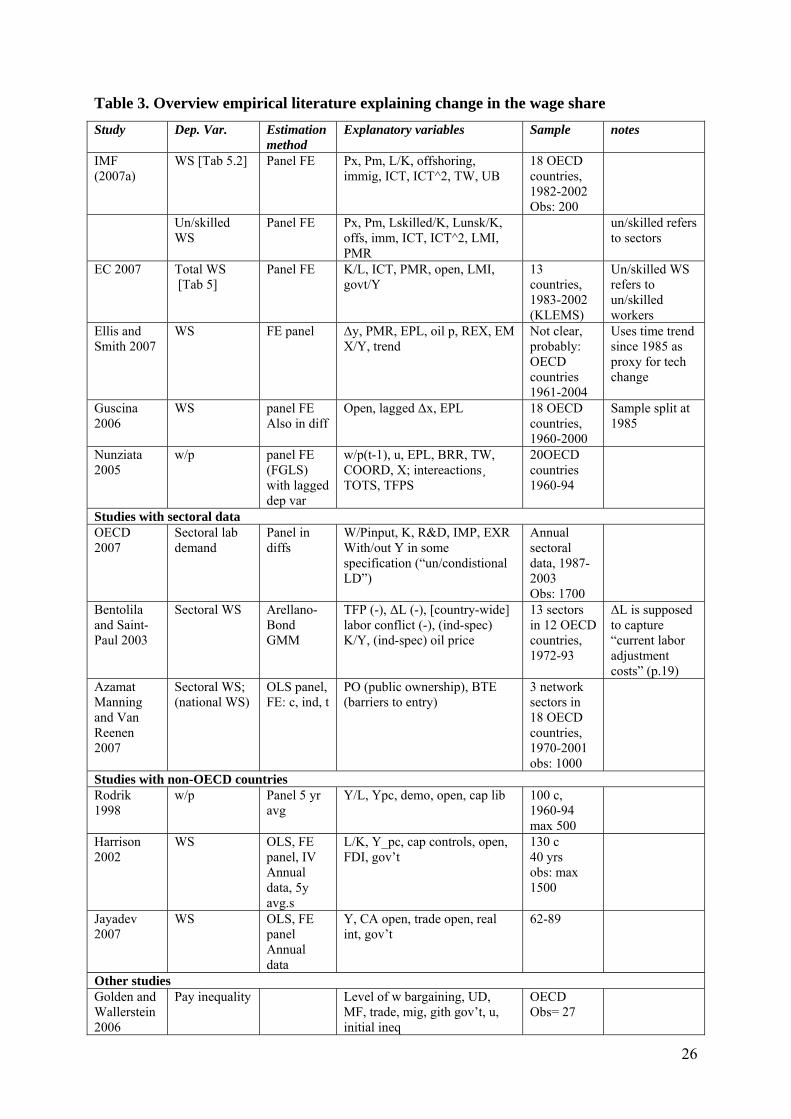
Table 3 gives an overview of the existing literature.
Bentolila and Saint-Paul (2003) stick closely to the neoclassical approach, that is, they derive
the wage share from a production function and discuss different types of technological
change. Their aim is to decompose changes in the wage share into movements along a
technology-determined curve, namely the [wage] share-capital curve, shifts of its locus and
26
Table 3. Overview empirical literature explaining change in the wage share Study Dep. Var. Estimation
method Explanatory variables Sample notes
IMF (2007a)
WS [Tab 5.2] Panel FE Px, Pm, L/K, offshoring, immig, ICT, ICT^2, TW, UB
18 OECD countries, 1982-2002 Obs: 200
Un/skilled WS
Panel FE Px, Pm, Lskilled/K, Lunsk/K, offs, imm, ICT, ICT^2, LMI, PMR
un/skilled refers to sectors
EC 2007 Total WS [Tab 5]
Panel FE K/L, ICT, PMR, open, LMI, govt/Y
13 countries, 1983-2002 (KLEMS)
Un/skilled WS refers to un/skilled workers
Ellis and Smith 2007
WS FE panel Δy, PMR, EPL, oil p, REX, EM X/Y, trend
Not clear, probably: OECD countries 1961-2004
Uses time trend since 1985 as proxy for tech change
Guscina 2006
WS panel FE Also in diff
Open, lagged Δx, EPL 18 OECD countries, 1960-2000
Sample split at 1985
Nunziata 2005
w/p panel FE (FGLS) with lagged dep var
w/p(t-1), u, EPL, BRR, TW, COORD, X; intereactions¸ TOTS, TFPS
20OECD countries 1960-94
Studies with sectoral data OECD 2007
Sectoral lab demand
Panel in diffs
W/Pinput, K, R&D, IMP, EXR With/out Y in some specification (“un/condistional LD”)
Annual sectoral data, 1987-2003 Obs: 1700
Bentolila and Saint-Paul 2003
Sectoral WS Arellano-Bond GMM
TFP (-), ΔL (-), [country-wide] labor conflict (-), (ind-spec) K/Y, (ind-spec) oil price
13 sectors in 12 OECD countries, 1972-93
ΔL is supposed to capture “current labor adjustment costs” (p.19)
Azamat Manning and Van Reenen 2007
Sectoral WS; (national WS)
OLS panel, FE: c, ind, t
PO (public ownership), BTE (barriers to entry)
3 network sectors in 18 OECD countries, 1970-2001 obs: 1000
Studies with non-OECD countries Rodrik 1998
w/p Panel 5 yr avg
Y/L, Ypc, demo, open, cap lib 100 c, 1960-94 max 500
Harrison 2002
WS OLS, FE panel, IV Annual data, 5y avg.s
L/K, Y_pc, cap controls, open, FDI, gov’t
130 c 40 yrs obs: max 1500
Jayadev 2007
WS OLS, FE panel Annual data
Y, CA open, trade open, real int, gov’t
62-89
Other studies Golden and Wallerstein 2006
Pay inequality Level of w bargaining, UD, MF, trade, mig, gith gov’t, u, initial ineq
OECD Obs= 27
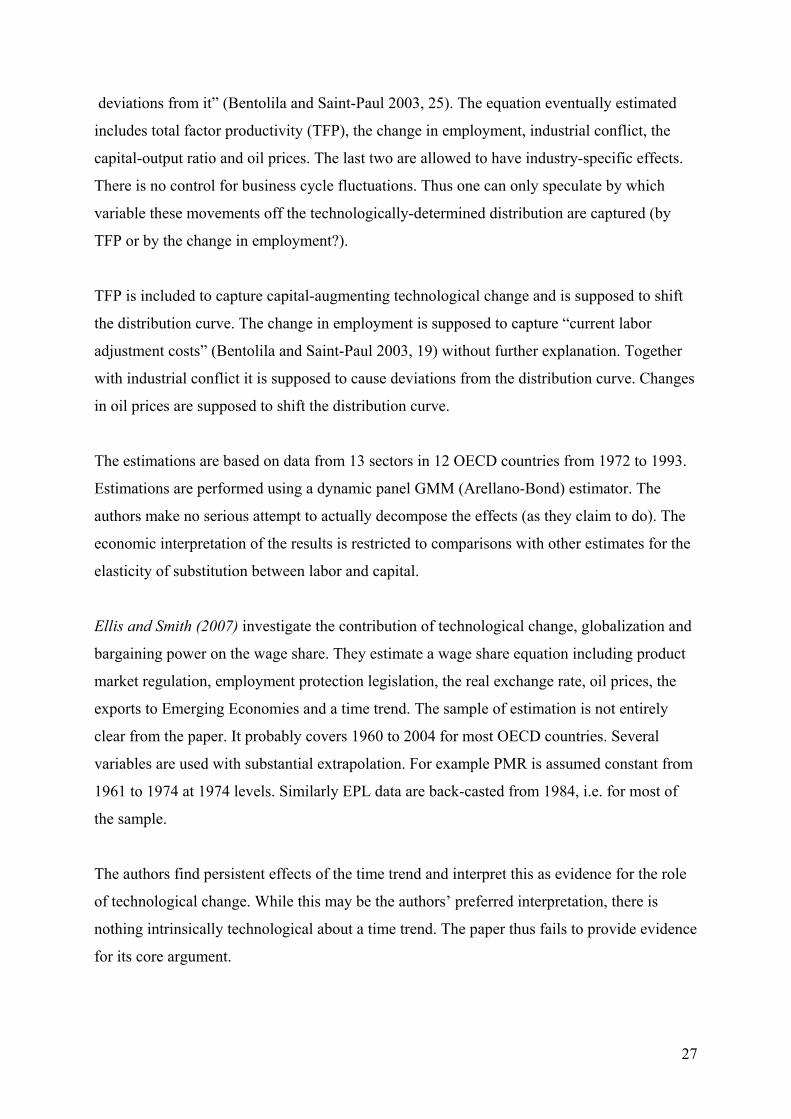
27
deviations from it” (Bentolila and Saint-Paul 2003, 25). The equation eventually estimated
includes total factor productivity (TFP), the change in employment, industrial conflict, the
capital-output ratio and oil prices. The last two are allowed to have industry-specific effects.
There is no control for business cycle fluctuations. Thus one can only speculate by which
variable these movements off the technologically-determined distribution are captured (by
TFP or by the change in employment?).
TFP is included to capture capital-augmenting technological change and is supposed to shift
the distribution curve. The change in employment is supposed to capture “current labor
adjustment costs” (Bentolila and Saint-Paul 2003, 19) without further explanation. Together
with industrial conflict it is supposed to cause deviations from the distribution curve. Changes
in oil prices are supposed to shift the distribution curve.
The estimations are based on data from 13 sectors in 12 OECD countries from 1972 to 1993.
Estimations are performed using a dynamic panel GMM (Arellano-Bond) estimator. The
authors make no serious attempt to actually decompose the effects (as they claim to do). The
economic interpretation of the results is restricted to comparisons with other estimates for the
elasticity of substitution between labor and capital.
Ellis and Smith (2007) investigate the contribution of technological change, globalization and
bargaining power on the wage share. They estimate a wage share equation including product
market regulation, employment protection legislation, the real exchange rate, oil prices, the
exports to Emerging Economies and a time trend. The sample of estimation is not entirely
clear from the paper. It probably covers 1960 to 2004 for most OECD countries. Several
variables are used with substantial extrapolation. For example PMR is assumed constant from
1961 to 1974 at 1974 levels. Similarly EPL data are back-casted from 1984, i.e. for most of
the sample.
The authors find persistent effects of the time trend and interpret this as evidence for the role
of technological change. While this may be the authors’ preferred interpretation, there is
nothing intrinsically technological about a time trend. The paper thus fails to provide evidence
for its core argument.

28
Guscina (2006) aims at identifying the effects of technological change, globalization and
bargaining power. Openness is used as a proxy for globalization, lagged productivity growth
for technological change and EPL for bargaining power. The estimations are performed for
the pre-1985 and post-1985 sample separately because 1985 is assumed as the beginning of
the technological revolution. Estimations are also performed with the employment share and
the Gini coefficient as dependent variables. The sample covers 18 OECD countries for the
period 1960-2000. The estimation is performed by a standard fixed panel estimator with
country fixed effects (but not time effects) and, as a robustness check in differences without
any fixed effects.
The authors find negative effects of openness (only statistically significant effects post 1985)
and no statistically significant effects of employment protection legislation. There are
statistically significant effects of productivity growth, namely positive ones prior to 1985 and
negative ones thereafter. The author interprets this as evidence of change in technological
progress.
3.4 Other studies on changes in income distribution
There are numerous studies that are related but not directly comparable, i.e. that either do not
investigate the determinants of the (national) wage share econometrically or that refer to very
different groups of countries. Thus the following literature review has to be necessarily
incomplete.
Azmat et al (2007) highlight the effects of privatization and barriers to entry to certain
industries on the wage share. They do so by “exploit[ing] a number of policy experiments
across several ‘network’ industries in many OECD countries to identify these effects” (Azmat
et al. 2007, 29), i.e. deregulation and privatization in the telecom, gas and electricity, and
transportation industries. They thus use data on three network industries in 18 OECD
countries, for the period 1970-2001, i.e. their dependent variable is sectoral wage shares.
Estimations are performed using standard fixed effects OLS panels. The fixed effects control
for sectoral, country and time effects. Azmat et al (2007) find that privatizations have
negative effects on the wage share and barriers to entry also have negative effects.

29
All the studies discussed so far have analyzed determinants of the changes in the wage share
in OECD countries. Rodrik (1997) and Harrison (2002) are two studies that analyse the
determinants of distribution on developed as well as developing countries. Because of their
number, developing countries will invariably dominate their results, which therefore are
difficult to compare to the other studies.
Rodrik (1998) investigates the effects of democracy and of capital mobility on manufacturing
wages in an analysis covering around 100 countries. The estimations control for the
manufacturing value added per worker, the output-capital ratio, the degree of openness and a
measure of capital liberalization. The sample consists of (non-overlapping) 5-year averages
and, in a variation, of a cross section analysis. Rodrik finds that democracy increases wages
and openness reduces wages.
Harrison (2002) investigates the effects of globalization on wage shares in an analysis
covering more than 100 countries over a period of up to 40 years. Openness, capital controls,
the terms of trade and exchange rate crises are used as variables for globalization. The
estimations also control for the capital-labor ratio, relative per capita GDP and government
share in GDP. Harrison finds the capital-labor ratio has a strong (positive) impact and
globalization has indeed had negative effects on distribution. Capital controls, have a positive
effect. Openness, exchange rate crises and FDI-inflows have negative effects on the wage
share.
Jayadev (2007) analyses the effect of financial openness and trade openness on the wage
share in an econometric analysis covering up to 80 countries for the period 1970-2001. The
openness variables are legal measures on openness. The estimations are performed using
standards fixed effects panel analysis. Control variables include (in various specifications) per
capita GDP, interest rates, a crisis dummy, the government share and the budget deficit.
Capital account openness and trade openness are found to have negative effects on the wage
share.
ILO (2008) argues that “financial globalization has led to a depression of the share of wages
in GDP” (ILO 2008, 39), but does not provide econometric evidence. At the center of the
ILO`s argument is that financial globalization may have had positive effects on growth, but
that these are rather small.

30
All the studies discussed so far (except Rodrik 1998) offer an econometric analysis that has
the wage share as the dependent variable. Wolff and Zacharias (2007) offer an innovative
approach based on a micro data analysis that takes aspects of functional income distribution
into account. They use a class approach to decompose changes in the distribution of
household income for the USA 1989 – 2001. They define the capitalist class with respect to
ownership of nonhome wealth and distinguish between various groups within the working
class according to the skill level and whether employees have supervisory functions. They
combine data from the US census with the CFS (consumer finance survey). They find that
capitalist households receive more than 80% from income from nonhome wealth, whereas this
ratio is below 20% for all other groups. They decompose the change in the Gini coefficient (of
household income distribution) according to class, education and ethnicity and find that “the
entire increase in inequality between 1989 and 2000 is attributable to the increase in inter-
class inequality” (Wolff and Zacharias 2007, 24).
3.5 Wrapping up: What’s missing in the IMF and EC studies?
IMF (2007a) and EC (2007) are the most relevant presentations of the mainstream view of the
determinants of the changes in the functional distribution of income. They both explain the
wage share in a flexible framework that allows to distinguish between effects from
technological change, globalization and labor market institutions/bargaining power. The
single most important factor found is technological change. ICT services and the capital labor
ratio are used as proxies for technological change.13 We note the following potential problems
with these studies:
• From an econometric point of view there are several issues that deserve closer
scrutiny. Given that the dependent variable, the wage share, is likely to be a unit-root
candidate, surprisingly little attention has been given to the issue of autocorrelation in
the residuals. There are several issues of robustness. For example IMF (2007a) does
not control for short-run business cycle variables. Another important issue is whether
results are robust to the inclusion of time effects. Neoclassical studies usually are
quick in equating time effects and time trends as proxies for technological changes. 13 Other neoclassically inspired works use time trends as proxies for technological change and can therefore not
be regarded as serious tests of the role of technological change in determining income distribution.

31
However, given that bargaining power is notoriously difficult to measure there is no a
priori reason to interpret time effects as being due to technological changes.
• Form a Keynesian view it is not obvious that the capital-labor ratio should be
interpreted as a technological change. Investment, and as a consequence, the capital
labor ratio will be driven to some extent by changes in animal spirits that are not
primarily related to technology.
• In the empirical literature the bargaining power of labor is proxied by various labor
market institutions. Essentially these measure welfare state generosity, which clearly
is an important determinant of bargaining power. However, it should be obvious that
power is a much broader concept that is not adequately captured by labor market
institutions and union membership.
• Wage policy has received surprisingly little attention in this context. In the past 20
years governments in several European states have tried to influence wage policies in
the direction of wage moderation. In many cases this crystallized in wage pacts signed
by unions, employers and the government.
• Financialization has so far been neglected as a potential determinant of functional
income distribution in studies on developed economies.
32
4 The determinants of functional income distribution. A panel analysis
This section will first examine the validity of the conclusions of EC (2007) and IMF (2007a)
by replicating their analyses, i.e. by estimating specifications similar to theirs, and by
investigating potential econometric problems. We thus will estimate a standard wage share
equation that includes variables for technological change (tech), globalization (glob), and
bargaining power (BP; in particular: labor market institutions) as presented graphically in
Figure 2:
),,( BPGlobTechfWS = (7)
Second, we will estimate an extended wage share equation that includes effects of financial
globalization (finglob), capital accumulation (KG), allow for different effect of union density
in countries belonging to the Ghent system and include a variable for wage pacts (WP).
Additionally controls for short-run fluctuations of the business cycle (∆y) and other structural
changes (X) will be included, corresponding to Figure 3.
);,,,,,;( XKGWPFinglobBPGlobTechyfWS Δ= (8)
In addition the corresponding reduced-form unemployment equations will also be estimated.
This will make it possible to check the plausibility of indirect effects of changes in, say, labor
market institutions on distribution via (implied) effects on unemployment.
One clarification is in place at the beginning of this chapter. The previous section has
identified several potential problems in the work of EC (2007) and IMF (2007a). The present
study will not be able to correct all of these problems for reasons to be explained below. In
particular we are unable to propose one correct specification. Rather, our aim is more modest:
firstly, we wish to perform a series of tests of robustness using different estimation
techniques; secondly we will extend the list of variables that may affect income distribution.
33
4.1 Variable definitions and data sources
The dependent variable is the adjusted wages share (AWS) from the AMECO database. In
some specifications we will also use a non-adjusted wage share (WS) with is compensation of
employees divided by the compensation plus operating surplus as taken from the AMECO
database.
As variables for technology (the logarithm of) ICT services (ICT) from the KLEMS database
and the capital-labor ratio (KL) will be used. KL is taken from AMECO. Variables for labor
market institutions are taken from the Bassanini-Duval dataset, which is the most up-to-date
dataset and has also formed the basis for the OECD Employment Outlook 2006. The following
variables are included: union density (UNDENS), employment protection legislation (EPL),
the unemployment benefit replacement ratio (UBRR), the tax wedge (TW) and product market
regulation in network industries (PMR). Trade openness (OPEN) is measured as the sum of
exports and imports divided by GDP, all of which are taken from the AMECO database. A
table with variable definitions is in the Appendix (Table A.1). TOT is (the logarithm of) the
terms of trade from AMECO.
The sample is 1979-2006 for the data from the AMECO dataset, but as the Bassanini-Duval
dataset covers only the period 1982-2003, the effective sample for most estimations reported
below is 1982-2003.
The following 15 countries are covered: Belgium, Denmark, Germany, Ireland, Spain, France,
Italy, Netherlands, Austria, Portugal, Finland, Sweden, United Kingdom, United States, and
Japan.14 For Germany macroeconomic variables have been chained with growth rates for
West-Germany prior to 1991 where necessary.
4.2 Time series properties
First we investigate the time series properties of the dependent variable individually. Only for
three countries is the null of a unit root (without trend) rejected at the 5% level or better. Four
more countries pass the test at the 10% level (Table 4). For 15 countries the ADF fails to
reject the null of a unit root. The results are qualitatively similar if we allow for a (linear)
14 Luxembourg, Greece, Iceland, Norway, Canada, Australia and New Zealand had to be dropped as they lack
one or more of the relevant variables in the Bassanini-Duval dataset.

34
trend. While these results are hardly conclusive they suggest that the variables have a unit
root.
Table 4. Unit root tests (ADF tests with two lags) for AWS for individual countries
without trend with trend Belgium -2.638 * -2.789 Test critical values (w/o trend): Denmark -2.443 -2.201 1% level -3.689194 Germany -0.938 -2.754 5% level -2.971853 Ireland -1.697 -1.239 10% level -2.625121 Greece -1.694 -2.963 Spain -1.790 -3.723 ** France -3.141 ** -2.250 Test critical values (w. trend): Italy -1.783 -2.845 1% level -4.323979 Luxembourg -2.768 * -2.598 5% level -3.580623 Netherlands -2.758 * -3.176 10% level -3.225334 Austria -0.189 -1.659 Portugal -3.525 ** -3.327 * Finland -0.732 -1.884 Sweden -3.920 *** -3.811 ** United Kingdom -2.820 * -3.083 Iceland -1.054 -2.605 Norway -0.367 -1.862 United States -1.931 -3.814 ** Japan -0.824 -1.630 Canada -0.757 -1.194 Australia -1.121 -2.134 New Zealand -1.821 -1.401 Sample: 1979-2007
Secondly, we perform panel unit root tests. These are often considered to have a higher power
than unit root tests on individual time series. However, they assume a uniform autoregressive
process across countries. The panel unit root tests are also not conclusive. While the Levin,
Lin and Chu test rejects the unit root hypothesis assuming a common autoregressive process
at the 5%-level, all tests allowing for individual unit root processes fail to reject the null of a
unit root.
Overall the unit root tests are not conclusive, but they suggest that countries exhibit individual
unit roots. Thus we learn that we ought to be skeptical of the pooling assumption and that we
ought to worry about spurious regression results.

35
Table 5. Panel unit root tests for AWS
Group unit root test: Summary Sample: 1979 2007 Exogenous variables: Individual effects Automatic selection of maximum lags Cross- Method Statistic Prob.** sections Obs Null: Unit root (assumes common unit root process) Levin, Lin & Chu t* -1.872 0.031 22 583 Null: Unit root (assumes individual unit root process) Im, Pesaran and Shin W-stat -0.216 0.415 22 583 ADF - Fisher Chi-square 45.271 0.419 22 583 PP - Fisher Chi-square 42.683 0.528 22 603 ** Probabilities for Fisher tests are computed using an asymptotic Chi -square distribution. All other tests assume asymptotic normality.
4.3 Econometric method
The purpose of this study is to investigate the robustness of the results of the IMF (2007a) and
EC (2007) and to extend their analysis by including further variables. This confronts several
substantial econometric problems. These range from heterogeneity across the countries within
our panel to limited variability of some variables over time within one country.
To pool or not to pool? Panel analysis requires the assumption that a change in a variable has
the same effect in different countries. As parts of this study will be based on annual data, the
assumption of uniform coefficients is rather restrictive. Indeed the unit root tests on the
dependent variable confirm the suspicion that the pooling restriction is violated. However, the
number of variables (twelve and more) that we wish to investigate and, in many cases, their
lack of variation within a country does not allow for a single country approach.15 In particular
it would make it impossible to use time series techniques that require more than one lag of
each variable. Thus we proceed with a word of caution. The coefficient estimates of the panel
analysis based on annual data have to be interpreted with caution and it has to be kept in mind
that the pooling restriction (i.e. the assumption of identical coefficients across countries) is
unlikely to be correct. The coefficient estimates have to be interpreted as average effects
across a group of heterogeneous countries. 15 In particular the various variables for labor market institutions often have little variation over time.

36
The first specification will be a standard fixed effects (FE) estimator as used by IMF (2007a)
and EC (2007). As we will see, this estimator comes with serious autocorrelation problems.
The second specification will be a first-difference estimator. This estimator should
theoretically yield similar results to the fixed effects estimator and is preferable if the
regression suffers from a high degree of autocorrelation in the residuals (Wooldridge 2002,
284). With all of these specifications we will report specifications with and without time
effects and we report panel corrected standard errors that are consistent to heteroscedasticity
and autocorrelation.
Thirdly we will present medium-run results based on non-overlapping 5-year average data.
This is attractive in our context because some of the variables, in particular those for labour
market institutions change slowly and because the pooling restriction is less restrictive here.
The critical assumption regarding pooling now is that over a five year (rather than a one year)
period the effects are the same. While this is still unlikely to be met, it certainly is more
plausible. The method also has the advantage that it circumvents unit root problems as the
residuals of the regressions have no (serious) autocorrelation problems. However, this
approach comes at the cost of throwing out some information. In a somewhat different (but
related) context Baccaro and Rei (2007) estimating reduced form unemployment equations
have concluded that specifications based on non-overlapping 5-year averages are preferable
on econometric grounds.
Because of the nature of our data, where the degree of integration is often unclear and, in
some cases, variation over time is low, we regard the estimations based on (non-overlapping)
5-year averages as the most reliable ones.
This study will not use dynamic panel approaches. While presently fashionable in the
literature, the Arellano and Bond (1991) estimator and the Blundell and Bond (1998)
estimator are not designed to deal with potential unit root problems. Panel cointegration
methods might be a logical next step in the analysis, but the tests are typically not designed to
for our high number of variables. Among the dynamic panel estimators the pooled mean
group estimator proposed by Pesaran, Shin and Smith (1999) may be an interesting extension
as it allows for country specific short-run effects but imposes an identical long-run relation.

37
4.4 Replicating the standard model
In a first step we try to replicate the studies by the IMF and the EC. We use a similar set of
variables and similar specifications. The explanatory variables include ICT and KL for
technological change; UNDENS, EPL, UBRR, and TW as labor market variables; PMR for
product market regulation and OPEN as measure of globalization. We will firstly estimate the
relevant equation (like IMF and EC) in a panel with annual data using a fixed effects
estimator, secondly, (unlike IMF and EC) using a first difference estimator and, thirdly,
(unlike IMF and EC) with non-overlapping 5-year averages and a fixed effects estimator.
4.4.1 Replicating the standard model with annual data
As in IMF (2007a) and EC (2007), in the first specification all variables are contemporaneous
and a basic OLS panel estimator with sectoral fixed effects (but not time effects!) is used.
Then we will modify the specification by adding period affects, estimate the specification in
difference form to prevent autocorrelation problems and use lagged variables to avoid
simultaneity. The results of these estimations are summarized in Table 6. All reported t-values
are based on panel corrected standard errors that are robust with respect to sector-specific
heteroscedasticity and autocorrelation.
Specification 1 includes all variables in levels and uses contemporaneous variables. The
specification includes sectoral fixed effects, but no period effects. By and large the results are
in line with the findings by the IMF and the EC. ICT and KL have statistically significant
negative effects, as does OPEN. UNDENS, however, has no statistically significant effect,
whereas EPL, UBRR and PMR do. This specification suffers from serious econometric
problems. First, the regression suffers from serious autocorrelation problems. The DW-
statistic, assuming a uniform autoregressive process across countries, is 0.44. Not only are the
coefficient estimates biased, but the DW-value is so low as to suggest spurious regression
problems. Second, the specification does not include period fixed effects. The redundant fixed
effects tests, however, rejects the null of redundant period fixed effects at the 1% level (F(21,
268): 2.36). Third, no attempt is made to address potential problems of endogeneity.

38
Table 6. Standard wage share equation with annual data
specification 1 2 3 (variables lagged) coeff t-value coeff t-value coeff t-value ict -1.383 -5.753 *** -0.396 -1.242 -0.378 -1.194 kl -11.789 -7.135 *** -10.122 -3.939 *** -11.268 -4.323 *** undens 0.044 1.265 0.012 0.308 0.020 0.508 epl -2.547 -5.203 *** -2.887 -5.972 *** -2.992 -6.215 *** ubrr -0.060 -4.283 *** -0.071 -5.105 *** -0.077 -5.588 *** tw 0.048 1.153 0.077 1.930 * 0.033 0.886 pmr -0.960 -3.950 *** -0.244 -0.787 -0.124 -0.406 open -14.512 -10.563 *** -18.155 -11.284 *** -20.315 -13.815 *** Sector FE yes yes yes Period FE no yes yes dw 0.438 0.439 0.472 adj R2 0.817 0.836 0.845 specification 4 (variables lagged) 5 6 (variables lagged) coeff t-value coeff t-value coeff t-value ∆ ict -0.379 -0.437 -0.260 -0.313 -0.248 -0.295 ∆ kl -8.757 -1.924 * 0.178 0.040 -13.096 -2.712 *** ∆ undens 0.066 1.014 0.094 1.462 0.054 0.779 ∆ epl 0.069 0.153 -0.242 -0.558 0.060 0.125 ∆ ubrr -0.016 -0.777 0.026 1.235 -0.014 -0.582 ∆ tw 0.010 0.266 0.013 0.356 -0.020 -0.501 ∆ pmr -0.082 -0.242 0.038 0.117 -0.186 -0.562 ∆ open -8.778 -4.624 *** -7.608 -3.880 *** -5.252 -3.482 *** Sector FE no no no Period FE yes yes no dw 1.624 1.709 1.531 adj R2 0.220 0.227 0.049 specification 7 (variables lagged) 8 (variables lagged) coeff t-value coeff t-value ∆ ict -0.469 -0.541 -0.383 -0.445 ∆ kl -2.277 -0.393 -9.017 -1.985 ** ∆ undens 0.066 1.021 0.052 0.788 ∆ epl -0.001 -0.002 0.046 0.103 ∆ ubrr -0.018 -0.887 -0.016 -0.756 ∆ tw 0.011 0.300 0.011 0.296 ∆ pmr -0.117 -0.347 -0.086 -0.255 ∆ open -8.936 -4.609 *** -8.622 -4.551 *** ∆ u(t-1) -0.188 -1.899 * ∆ tot 3.720 1.629 Sector FE no no Period FE yes yes dw 1.639 1.577 adj R2 0.227 0.224
Sample: 1982-2003, countries: 15; t-values are based on panel corrected standard errors that are robust to hetereoscedasticity and autorcorrelation. ***, **, * denote statistical significance at the 1%, 5%, and 10% level respectively. Variable defintions: see text section 4.1 and Table A.1 Specifications 1, 2, and 5 are with contemporaneous explanatory variables, Specifications 3, 4, 6, 7, and 8 with lagged explanatory variables.

39
Specification 2 includes period fixed effects. Including fixed effects does not solve the
autocorrelation problems (DW: 0.44). While results are generally qualitatively similar to
specification 1, there are important differences. The effects of ICT and PMR are not
statistically significant any more. Specification 3 uses lagged values of the explanatory
variables to avoid endogeneity problems. The results are similar and the autocorrelation
problems persist. Because of the serious autocorrelation problems all the estimations in level
form have to be regarded as unreliable.
To prevent autocorrelation we estimate the equation in difference form. To make them
comparable to the estimation in levels the sectoral fixed effects are omitted. Time effects have
been included based on the redundant fixed effects test. The basic equation is estimated once
with contemporaneous explanatory variables (specification 4) and lagged explanatory
variables (specification 5). The estimations in difference form show reasonable DW values
(1.62 and 1.71). The two specifications give rather similar results in that only OPEN has a
statistically significant negative effect (at the 1%-level). This is also the case for all following
specifications. KL is statistically significant at the 10% level (and negative) in specification 5.
All other variables are not even statistically significant at the 10% level.
Finally, we do three tests of robustness. Specification 6 uses no fixed effects at all. KL turns
statistically significant at the 1% level and has a negative effect. Specification 7 includes the
(lagged) rate of unemployment and specification 7 includes the terms of trade. Unemployment
has a negative effect that is statistically significant at the 10%-level. Only OPEN has a
statistically significant effect (again at the 1% level), KL is statistically significant at the 5%
level in specification 8.
4.4.2 Replicating the standard model with non-overlapping 5 year averages
Most of the effects of the explanatory variables we examine will take time. For example there
is little reason to assume that a change in technology or in union density will affect income
distribution in the same year. Moreover, there are reasons (such as institutional differences) to
expect the adjustment speed to differ across countries. Therefore a medium-term analysis
seems more appropriate than an analysis with annual data. It is less restrictive that, say, a

40
change in union density will have the same effect on distribution over five years. Thus we
repeat the estimation using non-overlapping five year averages. The results are reported in
Table 7.
Table 7. Standard wage share equation with (non-overlapping) 5-year averages
specification 1 2 coeff t-value coeff t-value 5.640 0.176 23.392 0.518 ict -1.659 -3.460 *** -0.255 -0.417 kl -11.327 -3.263 *** -8.662 -1.677 * undens 0.076 0.912 0.028 0.324 epl -2.857 -2.353 *** -3.511 -2.963 *** ubrr -0.060 -1.754 * -0.076 -2.222 ** tw -0.013 -0.137 0.031 0.353 pmr -1.254 -2.438 *** -0.326 -0.395 open -17.028 -5.441 *** -20.623 -5.507 *** u(t-1) tot Sector FE yes yes Period FE no yes dw 2.016 1.805 adj R2 0.825 0.843 3 4 coeff t-value coeff t-value 47.978 0.789 44.459 0.950 ict -0.262 -0.407 -0.539 -0.858 kl -5.722 -0.818 -7.222 -1.393 undens 0.042 0.528 0.059 0.615 epl -3.604 -3.030 *** -3.433 -2.834 *** ubrr -0.071 -2.060 ** -0.083 -2.394 *** tw 0.060 0.624 0.001 0.015 pmr -0.425 -0.498 -0.560 -0.677 open -20.793 -5.464 *** -21.958 -5.836 *** u(t-1) -0.153 -0.719 tot -0.063 -1.290 Sector FE no no Period FE yes yes dw 1.817 0.000 1.831 0.000 adj R2 0.842 0.000 0.845 0.000
Sample: 1982-2003, countries: 15; t-values are based on panel corrected standard errors that are robust to hetereoscedasticity and autorcorrelation. ***, **, * denote statistical significance at the 1%, 5%, and 10% level respectively. Variable defintions: see text section 4.1 and Table A.1
Specification 1 uses sectoral fixed effects only. As in all the following specifications, there
are no (serious) autocorrelation problems. ICT, KL, EPL, PMR and OPEN have statistically
significant effects at the 1% level, UBRR at the 10% level. Specification 2 uses sectoral as
well as period fixed effects. The redundant fixed effects test clearly suggests the inclusion of

41
both sets of fixed effects. Again ICT is not statistically significant once time effects are
allowed for. EPL, UBRR and OPEN have statistically significant (at the 5% level or better)
negative effects. KL has a statistically significant (negative) effect at the 10% level.
Specification 3 and 4 add unemployment and the terms of trade respectively. Both variables
are not statistically significant. In both specifications OPEN, EPL and UBRR are statistically
significant.
The negative effect of EPL and UBRR is perverse from a bargaining point of view. Higher
EPL should increase workers’ bargaining power and thus increase rather than decrease the
wage share. From a neoclassical perspective, it will be tempting to conclude that labor
demand is elastic and EPL and UBRR have positive effects on unemployment and thus
indirectly affect the wage share. This interpretation, however, is at odds with the results of
specification 3 which controls for unemployment, which should wipe out indirect effects. To
further clarify this issue we estimate an auxiliary regression with unemployment as the
dependent variable (Table 8). This clearly shows that there is no statistically significant effect
of EPL and UBRR on unemployment. In the case of UBRR the sign is positive. According to
these results only KL and TW have statistically significant (positive) effects on
unemployment.
Table 8. Standard unemployment equation with non-overlapping 5-year average data
specification 1 2 coeff t-value coeff t-value 106.333 3.606 *** 160.375 3.730 *** Ict -0.561 -1.408 -0.044 -0.067 Kl 12.898 3.976 *** 19.179 3.842 *** Undens 0.122 1.645 0.097 1.329 Epl -0.639 -0.640 -0.605 -0.648 Ubrr 0.038 1.443 0.033 1.253 Tw 0.187 2.142 ** 0.187 2.384 *** Pmr 0.506 1.173 -0.643 -0.910 Open -3.655 -1.377 -1.112 -0.348 Tot Sector FE yes yes Period FE no yes Dw 1.680 1.606 adj R2 0.834 0.847
Sample: 1982-2003, countries: 15; t-values are based on panel corrected standard errors that are robust to hetereoscedasticity and autorcorrelation. ***, **, * denote statistical significance at the 1%, 5%, and 10% level respectively. Variable defintions: see text section 4.1 and Table A.1
42
4.4.3 Conclusion for the replication of the standard model
Our conclusion from this attempt to replicate the results of the IMF and the EC are thus
sobering. Their result that technological change is the main driver of the increase in inequality
is not reliable. The result relies on a specification that suffers from serious autocorrelation
problems and is not robust to the inclusion of time effects.16 In other words the results are not
robust and do not withstand the fixing of obvious econometric problems. In particular ICT has
no statistically significant effect once time effects are allowed for. KL has statistically
significant effects in some specifications, but not in all.17 The only variable that has a
statistically significant effect that is robust across various specifications is openness.18
Overall, the IMF’s and the EC’s strong claim that technological change is the prime cause for
the decline in the wage share is not warranted on econometric grounds.
4.5 A more general specification
This section will extend the model estimated by the IMF and the EC. This more general
model is also based on the NAIRU model (section 2.2. and 2.4, in particular Figure 3). It
differs from the IMF/EC specification in the following ways:
• The counter-cyclical properties of the wage share are well known. We thus include
GDP growth as a cyclical indicator to control for short-run fluctuations.
• Countries differ in the structure of their social security systems. In particular in
countries belonging to the so-called Ghent system workers need to be union members
in order to be eligible for unemployment benefits. Union membership in these
countries is much higher than in other countries. If union density is used as a proxy for
the bargaining power of labor, countries in the Ghent system are difficult to compare
16 As there are measurement problems with all important variables there is no a priori reason to interpret time
effects as technology shocks. 17 This differs from IMF (2007a) and EC (2007). IMF uses the labor-capital ratio and reports no consistent
effect. EC uses the capital-labor ratio and finds positive effects (on the total wage share). 18 There is, however, a serious potential reverse-causation problem involved. If a country pursues a strategy of
wage moderation to stimulate exports, such as Germany arguably has in the past decade, then this will increase
exports. This will result in an increase in openness. But in this case the direction of causation was from wage
moderation to globalization rather than the other way round.
43
to other countries. We thus use a dummy variable for the countries in this system
(Denmark, Finland, Iceland and Sweden) and interact it with union density.
• Financialization has been highlighted as an important potential cause for the change in
income distribution (see section 2.3.4). The EC/IMF specifications do not include any
financialization variables. As variables for financialization we will use financial
globalization as a broad variable measuring all foreign assets and liabilities (relative to
GDP). In addition the real interest rate will be included as a specific, domestic
measure of financialization.19 These two variables cover only some aspects of
financialization, although important ones. In particular it would be desirable to have
measures of domestic financial liberalization. The two variables chosen have the
advantage of being readily available and of having been used in the literature. Future
research should expand the measures of financialization.
• Capital accumulation will be included as a variable for animal spirits. This variable
has been used successfully in the unemployment equation that complements the
distribution equation (Arestis et al 2007, Stockhammer and Klär 2008). The problem
with including capital accumulation is that it fails to distinguish between
endogenously induced capital accumulation and accumulation driven by animal
spirits. It thus is a rather crude indicator.
• Finally we include a dummy variable for countries in which a wage pact has been
signed. This variable tries to capture the influence of governments on wage
bargaining. In many European countries wage pacts that typically include wage
restraint as a package often covering areas like tax policy or education policies have
signed between employers, unions and governments.
Additionally we will include some other control variables in some specifications to test
robustness
• To control for changes in the sectoral composition in the economy the share of
industrial employment to total employment is included. As industry typically is more
capital intensive than services (with the exception of energy and transportation), one
would expect the wage share to be inversely related with industrial employment.
19 The role of interest rates on the mark up is discussed in Hein (2008).

44
4.5.1 Variable definitions
The rate of growth of real GDP (∆y) is taken from the AMECO database. It is used as short-
run business cycle indicator.
Financial globalization (FINGLOB) will be measured by (the (logarithm of) the value of
external assets and liabilities as a ratio to GDP as suggested by Lane and Milesi-Ferretti
(2007). This variable includes external assets and liabilities. International holdings and
transactions are classified in the following broad categories: portfolio investment, subdivided
into equity securities and debt securities; foreign direct investment, which refers to equity
participations above 10%; other investment (which includes debt instruments such as loans,
deposits, and trade credits); financial derivatives; and reserve assets.
A dummy variable for wage pacts (WP) that takes the value of one in the year a wage pact is
signed. The countries and dates of the wage pacts are taken from Table 10.1 in Schulten
(2004). As the effects of a wage pact will typically materialize in the following year(s) we
expect this variable to work with a lag.
The rate of growth of the capital stock (KG) is taken from the AMECO database.
The industrial share (IND) is the ratio of industrial gross value added to total gross value
added (both at current prices), both of which have been taken from the AMECO database. The
terms of trade shocks (TOTS) is the change in the terms of trade taken from the AMECO
database.
4.5.2 Estimations with non-overlapping 5-year averages
Again, we regard the estimation with medium term data, such as non-overlapping 5-year
averages as more reliable, because the effects may take time to materialize and the assumption
of similar effects across countries is more plausible.20 The results are summarized in Table 9.
Specification 1 excludes time effects, specification 2 includes them. Specifications 3 includes
a terms of trade shock, specification 4 uses unemployment instead of capital accumulation
and specification 5 uses the unadjusted wage share rather than the adjusted one. The results
show the following pattern. As observed previously, ICT has statistically significant effects
20 This specification, however, potentially suffers from endogeneity problems.

45
Table 9. Extended wage share equation with non-overlapping 5-year averages
1 2 3 coeff t-value coeff t-value coeff t-value 39.046 0.954 40.750 0.745 48.539 0.920 ict -1.203 -2.388 *** 0.323 0.464 0.235 0.339 kl -6.707 -1.449 -5.542 -0.873 -4.417 -0.720 undens 0.200 2.032 ** 0.140 1.452 0.191 2.111 ** undens*ghent -0.379 -1.258 -0.235 -0.854 -0.326 -1.215 epl -1.647 -1.238 -2.418 -1.983 ** -1.747 -1.433 ubrr -0.025 -0.677 -0.055 -1.585 -0.047 -1.350 tw -0.033 -0.323 0.017 0.185 0.016 0.170 pmr -1.996 -3.135 *** -0.976 -1.248 -1.381 -1.797 * open -9.763 -2.387 *** -15.446 -3.578 *** -13.891 -3.267 *** kg 14.051 0.355 59.444 1.367 82.798 1.947 * finglob -2.955 -2.137 ** -2.712 -1.894 * -3.020 -2.212 ** rir 0.197 0.792 0.509 1.877 * 0.492 1.858 * tots -33.332 -2.687 *** u Sectoral FE yes yes yes Period FE no yes yes dw 1.991 0.000 2.053 0.000 2.065 0.000 adj R2 0.833 0.000 0.858 0.000 0.871 0.000 4 5 coeff t-value coeff t-value 41.799 0.773 140.157 3.319 *** ict -0.094 -0.151 0.672 1.249 kl -5.763 -0.930 8.763 1.809 * undens 0.180 1.872 * 0.185 2.447 *** undens*ghent -0.244 -0.897 -0.387 -1.835 * epl -2.563 -2.160 ** -0.551 -0.601 ubrr -0.048 -1.366 -0.027 -1.052 tw 0.049 0.501 -0.008 -0.109 pmr -1.075 -1.365 -0.075 -0.129 open -15.205 -3.471 *** -12.165 -3.707 *** kg 42.242 1.318 finglob -2.517 -1.799 * -2.255 -2.131 ** rir 0.638 2.197 ** -0.049 -0.231 tots u -0.330 -1.629 Sectoral FE yes yes Period FE yes yes dw 2.071 2.209 adj R2 0.863 0.944
Sample: 1982-2003, countries: 15; t-values are based on panel corrected standard errors that are robust to hetereoscedasticity and autorcorrelation. ***, **, * denote statistical significance at the 1%, 5%, and 10% level respectively. Variable defintions: see text section 4.1 and Table A.1 Specification (5) uses WS, the wage share, as the dependent variable all other specification use AWS, the adjusted wage share.
only if time effects are excluded. KL never has a statistically significant effect except in
specification 5, where it has a positive effect. OPEN (at the 1% level) and FINGLOB (at the

46
5% or 10% level) have statistically significant (negative) effects in all specifications.
UNDENS has statistically significant positive effects in all specifications except in
specification 2. Including union density for Ghent-countries separately surprisingly shows a
perverse effect as the coefficient estimate is larger than that of UNDENS itself. RIR has
statistically significant positive, i.e. perverse, effects in three specifications. EPL and PMR
have statistically significant (negative) effects twice.
Moving to unemployment as the dependent variable (Table 10), we find statistically
significant negative effects of KG and statistically significant positive effects of RIR (all at
the 5% level or better), and statistically significant (at the 10% level) negative effect of ICT.
Surprisingly, in the unemployment equations there is no evidence that union density has
different effects in Ghent and non-Ghent countries.
Table 10. Extended unemployment equation with non-overlapping 5-year averages
1 2 3 coeff t-value coeff t-value coeff t-value 29.096 0.989 30.434 0.754 25.789 0.668 ict -0.541 -1.857 * -0.891 -1.816 * -0.839 -1.796 * kl 3.069 0.912 2.959 0.625 2.288 0.509 undens 0.091 1.390 0.118 1.616 0.088 1.261 undens*ghent 0.055 0.294 -0.011 -0.061 0.043 0.234 epl -0.832 -1.059 -0.455 -0.550 -0.855 -1.035 ubrr 0.012 0.499 0.021 0.939 0.016 0.708 tw 0.144 2.146 ** 0.116 1.581 0.117 1.595 pmr -0.109 -0.283 -0.419 -0.742 -0.177 -0.303 open -0.866 -0.325 0.363 0.120 -0.564 -0.186 kg -120.691 -4.259 *** -134.261 -4.168 *** -148.188 -4.724 *** finglob 0.419 0.465 0.394 0.392 0.578 0.593 rir 0.506 3.043 *** 0.437 2.298 ** 0.447 2.408 *** tots 19.876 1.806 * Sectoral FE yes yes yes Period FE no yes yes dw 1.968 1.749 1.763 adj R2 0.907 0.907 0.913
Sample: 1982-2003, countries: 15; t-values are based on panel corrected standard errors that are robust to hetereoscedasticity and autorcorrelation. ***, **, * denote statistical significance at the 1%, 5%, and 10% level respectively. Variable defintions: see text section 4.1 and Table A.1

47
4.5.3 Estimation with annual data
As in previous results, specifications in levels form suffer from serious autocorrelation
problems (DW 0.56), thus Table 11 only reports specifications with the first difference
estimator (again sectoral FE are excluded such that results are comparable to a standard FE-
specification in levels). Time effects have been included based on redundant FE tests.
Specifications 1 and 2 include the explanatory variables in lagged and in contemporaneous
values respectively. To avoid endogeneity problems we prefer lagged values (specification 1)
which will also form the basis of our robustness analysis. All the following robustness tests
are based on the lagged explanatory values to avoid endogeneity problems. The results are
broadly similar. GDP-growth has statistically significant (negative) effects in all
specifications. Union density in non-Ghent countries has statistically significant positive
effects (at the 1% level) in all specifications. OPEN has statistically significant (negative)
effects at the 1% level in all specifications except for specification 4. RIR has a statistically
significant negative effect in all specifications, except specification 2 where it has statistically
significant positive effects. FINGLOB consistently has a negative sign, but is only statistically
significant in specification 6. WP, which is included with two lags, has a negative effect that
is statistically significant (at the 5% level) in all specifications except specification 2. A wage
pact seems to reduce the wage share by almost half a percentage point two years later. Other
variables are not statistically significant. Only for openness and union density (in non-Ghent
countries) are the results robust with regards to contemporaneous or lagged variables.

48
Table 11. Extended wage share equation with annual data
1 2 (variables contemporaneous) 3
coeff t-value coeff t-value coeff t-value ∆∆ y -28.842 -6.842 *** -30.416 -7.203 *** -28.9544 -9.795 *** ∆ ict -0.148 -0.189 -0.395 -0.549 -0.4215 -0.309 ∆ kl -5.032 -1.075 -9.396 -2.114 ** -0.0049 -1.432 ∆ undens*(1-Ghent) 0.166 2.649 *** 0.201 3.253 *** 0.1251 2.413 *** ∆ epl 0.426 1.086 -0.074 -0.191 0.4836 0.555 ∆ ubrr 0.005 0.254 0.014 0.723 0.0066 0.332 ∆ tw 0.006 0.164 0.017 0.51 0.0036 0.208 ∆ pmr -0.176 -0.582 -0.013 -0.046 -0.0914 -0.874 ∆ open -5.464 -3.014 *** -5.025 -2.773 *** -4.8274 -4.271 *** ∆ finglob -1.006 -1.435 -0.555 -0.843 -0.9771 0.619 ∆ rir -0.1 -2.437 *** 0.151 3.625 *** -0.1015 -3.359 *** WP -0.465 -2.225 ** -0.102 -0.503 -0.4747 -2.591 *** ∆ kg -6.607 -0.33 -25.577 -1.262 -1.875 0.157 Sectoral FE no no no Period FE yes yes no dw 1.683 0 1.708 1.803 0 adj R2 0.387 0 0.409 0.4045 0 4 5 6 (WS as dep var) coeff t-value coeff t-value coeff t-value ∆∆ y -30.671 -7.023 *** -29.688 -6.975 *** -23.91 -6.628 *** ∆ ict 0.001 0.001 -0.161 -0.206 -0.146 -0.215 ∆ kl -4.764 -1.005 -5.954 -1.272 -4.536 -1.155 ∆ undens*(1-Ghent) 0.195 3.07 *** 0.152 2.408 *** 0.145 2.762 *** ∆ epl 0.51 1.304 0.396 1.012 0.29 0.849 ∆ ubrr -0.001 -0.071 0.004 0.238 0 -0.002 ∆ tw 0.019 0.536 0.008 0.225 0.013 0.422 ∆ pmr -0.108 -0.359 -0.179 -0.594 0.068 0.267 ∆ open -3.304 -1.598 -5.297 -2.903 *** -3.69 -2.351 *** ∆ finglob -0.864 -1.23 -0.924 -1.318 -1.05 -1.76 * ∆ rir -0.093 -2.15 ** -0.088 -2.128 ** -0.087 -2.448 *** WP -0.451 -2.053 ** -0.444 -2.124 ** -0.363 -1.998 ** ∆ kg 3.098 0.151 -11.798 -0.582 -1.925 -0.116 ∆ ind -27.103 -2.501 *** ∆ tots 3.82 1.831 * Sectoral FE no no no Period FE yes yes yes dw 1.653 1.639 1.75 adj R2 0.396 0.393 0.382
Sample: 1982-2003, countries: 15; t-values are based on panel corrected standard errors that are robust to hetereoscedasticity and autorcorrelation. ***, **, * denote statistical significance at the 1%, 5%, and 10% level respectively. Variable defintions: see text section 4.1 and Table A.1 Specification 2 is with contemporaneous explanatory variables, all other specifications with lagged explanatory variables. Specification (6) uses WS, the wage share, as the dependent variable all other specification use AWS, the adjusted wage share.

49
4.6 Economic significance: contributions to the change in the wage
share
To evaluate the economic effect, we calculate the contributions of the estimated effects of the
variables to the change in the dependent variable between the early 1980s (the 5-year average
1981-85) and the early 2000s (the 5-year average 2001-2005).21 The calculation of the
contributions thus roughly corresponds to those presented as Figure 5.12 of IMF (2007a) and
Chart 15 of EC (2007).22 All these calculations refer to a hypothetical average country, i.e. the
respective mean across countries in our sample. The contributions are summarized in Figure
6.
Figure 6. Contributions of explanatory variables to the change in the adjusted wage
share 1983-2003
Contributions of variables to the change in the adjusted wage share 1981/85 - 2001/05
-5,0
-4,0
-3,0
-2,0
-1,0
0,0
1,0
2,0
3,0
ict kl undens epl ubrr tw pmr open finglob rir wp kg
5YR-FEA-FD
21 Note that the calculation is performed irrespective of whether the coefficient in question is statistically
significant or not. See McCloskey and Ziliak (1996) and Ziliak and McCloskey (2004) for a discussion of
statistical and economic significance. 22 The only difference is that rather than comparing two years (e.g. 1982 and 2002), we use moving averages
around these years to smooth fluctuations due to the business cycle.
50
The contributions are calculated based on two specifications: the basic fixed effects
specification with non-overlapping 5-year data (5YR-FE, specification 2 in Table 9) and the
basic first-difference specification with (lagged) annual data (A-FD, specification 1 in Table
11). There are substantial differences according to the two specifications. We regard the
estimation based on 5-year averages as the most reliable and present the other for robustness.
Financial globalization emerges as the single most important variable by a substantial margin
in the preferred specification. According to our calculation, financial globalization contributed
to a decline of the wage share by 4.2%-points. Openness contributed around 2%-pts., the
capital-labor ratio and (non-Ghent) union density both contributed somewhat less than 2%pts.
In the difference specification the capital labor ratio, (non-Ghent) union density, and financial
globalization have substantial contributions to the change in distribution (ranging from -1.5 to
-2), whereas the contribution of openness is somewhat below 1. All other variables are
extremely sensitive to the specification.
Notably, statistical significance and economic significance do not coincide. Only openness
and union density in non-Ghent countries have had rather consistently statistically significant
effects. Financial globalization has had statistically significant effects only with 5-year
averages. In this specification it has an economically large effect. In first difference
estimations with annual data, however, its effect is much more modest. The capital-labor ratio
only occasionally has statistically significant effects. However, its economic contribution (just
below 2%-points) is substantial and surprisingly consistent in the two specifications. The
calculations, however, do confirm that ICT-services play little, if any, role in explaining the
change in the wage share. Its effects are neither statistically significant nor do the coefficient
estimates imply large effects.
Overall this suggests that the results are not very robust and have to be interpreted with
caution.
4.7 Limitations of the present study and open questions
The extended model presented in section 4.4 is an important improvement over the standard
version of the reduced-form distribution equation. However it remains preliminary in several
respects that should be addressed in future research.

51
Firstly, the present study has focused on the robustness of results. While we have addressed
some of the econometric problems of previous studies, it is fair to say, that not all have been
solved satisfactorily. For example our preferred estimator based on non-overlapping 5-year
averages may suffer from endogeneity problems. The underlying problems are rather basic
problems of panel analysis: while it is doubtful whether the pooling restrictions do hold, the
number and quality of the variables involved require panel analysis.
Secondly, the measure for financial globalization remains rather broad. This is at the same
time an asset and a liability. Being a broad measure it serves well in the context of the
explorative investigation performed here. Presumably, different aspects of financial
globalization will have different effects. Moreover, ‘domestic’ financialization has not been
properly included. Having more differentiated measures for globalization would also allow to
better identify the channels through which financialization affects functional income
distribution.
Thirdly, on a more conceptual level, our results pose some puzzles for the NAIRU theory.
The NAIRU theory predicts that the same set of variables should influence equilibrium
unemployment and equilibrium income distribution (see section 2.2). Our results fail to
support this assertion. While (non-Ghent) union density, openness and financial globalization
are the most important determinants of income distribution, unemployment seems to be
determined by capital accumulation and interest rates.

52
5 Conclusion / summary
Functional income distribution has changed substantially in the course of the last three
decades. Wage shares have declined in all OECD countries. In the Euro area the decline in the
adjusted wage share has been 10%-pts since 1981.
The IMF and the EC have recently published studies that investigate the causes of this
decline. Both concur that technological change has been the most important factor
contributing to the decline in wage shares and that globalization has also contributed to the
decline, though to a lesser extent. Both see some minor contributions by labor market
institutions.
The aim of this study has been to replicate, investigate the robustness and extend the work of
the IMF and the EC. To this end a wide set of possible specifications including estimations in
levels, differences and five-year averages have been performed.
We have found serious problems with the studies of the IMF and the EC. The regression
results which their conclusions are based on suffer from econometric problems, in particular
high autocorrelation in the residuals which leads to a bias in the results. The findings on the
role of ICT critically depend on the exclusion of time effects, which ought to be included
based on standard statistical tests. Fixing these econometric problems, i.e. estimating
IMF/EC-type specifications in difference form or in non-overlapping 5-year average, leads to
different results. Globalization (measured as openness) emerges as the only variable that has a
robust effect among the variables considered by the IMF and EC.
The results of the IMF and the EC can therefore not be regarded as reliable. In particular the
claim that technological change has had a strong (and statistically reliable) effect independent
of time effects is incorrect.
The study has also extended the analysis. Most importantly we have included a variable
measuring financial globalization and allowing for different effects of union density in
countries of the Ghent system, where union membership is a prerequisite for receiving
unemployment benefits.

53
We find that openness (globalization) and union density rather consistently have statistically
significant effects. Globalization has a negative effect and union density a positive effect. We
also find some (but not consistent) evidence that wage pacts, real interest rates and financial
globalization have negative effects on the wage share. In terms of economic contributions (in
a hypothetical average country) financial globalization has had strong effects, capital
deepening, union density and openness have also had substantial effects.
Overall our findings support the view that income distribution has changed due to
globalization in production and finance, changes in the bargaining power between capital and
labor rather than through technological change.
54
6 References
Arellano, M, Bond, S, 1991. Some tests of specification for panel data: Monte Carlo evidence and an application to employment equations. Review of Economic Studies 58: 277–297.
Arestis, P, Baddeley, M, Sawyer, M, 2007. The relationship between capital stock, unemployment and wages in nine EMU countries. Bulletin of Economic Research 59, (2): 125-148
Atkinson, A, Piketty, T, (eds) 2007. Top Incomes Over the Twentieth Century: A Contrast Between European and English-Speaking Countries. Oxford: Oxford University Press
Azmat, G, Manning, A, Van Reenen, J, 2007. Privatization, entry regulation and the decline of labour's share of GDP: A cross-country analysis of the network industries. CEPR Discussion Paper No. DP6348
Blundell, R., Bond, S., 1998. Initial conditions and moment restrictions in dynamic panel data models. Journal of Econometrics 87, 115–143.
Bentolila, S., Saint-Paul, G., 2003, Explaining movements in the labor share, Contribution to Macroeconomics, Vol. 3, Issue 1 (Berkeley, California Berkeley Press).
Colander, D, Holt, R, Rosser, B, 2006. The changing face of mainstream economics – Conversations with cutting edge economists. University of Michigan Press. Michigan.
Colander, D, 2000. Death of Neoclassical Econonomics. Journal of the History of Economic Thought 22 (2), 127-43
Duménil, G, Lévy, D, 2001. Costs and benefits of Neoliberalism: a class analysis. Review of International Political Economy 8 (4), 578-607
Duménil, G, Lévy, D, 2004. Capital Resurgent. Roots of the Neoliberal Revolution. Cambridge, MA: Harvard University Press
Ellis, L, Smith, K, 2007. The global upward trend in the profit share. BIS Working Paper No. 231
Epstein, G, Burke, S, 2001 Threat effects and the internationalization of production. Political Economy Research Institute Working Papers 15
Epstein, G, Jayadev, A, 2005. The rise of rentier incomes in OECD countries: financialization, Central Bank policy and labor solidarity In: G. Epstein (ed): Financialization and the World Economy. Cheltenham: Edward Elgar
European Commission 2007. The labour income share in the European Union. Chapter 5 of: Employment in Europe
Friedman, M, 1977. Inflation and unemployment. Journal of Political Economy 85 (3): 451-472
Golden, M, Wallerstein, M, 2006. Domestic and international causes for the rise of pay inequality: post-industrialism, globalization and labor market institutions. Draft http://www.international.ucla.edu/media/files/golden_wallerstein.pdf
Guscina, A, 2006. Effects of globalization on labor’s share in national income. IMF Working Paper 06/294
Harrison, A, 2002. Has globalization eroded labor’s share? Some cross-country evidence, Mimeo, UC Berkeley.
Hein, E, 2008. Money Distribution Conflict and Capital Accumulation. Contributions to ‘Monetary Analysis’. Palgrave Macmillan
ILO, 2008. World of Work Report 2008. Income inequalities in the age of financial globalization. Geneva: ILO
IMF, 2007a. The globalization of labor. Chapter 5 of World Economics Outlook April 2007. Washington: IMF
55
IMF, 2007b. Globalization and inequality. Chapter 4 of World Economic Outlook, Oct 2007 Jaumotte, F.; Tytell, I. 2007. How has the globalization of labour aff ected the labour income
share in advanced countries?, IMF Working Paper No. 298 (IMF, Washington, DC). Jayadev, A, 2007. Capital account openness and the labour share of inomce. Cambridge
Journal of Economics 31, 423-443 Kaldor, N, 1956. Alternative Theories of Distribution. Review of Economic Studies 23 (2):
83-100 Kalecki, M, 1954. Theory of Economic Dynamics. Reprinted in J. Osiatynski (ed): Collected
Works of Michal Kalecki, Vol. 1, Oxford: Clarendon Press Keynes, J, 1937. The General Theory of Employment. Quarterly Journal of Economics 41 (2):
209-223 Keynes, J, 1973. The General Theory of Employment, Interest and Money. The collected
writings of John Maynard Keynes volume VII. Cambridge: Macmillan Krueger, A, 1999. Measuring labor´s share. American Economic Review 89 (2): 45-51. Lane, P, Milesi-Ferretti, 2007. The external wealth of nations mark II: Revised and extended
estimates of foreign assets and liabilities. Journal of International Economics 73: 23-250.
Lane, P, Milesi-Ferretti, G, 2006, “The external wealth of nations mark II: Revised and extended estimates of foreign assets and liabilities, 1970–2004,” IMF Working Paper 06/69
Lawson, T, 1985. Uncertainty and economic analysis. Economic Journal 95, 1: 909-927. Lazonick, W, O'Sullivan, M, 2000) Maximising shareholder value: a new ideology for
corporate governance. Economy and Society 29 (1): 13-35 Marglin, S, 1984. Growth, Distribution, and Prices. Cambridge, Mass: Harvard University
Press McCloskey, D, Ziliak, S, 1996. The standard error of regressions. Journal of Economic
Literature 34 (1): 97-114 Nunziata, L, 2005. Institutions and wage determination: a multi-country approach. Oxford
Bulletin of Economics and Statistics 67 (4): 435-466 OECD 2008. Growing unequal? Income distribution and poverty in OECD countries. Paris:
OECD OECD 2007. OECD workers in the global economy: increasingly vulnerable? Chapter 3 of
OECD Employment Outlook 2007. Paris: OECD Onaran, Özlem, 2008. The effect of import penetration on labor market outcomes in Austrian
manufacturing industry. Vienna University of Economics and Business, Economics Department Working Paper 119
Piketty, T, Saez, E, 2003. Income inequality in the United States, 1913-1998. Quarterly Journal of Economics, 118 (1): 1-39
Piketty, T, Saez, E, 2007. Income inequality in the United States, 1913-1998. In: A.B. Atkinson and T. Piketty (eds.): Top Incomes in a Global Perspective, Oxford University Press
Power, D, Epstein, G, Abrena, M, 2003. Individual country Technical notes for: Trends in the rentier income share in OECD countries 1960-2000. PERI Working Paper 58b
Power, D, Epstein, G, Abrena, M, 2003. Trends in the rentier income share in OECD countries 1960-2000. PERI Working Paper 58a
Rodrik, D, 1997. Has Globalization Gone Too Far? Washington: Institute of International Economics
Rodrik, D, 1998. Capital mobility and labor. Manuscript. http://ksghome.harvard.edu/~drodrik/capitalm.pdf

56
Rossman, P, 2009. Financialization and casualization of labour – building a trade union and regulatory response. Paper presented at the Global Labour University Conference, Feb. 2009, Mumbai
Rowthorn, R, 1999a. Unemployment, wage bargaining and capital-labour substitution. Cambridge Journal of Economics 23: 413-425
Rowthorn, R, 1999b. Unemployment, Capital-Labor Substitution, and Economic Growth. IMF Working Paper 99/43
Stockhammer E, 2004. Financialization and the slowdown of accumulation. Cambridge Journal of Economics. 28 (5): 719-41
Stockhammer, E, Klär, E, 2008. Capital accumulation and unemployment in the medium run. DIW discussion paper 834
Stockhammer, E, Onaran, Ö and Ederer, S. 2009. Functional income distribution and aggregate demand in the Euro area. Cambridge Journal of Economics 33 (1): 139-159
Stockhammer, E., Ramskogler, P., 2009. Post Keynesian economics - how to move forward. Intervention forthcoming
Stockhammer, E, 2008. Is the NAIRU theory a Monetarist, New Keynesian, Post Keynesian or Marxist theory? Metroeconomica 59 (4): 479-510
Stolper, W, Samuelson, P, 1941. Protection and real wages, Review of Economic Studies, Vol. 9, 58–73.
Wolff, E, Zacharias, A, 2007. Class structure and economic inequality. Levy Economics Institute Working Paper No. 487
Wooldridge, J, 2002. Econometric Analysis of Cross Section and Panel Data. Cambridge, Mass: MIT Press
Ziliak, S, McCloskey, D, 2004. Size matters: the standard error of regressions in the American Economic Review. Econ Journal Watch 1 (2): 331-358

57
7 Appendix
Table A1. Variable definitions
Variable Definition Source Notes (abbreviation in the data source and comments)
AWS Adjuested wage share
AMECO ALCD2
WS Wage share AMECO UWCD/(UWCD+UOGD) u Unemployment rate AMECO ∆y Real GDP (dlog) AMECO OVGD ICT ICT services KLEMS CAPIT_QI KL Capital-labor ratio AMECO, OECD
Economic Outlook dataset
Net capital stock at constant prices, total economy (OKND, AMECO)/total employment (OECD) undens UD Union density BD 1982-03 In some specifications interacted with Ghent-System dummy variable
EPL Employment protection legislation
BD 1982-03 epl
UBRR Unemployment benefit replacement ratio
BD 1982-03 rr1
TW Tax wedge BD 1982-03 twcoup WP Wage pact dummy Schulten 2004 PMR Product market
regulation in network industires
BD 1982-03 regref
OPEN imports plus exports divided by GDP
AMECO
FINGLOB Financial globalization
Lane and Milesi-Ferretti 2007
foreign assets and liabilities as a ratio to GDP
RIR Real interest rate AMECO Long-term interest rate deflated by the GDP deflator
KG Growth of capital stock
AMECO
TOT Terms of trade AMECO APGS IND Industrial share AMECO industrial gross value added at
current prices (UVG2) / total gross value added at current prices(UVG0)

Publisher: Hans-Böckler-Stiftung, Hans-Böckler-Str. 39, 40476 Düsseldorf, Germany Phone: +49-211-7778-331, [email protected], http://www.imk-boeckler.de IMK Studies is an online publication series available at: http://www.boeckler.de/cps/rde/xchg/hbs/hs.xls/31939.html ISSN: 1861-2180 The views expressed in this paper do not necessarily reflect those of the IMK or the Hans-Böckler-Foundation. All rights reserved. Reproduction for educational and non-commercial purposes is permitted provided that the source is acknowledged.
Related Documents