8 ISER Working Paper Series Wage Mobility In Times Of Higher Earnings Disparities: Is It Easier To Climb The Ladder? Iga Magda Warsaw School of Economics and Ministry of Labour and Social Policy, Poland No. 2008-10 March 2008 www.iser.essex.ac.uk

Welcome message from author
This document is posted to help you gain knowledge. Please leave a comment to let me know what you think about it! Share it to your friends and learn new things together.
Transcript

8
ISER W
orking Paper S
eries
Wage Mobility In Times Of Higher Earnings Disparities: Is It Easier To Climb The Ladder?
Iga Magda
Warsaw School of Economics and Ministry of Labour and Social Policy, Poland
No. 2008-10 March 2008
ww
w.iser.essex.ac.uk

Non-technical summary
A worker may see his earnings rise, though that can result in di¤erent
outcomes in terms of his or her relative position among other employees which
may improve, worsen or remain unchanged. The main aim of this paper is
to analyze what chances individuals have of changing their status within the
wage hierarchy, how do these chances vary over time, across countries and
among di¤erent workers.
I study the evolution of Polish workers�individual earnings over time in
the 1995 -2006 period. I �nd that they are less likely to change their relative
position (compared to the other workers�wages) than they were in the mid
nineties, though these chances have been increasing back in the last few years.
Men in Poland are more likely to improve their rank in the wage hierarchy
than women, though a decade ago women were better o¤ in this respect.
For comparison I analyze the UK case, �nding that although workers in
the two countries have similar chances of changing their relative earnings
position, di¤erences in such mobility patterns stand out. British employees
are much less likely to move down in the wage rankings whereas Polish work-
ers have higher probability of large changes in their position in the earning
ladder.
The analysis shows also that the low wage workers have rather high
chances of improving their relative position among other employees. They
are however (particularly in Poland) more likely to exit employment, and the
majority of those entering the labour market take up low paid jobs.
Finally, the study demonstrates that in Poland the changes in the proba-
bility of moving up or down in the earnings ranking do not seem to be linked
to the evolution in the overall wage dispersion.

Wage mobility in times of higher earnings disparities:
is it easier to climb the ladder? �
Iga Magda y
March 12, 2008
Abstract
In this paper I study the earnings mobility in Poland and in the UK. Using both
transition matrices and a wage mobility index I �rst document changes in the overall
wage mobility in Poland across time, then compare mobility patterns among Polish
and British employees. I focus in particular on low wage workers and analyze their
transitions within the earnings distribution and between di¤erent labour market
states. Finally, I demonstrate that changes in the earnings mobility in Poland do
not seem to be linked to changes in the overall wage dispersion.
KEYWORDS : wage, earnings mobility, wage dispersion, wage dispersion
�This paper is based on work carried out during a visit to the European Center for Analysis in the
Social Sciences (ECASS) at the Institute for Social and Economic Research, University of Essex supported
by the Access to Research Infrastructures action under the EU Improving Human Potential Programme. I
would also like to thank the British Household Panel Survey principal investigator, the ISER �Colchester
for allowing the access to the data.yCorrespondence to: Iga Magda, Warsaw School of Economics and Ministry of Labour and Social
Policy, Poland ([email protected])

1 Introduction
The last years saw a considerable rise in cross sectional wage inequalities in Poland, yet
it is not known if and how has it changed the individuals earnings mobility. Changes
in the cross sectional earnings disparities may �but do not have to � imply changing
mobility patterns. Burkhauser et. al (1997) notice that the observed changes in the cross-
sectional distribution may be the consequence of changes in the relative labour earnings of
workers, or in the pattern of earnings mobility for workers, or some combination of both.
If the rise in Polish wage inequality, presented in section 3, has come from increased
transitory �uctuations in earnings whereas the individuals face higher wage mobility,
the consequences and implications for social and labour market policy are of a lesser
importance. If however the wage mobility remained the same or decreased consequences
are more serious since lifetme earnings become more unevenly distributed as well.
The question of how much mobility there is in the wage distribution in Poland has
not been researched so far. One of the reasons for that is the scarcity of data availability,
especially panel survey of individuals, which would include labour income data.
In this paper I study wage mobility of Polish workers. Constructing transition matrices
and a wage mobility index I analyze what is the degree of movements across the wage
distribution and how has it changed over the last ten years. I study also the level and
changes in earnings mobility among the UK employees, which allows for a better judgment
whether the degree of earnings transitions in Poland is in fact high or low. I analyze which
groups of workers �from the bottom, middle or upper part of the distribution are the most
mobile. I also try to determine whether changes in the wage inequalities over the past
ten years had an impact on wage mobility. This paper compares also the measurement of
wage mobility in Poland using two available data sources on labour income: the Household
Budget Survey and the Labour Force Survey.
Section 2 describes the data used for the analysis. Section 3 presents changes in the
earnings inequalities in Poland since mid nineties. In section 4, wage mobility of Polish
employees is analyzed whereas section 5 compares these results to the UK case. Section
6 presents the changes in earnings mobility in the light of increasing wage disparities.
Section 7 concludes, summarizing the research results.
1

2 Data description
The availability of data which allow the analysis of earnings mobility in Poland is rather
scarce. The data used in this paper come from two sources: Polish Household Budget
Survey (PHBS) and Polish Labour Force Survey (PLFS). Each of them has its advan-
tages and drawbacks, therefore I use the two to provide comparisons and complementary
information.
The PHBS is conducted yearly on a sample of approximately 33 thousand households,
whereas the PLFS surveys approximately 45 thousand individuals quarterly. In both
surveys the individuals can be observed only for two consecutive years1. PHBS seems to
be a more accurate source of information on wage data than LFS. In particular, the wage
reporting rates for employees in the PHBS are much higher (in 2005: 98 per cent vs. 66
per cent in PLFS). The respondents in PLFS also tend to round up data (as a result,
there are high peaks of responses at round numbers, such as 1000 PLN). Furthermore, in
the PLFS the higher earnings are underreported: the reporting rate for employees with
higher education is lower than for these with lower levels of education by a few percentage
points, which leads to lower levels of average wage. As a result the average PLFS wage
amounts to 75 per cent of average wage in the economy (net terms), whereas the PHBS �
for 86 per cent. Also the earnings distribution is a¤ected, as the PLFS is biased towards
lower earnings, its median to average ratio is 0.86, whereas it�s 0.82 in PHBS and 0.81 in
the Structure of Earnings Survey2. To conclude, the PHBS data is likely to better re�ect
the degree of wage mobility in Poland. However, since I have longer data series only for
the PLFS, this data will be used to analyse changes in the earnings mobility across time
whereas the PHBS will provide a comparison for the potential level of wage mobility in a
point in time.
One has to keep in mind that there are statistical factors which might impact the
analysis of changes in wage mobility across time using PLFS. One of them is the panel
attrition rate. The percentage of individuals dropping out of the panel has increased over
time, from less than 7 per cent in 1995/96 to around 19 per cent in 2005. It is hard to
determine to what extent the rising drop out rates might change the earnings transitions.
However, one can not notice any tendency for lower or higher wage workers to drop out
1Due to changes in methodology in the PLFS in 1999 and a lack of two waves of the survey, it is
impossible to construct the 1998/99 panel and the 1999/2000 is limited in size.2The Structure of Earnings Survey is a survey of full time employees conducted every two years (in
particular: 1996, 1998, 1999, 2001, 2002, 2004, 2006) by the Polish Central Statistical O¢ ce. It is
representative for ca. 6 �7 million of employees.
2

more often. The average wages for full time employees who remain in the sample are the
same as of those dropping out in 1995/96, slightly higher in 2000/01 and lower in 2004/05.
Therefore one might expect the changes in the attrition rates do not change the mobility
results in a consistent way. The other factor which might impact the analysis of earnings
transitions with PLFS data are the response rates, i.e. percentages of employees reporting
their wages. These have fallen considerably across the time, from over 95 per cent in 1995
to 65 per cent in 2006. This drop in response rate has been much higher among the better
educated earners3 , hence one expects that high wage earners underreport wages more
often, which may lead to underestimating the degree of earnings mobility over the years.
I use the 2004-2005 PHBS and 1995-2007 PLFS datasets. The wage variables are the
monthly earnings net of deductions (social contributions and tax). As in the PHBS data
there is no information on hours worked (and the information available in PLFS may pose
di¢ culties to derive reliable hourly earnings), I use monthly wages of full time workers
only. I restrict my sample further, by focusing on employees (as labour income data for
employers, self employed and helping family members is available in PHBS only). The
restricted PHBS sample provides a better picture of reality, as the reporting rates for
workers other than employees are very low (below 10 per cent for self employed and for
employers compared to more than 95 per cent for employees). For the �nal analysis of the
earnings mobility I exclude all people aged less than 25 (since I want to focus on these
who have left full time education) and more than 59. In the �rst part of the analysis,
transitions out and to employment are taken into account, hence the sample includes also
the unemployed and the inactive, as well as �ows to �missing wage (i.e. being a full time
employee who does not report its wage) and �other employment status�(i.e. part time
employee, self employed, employer, helping family member).
Finally, section 4 focuses on comparing the earnings mobility of Polish workers with
the case of UK . I use the British Household Panel Survey (BHPS) dataset (waves 2-
14, i.e. data for years 1991 -2004). The BHPS is a longitudinal panel data set including
information on approximately 5500 (wave 1) to more than 10 000 households (from 2001),
i.e. 10 �17 thousand individuals. Its missing wage data is imputed and it seems to re�ect
the overall economy wages rather well4 . For a more detailed description of the BHPS,
see for example Lynn et al. (2006).
3Between 1995 and 2005, the percentage of wage reporters among full time employees with tertiary
education fell from 92 per cent by 35 p.p., whereas among the employees with at the most basic vocational
education from 97 per cent by 25 p.p.4For example, the average gross wage for FT employee in BHPS m wave was more than 96% of average
wage in 2003 according to ASHE data.
3

All the analyses are carried out separately for men and women, so as to take into
account di¤erences in their employment patterns.
3 Earnings inequalities in Poland - trends and pat-
terns
Wage inequalities have been rising in Poland in almost the whole of the post transforma-
tion period (cf. MPiPS 2008). In 1996 the earnings in the ninth decile were 3.46 times
higher than those in the �rst decile, by 2006 this gap has risen to 4.31 (cf. Figure 1). The
rise in wage disparities was particularly sharp between 2001 and 2002. In mid nineties
the inequalities in the lower part of the distribution were much lower than in the upper
one, by 2006 this gap became much smaller due to a higher rise in inequalities among the
workers earning less than the median wage.
Figure 1: Wage inequalities in Poland, 1996 - 2006
1.6
1.7
1.8
1.9
2
2.1
2.2
1996 1997 1998 1999 2000 2001 2002 2003 2004 2005 20063
3.2
3.4
3.6
3.8
4
4.2
4.4
D5/D1
D9/D5
D9/D1 (right axis)
Own calculations based on the Structure of Earnings Survey data.
D1, D5, D5 – respective deciles in the earnings distribution.
The earning disparities in Poland are among the highest in Europe. According to
the European Commision (2005) data, out of the EU countries only Estonia, Latvia and
Romania ranked higher in terms of the D9/D1 ratio.
4

4 Wage mobility in Poland
4.1 The degree of wage mobility
One of the possible ways of looking at the earnings mobility are the transition matrices,
which present �ows between deciles in the earnings distribution and/or into and out of
employment. Tables A1(a), A.1(b) and A.1(c) in the Apendix present transitions for all
employees, male and female ones respectively. The picture that emerges shows a quite
high degree of mobility within the earnings distribution. The percentage of employees
staying over year in the same decile is actually lower than the percentage of employees
moving across the distribution, either upwards or downwards.
Only about thirty per cent of employees remain in the same decile one year later,
although it is certainly subjective to decide if it is a lot or not. At the same time there
are di¤erences in the lower and upper part of the wage distribution. Those at the bottom
end are more likely to escape their deciles; though it is due not only to higher earnings
mobility since many of these escapes result from exiting the employment at all. Still, for
the lowest earners about 40 per cent move up in the distribution and more than a half
of them move above one decile up. A few percent (7.8 in case of men in the 2nd decile)
make it beyond the median earnings.
Employees from the middle of the distribution are most likely to change their positions
in the decile distribution, both upwards and downwards. They are more likely to move
up one or more decile than to remain in the same one next year. The percentages of
employees moving up from the top of the distribution are lower, but this is most probably
an artefact, as the deciles in the upper part are much wider than in the bottom of the
distribution.
What is interesting, there is also a quite substantial degree of downwards earnings
mobility. For most of the wage distribution, employees are as much likely to move one
decile up, as to go one decile down. The shares of workers moving down more than one
decile are also quite signi�cant, above 10 per cent in the middle of the distribution.
One would expect di¤erences in the earnings transitions of male and female workers,
due to their di¤erent career paths and employment patterns. Indeed, the degree of per-
sistence in particular deciles is higher for women. Men are also more likely than women
to move upwards for each of the deciles and the downward transitions take place more
often among female workers.
5

There is substantial immobility within unemployment and inactivity, which can be
explained by a relatively di¢ cult labour market situation in Poland in this period of time
and the structural character of the unemployment (cf. MGiP 2005). It is interesting how-
ever, that the employees from the bottom deciles are much more likely to exit employment
(16 per cent from 1st decile and 10 per cent from the 2nd, compared to less than 3 per
cent for the highest two deciles). Male workers move mostly to unemployment, whereas
female have a relatively high share of withdrawal from the labour market. At the same
time, those who enter employment are much more likely to take up lower paid jobs (more
than 50 per cent enter the lowest two deciles, compared to only 17 per cent earning above
median).
The above analysis is based on the PHBS data. Table A.2 (a) and A.2 (b) in the
Appendix present a summary of analogical results based on the PLFS data. As mentioned
in the section 2, the latter tend to underestimate the degree of wage mobility, due to the
nature of wage responses. It does however con�rm the basic regularities observed in the
PHBS: the lower earnings mobility of women, higher persistence in the upper deciles, large
out�ows out of employment occurring mostly in the lowest deciles (to unemployment in
case of men and inactivity for women) and high in�ow of those entering employment to
the bottom of the distribution. The PLFS will be used in the next section for analyzing
changes in the wage mobility.
This analysis focuses only on yearly transitions due to data restrictions. However,
mobility seems likely to rise the longer the time period taken into account (Buchinsky and
Hunt, 1996). Dickens (2000) provides evidence that mobility over a three year period is
slightly higher than yearly transitions, although the degree of immobility is still signi�cant.
Cardoso (2005) obtained similar results.
4.2 Changes in the wage mobility over time
As pointed out above, determining whether a particular percentage of employees moving
up or down the wage distribution means a high or low level of mobility is a subjective
matter. Therefore it might be more interesting to compare the level of earnings mobility
with other countries (which will be presented in the next section) and its changes across
the time.
Since the earnings structure in Poland has been changing thoroughly since the transi-
tion, resulting in rising wage inequalities, one might expect also changes in the mobility
within the wage distribution. The Figure 2 presents a comparison of transition rates across
6

the wage distribution over time for three periods: 1995/1996, 2000/2001 and 2004/2005
for male employees (LFS data). The tables presenting transitions for females are included
in the Appendix (A.2 (a), A.2(b)). It is evident that thus measured earnings mobility
has decreased over time. The proportion of workers remaining in the same decile has
risen considerably. The increases have been more pronounced in the upper half of the
distribution. The percentage of one decile transitions has decreased and also these falls
were higher among the higher wage earners.
Figure 2: Earnings transitions: 1995/1996, 2000/2001 and 2004/2005, male employees
0.00
0.10
0.20
0.30
0.40
0.50
0.60
0.70
0.80
0.90
1 24 5 68 9 1 24 5 68 9
% staying in the same dec % moving one decdeciles
% o
f em
ploy
ees
95/96 00/01 04/05
Own calculations, based on LFS data.
Women have lower earnings mobility than men, as presented in the previous part.
PLFS data shows however this has changed across the past ten years, since in the mid
nineties the female earnings mobility relative to the men was much higher. Yet, in general
the trends in transitions across the wage distribution follow the men�s ones. The wage
mobility of female workers has declined over years, particularly in the upper part of the
distribution.
To sum up, the analysis of the decile transitions across the wage distribution points
to a relatively high wage mobility. At the same time the degree of mobility has fallen and
fewer individuals change the deciles in the distribution nowadays than 10 years ago. As
Dickens (2000) points out, analysing wage mobility with transition matrices may bring
7

uncertain results, since it does not account for mobility within the distribution and the
widening of the deciles with rising wage inequalities (which means that the individual�s
earnings must grow or drop more for him/her to leave a particular decile). Since the
earnings inequalities rose substantially in Poland within the period of analysis the results
I obtained may be misleading. Hence I will look at other potential measures of wage
mobility.
4.3 Mobility index
I will compute another mobility estimate, following Dickens (2000). As a pure mobility
measure, he suggests one based on the actual ranking of individuals in the wage distrib-
ution in each year and analysis of the degree of year - to - year movement . However,
one must take into account that only individuals who are present in the wage distribution
in two consecutive years are considered, thus there are potential biases arising from the
exclusion of workers dropping out of employment.
The scatterplots presented below show the earnings ranking of employees in two con-
secutive years, for two periods: 1995/1996 and 2005/2006, separately for men and women.
Each dot represents an individual and his position in the earnings ranking in 1995 and
1996 (2005/2006 respectively). The observations in the 2005/2006 graph tend to con-
centrate along the 45 degree line whereas the 1995/1996 ones are much more dispersed,
which con�rms that earnings mobility has fallen over time, as noted above.5 In 1995/96
women tended to move across the wage distribution slightly more, whereas in 2005/06
their earnings seem to be more concentrated than men�s.
5The number of observations in 2005/06 is about 30 per cent lower than in 1995/96, though the drop
in panel attrition accounts for only half of this di¤erence. As presented in section 2, it seems changes in
panel attrition did not impact the degree of wage mobility in a systematic way.
8

0.2
.4.6
.81
rank
95M
0 .2 .4 .6 .8 1rank96M
0.2
.4.6
.81
rank
95F
0 .2 .4 .6 .8 1rank96F
0.2
.4.6
.81
rank
04M
0 .2 .4 .6 .8 1rank05M
0.2
.4.6
.81
rank
05F
0 .2 .4 .6 .8 1rank06F
Source: own calculations based on LFS data.
Earnings ranking, 1995/96 (upper graphs) and 2005/06 (lower), male (left) and female
employees (right).
The mobility measure suggested by Dickens (2000) is based on earnings variable with
the age e¤ect excluded (i.e. residuals of regressions of log of wages on age dummies). The
mobility between year t and t+1 is de�ned as:
M =2PN
i=1 jrankit+1 � rankitjN
where the rank de�nes the cumulative distribution function for earnings and the N is
the number of employees reporting wages. Its minimum value, 0 means no mobility in
the wage distribution (the ranking of employees remains the same over the year), whereas
M=1 describes a situation, in which earnings in the two analysed years are perfectly
negatively correlated.
Plotting the constructed mobility index against time one notices a considerable fall
in earnings mobility between 1995 and 2002, both for men and women. The highest
decrease took place between 2000 and 2002. The index for males was 0.23 in 1995; it fell
9

by more than a half by 2002. For female workers the mobility index dropped by more
than 60 percent to 0.098 in 2002/2003. Since 2002 a visible increases in the mobility index
can be observed, though the 2005/2006 levels are still far below these noted in the late
nineties. Furthermore, the di¤erences in wage mobility between men and women have
reversed. Until 2000 the earnings mobility among female workers was higher than among
men whereas since 2000 men tend to move more across the wage distribution and the gap
tends to rise in the last few years.
Figure 3: One year mobility index for men and women, 1995-2006
0.05
0.10
0.15
0.20
0.25
0.30
95/96 96/97 97/98 98/99 99/00 00/01 01/02 02/03 03/04 04/05' 05/06 06/07
Males Females
Source: own calculations based on LFS data.
It is worth noting that the highest fall in the earnings mobility took place in the
period of a signi�cant economic slowdown and a worsening labour market situation (1999
�2002). One might expect that the economic conditions did play a role in the mobility
changes. High unemployment made it more di¢ cult to change jobs (which may be an
important source of increases in individual wages) and discouraged workers from claiming
wage rises. The situation on the labour market started improving in 2004, and a rise
in earnings mobility may be seen since then. It is worth noting that Pavlopoulos et al.
(2005) in their analysis of wage mobility in Europe found that macroeconomic conditions
(business cycle) did play a role in explaining cross country variation in wage mobiity
levels.
10

The analysis of transition matrices has shown that the mobility has decreased par-
ticularly at the upper end of the wage distribution. Table A.3 in the Appendix reports
the mobility indexes computed for male and female workers by decile of origin (in the
�rst year). It is evident that in case of women the decline in the mobility index between
1995/96 and 2005/2006 has not only been higher but also much more homogenous across
the distribution. Apart from the �rst decile, where the drop in mobility was the lowest,
both low and high earning female workers are much less likely to move across the earnings
distribution (though the drop has been more pronounced in the upper part of the distri-
bution). In the same period the mobility index for men fell by 43 per cent, although the
decline was much lower among the workers in the lower end of the distribution (around
36 per cent for 2-5 decile) and much higher in the top three deciles (45-60 per cent). It is
also interesting to see that the relative position of the bottom earners has improved. In
1995/96 the mobility indexes for male and female workers from the �rst decile were much
lower if compared to other deciles (2- 8 in particular), but although the probabilities of
moving across the earnings ladder diminished for all the workers, they decreased the least
for the employees from the �rst deciles, both men and women. As a result, the situation
reversed and the low wage (�rst decile) earners�mobility indexes in 2006 were much higher
than in any other decile of origin.
5 Polish wage mobility in an international perspec-
tive
As mentioned before, it is quite subjective to judge whether the reported levels of wage
mobility are in fact high or low. One may however look at how they relate to earnings
mobility observed in other countries. Below I present the comparison of mobility of Polish
and British workers.
The wage inequalities in the United Kingdom and in Poland are on a comparable
level, although Polish workers�wages are slightly more dispersed in the upper end of the
distribution.6 Furthermore, also the UK has experienced sharp wage inequality increases
in the nineties (OECD 1996), although these seem to have stopped. As the ONS (2005)
presents, between 1998 and 2004 the D9/D1 ratio for the full time employees remained
practically unchanged.
6Earnings disparities across European countries and regions, Statistics in focus, 7/2006.
11
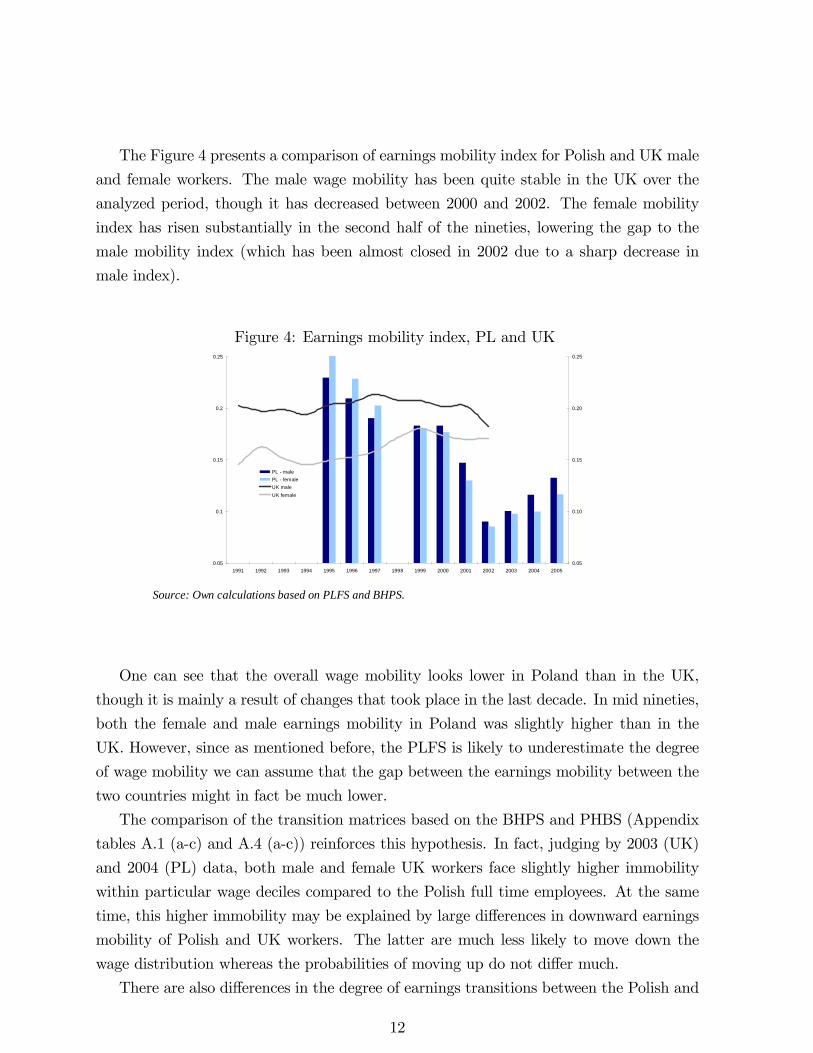
The Figure 4 presents a comparison of earnings mobility index for Polish and UK male
and female workers. The male wage mobility has been quite stable in the UK over the
analyzed period, though it has decreased between 2000 and 2002. The female mobility
index has risen substantially in the second half of the nineties, lowering the gap to the
male mobility index (which has been almost closed in 2002 due to a sharp decrease in
male index).
Figure 4: Earnings mobility index, PL and UK
0.05
0.1
0.15
0.2
0.25
1991 1992 1993 1994 1995 1996 1997 1998 1999 2000 2001 2002 2003 2004 20050.05
0.10
0.15
0.20
0.25
PL malePL femaleUK maleUK female
Source: Own calculations based on PLFS and BHPS.
One can see that the overall wage mobility looks lower in Poland than in the UK,
though it is mainly a result of changes that took place in the last decade. In mid nineties,
both the female and male earnings mobility in Poland was slightly higher than in the
UK. However, since as mentioned before, the PLFS is likely to underestimate the degree
of wage mobility we can assume that the gap between the earnings mobility between the
two countries might in fact be much lower.
The comparison of the transition matrices based on the BHPS and PHBS (Appendix
tables A.1 (a-c) and A.4 (a-c)) reinforces this hypothesis. In fact, judging by 2003 (UK)
and 2004 (PL) data, both male and female UK workers face slightly higher immobility
within particular wage deciles compared to the Polish full time employees. At the same
time, this higher immobility may be explained by large di¤erences in downward earnings
mobility of Polish and UK workers. The latter are much less likely to move down the
wage distribution whereas the probabilities of moving up do not di¤er much.
There are also di¤erences in the degree of earnings transitions between the Polish and
12

UK workers, since the former are relatively more likely to move by more than one decile,
whereas the majority of UK earnings transitions are �smaller steps�.
To sum up, a picture that emerges shows that the wage mobility in Polish is relatively
high, comparable to that in the UK. However, di¤erences in the patterns of earnings
transitions between the two countries emerge. In particular, they concern the levels of
downward wage mobility and the degree of transitions.
6 Wage inequalities and earnings mobility
As noted in section 3, the wage inequalities rose substantially in the past decade in
Poland, both in the upper and lower tail of the distribution. The question arises if and to
what extent it might have had impact on individual workers mobility across the earnings
distribution. On one hand, one might expect that higher wage dispersion implies more
possibilities to move across the distribution and thus higher earnings mobility. On the
other hand however, the wage rises have to be higher in order to change the worker�s
position in the earnings ranking.
Figure 5: Earnings mobility and inequality
0.00
0.05
0.10
0.15
0.20
0.25
95/96 96/97 97/98 98/99 99/00 00/01 01/02 02/03 03/04 04/05' 05/060.38
0.39
0.40
0.41
0.42
0.43
0.44
0.45
0.46
Male Mobility index
SD (ln(wage)), right axis
Source: Own calculations based on PLFS data.Earnings inequalities (standard deviation of log wages) calculated for full time employees.
The Figure 5 presents changes in the wage mobility (of male workers) and overall
earnings inequality over the past decade in Poland. In the mid nineties, between 1995
13

and 1998 the wage distribution has not changed much whereas the individual earnings
mobility has declined. Between 1998 and 2002 wage inequalities have risen substantially
and the mobility index has fallen sharply. Since 2002 both earnings inequalities and
earnings mobility have gone slightly up. Thus there is no marked trend in the mobility-
inequality changes. However, if we look at the levels, it is obvious the wage mobility was
on average much higher in times of lower wage inequalities.
Also international evidence points to a rather weak link between the earnings dispar-
ities and individual mobility. For example, Burkhauser et al. (1997) in their analysis of
German and US labour markets found out that despite overall constant wage inequalities
in both countries in the analyzed period, earnings mobility increased in the US while
declining in Germany. Cardoso (2006) found that in Portugal, between 1986 and 1999,
rising inequality was associated with relatively high mobility, whereas declining inequality
coexisted with lower mobility. OECD (1996) points out that despite various institutional
settings countries do not di¤er much with respect to the earnings mobility and those with
higher wage disparities to do not have higher wage mobility.
7 Conclusions
The analysis presented in this paper has shown that wage mobility in Poland is rather
high and its level is comparable to that observed in the UK. Men are more likely to change
their position in the wage distribution than women. The employees at the bottom of the
wage ladder have higher mobility than those in the upper part.
Plotting the changes in mobility index against time has shown that earnings mobility
in Poland has fallen in the second half of the nineties, with a sharp decline in 2002.
However, the mobility is on the rise again since than. The greatest change concerned the
low paid workers, which in the mid nineties were relatively (to medium and high earners)
less likely to move across the distribution, whereas in 2005 they were the most mobile.
There are a few striking di¤erences in the mobility of Polish and British workers.
Although the degree of upwards wage mobility is rather similar, the Polish employees are
more likely to experience downward transitions, whereas in the UK they have a higher
immobility within particular deciles. Furthermore, Polish employees are more likely to
make �bigger steps� i.e. to move by more than one decile in the earnings distribution,
whereas in the UK most of the transitions are by one decile only.
In Poland there is also a clear pattern of transitions out of employment, which concern
mostly the low paid workers. Men are more likely to become unemployed, whereas among
14

women there is a high share of withdrawals from the labour market. Also those entering
employment are much more likely to fall to the bottom deciles. In case of UK, these
transitions are much more heterogeneous with respect to the position in the earnings
distribution.
It has also been shown that the increases in earnings inequalities in Poland coexisted
both with falling and rising wage mobility. This seems to �t into the international evidence
of a lack of direct link between cross sectional and life time earnings inequalities. It also
implies that individuals are less income secure in the medium and long term, as the
increases in the cross sectional levels of wage inequalities in the recent years have not
been o¤set by rising wage mobility.
References
[1] Asplund R., Sloane P., Theodossiu I. (1998) Low Pay and Earnings Mobility in
Europe, Edward Elgar, Cheltenham
[2] Bigard A., Guillotin Y., Lucifora C. (1998), Earnings Mobility: An International
Comparison of Italy and France, Review of Income and Wealth, series 44, Number 4
[3] Buchinsky M., Hunt J. (1996), Wage Mobility in the Unites States, NBER Working
Paper no 5455
[4] Burkhauser R., Holtz - Eakin D., Rhody S. (1997), Labour Earnings Mobility and
Inequality in the United States and Germany during the Growth Years of the 1980s,
International Economic Review, Vol. 38, No. 4, pp. 775 - 794.
[5] Cappellari L. (2004), Earnings Mobility Among Italian Low Paid Workers, IZA Dis-
cussion Paper No 1068
[6] Cardoso A.R. (2006), Wage mobility: do institutions make a di¤erence? Labour
Economics 13, 387 - 404
[7] Cardoso A.R., Neuman S., Ziderman A. (2006), Wage Mobility In Israel, IZA Dis-
cussion Paper No 2335
[8] Contini, B.; Fillippi, M., Villosio, C. (1998), Earning Mobility In The Italian Econ-
omy In Asplund, R., Sloane, P.J., And Theodossiou, I. Low Pay And Earnings Mo-
bility In Europe, Edwards Elgar, Cheltenham, UK.
15

[9] De Grip A., Nekkers G. (2001), Skills, Wage Dispersion And Wage Mobility In The
1990s, Lower Working Paper No 2
[10] Dickens R. (2000), Caught In A Trap? Wage Mobility In Great Britain 1975 �1994,
Economica 67, P. 477-97
[11] European Commission (2005), Employment in Europe 2005, DG Employment, Social
A¤airs & Equal Opportunities
[12] Freeman R., Schettkat R., (2000), Skill Compression, Wage Di¤erentials and Em-
ployment: Germany vs. US, NBER Working Paper no 7610, Cambridge
[13] Gregory M., Elias P. (1994). Earnings Transitions Of The Low-Paid In Britain, 1976-
91: A Longitudinal Study. International Journal Of Manpower, Vol. 15, Issue 2,3,
[14] Katz L., Autor D. (1999), Changes in the Wage Structure and Earnings Inequality,
Published in O. Ashenfelter & D. Card (eds.), Handbook of Labor Economics, vol.
3A, North Holland, pp. 1463-1558
[15] Lynn P. (ed.) (2006), Quality Pro�le: British Household Panel Survey, ISER, Uni-
versity of Essex, Colchester
[16] MGiP (Polish Ministry of Economy and Labour) (2005), Employment in Poland
2005, Warsaw
[17] MPiPS (Polish Ministry of Labour and Social Policy) (2008), Employment in Poland
2007, Warsaw, forthcoming
[18] Nickell S., Bell B. (1996), Changes in the Distribution of Wages and Unemployment
in OECD Countries, American Economic Review, American Economic Association,
vol. 86(2), pages 302-08
[19] OECD (1996), Employment Outlook, OECD Paris
[20] ONS (2005), Patterns of Pay: results of the ASHE 1997 to 2005, O¢ ce for National
Statistics, London
[21] Pavlopoulos D., Mu¤els R., Vermunt J.K. (2005), Wage Mobility in Europe. A Com-
parative Analysis Using restricted Multinomial Logit Regression, MPRA Paper No.
229
16

[22] Sloane, P.J., Theodossiou, I. (1996), Earning Mobility, Family Income And Low Pay,
The Economic Journal 106 (May) Pp 657-666
[23] Sloane, P.J., Theodossiou, I. (1998), An Econometric Analysis Of Low Pay And
Earnings Mobility In Britain In Asplund, R., Sloane, P.J., And Theodossiou Low
Pay And Earnings Mobility In Europe, Edwards Elgar, Cheltenham, UK
[24] Stewart M.B., Swa¢ eld, J.K. (1999), Low Pay Dynamics and Transitions Probabili-
ties, Economica, New Series, Vol. 66, No. 261, pp. 23-42
[25] Weiss Y. (1986), The Determination of Life Cycle Earnings: A survey, Published
in O. Ashenfelter & R. Layard (eds.), Handbook of Labor Economics, vol. 1, North
Holland, pp. 603-640
17

Appendix
Table A1(a): One year transition rates 20042005, all full time employees.2005 state
2004state 1st d 2nd d 3rd d 4th d 5th d 6th d 7th d 8th d 9th d 10th d Miss
Pt&
0 U I
1st d 30.8 22.3 6.9 5.0 3.9 2.2 1.1 0.4 0.4 0.7 1.2 9.3 9.3 6.62nd d 16.4 30.1 16.7 9.5 3.9 2.4 1.8 1.6 0.4 0.3 1.5 5.6 5.1 4.73rd d 7.4 20.5 23.5 15.7 10.6 4.8 3.6 2.1 1.1 0.1 1.1 3.7 2.8 3.04th d 4.0 10.0 11.8 25.2 17.1 7.2 6.8 3.5 2.6 1.1 1.1 5.1 1.7 2.75th d 2.6 6.2 5.2 14.0 28.1 13.5 10.2 5.2 4.3 1.8 0.3 3.6 2.1 2.96th d 1.7 3.1 3.0 7.7 24.6 20.3 16.0 8.8 6.0 1.6 0.8 2.6 1.3 2.57th d 1.5 1.3 1.7 5.6 10.8 12.9 28.2 17.3 8.8 5.9 0.4 2.3 1.2 2.18th d 0.9 1.2 1.6 1.8 5.8 8.3 16.1 33.6 17.6 5.8 0.3 2.5 1.0 3.69th d 0.4 0.9 0.5 1.9 3.4 5.3 7.3 17.7 40.9 14.9 0.1 4.2 0.3 2.2
10th d 0.4 0.3 0.5 0.7 0.8 1.8 3.1 7.2 18.9 59.9 0.1 3.4 0.3 2.7Miss 14.3 5.7 4.8 4.8 3.8 1.0 0.0 2.9 2.9 1.0 10.5 23.8 13.3 11.4
Pt&O 2.7 1.5 1.0 1.0 0.7 0.4 0.6 0.5 0.5 0.4 0.5 81.0 2.4 6.8U 5.5 4.1 1.6 2.2 1.5 0.6 0.8 0.8 0.3 0.6 1.6 9.3 49.7 21.4I 1.4 0.8 0.4 0.3 0.5 0.1 0.2 0.1 0.1 0.2 0.4 6.0 5.2 84.4
Source: own calculations based on PHBS data.
Pt&O means part time employees, self employed, employers and working family members.
The table presents the percentage of employees in different deciles and labour market states in 2005, depending on theirstatus in 2004. For example, out of all employees who were in the 1st earnings decile in 2004, 30.8 % stayed within thisdecile, 22.3 moved to the 2nd decile, 9.3 became unemployed etc.
18

Table A1(b): One year transition rates 20042005, male employees.
2005 state
2004state 1st d 2nd d 3rd d 4th d 5th d 6th d 7th d 8th d 9th d 10th d Miss
Pt&
0 U I
1st d 28.8 17.6 7.8 4.4 5.1 1.4 1.4 0.3 0.7 0.3 1.7 13.9 11.5 5.1
2nd d 15.2 28.4 14.9 12.1 3.5 3.5 1.8 1.8 0.4 0.4 2.1 6.0 6.0 3.9
3rd d 5.8 21.9 21.4 15.1 12.6 5.8 4.3 2.3 1.0 0.3 1.3 3.8 2.8 2.0
4th d 3.7 7.5 11.0 24.8 16.6 7.5 7.7 4.0 3.3 2.1 1.4 5.9 2.3 2.1
5th d 2.0 6.1 4.9 14.5 30.6 13.9 9.2 5.5 2.9 1.2 0.6 4.3 2.6 1.7
6th d 2.2 3.2 3.0 9.9 23.9 16.4 16.2 9.5 7.1 1.7 0.9 2.8 1.9 1.3
7th d 1.7 1.5 1.9 6.0 11.2 12.9 27.5 17.6 7.1 6.2 0.6 2.6 0.9 2.2
8th d 0.7 0.7 1.0 2.2 5.1 7.7 16.5 35.1 17.2 6.5 0.0 2.4 1.5 3.4
9th d 0.2 0.4 0.2 2.0 4.1 4.6 6.5 18.4 40.8 15.8 0.2 4.1 0.4 2.2
10th d 0.4 0.4 0.4 0.4 0.9 1.3 2.8 7.1 20.3 59.5 0.2 4.3 0.2 1.7
Miss 11.8 7.8 7.8 2.0 5.9 0.0 0.0 2.0 2.0 0.0 15.7 27.5 15.7 2.0
Pt&O 2.4 1.5 1.1 1.2 0.8 0.5 0.8 0.6 0.6 0.5 0.7 81.9 2.7 4.7
U 6.0 5.2 1.7 2.9 1.6 0.7 1.3 1.0 0.4 0.9 2.2 9.5 52.3 14.4
I 1.6 0.3 0.2 0.3 0.7 0.0 0.0 0.0 0.1 0.2 0.3 5.9 4.5 85.8
Source: own calculations based on PHBS data.
Pt&O means part time employees, self employed, employers and working family members.
The table presents the percentage of employees in different deciles and labour market states in 2005, depending on theirstatus in 2004. For example, out of all employees who were in the 1st earnings decile in 2004, 28.8 % stayed within thisdecile,17.6 moved to the 2nd decile, 11.5 became unemployed etc.
19

Table A1(c): One year transition rates 20042005, female employees.2005 state
2004state 1st d 2nd d 3rd d 4th d 5th d 6th d 7th d 8th d 9th d 10th d Miss
Pt&
0 U I
1st d 32.1 25.4 6.3 5.4 3.1 2.7 0.9 0.4 0.2 0.9 0.9 6.3 7.8 7.62nd d 17.1 31.1 17.8 7.9 4.2 1.8 1.8 1.5 0.4 0.2 1.1 5.3 4.6 5.33rd d 9.2 19.0 26.0 16.5 8.4 3.6 2.8 2.0 1.1 0.0 0.8 3.6 2.8 4.24th d 4.2 12.9 12.7 25.6 17.7 6.9 5.8 2.9 1.8 0.0 0.8 4.2 1.1 3.45th d 3.2 6.4 5.4 13.5 25.3 13.1 11.2 4.8 5.8 2.6 0.0 2.9 1.6 4.26th d 1.0 3.0 3.0 4.3 25.7 26.3 15.7 7.7 4.3 1.3 0.7 2.3 0.3 4.37th d 1.3 1.0 1.3 5.1 10.2 13.0 29.2 16.8 11.4 5.4 0.0 1.9 1.6 1.98th d 1.1 1.9 2.7 1.1 6.8 9.1 15.6 31.2 18.3 4.6 0.8 2.7 0.4 3.89th d 0.7 1.8 1.1 1.8 2.2 6.5 8.6 16.5 41.2 13.3 0.0 4.3 0.0 2.2
10th d 0.4 0.0 0.7 1.1 0.7 2.5 3.6 7.2 16.7 60.5 0.0 1.8 0.4 4.3Miss 16.7 3.7 1.9 7.4 1.9 1.9 0.0 3.7 3.7 1.9 5.6 20.4 11.1 20.4
Pt&O 2.9 1.5 0.8 0.8 0.5 0.3 0.4 0.3 0.4 0.3 0.4 80.0 2.1 9.0U 5.1 3.0 1.5 1.5 1.5 0.4 0.4 0.5 0.1 0.3 1.1 9.1 47.3 28.2I 1.3 0.9 0.5 0.3 0.3 0.1 0.3 0.1 0.2 0.2 0.4 6.0 5.5 83.9
Source: own calculations based on PHBS data.
Pt&O means part time employees, self employed, employers and working family members.
The table presents the percentage of employees in different deciles and labour market states in 2005, depending on theirstatus in 2004. For example, out of all employees who were in the 1st earnings decile in 2004, 32.1 % stayed within thisdecile,25.4 moved to the 2nd decile, 7.8 became unemployed etc.
20

Table A2(a). Transition rates across time. Men full time employees.
1995/1996 2000/2001 2004/2005
deciles same d moved1d
moved2d+ same d moved
1dmoved
2d+ same d moved1d
moved2d+
1 0.34 0.13 0.28 0.45 0.17 0.12 0.47 0.12 0.152 0.17 0.36 0.30 0.37 0.28 0.16 0.50 0.24 0.093 0.26 0.30 0.31 0.10 0.50 0.21 0.48 0.26 0.094 0.20 0.29 0.39 0.31 0.30 0.20 0.63 0.18 0.075 0.08 0.38 0.43 0.50 0.25 0.13 0.66 0.12 0.116 0.20 0.31 0.39 0.41 0.26 0.19 0.60 0.23 0.107 0.28 0.34 0.29 0.34 0.38 0.14 0.72 0.18 0.048 0.26 0.44 0.21 0.49 0.28 0.10 0.80 0.10 0.049 0.29 0.49 0.16 0.53 0.29 0.06 0.81 0.11 0.01
10 0.68 0.18 0.06 0.70 0.13 0.04 0.88 0.01 0.01
"24" 0.21 0.31 0.33 0.26 0.36 0.19 0.54 0.23 0.08"68" 0.24 0.37 0.30 0.41 0.31 0.14 0.71 0.17 0.06
Source: own calculations based on PLFS data.
See tables A.1 for explanations.
Table A2(b). Transition rates across time. Women full time employees.
1995/1996 2000/2001 2004/2005
deciles same d moved1d
moved2d+ same d moved
1dmoved
2d+ same d moved1d
moved2d+
1 0.42 0.18 0.21 0.59 0.14 0.05 0.64 0.06 0.072 0.22 0.41 0.25 0.40 0.33 0.10 0.49 0.31 0.043 0.27 0.38 0.25 0.16 0.53 0.14 0.54 0.31 0.064 0.23 0.33 0.36 0.33 0.32 0.21 0.71 0.14 0.065 0.10 0.40 0.43 0.47 0.22 0.15 0.72 0.10 0.106 0.20 0.37 0.36 0.40 0.29 0.19 0.69 0.18 0.087 0.31 0.36 0.28 0.31 0.43 0.17 0.74 0.15 0.048 0.23 0.48 0.22 0.44 0.35 0.10 0.83 0.07 0.039 0.30 0.45 0.18 0.53 0.32 0.04 0.79 0.09 0.0310 0.62 0.20 0.09 0.77 0.09 0.05 0.85 0.01 0.03
"24" 0.24 0.37 0.29 0.30 0.39 0.15 0.58 0.25 0.05"68" 0.25 0.40 0.29 0.38 0.36 0.15 0.75 0.13 0.05
Source: own calculations based on P LFS data.
See tables A.1 for explanations.
21

Table A.3: One year mobility index by decile of origin
Male 1995/96 2005/06Percentage
changeMM_1 0.234 0.221 0.05MM_2 0.236 0.152 0.36MM_3 0.238 0.165 0.31MM_4 0.261 0.154 0.41MM_5 0.270 0.171 0.37MM_6 0.279 0.145 0.48MM_7 0.268 0.149 0.45MM_8 0.251 0.108 0.57MM_9 0.205 0.080 0.61
MM_10 0.132 0.048 0.64FemaleMF_1 0.253 0.171 0.32MF_2 0.281 0.136 0.52MF_3 0.285 0.146 0.49MF_4 0.302 0.137 0.55MF_5 0.305 0.134 0.56MF_6 0.282 0.096 0.66MF_7 0.250 0.104 0.59MF_8 0.210 0.081 0.62MF_9 0.137 0.051 0.63
MF_10 0.098 0.060 0.39Source: Own calculations using LFS data
22

Table A4(a): One year transition rates 20032004, UK all full time employees.
2004 state
2003state 1st d 2nd d 3rd d 4th d 5th d 6th d 7th d 8th d 9th d
10th
dPT&SE U I
1st d 33.1 12.6 2.9 2.3 1.6 1.6 3.8 1.6 2.7 1.6 9.0 0.0 27.32nd d 6.1 38.7 14.6 4.7 2.0 1.6 1.0 0.4 0.4 1.0 13.8 0.4 15.43rd d 2.0 11.2 37.9 19.7 7.9 4.2 0.9 0.2 0.2 0.2 7.2 0.7 7.74th d 2.6 3.9 10.8 38.7 18.7 4.7 1.4 2.0 1.0 0.0 4.5 0.2 11.45th d 2.4 1.6 3.6 13.8 38.1 18.2 5.8 1.8 0.5 0.0 3.5 1.1 9.56th d 1.5 1.7 1.5 3.7 16.5 33.8 18.4 7.4 2.6 0.4 3.1 0.6 9.07th d 2.1 0.6 0.3 2.1 3.2 12.5 39.2 20.4 4.8 1.1 3.9 0.8 8.88th d 3.0 0.7 0.7 0.5 0.9 3.0 15.2 43.4 17.9 2.9 3.4 0.5 7.99th d 2.9 1.1 0.3 0.2 0.2 0.9 3.1 13.5 51.7 16.1 4.1 0.0 6.110th d 3.3 0.7 0.2 0.0 0.2 0.2 0.7 1.7 7.5 72.2 5.0 0.8 7.7Pt&O 1.7 3.9 1.1 1.1 1.0 0.9 0.6 0.7 0.8 0.8 74.9 0.7 11.8
Unempl. 4.2 0.0 3.5 7.6 3.5 2.8 2.1 0.0 1.4 2.1 17.4 13.9 41.7Inactive 0.8 1.0 0.7 0.3 0.6 0.4 0.5 0.4 0.1 0.2 7.8 1.4 86.0
Source: own calculations based on BHPS data.
Pt&SE means part time employees and self employed..
See tables A.1 for explanations.
23

Table A4(b): One year transition rates 20032004, UK male full time employees.
2004 state
2003state 1st d 2nd d 3rd d 4th d 5th d 6th d 7th d 8th d 9th d
10th
dPT&SE U I
1st d 39.1 3.7 2.5 2.9 1.2 2.1 4.5 2.9 2.9 2.1 5.3 0.0 30.92nd d 9.6 27.9 18.4 7.4 5.1 2.9 1.5 0.7 1.5 2.2 6.6 0.7 15.43rd d 2.1 6.9 37.2 21.3 11.2 5.3 2.1 0.5 0.5 0.0 3.7 0.5 8.54th d 2.6 3.5 10.9 36.7 21.0 5.7 1.7 2.2 2.2 0.0 2.2 0.4 10.95th d 2.9 1.0 2.5 16.8 37.5 18.4 7.3 2.2 1.0 0.0 1.6 0.6 8.36th d 1.0 2.0 1.0 5.3 14.5 30.6 19.7 8.2 3.6 0.7 2.0 0.7 10.97th d 1.5 0.7 0.5 2.0 3.7 12.4 39.2 20.8 5.2 1.5 3.2 1.0 8.28th d 3.4 0.5 0.8 0.8 1.0 3.4 14.5 43.2 17.3 3.9 3.1 0.5 7.89th d 3.4 0.9 0.4 0.2 0.2 0.9 3.8 14.4 49.2 16.6 4.3 0.0 5.610th d 3.6 0.0 0.0 0.0 0.2 0.0 0.9 1.8 8.4 72.7 4.0 0.9 7.6Pt&O 2.2 2.0 0.8 0.4 1.1 1.3 0.6 1.1 1.3 2.2 74.4 1.0 11.7
Unempl. 4.8 0.0 2.4 9.6 3.6 3.6 3.6 0.0 0.0 3.6 13.3 15.7 39.8Inactive 0.9 1.1 1.3 0.2 1.3 0.9 1.1 0.5 0.2 0.4 5.9 2.1 84.3
Source: own calculations based on BHPS data.
Pt&SE means part time employees and self employed..
See tables A.1 for explanations.
24

Table A4(c): One year transition rates 20032004, UK female full time employees.
2004 state
2003state 1st d 2nd d 3rd d 4th d 5th d 6th d 7th d 8th d 9th d
10th
dPT&SE U I
1st d 25.9 23.4 3.5 1.5 2.0 1.0 3.0 0.0 2.5 1.0 13.4 0.0 22.92nd d 4.7 42.7 13.1 3.6 0.8 1.1 0.8 0.3 0.0 0.6 16.5 0.3 15.43rd d 1.9 14.2 38.4 18.7 5.6 3.4 0.0 0.0 0.0 0.4 9.7 0.7 7.14th d 2.7 4.2 10.7 40.5 16.8 3.8 1.1 1.9 0.0 0.0 6.5 0.0 11.85th d 1.7 2.6 5.1 9.8 38.9 17.9 3.8 1.3 0.0 0.0 6.0 1.7 11.16th d 2.1 1.3 2.1 1.7 19.2 37.9 16.7 6.3 1.3 0.0 4.6 0.4 6.77th d 3.2 0.5 0.0 2.3 2.3 12.8 39.3 19.6 4.1 0.5 5.0 0.5 10.08th d 2.3 1.2 0.6 0.0 0.6 2.3 16.8 43.9 19.1 0.6 4.0 0.6 8.19th d 1.9 1.4 0.0 0.0 0.0 1.0 1.4 11.5 56.9 14.8 3.8 0.0 7.210th d 2.7 2.7 0.7 0.0 0.0 0.7 0.0 1.3 4.7 70.7 8.0 0.7 8.0Pt&O 1.5 5.0 1.2 1.5 1.0 0.7 0.6 0.5 0.5 0.1 75.1 0.5 11.8Unempl. 3.3 0.0 4.9 4.9 3.3 1.6 0.0 0.0 3.3 0.0 23.0 11.5 44.3Inactive 0.7 1.0 0.4 0.3 0.3 0.2 0.2 0.3 0.1 0.1 8.6 1.1 86.7
Source: own calculations based on BHPS data.
Pt&SE means part time employees and self employed..
See tables A.1 for explanations.
25
Related Documents