ISSN: 2347-7474 International Journal Advances in Social Science and Humanities Available online at: www.ijassh.com RESEARCH ARTICLE Touitou Mohammed & Boudeghdegh Ahmed| June. 2014 | Vol.2 | Issue 6|35-48 35 Wage Inequality and Growth Economics in Algeria Analysis by CGEM Touitou Mohammed 1* , Boudeghdegh Ahmed 2 High National School of Applied Economics and Statistics (EX: INPS), 11 Rue DoudouMokhtar, Ben Aknoun, Algiers, Algeria. *Corresponding author-Email: [email protected] Abstract This article is devoted to the case of Algeria, and is based on a computable general equilibrium model with four sectors model: agriculture, urban private sector (readable simplification industry), the commercial and public sector and the informal sector. The labor market is segmented between skilled and unskilled workers. Our model is a modified version model of AGENOR et al. [1]. This is based on empirical studies conducted by the World Bank and the International Labor Office, and has been designed to adapt to the peculiarities of countries Middle East - North Africa. However, in our article, the model of AGENOR et al. was modified in two main ways. The first change was to model endogenously the wages paid to unskilled industrial workers. The second change was to remove any function of elasticities CES-CET. The model thus created was the subject of various simulations. In particular, we applied the shocks on the level of exogenous wage (agricultural wage, minimum wage, wage of skilled industrial workers).Our results show that in Algeria, growth underpinned by the low level of wages. This is the case regardless of the sector concerned. Thus, the will to increase the lowest wages is potentially unfavourable to growth. Only the will to increase the minimum wage can do exception. Keywords: Algeria, CGEM, Economic growth, Labor market. Introduction If economic growth and improved standards of living are two consensual objectives of development plans, remains unanswered the question of the relationship between growth, poverty reduction and inequality."Dissemination" of growth between different sectors of an economy can be seen as the key factor to ensure the economic and social development of a country [2].However, this design can be challenged, considering that growth, while creating wealth is insufficient to reduce poverty and inequality [3,4].However, this design may be calling into question, if considering that growth, although creative wealth is insufficient to reduce poverty and inequality [3,4]. The discussion is based primarily on the indicator to measure poverty and inequality. Under the assumption of a distribution of income remains more or less constant within each country, growth is a key factor in poverty reduction [5,6],measured by the "per capita income" indicator. However, this indicator is not always satisfactory: if growth only benefits individuals placed in the upper part of the income distribution, the "per capita income" indicator increase, but the number of people living below the poverty line will remain constant or be reduced more slowly than the rate of growth. Another part of the debate is based on the definition of "pro-poor growth."Should we consider that there is inequality reduction if growth benefits proportionately more disadvantaged groups or is it necessary that disadvantaged groups benefit more from growth in absolute terms?.Also raises the question of the appropriateness of a measure of inequality in purely monetary terms. Should we not it adds a consideration of qualitative variables, or non- monetary, such as health and education? Without denying the importance of these variables, our article is based solely on monetary items; salaries paid to different categories of workers in Algeria. We are looking what are the effects of a change in wage growth. In doing so, we wish to contribute to the debate with the impact of inequality on GDP growth, not the debate exposing the effects of growth on reducing inequalities.

Welcome message from author
This document is posted to help you gain knowledge. Please leave a comment to let me know what you think about it! Share it to your friends and learn new things together.
Transcript
ISSN: 2347-7474
International Journal Advances in Social Science and Humanities Available online at: www.ijassh.com
RESEARCH ARTICLE
Touitou Mohammed & Boudeghdegh Ahmed| June. 2014 | Vol.2 | Issue 6|35-48 35
Wage Inequality and Growth Economics in Algeria Analysis by CGEM
Touitou Mohammed1*, Boudeghdegh Ahmed2
High National School of Applied Economics and Statistics (EX: INPS), 11 Rue DoudouMokhtar, Ben Aknoun,
Algiers, Algeria.
*Corresponding author-Email: [email protected]
Abstract
This article is devoted to the case of Algeria, and is based on a computable general equilibrium model with four
sectors model: agriculture, urban private sector (readable simplification industry), the commercial and public sector
and the informal sector. The labor market is segmented between skilled and unskilled workers. Our model is a
modified version model of AGENOR et al. [1]. This is based on empirical studies conducted by the World Bank and
the International Labor Office, and has been designed to adapt to the peculiarities of countries Middle East - North
Africa. However, in our article, the model of AGENOR et al. was modified in two main ways. The first change was to
model endogenously the wages paid to unskilled industrial workers. The second change was to remove any function
of elasticities CES-CET. The model thus created was the subject of various simulations. In particular, we applied
the shocks on the level of exogenous wage (agricultural wage, minimum wage, wage of skilled industrial
workers).Our results show that in Algeria, growth underpinned by the low level of wages. This is the case regardless
of the sector concerned. Thus, the will to increase the lowest wages is potentially unfavourable to growth. Only the
will to increase the minimum wage can do exception.
Keywords: Algeria, CGEM, Economic growth, Labor market.
Introduction
If economic growth and improved standards of
living are two consensual objectives of
development plans, remains unanswered the
question of the relationship between growth,
poverty reduction and inequality."Dissemination"
of growth between different sectors of an economy
can be seen as the key factor to ensure the
economic and social development of a country
[2].However, this design can be challenged,
considering that growth, while creating wealth is
insufficient to reduce poverty and inequality
[3,4].However, this design may be calling into
question, if considering that growth, although
creative wealth is insufficient to reduce poverty
and inequality [3,4].
The discussion is based primarily on the indicator
to measure poverty and inequality. Under the
assumption of a distribution of income remains
more or less constant within each country, growth
is a key factor in poverty reduction [5,6],measured
by the "per capita income" indicator. However,
this indicator is not always satisfactory: if growth
only benefits individuals placed in the upper part
of the income distribution, the "per capita income"
indicator increase, but the number of people living
below the poverty line will remain constant or be
reduced more slowly than the rate of growth.
Another part of the debate is based on the
definition of "pro-poor growth."Should we consider
that there is inequality reduction if growth
benefits proportionately more disadvantaged
groups or is it necessary that disadvantaged
groups benefit more from growth in absolute
terms?.Also raises the question of the
appropriateness of a measure of inequality in
purely monetary terms. Should we not it adds a
consideration of qualitative variables, or non-
monetary, such as health and education?
Without denying the importance of these
variables, our article is based solely on monetary
items; salaries paid to different categories of
workers in Algeria. We are looking what are the
effects of a change in wage growth. In doing so, we
wish to contribute to the debate with the impact
of inequality on GDP growth, not the debate
exposing the effects of growth on reducing
inequalities.
Available online at: www.ijassh.com
Touitou Mohammed & Boudeghdegh Ahmed| June. 2014 | Vol.2 | Issue 6|35-48 36
The notion of "poverty trap" is used, including the
World Bank, to expose how poverty and income
inequality may affect economic activity. Non-poor
households, due to a shock such as a fall in wages,
will use their savings (or borrow) as reduce its
consumption to regain its initial income level. The
impact on wages therefore has only minimal and
transient effects on income. Conversely, following
a cut in pay, a poor household will try to maintain
its level of consumption, and for this purpose, is
strongly encouraged to make liquid capital. Thus
for example, a poor farmer may be forced to sell
some of his cattle, which deprives him of future
income, and will hamper its activity without
warranty recovers its capital.
We took the example of a loss of monetary capital,
but it is also possible to present the case of a loss
of human capital. Following a fall in wages, poor
households may be forced to withdraw his (her)
child (ren) from school to benefit from labor and
an additional income.
As the process described by the "poverty trap"
based initially on a reduced income, we propose to
analyze the effects of lower wage on Algerian
growth. For this purpose, we use a computable
general equilibrium model, which is a modified
version model of Agenor et al. [1].
We present first the issue of wages in Algeria,
after that we present our modified version. Then
we will justify in more detail the changes made.
The last part of the article will present the results
of simulations of shocks on Algerian wages.
The Issue of Wages in Algeria
How the wealth created was distributed? We will
try to answer the following by analyzing
macroeconomic indicators most highly correlated
with the standard of living of the population.
This note aims to present some thoughts about
the issue of wage and purchasing power in
Algeria.
In the absence of recent data on wage levels in
Algeria in recent years - the last salary survey
conducted by the National Office of Statistics
(NOS) for enterprises that have been carried out
in 2004 - the issue of wages will understood
through the analysis of the levels and trends of
aggregates and macro-economic indicators with
strong correlations with wages.
The main aggregate is to be used as the Gross
Domestic Product (GDP). Analysis of the share of
wages in gross domestic product (GDP) is indeed a
universal way of studying real wages.
Other equally important and correlated with wage
indicators, such as gross national disposable
income, individual final consumption of
households, will also be used.
Compared Evolution of GDP, Disposable
Gross National Income and Individual
Household Final Consumption in Algeria
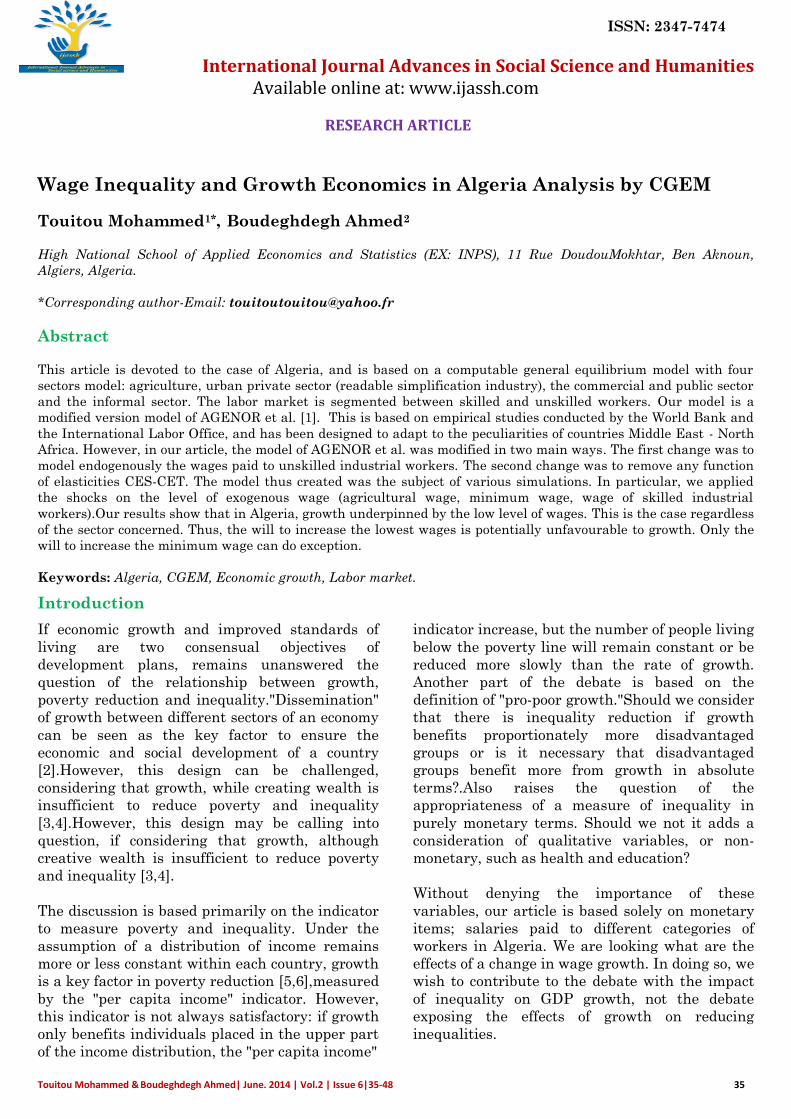
It is observed from the data in Table 3 below, that
during the decade of (1995 to 2004).GDP and
Gross National Income Available (GNIA)
increased very rapidly in Algeria. In 2004, Algeria
in the value of GDP expressed in a currency, the
U.S. $ is of the order of 85 billion U.S. $. The
corresponding growth rates indicate that in ten
years, the wealth produced has tripled in Algeria
(306%).
Individual final consumption of households
(IFCH) has more than doubled in Algeria with a
rate of 212%. We note that it is in Algeria the
households have benefited least from the
increased wealth created. Indeed, the final
consumption of households in 1995 accounted for
only 55.6% of GDP in Algeria. In 2004, ten years
later, it decreased by 17% with a share of 38.5% of
GDP.
Table 1: Compared evolution ofGDP, GNIA and IFCH (Values in millions of DZD)
1995 2000 2004 2004/1995 2004/2000
GDP 2,004,994.7 4,123,513.9 6,126,668.3 306% 149%
GNIA 1 877 457,5 3 753 594,7 5,712,585.4 304% 152%
IFCH 1 114 808,8 1 714 188,0 2,357,978.7 212% 138%
% GNIA /GDP 93,6% 91,0% 93,2%
% IFCH /GDP 55,6% 41,6% 38,5%
% IFCH / GNIA 59,4% 45,7% 41,3% Sources: salary survey conducted by the Algerian National Office of Statistics (ANOS) 2004.
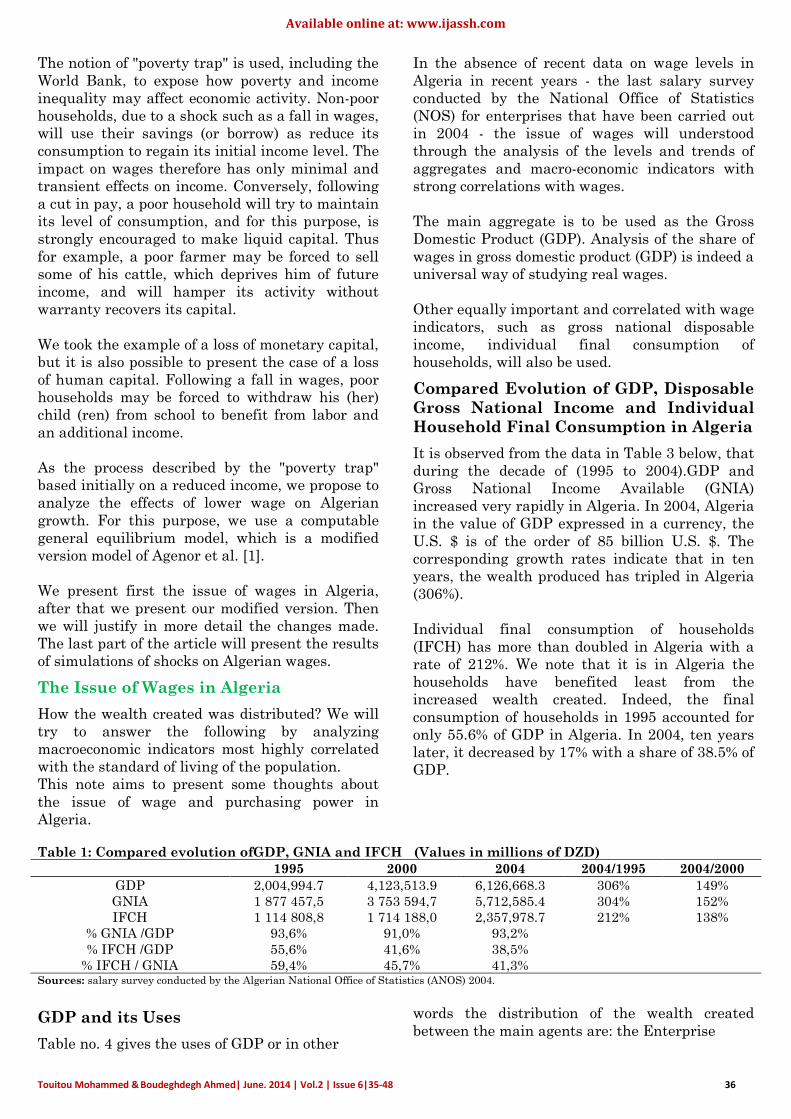
GDP and its Uses
Table no. 4 gives the uses of GDP or in other
words the distribution of the wealth created
between the main agents are: the Enterprise
Available online at: www.ijassh.com
Touitou Mohammed & Boudeghdegh Ahmed| June. 2014 | Vol.2 | Issue 6|35-48 37
through the net operating surplus and
depreciation of its equipment (Consumption Fund
fixed), the State through indirect taxes net of
subsidies, finally, Households across the
Compensation of employees.
Table 2: The uses of GDP(Values in millions of DZD)
1995 2000 2004
GDP 2,004,994.7 4,123,513.9 6,126,668.3
Ratios
% Net operating surplus/GDP 45% 54% 55%
%Indirect taxes net of subsidies/GDP 19% 18% 18%
%Consumption of Fixed Fund/GDP 7% 6% 7%
%global payroll/GDP 28% 21% 20% Sources: Salary survey conducted by the Algerian National Office of Statistics (ANOS) 2004.
It is clear from the examination of these data,
between 1995 and 2004, that the share of the
depreciation and indirect taxes in GDP remained
stable, respectively, of the order of 7% and 18% of
GDP.Against the share by the Company as net
operating surplus estimated at about 3,380 billion
dinars in 2004 increased 10% going from 45% of
GDP in 1995 to 55% of GDP in 2004 while in the
same period, payroll, estimated in 2004 to nearly
1,245 billion dinars, only 20% of GDP is 8% less
than in 1995.
The declining share of the global payroll in GDP
of 8% between 1995 and 2004 reflects both the
decline in the share of payroll productive
branches passing respectively 15.6% of GDP to 10
6% of GDP a decrease of 5%, and lower payroll
Administration that goes below 10% of GDP in
2004 against 12.7% in 1995, a decrease of 3.4% . It
should be noted that the salaries of agents of
administration represent 96% of the payroll of
non-productive branches.
Table 3: Evolution of the wage bill (W.B) by Branches (Values in millions of DZD)
1995 2000 2004
GDP 2,004,994.7 4,123,513.9 6,126,668.3
Ratios
%global payroll/the GDP 28% 21% 20%
Whose %W.B. productive branches/the GDP 19% 18% 18%
Whose %W.B. non-productive branches/the GDP 7% 6% 7%
%W.B. Administrations public /the GDP 28% 21% 20% Sources: Salary survey conducted by the Algerian National Office of Statistics (ANOS) 2004.
Methodology and Data
The initial model was created by Agenor et al. [1]
for the World Bank, and has also been used by
researchers not belonging to this institution:
Bchir et al. [7] and, Bibi and Chatti [8].
This model focuses on the characteristics of labor
markets in Southern and Eastern Mediterranean
Countries (SEMC).There are four sectors:
agriculture, urban private sector (readable
simplification industry), informal sector and
"government" sector, covering public activities
and services. The model retains the existence of a
segmented labor market between skilled and
unskilled workers. It is based on empirical data
and studies from the World Bank and the
International Labor Office, and is intended to
describe the situation of a country "type" of the
zone Middle East - North Africa.
However, it has proved necessary to modify the
model in two main ways: We first remove any
function of elasticities CES-CET, because they
can be in originally bias (reversion factor intensity
preventing verification of HOS theorem,
erroneous measure of well-being and impact
effects from trade liberalization), and based on an
assumption sometimes overly simplistic: the
constancy of the elasticities of substitution and
transformation [9].
Agenor et al., in their article in 2003, suggest that
in Tunisia and in Egypt, the wages paid to
unskilled industrial workers is not equal to the
legal minimum. If it affects the wage paid, it is
also necessary to take account of choice or conduct
business leaders. This last statement leads us to
model as an endogenous variable wages paid to
unskilled industrial workers. Agenor et al. did not
do so, because the model they realized was to
describe the situation of a country "type" of the
zone Middle East - North Africa. Or, the fact that
Available online at: www.ijassh.com
Touitou Mohammed & Boudeghdegh Ahmed| June. 2014 | Vol.2 | Issue 6|35-48 38
the wages paid to unskilled industrial workers
can be considered as an endogenous variable was
not presented as a feature of all countries in the
region, only Tunisia and Egypt being concerned.
Once selected equations to change, we sought
data allowing estimating the model. They cover
the period 1999-20021,and come from the World
Bank (World Development Indicators, 2008
African Development Indicators 2001), IMF (IFS
database), the Algerian National Office of
Statistics (NOS), National Economic and Social
Council (NESC) and the Central Bank of Algeria.
In the model, the unit of currency is the dollar,
except as regards the variables FLpd and FLgd
denominated in Algerian dinars. The meaning of
abbreviations is attached.
Equations 5 to 10, 12 to 14, 16 to 19, 28 to 33, 40,
and 43 to 45, are extracted from the model
AGENOR et al., and are some of them changed.
And the equations used may be justified.
The Justification of Equations Used
We detail the part of the model dedicated to the
labor market, and the equations with our major
changes. Explanations focus on specific aspects:
activities sectors, labor market segmentation,
qualifications, unemployment, labor demand,
wages of unskilled industrial workers, labor
supply, intersectoral migration, wages in the
informal sector, elimination of functions
elasticities CES-CET.
The Activity Sectors
As in the model of AGENOR et al. we change, four
sectors are retained: agriculture, urban private
sector, the informal sector, and the "government"
sector, which includes commercial activities and /
or public. For simplification, the private urban
sector represents the industry. Such
simplification was present in the original model,
although, as pointed out by the FAO [10], it is not
possible to completely assimilate urban private
sector and industry. Similarly, agriculture and
activities in rural areas are not perfect
substitutes.
A large part of the model is devoted to the
Algerian labor market.
1For subsequent years, different assumptions have been made
regarding the evolution of variables. When the available data permit,
we regressed the variables on their past values, assuming that the
equations obtained allow predicting the future level of variables.
When the available data do not allow making such equations, we
calculated over the period 1999-2002, average annual growth rate.
These were then used to calculate the level of future variables. The
resulting data allow, for the period 1999-2009, confirm all trends in
Tunisia on the evolution of labor, GDP, value added, and the budget
deficit.
Segmentation of the Labor Market
To describe the Algerian economy, we must
remember the existence of a segmented labor
market, including skilled workers and others
without qualifications. Specifically, individuals
with a high school diploma or higher were
retained as qualified. Persons holding a degree
elementary or without qualifications were
considered unqualified. The data come from
surveys population-employment by the Algerian
National Office of Statistics (NOS).
Qualifications
Agricultural labor is assumed without
qualification. Such an assumption was already
present in the model of AGENOR et al. [1].Private
urban sector and the government sector employ
skilled or unskilled. The government sector is
seen as the employer of "last resort." This
explains why this sector is the largest employer,
especially for those qualified. The unskilled
population engaged in the government sector
follows a deterministic process as it is a function
of its past value.
Unemployment
To account for the strong state intervention in the
labor market, the assumption of no
unemployment in the public sector is retained in
our model, the creation of public jobs with the
main purpose to absorb supply work "surplus."
This hypothesis was also present in the model of
Agenor et al. By cons, there is unemployment of
agricultural workers. It can be measured by the
difference between Ur (t) (active agricultural
population) UAd (t) of (request unskilled
agricultural workers).
Similarly, in urban areas, some unskilled workers
are unemployed, unable to fit into the urban
private sector, and refusing a public or informal
employment. The number of unskilled
unemployment in the urban formal sector is
presented in accounting. It is equal to the labor
unskilled in the formal urban sector, fewer
unskilled workers working in the government
sector or private urban.
The number of unskilled unemployed in the urban
formal sector and the number of unskilled
unemployed in private urban are equivalent.
Indeed, the sector g, which includes commercial
and public employment, is not supposed to be
unemployed.
If the number of unemployed is presented in
Available online at: www.ijassh.com
Touitou Mohammed & Boudeghdegh Ahmed| June. 2014 | Vol.2 | Issue 6|35-48 39
accounting, labor demand is explained by
economic functions.
Labor Demand
The demand for unskilled agricultural workers
depends on the economic state of the sector and
the cost represented by the wages of an unskilled
worker2. The economic state of the agricultural
sector is measured by wealth creation, which is to
say by the sector's value added. It is, in our
equation, expressed in relative terms, as divided
by the wage of an agricultural worker. The ratio is
calculated for the period t-1, and explains the
demand for agricultural workers in year t. This
time lag can be explained if we consider that
hiring in period t is not possible for a company, if
it has previously created enough relative wealth.
At first glance, this lag is not retained in the
demand equation in the private non- skilled
urban sector. Explicitly, this application depends
solely on a cost criterion. Are taken into account
the wages of skilled and unskilled workers, the
cost of capital, as well as taxes and subsidies on
wages. Such an assumption was also present in
the model of AGENOR et al. [1].
Salary of Unskilled Industrial Workers
The salary assigned to unskilled workers in the
private sector urban Algerian was not modeled
endogenously by AGENOR et al. We propose to
do, and consider, in our model, that wage is an
increasing function of the minimum wage, of the
economic state of the sector (represented by value
added), and decreasing the supply of labor-
'unskilled work sent to private urban sector.
Determinants of wages paid to unskilled
industrial workers were selected to refine further
the Algerian context. The wages paid depending
in particular the behavior of contractors, the
value added was chosen as a determinant of
wages: if the economic state of the sector
(represented by value added) is good, the funds
available to the contractor increase, and make
possible the payment of a higher salary. However,
as explained in neoclassical analysis, the salary
also depends on the labor supply addressed to the
sector. This justifies the choice of supply labor
unskilled as a determinant of wages. Moreover, in
practice, the abundance of labor supply is an
argument to play for lower wages.
Yet Keynesian analysis highlights that there may
be rigidities from disrupting the regulation of
markets described by the neo-classical. In this
2Agenor et al. evoked all importance of wage in regulation of the
agricultural labor market.
case, the salary is only partially explained by
labor supply. Among rigidities disturbing the
functioning of the market, it is possible to
mention the bad expectations of entrepreneurs
when the future economic activity. To correct
these expectations, the State must send clear
signals to contractors, to encourage them to invest
and grow their business. The rise of activity
encourages hiring, labor demand therefore
increases. Consequently, the wages paid by firms’
increases. Among the clear signals to contractors,
it is possible to include the minimum wage. If it
increases, contractors can anticipate an increase
in consumption, and therefore an increase in
activity for their businesses. It should follow an
increase in the demand for labor and higher
wages paid by contractors. Thus, the minimum
wage is seen as a promise of consumption or as an
expense to reduce it remains warranted among
the variables explaining the salary. Furthermore,
the evolutionary analysis emphasizes that "the
environment", represented by economic
conditions, legislative, etc. Influences on business
activity. This belief is also present in some works
of sociologists such as Durkheim (1975). The
evolutionary analysis, like sociology, therefore
justifies the choice to introduce legislation as an
explanatory variable, via the minimum wage.
Accordingly, our equation is dealing with
sociology as well as the major theoretical
economic.
The existence of endogenous wage helps explain
why contractors of private urban sector do not
directly take into account the economic situation
of their sector in their demand function for labor.
Decreasing due to a decline in value added, the
wage paid is "buffer", and allows mitigate
negative shocks known by private urban sector.
This salary is explained for the period (t), by the
minimum wage in the same period, representing
the legal constraints of the moment. For cons, the
economic state of the private urban sector
(measured by value added) and supply unskilled
labor, which also explain the wage paid, are given
for the period (t-1). This time lag is explained
again by the fact that the wealth created in the
previous period affects the conditions of
employment of the current period. The wealth
created in the period (t-1) is expressed in relative
terms, being divided by the supply of unskilled
labor addressed to sector p for the period (t-1).
This ratio therefore measures the wealth creation
in the sector p in terms of job applicants in this
sector. For the agricultural sector, we divided the
value added by the salary. It would have been
Available online at: www.ijassh.com
Touitou Mohammed & Boudeghdegh Ahmed| June. 2014 | Vol.2 | Issue 6|35-48 40
possible to proceed in the same way for the sector
p, but we preferred to replace wage by labor
supply. This allows introducing into the analysis
the idea that the supply of unskilled labor,
especially the number of unemployed in the sector
at the period (t-1), affects the wage paid for the
period (t). This model assumes that the salary is
flexible, and is a decreasing function of the offer
unskilled labor addressed to sector. It was
apparently more logical to accept the job offer
from the period (t) rather than the period (t-1),
but this caused a problem of implicitness in some
equations. To solve the problem, we used the
supply of unskilled labor in the period (t-1). This
choice is justified, considering that past value of a
variable is one of the best predictors of this
variable3.
Labor Supply
In the model, labor supply can be presented so
accountantor explained by economic criteria,
according to the chosen sector. Thus, the supply of
agricultural labor is equal to the active rural
population, less migrant labor4. On the supply of
unskilled labor in the formal sector, it is a
function of past values, on the request of unskilled
labor in the urban private sector, on unskilled
population engaged in the tertiary sector, on
wages in the informal sector andonthe wages paid
to unskilled workers in the private urban sector5.
To complete the description of the Algerian labor
market, the model takes into account a migration
through the variable MIG (t).
Migration Inter Sectoral
The variable (MIG) has negative, values because
departures to urban areas are lower than the
returns to rural areas. The migration equation is
a synthesis between the Harris-TODARO
hypothesis (migration based on the weighted
wage gap), and the hypothesis, according to the
Economics of Networks, at a certain stage,
migration dynamics of their own (the role of MIG
(t- 1)). Presented in the migration equation, the
expected rural wage depends on past price levels
3This principle establishes the causality test of GRANGER. In
addition, the supply of unskilled either deterministic or stochastic
variable, its past level is the best predictor of the variable. In the
case of a deterministic variable, this last value,however, must be
introduced into a function. This is the case in our model (Equation
15). 4This specification can be justified. In the supply equation of
agricultural labor, the growth rate of the labor of farm labor (Gr (t))
was estimated after passing the variable - MIG (t-1) on the left side
of the equation (7). Gr (t) corresponds to the growth rate would have known agricultural labor in the absence of internal migration. The
growth rate we get is "corrected" compared to the rate given by FAO,
it corresponds to the growth rate of labor given of migration. 5Our demand equation of unskilled labor in the formal sector shows
that present in the model of AGENOR et al. (2003). However we
replace the minimum wage by the wages paid to unskilled workers.
and wages in rural areas. The urban wage is said
early, because it takes into account the level of
price; it is also weighted by the probability of
finding a job. For an unskilled worker, the
probability of finding a job is a function of jobs the
previous period. Assumingthat migrants have
imperfect knowledge of the urban labor market;
the expected urban wage is based on the
minimum wage and the probability of finding
urban employment for an unskilled worker. If
market knowledge is perfect, the probability of
finding a job is not changed; by against, the urban
wage is no longer based on the minimum wage,
but on the wage paid. The assumption of perfect
knowledge of the market was selected before
performing simulations of exogenous shocks on
wages. Among these is the salary received in the
informal sector.
Wage in the Informal Sector
The salary received in the informal sector is taken
as exogenous in our model. By definition, the
informal sector is characterized by high flexibility
in the number of workers, but also working
conditions, compensation and value added. In the
model AGENOR et al. [1],value added explained
the informal wage. However, as this sector value
added is difficult to quantify, the level of informal
wage in our model was chosen so that the
equation of early urban wage (Ewu)6 is satisfied.
The level chosen was then subjected to various
shocks, upward or downward.
In addition to changing some equations devoted to
the labor market, we have also removed the
functions elasticities CES-CET present in the
model AGENOR et al.
Deleting Functions Elasticities CES-CET
It is possible to present the equation of function
elasticity CES:
𝑍 = ∅ 𝑑𝑋−𝑝 −1
𝑝 , with ∅a scale parameter, d a
distribution parameter, p a substitution
parameter, knowing that: 𝑝 =1−𝜎
𝜎 , 𝜎 elasticity of
substitution.
These functions can be to originally of bias
(reversion factor intensity preventing verification
of HOS theorem, measure erroneous of well-being
and impact effects from trade liberalization), and
based on an assumption sometimes overly
simplified: the constancy of the elasticities of
substitution and transformation [9, 11].
6𝐸𝑤𝑢 =
𝜑𝑢𝑊0 𝑡−1 +(1−𝜑𝑢 )𝑊𝑖 𝑡−1
𝑃𝑈𝑅𝐵 𝑡−1
Available online at: www.ijassh.com
Touitou Mohammed & Boudeghdegh Ahmed| June. 2014 | Vol.2 | Issue 6|35-48 41
For we overcome the problems arising from these
elasticities, we resorted to accounting equations
and modeled variables according to their
deterministic or stochastic nature.
Thus, GDP is presented in a purely accounting
way, since it is equal to the sum of value added
and net indirect taxes.
As for value added, they are measured in relative
terms, because they are divided by the number of
workers. This model does not mean that only
workers engaged in value added. It allows cons of
introducing flexible working through the number
of workers7.
The value added is not modeled linearly in CGE
models, we considered that the value added at
period (t), depends on the value added to the
period (t-1), not weighted by a coefficient but by
an exponent. The value of the exponent depends
on the stochastic or deterministic nature of value
added8.
These choices allow modeling not favor any
theoretical economic mainstream. The evolution
of value added due to a shock on wages will
depend on the size chosen for the exhibitors. Or,
these exponents were calculated from the
empirical data observed in Algeria.
The model is therefore proposed to remain as
close as possible to the Algerian reality, removing
all functions elasticities CES-CET. For this
purpose, we used a particular accounting
approach, which could lead to a loss of coherence
of the model, and non-compliance equilibrium
conditions. Thus, an accounting way, GDP can be
expressed in terms of supply, or in terms of
demand. In the approach in terms of supply, GDP
is the sum of value added and net indirect taxes.
This is the approach we have chosen in the
equation (1). For the approach in terms of
demand, GDP is equal to final consumption plus
gross capital formation, plus exports minus
imports.Or, domestic savings as we have shown in
equation (38) ensures that this approach in terms
of demand included in the model. This allows the
consistency of our model in terms of the
production supply and demand for goods by value
are equal in the studied economy.
7The writing values added relatively, by dividing by the number of
workers in the sector, does not necessarily mean that the added
values for the next period will decrease due to an increase in the
number of workers. The evolution of value added depends indeed
exhibitors, obtained by calibration.
8The exponent is equal to 1 if the variable is stochastic and equal to 1
in case of deterministic process.
The GDP equation does not separate the price and
volume of production. However, the primary
objective of models Computable General
Equilibrium (CGE) that following the Walrasian
theory is to study how markets adjust following a
shock on prices. Not always separate the price
effects of volume effects; we're getting a little of
this optical, like the EGC inspired neo-
structuralism models.
The model thus created was the subject of various
simulations. We will present and comment the
results of the impact exerted on the level of
exogenous wages.
The Simulation of Shock on Exogenous
Wages
Wage levels were selected based on data
presented by the World Bank (World
Development Indicators, 2008).
As regards the non-skilled workers, the wage in
the industrial sector is higher than the wages in
the informal and agricultural sectors. So there are
inequalities in remuneration by sector, between
workers with the same skill levels.
Wage levels were then subjected to simulated
shocks. These were applied to the level of
exogenous wage (agricultural wage, minimum
wage, wage of skilled industrial workers),
according to the following protocol research.
Scenario 1 tests the impact effects of a shock than
3% (down) on the agricultural wage Wa. Scenario
2 takes back the scenario 1, and adds the
assumption that the minimum wage increases of
5% Wm. This increase corresponds to the average
annual increase known that salary.
Finally, Scenario 3 takes back scenario 2, and
adds the assumption of an impact of 5% on Ws.
All shocks were applied in 1999, the first year of
our estimation model.
Table.4 outlines how the GDP, value added and
labor adjust due to changes simulated on wages.
Analysis and Discussion of Results
The statistics of the results given in percentages
and it represent growth rates compared to the
level of the variable in the previous scenario. For
example, in scenario 1 when the variable "GDP in
2000" increases of 0.41%, this is compared to its
value in the model has not undergone shock. On
the same principle, the results of scenario 2 are
given depending on the level variables in Scenario
Available online at: www.ijassh.com
Touitou Mohammed & Boudeghdegh Ahmed| June. 2014 | Vol.2 | Issue 6|35-48 42
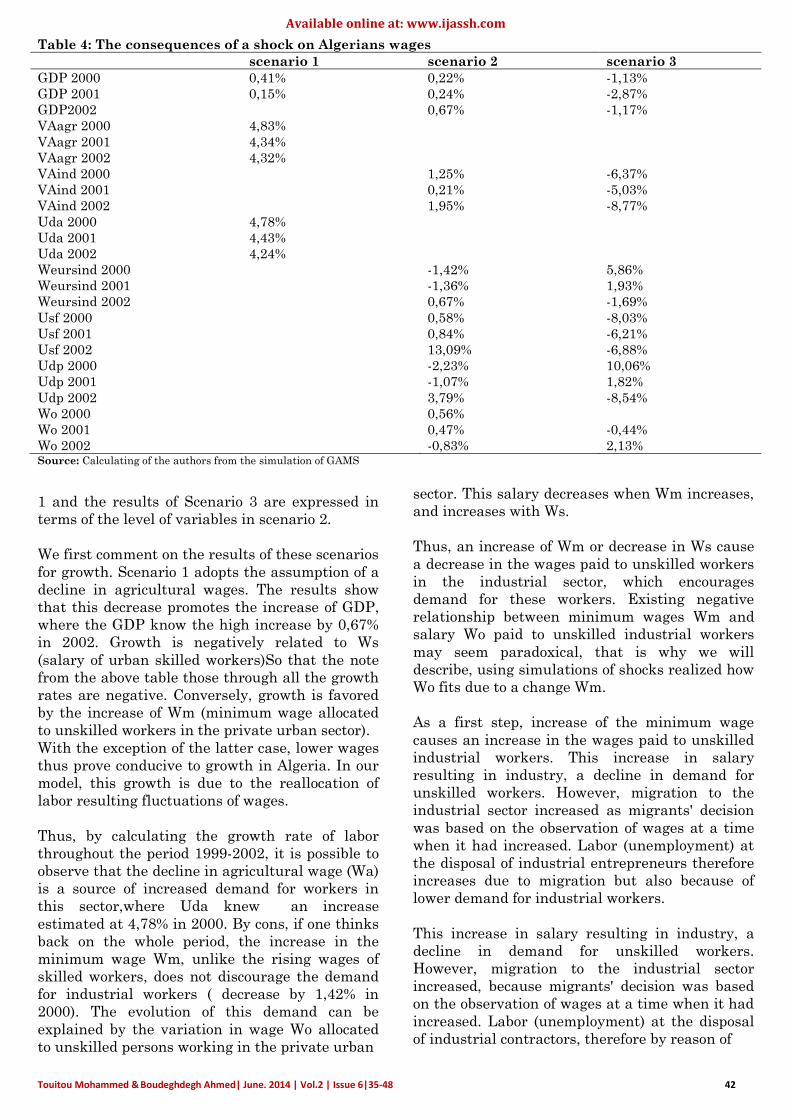
Table 4: The consequences of a shock on Algerians wages
scenario 1 scenario 2 scenario 3
GDP 2000 0,41% 0,22% -1,13%
GDP 2001 0,15% 0,24% -2,87%
GDP2002 0,67% -1,17%
VAagr 2000 4,83%
VAagr 2001 4,34%
VAagr 2002 4,32%
VAind 2000 1,25% -6,37%
VAind 2001 0,21% -5,03%
VAind 2002 1,95% -8,77%
Uda 2000 4,78%
Uda 2001 4,43%
Uda 2002 4,24%
Weursind 2000 -1,42% 5,86%
Weursind 2001 -1,36% 1,93%
Weursind 2002 0,67% -1,69%
Usf 2000 0,58% -8,03%
Usf 2001 0,84% -6,21%
Usf 2002 13,09% -6,88%
Udp 2000 -2,23% 10,06%
Udp 2001 -1,07% 1,82%
Udp 2002 3,79% -8,54%
Wo 2000 0,56%
Wo 2001 0,47% -0,44%
Wo 2002 -0,83% 2,13% Source: Calculating of the authors from the simulation of GAMS
1 and the results of Scenario 3 are expressed in
terms of the level of variables in scenario 2.
We first comment on the results of these scenarios
for growth. Scenario 1 adopts the assumption of a
decline in agricultural wages. The results show
that this decrease promotes the increase of GDP,
where the GDP know the high increase by 0,67%
in 2002. Growth is negatively related to Ws
(salary of urban skilled workers)So that the note
from the above table those through all the growth
rates are negative. Conversely, growth is favored
by the increase of Wm (minimum wage allocated
to unskilled workers in the private urban sector).
With the exception of the latter case, lower wages
thus prove conducive to growth in Algeria. In our
model, this growth is due to the reallocation of
labor resulting fluctuations of wages.
Thus, by calculating the growth rate of labor
throughout the period 1999-2002, it is possible to
observe that the decline in agricultural wage (Wa)
is a source of increased demand for workers in
this sector,where Uda knew an increase
estimated at 4,78% in 2000. By cons, if one thinks
back on the whole period, the increase in the
minimum wage Wm, unlike the rising wages of
skilled workers, does not discourage the demand
for industrial workers ( decrease by 1,42% in
2000). The evolution of this demand can be
explained by the variation in wage Wo allocated
to unskilled persons working in the private urban
sector. This salary decreases when Wm increases,
and increases with Ws.
Thus, an increase of Wm or decrease in Ws cause
a decrease in the wages paid to unskilled workers
in the industrial sector, which encourages
demand for these workers. Existing negative
relationship between minimum wages Wm and
salary Wo paid to unskilled industrial workers
may seem paradoxical, that is why we will
describe, using simulations of shocks realized how
Wo fits due to a change Wm.
As a first step, increase of the minimum wage
causes an increase in the wages paid to unskilled
industrial workers. This increase in salary
resulting in industry, a decline in demand for
unskilled workers. However, migration to the
industrial sector increased as migrants' decision
was based on the observation of wages at a time
when it had increased. Labor (unemployment) at
the disposal of industrial entrepreneurs therefore
increases due to migration but also because of
lower demand for industrial workers.
This increase in salary resulting in industry, a
decline in demand for unskilled workers.
However, migration to the industrial sector
increased, because migrants' decision was based
on the observation of wages at a time when it had
increased. Labor (unemployment) at the disposal
of industrial contractors, therefore by reason of
Available online at: www.ijassh.com
Touitou Mohammed & Boudeghdegh Ahmed| June. 2014 | Vol.2 | Issue 6|35-48 43
migration but also because of lower demand for
industrial workers.
This abundance of labor unskilled seeking
employment fact lowers wage Wo paid in the
industry. Reduced wages favors then hiring
unskilled industrial workers. This increases the
probability of finding a job in the industrial
sector; Migration to industry therefore continues,
despite the decline of wages paid. This results is
obtained when is retaining the assumption of
perfect information for migrants: they know that
the salary is a negative function of labor supply,
but nonetheless decided to migrate due to the
increased likelihood of finding a job in the private
urban sector.
The negative relationship existing between Wm
and Wo carries another teaching: in Algeria, the
abundance of labor available to business leaders
in the industrial sector plays a key role on the
level of wages paid to unskilled workers in the
private urban sector. Thus, any reduction of
industrial unemployment resulting from such a
job in the informal sector contributes to increase
the wages Wmpaid to unskilled industrial
workers. It is also possible to consider that in
Algeria, whatever the sector of activity concerned,
the wage paid is seen as a burden rather than
reduce consumption as a promise.
Thus, the increase in the minimum wage Wm,
increasing labor unskilled available to business
leaders in the industry sector, allows them to pay
a lower wage Wo to the previous period. This
lower wage Wo proves favorable to the growth and
increase in industrial value added9.
Regarding the agricultural wage, Scenario 1
shows that the decrease promotes growth, but
essentially only one year after the wage has
fallen. As decreases in wages in the private urban
sector, the results of scenarios 2 and 3 shows that
the gains in terms of growth are fairly evenly
distributed over time. Therefore promote growth
through lower wages is a potential source of more
constraints for agricultural workers that for
workers in the industrial sector.
The result of growth based in particular on the
low wages10, asthe result of growthmore binding
9There is therefore a bi-univocal relation between wages Wo and
industrial value added. This is one of the variables explaining the
wage Wo. In turn, a variation of Wo will exert impact effects on the
number of workers involved and the industrial value added. 10
The model that we realized highlights one of the sources of growth
in Algeria: the low level of wages. The economic history of Algeria
could invalidate this result. Note, however, that if other sources of
for agricultural workers, were obtained by
modeling the values added depending on their
deterministic or stochastic nature. GDP is
expressed in a purely accounting form. This is
also the case of the supply of agricultural labor.
On the supply of unskilled labor addressed to the
urban formal sector work, it is based on economic
criteria, but the answer of this offer to a shock
depends on the wage Wo Exhibitor bf (t). Or, it is
calculated from the observed data in Algeria. This
is also the case for the coefficients governing the
evolution of sectoral demands for labor.
These choices allow us to not favour any economic
way of thought. Consequently, our results are
obtained from remaining closer to the Algerian
reality equations. The model performed equally
respects the different proportions observed in the
Algerian labor market (number of workers in each
sector, share of skilled and unskilled workers in
the various sectors).
Conclusion
Shocks exerted on our model show that in Algeria,
low wages is one of the sources of growth. This is
the case regardless of the sector concerned. The
desire to reduce inequality by increasing wages in
the agricultural sector, this would bring the wage
paid to unskilled workers in the industrial sector.
Such a comparison would be against by
unfavourable to agricultural value added, as well
as growth in Algeria.
As for wages paid to unskilled industrial workers
(Wo), it is influenced by the particular legal
context. This influence is apparently paradoxical,
since the increase in the minimum industrial
wage (Wm) helps to reduce the wages paid to
unskilled sector. However, this result can be
explained logically: the minimum wage increase is
accompanied by an increase in the supply of
unskilled labor addressed to industrial sector. Or,
this increase in available labor favours lower
wage in the sector. It is possible to draw several
conclusions from this result.
First, any employment in the informal sector,
which would lower the workforce available to of
industrial Heads business, chipped the result of
negative link between wages Wm and Wo.
Second, policies to increase the minimum wage
(industrial) reduce pay inequality between
unskilled workers. As this reduction in inequality
growth have sufficiently positive impact effects on GDP, it becomes
possible to increase salaries, although this increase slows growth.
Available online at: www.ijassh.com
Touitou Mohammed & Boudeghdegh Ahmed| June. 2014 | Vol.2 | Issue 6|35-48 44
is decreasing the wage in the industrial sector, it
is favourable to the sector's value added, as well
as growth in Algeria.
In addition, as our present model, the reduction of
wages paid to unskilled industrial accompanied
by internal migration and encourage the hiring of
workers from the agricultural sector. Like that,
despite its decline, the salary Wo paid to unskilled
industrial sector remains above the agricultural
wage, it is possible to consider that migrants
engaged in the industrial sector have reduced
inequality, based on the increased income. This
increase of revenue is accompanied by an increase
in GDP, confirming the relevance of the concept of
"poverty trap" for a category of workers: the
agricultural Migrant engaged in the industrial
sector.
References
1. Agenor PA et al (2003) Labor market reforms,
growth, and unemployment in Labor-exporting
MENA Countries, Working Papers, The World
Bank, Washington, 65 p. Published in 2007 in the
journal newspaper of Policy Modelling. 27(2).
2. Lewis WA (1954) Economic development with
unlimited supplies of labour, Manchester School of
Economics and Social Studies. 22:139-91
3. Atkinson A, Brandolini A (2004) Global world
inequality : absolute, relative or intermediate ?,
Paper prepared for the 28th General Conference of
the International Association for Research in
Income and Wealth, Cork, Ireland, August 22-28.
4. Milanovic B (2005) Worlds apart: international and
global inequality 1950-2000, Princeton, N.J.,
Princeton University Press.
5. Dollar D, Kraay A (2001) Spreading the wealth,
Foreign Affairs, 81.
6. Bourguignon F (2004) The Poverty-Growth-
Inequality Triangle, Working Document of the
World Bank.
7. Bchir H et al (2005) Trade, employment and wages
in Tunisia: an integrated and dynamic CGE model″,
Rapport FEMISE n°FEM2-02-21-29, 48 p.
8. Bibi S, Chatti R (2006) Trade liberalization and the
dynamics of poverty in Tunisia: a layered CGE
micro simulation analysis, MPIA Working Paper.
9. Brechet T (1999) SPOT: an applied general
equilibrium model of the Belgian economy, Working
Paper 5-99, Federal Planning Bureau, Brussels.
p.102.
10. FAO (1999) Report urban agriculture andperi-
urban, 15th session of the Committee of Agriculture
(COAG), Rome 25-29.
11. Hertel T.et al (2004) How confident can we be in
CGE-based assessments of free trade agreements?
NBER Working Paper. n° 10477.
12. Milanovic B (2005) Worlds apart: international and
global inequality 1950-2000, Princeton, N.J.,
Princeton University Press.
13. Nabli M (1997) The Fiscal Dimension of the
European-Mediterranean Challenge, World Bank,
Manuscript
14. Devarajan S.et al(1993), Policy lessons from a
simple, open-economy model, World Bank.
15. Berthomieu C, Bonetto F (2005) Analysis of public
investment with growth ( capacity building public
investments ) and their financing difficulties -
Study cases of five Mediterranean partner countries
of the European Union: Morocco, Tunisia, Turkey,
Egypt, Lebanon," Final Report research project
FEM22-26, 57 .
Available online at: www.ijassh.com
Touitou Mohammed & Boudeghdegh Ahmed| June. 2014 | Vol.2 | Issue 6|35-48 45
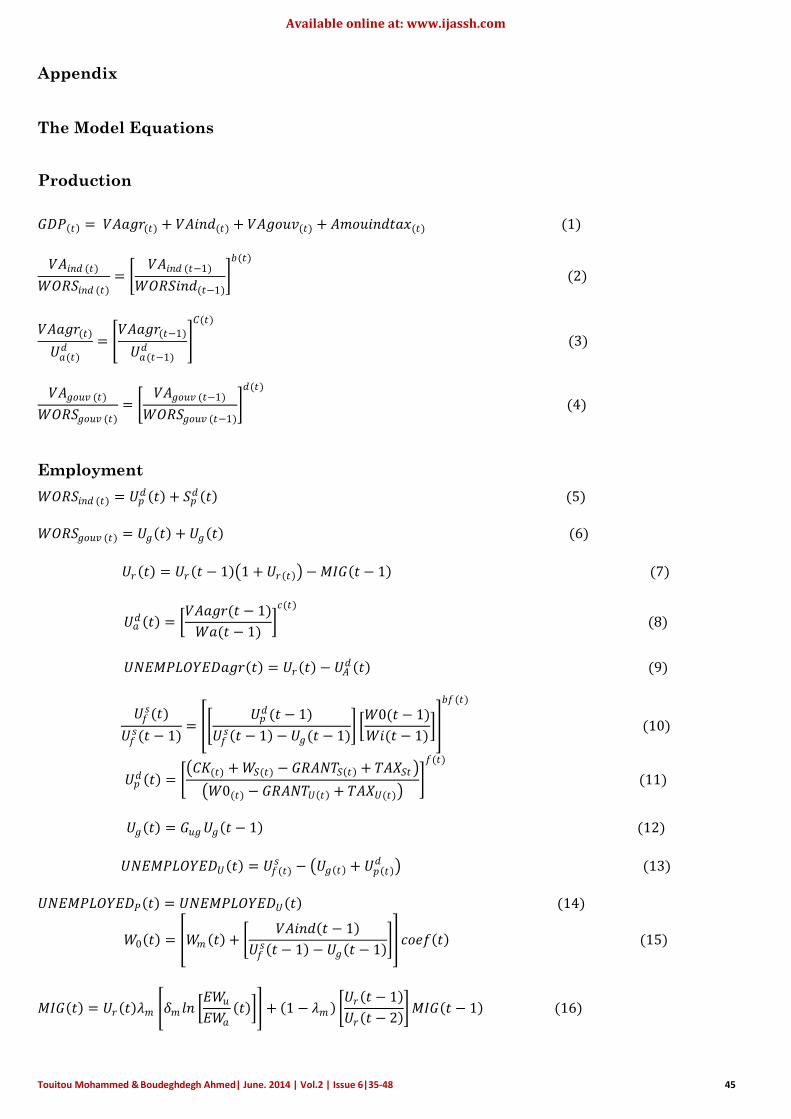
Appendix
The Model Equations
Production
𝐺𝐷𝑃 𝑡 = 𝑉𝐴𝑎𝑔𝑟(𝑡) + 𝑉𝐴𝑖𝑛𝑑(𝑡) + 𝑉𝐴𝑔𝑜𝑢𝑣(𝑡) + 𝐴𝑚𝑜𝑢𝑖𝑛𝑑𝑡𝑎𝑥(𝑡) (1)
𝑉𝐴𝑖𝑛𝑑 (𝑡)
𝑊𝑂𝑅𝑆𝑖𝑛𝑑 (𝑡)=
𝑉𝐴𝑖𝑛𝑑 (𝑡−1)
𝑊𝑂𝑅𝑆𝑖𝑛𝑑(𝑡−1)
𝑏(𝑡)
(2)
𝑉𝐴𝑎𝑔𝑟(𝑡)
𝑈𝑎(𝑡)𝑑 =
𝑉𝐴𝑎𝑔𝑟(𝑡−1)
𝑈𝑎(𝑡−1)𝑑
𝐶(𝑡)
(3)
𝑉𝐴𝑔𝑜𝑢𝑣 (𝑡)
𝑊𝑂𝑅𝑆𝑔𝑜𝑢𝑣 (𝑡)=
𝑉𝐴𝑔𝑜𝑢𝑣 (𝑡−1)
𝑊𝑂𝑅𝑆𝑔𝑜𝑢𝑣 (𝑡−1)
𝑑(𝑡)
(4)
Employment
𝑊𝑂𝑅𝑆𝑖𝑛𝑑 (𝑡) = 𝑈𝑝𝑑 𝑡 + 𝑆𝑝
𝑑 𝑡 (5)
𝑊𝑂𝑅𝑆𝑔𝑜𝑢𝑣 (𝑡) = 𝑈𝑔 𝑡 + 𝑈𝑔 𝑡 (6)
𝑈𝑟 𝑡 = 𝑈𝑟 𝑡 − 1 1 + 𝑈𝑟 𝑡 − 𝑀𝐼𝐺 𝑡 − 1 (7)
𝑈𝑎𝑑 𝑡 =
𝑉𝐴𝑎𝑔𝑟(𝑡 − 1)
𝑊𝑎(𝑡 − 1) 𝑐(𝑡)
(8)
𝑈𝑁𝐸𝑀𝑃𝐿𝑂𝑌𝐸𝐷𝑎𝑔𝑟 𝑡 = 𝑈𝑟 𝑡 − 𝑈𝐴𝑑 𝑡 (9)
𝑈𝑓𝑠(𝑡)
𝑈𝑓𝑠(𝑡 − 1)
= 𝑈𝑝
𝑑(𝑡 − 1)
𝑈𝑓𝑠 𝑡 − 1 − 𝑈𝑔(𝑡 − 1)
𝑊0(𝑡 − 1)
𝑊𝑖(𝑡 − 1)
𝑏𝑓(𝑡)
(10)
𝑈𝑝𝑑 𝑡 =
𝐶𝐾(𝑡) + 𝑊𝑆(𝑡) − 𝐺𝑅𝐴𝑁𝑇𝑆 𝑡 + 𝑇𝐴𝑋𝑆𝑡
𝑊0(𝑡) − 𝐺𝑅𝐴𝑁𝑇𝑈 𝑡 + 𝑇𝐴𝑋𝑈(𝑡)
𝑓(𝑡)
(11)
𝑈𝑔 𝑡 = 𝐺𝑢𝑔𝑈𝑔 𝑡 − 1 (12)
𝑈𝑁𝐸𝑀𝑃𝐿𝑂𝑌𝐸𝐷𝑈 𝑡 = 𝑈𝑓(𝑡)𝑠 − 𝑈𝑔 𝑡 + 𝑈𝑝 𝑡
𝑑 (13)
𝑈𝑁𝐸𝑀𝑃𝐿𝑂𝑌𝐸𝐷𝑃 𝑡 = 𝑈𝑁𝐸𝑀𝑃𝐿𝑂𝑌𝐸𝐷𝑈 𝑡 (14)
𝑊0 𝑡 = 𝑊𝑚 𝑡 + 𝑉𝐴𝑖𝑛𝑑 𝑡 − 1
𝑈𝑓𝑠 𝑡 − 1 − 𝑈𝑔 𝑡 − 1
𝑐𝑜𝑒𝑓 𝑡 (15)
𝑀𝐼𝐺 𝑡 = 𝑈𝑟 𝑡 𝜆𝑚 𝛿𝑚 𝑙𝑛 𝐸𝑊𝑢
𝐸𝑊𝑎
𝑡 + 1 − 𝜆𝑚 𝑈𝑟 𝑡 − 1
𝑈𝑟 𝑡 − 2 𝑀𝐼𝐺 𝑡 − 1 (16)
Available online at: www.ijassh.com
Touitou Mohammed & Boudeghdegh Ahmed| June. 2014 | Vol.2 | Issue 6|35-48 46
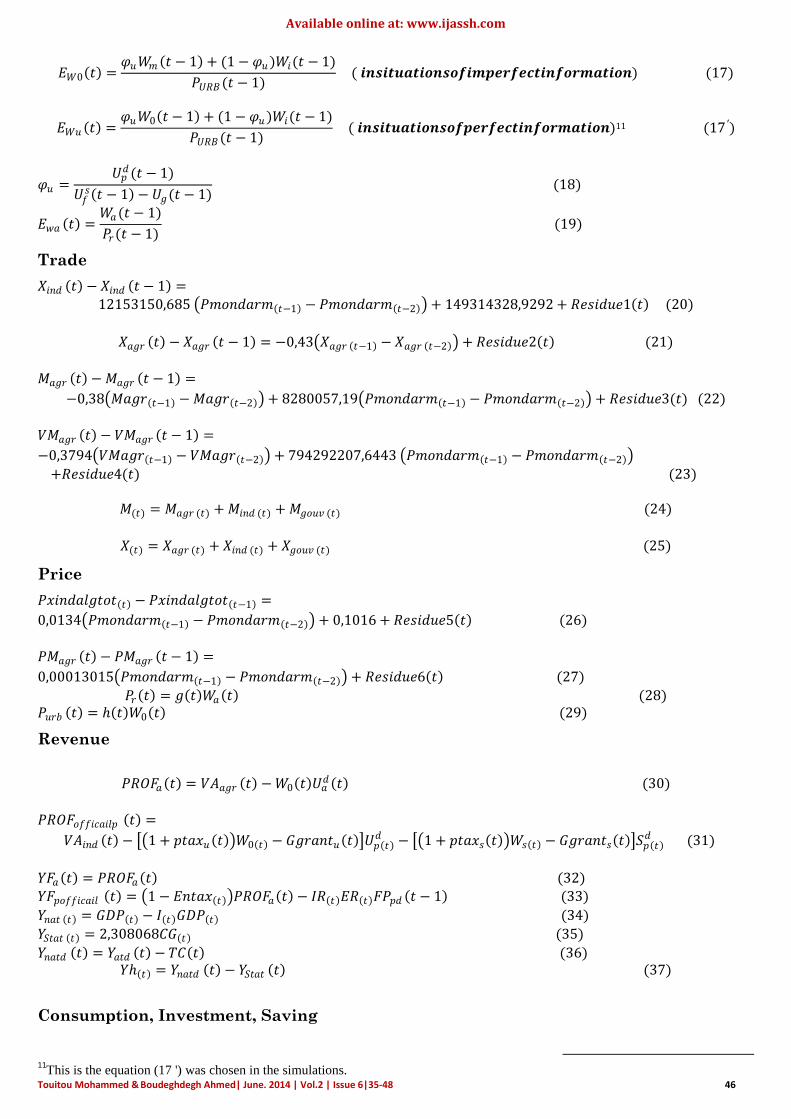
𝐸𝑊0 𝑡 =𝜑𝑢𝑊𝑚 𝑡 − 1 + (1 − 𝜑𝑢)𝑊𝑖(𝑡 − 1)
𝑃𝑈𝑅𝐵(𝑡 − 1) ( 𝒊𝒏𝒔𝒊𝒕𝒖𝒂𝒕𝒊𝒐𝒏𝒔𝒐𝒇𝒊𝒎𝒑𝒆𝒓𝒇𝒆𝒄𝒕𝒊𝒏𝒇𝒐𝒓𝒎𝒂𝒕𝒊𝒐𝒏) (17)
𝐸𝑊𝑢 𝑡 =𝜑𝑢𝑊0 𝑡 − 1 + (1 − 𝜑𝑢)𝑊𝑖(𝑡 − 1)
𝑃𝑈𝑅𝐵(𝑡 − 1) ( 𝒊𝒏𝒔𝒊𝒕𝒖𝒂𝒕𝒊𝒐𝒏𝒔𝒐𝒇𝒑𝒆𝒓𝒇𝒆𝒄𝒕𝒊𝒏𝒇𝒐𝒓𝒎𝒂𝒕𝒊𝒐𝒏)11 (17′)
𝜑𝑢 =𝑈𝑝
𝑑(𝑡 − 1)
𝑈𝑓𝑠 𝑡 − 1 − 𝑈𝑔(𝑡 − 1)
(18)
𝐸𝑤𝑎 𝑡 =𝑊𝑎(𝑡 − 1)
𝑃𝑟(𝑡 − 1) (19)
Trade
𝑋𝑖𝑛𝑑 𝑡 − 𝑋𝑖𝑛𝑑 𝑡 − 1 =
12153150,685 𝑃𝑚𝑜𝑛𝑑𝑎𝑟𝑚 𝑡−1 − 𝑃𝑚𝑜𝑛𝑑𝑎𝑟𝑚 𝑡−2 + 149314328,9292 + 𝑅𝑒𝑠𝑖𝑑𝑢𝑒1 𝑡 (20)
𝑋𝑎𝑔𝑟 𝑡 − 𝑋𝑎𝑔𝑟 𝑡 − 1 = −0,43 𝑋𝑎𝑔𝑟 𝑡−1 − 𝑋𝑎𝑔𝑟 𝑡−2 + 𝑅𝑒𝑠𝑖𝑑𝑢𝑒2 𝑡 (21)
𝑀𝑎𝑔𝑟 𝑡 − 𝑀𝑎𝑔𝑟 𝑡 − 1 =
−0,38 𝑀𝑎𝑔𝑟 𝑡−1 − 𝑀𝑎𝑔𝑟 𝑡−2 + 8280057,19 𝑃𝑚𝑜𝑛𝑑𝑎𝑟𝑚 𝑡−1 − 𝑃𝑚𝑜𝑛𝑑𝑎𝑟𝑚 𝑡−2 + 𝑅𝑒𝑠𝑖𝑑𝑢𝑒3(𝑡) (22)
𝑉𝑀𝑎𝑔𝑟 𝑡 − 𝑉𝑀𝑎𝑔𝑟 𝑡 − 1 =
−0,3794 𝑉𝑀𝑎𝑔𝑟 𝑡−1 − 𝑉𝑀𝑎𝑔𝑟 𝑡−2 + 794292207,6443 𝑃𝑚𝑜𝑛𝑑𝑎𝑟𝑚 𝑡−1 − 𝑃𝑚𝑜𝑛𝑑𝑎𝑟𝑚 𝑡−2
+𝑅𝑒𝑠𝑖𝑑𝑢𝑒4(𝑡) (23)
𝑀(𝑡) = 𝑀𝑎𝑔𝑟 (𝑡) + 𝑀𝑖𝑛𝑑 (𝑡) + 𝑀𝑔𝑜𝑢𝑣 (𝑡) (24)
𝑋(𝑡) = 𝑋𝑎𝑔𝑟 (𝑡) + 𝑋𝑖𝑛𝑑 (𝑡) + 𝑋𝑔𝑜𝑢𝑣 (𝑡) (25)
Price
𝑃𝑥𝑖𝑛𝑑𝑎𝑙𝑔𝑡𝑜𝑡 𝑡 − 𝑃𝑥𝑖𝑛𝑑𝑎𝑙𝑔𝑡𝑜𝑡 𝑡−1 =
0,0134 𝑃𝑚𝑜𝑛𝑑𝑎𝑟𝑚 𝑡−1 − 𝑃𝑚𝑜𝑛𝑑𝑎𝑟𝑚 𝑡−2 + 0,1016 + 𝑅𝑒𝑠𝑖𝑑𝑢𝑒5 𝑡 (26)
𝑃𝑀𝑎𝑔𝑟 𝑡 − 𝑃𝑀𝑎𝑔𝑟 𝑡 − 1 =
0,00013015 𝑃𝑚𝑜𝑛𝑑𝑎𝑟𝑚 𝑡−1 − 𝑃𝑚𝑜𝑛𝑑𝑎𝑟𝑚 𝑡−2 + 𝑅𝑒𝑠𝑖𝑑𝑢𝑒6 𝑡 (27)
𝑃𝑟 𝑡 = 𝑔 𝑡 𝑊𝑎 𝑡 (28) 𝑃𝑢𝑟𝑏 𝑡 = 𝑡 𝑊0 𝑡 (29)
Revenue
𝑃𝑅𝑂𝐹𝑎 𝑡 = 𝑉𝐴𝑎𝑔𝑟 𝑡 − 𝑊0 𝑡 𝑈𝑎𝑑 𝑡 (30)
𝑃𝑅𝑂𝐹𝑜𝑓𝑓𝑖𝑐𝑎𝑖𝑙𝑝 𝑡 =
𝑉𝐴𝑖𝑛𝑑 𝑡 − 1 + 𝑝𝑡𝑎𝑥𝑢 𝑡 𝑊0 𝑡 − 𝐺𝑔𝑟𝑎𝑛𝑡𝑢 𝑡 𝑈𝑝 𝑡 𝑑 − 1 + 𝑝𝑡𝑎𝑥𝑠 𝑡 𝑊𝑠 𝑡 − 𝐺𝑔𝑟𝑎𝑛𝑡𝑠 𝑡 𝑆𝑝 𝑡
𝑑 (31)
𝑌𝐹𝑎 𝑡 = 𝑃𝑅𝑂𝐹𝑎 𝑡 (32)
𝑌𝐹𝑝𝑜𝑓𝑓𝑖𝑐𝑎𝑖𝑙 𝑡 = 1 − 𝐸𝑛𝑡𝑎𝑥 𝑡 𝑃𝑅𝑂𝐹𝑎 𝑡 − 𝐼𝑅 𝑡 𝐸𝑅 𝑡 𝐹𝑃𝑝𝑑 𝑡 − 1 (33)
𝑌𝑛𝑎𝑡 𝑡 = 𝐺𝐷𝑃 𝑡 − 𝐼 𝑡 𝐺𝐷𝑃 𝑡 (34)
𝑌𝑆𝑡𝑎𝑡 𝑡 = 2,308068𝐶𝐺 𝑡 (35)
𝑌𝑛𝑎𝑡𝑑 𝑡 = 𝑌𝑎𝑡𝑑 𝑡 − 𝑇𝐶 𝑡 (36) 𝑌 𝑡 = 𝑌𝑛𝑎𝑡𝑑 𝑡 − 𝑌𝑆𝑡𝑎𝑡 𝑡 (37)
Consumption, Investment, Saving
11
This is the equation (17 ') was chosen in the simulations.
Available online at: www.ijassh.com
Touitou Mohammed & Boudeghdegh Ahmed| June. 2014 | Vol.2 | Issue 6|35-48 47
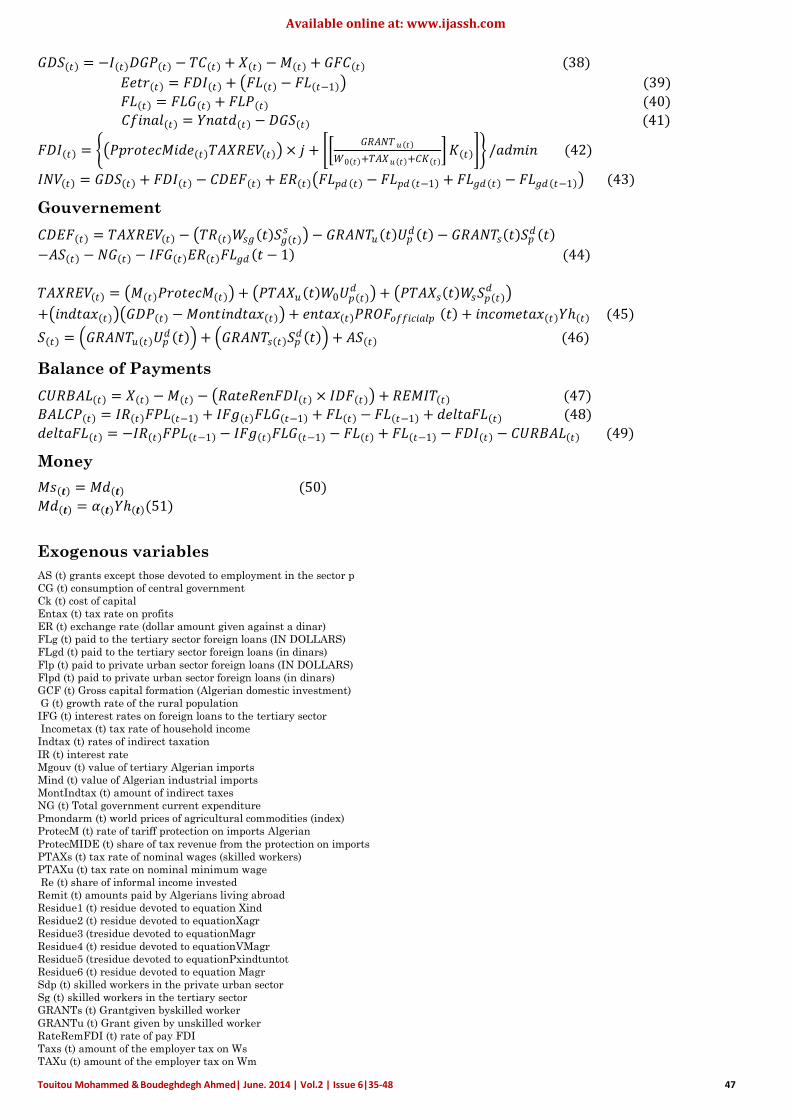
𝐺𝐷𝑆 𝑡 = −𝐼 𝑡 𝐷𝐺𝑃 𝑡 − 𝑇𝐶 𝑡 + 𝑋 𝑡 − 𝑀 𝑡 + 𝐺𝐹𝐶 𝑡 (38)
𝐸𝑒𝑡𝑟 𝑡 = 𝐹𝐷𝐼 𝑡 + 𝐹𝐿 𝑡 − 𝐹𝐿 𝑡−1 (39)
𝐹𝐿 𝑡 = 𝐹𝐿𝐺 𝑡 + 𝐹𝐿𝑃 𝑡 (40)
𝐶𝑓𝑖𝑛𝑎𝑙 𝑡 = 𝑌𝑛𝑎𝑡𝑑 𝑡 − 𝐷𝐺𝑆 𝑡 (41)
𝐹𝐷𝐼 𝑡 = 𝑃𝑝𝑟𝑜𝑡𝑒𝑐𝑀𝑖𝑑𝑒 𝑡 𝑇𝐴𝑋𝑅𝐸𝑉 𝑡 × 𝑗 + 𝐺𝑅𝐴𝑁𝑇 𝑢 𝑡
𝑊0 𝑡 +𝑇𝐴𝑋𝑢 𝑡 +𝐶𝐾 𝑡 𝐾 𝑡 /𝑎𝑑𝑚𝑖𝑛 (42)
𝐼𝑁𝑉 𝑡 = 𝐺𝐷𝑆 𝑡 + 𝐹𝐷𝐼 𝑡 − 𝐶𝐷𝐸𝐹 𝑡 + 𝐸𝑅 𝑡 𝐹𝐿𝑝𝑑 𝑡 − 𝐹𝐿𝑝𝑑 𝑡−1 + 𝐹𝐿𝑔𝑑 𝑡 − 𝐹𝐿𝑔𝑑 𝑡−1 (43)
Gouvernement
𝐶𝐷𝐸𝐹 𝑡 = 𝑇𝐴𝑋𝑅𝐸𝑉 𝑡 − 𝑇𝑅 𝑡 𝑊𝑠𝑔 𝑡 𝑆𝑔 𝑡 𝑠 − 𝐺𝑅𝐴𝑁𝑇𝑢 𝑡 𝑈𝑝
𝑑 𝑡 − 𝐺𝑅𝐴𝑁𝑇𝑠 𝑡 𝑆𝑝𝑑 𝑡
−𝐴𝑆 𝑡 − 𝑁𝐺 𝑡 − 𝐼𝐹𝐺 𝑡 𝐸𝑅 𝑡 𝐹𝐿𝑔𝑑 𝑡 − 1 (44)
𝑇𝐴𝑋𝑅𝐸𝑉 𝑡 = 𝑀 𝑡 𝑃𝑟𝑜𝑡𝑒𝑐𝑀 𝑡 + 𝑃𝑇𝐴𝑋𝑢 𝑡 𝑊0𝑈𝑝 𝑡 𝑑 + 𝑃𝑇𝐴𝑋𝑠 𝑡 𝑊𝑠𝑆𝑝 𝑡
𝑑
+ 𝑖𝑛𝑑𝑡𝑎𝑥 𝑡 𝐺𝐷𝑃 𝑡 − 𝑀𝑜𝑛𝑡𝑖𝑛𝑑𝑡𝑎𝑥 𝑡 + 𝑒𝑛𝑡𝑎𝑥 𝑡 𝑃𝑅𝑂𝐹𝑜𝑓𝑓𝑖𝑐𝑖𝑎𝑙𝑝 𝑡 + 𝑖𝑛𝑐𝑜𝑚𝑒𝑡𝑎𝑥 𝑡 𝑌 𝑡 (45)
𝑆 𝑡 = 𝐺𝑅𝐴𝑁𝑇𝑢 𝑡 𝑈𝑝𝑑 𝑡 + 𝐺𝑅𝐴𝑁𝑇𝑠 𝑡 𝑆𝑝
𝑑 𝑡 + 𝐴𝑆 𝑡 (46)
Balance of Payments
𝐶𝑈𝑅𝐵𝐴𝐿 𝑡 = 𝑋 𝑡 − 𝑀 𝑡 − 𝑅𝑎𝑡𝑒𝑅𝑒𝑛𝐹𝐷𝐼 𝑡 × 𝐼𝐷𝐹 𝑡 + 𝑅𝐸𝑀𝐼𝑇 𝑡 (47)
𝐵𝐴𝐿𝐶𝑃 𝑡 = 𝐼𝑅 𝑡 𝐹𝑃𝐿 𝑡−1 + 𝐼𝐹𝑔 𝑡 𝐹𝐿𝐺 𝑡−1 + 𝐹𝐿 𝑡 − 𝐹𝐿 𝑡−1 + 𝑑𝑒𝑙𝑡𝑎𝐹𝐿 𝑡 (48)
𝑑𝑒𝑙𝑡𝑎𝐹𝐿 𝑡 = −𝐼𝑅 𝑡 𝐹𝑃𝐿 𝑡−1 − 𝐼𝐹𝑔 𝑡 𝐹𝐿𝐺 𝑡−1 − 𝐹𝐿 𝑡 + 𝐹𝐿 𝑡−1 − 𝐹𝐷𝐼 𝑡 − 𝐶𝑈𝑅𝐵𝐴𝐿 𝑡 (49)
Money
𝑀𝑠 𝒕 = 𝑀𝑑 𝒕 (50)
𝑀𝑑 𝒕 = 𝛼 𝒕 𝑌 𝒕 (51)
Exogenous variables
AS (t) grants except those devoted to employment in the sector p
CG (t) consumption of central government
Ck (t) cost of capital
Entax (t) tax rate on profits
ER (t) exchange rate (dollar amount given against a dinar)
FLg (t) paid to the tertiary sector foreign loans (IN DOLLARS)
FLgd (t) paid to the tertiary sector foreign loans (in dinars)
Flp (t) paid to private urban sector foreign loans (IN DOLLARS)
Flpd (t) paid to private urban sector foreign loans (in dinars)
GCF (t) Gross capital formation (Algerian domestic investment)
G (t) growth rate of the rural population
IFG (t) interest rates on foreign loans to the tertiary sector
Incometax (t) tax rate of household income
Indtax (t) rates of indirect taxation
IR (t) interest rate
Mgouv (t) value of tertiary Algerian imports
Mind (t) value of Algerian industrial imports
MontIndtax (t) amount of indirect taxes
NG (t) Total government current expenditure
Pmondarm (t) world prices of agricultural commodities (index)
ProtecM (t) rate of tariff protection on imports Algerian
ProtecMIDE (t) share of tax revenue from the protection on imports
PTAXs (t) tax rate of nominal wages (skilled workers)
PTAXu (t) tax rate on nominal minimum wage
Re (t) share of informal income invested
Remit (t) amounts paid by Algerians living abroad
Residue1 (t) residue devoted to equation Xind
Residue2 (t) residue devoted to equationXagr
Residue3 (tresidue devoted to equationMagr
Residue4 (t) residue devoted to equationVMagr
Residue5 (tresidue devoted to equationPxindtuntot
Residue6 (t) residue devoted to equation Magr
Sdp (t) skilled workers in the private urban sector
Sg (t) skilled workers in the tertiary sector
GRANTs (t) Grantgiven byskilled worker
GRANTu (t) Grant given by unskilled worker
RateRemFDI (t) rate of pay FDI
Taxs (t) amount of the employer tax on Ws
TAXu (t) amount of the employer tax on Wm
Available online at: www.ijassh.com
Touitou Mohammed & Boudeghdegh Ahmed| June. 2014 | Vol.2 | Issue 6|35-48 48
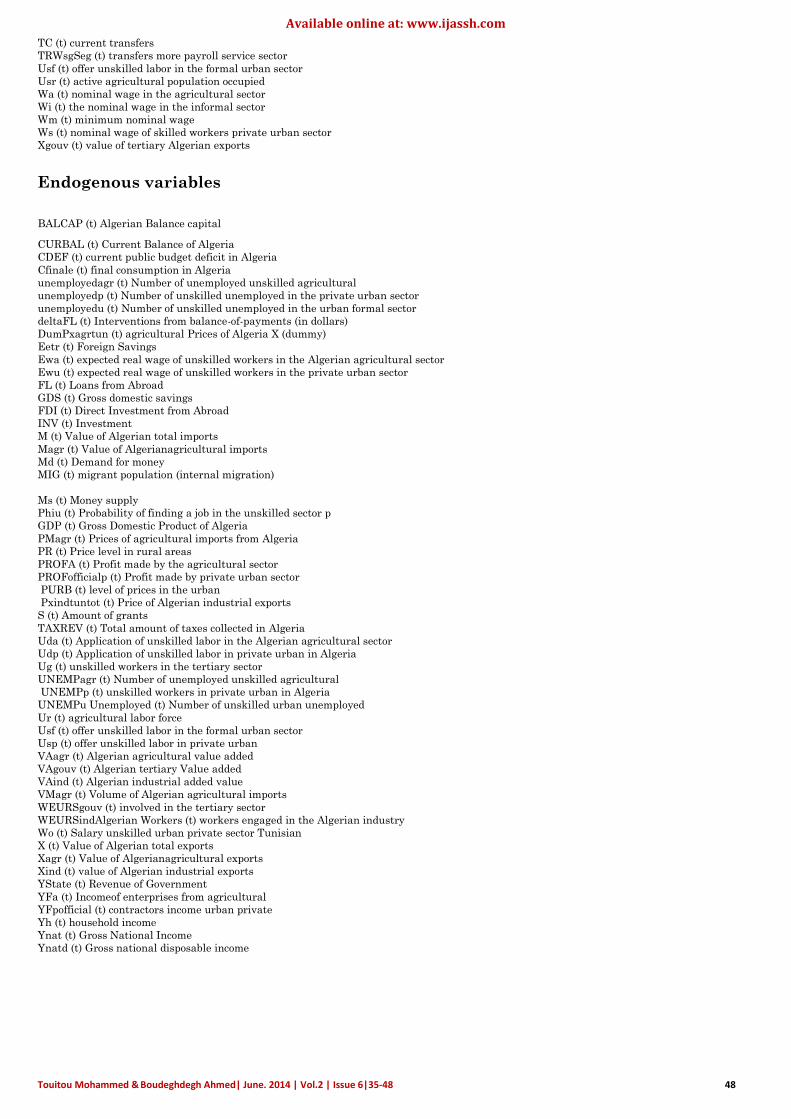
TC (t) current transfers
TRWsgSeg (t) transfers more payroll service sector
Usf (t) offer unskilled labor in the formal urban sector
Usr (t) active agricultural population occupied
Wa (t) nominal wage in the agricultural sector
Wi (t) the nominal wage in the informal sector
Wm (t) minimum nominal wage
Ws (t) nominal wage of skilled workers private urban sector
Xgouv (t) value of tertiary Algerian exports
Endogenous variables
BALCAP (t) Algerian Balance capital
CURBAL (t) Current Balance of Algeria
CDEF (t) current public budget deficit in Algeria
Cfinale (t) final consumption in Algeria
unemployedagr (t) Number of unemployed unskilled agricultural
unemployedp (t) Number of unskilled unemployed in the private urban sector
unemployedu (t) Number of unskilled unemployed in the urban formal sector
deltaFL (t) Interventions from balance-of-payments (in dollars)
DumPxagrtun (t) agricultural Prices of Algeria X (dummy)
Eetr (t) Foreign Savings
Ewa (t) expected real wage of unskilled workers in the Algerian agricultural sector
Ewu (t) expected real wage of unskilled workers in the private urban sector
FL (t) Loans from Abroad
GDS (t) Gross domestic savings
FDI (t) Direct Investment from Abroad
INV (t) Investment
M (t) Value of Algerian total imports
Magr (t) Value of Algerianagricultural imports
Md (t) Demand for money
MIG (t) migrant population (internal migration)
Ms (t) Money supply
Phiu (t) Probability of finding a job in the unskilled sector p
GDP (t) Gross Domestic Product of Algeria
PMagr (t) Prices of agricultural imports from Algeria
PR (t) Price level in rural areas
PROFA (t) Profit made by the agricultural sector
PROFofficialp (t) Profit made by private urban sector
PURB (t) level of prices in the urban
Pxindtuntot (t) Price of Algerian industrial exports
S (t) Amount of grants
TAXREV (t) Total amount of taxes collected in Algeria
Uda (t) Application of unskilled labor in the Algerian agricultural sector
Udp (t) Application of unskilled labor in private urban in Algeria
Ug (t) unskilled workers in the tertiary sector
UNEMPagr (t) Number of unemployed unskilled agricultural
UNEMPp (t) unskilled workers in private urban in Algeria
UNEMPu Unemployed (t) Number of unskilled urban unemployed
Ur (t) agricultural labor force
Usf (t) offer unskilled labor in the formal urban sector
Usp (t) offer unskilled labor in private urban
VAagr (t) Algerian agricultural value added
VAgouv (t) Algerian tertiary Value added
VAind (t) Algerian industrial added value
VMagr (t) Volume of Algerian agricultural imports
WEURSgouv (t) involved in the tertiary sector
WEURSindAlgerian Workers (t) workers engaged in the Algerian industry
Wo (t) Salary unskilled urban private sector Tunisian
X (t) Value of Algerian total exports
Xagr (t) Value of Algerianagricultural exports
Xind (t) value of Algerian industrial exports
YState (t) Revenue of Government
YFa (t) Incomeof enterprises from agricultural
YFpofficial (t) contractors income urban private
Yh (t) household income
Ynat (t) Gross National Income
Ynatd (t) Gross national disposable income
Related Documents