Ann Reg Sci (2012) 49:1–16 DOI 10.1007/s00168-010-0431-3 ORIGINAL PAPER Wage-based evidence of returns to external scale in China’s manufacturing: a spatial analysis Dean M. Hanink · Robert G. Cromley · Avraham Y. Ebenstein Received: 22 February 2010 / Accepted: 27 December 2010 / Published online: 15 January 2011 © Springer-Verlag 2011 Abstract Wage-based evidence of returns to external scale in China’s manufac- turing in 2004 is assessed using county-level units of observation. Two models are used: one with population and percent manufacturing employment as measures of urbanization and localization, respectively, and the other with population density and total manufacturing employment. Global results estimated from spatial error models and local results from geographically weighted regressions indicate that urbanization economies of scale, measured in terms of population but not population density, and localization economies of scale, measured in terms of percent of employment in man- ufacturing or total manufacturing employment, are apparent—but only when internal scale of production is not included as an explanatory factor in the models. Economies of scale are still outcomes of the models, but only when the urbanization, localization, and internal scale factors are considered in combination. The results not only illustrate particular characteristics with respect to recent returns in China’s manufacturing, they are also interesting with respect to schools of thought concerning increasing returns as externality effects. JEL Classification O18 · R12 · R15 D. M. Hanink · R. G. Cromley (B ) Department of Geography, University of Connecticut, Campus Unit 4148, Storrs, CT 06269-4148, USA e-mail: [email protected] A. Y. Ebenstein Department of Economics, The Hebrew University of Jerusalem, Mt. Scopus, 91905 Jerusalem, Israel 123

Welcome message from author
This document is posted to help you gain knowledge. Please leave a comment to let me know what you think about it! Share it to your friends and learn new things together.
Transcript
Ann Reg Sci (2012) 49:1–16DOI 10.1007/s00168-010-0431-3
ORIGINAL PAPER
Wage-based evidence of returns to external scalein China’s manufacturing: a spatial analysis
Dean M. Hanink · Robert G. Cromley ·Avraham Y. Ebenstein
Received: 22 February 2010 / Accepted: 27 December 2010 / Published online: 15 January 2011© Springer-Verlag 2011
Abstract Wage-based evidence of returns to external scale in China’s manufac-turing in 2004 is assessed using county-level units of observation. Two models areused: one with population and percent manufacturing employment as measures ofurbanization and localization, respectively, and the other with population density andtotal manufacturing employment. Global results estimated from spatial error modelsand local results from geographically weighted regressions indicate that urbanizationeconomies of scale, measured in terms of population but not population density, andlocalization economies of scale, measured in terms of percent of employment in man-ufacturing or total manufacturing employment, are apparent—but only when internalscale of production is not included as an explanatory factor in the models. Economiesof scale are still outcomes of the models, but only when the urbanization, localization,and internal scale factors are considered in combination. The results not only illustrateparticular characteristics with respect to recent returns in China’s manufacturing, theyare also interesting with respect to schools of thought concerning increasing returnsas externality effects.
JEL Classification O18 · R12 · R15
D. M. Hanink · R. G. Cromley (B)Department of Geography, University of Connecticut,Campus Unit 4148, Storrs, CT 06269-4148, USAe-mail: [email protected]
A. Y. EbensteinDepartment of Economics, The Hebrew University of Jerusalem,Mt. Scopus, 91905 Jerusalem, Israel
123
2 D. M. Hanink et al.
1 Introduction
The rapid growth of the Chinese economy since its reforms began in the late 1970shas been accompanied by a spatial concentration in its coastal areas. In many respectsthat coastal concentration is the result of preferential policies for the region that wereimplemented during the beginning of the reform era (Zhao and Tong 2000; Démurgeret al. 2002). Even beyond policy, however, much of coastal China is still at a spatial-economic advantage. It has a large internal market because of its population concen-tration, and it is well positioned for external trade because of its location and exportinfrastructure (Fujita et al. 2004). Whatever the root causes of the coastal concen-tration, several studies of the Chinese space economy indicate that agglomerationeconomies now play an important role in its distribution (Fujita and Hu 2001; Fan andScott 2003; Au and Henderson 2006).
The purpose of this paper is to further explore agglomeration economies in China’smanufacturing in an explicitly spatial context. Analyses are conducted at the county-level (counties and municipalities) unit of observation. Evidence of effects of bothurbanization and localization is examined controlling for human capital, cost of living,and internal scale of production. Global analysis is accomplished using spatial errormodels (SEMs), and local analysis is conducted using geographically weighted regres-sion (GWR). While there have been some analyses of returns to external scale in China,the present one is novel in its spatial detail and geographical identification of scaleeffects. The next part of the paper provides a theoretical background to wage-basedmeasurement of external economies and a review of selected related empirical workon China’s economy. Part Three contains descriptions of the regression models usedin the analyses and of the empirical data. Part Four presents the numerical and carto-graphic results of the regression analyses. The paper concludes with a brief summaryof the results, their implications for theory, and some suggestions for future research.
2 Wage-based analysis of returns to scale
Wages in cities tend to be higher than wages in rural areas, even after skill and sectoraldifferences have been taken into account. One explanation for the wage discrepancyis simply that urban labor is more productive than non-urban labor and that the pro-ductivity edge is the realization of external scale, or agglomeration economies. Sucheconomies may arise from a variety of sources. For example, Scott (1988) largelyconsidered external scale economies as the result of transaction cost reductions withinagglomerations. Alternatively, Krugman (1991) linked them to geographical concen-trations of similar firms that enjoy internal economies of scale within differentiatedmarkets. Those concentrations increase with market potential and therefore providethe effect resulting from population or the size of the concentrations themselves.Although the distinction is easily blurred (Duranton and Puga 2003), external econ-omies are often divided into two components: urban economies, which result fromlarge populations in general, and localization economies, which result from clusteringof like producers. Either may give rise to increased labor productivity and thereforehigher wages. For example, improved labor productivity in larger centers can result
123

Wage-based evidence of returns to external scale in China’s manufacturing 3
from larger local markets which encourage increased specialization and product dif-ferentiation (Nourse 1978; Krugman 1991). Higher labor productivity may also resultfrom the presumed larger knowledge stocks in larger populations and their localizedspillovers that make social returns exceed private returns to education (Hanson 2001).Localization economies may be realized in the same way. The more specialized areregions in their production, the more potential for specialized knowledge spilloversthat raise productivity in specific ways. Alternatively, size-based wage premiums mayreflect distribution and linkage efficiencies that exist in population or industrial clus-ters.
Most recent analyses of external scale rely generally on the approach taken inGlaeser and Maré (2001) which provided a useful summary of the equilibrium-basedtheoretical rationale for the observed urban wage premium from the perspectives ofboth workers and producers. For a worker, the wage premium must be offset by higherliving costs or consistently reduced environmental amenities, or smaller centers andrural areas would soon empty of their populations. For a producer, the wage premiummust match improved labor productivity, or larger centers would soon lose firms. Ifhigher wages are not offset by workers’ living costs and/or by improved labor produc-tivity, then the economy would be marked by spatial disequilibrium in the absence ofthird party actions, such as compensating government policy. Recent contributions toagglomeration wage-premium analysis include Gould (2007), Combes et al. (2008),and Rosenthal and Strange (2008). Wage-based analyses of externalities in China havealso been conducted. Liu (2007), for example, found wage-based evidence of externalreturns to education, with a 1-year increase in a city’s average education level yieldingbetween an 11 and 13% increase in average pay. Zheng et al. (2009) found that wagesare higher where firm densities are higher in Beijing, a characteristic they attributedto localization economies rather than competition for labor.
3 Methods and data
3.1 Methods
A basic wage-based regression (OLS) model useful in empirically assessing externalreturns to urbanization and localization is:
lnE = α+β1lnU + β2lnL + μ, (1)
with lnE is a vector of earnings (wages), urbanization is measured in the vector U ,localization is measured in the vector L , and μ is geographically and otherwise randomerror. Values of α, β1, and β2 are vectors of estimated parameters. The parameters ofinterest in Eq. 1 are β1 and β2, which are interpreted as returns to scale coefficientson urbanization and localization, respectively. The scale coefficients have the con-venient property, like Cobb-Douglas coefficients, of having meaningful reference tounity. Significantly increasing (or decreasing) returns can be determined simply bytesting the null hypothesis that β = 1, rather than β = 0. In the same sense, both scalecoefficients can be treated as elasticities describing the change in wages that occurs
123

4 D. M. Hanink et al.
with changes in urbanization and in localization from place to place (Wheaton andLewis 2002). While sometimes considered separately, urbanization and localizationmeasures are often used in the same model when estimating their effects (Melo et al.2009).
Two problems can easily arise from the basic wage-based model specification. Oneis the particular problem of multicollinearity in measures of urbanization and locali-zation when both effects are tested in the same model (Rosenthal and Strange 2004;Graham 2009). That issue is taken up below. The other problem is that spatially auto-correlated errors can easily arise when models use spatial cross-sections as observationsets. A non-random distribution of the error terms can result in inefficient parameterestimates and a misreading of their statistical significance. Further, a lack of spatialinformation in the model can lead to incorrect signs on estimated parameters (Paceand Gilley 1997). A more appropriate model for spatial cross-sections is:
lnE = α + β1lnU + β2lnL + γ W ε + μ, (2)
with W defining a spatial weights matrix characterizing geographical connectionsamong the places in the analysis. Referred to generally as a spatial errors model (SEM),Eq. 2 is estimated by maximum likelihood rather than OLS. In that model, γ Wε
accounts for the spatial association in returns to external scale that is not explained (ε)
by their covariance with urbanization and localization measures. The spatial weightsmatrix, W , is typically defined by a simple 0,1 connectivity matrix in which placeswith any length of common boundary have a weight of 1 and non-joined places havea weight of 0. The parameter γ is an estimated interaction coefficient that indicatesthe strength of the spatial association in ε across W . In our application of the SEMmodel, we use a simple queen’s case spatial structure with rows in W standardized tosum to one. As in the case of OLS, the SEM is global in scope because the regressionparameters are taken as applicable in a constant way across the space of the obser-vations, with any variation in effects resulting from the spatial heterogeneity of theexplanatory variables alone.
Fotheringham et al. (2002) developed geographically weighted regression (GWR)as an alternative format for spatial analysis that is local rather than global in its ana-lytical scope. The GWR version of the generalized wage-based specification in Eq. 1is:
lnEj = α(xj, yj) + β1(xj, yj)lnUj + β2(xj, yj)lnLj + μj (3)
where (xj, yj) are the spatial coordinates of the j th place, and α(xi, yi), β1(xi, yi), andβ2(xi, yi) are realizations of continuous spatial functions. Parameter values are consid-ered to form a continuous surface, and the spatial variation in the surfaces is measuredat specified points—county-level units in our analyses. In GWR, there is variabilityin the parameters as well as in the explanatory variables so each observation may betreated individually. Griffith (2008) indicates that while GWR accounts for much ofthe spatial pattern between covariates in its spatially varying estimates, spatial auto-correlation of residuals may still be a problem. In addition, Wheeler and Tiefelsdorf(2005) have shown that the WLS solutions can lead to multicollinearity and correlation
123
Wage-based evidence of returns to external scale in China’s manufacturing 5
among the calculated local regression coefficients even when the explanatory variablesused in a model are uncorrelated.
The GWR wage-based models used in our analyses were estimated using twospatial bandwidths in order to evaluate the robustness of the estimated parameters.Chosen arbitrarily, the first bandwidth estimated the parameters for each county-levelobservation using its 70 nearest neighbors (defined by inter-centroid distance) and thesecond bandwidth used each observation’s 140 nearest neighbors. County-unit densityis much higher in China’s east than in its west, so there is significant variation in thedistances encompassing the fixed sets of near neighbors that generally follow that spa-tial trend. The lack of spatial uniformity would also have an impact on a fixed-distance(for example, all neighbors within 125 km) bandwidth sampling strategy, with largevariations in the number of neighbors used to estimate local parameters in that case.
3.2 Data
Urbanization economies have been often proxied in the literature by population of theunit of observation (Melo et al. 2009); other measures used include market potentialand population density. Localization has been measured in a variety of ways as well,including employment in an industry (Graham 2009), number of plants (Henderson2003), and various indices of specialization (Rosenthal and Strange 2008).
We use two different versions of a wage model in our analyses of external econ-omies in China, with the versions differentiated by control variables. Both versionsconcern manufacturing only, each uses the natural log of total wages as the dependentvariable and each uses the same set of county-level unit observations.
Version 1 uses the natural log of population as the proxy measure of urbanizationand the natural log of percent employment in manufacturing as the proxy measureof localization. Version 1A uses the natural log of average years of schooling as acontrol for human capital effects on wages and the natural log of median rent as acontrol for cost of living, which may also have a wage effect. Version 1B also usesthose controls for human capital and for cost of living and also uses the natural log ofaverage current value of output as a measure of scale of production. (A standardizedphysical measure of production would be preferable, but such data are unavailable.)If manufacturing enjoys internal economies of scale, that productivity premium canbe passed on to workers in the form of higher wages in the same way as those result-ing from any productivity increases arising from agglomeration economies. Version1A is typical of many wage-based models which do not include controls for scaleof production. Its extension in Version 1B with the internal scale variable allows foran interesting comparison of internal and external scale effects and some empiricallybased reflection on agglomeration theory. Version 2A of the wage model uses thenatural log of population density as the proxy measure of urbanization and the naturallog of total manufacturing employment as the proxy measure of localization. It alsouses the human capital and cost of living controls contained in Version 1A, and therelated Version 2B is also extended by the scale of production variable used in Ver-sion 1B. The specifications of the model versions described in this paper arose froman iterative process of explanatory variable selection that was decided by trade-offs
123
6 D. M. Hanink et al.
between increasing model goodness-of-fit and decreasing multicollinearity among theexplanatory variables.
Information from two data sets is used in our analysis. One data set is derived from asurvey of manufacturing enterprises across China with over five million RMB in salesin 2004 (China National Bureau of Statistics 2005). Data are available in that sourcefor 2,672 county-level units (counties and equivalent municipalities) of China’s totalof 2,873. Total wages, the dependent variable used in our analyses, are taken from thatsource as is average current value of output, our measure of internal scale. The datawere compiled in GIS-usable form using a county-level shape file for 2000 from theHarvard Geospatial Library (2008). That shape file is linked to China’s 2000 Census(as compiled by All China Marketing Research Co., a licensed affiliate of the StateStatistical Bureau of China) and is the source of the other variables in our analyses,which when combined with the survey of manufacturers’ data yielded 2,572 completecounty-level units of observation. Note that the population data in China’s 2000 cen-sus, which are important to our analyses, include both registered and non-registeredresidents and so do not systematically under-report numbers as in that country’s 1990Census (Fang and Dewen 2003).
4 Results
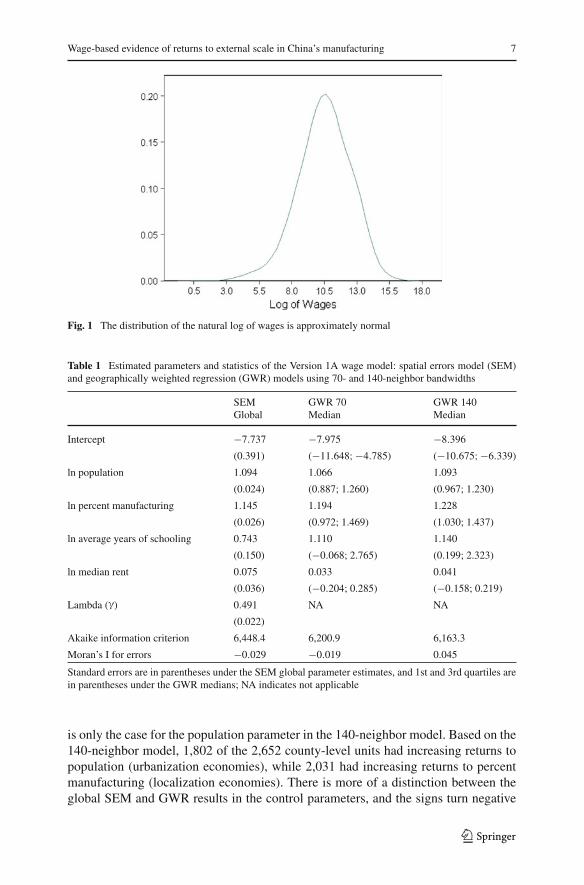
Although it has a slight negative skew (mean=10.49, median=10.55), the distribu-tion of the natural log of wages is approximately normal (Fig. 1). That distributionmakes it suitable for use as a dependent variable in regression analysis based on clas-sical assumptions. However, it does exhibit considerable spatial autocorrelation in itsmap distribution (Moran’s I = 0.640), which means it has considerable potential tolead to the non-random error problems described above when modeled by OLS. Alsoas indicated above, there is a potential for multicollinearity problems in each of themodels, which is a common when assessing coincident urbanization and localizationeffects by regression analysis (Rosenthal and Strange 2004, 2008; Graham 2009). Themulticollinearity condition numbers are high but not overly severe, ranging from 36.8in Version 2A to 57.1 in Version 1B. Further, the typical symptom of generally prob-lematic multicollinearity, insignificant parameters (with respect to zero) but stronggoodness-of-fit in the overall model, is simply not evident in our results.
Version 1A of the models indicates increasing returns to both population and local-ization, with both estimated parameters significantly larger than 1.0 in the SEM spec-ification (Table 1). The relevant parameters are significantly different than zero andindicate that wages are also positive in response to levels of human capital and rent—much as would be expected in any market economy. The spatial parameter, γ, is alsosignificantly different than zero in the SEM specification, and the remaining errorsappear to be free of spatial pattern as measured by Moran’s I . The median values of thepopulation and the percent manufacturing parameters estimated by GWR for both 70and 140-neighbor bandwidths are very similar to those estimated in the global SEM.There are many county-level units, however, where increasing returns are not in evi-dence. Both population and localization parameters are less than 1.0 on the far left-handside (1st quartile) of their distributions in the 70-neighbor bandwidth model, but that
123
Wage-based evidence of returns to external scale in China’s manufacturing 7
Fig. 1 The distribution of the natural log of wages is approximately normal
Table 1 Estimated parameters and statistics of the Version 1A wage model: spatial errors model (SEM)and geographically weighted regression (GWR) models using 70- and 140-neighbor bandwidths
SEM GWR 70 GWR 140Global Median Median
Intercept −7.737 −7.975 −8.396
(0.391) (−11.648;−4.785) (−10.675;−6.339)
ln population 1.094 1.066 1.093
(0.024) (0.887; 1.260) (0.967; 1.230)
ln percent manufacturing 1.145 1.194 1.228
(0.026) (0.972; 1.469) (1.030; 1.437)
ln average years of schooling 0.743 1.110 1.140
(0.150) (−0.068; 2.765) (0.199; 2.323)
ln median rent 0.075 0.033 0.041
(0.036) (−0.204; 0.285) (−0.158; 0.219)
Lambda (γ) 0.491 NA NA
(0.022)
Akaike information criterion 6,448.4 6,200.9 6,163.3
Moran’s I for errors −0.029 −0.019 0.045
Standard errors are in parentheses under the SEM global parameter estimates, and 1st and 3rd quartiles arein parentheses under the GWR medians; NA indicates not applicable
is only the case for the population parameter in the 140-neighbor model. Based on the140-neighbor model, 1,802 of the 2,652 county-level units had increasing returns topopulation (urbanization economies), while 2,031 had increasing returns to percentmanufacturing (localization economies). There is more of a distinction between theglobal SEM and GWR results in the control parameters, and the signs turn negative
123
8 D. M. Hanink et al.
in the left-hand sides of the distributions for both in the 70-neighbor specification andfor median rent in the 140-neighbor GWR.
Based on a Monte Carlo simulation, all of the estimated parameters in both the70 and 140-neighbor bandwidth GWR specifications have significant spatial varia-tion. Based on the Moran statistic, spatial autocorrelation in both GWR specifica-tions is negligible. Correlations among the parameters are generally low (Pearson’sr < 0.5), but the intercept is strongly correlated with the population (n = 70 Pearson’sr = − 0.592; n = 140 Pearson’s r = − 0.510) and human capital (n = 70 Pearson’sr = − 0.720; n = 140 Pearson’s r = − 0.700) parameters, and the human capitalparameter is strongly correlated with the percent manufacturing parameter (n = 70Pearson’s r = − 0.552; n = 140 Pearson’s r = − 0.647). Based on the Akaike infor-mation criterion (AIC), the GWR with the 140-neighbor bandwidth has the best fit ofthe Version 1A models.
Increasing returns to urbanization and to localization are no longer apparent wheninternal scale is added as a control variable. The estimated parameters for popula-tion and for percent manufacturing are both significantly less than 1.0 in the globalSEM results for Version 1B of the models (Table 2). Those parameters are markedlybelow 1.0 at the median in both the 70- and 140-neighbor GWR specifications as well.The average output parameter is positive and significantly different than zero, and theaddition of the scale variable to the model is the most likely reason that the appar-ent urbanization and localization effects are reduced when compared to their levelsin Version 1A. The effect is unlikely due to increased multicollinearity, because theparameters remain significantly different than zero despite their reduction. Assuminghomogeneity of the regression function which makes the parameters additive, this ver-sion of the model indicates that there are increasing returns to scale, but that the “scale”is spread over the three factors of urbanization, localization, and average output. Thenominal sum (disregarding errors) of the three parameters of interest in the globalSEM Version 1B is slightly larger than the nominal sum of the two parameters ofinterest in the global SEM Version 1A. While both positive, neither the parameter onhuman capital or on rent is significantly different than zero (α = 0.05) in the globalmodel.
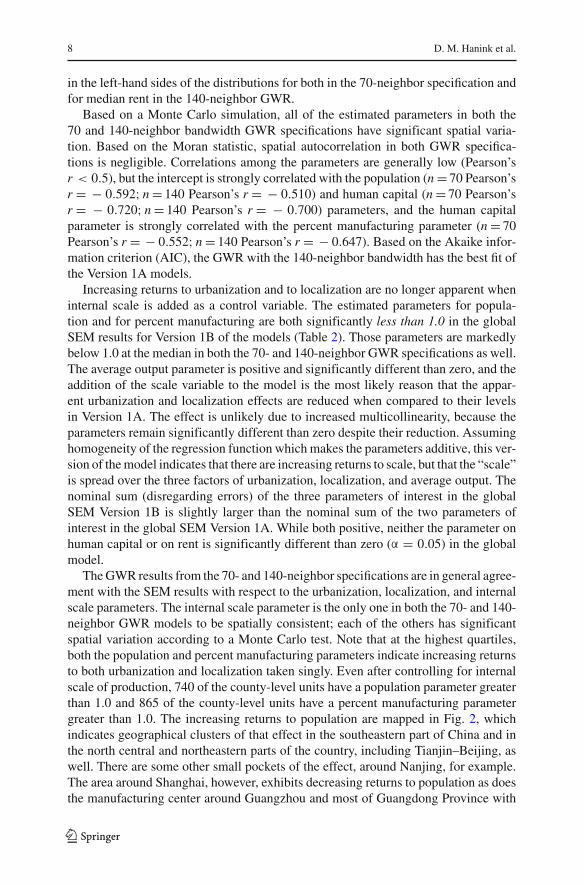
The GWR results from the 70- and 140-neighbor specifications are in general agree-ment with the SEM results with respect to the urbanization, localization, and internalscale parameters. The internal scale parameter is the only one in both the 70- and 140-neighbor GWR models to be spatially consistent; each of the others has significantspatial variation according to a Monte Carlo test. Note that at the highest quartiles,both the population and percent manufacturing parameters indicate increasing returnsto both urbanization and localization taken singly. Even after controlling for internalscale of production, 740 of the county-level units have a population parameter greaterthan 1.0 and 865 of the county-level units have a percent manufacturing parametergreater than 1.0. The increasing returns to population are mapped in Fig. 2, whichindicates geographical clusters of that effect in the southeastern part of China and inthe north central and northeastern parts of the country, including Tianjin–Beijing, aswell. There are some other small pockets of the effect, around Nanjing, for example.The area around Shanghai, however, exhibits decreasing returns to population as doesthe manufacturing center around Guangzhou and most of Guangdong Province with
123
Wage-based evidence of returns to external scale in China’s manufacturing 9
Table 2 Estimated parameters and statistics of the Version 1B wage model: spatial errors model (SEM)and geographically weighted regression (GWR) models using 70- and 140-neighbor bandwidths
SEM GWR 70 GWR 140Global Median Median
Intercept −9.034 −10.688 −10.840
(0.324) (−13.684;−7.978) (−12.978;−9.102)
ln population 0.894 0.904 0.919
(0.020) (0.768; 1.040) (0.814; 1.022)
ln percent manufacturing 0.830 0.868 0.860
(0.022) (0.649; 1.062) (0.672; 1.069)
Ln average output 0.598 0.618 0.613
(0.015) (0.491; 0.732) (0.525; 0.703)
ln average years of schooling 0.193 0.795 0.848
(0.124) (−0.161; 2.229) (−0.131; 1.974)
ln median rent 0.049 −0.020 −0.024
(0.029) (−0.221; 0.155) (−0.164; 0.127)
Lambda (γ) 0.557 NA NA
(0.020)
Akaike information criterion 5,256.9 4,992.9 4,947.3
Moran’s I for errors −0.038 −0.026 0.045
Standard errors are in parentheses under the SEM global parameter estimates, and 1st and 3rd quartiles arein parentheses under the GWR medians; NA indicates not applicable
Fig. 2 The spatial distribution of urbanization economies in China as indicated by the natural log ofpopulation parameter estimated in the 140-neighbor bandwidth GWR of Model Version 1B
123
10 D. M. Hanink et al.
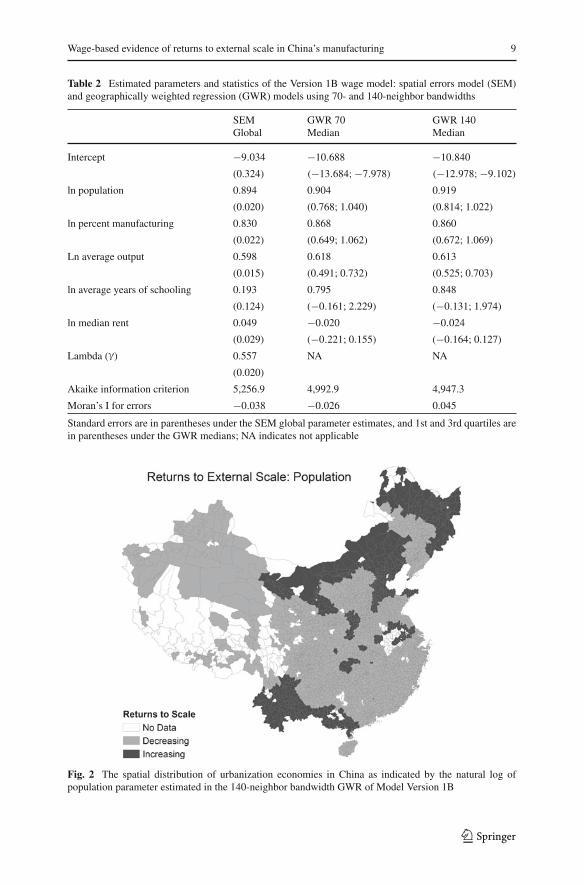
Fig. 3 The spatial distribution of localization economies in China as indicated by the natural log of percentof employment in manufacturing parameter estimated in the 140-neighbor bandwidth GWR of ModelVersion 1B
the exception of its far southwest. The Shanghai and Guangzhou regions, however,along with Tianjin–Beijing, exhibit increasing returns to localization (Fig. 3). Thateffect is spatially concentrated as well and is found along much of the coastal regionof China that is so strongly associated with its export manufacturing. It is also foundin a spatially extensive region in the south central part of the country, including part ofYunnan and the Guangxi Zhuang Autonomous Region, neither of which has a strongmanufacturing reputation.
As is consistent with the lack of significance in the global model, the GWR values ofthe human capital and rent variable parameters have a large degree of spread, includingchange of sign between 1st and 3rd quartiles. Correlations among the parameters inthe GWR specifications are again generally low. Exceptions are the intercept and thepopulation parameter (n = 70 Pearson’s r = −0.510; n = 140 Pearson’s r = −0.554),the intercept and the human capital parameter (n = 70 Pearson’s r = −0.700; n = 140Pearson’s r = −0.729), and the human capital and percent manufacturing parameters(n = 70 Pearson’s r = − 0.518; n = 140 Pearson’s r = − 0.585). Spatial autocorre-lation, as measured by Moran’s I, is not an issue in either of the GWR specifications.Based on its AIC, the 140-neighbor model has the best goodness-of-fit of the threeVersion 1B specifications.
Version 2A of the models uses the natural log of population density as the measureof urbanization and the natural log of total manufacturing employment as the mea-sure of localization. While it indicates that there are increasing returns to localization,sharply decreasing returns to urbanization—as measured in this version—are indicatedin the global SEM model (Table 3). As in Version 1A, wages respond positively to the
123

Wage-based evidence of returns to external scale in China’s manufacturing 11
Table 3 Estimated parameters and statistics of the Version 2A wage model: spatial errors model (SEM)and geographically weighted regression (GWR) models using 70- and 140-neighbor bandwidths
SEM GWR 70 GWR 140Global Median Median
Intercept 0.166 −2.074 −1.704
(0.219) (−4.578; 0.339) (−3.719;−0.017)
ln population density 0.084 −0.049 −0.022
(0.016) (−0.191; 0.064) (−0.130; 0.059)
ln manufacturing employment 1.108 1.149 1.171
(0.019) (0.951; 1.347 (0.991; 1.317)
ln average years of schooling 0.801 2.518 2.126
(0.137) (0.961; 3.971) (1.071; 3.285)
ln median rent 0.057 0.036 0.043
(0.035) (−0.213; 0.248) (−0.180; 0.234)
Lambda (γ) 0.422 NA NA
(0.024)
Akaike information criterion 6,316.2 6,132.6 6094.0
Moran’s I for errors −0.020 −0.041 0.030
Standard errors are in parentheses under the SEM global parameter estimates, and 1st and 3rd quartiles arein parentheses under the GWR medians; NA indicates not applicable
controls representing human capital and cost of living, but only significantly in theformer’s parameter. The spatial parameter is also positive and significant, and remain-ing errors have a spatially random distribution as indicated by the Moran measure. TheGWR parameter medians for both the 70- and 140-neighbor bandwidths are incon-sistent with the global SEM estimates for the intercept, the human capital parameter,and also the population density parameter. The signs are even inconsistent in the caseof the intercept and the population density parameters. In the latter case, the globalSEM estimate lies above the 3rd quartile for both of the bandwidth’s estimates. Theinconsistency results from the extreme (spatial) variability in the GWR local results.Intercepts range from −12.434 to 14.636 in the 70-neighbor model and from −10.451to 7.110 in the 140-neighbor model, while log of population density parameters rangefrom −0.950 to 0.721 using the smaller bandwidth and from −0.704 to 0.460 usingthe larger bandwidth. Note that none of the observations in either bandwidth exhibitsincreasing returns to urbanization as measured in this version of the model.
All of the GWR parameters in both the 70- and 140-neighbor bandwidths havesignificant spatial variability as indicated by a Monte Carlo test. Only two param-eters are highly correlated in the GWR specifications of this model version, how-ever, the intercept and the estimates for the human capital variable (n = 70 Pearson’sr = −0.860; n = 140 Pearson’s r = −0.843). Neither specification had spatially auto-correlated errors. The model with the strongest goodness-of-fit is the GWR using the140-neighbor bandwidth, but its AIC statistic of 6,094.0 indicates the specificationhas relatively poor fit compared to its equivalent in Version 1A, which had a muchbetter AIC of 4,947.3.
123
12 D. M. Hanink et al.
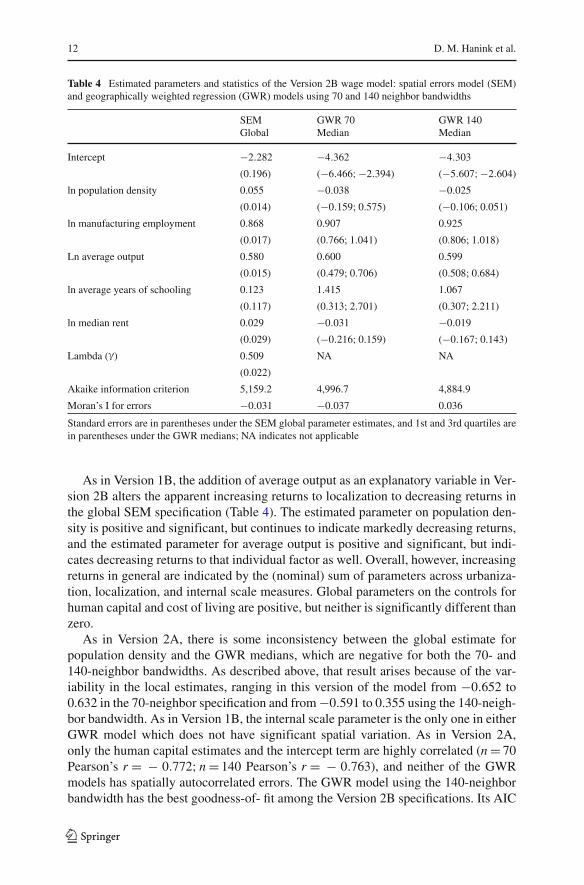
Table 4 Estimated parameters and statistics of the Version 2B wage model: spatial errors model (SEM)and geographically weighted regression (GWR) models using 70 and 140 neighbor bandwidths
SEM GWR 70 GWR 140Global Median Median
Intercept −2.282 −4.362 −4.303
(0.196) (−6.466;−2.394) (−5.607;−2.604)
ln population density 0.055 −0.038 −0.025
(0.014) (−0.159; 0.575) (−0.106; 0.051)
ln manufacturing employment 0.868 0.907 0.925
(0.017) (0.766; 1.041) (0.806; 1.018)
Ln average output 0.580 0.600 0.599
(0.015) (0.479; 0.706) (0.508; 0.684)
ln average years of schooling 0.123 1.415 1.067
(0.117) (0.313; 2.701) (0.307; 2.211)
ln median rent 0.029 −0.031 −0.019
(0.029) (−0.216; 0.159) (−0.167; 0.143)
Lambda (γ) 0.509 NA NA
(0.022)
Akaike information criterion 5,159.2 4,996.7 4,884.9
Moran’s I for errors −0.031 −0.037 0.036
Standard errors are in parentheses under the SEM global parameter estimates, and 1st and 3rd quartiles arein parentheses under the GWR medians; NA indicates not applicable
As in Version 1B, the addition of average output as an explanatory variable in Ver-sion 2B alters the apparent increasing returns to localization to decreasing returns inthe global SEM specification (Table 4). The estimated parameter on population den-sity is positive and significant, but continues to indicate markedly decreasing returns,and the estimated parameter for average output is positive and significant, but indi-cates decreasing returns to that individual factor as well. Overall, however, increasingreturns in general are indicated by the (nominal) sum of parameters across urbaniza-tion, localization, and internal scale measures. Global parameters on the controls forhuman capital and cost of living are positive, but neither is significantly different thanzero.
As in Version 2A, there is some inconsistency between the global estimate forpopulation density and the GWR medians, which are negative for both the 70- and140-neighbor bandwidths. As described above, that result arises because of the var-iability in the local estimates, ranging in this version of the model from −0.652 to0.632 in the 70-neighbor specification and from −0.591 to 0.355 using the 140-neigh-bor bandwidth. As in Version 1B, the internal scale parameter is the only one in eitherGWR model which does not have significant spatial variation. As in Version 2A,only the human capital estimates and the intercept term are highly correlated (n = 70Pearson’s r = − 0.772; n = 140 Pearson’s r = − 0.763), and neither of the GWRmodels has spatially autocorrelated errors. The GWR model using the 140-neighborbandwidth has the best goodness-of- fit among the Version 2B specifications. Its AIC
123
Wage-based evidence of returns to external scale in China’s manufacturing 13
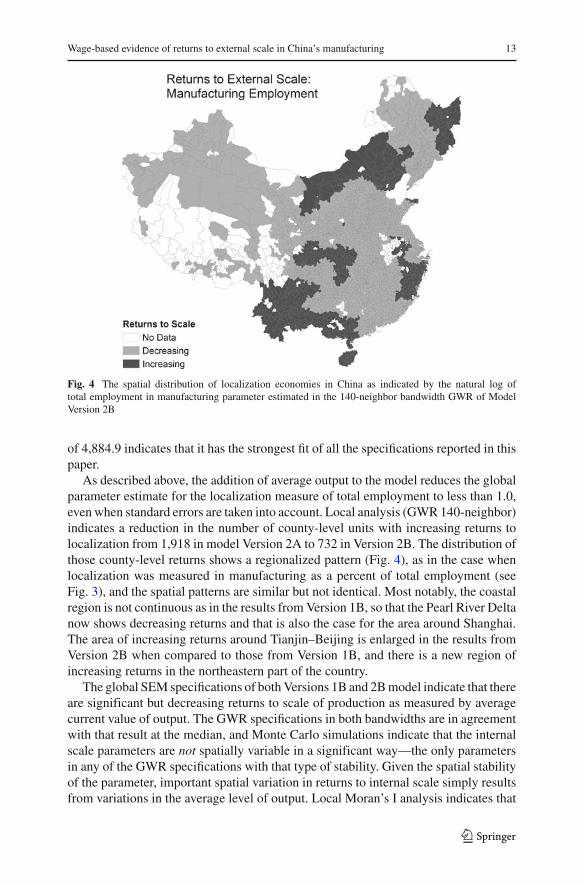
Fig. 4 The spatial distribution of localization economies in China as indicated by the natural log oftotal employment in manufacturing parameter estimated in the 140-neighbor bandwidth GWR of ModelVersion 2B
of 4,884.9 indicates that it has the strongest fit of all the specifications reported in thispaper.
As described above, the addition of average output to the model reduces the globalparameter estimate for the localization measure of total employment to less than 1.0,even when standard errors are taken into account. Local analysis (GWR 140-neighbor)indicates a reduction in the number of county-level units with increasing returns tolocalization from 1,918 in model Version 2A to 732 in Version 2B. The distribution ofthose county-level returns shows a regionalized pattern (Fig. 4), as in the case whenlocalization was measured in manufacturing as a percent of total employment (seeFig. 3), and the spatial patterns are similar but not identical. Most notably, the coastalregion is not continuous as in the results from Version 1B, so that the Pearl River Deltanow shows decreasing returns and that is also the case for the area around Shanghai.The area of increasing returns around Tianjin–Beijing is enlarged in the results fromVersion 2B when compared to those from Version 1B, and there is a new region ofincreasing returns in the northeastern part of the country.
The global SEM specifications of both Versions 1B and 2B model indicate that thereare significant but decreasing returns to scale of production as measured by averagecurrent value of output. The GWR specifications in both bandwidths are in agreementwith that result at the median, and Monte Carlo simulations indicate that the internalscale parameters are not spatially variable in a significant way—the only parametersin any of the GWR specifications with that type of stability. Given the spatial stabilityof the parameter, important spatial variation in returns to internal scale simply resultsfrom variations in the average level of output. Local Moran’s I analysis indicates that
123
14 D. M. Hanink et al.
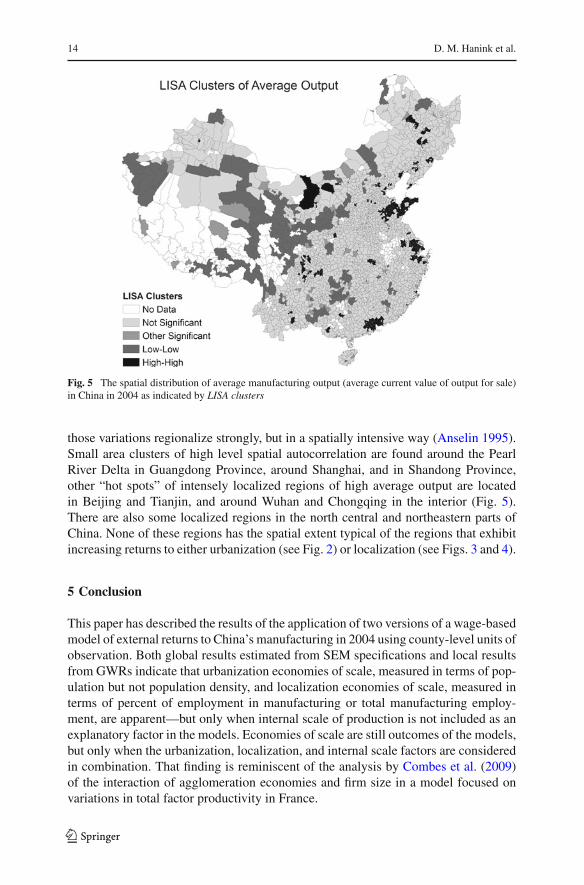
Fig. 5 The spatial distribution of average manufacturing output (average current value of output for sale)in China in 2004 as indicated by LISA clusters
those variations regionalize strongly, but in a spatially intensive way (Anselin 1995).Small area clusters of high level spatial autocorrelation are found around the PearlRiver Delta in Guangdong Province, around Shanghai, and in Shandong Province,other “hot spots” of intensely localized regions of high average output are locatedin Beijing and Tianjin, and around Wuhan and Chongqing in the interior (Fig. 5).There are also some localized regions in the north central and northeastern parts ofChina. None of these regions has the spatial extent typical of the regions that exhibitincreasing returns to either urbanization (see Fig. 2) or localization (see Figs. 3 and 4).
5 Conclusion
This paper has described the results of the application of two versions of a wage-basedmodel of external returns to China’s manufacturing in 2004 using county-level units ofobservation. Both global results estimated from SEM specifications and local resultsfrom GWRs indicate that urbanization economies of scale, measured in terms of pop-ulation but not population density, and localization economies of scale, measured interms of percent of employment in manufacturing or total manufacturing employ-ment, are apparent—but only when internal scale of production is not included as anexplanatory factor in the models. Economies of scale are still outcomes of the models,but only when the urbanization, localization, and internal scale factors are consideredin combination. That finding is reminiscent of the analysis by Combes et al. (2009)of the interaction of agglomeration economies and firm size in a model focused onvariations in total factor productivity in France.
123

Wage-based evidence of returns to external scale in China’s manufacturing 15
The results not only illustrate particular characteristics with respect to recent returnsin China’s manufacturing, they are also interesting in light of schools of thoughtthat have emerged concerning increasing returns as externality effects. One school isbased largely on spillover effects—of skills, knowledge, technology, etc.—in closequarters generating increasing returns to localization and/or spillover effects of lesstangible qualities—creativity, vibrancy, etc.—generating increasing returns to urban-ization levels. Another school essentially suggests that both urbanization economiesand localization economies result from concentrations of markets and the resultinginternal economies of scale. The findings in this paper indicate that increasing returnsmore often arise as a result of combinations of both internal and external effects, butnot from external effects alone. One policy implication of the scale result is that efforttoward increasing production levels away from the coastal regions is a necessary stepto making China’s interior economy competitive. Because the interior is at a disad-vantage, however, with respect to export markets, much of that increased productionwill have to supply domestic demand. A jump start to circular causation in regionaldevelopment may be required.
The results are far from conclusive, of course. They are for a particular timeand place and exclude smaller enterprises. The wage-based models described heremay suffer from missing control variables, such as environmental characteristics(Beeson and Eberts 1989), that could certainly impact the results. Future researchcould be directed at refining the models by adding such environmental factors or byconsidering other important characteristics such as spatial variations in technologyendowments. In addition, the robustness of the results could effectively be checkedby output-based models as in the studies by Fan and Scott (2003), Wen (2004),and Au and Henderson (2006).
Acknowledgments The authors gratefully acknowledge the contributions of Professor LawrenceW. Crissman, Director ACASIAN, Griffith University, Brisbane, Australia and Steven Leung, LondonSchool of Economics, in linking the manufacturing and spatial datasets described in the paper.
References
Anselin L (1995) Local indicators of spatial association—LISA. Geogr Anal 27:93–115Au C-C, Henderson JV (2006) Are Chinese cities too small? Rev Econ Stud 73:549–576Beeson PE, Eberts RW (1989) Identifying productivity and amenity effects in interurban wage differentials.
Rev Econ Stat 71:443–452China National Bureau of Statistics (2005) Survey of industrial enterprises with annual revenue from prin-
cipal business over 5 million RMB. BeijingCombes P-P, Duranton G, Gobillon L (2008) Spatial wage disparities: sorting matters! J Urban Econ
63:723–742Combes P-P, Duranton G, Puga D, Roux S (2009) The productivity advantages of large cities: distinguish-
ing agglomeration from firm selection. Working paper 353, Department of Economics University ofToronto
Démurger S, Sachs J. Woo W, Bao S (2002) Geography, economic policy, and regional development inChina. Working paper 8897, NBER
Duranton G, Puga D (2003) Micro-foundations of urban agglomeration economies. Working paper 9931,NBER
Fan C, Scott A (2003) Industrial agglomeration and development: a survey of spatial economic issues inEast Asia and a statistical analysis of Chinese regions. Econ Geog 79:295–319
123

16 D. M. Hanink et al.
Fang C, Dewen W (2003) Migration as marketization: what can we learn from China’s 2000 census data?China Rev 3(2):73–93
Fotheringham AS, Brunsdon C, Charlton M (2002) Geographically weighted regression: the analysis ofspatially varying relationships. Wiley, Chichester
Fujita M, Hu D (2001) Regional disparity in China 1985–1994: the effects of globalization and economicliberalization. Ann Reg Sci 35:3–37
Fujita M, Mori T, Henderson J, Kanemoto Y (2004) Spatial distribution of economic activities in Japan andChina. In: Henderson J, Thisse JF (eds) Handbook of regional and urban economics, vol 4. Elsevier,Amsterdam, pp 2912–2977
Glaeser E, Maré D (2001) Cities and skills. J Labor Econ 19:316–342Gould ED (2007) Cities, workers, and wages: a structural analysis of the urban wage premium. Rev Econ
Stud 74:477–506Graham D (2009) Identifying urbanization and localization externalities in manufacturing and service
industries. Pap Reg Sci 88:63–84Griffith D (2008) Spatial-filtering based contributions to a critique of geographically weighted regression
(GWR). Environ Plann A 40:2751–2769Hanson G (2001) Scale economies and the geographic concentration of industry. J Econ Geogr 1:255–276Harvard Geospatial Library (2008) China historical 2000 county population census data [http://peters.hul.
harvard.edu:8080/HGL/jsp/HGL.jsp]Henderson JV (2003) Marshall’s scale economies. J Urban Econ 53:1–28Krugman P (1991) Increasing returns and economic geography. J Polit Econ 99:483–499Liu Z (2007) The external returns to education: evidence from Chinese cities. J Urban Econ 61:542–564Melo P, Graham D, Noland R (2009) A meta-analysis of estimates of urban agglomeration economies. Reg
Sci Urban Econ 39:332–342Nourse H (1978) Equivalence of central place and economic base theories of urban growth. J Urban Econ
5:543–549Pace RK, Gilley OW (1997) Using the spatial configuration of the data to improve estimation. J Real Estate
Financ 14:333–340Rosenthal S, Strange W (2004) Evidence on the nature and sources of agglomeration economies. In:
Henderson J, Thisse JF (eds) Handbook of regional and urban economics, vol 4. Elsevier, Amsterdam,pp 2119–2171
Rosenthal S, Strange W (2008) The attenuation of human capital spillovers. J Urban Econ 64:373–389Scott AJ (1988) New industrial spaces. Pion, LondonWen M (2004) Relocation and agglomeration of Chinese industry. J Dev Econ 73:329–347Wheaton W, Lewis M (2002) Urban wages and labor market agglomeration. J Urban Econ 51:542–562Wheeler D, Tiefelsdorf M (2005) Multicollinearity and correlation among local regression coefficients in
geographically weighted regression. J Geogr Syst 7:161–187Zheng S, Peiser R, Zhang W (2009) The rise of external economies in Beijing: evidence for intra-urban
wage variation. Reg Sci Urban Econ doi:10.1016/j.regsciurbeco.2009.01.009Zhao X, Tong S (2000) Unequal economic development in China: spatial disparities and regional policy
reconsideration, 1985–1995. Reg Stud 34:549–561
123
Related Documents