W12A Landfill Annual Status Report January 1 to December 31, 2016 Prepared by City of London 300 Dufferin Ave P.O. Box 5035 London, Ontario N6A 4L9 March 2016

Welcome message from author
This document is posted to help you gain knowledge. Please leave a comment to let me know what you think about it! Share it to your friends and learn new things together.
Transcript

W12A Landfill Annual Status Report
January 1 to December 31, 2016
Prepared by
City of London 300 Dufferin Ave P.O. Box 5035
London, Ontario N6A 4L9
March 2016

W12A Landfill Status Report 2016
i
TABLE OF CONTENTS 1.0 Introduction ........................................................................................................ 1
1.1 General .................................................................................................................. 1 1.2 Site Description ..................................................................................................... 1 1.3 Brief History of W12A Landfill ................................................................................ 2 1.4 Planning Considerations ........................................................................................ 5
2.0 Environmental Monitoring ............................................................................... 13 2.1 Overview ............................................................................................................. 13 2.2 Groundwater ........................................................................................................ 16
2.2.1 Regional Characteristics................................................................................ 16 2.2.2 Site Characteristics ....................................................................................... 17 2.2.3 Groundwater Monitoring Program ................................................................. 31 2.2.4 Upper Aquifer Results ................................................................................... 33 2.2.5 White Oak Aquifer Results ............................................................................ 40
2.3 Surface Water ...................................................................................................... 45 2.3.1 Surface Water Hydrology .............................................................................. 45 2.3.2 Surface Water Monitoring Program ............................................................... 45 2.3.3 Surface Water Results .................................................................................. 47
2.4 Leachate .............................................................................................................. 48 2.4.1 Leachate Characterization ............................................................................. 48 2.4.2 Leachate Monitoring Program ....................................................................... 49 2.4.3 Leachate Quality Monitoring Results ............................................................. 49
2.5 Water Wells ......................................................................................................... 51 2.5.1 Area Groundwater Resources ....................................................................... 51 2.5.2 Water Well Monitoring Program ..................................................................... 51 2.5.3 Upper Aquifer ................................................................................................ 51 2.5.4 White Oak Aquifer ......................................................................................... 55
2.6 Landfill Gas .......................................................................................................... 56 2.6.1 Landfill Gas Overview ................................................................................... 56 2.6.2 Landfill Gas Monitoring Program ................................................................... 56
3.0 Site Development/Operations .......................................................................... 57 3.1 W12A Cell Expansion Construction ..................................................................... 57 3.2 Site Capacity ....................................................................................................... 57
3.2.1 Historical Waste Quantities ........................................................................... 57 3.1.2 Estimated Remaining Disposal Volume ......................................................... 61 3.2.3 Estimated Remaining Site Life ...................................................................... 62
3.2 Cover Material Requirements and Availability ...................................................... 63 3.2.1 Material Balance ........................................................................................... 64 3.2.2 Operating Materials (including imported daily cover) ..................................... 65 3.2.3 Final Cover Placement .................................................................................. 67 3.2.4 Leachate Collection System .......................................................................... 68
3.3 Leachate Management ........................................................................................ 68 3.3.1 System Description ....................................................................................... 68 3.3.2 Leachate Volumes......................................................................................... 69 3.3.3 Leachate Collection System Maintenance ..................................................... 70
3.4 Landfill Gas Management .................................................................................... 70 3.4.1 System Description ....................................................................................... 70 3.4.2 2016 Operation ............................................................................................. 75

W12A Landfill Status Report 2016
ii
TABLE OF CONTENTS (continued)
3.5 Stormwater Management ..................................................................................... 81 3.5.1 System Description ....................................................................................... 81 3.5.2 2016 Operation ............................................................................................. 81
3.6 Household Special Waste (HSW) Depot .............................................................. 81 3.7 Small Vehicle Drop-off ......................................................................................... 82 3.8 General Site Maintenance ................................................................................... 83 3.9 Public Liaison Committee .................................................................................... 83
W12A Landfill Status Report 2016
iii
LIST OF TABLES
Table 1 Permitted Uses for Various Zoning Designations ............................................... 9 Table 2 Environmental Monitoring Program Locations and Frequency ......................... 13 Table 3 Environmental Monitoring Program Parameters .............................................. 14 Table 4 Inputs and Sources for POLLUTE .................................................................... 25 Table 5 Trigger Mechanism for Groundwater Impacts .................................................. 32 Table 6 Calculation of Reasonable Use Criterion – Upper Aquifer ................................ 33 Table 7 Summary of Chemical Test Results for Key Parameters – Upper Aquifer ......... 34 Table 8 Summary of Chemical Test Results for Selected Parameters – Upper Aquifer . 38 Table 9 Calculation of Reasonable Use Criterion – White Oak Aquifer ......................... 40 Table 10 Summary of Chemical Test Results – White Oak Aquifer .............................. 41 Table 11 Trigger Mechanism for Surface Water Impacts .............................................. 46 Table 12 Surface Water Sampling Stations .................................................................. 47 Table 13 Summary of Chemical Test Results– Surface Water ..................................... 48 Table 14 Leachate Monitoring Results ......................................................................... 50 Table 15 Waste Quantities Disposed of at W12A Landfill in Tonnes ............................ 58 Table 16 Monthly Waste Quantities Disposed of at W12A Landfill in Tonnes ............... 60 Table 17 Landfill Capacity Calculations ......................................................................... 61 Table 18 Remaining Site Life at the W12A Landfill ........................................................ 63 Table 19 Cover Material Calculations ............................................................................ 66 Table 20 Annual Methane and GHG Destruction ........................................................... 79 Table 21 Summary of Gas Flare Shutdowns ................................................................. 80 Table 22 Quantity of Material Received at the W12A Landfill Depot in 2016 ................. 82
LIST OF FIGURES
Figure 1 Inferred Stratigraphy of W12A Landfill East-West Cross Section .................... 18 Figure 2 Inferred Stratigraphy of W12A Landfill North-South Cross Section: Phase 1 .. 20 Figure 3 Inferred Stratigraphy of W12A Landfill North-South Cross Section: Phase 2 .. 21 Figure 4 Landfill Gas Schematic .................................................................................... 74
LIST OF MAPS
Map 1 Site Location Plan ............................................................................................... 3 Map 2 Site Plan .............................................................................................................. 4 Map 3 Zoning Designations ............................................................................................ 7 Map 4 Land Use ............................................................................................................. 8 Map 5 Natural Resources and Heritage Features ......................................................... 11 Map 6 Thickness of Surficial Aquitard .......................................................................... 27 Map 7 Groundwater Flow Direction - Upper Aquifer ..................................................... 28 Map 8 Groundwater Flow Direction - White Oak Aquifer............................................... 29 Map 9 Chloride Concentrations .................................................................................... 43 Map 10 Area Water Well ............................................................................................... 53 Map 11 Water Well Monitoring Program ........................................................................ 54 Map 12 Status of Site Development ............................................................................. 72 Map 13 Landfill Gas Extraction Wells ........................................................................... 77

W12A Landfill Status Report 2016
iv
LIST OF APPENDICES
Appendix A Environmental Compliance Approvals Appendix B Environmental Monitoring Program Appendix C Groundwater Chemical Test Results Appendix D Surface Water Chemical Test Results Appendix E Leachate Chemical Test Results Appendix F Water Well Chemical Test Results Appendix G Water Sampling Protocols Appendix H Reports & Maps W12A Landfill Appendix I Historical Water Level Data Appendix J Groundwater Monitoring Wells Appendix K Hydrographs Appendix L Landfill Gas Test Results Appendix M Waste Generation Projections & Landfill Capacity Assessment Appendix N Leachate Volume Data Appendix O Landfill Gas Wells Appendix P Landfill Flare Shutdown Summary Appendix Q Stormwater Management Pond Data Appendix R Operational Data Appendix S Household Special Waste (HSW) Depot Appendix T Public Liaison Committee
LIST OF DRAWINGS
Drawing 1 Hydrogeologic Cross Sections ..................................Back of the report Drawing 2 Environmental Monitoring Location Plan............... …Back of the report

W12A Landfill Status Report 2016
Page 1
1.0 Introduction
1.1 General This report is being submitted to comply with the reporting requirements in the W12A Landfill’s various Environmental Compliance Approvals (ECAs) issued by the Ministry of the Environment and Climate Change (MOECC). The City of London W12A Landfill operates under three ECAs (as amended) which are listed below along with their reporting requirements (Appendix A). A042102 (issued October, 2007)
This ECA is the landfill’s approval under Part V of the Environmental Protection Act and deals with the landfill’s design and operation. Condition 71 of the ECA requires the submission of an annual Status Report on the landfill development, operations and monitoring to the MOECC District Manager by March 31 each year (or an alternative date agreed to by the District Manager). 1828-9CKRMK (issued December, 2013)
This ECA is the landfill’s approval under Section 20.2 of Part II.1 of the Environmental Protection Act and Section 53 of the Ontario Water Resources Act and deals with the landfill’s leachate collection and disposal system and stormwater management ponds. Condition 8 (5) requires the preparation of an annual Status Report on the leachate collection system and stormwater management ponds operation and monitoring results. The report is to be submitted to the MOECC District Manager upon request. 4183-78XHLX (issued December, 2007)
This ECA is the landfill’s approval under Section 9 of the Environmental Protection Act and deals with the landfill’s air emissions from the landfill gas flare and the Household Special Waste Depot.
1.2 Site Description The W12A Landfill is located at 3502 Manning Drive in the City of London approximately 1.5 kilometres west of Wellington Road (Map 1). The landfill is bounded by White Oak Road to the west, Manning Drive to the south and agricultural land to the north and east. All adjacent properties to the north and east of the landfill are owned by the City of London. The landfill accepts waste for landfilling generated within the City of London the Municipality of Thames Centre, Lake Huron and Elgin Area Water Treatment Plants and TRY Recycling. In addition, the W12A Landfill has a Household Special Waste (HSW) facility and a public drop-off depot for household garbage, appliances, blue box recyclables,

W12A Landfill Status Report 2016
Page 2
brush, cardboard, electronics, scrap metal, tires and wood. The Household Special Waste Depot accepts waste from the City of London, the County of Middlesex (including First Nations Communities) and the County of Elgin. These facilities and other operational infrastructure at the landfill are presented in Map 2 along with the general layout of the landfill and the property limits. The legal description of the landfill property is “Part Lots 18, 19, 20 in Concession 6 in the City of London and County of Middlesex designated as Parts 1, 2, 3, 4, 5, 6, 7, 8 and 9 on Expropriation Plan 42196”.
1.3 Brief History of W12A Landfill In 1969, the City of London commissioned James F. MacLaren Limited to develop a long term solid waste disposal plan. The results of the study are contained in the report entitled Report on Solid Waste Disposal for the City of London (October 1970). The report recommended that the City proceed with the necessary approvals, detailed design and land acquisition for the development of a new landfill referred to as W12 located on part of Lots 18, 19 and 20 Concession 5 in the former Township of Westminster. During site investigations, it was determined the geological setting of W12 was not suitable for a landfill because a spillway containing granular soils traversed the surficial silty clay soils that are generally predominant in the area. It was also determined the area south of W12 had thick surficial deposits of silty clay. As a result the location of the proposed landfill was changed to the area referred to as W12A located on part of Lots 18, 19 and 20 Concession 6 in the former Township of Westminster. In April 1973, the City of London filed an application for a Certificate of Approval (C of A), (now replaced by ECA), for a Waste Disposal Site to the MOECC for the W12A Landfill. Subsequently, the Environmental Hearing Board held a public hearing in the former Township of Westminster from July 30, 1973 to August 3, 1973 to review the application for the W12A Landfill. The Environmental Hearing approved the application. The MOECC issued Provisional C of A A042102 for the W12A Landfill on November 13, 1973. The C of A did not permit the disposal of waste until final design plans and specifications were submitted and approved by the MOECC. In 1974, the Ontario Municipal Board (OMB) held a public hearing to address planning issues related to the establishment of a new landfill. As a result of the hearing the OMB issued an order in January 1975 authorizing the City of London to acquire the necessary lands to create the W12A Landfill and spend the necessary funds to construct the new landfill. The OMB also directed the former Township of Westminster to amend its zoning by-law and any other necessary by-laws to permit landfilling in the lands referred to as W12A.

WONDERLAND RD S
EXETER RD
DINGMAN DR
MANNING DR
SCOTLAND DR
HIGH
BURY
AVE S
BRADLEY AVE
WELL
INGT
ON R
D S
WESTMINSTER DRWH
ITE O
AK R
D
GLANWORTH DR
DECKER DR
COLONEL TALBOT RD
WILTON GROVE RD
BOSTWICK RD
WHARNCLIFFE RD S
WELLINGTON RD
BRADLEY AVE W
GLANWORTH DR
WESTMINSTER DR
WHITE OAK RD
HWY 401
HWY 401
HWY 402
HWY 401
W12A LANDFILL
March 14, 2017
W12A LANDFILL2016 ANNUAL REPORT
LegendExisting W12A Landfill
Notes:1) City of London Aerial Photography, April 2016
300 Dufferin Avenue,PO Box 5035London, OntarioN6A 4L9General Inquiries: 519-661-4500www.london.ca
Date:
Solid Waste Management Division
_̂
!
!
!
!
!
!
!
!
Lake Erie
Lake Huron
USA
USA
SOUTHERN ONTARIO
Lake Ontario
KEY PLAN
SiteLocation
#
SOUTHERN ONTARIOKEY MAP
SarniaLondon
Windsor
Toronto
Chatham
Hamilton Niagara Falls
SITE LOCATION PLAN
Map 1
C:\U
sers
\34S
FG\D
eskt
op\D
eliv
ery\
Map
1 S
ite L
ocat
ion
Pla
n.m
xd
0 500 1,000 1,500
Metres
!I1:35,000

kj kj
")
")") ") ")")
")
kj
'
kj
!(
#*
#*
PondForebay
Household Special Waste Building
PHASE 2 WASTE DISPOSAL FILL AREA
PHASE 1 WASTE DISPOSALFILL AREA
Main Pumping Station/Standby Generator
Leachate Storage No. 2 Leachate
Storage No. 1
CELL 5EAST CELL 3 CELL 2 CELL 1
CELL 9
CELL 7
CELL 8
CELL 4CELL 10
CELL 5WEST
CELL 6SOUTH
SOUTH HALF
CELL 6NORTH
SOUTH HALF
CELL 6SOUTH
NORTH HALF
CELL 6NORTH
NORTH HALF
Stormwater Pond No. 5
Stormwater Pond No. 4
PondForebay
Stormwater Pond No. 2/3
Stormwater Pond No. 1
Flare Station
Administrative Building
Contractor Maintenance
Building
City Maintenance
BuildingWeigh Scale &
Scale House
MANNING DR
SCOTLAND DR
WHITE
OAK
RD
Drainage Ditch No. 4
Drainage Ditch No. 1
DrainageDitch No. 2
Drainage Ditch No. 3Drainage
Ditch No. 5
Drainage Ditch No. 7
Drainage Ditch No. 10
March 14, 2017
W12A LANDFILL2016 ANNUAL REPORT
Notes:1) City of London Aerial Photography, April 20162) Site Features prepared by Callon Dietz Inc. LTD, October 19, 2016
0 100 200 300
Metres
!I
1:6,000
300 Dufferin Avenue,PO Box 5035London, OntarioN6A 4L9General Inquiries: 519-661-4500www.london.ca
Date:
Solid Waste Management Division
SITE PLAN
Map 2
C:\U
sers
\34S
FG\D
eskt
op\D
eliv
ery\
Map
2 S
ite P
lan.
mxd
W12A LANDFILL
"
KEY MAP
DINGMAN DR
MANNING DR
SCOTLAND DR
WESTMINSTER DR
EXETER RD
WELL
INGT
ON R
D S
GLANWORTH DR
WILTON GROVE RD
WHITE
OAK
RD
DECKER DR
WELLINGTON RD
WESTMINSTER DR
HWY 401
HWY 401
HWY 402
Legendkj Landfill Site Entrance
kj Landfill Site Seconday Entrance
' Public Drop Off Area
!(MH 701 Pumping Station/StandbyGenerator
#* Leachate Storage") Drainage Ditch
Landfill Access RoadsMonitoring Access RoadsPhase 1 Waste Disposal Fill Area (59.3 ha)Phase 2 Waste Disposal Fill Area (47.7 ha)
Property InformationExisting W12A LandfillStormwater Ponds/ForebayBuildings

W12A Landfill Status Report 2016
Page 5
In 1976 the final design plans and specifications for the W12A Landfill were submitted to the MOECC by MacLaren Engineers (formerly James F. MacLaren Limited) on behalf of the City. The original site design consisted of 14 cells covering 107 hectares, five storm water management ponds, the use of berms and trees to provide screening, a perimeter leachate collection system and a surface and groundwater monitoring program. On August 16, 1976 the MOECC re-issued C of A A042102 for the W12A Landfill to permit the disposal of waste in accordance with the submitted plans. Since 1976 the C of A has been re-issued or amended sixteen times to permit changes in the operation of the landfill. These changes have included refinement of the environmental monitoring programs, requirement for an annual report, approval of a household special waste facility, various design changes and infrastructure upgrades and an expansion of the area from which waste can be received. Waste was first disposed of in the landfill during the summer of 1977. Over the next 25 years, approximately 5 million tonnes of waste were deposited at the W12A Landfill in the first six cells. These cells cover 60 hectares and are referred to as Phase One (Map 2). The remainder of the landfill covers 47 hectares and will accommodate a further approximately 5.5 million tonnes. The area is referred to as Phase Two (Map 2). Phase Two of the landfill includes several engineering upgrades that were approved in 2002 including approval for a full underdrain leachate collection system and a landfill gas collection system.
1.4 Planning Considerations Official Plan
The W12A Landfill resides within the area designated as the Waste Management Resource Recovery Area in the City’s Official Plan, called the London Plan. The London Plan was approved by the Province on December 28, 2016 (with modifications) however is currently under appeal to the Ontario Municipal Board. The sections of the London Plan that are under appeal are not associated with the land use policies of the Waste Management Resource Recovery Area. The Waste Management Resource Recovery Area Place Type covers 288 hectares that includes the W12A Landfill and surrounding land (Map 3). The following land uses in conformity with the policies of the London Plan may be permitted within the area, Landfills; Related uses to the function, operation and education of all aspects of waste reduction, re-use, recycling, management, resource recovery, treatment, and waste disposal; and Eco-Industrial Parks where industries are involved in the processing, fabricating or manufacturing of products using materials available from the Waste Resource Recovery Area, including alternative energy sources. Waste processing and other uses permitted by the policies of the London Plan are require to have a municipal use component.

W12A Landfill Status Report 2016
Page 6
The Waste Management Resource Recovery Area allows for the introduction of certain land uses by site specific zoning, subject to the criteria listed in the Waste Management Resource Recovery Area policies, and the Civic Infrastructure policies of the London Plan. These uses include:
1) Municipal waste disposal facility; 2) Landfill energy production system from landfill gas; 3) Leachate pre-treatment/hauled liquid waste facility; 4) Public drop-off depot for municipal hazardous or special waste; 5) Community recycling drop-off depot; 6) Material recovery facility; 7) Yard waste composting facility; 8) Source separated organic composting facility; 9) Transfer stations associated with municipal waste disposal facilities; 10) Thermal, mechanical and biological processing of waste to reduce
volumes, stabilize materials, treat residual waste and remove recyclables;
11) Other similar waste collection, processing and recovery functions; 12) Energy generation facilities, including wind and/or solar energy
conversion system, and; 13) Eco-industrial park uses.
Land Use
Existing land uses within the W12A Landfill property were restricted to landfilling in 2016. Agricultural activities, limited to the growing of cash crops, occurred in the north western portion of the landfill in 2015. All agricultural activities at the landfill were ceased in 2016. Land uses within 500 metres of the landfill and access road to the landfill are shown on Map 4. The majority of this land is in agricultural production. Other land uses include an aggregate pit, vacant land, radio transmission towers, single family dwellings, vegetative areas and a Material Recovery Facility owned by the City. There are a total of eleven single family residences within 500 metres of the landfill or along the main access road on Manning Drive. Six of the residences are owned by the City. All land within 500 metres of the W12A Landfill is designated as agricultural, open space, resource extraction, waste and resource management or environmental review in the London Plan. The designated open space area, approximately 20 hectares of land to the south of the landfill, coincides with a cemetery. The designated environmental review areas coincide with river, stream or ravine corridors that are outside of flood plain regulated corridors. Zoning
The landfill is zoned WRM1 (Waste and Resource Management Zone). This zoning permits municipal waste disposal (Map 3).

ER
ERER
ER
AG2
500m PERIMETER AROUND W12A LANDFILL
EX
EX
MANNING DR
SCOTLAND DRWH
ITE O
AK R
D
WELL
INGT
ON R
D S
GLANWORTH DR
HWY 401
AG2
EX
AG2
WRM1
AG2
AG1
ER
AG1
ER
ER
AG1
OS5
AG1
CF1
ER
ER AG2
h-18*h-89*AG2(20)
OS3(1)
AG1(1)
h-28*AG2
ER
h-28*AG2h-28*AG2
AG1(1)
AG2
ER
ERAG2
ER
h-2*CF1
ER
AG2
EX
ER
R1-10
ER
OS1
h-2*AG2
R1-10
R1-14
RT
ER
h-2*AG1h-18*AGC1
NF2/OS3
AG2
AG1(3)
h-2*AG1
h-17*RRC1
RRC1
AG2/AG5
AG2
NF1
NF1
NF1
W12A LANDFILL
March 21, 2017
W12A LANDFILL2016 ANNUAL REPORT
Notes:1) City of London Aerial Photography, April 20162) For Detailed Zoning designations please refer to the City ofLondon's zoning by-law No. Z. 1.
300 Dufferin Avenue,PO Box 5035London, OntarioN6A 4L9General Inquiries: 519-661-4500www.london.ca
Date:
Solid Waste Management Division
ZONING DESIGNATIONS
Map 3
LegendZones
Agricultural (AG)
Agricultural Commercial (AGC)
Community Facility (CF)
Environmental Review (ER)
Resource Extraction (EX)
Neighbourhood Facility (NF)
Neighbourhood Facility/Open Space(NF/OS)Open Space (OS)
Residential (R)
Rural Settlement Commercial Uses(RRC)
Rail Transportation (RT)
Waste and Resource Management(WRM)
Property InformationExisitng W12A LandfillWaste Management Resource RecoveryAreaParcels
0 250 500 750
Metres
!I1:15,000

#
#
500m PERIMETER AROUND W12A LANDFILL
FormerAggregate Operations Aggregate
Operations
Communication Equipment Facilities
Material Recovery Facility
Cemetery
Communication Equipment
Facility
School
CommunicationEquipmentFacilities #
School#
Glanworth Hamlet #
Glanworth Hamlet
MANNING DR
SCOTLAND DRWH
ITE O
AK R
D
WELL
INGT
ON R
D S
GLANWORTH DR
HWY 401
W12A LANDFILL
March 27, 2017
W12A LANDFILL2016 ANNUAL REPORT
Notes:1) City of London Aerial Photography, April 2016
300 Dufferin Avenue,PO Box 5035London, OntarioN6A 4L9General Inquiries: 519-661-4500www.london.ca
Date:
Solid Waste Management Division
LAND USE
Map 4
Legend! Residence
Non-Agricultural/Non-Residential Land UseVegetation Paches
Property InformationExisting W12A LandfillCity Owned PropertyParcels
0 250 500 750
Metres
!I1:12,000
C:\U
sers
\34S
FG\D
eskt
op\D
eliv
ery\
Map
4 L
and
Use
.mxd

W12A Landfill Status Report 2016
Page 9
Land within 500 metres of the landfill and access road is zoned AG2 (Agricultural 2), ER (Environmental Review), EX (Extractive), Waste and Resource Management and OS3 (1) (Open Space 3 Special Provision 1). Permitted uses for these zonings are presented in Table 1 below.
Table 1 Permitted Uses for Various Zoning Designations Designation Permitted Uses within 500 metres of the Landfill
AG2 Permits intensive (livestock facilities, riding stables, commercial greenhouse, compost facility, aquaculture, agricultural research station and manure storage facility) and non-intensive agricultural (general agricultural) uses
ER Land in this zone is intended to remain in a natural condition until their significance is determined through the completion of more detailed environmental studies. Permitted uses are; conservation lands, conservation works, passive recreational uses, managed woodlots and agricultural uses
EX Permits resource extraction operations, farms, wayside pits and forestry uses
WRM1 Municipal waste disposal, agricultural uses, leachate pre-treatment/hauled liquid waste facility, public drop-off for municipal hazardous and special waste, community recycling and drop-off depot, yard waste composting facility and material recovery facility
OS3(1) Cemeteries with a prohibition of any structures related to places of assembly, mausoleums and crematoriums
City Owned Lands
The City owns all of the properties within the block of land bound by Wellington Road, Manning Drive, White Oak Road, and Scotland Drive, with exception of three parcels. The City also owns a number of properties both adjacent to and further out from this block of land. Land acquisition around the W12A landfill is considered on a case by case basis and may be purchased to act as a buffer, to protect against short and long-term encroachment around the landfill or for other purposes. In 2016 the properties at the following municipal address were purchased by the City:
• 3674 Glanworth Drive
• 5861 White Oak Road

W12A Landfill Status Report 2016
Page 10
Natural Resource and Environmental Heritage Features
The City’s Official Plan recognizes a number of natural resource and environmental heritage features (Map 5). The City’s Official Plan identifies one natural resource feature and extractive industrial land within 500 metres of the landfill. With respect to environmental heritage features, there are no wetlands, Environmentally Sensitive Areas (ESAs), potential naturalization areas, upland corridors or floodplains located within 500 metres of the landfill. Beyond 500 metres, there is one potential ESA, several vegetative patches, and several river, stream or ravine corridors that are outside of flood plain regulated corridors (Map 5). It should also be noted the Official Plan shows “Big Picture Meta-Cores and Meta-Corridors” that crosses the landfill from south to north. The “Big Picture Meta-Cores and Meta-Corridors” are represented conceptually and are not to be interpreted as rigid boundary delineations. The corridors are also not a component of London’s Natural Heritage System, however, naturalization projects and landowner stewardship initiatives that support the “Big Picture” system of core natural areas and corridor connections are encouraged by the City of London.

kj
kj
"
"
"
"
"
"
"
"
Wright Drain
MANNING DR
SCOTLAND DRWH
ITE O
AK R
D
WELL
INGT
ON R
D S
GLANWORTH DR
HWY 401
500m PERIMETER AROUND W12A LANDFILL
Shore Drain
W12A
Drai
n
GoughDrain
W12A LANDFILL
Digman Creek Sub Watershed
Dodds Creek Sub Watershed
Dodds Creek Sub Watershed
KettleCreekSub Watershed
March 14, 2017
W12A LANDFILL2016 ANNUAL REPORT
Notes:1) City of London Aerial Photography, April 2016
300 Dufferin Avenue,PO Box 5035London, OntarioN6A 4L9General Inquiries: 519-661-4500www.london.ca
Date:
Solid Waste Management Division
NATURAL RESOURCES AND HERITAGE FEATURES
Map 5
London Plan (Map 5) - Natural HeritageAggregate Resource AreasExtractive Industrial
Other" Drainage Flow Direction
Municipal DrainsSub Watershed Divide
Property InformationExisting W12A LandfillCity Owned PropertyParcels
London Plan (Map6) - Hazards and NaturalResourceskj Potential Naturalization Areas
Environmentally Significant Area (ESA)
Potential Environmentally SignificantAreaWetlands
Significant Woodlands
River, Stream and Ravine CorridorsOutside of Flood Plain RegulatedCorridors
0 250 500 750
Metres
!I1:15,000
C:\U
sers
\34S
FG\D
eskt
op\D
eliv
ery\
Map
5 N
atur
al R
esou
rces
and
Her
itage
Fea
ture
s.m
xd
Legend
W12A Landfill Status Report 2016
Page 13
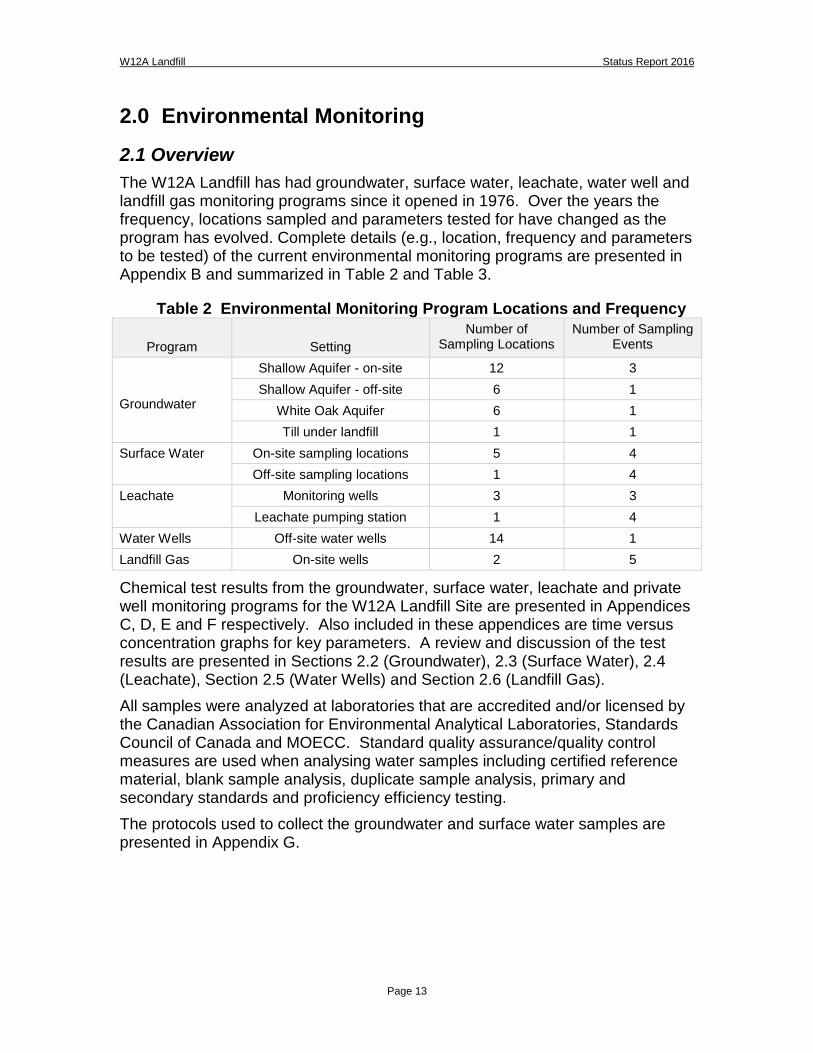
2.0 Environmental Monitoring
2.1 Overview The W12A Landfill has had groundwater, surface water, leachate, water well and landfill gas monitoring programs since it opened in 1976. Over the years the frequency, locations sampled and parameters tested for have changed as the program has evolved. Complete details (e.g., location, frequency and parameters to be tested) of the current environmental monitoring programs are presented in Appendix B and summarized in Table 2 and Table 3.
Table 2 Environmental Monitoring Program Locations and Frequency
Program
Setting Number of
Sampling Locations Number of Sampling
Events
Groundwater
Shallow Aquifer - on-site 12 3 Shallow Aquifer - off-site 6 1
White Oak Aquifer 6 1 Till under landfill 1 1
Surface Water On-site sampling locations 5 4 Off-site sampling locations 1 4
Leachate Monitoring wells 3 3 Leachate pumping station 1 4
Water Wells Off-site water wells 14 1 Landfill Gas On-site wells 2 5
Chemical test results from the groundwater, surface water, leachate and private well monitoring programs for the W12A Landfill Site are presented in Appendices C, D, E and F respectively. Also included in these appendices are time versus concentration graphs for key parameters. A review and discussion of the test results are presented in Sections 2.2 (Groundwater), 2.3 (Surface Water), 2.4 (Leachate), Section 2.5 (Water Wells) and Section 2.6 (Landfill Gas). All samples were analyzed at laboratories that are accredited and/or licensed by the Canadian Association for Environmental Analytical Laboratories, Standards Council of Canada and MOECC. Standard quality assurance/quality control measures are used when analysing water samples including certified reference material, blank sample analysis, duplicate sample analysis, primary and secondary standards and proficiency efficiency testing. The protocols used to collect the groundwater and surface water samples are presented in Appendix G.

W12A Landfill Status Report 2016
Page 14
Table 3 Environmental Monitoring Program Parameters
Parameter
Groundwater
Monitoring Wells
Leachate
Monitoring
Private
Water Wells
Surface Water
Stations
Comp. Indicator Comp. Indicator Comp. Indicator Comp. Indicator
General
Alkalinity X X X X X X X X
BOD5 X X X X
COD X X X X X
Conductivity X X X X X X X X
DOC X X X X X X
Hardness X X X X
pH X X X X X X X X
Phenols X X X X X X X X
Sulphate X X X X X X X X
Suspended Solids X X X X
Total Cyanide X
Nutrients
Ammonia X X X X X X
Nitrate X X X X X X
Nitrite X X X X
TKN X X X
Total Phosphorus X X X
Major Ions
Chloride X X X X X X X X
Calcium X X X X X X
Iron X X X X X X X X
Magnesium X X X X X X

W12A Landfill Status Report 2016
Page 15
Parameter
Groundwater
Monitoring Wells
Leachate
Monitoring
Private
Water Wells
Surface Water
Stations
Comp. Indicator Comp. Indicator Comp. Indicator Comp. Indicator
Manganese X X X
Potassium X X X X X X
Sodium X X X X X X
Trace Metals
Arsenic X X X X
Barium X X X X
Boron X X X X
Cadmium X X X X X X X
Chromium X X X X
Copper X X X X
Lead X X X X
Mercury X X
Nickel X X X X X X
Selenium X X
Silver X
Strontium X
Zinc X X X X
Volatiles
EPA 624 Scan X X

W12A Landfill Status Report 2016
Page 16
2.2 Groundwater 2.2.1 Regional Characteristics General
This section and the following section gives an overview of the hydrogeological setting to provide context for the monitoring program and the interpretation of the groundwater test results. Previous Studies
Previous studies conducted at the W12A Landfill have described the regional setting of the area in detail. These studies are listed in Appendix H and the information from these reports are summarized below. Regional Geology
The surface tills and stratified drift in the area were deposited by the Erie glacial lobe and its melt waters during the late Wisconsin ice age. The landfill is located on the Westminster moraine which consists of low permeability till soils identified as Port Stanley Till. The Westminster moraine was an end moraine, formed when there was a pause in the retreat of the ice margin. After the Erie Interstadial period, the re-advance of the Erie lobe formed the Ingersoll moraine (north of the landfill). The Westminster moraine was overridden as the Erie Lobe retreated to form the St. Thomas moraine, south of the landfill. Immediately north of the landfill, gravel and gravelly sand were formed from the older Catfish Creek drift (located under the Port Stanley Till) or were deposited underneath the Port Stanley Till by subglacial streams (Dreimanis, 1970). The bedrock surface of the region slopes from the north-northeast, where it is about 240 masl near Dorchester, to the southeast, where it is about 140 masl east of St. Thomas. Immediately below the landfill, the bedrock surface elevation is approximately 190 masl. The bedrock consists of Dundee Formation limestone. The regional stratigraphy for the area is presented on Drawing 1. These regional cross sections are from the W12A Landfill Area Plan Study Hydrogeological Background Study completed in December 2005 by Dillon Consulting. Regional Hydrogeology
Major hydrostratigraphic units are divided into aquitards and aquifers. An aquitard consists of low permeable soils that inhibit groundwater flow. An aquifer consists of permeable soils that can transmit significant quantities of water such that when water wells are installed they produce usable quantities of water. The regional hydrogeology is dominated by a Surficial Aquitard (Port Stanley Till).

W12A Landfill Status Report 2016
Page 17
The next major hydrogeological feature in the region is an aquifer found beneath the Port Stanley Till, consisting of stratified sand and gravel soils, most likely part of the Catfish Creek Drift. These soil deposits comprise the White Oak Aquifer. The aquifer is described as having an irregular vertical distribution with a maximum thickness of approximately 45 metres just north of the landfill along Scotland Drive (Golder Associates, November 1991). The approximate aerial extent of the White Oak Aquifer is 100 km2 and flow is in a general north to south direction (Golder Associates, November 1991). Some local aquifers consisting of sand and gravel soil layers within the till soils were probably formed by subglacial processes at the time that the till soils were deposited. One such local aquifer is underneath the landfill and above the White Oak Aquifer. These aquifers are not regionally extensive and generally thinner than the White Oak Aquifer. 2.2.2 Site Characteristics General
The following sections summarize the site specific stratigraphy and hydrogeological characteristics of the W12A Landfill. A complete description of the site specific characteristics can be found in Appendix H. The report titled, W12A Landfill Area Plan Study Hydrogeological Background Study, completed in December 2005 by Dillon Consulting provides a comprehensive examination of the stratigraphy at and near the landfill. Much of the information on the stratigraphy in the area comes from drilling monitoring wells and boreholes. The borehole logs from drilling and summary tables are provided in Appendix J and the borehole locations are shown on Drawing 2. Site Geology and Hydrogeology
The inferred stratigraphy below the landfill consists of the following major hydrostratigraphic units (Figure 1, 2, and 3):
• Surficial Aquitard
• Upper Aquifer
• Lower Aquitard
• White Oak Aquifer
• Aquitard
• Bedrock

Figure 1
H: 1:5,500
0 100 200 250
V: 1:1,100
INFERRED STRATIGRAPHY OF W12ALANDFILL WEST - EAST CROSS SECTION
Legend
Clayey Till Soil
Refuse
Sand / Sand and Gravel Soil
Bedrock
Water Level
W12A LANDFILL 2016 ANNUAL REPORT
Date:
February 24, 2017
Solid Waste Management Division
MANNING DRIVE
WH
ITEO
AK
RO
AD
Section Location
West East
W12A Landfill

Figure 2
H: 1:5,500
0 100 200 250
V: 1:1,100
INFERRED STRATIGRAPHY OF W12ALANDFILL NORTH - SOUTH CROSS
SECTION: PHASE 1
Legend
Clayey Till Soil
Refuse
Sand / Sand and Gravel Soil
Bedrock
Water Level
Monitoring Well
W12A LANDFILL 2016 ANNUAL REPORT
Date:
February 24, 2017
MANNING DRIVE
WH
ITEO
AK
RO
AD
Section Location
W12A Landfill
North
South
Phase
1
Solid Waste Management Division

Figure 3
H: 1:5,500
0 100 200 250
V: 1:1,100
INFERRED STRATIGRAPHY OF W12ALANDFILL NORTH - SOUTH CROSS
SECTION: PHASE 2
Legend
Clayey Till Soil
Refuse
Sand / Sand and Gravel Soil
Bedrock
Water Level
W12A LANDFILL 2016 ANNUAL REPORT
Date:
February 24, 2017
MANNING DRIVE
WH
ITEO
AK
RO
AD
Section Location
North
South
Phase
2
W12A Landfill
Solid Waste Management Division

W12A Landfill Status Report 2016
Page 23
Surficial Aquitard
The site is underlain by an upper till unit, consisting of low permeability Port Stanley Till referred to as the Surficial Aquitard. The thickness of the Surficial Aquitard varies from a high of 20 m in the northwest corner of the site to a low of 8 metres at the southeast corner of the site (Map 6). The base of the upper till unit is effectively flat at an elevation of 258 to 262 masl (Figure J-1 in Appendix J). The hydraulic conductivity of the till soils below the landfill is estimated to be approximately 1.3 x 10⁻¹⁰ m/sec (Geotechnical Research Centre University of Western Ontario, 2000). This is equivalent to a groundwater velocity of 1 to 2 cm per year (based on the site specific soil porosity of 0.35 and a unit hydraulic gradient). The hydraulic conductivity was estimated based on flexible wall hydraulic conductivity testing as well as the calculation of hydraulic conductivity based on the chloride profiles in the soil below the waste. The principal groundwater flow direction in the Surficial Aquitard is downwards, caused by the relatively low water level in the underlying sand and gravel unit. The upper few metres of this aquitard are weathered and fractured, which may cause preferential groundwater flow horizontally through a network of fractures. Upper Aquifer
Underlying the Surficial Aquitard is layered sand and gravel soils which are approximately 8 to 10 metres thick (see Figure J-2 in Appendix J). This stratum is referred to as the Upper Aquifer. The water level in the Upper Aquifer is consistently below the interface of the overlying till except for the southwest corner. The resulting unsaturated zone varies from 1 to 2 metres in the north east part of the site to non-existent in the southwest corner. Groundwater flow in the Upper Aquifer below the landfill is principally horizontal, towards the southwest (Map 7). The water level data as well as historical water level data is presented in Appendix I. The hydraulic gradient is minimal, especially for the western part of the landfill site. The reason for the low gradient is related to the small amount of recharge occurring through the Surficial Aquitard and the limited extent of the Upper Aquifer north of the site. Hydrographs, showing water levels over time, for selected wells are provided in Appendix K. The hydrographs show water levels were rising slowly (< 0.05 metres per year) in the Upper Aquifer until about 6 years ago and have since stabilized.

W12A Landfill Status Report 2016
Page 24
Geologic cross-sections show that the Upper Aquifer is spatially discontinuous. This aquifer exists beneath and southwest of the landfill site. The Upper Aquifer probably discharges to the upper reaches of Dodds Creek, southwest of the site. Directly north of the landfill the Upper Aquifer pinches out. Pump tests indicate that the Upper Aquifer has a hydraulic conductivity in the range of 10-5 m/sec to10-4m/sec which would result in a significant flow rate even under low hydraulic gradients (Dillon Consulting Ltd., 2002). Lower Aquitard
Underlying the Upper Aquifer, a Lower Aquitard exists, separating the Upper Aquifer from the White Oak Aquifer. The Lower Aquitard consists mainly of silty clay soils and is generally about 15 to 20 metres thick. The hydrogeologic characteristics of this unit have not been studied. However, based on soil descriptions in borehole logs (i.e., silty clay soils), the till will have low permeability similar to the Surficial Aquitard. White Oak Aquifer
As previously discussed, the White Oak Aquifer consists of layered sand and gravelly soils with some inter-layering of silt and clay soils (stratified glacial drift). The aquifer was used as a drinking water source for the City of London from the 1950’s until 1967. Groundwater was extracted via a series of wells located north of the landfill along Scotland Drive. When the wells were shut off and for a period of time afterwards, groundwater in the aquifer in the area that is now the W12A Landfill flowed to the north. Over time the water levels in the aquifer rebounded and groundwater flow shifted to the south and southeast. Groundwater flow in this aquifer for June 2016 (Map 8). The hydrographs for wells in the White Oak Aquifer show water levels in the aquifer are still rising in the up-gradient wells (Appendix K). Water levels have risen over the last 16 years by approximately 4 m up-gradient of the landfill and 1.5 m down-gradient of the landfill. Water levels up-gradient of the landfill appear to still be rising while water levels down-gradient and cross-gradient appear to have stabilized. Impact Assessment
Contaminant transport modelling for Phase 2 of the landfill was completed in 2002 and presented in Phase 2 of the W12A Landfill, Design and Operations Report Certificate of Approval No. A042102. Contaminant transport modelling of Phase 1 of the landfill was completed in 2003 and presented in the 2003 Annual Report. Modelling was completed in accordance with the Landfill Standards a Guideline on the Regulatory and Approval Requirements for New or Expanding Landfilling Sites (MOECC, 1998). The computer program POLLUTE was used to predict the groundwater quality in time and space as contaminants migrate from the landfill into the groundwater environment. The model incorporated the performance of the leachate collection system, soil characteristics, the hydrogeological setting and the characteristics of the various contaminants in the leachate (Table 4).
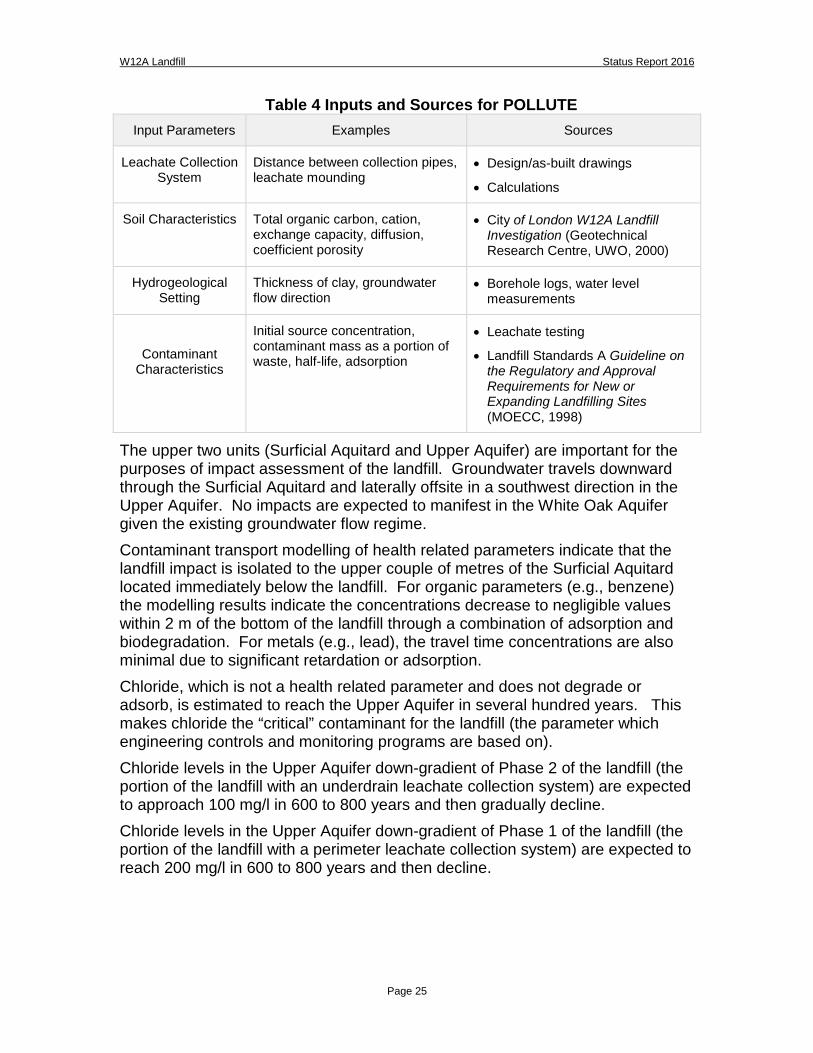
W12A Landfill Status Report 2016
Page 25
Table 4 Inputs and Sources for POLLUTE Input Parameters Examples Sources
Leachate Collection System
Distance between collection pipes, leachate mounding
• Design/as-built drawings
• Calculations
Soil Characteristics Total organic carbon, cation, exchange capacity, diffusion, coefficient porosity
• City of London W12A Landfill Investigation (Geotechnical Research Centre, UWO, 2000)
Hydrogeological Setting
Thickness of clay, groundwater flow direction
• Borehole logs, water level measurements
Contaminant Characteristics
Initial source concentration, contaminant mass as a portion of waste, half-life, adsorption
• Leachate testing
• Landfill Standards A Guideline on the Regulatory and Approval Requirements for New or Expanding Landfilling Sites (MOECC, 1998)
The upper two units (Surficial Aquitard and Upper Aquifer) are important for the purposes of impact assessment of the landfill. Groundwater travels downward through the Surficial Aquitard and laterally offsite in a southwest direction in the Upper Aquifer. No impacts are expected to manifest in the White Oak Aquifer given the existing groundwater flow regime. Contaminant transport modelling of health related parameters indicate that the landfill impact is isolated to the upper couple of metres of the Surficial Aquitard located immediately below the landfill. For organic parameters (e.g., benzene) the modelling results indicate the concentrations decrease to negligible values within 2 m of the bottom of the landfill through a combination of adsorption and biodegradation. For metals (e.g., lead), the travel time concentrations are also minimal due to significant retardation or adsorption. Chloride, which is not a health related parameter and does not degrade or adsorb, is estimated to reach the Upper Aquifer in several hundred years. This makes chloride the “critical” contaminant for the landfill (the parameter which engineering controls and monitoring programs are based on). Chloride levels in the Upper Aquifer down-gradient of Phase 2 of the landfill (the portion of the landfill with an underdrain leachate collection system) are expected to approach 100 mg/l in 600 to 800 years and then gradually decline. Chloride levels in the Upper Aquifer down-gradient of Phase 1 of the landfill (the portion of the landfill with a perimeter leachate collection system) are expected to reach 200 mg/l in 600 to 800 years and then decline.

WONDERLAND RD S
SIGNIFICANT WHITE OAKAQUIFER RECHARGE AREAS
$
$
$
$
MANNING DR
SCOTLAND DR
WHITE
OAK
RD
WELL
INGT
ON R
D S
WESTMINSTER DR
GLANWORTH DR
HWY 401
W12A LANDFILL
March 14, 2017
W12A LANDFILL 2016 ANNUAL REPORT
Notes:1) City of London Aerial Photography, April 20162) Thickness of surficial aquitard produced by Dillon Consulting Limited,December 2005 (Landfill Area Plan Study Hydrogeological BackgroundStudy Report #05-04556)
300 Dufferin Avenue,PO Box 5035London, OntarioN6A 4L9General Inquiries: 519-661-4500www.london.ca
Date:
Solid Waste Management Division
THICKNESS OF SURFICIAL AQUITARD
Map 6
0 250 500 750
Metres
!I1:20,000
C:\U
sers
\34S
FG\D
eskt
op\D
eliv
ery\
Map
6 T
hick
ness
of S
urfic
ial A
quita
rd.m
xd
Existing W12A LandfillParcels
Thickness of Surficial Aquitard (m)
5 - 1010 - 1515 - 2020 - 30
Legend
<5
Property Information

!>!A!>
!>
!>
!A
!>!A
!A!> !A
!>!A
@@@!!A
!!A
!!A !!A
!A !>
!A
!A !A!A
!A !A
!A
!A!>
!A
!A !A
!A
!A
!A!A
!A
!A
!A
!!A
$
$
$
HWY 401
WHITE
OAK
RD
WELL
INGT
ON R
D S
SCOTLAND DR
MANNING DR
97-2
257.5
258.0
259.0
260.0
259.5
258.5
GLANWORTH DR
259.0
260.0
259.5
258.5258.0
257.5
97-597-3
97-4
97-7
00-3b00-7a 00-3a
92-7
92-4(259.0)
04-6a(259.0)
06-2(258.7)
06-1(258.5)
05-5(258.9)
05-4(259.2)
05-3(257.9)
05-2(257.4)
05-1(257.1)
92-1(259.4)
92-2(259.9)
92-3(260.4)
82-6(259.1)
94-3(258.5)
94-1(258.8)
13-1a(258.3)
91-4a(259.1)
84-5b(258.8)
01-14(259.3)
04-2a(258.6)
01-9a(258.3)
92-11(259.1)
01-12b(260.7)
13-3a(258.7)
92-8
92-9
01-1392-10
94-2
01-3a
92-12 01-12a
14
W12A LANDFILL
March 14, 2017
W12A LANDFILL2016 ANNUAL REPORT
Notes:1) City of London Aerial Photography, April 20162) Site Features prepared by Callon Dietz Inc. LTD, October 19, 2016
300 Dufferin Avenue,PO Box 5035London, OntarioN6A 4L9General Inquiries: 519-661-4500www.london.ca
Date:
Solid Waste Management Division
PIEZOMETRIC SURFACE - UPPER AQUIFER SUMMER 2016
Map 7
LegendGround Water Flow
Piezometric Surface Upper Aquifer$ Groundwater Flow Direction
Active Monitoring Wells!!A Leachate@ Till!A Upper Aquifer!> White Oak Aquifer
Property Information Existing W12A Landfill City Owned Property Parcels
0 250 500 750
Metres
!I1:12,000
C:\U
sers
\34S
FG\D
eskt
op\D
eliv
ery\
Map
7 G
roun
dwat
er F
low
Dire
ctio
n - U
pper
Aqu
ifer.m
xd
97-3
00-3a
05-01
01-12a

!>!A!>
!>
!>
!A
!>!A
!A!> !A
!>!A
@@@!!A
!!A
!!A !!A
!A !>
!A
!A !A!A
!A !A
!A
!A!>
!A
!A !A
!A
!A
!A!A
!A
!A
!A
!!A
$
$
HWY 401
WHITE
OAK
RD
WELL
INGT
ON R
D S
SCOTLAND DR
MANNING DR
97-2
254.0256.0
258.0258.5
259.0
GLANWORTH DR
259.0
258.5
258.0
256.0
254.0
97-597-3
97-4
97-700-3b
00-7a00-3a
06-2
06-1 05-505-4
05-3
05-205-1
92-4
92-1
92-292-3
92-7
82-6
94-3
94-1
13-1a04-6a
91-4a84-5b
01-14
04-2a01-9a
92-11
01-12b
13-3a
92-9(259.0)
01-13(259.0)
92-8(253.5)
92-10(259.1)
94-2(258.8)
01-3a(258.8)
92-12(259.1)
01-12a(259.1)
14(258.6)
W12A LANDFILL
March 14, 2017
W12A LANDFILL2016 ANNUAL REPORT
Notes:1) City of London Aerial Photography, April 20162) Site Features prepared by Callon Dietz Inc. LTD, October 19, 2016
300 Dufferin Avenue,PO Box 5035London, OntarioN6A 4L9General Inquiries: 519-661-4500www.london.ca
Date:
Solid Waste Management Division
PIEZOMETRIC SURFACE - WHITE OAK AQUIFER SUMMER 2016
Map 8
LegendGround Water Flow
Piezometric Surface White Oak Aquifer$ Groundwater Flow Direction
Active Monitoring Wells!!A Leachate@ Till!A Upper Aquifer!> White Oak Aquifer
Property Information Existing W12A Landfill City Owned Property Parcels
0 250 500 750
Metres
!I1:12,000
C:\U
sers
\34S
FG\D
eskt
op\D
eliv
ery\
Map
8 G
roun
dwat
er F
low
Dire
ctio
n - W
hite
Oak
Aqu
ifer.m
xd
97-3
00-3a
05-01
01-12a

W12A Landfill Status Report 2016
Page 31
2.2.3 Groundwater Monitoring Program
The following discussion of groundwater quality test results for 2016 is intended to provide an evaluation of groundwater quality relative to historical data and current compliance standards. Modifications to the Groundwater Monitoring Network
There were no modifications to the groundwater monitoring network in 2016. The borehole logs and installation details for the wells can be found in Appendix J. Key Parameters
The review of water quality is focused on six key parameters: chloride, sodium, iron, Dissolved Organic Carbon (DOC), cadmium and nickel. In 1999, the MOECC and the City agreed that these parameters would be used in assessing impacts to groundwater with respect to the Reasonable Use Guideline (RUG). These parameters were chosen as they were found at high levels in the leachate and at low levels in the down-gradient groundwater monitors. Details on the RUG can be found in the MOECC document Guideline B-7 (formerly 15-08) Incorporation of the Reasonable Use Concept into MOEE Groundwater Management Activities. The guideline details the calculation of the Reasonable Use Criterion (RUC) for contaminants. The RUC is the maximum concentration for parameters allowed at the property boundary of a waste disposal site. Trigger Mechanism
Of the six aforementioned parameters, chloride is the “critical” contaminant (the parameter which engineering controls and monitoring programs are based on) because it is the only parameter expected to be detected in the down-gradient monitoring wells at elevated levels based on the previously described contaminant transport modelling. For this reason, the trigger mechanism for implementation of contingency measures to prevent groundwater impacts is based on chloride (Table 5). “Trigger Mechanism” wells consist of all cross-gradient and down-gradient monitoring wells adjacent to the landfill which are located in the Upper Aquifer as of 2006. These wells are 94-1, 94-3, 01-9a, 76-1 (13-1a), 76-2 (04-2a), 76-3 (13-3a), 91-4a, 84-5b, 06-1, and 06-2.

W12A Landfill Status Report 2016
Page 32
Table 5 Trigger Mechanism for Groundwater Impacts Level One Procedures
• Groundwater sampling program as detailed in Appendix K of Phase 2 of the W12A Landfill, Design and Operations Plan, Certificate of Approval No. A042102 (November 2002). The sampling program consists of three sampling events per year.
• Annual review of sampling program and trigger mechanism to confirm the adequacy of the program.
“Trigger” to Implement Level Two Procedures
• Groundwater sample and confirmation sample shows chloride greater than 33 mg/l (approximately 25% of the Reasonable Use Guideline (RUG) value for chloride for any down-gradient or cross gradient monitoring well in the shallow aquifer (monitoring wells 94-1, 94-3, 01-9a, 13-1a, 04-2a, 13-3a, 91-4a, 84-5b, 06-1 and 06-2).
• Confirmation sample to be taken as soon as possible after receiving results in excess of Level Two trigger values.
Level Two Procedures
• Groundwater sampling increased to six events per year: o Level one sampling program plus, o Sampling on-site monitoring wells in the shallow aquifer for indicator parameters in August,
December and February.
“Trigger” to Implement Level Three Procedures
• Groundwater sample and confirmation sample shows; o Chloride greater than 33 mg/l for three consecutive events at
a single monitoring well or, o Chloride greater than 66 mg/l (approximately 50% of RUG
value) for single event. o Confirmation sample to be taken as soon as possible after
receiving results in excess of Level Two trigger values.
Level Three Procedures
• Groundwater sampling as per Level Two operating procedures; • Investigations will be implemented to determine the cause of the elevated groundwater quality
results and/or assess down-gradient impacts. • If investigations determine the cause of the elevated groundwater results are landfill related, a
detailed design of the preferred contingency measure (e.g., purge wells, contaminant attenuation zone, etc.) will be undertaken.
“Trigger” to Implement Level Four Procedures
• Groundwater sample and confirmation sample shows; o Chloride greater than 131 mg/l.
• Confirmation sample to be taken as soon as possible after receiving results in excess of Level Two trigger values.
Level Four Procedures
• Implement contingency measures
“Trigger” to Return to Level One Procedures
• Surface water sampling program shows chloride less than 33 mg/l for all on-site down-gradient monitoring wells for 3 consecutive sampling events.

W12A Landfill Status Report 2016
Page 33
The trigger mechanism requires preliminary action should chloride levels exceed 33 mg/l and installation of the contingency measures should chloride levels exceed 131 mg/l. As previously discussed chloride is: • not a “health related” parameter and expected to be the only parameter to
eventually migrate off-site; • expected to take hundreds of years to reach the landfill’s property boundary
based on modelling; • predicted to peak at levels below the aesthetic drinking water criteria of 250
mg/l based on modelling. 2.2.4 Upper Aquifer Results Chemical test results from the groundwater monitoring program, as well as, time versus concentration graphs for key parameters are presented in Appendix C. Reasonable Use Criterion
As previously discussed, the MOECC and the City agreed that six parameters would be compared to the RUG in assessing impacts to groundwater. The RUC for these parameters in the Upper Aquifer are presented in Table 6.
Table 6 Calculation of Reasonable Use Criterion – Upper Aquifer
Item
Parameter
Chloride Sodium Iron DOC Cadmium Nickel
ODWO (mg/l) 250 200 0.30 5.0 0.005 0.1
Aesthetic/Health Aesthetic Aesthetic Aesthetic Aesthetic Health Aesthetic
RUC Factor 0.5 0.5 0.5 0.5 0.25 0.5
Background Level 12 49 0.46 1.5 0.0012 0.004
Reasonable Use Criterion
131 125 0.465 3.2 0.0013 0.052
Notes 1. Ontario Drinking Water Objectives (ODWO). 2. Background level calculated from 2016 average of levels in monitoring wells 92-11, 82-6 and
01-14. 3. Reasonable Use Criterion (RUC) is calculated using the equation:
(ODWO-Background) X RUC Factor + Background. 4. Details of the Reasonable Use Guideline can be found in the Ministry of Environment
Document GUIDELINE B-7 (formerly 15-08) Incorporation of the Reasonable Use Concept into MOEE Groundwater Management Activities.
5. Reasonable Use Criterion = Background Level if Reasonable Use Criterion < Background Level

W12A Landfill Status Report 2016
Page 34
Discussion of 2016 Water Quality Results Table 7 provides a summary of the water quality results for the “key” parameters (chloride, iron, sodium, DOC, cadmium and nickel). Complete water quality results are presented in Appendix C. Time versus concentration graphs were prepared for each of the six key parameters and are also presented in Appendix C.
Table 7 Summary of Chemical Test Results for Key Parameters – Upper Aquifer
Parameter
Monitoring Wells
Results
Comments
Maximum Value (mg/l)
Average Value (mg/l)
Wells with ↑ trend
Chloride RUC = 131 mg/l Trigger 1 = 33 mg/l
Trigger Mech. 12 4 No wells
Down-gradient 4 3 No wells
Up-gradient 166 31 No wells High concentration in 01-12b (54 mg/l), 04-6a (166 mg/l) and 92-11 (32 mg/l). Other wells were <3 mg/l.
Cross-gradient 12 5 No wells High concentration in 94-1 (12 mg/l). Other wells were < 3 mg/l.
Iron RUC = 0.46 mg/l
Down-gradient 1.57 0.98 No wells
Up-gradient 4.53 0.98 No wells High concentration in 82-6 (0.1 mg/l) and 91-4a (0.16 mg/l).
Cross-gradient 1.45 0.92 No wells
Sodium RUC = 125 mg/l
Down-gradient 65 42 No wells
Up-gradient 250 56 No wells All wells <74 mg/l except 04-6a (250 mg/l).
Cross-gradient 70 47 No wells
DOC RUC = 3.2 mg/l
Down-gradient 2.1 1.3 No wells
Up-gradient 2.4 1.6 No wells
Cross-gradient 7.3 1.7 No wells High concentration in 84-5b (7 mg/l).

W12A Landfill Status Report 2016
Page 35
Parameter
Monitoring
Wells
Results
Comments
Maximum Value (mg/l)
Average Value (mg/l)
Wells with ↑ trend
Cadmium RUC = 0.0013 mg/l
Down-gradient <0.0002 0.0004 No wells
Up-gradient 0.0004 <0.0002 No wells
Cross-gradient <0.0002 <0.0002 No wells
Nickel RUC = 0.052 mg/l
Down-gradient 0.006 0.003 No wells
Up-gradient 0.017 0.005 No wells
Cross-gradient 0.020 0.092 No wells
Notes 1. “Trigger Mechanism” wells are the wells adjacent to the landfill and are listed in the trigger
mechanism requiring action should chloride levels exceed 33 mg/l. These wells are 94-1, 94-3, 01-9a, 13-1a, 04-2a, 13-3a, 91-4a, 84-5b, 06-1 and 06-2.
2. “Down-gradient” wells are south and southwest of the landfill. These wells are 13-1a, 94-3, 01-9a, 05-1, 05-2 and 05-3.
3. “Up-gradient” wells are north and northeast of the landfill. These wells are 82-6, 91-4a, 92-11, 01-12b, 01-14 and 04-6a.
4. “Cross-gradient” wells are east and west of the landfill. These wells are 13-3a, 84-5b, 94-1 and 04-2a.
5. ↑ Trend is when or there is a statistically significant trend upwards using linear regression analysis method from McBean and Rover (1984).
RUC
There were no exceedance of the RUC in any of the down-gradient, up-gradient or cross-gradient wells with the exception of iron, chlorides and DOC as discussed below as discussed below. Iron Concentration
Iron concentrations in some of the down-gradient, up-gradient and cross gradient wells were observed above the RUC in 2016. It is noted that the June 2015 groundwater monitoring event was modified to incorporate field filtering. This sample collection modification was incorporated in each of the 2016 groundwater monitoring events. It is believed that this change in the sampling collection method is responsible for the elevated iron levels. In 2016, the average results in the up-gradient wells 01-12b (1.68 mg/l), 92-11(1.29 mg/l) and June 2016 result for 04-6a (4.53 mg/l) were in exceedance of the RUC, with maximum observed values in 01-12b (1.85mg/l) and 04-6a (4.53 mg/l) respectively. The average concentrations of the down-gradient and cross-gradient wells that were above the RUC were observed to be lower than the aforementioned up-gradient wells for both maximum and average concentrations.
W12A Landfill Status Report 2016
Page 36
This parameter as a result of the sample collection methodology change was closely monitored in 2016 and will continue to be monitored in 2017. Chloride Concentrations & Trigger Mechanism
There was an exceedance of the trigger mechanism for chlorides in two up-gradient wells. Chloride concentrations from the June 2016 sampling event are presented on Map 9. Chloride levels in the down-gradient and cross-gradient monitoring wells that are linked to the trigger mechanism (94-1, 94-3, 01-9a, 13-1a, 04-2a, 13-3a, 91-4a, 84-5b, 06-1, and 06-2) were on average less than 12 mg/l. Two up-gradient monitoring wells had chloride levels above the trigger mechanism level of 33 mg/l. Monitoring well 01-12b, located north of the landfill and in close proximity and down-gradient to the aggregate pits on Scotland Drive, had chloride levels of 54 mg/l. This level is consistent with historical results at this location. The cause of the elevated chloride levels may be road salt. The use of road salt along the 401 and the Significant Groundwater Recharge Area in the area of the gravel pits is likely the cause of elevated chloride concentrations in the White Oak Aquifer (Dillon Consulting Ltd., February 2015). The road salt may also be impacting the Upper Aquifer. Dissolved Organic Carbon
There was an exceedance of DOC in one well, 84-5b (7.3 mg/l), in June 2016. The results for April and October 2016 were, however, below the RUC (3.2 mg/l) and in line with historical averages. Given that the results observed in the months prior to and subsequent to the exceedance were within the nominal range for this parameter, it can be determined that the exceedance of RUC in this case is not representative of the data set for this well. This parameter will continue to be observed in 2017. Monitoring well 04-6a which is located east of the landfill and north of Manning Drive. Well 04-6a recorded chloride levels of 166 mg/l. The cause of the elevated chloride levels at this up-gradient location is unknown at this time. At this time the chloride levels in the down-gradient wells have not exceeded the Trigger Mechanism concentrations discussed above. The City will therefore continue to monitor any increasing trends as part of the W12A monitoring program. Increasing Trends
For the purposes of this report an increasing trend is defined as having a statistically significant trend upwards using linear regression analysis method from McBean and Rover (1984). The time versus concentration graphs show no increasing trends for any of the key parameters in any of the down-gradient wells. The time versus concentration graphs for chlorides show an increasing trend for chlorides in up-gradient well 92-11 and in cross-gradient well 94-1.

W12A Landfill Status Report 2016
Page 37
Chlorides have increased from typical values of less than 10 mg/l in the 1990’s to greater than 25 mg/l in well 92-11. This monitoring well is located up-gradient of the landfill therefore the increasing trend is not related to landfilling activities. This well is down-gradient of the aggregate pits where it is believed that chlorides from road salt is being introduced into the groundwater. The time versus concentration graphs show an increasing trend for chlorides in well 94-1. Chlorides have increased from typical values of 4 mg/l to 12 mg/l over the last decade. This monitoring well is located cross-gradient of the landfill and down-gradient of well 92-11. Other Parameters
Table 8 provides a summary of the test results for additional parameters to assess the overall groundwater quality. No exceedances of the ODWO were found in any of the down-gradient wells except for manganese in well 13-1a (0.06 mg/l in June). This value is marginally above the aesthetic guideline and is consistent with historical results. All wells had Volatile Organic Compounds (VOCs) levels below the detection limit. Summary
Overall, the test results indicate no impacts on the Upper Aquifer from the W12A Landfill.

W12A Landfill Status Report 2016
Page 38
Table 8 Summary of Chemical Test Results for Selected Parameters – Upper Aquifer
Parameter Monitoring Wells
Results Comments
Maximum Value (mg/l)
Average Value (mg/l)
Wells with ↑ trend
General Parameters
Sulphate ODWO = 500 mg/l
Down-gradient 450 155 No wells
Up-gradient 96 82 No wells
Cross-gradient 379 194 13-3a Year over year increased from 230-379 mg/l, however increase observed in-line with historical results observed for this monitoring location
Manganese ODWO = 0.05 mg/l
Down-gradient 0.060 0.03 No wells Marginal exceedance consistent with historical results observed at this location
Up-gradient 0.03 0.02 No wells
Cross-gradient 0.03 0.02 No wells
Nitrate ODWO = 10 mg/l
Down-gradient <0.06 <0.06 No wells
Up-gradient 0.10 <0.06 No wells
Cross-gradient <0.06 <0.06 No wells
Trace Metals
Arsenic ODWO = 0.025 mg/l
Down-gradient 0.02 0.01 No wells
Up-gradient 0.01 0.01 No wells
Cross-gradient 0.01 0.01 No wells
Chromium ODWO = 0.05 mg/l
Down-gradient <0.001 0.0007 No wells
Up-gradient <0.001 <0.001 No wells
Cross-gradient <0.001 <0.001 No wells
Zinc ODWO = 5 mg/l
Down-gradient 0.003 0.003 No wells
Up-gradient 0.021 0.009 No wells
Cross-gradient 0.009 0.004 No wells

W12A Landfill Status Report 2016
Page 39
Parameter Monitoring Wells
Results Comments
Maximum Value (mg/l)
Average Value (mg/l)
Wells with ↑ trend
Other
VOCs (over 20 different parameters tested)
Down-gradient Depends on parameter No wells Below detection limit
Up-gradient Depends on parameter No wells Below detection limit
Cross-gradient Depends on parameter No wells Below detection limit
Notes 1. ODWO = Ontario Drinking Water Objective. ND = Not Detected 2. “Down-gradient” wells are south and southwest of the landfill. These wells are 13-1a, 94-3,
01-9a, 05-1, 05-2 and 05-3. 3. “Up-gradient” wells are north and northeast of the landfill. These wells are 82-6, 91-4a, 92-11,
01-12b, 01-14 and 04-6a. 4. “Cross-gradient” wells are east and west of the landfill. These wells are 13-3a, 84-5b, 94-1
and 04-2a. 5. ↑ Trend is when there is a statistically significant trend upwards using linear regression
analysis method from McBean and Rover (1984).

W12A Landfill Status Report 2016
Page 40
2.2.5 White Oak Aquifer Results Chemical test results from the groundwater monitoring program for the White Oak Aquifer as well as time versus concentration graphs for key parameters are presented in Appendix C. Reasonable Use Guideline Criterion
The RUC for key parameters in the White Oak Aquifer are calculated in Table 9. Table 9 Calculation of Reasonable Use Criterion – White Oak Aquifer Item Parameter
Chloride Sodium Iron DOC Cadmium Nickel
ODWO (mg/l) 250 200 0.3 5.0 0.0050 0.100
Aesthetic/Health Aesthetic Aesthetic Aesthetic Aesthetic Health Aesthetic
RUC Factor 0.5 0.5 0.5 0.5 0.2500 0.500
Background Level 115 32 2.8 0.8 0.0002 0.005
Reasonable Use Criterion
182 116 1.5 2.9 0.0014 0.050
Notes
1. Ontario Drinking Water Objectives (ODWO). 2. Background level calculated from 2016 average of levels in monitoring wells 92-10 and 92-
12. 3. Reasonable Use Criterion is calculated using the equation:
(ODWO-Background) X RUC Factor + Background. 4. Details of the Reasonable Use Guideline can be found in the Ministry of Environment
Document GUIDELINE B-7 (formerly 15-08) Incorporation of the Reasonable Use Concept into MOEE Groundwater Management Activities.
Discussion of 2016 Water Quality Results
Table 10 provides a summary of the test results for chloride and the other “key” parameters (iron, sodium, DOC, cadmium and nickel). Time versus concentration graphs were prepared for each of the six key parameters and are presented in Appendix C.

W12A Landfill Status Report 2016
Page 41
Table 10 Summary of Chemical Test Results – White Oak Aquifer Parameter Monitoring
Wells Results Comments
Max. (mg/l)
Average (mg/l)
Wells with ↑ trend
Key parameters
Chloride RUC = 182 mg/l
Down-gradient 19 10 No wells
Up-gradient 138 58 92-12 Increased from 115-138 mg/l
Cross-gradient 10 10 No wells
Iron RUC = 1.54 mg/l
Down-gradient 3 2 No wells
Up-gradient 5 3 No wells
Cross-gradient 2 2 No wells
Sodium RUC = 116 mg/l
Down-gradient 14 9 No wells
Up-gradient 45 24 92-12 Increased from 37-45 mg/l
Cross-gradient 10 10 No wells
DOC RUC = 2.9 mg/l
Down-gradient 3.2 2.9 No wells
Up-gradient 1.6 1.2 No wells
Cross-gradient 2.5 2.4 No wells
Cadmium RUC = 0.0014 mg/l
Down-gradient <0.0002 <0.0002 No wells
Up-gradient 0.0005 <0.0002 No wells
Cross-gradient <0.0002 <0.0002 No wells
Nickel RUC = 0.05 mg/l
Down-gradient <0.002 <0.002 No wells
Up-gradient 0.013 0.006 No wells
Cross-gradient 0.012 0.007 No wells
Other Parameters
Sulphate ODWO = 500 mg/l
Down-gradient 79 44 No wells
Up-gradient 305 190 No wells
Cross-gradient 100 99 No wells
Notes 1. “Down-gradient” wells are south and southwest of the landfill. These wells are 92-8 and 01-
3a. 2. “Up-gradient” wells are north and northeast of the landfill. These wells are 92-9, 92-10, 92-
12, 01-12a and 01-13. 3. “Cross-gradient” wells are east and west of the landfill. This well is 94-2 (and formerly 72-
101a, decommissioned in 2006). 4. ↑ Trend is when there is a statistically significant trend upwards using linear regression
analysis method from McBean and Rover (1984).

W12A Landfill Status Report 2016
Page 42
Increasing Trends
For the purposes of this report an increasing trend is defined as having a statistically significant trend upwards using linear regression analysis method from McBean and Rover (1984). The time versus concentration graphs show no increasing trends for any of the key parameters in any of the down-gradient or cross-gradient wells except for chlorides in down-gradient well 01-3a. Chlorides have steadily increased from 5 mg/l to 19 mg/l over the last 14 years. The chloride levels of two up-gradient wells (92-10 and 92-12) have been fluctuating. Concentrations in well 92-10 increased from 20 mg/l in 2000 to approximately 120 mg/l in 2012 and have since declined to 90 mg/l in 2016. Concentrations in well 92-12 have increased from 30 mg/l to over 138 mg/l by end of 2016. As previously discussed, the cause of the elevated chloride levels may be road salt. The use of road salt along the 401 and the Significant Groundwater Recharge Area in the area of the gravel pits is likely the cause of elevated chloride concentrations in the White Oak Aquifer (Dillon Consulting Ltd., February 2015). These wells are down-gradient of the aggregate pits. Sodium levels also increased in these wells. Summary
Chloride levels in the down-gradient monitoring wells are less than levels in the up-gradient wells (Map 9). Many other parameters (e.g., iron, sulphate, etc.) are also much higher in the up-gradient wells as compared to the down-gradient wells. In general the groundwater in the White Oak Aquifer is poorer quality up-gradient of the landfill as compared to down-gradient. Overall, the test results indicate no impacts on the White Oak Aquifer from the W12A Landfill.

A!AA
A
A
!A
A!A
!AA !AA
!A
@@@!!A
!!A
!!A !!A
!A A
!A
!A !A!A
!A !A
!A
!AA
!A
!A !A
!A
!A
!A!A
!A
!A
!A
#*
#*
!!A97-2
MANNING DR
SCOTLAND DRWH
ITE O
AK R
D
WELL
INGT
ON R
D S
GLANWORTH DR
HWY 401
97-597-3
97-4
97-7
00-3b00-7a(75) 00-3a
05-505-4
92-4
92-1
92-292-3
92-7
01-14(3)
94-1(12)
05-2(2)
06-2(2)
06-1(6)
05-3(2)
05-1(2)
84-5b(3)
82-6(2)
94-3(3)
13-1a(3)
91-4a(3)
04-2a(2)
01-9a(3)
92-11(31)
01-12b(52)
04-6a(166)
13-3a(3)
92-8(1)
92-9(1)
01-13(7)
92-10(81)
94-2(10)
01-12a(39) 92-12
(119)
01-3a(19)
14(53.8)
G2-11
G1-11
W12A LANDFILL
March 14, 2017
W12A LANDFILL2016 ANNUAL REPORT
Notes:1) City of London Aerial Photography, April 20162) Site Features prepared by Callon Dietz Inc. LTD, October 19, 2016
300 Dufferin Avenue,PO Box 5035London, OntarioN6A 4L9General Inquiries: 519-661-4500www.london.ca
Date:
Solid Waste Management Division
CHLORIDE CONCENTRATIONS
Map 9
Active Monitoring Wells!!A Leachate@ Till!A Upper AquiferA White Oak Aquifer
Methane Gas Monitoring Well#* Methane Gas Well
Property Information Existing W12A Landfill City Owned Property Parcels
0 250 500 750
Metres
!I1:15,000
C:\U
sers
\34S
FG\D
eskt
op\D
eliv
ery\
Map
9 C
hlor
ide
Con
cent
ratio
ns.m
xd
97-3
00-3a
05-01
01-12a
G1-11
(52) Chloride Concentration mg/L(Upper Aquifer - June 2016)
(1) Chloride Concentration mg/L(White Oak Aquifer - June 2016)
Legend

W12A Landfill Status Report 2016
Page 45
2.3 Surface Water 2.3.1 Surface Water Hydrology The W12A Landfill sits on the surface water divide between the Dodds Creek watershed and the Dingman Creek watershed (Map 5). The majority of the site is within the Dodds Creek watershed (142 hectares) and a small portion in the Dingman Creek watershed (13 hectares). Prior to the development of the landfill, surface water drained to a number of separate channels that discharged into one of five culverts. Four culverts crossed Manning Drive (located in the Dodds Creek watershed) and one culvert crossed White Oak Road (located in the Dingman Creek watershed). Drainage in the channels was intermittent, with flows only after rainfall events. The soils in the area are moderately well drained Muriel silty clay, with silty loam overlying the clay near low-lying areas adjacent to the channels. Drainage in the eastern portion of the landfill is now controlled by ditches around the perimeter of the fill area which drain to one of two stormwater management ponds. The existing internal drainage system, location of the two stormwater management ponds, location of the culverts and the surface water sampling locations are shown on Drawing 2. Stormwater Management Pond #5 drains to Drainage Ditch #1 and Stormwater Management Pond #4 drains to Drainage Ditch #3. Drainage in the south-western portion of the landfill is controlled by ditches along the access road. The ditches direct surface water to Stormwater Management Pond #2/3 which discharges into Drainage Ditch #5. Drainage in the north-western portion of the landfill remains unchanged as no waste has been deposited or roads constructed. Drainage in this area drains to Stormwater Management Pond #1. 2.3.2 Surface Water Monitoring Program The following discussion of surface water quality test results for 2016 is intended to provide an evaluation of surface water quality relative to historical data and current compliance standards (Appendix D). Key Parameters
The discussion will focus on four key parameters (un-ionized ammonia, Biological Oxygen Demand (BOD5), chloride and sulphate) which the surface water “trigger mechanism” for implementation of contingency measures is based on. The trigger mechanism is presented in Table 11. All four parameters in the trigger mechanism are found in the leachate at concentrations many times greater than what would typically be expected in surface water and have been found occasionally at levels above background in the surface water discharging from the stormwater management ponds. These four parameters are also included in Landfill Standards (MOECC, 1998) as parameters to be included in surface water monitoring programs.

W12A Landfill Status Report 2016
Page 46
Table 11 Trigger Mechanism for Surface Water Impacts Level One Operating Procedures
• Stormwater management pond operated in “continuous” discharge mode • Surface water sampling program as detailed in Appendix K of Phase 2 of the W12A Landfill,
Design and Operations Report, Certificate of Approval No. A042105 (November 2002) or Appendix B of Stormwater Management Master Plan (November 2002). The sampling programs consists of four sampling events per year
• Annual review of sampling program and trigger mechanism
“Trigger” to Implement Level Two Operating Procedures
• Surface water sample and confirmation sample shows; o Un-ionized ammonia greater than 0.3 mg/l or, o BOD5 greater than 10 mg/l or, o Chloride greater than 800 mg/l or, o Sulphates greater than 1,000 mg/l,
• Or leachate outbreak occurs and leachate reaches drainage ditch
• Confirmation sample to be taken as soon as possible after receiving results in excess of Level Two trigger values
Level Two Operating Procedures
• Stormwater management pond operated in “batch” discharge mode. This involves closure of the valve that permits discharge of stormwater off-site.
• Surface water sampling consists of: • Level one sampling program plus • Sampling for parameter that ‘triggered’ Level Two operating procedures at the end of each rain
event • The stormwater is either discharged as stormwater or pumped into the leachate collection
system/ fill area depending on the water quality results from the monitoring program o Un-ionized ammonia greater than 0.3 mg/l or o BOD5 greater than 10 mg/l or o Chloride greater than 800 mg/l or o Sulphates greater than 1,000 mg/l
• Un-ionized ammonia, chloride and sulphate results will be available the same day samples are collected. BOD5 results will not be available until 5 days after the sample is collected. In the event that the water level in the pond is going to reach the overflow level for the stormwater management pond before results are available, the stormwater will be discharged (if practical) into the leachate collection system and/or onto the fill area to infiltrate and subsequently be collected by the leachate collection system.
• Investigations will be implemented to determine the cause of the elevated water quality results and/or assess down-gradient impacts. These investigations will determine potential long term actions that could be implemented or whether discharge of the surface is likely to have an adverse impact.
“Trigger” to Return to Level One Operating Procedures
• Surface water sampling program shows for 3 consecutive sampling events: o Un-ionized ammonia less than 0.3 mg/l, o BOD5 less than 10 mg/l, o Chloride less than 800 mg/l and o Sulphate less than 1,000 mg/l

W12A Landfill Status Report 2016
Page 47
Sampling Locations Surface water samples are collected from six drainage ditches (Table 12) and the four Stormwater Management Ponds #1, #2/3, #4 and #5 (Drawing 2).
Table 12 Surface Water Sampling Stations Sampling Station Receiving
Watershed Surface Runoff
Comments # Location Completed Fill Area
Landfill Property
1 Weir at southeast corner of landfill
Dodd Creek Yes Yes Receives flow from pond #5
2 West end of culvert at entrance to
landfill
Dodd Creek No Yes Includes drainage from buffer area including drop-off depot
3 Weir, Manning Drive (centre of
landfill)
Dodd Creek Yes Yes Receives flow from pond #4 & buffer area
5 Ditch at southwest corner of landfill
Dodd Creek Yes1 Yes Includes drainage from pond #2/3 & buffer area
7 Ditch at northwest corner of landfill
Dingman Creek No Yes Includes drainage from pond #1 and agricultural land
10 North end of culvert at 3713 Scotland
Drive
Dingman Creek No No Includes drainage from agricultural land
1This location receives flow from a partially completed fill area.
Since the landfill is situated on a surface water divide there are no up-gradient sampling locations. Ditches 7 and 10 do not receive surface water from areas that have been landfilled and can be considered representative of background conditions. 2.3.3 Surface Water Results A summary of the test results for the key parameters (un-ionized ammonia, BOD5, chloride and sulphate) at three surface water sampling stations (ditch #1, #3 and #5) used for the trigger mechanism are presented in Table 13. There were no exceedances for any trigger mechanism parameters in 2016. The City also undertakes sampling directly from the stormwater management ponds that receive runoff from areas that have been landfilled (Ponds 4 and 5). All samples collected from the stormwater management ponds did not exceed any of the trigger mechanism parameters.

W12A Landfill Status Report 2016
Page 48
Table 13 Summary of Chemical Test Results– Surface Water
Parameter
Sampling ID
Results
Maximum (mg/l) Average (mg/l)
BOD Trigger > 10 mg/l
Ditch 1 5 4
Ditch 3 4 4
Ditch 5 2 2
Chloride Trigger > 800 mg/l
Ditch 1 88 55
Ditch 3 261 161
Ditch 5 167 140
Sulphate Trigger > 1,000 mg/l
Ditch 1 39 33
Ditch 3 107 84
Ditch 5 94 91
Un-ionized Ammonia Trigger > 0.3 mg/l
Ditch 1 0.08 0.04
Ditch 3 0.004 0.003
Ditch 5 <0.006 <0.004
Other Parameters
Suspended Solids levels were similar to historic values which are typically below 100 mg/l. In 2016, the drainage ditches suspended solids ranged from < 3 mg/l to 292 mg/l. The highest level was recorded in October in drainage ditch #2. Suspended solids in the stormwater management ponds were below 100 mg/l. Phosphorous levels in all the ditches and the stormwater management ponds tested, including ditches not receiving surface water from the landfill, exceeded the Provincial Water Quality Objectives (PWQOs) criteria of 0.030 mg/l in 2016 except for one sample from pond #5. Phosphorous levels generally ranged between 0.03 mg/l and 0.380 mg/l and were always below the discharge criterion in the City’s Stormwater By-law of 0.40 mg/l. Analyses for trace metals were completed on field filtered samples since high suspended solids can skew metal levels. Metal levels were below the PWQO for all surface water samples. Historically, the stormwater management ponds typically have occasional exceedances of the PWQOs for copper and zinc.
2.4 Leachate 2.4.1 Leachate Characterization In 2000 and 2001, leachate from the W12A Landfill site was characterized to confirm no contaminants are overlooked in assessing future groundwater impacts or leachate treatment requirements.
W12A Landfill Status Report 2016
Page 49
The leachate characterization consisted of: • Reviewing historical monitoring results of leachate collected from on-site
leachate storage tanks (general chemistry and trace metals); • Testing of leachate in the on-site storage tanks for a wide range of
parameters not included in the historical monitoring program (Carbamates, Chlorinated Phenols, Dioxins & Furans, Herbicides & Phenoxy Acid Herbicides, Organochlorine & Organophosphorus Pesticides, Total PCBs, and Volatile Organic Compounds (VOCs));
• Testing of leachate collected from the leachate monitoring wells for general chemistry, trace metals and VOCs.
The leachate characterization study found the leachate to be typical of what would be expected for a mid-size Ontario landfill. The only parameters tested that exceeded the Ontario Drinking Water Standards were some general chemistry parameters, some trace metals and some VOCs. These parameters are included in the leachate and groundwater monitoring programs. These exceedances are expected given the nature of landfilling operations at W12A. As discussed above, these parameters were measured and characterized in order to assess any potential impacts to surrounding groundwater quality. 2.4.2 Leachate Monitoring Program Leachate from the landfill is collected by a perimeter leachate collection system in Phase 1 and an underdrain leachate collection system in Phase 2. Details of the leachate collection system are provided in Section 3.3.1. Leachate from the landfill must travel laterally through the waste to the leachate collection system and then along the collection system until it reaches one of two pumping stations. Leachate from the majority of Phase 1 drains directly to the main pumping station used to pump the leachate off-site for treatment. Leachate from the remainder of Phase 1 and all of Phase 2 drains to maintenance hole #701 and is then pumped to the main pumping station. The quality of the leachate may change as it moves from the centre of the landfill to the pumping stations especially for highly volatile compounds. In addition, the leachate collection system collects some clean surface water which has not been in contact with waste during heavy rain events. The result is leachate in the pumping station that is diluted when compared to the leachate collected from the leachate monitoring wells. Therefore, the results from the leachate collected from the leachate storage tanks is representative of the quality of leachate that will require treatment, and leachate from the monitoring wells is representative of leachate for assessing future groundwater impacts. For the above reasons, leachate is sampled from both the leachate storage tanks and leachate monitoring wells. 2.4.3 Leachate Quality Monitoring Results The following discussion of leachate water quality test results for 2016 is intended to provide an evaluation of leachate water quality relative to historical

W12A Landfill Status Report 2016
Page 50
data. The locations of the leachate pumping station and leachate monitoring wells are shown on Drawing 2. As noted in Section 2.1, the ECA requires that the leachate pumping station be sampled three times per year. The pumping station is typically sampled monthly. Leachate monitoring wells were constructed in 1997 and have been sampled since 2001. Leachate monitoring wells are located in the older portions of the landfill where no new waste has been placed for more than a decade. Current and historical test results, as well as time versus concentration graphs for key parameters are presented in Appendix E and summarized in Table 14.
Table 14 Leachate Monitoring Results
Parameter Leachate Monitoring Wells
Leachate Pumping Station
Comments
Treatment Related Parameters Ammonia • Stable
521 – 1210 mg/l
• Stable
130 – 551 mg/l
Long term decline in concentration has stabilized
BOD • Stable
19 – 126 mg/l
• Variable 28 – 802 mg/l
Long term decline in concentration has stabilized
COD • Stable
1110 – 1450 mg/l
• Stable
323 – 1150 mg/l
Long term decline in concentration has stabilized
Phosphorous • Stable
2.35 – 7.5 mg/l
• Stable
0.8 – 2.2 mg/l
Stable
Contaminant Transport Parameters Chloride • Stable
1420 – 2260 mg/l
• Variable
542 – 1050 mg/l
Long term decline in concentration has stabilized
Iron • stable
6 – 26 mg/l
• Stable
6.6 – 20.5 mg/l
Stable
DOC • Stable
246 – 427 mg/l
• Stable
92 – 395 mg/l
Stable
Sodium • Fairly stable
884 – 2040 mg/l
• Stable
456 – 974 mg/l
Slightly lower than 2015 data. Fairly stable
Cadmium • Stable 0.001 – <0.01 mg/l
• Stable <0.0005 – < 0.01 mg/l
Long term decline in concentration has stabilized
Nickel • Stable
0.12 – 0.22 mg/l
• Stable
0.05 – 0.10 mg/l
Long term decline in concentration has stabilized

W12A Landfill Status Report 2016
Page 51
2.5 Water Wells 2.5.1 Area Groundwater Resources As noted in Section 2.2.2 there are two aquifers below the W12A Landfill. The Upper Aquifer, that is discontinuous, “pinches” out just north of the landfill and the deeper White Oak Aquifer. Both aquifers are used as sources of drinking water. Map 10 shows the locations of historic and existing water wells that have been drilled in the area. 2.5.2 Water Well Monitoring Program The locations of the existing and historical water wells that have been sampled are detailed on Map 11. Many of the water wells north and east of the landfill are decommissioned. These wells have been taken out of service and the residents are on municipal water. The existing Water Well Monitoring program includes eleven water wells that terminate in the White Oak Aquifer and four wells that terminate in the Upper Aquifer. The chemical test results for these wells and time versus concentration graphs are presented in Appendix F. Indicator parameters, including the six key parameters identified by the MOECC and the City (chlorides, iron, sodium, DOC, cadmium and nickel), are tested for annually. Heavy metals are tested for on a 3-year cycle with the next testing scheduled for 2017. The following discussion of water well test results for 2016 is intended to provide an evaluation of water quality relative to historical data. The discussion includes a comparison of “key” parameters to the RUC. It should be noted that the RUC only applies to water quality at the landfill site property boundary, however, it provides a convenient comparator for assessing groundwater. RUC for the Upper Aquifer and White Oak Aquifer are presented for six parameters (chloride, sodium, iron, DOC, cadmium and nickel) in previous sections. 2.5.3 Upper Aquifer The Water Well Monitoring program includes three water wells in the Upper Aquifer (wells #12, #13, and #22). All three water wells are located down-gradient or cross-gradient of the landfill.

W12A Landfill Status Report 2016
Page 52
Key findings from reviewing the test results from the Upper Aquifer water wells are presented below:
• All wells had chloride (the “critical’ contaminant) levels below the RUC value of 131 mg/l
• Chlorides were below 20 mg/l for all wells except well #22 (63 mg/l in 2016)
• Well #12 had increasing trends for chlorides
• All wells continue to have high iron levels; high iron levels have been encountered in private water wells in the Upper Aquifer since monitoring began in 1976; recent iron levels are similar to historical levels
• Other key parameters (sodium, DOC, cadmium and nickel) were below RUC for all wells
Well #12 has displayed a slowly increasing trend for chlorides which have increased from 7 mg/l in the mid 1990’s to 18 mg/l in 2016. This well is located cross-gradient of the landfill and therefore increasing concentration is not from landfill groundwater impacts. This well is located near monitoring well 94-1 (cross-gradient to the landfill) and down-gradient of monitoring well 01-12b (up-gradient of the landfill). Both of these wells have increasing chlorides levels that are believed to be caused by road salt. Historically sulphate and hardness have also been observed to be increasing, but plateaued in 2010. Chloride levels in well #22 began increasing in 1994. Chloride levels peaked in 2008 at 108 mg/l and are currently 63 mg/l. The increase in chloride concentrations is not from landfill groundwater impacts because chloride levels (the first contaminant one would expect to increase because of landfill leachate impacts) in the groundwater monitoring wells located between well #22 and the landfill (wells 94-3, 01-9a, 05-1, 05-2 and 05-3) are at background levels ( < 10 mg/L) and not increasing. Investigation by Dillon Consulting indicates the relatively high chlorides may be caused by surface water infiltrating into the Upper Aquifer. The Surficial Aquitard decreases in thickness in this area and may potentially be non-existent for a small area including a portion of a tributary to Dodd’s Creek. The City of London owns the property that well #22 is located on and hired a contractor in 2016 to install a deeper well to take water from the White Oak Aquifer (well #131) to supply the property. Well #22 is still active as some additional internal water treatment equipment is required to be installed to address some aesthetic water quality parameters observed in new well #131. These activities are expected to be completed in 2017.

!(!(
!(
!(
!(
!(
!(
!(
!(
!(
$+
$+
$+
$+
$+
!(
!(
!(
!(
!(!( !(
!(
!(!(!(
$+
$+
$+
!(
!(
!(
$+!( !(
!(
$+!(")
")
!(!(
!(")$+
!($+$+!(
!(
!(
!(!(!( !(
!(
!(
!( !( !(
!(!(!( !(
!(!(!(
!(
!(!(!(!(
!(")")!(
!(
")
!(
!(
!(!(
")
!(
$+
!(
$+
$+
!(
!(
$+$+
!(
$+
!(
$+!(
")
!(
!(
!(
!($+
!(
!(
!(!(
!(
!(
!(
!(
!(
!(128
MANNING DR
SCOTLAND DR
WHITE
OAK
RD
WELL
INGT
ON R
D S
GLANWORTH DR GLANWORTH DR
HWY 401
E
7
2
9
438
6
1
5
33
14
68
71
50
64
7390
75
6159
17
70
95
8678
7772
67799288
52
979493
60699162
838581
80
82
84
9889 51
96
535463
5655
76
5787
58
99
66
65
74
30
24 25 32
31
28
29
22
19
18
13
12
16
23
27
26
20
15
21
11
10109130
131
129
111126
127
124
125116
114
117
115
119
118
121
120
113
112
110
108103105104
106
107
102101100
W12A LANDFILL
March 14, 2017
W12A LANDFILL2016 ANNUAL REPORT
Notes:1) City of London Aerial Photography, April 2016
300 Dufferin Avenue,PO Box 5035London, OntarioN6A 4L9General Inquiries: 519-661-4500www.london.ca
Date:
Solid Waste Management Division
WATER WELLS AROUND W12A
Map 10
0 250 500 750
Metres
!I1:15,000
LegendActive Water Wells!( White Oak Aquifer
$+ Upper Aquifer
") Unknown Water SourceInactive Water Wells!( White Oak Aquifer
$+ Upper Aquifer
") Unknown Water SourceDecommissioned Wells!( White Oak Aquifer
$+ Upper Aquifer
") Unknown Water SourceProperty Information
Existing W12A LandfillParcels

!(!(
!(
!(
!(
!(
!(
!(
!(
!(
$+
$+
$+
$+
$+
!(
!(
!(
!(
!(!( !(
!(
!(!(!(
$+
$+
$+
!(
!(
!(
!(
MANNING DR
SCOTLAND DR
WHITE
OAK
RD
WELL
INGT
ON R
D S
GLANWORTH DR GLANWORTH DR
HWY 401
EHWY 4
01 W
22
13
12
33
14 17
24 25 32
31
16
23
27
26
20 21
2
9
19
18
43
1
10
30
78
65
28
29
15
11
W12A LANDFILL
March 14, 2017
W12A LANDFILL2016 ANNUAL REPORT
Notes:1) City of London Aerial Photography, April 2016
300 Dufferin Avenue,PO Box 5035London, OntarioN6A 4L9General Inquiries: 519-661-4500www.london.ca
Date:
Solid Waste Management Division
WATER WELL MONITORING PROGRAM
Map 11
0 250 500 750
Metres
!I1:15,000
LegendCurrent Monitoring Program$+ Upper Aquifer
!( White Oak AquiferHistoric Monitoring Wells$+ Upper Aquifer
!( White Oak AquiferDecommissioned Wells$+ Upper Aquifer
!( White Oak Aquifer
Property InformationExisting W12A LandfillParcels

W12A Landfill Status Report 2016
Page 55
2.5.4 White Oak Aquifer The Water Well Monitoring program includes 11 water wells in the White Oak Aquifer (well #16, #17, #21, #23, #24, #25, #26, #31, #32 and #33). The water wells are located cross-gradient and down-gradient of the landfill. Key findings from reviewing the test results from the White Oak Aquifer water wells are presented below:
• All wells sampled had chloride (the “critical’ contaminant) levels below 30 mg/l which is below the RUC value of 182 mg/l.
• Most wells continue to have high iron levels which is typical of the area. The area up-gradient of the landfill has long been known to contain naturally high iron levels. In the late 1950’s and 1960’s water was pumped from the White Oak Aquifer from this area to supply the City of London with drinking water. Water pumped from the White Oak Aquifer had to be treated to reduce iron levels which sometimes exceeded 10 mg/l of iron.
• Other key parameters (sodium, DOC, cadmium and nickel) were below RUC for all wells.
• Several wells (#25, #26 and #32) have historically had increasing sulphate levels. Sulphate levels increased in wells #26 and #32 in 2016. The report W12A Landfill Site Assessment of Water Well Monitoring Program (Dillon Consulting Ltd., February 2005) concluded that the changing sulphate levels were not landfill related.
• Several wells in the White Oak Aquifer have historically had increasing chloride levels but concentrations that are relatively low (< 30 mg/l) and in some cases have plateaued; the report W12A Landfill Site Assessment of Water Well Monitoring Program (Dillon Consulting Ltd., February 2005) concluded that the changing chloride levels were not landfill related because: o Increasing chloride levels were not found in monitoring wells in the Upper
Aquifer which should be impacted first by any leachate migrating from the landfill before reaching the White Oak Aquifer;
o Chloride levels up-gradient of the landfill in the White Oak Aquifer are higher than down-gradient and therefore down-gradient chloride levels are likely to rise with time;
o Plotting of water chemistry using Durov diagrams show water chemistry in private wells distinctly different than what one would expect from water being impacted by leachate from W12A Landfill.

W12A Landfill Status Report 2016
Page 56
2.6 Landfill Gas 2.6.1 Landfill Gas Overview Landfill gas is formed from three processes (bacterial decomposition, volatilization, and chemical reactions). Most landfill gas is produced by bacterial decomposition, which occurs when organic waste is broken down by bacteria naturally present in the waste and in the soil used to cover the landfill. Landfill gases can be created by volatilization when certain wastes, particularly organic compounds, change from a liquid or a solid into a vapor. Landfill gas can also be created by the reactions of certain chemicals present in waste. For example, if chlorine bleach and ammonia come in contact with each other within the landfill. Landfill gas is composed of a mixture of hundreds of different gases. By volume, landfill gas typically contains 45% to 60% methane and 40% to 60% carbon dioxide. Landfill gas also includes small amounts of nitrogen, oxygen, ammonia, sulfides, hydrogen, carbon monoxide, and non-methane organic compounds (NMOCs) such as trichloroethylene, benzene, and vinyl chloride. 2.6.2 Landfill Gas Monitoring Program Landfill gas monitoring has historically consisted of:
• continuous air quality monitoring for methane, oxygen and hydrogen sulphate in all on-site buildings
• periodic “bartests” to determine the methane gas concentrations in the surficial soils in the area adjacent to the fill area
• periodic testing of landfill gas to determine its composition
• Semi-annual monitoring of two landfill gas monitoring wells installed in the buffer area of the landfill. These monitoring wells were installed at the property boundary opposite the two closest off-site buildings to the waste footprint (Drawing 2).
Monitoring of the buildings has never encountered elevated levels of methane or hydrogen sulphate or low levels of oxygen. No bartests were performed in 2016. Historically, the bartests have found detectable levels of methane do not migrate beyond 10 m from the waste footprint in the areas tested. No testing of the landfill gas composition was completed in 2016. Historical testing of the landfill gas quality have found the landfill gas to be typical of other landfills with methane ranging from 55% to 60% and carbon dioxide between 40% and 45% with trace amounts of a few NMOCs. Testing of the landfill gas monitoring wells in 2016 found methane levels were below 50 ppm, on average, in both monitoring wells, for all sampling events indicating that landfill gas is not migrating off site through the soil. Test results for the landfill gas monitoring wells are presented in Appendix L.

W12A Landfill Status Report 2016
Page 57
3.0 Site Development/Operations
3.1 W12A Cell Expansion Construction In 2016 an expansion of the landfill base and leachate collection system within the approved area for landfilling activities was completed. The expansion consisted of the construction of Cell 8, expansion of the Phase 2 leachate collection system, expansion of the Phase 2 storm water ditches and perimeter berms. The expansion added an additional 748,000m3 of usable capacity to the active landfilling area. It is assumed that approximately 10% of the 830,000 m3
design capacity will be consumed by roads and other operating infrastructure. The W12A landfill is expected to have 2 additional expansions in the next 8 years given the current approved operational footprint and predicted waste quantities.
3.2 Site Capacity 3.2.1 Historical Waste Quantities Table 15 presents the types and quantities of solid non-hazardous waste disposed at the landfill since it opened. The waste quantities in these tables are broken into eight categories; residential, IC&I (industrial, commercial & institutional) waste and CR&D (construction, renovation and demolition) recycling residuals, biosolids, street sweepings/road work, other municipal, water treatment plan residuals and contaminated soil. These categories are based on the waste categories used to record waste received at the W12A Landfill. Approximately 8,500,000 tonnes of waste has been disposed of at the landfill since 1977 inclusive of the 258,000 tonnes received at the landfill in 2016. A monthly breakdown of the waste quantities received at the landfill in 2016 is presented in Table 16.

W12A Landfill Status Report 2016
Page 58
Table 15 Waste Quantities Disposed of at W12A Landfill in Tonnes Year Residential1 IC&I2 C,R&D3 Ash4 Biosolids Street "Other" WTP6 Contaminated Soil Total
Recycling Sweepings/ Municipal5 Process Waste Residuals Road Work Residuals Waste Cover Landfilled
1977 20,123 32,093 0 0 3,806 0 0 0 0 0 56,022 1978 58,722 81,687 0 0 26,516 0 0 0 0 0 166,925 1979 71,955 69,874 0 0 30,861 0 0 0 0 0 172,690 1980 89,995 70,721 0 0 52,083 0 0 0 0 0 212,799 1981 100,810 71,451 0 0 47,888 0 0 0 0 0 220,150 1982 110,249 71,267 0 0 44,273 0 0 0 0 0 225,788 1983 113,247 72,616 0 0 36,745 0 1,096 0 0 0 223,705 1984 122,438 80,522 0 0 51,445 0 5,247 0 0 0 259,653 1985 125,460 90,263 0 0 43,000 0 2,935 0 0 0 261,657 1986 134,801 101,816 0 0 49,386 0 2,275 0 0 0 288,278 1987 123,205 114,928 0 0 67,046 0 1,465 0 0 0 306,644 1988 75,674 126,943 0 33,349 16,886 0 2,711 0 0 0 255,564 1989 81,410 141,954 0 33,752 15,272 0 3,677 0 0 0 276,065 1990 73,790 125,027 0 30,142 7,366 0 8,161 0 0 0 244,485 1991 97,133 109,099 0 14,180 8,745 0 27,110 0 0 0 256,266 1992 97,708 58,516 0 15,386 8,643 0 32,318 0 0 0 212,571 1993 93,397 37,191 0 14,404 11,389 0 33,923 0 0 0 190,303 1994 86,300 32,007 0 15,875 14,359 0 34,015 0 0 0 182,556 1995 70,041 13,154 0 16,422 12,840 0 63,243 0 0 0 175,700 1996 51,096 6,118 0 22,194 11,190 0 44,756 0 0 0 135,354 1997 49,063 4,294 0 21,677 12,973 0 42,404 0 0 0 130,410 1998 44,034 3,588 0 21,548 16,042 0 39,367 0 0 0 124,579 1999 49,622 2,192 0 19,373 7,861 0 57,925 0 0 0 136,973 2000 91,306 2,355 0 5,394 29,402 0 107,177 0 0 0 235,635

W12A Landfill Status Report 2016
Page 59
Year Residential1 IC&I2 C,R&D3 Ash4 Biosolids Street "Other" WTP6 Contaminated Soil Total Recycling Sweepings/ Municipal5 Process Waste Residuals Road Work Residuals Waste Cover Landfilled
2001 92,856 2,436 0 4,093 6,620 0 38,716 0 0 0 144,721 2002 97,771 3,732 0 5,746 15,993 35,529 19,736 0 5,556 851 184,914 2003 102,194 4,120 0 5,176 5,861 42,491 28,374 0 263 0 188,479 2004 98,477 21,378 0 3,867 6,601 34,073 9,912 0 468 3,019 177,795 2005 102,559 36,947 0 5,351 2,913 30,674 8,727 0 10,054 12,355 209,580 2006 100,206 47,921 0 6,069 6 37,034 8,808 0 5,423 23 205,490 2007 100,404 47,346 0 6,001 0 37,769 23,984 0 9,925 5,004 230,433 2008 101,437 64,178 0 2,956 23,851 43,040 26,941 0 4,689 17,300 284,392 2009 97,720 69,742 0 0 0 43,000 26,907 0 17,626 18,883 273,878 2010 93,898 72,436 0 6,067 4,121 29,697 11,551 0 6,185 42,410 266,365 2011 94,435 75,008 10,236 0 10,317 22,371 9,595 0 15,800 13,187 250,949 2012 91,638 54,445 23,403 0 4,747 26,554 5,623 0 18,528 4,511 229,449 2013 93,172 45,954 18,991 1,904 4,633 23,062 8,946 0 3,590 1,269 201,521 2014 93,569 40,314 24,155 4,163 5,994 42,748 8,511 0 2,473 1,073 223,000 2015 91,339 13,614 33,936 12,953 2,577 47,181 8,594 0 4,757 3,656 218,606 2016 93,151 24,245 35,332 4,166 14,268 51,512 7,762 0 6,954 21,137 258,528
Total 3,576,404 2,143,492 146,053 332,207 734,520 546,735 762,493 0 112,291 144,678 8,498,873
Percent 42% 25% 2% 4% 9% 6% 9% 0% 1% 2% Notes 1. "Residential" waste includes curbside, bulk bin and depot garbage collected by the City from residential and light commercial sources. 2. "IC&I" is an abbreviation for Industrial, Commercial & Institutional waste collected by the private sector. 3. "C,R&D recycling residuals" is an abbreviation for Construction and Demolition recycling residuals. Prior to 2011, C&D recycling residuals were included with IC&I. 4. "Ash" includes sewage sludge ash (since 1998) and residential waste ash (1988 to 1999). 5. "Other Municipal" includes material recovery facility residuals, waste from City parks and grit from water pollution control plants. 6. "WTP process residuals" is an abbreviation for water treatment plant process residuals.

W12A Landfill Status Report 2016
Page 60
Table 16 Monthly Waste Quantities Disposed of at W12A Landfill in Tonnes Month Residential/ IC&I1 C&D2 Other Contaminated Contaminated Biosolids Street Ash Total Operating
Light Commercial Municipal3 Soil Soil - Cover Cover Sweepings Landfilled Materials4
January 7,481 903 1,972 401 2,917 2,193 2,457 1,802 0 20,125 1,352 February 6,892 938 1,868 395 0 5,243 0 969 376 16,681 2,210
March 7,485 847 2,450 589 1,864 2,666 0 3,898 0 19,800 2,333 April 7,913 801 3,813 716 0 5,195 4,306 4,521 1,055 28,320 5,136 May 8,504 1,114 3,735 720 0 628 5,837 3,273 0 23,810 6,334 June 7,754 2,026 3,518 708 119 0 1,667 4,214 800 20,807 3,185 July 7,273 1,425 2,828 798 974 87 0 3,702 0 17,088 4,696
August 8,482 2,255 3,531 758 234 0 0 4,687 0 19,948 3,255 September 8,182 3,538 2,781 759 331 1,792 0 4,367 914 22,663 2,845
October 7,843 3,297 3,059 641 393 2,911 0 11,847 0 29,991 6,557 November 7,970 3,806 3,795 685 111 423 0 7,220 939 24,948 2,845 December 7,372 3,295 1,982 592 11 0 0 1,012 82 14,347 1,315
Total 93,151 24,245 35,332 7,762 6,954 21,137 14,268 51,512 4,166 258,528 42,064 Notes
1. "IC&I" is an abbreviation for Industrial, Commercial and Institutional. 2. "C&D" is an abbreviation for Construction and Demolition waste. 3. "Other Municipal" includes street sweepings, rubble and grit as well as waste from parks and City projects. 4. "Operating Materials" refers to purchased materials used (and subsequently buried) in the landfill (e.g. rubble, wood chips, etc.).

W12A Landfill Status Report 2016
Page 61
3.1.2 Estimated Remaining Disposal Volume Estimates of the volume of disposal capacity that has been consumed (including waste, daily/intermediate cover and final cover) for the period 1976 to 2015 and for 2016, as well as, the capacity remaining as of January 2017 are presented in Table 17. Based on a topographic survey, it is estimated that the remaining disposal volume is approximately 2,000,000 m3 as of January 2017 (Table 17). After allowing for final cover (400,000 m3) and daily/intermediate cover (assume 4:1 ratio of waste to cover soil), approximately 1,992,000 m3 of disposal capacity is available for waste as of January 2017.
Table 17 Landfill Capacity Calculations Capacity Used
Item Units Year Total
1976 - 2015 2016 Volume Used m3 10,641,000 272,000 10,913,000 Final Cover Installed m3 673,000 0 673,000 Volume Available for Waste & Daily Cover m3 9,968,000 272,000 10,240,000 Daily Cover Used m3 2,255,000 55,000 2,310,000 Volume Consumed by Waste m3 7,713,000 217,000 7,930,000 Tonnage Tonnes 8,240,000 259,000 8,499,000 Apparent Density (waste & cover material) Tonnes/m3 0.83 0.95 0.83
Waste Density Tonnes/m3 1.07 1.19 1.07 Cover Material Used m3 2,255,000 55,000 2,310,000 Waste to Cover Material Ratio - 3.4 3.9 3.4

W12A Landfill Status Report 2016
Page 62
Remaining Capacity
Item Units Quantity Total
Approved Capacity m3 13,800,000 Volume Used m3 10,913,000
Volume Remaining - January, 2017 m3 2,887,000
Final Cover Requirements m3 397,000 Dillon estimate Volume Available for Waste & Daily Cover m3 2,490,000 -
Daily Cover Requirements m3 498,000 Based on a 4:1 waste to cover ratio
Volume Available for Waste m3 1,992,000 -
Estimated Remaining Capacity Tonnes 2,128,106 Based on Scenario A - Status Quo
Estimated Closure Date - 2024 Based on Scenario A - Status Quo
Estimated Site Life Years 8 -
3.2.3 Estimated Remaining Site Life Waste quantity projections for the City of London for the next 34 years were developed for 5 possible scenarios. These waste quantity projections represent the likely range of waste quantities that can be expected taking into account:
• Population growth
• Provincial waste diversion target of 60% for residential, IC&I and CR&D waste
• Possible changes to the management of IC&I and CR&D waste Complete details of the key assumptions, calculations and rationale for estimating the waste quantities for each scenario are presented in W12A Annual Report 2016 Waste Generation Projections & Landfill Capacity Assessment (Appendix M). The waste quantity projections suggest that the W12A Landfill has between 6 and 13 years of capacity remaining depending on how residential, IC&I and CR&D processing residual waste is managed in the future. With no changes in the existing waste management practices it is estimated that the W12A Landfill will have 8 years of capacity remaining. A summary of all the assumptions and remaining site life is presented in Table 18.

W12A Landfill Status Report 2016
Page 63
Table 18 Remaining Site Life at the W12A Landfill Scenario Remaining Site Life
Years Date
A Status Quo
• residential diversion rate of 45% 8 2024 • no change in disposal rate from City operations
• no change in IC&I waste disposal rate (15% landfilled at W12A)
• no unprocessed C&D waste
• 100% of C&D recycling process residuals goes to W12A
B Decrease in Residential Waste Quantities
• 60% diversion of residential waste by 2020 9 2025 • no change in waste from City operations
• no change in IC&I waste disposal rate (15% landfilled at W12A)
• no unprocessed C&D waste
• 100% of C&D recycling process residuals goes to W12A
C Decrease in Residential, IC&I and C&D Waste Quantities
• 60% diversion of residential waste by 2020 13 2029 • no change in disposal rate from City operations • ICI disposal rate decreases (10% landfill at W12A)
• no C&D waste; 50% of C&D recycling process residuals
goes to W12A • no C&D residuals after 2020
D Increase in IC&I quantities and Status Quo for Residential Waste
• residential diversion rate of 45% 6 2022 • no change in waste from City operations
• ICI disposal rate increases (limited export, 60%
landfilled at W12A coupled with 40% diversion of IC&I waste)
• no unprocessed C&D waste
• 100% of C&D recycling process residuals goes to W12A
E Status Quo except for Increase in Service Area
• residential diversion rate of 45% 7 2023 • no change in waste from City operations
• no change in IC&I waste disposal rate (15% landfilled at W12A)

W12A Landfill Status Report 2016
Page 64
Scenario Remaining Site Life Years Date
• no unprocessed C&D waste
• 100% of C&D recycling process residuals goes to W12A
• Increase service area of landfill and accept
• C&D recycling process residuals from TRY Recycling (average of 20,000 tonnes per year)
• Residential waste from Thames Centre (800 tonnes per year) and TRY Recycling EnviroDepot (50 tonnes per year
• Process residuals received from the water treatment plants (20,000 tonnes per year) are used for daily cover and therefore does not take up landfill capacity reserved for waste.
3.2 Cover Material Requirements and Availability 3.2.1 Material Balance Waste disposed at the landfill is covered at the end of each working day. In 2016, daily cover consisted of soil, wood chips, shingles, compost and contaminated soil. Soil is also used for interim cover, final cover, screening berms and general landscaping needs. The majority of soil used as cover material comes from the excavation of new cells to proposed bottom elevations. Soil is also obtained from off-site sources, including construction projects where excess soil is to be disposed of, or contaminated fill that requires landfill disposal.

W12A Landfill Status Report 2016
Page 65
Table 19 provides a material balance for 1976 to 2015, 2016 and for the remaining life of the landfill. It is estimated that there will be a surplus of approximately 331,000 m3 at the time of closure. A surplus of soil can be accommodated by not dismantling the berms, increasing the thickness of the final cover or undertaking additional landscaping for the end-use for the landfill. A soil deficit could occur if the City decides not to dismantle the existing earth berms or if more soil is required for daily/interim cover needs (e.g., a 4:1 waste to cover ratio is not achieved). A soil deficit could be made up in a number of ways including importing clean soil from construction projects in the City, increasing the usage of alternate daily cover materials or employing a re-usable geotextile/membrane for daily cover. It has been the City’s experience during the operation of the W12A Landfill that significant amounts of excess fill does become available from time to time from major construction projects. 3.2.2 Operating Materials (including imported daily cover) Approximately 1,000,000 tonnes of operating materials has been imported at the landfill since 1977 including 42,000 tonnes in 2016. Materials imported in 2016 included rubble for road building, shingles to provide traction during wet weather periods and shingles and oversized compost for daily cover. Historically, imported cover material consisted of clean soil/topsoil from construction projects in the City. More recently, alternative cover materials such as wood chips, oversized compost and contaminated fill have been used as cover material. Wood chips are identified in the landfill’s Design and Operations Report as an alternative cover material that is to be used when covering garbage close to the limits of fill. The wood chips will provide a better hydraulic connection than clay and thereby reduce the likelihood of leachate outbreaks in the future. Compost is a permitted daily cover material in the MOECC Landfill Standards a Guideline on the Regulator and Approval Requirements for New or Expanding Landfills.

W12A Landfill Status Report 2016
Page 66
Table 19 Cover Material Calculations
Item Volume (m3) Comment
Historical Soil Balance (1976 to 2015) Source of Cover Material
- Soil excavated from Phase 1 1,788,000 Phase 1 excavation covered 59.6 hectares and averaged 3 metres deep
- Soil excavated from Phase 2 1,236,800 Based on topographical survey (portions of cells 6S, 6N and 7S)
- Soil excavated from buffer area 163,000 Excess from road construction and stormwater management ponds
- Clean Fill/Operating Materials 721,000 Tonnage of materials received and assumed density of 1,500 kg/m3
- Contaminated Soil 77,000 Tonnage of materials received and assumed density of 2,000 kg/m3
Total Available Material 3,985,800 Use of Cover Material
- Final Cover - Clay 838,000 Clay cover on cells 1, 2, 3, 4, 5E, 5W, 6S and 6N.
- Final Cover - Topsoil 115,000 Topsoil cover on cells 1, 2, 3, 4, 5E, 5W, 6S and 6N.
- Daily Cover 2,413,800 Calculated (total available material less final cover and berms)
- Berms 599,000 Based on topographical survey Total Material Used 3,965,800 2016 Soil Balance Available Material - Soil excavated from Phase 1 0 - - Soil excavated from Phase 2 817,696 cells 9 and 10 including stockpiles - Soil excavated from buffer area 0 -
- Clean Fill/Operating Mat. 28,043 Tonnage of materials received (density of 1,500 kg/m3)
- Contaminated Fill/Sweepings 23,447 Tonnage of materials received and assumed density of 2,000 kg/m3
Total Available Material 869,185 Material Use - Final Cover 0 - Daily Cover 55,000 - - Berms/Roads/Landscaping/Stockpiles 0
Total Material Used 55,000

W12A Landfill Status Report 2016
Page 67
Item Volume (m3) Comment
Remaining Soil Balance Available Material - Soil remaining in Phase 1 0 - - Soil remaining in Phase 2 814,185 based on Dillon estimate - Soil to be excavated from buffer area 0
- Clean Fill/Operating Materials 224,340 assume approximately 30,000 m3 imported per year for 9 years
- sweepings 187,573 - Berms Total Available Material 1,226,098 Material Needs - Final Cover 397,000 - Daily Cover 498,000 Based on a 3.3:1 waste to cover ratio Total Material Needs 895,000 Surplus 331,098
Contaminated fill is identified in the landfill’s Design and Operations Report as an alternative cover material, subject to restrictions on the level of contamination, and do not require any further approvals to be used. Approximately 21,000 tonnes of contaminated soil was received at the landfill in 2016 of which 10,500 tonnes was suitable as cover material. 3.2.3 Final Cover Placement Approximately 68 hectares has received final cover since 1977. Map 12 shows the locations where final cover has been placed. The quantity of clay and topsoil used for final cover is summarized in Table 19.

W12A Landfill Status Report 2016
Page 68
3.2.4 Leachate Collection System As discussed in Section 3.1, Phase 2 of the W12A leachate collection system was expanded as part of the Cell 8 landfill expansion in 2016. The expansion was completed to manage leachate generated from the increased landfill surface area. The system consists of an underdrain system that continuously collects leachate via a series of perforated leachate collection pipes that span the footprint of Phase 2 of the W12A landfill. The next scheduled expansions of the collection system will be completed with the construction of Cell 9 and 10.
3.3 Leachate Management 3.3.1 System Description The existing landfilling activities rely on the low permeability of the native soils to limit the downward migration of leachate and prevent off-site groundwater impacts. Collection System
Leachate from the landfill is collected by a perimeter leachate collection system in Phase 1 and an underdrain leachate collection system in Phase 2. The perimeter collection system in Phase 1 is comprised of 200 mm diameter perforated pipe embedded in gravel around the perimeter of the landfilling area. Temporary leachate collection pipes were installed between the active cell and the next cell to be developed. The temporary leachate collection lines were decommissioned when landfilling was moved to the next cell. A perimeter leachate collection system results in a leachate mound forming. The height of the mound has reached a steady state and is approximately 12 metres high at the peak. The underdrain leachate collection system in Phase 2 consists of 200 mm diameter perforated high density polyethylene (HDPE) leachate collection pipes, spaced approximately 90 m apart in “valleys”. The collection pipes will slope at a minimum grade of 0.5% and extend north-south across the width (approximately 880 m) of the landfill. The collection pipes are embedded in a drainage layer of clear stone that will cover the entire base of Phase 2. The drainage layer has a minimum thickness of 0.2 m at the ridges and a maximum thickness of 0.4 m at the bottom of the valleys, for an average thickness of 0.3 m. A non-woven geotextile filter is placed on top of the drainage layer to keep fines from clogging the drainage layer and 0.2 m thick protective layer (e.g., sand) is placed on top of the geotextile filter to protect the filter from being punctured. The underdrain leachate collection system in Phase 2 of the landfill will prevent the formation of a leachate mound. Map 12 shows the status of the leachate collection system at the end of 2016.
W12A Landfill Status Report 2016
Page 69
Conveyance System
Until February 2013, leachate from Phase 1 drained to a 60 m3 holding tank located near the scalehouse (Map 12). Leachate from Phase 2 drained to maintenance hole #701 and was then pumped to a 60 m3 holding tank located near the administration building (Map 12). Leachate from both holding tanks was hauled from the site on a daily basis, using tanker trucks, to the Dingman Creek Receiving Facility. After combining with other incoming sewage, the mixture flows by gravity sewer to the Wonderland Pumping Station and then is pumped through a forcemain to a gravity sewer and eventually reaches the Greenway Pollution Control Plant for biological treatment. Construction of a leachate pumping station and forcemain was completed in February 2012. All leachate is now pumped to the Dingman Creek Receiving Facility instead of being hauled by tanker truck. The pumping station draws leachate from the 60 m3 holding tank located near the scalehouse. Leachate from maintenance hole 701 (Phase 2) is pumped to a gravity sewer which drains to the aforementioned 60 m3 holding tank. Treatment System
The treatment of leachate at the Greenway Pollution Control Plant does not impact the quality of effluent from the facility nor increase the heavy metal content of the waste sludge (biosolids), with the exception of iron (Leachate Treatability Assessment – W12A Landfill by Dillon dated November, 2002). An increase in the iron concentration does not affect the management of the biosolids, since the biosolids are either incinerated or landfilled. As the landfill grows, the volume of leachate will increase but it is not expected to have a negative impact on effluent from the Greenway Pollution Control Plant (Leachate Treatability Assessment – W12A Landfill by Dillon dated November, 2002). 3.3.2 Leachate Volumes A weekly breakdown of the leachate collected in 2016 and information on the historical volumes of leachate captured is presented in Appendix N. The amount of leachate that is captured has generally increased over the years as the size of the waste footprint has increased. Approximately 163,000 m3 of leachate was captured and pumped for treatment in 2016. Leachate generation is estimated to be approximately 165,000 m3 when the entire landfill footprint has been developed and capped (Hydraulic Evaluation of Landfill Performance (HELP) Modeling by City of London dated November, 2002).

W12A Landfill Status Report 2016
Page 70
3.3.3 Leachate Collection System Maintenance The perimeter leachate collection system in Phase 1 and Phase 2 were not flushed in 2016. Some maintenance was required to prepare the leachate collection system in Cell 7 for connection to Cell 8 during construction.
3.4 Landfill Gas Management 3.4.1 System Description On February 19, 2004 the City of London received Certificate of Approval (Air) No. 8046-5VDKEC for the operation of an enclosed landfill gas flare system that will combust up to approximately 0.802 m3/s (1,700 standard cubic feet per minute (scfm)) of landfill gas. The flare is an enclosed type high temperature flare fabricated from carbon steel and supplied by LFG Specialties of Findlay, Ohio. A general process schematic of the system is provided in Figure 4. The flare’s data logger records the following data every two minutes:
• Oxygen concentration (percent by volume)
• Methane concentration (percent by volume)
• Flare temperature (°C)
• Landfill gas flow to the flare (cubic feet per minute, corrected to standard conditions)
The layout of the existing landfill gas collection system is shown on Map 13 including the location of the landfill gas wells. The borehole logs for the landfill gas wells are provided in Appendix O. The initial gas collection system consisted of approximately 2 kilometres of buried HDPE pipe connecting 14 landfill gas extraction wells and 4 maintenance holes to the flare. There are nine landfill gas extraction wells that are not connected to the piping system located in the northern portion of cell 5W. High leachate levels in this area have flooded the wells and made extraction of landfill gas from the wells impractical. French drains installed in the area in 2004 have marginally lowered the leachate levels. Investigations were completed in 2005 to determine the feasibility of collecting more gas in order to further reduce odours and destroy more greenhouse gases.

W12A Landfill Status Report 2016
Page 71
As a result of this testing, an expansion of the system was undertaken in 2006. The expansion is shown on Map 13 and consists of:
• permanent underground HDPE pipe connection to 8 additional gas extraction wells drilled in 2005 plus 3 maintenance holes (#101, #102 and #301)
• permanent underground HDPE pipe connection to 1 of the gas extraction wells located in the northern part of cell 5W drilled in 2003
• installation of approximately 700 metres of perforated HDPE collection pipe in the northern part of cell 5W just above the high leachate mound
Commissioning of the above noted system expansion was completed in 2007. In December of 2008 five additional landfill gas extraction wells were installed on the eastern side of the southern portion of cell six as noted above the location of these wells is shown on Map 13. These wells were brought on-line May 2009. A further expansion of the landfill gas collection system was completed in 2010. Twelve landfill gas extraction wells were installed in the southern part of Cell 6S and brought on line in July 2010. The gas collection system was further expanded in 2012. Seventeen landfill gas extraction wells were installed in the northern part of Cell 6S and brought on line in September 2012. In 2015, thirteen new landfill gas wells were installed. Ten of the new wells were installed in the western portion of Cell 5 west and three of the new wells were installed in the eastern portion of Cell 6 north. The location of these new wells is shown on Map 13. In 2016, a project was undertaken to connect the thirteen wells drilled in 2015 to the existing landfill gas collection system. The project also involved raising and retrofitting four of the existing pumped condensate traps in order to prevent flooding, as well as, the replacement of an existing crushed sub lateral pipe to re-establish flow from an existing landfill gas extraction well.

" " "
"
" "
"
"
""
"
"
"
"
""
""
""
"
"
"
"
"" " " " " " ""
" "
" "
"
"
"
"
""
Leachate Storage No. 2 Leachate
Storage No. 1
MANNING DR
SCOTLAND DR
WHITE
OAK
RD
CELL 3CELL 5 EAST CELL2 CELL 1
CELL 5 WEST
CELL 4
CELL 7
CELL 8
CELL 9
CELL 10
CELL 6 SOUTH SOUTH HALF
CELL 6 NORTH SOUTH HALF
CELL 6 SOUTH NORTH HALF
CELL 6 NORTH NORTH HALF
March 14, 2017
W12A LANDFILL2016 ANNUAL REPORT
Notes:1) City of London Aerial Photography, April 20162) Site Features prepared by Callon Dietz Inc. LTD, October 19, 2016
0 100 200 300
Metres
!I1:6,000
300 Dufferin Avenue,PO Box 5035London, OntarioN6A 4L9General Inquiries: 519-661-4500www.london.ca
Date:
Solid Waste Management Division
STATUS OF SITE DEVELOPMENT
Map 12
C:\U
sers
\34S
FG\D
eskt
op\D
eliv
ery\
Map
12
Sta
tus
of S
ite D
evel
opm
ent.m
xd
LegendFinal Cover Limit
Active Disposal Landfill Interim Cover
Interim Cover
Staged Cap (No Top Soil)
Undeveloped
Phase 1 Waste Disposal Fill Area
Phase 2 Waste Disposal Fill Area
Leachate Forcemain
Temporary Leachate Collection Pipe
Leachate Gravity Pipe
Permanent Leachate Collection Pipe
Property InformationExisting W12A Landfill
Stormwater Ponds/Forebay
Buildings
Forcemain Continues to Dingman Pump

Figure 4
LANDFILL GAS SCHEMATIC
W12A LANDFILL 2016 ANNUAL REPORT
Date:
February 24, 2017
Solid Waste Management Division

W12A Landfill Status Report 2016
Page 75
3.4.2 2016 Operation Flows
On June 20, 2004, the permanent LFG flaring system became operational at the W12A Landfill. Initially, the system was collecting around 750 standard cubic feet per minute (scfm) of LFG with a methane content of 45%. By December 2004, LFG flow to the LFG flare had dropped to around 500 scfm with a methane content of 50%. The reduction in LFG flow was caused by the depletion of the “pent-up” LFG within the landfill. Between 2005 and 2008 the system drew approximately 450 to 550 scfm with a methane content of approximately 50%. After the 2009 expansion of the gas collection system the quantity of gas captured increased to 500 to 600 scfm. The 2010 expansion of the gas collection system into Phase 2 of the landfill (first expansion into this area) initially increased gas flows to 600 scfm to 700 scfm. However in 2011 gas flows reduced to approximately 400 scfm to 500 scfm as
“pent-up” LFG within this are of the landfill was depleted. With the 2012 expansion of the system, gas flows increased to 1,000 scfm and held steadily until October 2015 with gas flows generally between 900 and 1,000 scfm. In October 2015, as a pilot project, a geomembrane was placed on the exposed leachate collection system on the west side of Cell 6N to prevent air from intruding into the leachate collection system. This allows gas to be drawn from the three leachate collection clean out pipes on the north end of Cell 6N. This temporary increased flow to 1,300 scfm between October and December 2015. Gas flows were then recorded in December 2015 have dropped to 1,100 scfm. In 2016, prior to the connection of the thirteen additional gas wells to the gas collection system, the average flow rate was recorded to be between 1,100– 1,200 scfm. The average flow rate increased to 1,500 scfm with the addition of the thirteen wells.
Installation of Geomembrane over Leachate Collection System in Cell 6N

W12A Landfill Status Report 2016
Page 76
Maintenance/Upgrades
In 2013, the flare stack portion of the system was upgraded to be in compliance with recent TSSA requirements for digester-gas, bio-gas and landfill gas installations. A summary of the upgrades undertaken is presented below:
• installation and integration of burner management system;
• installation of flare pilot, igniter and pilot fuel train system;
• installation of replacement damper actuators with analog feedback, and
• Installation of a main fuel train low pressure switch. Subsequent to the installation and commissioning of the upgrades a TSSA field inspection was undertaken and a field inspection approval certificate was issued by the TSSA for the landfill gas flare. In the summer of 2015 an inspection determined that the interior flare insulation liner had deteriorated and required replacing. In November 2015, the interior flare insulation liner was replaced. This work required the flare to be down for a period of approximately 5 consecutive days. The MOECC was notified of this maintenance work prior to proceeding. In 2016, one condensate pump was replaced and upgraded to a more corrosion resistant model. Another condensate pump was refurbished due to corrosion and reinstated. Landfill Gas Destruction
The quantities of methane gas destroyed and equivalent greenhouse gas (GHG) reduction since the installation of the initial landfill gas extraction wells in 2003 are presented in Table 20. The quantities of methane destroyed in the flare were calculated based on the following formula:
MCH4 = VLFG × cCH4 × ρCH4 Where, MCH4 = mass flowrate of methane to LFG flare (pounds/minute) VLFG = volume flowrate of LFG to flare (standard feet3 per minute)
cCH4 = methane concentration (percent by volume)
ρCH4 = methane density at standard conditions (0.0409 lbs/Sft3) The reduction in greenhouse gases is equivalent to approximately 21 times the amount of methane gas destroyed.

#*
#*
!(
!(
!(
!(
!(
!(
!(
!(
!(
!(
!(
!(
"
"
!(
"
"
"
"
!(
!(
!(
"
"
"
"
"
!(
"
"
!(
"
"
"
!(
!(
"
!("
"
!(
"
" "
"!(
!(
!(
!(
!(
!(
!(
!(
!(
!(
!(
!(
!(
!(
!(
!(
!(
!(
!(
!(
!(
!(
!(
!(
!(
!(
!(
!(
!(
!(
!(
!(
!(
!(
!(
!(
!(
!(
!(
!(
!(
!(
!(
!(
!(
!(
!(
B4 B2
A24 A22 A20
MH601
GE02-5
TW-4
MANNING DR
SCOTLAND DR
WHITE
OAK
RD
GE1
GE7
GE9
GE2
GE4
GE3
TW3
GE5
GE10GE11
GE19
GE17
GE18
GE6-12
GE33-5GE6A-6-10
GE24-05
GE26-05
GE29-05
GE22-05
GE23-05
GE36-05
GE35-05
GE4-3-12
GE4-2-12
GE5-8-12
GE4-1-12
GE5-4-12
GE5-1-10
GE5-2-10
GE5-3-10
GE5-5-12
GE5-7-12
GE5-9-12
GE5-16-15
GE5-14-15
GE5-12-15
GE5-10-15
GE6B-5-08
GE6B-4-08
GE6B-3-08
GE6B-2-08
GE6B-1-08
GE6A-9-12
GE5-11-15
GE5-19-15
GE5-17-15
GE5-15-15
GE5-13-15
GE6A-2-10
GE6A-1-10
GE6A-4-10
GE6A-3-10
GE6A-7-10
GE6A-5-10
GE6A-8-10GE6B-6-10
GE15-18-15
GE6A-10-12
GE6A-19-15
GE6A-21-15
GE6A-11-12
GE6A-13-12GE6A-12-12
GE6A-15-12GE6A-14-12
GE6A-17-15
GE6A-16-12
GE8
GE6
GE16
GE14
GE12
GE13
GE15
GE43-05GE42-05
GE32-05
GE34-05
GE25-05
GE27-05
GE31-05
GE28-05
GE30-05
GE21-05
GE20-05 GE41-05
GE40-05
GE39-05
GE38-05
GE37-05
MH102
MH101MH301
Stormwater Pond No.5
Stormwater Pond No. 2 -3
Stormwater Pond No.4
Stormwater Pond No.1
Pond Forebay
Pond Forebay
G2-11
G1-11
March 14, 2017
W12A LANDFILL2016 ANNUAL REPORT
Notes:1) City of London Aerial Photography, April 20162) Site Features prepared by Callon Dietz Inc. LTD, October 19, 20163) Landfill gas collection system as-built information by ComcorFebruary 8, 2017.
0 100 200 300
Metres
!I1:6,000
300 Dufferin Avenue,PO Box 5035London, OntarioN6A 4L9General Inquiries: 519-661-4500www.london.ca
Date:
Solid Waste Management Division
LANDFILL GAS COLLECTION AND FLARING SYSTEM
Map 13
C:\U
sers
\34S
FG\D
eskt
op\D
eliv
ery\
Map
13
Land
fill G
as C
olle
ctio
n an
d Fl
arin
g S
yste
m.m
xd
Legend
Property Information
Maintenance Hole Connected to Gas System
Gas Collection System Not Connected Gas Well
Historical Gas Well
Approved Fill
Existing Gas Piping Horizontal Gas Collector
Existing W12A Landfill
Stormwater Ponds/Forebay City Owned Property
Parcels Buildings
GE03-15!(
GE31-05"
MH601
GE02-5
Methane Gas Monitoring WellG2-11#*

W12A Landfill Status Report 2016
Page 79
Table 20 Annual Methane and GHG Destruction
Year Methane Destroyed
(tonnes/year)
GHG Reduction
(tonnes/year)
Comments
2004 900 18,000 • permanent gas collection and flaring system begins operation in June, 2004
• downtime approximately 25 to 30%
2005 2,050 41,100 • additional wells added to system using temporary piping during spring/summer/ fall
• downtime approximately 25 to 30%
2006 1,940 38,800 • permanent piping installed to new wells in fall
• downtime approximately 25 to 30%
2007 1,500
30,300 • downtime approximately 25%; 1/3 of the shut down time was related to shutting down the system to connect new wells & install pumped drain traps
2008 1,800 37,900 • downtime approximately 22%; approximately 1/4 of the shut down time was related to high vacuum pressure
2009 2,280 47,900 • downtime approximately 16%;
• downtime 40% in January/February due to expansion of the collection system
• downtime 11% after expansion
2010 2,850 59,800 • downtime approximately 7%
2011 2,650 55,800 • downtime approximately 10%
2012 3,240 68,000 • downtime approximately 11% for year
• downtime 2% from October to December after collection system expansion
2013 5,380 113,000 • downtime approximately 6.5% for year
2014 4,950 104,000 • downtime approximately 4.5% for year
2015 5,120 107,500 • downtime approx. 11.5% for the year
• downtime excluding planned shutdowns for inspections and maintenance approximately 9%
2016 7,129 149,717 • downtime approximately 6%

W12A Landfill Status Report 2016
Page 80
Operational Issues
In 2016, the flare automatically shut down a number of times resulting in the flare not being operational approximately 6% of the time. The flare was also shut down approximately 0.1% of the time for maintenance. Details on each shutdown in 2016 are provided in Appendix P and a summary of the causes of the shutdowns is presented in Table 21. The number of shutdowns that occurred in 2016 increased slightly from 2015, the majority of the increased shutdowns are associated with maintenance or upgrade events. In each reporting period since 2012, the number of flare shutdowns has been consistently lower than the 2012 reporting period. The decrease in flare shutdowns is attributed to consistent gas flows and methane concentrations of the landfill gas currently being drawn from the landfill.
Table 21 Summary of Gas Flare Shutdowns
Reason for Shutdown
Occurrences
Number of Occurrences Percentage of total Occurrences
Flare Low/High Temp 2 5
Flare Flameout 6 15
Power Fault 2 5
High Vacuum 1 3
Maintenance/Upgrade 3 8
Other 4 10
Failsafe Valve Failure 5 13
No Alarm 4 1
Low Methane/High O2 13 33
Total 40

W12A Landfill Status Report 2016
Page 81
3.5 Stormwater Management 3.5.1 System Description Stormwater Pond #5, at the southeast corner of the site, drains an area of 41 hectares on the eastern side of the landfill and has an active storage capacity of approximately 11,800 m3. The catchment area consists of landfill side slopes that have final cover and established vegetation, and the top of the landfill that has final cover and partially established vegetative cover. Stormwater Pond #4, in the south buffer area, drains an area of 58 hectares in the centre of the landfill. Stormwater Pond #4 has an active storage capacity of approximately 20,000 m3. The catchment area includes the west side of Phase 1 and lands associated with future Phase 2 fill area. Stormwater Pond #2/3, in the southwest corner of the site, drains an area of 30 hectares in the western side of the landfill. Stormwater Pond #2/3 has an active storage capacity of approximately 11,000 m3. The catchment area is currently in agricultural production and receives no runoff from landfilled areas. Stormwater Pond #1, in the northwest corner of the landfill drains an area of approximately14 hectares. Stormwater Pond #1 has an active storage capacity of approximately 5,800 m3. The catchment area is currently in agricultural production and receives no runoff from landfilled areas. 3.5.2 2016 Operation The W12A Landfill Operations Records indicate that no storm water pond clean out was undertaken in 2016. Pond 5 was drained in August 2016 for annual inspection, however, the results of the inspection did not require any need for further remediation or maintenance. Weekly flows from the ponds are presented in Appendix Q. Pond #4 lost connectivity with the servers and lost data for approximately one week.
3.6 Household Special Waste (HSW) Depot The W12A Landfill has a Household Special Waste Depot that accepts hazardous and special waste from residents and small businesses. The depot is open Tuesday through Saturday from 9:00 a.m. to 3:00 p.m. except Statutory Holidays. The depot accepts materials from the City of London and the County of Middlesex. Information on the operation of the HSW depot is provided in Appendix S and summarized below. Approximately 480 tonnes of hazardous/special waste was collected at the depot in 2016 which is the most ever collected and a 1% increase over 2015. About 70% of the material collected was reused or recycled. The remaining 30% of material was shipped to licensed processing and/or disposal facilities. The majority of the hazardous/special waste material collected was paints (49%), miscellaneous organic chemicals (e.g., solvents) (14%) and electronics (10%).

W12A Landfill Status Report 2016
Page 82
Approximately 10,115 residents used the HSW Depot in 2016. This represents a 17% increase in visitors over 2015. The facility typically receives between 9.000 and 11,000 visitors per year. The HSW Depot is also home to a PCB storage facility (Site No. 10199A0001). This facility received no materials in 2016 and had no materials stored in it. A copy of the annual report for this facility submitted to the MOECC in January as part of its approval requirements is provided in Appendix S.
3.7 Small Vehicle Drop-off The W12A Landfill has a small vehicle drop-off near the scalehouse for residents and small businesses. The small vehicle drop-off is open Monday through Saturday from 8:00 a.m. to 4:00 p.m. and Saturday 8:00 am to 3:00 pm except Statutory Holidays. There were approximately 10,000 users of the depot in 2016. The depot accepts garbage, appliances, blue box recyclables, brush, yard materials, scrap metal, tires, clean wood, cardboard and electronics. A breakdown of the quantity of material received in 2016 is presented below (Table 22).
Table 22 Quantity of Material Received at the W12A Landfill Depot in 2016 Material Quantity
(tonnes) Comments
Appliances 18
Blue Box Recyclables 52 estimated – 26 carts at 2 tonnes/year
Brush/yard materials 2,402
Cardboard 50
Electronics 56
Garbage 2,024
Scrap Metal 99
Tires 31
Wood (clean) 701
Total 5,433

W12A Landfill Status Report 2016
Page 83
3.8 General Site Maintenance Information on programs, investigations and activities in 2016 related to the general operations of the landfill is presented in Appendix R and summarized below: Odour Complaints
A total of 17 odour complaints were received throughout the year. A review of these complaints found the majority of them were in the evening between 6:00 pm and midnight. This is lesser than the number of complaints in 2014 (19 complaints) and 2015 (21 complaints). Litter Pickup
There were no litter complaints received in 2016. Slope Inspections
Weekly inspections of the side slopes were completed. Other Activities
Details on the litter control program, slope inspections and general activities at the W12A Landfill are provided in Appendix R.
3.9 Public Liaison Committee The W12A Landfill Site Community Enhancement and Mitigative Measure Program (Mitigative Measures Program) was adopted by London City Council in November 2009 (November 9, 2009 specifically). The Mitigative Measures Program provided for the formation of the W12A Landfill Public Liaison Committee (W12A PLC). In general the W12A PLC consists of a maximum of 12 community members plus a chair with City Staff participating as a resource. The basis or goals of the W12A PLC are as follows:
• To serve as a focal point for the dissemination, review and exchange of information and monitoring results relevant to the operation of the landfill;
• To be responsible for recommending projects or undertakings to the City that are paid for by the Community Enhancement Fund.
The Community Enhancement Fund was also established as part of the Mitigative Measures Program. The Community Enhancement Fund is to address mitigative measures and special circumstances in the broader community of the W12A Landfill Site. The Community Enhancement Fund commenced with an initial balance of $350,000.00 and is added to annually at a rate of $0.28 (adjusted annually for inflation) for every tonne of waste that is disposed of at the W12A Landfill Site. To date, two projects have received funding $15,000 for the Glanworth Community Library in 2013 and $180,000 for the Point of Source Water Treatment Program. The balance of the Community Enhancement Fund at the end of 2016 was $652,682.

W12A Landfill Status Report 2016
Page 84
The W12A PLC normally meet every second month or six times a year. The PLC only met five times in 2016 as one meeting was cancelled due to lack of attendance during the summer months. In general the format of the W12A PLC Meetings consists of the following:
• Approval of Previous Minutes;
• W12A Operational Update;
• W12A Capital Projects Update;
• Discussion of Previous Action Items;
• Open Discussion & New Business;
• Closing. Copies of minutes from meetings in 2016 are included in Appendix T.
Related Documents