w w w . n e s s t a r . c o m Put your tables on the Web Jostein Ryssevik IASSIST/IFDO 2005 Edinburgh, Scotland Tables with drill down Hinged tables Dynamic tables Statistical tables

W w w. n e s s t a r. c o m Put your tables on the Web Jostein Ryssevik IASSIST/IFDO 2005 Edinburgh, Scotland Tables with drill down Hinged tables Dynamic.
Dec 19, 2015
Welcome message from author
This document is posted to help you gain knowledge. Please leave a comment to let me know what you think about it! Share it to your friends and learn new things together.
Transcript
w w w . n e s s t a r . c o m
Put your tables on the Web
Jostein Ryssevik
IASSIST/IFDO 2005
Edinburgh, Scotland
Tables with drill down
Hinged tables
Dynamic tables
Statistical tables
w w w . n e s s t a r . c o m
Topics
• Aggregated (tabular) data versus micro-data• Basic properties of aggregated data• Metadata standards for describing tabular data• The tabular data implementation in Nesstar• Demo
w w w . n e s s t a r . c o m
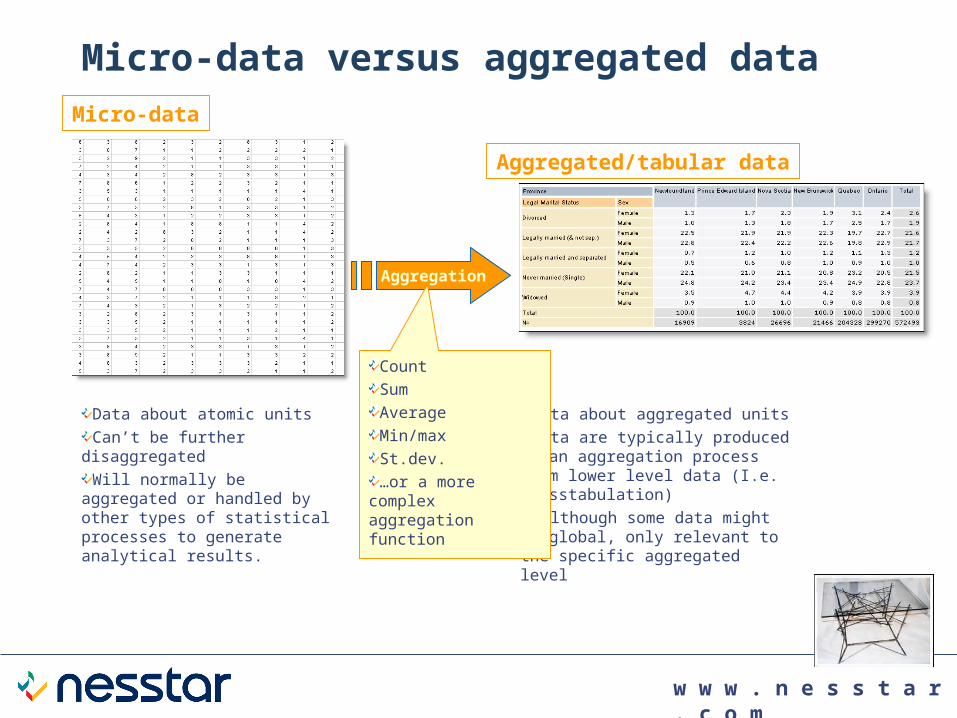
Micro-data versus aggregated data
Data about atomic units
Can’t be further disaggregated
Will normally be aggregated or handled by other types of statistical processes to generate analytical results.
Micro-data
Aggregated/tabular data
Data about aggregated units
Data are typically produced by an aggregation process from lower level data (I.e. crosstabulation)
…although some data might be global, only relevant to the specific aggregated level
Aggregation
Count
Sum
Average
Min/max
St.dev.
…or a more complex aggregation function

w w w . n e s s t a r . c o m
Relationships – from simple to complex
Aggregation
Micro-data Aggregated/tabular dataA table aggregated from a single source
Aggregation
A table where the nominator and
denominator of each single aggregated
value come from two different sources.
A table where each single aggregated data value is coming from a
different source.
w w w . n e s s t a r . c o m
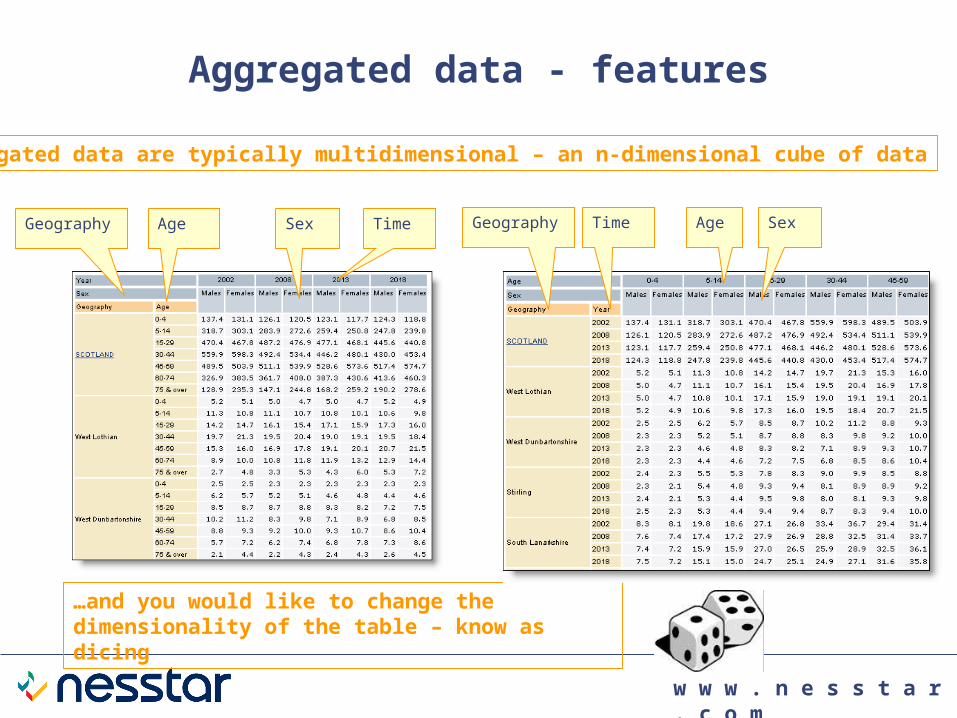
Aggregated data - features
Aggregated data are typically multidimensional – an n-dimensional cube of data
Geography TimeSexAge
…and you would like to change the dimensionality of the table – know as dicing
Age SexGeography Time

w w w . n e s s t a r . c o m
Aggregated data - features
It is also nice to be able to slice the data cube – cut trough the data cube on one or more of the dimensions. In the example below we have sliced the cube on the time dimension, now only showing data for 2002

w w w . n e s s t a r . c o m
Aggregated data - features
The dimensions of a data cube will typically be hierarchical.
Drilling down a dimension
Rolling up a dimension
w w w . n e s s t a r . c o m
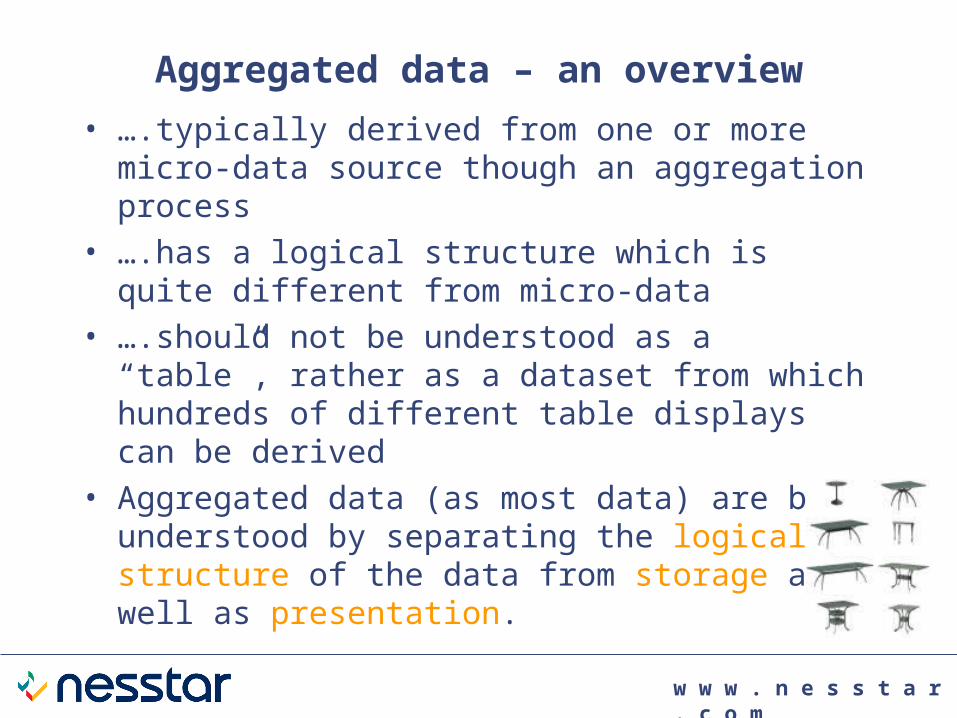
Aggregated data – an overview
• ….typically derived from one or more micro-data source though an aggregation process
• ….has a logical structure which is quite different from micro-data
• ….should not be understood as a “table”, rather as a dataset from which hundreds of different table displays can be derived
• Aggregated data (as most data) are best understood by separating the logical structure of the data from storage as well as presentation.
w w w . n e s s t a r . c o m
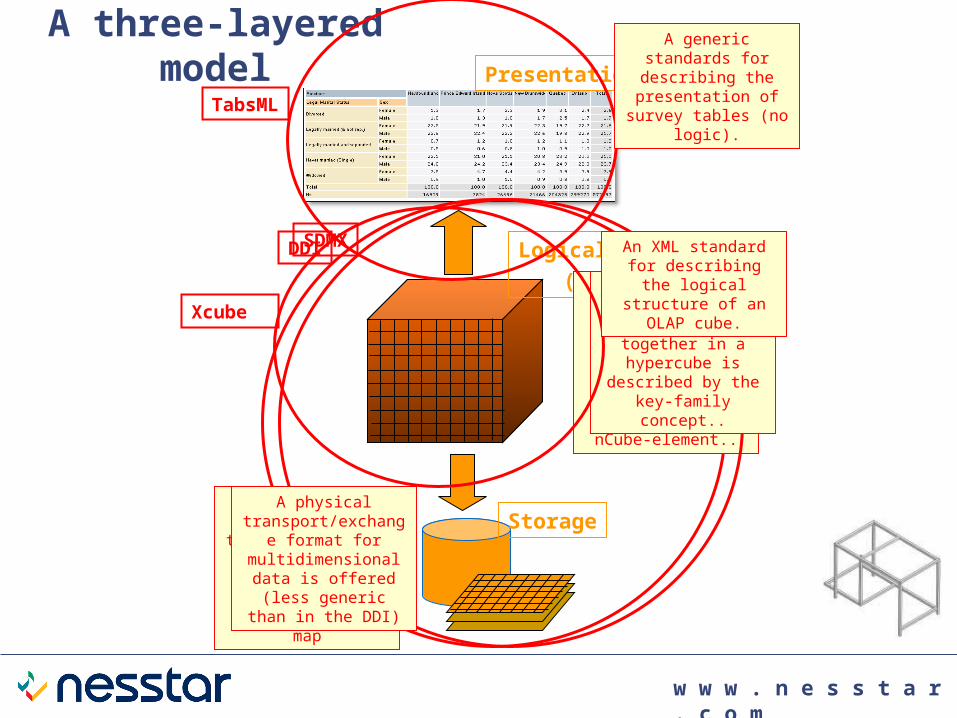
A three-layered model
Logical data model
(hypercube)
Presentation
Storage
DDI
Dimensions and measures described by the var-element. How
they are brought together in a
hypercube is described in the nCube-element..
A fairly generic mechanism to map the
logical model to the physical storage of the data is provided by the
location map
SDMX
Dimensions and measures and how
they are brought together in a
hypercube is described by the key-family
concept..
A physical transport/exchange
format for multidimensional data is offered (less generic
than in the DDI)
TabsML
A generic standards for describing the
presentation of survey tables (no logic).
Xcube
An XML standard for describing the logical structure of an OLAP
cube.
w w w . n e s s t a r . c o m
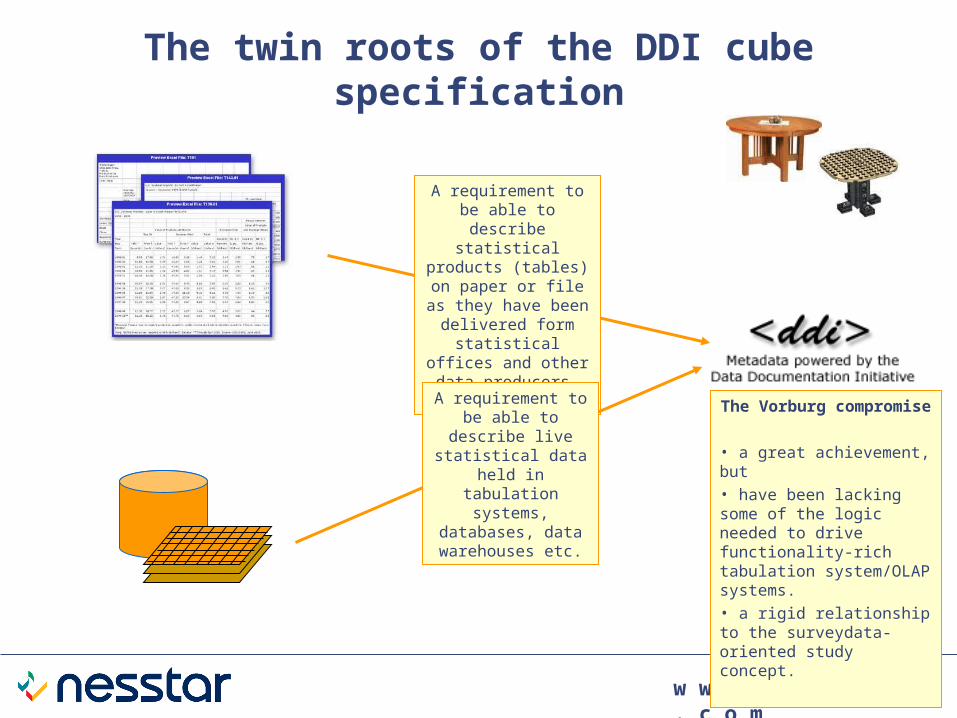
The twin roots of the DDI cube specification
The Vorburg compromise
• a great achievement, but• have been lacking some of the logic needed to drive functionality-rich tabulation system/OLAP systems.• a rigid relationship to the surveydata-oriented study concept.
A requirement to be able to describe
statistical products (tables) on paper or file
as they have been delivered form
statistical offices and other data producers.
Archived stuff.
A requirement to be able to describe live
statistical data held in tabulation systems,
databases, data warehouses etc.

w w w . n e s s t a r . c o m
The Nesstar implementation• Nesstar is a general purpose system for publishing and sharing
statistical information on the Web.
• A specific feature of Nesstar is the support for different logical data models.
Hierarchical/relational
Multidimensional
Rectangular
w w w . n e s s t a r . c o m
Live tables are great
fun.
Related Documents


