AFFDL FXG TM 72-23 AIR FORCE FLIGHT DYNAMICS LABORATORY W" + DIRECTOR OF LABORATORIES + AIR FORCE SYSTEMS COMMAND WRIGHT PATTERSON AIR FORCE BASE OHIO FINAL SCIENTIFIC REPORT DRAG COEFFICIENTS OF CONES May 1972 John F. Wendt von Karman Institute for Fluid Dynamics Rhode Saint Genese Belgium This document has been approved for public release and sale; its distribution is unlimited, This research has been sponsored in part by the Air Force Flight Dynamics Laboratory (FXG), Wright-Patterson AFB, Ohio, 45433 througehj tha L'uropean Office of Aerospace Resear-h, OAR, United States Air Force, under Contract F61052--70-C-0018. NATIONAL TECHNICAL rY-pfD D C INFORMATION SERVICE P(Fn SEP 25 1972 ! , I i ,' IL f7 1 Il _ __

Welcome message from author
This document is posted to help you gain knowledge. Please leave a comment to let me know what you think about it! Share it to your friends and learn new things together.
Transcript

AFFDL FXG TM 72-23
AIR FORCE FLIGHT DYNAMICS LABORATORY W" +DIRECTOR OF LABORATORIES +
AIR FORCE SYSTEMS COMMAND
WRIGHT PATTERSON AIR FORCE BASE OHIOFINAL SCIENTIFIC REPORT
DRAG COEFFICIENTS OF CONES
May 1972
John F. Wendt
von Karman Institute for Fluid DynamicsRhode Saint Genese
Belgium
This document has been approved for public release and sale;its distribution is unlimited,
This research has been sponsored in part by the Air Force FlightDynamics Laboratory (FXG), Wright-Patterson AFB, Ohio, 45433througehj tha L'uropean Office of Aerospace Resear-h, OAR, UnitedStates Air Force, under Contract F61052--70-C-0018.
NA TIONAL TECHNICAL rY-pfD D CINFORMATION SERVICE P(Fn
SEP 25 1972! , Ii ,' IL f7 1 Il_ __

SuiC~ I a .Fi% fic.mone,
DOCUMENT CONTROL DATA - R& D05- etrtfy ta , ti n c i I Itof . t,. s , t .1 , inI, 1 o I F.! tni. ln .ncfi, It, b, Wr dfl l't, c1 uhe,. It,, ,rlt r- Ipe, . c it. it Il ..
QCI 1-A IING AC TIVi IV (L( tj .tIwrIe nihor) I ll I I ' ,I CUt(I 7V C LA$51I IC A 1 ION
von Karman Institute for Fluid Dynamics UnclassifiedChaussee de Waterloo, 72 21. GROU'
1640 Rhode saint Genese, BelgiumJ REPORT TITLEDrag coefficient of cones
4 DESCRIPTIVE NOTES (7'pe of report nnd inclusive dates)
Scientific Final I March 1970 - 30 November 1971Au THORISI (fitur nume. middle initial, last nmue)
Wendt, John F.
1, REPORT DATE 7a TOTAL NO. OF PAGES 1 7b. NO. OF REFS
51_1 15,,. CONTRACT OR GRANT NO F61052-70-C-0018 9b. ORIGINATOR'S REPORT NUMOER(S)
b. PROJECT NO. AFFDL 1366
C. 9b. OTHER REe.aR-"nO"I (An_7 other numbers that may be &ssignedthis report)
d. AFFDIYTM 72-23 FXG
,0 OISTRIBUTION STATEMENT
his document has been approved for public release and sale; its distributionis unlimited.
II SUPPLEMENTARY NOTES 12. SPONSORING MILITARY ACTIVITY
Tnch, Other Air Force Flight Dynamics Lab.(FXG)
_ Wright Patterson AFB Ohio 4543313. ABSTRACT
The objective of this research was to provide experimental values for conedrag coefficients in the near free molecule and transitional flow regimes includingan examination of the effects of Mach number, wall speed ratio, bluntness, andspecific heat ratio. A modulated force probe with a sensitivity in the microgramrange was employed to measure the drag forces on 90 half-angle cones in the range6<M <10, l<Re z<50 with an RMS dispersion of +2%. A knowledge of the flow propertiesin the free jW.employed for this study permitted the calculation of cone dragc.efficients. The resulting values cover the flow regimes from near-free-moleculeto transitional.The experimental data are presented as a function of the dimensionless parameters:wall Re number, and free-stream Knudsen number. In addition an "effective" Knudsennumber, based on reflected incident m6lecular collisions employing velocity dependentcross sections is shown, based on limited data, to provide a valid correlation forvarious values of M number and specific heat ratio as long as cone angle and wall speedratio are fixed. The relationship between Knri,D and the parameters commonly employed
in the literature is examined and shown to be consisteut in limiting cases.
1473 FORM 14 73NOV IS147
Se( ur-t\' (Clal'sifziztion

S., vfttV C'la%%tfl itimon
K I IN A LtIK I$ LINJK C
Dra coefficients
IOL I O. T
Cone drag
Rarefied hypersonic flow
-.... - -=. -- -o
e _______________urtt ____________________________n

!a
AFFDL FXG TM 72-2 ,
FINAL SCIENTIFIC REP'JRT
DRAG COEFFICIENTS OF CONES
May 1972
John F. Wendt
von Karman Institute for Fluid Dynamics
Rhode Saint GeneseBelgium
This document has been approved for public release and sale;its distribution is unlimited.
This research has been sporsored in part by the Air Force FlightDynamics Laboratory (FXG), Wright-Patterson AFB, Ohio, 45433through the European Office of Aerospace Research, OAR, UnitedStates Air Force, under Contract F 61052-70-C-0018.
bW
'1~
FOREWORD
This work was supported by the Air Force Flight Dynamics
Laboratory (FXG), Wright-Patterson AFB, Ohio under Project number
1366.
The results presented were obtained by the von Karman Institute
for Fluid Dynamics, Rhode Saint Gencse, Belgium, under Contract F
61052-70-C-0018.
The author wishes to acknowledge the support furnished by a
grant from the Mechanics Division of the Air Force Office of Scicntific
Research which aided materially in the development of the modulated force
probp used in this study. In addition, sincere thanks are expressed
to Professor Jean J. Smolderen for many stimulating discussions on all
facets of this work.
This technical memorandum has been published for exchange of
information purposes only.
1 P. ANTONATOSChief, Flight Mechanics DivisionAF Flight Dynamics Laboratory
i -'
1

ABSTRACT
The objective of this research was to provide experimental values
for cone drag coefficients in the near free molecule and tiansitional
flow regimes including an examination of the effects of Mach number,
wall speed ratio, bluntness, and specific heat ratio.
A modulated force probe with a sensitivity in the microgram
range was employed to measure the drag forces on 90 half-angle cones
in the range 6 < M < 10, 1 < Re < 50 with an R.M.S. dispersion
of +2%. A knowledge of the flow properties in the free jet employed
for this study permitted the calculation of cone drag coefficients.
The resulting values cover the flow regimes from near-free-molecule
to transitional.
The ,experimental data are presented as a function of the dimensionless
parametefs: wall ReyncIds number, Re and free-stream Knudsen number,
KnC, D" In addition, an "effective" Knudsen ntuber, Kn ri,D based on
reflected-incident molecular collisions employing velocity dependent
cross section is shown, based on limited data, to provide a valid correlation
for various values of Mach number and specific heat ratio as long
as cone angle and wall speed ratio are fixed. The relationship between
Knri,D and the parameters commonly employed in the literature is examined
and shown to be consi.stent in limiting cases.
li
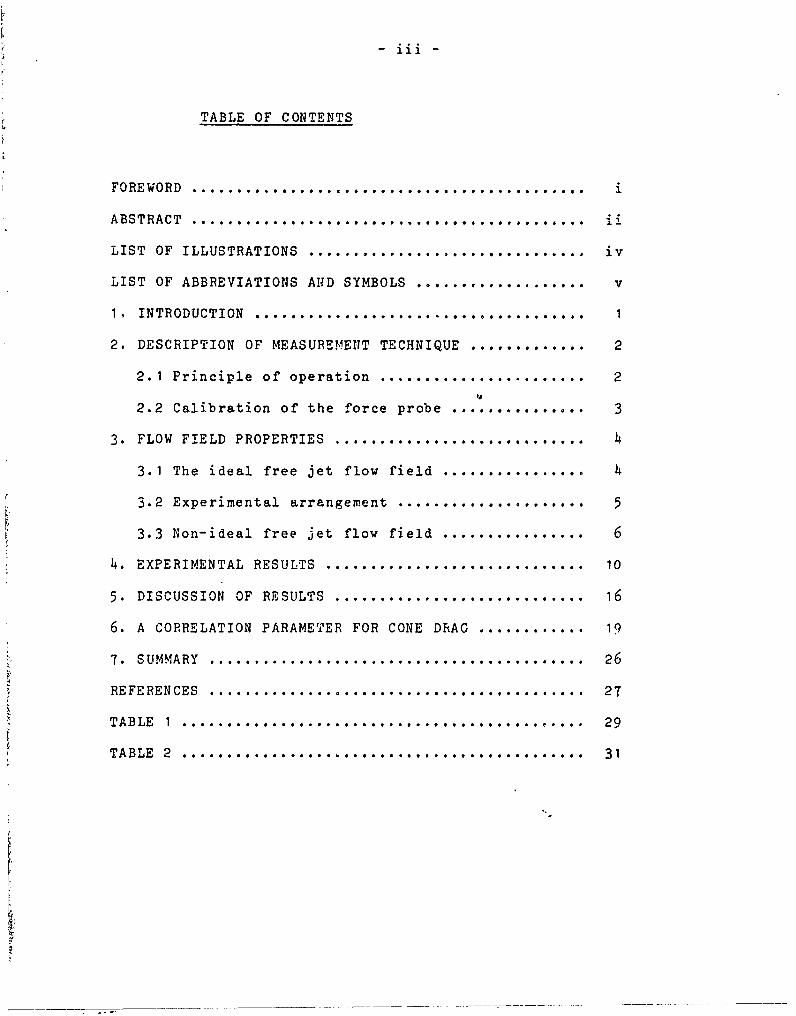
TABLE OF CONTENTS
FOREWORD ............................................ i
ABSTRACT ............................................ ii
LIST OF ILLUSTRATIONS ..................... # .. . ..... iv
LIST OF ABBREVIATIONS AND SYMBOLS ................... v
1 . INTRODUCTION ....................... . ..... .. . 1
2. DESCRIPTION OF MEASUREMENT TECHNIQUE ............. 2
2.1 Principle of operation ....................... 2
2.2 Calibration of the force probe ............... 3
3. FLOW FIELD PROPERTIES ....................... . ...
3.1 The ideal free jet flow field ............... 0 4
3.2 Experimental arrangement ......... ........... 5
3.3 Non-ideal free jet flow field ................ 6
4. EXPERIMENTAL RESULTS .......................... 10
5. DISCUSSION OF RESULTS ........................... 16
6. A CORRELATION PARAMETER FOR CONE DRAG ............ 19
7. SUMMARY.. ...................................... 26
REFERENCES ......... . . . ........... . ....... 27
TABLE 1 ................................ ....... 29
TABLE 2 ............................... 31
- iv -
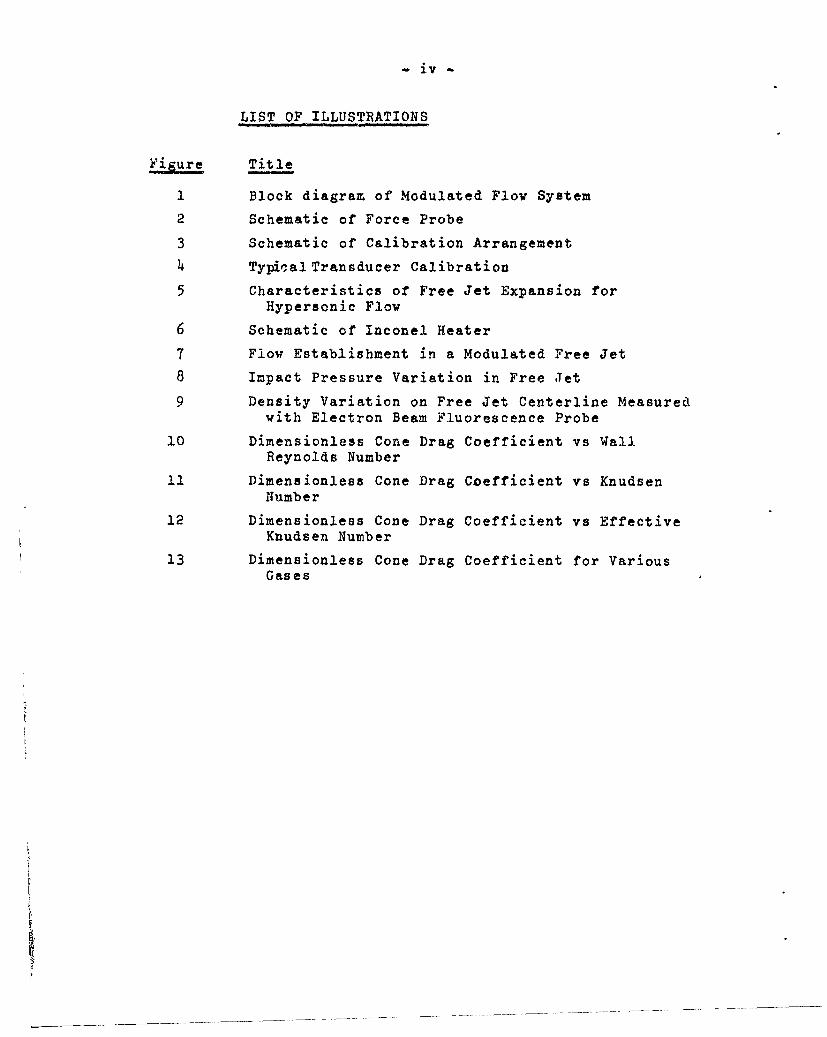
LIST OF ILLUSTRATIONS
Figure Title
1 Block diagram of Modulated Flow System
2 Schematic of Force Probe
3 Schematic of Calibration Arrangement
4 Typical Transducer Calibration
5 Characteristics of Free Jet Expansion forHypersonic Flow
6 Schematic of Inconel Heater
7 Flow Establishment in a Modulated Free Jet
8 Impact Pressure Variation in Free Jet
9 Density Variation on Free Jet Centerline Measuredwith Electron Beam Fluorescence Probe
10 Dimensionless Cone Drag Coefficient vs WallReynolds Number
11 Dimensionless Cone Drag Coefficient vs KnudsenNumber
12 Dimensionless Cone Drag Coefficient vs EffectiveKnudsen Number
13 Dimensionless Cone Drag Coefficient for VariousGases
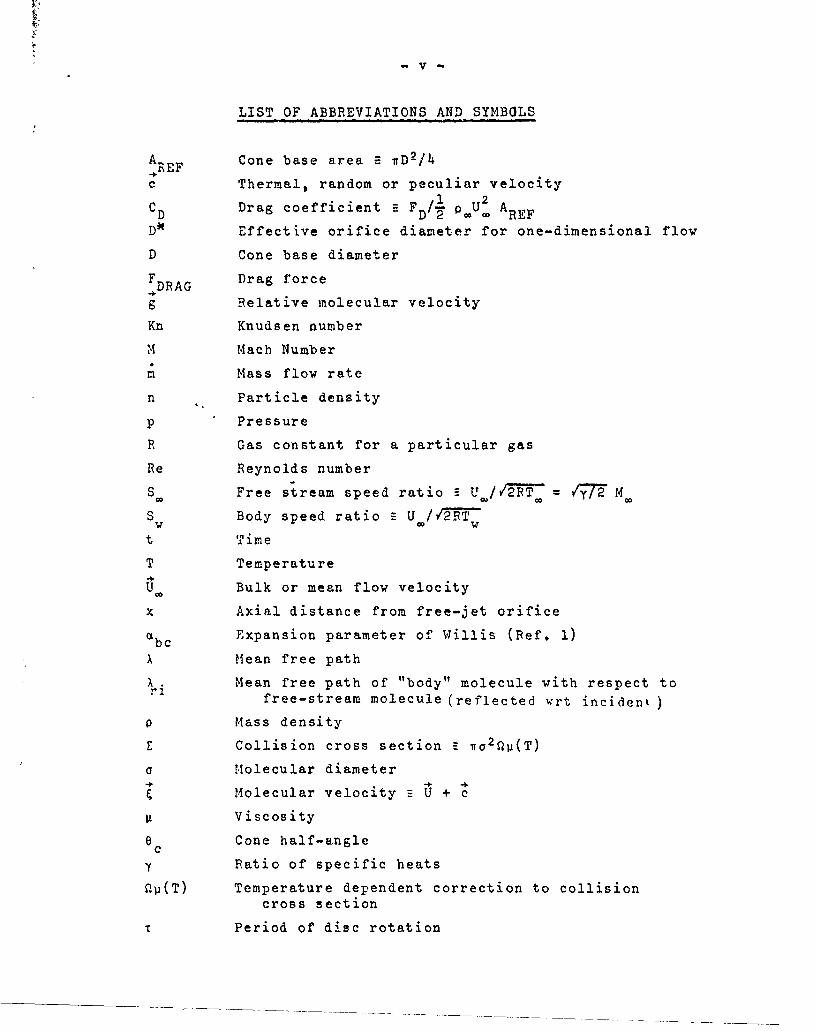
LIST OF ABBREVIATIONS AND SYMBOLS
AREF Cone base area =- nD2/4
c Thermal, random or peculiar velocity
C Drag coefficient - FD o/U 2 AREFD D 2 c EDR Effective orifice diameter for one-dimensional flow
D Cone base diameter
FDRAG Drag force
g Relative molecular velocity
Kn Knudsen number
M Mach Number
m Mass flow rate
n Particle density
p Pressure
R Gas constant for a particular gas
Re Reynolds number
So Free stream speed ratio E= / M.
S Body speed ratio " U //2R/Tw w
t Time
T Temperature
U. Bulk or mean flow velocity
x Axial distance from free-jet orifice
be Expansion parameter of Willis (Ref. 1)
XMean free path
X . Mean free path of "body" molecule with respect tori free-stream molecule (reflected wrt incident)
0 Mass density
Collision cross section -ra 2SP(T)
o Molecular diameter
Molecular velocity = U + c
Viscosity
O Cone half-anglee
y Ratio of specific heats
QV(T) Temperature dependent correction to collisioncross section
Period of disc rotation

- vi -
Subscripts
a Ambient conditions
r Molecules reflected from the body
i Molecules incident on the body
c Free stream conditions
0 Stagnation conditions
f.m. Free-molecule conditions
w Conditions on the body (wall)
z Conditions based on cone length
D Conditions based on cone base diameter
M Location of Mach disc
1. INTRODUCTION
Although considerablz progress has been witnessed
during the last few years in providing experimental data and
theoretical predictions on the drag of slender cones at zero
angle of attack in the rarefied hypersonic flow regime, a
completely satisfactory understanding of the problem seems
still not to be in hand. An excellent critique of near free
molecule theories and a discussion of available experimental
results have recently been presented by Keel and Willis (Ref, 1).
It contains numerous references to earlier studies which will
not be repeated here.
The objective of this study was to provide further
experimental information on 90 half-angle cones in the Mach
number range from 6 to 10 and to assess the effects of specific
heat ratio, bluntness, and wall-to-stagnation-temperature ratio
(wall speed ratio). A correlation parameter, the Knudsen number
characterizing reflected-incident collisions, incorporating
temperature-dependent collision cross sections, is introduced
and its usefulness is examined by considering selected sets of
experimental data from the literature.

-2-
2. DESCRIPTION OF MEASUREMENT TECHNIQUE
This section describes the operating principle of
the modulated force probe and the calibration procedure
employed for these measurements.
2.1 Principle of Operation
Low density wind tunnels seldom are capable of pro-
ducing reasonably large-scale flow fields with mean-free-paths
greater than 5 to 10 mm. Since it may easily be shown that the
drag force on a model with dimensions of order millimeters in
a hypersonic cold flow at Kn ^. 0(10) is the order of milli-
grams, it is clear that a measurement technique suitable for
the transitional (0.3 < Kn < 3) and near free molecule
(3 < Kn. < 10) regimes must exhibit a sensitivity of 10 to
100 pgrams to provide a "1%" measurement.
For this purpose, an instrument was developed at the
VKI whose operation is based on the principle of flow modulation.
Operational details may be found in Reference 2, Briefly, modu-
lating (turning "on" and "off" periodically) the flow acting on
a body attached to a typical ceraric force transducer produces
an A.C. output whose peak-to-peak amplitude is directly propor-
tional to the applied force. A P.A.R. Model JB-6 lock-in ampli-
fier (a highly tuned amplifier - synchronous demodulator),
employing the modulating frequency as a reference, allows the
signal of interest to be extracted even when very low values of
the signal-to-noise ratio exist * A schematic of the instrumnent
chain is shown in Figure 1.
The flow field in which these drag measurements were
performed is a free-jet expansion which provides a high Mach
number, low density flow (described in detail in the following
chapter) without the attendent problem of boundary layer growth
experienced when the more common de Laval geometry is employed.
In addition, the small size of the jet orifice allows the -flow
to be modulated quite easily. A disc with a semi-circular window
-3-
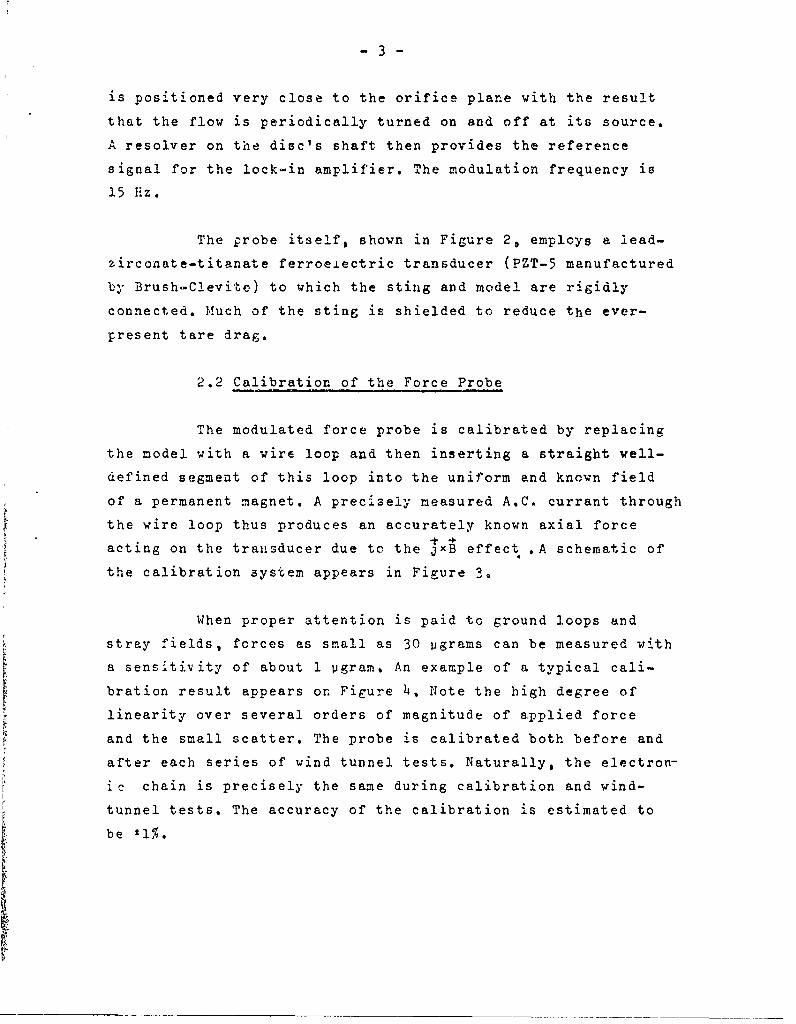
is positioned very close to the orifice plane with the result
that the flow is periodically turned on and off at its source.
A resolver on the disc's shaft then provides the reference
signal for the lock-in amplifier. The modulation frequency is
15 Hz.
The probe itself, shown in Figure 2, employs a lead-
zirconate-titanate ferroe±ectric transducer (PZT-5 manufactured
by Brush-Clevite) to which the sting and model are rigidly
connected. Much of the sting is shielded to reduce the ever-
present tare drag.
2.2 Calibration of the Force Probe
The modulated force probe is calibrated by replacing
the model with a wire loop and then inserting a straight well-
defined segment of this loop into the uniform and known field
of a permanent magnet. A precisely measured A.C. currant through
the wire loop thus produces an accurately known axial force
acting on the transducer due to the JXB effect ,A schematic of
the calibration system appears in Figure 3.
When proper attention is paid to ground loops and
stray fields, forces as small as 30 pgrams can be measured with
a sensitivity of about 1 pgram. An example of a typical cali-
bration result appears on Figure 4. Note the high degree of
linearity over several orders of magnitude of applied force
and the small scatter. The probe is calibrated both before and
after each series of wind tunnel tests. Naturally, the electron-
Ic chain is precisely the same during calibration and wind-
tunnel tests. The accuracy of the calibration is estimated to
be tl%.
3. FLOW FIELD PROPERTIES
In this section, the "ideal" free jet flow properties
are described to present a simple picture of the flow field
employed for the force measurements, Then the experimental ar-
rangement is discussed with particular attention to design
problems encountered when heated flows are employed. Finally,
the real or non-ideal free jet is discussed with the emphasis
on problems peculiar to this investigation.
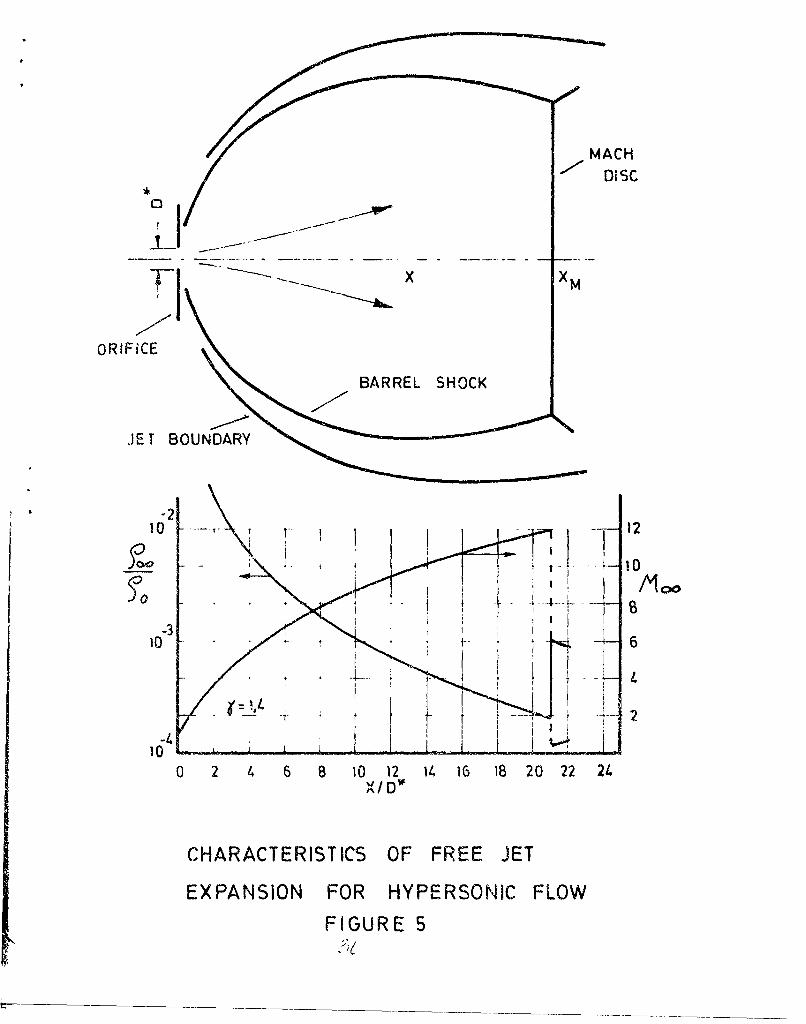
3.1 The Ideal Free Jet Flow Field
The free-jet expansion (a highly underexpended jet)
is employed to produce high Mach number, low density flows. A
schematic diagram of the jet structure is shown in the upper
half of Figure 5. As it is a nearly spherical expansion, flow
gradients are important; however, the use of sufficiently
small models circumvents to a large degree this problem.
The case of a jet exhausting isentropically into a
vacuum has been studied in Reference 3 and the results quoted
are now widely used to determine "ideal" local flow properties
in a free-jet flow. The Mach number on the jet centerline may
be expressed uniquely in terms of x/D, the distance from the
orifice to the point in question divided by the effective nozzle
diameter for one-dimensional flow, and y, the specific heat
ratio. The Mach number and density ratio are plotted versus
xiD in the lower part of Figure 5. Thus, the Reynolds numbert
Re,, (or Knudsen number Kn,) at a fixed x/D can be altered
independently of M. simply by changing the stagnation pressure,
PO. The test procedure in a free jet is therefore to select M.*
which fixes x/D*; then perform the desired measurements at this
value of x/D by varying Po which directly varies Re or Kn.

-5 -
3,2 Exper imental. Arrangement
Two distinct arrangements have been employed to pro-
duce the desired £Xow field depending on whether or not the
flow is to be heated.
Cold flows (room temperature) emanate from a 50 liter
settling chamber through a sharp-edged nominal 5 mm diameter
orifice. The 30 cm diameter chopper disc is positioned such
that the plane of the disc is witnin 0.5 mm from the plane of
the orifice. Stagnation pressureb are measured with a Texas
Instrument Bourdon Tube Gauge with an absolute accuracy of 10
microns Hg. Stagnation tenperatures are determined with thermo-
couples and mass flows are measured with precision "ROTA"
rotameters.
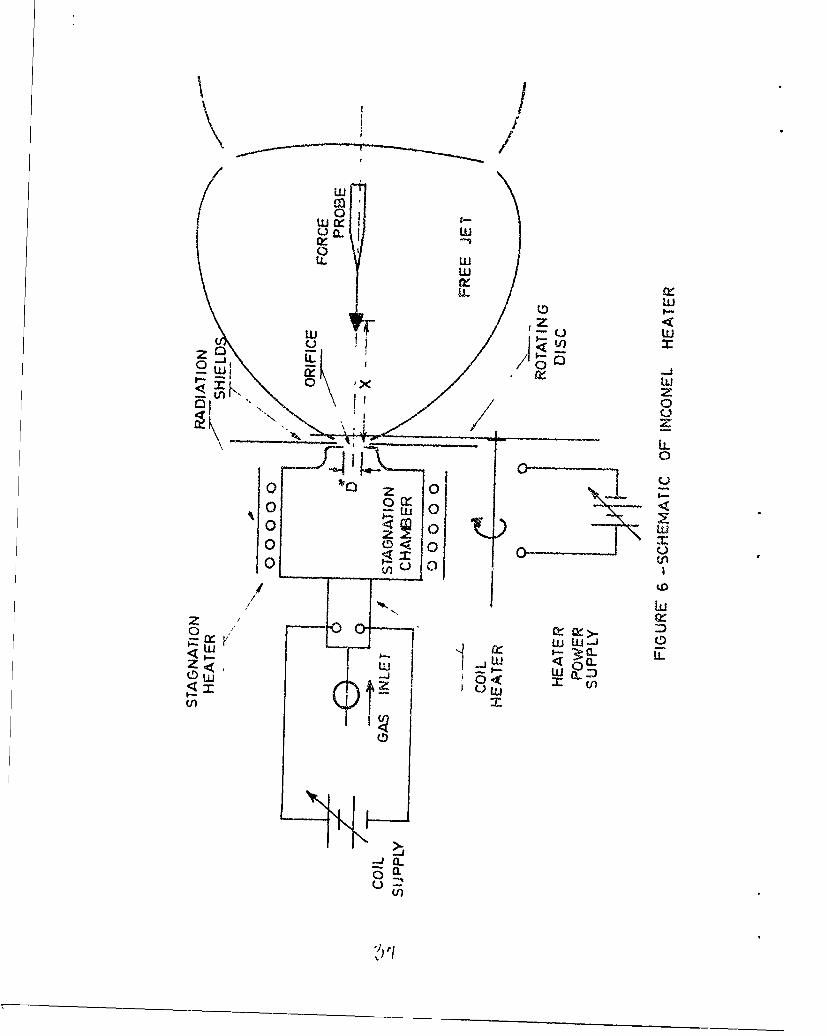
Heated flows are prodcued with ar inconel heater show.n
in Figure 6. Two inconel coils, each carrying the gas load,
bring d.c. current to and from the one-liter inconel settling
chamber which is surrounded by an auxiliary oven. Radiation
shielding protects the model/transducer system from excessive
radiative heat transfer. Measurements of the stagnation temper-
ature, To, with tnermoccuples and calculation of To using the
sonic flow technique - requiring a knowledge of the effective
orifice diameter D , stagnation pressure, P0, and mass flow m -
were in agreenent over a wide range of operating conditions.
Temperatures up to 1000'K can easily be produced and higher
temperatures are certainly possible if and when desired, although
the radiant heat transfer losses then becomie significant.
In each of the above cases, the force probe and sup-
port are mounted on a platform suspended by rubber supports
which In turn is attached to a linear-bearing traversing mechan-
s . Model-orifice alignment is carried out using optical
techniques. The model can be positioned with respect to the
orifice with an accuracy of 0.2 mm.
-6-
3.3 Non-Ideal Free Jet Flow Field
The flow properties in a free jet do not always cor-
respond to the "ideal" picture presented above. This section
discusses the practical case of a "non-ideal" free jet.
There are two classes of non-ideal free jet flows
which need to be considered: those which are due to the manner
in which the free jet is employed in this rarticular study
(primarily resulting from flow moaulation), and those which
are always observed when free jets at low densities are employed
for aerodynamic testing purposes.
Looking at the first class, it is clear that modulating
a free jet with a rotating chopper disc produces a periodic
partial blockage of the flow which in turn cat'ses the stagnation
pressure to rise and fall. Thus, the model will be subjected
to a time-varying force When the orifice is uncovered and
covered. This problem is easily circumvented by employing a
sufficiently large stagnation chamber such that the response
time is much greater than the disc's half-period. In cold flow
studies, a 50 liter settling chamber is employed which results
in pressure fluctuations of a few tenths of one percent. The
use of heated flows precludes such a large volume because of
the heating requirements that would be imposed. Pressure fluctua-
tions in the one liter settling chamber used for hot flows were
reduced to less than 1% by positioning the chopper disc a few
millimeters downstream of the orifice plane. Flow effects felt
on the free jet centerline due to spillage around the disc
during the "flo r-off" period were investigated with impact
probes and found to be entirely negligible.
Flow transients must also be expected when using a
chopper disc. Their form and duration have been studied exper-
imei.talli with a hot-wire system. When the flow is modulated,
the typical response of a nominal one micron wire is that shown
on Figure 7. The peaks correspond to the "rlosing" of the ori-

-7-
fice by the rotating disk and appear to be quite clean and
sharp. The valleys, on the other hand, correspond to the
"opening" of the orifice and are characterized by a small
irregularity which is typically 2-3% of the half-period. It
is properly termed the flow-establishment time. Note that the
"uncovering-time" of the orifice is approximately 1% of the
half-period (0.5 cm dia. orifice/50 cm half-circumference of
the rotating disk). Thus, the flow transient is, es might be
expected, somewhat in excess of the time required to uncover
the orifice. However, the ultimate effect of this transient
on the force meesurements is diminshed considerably by the man-
ner in which the lock-in amplifier treats such transients (see
Reference 2 for details; basically, the error due to a transient
of duration Lt is not At/T, where T is the period of rotation,
but rather (6t/T)2 .
Looking at the second class of problems, it is seen
that when usiag the results of the method of characteristics
(Ref. 3) to determine the flow field properties, the effective
orifice diameter, D, for one dimensional flow must be known.
It is nearly, but not precisely, equal to the geometric dia-
meter. For each orifice employed, the effective orifice
diameter was calculated as a function of the Reynolds number
by measuring the mass flow as a function of stagnation press-tre.
For all sharp-edged orifices analyzed to date, the effective
diameter was found to be only a few percent smaller than the
geometric diameter and, more importantly, to vary by no more
than two percent over the entire range of source Reynolds num-
bers employed in the eventual test program. For purposes of
computing flow properties, DK was assumed constant.
A check on the applicability of the method-of-charac-
teristics solution to the free jet was made by measuring the
impact pressure along the centerline of the free jet as a func-
tion of x/D and comparing the measured values with the pre-
dicted results. Both heated and unheated flows were employed.
The raw experimental points are shown in Figure 5. Corrections

for shock stand-off distance will shi-t all the data points to
the left by about 0.4 x/D . Viscous corrections to the impact
pressure measurements are negligible for the unheated cases,
but they vill shift downwards the data points taken under
heated conditions by as much as 6-8 % (Ref. h) at an x/DM of
^12. These considerations, combined with the computed measure-
ment accuracy - about 11% at an -/D of 5 and t8% at an x/D H of
12 - allow us to conclude that the impact pressure surveys are
in good agreement with theory. They also lend credence to the
fact that the flow is not disturbed by either the rotating disk
or the radiation shields.
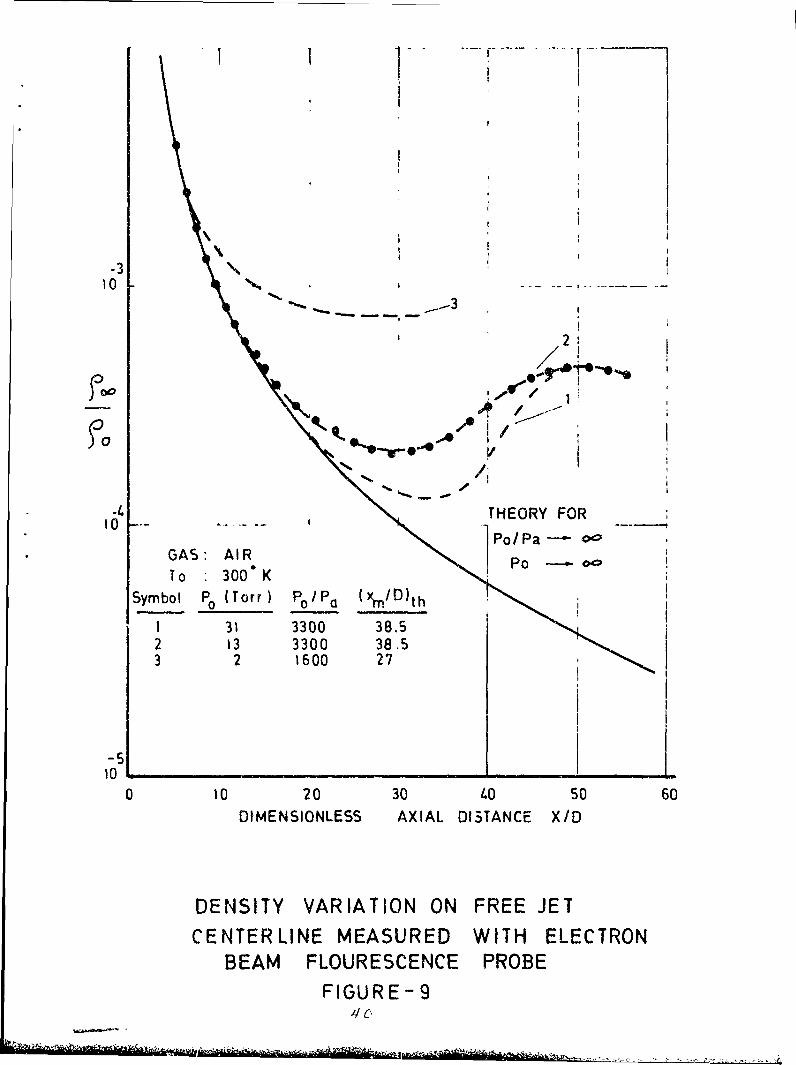
A final non-ideal free jet characteristic is the
thickening of the shock waves which form the "barrel" causing
the boundaries to encroach on the useful testing region.
Electron beam measurements of the free-jet density profiles on
the jet centerline have been carried out for different values of
the stagnation pressure. The results are shown in Figure 9. The
empirical high-density location of the Mach disk (Xm/D )h which
terminates the hypersoniL flow fiela is calculated from the
expression (Ref. 3)
x P0 1/2
Dth ~a
it is clearly seen that reducing p0, so as to increase X , can
only be continued to a certain level, depending on the axial
location of the model, Below this level, the free jet density
profile no longer agrees with the method of characteristics'
predictions. The results preserted herein all were obtained at
values of Po such that the measured values of density agree
with the theoretical predictions. Therefore, no changes in flow
properties occur due to the encroachment of the surrounding
shock structure as po is decreased (so as to increase Kn.).
In summary, satisfactory operating conditions for the
proper use of a free jet flow field have been confirmed by a
variety of experimental checks. Within the boundaries specified,
1 -0 -
the theoretical values for the free jet flow properties may be
used with confidence for data reduction in both cold and hot
flows, requiring only a knowledge of the distance from the
orifice to the model and the effective diameter of the orifice.
-10-
4. EXPERIMENTAL RESULTS
This section describes the test procedure and the
results of force measurements on the 90 half-angle cones.
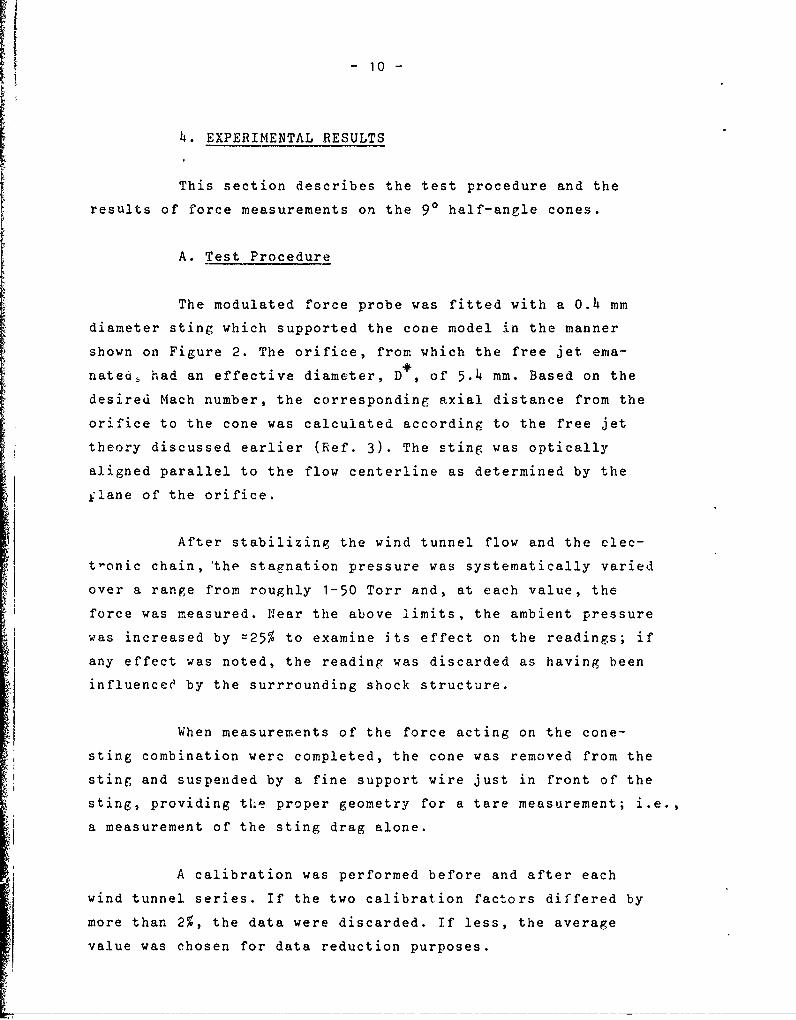
A. Test Procedure
The modulated force probe was fitted with a 0.4 mm
diameter sting which supported the cone model in the manner
shown on Figure 2. The orifice, from which the free jet ema-
nated, had an effective diameter, D , of 5.4 mm. Based on the
desired Mach number, the corresponding axial distance from the
orifice to the cone was calculated according to the free jet
theory discussed earlier (Ref. 3). The sting was optically
aligned parallel to the flow centerline as determined by the
ilane of the orifice.
After stabilizing the wind tunnel flow and the elec-
t-onic chain, 'the stagnation pressure was systematically varied
over a range from roughly 1-50 Torr and, at each value, the
force was measured. Near the above limits, the ambient pressure
was increased by =25% to examine its effect on the readings; if
any effect was noted, the reading was discarded as having been
influenceO by the surrrounding shock structure.
When measurements of the force acting on the cone-
sting combination were completed, the cone was removed from the
sting and suspended by a fine support wire just in front of the
sting, providing tke proper geometry for a tare measurement; i.e.,
a measurement of the sting drag alone.
A calibration was performed before and after each
wind tunnel series. If the two calibration factors differed by
more than 2%, the data were discarded. If less, the average
value was chosen for data reduction purposes.

- 11 -
B. Results in Unheated Flows
The force measurements at a given P0 are normalized
by the appropriate free stream properties, computed from a
knowledge of model position, x/I, and Po, to form the desired
dimensionless grouping - the cone drag coefficient
= FDRAG 4-1D 1 2
2 C REF
where A = D2 /h. The distance x, is taken as the distance
from the orifice to the "half-area" point of the cone; i.e.,
the point at which half the cone area lies upstream and half
downstream, excluding the base area.
The results are shown in Figure 10 for different
Mach numbers as a function of the wall Reynolds number,
Re - -The data are tabulated in Table 1 and the symbolsP w
are identified in Table 2. The accuracy of the data was computed
based on the following considerations
CD 6F 6 1/2 2 6A
CU 6AREF-+ + -2
CD F 1/2 PU2 AREF
In a free jet,
26 1/2 PU 6po 26x/D
1/2+ 4-32 PO x/D/2OD
- 12 -
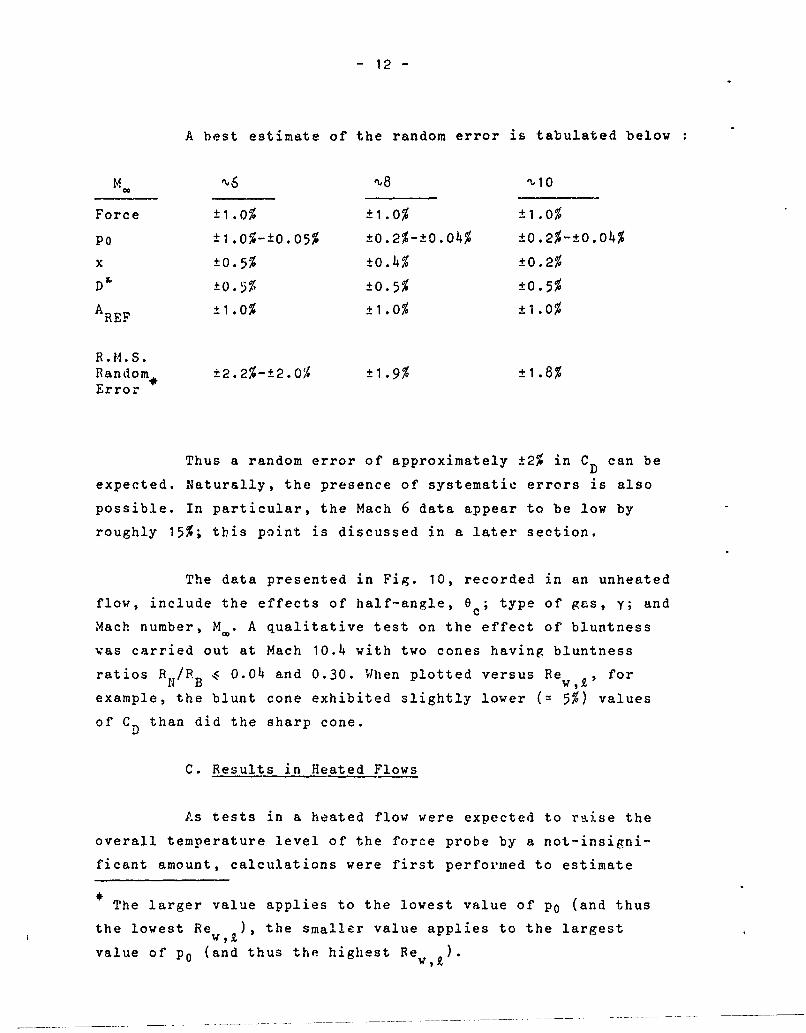
A best estimate of the random error is tabulated below
M "6 8 "10
Force ±1.0% ±1.0% ±1.0%
P0 ±1.0%-±0.05% ±0.2%-±o.o4% ±0.2%-±0.o4%
x ±0.5% ±0.4% ±0.2%
D ±0.5% ±0.5% ±0.5%
AREF ±1.0% ±1.0% ±1.0%
R.M.S.Random ±2.2%-±2.0% ±1.9% ±1.8%Error
Thus a random error of approximately ±2% in CD can be
expected. Naturally, the presence of systematic errors is also
possible. In particular, the Mach 6 data appear to be low by
roughly 15%; this point is discussed in a later section.
The data presented in Fig. 10, recorded in an unheated
flow, include the effects of half-angle, e ; type of gas, y; and
Mach number, M. A qualitative test on the effect of bluntness
was carried out at Mach 10.4 with two cones having bluntness
ratios RN/R B < 0.04 and 0.30. When plotted versus Rewtc, for
example, the blunt cone exhibited slightly lower (= 5%) values
of CD than did the sharp cone.
C. Results in Heated Flows
As tests in a heated flow were expected to raise the
overall temperature level of the force probe by a not-insigni-
ficant amount, calculations were first performed to estimate
The larger value applies to the lowest value of P0 (and thusthe lowest Re ), the smaller value applies to the largest
wvahvalue of' p0 (and thus the highest Rew,).

- 13 -
the equilibrium temperature of the cone model under a variety
of flow conditions. Factors included in the calculation were
radiation beat transfer from the interior, exterior and surround-
ing shields of the settling chamber; convective heat transfer;
and conduction heat transfer through the connecting sting and
support assembly. Detailed results can be found elsewhere
(Ref. 5). Of essential interest was the fact that model temper-
atures between 350-550 0 K might be expected with the existing
probe design for the anticipated range of flow conditions and
a stagnation temperature of 1200 0 K - the maximum design temper-
ature for the heated stagnation chamber discussed earlier.
Considering the specific geometry of the force probe, it was
further concluded that the transducer temperature would be
about 330 0 K ("- 500 C). This is well below the Curie temperature
of the PZT-5 ferroelectric employed, but it is known that the
properties of these crystals are somewhat dependent on temper-
ature over such a range.
A calibration of the transducer was therefore performed
in a temperature-controlled oven at temperatures up to 360°K.
Small ( 10%) changes in the calibration factor of the ferro-
electric device were noted, but the performance was otherwise
quite stable and repeatable.
When tests in a heated flow in the wind tunnel were
initiated, however, completely different results were obtained
characterized by marked instabilities and force values which
were far removed (15%-25%) from the expected values. Measurements
of the model temperature confirmed the earlier predicted values
and hence the transducer temperature was certainly well within
the limits reached in the oven during calibration (i.e., <3600 K).
The only essential difference between the oven calibration tests
and the wind tunnel experiments was that in the latter a temper-
ature gradient existed along the length of the transducer (a AT
of approximately I0 0C), whereas the former were performed at a
uniform element temperature.
- 14 -
Since it was desirable to further reduce the model
temperature to provide an increased ratio of To/T w , and as such
a change would also decrease both AT across the transducer as
well as the average temperature of the transducer, the probe
vas modified to provide an alternate conduction path for the
heat which would reduce the model and transducer temperature
levels at the expense of only a small loss in sensitivity. The
result was unsuccessful in the sense that the same unstable
operation was observed.
Finally, a special test set-up was arranged to quanti-
tatively examine the effect. In the calibration mode, the
supports fore and aft of the transducer (see Fig. 3) were fitted
with thermocouples and a blackened foil was cemented with
conducting glue to the sting. The light from a 150 watt reflector
lamp was focused onto the black foil. Thus, sufficient heat was
added forward of the transducer to prcduce a AT across the
transducer which could reach 300 C. At the same time, a force
could be applied to the element and thus the effect of a well-
defined temperature gradient on the output signal could be
accurately determined. An oscilloscope provided a direct record-
ing of the signal at the input to the lock-in amplifier. The
results were striking. A heat pulse, producing an initial rate
of change of AT on the order of 0.10 C/sec, caused the transducer
output to surge in such a way as to saturate the charge amplifier
and momentarily cut to zero the input signal to the lock-in
amplifier. Some tens of seconds were required for the system to
return to normal operation. Various tests eventually proved
conclusively that the responsible cause was the change in element
temperature with time. The mechanism is probably a little-under-
stood (from the quantitative point of view) phenomena called
the pyro-electric effect. It should be emphasized that the pyro-
electric effect can easily produce volts, whereas the largest
output signals observed in force measurements are typically
millivolts. Thus, complete saturation is quite understandable.

-15-
When a time-independent AT of 20 C was established across
the element, the output signal was quite satisfactory. At a AT
of 40C, some unstable operation was noted; enough to remove the
element from the realm of a ±1% instrument. At larger AT's,
operation was impossible due to large drifts and instabilities.
Since the applied force during all of the above tests
was relatively large compared to the values recorded under near-
free molecule flow conditions, it became clear that even a
AT = 20 C could not be tolerated.
In summary, the heated flow tests could not be carried
out with an:r reasonable degree of accuracy (< 20%) because of
a highly unstable output signal produced by a temperature
gradient of only a few degrees Celsius or more, a gradient so
small that any modifications to the probe design for the purpose
of providing increased cooling would have to be so important as
to produce unacceptable side-effects; i.e., a highly reduced
sensitivity due to the mechanical constraint of the heat-conduction
member.

- 16 -
5. D2SCUSSION OF RESULTS
An examination of Figure 10 discloses a number of
points which are commented on here.
1. The Mach 8.1 data (X+ ), while exhibiting little scatter
within each set, show a systematic difference from each other
which varies from 6 to 8%. A similar result is noted for the
Mach 10.4 data ((, ? ). In principle, the data for each Mach
number should be averaged resulting in the conclusion that
for these two sets of tests the reproducibility is roughly
± 3 to 4%. As the tare correction typically amounted to
30 - 400 of the total drag, some discrepancy may be due to the
inevitable substraction errors that occur in a sting-mounted
arrangement. A second source of error is in the location of
the model relative to the orifice. Because of the expanding
nature of the flow, the Mach number, and hence normalized
dynamic pressure and C changes with x/D. As an example, anD
error in x of V2 mm will result in a 2 - 3% error in the
calculated value of CD for the Mach 8 case.
2. While the bulk of the data falls on a straight line
emanating from the C D/C Df.= 1 point, a tendency is noted
for the data to rise above this line for Rew;z< 2 or 3. This
fact has been noted previously (Ref.1, p.33), but whether the
effect is real or simply represents experin.ental difficulties
in the regime of very low force levels is not clear.
3. The data have been compared with the predictions of Willis'
Knudsen iteration analysis (Ref. 1) which provides a first order
correction to the free molecule drag coefficient and is based
on the modified Krook model for the collision term in the
Boltzmannequation. The expansion parameter in Willis' analysis,
essentially a Knudsen number, can be defined in different ways
depending on the test conditions. Briefly, Willis predicts

- 17 -
CD - C
A abc 5-1
Df.m.
where A is a function of cone angle 0 , and wall speed ratio,C
Sw, and ab is taken to be
S
abc = 5-2
2/- sin e Kn(D)
0P0where Kn(D) -
When these quantities are rewritten in terms of Rewt, the
straight lines on Figure 10 result.
It is noted that the agreement between theory and
experiment is very good for the 0 = 13.50 cese and reasonablyC
good for the 0 = 90 case (with the exception of the Mach 6Ccase discussed below), particularly when slopes rather than
absolute values are considered.
4. The Mach 6 data are appreciably below (= 15%) the other
data. While some Mach number effect is anticipated, such a
discrepancy is too large to be expected. Noting that a straight
line through the '4ach 6 data is nearly parallel to the theoretical
line (the solid line for ec = 90), it is possible that a systematicC
error occurred. Extrapolating the data to Re w,= 0 yields a
C :/CDP~m = 0.86 instead of unity. If' the values of the ordinatesare raised by a corresponding amount, then the "corrected"
data for the Mach 6 case will (naturally) fall on or around the
solid line and at the same time will agree with the other data.
Clearly, no firm theoretical or experimental justification exists
for this type of data manipulation. Such a large systematic
error could, however, arise due'to an error in the measurement
of x, the distance from the orifice to the model. In this case,
an error of 1.5 mm would be necessary to explain the observed
discrepancy. A more likely explanation is related to the

- 18 -
fundamental question regarding the selection of x itself.
Is it the distance to the apex, the mid point, the "half-area"
point (used herein), or the base ? As the models have a
nominal length of 5 mm, it is readily seen that the normalized
dynamic pressure (and hence the calculated C D ) will vary by
= h5% from apex to base for the Mach 6 case because the distance6CD 6from orifice to apex is 21.4 mm and -- 1 2 --. (The variation0 Dxof the normalized dynamic pressure for the Mach 8 to 10 cases is,
of course, much less because x is larger; the corresponding
percentages would be = 25' and = 15% respectively.) As it i-
quite difficult to accurately machine smooth slender cone moL, .s
with a length of less than 5 mm, and as the absolute size of
the VKI free jet is quite large compared with others currently
in use for similar studies, the wide variation in calculated
values of CD which are possible depending on the choice of x
should be kept in mind wuen analyzing free jet results. In
summary, although an evaluation of flow properties at the "half-
area point appears logical, it cannot be said to be correct
in an absolute sense.

- 19 -
6. A CORRELATION PARAMETER FOR CONE DRAG
It is clearly of interest to develop a parameter
which would correlate cone drag coefficients over a wide range
of conditions. In the past, experimentalists in the low density
field generally employed the free stream Knudsen number Kn.,
while members of the continuum school used the free stream
Reynolds number, Re . Ignoring the effect of relative veloc ty
on collision frequency, the two quantities are related in a
simple way as first shown by von Karman; Kn. "' M /Re. where
the coefficient is of order unity. Thus the two parameters are
not at all independent, but on the other hand the success of
either one is limited as can be seen in Figure 11, for example,
where a wide variety of data has been plotted as a function of
Kn D It should not be surprising that Kn. (or Re.) is
unsuccessful in the low density regire because it says nothing
about the effect of the body or wall temperature; an effect
which is clearly important in the free molecule regime and thus
one which must persist at least to some extent as Kn decreases.
However, there is general agreement that a Knudsen
number based on the mean free path of a molecule leaving the
body in question and colliding with an incident or free stream
molecule (defined here as X .) must characterize the near-freeri
rolecule regime. It is a Knudsen number which accounts for both
the free stream properties (M., T) and the properties of the wall.
(T ) and may, in addition, account for the temperature (orw
velocity) dependence of the cross section characterizing this
particular type of collision. The latter point seems important
to this author when comparing results in which the relative
Kn 1 1M,D D n ia 2 (T)D
where Q(T.) may be calculated from tables presented
in Pef.6.
- 20-
velocities characterizing collisions in the various wind tunnel
experiments on record vary by nearly one order of magnitude.
Such a Knudsen number has been successful in correlating a
widc variety of sphere drag data (Ref.7).
The purpose of this section, then, is to define a
Knudsen number based on a reflected-incident collision process
which includes a realistic temperature (or energy) dependent
cross section and then to use this so-called "effective"
Knudsen number to correlate a variety of cone drag results
and assess the consequences. This section essentially repeats
material previously presented in Ref.7.
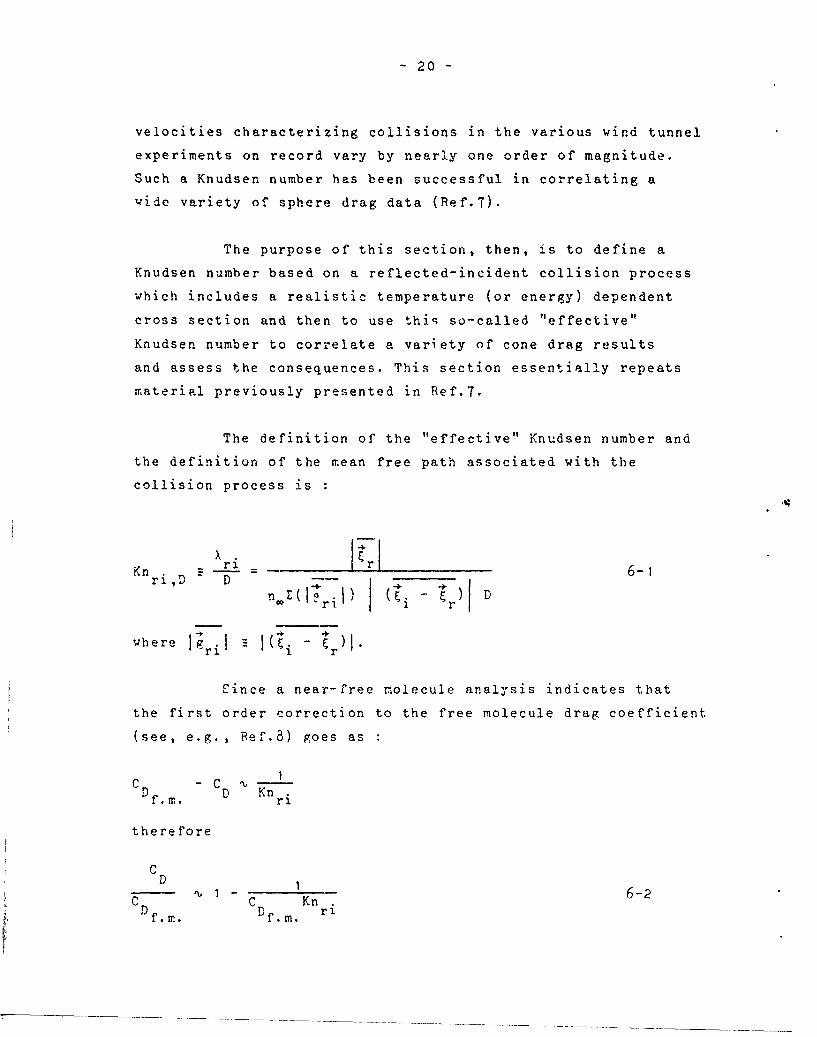
The definition of the "effective" Knudsen number and
the definition of the mean free path associated with the
collision process is
Kn ri = 6-iri,D -D --
where r i -
Since a near-free molecule analysis indicates that
the first order correction to the free molecule drag coefficient
(see, e.g., Ref.8) goes as:
CD -C CC CD Kn.f.m. D ri
therefore
CD
C C Kn 6-2Df.M. Df.m. ri

- 21 -
This point is emphasized because it is common (and indeed
essential) to normalize near free molecule drag by the free
molecule drag coefficient and thus the relevant correlation
parameter is more correctly CDf.M. Knri rather than just
Knri . (Since C seldom exceeds 3, and then only at los
supersonic conditions, and cannot be less than 2, the inclusion
of this parameter as a multiplying factor does not exert an
important influence on the results).
It remains to put equations 6-I into a form which
will allow the insertion of experimentally measurable quantities.
Assume that we can write
- r - )2 = I i -
Choosing the x-direction parallel to the bulk velocity U.;
putting the cone at the origin of the coordinate system so
that molecules reflected from it have no bulk velocity, but
only their random therral velocity, so that r ; andr r
using the fact tnat C = 0; we have
( r )2 = U 2 + 2U C + C 2 + C 2i - r ==r =rx
Ignoring the complicating effects of geometry and simply
picturing all molecules as emanating fror a plane perpendicular
to the free stream velocity,
C /RT7
cr 21
(It is clear that this assumption is less adequate for cones
than for blunt bodies; however the quality of experimental
data to date probably does not justify additional rigor.)

- 22-
Recalling that C2 = 3RT, the main term of interest in 6-I
becomes
_2 r ( 2__ . + + i)6-(i - rl (s 3 s2 3 V71
(Note that for S >> 1, S >> 1; 6-4 is nearly S)go w w
We define
F(S ,S S 2 2+ 1 + S 6-5w 00 w 3 S2 3 /
Therefore,
ri -ri ,D D n c£(,r')D /F(q ,S Y) 6-6ri ws)6-
The velocity dependent cross section (gri) must
now be ptt into a sensible form. We compute an equivalent
temperature characterizing the collision process by corputing
the temperature of an equilibrium gas in which the mean square
relative velocity between two molecules is taken equal to tne
mean square relative velocity of a free stream molecule with
respect to a molecule emitted from the surface; i.e. in a
general equilibrium case
9' C1 2+ 2 = 2(3RT )g 1 eq
In the situation described here,
(. - )2 = U2 + 2U C + C2,I r CO co r rx
-23 -
which is the mean square relative velocity for the collision
geometry considered. Equating the two allows one to define an
equivalent temperature for the collision process which is
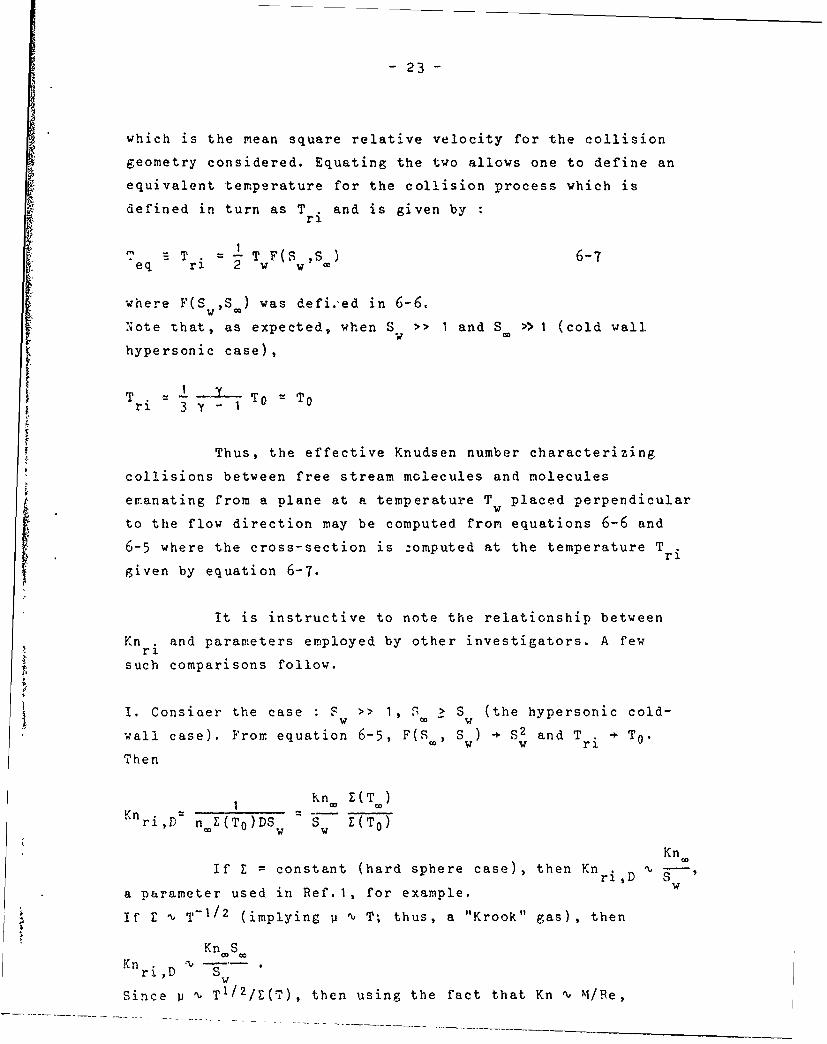
defined in turn as Tri and is given by
T T =-1 T F(S ,S 6-7eq ri 2 w w cc
where F(S ,S) was defi.'ed in 6-6.
:ote that, as expected, when S >> I and S > 1 (cold wall
hypersonic case),
T To = To
Thus, the effective Knudsen number characterizing
collisions between free stream molecules and molecules
eranating from a plane at a temperature T placed perpendicularw
to the flow direction may be computed from equations 6-6 and
6-5 where the cross-section is zomputed at the temperature Tri
given by equation 6-7.
It is instructive to note the relationship between
Kn and parameters employed by other investigators. A few
such comparisons follow.
I. Consiaer the case : S >> 1, S, a S (the hypersonic cold-
wall case). From equation 6-5, F(S., S) S2 and T + To.w w riThen
n nKn Z(T.)KnriD- n Z(T0 )DS S (T0 )
w
KnIf E = constant (hard sphere case), then Kn riD S-
a parameter used in Ref.1, for example. w
If Z v T-1/2 (implying -. ' ' T; thus, a "Krook" gas), then
Kn SKn . ' _ 'ri,D SwSince Di % Tl/2iZ(T), then using the fact that Kn "% M/.e,
- 24-
it is seen that Kn the correlation employedri,D Reo T 0
in Ref. 9.
II. Next, consider the case : S 'n 1 (the hypersonic hot wall
case). From equation 6-5, F(S , S ) 1 1 as long as S > S
and T ri- T- To when S. >> 1. Then
I E ( T )
K n riD1 n _
nri,D nZ(T )D nE(T@ w w;
If E = constant, then Kn ri,!- Kn..
If E T- 1/2, then Kn D Kn -Hw; but since T T•ri ,D - f T W w 0
when S '% 1 if S >> 1, it follows that KniD - Kn ,?4,, Thus,it is readily seen that the effective correlation parameter for
this problem, restricting our attention to the hypersonic case,
may be expressed as the product of Kn and a quantity which
will vary from 1/S to S IS to 1 to S, derending on the
temperature dependence of the collision cross section and the
relative magnitude of S compared to unity.
It is seen that the effective Knudsen number defined
in 6-I reduces to the conventional forms of Kn (or Re) under
certain limiting conditions. Therefore, it is clear that a
realistic temperature-dependent cross section must be incorporated
ir any such correlation paramp if a wide variety of data
representing many distinctly different flow conditions are to
be adequately correlated.
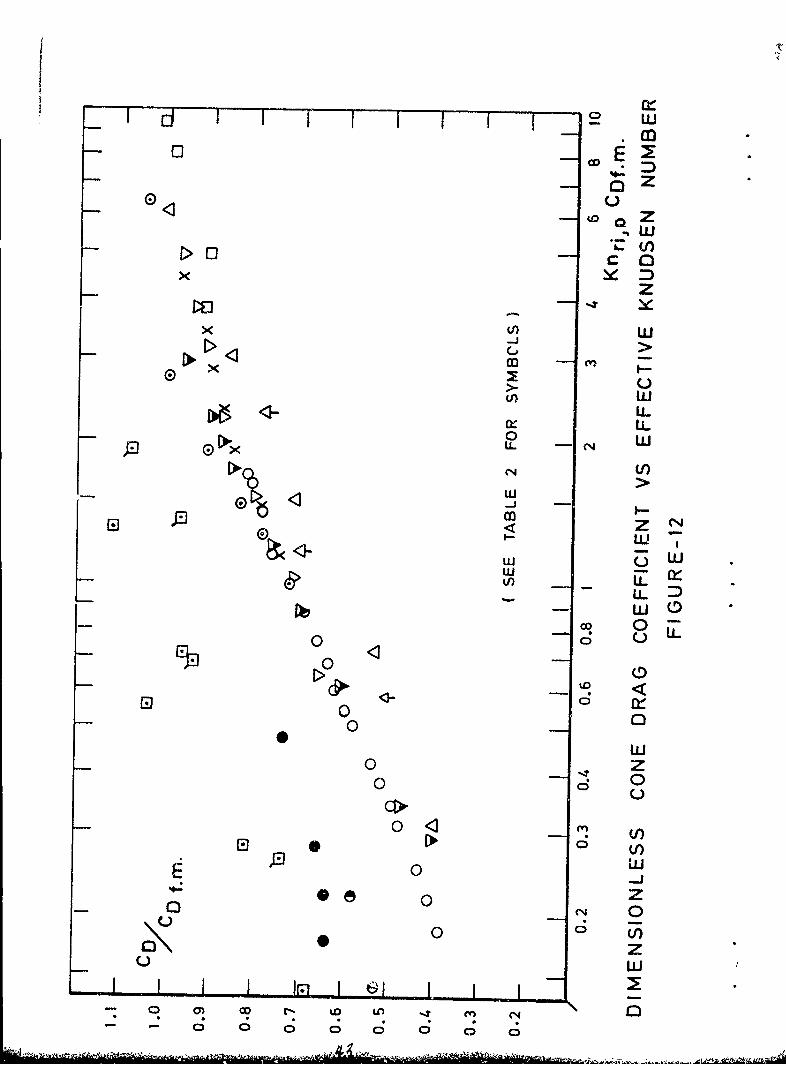
A limited amount of slender sharp cone drag data
has been plotted in terms of Kn ri,D CDf.m. on Figure 12. The
symbols are defined in Table 2. The wall speed ratios vary from
1.5 to 10, y from 1.30 (CO2 ) to 1.67(A), M from 3.7 to 24,
and 0 from 60 to 150.* c

- 25 -
A word of caution must be expressed (and possibly
an apology as well) regarding the translation of data,
originally expressed in terms of Kn., Re w, etc., into Knri,D"
In some cases, a bit of guessing as to the values of unspecified
flow or model conditions was required to effect the transformation.
In other cases, certain flow conditions were recomputed; e.g.,
Geigers values of Re in Ref.10 were recalculated because
the Sutherland viscosity law used therein is well known to
be incorrect at values of T below 50 0 K. The Chapman-Enskog
viscosity with temperature-dependent cross sections (Ref.6)
was employed in all data manipulation for consistancy. In
addition, the data of Kussoy et al (Ref.12) was actually taken
from the graphs of Ref. 1.
The results in Figure 12 are not as strikingly clear
as in Ref.7 for sphere arag where much more data were available.
In that case, it was found that data for different y's and
*4 's fell on a single curve for a riven value of S and thatCO was Sw increased, CD /Crf.m. increased for a fixed value of Kn
Here the same trend can be inferred only if Geiger's data are
ignored. It should be mentioned that Willis' theoretical
predictions (Ref.1) lie above Geiger's results, below the results
of Jones and Miller (Ref. 11), and generally somewhat below
the results of Kussoy, et al. (Ref. 12). Willis' theory also
predicts the same variation of CD wm" wI
here.
A close inspection of Figure 12 illustrates that the
quantity Knri,D C is a useful correlation parameter.D f.m.
This asser.ion is borne out when three sets of data for nearly
the same S are plotted in Figure 13. Note that although yw
varies from 1.3 to 1.6 ' and M varies from 3.7 to 11.5, a
satisfactory corre)ation is achieved. It might even be
argued that the C02 date- of Sims (Pef. 13) would be expected to
lie somewhat above the other data because the cone half-angle
in Sims' case is somewhat smaller (100) than the other cases
(13.50) - again a trend predicted by Willis' theory.
- 26 -
7. SUMMARY
Drag coefficients for sharp 90 cones have been
experimentally determined in the hypersonic hot-wall regime
at nominal Mach numbers of 6,8 and 10. The results are in
satisfactory agreement with the data of other investigators
and with Willis' theory for the near-free molecule regime.
Cones with a bluntness ratio of 0.3 exhibit slightly smaller
values of CD at otherwise identical conditions.
The correlation parameter Knri, successfully employed
foi blunt bodies, appears to correlate data in the transitional
and near-free molecule regimes for varying Mach numbers and specific
heat ratios if the wall speed ratio is constant.
More precise data on slender cones are required in
the cold-wall regime before a more definitive statement can be
made regarding the adequacy and limits of applicability of
this parameter.
r 27 -
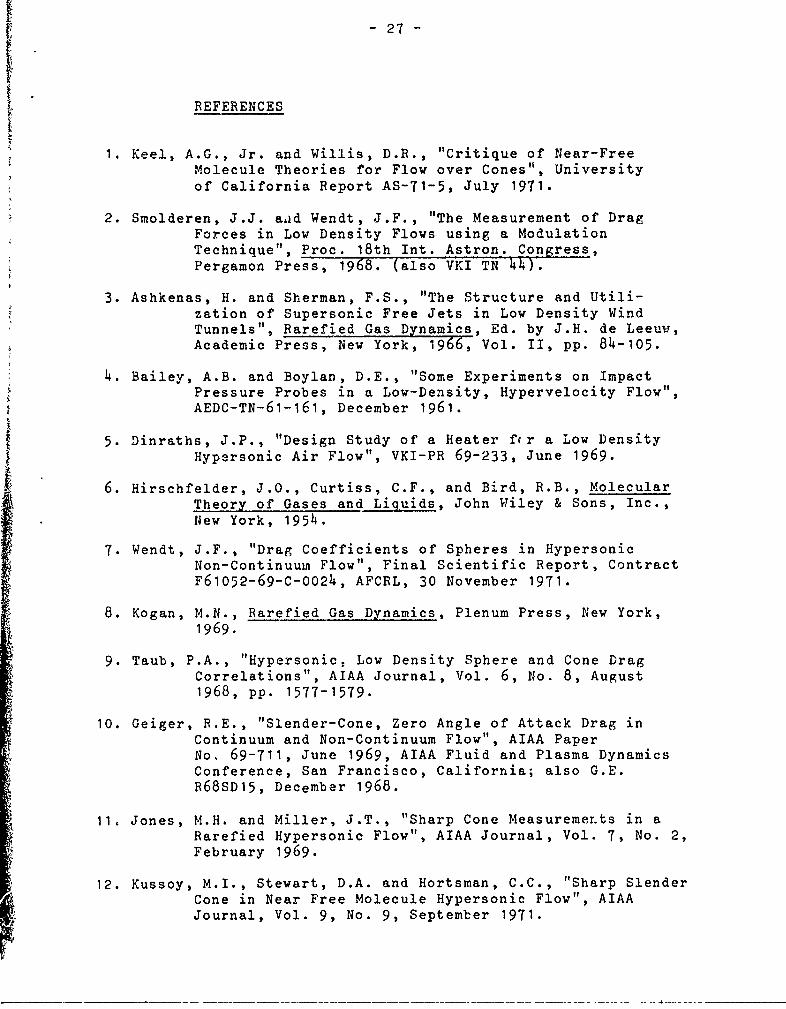
REFERENCES
1. Keel, A.G., Jr. and Willis, D.R., "Critique of Near-FreeMolecule Theories for Flow over Cones", Universityof California Report AS-71-5, July 1971.
2. Smolderen, J.J. aad Wendt, J.F., "The Measurement of DragForces in Low Density Flows using a ModulationTechnique", Proc. 18th Int. Astron. Congress,Pergamon Press, 1968. (also VKI TN 44).
3. Ashkenas, H. and Sherman, F.S., "The Structure and Utili-zation of Supersonic Free Jets in Low Density WindTunnels", Rarefied Gas Dynamics, Ed. by J.H. de Leeuv,Academic Press, New York, 1966, Vol. II, pp. 84-105.
4. Bailey, A.B. and Boylan, D.E., "Some Experiments on ImpactPressure Probes in a Low-Density, Hypervelocity Flow",AEDC-TN-61-161, December 1961.
5. Dinraths, J.P., "Design Study of a Heater fcr a Low Density
Hypersonic Air Flow", VKI-PR 69-233, June 1969.
6. Hirschfelder, J.O., Curtiss, C.F., and Bird, R.B., MolecularTheory of Gases and Liquids, John Wiley & Sons, Inc.,Hew York, 1954.
7. Wendt, J.F., "Drag Coefficients of Spheres in HypersonicNon-Continuum Flow", Final Scientific Report, ContractF61052-69-C-0024, AFCRL, 30 November 1971.
8. Kogan, M.N., Rarefied Gas Dynamics, Plenum Press, New York,1969.
9. Taub, P.A., "Hypersonic. Low Density Sphere and Cone DragCorrelations", AIAA Journal, Vol. 6, No. 8, August1968, pp. 1577-1579.
10. Geiger, R.E., "Slender-Cone, Zero Angle of Attack Drag inContinuum and Non-Continuum Flow", AIAA PaperNo, 69-711, June 1969, AIAA Fluid and Plasma DynamicsConference, San Francisco, California; also G.E.R68SD15, December 1968.
11. Jones, M.H. and Miller, J.T., "Sharp Cone Measurements in a
Rarefied Hypersonic Flow", AIAA Journal, Vol. 7, No. 2,February 1969.
12. Kussoy, M.I., Stewart, D.A. and Hortsman, C.C., "Sharp SlenderCone in Near Free Molecule Hypersonic Flow", AIAAJournal, Vol. 9, No. 9, September 1971.

S- 28-
13. Sims, W.H., "Drag Coefficients of Sharp and Blunt Cones inHighly Rarefied, Supersonic Flow", Rarefied GasDynamics, Sixth Symposium, Supplement 5, AcademicPress, New York, 1969.
14 . Keel, A.G., Jr., Kraize, L.G., PassLore, R.D., and Zapata,R.N., "Hypersonic Low Density Cone Drag", AIAA Paper
No. 71-133, Jan. 1971, AIAA 9th Aerospace SciencesMeeting, New York.
15. Smolderen, J.J., Wendt, J.F., Naveau J., and Bramlette, T.T.,"Sphere and Cone Drag Coefficients in HypersonicTransitional Flow", Rarefied Gas Dynamics, SixthSymposium, Supplement 5, Vol. 1, Academic Press,New York, 1969, pp. 903-907.

- 29 -
TABLE 1
Cone Drag Coefficients - VKI Data
A. Half Angle - 9' (sharp), T o = T = 293 0 KGas-Air,
Symbol Re Kn C D/C Df.m CDw,2. m,D D .D f.m.
2.97 1.20 0.820 2.344.22 0.850 0.795
m. = 6.0 5.24 0.684 o.*765Sw = 1.75 6.60 0.542 0.745
7.78 o.46o 0.73511.1 0.322 o.68511.8 0.304 0.67513.5 0.265 0.66517.4 0.206 0.61521.5 o.167 0.58025.3 0.141 0.39031.4 0.114 0.36541.6 0.0860 0.34052.2 0.0685 0.320
X 3.84 0.725 0.975 2.224.94 0.564 0.920
M"" = 8.1 6.05 0.460 0.900Sw = 1.80 7.15 0.388 0.875
8.85 0.314 o.85011.6 0.239 0.79014.7 0.189 0.755
3.03 0.916 1.04 2.223.78 0.736 1.02
m. = 8.1 4.87 0.571 0.955
Sw = 1.80 5.84 0.476 0.9508.82 0.315 0.92011.6 0.240 0.85014.7 0.189 0.820
13 1.78 1.28 1.02 2.192.07 1.10 0.990
M = 10.4 3.42 0.665 0.910Sw = 1.83 4.31 0.527 0.925
1.84 1.23 1.01 2.192.36 0.963 0.925
m= 10.4 3.25 0.698 0.830Sw = 1.83 4.25 0.535 0.860
- 30 -
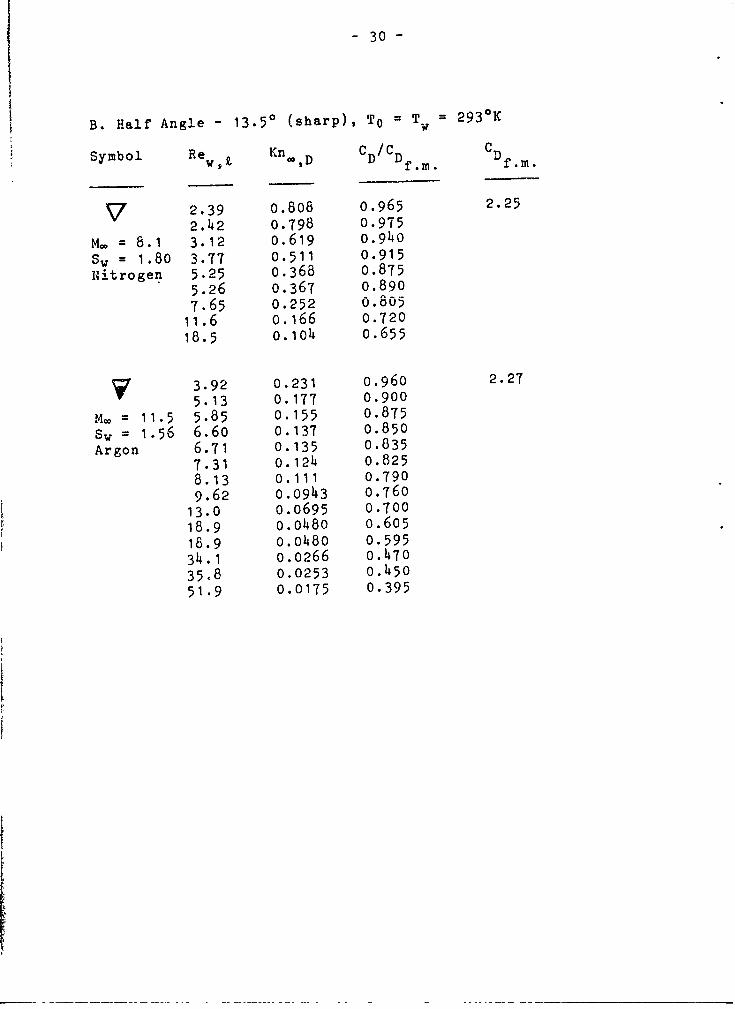
B. Half Angle - 13.50 (sharp), To = Tw = 2930 K
Symbol Re KnD CD/C CSbo ReDDf.m. f.m.
'7 2.39 0.808 0.965 2.25
2.42 0.798 0.975
M. = 8.1 3.12 0.619 0.94o
Sw = 1.80 3.77 0.511 0.915Nitrogen 5.25 0.368 0.875
5.26 0.367 0.890
7.65 0.252 0.805!1.6 o.166 0.720
18.5 0.104 0.655
3.92 0.231 0.960 2.27
5.13 0.177 0.900
M = = 11.5 5.85 0.155 0.875Sw = 1.56 6.60 0.137 0.850
Argon 6.71 0.135 0.835
7.31 0.124 0.825
8.13 0.111 0.790
9.62 0.0943 0.760
13.0 0.0695 0.70018.9 0.0480 0.60518.9 o.0480 0.59534.1 0.0266 0.47035.8 0.0253 o.45051.9 0.0175 0.395
- 31 -
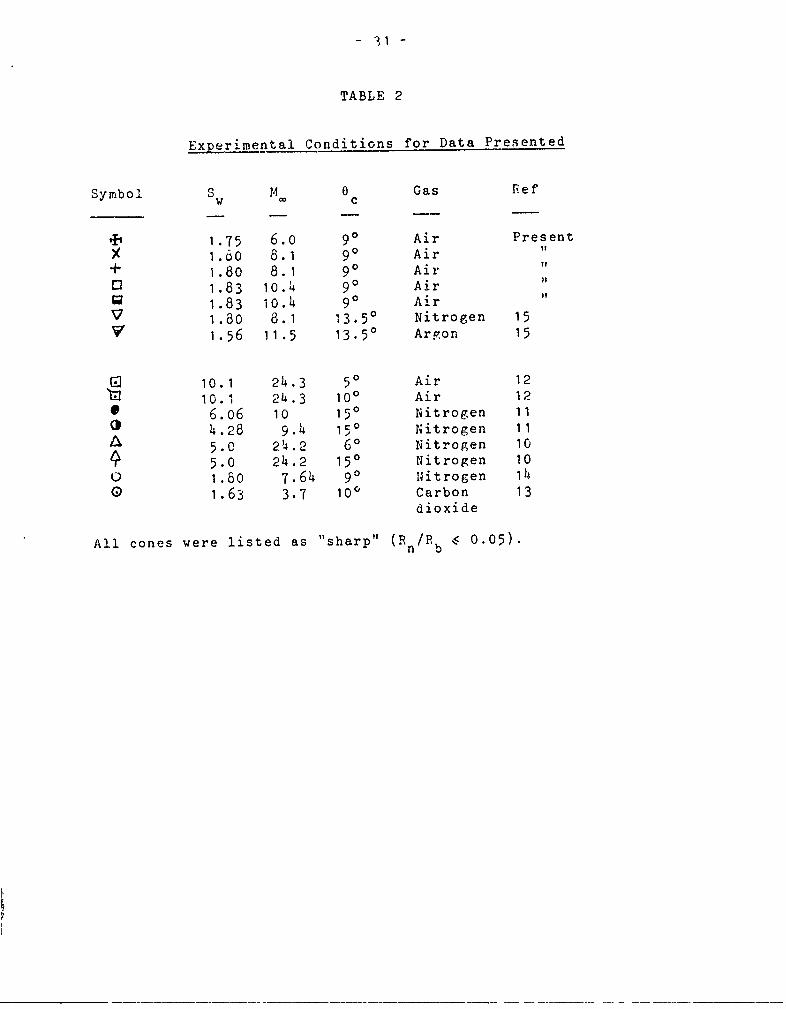
TABLE 2
Experimental Conditions for Data Presented
Symbol Sw 0 Gas Ref
1.75 6.0 90 Air Present
X 1.60 8.1 90 Air "
+ 1.80 8.1 90 Air "
[O 1.83 io.h 90 Air i
1.83 io.h 90 Air
1.80 8.1 13.5 ° Nitrogen 151 .56 11.5 13.50 Argon 15
10.1 24.3 50 Air 12
10.1 24.3 100 Air 12
* 6.06 10 150 Nitrogen 114.28 9.4 150 Nitrogen 115.0 21.2 60 Nitrogen 10
5.0 24.2 150 Nitrogen 10
U 1.80 7.64 9 ° Nitrogen 140 1.63 3.7 100 Carbon 13
dioxide
All cones were listed as "sharp" (Rn/. b < 0.05).

0
0 U>5 0
w0
uii
0
0-Tu-y u
Lii 0:
w l -j
_ u.~~~~1 ZA-f~. .
0
- O

wJz0
Go
E
z
0 3:
0- in
zz
0Lu E-
L() a 0 0
Q< 0
LLua.
C4)
zu Lu
00
0 CLu
rt)

z
U-J
uzow
0
En 0
ww 0 L0
oN L
0 L0oL 0w z
)CL(
a_ I
LL

'1
0
K<
t vi
0!
o 1N 0coC(M CD n
ci cs C30801 C11c~JVI 01 INO4
inaino =o oua (1ZIIV48J
x x
ORIFiCE
BARREL SHOCK
JET BOUNDARY
-2L-~12
- ~J 10
44
10L ~ ~ i~0 2 4. 6 B 10 12 14. 16 18 20 22 24.
CHARACTERISTICS OF FREE JET
EXPANSION FOR HYPERSONIC FLOWFIGURE 5
Q /Uw2
0 I:
w uw
UJ-J
0
z0
0- ttJ0 0D 0 x
z a:0
IX Vwu u wLw : :C< j . <wCLL
0 4 U
<') Q U

C)w
'U-
LUJ
0
I- 0LL
tJY)
U.,-
zz
LU.
IL

8
6- THEORY (REF 3)
VALID FOR X/D I 2.54-
DATA UNCORRECTED FORPROBE VISCOUS EFFECTS
2 AND SHOCK STAND - OFF
oV10
Cv
4 -6
4 -
E
-210 Po, TORR To, K
8 X 49 300
6 0 25 300
v 7 300
4 26 1000 o_._1 2 3 4 5 6 7 8 9 10
x/D
Fig.8 IMPACT PRESSURE VARIATION IN FREE JET
Fi
-310! .
2
di I
*- T0H-EORY FOR _ -
*GAS: AIR 0Po - 0
T o :300 K
Symbol P0 (rorr) P0 / Pci yrm 10 t)131 3300 38.5321600 27
10
0 10 20 30 4.0 s0 60DIMENSIONLESS AXIAL DISTANCE X/D
DENSITY VARIATION ON FREE JETCENTERLINE MEASURED WITH ELECTRON
BEAM FLOURESCENCE PROBEFIGURE-9
.1/ !
- 3

z
- + Di- -w
o : + D
Ij I
I] /CDI
IN / I
+4 -
0LL
+/0
Do,,
D + ++ LLJ 0n
Do)
(n )
NI z
00I,
, z

I j I - w-~im
8 zC
~z
0 -. w
E) 0 UU)
N >- >
x C
'10 0G* C00
U)ww
x I-.8
0~
0
WocD" 0 0L
0 1 :
0 0 zCO. 0 0n
0 CD
0
0 VZC~) 0
G! OR U? 0
4D
C
zL~J -I
(I) >>
-JcJU
ILL
LLLL
E)J -L I0 E;
oD 0
0 0 i
0 w
00
0 0
z
0) 0 D C- t~o LO -2 mVC; * C ;

0(1
0
0
0 0
U) zw
oo 0
-z 0
0 D D- LL
Do, ~ V> -
wsw 0
E)U )E w
00
Lo 0Z
0
Related Documents