VULNERABILITY TO CHILDHOOD DEPRESSION: RACE AND AGE DIFFERENCES Kristen M. Longmire A Thesis Submitted to the University of North Carolina at Wilmington in Partial Fulfillment Of the Requirements for the Degree of Master of Arts Department of Psychology University of North Carolina Wilmington 2005 Approved by Advisory Committee Anne Hungerford, Ph.D. William Overman, Ph.D. Caroline Clements, Ph.D. Chair Accepted by Robert Roer, Ph.D. Dean, Graduate School

Welcome message from author
This document is posted to help you gain knowledge. Please leave a comment to let me know what you think about it! Share it to your friends and learn new things together.
Transcript

VULNERABILITY TO CHILDHOOD DEPRESSION: RACE AND AGEDIFFERENCES
Kristen M. Longmire
A Thesis Submitted to theUniversity of North Carolina at Wilmington in Partial Fulfillment
Of the Requirements for the Degree ofMaster of Arts
Department of Psychology
University of North Carolina Wilmington
2005
Approved by
Advisory Committee
Anne Hungerford, Ph.D. William Overman, Ph.D.
Caroline Clements, Ph.D.Chair
Accepted by
Robert Roer, Ph.D.Dean, Graduate School

ii
TABLE OF CONTENTS
ABSTRACT........................................................................................................................ v
ACKNOWLEDGMENTS ................................................................................................. vi
DEDICATIONS................................................................................................................ vii
LIST OF TABLES........................................................................................................... viii
INTRODUCTION .............................................................................................................. 1
Depression............................................................................................................... 1
Child and Adolescent Depression........................................................................... 1
Child and Adolescent Risk Factors......................................................................... 2
Recognizing and Diagnosing Depression in Children and Adolescents................. 3
Ethnicity/Race and Depression ............................................................................... 4
Ethnic/Racial Differences in Adult Depression...................................................... 5
Ethnic/Racial Differences in Child/Adolescent Depression ................................... 6
African-American and Caucasian Samples ................................................ 6
Other Child Samples ................................................................................... 7
Attributional Style and Childhood Depression ..................................................... 10
Attributional Style Predicting Childhood Depression: Prospective Designs........ 11
Test of the Hopelessness Theory in 3rd and 7th graders ........................................ 11
Diathesis-Stress Component ..................................................................... 11
Parent-Child Correlations ..................................................................................... 12
Rationale for Current Study.................................................................................. 13
Hypotheses............................................................................................................ 14
iii
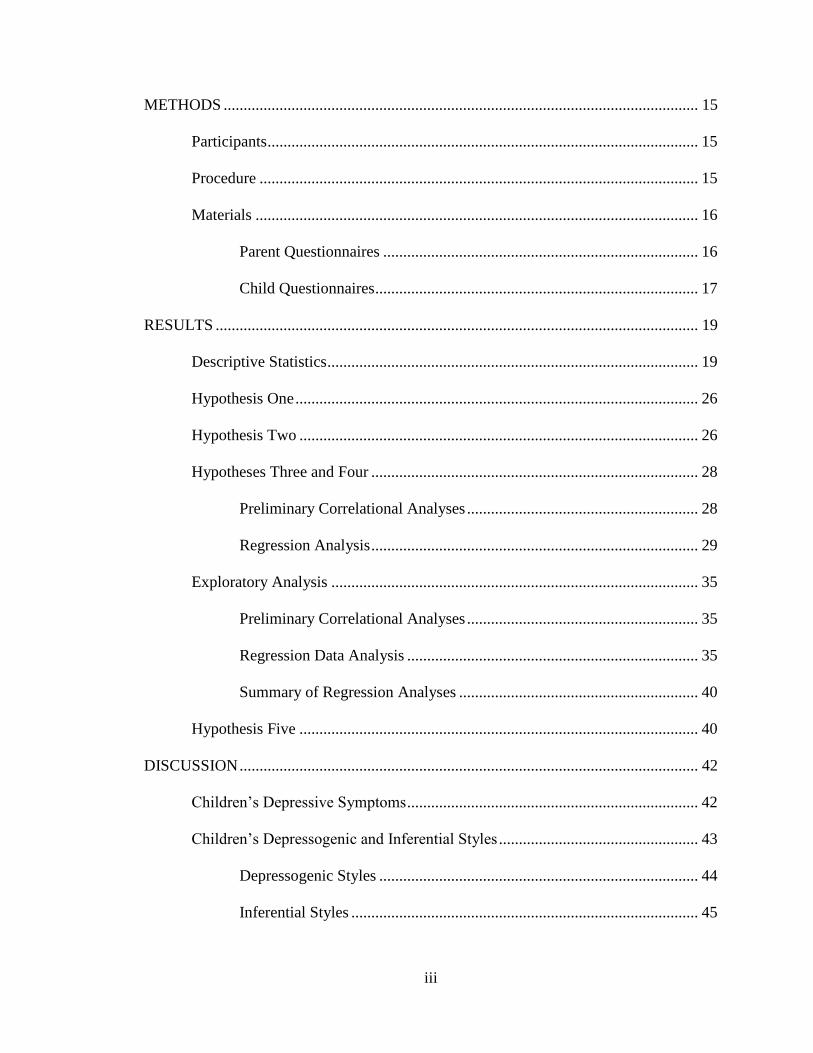
METHODS ....................................................................................................................... 15
Participants............................................................................................................ 15
Procedure .............................................................................................................. 15
Materials ............................................................................................................... 16
Parent Questionnaires ............................................................................... 16
Child Questionnaires................................................................................. 17
RESULTS ......................................................................................................................... 19
Descriptive Statistics............................................................................................. 19
Hypothesis One..................................................................................................... 26
Hypothesis Two .................................................................................................... 26
Hypotheses Three and Four .................................................................................. 28
Preliminary Correlational Analyses .......................................................... 28
Regression Analysis.................................................................................. 29
Exploratory Analysis ............................................................................................ 35
Preliminary Correlational Analyses .......................................................... 35
Regression Data Analysis ......................................................................... 35
Summary of Regression Analyses ............................................................ 40
Hypothesis Five .................................................................................................... 40
DISCUSSION................................................................................................................... 42
Children’s Depressive Symptoms......................................................................... 42
Children’s Depressogenic and Inferential Styles.................................................. 43
Depressogenic Styles ................................................................................ 44
Inferential Styles ....................................................................................... 45

iv
Racial Differences..................................................................................... 46
Predictors of Child Depression ............................................................................. 48
Younger Children...................................................................................... 48
Older Children .......................................................................................... 50
Clinical Implications............................................................................................. 53
Limitations ............................................................................................................ 55
REFERENCES ................................................................................................................. 56

v
ABSTRACT
This study examined race and age differences inchildren’svulnerability to
depression, negative life events, and negative attributional styles to explain these events..
The relationship between parent-child depression and explanatory styles was also
assessed. There were no significant age or race differences in depression. There were no
significant racial differences in attributional or inferential styles. Younger children
reported more internal and global attributional styles than older children. Younger
children reported the consequences of negative life events as more disastrous than older
children. In younger Caucasians, negative life events were the only predictors of
depression in the equations assessing the role of attributional styles and stress in
predicting depression. In older Caucasians, STAGLO predicted depression. In the
equations assessing the role of inferential styles and stress in predicting depression, there
was a significant consequence-stress interaction in older Caucasians. In older African-
Americans, only stress predicted depression. In younger African-Americans, no
cognitive style predicted depression. When groups were collapsed across race, negative
life events and STAGLO were the only predictors of depression in the equations
assessing attributional style and stress. The interaction terms were not significant. For
equations assessing the role of event consequences and stress, there was a significant
consequence-stress interaction in both age groups. Higher depression scores in parents
were associated with higher child depression, more internal child attributions, and a
greater tendency for the child to view the self as flawed.

vi
ACKNOWLEDGMENTS
Much appreciation goes to my major advisor, Dr. Caroline Clements, who has
provided me with encouragement, enthusiasm, and knowledge throughout my graduate
career. I am thankful for all that she has taught me, both professionally and personally.
My thanks also go to the members of my committee, Dr. Anne Hungerford and
Dr.William Overman, for their suggestions and continuing support. I would also like to
thank the following agencies for assistance in this study: The Brigade Boys and Girls
Club, The Community Boys and Girls Club, Wesley Memorial Methodist Church, and
Southeastern Pre-School Educational Center. Finally, I would like to extend a special
thanks to all past and present members of the ‘grant’ lab for their assistance, guidance,
and friendship.
vii
DEDICATIONS
I would like to dedicate this thesis to my parents, Peggy and Michael Longmire,
who have provided me with a lifetime of encouragement. I would also like to dedicate
this thesis to my best friend and fiancée, Jeff Lewis, whose constant love and support
have meant the world to me.

viii
LIST OF TABLES
Table Page
1. Chi-Square Analyses for Gender and SES by Group ...........................................21
2. Adult Demographic Characteristics: Percentages ................................................22
3. Means and Standard Deviations for Child Depression, Stress, Attributional
Style Scores by Group ...........................................................................................24
4. Number of Children Meeting Depression Levels by Group..................................25
5. Means and Standard Deviations for Parent Depression and Attributional
Style Scores............................................................................................................27
6. Summary of Hierarchical Regression Analysis for Variables Predicting
Depression in Older Caucasian Children...............................................................32
7. Summary of Hierarchical Regression Analysis for Variables Predicting
Depression in Younger Caucasian Children ..........................................................34
8. Summary of Hierarchical Regression Analysis for Variables Predicting
Depression in Younger Children ...........................................................................37
9. Summary of Hierarchical Regression Analysis for Variables Predicting
Depression in Older Children ................................................................................39
10. Correlations for Child and Parent Depression and Attributional
Style Measures .......................................................................................................41

INTRODUCTION
Depression
Over 20 million American adults are diagnosed with a depressive disorder each
year. This includes almost ten million diagnoses of major depression and over ten million
diagnoses of dysthymic disorder. Twice as many women as men are affected by
depression (National Mental Health Association, 2004). Depression places tremendous
psychological and physical burdens on those suffering and causes enormous strains on
the economy. Followed by heart disease it is expected to be the second most serious
world health problem by 2020 (World Health Organization, 2004). Approximately 43.7
billion dollars per year are spent in the U.S. on depressive disorders. Most financial cost
is due to job loss, but 12.4 billion dollars are spent on healthcare (Berto, D’llario, Ruffo,
Di-Virgilio, & Rizzo, 2000).
Child and Adolescent Depression
Child and adolescent depression has garnered more clinical attention in recent
years (Weiss, Weisz, Politano, & Carey, 1991). Depression is being diagnosed in
younger populations in increasing rates (Birmaher, Brent, & Benson, 1998). Up to 20%
of adolescents have experienced at least one depressive episode and over 2% of young
children receive this diagnosis (Birhamer, Ryan, Williamson, & Brent, 1996). At any
given time, 10-15% of children and adolescents will report moderate to severe depression
(Smucker, Craighead, & Green, 1986). According to one study, the average length of a
child or adolescent depressive episode is approximately one year (Kovacs, Obrosky,
Gatsonis, & Richards, 1997). Approximately 7 percent of adolescents diagnosed with
major depression commit suicide in adulthood (Weissman, Wolk, & Goldstein, 1999).

2
Suicide was the 3rd leading cause of death in 10-24 year olds in 1997 (Center for Health
Statistics, 1997).
The age of first depression diagnosis in children is decreasing, highlighting the
importance of research on younger populations (Lewinsohn, Rohde, Steeley, & Fischer,
1993). A study by the National Institute of Mental Health showed that over the last 40
years, the average age at first depressive episode has decreased by ten years (NIMH,
2002). Although recovery from a single episode of major depressive disorder in
childhood is high, recurrence is extremely likely (Lewinsohn, Clarke, Seeley, & Rohde,
1994). One study reported a 70% recurrence rate of major depressive disorder in children
(Kovacs, 1996). In samples of adults diagnosed with recurrent major depressive disorder,
up to 40% have onset in childhood. A more recent longitudinal study reported a strong
association between early-onset childhood depression, recurrence, and continuing
diagnoses in adulthood (Weissman, Wolk, & Goldstein, 1999).
Child and Adolescent Risk Factors
Risk factors for childhood depression include family history and depression
severity (Harrington, Rutter, Weissman, & Fudge, 1997; Weissman, et al., 1999).
According to one report, children of depressed parents are three times more likely to
experience depression themselves (U.S. Surgeon General, 1999). Gender does not appear
to be a risk factor in young children as equal numbers of males and females are
diagnosed. There is a rapid increase in depressive symptoms in females starting in
adolescence (Angold & Rutter, 1992; Angold, Costello, & Worthman, 1998; Buchanan,
Eccles, & Becker, 1992; Lewinsohn, Rohde, Seeley, & Fischer, 1993; Nolen-Hoeksema,
1994). One large meta-analysis reported a dramatic increase for girls in the transition

3
from childhood to adolescence with depression scores highest after age 14 (Twenge &
Nolen-Hoeksema, 2002).
The mechanisms underlying this increase are not well understood, but it is likely
to involve a variety of processes. Physiological changes in puberty may increase a
female’s risk for depression. One study found that pubertal status was the best predictor
of depression for females but not males (Angold, Costello, & Worthman, 1998). Another
study assessing almost 3,000 adolescent girls found that at each age, post-menarcheal
girls had the highest depression rates and menarcheal stage was a better predictor of
depressive symptoms than chronological age (Patton, Hibbert, & Carlin, 1996).
Other theorists emphasize socio-cultural precursors to depression. A female’s self
image appears to become increasingly more negative in the transition to adolescence,
whereas a male’s image remains more stable (Seligman, 1989). In one study, female
adolescents were significantly more likely than boys to report not liking their looks
(Kanner, Feldman, Weinberger, & Ford, 1987). Rao (1999) found that managing the
demands of academics and relationships was more stressful for female adolescents than
for males. Nolen-Hoeksema (1987) found that girls were more likely than boys to use
rumination as a coping strategy for stressful events and that dwelling on negative events
accounts for higher depression rates in girls.
Recognizing and Diagnosing Depression in Children and Adolescents
At one time scientists did not believe children and younger adolescents had a
strong enough sense of “the self” to feel depressive symptoms (National Institute of
Mental Health, 2002). Current research demonstrates that children show the full
spectrum of adult depressive disorders (Voelker, 2003). Moreover, the basic diagnostic

4
criteria for depression are the same for children, adolescents, and adults. Common
features include symptoms such as sad mood, loss of interest in activities, and loss of
energy.
Recognizing and diagnosing childhood depression may be more difficult because
the way that symptoms are expressed may vary with developmental stage. Younger
children may have a harder time describing depressive symptoms (Birmaher, et al., 1998;
Ryan, Puig, & Ambrosini, 1987). Further, parents may have a difficult time recognizing
major depression in younger children, misattributing depressive symptoms to
disobedience (Fleming & Offord, 1990).
Depressive symptoms co-occur with attention, anxiety, and conduct disorders,
further clouding the diagnostic picture. A younger child may have more trouble
communicating emotional pain, so symptoms more common in depressed children and
adolescents such as irritability, hostility, and boredom may be misdiagnosed as
externalizing disorders rather than depression (National Institute of Mental Health, 2002).
One study showed that children suffering from major depression were less likely to
experience common adult symptoms such as weight loss and hypersomnia. These
children displayed symptoms such as low self-esteem and impaired self-control (Kaslow,
Rehm, & Siegel, 1984).
Ethnicity/Race and Depression
Just as researchers are beginning to examine age related differences in depression,
they are also beginning to acknowledge that depression may manifest itself differently in
different ethnic groups (National Advisory Mental Health Council, 1998). The addition
of race and ethnicity as variables in depression research has grown in recent years (Senior
5
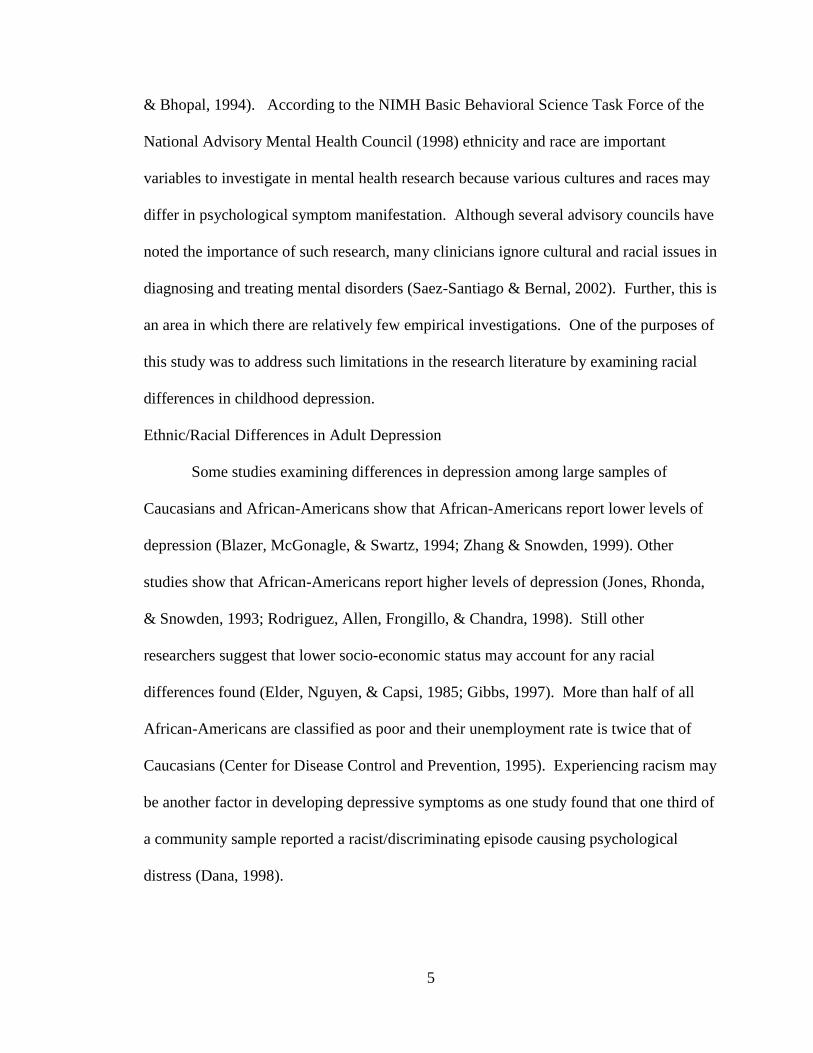
& Bhopal, 1994). According to the NIMH Basic Behavioral Science Task Force of the
National Advisory Mental Health Council (1998) ethnicity and race are important
variables to investigate in mental health research because various cultures and races may
differ in psychological symptom manifestation. Although several advisory councils have
noted the importance of such research, many clinicians ignore cultural and racial issues in
diagnosing and treating mental disorders (Saez-Santiago & Bernal, 2002). Further, this is
an area in which there are relatively few empirical investigations. One of the purposes of
this study was to address such limitations in the research literature by examining racial
differences in childhood depression.
Ethnic/Racial Differences in Adult Depression
Some studies examining differences in depression among large samples of
Caucasians and African-Americans show that African-Americans report lower levels of
depression (Blazer, McGonagle, & Swartz, 1994; Zhang & Snowden, 1999). Other
studies show that African-Americans report higher levels of depression (Jones, Rhonda,
& Snowden, 1993; Rodriguez, Allen, Frongillo, & Chandra, 1998). Still other
researchers suggest that lower socio-economic status may account for any racial
differences found (Elder, Nguyen, & Capsi, 1985; Gibbs, 1997). More than half of all
African-Americans are classified as poor and their unemployment rate is twice that of
Caucasians (Center for Disease Control and Prevention, 1995). Experiencing racism may
be another factor in developing depressive symptoms as one study found that one third of
a community sample reported a racist/discriminating episode causing psychological
distress (Dana, 1998).

6
African-Americans share similarities with Caucasians such as language and this is
an advantage in using African-Americans as a comparison group (Anderson & McNeilly,
1991). Major limitations in researching minorities of other ethnicities include language
and cultural barriers. There has been little research comparing Hispanics to other racial
groups. The National Comorbidity Survey (1994) indicated that Hispanics report more
depressive symptoms than Caucasians and African-Americans. Another adult study
found that major depression was more frequently reported in minority groups of
Hispanics and African-Americans than Caucasians (Dunlop, Song, Lyons, Manheim, &
Chang, 2003). Similar to African-Americans, higher rates of depression in Hispanics
may be due to lower socio-economic status and discrimination, in addition to
acculturative stress (Dana, 1998).
Ethnic/Racial Differences in Child/Adolescent Depression
African-American and Caucasian Samples
As with adults, most research focusing on ethnic/racial differences and depressive
symptoms in children and adolescents includes Caucasian and African-American children
but not other minority groups. Some studies indicate that African-American children
score higher on depression inventories than Caucasian children (Garrison, Jackson,
Martsteller, McKewown, & Addy, 1990; McDonald & Gynther, 1963). Others find no
significant differences (Helsel & Matson, 1984; Lubin & McCollum, 1994; Flannery-
Schroeder, & Kendall, 1995; Wrobel & Lachar, 1995). Kistner, David, and White (2003)
note that these inconsistencies may be due to varying age ranges, diagnostic measures,
and sample sizes used.
7
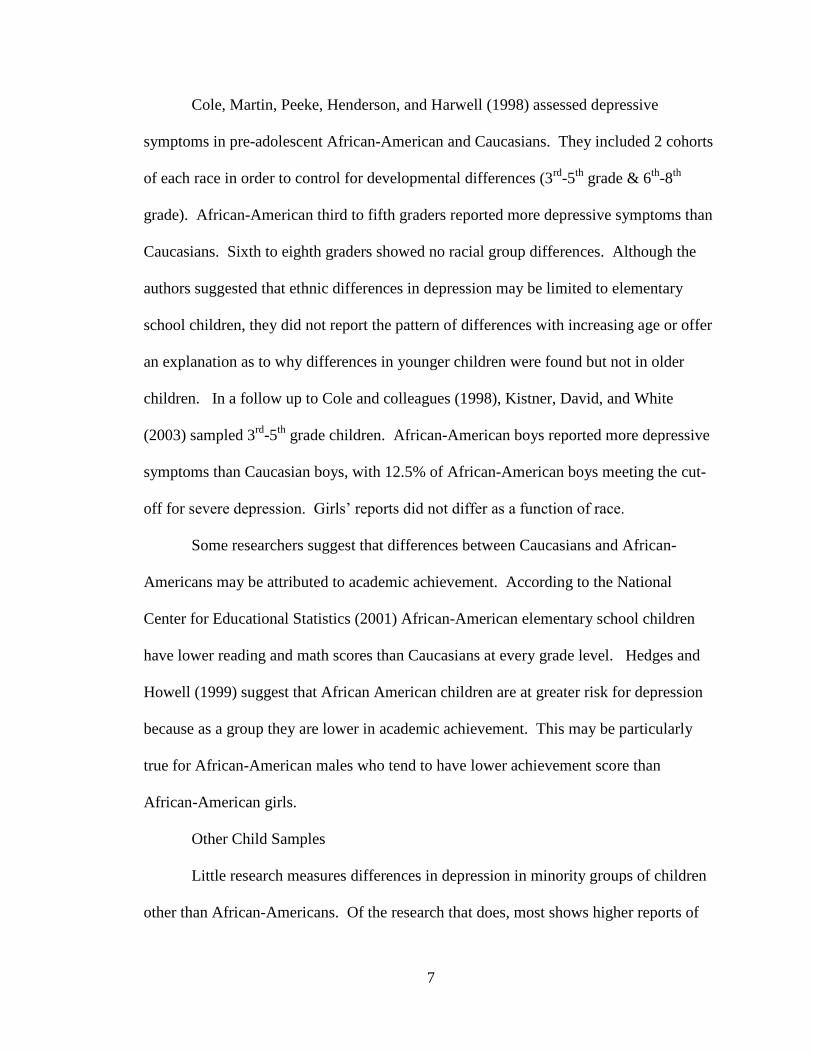
Cole, Martin, Peeke, Henderson, and Harwell (1998) assessed depressive
symptoms in pre-adolescent African-American and Caucasians. They included 2 cohorts
of each race in order to control for developmental differences (3rd-5th grade & 6th-8th
grade). African-American third to fifth graders reported more depressive symptoms than
Caucasians. Sixth to eighth graders showed no racial group differences. Although the
authors suggested that ethnic differences in depression may be limited to elementary
school children, they did not report the pattern of differences with increasing age or offer
an explanation as to why differences in younger children were found but not in older
children. In a follow up to Cole and colleagues (1998), Kistner, David, and White
(2003) sampled 3rd-5th grade children. African-American boys reported more depressive
symptoms than Caucasian boys, with 12.5% of African-American boys meeting the cut-
off for severe depression. Girls’ reports did not differ as a function of race.
Some researchers suggest that differences between Caucasians and African-
Americans may be attributed to academic achievement. According to the National
Center for Educational Statistics (2001) African-American elementary school children
have lower reading and math scores than Caucasians at every grade level. Hedges and
Howell (1999) suggest that African American children are at greater risk for depression
because as a group they are lower in academic achievement. This may be particularly
true for African-American males who tend to have lower achievement score than
African-American girls.
Other Child Samples
Little research measures differences in depression in minority groups of children
other than African-Americans. Of the research that does, most shows higher reports of
8
depressive symptoms in minority children. Roberts, Roberts, and Chen (1997) found that
African-American and Mexican American children in 6th through 8th grade displayed
significantly higher rates of depression than other ethnic groups. Schraedley, Gotlib, and
Hayward (1999) found significantly higher depression levels in Hispanic 9-12 year olds
compared to Caucasians of that age group. Hispanics and African-Americans were also
significantly more likely to report lower SES. The relationship between ethnicity and
depressive symptoms was the same for boys and girls. Higher life stress was also found
to be a psychosocial correlate to greater depressive symptoms.
In one review of the literature pertaining to poverty and depression in children,
African-American and Hispanic children reported more depressive symptoms than
Caucasians, but were also significantly more likely to report low SES (Samaan, 1998). In
another meta-analytic review including over approximately 60,000 children, Hispanics
reported more depressive symptoms than Caucasians and African-Americans (Twenge &
Nolen-Hoeksema, 2002). There were no significant relationships between self-reported
depressive symptoms and a child’s SES. This analysis included children and adolescents
ages 8-16 and did not separate the age ranges. It may have been helpful to have separated
age ranges in this analysis because of past research showing ethnic differences in younger
children (Cole, Martin, Peeke, Henderson, & Harwell, 1998; Kistner, David, & White,
2003).
Research on early childhood depression suggests that race and age may interact to
increase vulnerability to depression. This seems to be especially true in younger minority
children who seem most vulnerable. Because depression, age, and race are rarely studied
concurrently, one of the purposes of this study was to examine this interaction.

9
Hopelessness Theory of Depression
Numerous psychological, social, and biological theories have attempted to
account for vulnerability to depression (Allen-Meares, Colarossi, Oyserman, & DeRoos,
2003). One such theory is hopelessness theory, a cognitive vulnerability model of
depression. In this model, specific cognitive styles act as diatheses or vulnerability
factors for depression. Individuals showing such styles are more likely to become
depressed in the face of stress than individuals not showing such styles (Abramson,
Alloy, & Metalsky, 1989). Hopelessness theorists propose that such vulnerabilities are
learned in childhood, through exposure to aversive life circumstances (Rose &
Abramson, 1992). According to hopelessness theory the cognitive diathesis for
depression is a depressogenic causal attributional style. This attributional style consists
of the tendency to make internal, stable, and global causal inferences about the
occurrence of negative outcomes. Internal causal inferences are attributing negative life
events to the self. Stable causal inferences are viewing negative life events as permanent
or enduring. Global causal inferences are viewing negative events as spanning all
situations.
More recently Abela (2001) has proposed two additional cognitive diatheses for
depression in children; a depressogenic inferential style about the self, and a
depressogenic inferential style about the consequences of negative life events. The two
depressogenic inferential styles consist of the tendency to view the self as flawed and
deficient following negative events and to view the consequences of negative life events
as disastrous (Abela, 2001; Abramson et al., 1989).

10
There is a large body of research on the relationship between depressogenic
attributional styles, stress, and symptoms of depression in adults (Kwon & Laurenceau,
2002). Early cross-sectional studies found that internal, global, and stable attributions did
not predict depressive symptoms (Hunsley, 1989; Jacobson, 1987; Follette & Jacobson,
1987; Persons & Miranda, 1992; Ralph & Mineka, 1998; Robins & Hayes, 1995). More
recently, the importance of employing longitudinal designs to measure the interaction
between attributional style and life stress has become evident. Most support for
hopelessness theory comes from studies utilizing longitudinal designs (Alloy &
Clements, 1998; Alloy, 1997; Alloy & Abramson, 1999; Metalsky & Joiner, 1992;
Metalsky & Joiner, 1997). In one large study, cognitively high risk individuals with no
reports of major depressive disorder were significantly more likely over 5 years to
develop depressive episodes and recurrences than low risk individuals (Alloy &
Abramson, 1999). In another study, those with a more depressogenic style showed
greater increases in depressive symptoms over a 10 week time period (Kwon &
Laurenceau, 2002).
Attributional Style and Childhood Depression
A large number of cross-sectional studies involving children show significant
associations between depression and depressogenic attributional styles, with most
reporting a strong relationship (Seligman, Abramson, Semmel, &Von-Baeyer, 1984,
Joiner & Wagner, 1995). In one meta-analytic review involving almost 8,000 children,
internal, stable, and global attributions for negative life events were positively correlated
with depressive symptoms. Higher depressive symptoms were related to external,
unstable, and specific attributions for positive life events (Gladstone & Kaslow, 1995).

11
Another meta-analysis including more than 4,000 children found that a depressogenic
attributional style was clearly cross-sectionally related to depressive symptoms. This was
true across gender and sample type (Joiner & Wagner, 1995).
Attributional Style Predicting Childhood Depression: Prospective Designs
There are relatively few longitudinal studies assessing hopelessness theory in
children. Some studies report no association between depressogenic diatheses and
depression (Cole & Turner, 1995; Hammen, Adrian, & Hiroto, 1988). Others find strong
associations (Dixon & Ahrens, 1992; Hillsman & Garber, 1995; Panak & Garber, 1992).
Turner and Cole (1994) and Nolen-Hoeksema (1992) suggest that these inconsistencies
occur because children younger than twelve are not capable of abstract reasoning and
formal operational thought and so therefore cannot make causal attributions in as
complex a fashion as is proposed in hopelessness theory (Abela, 2001). These
researchers proposed that negative attributional styles in interaction with stress begin to
predict symptoms of depression by age 12. Prior to that, negative life events would
predict depression.
Test of the Hopelessness Theory in 3rd and 7th graders
Diathesis-Stress Component
To assess Turner and Cole (1994) and Nolen-Hoeksema’s logic (1992), Abela
(2001) compared 3rd grade boys and girls to 7th grade boys and girls on attributional style
measures and stress and followed both groups of children over time to determine whether
attributional style interacted with stress to predict depressive symptoms. He
hypothesized those 7th grade children showing the cognitive diatheses proposed by
hopelessness theory would report more depression in the face of negative life events than

12
those not showing the styles. He hypothesized that 3rd graders would not show the styles
and that only negative events would predict depression in this age cohort. He did not
make specific hypotheses in regard to gender.
As hypothesized, in Abela’s(2001) study, depressogenic attributional styles were
associated with increased depressive symptoms in 7th grade boys and girls but not 3rd
grade boys and girls. Depressogenic inferential styles about the self interacted with
negative life events to predict depression in females of both grade levels but not males.
Depressogenic styles concerning the consequences of negative life events interacted with
stress to predict depression in both grade levels for both sexes. Although Abela noted
gender differences in this study, he did not note whether other subject factors, such as
race, impacted the data. Abela (2001) interpreted these results as indicating that 7th
graders were cognitively capable of making depressogenic attributions, but that 3rd
graders were not.
Parent-Child Correlations
According to hopelessness theory depressogenic attributions are learned in
childhood. One potential source of such learning is parents. There have been a small
number of studies in which parental attributional style was examined in conjunction with
attributional style in children. Some studies find that parent attributional style is
associated with greater likelihood of depressogenic styles in children (Seligman, et al.,
1984; Stark, Schmidt, & Joiner, 1996). Alloy and colleagues (2001) demonstrated that
mothers of cognitively high risk undergraduates reported more stable and global
attribution feedback for stressful events in their children’s lives than parents of low risk
students. In addition, mothers’ inferential feedback predicted their children’s likelihood

13
of developing a major, minor, or hopelessness sub-type of depressive episodes. Other
studies do not find this association (Oliver & Berger, 1992, Turk & Bry, 1992; Kaslow,
Rehm, Pollack, & Seigel, 1988). Some researchers suggest that these inconsistencies are
due to varying sample sizes, sex of the child, and cognitive measures used (Alloy,
Abramson, Tashman, Berrebbi, Hogan, Whitehouse, Crossfield, & Moroco, 2001;
Tashman, 1997).
Maternal depression is also associated with children’s attributional style (Jaenicke
et al., 1987; Goodman, Adamson, Riniti, & Cole, 1994). Inone study, children’s
attributional style for negative events and depressive symptoms were positively
correlated with their mothers' depression scores but not their fathers (Seligman, et al.,
1984). Garber and Flynn (2001) found significant positive correlations between maternal
history of depression and adolescent depressogenic attributional style and hopelessness.
Mothers reporting a history of depression had adolescent children who reported more
depressogenic attributions and more depression themselves over time than mothers
reporting no history of depression. This shows that one potential contributory factor to
an adolescent’s cognitive risk for depression is a history of parental depression.
Rationale for Current Study
The purpose of this study was to apply the logic of the hopelessness theory of
depression to examine potential differences in vulnerability to depression among different
age and race groups of children. Although a great deal of research supports the utility of
hopelessness theory as an explanatory model of depression in adults, there have been
relatively few applications of the model to children. Moreover, there have been no
studies assessing whether hopelessness theory is a useful explanatory model of

14
depression in some ethnic groups but not in others. This is important to assess because
racial differences in depression are understudied and correlates of such differences are
unknown.
I hypothesize that factors associated with minority status will make it more likely
that minority children will show depressogenic attributional and inferential styles at a
younger age, perhaps accounting for ethnic differences in depression in younger children.
Factors such as lower academic achievement, less peer acceptance, and experiencing
prejudiced attitudes (Sadowski, 2001) may increase the likelihood of viewing the self as
flawed, for example. To the extent that such factors cause an increase in negative
explanatory style, minority children may be more vulnerable to develop depressive
symptoms.
Hypotheses
1) There will be an age/race interaction in depression in the younger cohort with younger
African-Americans reporting more depressive symptoms than younger Caucasians.
Older Caucasian children will not differ from older African-American children.
2) There will be an age/race interaction in depressogenic attributional styles in the
younger cohort with younger African-Americans reporting more depressogenic
attributional styles than younger Caucasians. Older Caucasian children will not differ
from older African-American children.
3) A Caucasian child’s attributional style will interact with negative life events to predict
depressive symptoms in the older age cohort but not in the younger age cohort.
4) An African-American child’s attributional style will interact with negative life events
to predict depressive symptoms in both age cohorts.
15
5) Parental attributional style and depressive symptoms will be positively correlated with
children’s attributional styles.
METHODS
Participants
A total of 188 children and 154 parents participated. Data were collected from
four after-school care programs in New Hanover County, Brigade Boys and Girls Club,
Community Boys and Girls Club, Wesley Memorial Methodist Church, and Southeastern
Preschool Educational Center (SPEC).
Procedure
Participants were told that the purpose of the study was to “understand how
children and parents cope with life stress.” Program directors and/or researchers first
obtained consent from parents. Parents then completed questionnaires. Within one week
of data collection from parents, researchers met with the children and administered the
children’s questionnaires. After connecting the appropriate child with parent, all names
and identifiers were destroyed to ensure anonymity.
Parents completed three questionnaires, including the Demographic Questionnaire
(DQ), the Beck Depression Inventory (BDI; Beck, et al., 1996), and the Control,
Attributions, and Expectations Questionnaire (CAEQ; Clements, 1990). Children
completed four questionnaires,including the Children’s DepressionInventory (CDI;
Kovacs, 1981), the Children’s Life Event Scale (CLES; Coddington, 1972, Kanner, et al.,
1987), Children’s Attributional Style Questionnaire (CASQ; Seligman, et al., 1984), and
the Children’s Cognitive Style Questionnaire (CCSQ; Abela, 2001).

16
Materials
Parent Questionnaires
Demographic Questionnaire (DQ). This 10 item questionnaire, created for the
current study, measures basic demographic characteristics. The question asking child and
parent ethnicity/race was modeled after the current census (United States Census, 2000)
to include African-American, Caucasian, and Hispanic categories. Socio-economic status
(SES) was measured categorically by asking the parent if his or her child qualifies for
free or reduced lunch in the school system.
Beck Depression Inventory (BDI). The BDI is a 21 item self-report measure of
adult depressive symptoms. For the present study, the question on suicidal ideation was
omitted. Items were rated on a scale of 0-3. Higher scores indicated higher levels of
depression. A score between 9 and 17 suggested mild depression. A score of 18 or
higher indicated severe depression. The BDI is a reliable and valid measure of adult
depressive symptoms in both clinical (α =.86) and non-clinical (α =.81) samples (Beck,
Steer, & Garbin, 1988). Good internal consistency was demonstrated in this study for the
BDI (α =.90).
Control, Attributions, & Expectations Questionnaire (CAEQ). This modified
version of the Attributional Style Questionnaire (Peterson & Seligman, 1984) assessed
three dimensions of a depressogenic causal attribution style-internal/external,
stable/unstable, and global/specific. Participants were asked to make causal and control
attributions for their most recent stressful negative life event on 6 point Likert scales.
Clements (1990) has demonstrated adequate reliability for this instrument for perceptions
about positive events (α=.69) and for perceptions about negative events (α=.62).

17
Peterson, et al. (1982) found moderate reliability for perceptions about negative events
(α=.75) and good test-retest reliability for internal (r=.64), stable (r=.69) and global
(r=.51) negative life events. For the present study, adequate reliability was found for
internal (α =.64), stable (α =.63),and global (α =.63) negative life events.
Child Questionnaires
Children’s Depression Inventory (CDI). This 27-item self- report questionnaire
measured the cognitive, affective, and behavioral symptoms of depression and is the most
widely used depression self-report questionnaire for children (Hammen & Gotlib, 1992).
For the present study, the question pertaining to suicidal ideation was omitted. Total
scores on the CDI may range from 0-54. Individual items are scored on a 0-2 scale with
higher scores representing more severe depression symptoms. A score of 13 indicates
mild depression. A cutoff score of 19 indicates severe depression according to Kovacs
(1984). Kovacs (1980) found good internal consistency of .87 and high test-retest
reliability (α =.84) (Kanner, et. al, 1987). Abela (2001) found moderate (α=.39-.94) to
high (αranged from .89-.94) internal consistency in third and seventh graders. Good
internal consistency was demonstrated in this study (α=.90).
Children's Life Events Scale (CLES). The CLES is a 67 item self-report life
stress measure created by Abela (2001) and included 37 negative life event items from
the Children's Hassles Scale (Kanner et. al, 1987) and 30 items from the Life Stress Scale
(Coddington, 1972). For the purposes of this study, 52 of these items were used. Scores
closer to 52 indicated that the child has experienced more negative events in the past two
weeks. Kanner (1987)has demonstrated good internal consistency (α=.87) for this
18
instrument in a sample of 6-13 year old children. Good internal consistency was
demonstrated in this study (α=.85).
Children’s Attributional Style Questionnaire (CASQ). This 24 item self-report
inventory assessed causal attributions for hypothetical negative life events. Abela (2001)
adapted it from the original CASQ to assess the occurrence of negative life events only
(Seligman, et al., 1984). Children were asked to choose which of two statements best
describes the reason why that event may have occurred. This measure assessed the three
dimensions of a depressogenic causal attributional style- internal/external,
stable/unstable, and global/specific (Kanner, et. al., 1987). Higher numbers on this scale
represented a more depressogenic attributional style (Abela, 2001). In previous research,
moderate internal consistency for negative events (α = .42-.67) was found (Seligman,
1984). Good test-retest reliability of .66 was also demonstrated for negative events
across 6 months time (Nolen-Hoeksema, Girgus, and Seligman, 1986). Abela (2001)
obtained moderate internal consistency for negative events in third graders (α = .56) and
in seventh graders (α = .52). Moderate internal consistency for negative events was
obtained in this study (α=.69).
Children’s Cognitive Style Questionnaire(CCSQ). This 24 item self-report
questionnaire assessed the tendency for a child to view him/herself as flawed following
the occurrence of negative life events (self subscale) and the tendency for the child to
catastrophize the consequences of negative life events (consequence subscale). An
example of a deficient self question was ‘You’re the last person to be picked on a team in
gym class.’ An example of a disastrous consequence question was ‘You gain a lot of
weight and start to look fat.’ Each response in part one was assigned a value from 0-3

19
and each response in part two a value from 0-2. Higher scores represent a greater
tendency for the child to catastrophize the consequences of negative events and for the
child to view him/herself as flawed following the occurrence of negative life events.
Abela (2001) found moderate internal consistency for both the inferential style about
consequences [3rd graders (α = .71 and .78); [7th graders (α =.66 and .77)] and the self,
[3rd graders (α = .64 and .81); 7th graders (α =.68 and .78)] over a seven week interval.
Abela (2001) found moderate test-retest reliability in 3rd graders (r=.41, p<.001); (r=.31,
p<.001) and 7th graders (r=.46, p<.001); (r=.63, p<.001) for both parts of the
questionnaire. Moderate internal consistency was demonstrated in this study for
inferential styles about consequences (α=.77) and the self (α=.76).
RESULTS
All analyses were conducted with Statistical Package for the Social Sciences data
analysis software (SPSS 12.0; Norusis, 2003).
Descriptive Statistics
Children were classified into racial groups on the basis of parent answers to the
race question for their child (African-American or Caucasian). Fifty-two percent of the
children were African-American and 48% were Caucasian. Children ranged in age from
7-16 years (M=10.44 years; SD=1.98). Only three of the older children were ages 15 or
16. Children were classified into age groups based on a median split of the age data
(younger = 7-10 years; older = 11-16) Thus four groups participated in the study;
younger African-American (n = 46), older African-American (n = 52), younger
Caucasian (n = 50), and older Caucasian (n = 40). Chi-square (χ2) analysis showed no
differences in the number of children in each of these four groups,
20
χ2 (1,188) =1.40, p>.05.
Forty-seven percent of children qualified for free or reduced childcare or lunch
services and 53% of children did not qualify for these services. Fifty-one percent of the
children were female and 49% were male. Chi-square analyses were conducted to
determine whether the four race and age groups were differentially represented on socio-
economic status and gender. There were no differences in gender between the four groups
(all p’s >.05). There was, however, a significant difference effect for economic status, χ2
(3,176) = 21.42, p<.001. As can be seen in Table 1, greater numbers of African-
Americans qualified for free or reduced lunch or childcare services. Socio-economic
status was therefore used as a fixed factor in subsequent analyses.
Parents’ mean age was 37.55 (SD=5.53). Eighty-six percent of parents were the
children’s mother, 13% were the father, and 1% served as the legal guardian. The
majority of parents had only one child at the particular after school care or summer camp
facility (64%), but 36% reported having two or more children. All parent demographic
information can be seen in Table 2.

21
Table 1
Chi-Square Analyses for Gender and SES by Group(N=188)
Variable
YoungerAfrican-
AmericanN
OlderAfrican-
AmericanN
YoungerCaucasian
N
OlderCaucasian
NGender
Male 22 22 27 21Female 21 26 20 29
Free/Reduced ServicesYes 25 30 14 19No 17 18 33 31

22
Table 2
Adult Demographic Characteristics: Percentages (N=154)
Sample Characteristics %Parent Race
Caucasian 47African-American 53
Relationship to ChildMother 86Father 13Guardian 1
Child’s Primary CaregiverYes 96No 4
Currently on Anti-DepressantsYes 8No 92
Parent EmploymentYes 88No 12
Parent Marital StatusDating 8Married 42Separated or divorced 42Unmarried, but livingtogether 8
Parent EducationLess than high school 2High school 18Some college 38Associate/technical 30College 9Beyond college 3

23
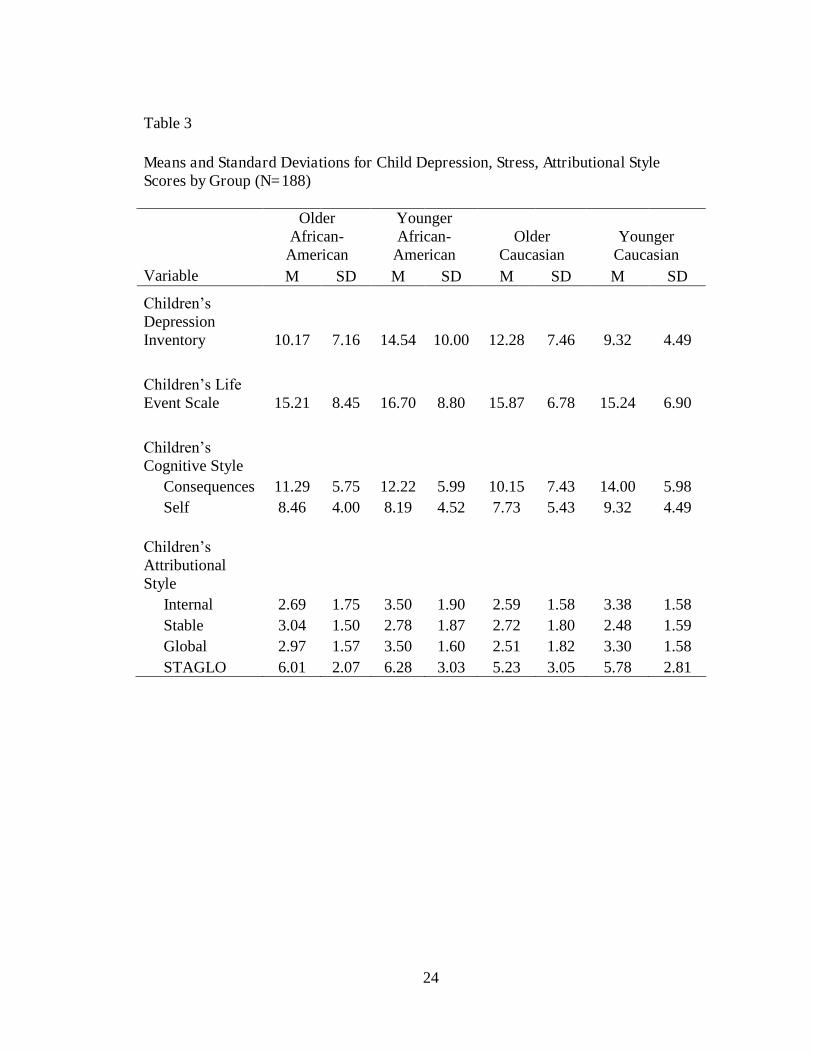
The means and standard deviations for child depression, attributional style, and
stress variables by group for the entire sample can be seen in Table 3. Overall children
scored in the non-depressed range although three of the groups’(younger African-
American children, older African-American and older Caucasian) mean score were
approaching or in the mildly depressed range. According to Kovacs (1981), a cut-off
score of 13 on the CDI indicates mild depression, and a cut-off score of 19 indicates
severe depression. The number of children in each group meeting the cut-off for mild,
moderate, and severe depression can be seen in Table 4. More children in the younger
African-American group met the cut-off for severe depression than in any other group.
Total scores on the CCSQ consequences and self subscales range from 0-36 and
0-24 respectively. Higher scores indicate a greater tendency to view the consequences of
negative life events as disastrous or the tendency to view the self as flawed following the
occurrence of negative life events (Abela, 2001). As can be seen in Table 3, scores
ranged from 9.15-14 and 7.73-9.32 on the consequences and self subscales, respectively.
Younger Caucasians displayed the highest CCSQ-consequences and self subscale mean
scores.
Total scores for each dimension (internal, stable, global) of the CASQ range from
0-8; higher scores represent a greater tendency towards internality, stability, and
globality. Lower scores represent a greater tendency toward being external, unstable, and
specific. In line with Abela (2001) and the hopelessness theory (Abramson, Alloy, &
Metalsky, 1989), the composite score or addition of stable and global (STAGLO) scores
was computed and used as the depressogenic attributional style variable. STAGLO
scores can range from 0-16. Higher scores represent more depressogenic
24
Table 3
Means and Standard Deviations for Child Depression, Stress, Attributional StyleScores by Group (N=188)
OlderAfrican-
American
YoungerAfrican-
AmericanOlder
CaucasianYounger
CaucasianVariable M SD M SD M SD M SD
Children’s DepressionInventory 10.17 7.16 14.54 10.00 12.28 7.46 9.32 4.49
Children’s Life Event Scale 15.21 8.45 16.70 8.80 15.87 6.78 15.24 6.90
Children’s Cognitive Style
Consequences 11.29 5.75 12.22 5.99 10.15 7.43 14.00 5.98Self 8.46 4.00 8.19 4.52 7.73 5.43 9.32 4.49
Children’s AttributionalStyle
Internal 2.69 1.75 3.50 1.90 2.59 1.58 3.38 1.58Stable 3.04 1.50 2.78 1.87 2.72 1.80 2.48 1.59Global 2.97 1.57 3.50 1.60 2.51 1.82 3.30 1.58STAGLO 6.01 2.07 6.28 3.03 5.23 3.05 5.78 2.81

25
Table 4
Number of Children Meeting Depression Levels by Group (N=188)
Variable
OlderAfrican-
American
YoungerAfrican-
AmericanOlder
CaucasianYounger
CaucasianCDINon-Depressed 34 21 26 29Mild 12 7 6 8Severe 6 18 8 13
26
attributional styles. As can be seen in Table 3, African-Americans, especially younger
African-Americans, had the highest mean STAGLO scores.
The means and standard deviations for parent depression and attributional style
scores by race are reported in Table 5. African-American and Caucasian parents were
equivalently non-depressed and overall did not display a depressogenic attributional
style, scoring in the mid-range on each attributional dimension (Beck, Steer and Garbin,
1996; Clements, 1990).
Hypothesis One
According to the first hypothesis, there would be an age/race interaction in the
younger cohort with younger African-Americans reporting more depressive symptoms
than younger Caucasians. Older African-Americans were predicted not to differ from
older Caucasians.
A 2 (older vs. younger) X 2 (African-American vs. Caucasian) X 2 (yes or no for
free and reduced lunch) Analysis of Variance (ANOVA) was used to test Hypothesis
One. CDI symptoms served as the dependent variable. As predicted, older African-
American children did not differ from older Caucasian children in depression levels.
Contrary to the prediction, however, there was not an age/race interaction in the younger
cohort. Younger African-Americans did not report significantly more depressive
symptoms than younger Caucasians, F(1, 185) = 2.94, p=.06, although there was a non-
significant trend towards significance.
Hypothesis Two
According to the second hypothesis, there would be an age/race interaction in the
younger cohort with younger African-Americans reporting more depressogenic

27
Table 5
Means and Standard Deviations for Parent Depression and Attributional Style Scores(N=154)
Total CaucasianAfrican-
AmericanVariable M SD M SD M SDBeck Depression Inventory 7.42 6.32 7.34 6.27 7.91 6.40
Control, Attributions,Expectation
Internal 5.78 2.56 5.67 2.58 5.98 2.60Stable 6.74 2.68 6.63 2.83 6.85 2.46Global 6.65 2.86 6.38 3.05 6.79 2.53

28
attributional styles than younger Caucasians. Older African-Americans were predicted
not to differ from older Caucasian children in depressogenic attributional styles.
A 2 (Older vs. Younger) X 2 (African-American vs. Caucasian) X 2 (yes or no on
free or reduced lunch) Multivariate Analysis of Variance (MANOVA) with CASQ
attributional styles (internal, stable, global, STAGLO) and CCSQ (consequences, self)
inferential styles serving as the dependent variables was used to test hypothesis two.
There was a multivariate effect of age on attributional styles, (Wilk’s Lambda F (1, 173)
= 4.52, p<.01). Univariate analyses indicated that younger children reported more
internal (M = 3.53; F (1, 175) = 9.34, p<.01) and more global (M= 3.46; F (1,175) = 6.60,
p<.05.) depressogenic styles than older children (M = 2.72 and M = 2.79 respectively).
There was also a main effect of age on inferentialstyles, (Wilk’s Lambda F (2,
177) = 3.66, p<.05). Univariate analyses indicated that younger children reported
consequences of negative life events as more disastrous (M=13.15) than did older
children (M=10.53), F (1,178) = 6.93, p<.01.
Significant racial differences were not found in children’s reports of any
depressogenic attributional or inferential style. There was a significant multivariate effect
for SES, F (3, 183) = 3.26, p<.05, but no univariate effects.
Hypotheses Three and Four
Preliminary Correlational Analyses
Preliminary correlational analyses indicated that greater child depression was
associated with greater stress (r (186)=.35, p<.001) and STAGLO scores (r(183) =.26,
p<.001). Greater child depression was also associated with the tendency for children to
29
view consequences of negative life events as disastrous (r(185) =.22, p<.001) and the self
as flawed following negative life events (r(186) =.22, p<.01).
In the older African-American group, greater child depression was associated
with greater stress (r(51)=.48, p<.01). In the younger African-American group, child
depression was not significantly correlated with any stress, attributional, or inferential
style measure.
In the older Caucasian group, greater child depression was associated with greater
stress (r(38)=.33, p<.01) and STAGLO scores (r(38)=.49, p<.01). Greater child
depression was also associated with the tendency for children to view consequences of
negative life events as disastrous (r(39) =.56, p<.001) and the self as flawed following
negative life events (r(39) =.34, p<.05).
In the younger Caucasian group, greater child depression was associated with
greater stress (r(48)=.58, p<.01) and STAGLO scores (r(48)=.43, p<.01). Greater child
depression was also associated with the tendency for children to view consequences of
negative life events as disastrous (r(49) =.35, p<.001) and the self as flawed following
negative life events (r(49) =.29, p<.05).
Regression Analysis
According to hypotheses three and four, a Caucasian child’s attributional style
would interact with negative life events to predict depressive symptoms in the older age
cohort but not in the younger age cohort. Negative life events alone were hypothesized to
predict depressive symptoms in younger Caucasian children. An African-American’s
attributional style would interact with negative events to predict depressive symptoms in
both age cohorts.

30
Hierarchical regressions were used to test hypotheses three and four in the
younger and older Caucasian groups, three equations for each of the four age and race
cohorts. In the first equation, attributional style was assessed for each group. In the
second equation, inferences about event consequences were assessed for each group. In
the third equation, inferences about the self were assessed for each group. In line with
Abela (2001) and hopelessness theory (Abramson, Alloy, & Metalsky, 1989), globality
and stability were combined to form a composite attributional style score for these
analyses (STAGLO). For the younger and older Caucasians, attributional or inferential
styles (STAGLO, consequences, or self) were entered on the first step of the regression
equation, CLES life stress on the second step, and the interaction of life stress and the
attributional and inferential style variables on the third. CDI scores served as the
dependent variable in each equation.
Because preliminary correlational analyses indicated that negative life events
were the only measure significantly correlated with depression in the older African-
American group, only negative events were entered in the regression equation addressing
Hypotheses three and four for older African-Americans. Because preliminary
correlational analyses indicated no significant correlations between stress, attributional,
cognitive style and depression in the younger African-American group, regression
analyses were not conducted on this group.
In older African-Americans, negative life events were significant predictors of
greater depression, R2Δ=.22; F(1,49) =14.66, p<.05. The beta weight for negative life
events was significant,β= .48. p < .05. No attributional or inferential style variables on
any step were significant.

31
In older Caucasian children, STAGLO on step one was a significant predictor of
greater depression, R2Δ=.25; F (1,35)= 11.75, p<.01. Negative events on the second step
and the interaction of negative events and STAGLO were not significant, R2Δ=.05; F
(1,34) = 2.53, p=.12; R2Δ=.000; F(1,33)= .01, p = .90.
With respect to the inferential style about event consequences, consequences on
step one was a significant predictor of greater depression, R2Δ= .33; F (1,36) = 18.18,
p<.01. Negative life events on step two was not significant, R2Δ= .06; F (1,35) = 3.57, p
= .07. The interaction of higher consequence scores and more negative life events on the
third step was a significant predictor of greater depression, R2Δ=.18; F(1,34)= 15.32,
p<.01. When the interaction term was added on step three, the beta weight for negative
events remained insignificant.
With respect to the inferential style about the self, self and negative events on
steps one and two were significant predictors of greater depression, R2Δ=.13; F (1,46) =
5.35, p<.05; R2Δ= .12, F (1,45) = 5.55, p<.05, respectively. The interaction of self and
negative life events on step three was not significant, R2Δ = .00; F (1,44) = 09, p = .76.
Beta weights for these regression equations can be found in Table 6.

32
Table 6
Summary of Hierarchical Regression Analysis for Variables PredictingDepression in Older Caucasian Children (N=40)
Variable B SE B βStep 1
STAGLO 1.12 0.33 0.50*Step 2
STAGLO 1.06 0.32 0.47*Negative events 0.24 0.15 0.23
Step 3STAGLO 0.96 0.85 0.43Negative events 0.21 0.31 0.20STAGLO * Negative events 0.01 0.05 0.06
Step 1Consequences 0.57 0.13 0.57**
Step 2Consequences 0.53 0.13 0.54*Negative events 0.28 0.15 0.25
Step 3Consequences -0.71 0.33 -0.72*Negative events -0.32 0.19 -0.29Consequences * Negative events 0.07 0.02 0.51**
Step 1Self 0.48 0.20 0.36*
Step 2Self 0.50 0.12 0.37*Negative events 0.39 0.16 0.34*
Step 3Self 0.32 0.62 0.24Negative events 0.31 0.31 0.28Self * Negative events 0.01 0.03 0.15
Note: * significant at the .05 alpha level; ** significant at the .01 alphalevel

33
In younger Caucasian children, STAGLO and negative events on steps one and
two were significant predictors of greater depression, R2Δ= .19; F (1,45) = 10.60, p<.01;
R2Δ= .17; F (1,44) = 11.44, p<.01, respectively. When the interaction term was added
on Step three, the R2Δwas not significant, R2Δ= .002; F (1,43) = .11, p = .74.
With respect to inferential style about event consequences, consequences and
negative events on steps one and two were significant predictors of greater depression,
R2Δ=.12; F (1,46) = 6.51, p = .01; R2Δ= .28; F (1,45) = 22.01, p<.01 respectively. The
interaction of consequences and negative life events on the third step was not significant,
R2Δ= .46; F(1,44) = 3.46, p = .07.
With respect to the inferential style about the self, self and negative events on
steps one and two were significant predictors of greater depression, R2Δ= .07; F (1,46) =
3.96, p<.05; R2Δ= .28; F (1,45) = 19.68, p<.01, respectively. The interaction of self and
negative life events on the third step was not significant, R2Δ= .03; F (1,44) = 2.35, p =
.13. Beta weights for these regression equations can be found in Table 7.

34
Table 7
Summary of Hierarchical Regression Analysis for VariablesPredicting Depression in Younger Caucasian Children (N=50)
Variable B SE B βStep 1
STAGLO 1.66 0.51 0.44**Step 2
STAGLO 0.78 0.53 0.21Negative events 0.77 0.23 0.47**
Step 3STAGLO 1.26 1.54 0.33Negative events 0.89 0.45 0.55*STAGLO * Negative events -0.03 0.08 -0.18
Step 1Consequences 0.64 0.25 0.35*
Step 2Consequences 0.47 0.21 0.26*Negative events 0.9 0.19 0.54**
Step 3Consequences -0.41 0.52 -0.27Negative events 0.13 0.45 0.08Consequences * Negative events 0.05 0.03 0.75
Step 1Self 0.69 0.35 0.28*
Step 2Self 0.31 0.31 0.12Negative events 0.91 0.21 0.55**
Step 3Self -0.80 0.78 -0.33Negative events 0.19 0.51 0.11Self * Negative events 0.07 0.04 0.73
Note: * significant at the .05 alpha level; ** significant at the .01 alphalevel

35
Exploratory Analysis
The purpose of the above regression analyses was to fully explore the relationship
between cognitive predictors and depression within each age and race group. However,
because race differences were not found in the initial MANOVAs, racial groups were
collapsed for the purpose of subsequent exploratory analyses. In these exploratory
analyses, regressions were conducted assessing the contribution of attributional style,
inferential styles, stress and their interactions in predicting depression within the younger
(n=96) and older (n=92) age groups.
Preliminary Correlational Analyses
In the younger age cohort, preliminary correlational analyses indicated that
greater child depression was associated with greater stress (r (89) =..37, p<.01) and
STAGLO scores (r(94) =.27, p<.01). Greater child depression was also associated with
the tendency for younger children to view consequences of negative life events as
disastrous (r(95) =.25, p<.05).
In the older age cohort, greater child depression was associated with greater stress
(r (89)=.42, p<.01) and STAGLO scores (r(89) =.33, p<.01). Greater child depression
was also associated with the tendency for older children to view consequences of
negative life events as disastrous (r(90) =.39, p<.01) and the self as flawed following the
occurrence of negative life events (r(91)=.27, p<.01).
Regression Data Analysis
Six hierarchical regressions were used for exploratory analyses; three for each of
the two age cohorts. In the first equation, attributional styles were assessed. In the
second equation, inferences about event consequences were assessed. In the third

36
equation, inferences about the self were assessed. In line with Abela (2001) and
hopelessness theory (Abramson, Alloy, & Metalsky,1989), globality and stability were
combined to form a composite attributional style score for these analyses (STAGLO).
Attributional or inferential style (STAGLO, consequences, or self) were entered on the
first step of the regression equation, CLES life stress on the second step, and the
interaction of life stress and the attributional and inferential style variables on the third.
CDI scores served as the dependent variable in each equation. Because preliminary
correlational analyses indicated that the self variable was not significantly correlated with
depression in the younger age group, a regression equation was not conducted using this
measure.
In younger children with respect to attributional styles, STAGLO on the first step
and negative events on the second step were significant predictors of greater depression,
R2Δ= .08; F(1,86) = 7.33, p<.01; R2Δ= .17; F(1,86) = 9.77, p<.01, respectively. The
interaction of STAGLO and negative life events on the third step was not significant, R2Δ
= .42; F(1,84) = .01, p = .91.
With respect to the inferential style about event consequences, consequences on
the first step, negative events on the second step, and the interaction of higher
consequence scores and more negative life events on the third step were all significant
predictors of greater depression, R2Δ= .08; F (1,87) = 7.70; p<.01; R2Δ= .21; F(1,86) =
13.70, p<.01; R2Δ= .25; F(1,85) = 4.22, p<.05, respectively. When the interaction term
was added on step three, the beta weights for negative events was no longer significant.
Beta weights for these regression equations can be found in Table 8.

37
Table 8
Summary of Hierarchical Regression Analysis for VariablesPredicting Depression in Younger Children (N=96)
Variable B SE B βStep 1
STAGLO 1.02 0.38 0.28**Step 2
STAGLO 0.77 0.37 0.21**Negative events 0.44 0.14 0.32**
Step 3STAGLO 0.88 1.02 0.24Negative events 0.47 0.29 0.34STAGLO * Negative events -0.01 0.06 -0.04
Step 1Consequences 0.51 0.18 0.29**
Step 2Consequences 0.47 0.17 0.26**Negative events 0.50 0.13 0.36**
Step 3Consequences -0.30 0.41 -0.17Negative events 0.02 0.27 0.02Consequences * Negative events 0.04 0.02 0.60*
Note: * significant at the .05 alpha level; ** significant at the .01 alphalevel

38
In older children, STAGLO on the first step and negative events on the second
step were significant predictors of greater depression, R2Δ= .33; F(1,85) = 10.39, p<.01;
R2Δ= .48; F(1,84) = 13.94, p<.01. The interaction of STAGLO and negative events on
the third step was not significant, R2Δ= .48; F(1,83) = .41, p = .52.
With respect to the inferential style about event consequences, consequences on
the first step, negative events on the second step, and the interaction of higher
consequence scores and more negative events on the third step were all significant
predictors of greater depression, R2Δ= .34; F(1,86) = 16.19, p<.01; R2Δ= .51 F(1,85) =
11.24, p<.01; R2Δ= .58; F(1,84)=9.31, p<.01, respectively. When the interaction term
was added on step three, the beta weights for negative events was no longer significant.
With the respect to the inferential style about the self, self on the first step and
negative events on the second step were both significant predictors of greater depression,
R2Δ= .28; F(1,87) = 7.55, p<.01; R2Δ= .49; F(1,86) = 17.84, p<.01, respectively. The
interaction of the self and negative events on the third step was not significant, R2Δ= .51
F(1,85) = 2.68, p = .10. Beta weights for these regression equations can be found in
Table 9.

39
Table 9
Summary of Hierarchical Regression Analysis for VariablesPredicting Depression in Older Children (N=92)
Variable B SE B βStep 1
STAGLO 0.77 0.24 0.33**Step 2
STAGLO 0.66 0.22 0.28**Negative events 0.31 0.08 0.06**
Step 3STAGLO 0.95 0.51 0.41Negative events 0.44 0.21 0.50*STAGLO * Negative events -0.02 0.03 -0.21
Step 1Consequences 0.44 0.11 0.40**
Step 2Consequences 0.34 0.11 0.31**Negative events 0.31 0.09 0.33**
Step 3Consequences -0.33 0.24 -0.29Negative events -0.16 0.18 -0.17Consequences * Negative events 0.04 0.01 0.92**
Step 1Self 0.44 0.16 0.28**
Step 2Self 0.36 0.15 0.25**Negative events 0.38 0.09 0.40**
Step 3Self -0.17 0.37 -0.11Negative events 0.15 0.17 0.16Self * Negative events 0.03 0.02 0.48
Note: * significant at the .05 alpha level; ** significant at the .01 alphalevel

40
Summary of Regression Analyses
In younger Caucasians negative life events were the only predictors of depression
in the equations assessing the role of attributional styles and stress in predicting
depression. In older Caucasians, STAGLO predicted depression. In the equations
assessing the role of inferential styles and stress in predicting depression, the interaction
of event consequences and stress significantly predicted depression in older Caucasians.
In older African-Americans, only stress predicted depression. In younger African-
Americans, no cognitive style predicted depression. When groups were collapsed across
race, negative life events and STAGLO were the only predictors of depression in the
equations assessing attributional style and stress. The interaction terms were not
significant. For equations assessing the role of event consequences and stress, there was a
significant consequence-stress interaction in both age groups.
Hypothesis Five
According to my final hypothesis, there will be significant positive correlations
between parent depression and attributional style and child depression and attributional
styles. Higher depression scores in parents were associated with higher depression
scores in children. Higher depression scores in parents were also associated with more
internal attributional styles in children, p<.001, and the tendency for children to view the
self as flawed following the occurrence of negative life events, p<.01. Higher depression
scores in parents were associated with an increased report of stable depressogenic styles
in parents, p<.001. Correlations between all variables can be seen in Table 10.

41
Table 10
Correlations for Child and Parent Depression and Attributional Style Measures
Variable 1 2 3 4 5 6 7 8 9 10 11
1. Child depression 1 0.21** 0.18* 0.16** 0.31** 0.26** .31** 0.26** 0.06 0.04 0.06
2. Parent depression 0.21** 1 0.26** 0.02 0.07 0.02 0.02 0.20** 0.11 0.24** 0.12
3. Child internal 0.18* 0.26** 1 0.23** 0.31** 0.31** 0.04 0.01 0.09 0.13 0.09
4. Child stable 0.16* -0.02 0.23** 1 0.50** 0.87** 0.13 0.16* 0.01 0.01 -0.01
5. Child global 0.31** 0.07 0.31** 0.50** 1 0.87** 0 0.05 0.19** -0.17* -0.15*
6. Child STAGLO 0.26** 0.02 0.31** 0.87** 0.87** 1 0.07 0.06 0.09 0.09 -0.09
7. Child consequence 0.31** 0.02 0.04 0.13 0 0.07 1 .60** 0.09 0.08 0.08
8. Child self 0.23** 0.20** 0.01 0.16* 0.05 0.06 .60** 1 0.06 0 -0.01
9. Parent internal -0.06 0.11 0.09 0.01 0.11** 0.09 0.09 0.06 1 0.42* 0.42**
10. Parent stable 0.04 0.24** 0.13 0.01 -0.17* -0.09 0.08 0 0.41** 1 0.86**
11. Parent global 0.07 0.12 0.09 -0.01 -0.15* 0.09 0.08 0.01 0.42** 0.86** 1
Note: * significant at the .05 alpha level; ** significant at the .01alpha level

42
DISCUSSION
The purpose of this study was to examine differences in depression, negative life
events, attributional styles, and inferential styles in younger Caucasian, younger African-
American, older Caucasian, and older African-American children. To my knowledge this
is the first study to concurrently examine age and race differences in vulnerability to
depression utilizing the framework of hopelessness theory of depression.
Children’s Depressive Symptoms
There were no differences in depressive symptoms as a function of age or race.
Nor was there an age and race interaction in predicting depression. This is consistent with
previous research showing that older African-American children do not differ from older
Caucasian children in their reports of depressive symptoms (Shraedly, Gotlib, &
Hayward, 1999; Twenge & Nolen-Hoeksema, 2002). This is inconsistent with some
research showing that younger African-American children show more depressive
symptoms than younger Caucasian children, although there was a trend in the direction of
hypothesis one (e.g. Cole, Peeke, Martin, Henderson, & Harwell, 1998).
One difference between this sample and others is that as a group they were more
depressed than those sampled by previous researchers. In this sample, the mean
depression scores for all groups except younger Caucasians approached or exceeded
clinical cutoffs for mild depression. In Abela’s (2001) sample no groups met clinical
criterion. Similarly in Cole et al., (1998) none of the younger aged cohort’s means were
above clinical cutoffs for depression. Thus our inability to find between group differences
in depression may have reflected the relatively higher rates of depression reported by all
groups in this sample.

43
Not all studies find race and age differences in depression. The lack of
differences in this study is consistent with a small number of studies also showing no
differences. For example, Twenge & Nolen-Hoeksema (2002) found no differences in
depression between Caucasians and African-Americans ages 8-16. Similarly other
researchers note no differences in Caucasian and African-American children ranging in
age from 4-18 (Flannery-Shroeder & Kendall, 1995; Helsel & Matson, 1984).
It is important to note that younger African-Americans had the highest mean
depression score, even though they did not differ statistically from any other group.
Younger Caucasians had the lowest depression score. This disparity in scores is similar to
the pattern seen in studies which do demonstrate significant depression differences in
younger cohorts. Cole et al. (1998) found that younger African-American children report
more depressive symptoms than younger Caucasian children, suggesting that racial
differences in depression may be more prevalent in younger African-American children.
In Cole’s (1998) study, far more children were assessed. This suggests that the effect
size in ethnic differences in depression may be smaller than the power afforded by the
relatively smaller sample assessed in the current study. Thus researchers examining
minority differences in depression may wish to include large sample sizes to detect what
may be small, but important effects.
Children’s Depressogenic and Inferential Styles
There were age differences in depressogenic and inferential styles. There were no
between group differences in depressogenic attributional style or inferential styles as a
function of race. Nor, as predicted, was there an interaction between age and race in
attributional or inferential styles.
44
Depressogenic Styles
Younger children reported more internal and global attributions than older
children. The tendency for younger children to make more internal attributions is
consistent with the larger developmental literature which suggests that children younger
than twelve make higher internal attributions than do older children. This is true even in
situations in which these children have no objective control (Skinner, 1990; 1991; Weisz,
1986).
Previous researchers have suggested that the reason the diathesis-stress interaction
does not predict depression in younger children is that younger children are unable to
make cognitively complex attributions (Abela, 2001; Nolen-Hoeksema, 1992; Turner &
Cole, 1994). Not only does this conclusion ignore the larger developmental literature, but
data from this study suggest that this conclusion is flawed. Younger children made more
internal and more global attributions than did older children.
One difference between this study and others is that between group differences
were studied in addition to within group effects. Most researchers assess whether the
diathesis stress interaction predicts depression within different age groups without first
assessing whether different age groups are actually making the attributions at all (for
review see Joiner & Wagner, 1995). Abela (2001), for example, did not compare
younger and older age cohorts on attributional style. Rather he assessed the predictive
utility of the diathesis-stress interaction within age group. He concluded that younger
children weren’t able to make the attributions on the basis of the finding that the
interaction did not predict depression.

45
Abela (2001) suggests that the ability to make these attributions may be a schema-
driven process. Therefore younger children may be less efficient at the types of
information processing techniques that require this abstract reasoning (2001). The main
effects for age on attributions in this study imply that younger children are indeed able to
make these attributions. It may be important to more fully assess the main effects of age
on attributional styles, in addition to the predictive utility of the interaction, before
drawing conclusions that younger children do not have the cognitive capacity to make
depressogenic attributions.
Inferential Styles
Consistent with Abela (2001), younger children in this sample perceived the
consequences of negative life events as more disastrous than older children. Abela
(2001) suggests that inferential styles about the consequences of negative life events
emerge earlier in childhood than depressogenic styles. He theorizes that this occurs
because the processes involved in perceiving the consequences of negative life events
require less abstract reasoning and involve more direct environmental feedback than the
processes involved in developing depressogenic styles. This study provides support for
Abela’s emphasis on the importance of children’s inferential styles as cognitive
precursors to depression. His logic regarding the early emergence of such styles relative
to attributional style was not supported, as younger children in this sample also displayed
depressogenic attributional styles.
Younger children made more global attributions and also more negative
inferences about event consequences. Abela (2001) found an association between global
attributions and inferences about the consequences of negative life events in younger

46
children, which was not found in this study.Thus Abela’s(2001) data suggests that these
dimensions may be tapping the same underlying construct, while these data suggest they
do not. It may be important to further assess the degree to which these particular
attributional and inferential styles are indeed measuring the same cognitive dimension in
making decisions about the predictive utility of attributional style versus inferential style
in younger children.
There were no differences between younger and older children in the tendency to
view the self as deficient following negative life events. Abela (2001) found that younger
children, especially females, were more likely to show this style than older children.
Abela suggests that in females, negative inferences about the self may emerge earlier than
attributional styles because concerns about body image, self-esteem, and self-efficacy
emerge earlier in girls (2001).
In the current study, groups were matched for gender but gender was not used as a
fixed factor. We may not have seen gender differences simply because we did not assess
them. It may be important to further assess whether the differences Abela (2001) found
reflect gender disparities or age disparities in order to draw reliable conclusions about
whether younger children do indeed differ from older children in negative inferences
about the self.
Racial Differences
We had predicted that age would interact with race such that younger African-
Americans would be as likely to show depressogenic attributional and inferential styles as
both older cohorts. Younger Caucasians would be less likely to show such styles than
younger African-Americans. This was based on the empirical rationale that these styles

47
are learned through repetitive exposure to aversive life circumstances and the
epidemiological literature indicating that younger African-American children are exposed
to such stressors in greater degrees than younger Caucasian children (Hedges & Howell,
1999). Older children were not expected to differ by race because hopelessness theory
suggests that depressogenic attributional styles, if they emerge, do so by age twelve
(Abramson, Alloy & Metalsky, 1989).
Similarly to depression, one reason racial differences in attributional styles may
not have been detected is the relatively high level of stress evidenced by all groups. Mean
stress scores for the older cohorts were higher than those noted by Abela (2001), and in
the younger cohort almost twice as high. Further, there were no age differences in
reported stress. According to hopelessness theory, no differences in cognitive styles
would be expected in groups exposed to the similar learning histories that such stress
would create (Rose & Abramson, 1992).
It is important to note that our sample was not drawn from as representative
section of the community as Abela’s sample (2001). A substantial percent of this sample
qualified for free and reduced lunch, with an overrepresentation of African-Americans in
that group. Students not qualifying for free and reduced lunch were drawn from sections
of the community representing low to lower mid-range SES groups.
We had hypothesized that greater stress would exist among African-American
participants and that this stress would engender earlier development of depressogenic
attributional styles in these participants. However the sample was homogeneous with
respect to stress, perhaps because it was homogeneous with respect to SES (Abela, 2001;
Cole, et al., 1998). We may not have been able to access stress differences due to

48
homogeneity of SES. Further studies assessing racial differences might want to assess
ethnic groups across the range of SES to determine whether SES or ethnicity is associated
with differences in stress levels or attributional styles.
Predictors of Child Depression
Younger Children
Regression equations were used to determine predictors of depression within each
age and race cohort. No studies to my knowledge have assessed the predictive utility of
the diathesis-stress interaction with specific racial groups. I had predicted that the
attribution-stress interaction would predict depression in younger African-American
children but would not predict depression in younger Caucasian children because greater
stress would engender earlier development of negative attributional styles in African-
American children (Sadowski, 2001). I also collapsed race groups and looked at
predictors on depression within each age group.
Stability and globality composite scores (STAGLO) in interaction with stress did
not predict depression in younger children, either Caucasian or African-American.
Attributional style, inferential styles and stress predicted depression in younger
Caucasian children, but not younger African-American children. With similar findings,
Abela (2001) concluded that younger children did not have the cognitive capacity needed
for attributional processing. These data suggest that younger children do indeed make
these attributions, but that the attributions do not interact with stress in predicting
depression in this age cohort.
Unlike Abela (2001), in this study, STAGLO scores accounted for a significant
amount of variance in predicting depression in younger Caucasians. This suggests that

49
younger children do make depressogenic attributions and that, at least for Caucasians,
these attributions predict depression. These findings regarding the interaction term are
similar to many other studies, suggesting that the diathesis-stress interaction may not
operate in young children in the predictive manner that hopelessness theory suggests is
true for adults. It is possible that stress and depressogenic styles contribute independently
but not interactively to depression in younger children, particularly Caucasian children.
It would be important to replicate these findings with adequate power to fully embrace
that interpretation.
Negative events predicted depression in younger Caucasian children, but not
African-American children. This finding with regards to Caucasians is consistent with
Abela (2001) and Nolen-Hoeksema, et al. (1992) who also reported that negative life
events predicted depression in younger children. These researchers did not examine
racial differences in their samples. Abela’s (2001) sample was primarily Caucasian, and
Nolen-Hoeksema, et al. (1992) did not report demographics on race. The finding that
stress did not predict depression in younger African-American children in this sample
points to the importance of including such demographics in future studies investigating
children’s vulnerability to depression. It is possible that African-American children differ
from Caucasians in specific vulnerabilities to depression and that previous findings may
reflect, in part, the makeup of the sample.
The fact that neither attributional nor inferential style predicted depression in
younger African-American children suggests that there are other factors involved in
depression onset in this particular group. This is interesting because, as a group, they
showed the highest mean depression and stress scores. Thus we expected this group to be
50
the most attributionally vulnerable. These findings, while underpowered, suggest that
hopelessness theory may not have much predictive utility with younger African-
American children. It may be important to further describe vulnerability to depression in
this cohort. The importance of understanding the etiological pathway to depression in
this group is only underscored by their relatively high levels of depression.
When race groups were collapsed the pattern of findings among all younger
children resembled the pattern of findings for younger Caucasian children. For example,
STAGLO and consequences were independent predictors of depression when younger
Caucasians were used as the group of analysis as they were when all younger children
were the group of analysis. Neither attributions nor stress predicted depression in younger
African-Americans. Thus the lack of findings with respect to African-Americans was
completely obscured by the findings in younger Caucasians.
This cannot be due to lack of power in the African-American group relative to the
Caucasian group. There were similar numbers of younger children in each age group.
Thus, while underpowered, our findings with respect to race are likely representative.
Thus any research which does not take race into account is likely to end up with results
that are generalizable just to Caucasians.
Older Children
STAGLO attributions predicted depression in older Caucasian children but stress
and the interaction term did not. This is inconsistent with a number of published reports
finding that in interaction with stress, attributions prospectively predict depression in
older children (Nolen-Hoeksema, Girgus, & Seligman, 1992; Turner & Cole, 1994;
Abela, 2001). Because this study included fewer participants than those used in previous

51
research it is likely that this lack of finding reflects low power. It would be important to
replicate this study with larger numbers to establish whether failure to find the interaction
is a power issue
Stress predicted depression in older African American children but attributions
did not. This is inconsistent with previous research but previous research has not
assessed racial differences in attributions. Although likely underpowered, these data
suggest that attributional processing does not appear to be an important etiological factor
in older AfricanAmerican children’s depression. Hopelessness theory may have limited
utility in older African-American children relative to older Caucasian children. If this is
true than it would be important to investigate what other variables in addition to stress
render African-American children at higher risk for depression.
Inferences about the consequences of negative events interacted with stress to
predict depression in older Caucasian children but not older African-American children.
Only stress predicted depression in older African-American children. In Abela’s(2001)
study (2001), consequences interacted with negative events to predict depression in both
older and younger children.Again, Abela’s (2001) sample was predominately Caucasian.
These data, as with the younger children’s data, suggest that specific vulnerability to
depression differs in older Caucasian and African-American children. It also points to
the need for further research on the epidemiology of depression among different race
groups.
It is interesting to note that younger children rated the consequences of negative
life events as more disastrous and made higher internal and global attributions than older
children. Inferences about consequences in interaction with stress predicted depression in

52
older Caucasian children but the interaction between attributions and stress did not
predict depression in either age cohort. These findings are inconsistent with Abela’s
(2001) suggestion that information about event consequences is more salient to younger
children than information about attributions. However, they lend weight to Abela’s
suggestion that the cognitive diatheses proposed in hopelessness theory for adults may
not be applicable to either younger or older children. It may be important to further
explore the relationship between inferences about consequences and depression in order
to assess the applicability of hopelessness theory to children. Assessing inferential styles
may be a necessary extension of hopelessness theory in predicting child depression.
Inferences about the self and stress predicted depression in older Caucasian, but
not older African-American children. The interaction of stress and inferences about the
self was not a significant predictor of depression in either race group. It is interesting to
note that Abela (2001) found the self-stress interaction only in girls. Thus there appear to
be gender differences in the extent to which inferences about the self interact with stress
in predicting depression and, in this study age and race differences. It may be important
to more fully describe Abela's (2001) inference about the self variable. Greater
understanding of the self-inference variable would allow researchers to determine for
which groups this variable is an important etiological factor.
When race groups were collapsed the pattern of the findings among all older
children resembled the pattern of findings for older Caucasians. For example, the
interaction of consequences and stress predicted depression in older Caucasian children
when they were the group of analysis. The same interaction predicted depression when
all older children were the group of analysis. However, when older African-American
53
children were the group of analysis, only stress predicted depression. Thus, when race
groups were collapsed, the lack of findings with respect to older African-Americans
inferential style was completely obscured by the findings in older Caucasians.
This was not due to lack of power in the African-American group relative to the
Caucasian group. There were similar numbers of older children in each age group. Thus,
while underpowered, our findings with respect to race are likely representative. This
strongly suggests that any child depression research which does not take race into
account is likely to end up with results that are generalizable just to Caucasians. It also
further underscores the importance of continued research into ethnic differences in
vulnerability to depression.
Clinical Implications
These data indicate that younger and older children display different
vulnerabilities to depression. Further, factors associated with increased vulnerability to
depression in African-American children appear to differ from factors associated with
increased vulnerability in Caucasian children. One important consequence of this
research is to inform clinicians about the likely precursors to depression in these age and
racial groups. Clinicians working with older African-American children, for example,
might do better focusing on stress as they attempt to remediate current depressive
episodes and prevent future episodes. Clinicians working with older Caucasians might
benefit from focusing on inferences about the consequences of such stress.
In this study racial differences in vulnerability to depression appeared to be
greater than age differences. Previous literature has emphasized age differences and more
is known about age differences in vulnerability than racial differences (National Institute

54
of Mental Health, 2002). This study suggests that information about racial differences in
vulnerability may have more clinical utility than information about age. It may be more
useful for clinicians to know that attributions and inferences do not predict depression in
African-Americans than it would be for them to know that inferences about consequences
and stress independently rather than interactively predict depression in younger children.
More investigations of the nature of such differences are needed as well as better clinical
education in racial differences in depression vulnerability.
Of particular note in this study were differences found between older and younger
children in the influence of causal attributions and inferences about the self on
depression. It was clear that younger children do indeed have the capacity to form
depressogenic attributions and that these attributions predict depression, albeit not in
interaction with stress. Thus, clinicians should not assume that children lack the
cognitive capacity to form these attributions. Indeed it appears that the presence of such
attributions has a direct effect on depression vulnerability. Interventions aimed at
changing attributional style rather than changing attributions about particular stressors
may be more beneficial for children.
One difference between this sample and other studies in which attributions have
not predicted depression is the relatively low SES of the sample. It likely that low SES is
correlated with higher stress levels. Thus we may have found younger children making
depressogenic inferences because of the relatively high level of stress associated with low
SES. If this is true, then clinicians should be aware that the attributional pattern
characteristic of hopelessness depression may develop earlier in low SES children and
target intervention attempts accordingly.

55
Limitations
There were several limitations of this study. First, self-report questionnaires were
used to assess parent and child depression and attributional styles. Results may have
therefore been influenced by factors such as social desirability. Further, clinical
interviewing might be a better way to build rapport and more accurately measure
depressive symptoms. This was not possible in this study due to time constraints.
Second, data were cross-sectional in nature. As Abela (2001) states, a true test of
hopelessness theory requires a longitudinal design. Such a design was not possible due to
the practical constraints associated with the timely completion of a Master’s thesis.
Third, although a large number of children (N=188) and parents (N=154) were
surveyed, there was a small number of children in each age and race cohort (Ns ranged
from 40-50). Future studies with a larger number in each age and race cohort may help to
clarify the relationship between attributional styles and depression in children.
56
REFERENCES
Abela, J. (2001). The hopelessness theory of depression: A test of the diathesis
stress and causal mediation components in third and seventh grade children.
Journal of Abnormal Child Psychology, 29, 241-254.
Abramson, L.Y., Alloy, L.B. & Metalsky, G.I. (1989). Hopelessness depression:
A theory-based subtype of depression. Psychological Review, 96, 358-372.
Allen-Meares, P., Colarossi, L., Oyserman D. & DeRoos,Y. (2003). Assessing
depression in childhood and adolescence: A guide for social work practice.
Child and Adolescent Social Work Journal, 20, 5-20.
Alloy, L.B. (1997). Carving depression at its joints: Cognitive and personality subtypes
of depression. Cognitive Therapy and Research, 21, 243-245.
Alloy, L.B. & Abramson, L.Y. (1999). The temple Wisconsin cognitive vulnerability to
depression project: Conceptual background, design, and methods. Journal of
Cognitive Psychotherapy, 13, 227-262.
Alloy, L.B., Abramson, L.Y., Tashman, N.A., Berrebbi, D.S., Hogan, M.E., Whitehouse,
W.G., Crossfield, A.G. & Moroco, A.(2001). Developmental origins of cognitive
vulnerability to depression: parenting, cognitive, and inferential feedback styles of
the parents of individuals at high and low risk for depression. Cognitive Therapy
and Research, 25, 397-423.
Alloy, L.B. & Clements, C. (1998). Hopelessness theory of depression: tests of the
symptom component. Cognitive Therapy and Research, 22, 303-335.

57
Anderson, N. & McNeilly, M. (1991). Age, gender, and ethnicity as variables
in psychophysiological assessment: Sociodemographics in context. Psychological
Assessment, 3, 376-384
Angold, A & Rutter, M. (1992). The effects of age and pubertal status on depression in a
large clinical sample. Development and Psychopathology, 4, 5-28.
Angold, A., Costello, E. & Worthman, C. (1998). Puberty and depression: The
roles of pubertal status and pubertal timing. Psychological Medicine, 28, 51-61.
Beck, A., Steer, R., & Garbin, M. (1988). Psychometric properties of the Beck
Depression Inventory: Twenty-five years of evaluation. Clinical Psychology
Review, 8, 77-100.
Beck, A., Steer, R., Ball, R., & Ranieri, W. (1996). Comparison of Beck
Depression Inventories IA and II in psychiatric outpatients. Journal of Personality
Assessment, 67, 588-597.
Berto, P., D'Ilario, D., Ruffo, P., Di-Virgilio, R. & Rizzo, F. (2000). Depression:
Cost of illness studies in the international literature, a review. Journal of Mental
Health Policies and Education, 3, 3-10.
Birmaher, B, Ryan, N., Williamson, D. & Brent, D. (1996). Childhood and
adolescent depression: A review of the past 10 years, Part I. Journal of the
American Academy of Child and Adolescent Psychiatry, 35, 1427-1439.
Birmaher, B., Ryan, N., Williamson, D., & Brent, D. (1996). Childhood and adolescent
Depression: A review of the past 10 years, Part II. Journal of the American
Academy of Child and Adolescent Psychiatry, 35, 1575-1583.

58
Birmaher B, Brent D., & Benson R. (1998). Summary of the practice parameters for
the assessment and treatment of children and adolescents with depressive
disorders. American Academy of Child and Adolescent Psychiatry. Journal of the
American Academy of Child and Adolescent Psychiatry, 37, 1234-8.
Blazer, D.G., McGonagle, K.A. & Swartz, M.S. (1994). The prevalence and
distribution of major depression in a national community sample: The National
Comorbidity Survey. American Journal of Psychiatry, 151, 979-986.
Buchanan, C., Eccles, J., & Becker, J. (1992). Are adolescents the victims of
raging hormones? Evidence for activational effects of hormones on moods and
behavior at adolescence. Psychological Bulletin, 111, 62-107.
Center for Disease Control and Prevention (1995). U.S. Department of Healthy and
HumanServices Youth Risk Behavior Survey.
Center for Health Statistics (1997). Retrieved March, 2004 from
http://www.cdc.gov/nchs/Default.htm.
Clements C. (1990). Perceptions of control style: A construct validation approach.
Unpublished Doctoral dissertation, Northwestern University, Illinois.
Coddington, D. (1972). The significance of life events as etiologic factors in the
diseases of children: A study of normal populations. Journal of Psychosomatic
Research, 16, 205-213.
Cole, D.A. & Turner, J.E. (1993). Models of cognitive mediation and moderation
in child depression. Journal of Abnormal Psychology, 102, 271-281.

59
Cole, D., Martin, J., Peeke, L., Henderson, A., & Harwell, J. (1998). Validation
of depression and anxiety measures in White and Black youths: Multitrait-
multimethod analyses. Psychological Assessment, 10, 261-276.
Dana, R. (1998). Problems with managed mental health care for multicultural
populations. Psychological Reports, 83, 283-294.
Dixon, J. & Ahrens, A. (1992). Stress and attributional style as predictors of
self-reported depression in children. Cognitive Therapy and Research, 16, 623-
634.
Dunlop, D., Song, J., Lyons, J., Manheim, L., & Chang, R. (2003). Racial/Ethnic
Differences in Rates of Depression Among Pre-retirement Adults. American
Journal of Public Health, 93, 1945-1952.
Elder G., Nguyen, T., & Capsi, A.(1985). Linking family hardship to children’s lives.
Child Development,56, 361-375.
Follette, V. & Jacobson, N. (1987). Importance of attitudes as a predictor of how people
cope with failure. Journal of Personality and Social Psychology, 52, 1205-
1211.
Flannery-Schroeder, E. & Kendall, P. (2002). Rigor, but not rigor mortis, in depression
research. Journal of Personality and Social Psychology, 68, 892-894.
Fleming, J. & Offord, D. (1990). Epidemiology of childhood depressive disorders: A
critical review. Journal of the American Academy of Child and Adolescent
Psychology, 29, 571-580.
Garber, J. & Flynn, C. (2001). Predictors of depression in young adolescents. Cognitive
Therapy and Research, 25(4), 353-376.

60
Garrison, C., Jackson, K., Marsteller, F., McKeown, R., & Addy, P. (1990). A
longitudinal study of depressive symptomatology in young adolescents. Journal
of the American Academy of Child and Adolescent Psychiatry, 29, 581-585.
Gibbs, J.T. (1997). African-American suicide: A cultural paradox. Sucide and Life
Threatening Behavior, 27, 68-70.
Gladstone, T. & Kaslow, N. (1995). Depression and attributions in children
and adolescents: A meta-analytic review. Journal of Abnormal Child Psychology.
23, 597-606.
Goodman, S., Adamson, L., Riniti, J., & Cole, S. (1994). Mothers’ expressed attitudes:
Association withmaternal depression and children’s self-esteem and
psychopathology. Journal of the American Academy of Child and Adolescent
Psychology, 33, 1265-1274.
Hammen, C. & Goodman-Brown, T. (1990). Self-schemas and vulnerability to specific
life stress in children at risk for depression. Cognitive Therapy and Research,
14(2), 215-227.
Hammen, C., Adrian, C. & Hiroto, D. (1988). A longitudinal test of the attribution
vulnerability model in children at risk for depression. British Journal of Clinical
Psychology, 27, 37-46.
Harrington, R., Rutter, M., Weissman, M., & Fudge, H. (1997). Psychiatric disorders in
the relatives of depressed probands: Comparison of prepubertal, adolescent and
early adult onset cases. Journal of Affective Disorders, 42, 9-22.
61
Hayward, C., Gotlib, I., Schraedley, P., & Litt, I (1999). Ethnic differences in
association between pubertal status and symptoms of depression in adolescent
girls. Journal of Adolescent Health, 25, 143-149.
Hedges, L. & Howell, A. (1999). Changes in the Black-White gap in achievement
test scores. Sociology of Education, 72(2), 111-135.
Helsel, W.J., & Matson, J.L. (1984). The assessment of depression in children: The
internal structure of the Child Depression Inventory (CDI). Behaviour Research
and Therapy, 22(3), 289-298.
Hillsman, R. & Garber, J. (1995). A test of the cognitive diathesis stress model of
depression in children: Academic stressors, attributional style, perceived
competence, and control. Journal of Personality and Social Psychology, 69(2),
370-380.
Hunsley, J. (1989). Vulnerability to depressive mood: An examination of temporal
consistency of reformulated learned helplessness model. Cognitive Therapy and
Research, 13, 599-608.
Jacobson, D. (1987). The cultural text of social support and support networks. Medical
Anthropology Quarterly, 1, 32-67.
Jaenicke, C., Hammen, C., Zupan, B., & Hiroto, D. (1987). Cognitive vulnerability in
children at risk for depression. Journal of Abnormal Child Psychology, 15, 559-
572.
Joiner, T.E. & Wagner, K.D. (1995). Attribution style and depression in children
and adolescents: A meta-analytic review. Clinical Psychology Review. 15(8), 777-
798.

62
Jones, W., Rhonda, J., Snowden, L. (1993). Symptoms of depression among Blacks and
Whites. American Journal of Public Health, 83(2), 240-244.
Kanner, A.D. , Feldman, S.S., Weinberger, D.A. , Ford, M.E. (1987). Uplifts, hassles,
and adaptational outcomes in early adolescents. Journal of Early Adolescence,
7(4), 371-394.
Kaslow, N., Rehm, L, & Siegel, A. (1984). Social cognitive and cognitive correlates of
depression in childhood. Journal of Abnormal Child Psychology, 12, 605-620.
Kaslow, N., Rehm, L., Pollack, S., & Siegel, A. (1988). Depression and perception of
family functioning in children and their parents. American Journal of Family
Therapy, 18(3), 227-235.
Kistner, J.A., David, C.F., & White, B.A. (2003). Ethnic and Sex Differences Children's
Depressive Symptoms. Journal of Clinical Child and Adolescent Psychology,
32(3), 341-350.
Kovacs, M. (1980). The efficacy of cognitive and behavior therapies for depression.
American Journal of Psychiatry, 137(12), 1495-1501.
Kovacs, M. (1981). Rating scales to assess depression in school-aged children.
Acta Paedopsychiatrica: International Journal of Child and Adolescent
Psychiatry, 46, 305-315.
Kovacs, M. (1996). The course of childhood onset depressive disorders. Psychiatric
Annals, 26(6), 326-330.
Kovacs, M., Obrosky, S., Gatsonis, C., & Richards, C. (1997). First episodes of Major
Depressive and Dysthymic Disorder in childhood: Clinical and sociodemographic
factors in recovery. Journal of Adolescent and Child Psychology, 36, 777-784.
63
Kwon, P. & Laurenceau, J. (2002). A longitudinal study of the hopelessness theory of
depression: Testing the diathesis-stress model within a differential reactivity and
exposure framework. Journal of Clinical Psychology, 58(10), 1305-1321.
Lewinsohn, P., Rohde, P., Seeley, J. & Fischer, S. (1993). Age-cohort changes in the
lifetime occurrence of depression and other mental disorders. Journal of
Abnormal Psychology, 102(1), 110-120.
Lewinsohn, P., Clarke, G., Seeley, J. & Rohde, P. (1994). Major depression in
community adolescents: Age at onset, episode duration, and time to recurrence.
Journal of the American Academy of Child and Adolescent Psychiatry, 33(6),
809-818.
Lubin, B. & McCollum, K. (1994). Depressive mood in Black and White female
adolescents. Adolescence, 29(113), 241-245.
McDonald, R. & Gynther, M. (1963). MMPI differences associated with sex, race, and
class in two adolescent samples. Journal of Consulting Psychology, 27(2), 112-
116.
Metalsky, G. & Joiner, T. (1992). Vulnerability to depressive symptoms: A prospective
test of the diathesis-stress and causal-mediation component of the hopelessness
theory of depression. Journal of Personality and Social Psychology, 63, 667-675.
Metalsky, G. & Joiner, T. (1997). The hopelessness depression symptom questionnaire.
Cognitive Therapy and Research, 21, 359-384.
National Advisory Mental Health Council (1998). National Institute of Mental Health.
Retrieved March, 2004 from http://www.nimh.nih.gov/council/advis.cfm.

64
National Center of Educational Statistics (2000). Retrieved March, 2004 from
http://nces.ed.gov/.
National Comorbidity Survey (1994). Retrieved February, 2004 from
http://www.hcp.med.harvard.edu/ncs/.
National Institute of Mental Health (2002). Depression. Retrieved March, 2004 from
www.nimh.nih.gov/publicat/depression.menu.cfm.
National Mental Health Association (2004). Retrieved April, 2004 from
http://www.nmha.org/ccd/support/women.cfm.
Nolen-Hoeksema, S. (1987). Sex differences in unipolar depression: evidence and
theory. Psychological Bulletin, 101(2), 259-282.
Nolen-Hoeksema, S. (1992). Children coping with uncontrollable stressors. Applied and
preventative psychology, 1(4), 183-189.
Nolen-Hoeksema, S. (1994). An interactive model for the emergence of gender
differences in depression in adolescence. Journal of Research on Adolescence,
4(4), 519-534.
Nolen-Hoeksema, S., Girgus, J., & Seligman, M. (1986). Learned helplessness in
childhood: A longitudinal study of depression, achievement, and explanatory
styles. Journal of Personality and Social Psychology, 51, 435-442.
Oliver, J.M., & Berger, L.S. (1992). Depression, parent-offspring relationship, and
cognitive vulnerability. Journal of Social Behavioral and Personality, 17, 415-
429
65
Panak, W. & Garber, J. (1992). Role of aggression, rejection, and attributions in the
prediction of depression in children. Development and Psychopathology,
4(1),145-165.
Persons, J. & Miranda, J. (1992). Cognitive theories of vulnerability to depression:
Reconciling negative evidence. Cognitive Therapy and Research, 16, 485-502.
Peterson, E. & Seligman, M. (1984). Causal explanations as a risk factor for depression:
Theory and evidence. Psychological Review, 91, 347-374.
Ralph, J. & Mineka, S. (1998). Attributional style and self-esteem: The prediction of
emotional distress following a mid-term exam. Journal of Abnormal Psychology,
107, 203-215).
Roberts, R., Roberts, C., & Chen, R. (1997). Ethnocultural differences in prevalence of
adolescent suicidal behaviors. Suicide and Life Threatening Behavior, 27(2), 208-
217.
Robins, C. & Hayes, A. (1995). Interpersonal and achievement concerns and the
depression vulnerability and symptoms specificity hypothesis: A prospective
study. CognitiveTherapy and Research, 19, 1-20.
Rodriguez, E., Allen, J., Frongillo, E., & Chandra, P. (1999). Unemployment,
Depression, and Health: A Look at the African American Community. Journal of
Epidemiology and Community Health, 53(6), 335-342.
Rose, D. & Abramson, L. (1992). Developmental predictors of depressive
cognitive style: Research and theory. Developmental perspectives on depression,
323-349.

66
Ryan N., Puig, A., & Ambrosini P. (1987). The clinical picture of major depression in
children and adolescents. Archives of General Psychiatry, 44, 854-861.
Saez-Santiago, E., Bernal G. (2003). Depression and Ethnic Minorities. Handbook of
racial andethnic minority psychology, Thousand Oaks, CA.: Sage Publications.
Samaan R. (1998). The influences of race, ethnicity, and poverty on the mental health of
children.(2000). Journal of Health Care for the Poor and Underserved ,11, 100-
110.
Schraedley, P., Gotlib, I., & Hayward, C. (1999). Gender differences in correlates of
depressive symptoms in adolescents. Journal of Adolescent Health, 25(2), 98-
108.
Seligman,M., Abramson, L., Semmel, A., & Von-Baeyer, C. (1984). Depressive
attributional style. Southern Psychologist, 2(1), 18-22.
Seligman, M. (1989). Sex differences in depression and explanatory style in children.
Journal ofYouth and Adolescence, 20, 233-245.
Senior P. & Bhopal R. (1994) Ethnicity as a variable in epidemiological research.
British Medical Journal, 309: 327-330.
Skinner, E.A. (1990). Age differences in the dimensions of perceived control during
middle childhood: Implications for developmental conceptualizations and
research. Child Development, 61(6), 1880-1890.
Smucker, M., Craighead, W., & Green, B. (1986). Normative and reliability data for the
Depressive Inventory. Journal of Abnormal Child Psychology, 14, 25-29.

67
Stark, K., Schmidt, K., & Joiner, T. (1996). Cognitive triad: Relationship to depressive
symptoms,parents’ cognitive triad and perceived parental messages. Journal of
Abnormal Child Psychology,24, 615-631.
Swanson, J., Linskey, A., Quintero-Salinas, R., & Pumariega, A. (1992). A binational
school survey of depressive symptoms, drug use, and suicidal ideation. Journal of
the American Academy of Child and Adolescent Psychiatry, 31(4): 669-678.
Tashman, N.A. (1997). The parent child study: Cognitive syle, psychopathology,
personality dysfunction, and parent-child relations in the parents of children at
high and low cognitive risk for depression. The Sciences and Engineering, 5 (3-
B): 1549.
Turk, E. & Bry, B. (1992). Adolescents’ and parents’ explanatory styles and parent’s
causal explanation about their adolescents. Cognitive Therapy and Research, 16,
349-357.
Turner, J. &; Cole, D. (1994). Development differences in cognitive diatheses for child
depression. Journal of Abnormal Child Psychology, 22(1), 15-32.
Twenge, J. & Nolen-Hoeksema, S. (2002). Age, gender, race, socioeconomic status, and
birth cohort difference on the children's depression inventory: A meta-analysis.
Journal of Abnormal Psychology, 111(4), 578-588.
U.S. Surgeon General (1999). Retrieved on February, 2004 from
http://www.surgeongeneral.gov/.
U.S. Census (2000). Retrieved on March, 2004 from http://www.census.gov/.
Voelker, R. (2003). Researchers probe depression in children and adolescents. Journal of
the American Medical Association, 289, 3078-3079.

68
Weiss, Weiz, Politano, & Cary (1991). Developmental differences in factor structure of
theChildren’s Depressive Inventory. Psychological Assessment, 3, 38-45.
Weissman, M. Wolk, S., & Goldstein R. (1999). Depressed adolescents grown up.
Journal of theAmerican Medical Association, 281, 1701-1713.
World Health Organization (2004). Depression. Retrieved January, 2004 from
http://www.who.int/en/.
Wrobel, N. & Lachar, D. (1995). Racial differences in adolescent self-report: A
comparative validity study using homogeneous MMPI content measures.
Psychological Assessment, 7(2), 140-147.
Zhang, A. & Snowden, L. (1999). Ethnic characteristics of mental disorders in five U.S.
communities. Cultural Diversity and Ethnic Minority Psychology, 5(2), 134-146.
Related Documents