Atmósfera 24(1), 141-155 (2011) Vulnerability of water resources to climate change scenarios. Impacts on the irrigation districts in the Guayalejo-Tamesí river basin, Tamaulipas, México G. SANCHEZ-TORRES ESQUEDA Universidad Autónoma de Tamaulipas, Facultad de Ingeniería “Arturo Narro Siller”, División de Estudios de Posgrado e Investigación, Centro Universitario Tampico-Madero Corresponding author: G.SANCHEZ; e-mail: [email protected] J. E. OSPINA-NOREÑA, C. GAY-GARCÍA and C. CONDE Centro de Ciencias de la Atmósfera, Universidad Nacional Autónoma de México, Circuito Exterior, Ciudad Universitaria, México, D.F. 04510 México. Received mayo 18, 2009; accepted june 22, 2010 RESUMEN En este artículo se describe la metodología aplicada para la modelación de la disponibilidad del agua en la cuenca del Río Guayalejo-Tamesí, en el sur de Tamaulipas, México, tomando en cuenta los efectos que el cambio climático puede tener sobre la disponibilidad del agua en los sectores municipal, industrial y agrícola. Los resultados obtenidos indicaron que el sector agrícola es el más afectado; por lo que, los resultados que se describen en este artículo hacen especial énfasis en el sector agrícola. La relación Precipitación/Temperatura o Índice de Lang fue el parámetro que se utilizó para determinar la vulnerabilidad del área de estudio ante el cambio climático. Se aplicó la nueva versión del programa MAGICC/ScenGen considerando los modelos MPIECH-5, GFDL2.0 y UKHADCM3, para los escenarios de emisiones A2 y B2. ABSTRACT This paper presents an assessment of the impacts of climate change induced water availability varia- tions on the irrigation districts in the Guayalejo-Tamesí River Basin in Tamaulipas, México. A model was developed using WEAP (Water Evaluation and Planning) to describe the vulnerability of the water resources in the case study river basin, taking into account the effects that climate change can have on water availability in the municipal, industrial, and agricultural sectors. The parameter to assess the extent to which the area is vulnerable to climate change was the Precipitation/Temperature relationship, or Lang Index. The latest version of the climate change program MAGICC/ScenGen was used, considering the MPIECH-5, GFDL2.0, and UKHADCM3 models for the A2 and B2 greenhouse gas emissions scenarios. The results indicate that climate change scenarios have the most negative impact on water availability in the agricultural sector. In addition, an analysis of the results suggests that water concessions, irrigation districts and hydraulic infrastructure in the river basin need to be reconsidered and updated to assure water availability to all its users. Keywords: basin, water availability, vulnerability, water resources, climate change scenarios, public policies.

Welcome message from author
This document is posted to help you gain knowledge. Please leave a comment to let me know what you think about it! Share it to your friends and learn new things together.
Transcript
Atmósfera 24(1), 141-155 (2011)
Vulnerability of water resources to climate change scenarios. Impacts on the irrigation districts in the Guayalejo-Tamesí river basin,
Tamaulipas, México
G. SANCHEZ-TORRES ESQUEDAUniversidad Autónoma de Tamaulipas, Facultad de Ingeniería “Arturo Narro Siller”, División de
Estudios de Posgrado e Investigación, Centro Universitario Tampico-MaderoCorresponding author: G.SANCHEZ; e-mail: [email protected]
J. E. OSPINA-NOREÑA, C. GAY-GARCÍA and C. CONDECentro de Ciencias de la Atmósfera, Universidad Nacional Autónoma de México, Circuito Exterior,
Ciudad Universitaria, México, D.F. 04510 México.
Received mayo 18, 2009; accepted june 22, 2010
RESUMEN
En este artículo se describe la metodología aplicada para la modelación de la disponibilidad del agua en la cuenca del Río Guayalejo-Tamesí, en el sur de Tamaulipas, México, tomando en cuenta los efectos que el cambio climático puede tener sobre la disponibilidad del agua en los sectores municipal, industrial y agrícola. Los resultados obtenidos indicaron que el sector agrícola es el más afectado; por lo que, los resultados que se describen en este artículo hacen especial énfasis en el sector agrícola. La relación Precipitación/Temperatura o Índice de Lang fue el parámetro que se utilizó para determinar la vulnerabilidad del área de estudio ante el cambio climático. Se aplicó la nueva versión del programa MAGICC/ScenGen considerando los modelos MPIECH-5, GFDL2.0 y UKHADCM3, para los escenarios de emisiones A2 y B2.
ABSTRACT
This paper presents an assessment of the impacts of climate change induced water availability varia-tions on the irrigation districts in the Guayalejo-Tamesí River Basin in Tamaulipas, México. A model was developed using WEAP (Water Evaluation and Planning) to describe the vulnerability of the water resources in the case study river basin, taking into account the effects that climate change can have on water availability in the municipal, industrial, and agricultural sectors. The parameter to assess the extent to which the area is vulnerable to climate change was the Precipitation/Temperature relationship, or Lang Index. The latest version of the climate change program MAGICC/ScenGen was used, considering the MPIECH-5, GFDL2.0, and UKHADCM3 models for the A2 and B2 greenhouse gas emissions scenarios. The results indicate that climate change scenarios have the most negative impact on water availability in the agricultural sector. In addition, an analysis of the results suggests that water concessions, irrigation districts and hydraulic infrastructure in the river basin need to be reconsidered and updated to assure water availability to all its users.
Keywords: basin, water availability, vulnerability, water resources, climate change scenarios, public policies.

142 G. Sanchez-Torres Esqueda et al.
1. IntroductionThe Guayalejo-Tamesí river basin Commission (CCRGT for its abbreviation in Spanish) is part of the Pánuco River Basin Council. The Guayalejo-Tamesí River is the final tributary of the Pánuco River before it flows into the Gulf of México and virtually the entire area of the river basin is located in the southern part of the state of Tamaulipas, México. According to the guidelines and regulations of the River Basin Councils, the CCRGT’s main objective is the integrated management of the water resources in the river basin with the participation of all the users.
In water resource management meetings and workshops held by the CCRGT, the need for a study of current water availability in the Guayalejo-Tamesí basin was identified in order to determine to what extent the water in this basin is available to its users and thereby identify the public policies that would assure the sustainable management of its water resources in both the short and mid terms.
As a result of this decision, a model of the availability of water was developed by means of the application of WEAP (Water Evaluation and Planning). A software tool that uses the basic principle of mass balance, the WEAP program can be used for municipal and agricultural systems, in a single basin or in complex basin systems. In addition, this program can simulate a wide range of the natural and man modified components of river basin systems, including rainfall runoff, base flows, aquifer recharge, analysis of demand for water by sectors, water conservation policies, water rights and priority outlines for the assignation of water, reservoir operations, hydroelectric power generation, contamination processes and water quality monitoring, vulnerability assessments, and the hydrological requirements of ecosystems. Furthermore, a financial analysis model in the WEAP program facilitates cost-benefit comparisons of several projects (Lee et al., 2005; Sieber and Purkey, 2007).
2. The use of water in the Guayalejo-Tamesí River Basin All the information concerning water use and users in the Guayalejo-Tamesí river basin was compiled during years of 2004-2006, and was subsequently incorporated into the WEAP model. This database includes 1283 users of surface water, 1337 users of groundwater, 3 irrigation districts (Xicoténcatl, Mante, and Las Ánimas), the main urban centers, the industrial port of Altamira (Puerto Industrial de Altamira [PIA]), as well as the basin’s existing infrastructure.
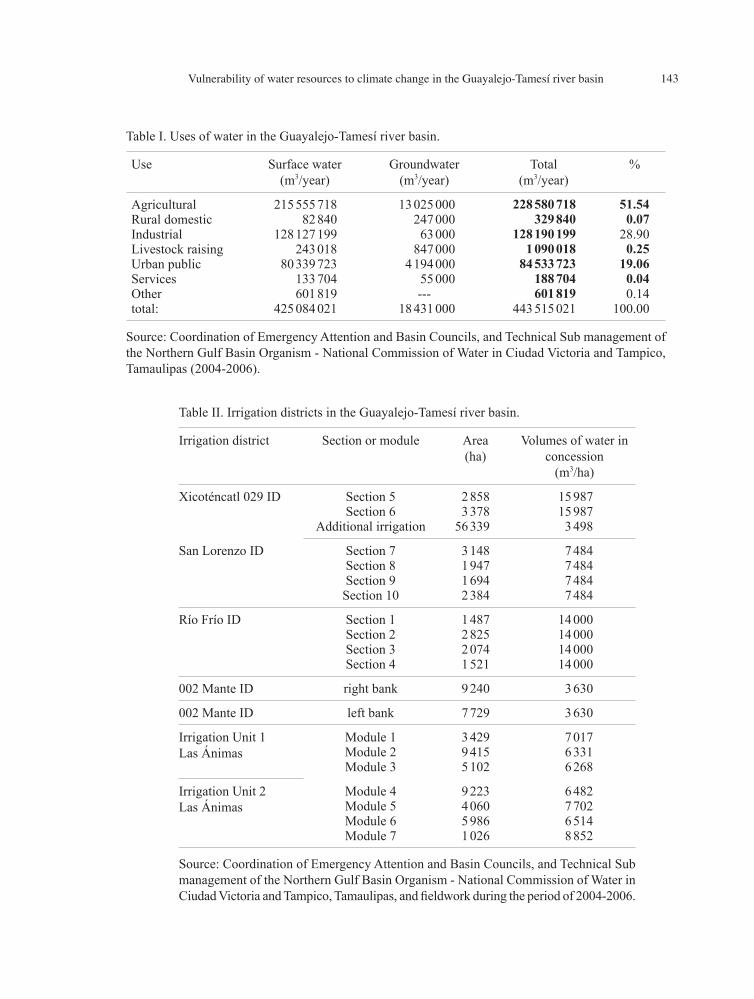
The volumes of water in concession through water rights and their corresponding uses in the river basin are shown in Table I. Of the total water in concession, 51.54% was used for agriculture, 28.9% for industry, and 19.06% for urban public services.
Within the agricultural sector, the irrigation districts incorporated into the WEAP model along with their corresponding irrigation areas and the irrigation volumes that were in concession in each area are shown in Table II. The Xicoténcatl 029 irrigation district includes the Río Frío, Xicoténcatl, and San Lorenzo irrigation districts. The Mante irrigation district is made up of the irrigation areas of right bank and left bank, and the Las Ánimas irrigation district includes irrigation units 1 and 2. The volumes of water for irrigation shown in Table II as m3/ha are the result of dividing the volumes of water which were given in concession to each irrigation district by the corresponding irrigation area.
143Vulnerability of water resources to climate change in the Guayalejo-Tamesí river basin
Table I. Uses of water in the Guayalejo-Tamesí river basin.
Use Surface water(m3/year)
Groundwater(m3/year)
Total(m3/year)
%
Agricultural 215 555 718 13 025 000 228 580 718 51.54Rural domestic 82 840 247 000 329 840 0.07Industrial 128 127 199 63 000 128 190 199 28.90Livestock raising 243 018 847 000 1 090 018 0.25Urban public 80 339 723 4 194 000 84 533 723 19.06Services 133 704 55 000 188 704 0.04Other 601 819 --- 601 819 0.14total: 425 084 021 18 431 000 443 515 021 100.00
Source: Coordination of Emergency Attention and Basin Councils, and Technical Sub management of the Northern Gulf Basin Organism - National Commission of Water in Ciudad Victoria and Tampico, Tamaulipas (2004-2006).
Table II. Irrigation districts in the Guayalejo-Tamesí river basin.
Irrigation district Section or module Area(ha)
Volumes of water inconcession
(m3/ha)
Xicoténcatl 029 ID Section 5 2 858 15 987Section 6 3 378 15 987
Additional irrigation 56 339 3 498
San Lorenzo ID Section 7 3 148 7 484Section 8 1 947 7 484Section 9 1 694 7 484Section 10 2 384 7 484
Río Frío ID Section 1 1 487 14 000Section 2 2 825 14 000Section 3 2 074 14 000Section 4 1 521 14 000
002 Mante ID right bank 9 240 3 630
002 Mante ID left bank 7 729 3 630
Irrigation Unit 1Las Ánimas
Module 1 3 429 7 017Module 2 9 415 6 331Module 3 5 102 6 268
Irrigation Unit 2Las Ánimas
Module 4 9 223 6 482Module 5 4 060 7 702Module 6 5 986 6 514Module 7 1 026 8 852
Source: Coordination of Emergency Attention and Basin Councils, and Technical Sub management of the Northern Gulf Basin Organism - National Commission of Water in Ciudad Victoria and Tampico, Tamaulipas, and fieldwork during the period of 2004-2006.

144 G. Sanchez-Torres Esqueda et al.
Table III presents the information on demand centers and population that was incorporated into the WEAP model. These figures were based on the results of the 2000 Census and the 2005 population count which were carried out by INEGI, as well as on the their population projections for these cities and the municipalities for 2010. The total municipal population is the sum of the urban and rural inhabitants. Since the municipalities of Tampico and Ciudad Madero are completely urbanized, the figures for these two cities represent the total population. The projected population for 2010 is 707 390 inhabitants in the main urban centers and 964 334 in the municipalities.
3. A Model of climate change in the Guayalejo-Tamesí river basinOne of the main objectives of this study was to determine the possible scenarios of climate change and then incorporate this information into the WEAP model in order to determine the impact that climate change is likely to have on the natural availability of the water resources in the river basin.
The modeling process generated these vulnerability scenarios using the P/T ratio, or Lang Index, and the latest versions of the climate change models ECHAM and GFDL (MPIECH-5 and GFDL2.0) for A2 and B2 emissions scenarios. In addition, the natural renewable water supply in the river basin under various climate change scenarios was determined. Several variables affecting water availability such as the supply/demand ratio in the river basin were considered, including unmet demand by use and by sector, demand coverage, and supply requirements.
Table III. Population of the main urban centers in the Guayalejo-Tamesí river basin
Demandcenter
2000 Census 2005 Count Population projections 2010
Urbanpopulation
Total municipalpopulation
Urban population
Totalmunicipalpopulation
Urban population
Municipal population
Palmillas 992 1 821 951 1 603 912 1 420Jaumave 4 090 13 184 4 766 14 021 5 608 14 934Llera 3 705 18 017 3 968 17 317 4 258 16 655Xicoténcatl 8 645 22 464 8 941 21 877 9 251 21 311Gómez Farías 905 8 570 891 8 464 877 8 360Mante Antiguo 80 533 112 602 81 884 112 061 83 267 111 524Morelos 2 978 8 915 3 042 8 561 3 108 8 226Ocampo 4 784 13 303 4 781 12 477 4 778 11 721GonzálezG. Sánchez
10 2664 080
41 455 10 6834 169
40 946 11 1244 261
40 446
Altamira 41 713 127 664 50 896 162 628 63 132 212 322Tampico 295 442 295 442 303 635 303 924 312 149 312 750Cd. Madero 182 325 182 325 193 045 193 045 204 665 204 665Totals 640 458 845 762 671 652 896 924 707 390 964 334
Source: INEGI. 2000 Census and 2005 Population Count.

145Vulnerability of water resources to climate change in the Guayalejo-Tamesí river basin
The P/T ratio was obtained by running the MAGICC/ScenGen1 program (Version 5.3) for the MPIECH-5, GFDL2.0, UKHADCM3 models. Considering the A2, B2, B1, and A1B scenarios of greenhouse gas emissions, rainfall anomalies in the basin during the periods of 2010-2039 and 2040-2069 were estimated in order to establish the water year type (Very wet, Wet, Average, Dry or Very dry), which was entered as input data for the WEAP modeling runs. The anomalies found were interpolated at the location of the Magiscatzin weather and hydrometric station; from this point, the climate baseline for the period of 1960-1990 was generated. Tables IV and V show these results. Based on the results of the MAGICC/Scen-Gen runs, it is evident that no Wet or Very wet years are expected in the Guayalejo-Tamesí river basin for the 2010-2069 period.
During the1961-1990 period, the annual mean precipitation at the Magiscatzin weather station, which is located at the geographical center of the basin, was 826.5 mm. Based on this rainfall data, the criteria for determining the type of water year according to the annual mean precipitation were established as follows:
• When in any given year the precipitation is below 95% of the annual mean precipitation of the1961-1990 period, that year was classified as a Very dry year;
• When in any given year the precipitation ranges between 95% and 97.5% of the annual mean precipitation of the 1961-1990 period, that year was classified as a Dry year;
1Simple climate models have been developed that allow the input of a wide range of emissions scenarios to climate change studies. These models can simulate the global climate response to changes in the concentrations of greenhouse gases (GHG) in terms of the increase of temperature and the rise of sea level. The simple model used in this study was the Model for the Assessment of Greenhouse-gas Induced Climate Change (MAGICC). To combine the results of the MAGICC program with the output of the general circulation models, the Scenario Generator program (Scen-Gen) was used. (Wigley 1994 and 2003; Hulme et al. 2000).
Table IV. Water year types in the models and scenarios selected for the Guayalejo-Tamesí river basin. 2010-2039 period.
Water year type
GFDLCM20 UKHADGEM MPIECH-5
A2 B2 B1 A1B A2 B2 B1 A1B A2 B2 B1 A1B
Average 2010-2012
2010-2039
2010-2039
2010-2017
2010-2039
2010-2010
2010-20142036-2039
2010-2011
2010-2030
2010-2028
Dry 2013-2023
2010-20242033-2039
2018-2033
2015-2035
2012-2020
2031-2039
2029-2039
2010-2018
Very dry 2024-2039
2025-2032
2034-2039
2021-2039
2019-2039

146 G. Sanchez-Torres Esqueda et al.
• When in any given year the precipitation ranges between 97.5 and 102.5% of the annual mean precipitation of the 1961-1990 period, that year was classified as an Average year;
• When in any given year the precipitation ranges between 102.5 and 105% of the annual mean precipitation of the 1961-1990 period, that year was classified as a Wet year;
• When in any given year the precipitation is higher than 105% of the annual mean precipitation of the 1961-1990 period, that year was classified as a Very wet year.
In order to include projections of temperature in the study area, anomalies of mean temperature were estimated, using the output of the MAGICC/ScenGen (Version 5.3) programs for the aforementioned models and scenarios. With these data, predictions about temperature were calculated in accordance with the baseline using the registers for the 1971-2000 period.
The projections of precipitation and temperature were used to calculate the P/T ratio (Lang Index, IL), which, according to Urbano (1995), can be interpreted as follows:
The ranges in Table VI were used to classify zones with significant differences in precipitation and temperature. The Lang Index for the Guayalejo-Tamesí river basin has a value of 33.06, which lies approximately at the midpoint of the range corresponding to the Arid zone (20 ≤ IL < 40).
Table V. Water year type in the models and scenarios selected for the Guayalejo-Tamesí river basin. 2040-2069 period.
Water year type
GFDLCM20 UKHADGEM MPIECH-5
A2 B2 B1 A1B A2 B2 B1 A1B A2 B2 B1 A1B
Average 2040-2055
2040-20442059-2069
2069
2040-2069
2040-2069
2040-2069
Dry 2056-2069
2045-2058
2040-2068
2063-2069
2040-2069
2040-2069
2041-20422065-2069
Very dry 2040-2069
2040-2062
2040-2069
20402043-2064
Table VI. Lang’s climate zones.
IL Climate zones
0 ≤ IL < 20 Desert20 ≤ IL < 40 Arid zone 40 ≤ IL < 60 Wet zone of steppe and savannah60 ≤ IL < 100 Wet zone of sparse forest100 ≤ IL < 160 Wet zone of dense forest
IL ≥ 160 Very wet zone of grassland and tundra
147Vulnerability of water resources to climate change in the Guayalejo-Tamesí river basin
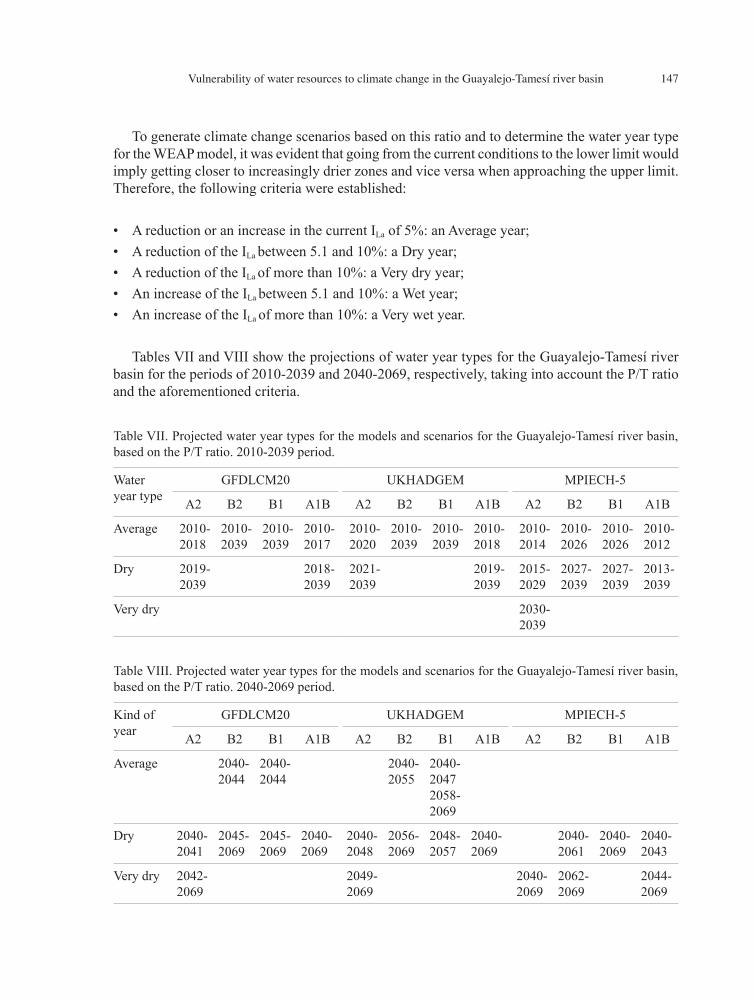
To generate climate change scenarios based on this ratio and to determine the water year type for the WEAP model, it was evident that going from the current conditions to the lower limit would imply getting closer to increasingly drier zones and vice versa when approaching the upper limit. Therefore, the following criteria were established:
• A reduction or an increase in the current ILa of 5%: an Average year;• A reduction of the ILa between 5.1 and 10%: a Dry year;• A reduction of the ILa of more than 10%: a Very dry year;• An increase of the ILa between 5.1 and 10%: a Wet year; • An increase of the ILa of more than 10%: a Very wet year.
Tables VII and VIII show the projections of water year types for the Guayalejo-Tamesí river basin for the periods of 2010-2039 and 2040-2069, respectively, taking into account the P/T ratio and the aforementioned criteria.
Table VII. Projected water year types for the models and scenarios for the Guayalejo-Tamesí river basin, based on the P/T ratio. 2010-2039 period.
Water year type
GFDLCM20 UKHADGEM MPIECH-5
A2 B2 B1 A1B A2 B2 B1 A1B A2 B2 B1 A1B
Average 2010-2018
2010-2039
2010-2039
2010-2017
2010-2020
2010-2039
2010-2039
2010-2018
2010-2014
2010-2026
2010-2026
2010-2012
Dry 2019-2039
2018-2039
2021-2039
2019-2039
2015-2029
2027-2039
2027-2039
2013-2039
Very dry 2030-2039
Table VIII. Projected water year types for the models and scenarios for the Guayalejo-Tamesí river basin, based on the P/T ratio. 2040-2069 period.
Kind of year
GFDLCM20 UKHADGEM MPIECH-5
A2 B2 B1 A1B A2 B2 B1 A1B A2 B2 B1 A1B
Average 2040-2044
2040-2044
2040-2055
2040-20472058-2069
Dry 2040-2041
2045-2069
2045-2069
2040-2069
2040-2048
2056-2069
2048-2057
2040-2069
2040-2061
2040-2069
2040-2043
Very dry 2042-2069
2049-2069
2040-2069
2062-2069
2044-2069
148 G. Sanchez-Torres Esqueda et al.
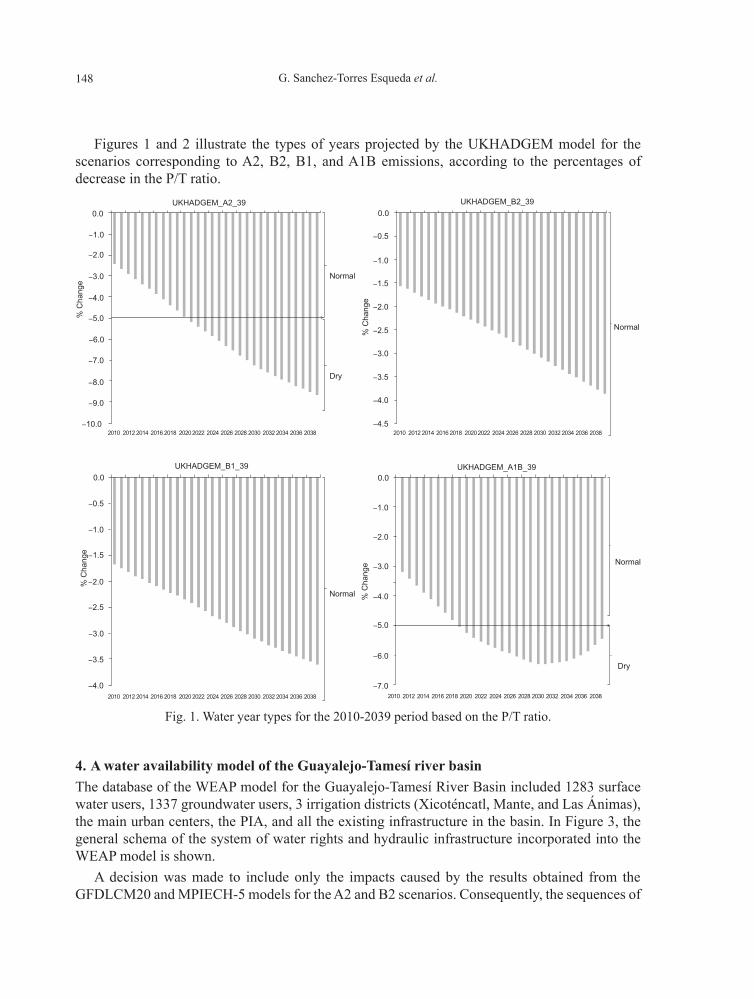
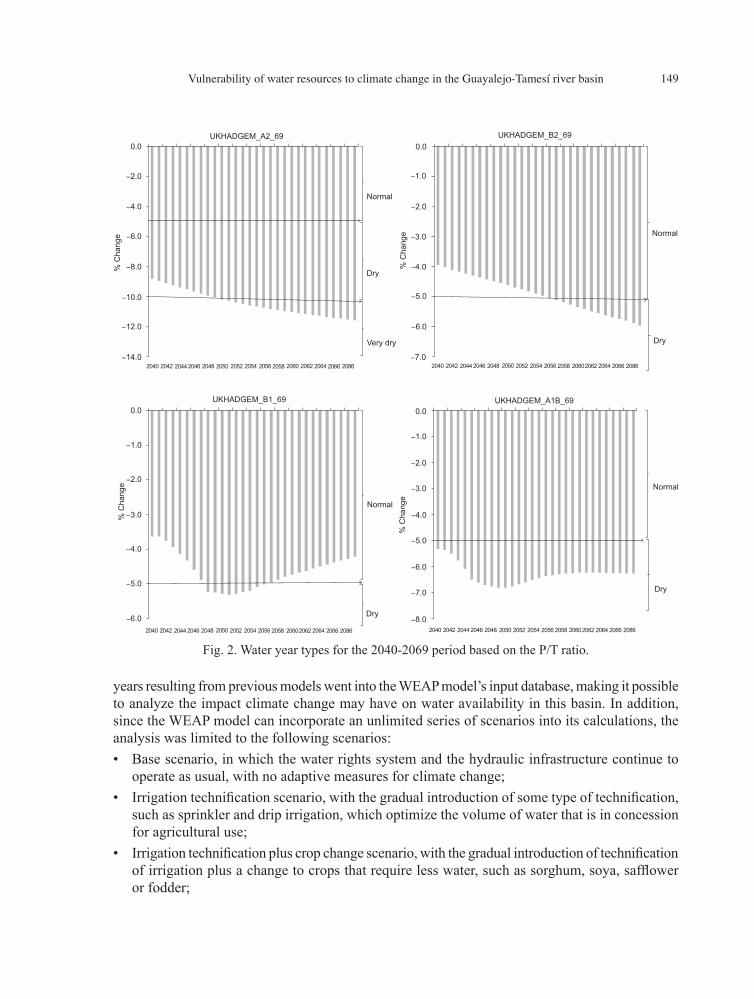
Figures 1 and 2 illustrate the types of years projected by the UKHADGEM model for the scenarios corresponding to A2, B2, B1, and A1B emissions, according to the percentages of decrease in the P/T ratio.
4. A water availability model of the Guayalejo-Tamesí river basinThe database of the WEAP model for the Guayalejo-Tamesí River Basin included 1283 surface water users, 1337 groundwater users, 3 irrigation districts (Xicoténcatl, Mante, and Las Ánimas), the main urban centers, the PIA, and all the existing infrastructure in the basin. In Figure 3, the general schema of the system of water rights and hydraulic infrastructure incorporated into the WEAP model is shown.
A decision was made to include only the impacts caused by the results obtained from the GFDLCM20 and MPIECH-5 models for the A2 and B2 scenarios. Consequently, the sequences of
Normal
0.0UKHADGEM_A2_39
Dry
2010 2012 2014 2016 2018 20202022 2024 2026 2028 2030 2032 2034 2036 2038
% C
hang
e
−1.0
−2.0
−3.0
−4.0
−5.0
−6.0
−7.0
−8.0
−9.0
−10.0
Normal
0.0UKHADGEM_A1B_39
Dry
2010 2012 2014 2016 2018 2020 2022 2024 2026 2028 2030 2032 2034 2036 2038
% C
hang
e
−1.0
−2.0
−3.0
−4.0
−5.0
−6.0
−7.0
Normal
0.0UKHADGEM_B2_39
2010 2012 2014 2016 2018 20202022 2024 2026 2028 2030 2032 2034 2036 2038
% C
hang
e
−0.5
−1.0
−1.5
−2.0
−2.5
−3.0
−3.5
−4.0
−4.5
Normal
0.0UKHADGEM_B1_39
2010 2012 2014 2016 2018 20202022 2024 2026 2028 2030 2032 2034 2036 2038
% C
hang
e
−0.5
−1.0
−1.5
−2.0
−2.5
−3.0
−3.5
−4.0
Fig. 1. Water year types for the 2010-2039 period based on the P/T ratio.
149Vulnerability of water resources to climate change in the Guayalejo-Tamesí river basin
years resulting from previous models went into the WEAP model’s input database, making it possible to analyze the impact climate change may have on water availability in this basin. In addition, since the WEAP model can incorporate an unlimited series of scenarios into its calculations, the analysis was limited to the following scenarios: • Base scenario, in which the water rights system and the hydraulic infrastructure continue to
operate as usual, with no adaptive measures for climate change;• Irrigation technification scenario, with the gradual introduction of some type of technification,
such as sprinkler and drip irrigation, which optimize the volume of water that is in concession for agricultural use;
• Irrigation technification plus crop change scenario, with the gradual introduction of technification of irrigation plus a change to crops that require less water, such as sorghum, soya, safflower or fodder;
Normal
0.0UKHADGEM_A2_69
Very dry
Dry% C
hang
e
−2.0
−4.0
−6.0
−8.0
−10.0
−12.0
−14.0
Normal
0.0UKHADGEM_A1B_69
Dry
2040 2042 2044 2046 2048 2050 2052 2054 2056 2058 20602062 2064 2066 2086
2040 2042 2044 2046 2048 2050 2052 2054 2056 2058 20602062 2064 2066 2086
2040 2042 2044 2046 2048 2050 2052 2054 2056 2058 20602062 2064 2066 2086
% C
hang
e
−1.0
−2.0
−3.0
−4.0
−5.0
−6.0
−8.0
−7.0
Normal
Dry
0.0UKHADGEM_B2_69
% C
hang
e
−1.0
−2.0
−3.0
−4.0
−5.0
−6.0
−7.0
Normal
Dry
0.0UKHADGEM_B1_69
% C
hang
e
−1.0
−2.0
−3.0
−4.0
−5.0
−6.0
2040 2042 2044 2046 2048 2050 2052 2054 2056 2058 2060 2062 2064 2066 2086
Fig. 2. Water year types for the 2040-2069 period based on the P/T ratio.

150 G. Sanchez-Torres Esqueda et al.
• Irrigation technification plus crop area reduction scenario, with a gradual introduction of technification of irrigation plus a gradual decrease in the irrigated areas used for farming.The results of the WEAP model show the percentage of the monthly demand of water that has
been met during the 2010-2069 period in the main urban centers, municipalities, and irrigation districts of the Guaylejo-Tamesí river basin.
Results of the WEAP model for the base scenarioThe following results are for the base scenario, in which the current water concession system and hydraulic infrastructure continue to operate as they do at present, without adaptive measures for climate change. In addition, the results shown come mainly from the irrigation districts which were incorporated into the WEAP model because these were the water demand centers with serious water scarcity.
In general, the water demand centers corresponding to the urban areas and to the PIA had minimal or no water scarcity problems except for the semi-urban center known as Xico Neighborhoods (Colonias Xico). The cities and towns included in the WEAP model were: Palmillas, Jaumave, Llera, Xicoténcatl, Gómez Farías, Mante, Antiguo Morelos, Ocampo González, Graciano Sánchez, Altamira, Tampico, and Ciudad Madero. The rural population, which depends on ground water for its water supply, had some water supply problems. However, it was the agricultural sector which was the most seriously affected by the unmet demand for water; therefore, the following results refer only to this sector.
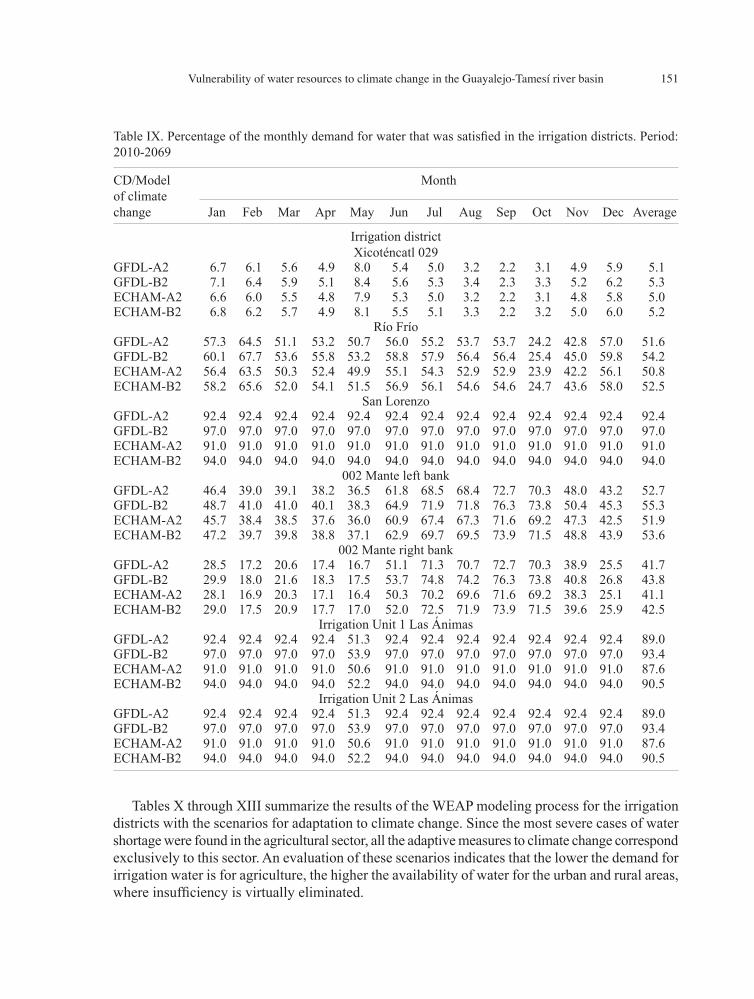
Table IX shows the percentage of the monthly demand for water that was satisfied in the irrigation districts located in the basin. An analysis of these results clearly shows that not only is the agricultural sector the most seriously affected by the negative impacts of climate change, but also how vulnerable it is to climate variation due to the way water concessions have been assigned, and the way irrigation districts have been created and operated in the basin. Because of the lack of thorough, detailed studies of water availability in the region, the CNA has given farmers –through concessions or water rights– volumes of water greater than the natural supply, especially in the irrigation districts of Xicoténcatl 029, Río Frío, and Mante 002 (left bank and right bank).
The results in Table IX show that the agricultural sector has great difficulty covering the demand for irrigation water. It is therefore necessary to verify and update the concession of irrigation water in the river basin, given the fact that the current system of granting water rights does not consider the natural water availability in the basin. In other words, the agricultural sector has been granted concessions for larger volumes of water than the available supply.
Results of the WEAP model, according to three scenarios of adaptation to climate change The figures shown in the previous tables refer only to the base scenario and do not consider any measures of adaptation to climate change that would be implemented in the main water demand centers of the urban and rural sectors and to the irrigation districts in the basin. Based on these results, it can be concluded that, generally speaking, most of the urban centers do not face severe problems of supply or coverage of water needs. In the rural sector, however, those users who depend on groundwater for their water supply have some difficulty meeting their needs. The levels of coverage are the lowest in the agricultural sector, and it is these users that experience the most scarcity.
151Vulnerability of water resources to climate change in the Guayalejo-Tamesí river basin
Tables X through XIII summarize the results of the WEAP modeling process for the irrigation districts with the scenarios for adaptation to climate change. Since the most severe cases of water shortage were found in the agricultural sector, all the adaptive measures to climate change correspond exclusively to this sector. An evaluation of these scenarios indicates that the lower the demand for irrigation water is for agriculture, the higher the availability of water for the urban and rural areas, where insufficiency is virtually eliminated.
Table IX. Percentage of the monthly demand for water that was satisfied in the irrigation districts. Period: 2010-2069
CD/Model of climatechange
Month
Jan Feb Mar Apr May Jun Jul Aug Sep Oct Nov Dec Average
Irrigation districtXicoténcatl 029
GFDL-A2 6.7 6.1 5.6 4.9 8.0 5.4 5.0 3.2 2.2 3.1 4.9 5.9 5.1GFDL-B2 7.1 6.4 5.9 5.1 8.4 5.6 5.3 3.4 2.3 3.3 5.2 6.2 5.3ECHAM-A2 6.6 6.0 5.5 4.8 7.9 5.3 5.0 3.2 2.2 3.1 4.8 5.8 5.0ECHAM-B2 6.8 6.2 5.7 4.9 8.1 5.5 5.1 3.3 2.2 3.2 5.0 6.0 5.2
Río FríoGFDL-A2 57.3 64.5 51.1 53.2 50.7 56.0 55.2 53.7 53.7 24.2 42.8 57.0 51.6GFDL-B2 60.1 67.7 53.6 55.8 53.2 58.8 57.9 56.4 56.4 25.4 45.0 59.8 54.2ECHAM-A2 56.4 63.5 50.3 52.4 49.9 55.1 54.3 52.9 52.9 23.9 42.2 56.1 50.8ECHAM-B2 58.2 65.6 52.0 54.1 51.5 56.9 56.1 54.6 54.6 24.7 43.6 58.0 52.5
San LorenzoGFDL-A2 92.4 92.4 92.4 92.4 92.4 92.4 92.4 92.4 92.4 92.4 92.4 92.4 92.4GFDL-B2 97.0 97.0 97.0 97.0 97.0 97.0 97.0 97.0 97.0 97.0 97.0 97.0 97.0ECHAM-A2 91.0 91.0 91.0 91.0 91.0 91.0 91.0 91.0 91.0 91.0 91.0 91.0 91.0ECHAM-B2 94.0 94.0 94.0 94.0 94.0 94.0 94.0 94.0 94.0 94.0 94.0 94.0 94.0
002 Mante left bankGFDL-A2 46.4 39.0 39.1 38.2 36.5 61.8 68.5 68.4 72.7 70.3 48.0 43.2 52.7GFDL-B2 48.7 41.0 41.0 40.1 38.3 64.9 71.9 71.8 76.3 73.8 50.4 45.3 55.3ECHAM-A2 45.7 38.4 38.5 37.6 36.0 60.9 67.4 67.3 71.6 69.2 47.3 42.5 51.9ECHAM-B2 47.2 39.7 39.8 38.8 37.1 62.9 69.7 69.5 73.9 71.5 48.8 43.9 53.6
002 Mante right bankGFDL-A2 28.5 17.2 20.6 17.4 16.7 51.1 71.3 70.7 72.7 70.3 38.9 25.5 41.7GFDL-B2 29.9 18.0 21.6 18.3 17.5 53.7 74.8 74.2 76.3 73.8 40.8 26.8 43.8ECHAM-A2 28.1 16.9 20.3 17.1 16.4 50.3 70.2 69.6 71.6 69.2 38.3 25.1 41.1ECHAM-B2 29.0 17.5 20.9 17.7 17.0 52.0 72.5 71.9 73.9 71.5 39.6 25.9 42.5
Irrigation Unit 1 Las ÁnimasGFDL-A2 92.4 92.4 92.4 92.4 51.3 92.4 92.4 92.4 92.4 92.4 92.4 92.4 89.0GFDL-B2 97.0 97.0 97.0 97.0 53.9 97.0 97.0 97.0 97.0 97.0 97.0 97.0 93.4ECHAM-A2 91.0 91.0 91.0 91.0 50.6 91.0 91.0 91.0 91.0 91.0 91.0 91.0 87.6ECHAM-B2 94.0 94.0 94.0 94.0 52.2 94.0 94.0 94.0 94.0 94.0 94.0 94.0 90.5
Irrigation Unit 2 Las ÁnimasGFDL-A2 92.4 92.4 92.4 92.4 51.3 92.4 92.4 92.4 92.4 92.4 92.4 92.4 89.0GFDL-B2 97.0 97.0 97.0 97.0 53.9 97.0 97.0 97.0 97.0 97.0 97.0 97.0 93.4ECHAM-A2 91.0 91.0 91.0 91.0 50.6 91.0 91.0 91.0 91.0 91.0 91.0 91.0 87.6ECHAM-B2 94.0 94.0 94.0 94.0 52.2 94.0 94.0 94.0 94.0 94.0 94.0 94.0 90.5
152 G. Sanchez-Torres Esqueda et al.
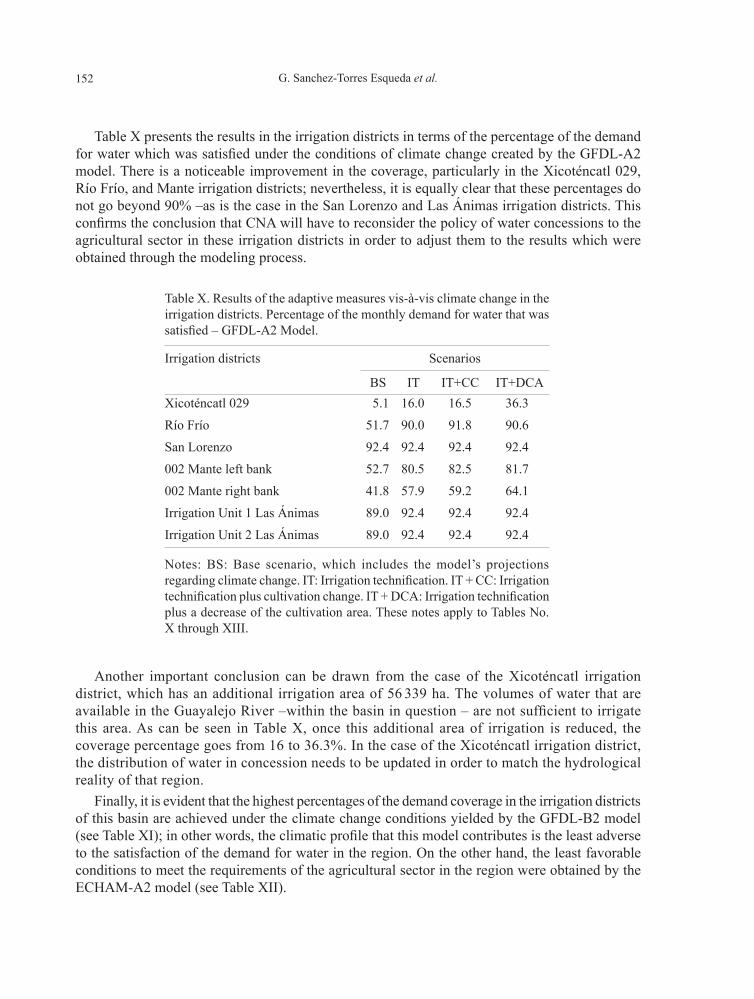
Table X presents the results in the irrigation districts in terms of the percentage of the demand for water which was satisfied under the conditions of climate change created by the GFDL-A2 model. There is a noticeable improvement in the coverage, particularly in the Xicoténcatl 029, Río Frío, and Mante irrigation districts; nevertheless, it is equally clear that these percentages do not go beyond 90% –as is the case in the San Lorenzo and Las Ánimas irrigation districts. This confirms the conclusion that CNA will have to reconsider the policy of water concessions to the agricultural sector in these irrigation districts in order to adjust them to the results which were obtained through the modeling process.
Another important conclusion can be drawn from the case of the Xicoténcatl irrigation district, which has an additional irrigation area of 56 339 ha. The volumes of water that are available in the Guayalejo River –within the basin in question – are not sufficient to irrigate this area. As can be seen in Table X, once this additional area of irrigation is reduced, the coverage percentage goes from 16 to 36.3%. In the case of the Xicoténcatl irrigation district, the distribution of water in concession needs to be updated in order to match the hydrological reality of that region.
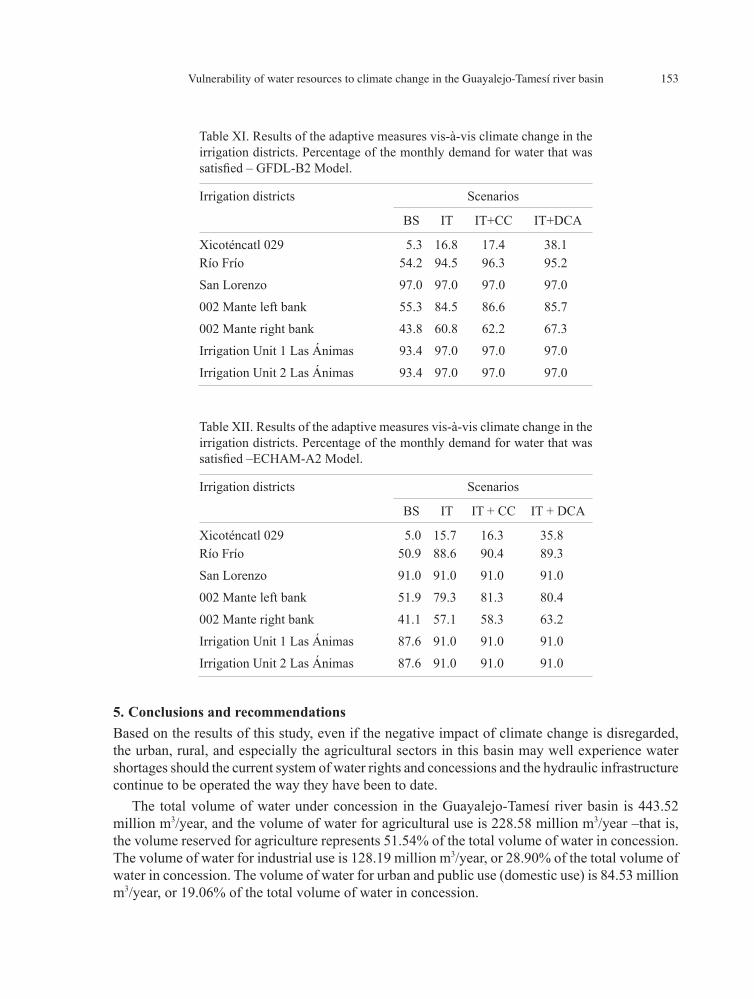
Finally, it is evident that the highest percentages of the demand coverage in the irrigation districts of this basin are achieved under the climate change conditions yielded by the GFDL-B2 model (see Table XI); in other words, the climatic profile that this model contributes is the least adverse to the satisfaction of the demand for water in the region. On the other hand, the least favorable conditions to meet the requirements of the agricultural sector in the region were obtained by the ECHAM-A2 model (see Table XII).
Table X. Results of the adaptive measures vis-à-vis climate change in the irrigation districts. Percentage of the monthly demand for water that was satisfied – GFDL-A2 Model.
Irrigation districts Scenarios
BS IT IT+CC IT+DCAXicoténcatl 029 5.1 16.0 16.5 36.3
Río Frío 51.7 90.0 91.8 90.6
San Lorenzo 92.4 92.4 92.4 92.4
002 Mante left bank 52.7 80.5 82.5 81.7
002 Mante right bank 41.8 57.9 59.2 64.1
Irrigation Unit 1 Las Ánimas 89.0 92.4 92.4 92.4
Irrigation Unit 2 Las Ánimas 89.0 92.4 92.4 92.4
Notes: BS: Base scenario, which includes the model’s projections regarding climate change. IT: Irrigation technification. IT + CC: Irrigation technification plus cultivation change. IT + DCA: Irrigation technification plus a decrease of the cultivation area. These notes apply to Tables No. X through XIII.
153Vulnerability of water resources to climate change in the Guayalejo-Tamesí river basin
5. Conclusions and recommendationsBased on the results of this study, even if the negative impact of climate change is disregarded, the urban, rural, and especially the agricultural sectors in this basin may well experience water shortages should the current system of water rights and concessions and the hydraulic infrastructure continue to be operated the way they have been to date.
The total volume of water under concession in the Guayalejo-Tamesí river basin is 443.52 million m3/year, and the volume of water for agricultural use is 228.58 million m3/year –that is, the volume reserved for agriculture represents 51.54% of the total volume of water in concession. The volume of water for industrial use is 128.19 million m3/year, or 28.90% of the total volume of water in concession. The volume of water for urban and public use (domestic use) is 84.53 million m3/year, or 19.06% of the total volume of water in concession.
Table XI. Results of the adaptive measures vis-à-vis climate change in the irrigation districts. Percentage of the monthly demand for water that was satisfied – GFDL-B2 Model.
Irrigation districts Scenarios
BS IT IT+CC IT+DCA
Xicoténcatl 029 5.3 16.8 17.4 38.1Río Frío 54.2 94.5 96.3 95.2
San Lorenzo 97.0 97.0 97.0 97.0
002 Mante left bank 55.3 84.5 86.6 85.7
002 Mante right bank 43.8 60.8 62.2 67.3
Irrigation Unit 1 Las Ánimas 93.4 97.0 97.0 97.0
Irrigation Unit 2 Las Ánimas 93.4 97.0 97.0 97.0
Table XII. Results of the adaptive measures vis-à-vis climate change in the irrigation districts. Percentage of the monthly demand for water that was satisfied –ECHAM-A2 Model.
Irrigation districts Scenarios
BS IT IT + CC IT + DCA
Xicoténcatl 029 5.0 15.7 16.3 35.8Río Frío 50.9 88.6 90.4 89.3
San Lorenzo 91.0 91.0 91.0 91.0
002 Mante left bank 51.9 79.3 81.3 80.4
002 Mante right bank 41.1 57.1 58.3 63.2
Irrigation Unit 1 Las Ánimas 87.6 91.0 91.0 91.0
Irrigation Unit 2 Las Ánimas 87.6 91.0 91.0 91.0
154 G. Sanchez-Torres Esqueda et al.
Once the impact of climate change was incorporated into the modeling process, its effects on the agricultural sector were particularly acute. As the data shows, there are no models or scenarios replicating climate change that foresee significant increases in the precipitation over the basin in question; although the condition of Average years is preserved in some cases, no Wet years are predicted. In fact, in most of the climate change scenarios there is an undeniable tendency toward the coming of Dry and Very dry years.
The parameter of the ranges of decrease in precipitation was the main criterion to determine the type of water year type. Although these decreases are apparently very small, they were used to estimate the anomalies in precipitation in order to pinpoint the sequence followed by the types of years which are being projected for the future (Very dry, Dry, Average, Wet, and Very wet years). However, considering that in this region, according to these predictions, the temperatures are expected to continue to rise over time, even slight decreases in precipitation and higher temperatures would result in a considerable decrease in the surface water flow at the disposal of the different areas comprising the river basin. This situation would aggravate the runoff in the high and middle altitude zones of the basin, thereby adversely affecting the Xicoténcatl 029 and Mante 002 irrigation districts. In the case of the urban centers, such a critical state would intensify the problem of water scarcity in the Xico neighborhoods and in Ciudad González.
As for the types of water years estimated by means of the P/T relationship, the analysis found that none of the cases presents changes that favor the water supply; on the contrary, there is a definite tendency towards decrease in the supply. Figure 1 shows that, although the B2 and B1 scenarios would be the only ones to fall within the normal range, over time they would get closer to states of ever increasing dryness. The A2 and A1B scenarios would stay within the average range until approximately 2020, but then they would start getting dry –a condition that would be more intense for the 2040-2069 period, as shown in Figure 2.
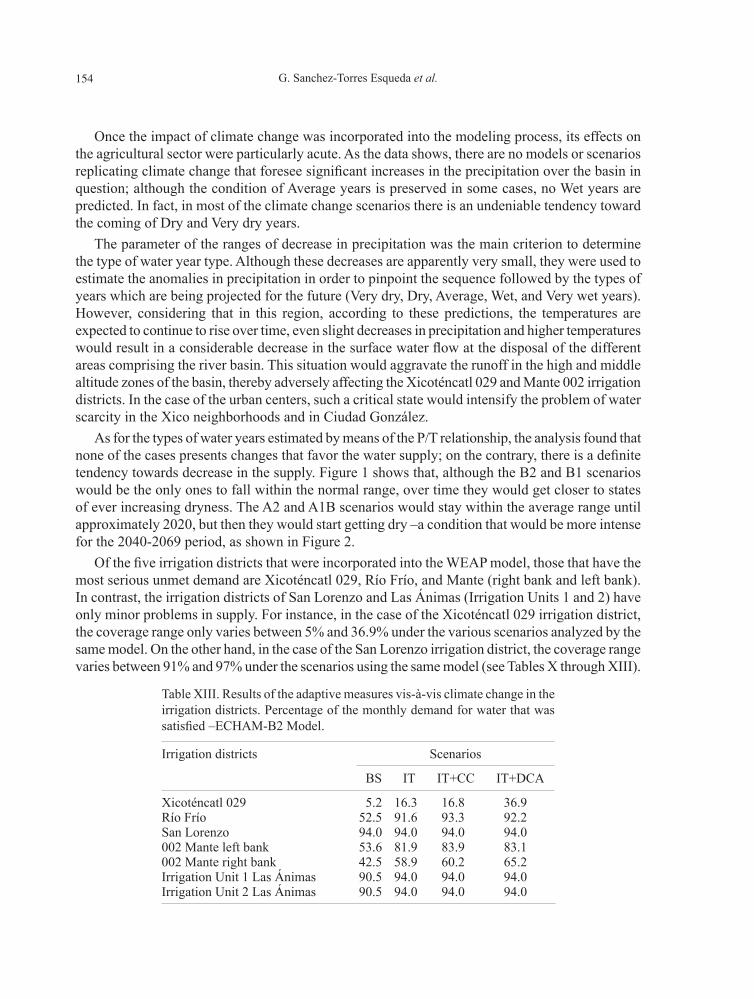
Of the five irrigation districts that were incorporated into the WEAP model, those that have the most serious unmet demand are Xicoténcatl 029, Río Frío, and Mante (right bank and left bank). In contrast, the irrigation districts of San Lorenzo and Las Ánimas (Irrigation Units 1 and 2) have only minor problems in supply. For instance, in the case of the Xicoténcatl 029 irrigation district, the coverage range only varies between 5% and 36.9% under the various scenarios analyzed by the same model. On the other hand, in the case of the San Lorenzo irrigation district, the coverage range varies between 91% and 97% under the scenarios using the same model (see Tables X through XIII).
Table XIII. Results of the adaptive measures vis-à-vis climate change in the irrigation districts. Percentage of the monthly demand for water that was satisfied –ECHAM-B2 Model.
Irrigation districts Scenarios
BS IT IT+CC IT+DCA
Xicoténcatl 029 5.2 16.3 16.8 36.9Río Frío 52.5 91.6 93.3 92.2San Lorenzo 94.0 94.0 94.0 94.0002 Mante left bank 53.6 81.9 83.9 83.1002 Mante right bank 42.5 58.9 60.2 65.2Irrigation Unit 1 Las Ánimas 90.5 94.0 94.0 94.0Irrigation Unit 2 Las Ánimas 90.5 94.0 94.0 94.0
155Vulnerability of water resources to climate change in the Guayalejo-Tamesí river basin
Another conclusion that can be reached from the results of the WEAP model is that the volumes of water in concession are higher than those which actually circulate along the basin’s natural hydrological system. This conclusion is based on the fact that, even if adaptive measures for climate change are taken –all of which went into three of the scenarios included in the WEAP model– the efficiency levels reached by the coverage of the demand for water remain very low.
Furthermore, it is worth highlighting that, according to this study, the CNA will not only have to make adjustments in the assignation of rights, but must also, together with the water users of those irrigation districts, reexamine the way those irrigation districts are defined, since in some of these areas there is not enough water for the extension of land involved. This is the case of the additional area of over 56 000 hectares that is located in the Xicoténcatl 029 irrigation district. Another issue the CNA will have to deal with is how to improve the hydraulic infrastructure by avoiding leaks or losses of water in the irrigation systems and by adopting new techniques of irrigation which would make the use of water in the agricultural sector more efficient.
In the urban and rural sectors, it will be necessary to improve the hydraulic infrastructure to maintain the current demand coverage by reducing leaks and/or losses of water in the domestic water distribution systems. The industrial sector must also implement reuse and recycling systems to continue to supply water at present rates.
ReferencesCNA, 2007. Estadísticas del agua en México. 2007, edition. Comisión Nacional del Agua, Secretaría
de Medio Ambiente y Recursos Naturales. Mexico City.Hulme M., T. M. L. Wigley, E. M. Brown, S. C. B. Raper, A. Centella, S. Smith and A. C. Chipanshi,
2000. Using Climate Scenario Generator for Vulnerability and Adaptation Assessment: MAGICC and SCENGEN. Version 2.4 Workbook. Climate Research Unit, Norwich. UK, 52 pp.
Lee A. H., J. Sieber and C. Swartz, 2005. WEAP. Water Evaluation and Planning System. Userguide. Stockholm Environment Institute, Tellus Institute, Boston, MA, 176 pp.
Sieber, J. and D. Purkey, 2007. WEAP. Water Evaluation and Planning System USER GUIDE for WEAP21. Stockholm Environment Institute. U.S. Center. 219pp.
Wigley T. M. L., 1994. MAGICC (Model for Assessment of Greenhouse –gas Induced Climate Change): User’s Guide and Scientific Research Manual. National Center for Atmospheric Research, Boulde.
Wigley T. M. L., 2003. MAGICC/SCENGEN: User-friendly Software for GCM Inter-comparisons, Climate Scenario Development and Uncertainty Assessment. Tom M.L. Wigley, National Center for Atmospheric Research, Boulder, CO 80307.
Wigley T. M. L., S. C. B. Raper, M. Hulme and S. Smith, 2000. The MAGICC/SCENGEN Climate Scenario Generator Version 2.4: Technical Manual.
Related Documents


