See discussions, stats, and author profiles for this publication at: http://www.researchgate.net/publication/280064992 Vulnerability Against Internet Disruptions – A Graph-based Perspective CONFERENCE PAPER · OCTOBER 2015 DOWNLOADS 8 VIEWS 16 2 AUTHORS: Annika Baumann Humboldt-Universität zu Berlin 13 PUBLICATIONS 10 CITATIONS SEE PROFILE Benjamin Fabian Humboldt-Universität zu Berlin 74 PUBLICATIONS 370 CITATIONS SEE PROFILE Available from: Benjamin Fabian Retrieved on: 12 September 2015

Welcome message from author
This document is posted to help you gain knowledge. Please leave a comment to let me know what you think about it! Share it to your friends and learn new things together.
Transcript
Seediscussions,stats,andauthorprofilesforthispublicationat:http://www.researchgate.net/publication/280064992
VulnerabilityAgainstInternetDisruptions–AGraph-basedPerspective
CONFERENCEPAPER·OCTOBER2015
DOWNLOADS
8
VIEWS
16
2AUTHORS:
AnnikaBaumann
Humboldt-UniversitätzuBerlin
13PUBLICATIONS10CITATIONS
SEEPROFILE
BenjaminFabian
Humboldt-UniversitätzuBerlin
74PUBLICATIONS370CITATIONS
SEEPROFILE
Availablefrom:BenjaminFabian
Retrievedon:12September2015
1
Vulnerability Against Internet Disruptions – A Graph-based Perspective
Annika Baumann and Benjamin Fabian
Institute of Information Systems Humboldt-Universität zu Berlin
Spandauer Str. 1, 10178 Berlin, Germany e-mail: {annika.baumann,bfabian}@wiwi.hu-berlin.de
Abstract. The Internet of today permeates societies and markets as a critical in-frastructure. Dramatic network incidents have already happened in history with strong negative economic impacts. Therefore, assessing the vulnerability of In-ternet connections against failures, accidents and malicious attacks is an im-portant field of high practical relevance. Based on a large integrated dataset de-scribing the Internet as a complex graph, this paper develops a multi-dimensional Connectivity Risk Score that, to our knowledge, constitutes the first proposal for a topological connectivity-risk indicator of single Autono-mous Systems, the organizational units of the Internet backbone. This score en-compasses a variety of topological robustness metrics and can help risk manag-ers to assess the vulnerability of their organizations even beyond network pe-rimeters. Such analyses can be conducted in a user-friendly way with the help of CORIA, a newly developed software framework for connectivity risk analy-sis. Our approach can serve as an important element in an encompassing strate-gy to assess and improve companies’ connectivity to the Internet.
Keywords: Vulnerability, Internet Robustness, Internet Topology, Graph Min-ing, Risk Score
1 Introduction
The importance of the Internet as today’s communication and information medium is undisputed. It has revolutionized worldwide communication, made it cost efficient and fast and created countless of new or refined business models. There are numerous businesses in the world whose core competencies rely completely on the Internet. Based on these considerations, it becomes apparent that a limited or disrupted Internet connectivity can lead to significant financial losses for businesses and even econo-mies. A study of the IT systems integrator CDW revealed that network disruptions caused $1.7 billion in financial losses in 2010 [1]. This is an indicator of how crucial the Internet is for many business activities today.
In this paper, we aim to develop an analysis method and score that can help risk managers to assess the potential vulnerability of their organizations even beyond their own area of control, i.e., beyond their network perimeters. Here the question arises
2
how robust their Internet connectivity is regarding failures, accidents and malicious attacks. How difficult is it to tear certain parts of their network neighborhood down? This article will examine this problem by first developing a global graph of the Inter-net based on a combination of several recent data sources. This graph will serve as a basis for robustness analyses focusing on the local vulnerability of single autonomous systems (ASs). From a high-level vantage point, an AS can be considered as an “atomic unit” of the Internet backbone, constituting a single administrative domain that is under the control of a particular organization, such as a company or public institution. Many companies in several industries own a dedicated AS [2], while for others the AS of their Internet service provider can be investigated.
From a topological point of view, connectivity risk can be characterized by being a potential victim of a random failure or a targeted attack. This leads to a certain duali-ty: On the one hand, ASs that are not well-connected to the Internet are most at risk with respect to failures. On the other hand, those ASs, which are indeed well-connected and therefore contribute most to communication ability and efficiency of the entire network, represent an attractive target for attacks aimed at weakening the global Internet. In order to make a statement about which ASs will fit into these two risk categories from a topological viewpoint, a proposal for a multi-dimensional score is developed in this paper that we call Connectivity Risk Score (CRS). This score is based upon a combination of selected and normalized topological metrics. Normaliza-tion ensures the comparability across ASs and network graph instances. Moreover, the CRS also reflects that the Internet topology is highly complex and the connectivity status of a certain AS depends on various factors.
The paper is structured as follows: First, related literature in the area of Internet re-silience will be presented. Afterwards, the relevant methodology used in this paper will be described. Then, the development and evaluation of the CRS will be dis-cussed. This score and all of the aggregated metrics can be accessed in a user-friendly way by security analysts via our newly developed CORIA analysis software that is presented in the subsequent section. The final section will summarize our contribu-tions and results, discuss limitations as well as comment on future work.
2 Related Work
An important design feature of the Internet is its robustness. The term resilience can be seen as synonym and can be described as the ability of a certain system to return to a normal condition after external impacts. The robustness of the Internet is therefore “the ability of the network to provide and maintain an acceptable level of service in the face of various faults and challenges to normal operation” [26, p.2]. The approach presented in the current article extends established reliability analysis of online ser-vices, such as Tseng & Wu [3] who focus on the reliability of critical servers, by analyses of connectivity based on the Internet graph.
Several researchers investigated the question of how to assess Internet robustness, but so far the main focus was placed on a global perspective [4]. In an early work, Albert et al. [5] analyzed the attack and failure tolerance of the Internet at the AS
3
level based on both the classical Erdös–Rényi (ER) model and a scale-free graph model for the Internet. Dolev et al. [6] additionally considered economically driven restrictions of data exchange over the Internet backbone, i.e., policy-driven routing. Wu et al. [7] examined the router robustness of the Internet in case of node removal, also taking policy restrictions into account. Xiao et al. [8] focused on the attack toler-ance of the Internet under the assumption that the possession of complete and global information about the Internet graph is an unrealistic assumption. Finally, Deng et al. [9] considered the so-called k-fault tolerance of the Internet on the AS level which is the reachability of a pair of nodes in the network after the removal of k nodes.
More recent literature examines Internet resilience in a more specialized way. For example, Zhao et al. [10] analyze the effect of removing the so-called k-core nodes from the Internet AS-level graph, i.e., the most important nodes which have at least degree k. Using a simulation based approach, Çetinkaya et al. [11] propose a frame-work for better understanding the robustness of networks such as the Internet for fu-ture improvements. Shirazi et al. [12] examine the resilience of anonymous communi-cation networks such as Tor and propose a new metric for measuring robustness. Moreover, some projects already exist which examine the idea of combining different metrics to estimate the resilience of a network from a theoretical point of view (see for example [29] and [30]) where our approach will add significant results from a practical perspective.
3 Methodology
In order to obtain an extensive and recent dataset, we use a combination of three dif-ferent main sources for Internet connectivity data: Border Gateway Protocol (BGP) routing tables, traceroute measurements and Internet Routing Registry (IRR) data.
In case of BGP routing tables, data provided by CAIDA’s AS Rank project are used [13] comprising a 5-day-period (06/01–06/05/2012). In addition, a research group of the University of California in Los Angeles (UCLA) provides another da-taset [14]. Choosing the closest time period with available data files from 05/24/12 to 05/28/12, this dataset contains 159,383 unique AS paths. The traceroute-based Mac-roscopic Topology Project of CAIDA uses Archipelago (Ark) as a measurement tool [15]. All data files fitting into the appropriate time period (either the same as in case of CAIDA AS Rank or the most similar available) were downloaded from their web-site and preprocessed using only direct links between two ASs. After merging of the data, 57,922 unique AS paths are provided by Ark. In addition, Internet Routing Reg-istry (IRR) data is also used in this paper. For this purpose, the data files of all availa-ble 34 IRRs were downloaded from their website [16]. Based on the method men-tioned by Siganos and Faloutsos [17] as well as Zhang et al. [18], the necessary AS path information was selected as a part of the aut-num object class. To gain reliable
4
data only dyadic relationships were included in the dataset and those that were updat-ed at last in 20121.The final IRR dataset consists of 47,348 unique AS paths.
All the individual datasets of CAIDA AS Rank, UCLA, Ark and IRR were then merged into one single file for the final dataset used in this paper resulting in 44,397 nodes and 199,073 edges.
4 Connectivity Risk Score (CRS)
4.1 Selection of Topological Metrics
To develop a comprehensive risk score, a literature survey was conducted examining existing metrics specifically used for assessing Internet robustness. Overall, 37 met-rics could be identified2. Most of these metrics provide just a very general statement about the connectedness of an AS. Because of this, the CRS combines several metrics into a single measure to take advantage of multiple metrics and outweigh their disad-vantages. Therefore in the next step, a number of requirements were defined which needed to be fulfilled by the metrics in order to be selected for the CRS. The initial properties that we required for the selection of metrics were:
1. A statement about the connectivity to the network for a single AS should be de-rived from it (not the entire graph, not aggregated AS groups).
2. The metric should have two distinct value ranges in order to distinguish the attrac-tiveness for an attack and the susceptibility to failures.
Therefore, metrics that provide a statement solely for the global topology or AS groups were not selected (i.e., assortativity coefficient, symmetry ratio, (joint) degree distribution, average neighbor connectivity, eigenvalue-based metrics as well as glob-al average metrics such as average degree, average clustering coefficient or diameter). Overall, six out of the initial 37 metrics remain which meet the requirements and are therefore used for the CRS: degree [DEG], average neighbor degree [AND], iterated average neighbor degree (two-hop neighborhood of a node) [IAND], betweenness centrality [BC], shortest path length [SPL] and eccentricity [ECC]. Some of these metrics are calculated based on the whole network structure (e.g., betweenness cen-trality) meaning that changing arbitrary nodes in the network might have an influence on the characteristics of that node. Those quasi-local metrics are still rather important for capturing the topological connectivity of a single AS since it cannot be seen as an isolated unit but is interconnected with a huge, interrelated network structure. For a more detailed description of these metrics see, e.g., [19] and [20]. All of these metrics
1 An exception is the RIPE IRR. This registry is considered as the most accurate and current one [18]. Therefore, from the RIPE registry all entries last changed in 2011 and 2012 have been included in this dataset.
2 The complete list of identified metrics is available from the authors upon request.
5
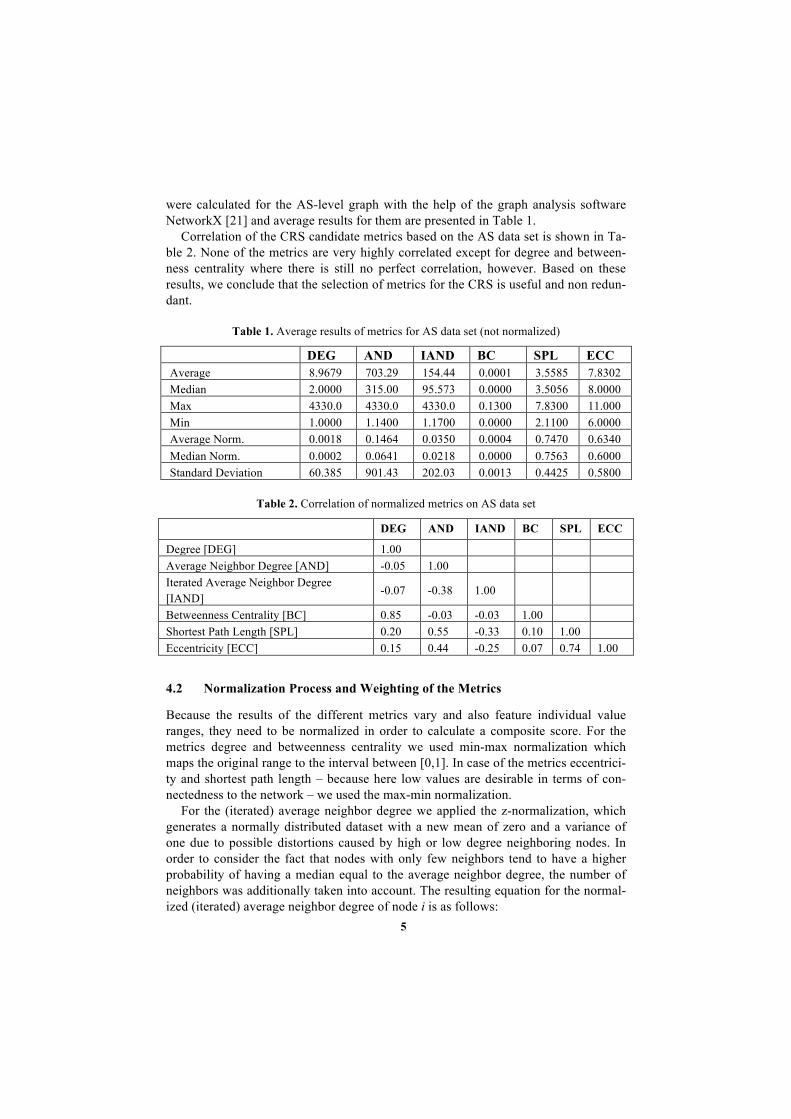
were calculated for the AS-level graph with the help of the graph analysis software NetworkX [21] and average results for them are presented in Table 1.
Correlation of the CRS candidate metrics based on the AS data set is shown in Ta-ble 2. None of the metrics are very highly correlated except for degree and between-ness centrality where there is still no perfect correlation, however. Based on these results, we conclude that the selection of metrics for the CRS is useful and non redun-dant.
Table 1. Average results of metrics for AS data set (not normalized)
DEG AND IAND BC SPL ECC Average 8.9679 703.29 154.44 0.0001 3.5585 7.8302 Median 2.0000 315.00 95.573 0.0000 3.5056 8.0000 Max 4330.0 4330.0 4330.0 0.1300 7.8300 11.000 Min 1.0000 1.1400 1.1700 0.0000 2.1100 6.0000 Average Norm. 0.0018 0.1464 0.0350 0.0004 0.7470 0.6340 Median Norm. 0.0002 0.0641 0.0218 0.0000 0.7563 0.6000 Standard Deviation 60.385 901.43 202.03 0.0013 0.4425 0.5800
Table 2. Correlation of normalized metrics on AS data set
DEG AND IAND BC SPL ECC
Degree [DEG] 1.00 Average Neighbor Degree [AND] -0.05 1.00 Iterated Average Neighbor Degree [IAND]
-0.07 -0.38 1.00
Betweenness Centrality [BC] 0.85 -0.03 -0.03 1.00 Shortest Path Length [SPL] 0.20 0.55 -0.33 0.10 1.00 Eccentricity [ECC] 0.15 0.44 -0.25 0.07 0.74 1.00
4.2 Normalization Process and Weighting of the Metrics
Because the results of the different metrics vary and also feature individual value ranges, they need to be normalized in order to calculate a composite score. For the metrics degree and betweenness centrality we used min-max normalization which maps the original range to the interval between [0,1]. In case of the metrics eccentrici-ty and shortest path length – because here low values are desirable in terms of con-nectedness to the network – we used the max-min normalization.
For the (iterated) average neighbor degree we applied the z-normalization, which generates a normally distributed dataset with a new mean of zero and a variance of one due to possible distortions caused by high or low degree neighboring nodes. In order to consider the fact that nodes with only few neighbors tend to have a higher probability of having a median equal to the average neighbor degree, the number of neighbors was additionally taken into account. The resulting equation for the normal-ized (iterated) average neighbor degree of node i is as follows:

6
[!]!"#!"##$!%$&,! = [!]!"#! + !"#$%&!![!]!"#!!!
∙ #!"!!"#$ℎ!"#$! !! ∙ [I]!"#! (1)
The up-voted and down-voted results for the (iterated) average neighbor degree were then finally normalized with the help of min-max normalization.
Furthermore, it is not reasonable to consider all metrics as equally important be-cause their impact on the connection status of an AS might vary significantly. For the final CRS all metrics were weighted by a particular value. It was determined that the weights should sum up to one. The degree and the betweenness centrality were equally weighted and considered to be most important. Furthermore, the network environment one hop away from a node was considered to be more important for the robustness of a node than the network environment at subsequent hops due to the further distance from a node. Therefore, the average neighbor degree and the iterated neighbor degree were handled as less important and therefore weighted increasingly less. Because of the relatedness of the shortest path length and the eccentricity, the combination of both was weighted with the same amount as the degree and the betweenness centrality. Therefore, each of both distance-based metrics has a weighting of 0.125. This leads to the final weightings of 0.25 for the degree and the betweenness centrality, 0.125 for the shortest path length and the eccentricity, 0.15 for the average neighbor degree and 0.1 for the iterated average neighbor degree. The final score ranges between zero and one hundred percent.
4.3 Application of the CRS
Once the results for the selected metrics of the CRS are calculated, ranges need to be established that indicate critical areas for interpretation. The theoretical range of the CRS is between 100 % and 0 %, while the effective values, based on the dataset used, range between 74.58 % at the maximum and 0.01 % at the minimum. There are two numerical subranges that indicate those ASs that are most at risk. If the CRS is plotted against the risk of an AS in terms of robustness, a theoretical U-shaped curve is the result (see Fehler! Verweisquelle konnte nicht gefunden werden., left), which can be regarded as exemplary representation used to visually communicate the idea of the CRS.
Fig. 1. Critical areas for ASs (left) and distribution of CRS values (right)

7
It is assumed that an AS is not at risk if it is neither vulnerable to random failures nor an attractive target for global attacks. This is associated with the following inter-pretation of the CRS: a small CRS value indicates a vulnerability to random errors. In the worst case, ASs that appear at the bottom of a CRS ranking list have a small de-gree and low (iterated) average neighbor degree. Their path options are quite limited. Furthermore, their betweenness centrality would in general be quite small, meaning that there are no or only few shortest paths passing through that node. Eccentricity and shortest path length can be expected to be high, indicating that these ASs are probably located somewhere at the edge of the network. Therefore, ASs with a low CRS value are badly connected to the network and insignificant for its communica-tion ability, which makes them prone to random errors, but not attractive attack tar-gets. On the other hand, a high CRS value is an indicator of high attractiveness for targeted attacks. In particular, ASs with a high degree as well as a high (iterated) av-erage neighbor degree have a high CRS. Their path options are quite versatile. Both distance-based metrics are low. Those ASs are located at important communication points of the network, which can also often lead to a high betweenness centrality be-cause many shortest paths are passing through those kinds of nodes. In summary, ASs with a high CRS value are well connected to the network and form an important communication backbone. This makes them highly attractive for deliberate attacks targeted at nodes whose removal would hurt the entire network most.
The distribution of the CRS values based on the empirical AS dataset is shown in Fig. 1, right. Each data point shows a specific AS and its corresponding value of the CRS. There are many ASs with a low and few with a high CRS value. Only four of them reach a threshold of 50 % while two of them are extreme outliers having values of 74.58 % and 72.36 %. The average CRS value for all ASs is around 19.86 %. This again shows that there are many ASs having a low value, while the majority of them is located somewhere between 30 % and 10 %. This is an indicator that even today the global robustness of the Internet graph has a lot of potential for improvement.
A desirable global distribution of the CRS would involve a quite homogeneous ac-cumulation of ASs in a certain score area to reduce the impact of attacks. This means that all ASs would be equally important for the communication ability of the network and the elimination of a selected AS would not have such a dramatic effect as it is the case now, e.g., more similar to the Erdös–Rényi model [5]. At the same time, the CRS values should be as high as possible. A general increase of the CRS values for every ASs would be beneficial and would enhance the robustness of the global Internet graph by reducing the impact of random errors. We emphasize that the CRS serves as a first risk indicator to assess the vulnerability of single ASs but should be comple-mented in risk management practice by a more detailed examination of each particu-lar AS.
4.4 Selective Validation of the CRS
In order to validate the usefulness of our CRS, we selected two poorly connected ASs with a low score and visualized their nearby graph environment (see Fig. 2). Bold numbers represent the associated AS number, expressions in brackets specify the

8
underlying organization; if an additional number is given, it refers to the degree of the nodes at the end of the network segment. The illustration makes it obvious that AS 636 and AS 45,076 are indeed badly connected to the Internet topology according to our dataset as was indicated by the CRS. For example, if any one of the subsequent one-degree nodes fail, these nodes will be affected as well and get completely disconnected from the rest of the network. Therefore, their connectivity depends not only on their own characteristics but also on those of the following ASs. In case of AS 45,076 the breakdown of any single node out of five (including the node itself) will affect this AS most severely. If only the degree metric were used, these ASs would not have scored worse than many other nodes with degree 1 and their particular vulnerability could have been easily overlooked.
Fig. 2. Two examples of badly connected ASs
5 Connectivity Risk Analyzer (CORIA)
Based on the theoretical foundations presented in the earlier sections, we developed a web-based software framework that supports security analysts and consultants in assessing the connectivity risks of a particular organization. This Connectivity Risk Analyzer (CORIA) can be accessed via web browser. The analyst can search for indi-vidual AS and display the results of all connectivity metrics and the CRS discussed in this article. Moreover, statistical analyses of the entire AS datasets are possible and ASs can be ranked according to any of the metrics.
The high-level system architecture consists of a backend, the storage area as well as the frontend. The backend is responsible for importing AS data and calculating metrics and scores. It is implemented in the Python programming language and utiliz-es the network analysis framework NetworkX [21]. The calculation time of base met-

9
rics for the AS dataset used in this article are displayed in Table 3. All measurements were obtained in a virtual machine that was equipped with one CPU core running at 3 GHz and 4 GB of memory.
These results indicate that CORIA could cope with frequent updates of the under-lying data set, which is one important direction for future improvements. The storage tier makes the results of the backend calculations persistent and enriches them with general information about each AS for later display via the frontend. It can also store interim results of calculations. For speed and flexibility, the storage tier is implement-ed using the Redis key-value store [22]. User requests via a web browser are served by the frontend tier which is based on established web technology. It is implemented as a combination of a Ruby application based on the Sinatra framework [23] and HTML views based on the Twitter Bootstrap library [24]. An example user view is shown in Fig. 3.
Table 3. Calculation runtimes for the AS data set
Metric Duration [s] Duration [m] Percentage of Duration DEG 0.468 0.01 0.000817% AND 1.307 0.02 0.0022% IAND 631.865 10.53 1.10% BC 40226.493 670.44 70.26% SPL 7553.916 125.9 13.19% ECC 7456.873 124.28 13.02% Total 57250.629 954.18 100%
CORIA is designed with flexibility in mind: new or updated AS datasets can be load-ed into the software whenever required. Further or refined metrics can be added with ease and can be flexibly combined into several different aggregated scores.
Fig. 3. Example user view in CORIA (AS screen)
10
6 Summary, Limitations and Future Work
To the best of our knowledge, our proposed CRS marks the first attempt to measure the vulnerability of single ASs with regard to random failures and targeted attacks. The CRS takes several connectivity-based aspects into account and is therefore multi-dimensional (degree, average neighbor degree, iterated average neighbor degree, be-tweenness centrality, shortest path length, eccentricity). Considering these various dimensions helps to cope with the high complexity of the AS-level graph. In sum-mary, the lower the CRS value, the more prone a specific AS is to random failures. The higher the CRS value, the more attractive a specific AS is for an attack. A desira-ble global state could involve a quite homogeneous accumulation of ASs in a certain high CRS value area.
Our article is subject to typical limitations of our research area that we aim to ad-dress in future work. Because there is a general lack of complete information regard-ing the Internet topology, our dataset is still incomplete. Also the dataset used in this work can be seen as only a first exemplarily starting point of investigation since it represents solely the AS level, is still incomplete in terms of included ASs as well as corresponding paths, and it originates from 2012. Furthermore, our data might contain some incorrect edges because its reliability strongly depends on the quality of the data sources used, e.g., the insertion of traceroute data whose alias resolution process is still not mature. Furthermore, policy-driven routing as well as traffic flow aspects are not considered so far but we plan to include this aspect in future work due to the pos-sible current overestimation of viable connections in the Internet graph. Possible ex-isting internal connections between ASs belonging to the same organization may not be visible in the public dataset. This might lead to imprecise risk assessment results based on the CRS only due to the underestimation of connectedness of the concerned ASs. However, an internal risk manager could take the CRS as a starting point of investigation and then verify the actual private connections of his or her organization.
In future work we also aim to further refine the CRS by developing an extended score which would take into account the homogeneity of ASs or rather their similarity of attractiveness in terms of being an attack target. In addition, we want to include an assessment of how hard it is to cut a certain AS off. It might also be valuable to utilize additional input for an extension of this score by using third-party knowledge. This could be achieved with the help of expert and stakeholder interviews.
Furthermore, statistical correlations between the current metrics and future metrics on different datasets should be investigated. Based on this, the weights could be ad-justed accordingly in order to reduce internal correlations, improving the balance of the various metrics used in the score. Moreover, the score could then more reliably be transferred to other complex networks with different properties than the Internet AS graph. Therefore, we also plan to integrate further metrics. As research has shown, the effects of quasi-local metrics such as the spectrum of the graph, e.g., as in case of the spread of virus diffusions [27] which might be influenced by rather global metrics such as the assortativity coefficient [28], show again the deep interconnection of the network where the general structure has an immense influence on characteristics of

11
single nodes. Therefore in future research these effects of global metrics should not be underestimated and be taken into account.
We also aim to further validate the CRS and related newly developed scores. This could, for example, be conducted through several case studies such as in the applica-tion field of cloud computing [31], an analysis of historical events of failure, a com-plementary IP-based analysis or insider knowledge of contracts between ISPs. Fur-thermore, we plan to enhance the web-based connectivity-risk analyzer CORIA with new features such as integrating further publicly available information on each AS and the possibility to manually add internal connections that may not be visible in the public data. Furthermore, each future evolution of the CRS and the underlying data set will be easily implemented in CORIA because it was designed for flexibility and extensibility. Another promising direction is adoption of methods from network relia-bility estimation, such as proposed by [25] for failures of cloud computing nodes, to our AS-level context. Not least, there is an important area of research on how to im-prove the connectivity of single organizations in a way that is technically and eco-nomically feasible. Since connectivity of an organization A does not only depend on the degree and local edges of A, one of the challenges involves how to motivate other organizations B and C to create links that primarily benefit A. Here, we aim to devel-op practical approaches based on game theory and economic mechanism design. References
1. CDW. Billions Lost due to IT Network Outages in 2010: Survey. Retrieved April 30, 2015 from http://www.eweek.com/c/a/Enterprise-Networking/Billions-Lost-Due-to-IT-Network-Outages-in-2010-Survey-559569 (2011)
2. Baumann, A. & Fabian, B. Who Runs the Internet? Classifying Autonomous Systems into Industries. In: Proceedings of the 10th International Conference on Web Information Sys-tems and Technologies (WEBIST), Barcelona, Spain (2014)
3. Tseng, J.C. & Wu, C.-H. An Expert System Approach to Improving Stability and Reliabil-ity of Web Service. Expert Systems with Applications, 33(2), 379–388 (2007)
4. Baumann, A. & Fabian, B. How Robust is the Internet? – Insights from Graph Analysis. 9th International Conference on Risks and Security of Internet and Systems (CRiSIS 2014), Trento, Italy, Springer, LNCS 8924 (2014)
5. Albert, R., Jeong, H. & Barabási, A.-L. Error and Attack Tolerance of Complex Networks. Nature, 406, 378-382 (2000)
6. Dolev, D., Jamin, S., Mokryn, O. & Shavitt, Y. Internet Resiliency to Attacks and Failures under BGP Policy Routing. Computer Networks, 50(16), 3183-3196 (2006)
7. Wu, J., Zhang, Y., Morley Mao, Z. & Shin, K. G. Internet Routing Resilience to Failures: Analysis and Implications. In Proceedings of 2007 ACM CoNEXT Conference (CoNEXT '07), New York, NY, USA (2007)
8. Xiao, S., Xiao, G. & Cheng, T. H. Tolerance of Intentional Attacks in Complex Communi-cation Networks. IEEE Communications Magazine, 46(1), 146-152 (2008)
9. Deng, W., Karaliopoulos, M., Mühlbauer, W., Zhu, P., Lu, X. & Plattner, B. k-Fault Tol-erance of the Internet AS Graph. Computer Networks, 55(10), 2492-2503 (2011)
10. Zhao, J., Wu, J., Chen, M., Fang, Z., & Xu, K. K-core-preferred Attack to the Internet: Is it more malicious than Degree Attack? In Proceedings of Web-Age Information Manage-ment (WAIM), Springer, Berlin Heidelberg (pp. 717-728) (2013)

12
11. Çetinkaya, E. K., Broyles, D., Dandekar, A., Srinivasan, S., & Sterbenz, J. P. Modelling Communication Network Challenges for Future Internet Resilience, Survivability, and Disruption Tolerance: A simulation-based approach. Telecommunication Systems, 52(2), 751-766 (2013)
12. Shirazi, F., Diaz, C., Mullan, C., Wright, J., & Buchmann, J. Towards Measuring Resili-ence in Anonymous Communication Networks. In Proceedings of 6th Hot Topics in Priva-cy Enhancing Technologies (HotPETs 2013) (2013)
13. CAIDA AS Rank (2014). AS Ranking. Retrieved April 30, 2015 from http://as-rank.caida.org/
14. UCLA (2014). Retrieved April 30, 2015 from http://irl.cs.ucla.edu/ 15. CAIDA Ark (2014). Archipelago Measurement Infrastructure. Retrieved April 30, 2015
from http://www.caida.org/projects/ark/ 16. IRR.net (2014). Internet Routing Registry. Retrieved April 30, 2015 from
http://www.irr.net/ 17. Siganos, G. & Faloutsos, M. Detection of BGP Routing Misbehavior against Cyber-
Terrorism. In Proceedings of the 2005 IEEE Military Communications Conference (MILCOM 2005) (pp. 923-929) (2005)
18. Zhang, B., Liu, R., Massey, D. & Zhang, L. Collecting the Internet AS-Level Topology. ACM SIGCOMM Computer Communication Review, 35(1), 53-61 (2005)
19. Mahadevan, P., Krioukov, D., Fomenkov, M., Huffaker, B., Dimitropoulos, X., claffy, kc. & Vahdat, A. The Internet AS-Level Topology: Three Data Sources and One Definitive Metric. ACM SIGCOMM Computer Communication Review (CCR), 36(1), 17-26 (2006)
20. Manzano, M., Calle, E. & Harle, D. Quantitative and Qualitative Network Robustness Analysis under Different Multiple Failure Scenarios. In Proceedings of the 3rd Interna-tional Congress on Ultra Modern Telecommunications and Control Systems and Work-shops (pp. 1-7) (2011)
21. NetworkX (2014). Retrieved April 30, 2015 from http://networkx.lanl.gov/ 22. Redis (2014). Retrieved April 30, 2015 from http://redis.io/ 23. Sinatra (2014). Retrieved April 30, 2015 from http://www.sinatrarb.com/intro.html 24. Twitter Bootstrap (2014). Twitter Bootstrap Library. Retrieved April 30, 2015 from
http://getbootstrap.com/about/ 25. Lin, Y.-K., & Chang, P.-C. Maintenance Reliability Estimation for a Cloud Computing
Network with Nodes Failure. Expert Systems with Applications, 38(11), 14185-14189 (2011)
26. Sterbenz, J. P. G., Hutchison, D., Çetinkaya, E. K., Jabbar, A., Rohrer, J. P., Schöller, M. & Smith, P. Resilience and Survivability in Communication Networks: Strategies, Princi-ples, and Survey of Disciplines. Computer Networks, 54(8), 1245-1265 (2010).
27. Wang, Y., Chakrabarti, D., Wang, C., & Faloutsos, C. Epidemic Spreading in Real Net-works: An eigenvalue viewpoint. In International Symposium on Reliable Distributed Sys-tems, 25-34 (2003).
28. D'Agostino, G., Scala, A., Zlatić, V. & Caldarelli, G. Robustness and Assortativity for Dif-fusion-like Processes in Scale-Free Networks. EPL (Europhysics Letters), 97(6), 68006 (2012).
29. Van Mieghem, P., Doerr, C., Wang, H., Hernandez, J. M., Hutchison, D., Karaliopoulos, M., & Kooij, R. E. A Framework for Computing Topological Network Robustness. Delft University of Technology (2010).
30. ResumeNet (2011). Retrieved August 14, 2015 from http://www.resumenet.eu/ 31. Fabian, B., Baumann, A., Lackner, J.: Topological Analysis of Cloud Service Connectivi-
ty. Computers & Industrial Engineering, Volume 88, October 2015, 151–165.
Related Documents