Please refer to the important disclosures and analyst certification on inside back cover of this document, or on our website www.macquarie.com.au/disclosures. HONG KONG 856 HK Outperform Price 27 May 11 HK$1.81 12-month target HK$ 2.85 Upside/Downside % 57.5 Valuation HK$ 2.85 - PER GICS sector Technology Hardware & Equipment Market cap HK$m 2,279 30-day avg turnover US$m 0.7 Market cap US$m 293 Number shares on issue m 1,259 Investment fundamentals Year end 31 Dec 2010A 2011E 2012E 2013E Revenue m 26,213 30,062 34,872 40,103 EBIT m 466 586 698 822 EBIT growth % -8.4 25.7 19.0 17.9 Reported profit m 370 417 492 581 Adjusted profit m 303 417 492 581 EPS rep ¢ 29.3 32.6 38.4 45.4 EPS rep growth % 6.0 11.2 17.9 18.1 EPS adj ¢ 24.0 32.6 38.4 45.4 EPS adj growth % -12.6 35.7 17.9 18.1 PER rep x 6.2 5.6 4.7 4.0 PER adj x 7.5 5.6 4.7 4.0 Total DPS ¢ 0.0 5.0 9.8 11.5 Total div yield % 0.0 2.7 5.4 6.4 ROA % 6.5 7.0 7.5 7.8 ROE % 15.9 17.8 17.9 18.4 EV/EBITDA x 5.9 4.7 4.1 3.5 Net debt/equity % 32.6 46.1 45.3 43.2 P/BV x 1.1 0.9 0.8 0.7 856 HK rel HS China Enter performance, & rec history Note: Recommendation timeline - if not a continuous line, then there was no Macquarie coverage at the time or there was an embargo period. Source: FactSet, Macquarie Research, May 2011 (all figures in HKD unless noted) Jamie Zhou +86 21 2412 9033 [email protected] Jake Lynch +86 21 2412 9007 [email protected] 30 May 2011 Macquarie Capital Securities Limited VST Holdings Limited Asia-Pac’s IT distributor of choice Event VST’s stock price has fallen 41% since early February (2% gain on the HSCEI) and reached a fresh 52-week low of HK$1.71 on Tuesday May 24. On a valuation basis, the stock has reached a level that it has not traded at since early 2009. Also on May 24, VST bought back shares on the open market for the first time in 2.5 years. The previous time VST did a share buyback, a multi-year price floor was set. We met with the management for business updates and a closer examination of the company’s operational strength and potential growth drivers. We detail our findings in this report. Impact The most efficient Asia-Pac IT distributor with plenty of growth drivers: Compared with peers, VST’s strong operational management is evident in its superior EBIT margins (11-30bps higher than peers). With a strengthened balance sheet and rapidly expanding vendor platform, new growth drivers will emerge as VST moves into Vietnam, India and lower-tier cities in China. On track for a strong FY11: Subsidiary ECS delivered 28% YoY growth in 1Q and 0.4% GM expansion, attributable to new vendor partnerships (incl. the iPad), driving strong China growth and increasing enterprise systems revenue. VST looks on track to deliver 18% adjusted revenue growth for FY11. Increasing operating leverage from scale benefits should drive 17bps OPM expansion and 36% adj. EPS growth in FY11E. We forecast 15% EPS CAGR for FY12-14. 58% discount deeply unjustified: VST is now trading at a 2-year valuation trough of 5.6x FY11E PER, a 58% discount to Digital China and 46% discount to global peers – a level last seen during the global financial crisis when VST struggled to avert a solvency crisis. We think the situation now is radically different and the discount is unjustified. Earnings and target price revision We lower FY11 EPS by 2%, FY12 by 3% to reflect dilutions from recently granted options. We reduce our target price by 11% to HK$2.85. Price catalyst 12-month price target: HK$2.85 based on a PER methodology. Catalyst: 1H results in August, settlement of Chairman’s case in 3Q Action and recommendation Our revised target price of HK$2.85 is based on 8.7x FY11E PER, representing a 15% discount to global peer group at 10.2x FY11E. We believe the market’s concerns over potential TDR placement, quake disruption on inventory and Chairman’s litigation have caused the stock’s recent weakness, but these overhangs are short-term in nature and should be resolved in the next 12 months. Reiterate Outperform with 58% implied upside.

Welcome message from author
This document is posted to help you gain knowledge. Please leave a comment to let me know what you think about it! Share it to your friends and learn new things together.
Transcript

Please refer to the important disclosures and analyst certification on inside back cover of this document, or on our
website www.macquarie.com.au/disclosures.
HONG KONG
856 HK Outperform
Price 27 May 11 HK$1.81 12-month target HK$ 2.85
Upside/Downside % 57.5
Valuation HK$ 2.85 - PER GICS sector
Technology Hardware & Equipment
Market cap HK$m 2,279
30-day avg turnover US$m 0.7
Market cap US$m 293
Number shares on issue m 1,259
Investment fundamentals
Year end 31 Dec 2010A 2011E 2012E 2013E
Revenue m 26,213 30,062 34,872 40,103
EBIT m 466 586 698 822 EBIT growth % -8.4 25.7 19.0 17.9 Reported profit m 370 417 492 581 Adjusted profit m 303 417 492 581 EPS rep ¢ 29.3 32.6 38.4 45.4 EPS rep growth % 6.0 11.2 17.9 18.1
EPS adj ¢ 24.0 32.6 38.4 45.4 EPS adj growth % -12.6 35.7 17.9 18.1 PER rep x 6.2 5.6 4.7 4.0 PER adj x 7.5 5.6 4.7 4.0 Total DPS ¢ 0.0 5.0 9.8 11.5 Total div yield % 0.0 2.7 5.4 6.4 ROA % 6.5 7.0 7.5 7.8
ROE % 15.9 17.8 17.9 18.4 EV/EBITDA x 5.9 4.7 4.1 3.5 Net debt/equity % 32.6 46.1 45.3 43.2 P/BV x 1.1 0.9 0.8 0.7
856 HK rel HS China Enter performance, & rec history
Note: Recommendation timeline - if not a continuous line, then there was no Macquarie coverage at the time or there was an embargo period.
Source: FactSet, Macquarie Research, May 2011
(all figures in HKD unless noted)
Jamie Zhou +86 21 2412 9033 [email protected] Jake Lynch +86 21 2412 9007 [email protected]
30 May 2011 Macquarie Capital Securities Limited
VST Holdings Limited Asia-Pac’s IT distributor of choice Event
VST’s stock price has fallen 41% since early February (2% gain on the
HSCEI) and reached a fresh 52-week low of HK$1.71 on Tuesday May 24.
On a valuation basis, the stock has reached a level that it has not traded at
since early 2009. Also on May 24, VST bought back shares on the open
market for the first time in 2.5 years. The previous time VST did a share
buyback, a multi-year price floor was set.
We met with the management for business updates and a closer examination
of the company’s operational strength and potential growth drivers. We detail
our findings in this report.
Impact
The most efficient Asia-Pac IT distributor with plenty of growth drivers:
Compared with peers, VST’s strong operational management is evident in its
superior EBIT margins (11-30bps higher than peers). With a strengthened
balance sheet and rapidly expanding vendor platform, new growth drivers will
emerge as VST moves into Vietnam, India and lower-tier cities in China.
On track for a strong FY11: Subsidiary ECS delivered 28% YoY growth in 1Q
and 0.4% GM expansion, attributable to new vendor partnerships (incl. the iPad),
driving strong China growth and increasing enterprise systems revenue. VST
looks on track to deliver 18% adjusted revenue growth for FY11. Increasing
operating leverage from scale benefits should drive 17bps OPM expansion and
36% adj. EPS growth in FY11E. We forecast 15% EPS CAGR for FY12-14.
58% discount deeply unjustified: VST is now trading at a 2-year valuation
trough of 5.6x FY11E PER, a 58% discount to Digital China and 46% discount
to global peers – a level last seen during the global financial crisis when VST
struggled to avert a solvency crisis. We think the situation now is radically
different and the discount is unjustified.
Earnings and target price revision
We lower FY11 EPS by 2%, FY12 by 3% to reflect dilutions from recently
granted options. We reduce our target price by 11% to HK$2.85.
Price catalyst
12-month price target: HK$2.85 based on a PER methodology.
Catalyst: 1H results in August, settlement of Chairman’s case in 3Q
Action and recommendation
Our revised target price of HK$2.85 is based on 8.7x FY11E PER,
representing a 15% discount to global peer group at 10.2x FY11E.
We believe the market’s concerns over potential TDR placement, quake
disruption on inventory and Chairman’s litigation have caused the stock’s
recent weakness, but these overhangs are short-term in nature and should be
resolved in the next 12 months. Reiterate Outperform with 58% implied
upside.

Macquarie Research VST Holdings Limited
30 May 2011 2
Why has the stock been so weak lately? VST’s stock price has fallen 41% since early February and reached a fresh 52-week low of HK$1.71
on Tuesday (while the HSCEI gained 2% over the same period). On a valuation basis, the stock has
reached levels we have not seen since early 2009. We identify several possible reasons for VST’s
recent underperformance.
Earthquake concerns overdone: As a result of the devastating earthquake in Japan, VST has
experienced some disruption with the supply of Toshiba hard drive side (<2% of revenue), but the
effect is immaterial according to management. VST confirmed that there have been no notable
inventory disruptions from other vendors or products besides Toshiba HD. Indeed, mild supply
shortage (as demand remains strong) has been favourable for VST in the past, since vendors do not
push extra inventory down distribution channels and, as such, distributors are not under pressure to
give deep price discounts to sell excess inventory.
Unresolved share price overhangs: The stock is currently suffering from multiple price overhangs:
the insider trading probe involving Chairman Li, which is now adjourned until September; Eternal
Asia’s sell-down of 150m shares; and potential TDR listing and US$50m placement.
We will discuss these in detail on pages 14 and 16, but it is important to note that we believe these
overhangs are short-term in nature and do not pose threats to VST’s longer-term growth prospects.
Too cheap to ignore
VST is now trading at 5.6x FY11EE PER, representing a 58% discount to Digital China (861 HK,
HK$14.26, OP, TP HK$18.50) and 46% to the sector average - a level last seen in early 2009 when
global economic uncertainty was at a peak and VST was struggling to reduce its net gearing from an
all-time high of 143% to avoid a solvency crisis. We think the situation now is radically different from
early 2009 and the market’s deep discount on VST is unjustified.
We note that the company started buying back shares on May 24. The previous time a share
buyback was orchestrated by the company – in late 2008 – a multi-year price floor was set for VST’s
stock price (see Fig 1).
Fig 1 VST historic price chart and PER bands
Source: Bloomberg, Company data, Macquarie Research, May 2011
0.00
0.50
1.00
1.50
2.00
2.50
3.00
3.50
4.00
Jan-06 Jul-06 Jan-07 Jul-07 Jan-08 Jul-08 Jan-09 Jul-09 Jan-10 Jul-10 Jan-11 Jul-11
4x
6x
8x
10x12xHK$
2x
Chairman
accused of
insider trading
iPad deal
announcement
Malaysia unit
spin-off
Appointed Mervyn Mao
as Executive Director
and CEO of ECS China
Announced Malaysia
spin-off
14m shares
buyback @
HK$0.44-
0.49/sh
HK$66m 2-year
CB issuance
206m share placement at
HK$2.89/sh, raising net of proceed
HK$552m for the acquisition of ECS
Partially refinanced the
HK$800m bridge loan
w ith:
1. private placement of
170m shares to Eternal
Asia at HK$1.00/sh
2. HK$330m 3-year
loan 51% collateralized
by ECS shares
First announcement
on ECS acquisition
Company continued to de-lever from an all-
time high net gearing of 143% as business
conditions improved w ith the economy
Acquired ECS for
~HK$1.3bn
Financed partially by
a short-term bridge
loan of HK$800m,
collateralized by
ECS shares
Stock reaches 2-year
valuation low , company
buys back shares

Macquarie Research VST Holdings Limited
30 May 2011 3
Solid 1Q11, strong year ahead Strong ECS 1Q results: VST’s 90%-owned subsidiary ECS (ECS SP, Not rated), which accounts for
about two-thirds of VST’s revenue and profits, announced very strong 1Q results on May 12.
Adjusted revenues were up 28% YoY, while net profit was up 30%. The strong growth is impressive
compared with the company's overall guidance of a high-teens growth rate.
Particularly impressive was the strong 33% YoY revenue growth recorded in China. This was
attributable to new vendor distributorship agreements obtained in the second half of 2010,
particularly the main distributorship for Apple iPads. ECS alone sold more than 80k units of iPad in
the first quarter, which represents approximately 40% market share among the appointed
distributors. Management expects this momentum to continue into the remainder of the year, as their
partnership agreement with Apple also includes the distribution of the second generation of the
popular tablet after its launch in May 2011.
Equally positive was the expansion of gross margin from 4.7% to 5.1%, even during the seasonally
weak quarter. ECS saw increase in revenue contribution from the higher gross margin Enterprise
Systems segment (6-8% GM vs. 3-5% distribution GM).
Fig 2 Financial snapshot
HK$m FY10 FY11E FY12E FY13E FY14E
Revenue (reported) 26,213 30,062 34,872 40,103 44,113 …YoY growth 5.0% 14.7% 16.0% 15.0% 10.0% Revenue (ex-Malaysia) 25,476 30,062 …YoY growth 15.9% 18.0% Gross profit 1,153 1,323 1,535 1,765 1,941 …Gross margin 4.4% 4.4% 4.4% 4.4% 4.4% EBIT (Macquarie def) 466 586 698 822 904 …EBIT margin 1.8% 2.0% 2.0% 2.1% 2.1% Net profit (before minorities) 408 460 542 640 703 …Net margin 1.6% 1.5% 1.6% 1.6% 1.6% Adjusted EPS (HK¢) 24.0 32.6 38.4 45.4 49.9 …YoY growth NA 36% 18% 18% 10%
Source: Company data, Macquarie Research, May 2011
As VST is one of the largest IT distributors regionally and arguably has the strongest operational
management, growth should be driven by robust Asia-Pac IT demand and by market share
expansion on the back of continuing industry consolidation.
Scale and scope benefits to drive operating margin expansion in FY11: With the acquisition of
ECS in 2007, VST has transformed itself from a China-only distributor that carried a few products to
a leading regional distributor with an expanding vendor platform and geographical penetration. We
believe VST will continue to benefit from increased operating leverage as well as growing vendor
market share, which should drive EBIT margin higher.
We forecast 18% adjusted revenue growth (ex-Malaysia) and a 17bp rise in EBIT margin, driving
36% growth in adjusted EPS in FY11E and 15% EPS CAGR FY12-14E.
Macquarie Research VST Holdings Limited
30 May 2011 4
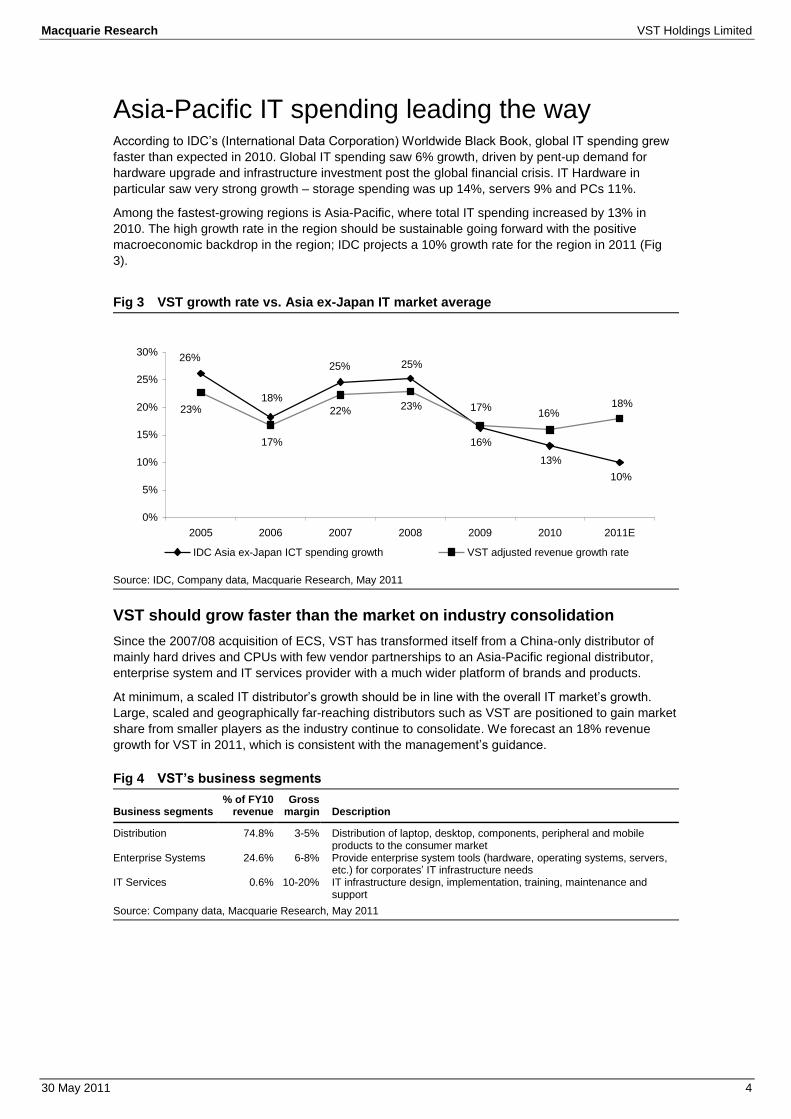
Asia-Pacific IT spending leading the way According to IDC’s (International Data Corporation) Worldwide Black Book, global IT spending grew
faster than expected in 2010. Global IT spending saw 6% growth, driven by pent-up demand for
hardware upgrade and infrastructure investment post the global financial crisis. IT Hardware in
particular saw very strong growth – storage spending was up 14%, servers 9% and PCs 11%.
Among the fastest-growing regions is Asia-Pacific, where total IT spending increased by 13% in
2010. The high growth rate in the region should be sustainable going forward with the positive
macroeconomic backdrop in the region; IDC projects a 10% growth rate for the region in 2011 (Fig
3).
Fig 3 VST growth rate vs. Asia ex-Japan IT market average
Source: IDC, Company data, Macquarie Research, May 2011
VST should grow faster than the market on industry consolidation
Since the 2007/08 acquisition of ECS, VST has transformed itself from a China-only distributor of
mainly hard drives and CPUs with few vendor partnerships to an Asia-Pacific regional distributor,
enterprise system and IT services provider with a much wider platform of brands and products.
At minimum, a scaled IT distributor’s growth should be in line with the overall IT market’s growth.
Large, scaled and geographically far-reaching distributors such as VST are positioned to gain market
share from smaller players as the industry continue to consolidate. We forecast an 18% revenue
growth for VST in 2011, which is consistent with the management’s guidance.
Fig 4 VST’s business segments
Business segments % of FY10
revenue Gross
margin Description
Distribution 74.8% 3-5% Distribution of laptop, desktop, components, peripheral and mobile products to the consumer market
Enterprise Systems 24.6% 6-8% Provide enterprise system tools (hardware, operating systems, servers, etc.) for corporates’ IT infrastructure needs
IT Services 0.6% 10-20% IT infrastructure design, implementation, training, maintenance and support
Source: Company data, Macquarie Research, May 2011
25%26%
18%
16%
25%
13%
10%
17%
23% 17%23% 22% 16%18%
0%
5%
10%
15%
20%
25%
30%
2005 2006 2007 2008 2009 2010 2011E
IDC Asia ex-Japan ICT spending growth VST adjusted revenue growth rate

Macquarie Research VST Holdings Limited
30 May 2011 5
Why do IT vendors need the distributors? An IT hardware vendor’s top priority is to design and manufacture the best products, and then
convert them into cash as quickly as they can.
Distribution is an integral part of the IT value chain, particularly given that many products have short
lifecycles. As a result, the timely and efficient distribution of products is a crucial determinant of their
commercial success as vendors compete with each other to bring the latest technology to the
market.
IT distribution is a working capital-intensive function; most of the funds in the distribution
process are tied up in inventory and receivables (Fig 16). Many major vendors don’t have expertise,
lack sufficient resources to run an efficient distribution network, or find it more economical to partner
with third-party distributors.
What about the direct selling model? Direct selling to the end customer works well in developed
economies such as the US, but not as effective in emerging Asia where customers are less willing to
purchase big-ticket items such as computers or laptops online or over the phone with credit cards.
Some direct selling is emerging in the Tier 1 cities in China, but it is unlikely to replace the traditional
distributor-retailer model in the near future.
What do vendors look for in distributors?
Extensive distribution network: Vendors choose distribution partners based on their number
of sales channels, regional offices and retailer partnerships. Vendors prefer to partner with
distributors that have a large network, allowing vendors to efficiently push inventory to the
desired target markets and end customers. A large IT distribution network in Emerging Asia is
particularly difficult to build and maintain, given the complexity of logistics systems and multiple
layers of middlemen.
Balance sheet strength: Vendors are inclined to give large volumes of inventory to scaled
distributors who have the balance sheet strength to pay for most or the entire purchases with
cash; in return, the vendors will give cash discount incentives. The ability for a distributor to
secure bank financing at a reasonable rate generally depends on the scale of operation and
level of cash flow.
We discuss VST’s comparative advantages in detail in the following sections.

Macquarie Research VST Holdings Limited
30 May 2011 6
Growing vendor portfolio VST’s revenue has historically been concentrated in a few brands and products. In FY10, 31% of the
company’s revenue came from HP, while another 20% came from the sale of Seagate and Western
Digital hard drives (Figure 6). Concentration on a few brands can be risky as was the case for HP in
2010; we discuss this in detail in the Risk section later in this report.
Since the ECS acquisition in 2008, the company has made significant progress in diversifying its
vendor portfolio. The company has been signing distribution partnership agreements with global IT
brands. In 2010 alone, VST and subsidiaries secured regional distributorships of, among others,
Lenovo and Dell laptops, and most noticeably, the iPad and iPhone in China.
Thanks to these new vendor partnerships, VST’s overall revenue mix should be more evenly
diversified among the brands going forward. For FY11, management expects HP sales as a
percentage of overall sales to fall below 30%, while Apple will increase to 15% and other brands to
increase proportionally as well.
Replicating the iPad success in South East Asia: During the first quarter of 2011, VST sold over
80k iPads in China, which represents approximately 40% of market share (according to VST
management) among the authorised distributors appointed by Apple. Leveraging off its success in
China, VST intends to bring the iPad to Southeast Asia.
Fig 5 Partnering with top IT brands Fig 6 FY10 revenue breakdown by brands
Source: Company data, Macquarie Research, May 2011 Source: Company data, Macquarie Research, May 2011
HP
31%
Seagate
14%Apple
6%
Western Digital
6%
Lenovo
5%
AMD
4%
Dell
3%
Intel
3%
Others
28%
Macquarie Research VST Holdings Limited
30 May 2011 7
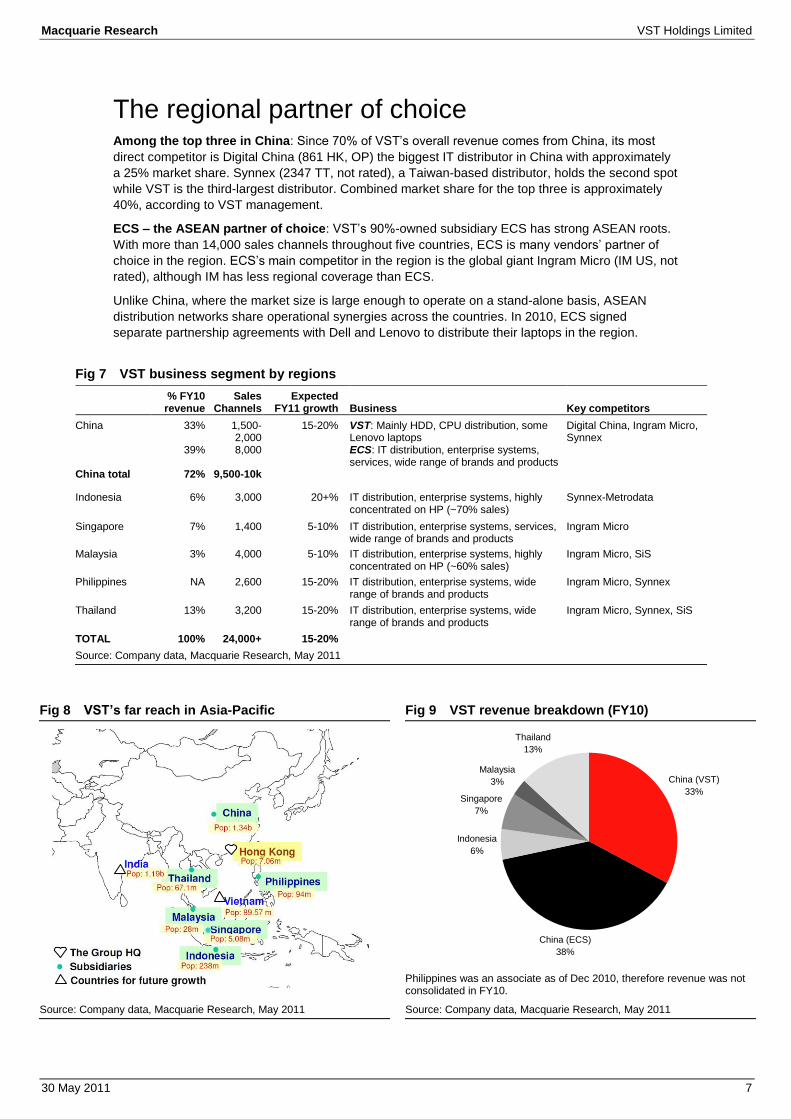
The regional partner of choice Among the top three in China: Since 70% of VST’s overall revenue comes from China, its most
direct competitor is Digital China (861 HK, OP) the biggest IT distributor in China with approximately
a 25% market share. Synnex (2347 TT, not rated), a Taiwan-based distributor, holds the second spot
while VST is the third-largest distributor. Combined market share for the top three is approximately
40%, according to VST management.
ECS – the ASEAN partner of choice: VST’s 90%-owned subsidiary ECS has strong ASEAN roots.
With more than 14,000 sales channels throughout five countries, ECS is many vendors’ partner of
choice in the region. ECS’s main competitor in the region is the global giant Ingram Micro (IM US, not
rated), although IM has less regional coverage than ECS.
Unlike China, where the market size is large enough to operate on a stand-alone basis, ASEAN
distribution networks share operational synergies across the countries. In 2010, ECS signed
separate partnership agreements with Dell and Lenovo to distribute their laptops in the region.
Fig 7 VST business segment by regions
% FY10
revenue Sales
Channels Expected
FY11 growth Business Key competitors
China 33% 1,500-2,000
15-20% VST: Mainly HDD, CPU distribution, some Lenovo laptops
Digital China, Ingram Micro, Synnex
39% 8,000 ECS: IT distribution, enterprise systems, services, wide range of brands and products
China total 72% 9,500-10k
Indonesia 6% 3,000 20+% IT distribution, enterprise systems, highly concentrated on HP (~70% sales)
Synnex-Metrodata
Singapore 7% 1,400 5-10% IT distribution, enterprise systems, services, wide range of brands and products
Ingram Micro
Malaysia 3% 4,000 5-10% IT distribution, enterprise systems, highly concentrated on HP (~60% sales)
Ingram Micro, SiS
Philippines NA 2,600 15-20% IT distribution, enterprise systems, wide range of brands and products
Ingram Micro, Synnex
Thailand 13% 3,200 15-20% IT distribution, enterprise systems, wide range of brands and products
Ingram Micro, Synnex, SiS
TOTAL 100% 24,000+ 15-20%
Source: Company data, Macquarie Research, May 2011
Fig 8 VST’s far reach in Asia-Pacific Fig 9 VST revenue breakdown (FY10)
Philippines was an associate as of Dec 2010, therefore revenue was not consolidated in FY10.
Source: Company data, Macquarie Research, May 2011 Source: Company data, Macquarie Research, May 2011
China (VST)
33%
China (ECS)
38%
Indonesia
6%
Singapore
7%
Malaysia
3%
Thailand
13%

Macquarie Research VST Holdings Limited
30 May 2011 8
Expanding into new markets With HK$1bn cash on the balance sheet and a historically low net gearing level of 33% as at the end
of December 2010, VST is looking to deploy some of the funds for value-accretive capital
expenditure. However, the company is not ruling out a potential placement through the listing of TDR
shares (see page 13) to fund additional M&A opportunities in South-East Asia. We discuss here in
details the opportunities that VST is currently exploring.
Lower-tier cities in China: As Tier 1 cities in China are becoming ever more saturated with IT
distributors, VST is looking to expand further out into lower-tier cities, where significant growth
potential still exists and distribution profit margins are less negatively impacted than in the major
cities. VST has more than 10,500 sales channels in mainland China; a lot of these are already in the
lower-tier cities.
We recently spoke with Mervyn Mao, current CEO of ECS China and previously an executive at
Digital China managing its distribution business. Mr. Mao explained to us ECS’s plan to set up
provincial sales offices in lower-tier cities of China where critical mass of customers have been
reached. Having a provincial sales office would allow VST to further penetrate the local markets and
better serve customers. The company has stated that it plans to increase the number of regional
sales offices from 11 to 20 by the end of 2011 and plan to further expand in 2012 to cover majority of
the country.
Vietnam – bringing in vendor relationships: VST is seeking partnership opportunities with local
distributors who have the domestic channels but lack relationships with global vendors. VST plans to
establish a joint venture with an ideal partner to which VST would bring in its established vendor
relationships. The partnership could be structured similarly to VST’s Philippines operation (ECS
Infocom), where ECS has a 49% stake with an option to purchase up to 60% – at which point the
entity could be consolidated as a subsidiary of the company.
India – market consolidation story: VST sees fruitful consolidation opportunities in India – a
country that IDC predicts will become the third-largest IT market in Asia-Pacific, trailing only China
and Japan. The Indian IT distribution industry is a rather fragmented one with the market leader
Redington (REDI IN, not rated) holding a low-teen market share. Redington is owned 25% by Synnex
(2347 TT not rated), a major competitor of VST. VST’s entrance into India would likely be in the form
of an acquisition of a medium-sized distributor.
Laos is a market that VST aims to expand into with the support of its Thailand unit. Per our most
recent conversation with management, they do not have a detailed plan for Laos at this point.
VST has not explicitly given profit margin expectations in these new markets but has said they should
fall within the 3-5% range for distribution gross margin.
We are not factoring in any additional revenue or profit from the regional M&A opportunities. Should
VST pursue any value-accretive acquisition, it could lead to upside to our current forecasts.

Macquarie Research VST Holdings Limited
30 May 2011 9
The most efficient IT distributor Pure IT distribution profit margins are low, with gross margin typically around the 3-5% range. This is
especially the case in China, where competition among distributors has intensified as top-tier cities
are becoming saturated. Thus, a pure distributor’s profit margin is highly correlated to operational
efficiency.
We compared the profit margins of VST against its main competitors Digital China and Synnex. As
illustrated below in Fig 10, VST’s operating profit margins have been consistently higher than those
of DC and Synnex.
Fig 10 Operating profit margins Fig 11 SG&A as % of revenue
*adjusted to replicate VST’s revenue mix
Source: Company data, Macquarie Research, May 2011 Source: Company data, May 2011
Fig 12 Gross profit margins Fig 13 Net profit margins
*adjusted to replicate VST’s revenue mix
Source: Company data, Macquarie Research, May 2011 Source: Company data, May 2011
Margins likely to stabilize at current levels
The decline in VST’s OPM from FY06-08 levels was due to the ECS acquisition. Prior to ECS, VST
was a component distributor of two main products: CPUs and hard drives. The company had two
major vendors (AMD and Seagate), in which VST had majority (~50%) vendor shares. Therefore,
VST’s operating costs were significantly lower pre-ECS but at the expense of limited growth potential
and declining gross margins.
The ECS acquisition brought VST a wide range of products and vendors, transforming the group into
a pan-Asia distributor with multiple new growth drivers. Competition for vendor share and increased
operational cost resulted in lower margins. Going forward, profit margins will likely to continue facing
pressure as competition intensifies. However, increasing operational leverage and growing enterprise
systems revenue should more than offset the margin erosion from competition. We forecast VST’s
operating margin to rise by 17bp to 2% in FY11 and stabilize at that level going forward.
0.0%
1.0%
2.0%
3.0%
4.0%
5.0%
FY06 FY07 FY08 FY09 FY10 FY11E FY12E
VST Digital China (distribution + ent. systems)* Synnex
0.0%
1.0%
2.0%
3.0%
4.0%
5.0%
6.0%
FY06 FY07 FY08 FY09 FY10 FY11E FY12E
VST Digital China Synnex
0.0%
1.0%
2.0%
3.0%
4.0%
5.0%
6.0%
7.0%
FY06 FY07 FY08 FY09 FY10 FY11E FY12E
VST Digital China (distribution + ent. systems)* Synnex
0.0%
0.5%
1.0%
1.5%
2.0%
2.5%
3.0%
3.5%
4.0%
FY06 FY07 FY08 FY09 FY10 FY11E FY12E
VST Digital China (company) Synnex
Macquarie Research VST Holdings Limited
30 May 2011 10
How does VST achieve superior operational efficiency?
Stringent cost control: VST’s operational managers are given strict targets to minimize costs. Their
KPIs are designed to align with the company’s overall goal of maintaining a lean cost structure and
healthy working capital turnover. Operational managers’ KPI is partially based on the collection
period and bad debt write-down of his/her client portfolio. In addition, staff expense is tightly
managed; for example, no employees (including senior management) are permitted to take business-
class flights.
VST promotes and rewards outstanding performers. In February 2011, VST granted 4.9 million share
options to directors and employees, including more than 30 senior managers.
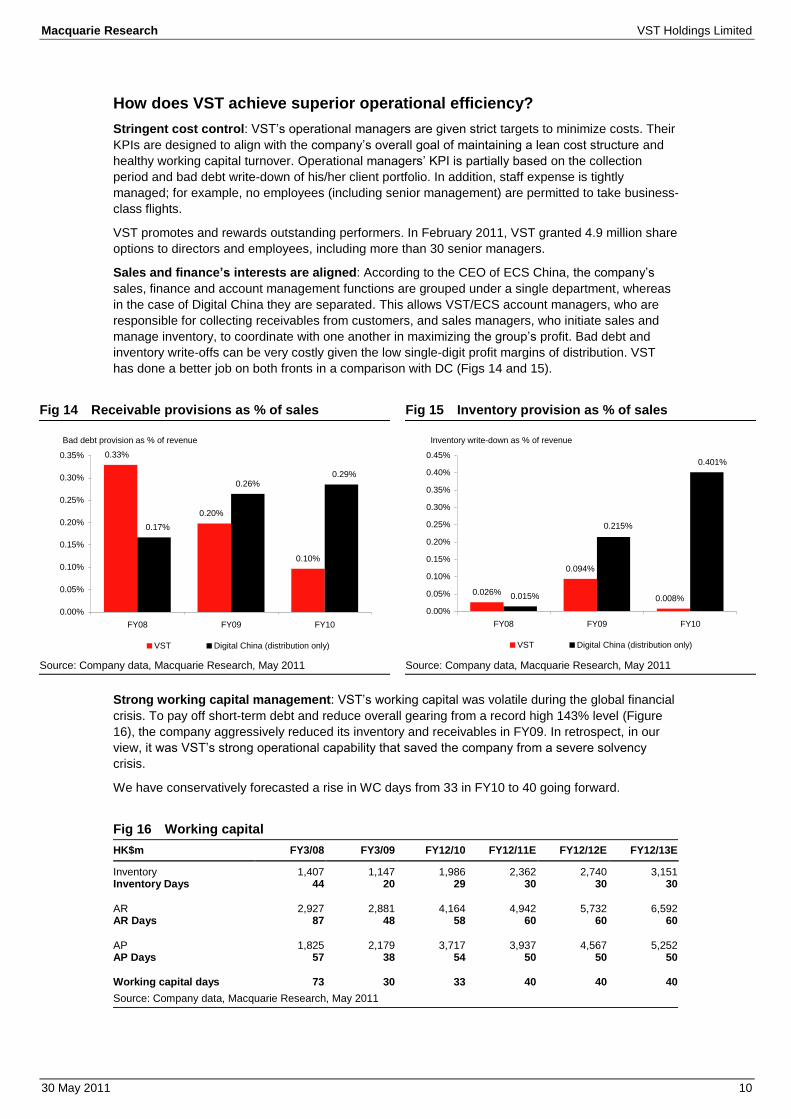
Sales and finance’s interests are aligned: According to the CEO of ECS China, the company’s
sales, finance and account management functions are grouped under a single department, whereas
in the case of Digital China they are separated. This allows VST/ECS account managers, who are
responsible for collecting receivables from customers, and sales managers, who initiate sales and
manage inventory, to coordinate with one another in maximizing the group’s profit. Bad debt and
inventory write-offs can be very costly given the low single-digit profit margins of distribution. VST
has done a better job on both fronts in a comparison with DC (Figs 14 and 15).
Fig 14 Receivable provisions as % of sales Fig 15 Inventory provision as % of sales
Source: Company data, Macquarie Research, May 2011 Source: Company data, Macquarie Research, May 2011
Strong working capital management: VST’s working capital was volatile during the global financial
crisis. To pay off short-term debt and reduce overall gearing from a record high 143% level (Figure
16), the company aggressively reduced its inventory and receivables in FY09. In retrospect, in our
view, it was VST’s strong operational capability that saved the company from a severe solvency
crisis.
We have conservatively forecasted a rise in WC days from 33 in FY10 to 40 going forward.
Fig 16 Working capital
HK$m FY3/08 FY3/09 FY12/10 FY12/11E FY12/12E FY12/13E
Inventory 1,407 1,147 1,986 2,362 2,740 3,151 Inventory Days 44 20 29 30 30 30 AR 2,927 2,881 4,164 4,942 5,732 6,592 AR Days 87 48 58 60 60 60 AP 1,825 2,179 3,717 3,937 4,567 5,252 AP Days 57 38 54 50 50 50 Working capital days 73 30 33 40 40 40
Source: Company data, Macquarie Research, May 2011
0.10%
0.26%
0.33%
0.20%
0.17%
0.29%
0.00%
0.05%
0.10%
0.15%
0.20%
0.25%
0.30%
0.35%
FY08 FY09 FY10
VST Digital China (distribution only)
Bad debt provision as % of revenue
0.026%
0.094%
0.008%
0.215%
0.015%
0.401%
0.00%
0.05%
0.10%
0.15%
0.20%
0.25%
0.30%
0.35%
0.40%
0.45%
FY08 FY09 FY10
VST Digital China (distribution only)
Inventory write-down as % of revenue

Macquarie Research VST Holdings Limited
30 May 2011 11
Access to inexpensive bank financing: VST and its subsidiaries have over the years built strong
relationships with close to 20 commercial banks across the six regions they operate in. The majority
of VST’s borrowings are short-term bank loans in US dollars from banks in Hong Kong and
Singapore. Interest rates in those regions can be as low as LIBOR plus 1-2% per annum, compared
with more than 6% in China in today’s environment. VST has an aggregate short-term banking facility
of approximately HK$4bn, of which less than 25% is being utilized.
Fig 17 VST’s various sources of inexpensive bank financing
Debt as of Dec 2010 % of Nominal Year of Currency In HK$m Total borrowing Interest rate Maturity
HK$ 171 10% 1.80% 2011 RMB 163 9% 4.86% - 5.10% 2011 S$ 9 1% 1.29% - 1.45% 2011 US$ 1,229 69% 1.34% - 3.91% 2011-13 THB 201 11% 1.88% - 2.20% 2011 Total 1,773
Source: Company data, Macquarie Research, May 2011
Fig 18 Net gearing ratio significantly lowered Fig 19 Low interest rates keep financing cost down
Source: Company data, Macquarie Research, May 2011 Source: Company data, Macquarie Research, May 2011
Based on our model, one percentage change in average interest rate VST pays on its borrowings
would inversely impact EPS by three percentage points.
Fig 20 Interest rate sensitivity
Average 2011 interest rate
3% 4% 5%
FY11 EPS (HK cents) 33.6 32.6 31.6 vs. base case +3% 0% -3%
Source: Macquarie Research, May 2011
48%46%33%
51%48%50%
67%
103%
143%
0.0
0.5
1.0
1.5
2.0
2.5
2H08 1H09 2H09 09/09 12/09 1H10 2H10 FY11E FY12E
0%
20%
40%
60%
80%
100%
120%
140%
160%
Total borrowing Net D/E
Net D/ETotal borrowing HK$bn
0.44%
0.50%
0.34%
0.16%
0.22%0.24% 0.24% 0.23%
0.00%
0.10%
0.20%
0.30%
0.40%
0.50%
0.60%
2H08 1H09 2H09 12/09 1H10 2H10 FY11E FY12E
Financing cost as % of sales

Macquarie Research VST Holdings Limited
30 May 2011 12
SWOT Analysis
Strengths Weaknesses
A top regional IT distributor with more country coverage
than most peers
Sources of inexpensive bank financing from Hong Kong
and Singapore
Operationally the most efficient distributor
Ability to attract talents from competitors
Strong balance sheet position: HK$1bn cash, 33% net
gearing
#3 player in China; has smaller scale than key
competitors Digital China and Synnex
Lack of revenue from higher-margin IT services and
software
Complex corporate structure: 3 listed entities and a
possible TDR listing
Higher net gearing than its peers, although it has come
down significantly in the past two years
ECS and VST not fully integrated
ERP systems are not uniform across the group
Opportunities Threats
Lower-tier cities in China and ASEAN still have plenty of
growth potential
Market consolidation opportunity in China and India
Bringing vendor relationships into Vietnam in JV form
Intensifying competition in Tier 1 cities in China
Increasing vendor direct selling could harm distributor
margins
Key vendors losing market shares to their competitors
Unexpected rise in interest rates could increase VST’s
cost of borrowing thus lowering operating profits

Macquarie Research VST Holdings Limited
30 May 2011 13
Key investment risks Vendor concentration risk
A distributor’s business prospects are intrinsically linked to the success of its vendor’s products. High
vendor concentration can be risky, as was the case for VST and HP in 2010.
In the case of HP, the company failed to properly address customer complaints and did not provide
adequate warranty services relating to defective screens on some of its laptop products sold in China
since 2007. On March 15, 2010 (International Consumer Rights Protection Day), HP received an
official complaint filed by a lawyer representing 170 dissatisfied customers in China.
The incident was widely covered by national media. HP’s China sales declined significantly as a
consequence, with its market share falling from 16.6% to 9.2%, leading it to concede its top 3 spot to
Acer (according to IDC).
Since HP accounts for almost one-third of VST’s total sales, the incident hurt VST’s sales in FY10.
Towards the end of 1H2010, VST was forced to reduce prices on many of its HP products and
increase its inventory provision. The majority of the write-offs were reversed in the second half, but
the incident was concerning.
As previously discussed, VST and its subsidiaries have made significant progress in diversifying its
vendor platform in 2010. VST expects proportional sales from HP to drop to below 30% in FY11
while Apple, Lenovo and Dell sales should increase.
Placement risk: Taiwan Depository Receipt (TDR)
VST’s subsidiary ECS is applying for listing its shares in Taiwan. Management has also openly
discussed raising approximately US$50m in new shares. From our recent conversation with the
company, ECS will not likely sell new shares at the current low valuation but did not rule out the
possibility should share prices recover to higher levels.
We think a Taiwan listing and raising funds for value-accretive acquisitions would be positive moves
for VST, but in our view they should be done at the VST level. We believe an ECS TDR will further
complicate the already complex corporate structure VST has, with three listed entities under its belt.
Fig 21 VST corporate structure
*ECS has 49% stake in ECS Infocom Philippines and the option to increase stake to 60%.
Source: Bloomberg, Macquarie Research, May 2011
ECS Holdings Limited (ECS SP )
VST Holdings Limited (856 HK )
VST
China
ECS
China
ECS
Singapore
ECS
Indonesia
The Value
Systems
Thailand
ECS
Malaysia
(ECS MK )
ECS
Infocom
Philippines
89%
100% 100% 100% 100% 100% 41% 49%*
ECS TDR?
Macquarie Research VST Holdings Limited
30 May 2011 14
Working capital management risk
Common to most distributors, receivables and inventory management are critical areas, as most of
their balance sheets are tied up in working capital. VST and its subsidiaries interact with hundreds of
vendors and customers on a regular basis. It is an ongoing trade-off for procurement and sales
managers to decide whether to take on extra inventory (fighting for vendor market share) and risking
having to mark down inventory should demand for products be weaker than anticipated, as well as
selling product to customers on credit that would later be written off as bad debt.
As we have discussed previously, one of VST’s key operational advantages over its larger peers is
that its sales, inventory and account functions are grouped under a single unit, so that maximizing
operating profit goals are aligned. Owing to this structure, VST was able to quickly reduce its working
capital in order to pay down short-term borrowing during the 2008/09 financial crisis.
Foreign exchange risk
VST’s primary forex exposure is the conversion of renminbi into US dollars. 70% of VST’s revenue
comes from China where revenue is generated in RMB through onshore sales but payments to
vendor for inventory is done through offshore accounts in USD. In the current appreciating RMB
environment, the forex implication for VST is positive: the company pays for inventory with USD first,
then collects sales proceeds in RMB as it appreciates against USD.
However, should the RMB unexpectedly depreciate against the USD, VST could face foreign
exchange losses.
Liquidity risk
Given the working capital-intensive nature of VST’s distribution business, maintaining healthy
financial leverage is important. Much of VST’s working capital needs (HK$2.4bn as at Dec 2010) is
financed by unsecured bank financing (HK$1.6bn, >60% short term).
In late 2007, VST financed the HK$1.3bn acquisition of ECS with a short-term bridge loan of
HK$800m and share placement of HK$550m, with the expectations that the loan could easily be
refinanced upon maturity. However it wasn’t the case when VST tried to refinance a year later, when
credit markets worldwide seized up dramatically in the midst of the global financial crisis. This almost
put VST on the brink of insolvency but thanks to its strong operational management, it was able to
squeeze out much of the needed cash from working capital to pay down debt and reduce net gearing
from a very high level of 143% (Fig 16).
Macquarie Research VST Holdings Limited
30 May 2011 15
Valuation VST has historically traded at a discount to its larger peers, particularly to Digital China, due to its
smaller size and limited revenue contribution from higher-margin IT services and software segments.
In addition to the TDR placement risk mentioned earlier, the stock is suffering from two major
overhangs:
Share price overhang #1: Chairman’s insider trading probe
Chairman Li is currently under investigation by Hong Kong authorities for insider trading. Based on
our understanding of the case, Chairman Li failed to disclose the trading of 5.8m shares of VST
between Sept 2007 and Jan 2008. Total value of the trades was around US$2m during a time when
VST shares traded between 8-14x forward PER.
HK Authorities are trying to determine whether he is guilty of share price manipulation. The case is
adjourned until September 2011. Potential punishment could range from a fine to jail sentence
depending on the outcome.
Our focus is on the sturdiness of the management team. In the worst-case scenario under which
Chairman Li is not able to run the company full time, would the rest of the management team be able
to continue executing its growth story? We are reasonably confident that the team would be able to
do so. Much of the ECS team from the acquisition is intact. Equally worth mentioning, we believe the
expertise of Mervyn Mao (who came from Digital China in 2009) would be critical in building out the
China business. Our sense is that Mr Li has been actively trying to build a well-developed
management team for at least three years. As such, we think our projection of continued growth is
achievable.
Share price overhang #2: Eternal Asia sell-down
VST placed 112m and 56m shares to Eternal Asia (002183 CH, not rated) at HK$1 per share in July
and August 2009, respectively, giving EA an 18% stake. EA then sold 60m VST shares at HK$2 per
share off-market in December 2009 and also made it public that it is considering selling the
remaining VST shares to take profit. EA presently holds 159m of VST shares.
Another VST shareholder, privately-held Potent Growth (currently holding 5% of VST) entered into an
agreement with EA in December 2009 giving PG the option to buy 150m VST shares from EA at
HK$2.10 per share by the end of May 2010. However, this transaction has been postponed
repeatedly because as an A-share listed company, EA needed to obtain CSRC approval on the sales
of foreign investments (VST shares).
According to announcements made by EA, it has obtained CSRC approval on the share sale and
PG’s call option has been extended to November 26, 2011 and both parties remain committed to
completing the transaction.
We believe both of the above-mentioned overhangs are short-term in nature and do not pose a threat
to VST’s longer-term growth prospects.
Macquarie Research VST Holdings Limited
30 May 2011 16
What’s an appropriate valuation discount for VST?
We believe VST will likely to continue trading at a discount to larger peers; however, the current
discount of 58% to Digital China and 46% to sector peers seems unjustified to us. VST’s 4-year
average PER discount to Digital China is about 17%.
On one hand, we think VST should trade at a valuation discount due to its smaller size compared
with peers DC and Synnex, its lack of a high-margin growth driver such as software and its complex
corporate structure. On the other hand, given VST’s strong position and growth prospects in the
Asia-Pacific region, comparative operational strength, higher-than-peer distribution profit margins and
reduced net gearing level, we believe it deserves to trade at a multiple close to the sector average.
Our new target price of HK$2.85 (HK$3.20 previously) is based on 8.7x CY11E PER (vs. 9.8x
previously), implying a 15% discount to the global peer group – a discount we believe appropriately
reflects VST’s intrinsic value. VST’s average forward PER over the last five years is 7.5x; however,
we think the average is not meaningful since it is distorted by a period of ultra-low valuation (<2x)
during the financial crisis. We reduced VST’s target price by 11% primarily to reflect the lowered
global peer group valuation.
The stock could continue to trade at a discount in the near term in the presence of the previously
mentioned overhangs. On a 12-month basis, however, we expect the overhangs to be resolved and
VST shares to trade at our target valuation.
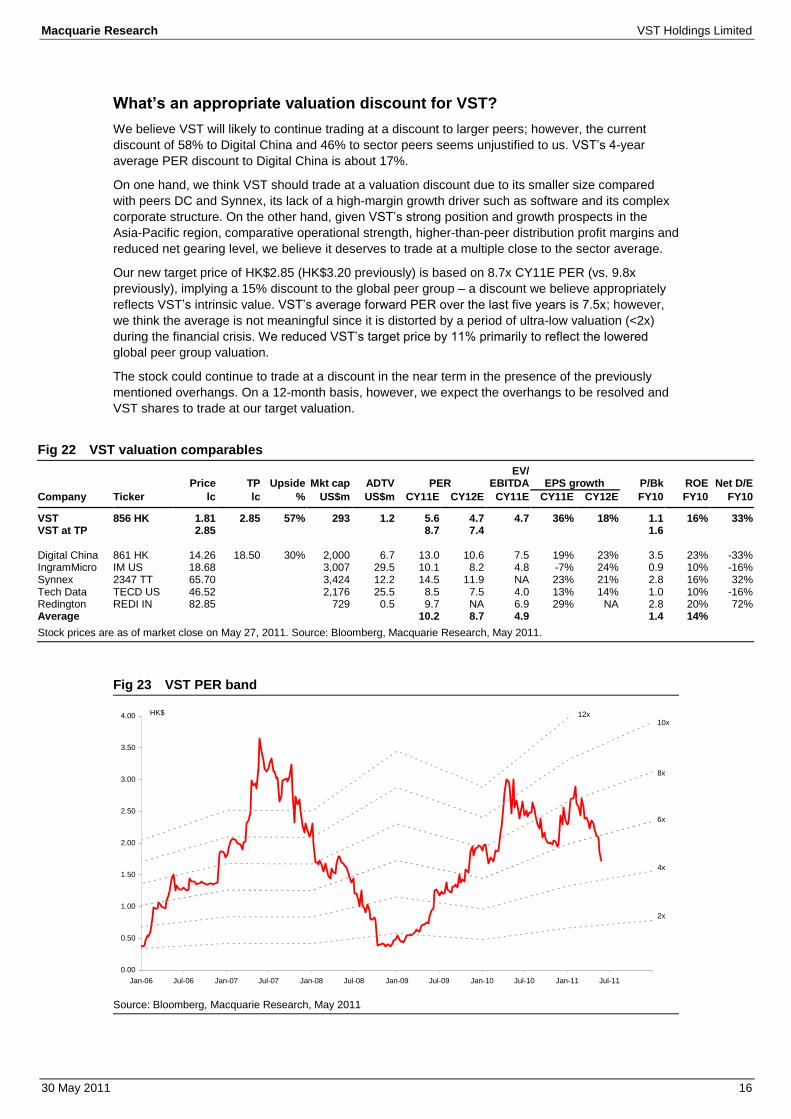
Fig 22 VST valuation comparables
Price TP Upside Mkt cap ADTV PER
EV/ EBITDA EPS growth P/Bk ROE Net D/E
Company Ticker lc lc % US$m US$m CY11E CY12E CY11E CY11E CY12E FY10 FY10 FY10
VST 856 HK 1.81 2.85 57% 293 1.2 5.6 4.7 4.7 36% 18% 1.1 16% 33% VST at TP 2.85 8.7 7.4 1.6 Digital China 861 HK 14.26 18.50 30% 2,000 6.7 13.0 10.6 7.5 19% 23% 3.5 23% -33% IngramMicro IM US 18.68 3,007 29.5 10.1 8.2 4.8 -7% 24% 0.9 10% -16% Synnex 2347 TT 65.70 3,424 12.2 14.5 11.9 NA 23% 21% 2.8 16% 32% Tech Data TECD US 46.52 2,176 25.5 8.5 7.5 4.0 13% 14% 1.0 10% -16% Redington REDI IN 82.85 729 0.5 9.7 NA 6.9 29% NA 2.8 20% 72% Average 10.2 8.7 4.9 1.4 14%
Stock prices are as of market close on May 27, 2011. Source: Bloomberg, Macquarie Research, May 2011.
Fig 23 VST PER band
Source: Bloomberg, Macquarie Research, May 2011
0.00
0.50
1.00
1.50
2.00
2.50
3.00
3.50
4.00
Jan-06 Jul-06 Jan-07 Jul-07 Jan-08 Jul-08 Jan-09 Jul-09 Jan-10 Jul-10 Jan-11 Jul-11
4x
6x
8x
10x12xHK$
2x

Macquarie Research VST Holdings Limited
30 May 2011 17
Other companies mentioned:
Acer (2353 TT, NT$55.90, UP, TP NT$39.00 Andrew Chang)
AMD (AMD US, US$8.49, N, Shawn Webster)
Apple (AAPL US, NR)
Dell (DELL US, NR)
Lenovo (992 HK, HK$4.56, OP, TP HK$6.50, Jiong Shao)
SiS (SIS TB, NR)
Seagate (STX US, NR)

Macquarie Research VST Holdings Limited
30 May 2011 18
VST (856 HK, Outperform, Target Price: HK$2.85) Interim Results 2H/10A 1H/11E 2H/11E 1H/12E Profit & Loss 2010A 2011E 2012E 2013E
Revenue m 13,921 14,430 15,632 16,739 Revenue m 26,213 30,062 34,872 40,103 Gross Profit m 611 635 688 737 Gross Profit m 1,153 1,323 1,535 1,765 Cost of Goods Sold m 13,310 13,795 14,944 16,002 Cost of Goods Sold m 25,060 28,739 33,337 38,338 EBITDA m 252 289 312 341 EBITDA m 482 601 704 822
Depreciation m 8 7 7 6 Depreciation m 15 14 6 0 Amortisation of Goodwill m 0 0 0 0 Amortisation of Goodwill m 0 0 0 0 Other Amortisation m 0 0 0 0 Other Amortisation m 0 0 0 0 EBIT m 244 281 305 335 EBIT m 466 586 698 822 Net Interest Income m -29 -24 -26 -31 Net Interest Income m -53 -51 -65 -74 Associates m 18 19 20 22 Associates m 30 39 45 52 Exceptionals m 14 0 0 0 Exceptionals m 67 0 0 0 Forex Gains / Losses m 0 0 0 0 Forex Gains / Losses m 0 0 0 0 Other Pre-Tax Income m 0 0 0 0 Other Pre-Tax Income m 0 0 0 0 Pre-Tax Profit m 247 276 299 325 Pre-Tax Profit m 510 575 677 800
Tax Expense m -48 -55 -60 -65 Tax Expense m -102 -115 -135 -160 Net Profit m 199 221 239 260 Net Profit m 408 460 542 640 Minority Interests m -18 -20 -22 -24 Minority Interests m -38 -43 -50 -59
Reported Earnings m 180 200 217 236 Reported Earnings m 370 417 492 581 Adjusted Earnings m 166 200 217 236 Adjusted Earnings m 303 417 492 581
EPS (rep) ¢ 14.3 15.7 17.0 18.5 EPS (rep) ¢ 29.3 32.6 38.4 45.4 EPS (adj) ¢ 13.2 15.7 17.0 18.5 EPS (adj) ¢ 24.0 32.6 38.4 45.4 EPS Growth yoy (adj) % -9.8 44.2 28.7 17.9 EPS Growth (adj) % -12.6 35.7 17.9 18.1
PE (rep) x 6.2 5.6 4.7 4.0 PE (adj) x 7.5 5.6 4.7 4.0
EBITDA Margin % 1.8 2.0 2.0 2.0 Total DPS ¢ 0.0 5.0 9.8 11.5 EBIT Margin % 1.8 2.0 2.0 2.0 Total Div Yield % 0.0 2.7 5.4 6.4 Earnings Split % 54.8 48.0 52.0 48.0 Weighted Average Shares m 1,263 1,279 1,279 1,279 Revenue Growth % 7.6 17.4 12.3 16.0 Period End Shares m 1,263 1,279 1,279 1,279 EBIT Growth % -11.2 26.6 24.9 19.0
Profit and Loss Ratios 2010A 2011E 2012E 2013E Cashflow Analysis 2010A 2011E 2012E 2013E
Revenue Growth % 9.4 14.7 16.0 15.0 EBITDA m 482 601 704 822 EBITDA Growth % -7.7 24.7 17.1 16.8 Tax Paid m -87 -115 -135 -160 EBIT Growth % -8.4 25.7 19.0 17.9 Chgs in Working Cap m -239 -933 -539 -586 Gross Profit Margin % 4.4 4.4 4.4 4.4 Net Interest Paid m 0 0 0 0 EBITDA Margin % 1.8 2.0 2.0 2.1 Other m 16 1 7 13 EBIT Margin % 1.8 2.0 2.0 2.1 Operating Cashflow m 172 -447 37 89
Net Profit Margin % 1.6 1.5 1.6 1.6 Acquisitions m -4 0 0 0 Payout Ratio % 0.0 15.2 25.4 25.4 Capex m -19 -10 -10 -10 EV/EBITDA x 5.9 4.7 4.1 3.5 Asset Sales m 0 0 0 0 EV/EBIT x 6.1 4.9 4.1 3.5 Other m -23 20 15 14
Investing Cashflow m -46 10 5 4 Balance Sheet Ratios Dividend (Ordinary) m 0 0 -112 0 ROE % 15.9 17.8 17.9 18.4 Equity Raised m 0 0 1 0 ROA % 6.5 7.0 7.5 7.8 Debt Movements m 419 227 109 -1,210 ROIC % 13.3 15.2 13.9 14.5 Other m 0 -71 -80 1,100 Net Debt/Equity % 32.6 46.1 45.3 43.2 Financing Cashflow m 419 156 -82 -110 Interest Cover x 8.8 11.6 10.7 11.1
Price/Book x 1.1 0.9 0.8 0.7 Net Chg in Cash/Debt m 564 -281 -40 -17 Book Value per Share 1.7 2.0 2.3 2.6
Free Cashflow m 153 -457 27 79
Balance Sheet 2010A 2011E 2012E 2013E Cash m 1,015 735 694 677 Receivables m 4,164 4,942 5,732 6,592 Inventories m 1,986 2,362 2,740 3,151 Investments m 0 0 0 0 Fixed Assets m 116 107 101 96 Intangibles m 330 330 330 330 Other Assets m 299 301 303 303 Total Assets m 7,906 8,770 9,892 11,141 Payables m 3,717 3,937 4,567 5,252 Short Term Debt m 1,123 1,100 1,210 1,320 Long Term Debt m 650 900 900 900 Provisions m 86 62 62 62 Other Liabilities m 3 28 30 35 Total Liabilities m 5,579 6,026 6,769 7,569
Shareholders' Funds m 2,134 2,551 2,931 3,380 Minority Interests m 192 192 192 192 Other m 0 0 0 0 Total S/H Equity m 2,326 2,743 3,123 3,572 Total Liab & S/H Funds m 7,906 8,770 9,892 11,141
All figures in HKD unless noted.
Source: Company data, Macquarie Research, May 2011
Macquarie Research VST Holdings Limited
30 May 2011 19
Important disclosures:
Recommendation definitions
Macquarie - Australia/New Zealand Outperform – return >3% in excess of benchmark return Neutral – return within 3% of benchmark return Underperform – return >3% below benchmark return Benchmark return is determined by long term nominal GDP growth plus 12 month forward market dividend yield
Macquarie – Asia/Europe Outperform – expected return >+10% Neutral – expected return from -10% to +10% Underperform – expected return <-10%
Macquarie First South - South Africa Outperform – expected return >+10% Neutral – expected return from -10% to +10% Underperform – expected return <-10%
Macquarie - Canada
Outperform – return >5% in excess of benchmark return Neutral – return within 5% of benchmark return Underperform – return >5% below benchmark return
Macquarie - USA
Outperform (Buy) – return >5% in excess of Russell 3000 index return Neutral (Hold) – return within 5% of Russell 3000 index return Underperform (Sell)– return >5% below Russell 3000 index return
Volatility index definition*
This is calculated from the volatility of historical price movements. Very high–highest risk – Stock should be expected to move up or down 60–100% in a year – investors should be aware this stock is highly speculative. High – stock should be expected to move up or down at least 40–60% in a year – investors should be aware this stock could be speculative. Medium – stock should be expected to move up or down at least 30–40% in a year. Low–medium – stock should be expected to move up or down at least 25–30% in a year. Low – stock should be expected to move up or down at least 15–25% in a year. * Applicable to Australian/NZ/Canada stocks only
Recommendations – 12 months Note: Quant recommendations may differ from Fundamental Analyst recommendations
Financial definitions
All "Adjusted" data items have had the following adjustments made: Added back: goodwill amortisation, provision for catastrophe reserves, IFRS derivatives & hedging, IFRS impairments & IFRS interest expense Excluded: non recurring items, asset revals, property revals, appraisal value uplift, preference dividends & minority interests EPS = adjusted net profit / efpowa* ROA = adjusted ebit / average total assets ROA Banks/Insurance = adjusted net profit /average total assets ROE = adjusted net profit / average shareholders funds Gross cashflow = adjusted net profit + depreciation *equivalent fully paid ordinary weighted average number of shares All Reported numbers for Australian/NZ listed stocks are modelled under IFRS (International Financial Reporting Standards).
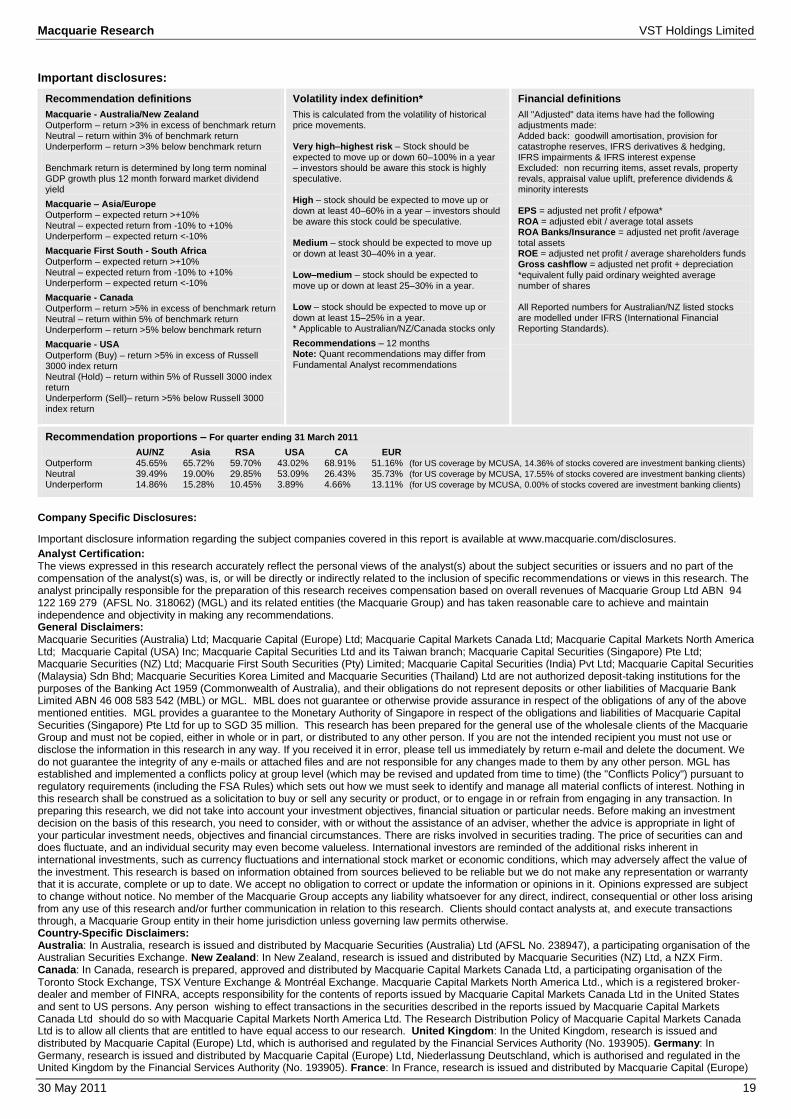
Recommendation proportions – For quarter ending 31 March 2011
AU/NZ Asia RSA USA CA EUR Outperform 45.65% 65.72% 59.70% 43.02% 68.91% 51.16% (for US coverage by MCUSA, 14.36% of stocks covered are investment banking clients)
Neutral 39.49% 19.00% 29.85% 53.09% 26.43% 35.73% (for US coverage by MCUSA, 17.55% of stocks covered are investment banking clients)
Underperform 14.86% 15.28% 10.45% 3.89% 4.66% 13.11% (for US coverage by MCUSA, 0.00% of stocks covered are investment banking clients)
Company Specific Disclosures: Important disclosure information regarding the subject companies covered in this report is available at www.macquarie.com/disclosures.
Analyst Certification: The views expressed in this research accurately reflect the personal views of the analyst(s) about the subject securities or issuers and no part of the compensation of the analyst(s) was, is, or will be directly or indirectly related to the inclusion of specific recommendations or views in this research. The analyst principally responsible for the preparation of this research receives compensation based on overall revenues of Macquarie Group Ltd ABN 94 122 169 279 (AFSL No. 318062) (MGL) and its related entities (the Macquarie Group) and has taken reasonable care to achieve and maintain independence and objectivity in making any recommendations. General Disclaimers: Macquarie Securities (Australia) Ltd; Macquarie Capital (Europe) Ltd; Macquarie Capital Markets Canada Ltd; Macquarie Capital Markets North America Ltd; Macquarie Capital (USA) Inc; Macquarie Capital Securities Ltd and its Taiwan branch; Macquarie Capital Securities (Singapore) Pte Ltd; Macquarie Securities (NZ) Ltd; Macquarie First South Securities (Pty) Limited; Macquarie Capital Securities (India) Pvt Ltd; Macquarie Capital Securities (Malaysia) Sdn Bhd; Macquarie Securities Korea Limited and Macquarie Securities (Thailand) Ltd are not authorized deposit-taking institutions for the purposes of the Banking Act 1959 (Commonwealth of Australia), and their obligations do not represent deposits or other liabilities of Macquarie Bank Limited ABN 46 008 583 542 (MBL) or MGL. MBL does not guarantee or otherwise provide assurance in respect of the obligations of any of the above mentioned entities. MGL provides a guarantee to the Monetary Authority of Singapore in respect of the obligations and liabilities of Macquarie Capital Securities (Singapore) Pte Ltd for up to SGD 35 million. This research has been prepared for the general use of the wholesale clients of the Macquarie Group and must not be copied, either in whole or in part, or distributed to any other person. If you are not the intended recipient you must not use or disclose the information in this research in any way. If you received it in error, please tell us immediately by return e-mail and delete the document. We do not guarantee the integrity of any e-mails or attached files and are not responsible for any changes made to them by any other person. MGL has established and implemented a conflicts policy at group level (which may be revised and updated from time to time) (the "Conflicts Policy") pursuant to regulatory requirements (including the FSA Rules) which sets out how we must seek to identify and manage all material conflicts of interest. Nothing in this research shall be construed as a solicitation to buy or sell any security or product, or to engage in or refrain from engaging in any transaction. In preparing this research, we did not take into account your investment objectives, financial situation or particular needs. Before making an investment decision on the basis of this research, you need to consider, with or without the assistance of an adviser, whether the advice is appropriate in light of your particular investment needs, objectives and financial circumstances. There are risks involved in securities trading. The price of securities can and does fluctuate, and an individual security may even become valueless. International investors are reminded of the additional risks inherent in international investments, such as currency fluctuations and international stock market or economic conditions, which may adversely affect the value of the investment. This research is based on information obtained from sources believed to be reliable but we do not make any representation or warranty that it is accurate, complete or up to date. We accept no obligation to correct or update the information or opinions in it. Opinions expressed are subject to change without notice. No member of the Macquarie Group accepts any liability whatsoever for any direct, indirect, consequential or other loss arising from any use of this research and/or further communication in relation to this research. Clients should contact analysts at, and execute transactions through, a Macquarie Group entity in their home jurisdiction unless governing law permits otherwise. Country-Specific Disclaimers: Australia: In Australia, research is issued and distributed by Macquarie Securities (Australia) Ltd (AFSL No. 238947), a participating organisation of the Australian Securities Exchange. New Zealand: In New Zealand, research is issued and distributed by Macquarie Securities (NZ) Ltd, a NZX Firm. Canada: In Canada, research is prepared, approved and distributed by Macquarie Capital Markets Canada Ltd, a participating organisation of the Toronto Stock Exchange, TSX Venture Exchange & Montréal Exchange. Macquarie Capital Markets North America Ltd., which is a registered broker-dealer and member of FINRA, accepts responsibility for the contents of reports issued by Macquarie Capital Markets Canada Ltd in the United States and sent to US persons. Any person wishing to effect transactions in the securities described in the reports issued by Macquarie Capital Markets Canada Ltd should do so with Macquarie Capital Markets North America Ltd. The Research Distribution Policy of Macquarie Capital Markets Canada Ltd is to allow all clients that are entitled to have equal access to our research. United Kingdom: In the United Kingdom, research is issued and distributed by Macquarie Capital (Europe) Ltd, which is authorised and regulated by the Financial Services Authority (No. 193905). Germany: In Germany, research is issued and distributed by Macquarie Capital (Europe) Ltd, Niederlassung Deutschland, which is authorised and regulated in the United Kingdom by the Financial Services Authority (No. 193905). France: In France, research is issued and distributed by Macquarie Capital (Europe)

Macquarie Research VST Holdings Limited
30 May 2011 20
Ltd, which is authorised and regulated in the United Kingdom by the Financial Services Authority (No. 193905). Hong Kong & Mainland China: In Hong Kong, research is issued and distributed by Macquarie Capital Securities Ltd, which is licensed and regulated by the Securities and Futures Commission. In Mainland China, Macquarie Securities (Australia) Limited Shanghai Representative Office only engages in non-business operational activities excluding issuing and distributing research. Only non-A share research is distributed into Mainland China by Macquarie Capital Securities Ltd. Japan: In Japan, research is issued and distributed by Macquarie Capital Securities (Japan) Limited, a member of the Tokyo Stock Exchange, Inc. and Osaka Securities Exchange Co. Ltd (Financial Instruments Firm, Kanto Financial Bureau (kin-sho) No. 231, a member of Japan Securities Dealers Association and Financial Futures Association of Japan). India: In India, research is issued and distributed by Macquarie Capital Securities (India) Pvt Ltd., 92, Level 9, 2 North Avenue, Maker Maxity, Bandra Kurla Complex, Bandra (East), Mumbai – 400 051, India, which is a SEBI registered Stock Broker having membership with National Stock Exchange of India Limited (INB231246738) and Bombay Stock Exchange Limited (INB011246734). Malaysia: In Malaysia, research is issued and distributed by Macquarie Capital Securities (Malaysia) Sdn. Bhd. (Company registration number: 463469-W) which is a Participating Organisation of Bursa Malaysia Berhad and a holder of Capital Markets Services License issued by the Securities Commission. Taiwan: Information on securities/instruments that are traded in Taiwan is distributed by Macquarie Capital Securities Ltd, Taiwan Branch, which is licensed and regulated by the Financial Supervisory Commission. No portion of the report may be reproduced or quoted by the press or any other person without authorisation from Macquarie. Nothing in this research shall be construed as a solicitation to buy or sell any security or product. Thailand: In Thailand, research is issued and distributed by Macquarie Securities (Thailand) Ltd, a licensed securities company that is authorized by the Ministry of Finance, regulated by the Securities and Exchange Commission of Thailand and is an exchange member no. 28 of the Stock Exchange of Thailand. The Thai Institute of Directors Association has disclosed the Corporate Governance Report of Thai Listed Companies made pursuant to the policy of the Securities and Exchange Commission of Thailand. Macquarie Securities (Thailand) Ltd does not endorse the result of the Corporate Governance Report of Thai Listed Companies but this Report can be accessed at: http://www.thai-iod.com/en/publications.asp?type=4. South Korea: In South Korea, unless otherwise stated, research is prepared, issued and distributed by Macquarie Securities Korea Limited, which is regulated by the Financial Supervisory Services. Information on analysts in MSKL is disclosed at http://dis.kofia.or.kr/fs/dis2/fundMgr/DISFundMgrAnalystPop.jsp?companyCd2=A03053&pageDiv=02. South Africa: In South Africa, research is issued and distributed by Macquarie First South Securities (Pty) Limited, a member of the JSE Limited. Singapore: In Singapore, research is issued and distributed by Macquarie Capital Securities (Singapore) Pte Ltd (Company Registration Number: 198702912C), a Capital Markets Services license holder under the Securities and Futures Act to deal in securities and provide custodial services in Singapore. Pursuant to the Financial Advisers (Amendment) Regulations 2005, Macquarie Capital Securities (Singapore) Pte Ltd is exempt from complying with sections 25, 27 and 36 of the Financial Advisers Act. All Singapore-based recipients of research produced by Macquarie Capital (Europe) Limited, Macquarie Capital Markets Canada Ltd, Macquarie First South Securities (Pty) Limited and Macquarie Capital (USA) Inc. represent and warrant that they are institutional investors as defined in the Securities and Futures Act. United States: In the United States, research is issued and distributed by Macquarie Capital (USA) Inc., which is a registered broker-dealer and member of FINRA. Macquarie Capital (USA) Inc, accepts responsibility for the content of each research report prepared by one of its non-US affiliates when the research report is distributed in the United States by Macquarie Capital (USA) Inc. Macquarie Capital (USA) Inc.’s affiliate’s analysts are not registered as research analysts with FINRA, may not be associated persons of Macquarie Capital (USA) Inc., and therefore may not be subject to FINRA rule restrictions on communications with a subject company, public appearances, and trading securities held by a research analyst account. Any persons receiving this report directly from Macquarie Capital (USA) Inc. and wishing to effect a transaction in any security described herein should do so with Macquarie Capital (USA) Inc. Important disclosure information regarding the subject companies covered in this report is available at www.macquarie.com/research/disclosures, or contact your registered representative at 1-888-MAC-STOCK, or write to the Supervisory Analysts, Research Department, Macquarie Securities, 125 W.55th Street, New York, NY 10019. © Macquarie Group
Auckland
Tel: (649) 377 6433
Jakarta Tel: (62 21) 515 1818
Mumbai Tel: (91 22) 6653 3000
Singapore
Tel: (65) 6601 1111
Bangkok
Tel: (662) 694 7999
Johannesburg Tel: (2711) 583 2000
Munich Tel: (089) 2444 31800
Sydney
Tel: (612) 8232 9555
Calgary
Tel: (1 403) 218 6650
Kuala Lumpur Tel: (60 3) 2059 8833
New York Tel: (1 212) 231 2500
Taipei
Tel: (886 2) 2734 7500
Denver
Tel: (303) 952 2800
London Tel: (44 20) 3037 4400
Paris Tel: (33 1) 7842 3823
Tokyo
Tel: (81 3) 3512 7900
Frankfurt
Tel: (069) 509 578 000
Manila Tel: (63 2) 857 0888
Perth Tel: (618) 9224 0888
Toronto
Tel: (1 416) 848 3500
Geneva
Tel: (41) 22 818 7777
Melbourne Tel: (613) 9635 8139
Seoul Tel: (82 2) 3705 8500
Hong Kong
Tel: (852) 2823 3588
Montreal Tel: (1 514) 925 2850
Shanghai Tel: (86 21) 6841 3355
Available to clients on the world wide web at www.macquarieresearch.com and through Thomson Financial, FactSet, Reuters, Bloomberg, CapitalIQ and TheMarkets.com.

Asia Research Head of Equity Research John O’Connell (Global Co – Head) (612) 8232 7544 David Rickards (Global Co – Head) (44 20) 3037 4399 Chris Hunt (Asia – Head) (852) 3922 1119 Tim Smart (Asia – Deputy Head) (852) 3922 3565
Automobiles/Auto Parts Leah Jiang (China) (8621) 2412 9020 Linda Huang (Hong Kong) (852) 3922 4068 Clive Wiggins (Japan) (813) 3512 7856 Dan Lucas (Japan) (813) 3512 6050 Michael Sohn (Korea) (82 2) 3705 8644
Banks and Non-Bank Financials Ismael Pili (Asia, Hong Kong) (852) 3922 4774 Victor Wang (China) (852) 3922 1479 Alastair Macdonald (Japan) (813) 3512 7476 Mudit Painuly (India) (9122) 6720 4083 Suresh Ganapathy (India) (9122) 6720 4078 Chan Hwang (Korea) (822) 3705 8643 Alex Pomento (Philippines) (632) 857 0899 Matthew Smith (Malaysia, Singapore) (65) 6601 0981 Jemmy Huang (Taiwan) (8862) 2734 7530 Passakorn Linmaneechote (Thailand) (662) 694 7728 Apichet Kiatworakun (Thailand) (662) 694 7724
Conglomerates Leah Jiang (China) (8621) 2412 9020 Alex Pomento (Philippines) (632) 857 0899
Consumer and Gaming Gary Pinge (Asia) (852) 3922 3557 Linda Huang (Hong Kong) (852) 3922 4068 Toby Williams (Japan) (813) 3512 7392 Lyall Taylor (Indonesia) (6221) 2598 8489 HongSuk Na (Korea) (822) 3705 8678 Alex Pomento (Philippines) (632) 857 0899 Amit Mishra (India) (9122) 6720 4084 Brandon Chen (Taiwan) (8862) 2734 7518 Best Waiyanont (Thailand) (662) 694 7993
Emerging Leaders Jake Lynch (China, Asia) (8621) 2412 9007 Jonathan Hsu (China, Hong Kong) (852) 3922 4625 Saiyi He (Hong Kong) (852) 3922 3585 Robert Burghart (Japan) (813) 3512 7853
Industrials Janet Lewis (Asia) (852) 3922 5417 Inderjeetsingh Bhatia (India) (9122) 6720 4087 Linda Huang (Hong Kong) (852) 3922 4068 Chang Han Joo (Korea) (822) 3705 8511 Juwon Lee (Korea) (822) 3705 8661 Sunaina Dhanuka (Malaysia) (603) 2059 8993 David Gambrill (Thailand) (662) 694 7753
Insurance Scott Russell (Asia) (852) 3922 3567 Chung Jun Yun (Korea) (822) 2095 7222
Media and Internet Jiong Shao (China, Hong Kong) (852) 3922 3566 Steve Zhang (China, Hong Kong) (852) 3922 3578 Prem Jearajasingam (Malaysia) (603) 2059 8989 Alex Pomento (Philippines) (632) 857 0899
Oil, Gas and Petrochemicals Linda Huang (Hong Kong) (852) 3922 4068 Jal Irani (India) (9122) 6720 4080 Polina Diyachkina (Japan) (813) 3512 7886 Shawn Park (Korea) (822) 3705 8669 Sunaina Dhanuka (Malaysia) (603) 2059 8993 Trevor Buchinski (Thailand) (662) 694 7829 Pharmaceuticals and Healthcare Jonathan Hsu (Hong Kong) (852) 3922 4625 Abhishek Singhal (India) (9122) 6720 4086 Christina Lee (Korea) (852) 3922 3571 Chinnarat Boonmahanark (Thailand) (662) 694 7985 Property Callum Bramah (Asia) (852) 3922 4731 Eva Lee (China, Hong Kong) (852) 3922 3573 Eugene Cheung (Hong Kong) (852) 3922 4627 Unmesh Sharma (India) (9122) 6720 4092 Felicia Barus (Indonesia) (6221) 2598 8480 Hiroshi Okubo (Japan) (813) 3512 7433 Chang Han Joo (Korea) (822) 3705 8511 Sunaina Dhanuka (Malaysia) (603) 2059 8993 Alex Pomento (Philippines) (632) 857 0899 Tuck Yin Soong (Singapore) (65) 6601 0838 Elaine Cheong (Singapore) (65) 6601 0839 Corinne Jian (Taiwan) (8862) 2734 7522 Brandon Chen (Taiwan) (8862) 2734 7518 Patti Tomaitrichitr (Thailand) (662) 694 7727 Resources / Metals and Mining Andrew Dale (Asia) (852) 3922 3587 Graeme Train (China) (8621) 2412 9035 Carol Cao (China, Hong Kong) (852) 3922 4075 Pelen Ji (China, Hong Kong) (852) 3922 4741 Christina Lee (Hong Kong) (852) 3922 3571 Rakesh Arora (India) (9122) 6720 4093 Adam Worthington (Indonesia) (852) 3922 4626 Albert Saputro (Indonesia) (6221) 515 7340 Polina Diyachkina (Japan) (813) 3512 7886 Chak Reungsinpinya (Thailand) (662) 694 7982 Technology Jeffrey Su (Asia) (8862) 2734 7512 Stephen Chow (China, Hong Kong) (852) 3922 3634 Lisa Soh (China) (852) 3922 1401 Nitin Mohta (India) (9122) 6720 4090 Damian Thong (Japan) (813) 3512 7877 David Gibson (Japan) (813) 3512 7880 George Chang (Japan) (813) 3512 7854 Jeff Loff (Japan) (813) 3512 7851 Michiko Kakiya (Japan) (813) 3512 7868 Yukihiro Goto (Japan) (813) 3512 5984 Daniel Kim (Korea) (822) 3705 8641 Benjamin Ban (Korea) (822) 3705 8659 Andrew Chang (Taiwan) (8862) 2734 7526 Daniel Chang (Taiwan) (8862) 2734 7516 Jimmy Hsu (Taiwan) (8862) 2734 7533 Kylie Huang (Taiwan) (8862) 2734 7528 Telecoms Keith Neruda (Asia) (65) 6601 0830 Tim Smart (China) (852) 3922 3565 Lisa Soh (China, Hong Kong) (852) 3922 1401 Riaz Hyder (Indonesia) (6221) 2598 8486 Nathan Ramler (Japan) (813) 3512 7875 Prem Jearajasingam (Malaysia) (603) 2059 8989 Joseph Quinn (Taiwan) (8862) 2734 7519 Best Waiyanont (Thailand) (662) 694 7993
Transport & Infrastructure Janet Lewis (Asia, Japan) (852) 3922 5417 Nicholas Cunningham (Japan) (813) 3512 6044 Chang Han Joo (Korea) (822) 3705 8511 Sunaina Dhanuka (Malaysia) (603) 2059 8993 Utilities Adam Worthington (Asia) (852) 3922 4626 Carol Cao (China, Hong Kong) (852) 3922 4075 Jeff Evans (India) (9122) 6720 4081 Ayako Mitsui Boston (Japan) (813) 3512 7885 Prem Jearajasingam (Malaysia) (603) 2059 8989 Alex Pomento (Philippines) (632) 857 0899 Commodities Jim Lennon (4420) 3037 4271 Max Layton (4420) 3037 4273 Jan Stuart (1 212) 231 2485 Duncan Hobbs (4420) 3037 4497 Bonnie Liu (8621) 2412 9008 Graeme Train (8621) 2412 9035 Rakesh Arora (9122) 6720 4093 Data Services Andrea Dailly (Asia) (852) 3922 4076 Eric Yeung (852) 3922 4077 Economics Richard Jerram (Asia, Japan) (65) 6601 0842 Philip McNicholas (ASEAN) (65) 6601 0982 Richard Gibbs (Australia) (612) 8232 3935 Paul Cavey (China) (852) 3922 3570 Renee Chen (Hong Kong, Taiwan) (852) 3922 3597 Quantitative / CPG George Platt (Global) (612) 8232 6539 Viking Kwok (Asia) (852) 3922 4735 Burke Lau (Asia) (852) 3922 5494 Patrick Hansen (Japan) (813) 3512 7876 Ayumu Kuroda (Japan) (813) 3512 7569 Simon Rigney (Japan) (813) 3512 7872 Strategy/Country Michael Kurtz (Asia) (852) 3922 1403 John Woods (Asia) (852) 3922 4636 Peter Eadon-Clarke (Asia, Japan) (813) 3512 7850 Jiong Shao (China, Hong Kong) (852) 3922 3566 Rakesh Arora (India) (9122) 6720 4093 David Gibson (Japan) (813) 3512 7880 Chan Hwang (Korea) (822) 3705 8643 Kieran Calder (Malaysia) (603) 2059 8992 Yeonzon Yeow (Malaysia) (603) 2059 8982 Alex Pomento (Philippines) (632) 857 0899 Daniel Chang (Taiwan) (8862) 2734 7516 David Gambrill (Thailand) (662) 694 7753 Find our research at Macquarie: www.macquarie.com.au/research Thomson: www.thomson.com/financial Reuters: www.knowledge.reuters.com Bloomberg: MAC GO Factset: http://www.factset.com/home.aspx CapitalIQ www.capitaliq.com TheMarkets.com www.themarkets.com Email [email protected] for access
Asia Sales Regional Heads of Sales Robin Black (Asia) (852) 3922 2074 Chris Gray (ASEAN) (65) 6601 0288 Peter Slater (Boston) (1 617) 598 2502 Jeffrey Shiu (China & Hong Kong) (852) 3922 2061 Thomas Renz (Geneva) (41) 22 818 7712 Andrew Mouat (India) (9122) 6720 4100 Kenneth Yap (Indonesia) (6221) 515 1555 JJ Kim (Korea) (822) 3705 8799 Jason Lee (Malaysia) (603) 2059 8888 Chris Gould (Malaysia) (603) 2059 8888 Gino C Rojas (Philippines) (632) 857 0761 Greg Norton-Kidd (New York) (1 212) 231 2527 Luke Sullivan (New York) (1 212) 231 2507 Eric Roles (New York) (1 212) 231 2559 Sheila Schroeder (San Francisco) (1 415) 762 5001
Regional Heads of Sales cont’d Miki Edelman (Taiwan) (8862) 2734 7580 Angus Kent (Thailand) (662) 694 7601 Michael Newman (Tokyo) (813) 3512 7920 Angus Innes (UK/Europe) (44) 20 3037 4841 Rob Fabbro (UK/Europe) (44) 20 3037 4865 Sean Alexander (Generalist) (852) 3922 2101
Regional Head of Distribution Justin Crawford (Asia) (852) 3922 2065
Sales Trading Adam Zaki (Asia) (852) 3922 2002 Yat Quan Tan (Hong Kong) (852) 3922 2028 Phil Sellaroli (Japan) (813) 3512 7837 Grace Lee (Korea) (822) 3705 8601 Matthew Ryan (Singapore) (65) 6601 0288
Sales Trading cont’d Mike Keen (Europe) (44) 20 3037 4905 Chris Reale (New York) (1 212) 231 2555 Marc Rosa (New York) (1 212) 231 2555 Stanley Dunda (Indonesia) (6221) 515 1555 James Aitchison (Korea) (822) 3705 9990 Kenneth Cheung (Malaysia) (603) 2059 8888 Michael Santos (Philippines) (632) 857 0813 Isaac Huang (Taiwan) (8862) 2734 7582 Dominic Shore (Thailand) (662) 694 7707 Alternative Strategies Convertibles - Roland Sharman (852) 3922 2095 Depository Receipts – Seung-Jin Lee (65) 6601 0203 Derivatives – Mark Holland (852) 3922 2081 Futures - Tim Smith (852) 3922 2113 Structured Products - Andrew Terlich (852) 3922 2013
Related Documents