VSQual: a visual system to assist DNA sequencing quality control Eliseu Binneck, João Flávio V. Silva, Norman Neumaier, José Renato B. Farias and Alexandre L. Nepomuceno Laboratory for Biotechnology and Bioinformatics, Embrapa Soybean - CNPSo, Londrina, PR, Brazil Corresponding author: E. Binneck E-mail: [email protected] Genet. Mol. Res. 3 (4): 474-482 (2004) Received October 4, 2004 Accepted December 3, 2004 Published December 30, 2004 ABSTRACT. A lack of pliant software tools that support small- to medium-scale DNA sequencing efforts is a major hindrance for record- ing and using laboratory workflow information to monitor the overall quality of data production. Here we describe VSQual, a set of Perl pro- grams intended to provide simple and powerful tools to check several quality features of the sequencing data generated by automated DNA sequencing machines. The core program of VSQual is a flexible Perl- based pipeline, designed to be accessible and useful for both program- mers and non-programmers. This pipeline directs the processing steps and can be easily customized for laboratory needs. Basically, the raw DNA sequencing trace files are processed by Phred and Cross_match, then the outputs are parsed, reformatted into Web-based graphical re- ports, and added to a Web site structure. The result is a set of real time sequencing reports easily accessible and understood by common labora- tory people. These reports facilitate the monitoring of DNA sequencing as well as the management of laboratory workflow, significantly reduc- ing operational costs and ensuring high quality and scientifically reliable results. Key words: DNA sequence analysis software, Perl programming, Bioinformatics Genetics and Molecular Research 3 (4): 474-482 (2004) FUNPEC-RP www.funpecrp.com.br

Welcome message from author
This document is posted to help you gain knowledge. Please leave a comment to let me know what you think about it! Share it to your friends and learn new things together.
Transcript
E. Binneck et al. 474
Genetics and Molecular Research 3 (4): 474-482 (2004) www.funpecrp.com.br
VSQual: a visual system to assist DNAsequencing quality control
Eliseu Binneck, João Flávio V. Silva, Norman Neumaier,José Renato B. Farias and Alexandre L. Nepomuceno
Laboratory for Biotechnology and Bioinformatics,Embrapa Soybean - CNPSo, Londrina, PR, BrazilCorresponding author: E. BinneckE-mail: [email protected]
Genet. Mol. Res. 3 (4): 474-482 (2004)Received October 4, 2004Accepted December 3, 2004Published December 30, 2004
ABSTRACT. A lack of pliant software tools that support small- tomedium-scale DNA sequencing efforts is a major hindrance for record-ing and using laboratory workflow information to monitor the overallquality of data production. Here we describe VSQual, a set of Perl pro-grams intended to provide simple and powerful tools to check severalquality features of the sequencing data generated by automated DNAsequencing machines. The core program of VSQual is a flexible Perl-based pipeline, designed to be accessible and useful for both program-mers and non-programmers. This pipeline directs the processing stepsand can be easily customized for laboratory needs. Basically, the rawDNA sequencing trace files are processed by Phred and Cross_match,then the outputs are parsed, reformatted into Web-based graphical re-ports, and added to a Web site structure. The result is a set of real timesequencing reports easily accessible and understood by common labora-tory people. These reports facilitate the monitoring of DNA sequencingas well as the management of laboratory workflow, significantly reduc-ing operational costs and ensuring high quality and scientifically reliableresults.
Key words: DNA sequence analysis software, Perl programming,Bioinformatics
Genetics and Molecular Research 3 (4): 474-482 (2004) FUNPEC-RP www.funpecrp.com.br
VSQual to assist DNA sequencing 475
Genetics and Molecular Research 3 (4): 474-482 (2004) www.funpecrp.com.br
INTRODUCTION
With the recent advances in biotechnological research, most laboratories have accessto modern automated DNA sequencing machines that give rise to vast amounts of data withlittle hands-on laboratory time. Consequently, enormous amounts of raw sequencing data aregenerated and, for this reason, there is a growing need for automated data processing.
A basic need for analyzing for raw DNA sequencing data is accurately assessing thesequence of bases and the quality of traces obtained for each read, in a process called basecalling.Since DNA sequencing involves ordering a set of peaks (A, G, C, or T) on a sequencing gel, theprocess can be quite error-prone, depending on the process of sample preparation, the machinesetup, and so on. Commonly, an automated DNA sequencing machine includes basecallingsoftware as part of the processing software, such as ABI PRISM DNA Sequencing AnalysisSoftware (ABI, 1999), which processes raw trace files, translating them into sequences ofbases and assigning an N when resolution is not good. Other DNA sequencing systems havecomponent software for basecalling and assessing the quality of the reads. An example is theMegaBACE 1000 DNA Sequencing System from Amersham Pharmacia/Molecular Dynamics(Sunnyvale, CA, USA). However, a more accurate program, like Phred (Ewing et al., 1998),currently the most widely used basecalling software, is generally required to measure the errorprobability associated with each base through chromatogram analysis.
Basecalling software like Phred analyzes trace files (e.g., ab1 trace files from ABI,esd trace files from MegaBACE, or scf standard chromatogram files) and produces a se-quence of bases, attaching an assessment of the probability of certainty to each base. Thecombination of a sequence and the quality values of its bases is called a read [or sequencingread]. The purpose of basecalling is to determine the nucleotide sequence on the basis of peaksin the trace. Because traces (and regions within a trace) are of variable quality, the fidelity of“called” nucleotides is also variable. This accuracy for each called base is measured by basequality scores, which evaluate the real sequence accuracy.
The principal goal of Phred analysis is to produce the input files for programs thatperform sequence trimming, clustering or assembly (e.g., by Phrap or CAP3) and finishingprocesses (e.g., by Consed), although it can also be useful for an evaluation of the reads at thetime they are obtained, in order to reduce the cost of sequencing by optimizing resource utiliza-tion in the laboratory. The inconvenience is the fact that the raw text outputs of Phred are noteasily readable and informative for most technicians in the laboratory.
To help solve this, we developed a set of Perl (Wall et al., 1996; Stein, 2001) multiplatformprograms that constitute the system we call VSQual. This system is directed by a central pipe-line that runs Phred and Cross_match, and then parses the output files and produces a set ofWeb-based visually intuitive reports.
MATERIAL AND METHODS
VSQual comprises a group of programs (Table 1) that manage the trace files producedby automated DNA sequencing machines, in order to obtain graphically informative reports andto organize the sequencing data obtained in the laboratory. The core program of VSQual is aPerl-based pipeline, designed with flexibility in order to allow it to be modified according tolaboratory conditions. This pipeline directs the processing steps and the organization of reports.
E. Binneck et al. 476
Genetics and Molecular Research 3 (4): 474-482 (2004) www.funpecrp.com.br
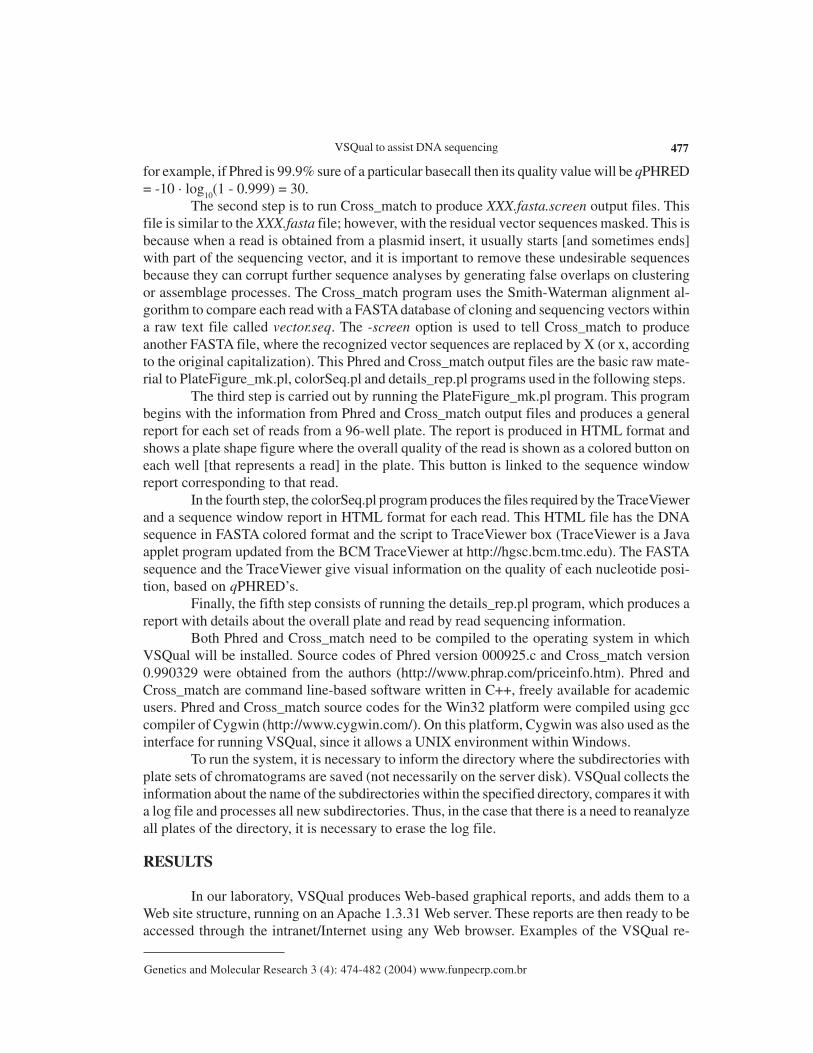
As a default, VSQual programs run in the following order: 1) Phred, 2) Cross_match, 3)PlateFigure_mk.pl, 4) colorSeq.pl, and 5) details_rep.pl.
Program Description Reference/URL
VSQual.pl Perl-based pipeline that manages the The present studyoperation of the system programs
Phred Basecalling and generation of quality Ewing et al., 1998values from trace files
Cross_match Vector screening and generation of http://www.phrap.orgFASTA sequence files with maskedvector sequences
PlateFigure_mk.pl Perl script that produces reports on 96- The present studywell plate shape figure reporting thegeneral quality of each read
colorSeq.pl Perl script that produces Web-based The present studyreports of the reads in FASTA coloredformat with visual quality information foreach base and the interface for TraceViewer
details_rep.pl Perl script that produces Web-based The present studyreports detailing statistics aboutqPHREDs, size of the reads and aboutvector sequences identified in each read
TraceViewer Java applet adapted from BCM Trace http://hgsc.bcm.tmc.eduViewer (Baylor College of Medicine -Human Genome Sequencing Center).Shows the read trace (electropherogram)with a graphical/numerical view of theqPHREDs
Perl Perl is a stable, cross platform Information about Perl isprogramming language. Perl interpreter is available at http://www.perl.org/available for various platforms, including and http://www.perl.com/Linux, UNIX, Win32 (Windows NT/95),Mac OS and other operating systems. Availableat (http://www.cpan.org/ports/index.html)free of charge
Table 1. VSQual programs.
Beginning with the trace files, at the first step Phred produces XXX.fasta, XXX.fasta.qualand XXX.scf output files (XXX is the name of the read). The FASTA file (.fasta) contains thesequence of bases determined by Phred for the corresponding read, while the Qual file(.fasta.qual) has a sequence of corresponding quality values for each base on the read. Thesequality values (qPHRED) are calculated from the estimated probability (p) that the correspond-ing nucleotide was called incorrectly: qPHRED = -10 · log
10(p) (Ewing and Green, 1998). Thus,
VSQual to assist DNA sequencing 477
Genetics and Molecular Research 3 (4): 474-482 (2004) www.funpecrp.com.br
for example, if Phred is 99.9% sure of a particular basecall then its quality value will be qPHRED= -10 · log
10(1 - 0.999) = 30.
The second step is to run Cross_match to produce XXX.fasta.screen output files. Thisfile is similar to the XXX.fasta file; however, with the residual vector sequences masked. This isbecause when a read is obtained from a plasmid insert, it usually starts [and sometimes ends]with part of the sequencing vector, and it is important to remove these undesirable sequencesbecause they can corrupt further sequence analyses by generating false overlaps on clusteringor assemblage processes. The Cross_match program uses the Smith-Waterman alignment al-gorithm to compare each read with a FASTA database of cloning and sequencing vectors withina raw text file called vector.seq. The -screen option is used to tell Cross_match to produceanother FASTA file, where the recognized vector sequences are replaced by X (or x, accordingto the original capitalization). This Phred and Cross_match output files are the basic raw mate-rial to PlateFigure_mk.pl, colorSeq.pl and details_rep.pl programs used in the following steps.
The third step is carried out by running the PlateFigure_mk.pl program. This programbegins with the information from Phred and Cross_match output files and produces a generalreport for each set of reads from a 96-well plate. The report is produced in HTML format andshows a plate shape figure where the overall quality of the read is shown as a colored button oneach well [that represents a read] in the plate. This button is linked to the sequence windowreport corresponding to that read.
In the fourth step, the colorSeq.pl program produces the files required by the TraceViewerand a sequence window report in HTML format for each read. This HTML file has the DNAsequence in FASTA colored format and the script to TraceViewer box (TraceViewer is a Javaapplet program updated from the BCM TraceViewer at http://hgsc.bcm.tmc.edu). The FASTAsequence and the TraceViewer give visual information on the quality of each nucleotide posi-tion, based on qPHRED’s.
Finally, the fifth step consists of running the details_rep.pl program, which produces areport with details about the overall plate and read by read sequencing information.
Both Phred and Cross_match need to be compiled to the operating system in whichVSQual will be installed. Source codes of Phred version 000925.c and Cross_match version0.990329 were obtained from the authors (http://www.phrap.com/priceinfo.htm). Phred andCross_match are command line-based software written in C++, freely available for academicusers. Phred and Cross_match source codes for the Win32 platform were compiled using gcccompiler of Cygwin (http://www.cygwin.com/). On this platform, Cygwin was also used as theinterface for running VSQual, since it allows a UNIX environment within Windows.
To run the system, it is necessary to inform the directory where the subdirectories withplate sets of chromatograms are saved (not necessarily on the server disk). VSQual collects theinformation about the name of the subdirectories within the specified directory, compares it witha log file and processes all new subdirectories. Thus, in the case that there is a need to reanalyzeall plates of the directory, it is necessary to erase the log file.
RESULTS
In our laboratory, VSQual produces Web-based graphical reports, and adds them to aWeb site structure, running on an Apache 1.3.31 Web server. These reports are then ready to beaccessed through the intranet/Internet using any Web browser. Examples of the VSQual re-
E. Binneck et al. 478
Genetics and Molecular Research 3 (4): 474-482 (2004) www.funpecrp.com.br
ports are shown in Figures 1, 2 and 3 and an online version can be accessed at http://www.cnpso.embrapa.br/bioinformatica/.
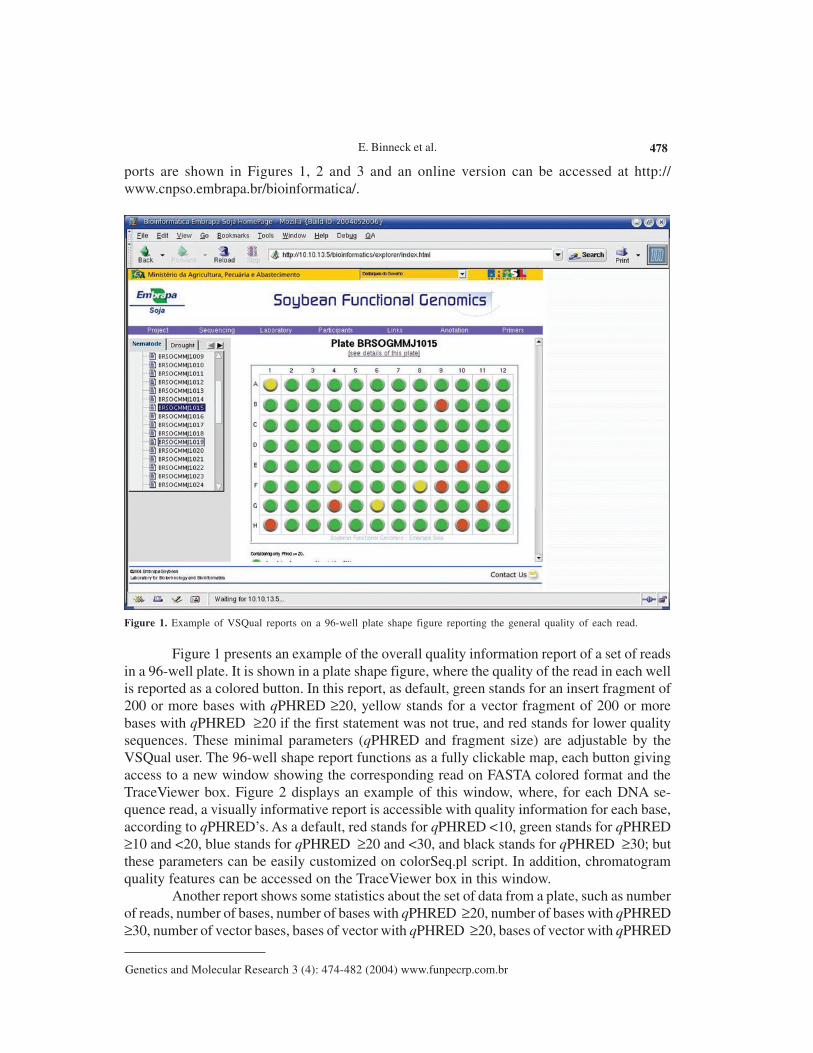
Figure 1. Example of VSQual reports on a 96-well plate shape figure reporting the general quality of each read.
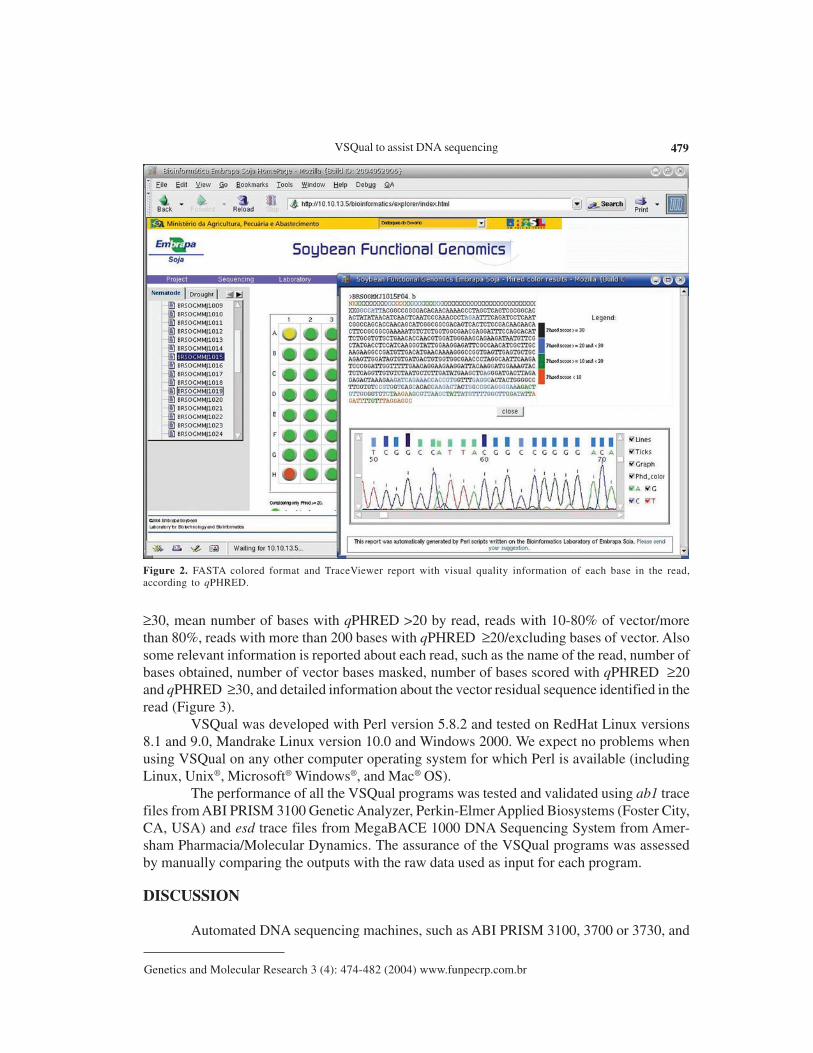
Figure 1 presents an example of the overall quality information report of a set of readsin a 96-well plate. It is shown in a plate shape figure, where the quality of the read in each wellis reported as a colored button. In this report, as default, green stands for an insert fragment of200 or more bases with qPHRED ≥20, yellow stands for a vector fragment of 200 or morebases with qPHRED ≥20 if the first statement was not true, and red stands for lower qualitysequences. These minimal parameters (qPHRED and fragment size) are adjustable by theVSQual user. The 96-well shape report functions as a fully clickable map, each button givingaccess to a new window showing the corresponding read on FASTA colored format and theTraceViewer box. Figure 2 displays an example of this window, where, for each DNA se-quence read, a visually informative report is accessible with quality information for each base,according to qPHRED’s. As a default, red stands for qPHRED <10, green stands for qPHRED≥10 and <20, blue stands for qPHRED ≥20 and <30, and black stands for qPHRED ≥30; butthese parameters can be easily customized on colorSeq.pl script. In addition, chromatogramquality features can be accessed on the TraceViewer box in this window.
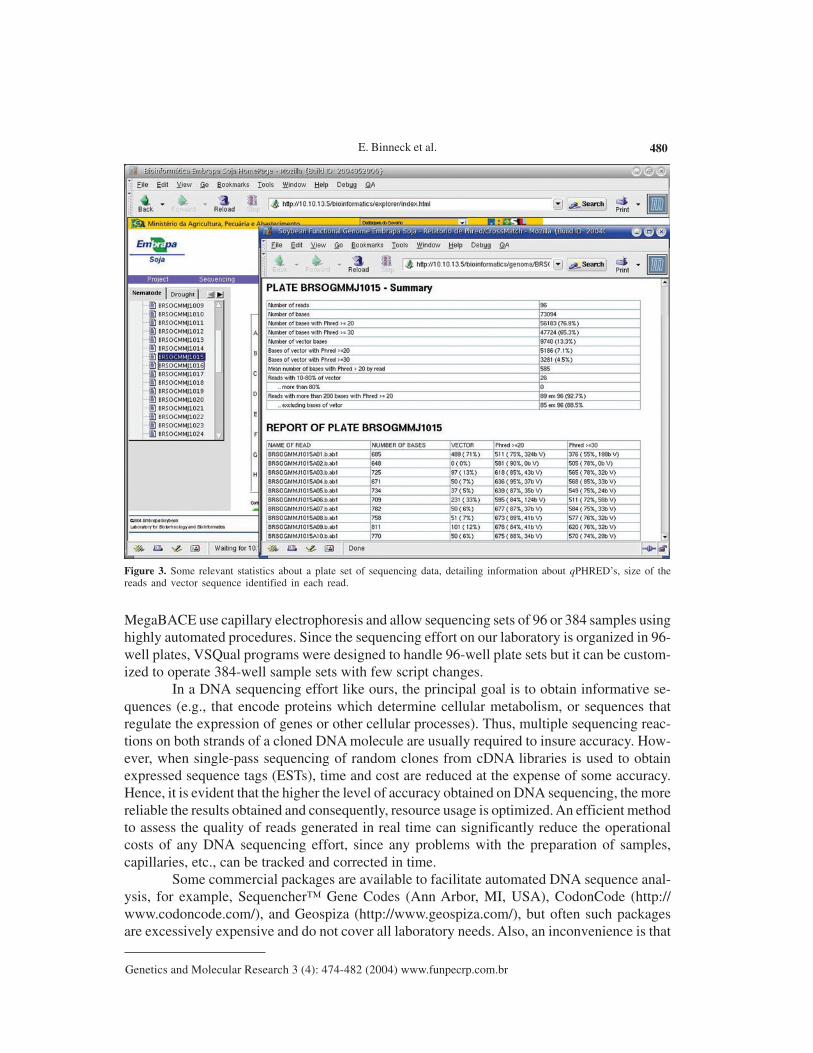
Another report shows some statistics about the set of data from a plate, such as numberof reads, number of bases, number of bases with qPHRED ≥20, number of bases with qPHRED≥30, number of vector bases, bases of vector with qPHRED ≥20, bases of vector with qPHRED
VSQual to assist DNA sequencing 479
Genetics and Molecular Research 3 (4): 474-482 (2004) www.funpecrp.com.br
≥30, mean number of bases with qPHRED >20 by read, reads with 10-80% of vector/morethan 80%, reads with more than 200 bases with qPHRED ≥20/excluding bases of vector. Alsosome relevant information is reported about each read, such as the name of the read, number ofbases obtained, number of vector bases masked, number of bases scored with qPHRED ≥20and qPHRED ≥30, and detailed information about the vector residual sequence identified in theread (Figure 3).
VSQual was developed with Perl version 5.8.2 and tested on RedHat Linux versions8.1 and 9.0, Mandrake Linux version 10.0 and Windows 2000. We expect no problems whenusing VSQual on any other computer operating system for which Perl is available (includingLinux, Unix®, Microsoft® Windows®, and Mac® OS).
The performance of all the VSQual programs was tested and validated using ab1 tracefiles from ABI PRISM 3100 Genetic Analyzer, Perkin-Elmer Applied Biosystems (Foster City,CA, USA) and esd trace files from MegaBACE 1000 DNA Sequencing System from Amer-sham Pharmacia/Molecular Dynamics. The assurance of the VSQual programs was assessedby manually comparing the outputs with the raw data used as input for each program.
DISCUSSION
Automated DNA sequencing machines, such as ABI PRISM 3100, 3700 or 3730, and
Figure 2. FASTA colored format and TraceViewer report with visual quality information of each base in the read,according to qPHRED.
E. Binneck et al. 480
Genetics and Molecular Research 3 (4): 474-482 (2004) www.funpecrp.com.br
MegaBACE use capillary electrophoresis and allow sequencing sets of 96 or 384 samples usinghighly automated procedures. Since the sequencing effort on our laboratory is organized in 96-well plates, VSQual programs were designed to handle 96-well plate sets but it can be custom-ized to operate 384-well sample sets with few script changes.
In a DNA sequencing effort like ours, the principal goal is to obtain informative se-quences (e.g., that encode proteins which determine cellular metabolism, or sequences thatregulate the expression of genes or other cellular processes). Thus, multiple sequencing reac-tions on both strands of a cloned DNA molecule are usually required to insure accuracy. How-ever, when single-pass sequencing of random clones from cDNA libraries is used to obtainexpressed sequence tags (ESTs), time and cost are reduced at the expense of some accuracy.Hence, it is evident that the higher the level of accuracy obtained on DNA sequencing, the morereliable the results obtained and consequently, resource usage is optimized. An efficient methodto assess the quality of reads generated in real time can significantly reduce the operationalcosts of any DNA sequencing effort, since any problems with the preparation of samples,capillaries, etc., can be tracked and corrected in time.
Some commercial packages are available to facilitate automated DNA sequence anal-ysis, for example, Sequencher™ Gene Codes (Ann Arbor, MI, USA), CodonCode (http://www.codoncode.com/), and Geospiza (http://www.geospiza.com/), but often such packagesare excessively expensive and do not cover all laboratory needs. Also, an inconvenience is that
Figure 3. Some relevant statistics about a plate set of sequencing data, detailing information about qPHRED’s, size of thereads and vector sequence identified in each read.
VSQual to assist DNA sequencing 481
Genetics and Molecular Research 3 (4): 474-482 (2004) www.funpecrp.com.br
most of these software solutions require massive user intervention, or they have modules thatneed advanced knowledge of the system to allow implementation in automated pipelines. In-vestments in sophisticated and rigid pipelines might be justified for large laboratories/large projectsbut can be too expensive for smaller laboratories.
Alternatively, some software solutions are available that perform these tasks at lowcost, such as Staden Package (Staden et al., 2000) and Bioperl (Stajich et al., 2002; http://www.bioperl.org/). The Staden Package programs provide an intuitive graphical user interface,but they require considerable user intervention and thus, hands-on time. VSQual considerablyreduces hands-on analysis time if compared to the Staden package when extracting sequenceinformation from raw sequencing files, since all VSQual reports are available ready to use onthe Web.
Bioperl is a collection of Perl modules designed to facilitate sequence manipulation,access to biological databases and to parse the output of various programs. However, it does notprovide complete programs. A module similar to VSQual is Bio::Seq::SeqWithQuality, which canbe used to manipulate sequences with quality data, like those produced by Phred. The inconve-nience of Bioperl is that the user is responsible for writing the Perl script that holds the modulesto achieve the desired task.
VSQual allows flexible and easy implementation and usage of a Perl-based pipeline tohandle and analyze DNA sequencing data, while requiring only minor or no programming skills.It is a flexible open-source software that can be adapted for different laboratory structures andneeds. Another favorable characteristic is that it allows the organization of laboratory workflowin a Web-based environment. Laboratory data is promptly organized and available for all autho-rized users, providing an easy and low cost way of accessing the sequencing information by allscientists and technicians from anywhere, as soon as it is generated. No more than a webbrowser is required to access all sequencing data features, with highly reliable information aboutthe quality of the data obtained.
ACKNOWLEDGMENTS
Research supported by the National Council for Scientific and Technological Deve-lopment (Conselho Nacional de Desenvolvimento Científico e Tecnológico - CNPq), the Brazil-ian Agricultural Technology Development Project (Projeto de Apoio ao Desenvolvimento deTecnologia Agropecuária para o Brasil - PRODETAB), the Japanese International ResearchCenter for Agricultural Sciences (Jircas), and the Brazilian Agricultural Research Corporation(Empresa Brasileira de Pesquisa Agropecuária - Embrapa), through Embrapa Soybean.
REFERENCES
ABI (1999). ABI PRISM, DNA Sequencing Analysis Software Version 3.6 NT, User’s Manual. PE AppliedBiosystems, Foster City, CA, USA.
Ewing, B. and Green, P. (1998). Base-calling of automated sequencer traces using Phred. II. Error prob-abilities. Genome Res. 8: 186-194.
Ewing, B., Hillier, L., Wendl, M.C. and Green, P. (1998). Base-calling of automated sequencer tracesusing Phred. I. Accuracy assessment. Genome Res. 8: 175-185.
Staden, R., Beal, K.F. and Bonfield, J.K. (2000). The Staden package, 1998. Methods Mol. Biol. 132: 115-130.
Stajich, J.E., Block, D., Boulez, K., Brenner, S.E., Chervitz, S.A., Dagdigian, C., Fuellen, G., Gilbert, J.G.,
E. Binneck et al. 482
Genetics and Molecular Research 3 (4): 474-482 (2004) www.funpecrp.com.br
Korf, I., Lapp, H., Lehvaslaiho, H., Matsalla, C., Mungall, C.J., Osborne, B.I., Pocock, M.R., Schattner,P., Senger, M., Stein, L.D., Stupka, E., Wilkinson, M.D. and Birney, E. (2002). The Bioperl toolkit:Perl modules for the life sciences. Genome Res. 12: 1611-1618.
Stein, L.D. (2001). Using Perl to facilitate biological analysis. Methods Biochem. Anal. 43: 413-449.Wall, L., Christiansen, T. and Schwartz, R.L. (1996). Programming Perl. 2nd edn. O’Reilly & Associates,
Sebastopol, CA, USA.
Related Documents


