vRealize Operations Management Pack for OpenStack 5.0

Welcome message from author
This document is posted to help you gain knowledge. Please leave a comment to let me know what you think about it! Share it to your friends and learn new things together.
Transcript

vRealize OperationsManagement Pack forOpenStack 5.0

vRealize Operations Management Pack for OpenStack 5.0
VMware, Inc. 2
You can find the most up-to-date technical documentation on the VMware website at:
https://docs.vmware.com/
If you have comments about this documentation, submit your feedback to
Copyright © 2018 VMware, Inc. All rights reserved. Copyright and trademark information.
VMware, Inc.3401 Hillview Ave.Palo Alto, CA 94304www.vmware.com

Contents
About This Book 5
1 Introduction to the vRealize Operations Management Pack for OpenStack 6
2 Installing and Configuring the Management Pack for OpenStack 7
Integrate the Management Pack for OpenStack with vRealize Management Packs 7
Install the Management Pack 9
Configure the OpenStack Instance 9
Configure the NSX-T Instance 11
View Management Pack for OpenStack Objects 12
3 Installing the End Point Operations Agent for OpenStack 14
Install the End Point Operations Agent in OpenStack 15
4 Management Pack for OpenStack Dashboards 16
Displaying OpenStack Dashboards 16
OpenStack Services Dashboard 17
OpenStack Compute Infrastructure Dashboard 17
OpenStack Network Infrastructure Dashboard 18
OpenStack vCenter Storage Infrastructure Dashboard 19
OpenStack Projects Dashboard 20
5 Working with the Management Pack for OpenStack 22
Open an External Application 22
Configuring OpenStack with Log Insight 23
6 Management Pack for OpenStack Alert Definitions 25
Nova Controller Service Alert Definitions 26
OpenStack Compute Services Alert Definitions 29
Cinder Controller Service Alert Definitions 40
Glance Controller Service Alert Definitions 41
Swift Controller Service Alert Definitions 42
OpenStack Storage Services Alert Definitions 44
Neutron Controller Service Alert Definitions 53
OpenStack Network Services Alert Definitions 55
KeyStone Controller Service Alert Definitions 61
mySQL Alert Definitions 62
Apache Alert Definitions 62
VMware, Inc. 3

RabbitMQ Alert Definitions 63
Memcached Alert Definitions 63
OpenStack Management Services Alert Definitions 64
Non-ESX Virtual Machine Alert Definitions 76
OpenStack Logical Switch Alert Definitions 77
OpenStack External Logical Switch Alert Definitions 77
OpenStack Logical Router Alert Definitions 78
OpenStack Project Alert Definitions 79
OpenStack Compute Infrastructure Alert Definitions 82
Host System Alert Definitions 83
Non-ESX Host System Alert Definitions 84
OpenStack Storage Infrastructure Alert Definitions 85
vPostgres Alert Definitions 86
Heat Controller Service Alert Definitions 86
VMware Integrated OpenStack Management Server Alert Definitions 88
7 Management Pack for OpenStack Objects and Metrics 90
OpenStack Compute Infrastructure 90
OpenStack Storage Infrastructure 93
OpenStack Compute Services 95
OpenStack Network Services 96
OpenStack Storage Services 97
OpenStack Management Services 99
OpenStack Project 103
OpenStack Logical Switch 105
OpenStack Logical Router 107
OpenStack External Logical Switch 108
Non-ESX Host System 110
Non-ESX Virtual Machine 111
8 Management Pack for OpenStack Capacity Models 114
9 Management Pack for OpenStack Reports 117
Generate a Report 117
vRealize Operations Management Pack for OpenStack 5.0
VMware, Inc. 4

About This Book
The VMware vRealize™ Operations Management Pack™ for OpenStack takes you through the processof deploying a working instance of Management Pack for OpenStack within your vCenter environment. Italso describes the prerequisites for OpenStack, plug-in installation and configuration, and how to work inthe Management Pack for OpenStack environment.
Intended AudienceThis information is intended for any network engineer, network administrator, network manager, ornetwork operations manager who is involved with the daily operations related to deployment,configuration, change management, troubleshooting, and capacity management of OpenStacknetworking technologies. In addition, it is intended for any cloud operations manager, cloud infrastructuremanager, or virtual administrator who has operation responsibility for troubleshooting virtual infrastructureproblems, and within this infrastructure OpenStack has been deployed.
VMware Technical Publications GlossaryVMware Technical Publications provides a glossary of terms that might be unfamiliar to you. Fordefinitions of terms as they are used in VMware technical documentation, go to http://www.vmware.com/support/pubs.
VMware, Inc. 5

Introduction to thevRealize OperationsManagement Pack forOpenStack 1The Management Pack for OpenStack extends the operational management capabilities of the vRealizeOperations platform to provide operational control of OpenStack environments.
This management pack is intended for administrators who are operating an OpenStack cloud. It includesthe following key features:n Performance and availability monitoring of OpenStack infrastructure and services.
n Pre-defined dashboards for:n Cloud Controllers Health
n Compute Infrastructure
n vCenter Storage Infrastructure
n Network Infrastructure
n Projects Inventory, Health and Quota usage
n Visibility into cloud resources running on any VMware ESX, KVM, XEN, or Hyper-v technologies.
n Advanced performance and capacity analytics for OpenStack inventory running on any VMware ESXand NSX technologies.
n Pre-defined alerts for several common OpenStack operational problems.
n Report templates for the following objects.n OpenStack Project Inventory
n OpenStack Infrastructure Capacity
n OpenStack Alerts
VMware, Inc. 6

Installing and Configuring theManagement Pack forOpenStack 2Using the Management Pack for OpenStack, you can collect inventory and capacity information ofcompute nodes registered with OpenStack, and inventory and availability of projects and provisionedvirtual machines, networks, and storage.
This chapter includes the following topics:n Integrate the Management Pack for OpenStack with vRealize Management Packs
n Install the Management Pack
n Configure the OpenStack Instance
n Configure the NSX-T Instance
n View Management Pack for OpenStack Objects
Integrate the Management Pack for OpenStack withvRealize Management PacksTo enhance monitoring and data collection capabilities, you can integrate theManagement Pack for OpenStack with the vRealize Operations Management Pack for vCenter, and thevRealize Operations Management Pack for NSX for vSphere.
If you intend to work with these management packs, for the most efficient use of resources, configure theadapters of the management pack in the following order.
1 Management Pack for vCenter
2 Endpoint Operations agents for the Endpoints
3 Management Pack for NSX for vSphere
VMware, Inc. 7

4 Management Pack for OpenStack
Note Each management pack populates a particular area of the user interface with specific data. If youchoose not to integrate the Management Pack for OpenStack with these management packs, some areasof the OpenStack user interface will not be populated with data, as shown in the following table.
Note If OpenStack is using vCenter for the compute backend, an instance of the vCenter adapter mustbe configured to monitor the vCenter environment that is registered with OpenStack. If this is not done,hosts and virtual machines will show up as "Non-ESX Hosts" and "Non-ESX Virtual Machines".
Note Capacity is only calculated for the storage infrastructure when using vCenter data stores.
Table 2‑1. OpenStack Integration with vRealize Management Packs
Management Pack Required by Description
Management Pack for vCenter Openstack vCenter Storage Infrastructure dashboard If the OpenStack deployment isusing vCenter for the computecomponent, the vRealizeManagement Pack for vCenterprovides integration with the datathat the management pack collectsfor vCenter, such as additionalmetrics and capacity calculations.
Endpoint Operations n OpenStack Services dashboardn OpenStack Services navigation tree
TheManagement Pack for OpenStacktakes advantage of the EndpointOperations plug-ins for monitoringthe availability and resource use ofOpenStack controller services,such as nova-compute, neutron-server, and cinder-volume. Inaddition, by integrating withEndpoint Operations, you canmonitor the availability andresource use of OpenStack web,database and messagingapplications, including MySQL,Apache, RabbitMQ, andMemcached.
Management Pack for NSX forvSphere
OpenStack Network Infrastructure dashboard If the OpenStack deployment isusing NSX for vSphere for thenetworking component, thismanagement pack providesintegration with the data that themanagement pack collects, suchas additional metrics, andmonitoring of the networkinginfrastructure.
vRealize Operations Management Pack for OpenStack 5.0
VMware, Inc. 8

Install the Management PackA management pack is the part of the solution that you install.
Procedure
1 Log in to the vRealize Operations Manager user interface with administrator privileges.
2 In the menu, click Administration and then in the left pane, click Solutions.
3 On the Solutions page, click the Add icon.
4 Browse to locate the temporary folder, select the PAK file, and click Upload.
The upload might take several minutes.
5 Read and accept the EULA, and click Next.
Installation details appear in the window during the process.
6 Ensure that you install the PAK file on the master node.
7 When the installation is complete, click Finish.
What to do next
Configure an adapter instance for the management pack.
Configure the OpenStack InstanceAfter you install the management pack, add and configure an instance to start collecting data.
Procedure
1 In the menu, click Administration and then in the left pane, click Solutions.
2 On the Solutions page, click Management Pack for OpenStack, and click the Configure icon.
3 Select the OpenStack Adapter and configure the instance settings.
Option Action
Display Name Enter a name for the adapter instance.
Description Enter a description for the adapter instance.
OpenStack API Host Enter the host name or IP address where the KeyStone service is running. Thisservice provides an entry point to the OpenStack API.
Port Enter the port number where the KeyStone service is running. The default portnumber is 5000.
Connection Type Select the connection type with which the management pack should communicatewith OpenStack. The option set by default is HTTPS.
vRealize Operations Management Pack for OpenStack 5.0
VMware, Inc. 9

Option Action
Endpoint Type Endpoints are the APIs used to call the different OpenStack services. Select theset of endpoints which vRealize Operations Manager uses when connecting withthe OpenStack API.n Detect Automatically. This option is selected by default, and can be used if
you do not know where vRealize Operations Manager is installed.n Public Only. Select if vRealize Operations Manager is installed outside the
management network.n Admin Only. Select if vRealize Operations Manager is installed inside the
management network.n Internal Only. Select if you want to use the Internal service endpoints that
are registered with OpenStack
Support Auto Discovery Auto discovery enables the management pack to discover resources and monitorthe OpenStack deployment. This option is set to True by default, and should notbe changed.
4 To add the credentials used to access OpenStack and optionally vCenter Server, click the Add icon.
Option Description
Credential name Enter the name by which you are identifying the configured credentials.
OpenStack Username Enter the username with which you connect to OpenStack.
OpenStack Password Enter the password with which you connect to OpenStack.
Admin Project Enter the name of a project for which you have an admin role. For the mostcomplete discovery possible, you should have the admin role on all projects.
Domain Name Enter the domain name of a project to receive data from that particular domain.
5 Click Test Connection to validate the connection.
6 The Advanced Settings area includes the Collector drop-down box, in which you can select thecollector upon which you want to run the adapter instance. A collector gathers objects into itsinventory for monitoring. The collector specified by default has been selected for optimal datacollecting.
7 Click Save Settings.
The adapter instance is added to the list.
What to do next
Verify that the adapter is configured and collecting data by viewing application-related data.
vRealize Operations Management Pack for OpenStack 5.0
VMware, Inc. 10

Table 2‑2. Successful Configuration Indicators
Where to View the Information Information to View
Collection Status and Collection State columns in theManagement Pack for OpenStack Solutions Details pane onthe Solutions tab.
The strings Collecting or Data receiving appearapproximately ten minutes after you have configured theadapter.
Environment Overview The objects related to OpenStack are added to the inventorytrees.
Dashboards Management Pack for OpenStack dashboards are added tothe vRealize Operations Manager dashboards.n OpenStack Servicesn OpenStack Compute Infrastructuren OpenStack Network Infrastructuren OpenStack vCenter Storage Infrastructuren OpenStack Projects
Click the Home icon in the left pane ofvRealize Operations Manager to view dashboards.
Configure the NSX-T InstanceAfter you install the management pak, add and configure an instance to start collecting data.
Procedure
1 In the menu, click Administration and then in the left pane, click Solutions.
2 On the Solutions page, click Management Pack for OpenStack, and click the Configure icon.
3 Select the NSX-T Adapter and configure the instance settings.
Option Action
Display Name Enter a name for the adapter instance.
Description Enter a description for the adapter instance.
NSX-T Host Enter the host name or IP address for NSX-T.
4 To add the credentials used to access NSX-T, click the Add icon.
Option Description
Credential name Enter the name by which you are identifying the configured credentials.
Username Enter the user name with which you connect to NSX-T.
Password Enter the password with which you connect to NSX-T.
5 Click Test Connection to validate the connection.
6 The Advanced Settings area includes the Collector drop-down box, in which you can select thecollector upon which you want to run the adapter instance. A collector gathers objects into itsinventory for monitoring. The collector specified by default has been selected for optimal datacollecting.
vRealize Operations Management Pack for OpenStack 5.0
VMware, Inc. 11

7 Click Save Settings.
The adapter instance is added to the list.
What to do next
Verify that the adapter is configured and collecting data by viewing application-related data.
Table 2‑3. Successful Configuration Indicators
Where to View the Information Information to View
Collection Status and Collection State columns in theManagement Pack for OpenStack Solutions Details pane onthe Solutions tab.
The strings Collecting or Data receiving appearapproximately ten minutes after you have configured theadapter.
Environment Overview The objects related to NSX-T are added to the inventory trees.
Dashboards Management Pack for OpenStack dashboards are added tothe vRealize Operations Manager dashboards.n NSX-T Main
Click the Home icon in the left pane ofvRealize Operations Manager to view dashboards.
View Management Pack for OpenStack ObjectsWhen the Management Pack for OpenStack has been installed and configured, the following objects areadded to the Inventory trees in the vRealize Operations Manager Environment.
Check that the OpenStack environment is configured correctly by viewing OpenStack objects.
Procedure
1 In the left pane of vRealize Operations Manager, click the Environment icon.
2 In the Environment Overview, scroll down the list, and under the Inventory Trees list, click AllObjects.
3 In the All Objects list, click the arrow next to MP for OpenStack.
OpenStack objects are displayed in the expanded list.
Table 2‑4. Management Pack for OpenStack Objects
Object Description
MP for OpenStack Instance Represents an instance of the OpenStack adapter.
Non-ESX Host System Represents a non-ESX hypervisor that is registered withOpenStack.
Non-ESX Virtual Machine Represents a virtual machine that has been provisioned by auser and is running on a non-ESX hypervisor.
OpenStack Compute Infrastructure Represents an aggregation of all hosts and clusters that areregistered with OpenStack.
OpenStack Compute Services Represents an aggregation of all Nova services in theOpenStack environment.
vRealize Operations Management Pack for OpenStack 5.0
VMware, Inc. 12

Table 2‑4. Management Pack for OpenStack Objects (Continued)
Object Description
OpenStack External Logical Switch Represents an external logical switch that has beenprovisioned by a project. If you are using NSX for vSphere asyour networking component, this object is not used by theManagement Pack for OpenStack.
OpenStack Group Internal object that is used by theManagement Pack for OpenStack for grouping certain objectstogether in order to show them on the dashboards.
OpenStack Logical Router Represents a logical router that has been provisioned by aproject. If you are using NSX for vSphere as your networkingcomponent, this object is not used by theManagement Pack for OpenStack
OpenStack Logical Switch Represents a logical switch that has been provisioned by aproject. If you are using NSX for vSphere as your networkingcomponent, this object is not used by theManagement Pack for OpenStack
OpenStack Management Services Represents an aggregation of all KeyStone, Ceilometer, andsupport services in the OpenStack environment.
OpenStack Network Infrastructure Represents an aggregation of the components in your networkinfrastructure that are registered with OpenStack. ForNSX for vSphere, these are controllers, controller clusters, andtransport zones.
OpenStack Network Services Represents an aggregation of all Neutron services in theOpenStack environment.
OpenStack Storage Infrastructure Represents an aggregation of all vCenter datastores that areregistered with OpenStack. This is only applicable when usingOpenStack with vCenter.
OpenStack Storage Services Represents an aggregation of all Cinder, Glance, and Swiftservices in the OpenStack environment.
OpenStack Project Represents a project in OpenStack, along with all provisionedinstances, networks, and routers.
vRealize Operations Management Pack for OpenStack 5.0
VMware, Inc. 13

Installing theEnd Point Operations Agent forOpenStack 3You can achieve wider monitoring capabilities by configuring the End Point Operations agent.
Discover the following OpenStack resources in the End Point Operations Inventory.
n Keystone Service
n Nova Service
n Neutron Service
n Glance Service
n Cinder Service
n Swift Service
n Ceilometer Service
n RabbitMQ
n MySQL
n Apache
n Memcached
n Heat Service
n VIO Management Server
The following End Point Operations are installed along with OpenStack solution.
Table 3‑1. End Point Operations Plug-Ins for OpenStack
Plug-in Description
MySQL_Stats Monitors the MySQL database. This plug-in is installed whenthe OpenStack solution is installed.
Apache Web Server Monitors the Apache server. This plug-in is installed when theOpenStack solution is installed.
RabbitMQ Monitors the RabbitMQ messaging server. This plug-in isinstalled when theOpenStack solution is installed.
Memcached Monitors Memcached caching applications. Download thisplug-in from the VMware Solution Exchange.
VMware, Inc. 14

Table 3‑1. End Point Operations Plug-Ins for OpenStack (Continued)
Plug-in Description
OpenStack Monitors OpenStack related services. This plug-in is installedalong with the OpenStack solution.
vPostgres Monitors the PostgreSQL database. This plug-in is installedwhen the OpenStack solution is installed.
Install the End Point Operations Agent in OpenStackDownload an End Point Operations agent for each virtual machine that is running OpenStack services.
Prerequisites
n Ensure that the End Point Operations agent corresponds with your vRealize Operations server. Forexample, if you are running vRealize Operations server 6.7, download the Endpoints agent forvRealize Operations server 6.7.
n Ensure that you are logged in as the root user and have access to the download folder before youperform the installation.
Procedure
1 Run tar -xvf <downloaded_epops_agent> to extract the file.
2 Run cd <epops_extracted>/bin to extract the files.
3 Run ./ep-agent start and follow the instructions to complete agent setup.
vRealize Operations Management Pack for OpenStack 5.0
VMware, Inc. 15

Management Pack forOpenStack Dashboards 4The Management Pack for OpenStack dashboards enable you to diagnose and troubleshoot problems inyour OpenStack environment.
For information about how to configure the options on the dashboard widgets, see thevRealize Operations Manager documentation, at https://www.vmware.com/support/pubs/.
This chapter includes the following topics:n Displaying OpenStack Dashboards
n OpenStack Services Dashboard
n OpenStack Compute Infrastructure Dashboard
n OpenStack Network Infrastructure Dashboard
n OpenStack vCenter Storage Infrastructure Dashboard
n OpenStack Projects Dashboard
Displaying OpenStack DashboardsManagement Pack for OpenStack dashboards are displayed in the vRealize Operations Manager Homepage after the management pack is installed. If you have numerous dashboards open invRealize Operations Manager, the OpenStack dashboards may not be visible. Instead of scrolling throughyour available dashboards, you can select them from the dashboard list.
Procedure
1 In the left pane of vRealize Operations Manager click the Home icon.
2 In the right pane, click Dashboard List, and from the drop-down menu point to OpenStack, andselect the OpenStack dashboard you want to work with.
The selected dashboard is displayed in the vRealize Operations Manager Home page.
3 To ensure that Management Pack for OpenStack dashboards are always available in the Home page,click Dashboard List, and make sure that the OpenStack check box is selected.
VMware, Inc. 16

OpenStack Services DashboardThe OpenStack Services dashboard provides a high level view of the compute, network, storage, andmanagement services. This dashboard enables you to detect health-related problems at the service level,and then drill-down to the individual processes by viewing the topology and alerts.
To view service-related information in the Controller Service Topology widget, the End Point Operationsagent must be installed on the Endpoints.
Table 4‑1. OpenStack Services Dashboard Widgets
Widget Description
Controller Service Inventory Provides a high level view of the compute, network, storage,and management services in your environment. Select anobject to show detailed information about the controller servicein the dashboard.
Hover over an object to display capacity-related details.
Controller Service Topology Displays the individual services running on the controllers. Thehealth of the services impacts the controller service object inthe Controller Service Inventory widget. For example, if 50% ofthe services of a particular type are down, the object is orange.
To display an extended view that includes other connectedobjects, right-click an object, select Expand Node, and selectthe objects you want to include in the expanded view.
Controller Service Metrics When you select a controller in the Controller ServiceInventory, this widget displays the number of services that havebeen configured and running. When you select a service in theController Service Topology widget, this widget providesrelated resource usage data.
Controller Service Alerts Displays alerts for objects selected in the Controller ServiceTopology widget.
OpenStack Compute Infrastructure DashboardThe OpenStack Compute Infrastructure dashboard displays top level objects that show the correlationbetween the environment and the infrastructure components of that type. This top level view provides youwith enough information to determine if there is sufficient capacity for users to provision virtual machines.
vRealize Operations Management Pack for OpenStack 5.0
VMware, Inc. 17

Table 4‑2. OpenStack Compute Infrastructure Dashboard Widgets
Widget Description
Compute Inventory Displays a high level view of the components in the computeinfrastructure. Each component is represented by a box. Selectan object to view related components in the dashboard.
Hover over an object to display capacity-related details.
Compute Infrastructure Displays related components of the object selected in theCompute Inventory widget.
Hover over an object to view health and capacity relateddetails.
To display an extended view that includes other connectedobjects, right-click the object, select Expand Node, and selectthe objects you want to include in the expanded view.
Compute Resource Utilization Displays a heatmap of the workloads of the different objectsregistered with OpenStack. The workloads are broken down bycluster. A threshold is set at 80% of the workload. Theheatmap remains green and healthy as long as the workloadremains below 80% of the capacity. You can view heatmaps forthe cluster CPU, ESX Host CPU, cluster memory, and ESXHost memory workloads, and Non-ESX Host memory usage byselecting the required option from the Configurations drop-down menu.
Compute Alerts Displays alerts for selected objects. Also displays risk-basedalerts that are opened if the infrastructure is approachingcapacity. Risk alerts are opened when capacity has reached athreshold of 85%, 90% and 95%.
OpenStack Network Infrastructure DashboardThe OpenStack Network Infrastructure dashboard provides you with a high level view of the networkinginfrastructure.
The networking infrastructure is only available if you are using NSX for vSphere as your networkingcomponent, and you have configured the NSX for vSphere adapter. If you are not using NSX for vSphereas your networking component, this dashboard will not display any information.
vRealize Operations Management Pack for OpenStack 5.0
VMware, Inc. 18

Table 4‑3. OpenStack Network Infrastructure Dashboard Widgets
Widget Description
Network Inventory Provides a high level view of your networking infrastructure:
If NSX for vSphere is your network component, Controller,Controller Cluster, and Transport Zone is displayed. Select anobject to view related components and information in thedashboard.
Hover over an object to display health and configurationrelated details.
Network Infrastructure Displays related components of the object selected in theNetwork Inventory widget.
Hover over an object to view health and capacity relateddetails.
To display an extended view that includes other connectedobjects, right-click an object, select Expand Node, and selectthe objects you want to include in the expanded view.
Network Infrastructure Resource Utilization Displays a heatmap of the workloads of the different networkobjects. A threshold is set at 80% of the workload. Theheatmap remains green and healthy as long as the workloadremains below 80% of the capacity.
View a heatmap by selecting the required network object fromthe Configurations drop-down menu
If you are using NSX for vSphere as your networkingcomponent, you can view a heatmap for the NSX-vSphereController CPU, NSX-vSphere Controller Memory, NSX-vSphere Controller Disk, and the NSX-vSphere ControllerNetwork.
Network Alerts Displays alerts for objects selected in the NetworkInfrastructure widget.
OpenStack vCenter Storage Infrastructure DashboardIf you are using VMware vCenter host as your computing infrastructure, the OpenStack vCenter StorageInfrastructure dashboard displays the data stores in your environment.
If you are not using vCenter as your computing infrastructure, vRealize Operations Manager can notaccess data about the storage devices registered with OpenStack, and the OpenStack vCenter StorageInfrastructure dashboard does not display data.
vRealize Operations Management Pack for OpenStack 5.0
VMware, Inc. 19

Table 4‑4. OpenStack vCenter Storage Infrastructure Dashboard Widgets
Widget Description
vCenter Storage Inventory Displays the data stores available in your environment.
Hover over an object to display capacity-related details.
vCenter Storage Infrastructure Displays related components of the object selected in thevCenter Storage Inventory widget.
Hover over an object to view health and capacity relateddetails.
To display an extended view that includes other connectedobjects, right-click an object, select Expand Node, and selectthe objects you want to include in the expanded view.
vCenter Storage Resource Utilization Displays a heatmap representing capacity of the data stores.The configurations are broken down by cluster. A threshold isset at 80% of the capacity. The heatmap remains green andhealthy as long as the usage remains below 80% of thecapacity. You can view heatmaps for the datastore diskspaceusage, IOPs, and average latency by selecting the requiredoption from the Configurations drop-down menu.
vCenter Storage Alerts Displays alerts for objects selected in the vCenter StorageInfrastructure widget.
OpenStack Projects DashboardThe OpenStack Projects dashboard provides you with a list of all OpenStack projects, and the ability toview quota usage, provisioned objects, and alerts for each project.
vRealize Operations Management Pack for OpenStack 5.0
VMware, Inc. 20

Table 4‑5. OpenStack Projects Dashboard Widgets
Widget Description
Project Quota Usage Displays the current quota usage of each project in theenvironment, and enables you to see if a project is close toreaching one of its quota limits. Each project is represented bya box. Each box is proportionate to the size of the projectquota. In addition, a threshold is defined at 80% of the quota,at which point the box starts to turn red.
You can view the Projects instance, vCPU, and vRAM, byselecting the required configuration from the Configurationsdrop-down menu.
Project Inventory Provides a view of the objects that the project has provisionedand how they are connected together. The view expands fromProject, to virtual machine to switch.
To display an extended view that includes other connectedobjects, right-click an object, select Expand Node, and selectthe objects you want to include in the expanded view. Forexample, you can expand the view of a logical switch anddisplay the logical router that it is connected to.
Note If you are using VMware Integrated OpenStack withVDS setup, your network is represented as a Distributed VirtualPort Group (DVPG). DVPG connected objects can only beviewed when the view of the virtual machine or project isexpanded.
Hover over any object to see more information about the objectsuch as its name and its health.
Project List Displays a list of all the projects in the environment. Click aproject in this list to display the project in the Project Inventorywidget.
Project Alerts Displays alerts for objects selected in the Project Inventorywidget. Alerts are displayed from both an object perspective,and from a project perspective. For example, if you try toprovision a virtual machine and it fails, an alert is displayed onthe object that failed to provision and also on its project. Thisenables you to diagnose problems on both the object and theproject.
vRealize Operations Management Pack for OpenStack 5.0
VMware, Inc. 21

Working with theManagement Pack forOpenStack 5The Management Pack for OpenStack provides you with a high level view of your OpenStackenvironment and enables you to drill down to more object-specific information by opening selectedobjects in external applications. You can investigate problems and better analyze the providedinformation. You can also make configuration changes, as required.
Table 5‑1. Examples of Use
Application Example of Use
View logging information in Log Insight. Information includes,component logs, neutron logs, nova logs, and API requestlogs.
Note To view logging information in Log Insight, you must firstintegrate Log Insight with theManagement Pack for OpenStack. See Configuring OpenStackwith Log Insight
If a provisioning attempt fails, view the Nova logs in Log Insightto determine any errors that occurred.
Open project-related objects in OpenStack Horizon. If a project is approaching their quota, open the project inOpenStack Horizon and view the quota.
This chapter includes the following topics:n Open an External Application
n Configuring OpenStack with Log Insight
Open an External ApplicationOpen selected objects in an external application to make configuration changes or to view application-related information.
VMware, Inc. 22

Table 5‑2. Applications and objects
Application Available on these objects
vRealize Log Insight n Compute Infrastructuren Compute Servicesn Host Systemn Non-ESX Host Systemn Virtual Machinen Non-ESX Virtual Machinen Network Servicesn Logical Routern Storage Servicesn Management Servicesn Logical Switch
OpenStack Horizon n Projectn Non-ESX Host Systemn Non-ESX Virtual Machinen Logical Switchn External Logical Switchn Logical Routern Virtual Machine
vSphere Web Client n Virtual Machinen Host System
Procedure
1 Select the required object in a widget.
2 In the widget toolbar, click the Dashboard Navigation icon, and from the drop-down menu, select theapplication you want to open.
The external application is opened and you can view application-related information about the object.
What to do next
Analyze the information in the application. Make any configuration changes. Continue to monitor theobject in vRealize Operations Manager
Configuring OpenStack with Log InsightThe Management Pack for OpenStack enables you to open selected objects in Log Insight, and viewlogging information for the object. OpenStack does not support automatic configuration of logginginformation, and if you want to forward logging information to Log Insight, you must configure theOpenStack host manually.
Prerequisites
Ensure that Log Insight is integrated with vRealize Operations Manager. See the Log Insightdocumentation at https://www.vmware.com/support/pubs/log-insight-pubs.html.
vRealize Operations Management Pack for OpenStack 5.0
VMware, Inc. 23

Procedure
1 On each host, locate the config file for OpenStack components.
For example, /etc/nova/nova.conf, /etc/neutron/neutron.conf.
2 In the config file, set the use_syslog parameter to true.
3 Specify the forwarding host by running the following command in the /etc/rsyslog.d/50-default.conf file.
# echo "*.* @@<loginsight-hostname>:514" >>
/etc/rsyslog.d/50-default.conf
# tail -1 /etc/rsyslog.d/50-default.conf
*.* @@<loginsight-hostname>:514
# service rsyslog restart
The name of your config file may be different, but the forwarding information you enter is the same.
4 Restart OpenStack services on the host to apply the changes.
OpenStack begins to forward logging information. Check Log Insight to see if the logs are beingforwarded.
vRealize Operations Management Pack for OpenStack 5.0
VMware, Inc. 24

Management Pack forOpenStack Alert Definitions 6Management Pack for OpenStack alert definitions are a combination of symptoms and recommendationsthat identify problem areas in your environment and generate alerts on which you can act for those areas.
This chapter includes the following topics:
n Nova Controller Service Alert Definitions
n OpenStack Compute Services Alert Definitions
n Cinder Controller Service Alert Definitions
n Glance Controller Service Alert Definitions
n Swift Controller Service Alert Definitions
n OpenStack Storage Services Alert Definitions
n Neutron Controller Service Alert Definitions
n OpenStack Network Services Alert Definitions
n KeyStone Controller Service Alert Definitions
n mySQL Alert Definitions
n Apache Alert Definitions
n RabbitMQ Alert Definitions
n Memcached Alert Definitions
n OpenStack Management Services Alert Definitions
n Non-ESX Virtual Machine Alert Definitions
n OpenStack Logical Switch Alert Definitions
n OpenStack External Logical Switch Alert Definitions
n OpenStack Logical Router Alert Definitions
n OpenStack Project Alert Definitions
n OpenStack Compute Infrastructure Alert Definitions
n Host System Alert Definitions
VMware, Inc. 25

n Non-ESX Host System Alert Definitions
n OpenStack Storage Infrastructure Alert Definitions
n vPostgres Alert Definitions
n Heat Controller Service Alert Definitions
n VMware Integrated OpenStack Management Server Alert Definitions
Nova Controller Service Alert DefinitionsThe Management Pack for OpenStack provides the following predefined alert definitions for the NovaController Service object type.
Table 6‑1. Nova Controller Service Alert Definitions
Alert Name Alert Definition Symptom Recommendations Impact Severity
Nova-objectstoreservice isunavailable
The nova-objectstoreservice is currentlyunavailable, and may bedown.
Self Metric:Nova-ObjectStoreProcessMetrics|AVAILABILITY|ResourceAvailability <100
1 Restart the nova-objectstore service.
2 Check the log filesfor moreinformation aboutwhat caused thefailure.
3 Verify that theEnd PointOperations agent isrunning on thecontroller.
Health Critical
Nova-apiservice isunavailable
The nova-api service iscurrently unavailable, andmay be down.
Self Metric:Nova-ApiProcessMetrics|AVAILABILITY|ResourceAvailability <100
1 Restart the nova-api service.
2 Check the log filesfor moreinformation aboutwhat caused thefailure.
3 Verify that theEnd PointOperations agent isrunning on thecontroller.
Health Critical
vRealize Operations Management Pack for OpenStack 5.0
VMware, Inc. 26

Table 6‑1. Nova Controller Service Alert Definitions (Continued)
Alert Name Alert Definition Symptom Recommendations Impact Severity
Nova-schedulerservice isunavailable
The nova-schedulerservice is currentlyunavailable, and may bedown.
Self Metric:Nova-SchedulerProcessMetrics|AVAILABILITY|ResourceAvailability <100
1 Restart the nova-scheduler service.
2 Check the log filesfor moreinformation aboutwhat caused thefailure.
3 Verify that theEnd PointOperations agent isrunning on thecontroller.
Health Critical
Nova-conductorservice isunavailable
The nova-conductorservice is currentlyunavailable, and may bedown.
Self Metric:Nova-ConductorProcessMetrics|AVAILABILITY|ResourceAvailability <100
1 Restart the nova-conductor service.
2 Check the log filesfor moreinformation aboutwhat caused thefailure.
3 Verify that theEnd PointOperations agent isrunning on thecontroller.
Health Critical
Nova-consoleauthservice isunavailable
The nova-consoleauthservice is currentlyunavailable, and may bedown.
Self Metric:Nova-ConsoleAuthProcessMetrics|AVAILABILITY|ResourceAvailability <100
1 Restart the nova-consoleauthservice.
2 Check the log filesfor moreinformation aboutwhat caused thefailure.
3 Verify that theEnd PointOperations agent isrunning on thecontroller.
Health Critical
Nova-consoleservice isunavailable
The nova-console serviceis currently unavailable,and may be down.
Self Metric:Nova-ConsoleProcessMetrics|AVAILABILITY|ResourceAvailability <100
1 Restart the nova-console service.
2 Check the log filesfor moreinformation aboutwhat caused thefailure.
3 Verify that theEnd PointOperations agent isrunning on thecontroller.
Health Critical
vRealize Operations Management Pack for OpenStack 5.0
VMware, Inc. 27

Table 6‑1. Nova Controller Service Alert Definitions (Continued)
Alert Name Alert Definition Symptom Recommendations Impact Severity
Nova-certservice isunavailable
The nova-cert service iscurrently unavailable, andmay be down.
Metric: Nova-Cert ProcessMetrics|AVAILABILITY|ResourceAvailability <100
1 Restart the nova-cert service.
2 Check the log filesfor moreinformation aboutwhat caused thefailure.
3 Verify that theEnd PointOperations agent isrunning on thecontroller.
Health Critical
Nova-computeservice isunavailable
The nova-computeservice is currentlyunavailable, and may bedown.
Self Metric:Nova-ComputeProcessMetrics|AVAILABILITY|ResourceAvailability <100
1 Restart the nova-compute service.
2 Check the log filesfor moreinformation aboutwhat caused thefailure.
3 Verify that theEnd PointOperations agent isrunning on thecontroller.
Health Critical
Nova-xvpvnc-proxy service isunavailable
The nova-xvpvnc-proxyservice is currentlyunavailable, and may bedown.
Self Metric:Nova-XvpvncProxyProcessMetrics|AVAILABILITY|ResourceAvailability <100
1 Restart the nova-compute service.
2 Check the log filesfor moreinformation aboutwhat caused thefailure.
3 Verify that theEnd PointOperations agent isrunning on thecontroller.
Health Critical
vRealize Operations Management Pack for OpenStack 5.0
VMware, Inc. 28

Table 6‑1. Nova Controller Service Alert Definitions (Continued)
Alert Name Alert Definition Symptom Recommendations Impact Severity
Nova-novnc-proxy service isunavailable
The nova-novnc-proxyservice is currentlyunavailable, and may bedown.
Self Metric:Nova-NoVncProxyProcessMetrics|AVAILABILITY|ResourceAvailability <100
1 Restart the nova-compute service.
2 Check the log filesfor moreinformation aboutwhat caused thefailure.
3 Verify that theEnd PointOperations agent isrunning on thecontroller.
Health Critical
Nova-networkservice isunavailable
The nova-network serviceis currently unavailable,and may be down.
Self Metric:Nova-NetworkProcessMetrics|AVAILABILITY|ResourceAvailability <100
1 Restart the nova-network service.
2 Check the log filesfor moreinformation aboutwhat caused thefailure.
3 Verify that theEnd PointOperations agent isrunning on thecontroller.
Health Critical
OpenStack Compute Services Alert DefinitionsThe Management Pack for OpenStack provides the following predefined alert definitions for theOpenStack Compute Services object type.
vRealize Operations Management Pack for OpenStack 5.0
VMware, Inc. 29

Table 6‑2. OpenStack Compute Services Alert Definitions
Alert Name Alert Description Symptom Recommendations Impact Severity
One or morenova-api servicesare unavailable
One or morenova-api servicesare unavailable,and may bedown.
Self Metric:Service|Nova:Nova-ApiRunning (%) <100
1 Restart anycompute servicesthat are down.
2 Check the log filesfor moreinformation aboutwhat caused thefailure.
3 Verify that theEnd PointOperations agentis running on thecontroller.
Health Warning
The majority ofnova-api servicesare unavailable
The majority ofnova-api servicesare unavailable,which may beimpacting theability for projectsto managecomputingresources
Self Metric:Service|Nova:Nova-ApiRunning (%)<= 50
1 Restart anycompute servicesthat are down.
2 Check the log filesfor moreinformation aboutwhat caused thefailure.
3 Verify that theEnd PointOperations agentis running on thecontroller.
Health Immediate
All nova-apiservices areunavailable
All nova-apiservices areunavailable,which may beimpacting theability for projectsto managecomputingresources.
SelfMetric:Service|Nova:Nova-ApiRunning (%)=0
1 Restart anycompute servicesthat are down.
2 Check the log filesfor moreinformation aboutwhat caused thefailure.
3 Verify that theEnd PointOperations agentis running on thecontroller.
Health Critical
vRealize Operations Management Pack for OpenStack 5.0
VMware, Inc. 30

Table 6‑2. OpenStack Compute Services Alert Definitions (Continued)
Alert Name Alert Description Symptom Recommendations Impact Severity
One or morenova-certservices areunavailable
One or morenova-certservices areunavailable, andmay be down.
SelfMetric:Service|Nova:Nova-Cert|Running (%) <100
1 Restart anycompute servicesthat are down.
2 Check the log filesfor moreinformation aboutwhat caused thefailure.
3 Verify that theEnd PointOperations agentis running on thecontroller.
Health Warning
The majority ofnova-certservices areunavailable
The majority ofnova-certservices areunavailable,which may beimpacting theability for projectsto managecomputingresources.
SelfMetric:Service|Nova:Nova-Cert|Running (%) <=50
1 Restart anycompute servicesthat are down.
2 Check the log filesfor moreinformation aboutwhat caused thefailure.
3 Verify that theEnd PointOperations agentis running on thecontroller.
Health Immediate
All nova-certservices areunavailable
All nova-certservices areunavailable ,which may beimpacting theability for projectsto managecomputingresources.
SelfMetric:Service|Nova:Nova-Cert|Running (%) = 0
1 Restart anycompute servicesthat are down.
2 Check the log filesfor moreinformation aboutwhat caused thefailure.
3 Verify that theEnd PointOperations agentis running on thecontroller.
Health Critical
vRealize Operations Management Pack for OpenStack 5.0
VMware, Inc. 31

Table 6‑2. OpenStack Compute Services Alert Definitions (Continued)
Alert Name Alert Description Symptom Recommendations Impact Severity
One or more novacompute servicesare unavailable
One or more novacompute servicesare unavailable,and may bedown.
Self Metric:Service|Nova:Nova-Compute|Running(%) < 100
1 Restart anycompute servicesthat are down.
2 Check the log filesfor moreinformation aboutwhat caused thefailure.
3 Verify that theEnd PointOperations agentis running on thecontroller.
Health Warning
The majority ofnova-computeservices areunavailable
The majority ofnova-computeservices areunavailable,which may beimpacting theability for projectsto managecomputingresources.
SelfMetric:Service|Nova:Nova-Compute|Running(%) <= 50
1 Restart anycompute servicesthat are down.
2 Check the log filesfor moreinformation aboutwhat caused thefailure.
3 Verify that theEnd PointOperations agentis running on thecontroller.
Health Immediate
All nova-computeservices areunavailable
All nova-computeservices areunavailable,which may beimpacting theablity for projectsto managecomputingresources.
SelfMetric:Service|Nova:Nova-Compute|Running(%) = 0
1 Restart anycompute servicesthat are down.
2 Check the log filesfor moreinformation aboutwhat caused thefailure.
3 Verify that theEnd PointOperations agentis running on thecontroller.
Health Critical
vRealize Operations Management Pack for OpenStack 5.0
VMware, Inc. 32

Table 6‑2. OpenStack Compute Services Alert Definitions (Continued)
Alert Name Alert Description Symptom Recommendations Impact Severity
One or morenova-conductorservices areunavailable
One or morenova-conductorservices areunavailable, andmay be down.
Self Metric:Service|Nova:Nova-Conductor|Running (%) <100
1 Restart anycompute servicesthat are down.
2 Check the log filesfor moreinformation aboutwhat caused thefailure.
3 Verify that theEnd PointOperations agentis running on thecontroller.
Health Warning
The majority ofnova-conductorservices areunavailable
The majority ofnova-conductorservices areunavailable,which may beimpacting theablity for projectsto managecomputingresources.
Self Metric:Service|Nova:Nova-Conductor|Running (%) <=50
1 Restart anycompute servicesthat are down.
2 Check the log filesfor moreinformation aboutwhat caused thefailure.
3 Verify that theEnd PointOperations agentis running on thecontroller.
Health Immediate
All nova-conductorservices areunavailable
All nova-conductorservices areunavailable,which may beimpacting theablity for projectsto managecomputingresources.
Self Metric:Service|Nova:Nova-Conductor|Running (%) = 0
1 Restart anycompute servicesthat are down.
2 Check the log filesfor moreinformation aboutwhat caused thefailure.
3 Verify that theEnd PointOperations agentis running on thecontroller.
Health Critical
vRealize Operations Management Pack for OpenStack 5.0
VMware, Inc. 33

Table 6‑2. OpenStack Compute Services Alert Definitions (Continued)
Alert Name Alert Description Symptom Recommendations Impact Severity
One or morenova-consoleservices areunavailable
One or morenova-consoleservices areunavailable, andmay be down.
Self Metric:Service|Nova:Nova-Console|Running(%) < 100
1 Restart anycompute servicesthat are down.
2 Check the log filesfor moreinformation aboutwhat caused thefailure.
3 Verify that theEnd PointOperations agentis running on thecontroller.
Health Warning
The majority ofnova-consoleservices areunavailable
The majority ofnova-consoleservices areunavailable,which may beimpacting theability for projectsto managecomputingresources.
Self Metric:Service|Nova:Nova-Console|Running(%) <= 50
1 Restart anycompute servicesthat are down.
2 Check the log filesfor moreinformation aboutwhat caused thefailure.
3 Verify that theEnd PointOperations agentis running on thecontroller.
Health Immediate
All nova-consoleservices areunavailable
All nova-consoleservices areunavailable,which may beimpacting theability for projectsto managecomputingresources.
SelfMetric:Service|Nova:Nova-ConsoleRunning(%) = 0
1 Restart anycompute servicesthat are down.
2 Check the log filesfor moreinformation aboutwhat caused thefailure.
3 Verify that theEnd PointOperations agentis running on thecontroller.
Health Critical
vRealize Operations Management Pack for OpenStack 5.0
VMware, Inc. 34

Table 6‑2. OpenStack Compute Services Alert Definitions (Continued)
Alert Name Alert Description Symptom Recommendations Impact Severity
One or morenova-consoleauthservices areunavailable
One or morenova-consoleauthservices areunavailable, andmay be down.
Self Metric:Service|Nova:Nova-ConsoleAuth|Running (%) <100
1 Restart anycompute servicesthat are down.
2 Check the log filesfor moreinformation aboutwhat caused thefailure.
3 Verify that theEnd PointOperations agentis running on thecontroller.
Health Warning
The majority ofnova-consoleauthservices areunavailable
The majority ofnova-consoleauthservices areunavailable,which may beimpacting theability for projectsto managecomputingresources.
SelfMetric:Service|Nova:Nova-Console Auth|Running (%) <=50
1 Restart anycompute servicesthat are down.
2 Check the log filesfor moreinformation aboutwhat caused thefailure.
3 Verify that theEnd PointOperations agentis running on thecontroller.
Health Immediate
All nova-consoleauthservices areunavailable
All nova-consoleauthservices areunavailable,which may beimpacting theability for projectsto managecomputingresources.
Self Metric:Service|Nova:Nova-Console Auth|Running (%) = 0
1 Restart anycompute servicesthat are down.
2 Check the log filesfor moreinformation aboutwhat caused thefailure.
3 Verify that theEnd PointOperations agentis running on thecontroller.
Health Critical
vRealize Operations Management Pack for OpenStack 5.0
VMware, Inc. 35

Table 6‑2. OpenStack Compute Services Alert Definitions (Continued)
Alert Name Alert Description Symptom Recommendations Impact Severity
One or morenova-networkservices areunavailable
One or morenova-networkservices areunavailable, andmay be down.
Self Metric:Service|Nova:Nova-Network|Running(%) < 100
1 Restart anycompute servicesthat are down.
2 Check the log filesfor moreinformation aboutwhat caused thefailure.
3 Verify that theEnd PointOperations agentis running on thecontroller.
Health Warning
The majority ofnova-networkservices areunavailable
The majority ofnova-networkservices areunavailable,which may beimpacting theability for projectsto managecomputingresources.
Self Metric:Service|Nova:Nova-Network|Running(%) <= 50
1 Restart anycompute servicesthat are down.
2 Check the log filesfor moreinformation aboutwhat caused thefailure.
3 Verify that theEnd PointOperations agentis running on thecontroller.
Health Immediate
All nova-networkservices areunavailable
All nova-networkservices areunavailable,which may beimpacting theability for projectsto managecomputingresources.
Self Metric:Service|Nova:Nova-NetworkRunning(%) = 0
1 Restart anycompute servicesthat are down.
2 Check the log filesfor moreinformation aboutwhat caused thefailure.
3 Verify that theEnd PointOperations agentis running on thecontroller.
Health Critical
vRealize Operations Management Pack for OpenStack 5.0
VMware, Inc. 36

Table 6‑2. OpenStack Compute Services Alert Definitions (Continued)
Alert Name Alert Description Symptom Recommendations Impact Severity
One or morenova-novnc-proxyservices areunavailable
One or morenova-novnc-proxyservices areunavailable, andmay be down.
Self Metric:Service|Nova:Nova-NoVncProxy|Running (%) <100
1 Restart anycompute servicesthat are down.
2 Check the log filesfor moreinformation aboutwhat caused thefailure.
3 Verify that theEnd PointOperations agentis running on thecontroller.
Health Warning
The majority ofnova-novnc-proxyservices areunavailable
The majority ofnova-novnc-proxyservices areunavailable,which may beimpacting theability for projectsto managecomputingresources.
SelfMetric:Service|Nova:Nova-NoVncProxy|Running (%) <=50
1 Restart anycompute servicesthat are down.
2 Check the log filesfor moreinformation aboutwhat caused thefailure.
3 Verify that theEnd PointOperations agentis running on thecontroller.
Health Immediate
All nova-novnc-proxy servicesare unavailable
All nova-novnc-proxy servicesare unavailable,which may beimpacting theability for projectsto managecomputingresources.
Self Metric:Service|Nova:Nova-NoVncProxy|Running (%) = 0
1 Restart anycompute servicesthat are down.
2 Check the log filesfor moreinformation aboutwhat caused thefailure.
3 Verify that theEnd PointOperations agentis running on thecontroller.
Health Critical
vRealize Operations Management Pack for OpenStack 5.0
VMware, Inc. 37

Table 6‑2. OpenStack Compute Services Alert Definitions (Continued)
Alert Name Alert Description Symptom Recommendations Impact Severity
One or morenova-objectstoreservices areunavailable
One or morenova-objectstoreservices areunavailable, andmay be down.
Self Metric:Service|Nova:Nova-ObjectStore|Running (%) <100
1 Restart anycompute servicesthat are down.
2 Check the log filesfor moreinformation aboutwhat caused thefailure.
3 Verify that theEnd PointOperations agentis running on thecontroller.
Health Warning
The majority ofnova-objectstoreservices areunavailable
The majority ofnova-objectstoreservices areunavailable,which may beimpacting theability for projectsto managecomputingresources.
Self Metric:Service|Nova:Nova-ObjectStore|Running (%) <=50
1 Restart anycompute servicesthat are down.
2 Check the log filesfor moreinformation aboutwhat caused thefailure.
3 Verify that theEnd PointOperations agentis running on thecontroller.
Health Immediate
All nova-objectstoreservices areunavailable
All nova-objectstoreservices areunavailable,which may beimpacting theability for projectsto managecomputingresources.
Self Metric:Service|Nova:Nova-ObjectStore|Running (%) = 0
1 Restart anycompute servicesthat are down.
2 Check the log filesfor moreinformation aboutwhat caused thefailure.
3 Verify that theEnd PointOperations agentis running on thecontroller.
Health Critical
vRealize Operations Management Pack for OpenStack 5.0
VMware, Inc. 38

Table 6‑2. OpenStack Compute Services Alert Definitions (Continued)
Alert Name Alert Description Symptom Recommendations Impact Severity
One or morenova-schedulerservices areunavailable
One or morenova-schedulerservices areunavailable, andmay be down.
Self Metric:Service|Nova:Nova-Scheduler|Running (%) <100
1 Restart anycompute servicesthat are down.
2 Check the log filesfor moreinformation aboutwhat caused thefailure.
3 Verify that theEnd PointOperations agentis running on thecontroller.
Health Warning
The majority ofnova-schedulerservices areunavailable
The majority ofnova-schedulerservices areunavailable,which may beimpacting theability for projectsto managecomputingresources.
Self Metric:Service|Nova:Nova-Scheduler|Running (%) <=50
1 Restart anycompute servicesthat are down.
2 Check the log filesfor moreinformation aboutwhat caused thefailure.
3 Verify that theEnd PointOperations agentis running on thecontroller.
Health Immediate
All nova-schedulerservices areunavailable
All nova-schedulerservices areunavailable,which may beimpacting theability for projectsto managecomputingresources.
Self Metric:Service|Nova:Nova-Scheduler|Running (%) = 0
1 Restart anycompute servicesthat are down.
2 Check the log filesfor moreinformation aboutwhat caused thefailure.
3 Verify that theEnd PointOperations agentis running on thecontroller.
Health Critical
vRealize Operations Management Pack for OpenStack 5.0
VMware, Inc. 39

Table 6‑2. OpenStack Compute Services Alert Definitions (Continued)
Alert Name Alert Description Symptom Recommendations Impact Severity
One or morenova-xvpvnc-proxy servicesare unavailable
One or morenova-xvpvnc-proxy servicesare unavailable,and may bedown.
Self Metric:Service|Nova:Nova-XvpvncProxy|Running (%) <100
1 Restart anycompute servicesthat are down.
2 Check the log filesfor moreinformation aboutwhat caused thefailure.
3 Verify that theEnd PointOperations agentis running on thecontroller.
Health Warning
The majority ofnova-xvpvnc-proxy servicesare unavailable
The majority ofnova-xvpvnc-proxy servicesare unavailable,which may beimpacting theability for projectsto managecomputingresources.
Self Metric:Service|Nova:Nova-XvpvncProxy|Running (%) <=50
1 Restart anycompute servicesthat are down.
2 Check the log filesfor moreinformation aboutwhat caused thefailure.
3 Verify that theEnd PointOperations agentis running on thecontroller.
Health Immediate
All nova-xvpvnc-proxy servicesare unavailable
All nova-xvpvnc-proxy servicesare unavailable,which may beimpacting theability for projectsto managecomputingresources.
Self Metric:Service|Nova:Nova-XvpvncProxy|Running (%) = 0
1 Restart anycompute servicesthat are down.
2 Check the log filesfor moreinformation aboutwhat caused thefailure.
3 Verify that theEnd PointOperations agentis running on thecontroller.
Health Critical
Cinder Controller Service Alert DefinitionsThe Management Pack for OpenStack provides the following predefined alert definitions for the CinderController Service object type.
vRealize Operations Management Pack for OpenStack 5.0
VMware, Inc. 40

Table 6‑3. Cinder Controller Service Alert Definitions
Alert Name Alert Description Symptom Recommendations Impact Severity
The cinder-apiservice isunavailable
The cinder-apiservice iscurrentlyunavailable, andmay be down.
Self Metric:Cinder-ApiProcess Metrics|AVAILABILITY|ResourceAvailability < 100
1 Restart the cinder-api service.
2 Check the log filesfor moreinformation aboutwhat caused thefailure.
3 Verify that theEnd PointOperations agentis running on thecontroller.
Health Critical
The cinder-scheduler serviceis unavailable
The cinder-scheduler serviceis currentlyunavailable, andmay be down.
Self Metric:Cinder-SchedulerProcess Metrics|AVAILABILITY|ResourceAvailability < 100
1 Restart the cinder-scheduler service.
2 Check the log filesfor moreinformation aboutwhat caused thefailure.
3 Verify that theEnd PointOperations agentis running on thecontroller.
Health Critical
The cinder-volume service isunavailable
The cinder-volume service iscurrentlyunavailable, andmay be down.
Self Metric:Cinder-VolumeProcess Metrics|AVAILABILITY|ResourceAvailability < 100
1 Restart the cinder-volume service.
2 Check the log filesfor moreinformation aboutwhat caused thefailure.
3 Verify that theEnd PointOperations agentis running on thecontroller.
Health Critical
Glance Controller Service Alert DefinitionsThe Management Pack for OpenStack provides the following predefined alert definitions for the GlanceController Service object type.
vRealize Operations Management Pack for OpenStack 5.0
VMware, Inc. 41

Table 6‑4. Glance Controller Service Alert Definitions
Alert Name Alert Definition Symptom Recommendations Impact Severity
The glance-apiservice isunavailable
The glance-apiservice iscurrentlyunavailable, andmay be down.
Self Metric:Glance-ApiProcess Metrics|AVAILABILITY|ResourceAvailability < 100
1 Restart the glance-api service.
2 Check the log filesfor moreinformation aboutwhat caused thefailure.
3 Verify that theEnd PointOperations agentis running on thecontroller.
Health Critical
The glance-registry service isunavailable
The glance-registry service isunavailable, andmay be down.
Self Metric:Glance-RegistryProcess Metrics|AVAILABILITY|ResourceAvailability < 100
1 Restart the glance-registry service.
2 Check the log filesfor moreinformation aboutwhat caused thefailure.
3 Verify that theEnd PointOperations agentis running on thecontroller.
Health Critical
Swift Controller Service Alert DefinitionsThe Management Pack for OpenStack provides the following predefined alert definitions for the SwiftController Service object type.
vRealize Operations Management Pack for OpenStack 5.0
VMware, Inc. 42

Table 6‑5. Swift Controller Service Alert Definitions
Alert Name Alert Description Symptom Recommendations Impact Severity
The swift-proxy-server service isunavailable
The swift-proxy-serverservice is unavailable,and may be down.
Self Metric:Swift-Proxy-Server ProcessMetrics|AVAILABILITY|ResourceAvailability <100
1 Restart the swift-proxy-serverservice.
2 Check the log filesfor moreinformation aboutwhat caused thefailure.
3 Verify that theEnd PointOperations agent isrunning on thecontroller.
Health Critical
The swift-account-serverservice isunavailable
The swift-account-serverservice is unavailable,and may be down.
Self Metric:Swift-Account-Server ProcessMetrics|AVAILABILITY|
ResourceAvailability <100
1 Restart the swift-account-serverservice.
2 Check the log filesfor moreinformation aboutwhat caused thefailure.
3 Verify that theEnd PointOperations agent isrunning on thecontroller.
Health Critical
vRealize Operations Management Pack for OpenStack 5.0
VMware, Inc. 43

Table 6‑5. Swift Controller Service Alert Definitions (Continued)
Alert Name Alert Description Symptom Recommendations Impact Severity
The swift-container-serverservice isunavailable
The swift-container-server service isunavailable, and may bedown.
Self Metric:Swift-Container-Server ProcessMetrics|AVAILABILITY|ResourceAvailability <100
1 Restart the swift-container-serverservice.
2 Check the log filesfor moreinformation aboutwhat caused thefailure.
3 Verify that theEnd PointOperations agent isrunning on thecontroller.
Health Critical
The swift-object-serverservice isunavailable
The swift-object-serverservice is unavailable,and may be down
Self Metric:Swift-Object-Server ProcessMetrics|AVAILABILITY|ResourceAvailability <100
1 Restart the swift-object-serverservice.
2 Check the log filesfor moreinformation aboutwhat caused thefailure.
3 Verify that theEnd PointOperations agent isrunning on thecontroller.
Health Critical
OpenStack Storage Services Alert DefinitionsThe Management Pack for OpenStack provides the following predefined alert definitions for theOpenStack Storage Services object type.
vRealize Operations Management Pack for OpenStack 5.0
VMware, Inc. 44

Table 6‑6. OpenStack Storage Services Alert Definitions
Alert Name Alert Description Symptom Recommendations Impact Severity
One or morecinder-apiservices areunavailable
One or morecinder-apiservices areunavailable, andmay be down.
Self Metric:Service|Cinder:Cinder-Api|Running (%)< 100
1 Restart anystorage servicesthat are down.
2 Check the log filesfor moreinformation aboutwhat caused thefailure.
3 Verify that theEnd PointOperations agentis running on thecontroller.
Health Warning
The majority ofcinder-apiservices areunavailable
The majority ofcinder-apiservices areunavailable,which may beimpacting theability for projectsto managestorageresources.
Self Metric:Service|Cinder:Cinder-Api|Running (%)<= 50
1 Restart anystorage servicesthat are down.
2 Check the log filesfor moreinformation aboutwhat caused thefailure.
3 Verify that theEnd PointOperations agentis running on thecontroller.
Health Immediate
All cinder-apiservices areunavailable
All cinder-apiservices areunavailable,which may beimpacting theability for projectsto managestorageresources.
Self Metric:Service|Cinder:Cinder-Api|Running (%)= 0
1 Restart anystorage servicesthat are down.
2 Check the log filesfor moreinformation aboutwhat caused thefailure.
3 Verify that theEnd PointOperations agentis running on thecontroller.
Health Critical
vRealize Operations Management Pack for OpenStack 5.0
VMware, Inc. 45

Table 6‑6. OpenStack Storage Services Alert Definitions (Continued)
Alert Name Alert Description Symptom Recommendations Impact Severity
One or morecinder-schedulerservices areunavailable
One or morecinder-schedulerservices areunavailable, andmay be down.
Self Metric:Service|Cinder:Cinder-Scheduler|Running (%) <100
1 Restart anystorage servicesthat are down.
2 Check the log filesfor moreinformation aboutwhat caused thefailure.
3 Verify that theEnd PointOperations agentis running on thecontroller.
Health Warning
The majority ofcinder-schedulerservices areunavailable
The majority ofcinder- schedulerservices areunavailable,which may beimpacting theability for projectsto managestorageresources.
Self Metric:Service|Cinder:Cinder-Scheduler|Running (%) <=50
1 Restart anystorage servicesthat are down.
2 Check the log filesfor moreinformation aboutwhat caused thefailure.
3 Verify that theEnd PointOperations agentis running on thecontroller.
Health Immediate
All cinder-schedulerservices areunavailable
All cinder-schedulerservices areunavailable,which may beimpacting theability for projectsto managestorageresources.
Self Metric:Service|Cinder:Cinder-Scheduler|Running (%) = 0
1 Restart anystorage servicesthat are down.
2 Check the log filesfor moreinformation aboutwhat caused thefailure.
3 Verify that theEnd PointOperations agentis running on thecontroller.
Health Critical
vRealize Operations Management Pack for OpenStack 5.0
VMware, Inc. 46

Table 6‑6. OpenStack Storage Services Alert Definitions (Continued)
Alert Name Alert Description Symptom Recommendations Impact Severity
One or morecinder-volumeservices areunavailable
One or morecinder-volumeservices areunavailable, andmay be down.
Self Metric:Service|Cinder:Cinder-Volume|Running(%) < 100
1 Restart anystorage servicesthat are down.
2 Check the log filesfor moreinformation aboutwhat caused thefailure.
3 Verify that theEnd PointOperations agentis running on thecontroller.
Health Warning
The majority ofcinder-volumeservices areunavailable
The majority ofcinder- volumeservices areunavailable,which may beimpacting theability for projectsto managestorageresources.
Self Metric:Service|Cinder:Cinder-Volume|Running(%) <= 50
1 Restart anystorage servicesthat are down.
2 Check the log filesfor moreinformation aboutwhat caused thefailure.
3 Verify that theEnd PointOperations agentis running on thecontroller.
Health Immediate
All cinder-volumeservices areunavailable
All cinder- volumeservices areunavailable,which may beimpacting theability for projectsto managestorageresources.
Self Metric:Service|Cinder:Cinder-Volume|Running(%) = 0
1 Restart anystorage servicesthat are down.
2 Check the log filesfor moreinformation aboutwhat caused thefailure.
3 Verify that theEnd PointOperations agentis running on thecontroller.
Health Critical
vRealize Operations Management Pack for OpenStack 5.0
VMware, Inc. 47

Table 6‑6. OpenStack Storage Services Alert Definitions (Continued)
Alert Name Alert Description Symptom Recommendations Impact Severity
One or moreglance-apiservices areunavailable
One or moreglance-apiservices areunavailable, andmay be down.
Self Metric:Service|Glance:Glance-Api|Running (%)< 100
1 Restart anystorage servicesthat are down.
2 Check the log filesfor moreinformation aboutwhat caused thefailure.
3 Verify that theEnd PointOperations agentis running on thecontroller
Health Warning
The majority ofglance-apiservices areunavailable
The majority ofglance-apiservices areunavailable,which may beimpacting theability for projectsto managestorageresources.
Self Metric:Service|Glance:Glance-Api|Running (%)<= 50
1 Restart anystorage servicesthat are down.
2 Check the log filesfor moreinformation aboutwhat caused thefailure.
3 Verify that theEnd PointOperations agentis running on thecontroller.
Health Immediate
All glance-apiservices areunavailable
All glance-apiservices areunavailable,which may beimpacting theability for projectsto managestorageresources.
Self Metric:Service|Glance:Glance-Api|Running (%)= 0
1 Restart anystorage servicesthat are down.
2 Check the log filesfor moreinformation aboutwhat caused thefailure.
3 Verify that theEnd PointOperations agentis running on thecontroller.
Health Critical
vRealize Operations Management Pack for OpenStack 5.0
VMware, Inc. 48

Table 6‑6. OpenStack Storage Services Alert Definitions (Continued)
Alert Name Alert Description Symptom Recommendations Impact Severity
One or moreglance-registryservices areunavailable
One or moreglance- registryservices areunavailable, andmay be down.
Self Metric:Service|Glance:Glance-Registry|Running(%) < 100
1 Restart anystorage servicesthat are down.
2 Check the log filesfor moreinformation aboutwhat caused thefailure.
3 Verify that theEnd PointOperations agentis running on thecontroller.
Health Warning
The majority ofglance-registryservices areunavailable
The majority ofglance- registryservices areunavailable,which may beimpacting theability for projectsto managestorageresources.
Self Metric:Service|Glance:Glance-Registry|Running(%) <= 50
1 Restart anystorage servicesthat are down.
2 Check the log filesfor moreinformation aboutwhat caused thefailure.
3 Verify that theEnd PointOperations agentis running on thecontroller.
Health Immediate
All glance-registryservices areunavailable
All glance-registry servicesare unavailable,which may beimpacting theability for projectsto managestorageresources.
Self Metric:Service|Glance:Glance-Registry|Running(%) = 0
1 Restart anystorage servicesthat are down.
2 Check the log filesfor moreinformation aboutwhat caused thefailure.
3 Verify that theEnd PointOperations agentis running on thecontroller.
Health Critical
vRealize Operations Management Pack for OpenStack 5.0
VMware, Inc. 49

Table 6‑6. OpenStack Storage Services Alert Definitions (Continued)
Alert Name Alert Description Symptom Recommendations Impact Severity
One or moreswift-account-server servicesare unavailable
One or moreswift-account-server servicesare unavailable,and may bedown.
Self Metric:Service|Swift:Swift-Account-Server|Running (%) <100
1 Restart anystorage servicesthat are down.
2 Check the log filesfor moreinformation aboutwhat caused thefailure.
3 Verify that theEnd PointOperations agentis running on thecontroller.
Health Warning
The majority ofswift-account-server servicesare unavailable
The majority ofswift-account-server servicesare unavailable,which may beimpacting theability for projectsto managestorageresources.
Self Metric:Service|Swift:Swift-Account-Server|Running (%) <=50
1 Restart anystorage servicesthat are down.
2 Check the log filesfor moreinformation aboutwhat caused thefailure.
3 Verify that theEnd PointOperations agentis running on thecontroller.
Health Immediate
All swift-account-server servicesare unavailable
All swift-account-server servicesare unavailable,which may beimpacting theability for projectsto managestorageresources.
Self Metric:Service|Swift:Swift-Account-Server|Running (%) = 0
1 Restart anystorage servicesthat are down.
2 Check the log filesfor moreinformation aboutwhat caused thefailure.
3 Verify that theEnd PointOperations agentis running on thecontroller.
Health Critical
vRealize Operations Management Pack for OpenStack 5.0
VMware, Inc. 50

Table 6‑6. OpenStack Storage Services Alert Definitions (Continued)
Alert Name Alert Description Symptom Recommendations Impact Severity
One or moreswift-container-server servicesare unavailable
One or moreswift- container-server servicesare unavailable,and may bedown.
Self Metric:Service|Swift:Swift-Container-Server|Running (%) <100
1 Restart anystorage servicesthat are down.
2 Check the log filesfor moreinformation aboutwhat caused thefailure.
3 Verify that theEnd PointOperations agentis running on thecontroller.
Health Warning
The majority ofswift-container-server servicesare unavailable
The majority ofswift- container -server servicesare unavailable,which may beimpacting theability for projectsto managestorageresources.
Self Metric:Service|Swift:Swift-Container-Server|Running (%) <=50
1 Restart anystorage servicesthat are down.
2 Check the log filesfor moreinformation aboutwhat caused thefailure.
3 Verify that theEnd PointOperations agentis running on thecontroller.
Health Immediate
All swift-container-serverservices areunavailable
All swift-container-serverservices areunavailable,which may beimpacting theability for projectsto managestorageresources.
Self Metric:Service|Swift:Swift-Container-Server|Running (%) = 0
1 Restart anystorage servicesthat are down.
2 Check the log filesfor moreinformation aboutwhat caused thefailure.
3 Verify that theEnd PointOperations agentis running on thecontroller.
Health Critical
vRealize Operations Management Pack for OpenStack 5.0
VMware, Inc. 51

Table 6‑6. OpenStack Storage Services Alert Definitions (Continued)
Alert Name Alert Description Symptom Recommendations Impact Severity
One or moreswift-object-server servicesare unavailable
One or moreswift-object -server servicesare unavailable,and may bedown.
Self Metric:Service|Swift:Swift-Object-Server|Running (%) <100
1 Restart anystorage servicesthat are down.
2 Check the log filesfor moreinformation aboutwhat caused thefailure.
3 Verify that theEnd PointOperations agentis running on thecontroller.
Health Warning
The majority ofswift-object-server servicesare unavailable
The majority ofswift-object -server servicesare unavailable,which may beimpacting theability for projectsto managestorageresources.
Self Metric:Service|Swift:Swift-Object-Server|Running (%) <=50
1 Restart anystorage servicesthat are down.
2 Check the log filesfor moreinformation aboutwhat caused thefailure.
3 Verify that theEnd PointOperations agentis running on thecontroller.
Health Immediate
All swift-object-server servicesare unavailable
All swift- object -server servicesare unavailable,which may beimpacting theability for projectsto managestorageresources.
Self Metric:Service|Swift:Swift-Object-Server|Running (%) = 0
1 Restart anystorage servicesthat are down.
2 Check the log filesfor moreinformation aboutwhat caused thefailure.
3 Verify that theEnd PointOperations agentis running on thecontroller.
Health Critical
vRealize Operations Management Pack for OpenStack 5.0
VMware, Inc. 52
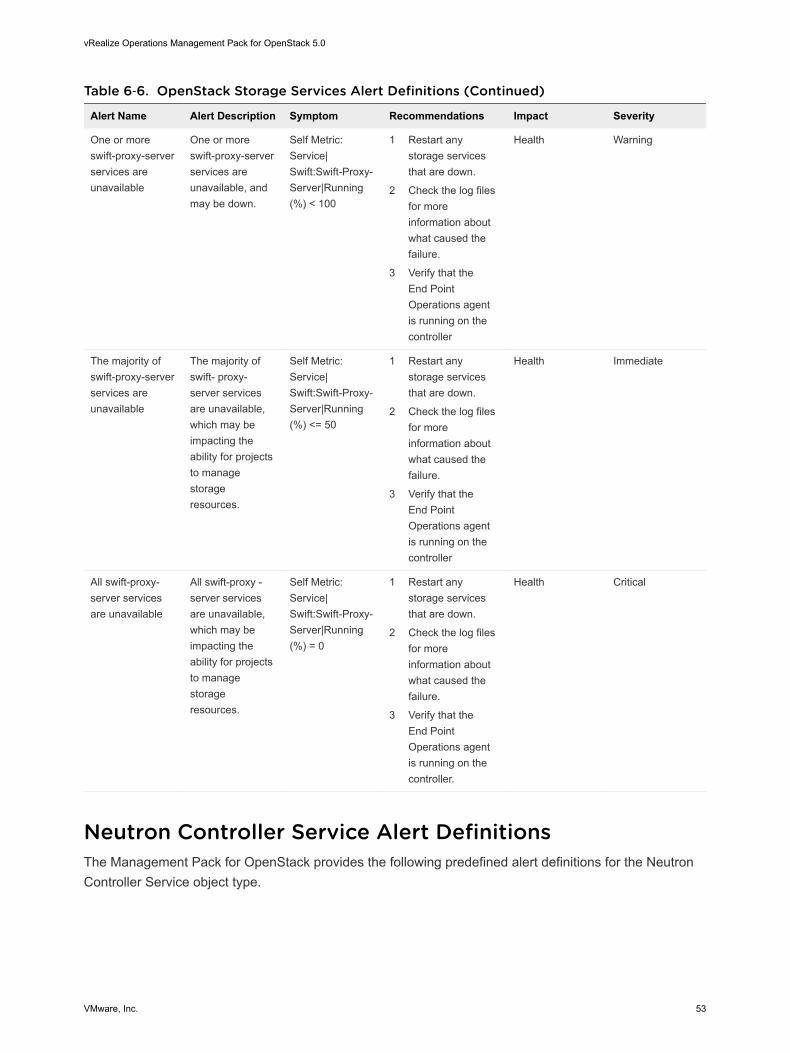
Table 6‑6. OpenStack Storage Services Alert Definitions (Continued)
Alert Name Alert Description Symptom Recommendations Impact Severity
One or moreswift-proxy-serverservices areunavailable
One or moreswift-proxy-serverservices areunavailable, andmay be down.
Self Metric:Service|Swift:Swift-Proxy-Server|Running(%) < 100
1 Restart anystorage servicesthat are down.
2 Check the log filesfor moreinformation aboutwhat caused thefailure.
3 Verify that theEnd PointOperations agentis running on thecontroller
Health Warning
The majority ofswift-proxy-serverservices areunavailable
The majority ofswift- proxy-server servicesare unavailable,which may beimpacting theability for projectsto managestorageresources.
Self Metric:Service|Swift:Swift-Proxy-Server|Running(%) <= 50
1 Restart anystorage servicesthat are down.
2 Check the log filesfor moreinformation aboutwhat caused thefailure.
3 Verify that theEnd PointOperations agentis running on thecontroller
Health Immediate
All swift-proxy-server servicesare unavailable
All swift-proxy -server servicesare unavailable,which may beimpacting theability for projectsto managestorageresources.
Self Metric:Service|Swift:Swift-Proxy-Server|Running(%) = 0
1 Restart anystorage servicesthat are down.
2 Check the log filesfor moreinformation aboutwhat caused thefailure.
3 Verify that theEnd PointOperations agentis running on thecontroller.
Health Critical
Neutron Controller Service Alert DefinitionsThe Management Pack for OpenStack provides the following predefined alert definitions for the NeutronController Service object type.
vRealize Operations Management Pack for OpenStack 5.0
VMware, Inc. 53
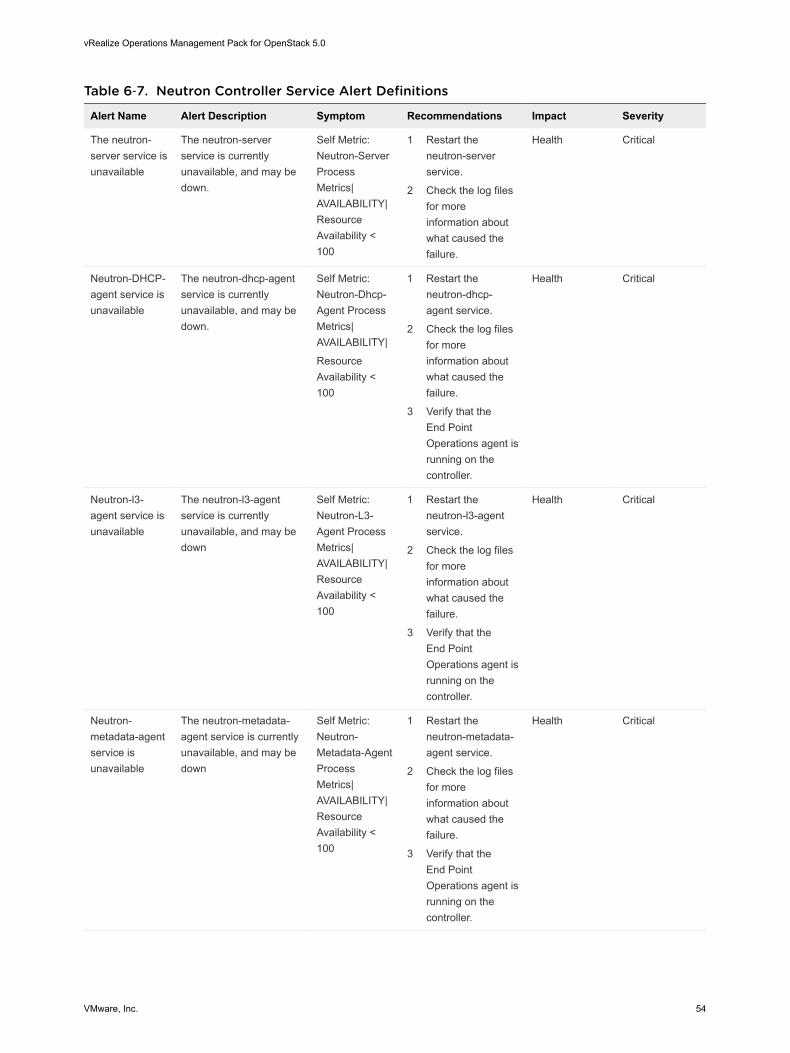
Table 6‑7. Neutron Controller Service Alert Definitions
Alert Name Alert Description Symptom Recommendations Impact Severity
The neutron-server service isunavailable
The neutron-serverservice is currentlyunavailable, and may bedown.
Self Metric:Neutron-ServerProcessMetrics|AVAILABILITY|ResourceAvailability <100
1 Restart theneutron-serverservice.
2 Check the log filesfor moreinformation aboutwhat caused thefailure.
Health Critical
Neutron-DHCP-agent service isunavailable
The neutron-dhcp-agentservice is currentlyunavailable, and may bedown.
Self Metric:Neutron-Dhcp-Agent ProcessMetrics|AVAILABILITY|
ResourceAvailability <100
1 Restart theneutron-dhcp-agent service.
2 Check the log filesfor moreinformation aboutwhat caused thefailure.
3 Verify that theEnd PointOperations agent isrunning on thecontroller.
Health Critical
Neutron-l3-agent service isunavailable
The neutron-l3-agentservice is currentlyunavailable, and may bedown
Self Metric:Neutron-L3-Agent ProcessMetrics|AVAILABILITY|ResourceAvailability <100
1 Restart theneutron-l3-agentservice.
2 Check the log filesfor moreinformation aboutwhat caused thefailure.
3 Verify that theEnd PointOperations agent isrunning on thecontroller.
Health Critical
Neutron-metadata-agentservice isunavailable
The neutron-metadata-agent service is currentlyunavailable, and may bedown
Self Metric:Neutron-Metadata-AgentProcessMetrics|AVAILABILITY|ResourceAvailability <100
1 Restart theneutron-metadata-agent service.
2 Check the log filesfor moreinformation aboutwhat caused thefailure.
3 Verify that theEnd PointOperations agent isrunning on thecontroller.
Health Critical
vRealize Operations Management Pack for OpenStack 5.0
VMware, Inc. 54

Table 6‑7. Neutron Controller Service Alert Definitions (Continued)
Alert Name Alert Description Symptom Recommendations Impact Severity
Neutron-lbaas-agent service isunavailable
The neutron-lbaas-agentservice is currentlyunavailable, and may bedown
Self Metric:Neutron-Lbaas-Agent ProcessMetrics|AVAILABILITY|ResourceAvailability <100
1 Restart theneutron-lbaas-agent service.
2 Check the log filesfor moreinformation aboutwhat caused thefailure.
3 Verify that theEnd PointOperations agent isrunning on thecontroller.
Health Critical
Neutron-openvswitch-agent service isunavailable
The neutron-openvswitch-agentservice is currentlyunavailable, and may bedown
Self Metric:Neutron-Openvswitch-Agent ProcessMetrics|AVAILABILITY|ResourceAvailability <100
1 Restart theneutron-openvswitch-agentservice.
2 Check the log filesfor moreinformation aboutwhat caused thefailure.
3 Verify that theEnd PointOperations agent isrunning on thecontroller.
Health Critical
OpenStack Network Services Alert DefinitionsThe Management Pack for OpenStack provides the following predefined alert definitions for theOpenStack Network Services object type.
vRealize Operations Management Pack for OpenStack 5.0
VMware, Inc. 55

Table 6‑8. OpenStack Network Services Alert Definitions
Alert Name Alert Description Symptom Recommendations Impact Severity
One or moreneutron-serverservices areunavailable
One or more neutron-server services areunavailable, and may bedown.
Self Metric:Service|Neutron:Neutron-Server|Running (%) <100
1 Restart anynetwork servicesthat are down.
2 Check the log filesfor moreinformation aboutwhat caused thefailure.
3 Verify that theEnd PointOperationsagent isrunning on thecontroller.
Health Warning
The majority ofneturon-serverservices areunavailable
The majority of neutron -server services areunavailable, which maybe impacting the abilityfor projects to managenetwork resources.
Self Metric:Service|Neutron:Neutron-Server|Running (%) <=50
1 Restart anynetwork servicesthat are down.
2 Check the log filesfor moreinformation aboutwhat caused thefailure.
3 Verify that theEnd PointOperations agent isrunning on thecontroller.
Health Immediate
All neutron-server servicesare unavailable
All neutron -serverservices are unavailable,which may be impactingthe ability for projects tomanage networkresources.
Self Metric:Service|Neutron:Neutron-Server|Running (%) =0
1 Restart anynetwork servicesthat are down.
2 Check the log filesfor moreinformation aboutwhat caused thefailure.
3 Verify that theEnd PointOperations agent isrunning on thecontroller.
Health Critical
vRealize Operations Management Pack for OpenStack 5.0
VMware, Inc. 56

Table 6‑8. OpenStack Network Services Alert Definitions (Continued)
Alert Name Alert Description Symptom Recommendations Impact Severity
One or moreneutron-DHCP-agent servicesare unavailable
One or more neutron-dhcp-agent areunavailable, and may bedown.
Self Metric:Service|Neutron:Neutron-Dhcp-Agent|Running (%) <100
1 Restart anynetwork servicesthat are down.
2 Check the log filesfor moreinformation aboutwhat caused thefailure.
3 Verify that theEnd PointOperations agent isrunning on thecontroller.
Health Warning
The majority ofneutron-dhcp-agent servicesare unavailable
The majority of neutron-dhcp-agent services areunavailable, which maybe impacting the abilityfor projects to managenetwork resources.
Self Metric:Service|Neutron:Neutron-Dhcp-Agent|Running (%) <=50
1 Restart anynetwork servicesthat are down.
2 Check the log filesfor moreinformation aboutwhat caused thefailure.
3 Verify that theEnd PointOperationsagent isrunning on thecontroller.
Health Immediate
All neutron-dhcp-agentservices areunavailable
All neutron-dhcp-agentservices are unavailable,which may be impactingthe ability for projects tomanage networkresources.
Self Metric:Service|Neutron:Neutron-Dhcp-Agent|Running (%) =0
1 Restart anynetwork servicesthat are down.
2 Check the log filesfor moreinformation aboutwhat caused thefailure.
3 Verify that theEnd PointOperations agent isrunning on thecontroller.
Health Critical
vRealize Operations Management Pack for OpenStack 5.0
VMware, Inc. 57

Table 6‑8. OpenStack Network Services Alert Definitions (Continued)
Alert Name Alert Description Symptom Recommendations Impact Severity
One or moreneutron-l3-agent servicesare unavailable
One or more neutron-l3-agent are unavailable,and may be down.
Self Metric:Service|Neutron:Neutron-L3-Agent|Running (%) <100
1 Restart anynetwork servicesthat are down.
2 Check the log filesfor moreinformation aboutwhat caused thefailure.
3 Verify that theEnd PointOperations agent isrunning on thecontroller.
Health Warning
The majority ofneutron-l3-agent servicesare unavailable
The majority of neutron-l3-agent services areunavailable, which maybe impacting the abilityfor projects to managenetwork resources.
Self Metric:Service|Neutron:Neutron-L3-Agent|Running (%) <=50
1 Restart anynetwork servicesthat are down.
2 Check the log filesfor moreinformation aboutwhat caused thefailure.
3 Verify that theEnd PointOperations agent isrunning on thecontroller.
Health Immediate
All neutron-l3-agent servicesare unavailable
All neutron-l3-agentservices are unavailable,which may be impactingthe ability for projects tomanage networkresources.
Self Metric:Service|Neutron:Neutron-L3-Agent|Running (%) =0
1 Restart anynetwork servicesthat are down.
2 Check the log filesfor moreinformation aboutwhat caused thefailure.
3 Verify that theEnd PointOperationsagent isrunning on thecontroller.
Health Critical
vRealize Operations Management Pack for OpenStack 5.0
VMware, Inc. 58

Table 6‑8. OpenStack Network Services Alert Definitions (Continued)
Alert Name Alert Description Symptom Recommendations Impact Severity
One or moreneutron-metadata-agentservices areunavailable
One or more neutron-metadata-agent areunavailable, and may bedown.
Self Metric:Service|Neutron:Neutron-Metadata-Agent|Running(%) < 100
1 Restart anynetwork servicesthat are down.
2 Check the log filesfor moreinformation aboutwhat caused thefailure.
3 Verify that theEnd PointOperationsagent isrunning on thecontroller.
Health Warning
The majority ofneutron-metadata-agentservices areunavailable
The majority of neutron-metadata-agent servicesare unavailable, whichmay be impacting theability for projects tomanage networkresources.
Self Metric:Service|Neutron:Neutron-Metadata-Agent|Running(%) <= 50
1 Restart anynetwork servicesthat are down.
2 Check the log filesfor moreinformation aboutwhat caused thefailure.
3 Verify that theEnd PointOperations agent isrunning on thecontroller.
Health Immediate
All neutron-metadata-agentservices areunavailable
All neutron-metadata-agent services areunavailable, which maybe impacting the abilityfor projects to managenetwork resources.
Self Metric:Service|Neutron:Neutron-Metadata-Agent|Running(%) = 0
1 Restart anynetwork servicesthat are down.
2 Check the log filesfor moreinformation aboutwhat caused thefailure.
3 Verify that theEnd PointOperationsagent isrunning on thecontroller.
Health Critical
vRealize Operations Management Pack for OpenStack 5.0
VMware, Inc. 59

Table 6‑8. OpenStack Network Services Alert Definitions (Continued)
Alert Name Alert Description Symptom Recommendations Impact Severity
One or moreneutron-lbaas-agent servicesare unavailable
One or more neutron-lbaas-agent areunavailable, and may bedown.
Self Metric:Service|Neutron:Neutron-Lbaas-Agent|Running (%) <100
1 Restart anynetwork servicesthat are down.
2 Check the log filesfor moreinformation aboutwhat caused thefailure.
3 Verify that theEnd PointOperations agent isrunning on thecontroller.
Health Warning
The majority ofneutron-lbaas-agent servicesare unavailable
The majority of neutron-lbaas-agent services areunavailable, which maybe impacting the abilityfor projects to managenetwork resources.
Self Metric:Service|Neutron:Neutron-Lbaas-Agent|Running (%) <=50
1 Restart anynetwork servicesthat are down.
2 Check the log filesfor moreinformation aboutwhat caused thefailure.
3 Verify that theEnd PointOperationsagent isrunning on thecontroller.
Health Immediate
All neutron-lbaas-agentservices areunavailable
All neutron-lbaas-agentservices are unavailable,which may be impactingthe ability for projects tomanage networkresources.
Self Metric:Service|Neutron:Neutron-Lbaas-Agent|Running (%) =0
1 Restart anynetwork servicesthat are down.
2 Check the log filesfor moreinformation aboutwhat caused thefailure.
3 Verify that theEnd PointOperations agent isrunning on thecontroller.
Health Critical
vRealize Operations Management Pack for OpenStack 5.0
VMware, Inc. 60

Table 6‑8. OpenStack Network Services Alert Definitions (Continued)
Alert Name Alert Description Symptom Recommendations Impact Severity
One or moreneutron-openvswitch-agent servicesare unavailable
One or more neutron-openvswitch-agent areunavailable, and may bedown.
Self Metric:Service|Neutron:Neutron-Openvswitch-Agent|Running(%) < 100
1 Restart anynetwork servicesthat are down.
2 Check the log filesfor moreinformation aboutwhat caused thefailure.
3 Verify that theEnd PointOperationsagent isrunning on thecontroller.
Health Warning
The majority ofneutron-openvswitch-agent servicesare unavailable
The majority of neutron-openvswitch-agentservices are unavailable,which may be impactingthe ability for projects tomanage networkresources.
Self Metric:Service|Neutron:Neutron-Openvswitch-Agent|Running(%) <= 50
1 Restart anynetwork servicesthat are down.
2 Check the log filesfor moreinformation aboutwhat caused thefailure.
3 Verify that theEnd PointOperationsagent isrunning on thecontroller.
Health Immediate
All neutron-openvswitch-agent servicesare unavailable
All neutron-openvswitch-agent services areunavailable, which maybe impacting the abilityfor projects to managenetwork resources.
Self Metric:Service|Neutron:Neutron-Openvswitch-Agent|Running(%) = 0
1 Restart anynetwork servicesthat are down.
2 Check the log filesfor moreinformation aboutwhat caused thefailure.
3 Verify that theEnd PointOperations agent isrunning on thecontroller.
Health Critical
KeyStone Controller Service Alert DefinitionsThe Management Pack for OpenStack provides the following predefined alert definitions for the KeyStoneController Service object type.
vRealize Operations Management Pack for OpenStack 5.0
VMware, Inc. 61

Table 6‑9. KeyStone Controller Service Alert Definitions
Alert Name Alert Definition Symptom Recommendations Impact Severity
The keystone-all-service isunavailable
The keystone-allservice iscurrentlyunavailable, andmay be down.
Self Metric:Keystone-AllProcess Metrics|AVAILABILITY|ResourceAvailability < 100
1 Restart thekeystone-allservice.
2 Check the log filesfor moreinformation aboutwhat caused thefailure.
3 Verify that theEnd PointOperations agentis running on thecontroller.
Health Critical
mySQL Alert DefinitionsThe Management Pack for OpenStack provides the following predefined alert definitions for the mySQLobject type.
Table 6‑10. mySQL Alert Definitions
Alert Name Alert Description Symptom Recommendations Impact Severity
The mySQLdatabase serviceis unavailable
The mySQLdatabase serviceis currentlyunavailable, andmay be down.
Self Metric:AVAILABILITY|ResourceAvailability< 100
1 Restart the MySQLDatabase services.
2 Check the log filesfor moreinformation aboutwhat caused thefailure.
3 Verify that theEnd PointOperations agentis running on thecontroller.
Health Critical
Apache Alert DefinitionsThe Management Pack for OpenStack provides the following predefined alert definitions for the Apacheobject type.
vRealize Operations Management Pack for OpenStack 5.0
VMware, Inc. 62

Table 6‑11. Apache Alert Definitions
Alert Name Alert Description Symptom Recommendations Impact Severity
The Apacheserver isunavailable
The Apache service iscurrently unavailable, andmay be down.
Self Metric:AVAILABILITY|ResourceAvailability< 100
1 Restart the Apacheservices.
2 Check the log filesfor moreinformation aboutwhat caused thefailure.
3 Verify that theEnd PointOperations agent isrunning on thecontroller
Health Critical
RabbitMQ Alert DefinitionsThe Management Pack for OpenStack provides the following predefined alert definitions for theRabbitMQ object type.
Table 6‑12. RabbitMQ Alert Definitions
Alert Name Alert Description Symptom Recommendations Impact Severity
The RabbitMessagingservice isunavailable
The Rabbit Messagingservice is currentlyunavailable, and may bedown.
SelfMetric:AVAILABILITY|ResourceAvailability< 100
1 Restart theRabbitMQservices.
2 Check the log filesfor moreinformation aboutwhat caused thefailure.
3 Verify that theEnd PointOperations agent isrunning on thecontroller.
Health Critical
Memcached Alert DefinitionsThe Management Pack for OpenStack provides the following predefined alert definitions for theMemcached object type.
vRealize Operations Management Pack for OpenStack 5.0
VMware, Inc. 63

Table 6‑13. Memcached Alert Definitions
Alert Name Alert Definition Symptom Recommendations Impact Severity
Thememcachedservice isunavailable
The memcached serviceis currently unavailable,and may be down.
Self Metric:AVAILABILITY|ResourceAvailability< 100
1 Restart thememcachedservice.
2 Check the log filesfor moreinformation aboutwhat caused thefailure.
3 Verify that theEnd PointOperations agent isrunning on thecontroller.
Health Critical
OpenStack Management Services Alert DefinitionsThe Management Pack for OpenStack provides the following predefined alert definitions for theOpenStack Management Services object type.
Table 6‑14. OpenStack Management Services Alert Definitions
Alert Name Alert Description Symptom Recommendations Impact Severity
One or morekeystone-allservices areunavailable
One or more keystone-allservices are unavailable,and may be down.
Self Metric:Service|Keystone:Keystone-All|Running(%) < 100
1 Restart anykeystone servicesthat are down.
2 Check the log filesfor moreinformation aboutwhat caused thefailure.
3 Verify that theEnd PointOperations agent isrunning on thecontroller.
Health Warning
The majority ofkeystone-allservices areunavailable
The majority of keystone-all services areunavailable, which maybe impacting the abilityfor projects toauthenticate.
Self Metric:Service|Keystone:Keystone-All|Running(%) <= 50
1 Restart anykeystone servicesthat are down.
2 Check the log filesfor moreinformation aboutwhat caused thefailure.
3 Verify that theEnd PointOperations agent isrunning on thecontroller.
Health Immediate
vRealize Operations Management Pack for OpenStack 5.0
VMware, Inc. 64

Table 6‑14. OpenStack Management Services Alert Definitions (Continued)
Alert Name Alert Description Symptom Recommendations Impact Severity
All keystone-allservices areunavailable
All keystone-all servicesare unavailable, whichmay be impacting theability for projects toauthenticate.
Self Metric:Service|Keystone:Keystone-All|Running(%) = 0
1 Restart anykeystone servicesthat are down.
2 Check the log filesfor moreinformation aboutwhat caused thefailure.
3 Verify that theEnd PointOperations agent isrunning on thecontroller.
Health Critical
One or moremySQLservices areunavailable
One or more MySQLservices are unavailable,and may be down.
Self Metric:Service|MySQL|Running (%) <100
1 Restart anyapplicationservices that aredown.
2 Check the log filesfor moreinformation aboutwhat caused thefailure.
3 Verify that theEnd PointOperations agent isrunning on thecontroller.
Health Warning
The majority ofmySQLservices areunavailable
The majority of MySQLservices are unavailable,which may be impactingthe OpenStackinfrastructure.
Self Metric:Service|MySQL|Running (%) <=50
1 Restart anyapplicationservices that aredown.
2 Check the log filesfor moreinformation aboutwhat caused thefailure.
3 Verify that theEnd PointOperations agent isrunning on thecontroller.
Health Immediate
vRealize Operations Management Pack for OpenStack 5.0
VMware, Inc. 65
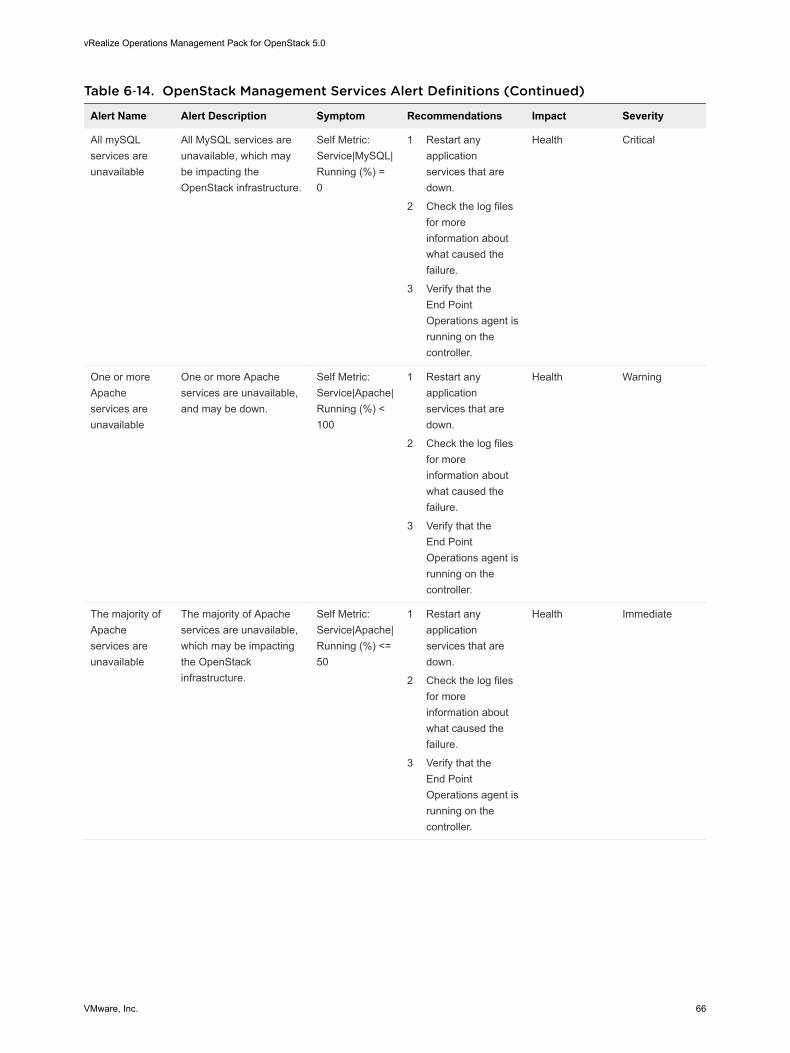
Table 6‑14. OpenStack Management Services Alert Definitions (Continued)
Alert Name Alert Description Symptom Recommendations Impact Severity
All mySQLservices areunavailable
All MySQL services areunavailable, which maybe impacting theOpenStack infrastructure.
Self Metric:Service|MySQL|Running (%) =0
1 Restart anyapplicationservices that aredown.
2 Check the log filesfor moreinformation aboutwhat caused thefailure.
3 Verify that theEnd PointOperations agent isrunning on thecontroller.
Health Critical
One or moreApacheservices areunavailable
One or more Apacheservices are unavailable,and may be down.
Self Metric:Service|Apache|Running (%) <100
1 Restart anyapplicationservices that aredown.
2 Check the log filesfor moreinformation aboutwhat caused thefailure.
3 Verify that theEnd PointOperations agent isrunning on thecontroller.
Health Warning
The majority ofApacheservices areunavailable
The majority of Apacheservices are unavailable,which may be impactingthe OpenStackinfrastructure.
Self Metric:Service|Apache|Running (%) <=50
1 Restart anyapplicationservices that aredown.
2 Check the log filesfor moreinformation aboutwhat caused thefailure.
3 Verify that theEnd PointOperations agent isrunning on thecontroller.
Health Immediate
vRealize Operations Management Pack for OpenStack 5.0
VMware, Inc. 66

Table 6‑14. OpenStack Management Services Alert Definitions (Continued)
Alert Name Alert Description Symptom Recommendations Impact Severity
All Apacheservices areunavailable
All Apache services areunavailable, which maybe impacting theOpenStack infrastructure.
Self Metric:Service|Apache|Running (%) =0
1 Restart anyapplicationservices that aredown.
2 Check the log filesfor moreinformation aboutwhat caused thefailure.
3 Verify that theEnd PointOperations agent isrunning on thecontroller.
Health Critical
One or moreRabbitMQservices areunavailable
One or more RabbitMQservices are unavailable,and may be down.
Self Metric:Service|RabbitMQ|Running (%) <100
1 Restart anyapplicationservices that aredown.
2 Check the log filesfor moreinformation aboutwhat caused thefailure.
3 Verify that theEnd PointOperations agent isrunning on thecontroller.
Health Warning
The majority ofRabbitMQservices areunavailable
The majority of RabbitMQservices are unavailable,which may be impactingthe OpenStackinfrastructure.
Self Metric:Service|RabbitMQ|Running (%) <=50
1 Restart anyapplicationservices that aredown.
2 Check the log filesfor moreinformation aboutwhat caused thefailure.
3 Verify that theEnd PointOperations agent isrunning on thecontroller.
Health Immediate
vRealize Operations Management Pack for OpenStack 5.0
VMware, Inc. 67

Table 6‑14. OpenStack Management Services Alert Definitions (Continued)
Alert Name Alert Description Symptom Recommendations Impact Severity
All RabbitMQservices areunavailable
All RabbitMQ servicesare unavailable, whichmay be impacting theOpenStack infrastructure.
Self Metric:Service|RabbitMQ|Running (%) =0
1 Restart anyapplicationservices that aredown.
2 Check the log filesfor moreinformation aboutwhat caused thefailure.
3 Verify that theEnd PointOperations agent isrunning on thecontroller.
Health Critical
One or moreMemcachedservices areunavailable
One or more Memcachedservices are unavailable,and may be down.
Self Metric:Service|Memcached|Running (%) <100
1 Restart anyapplicationservices that aredown.
2 Check the log filesfor moreinformation aboutwhat caused thefailure.
3 Verify that theEnd PointOperations agent isrunning on thecontroller.
Health Warning
The majority ofMemcachedservices areunavailable
The majority ofMemcached services areunavailable, which maybe impacting theOpenStack infrastructure.
Self Metric:Service|Memcached|Running (%) <=50
1 Restart anyapplicationservices that aredown.
2 Check the log filesfor moreinformation aboutwhat caused thefailure.
3 Verify that theEnd PointOperations agent isrunning on thecontroller.
Health Immediate
vRealize Operations Management Pack for OpenStack 5.0
VMware, Inc. 68

Table 6‑14. OpenStack Management Services Alert Definitions (Continued)
Alert Name Alert Description Symptom Recommendations Impact Severity
All Memcachedservices areunavailable
All Memcached servicesare unavailable, whichmay be impacting theOpenStack infrastructure.
Self Metric:Service|Memcached|Running (%) =0
1 Restart anyapplicationservices that aredown.
2 Check the log filesfor moreinformation aboutwhat caused thefailure.
3 Verify that theEnd PointOperations agent isrunning on thecontroller.
Health Critical
One or moreheat-apiservices areunavailable
One or more heat-apiservices are unavailable,and may be down
Self Metric:Service|Heat:Heat-Api|Running (%) <100
1 Restart any heatservices that aredown.
2 Check the log filesfor moreinformation aboutwhat caused thefailure.
3 Verify that theEnd PointOperations agent isrunning on thecontroller.
Health Warning
The majority ofheat-apiservices areunavailable
The majority of heat-apiservices are unavailable,and may be down
Self Metric:Service|Heat:Heat-Api|Running (%) <=50
1 Restart any heatservices that aredown.
2 Check the log filesfor moreinformation aboutwhat caused thefailure.
3 Verify that theEnd PointOperations agent isrunning on thecontroller.
Health Immediate
vRealize Operations Management Pack for OpenStack 5.0
VMware, Inc. 69

Table 6‑14. OpenStack Management Services Alert Definitions (Continued)
Alert Name Alert Description Symptom Recommendations Impact Severity
All heat-apiservices areunavailable
All heat-api services areunavailable, and may bedown
Self Metric:Service|Heat:Heat-Api|Running (%) =0
1 Restart any heatservices that aredown.
2 Check the log filesfor moreinformation aboutwhat caused thefailure.
3 Verify that theEnd PointOperations agent isrunning on thecontroller.
Health Critical
One or moreheat-api-cfnservices areunavailable
One or more heat-api-cfnare unavailable, and maybe down
Self Metric:Service|Heat:Heat-Api-Cfn|Running(%) < 100
1 Restart any heatservices that aredown.
2 Check the log filesfor moreinformation aboutwhat caused thefailure.
3 Verify that theEnd PointOperations agent isrunning on thecontroller.
Health Warning
The majority ofheat-api-cfnservices areunavailable
The majority of heat-api-cfn services areunavailable, and may bedown
Self Metric:Service|Heat:Heat-Api-Cfn|Running(%) <= 50
1 Restart any heatservices that aredown.
2 Check the log filesfor moreinformation aboutwhat caused thefailure.
3 Verify that theEnd PointOperations agent isrunning on thecontroller.
Health Immediate
vRealize Operations Management Pack for OpenStack 5.0
VMware, Inc. 70

Table 6‑14. OpenStack Management Services Alert Definitions (Continued)
Alert Name Alert Description Symptom Recommendations Impact Severity
All heat-api-cfnservices areunavailable
All heat-api-cfn servicesare unavailable, and maybe down
Self Metric:Service|Heat:Heat-Api-Cfn|Running(%) = 0
1 Restart any heatservices that aredown.
2 Check the log filesfor moreinformation aboutwhat caused thefailure.
3 Verify that theEnd PointOperations agent isrunning on thecontroller.
Health Critical
One or moreheat-engineservices areunavailable
One or more heat-engineare unavailable, and maybe down
Self Metric:Service|Heat:Heat-Engine|Running(%) < 100
1 Restart any heatservices that aredown.
2 Check the log filesfor moreinformation aboutwhat caused thefailure.
3 Verify that theEnd PointOperations agent isrunning on thecontroller.
Health Warning
The majority ofheat-engineservices areunavailable
The majority of heat-engine services areunavailable, and may bedown
Self Metric:Service|Heat:Heat-Engine|Running(%) <= 50
1 Restart any heatservices that aredown.
2 Check the log filesfor moreinformation aboutwhat caused thefailure.
3 Verify that theEnd PointOperations agent isrunning on thecontroller.
Health Immediate
vRealize Operations Management Pack for OpenStack 5.0
VMware, Inc. 71

Table 6‑14. OpenStack Management Services Alert Definitions (Continued)
Alert Name Alert Description Symptom Recommendations Impact Severity
All heat-engineservices areunavailable
All heat-engine servicesare unavailable, and maybe down
Self Metric:Service|Heat:Heat-Engine|Running(%) = 0
1 Restart any heatservices that aredown.
2 Check the log filesfor moreinformation aboutwhat caused thefailure.
3 Verify that theEnd PointOperations agent isrunning on thecontroller.
Health Critical
One or moreheat-api-cloudwatchservices areunavailable
One or more heat-api-cloudwatch areunavailable, and may bedown
Self Metric:Service|Heat:Heat-Api-Cloudwatch|Running (%) <100
1 Restart any heatservices that aredown.
2 Check the log filesfor moreinformation aboutwhat caused thefailure.
3 Verify that theEnd PointOperations agent isrunning on thecontroller.
Health Warning
The majority ofheat-api-cloudwatchservices areunavailable
The majority of heat-api-cloudwatch services areunavailable, and may bedown
Self Metric:Service|Heat:Heat-Api-Cloudwatch|Running (%) <=50
1 Restart any heatservices that aredown.
2 Check the log filesfor moreinformation aboutwhat caused thefailure.
3 Verify that theEnd PointOperationss agentis running on thecontroller.
Health Immediate
vRealize Operations Management Pack for OpenStack 5.0
VMware, Inc. 72

Table 6‑14. OpenStack Management Services Alert Definitions (Continued)
Alert Name Alert Description Symptom Recommendations Impact Severity
All heat-api-cloudwatchservices areunavailable
All heat-api-cloudwatchservices are unavailable,and may be down
Self Metric:Service|Heat:Heat-Api-Cloudwatch|Running (%) =0
1 Restart any heatservices that aredown.
2 Check the log filesfor moreinformation aboutwhat caused thefailure.
3 Verify that theEnd PointOperations agent isrunning on thecontroller.
Health Critical
One or morejarvis servicesare unavailable
One or more jarvis areunavailable, and may bedown
Self Metric:Service|OMS:Jarvis|Running (%) <100
1 Restart anymanagementservices that aredown.
2 Check the log filesfor moreinformation aboutwhat caused thefailure.
3 Verify thattheEnd PointOperations agent isrunning on thecontroller.
Health Warning
The majority ofjarvis servicesare unavailable
The majority of jarvisservices are unavailable,and may be down
Self Metric:Service|OMS:Jarvis|Running (%) <=50
1 Restart anymanagementservices that aredown.
2 Check the log filesfor moreinformation aboutwhat caused thefailure.
3 Verify that theEnd PointOperations agent isrunning on thecontroller.
Health Immediate
vRealize Operations Management Pack for OpenStack 5.0
VMware, Inc. 73

Table 6‑14. OpenStack Management Services Alert Definitions (Continued)
Alert Name Alert Description Symptom Recommendations Impact Severity
All jarvisservices areunavailable
All jarvis services areunavailable, and may bedown
Self Metric:Service|OMS:Jarvis|Running (%) =0
1 Restart anymanagementservices that aredown.
2 Check the log filesfor moreinformation aboutwhat caused thefailure.
3 Verify that theEnd PointOperations agent isrunning on thecontroller.
Health Critical
One or morevPostGresservices areunavailable
One or more vPostGresservices are unavailable,and may be down
Self Metric:Service|vPostgres|Running (%) <100
1 Restart anyvpostgres servicesthat are down.
2 Check the log filesfor moreinformation aboutwhat caused thefailure.
3 Verify that theEnd PointOperations agent isrunning on thecontroller.
Health Warning
The majority ofvPostGresservices areunavailable
The majority ofvPostGres services areunavailable, which maybe impacting theOpenStack infrastructure
Self Metric:Service|vPostgres|Running (%) <=50
1 Restart anyvpostgres servicesthat are down.
2 Check the log filesfor moreinformation aboutwhat caused thefailure.
3 Verify that theEnd PointOperations agent isrunning on thecontroller.
Health Immediate
vRealize Operations Management Pack for OpenStack 5.0
VMware, Inc. 74

Table 6‑14. OpenStack Management Services Alert Definitions (Continued)
Alert Name Alert Description Symptom Recommendations Impact Severity
All vPostGresservices areunavailable
All vPostGres servicesare unavailable, whichmay be impacting theOpenStack infrastructure
Self Metric:Service|vPostgres|Running (%) =0
1 Restart anyvpostgres servicesthat are down.
2 Check the log filesfor moreinformation aboutwhat caused thefailure.
3 Verify that theEnd PointOperations agent isrunning on thecontroller.
Health Critical
One or more tc-oms servicesare unavailable
One or more tc-omsservices are unavailable,and may be down
Self Metric:Service|OMS:Tc-Oms|Running (%) <100
1 Restart anymanagementservices that aredown.
2 Check the log filesfor moreinformation aboutwhat caused thefailure.
3 Verify that theEnd PointOperations agent isrunning on thecontroller.
Health Warning
vRealize Operations Management Pack for OpenStack 5.0
VMware, Inc. 75
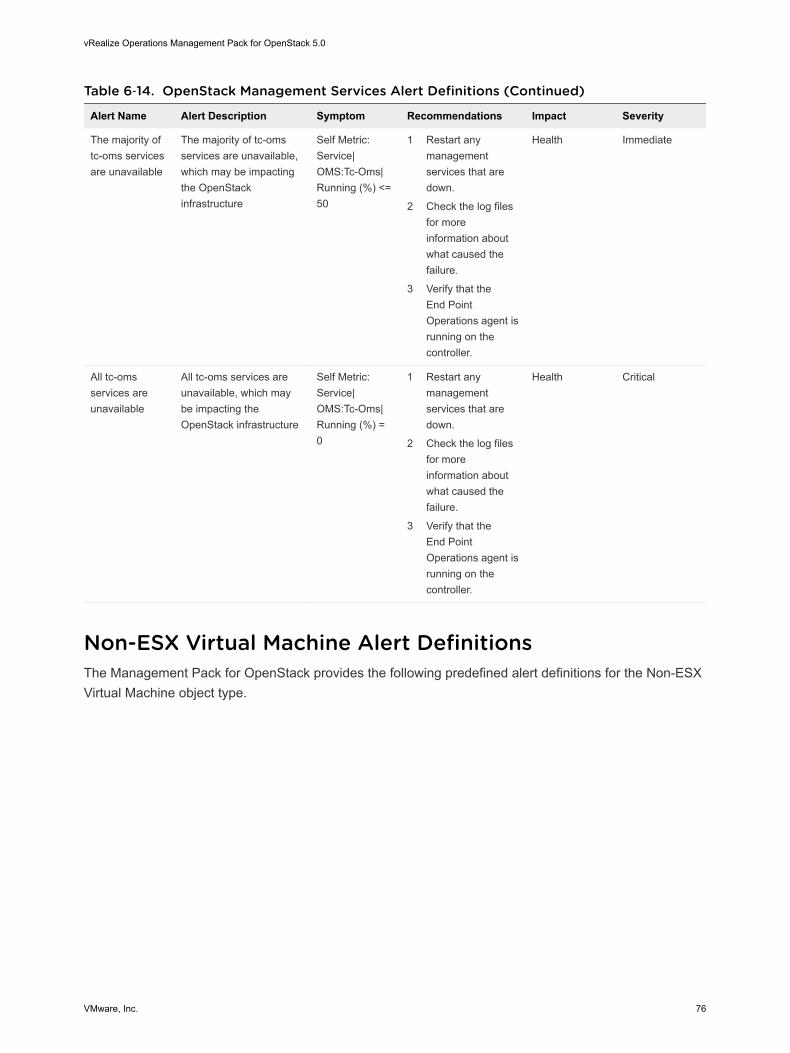
Table 6‑14. OpenStack Management Services Alert Definitions (Continued)
Alert Name Alert Description Symptom Recommendations Impact Severity
The majority oftc-oms servicesare unavailable
The majority of tc-omsservices are unavailable,which may be impactingthe OpenStackinfrastructure
Self Metric:Service|OMS:Tc-Oms|Running (%) <=50
1 Restart anymanagementservices that aredown.
2 Check the log filesfor moreinformation aboutwhat caused thefailure.
3 Verify that theEnd PointOperations agent isrunning on thecontroller.
Health Immediate
All tc-omsservices areunavailable
All tc-oms services areunavailable, which maybe impacting theOpenStack infrastructure
Self Metric:Service|OMS:Tc-Oms|Running (%) =0
1 Restart anymanagementservices that aredown.
2 Check the log filesfor moreinformation aboutwhat caused thefailure.
3 Verify that theEnd PointOperations agent isrunning on thecontroller.
Health Critical
Non-ESX Virtual Machine Alert DefinitionsThe Management Pack for OpenStack provides the following predefined alert definitions for the Non-ESXVirtual Machine object type.
vRealize Operations Management Pack for OpenStack 5.0
VMware, Inc. 76

Table 6‑15. Non-ESX Virtual Machine Alert Definitions
Alert Name Alert Description Symptom Recommendations Impact Severity
Virtual Machineis reporting anerror status
The virtual machine isreporting an error status,and may not be availablefor use.
Self Metric:Status|Availability < 1
1 Restart the VirtualMachine.
2 Verify that thenetworkconfiguration onthe Virtual Machineis correct.
3 Check the log filesfor moreinformation aboutis causing thefailure.
Health Critical
OpenStack Logical Switch Alert DefinitionsThe Management Pack for OpenStack provides the following predefined alert definitions for theOpenStack Logical Switch object type.
Table 6‑16. OpenStack Logical Switch Alert Definitions
Alert Name Alert Description Symptom Recommendations Impact Severity
Logical Switch isreporting an errorstatus
The LogicalSwitch isreporting an errorstatus, and maynot be availablefor use.
Self Metric:Status|Availability< 1
1 Verify that theconfiguration onthe Logical Switchis correct.
2 Check the log filesfor moreinformation aboutis causing thefailure.
Health Critical
One or moreports on theLogical Switchare down
One or moreports on theLogical Switchare reporting adown state, whichmay be impactingnetworkconnectivity forproject virtualmachines.
Self Metric: Port|Status = DOWN
1 Verify that theconfiguration onthe Logical Switchis correct.
2 Verify that there isphysical networkconnectivity for thislogical network.
3 Check the log filesfor moreinformation aboutis causing thefailure.
Health Critical
OpenStack External Logical Switch Alert DefinitionsThe Management Pack for OpenStack provides the following predefined alert definitions for theOpenStack External Logical Switch object type.
vRealize Operations Management Pack for OpenStack 5.0
VMware, Inc. 77

Table 6‑17. OpenStack External Logical Switch Alert Definitions
Alert Name Alert Description Symptom Recommendations Impact Severity
External LogicalSwitch isreporting anerror status
The Exernal LogicalSwitch is reporting anerror status, and may notbe available for use.
Self Metric:Status|Availability < 1
1 Verify that theconfiguration onthe ExternalLogical Switch iscorrect.
2 Check the log filesfor moreinformation aboutwhat is causing thefailure.
Health Critical
One or moreports on theexternal LogicalSwitch aredown
One or more ports on theExternal Logical Switchare reporting a downstate, which may beimpacting networkconnectivity for projectvirtual machines.
Self Metric:Port|Status =DOWN
1 Verify that theconfiguration onthe ExternalLogical Switch iscorrect.
2 Verify that there isphysical networkconnectivity for thislogical network.
3 Check the log filesfor moreinformation aboutwhat is causing thefailure.
Health Critical
OpenStack Logical Router Alert DefinitionsThe Management Pack for OpenStack provides the following predefined alert definitions for theOpenStack Logical Router object type.
vRealize Operations Management Pack for OpenStack 5.0
VMware, Inc. 78

Table 6‑18. OpenStack Logical Router Alert Definitions
Alert Name Alert Description Symptom Recommendations Impact Severity
Logical Routeris reporting anerror status
The Logical Router isreporting an error status,and may not be availablefor use.
Self Metric:Status|Availability < 1
1 Verify that theconfiguration onthe Logical Routeris correct.
2 Check the log filesfor moreinformation aboutis causing thefailure.
Health Critical
One or moreports on theLogical Routerare down
One or more ports on theLogical Router arereporting a down state,which may be impactingnetwork connectivity forproject virtual machines.
Self Metric:Port|Status =DOWN
1 Verify that theconfiguration onthe Logical Routeris correct.
2 Verify that there isphysical networkconnectivity for thislogical network.
3 Check the log filesfor moreinformation aboutis causing thefailure.
Health Critical
OpenStack Project Alert DefinitionsThe Management Pack for OpenStack provides the following predefined alert definitions for theOpenStack Project object type.
vRealize Operations Management Pack for OpenStack 5.0
VMware, Inc. 79

Table 6‑19. OpenStack Project Alert Definitions
Alert Name Alert Description SymptomRecommendations Impact Severity
One or moreprovisionedresources arereporting an errorstatus
One or moreprovisionedresources arereporting an errorstatus, and maynot be available foruse.
Child (VirtualMachine) Metric:Status|Availability< 1
Child (LogicalSwitch) Metric:Status|Availability< 1
Child (ExternalLogical Switch)Metric: Status|Availability < 1
Child (LogicalRouter) Metric:Status|Availability< 1
1 If the resourceis a VirtualMachine,restart theVirtualMachine.
2 Verify that theconfigurationon theresource iscorrect.
3 Check the logfiles for moreinformationabout iscausing thefailure.
Health Critical
Project is currentlydisabled
The Project iscurrently disabled,and is unable toprovision anyresources.
Self Metric: Status|Availability < 1
Enable the Projectfor public access.
Health Warning
vRealize Operations Management Pack for OpenStack 5.0
VMware, Inc. 80

Table 6‑19. OpenStack Project Alert Definitions (Continued)
Alert Name Alert Description SymptomRecommendations Impact Severity
Project resourcecreation rate ishigh
The Projectresource creationrate is abnormallyhigh.
Self Metric:Network|TotalNetworks abovedynamic threshold
Self Metric:Network|TotalRouters abovedynamic threshold
Self Metric:Instance|Usageabove dynamicthreshold
Investigatenetwork, routerand virtualmachine creationfor Project todetermine ifincrease isexpected.
Risk Warning
Project isapproaching theirquota
The Project isapproaching theirquota, which mayimpact their abilityto provisionadditionalresources.
Warning -n Self Metric:
Instance|Usage (%)>=85
n Self Metric:CPU|Usage(%)>= 85
n Self Metric:Memory|Usage (%)>=85
n Self Metric:Floating IP|Usage (%)>=85
n Self Metric:SecurityGroup|Usage(%)>= 85
Immediate -n Self Metric:
Instance|Usage (%)>=90
n Self Metric:CPU|Usage(%)>= 90
n Self Metric:Memory|Usage (%)>=90
n Self Metric:Floating IP|Usage (%)>=90
Increase the quotafor this Project.
Risk 1 Warning
2 Immediate
3 Critical
vRealize Operations Management Pack for OpenStack 5.0
VMware, Inc. 81

Table 6‑19. OpenStack Project Alert Definitions (Continued)
Alert Name Alert Description SymptomRecommendations Impact Severity
n Self Metric:SecurityGroup|Usage(%)>= 90
Critical -n Self Metric:
Instance|Usage (%)>=95
n Self Metric:CPU|Usage(%)>= 95
n Self Metric:Memory|Usage (%) >=95
n Self Metric:Floating IP|Usage (%)>=95
n Self Metric:SecurityGroup|Usage(%)>= 95
OpenStack Compute Infrastructure Alert DefinitionsThe Management Pack for OpenStack provides the following predefined alert definitions for theOpenStack Compute Infrastructure object type.
vRealize Operations Management Pack for OpenStack 5.0
VMware, Inc. 82

Table 6‑20. OpenStack Compute Infrastructure Alert Definitions
Alert Name Alert Description Symptom Recommendations Impact Severity
Computeinfrastructure isapproachingcapacity
The computeinfrastructure isapproaching capacity,which may impact theability for projects toprovision resources.
Warning -n Self Metric:
Memory|Demand(%)<= 70
n SelfMetric :DiskSpace|Usage(%)<= 70
Immediate -n Self Metric:
Memory|Demand(%)<= 80
n Self Metric:Disk Space|Usage(%)<= 80
Critical -n Self Metric:
Memory|Demand(%)<= 90
n Self Metric:Disk Space|Usage(%)<= 90
1 Register additionalhosts withOpenStack.
2 Add additionalmemory or disksto the hosts.
3 Remove anyvirtual machinesthat are no longerneeded.
Risk 1 Warning
2 Immediate
3 Critical
Host System Alert DefinitionsThe Management Pack for OpenStack provides the following predefined alert definitions for the HostSystem object type.
vRealize Operations Management Pack for OpenStack 5.0
VMware, Inc. 83

Table 6‑21. Host System Alert Definitions
Alert Name Alert Definition Symptom Recommendations Impact Severity
Host isapproachingcapacity
The host system isapproaching capacity,which may prevent theprovisioning of additionalvirtual machines.
Warning -n Self Metric:
Memory|Usage(%)<= 85
n SelfMetric :DiskSpace|Demand|Workload(%)<= 85
Immediate -n Self Metric:
Memory|Usage(%)<= 90
n Self Metric:Disk Space|Demand|Workload(%)<= 90
Critical -n Self Metric:
Memory|Usage(%)<= 95
n Self Metric:Disk Space|Demand|Workload(%)<= 95
1 Add additionalmemory or disks tothe host.
2 Remove any virtualmachines that areno longer needed.
Risk 1 Warning
2 Immediate
3 Critical
Non-ESX Host System Alert DefinitionsThe Management Pack for OpenStack provides the following predefined alert definitions for the Non-ESXHost System object type.
vRealize Operations Management Pack for OpenStack 5.0
VMware, Inc. 84

Table 6‑22. Non-ESX Host System Alert Definitions
Alert Name Alert Description Symptom Recommendations Impact Severity
Host isapproachingcapacity
The host system isapproaching capacitywhich may prevent theprovisioning of additionalvirtual machines.
Warning -n Self Metric:
Memory|Usage(%)<= 85
n SelfMetric :Disk|Usage(%)<= 85
Immediate -n Self Metric:
Memory|Usage(%)<= 90
n Self Metric:Disk|Usage(%)<= 90
Critical -n Self Metric:
Memory|Usage(%)<= 95
n Self Metric:Disk|Usage(%)<= 95
1 Add additionalmemory or disks tothe host.
2 Remove any virtualmachines that areno longer needed.
Risk 1 Warning
2 Immediate
3 Critical
OpenStack Storage Infrastructure Alert DefinitionsThe Management Pack for OpenStack provides the following predefined alert definitions for theOpenStack Storage Infrastructure object type.
vRealize Operations Management Pack for OpenStack 5.0
VMware, Inc. 85

Table 6‑23. OpenStack Storage Infrastructure Alert Definitions
Alert Name Alert Description Symptom Recommendations Impact Severity
Storageinfrastructure isapproachingcapacity
The Storageinfrastructure isapproaching capacity,which may impact theability for projects toprovision resources
n Warning -Self Metric:Capacity|Usage(%)<= 70
n Immediate -Self Metric:Capacity|Usage(%)<= 80
n Critical -Self Metric:Capacity|Usage(%)<= 90
1 Add additional datastores to thevCenter cluster.
2 Remove any virtualmachines that areno longer needed.
Risk 1 Warning
2 Immediate
3 Critical
vPostgres Alert DefinitionsThe Management Pack for OpenStack provides the following predefined alert definitions for the vPostgresobject type.
Table 6‑24. vPostgres Alert Definitions
Alert Name Alert Description SymptomRecommendations Impact Severity
The vpostgresservice isunavailable
The vpostgresservice is currentlyunavailable, andmay be down
Self Metric:AVAILABILITY|ResourceAvailability < 100
1 Restart thevpostgresservice that aredown.
2 Check the logfiles for moreinformationabout whatcaused thefailure.
3 Verify that theEnd PointOperationsagent isrunning on thecontroller.
Health Critical
Heat Controller Service Alert DefinitionsThe Management Pack for OpenStack provides the following predefined alert definitions for the HeatController object type.
vRealize Operations Management Pack for OpenStack 5.0
VMware, Inc. 86

Table 6‑25. Heat Controller Service Alert Definitions
Alert Name Alert Description SymptomRecommendations Impact Severity
The heat-apiservice isunavailable
The heat-apiservice iscurrentlyunavailable, andmay be down.
Self Metric: Heat-Api ProcessMetrics|AVAILABILITY|ResourceAvailability < 100
1 Restart theheat-apiservice.
2 Check the logfiles for moreinformationabout whatcaused thefailure.
3 Verify that theEnd PointOperationsagent isrunning onthe controller.
Health Critical
The heat-api-cfnservice isunavailable
The heat-api-cfnservice iscurrentlyunavailable, andmay be down.
Self Metric: Heat-Api-Cfn ProcessMetrics|AVAILABILITY|ResourceAvailability < 100
1 Restart theheat-api-cfnservice.
2 Check the logfiles for moreinformationabout whatcaused thefailure.
3 Verify that theEnd PointOperationsagent isrunning onthe controller.
Health Critical
vRealize Operations Management Pack for OpenStack 5.0
VMware, Inc. 87

Table 6‑25. Heat Controller Service Alert Definitions (Continued)
Alert Name Alert Description SymptomRecommendations Impact Severity
The heat-engineservice isunavailable
The heat-engineservice iscurrentlyunavailable, andmay be down
Self Metric: Heat-Engine ProcessMetrics|AVAILABILITY|ResourceAvailability < 100
1 Restart theheat-engineservice.
2 Check the logfiles for moreinformationabout whatcaused thefailure.
3 Verify that theEnd PointOperationsagent isrunning onthe controller.
Health Critical
The heat-api-cloudwatchservice isunavailable
The heat-api-cloudwatchservice iscurrentlyunavailable, andmay be down
Self Metric: Heat-Api-CloudwatchProcess Metrics|AVAILABILITY|ResourceAvailability < 100
1 Restart theheat-api-cloudwatchservice.
2 Check the logfiles for moreinformationabout whatcaused thefailure.
3 Verify that theEnd PointOperationsagent isrunning onthe controller.
Health Critical
VMware Integrated OpenStack Management Server AlertDefinitionsThe Management Pack for OpenStack provides the following predefined alert definitions for the VMwareIntegrated OpenStack Management Server object type.
vRealize Operations Management Pack for OpenStack 5.0
VMware, Inc. 88

Table 6‑26. VMware Integrated OpenStack Management Server Alert Definitions
Alert Name Alert Description SymptomRecommendations Impact Severity
The jarvis serviceis unavailable
The jarvis serviceis currentlyunavailable, andmay be down
Self Metric: JarvisProcess Metrics|AVAILABILITY|ResourceAvailability < 100
1 Restart thejarvis service.
2 Check the logfiles for moreinformationabout whatcaused thefailure.
3 Verify that theEnd PointOperationsagent isrunning on thecontroller
Health Critical
The tc-oms serviceis unavailable
The tc-oms serviceis currentlyunavailable, andmay be down.
Self Metric: Tc-Oms ProcessMetrics|AVAILABILITY|ResourceAvailability < 100
1 Restart the tc-oms service.
2 Check the logfiles for moreinformationabout whatcaused thefailure.
3 Verify that theEnd PointOperationsagent isrunning on thecontroller.
Health Critical
The tc-osvmwservice isunavailable
The tc-osvmwservice is currentlyunavailable, andmay be down.
Self Metric: Tc-Osvmw ProcessMetrics|AVAILABILITY|ResourceAvailability < 100
1 Restart the tc-osvmwservice.
2 Check the logfiles for moreinformationabout whatcaused thefailure.
3 Verify that theEnd PointOperationsagent isrunning on thecontroller.
Health Critical
vRealize Operations Management Pack for OpenStack 5.0
VMware, Inc. 89

Management Pack forOpenStack Objects and Metrics 7The Management Pack for OpenStack collects metrics for OpenStack objects.
Metrics have not been defined for the following objects.n OpenStackNetwork Infrastructure
This chapter includes the following topics:n OpenStack Compute Infrastructure
n OpenStack Storage Infrastructure
n OpenStack Compute Services
n OpenStack Network Services
n OpenStack Storage Services
n OpenStack Management Services
n OpenStack Project
n OpenStack Logical Switch
n OpenStack Logical Router
n OpenStack External Logical Switch
n Non-ESX Host System
n Non-ESX Virtual Machine
OpenStack Compute InfrastructureThe Management Pack for OpenStack collects metrics for the OpenStack Compute Infrastructure.
VMware, Inc. 90

Table 7‑1. OpenStack Compute Infrastructure Metrics
Name Category Type Unit Description Instanced
ProvisionedCapacity
Memory Metric GB Total physicalmemory capacityof all Hostsregistered withOpenStack.
No
Usable Capacity Memory Metric GB Total physicalmemory capacityof all Hostsregistered withOpenStack, minusthe memoryoverhead.
No
Usage Memory Metric GB Total amount ofphysical memorybeing used acrossall Hostsregistered withOpenStack.
No
Usage Memory Metric % Percentage ofphysical memorybeing used acrossall Hostsregistered withOpenStack
No
Demand Memory Metric GB Total amount ofphysical memorybeing demandedacross all Hostsregistered withOpenStack
No
Demand Memory Metric % Percentage ofphysical memorybeing demandedacross all Hostsregistered withOpenStack
No
OpenStackInstance Usage
Memory Metric GB Total amount ofphysical amountmemory beingused byOpenStackinstances acrossall hosts registeredwith OpenStack.
No
vRealize Operations Management Pack for OpenStack 5.0
VMware, Inc. 91

Table 7‑1. OpenStack Compute Infrastructure Metrics (Continued)
Name Category Type Unit Description Instanced
OpenStackInstance Usage
Memory Metric % Percentage ofphysical memorybeing used byOpenStackinstances acrossall hosts registeredwith OpenStack.
No
ProvisionedCapacity
Disk Space Metric GB Total disk spacecapacity of allHosts registeredwith OpenStack
No
Usage Disk Space Metric GB Total amount ofdisk space beingused across allHosts registeredwith OpenStack
No
Usage Disk Space Metric % Percentage of diskspace being usedacross all Hostsregistered withOpenStack
No
OpenStackInstance Usage
Disk Space Metric GB Total amount ofdisk space beingused byOpenStackinstances acrossall hosts registeredwith OpenStack
No
OpenStackinstance Usage
Disk Space Metric % Percentage of diskspace being usedby OpenStackinstances acrossall Hostsregistered withOpenStack
No
Logical Processors CPU Metric Integer Number of logicalprocessors on allHosts registeredwith OpenStack
No
vRealize Operations Management Pack for OpenStack 5.0
VMware, Inc. 92

Table 7‑1. OpenStack Compute Infrastructure Metrics (Continued)
Name Category Type Unit Description Instanced
Number of VirtualCPUs in Use
CPU Metric Integer Number of vCPUsprovisioned acrossall Hostsregistered withOpenStack
No
OpenStackInstance Usage
CPU Metric Integer Number of vCPUsprovisioned byOpenStackinstance across allHosts registeredwith OpenStack
No
OpenStack Storage InfrastructureThe Management Pack for OpenStack collects metrics for the OpenStack Storage Infrastructure.
Table 7‑2. OpenStack Storage Infrastructure Metrics
Name Category Type Unit Description Instanced
Total Capacity Capacity Metric GB Total disk spacecapacity across allvCenterDatastoresregistered withOpenStack.
No
Used Space Capacity Metric GB Total amount ofdisk space beingused across allvCenterDatastoresregistered withOpenStack.
No
Usage Capacity Metric % Percentage of diskspace being usedacross all vCenterDatastoresregistered withOpenStack.
No
Outstanding IORequests
Datastore Metric OIOs Total number ofoutstanding I/Orequests across allvCenterDatastoresregistered withOpenStack.
No
vRealize Operations Management Pack for OpenStack 5.0
VMware, Inc. 93

Table 7‑2. OpenStack Storage Infrastructure Metrics (Continued)
Name Category Type Unit Description Instanced
Max ObservedNumber ofOutstanding IOOperations
Datastore Metric OIOs Maximumobserved numberof I/O requestsacross all vCenterDatastoresregistered withOpenStack.
No
Reads per Second Datastore Metric IOPs Total rate of readcommands issuedacross all vCenterDatastoresregistered withOpenStack.
No
Max ObservedReads per Second
Datastore Metric IOPS Maximumobserved rate ofread commandsissued across allvCenterDatastoresregistered withOpenStack.
No
Writes per Second Datastore Metric IOPS Total rate of writecommands issuedacross all vCenterDatastoresregistered withOpenStack.
No
Max ObservedWrites per Second
Datastore Metric IOPS Maximumobserved rate ofwrite commandsissued across allvCenterDatastoresregistered withOpenStack.
No
Read Rate Datastore Metric KBps Total rate of dataread across allvCenterDatastoresregistered withOpenStack.
No
Max ObservedRead Rate
Datastore Metric KBps Maximumobserved rate ofdata read acrossall vCenterDatastoresregistered withOpenStack.
No
vRealize Operations Management Pack for OpenStack 5.0
VMware, Inc. 94

Table 7‑2. OpenStack Storage Infrastructure Metrics (Continued)
Name Category Type Unit Description Instanced
Write Rate Datastore Metric KBps Total rate of datawritten across allvCenterDatastoresregistered withOpenStack.
No
Max ObservedWrite Rate
Datastore Metric KBps Maximumobserved rate ofdata written acrossall vCenterDatastoresregistered withOpenStack.
No
OpenStack Compute ServicesThe Management Pack for OpenStack collects metrics for the OpenStack Compute Services.
Table 7‑3. OpenStack Compute Services Metrics
Name Category Type Unit Description Instanced
Configured Service Metric Integer Total number ofNova servicesconfigured in theOpenStackdeployment.
No
Running Service Metric Integer Number of Novaservices that arecurrently runningin the OpenStackdeployment.
No
Running Service Metric % Percentage ofNova services thatare currentlyrunning in theOpenStackdeployment.
No
Configured Service|Nova Metric Integer Number ofinstances of eachNova serviceconfigured in theOpenStackdeployment.
Yes
vRealize Operations Management Pack for OpenStack 5.0
VMware, Inc. 95

Table 7‑3. OpenStack Compute Services Metrics (Continued)
Name Category Type Unit Description Instanced
Running Service|Nova Metric Integer Number ofinstances of eachNova servicecurrently runningin the OpenStackdeployment.
Yes
Running Service|Nova Metric % Percentage ofinstances of eachNova servicecurrently runningin the OpenStackdeployment.
Yes
OpenStack Network ServicesThe Management Pack for OpenStack collects metrics for the OpenStack Network Services.
Table 7‑4. OpenStack Network Services Metrics
Name Category Type Unit Description Instanced
Configured Service Metric Integer Total number ofNeutron servicesconfigured in theOpenStackdeployment.
No
Running Service Metric Integer Number ofNeutron servicesthat are currentlyrunning in theOpenStackdeployment.
No
Running Service Metric % Percentage ofNeutron servicesthat are currentlyrunning in theOpenStackdeployment.
No
Configured Service|Neutron Metric Integer Number ofinstances of eachNeutron serviceconfigured in theOpenStackdeployment.
Yes
vRealize Operations Management Pack for OpenStack 5.0
VMware, Inc. 96

Table 7‑4. OpenStack Network Services Metrics (Continued)
Name Category Type Unit Description Instanced
Running Service|Neutron Metric Integer Number ofinstances of eachNeutron servicecurrently runningin the OpenStackdeployment.
Yes
Running Service|Neutron Metric % Percentage ofinstances of eachNeutron servicecurrently runningin the OpenStackdeployment.
Yes
OpenStack Storage ServicesThe Management Pack for OpenStack collects metrics for the OpenStack Storage Services.
Table 7‑5. OpenStack Storage Services Metrics
Name Category Type Unit Description Instanced
Configured Service Metric Integer Total number ofCinder, Glance,and Swift servicesconfigured in theOpenStackdeployment.
No
Running Service Metric Integer Number of Cinder,Glance, and Swiftservices that arecurrently runningin the OpenStackdeployment.
No
Running Service Metric % Percentage ofCinder, Glance,and Swift servicesthat are currentlyrunning in theOpenStackdeployment..
No
Configured Service|Cinder Metric Integer Number ofinstances of eachCinder serviceconfigured in theOpenStackdeployment.
Yes
vRealize Operations Management Pack for OpenStack 5.0
VMware, Inc. 97

Table 7‑5. OpenStack Storage Services Metrics (Continued)
Name Category Type Unit Description Instanced
Running Service|Cinder Metric Integer Number ofinstances of eachCinder servicecurrently runningin the OpenStackdeployment.
Yes
Running Service|Cinder Metric % Percentage ofinstances of eachCinder servicecurrently runningin the OpenStackdeployment.
Yes
Configured Service|Glance Metric Integer Number ofinstances of eachGlance serviceconfigured in theOpenStackdeployment.
Yes
Running Service|Glance Metric Integer Number ofinstances of eachGlance servicecurrently runningin the OpenStackdeployment.
Yes
Running Service|Glance Metric % Percentage ofinstances of eachGlance servicecurrently runningin the OpenStackdeployment.
Yes
Configured Service|Swift Metric Integer Number ofinstances of eachSwift serviceconfigured in theOpenStackdeployment.
Yes
Running Service|Swift Metric Integer Number ofinstances of eachSwift servicecurrently runningin the OpenStackdeployment.
Yes
Running Service|Swift Metric % Percentage ofinstances of eachSwift servicecurrently runningin the OpenStackdeployment.
Yes
vRealize Operations Management Pack for OpenStack 5.0
VMware, Inc. 98

OpenStack Management ServicesThe Management Pack for OpenStack collects metrics for the OpenStack Management Services.
Table 7‑6. OpenStack Management Services Metrics
Name Category Type Unit Description Integer
Configured Service Metric Integer Total number ofmanagementservicesconfigured in theOpenStackdeployment.
No
Running Service Metric Integer Number ofmanagementservices that arecurrently runningin the OpenStackdeployment.
No
Running Service Metric % Percentage ofmanagementservices that arecurrently runningin the OpenStackdeployment.
No
Configured Service|KeyStone Metric Integer Number ofinstances of eachKeyStone serviceconfigured in theOpenStackdeployment.
Yes
Running Service|KeyStone Metric Integer Number ofinstances of eachKeyStone servicecurrently runningin the OpenStackdeployment.
Yes
Running Service|KeyStone Metric % Percentage ofinstances of eachKeyStone servicecurrently runningin the OpenStackdeployment.
Yes
vRealize Operations Management Pack for OpenStack 5.0
VMware, Inc. 99

Table 7‑6. OpenStack Management Services Metrics (Continued)
Name Category Type Unit Description Integer
Configured Service|Ceilometer Metric Integer Number ofinstances of eachCeilometer serviceconfigured in theOpenStackdeployment.
Yes
Running Service|Ceilometer Metric Integer Number ofinstances of eachCeilometer servicecurrently runningin the OpenStackdeployment.
Yes
Running Service|Ceilometer Metric % Percentage ofinstances of eachCeilometer serviceconfigured in theOpenStackdeployment.
Yes
Configured Service|MySQL Metric Integer Number of MySQLservicesconfigured in theOpenStackdeployment.
Yes
Running Service|MySQL Metric Integer Number of MySQLservices that arecurrently runningin the OpenStackdeployment.
Yes
Running Service|MySQL Metric % Percentage ofMySQL servicesthat are currentlyrunning in theOpenStackdeployment.
Yes
Configured Service|Apache Metric Integer Number of Apacheservicesconfigured in theOpenStackdeployment.
Yes
Running Service|Apache Metric Integer Number of Apacheservices that arecurrently runningin the OpenStackdeployment.
Yes
vRealize Operations Management Pack for OpenStack 5.0
VMware, Inc. 100

Table 7‑6. OpenStack Management Services Metrics (Continued)
Name Category Type Unit Description Integer
Running Service|Apache Metric % Percentage ofApache servicesthat are currentlyrunning in theOpenStackdeployment.
Yes
Configured Service|RabbitMQ Metric Integer Number ofRabbitMQ servicesconfigured in theOpenStackdeployment.
Yes
Running Service|RabbitMQ Metric Integer Number ofRabbitMQ servicesthat are currentlyrunning in theOpenStackdeployment.
Yes
Running Service|RabbitMQ Metric % Percentage ofRabbitMQ servicesthat are currentlyrunning in theOpenStackdeployment.
Yes
Configured Service|Memcached
Metric Integer Number ofMemcachedservicesconfigured in theOpenStackdeployment.
Yes
Running Service|Memcached
Metric Integer Number ofMemcachedservices that arecurrently runningin the OpenStackdeployment.
Yes
Running Service|Memcached
Metric % Percentage ofMemcachedservices that arecurrently runningin the OpenStackdeployment.
Yes
Configured Service|Heat Metric Integer Number ofinstances of eachHeat serviceconfigured in theOpenStackdeployment.
Yes
vRealize Operations Management Pack for OpenStack 5.0
VMware, Inc. 101

Table 7‑6. OpenStack Management Services Metrics (Continued)
Name Category Type Unit Description Integer
Running Service|Heat Metric Integer Number ofinstances of eachHeat servicecurrently runningin the OpenStackdeployment.
Yes
Running Service|Heat Metric % Percentage ofinstances of eachHeat servicecurrently runningin the OpenStackdeployment.
Yes
Configured Service|OMS Metric Integer Number ofinstances of eachOMS serviceconfigured in theOpenStackdeployment.
Yes
Running Service|OMS Metric Integer Number ofinstances of eachOMS servicerunning in theOpenStackdeployment.
Yes
Running Service|OMS Metric % Percentage ofinstances of eachOMS servicecurrently runningin the OpenStackdeployment.
Yes
Configured Service| vPostgres Metric Integer Number ofvPostgres servicesconfigured in theOpenStackdeployment.
Yes
Running Service| vPostgres Metric Integer Number ofvPostgres servicesrunning in theOpenStackdeployment.
Yes
Running Service| vPostgres Metric % Percentage ofinstances ofvPostgres servicecurrently runningin the OpenStackdeployment.
Yes
vRealize Operations Management Pack for OpenStack 5.0
VMware, Inc. 102

OpenStack ProjectThe Management Pack for OpenStack collects metrics for the OpenStack Project.
Table 7‑7. OpenStack Project Metrics
Name Category Type Unit Description Instanced
Total IngressTraffic
Network Metric KBps Incoming networktraffic across allinstancesprovisioned by theProject.
No
Total EgressTraffic
Network Metric KBps Outgoing networktraffic across allinstancesprovisioned by theProject.
No
Total IngressPackets perSecond
Network Metric Integer Rate of incomingpackets across allincoming networktraffic across allinstancesprovisioned by theProject.
No
Total EgressPackets perSecond
Network Metric Integer Rate of outgoingpackets across allincoming networktraffic across allinstancesprovisioned by theProject.
No
Total Networks Network Metric Integer Number of logicalswitches that havebeen provisionedby the Project.
No
Total Routers Network Metric Integer Number of logicalrouters that havebeen provisionedby the Project.
No
Quota Instance Metric Integer Maximum numberof instances thatcan be provisionedby the Project.
No
Usage Instance Metric Integer Number ofinstances thathave beenprovisioned by theProject.
No
vRealize Operations Management Pack for OpenStack 5.0
VMware, Inc. 103

Table 7‑7. OpenStack Project Metrics (Continued)
Name Category Type Unit Description Instanced
Usage Instance Metric % Percentage ofinstances thathave beenprovisioned by theProject.
No
Quota Memory Metric MB Maximum amountof vRAM that canbe provisioned bythe Project.
No
Usage Memory Metric MB Amount of vRAMprovisioned by theProject.
No
Usage Memory Metric % Percentage ofvRAM that hasbeen provisionedby the Project.
No
Quota CPU Metric Integer Maximum numberof vCPUs that canbe provisioned bythe Project
No
Usage CPU Metric Integer Number of vCPUSthat have beenprovisioned by theProject.
No
Usage CPU Metric % Percentage ofvCPUs that havebeen provisionedby the Project.
No
Read Rate Disk Metric KBps Rate of data beingread from diskacross allinstancesprovisioned by theProject.
No
Reads per Second Disk Metric Integer Rate of disk readoperations acrossall instancesprovisioned by theProject.
No
Write Rate Disk Metric KBps Rate of data beingwritten from diskacross allinstancesprovisioned by theProject.
No
vRealize Operations Management Pack for OpenStack 5.0
VMware, Inc. 104

Table 7‑7. OpenStack Project Metrics (Continued)
Name Category Type Unit Description Instanced
Writes per Second Disk Metric Integer Rate of disk writeoperations acrossall instancesprovisioned by theProject.
No
Quota Floating IP Metric Integer Maximum numberof floating IPs thatcan be provisionedby the Project.
No
Usage Floating IP Metric Integer Number of floatingIPs that have beenprovisioned by theProject.
No
Usage Floating IP Metric % Percentage offloating IPs thathave beenprovisioned by theProject.
No
Quota Security Group Metric Integer Maximum numberof security groupsthat can beprovisioned by theProject.
No
Usage Security Group Metric Integer Number of securitygroups that havebeen provisionedby the Project.
No
Usage Security Group Metric % Percentage ofsecurity groupsthat have beenprovisioned by theProject
Availability Status Metric Boolean 1 if the Project isenabled, 0 if theProject is disabled.
No
OpenStack Logical SwitchThe Management Pack for OpenStack collects metrics for the OpenStack Logical Switch.
vRealize Operations Management Pack for OpenStack 5.0
VMware, Inc. 105

Table 7‑8. OpenStack Logical Switch Metrics
Name Category Type Unit Description Instanced
Total IngressTraffic
Network Metric KBps Incoming networktraffic across allinstances attachedto the LogicalSwitch.
No
Total EgressTraffic
Network Metric KBps Outgoing networktraffic across allinstances attachedto the LogicalSwitch.
No
Total IngressPackets perSecond
Network Metric Integer Rate of incomingpackets across allincoming networktraffic attached tothe Logical Switch.
No
Total EgressPackets perSecond
Network Metric Integer Rate of outgoingpackets across allincoming networktraffic attached tothe Logical Switch.
No
Total Port Metric Integer Total number ofports configuredon the LogicalSwitch.
No
Active Port Metric Integer Number of portsthat are currentlyactive on theLogical Switch.
No
Active Port Metric % Percentage ofports on theLogical Switch thatare active.
No
Status Port Metric String Current link statusof each port on theLogical Switch.
Yes
Admin State Port Metric String Current adminstate of each porton the LogicalSwitch.
Yes
Availability Status Metric Boolean 1 if the LogicalSwitch is active. 0if the LogicalSwitch is notactive
No
vRealize Operations Management Pack for OpenStack 5.0
VMware, Inc. 106

Table 7‑8. OpenStack Logical Switch Metrics (Continued)
Name Category Type Unit Description Instanced
Project Summary|OpenStack
Property String Name of theProject thatprovisioned theLogical Switch.
No
Status Summary|OpenStack
Property String Current link statusof the LogicalSwitch.
No
Admin State Summary|OpenStack
Property String Current adminstate of the LogicalSwitch.
No
Shared Summary|OpenStack
Property String True if the LogicalSwitch if shared byother Projects.False if the LogicalSwitch is private tothe Project thatprovisioned it.
No
OpenStack Logical RouterThe Management Pack for OpenStack collects metrics for the OpenStack Logical Router.
Table 7‑9. OpenStack Logical Router Metrics
Name Category Type Unit Description Instanced
Total IngressTraffic
Network Metric KBps Incoming networktraffic across allinstances attachedto the LogicalRouter.
No
Total EgressTraffic
Network Metric KBps Outgoing networktraffic across allinstances attachedto the LogicalRouter.
No
Total IngressPackets perSecond
Network Metric Integer Rate of incomingpackets across allincoming networktraffic attached tothe Logical Router.
No
Total EgressPackets perSecond
Network Metric Integer Rate of outgoingpackets across allincoming networktraffic attached tothe Logical Router.
No
vRealize Operations Management Pack for OpenStack 5.0
VMware, Inc. 107

Table 7‑9. OpenStack Logical Router Metrics (Continued)
Name Category Type Unit Description Instanced
Total Port Metric Integer Total number ofports configuredon the LogicalRouter.
No
Active Port Metric Integer Number of portsthat are currentlyactive on theLogical Router.
No
Active Port Metric % Percentage ofports on theLogical Router thatare active.
No
Status Port Metric String Current link statusof each port on theLogical Router.
Yes
Admin State Port Metric String Current adminstate of each porton the LogicalRouter.
Yes
Availability Status Metric Boolean 1 if the LogicalSwitch is active. 0if the LogicalRouter is notactive.
No
Project Summary|OpenStack
Property String Name of theProject thatprovisioned theLogical Router.
No
Status Summary|OpenStack
Property String Current link statusof the LogicalRouters.
No
Admin State Summary|OpenStack
Property String Current adminstate of the LogicalRouter.
OpenStack External Logical SwitchThe Management Pack for OpenStack collects metrics for the OpenStack External Logical Switch.
vRealize Operations Management Pack for OpenStack 5.0
VMware, Inc. 108

Table 7‑10. OpenStack External Logical Switch Metrics
Name Category Type Unit Description Instanced
Total IngressTraffic
Network Metric KBps Incoming networktraffic across allinstances attachedto the LogicalSwitch.
No
Total EgressTraffic
Network Metric KBps Outgoing networktraffic across allinstances attachedto the LogicalSwitch.
No
Total IngressPackets perSecond
Network Metric Integer Rate of incomingpackets across allincoming networktraffic attached tothe Logical Switch.
No
Total EgressPackets persecond
Network Metric Integer Rate of outgoingpackets across allincoming networktraffic attached tothe Logical Switch.
No
Total Port Metric Integer Total number ofports configuredon the LogicalSwitch.
No
Active Port Metric Integer Number of portsthat are currentlyactive on theLogical Switch.
No
Active Port Metric % Percentage ofports on theLogical Switch thatare active.
No
Status Port Metric String Current link statusof each port on theLogical Switch.
Yes
Admin State Port Metric String Current adminstate of each porton the LogicalSwitch.
Yes
Availability Status Metric Boolean 1 if the LogicalSwitch is active. 0if the LogicalSwitch is notactive.
No
vRealize Operations Management Pack for OpenStack 5.0
VMware, Inc. 109

Table 7‑10. OpenStack External Logical Switch Metrics (Continued)
Name Category Type Unit Description Instanced
Project Summary|OpenStack
Property String Name of theProject thatprovisioned theLogical Switch.
No
Status Summary|OpenStack
Property String Current link statusof the LogicalSwitch.
No
Admin State Summary|OpenStack
Property String Current adminstate of the LogicalSwitch.
No
Non-ESX Host SystemThe Management Pack for OpenStack collects metrics for the Non-ESX Host System.
Table 7‑11. Non-ESX Host System Metrics
Name Category Type Unit Description Instanced
ProvisionedCapacity
Memory Metric GB Physical memorycapacity of theHost.
No
Usage Memory Metric GB Amount of physicalmemory beingused by the Host.
No
Usage Memory Metric % Percentage ofphysical memorybeing used by theHost.
No
Capacity Disk Metric GB Local disk spacecapacity on theHost.
No
Usage Disk Metric GB Amount of localdisk space beingused by the Host.
No
Usage Disk Metric % Percentage oflocal disk spacebeing used by theHost.
No
Logical Processors CPU Metric Integer Number of logicalprocessors on theHost.
No
Number of VirtualCPUs in Use
CPU Metric Integer Number of vCPUsprovisioned acrossall instances onthe Host.
No
vRealize Operations Management Pack for OpenStack 5.0
VMware, Inc. 110

Non-ESX Virtual MachineThe Management Pack for OpenStack collects metrics for the Non-ESX virtual machine.
Table 7‑12. Non-ESX Virtual Machine Metrics
Name Category Type Unit Description Instanced
Capacity Disk Property GB Amount of diskspace provisionedby the virtualmachine.
No
Read Rate Disk Metric KBps Rate of data beingread from all diskson the virtualmachine.
No
Reads per Second Disk Metric Integer Rate of disk readoperations on thevirtual machine.
No
Write Rate Disk Metric KBps Rate of data beingwritten from alldisks on the virtualmachine.
No
Writes per Second Disk Metric Integer Rate of disk writeoperations on thevirtual machine.
No
ProvisionedvCPUs
CPU Property Integer Number of vCPUsprovisioned by thevirtual machine.
No
CPU Utilization CPU Metric % Percentage ofCPU time beingused by the virtualmachine.
No
ProvisionedCapacity
Memory Property GB Amount of vRAMprovisioned by thevirtual machine.
No
Uptime System Metric Integer Number ofseconds that haveelapsed since thevirtual machinewas started.
No
IP Addresses Network Property String IP Addressesassigned to thevirtual machine.
No
Total IngressTraffic
Network Metric KBps Incoming networktraffic on the virtualmachine.
No
vRealize Operations Management Pack for OpenStack 5.0
VMware, Inc. 111

Table 7‑12. Non-ESX Virtual Machine Metrics (Continued)
Name Category Type Unit Description Instanced
Total EgressTraffic
Network Metric KBps Outgoing networktraffic on the virtualmachine.
No
Total IngressPackets perSecond
Network Metric Integer Rate of incomingpackets on thevirtual machine.
No
Total EgressPackets perSecond
Network Metric Integer Rate of outgoingpackets on theVirtual Machine.
No
Availability Status Metric Boolean 1 if the virtualmachine iscurrently available.0 if the virtualmachine is notavailable.
No
VM Error Code Status Property String Error code thatwas returned fromOpenStack for thelast configurationoperation on thevirtual machine.
No
VM Error Message Status Property String Error messagethat was returnedfrom OpenStackfor the lastconfigurationoperations on thevirtual machine.
No
Project Summary|OpenStack
Property String Name of theProject thatprovisioned thevirtual machine.
No
Instance Name Summary|OpenStack
Property String Name of theOpenStackinstance thatcorresponds to thevirtual machine.
No
Image Summary|OpenStack
Property String Name of theOpenStack imagethat the virtualmachine wasprovisioned from.
No
Flavor Summary|OpenStack
Property String Name of theOpenStack flavorthat was used forconfiguring thevirtual machine.
No
vRealize Operations Management Pack for OpenStack 5.0
VMware, Inc. 112

Table 7‑12. Non-ESX Virtual Machine Metrics (Continued)
Name Category Type Unit Description Instanced
Status Summary|OpenStack
Property String Current status ofthe virtual machineas reported byOpenStack
No
Power state Summary|OpenStack
Property String Whether the virtualmachine is runningor not.
No
vRealize Operations Management Pack for OpenStack 5.0
VMware, Inc. 113

Management Pack forOpenStack Capacity Models 8An object's capacity model, combined with policy settings, is used to determine the value of all badgesand sub-badges aside from Health.
The Management Pack for OpenStack capacity model tables describe the capacity models that havebeen defined for each object type.
OpenStack Compute InfrastructureThe capacity of the Compute Infrastructure is represented by the aggregated capacity of all hosts andclusters registered with OpenStack
Table 8‑1. OpenStack Compute Infrastructure Capacity Model
Container Description Use in Workload
Memory Aggregate amount of physical memory used acrossall hosts and clusters that are registered withOpenStack.
Yes
Disk Space Aggregate amount of local disk space used across allhosts and clusters that are registered withOpenStack.
Yes
OpenStack Storage InfrastructureThe capacity of the Storage Infrastructure is represented by the aggregated capacity of all vCenterdatastores with OpenStack.
Table 8‑2. OpenStack Storage Infrastructure Capacity Model
Container Description Use in Workload
Datastore|Outstanding IORequests
Aggregate number of outstanding I/O requests acrossall vCenter datatores that are registered withOpenStack. The capacity for this container uses amaximum observed value approach.
Yes
Datastore|Reads per second Aggregate rate of reads across all vCenter datastorethat are registered with OpenStack. The capacity forthis container uses a maximum observed valueapproach.
Yes
VMware, Inc. 114

Table 8‑2. OpenStack Storage Infrastructure Capacity Model (Continued)
Container Description Use in Workload
Datastore|Writes per second Aggregate rate of writes across all vCenterdatastores that are registered with OpenStack. Thecapacity for this container uses a maximum observedvalue approach.
Yes
Datastore|Read Rate Aggregate rate of data read across all vCenterdatastores that are registered with OpenStack. Thecapacity for this container uses a maximum observedvalue approach.
Yes
Datastore|Write Rate Aggregate rate of data written across all vCenterdatastores that are registered with OpenStack. Thecapacity for this container uses a maximum observedvalue approach.
Yes
Disk Space|Usage Aggregate amount of local disk space used across allhosts and clusters that are registered withOpenStack.
Yes
OpenStack ProjectThe capacity of a Project represents the number of provisioned objects relative to the configured quota.
Table 8‑3. OpenStack Project Capacity Model
Container Description Use in Workload
Instance Number of virtual machines provisioned by theproject compared to the quota.
No
CPU Number of virtual CPUs provisioned across all virtualmachines by the project compared to the quota.
No
Memory Amount of vRAM provisioned across all virtualmachines by the project compared to the quota.
No
Floating IP Number of floating IPs provisioned by the projectcompared to the quota.
No
Security Group Number of security groups provisioned by the projectcompared to the quota.
No
Non-ESX Host
Table 8‑4. Non-ESX Host Capacity Model
Container Description Use in Workload
Memory Amount of physical memory used by the host. Yes
Disk Amount of local disk space used by the host. Yes
vRealize Operations Management Pack for OpenStack 5.0
VMware, Inc. 115
Capacity ModelsCapacity models have not been defined for the following objects.
n OpenStack Network Infrastructure
n OpenStack Compute Services
n OpenStack Network Services
n OpenStack Storage Services
n OpenStack Management Services
n OpenStack Logical Switch
n OpenStack External Logical Switch
n OpenStack Logical Router
n Non-ESX Virtual Machine
vRealize Operations Management Pack for OpenStack 5.0
VMware, Inc. 116

Management Pack forOpenStack Reports 9A report is a scheduled snapshot of views. The Management Pack for OpenStack provides a variety ofreport templates to enable you to generate reports for OpenStack objects.
Table 9‑1. Management Pack for OpenStack Reports
Name Applies to Content
OpenStack Project Alerts Project Provides a list of the number of alertsreported for each project. Alerts arebroken down into current and 7-dayaverages for Critical, Immediate, andWarning alerts.
OpenStack Project Quota Usage Project Provides an overview of the percentageof instances, vCPUs, vRAM, FloatingIPs, and Security Groups provisioned byeach project, and a detailed breakdownof the provisioned and quota numbers ofeach object type for each project.
Generate a ReportThe Management Pack for OpenStack provides a list of report templates.
Procedure
1 In the left pane of vRealize Operations Manager, click the Environment icon.
2 Select the Management Pack for OpenStack object for which you want to generate the report.
The Report tab is displayed.
3 From the Report tab, select the required report template, and click the Run Template icon.
When the report is complete, the number of generated reports is updated under the name of thereport template.
What to do next
Download the report by clicking Generated Reports. Select the report from the list of reports, and clickthe required format in the Download column.
VMware, Inc. 117
Related Documents