C O U N T Y O F L O S A N G E L E S - C A L IF O R N I R E G I S T R A R - R E C O R D E R/ C O U N T Y C L E R K A Los Angeles County REGISTRAR-RECORDER/COUNTY CLERK VOTING SYSTEMS ASSESSMENT PROJECT REPORT VOTING SYSTEMS ASSESSMENT PROJECT REPORT JULY 9, 2010 Dean C. Logan, Registrar-Recorder/County Clerk

Welcome message from author
This document is posted to help you gain knowledge. Please leave a comment to let me know what you think about it! Share it to your friends and learn new things together.
Transcript
CO
UN
T
YO
F LOS ANGELES - CALIFO
RN
I
RE
GIS
TR
AR-R
ECORDER/COUNTYC
LE
RK
A
Los Angeles County REGISTRAR-RECORDER/COUNTY CLERK
VOTING SYSTEMS ASSESSMENT
PROJECT REPORT
VOTING SYSTEMS ASSESSMENT
PROJECT REPORT
JULY 9, 2010
Dean C. Logan, Registrar-Recorder/County Clerk
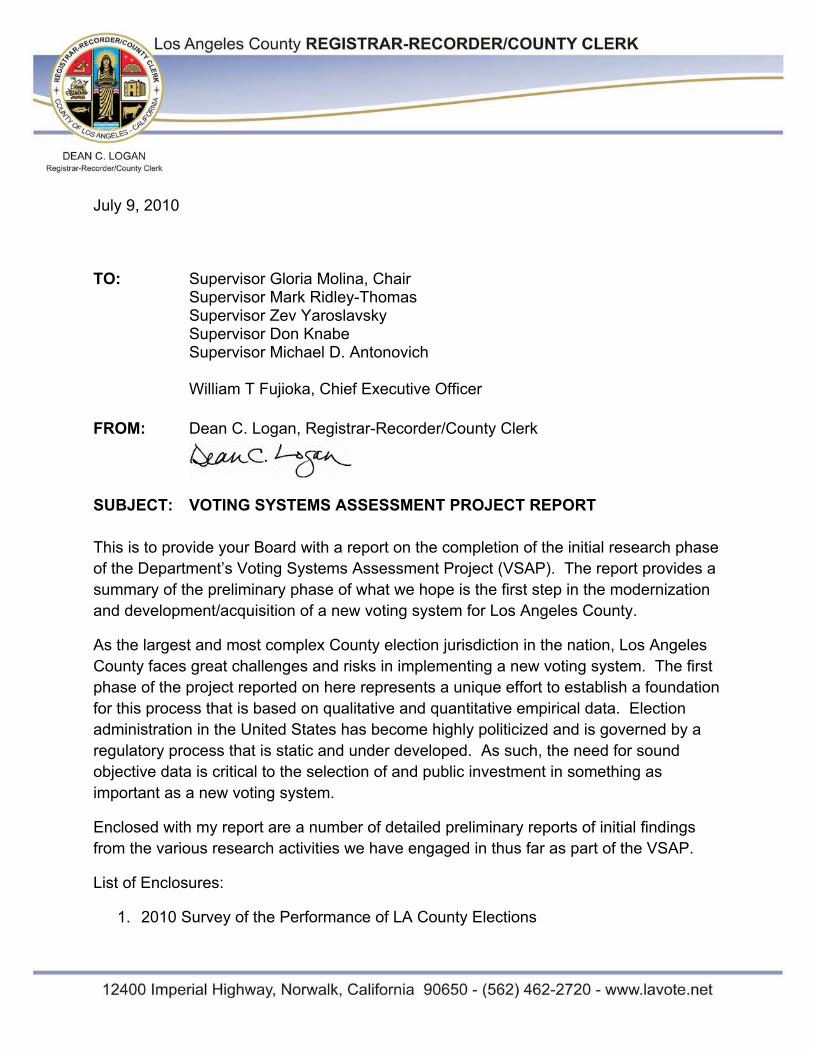
July 9, 2010
TO: Supervisor Gloria Molina, Chair Supervisor Mark Ridley-ThomasSupervisor Zev Yaroslavsky Supervisor Don Knabe Supervisor Michael D. Antonovich
William T Fujioka, Chief Executive Officer
FROM: Dean C. Logan, Registrar-Recorder/County Clerk
SUBJECT: VOTING SYSTEMS ASSESSMENT PROJECT REPORT
This is to provide your Board with a report on the completion of the initial research phase of the Department’s Voting Systems Assessment Project (VSAP). The report provides a summary of the preliminary phase of what we hope is the first step in the modernization and development/acquisition of a new voting system for Los Angeles County.
As the largest and most complex County election jurisdiction in the nation, Los Angeles County faces great challenges and risks in implementing a new voting system. The first phase of the project reported on here represents a unique effort to establish a foundation for this process that is based on qualitative and quantitative empirical data. Election administration in the United States has become highly politicized and is governed by a regulatory process that is static and under developed. As such, the need for sound objective data is critical to the selection of and public investment in something as important as a new voting system.
Enclosed with my report are a number of detailed preliminary reports of initial findings from the various research activities we have engaged in thus far as part of the VSAP.
List of Enclosures:
1. 2010 Survey of the Performance of LA County Elections
July 9, 2010 Page 2 of 12
2. Getting Ready for Tomorrow’s Voters – Los Angeles County Registrar-Recorder/County Clerk (RR/CC) Voting Systems Assessment Project Focus Group Report
3. 2010 Poll Worker Survey of the Performance of LA County Elections
4. Memorandum: Internal RR/CC Staff Discussion Groups
Executive Summary
With the partnership of the Voting Technology Project (VTP), and the financial support of the James Irvine Foundation, the County of Los Angeles Registrar-Recorder/County Clerk launched the Voting Systems Assessment Project, an unprecedented project, with the goal of implementing a new and enhanced voting system for the County. The preliminary phase of this project has been implemented, and the findings that emerged from this initial research stage are a solid foundation for the continuation of the project.
In this initial phase, the Department, with the partnership of the VTP, conducted a countywide voter survey, voter focus groups, a pollworker survey, local election official focus groups, and internal discussion groups with Department staff. Among the key findings resulting from these activates were:
� Voters have a significant level of trust in the County’s electoral process and voting system.
� Voters feel like they lack knowledge or information about the process.
� Department staff and local election officials are concerned about the ability of the current InkaVote Plus’s system’s ability to meet the changing needs of the County.
� Accuracy, security, reliability, and ease of use are the values that voters prioritize in a voting system.
� All stakeholders trust a voting system acquisition/development model that demonstrates a public-private partnership and that will give the RR/CC full control of the system.
VSAP Board Update
VSAP Board Update July 9, 2010
Page 3 of 12
The data compiled in this research provides us a solid base as we proceed to the next steps of this project, which will include making some complex decisions. (See “Recommendations/Next Steps” on Page 10)
Project Background
The Voting Systems Assessment Project is an unprecedented project premised on a collaborative approach that ensures greater citizen input through partnerships within the academic community, public interest organizations, and with policy makers, in the pursuit of establishing a voting systems acquisition/development model that is collaborative and transparent -- and which is founded on sound data. This project was developed by the Department in response to the growing voting system needs faced by the County and in recognition of future regulatory changes and pending legal requirements our current systems are unable to meet.
The Voting Systems Assessment Project was launched on September 16, 2009. Since the launch of the project, the Voting Technology Project (VTP) has agreed to serve as our research partner, providing important support and a breadth of experience in the area of voting systems research and analysis of stakeholder input. The Voting Technology Project is a collaboration of the California Institute of Technology (Caltech) and the Massachusetts Institute of Technology (MIT). Thanks to a partnership with the Voting Technology Project and the support of the James Irvine Foundation, the project secured a $150,000 grant in support of initial research activities.
Research Activities
Research activities seek to collect and analyze sound data from diverse sources including: voters, community organizations, poll workers, election advocates, local election officials (City Clerks and RR/CC staff), and other election experts. The data collected by the project represents a unique attempt at informing the project with qualitative and quantitative empirical data, gathered under the advisement and direction of the project partner (Voting Technology Project). Please note that more detailed preliminary draft reports for these various activities have been enclosed with this report.
Countywide Voter Survey: The VTP developed and implemented statistically based surveys of Los Angeles County registered voters. These surveys were conducted using both a telephone and Internet mode. From March 16- 28, 2010, 500 randomly selected
� �
VSAP Board Update July 9, 2010
Page 4 of 12
voters completed the online survey. 651 responded to the telephone survey between March 11 and 29. The telephone survey was also utilized to produce samples of Spanish-speaking and Mandarin-speaking registered voters. Interviewing Services of America Inc. provided research support for the telephone survey. The internet survey was administered by YouGov/Polimetrix.
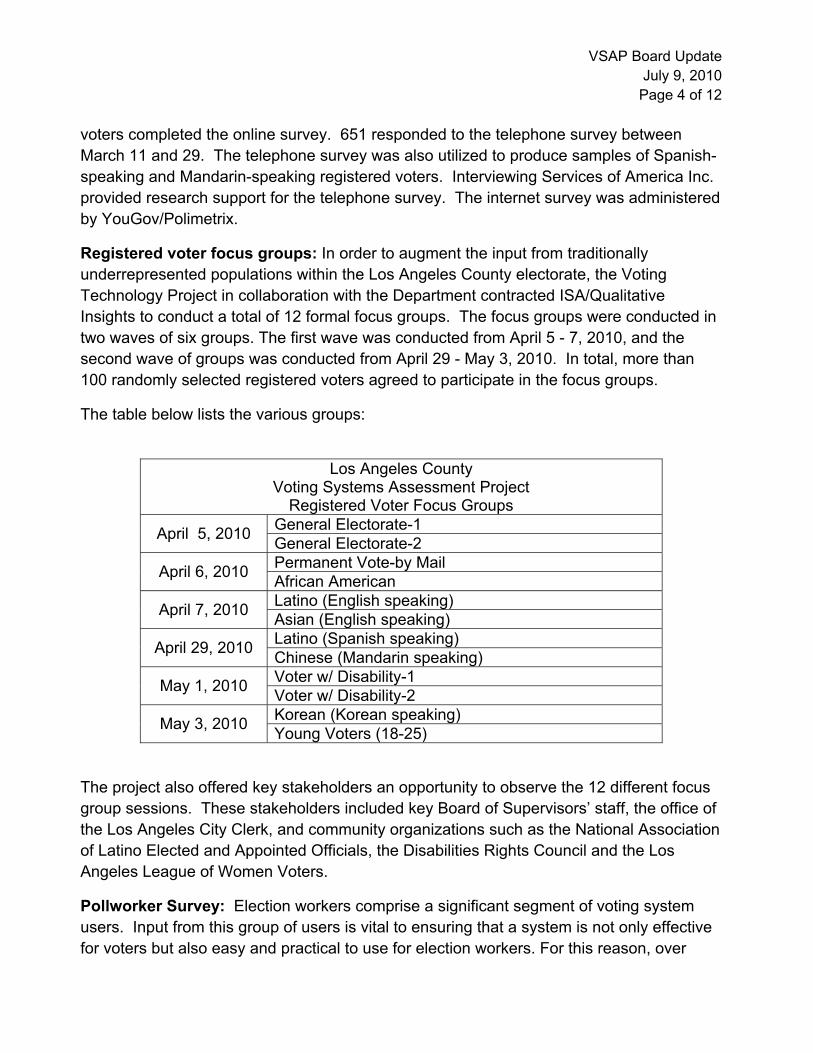
Registered voter focus groups: In order to augment the input from traditionally underrepresented populations within the Los Angeles County electorate, the Voting Technology Project in collaboration with the Department contracted ISA/Qualitative Insights to conduct a total of 12 formal focus groups. The focus groups were conducted in two waves of six groups. The first wave was conducted from April 5 - 7, 2010, and the second wave of groups was conducted from April 29 - May 3, 2010. In total, more than 100 randomly selected registered voters agreed to participate in the focus groups.
The table below lists the various groups:
�Los Angeles County
Voting Systems Assessment Project Registered Voter Focus Groups
General Electorate-1 April 5, 2010 General Electorate-2 Permanent Vote-by Mail April 6, 2010 African American Latino (English speaking) April 7, 2010 Asian (English speaking) Latino (Spanish speaking) April 29, 2010 Chinese (Mandarin speaking) Voter w/ Disability-1 May 1, 2010 Voter w/ Disability-2 Korean (Korean speaking) May 3, 2010 Young Voters (18-25)
The project also offered key stakeholders an opportunity to observe the 12 different focus group sessions. These stakeholders included key Board of Supervisors’ staff, the office of the Los Angeles City Clerk, and community organizations such as the National Association of Latino Elected and Appointed Officials, the Disabilities Rights Council and the Los Angeles League of Women Voters.
Pollworker Survey: Election workers comprise a significant segment of voting system users. Input from this group of users is vital to ensuring that a system is not only effective for voters but also easy and practical to use for election workers. For this reason, over
� �
VSAP Board Update July 9, 2010
Page 5 of 12
1,100 pollworkers were surveyed online between April 29 and June 8, 2010. The survey was completed after poll workers completed their online pollworker training for the June 8, 2010 Statewide Direct Primary Election. Pollworkers were asked about their attitude towards the voting system Los Angeles County currently uses, and about their attitudes towards other types of systems.
Local Election Officials: The Department conducted a series of focus group discussions with City Clerks between May 7 and 11, 2010. The forums included 26 City Clerks from across Los Angeles County. City Clerks discussed some of the challenges they are facing with the current voting system and their preferences and priorities in voting devices. Local election officials were invaluable to this assessment and are valued stakeholders that we will continue to engage in the process.
Internal Discussion Groups: Internal focus group discussions were held with Registrar-Recorder/County Clerk staff. During March 31 through April 2, 2010 the project conducted seven discussion groups, each approximately two hours in length. In total, 64 staff had the opportunity to participate in the discussion groups and contribute their thoughts, experiences, and expectations regarding the current and future voting system and electoral processes.
Summary of Findings
The following is a synthesis of the key findings from the various research activities outlined above. These findings are intended to provide a global perspective of what was learned over the first phase of the Voting Systems Assessment Project. The summary findings are organized into a series of topic areas to help give some context. The reported findings in this section are not meant to be an exhaustive list of all the information gathered.Specific findings have been compiled in a series of reports that provide greater detail on the findings for each specific research activity.
Voter Perceptions of the Process
Currently the electorate in Los Angeles County has a significant level of trust in the integrity of the County’s electoral process and voting system. Results from our countywide survey found that nearly nine in ten voters are confident that their votes are counted as intended. Pollworkers exhibit a similar level of confidence. Specifically, pollworkers believe that the current InkaVote Plus voting system is working fine. When asked whether they believe that the InkaVote Plus voting system should be replaced, a majority (55%) say
� �
VSAP Board Update July 9, 2010
Page 6 of 12
“No.” It is important to note however, that 27% said they did not know if the system should be replaced, and another 18% said it should be replaced.
Despite the confidence expressed by voters, the focus group sessions did find that voter confidence is very impressionable due to a lack of knowledge or information about what happens to voters’ ballots once they are cast. This lack of information about ballot processing on Election Night and during the Election Canvass period can be a source of anxiety that can lead to mistrust on the part of the voter.
Finally, election irregularities and problems that were highlighted on a national stage during the 2000 and 2004 Presidential Elections in Florida and Ohio have had a lasting impression on voters. While these events occurred a decade or so ago, they are still engrained in voters’ minds. When thinking about what can go wrong with elections these instances are examples and cautionary markers for voters.
The findings also helped to underscore the importance of transparency both in the conduct of elections but also in the process of acquiring/developing new voting systems. They also demonstrate that it will be important to provide an explanation to voters and pollworkers about the need to replace current systems.
In addition to voter perspectives about the electoral process, the perspectives and outlook of RR/CC staff when it comes to the elections environment in which they are asked to perform is also valuable. According to internal discussion groups held with RR/CC staff, the conduct of elections in Los Angeles County is becoming increasingly difficult. A fluid regulatory environment with increasing demands on voting system requirements and legislative changes to the election code make conducting elections more challenging. In a County like Los Angeles, the increasing number of variables and frequency of change associated with the current elections process in California have significantly increased the costs of election administration and the risk of procedural error. Staff noted that the scale and diversity of the County magnify the complexities that come with this fluid elections environment. Moreover, this fluid environment requires a voting system with greater flexibility to adapt and accommodate changes; a limitation of the current InkaVote Plussystem.
Current InkaVote Plus Voting System
Despite a strong level of trust in the current voting system, technical assessment and changing demographics and complexities suggest strong need to change the voting system.
While there are some discernable advantages with the existing system, there are serious disadvantages and limitations. Per staff, various adaptations and iterations of what is now
� �
VSAP Board Update July 9, 2010
Page 7 of 12
the InkaVote Plus voting system have served the voters of Los Angeles County for more than thirty years. The system provides a number of efficiencies, fair usability and an unrivaled familiarity for voters, pollworkers, and RR/CC staff. VSAP research found that, in general, all stakeholders are well accustomed and adapted to the InkaVote Plus voting system. However, technical limitations that present challenges to complying with current and future laws -- and to meeting the demands of the electorate when it comes to providing greater voting options, accessibility and ease of use require that we identify and implement a new voting system.
Our findings suggest that beyond a level of comfort with the system, voters and election officials value the simplicity and practicality that the system offers. These are important characteristics that we will endeavor to preserve in a future voting system. The accompanying reports provide additional details on the research. Specifically, the RR/CC staff report identifies advantages and disadvantages of the current system.
Local election officials (e.g. City Clerks) made possibly the strongest case for a comprehensive overhaul of our voting systems. While discussion sessions with City Clerks closely align with and helped to further inform our research, their particular perspectives as election officials are important to consider here.
� Local election officials see added possibilities for providing voters a more consistent voting experience. A new voting system may provide opportunities for more local jurisdictions to consolidate local elections with countywide elections.
� A new voting system could present opportunities to secure new service models that lead to more cost effective elections. Local officials hope that a new voting system will provide for new service models that will give jurisdictions the ability to identify cost savings.
� Finally, a new voting system that could also meet the needs of local jurisdictions might also promote a more consistent voting experience for voters regardless of the election. Local election officials envision the possibility of the County making its voting system available for local elections. This would standardize the equipment used by voters and also streamline pollworker training, as the voting systems used would remain the same regardless of the jurisdiction conducting the election (County or City).
Voting System Values and Preferences
A large part of the survey and focus group research was dedicated to identifying how and what voters prioritize as core values/characteristics that a voting system should satisfy.Any voting system that serves Los Angeles County must satisfy all legal standards and
� �
VSAP Board Update July 9, 2010
Page 8 of 12
requirements pertaining to accuracy, security, and accessibility for voters with language needs and voters with disabilities; as established by Federal and State laws. However, the purpose of this research was to ascertain what voters think about when they use and/or the methods used to audit voting systems. What do they value most in a voting system? This data is extremely valuable in our efforts to ensure that a future voting system pays particular attention to our electorate’s needs and values.
General Observations
A consistent and central finding from our focus group and discussion group research was the recognition that the voting system discussion entails much more than the acquisition/development of new equipment. From voters to local election officials, the voting system discussion linked equipment to voting methods (e.g. vote by mail, early voting), poll workers, and polling place locations. This suggests that the process of revamping the County’s voting systems will need to also consider accompanying changes to practices around early voting, precinct consolidation, and polling locations, etc. Such changes will likely involve proposals for legislative and regulatory changes or flexibility in addition to equipment and system acquisition/development.
The broader perspective of considering more than just the equipment correlates to the other consistent theme, voiced by voters, staff, and other stakeholders, that there is not a single voting method/system that will satisfy the diversity and breadth of voter needs in Los Angeles County. It is important that any new system is only part of a menu of options available for voters to cast their vote. The focus group data compiled included Vote by Mail, Early Voting, Paper Ballots and Electronically-marked ballots as the variety of options that might be available to ensure voters have options.
Voting System Values
Accuracy, Security, Reliability, and Ease of Use are the priority values identified by voters in the research. Albeit, there are some important variations in terms of prioritizing these values among different racial/ethnic and socioeconomic subgroups, accuracy, security, and ease of use rank as the top three values the County must prioritize in conceptualizing a new voting system.
� In our countywide survey anywhere from one in four to one in three voters ranked accuracy as their top value.
� Voters with disabilities, Asians, and Latinos place greater priority on being sure a future voting system is “easy-to-use;” more than other groups in the survey.
� �
VSAP Board Update July 9, 2010
Page 9 of 12
Marking the ballot
Voters were also asked to think more practically and to give their opinions/preferences about various methods by which voters mark their ballots on various conventional systems.Our research suggests that voters use their stated values to evaluate and make up their minds about voting systems. Voters in these studies rated/evaluated the systems based on values associated with accuracy, security, and ease of use.
In general, voters were presented with three voting methods. In our survey voters discussed models using 1) Hand counted paper ballots; 2) Hand marked optical Scan ballots; 3) Electronically marked Direct Recording Electronic (DRE) ballots. Focus groups presented voters with a slight variation: 1) Hand counted paper ballots; 2) Optical Scan-Ballot marking device which, blends a touchscreen interface with an opscan ballot; 3) Direct Recording Electronic (DRE) ballots. When asked about their preferred system for marking their ballots, respondents to the countywide survey demonstrated a greater preference for DRE and Optical Scan ballots, 43% and 19% respectively. Preferences had some variation depending on socioeconomic variables such as educational attainment, income, age, etc.
A more in-depth look at some of our results from focus groups provided additional perspective on the various modes. In general, there is a strong value placed by voters on having a paper record of their ballot. The paper ballot provides them a sense of assurance that, if need be, things could be re-verified to demonstrate accuracy and security.
� In our focus groups some voters cited having a paper trail as one of the most important attributes of any system that produces a paper ballot;
� Our focus groups also found that voters value DREs because they are viewed as easy-to-use. However, the value was qualified by a number of voters with their strong desire for a paper record as a back-up or record of votes cast. Concerns about the ease of use of the system for certain demographics, in particular seniors, were also cited.
� Ballot marking devices were seen as ideal because they provide the ease of use of a touchscreen interface and can produce a paper ballot.
It is important to note however, that the sense of assurance that a paper ballot provides did not necessarily equate to full trust in hand counted paper ballot systems. Results from our countywide survey found that hand counted paper ballot systems are seen as the most vulnerable to tampering and fraud. Nearly two thirds (65%) of countywide respondents identified traditional paper ballot systems as “easy for dishonest people to steal votes.”
� �
VSAP Board Update July 9, 2010
Page 10 of 12
Respectively, 41% and 43% said the same thing about optical scan ballots and DRE ballots.
Voters in Los Angeles County place high value on accuracy, security, reliability, and ease-of-use. Specifically, when it comes to how that manifests itself in a voting system, a paper ballot was a strong attribute to preserve and ensure. However, ease-of-use will also be a priority and consideration for seeking out reliable ballot marking methods.
Acquisition and Development
The process by which the County secures its future voting system will play an important role in setting the foundation for voter trust in the system and also for the level of flexibility and options that will be available to the County, at least cost effectively. Voters, local officials, and RR/CC staff agreed that the County must seek out an acquisition/development model that affords the County maximum control over the voting system and one that exemplifies a strong public-private venture.
Voting system development and acquisition is driven primarily by a private vendor market.Most states and counties purchase/lease voting systems from commercial vendors. The contractual agreements in this model usually involve a lot of proprietary information that cannot be disclosed to the election officials or the public. In addition, most contracts – and current voting systems regulatory framework -- also place a number of restrictions on the ability of the election official to make modifications to the system, whether by agreement or by restricting access to proprietary source code.
The project found that all stakeholders give the highest level of trust and flexibility to a model that will give the RR/CC full control of source code, minimize private ownership, and to the extent possible explore the involvement of non-commercial, non-profit, stakeholders such as other government agencies or academic institutions.
Recommendations/Next Steps
The following recommendations are presented for your consideration and further discussion:
� Consult with the Board of Supervisors and the Chief Executive Officer to explore the establishment of an advisory committee to be tasked with advising/working with the RR/CC in developing specific requirements that align with the key preliminary findings of this research (e.g. core values of flexibility, security, accuracy, and user friendliness);
� �
VSAP Board Update July 9, 2010
Page 11 of 12
� Work with the Chief Executive Officer to identify and develop appropriate acquisition and/or development models (e.g. public/private partnerships, or turn key projects) that will help the County meet the technical requirements as well as the strategic objective of strong voter trust and maximum flexibility for the County. Prospective models identified will be presented to your board for due consideration;
� Continue to work with the California Institute of Technology and the Massachusetts Institute of Technology through the Voting Technology Project and the James Irvine Foundation to conduct additional benchmarking research and continue to coordinate a stakeholder input model through this process.
Conclusion
The successful implementation of this preliminary phase of the Voting Systems Assessment Project has provided the project a solid first step. More importantly, the data compiled has given us the ability to make informed decisions based solidly on empirical data; a sound foundation for the complex decisions that lie ahead.
The initial findings from our research allow us to draw some concrete conclusions, if only preliminarily:
1. The collaborative partnership with academia via the Voting Technology Project provides for sound research guidance to ensure data gathered is reliable and proper research standards are applied. More importantly, these partnerships open the doors for more creative thinking and expert input;
2. Los Angeles County enjoys a generally positive outlook from voters, when it comes to voter trust that their votes are counted as intended;
3. Implementation of new voting systems requires early, large scale, sustained voter education. Early voter education efforts need to address voter understanding of ballot processing;
4. Transparency throughout the acquisition/development and implementation process is critical to establish a fundamental sense of voter trust in the system;
5. There are four cores values that must be clearly articulated in system requirements and more importantly demonstrated in any new voting systems—accuracy, security, reliability, and easy-to-use;
6. A physical and auditable paper record of a voter’s vote must be an essential component of any future voting system for Los Angeles County;
� �
VSAP Board Update July 9, 2010
Page 12 of 12
7. The voting system acquisition/development process should identify a model that provides for maximum County control over voting system programming and maintenance.
The mission of the Department is to provide the voters of Los Angeles County fair, transparent, and accessible elections. We are fully committed to fulfilling our mission by ensuring that the voting systems used to conduct elections meet current and future needs of voters. The Voting Systems Assessment Project is an excellent example and the primary vehicle by which we hope to accomplish the goal of implementing a new and enhanced voting system for the County.�
� �
Voting Systems Assessment Project
2010 Survey of the Performance of LA County Elections Spring 2010 Study
Initial Survey Report [DRAFT]
June 24, 2010
R. Michael Alvarez and Charles Stewart III Caltech/MIT Voting Technology Project
We wish to acknowledge the financial support of the John L. and James S. Knight Foundation, for providing the resources for this survey research project as part of a grant to the Caltech/MIT Voting Technology Project. The James Irvine Foundation also provided financial support for this study, through a grant to the Caltech/MIT Voting Technology Project in support of the Voting Systems Assessment Project.
2
Executive Summary
As part of the Voting Systems Assessment Project (VSAP) we developed and implemented surveys of registered voters from Los Angeles County. These surveys, largely patterned on previous voter experience surveys that we have fielded since 2007, were conducted in March 2010, using both a telephone and Internet mode. In this report we present results from two sections of those surveys, focusing our attention here on the experiences of registered voters in our samples using the existing InkaVote Plus system, and then on an analysis of their opinions about the necessary attributes of a voting system for Los Angeles County.
3
Introduction
A major goal of the Voting Systems Assessment Project is to gauge attitudes of Los Angeles County voters toward the current election system and systems that might be adopted in the future. If the desires of County residents are to be taken seriously, attitudes must be measured at regular intervals. If a major goal is the improvement of how the election system operates in Los Angeles County, it is important to establish a set of performance benchmarks against which future systems can be judged.
Election systems are typical of much government infrastructure, insofar as most people don’t give them a second thought, except in those rare cases where the system is judged against exacting criteria, as in a recount, or when it fails catastrophically, as in Palm Beach County, Florida in 2000. Unlike most critical government infrastructure, citizens encounter voting systems very infrequently. Because citizens rarely give voting systems careful consideration, in assessing residents’ attitudes toward voting in Los Angeles County, we must keep in mind that we may be tapping into opinions that are volatile and subject to manipulation, by circumstances, study design, etc. Therefore, it is best to regard the findings reported below as preliminary. They are a starting point in assessment, not the end. We expect that attitudes will evolve in the near future, as the assessment project itself evolves and as the quality of the current voting system becomes more salient in the County’s affairs.
The results reported below are based on parallel surveys, one conducted by the Internet and one by telephone. The Internet survey netted 500 observations, while the phone survey is based on 651 observations. The results are generally consistent across the two survey modes, but not always. The differences in responses that appear across the two survey modes are most likely due to the uncertainty of voter opinions in this domain, not the superiority of one survey mode over the other.
The overall view of the voting system in LA County is positive. Reflecting on their experience in the 2008 general election, 88% of Internet respondents said they were either “very confident” or “somewhat confident” their own vote was counted as intended; 84% stated similar confidence levels that votes were counted as intended in the County as a whole. These numbers are comparable to statewide responses in a similar survey administered statewide in 2008, where 86% of Californians stated they were either “very confident” or “somewhat confident” their vote was counted as intended.1
At the same time, opinions are weakly formed, and likely subject to change, given new information, a changing economy, etc. One sign of the volatility of opinion about the LA County voting system is that opinions about voting systems seem to be different depending on whether we conduct the survey via the Internet or by telephone. These differences are unlikely due to demographic differences in the two samples. Furthermore, the answers themselves
1 The overall California confidence level was lower than the nation as a whole: 93% of all respondents to the nationwide study stated they were either “very confident” or “somewhat confident” their own vote was counted as intended. If LA County is lower than the national average that can probably be attributed to factors unique to California, rather than the County, per se.
4
elicited uncertainty directly. For instance, when asked if LA County’s InkaVote Plus system should be replaced, 49% of the Internet respondents and 25% of the telephone respondents answered “don’t know.”
The remainder of this report provides basic background about responses to two sets of questions, (1) attitudes toward different specific types of voting systems (optical scanning, paper ballots, etc.) and (2) attitudes toward generic characteristics of voting systems, such as accuracy and usability. In addition, it provides information about the two samples employed, telephone and Internet.
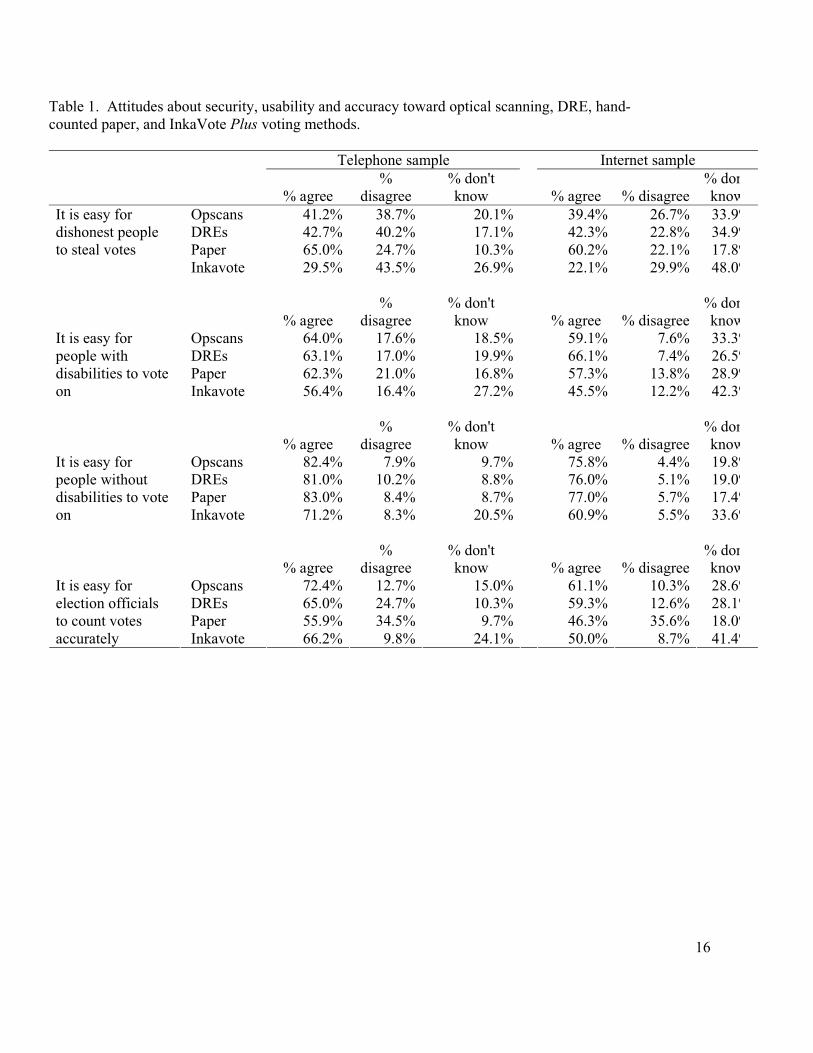
Comparisons among four systems: optical scanning, DREs, hand-counted paper, and InkaVote Plus
In both the telephone and Internet surveys we asked voters to express their opinions about the current InkaVote Plus system and about the three principal types of voting systems used in other parts of the country, optically-scanned ballots (opscans), traditional paper ballots (paper), and direct recording electronic (DRE) machines.
The section about attitudes toward voting systems was prefaced with the following statement:
When communities decide what kind of voting equipment to use, they are very interested in how well it performs. Different methods of voting might be better than others. Please tell us how you feel about the following voting methods, based either on your personal experience, or what you have read or heard from others.
Then, respondents were presented with four succeeding screens (for the Internet sample) or subsections (for the telephone sample), one for each technology type. Each section/screen introduced the relevant technology, followed by a series of identical statements concerning the technology. For instance, the first technology we asked about was optically scanned paper ballots. The introductory sentence was, “What are your opinions about paper ballots with all the candidates and races printed on them that are then scanned and counted by a computer?” Respondents were then asked to agree or disagree with the following four statements:
� It is easy for dishonest people to steal votes [We will refer to this feature as “security.”] � It is easy for people with disabilities to vote on [We will refer to this feature as “usability
for the disabled.”] � It is easy for people without disabilities to vote on [We will refer to this feature as
“usability for the non-disabled.”] � It is easy for election officials to count votes accurately [We will refer to this feature as
“accuracy.”]
The prompt for DREs was “What are your opinions about electronic voting machines, that is, voting machines with a touch screen, like an ATM machine?”; the introductory question for paper ballots was “What are your opinions about paper ballots that are counted by hand?”; and
5
the sentence for InkaVote Plus was “What are your opinions about the InkaVote Plus system currently used in Los Angeles County?”
Overall results are given in Table 1.
We start by focusing on attitudes toward the InkaVote Plus system. The first thing that stands out is that, in contrast with the other systems, voters were more likely to answer, “don’t know” when asked their opinion of InkaVote Plus. In the telephone sample, 26.9% of respondents said they did not know whether it was easy for dishonest people to steal votes with InkaVote Plus,compared to 20.1% for opscans, 17.1% for DREs, and 10.3% for paper. The patterns were similar for the Internet respondents, although the overall level of “don’t know” responses was higher across-the-board.2
The relatively large number of respondents who stated they did not know enough about InkaVotePlus to have opinions about security, accuracy, and usability is surprising, since virtually all LA County voters have had actual experiences with InkaVote Plus, whereas presumably only a minority of voters have had experiences with other voting systems from voting in other jurisdictions.
Voters were much less likely to agree that it is “easy for dishonest people to steal votes” using InkaVote Plus, compared to the other three voting systems — 29.5% of the telephone survey felt that vote-stealing was easy on the InkaVote Plus, compared to 41.2% on opscans, 42.7% on DREs, and 65.0% on paper ballots. On the other performance dimensions that we asked about — usability for disabled and non-disabled voters and accuracy —the InkaVote Plus was judged to be similar to the other voting methods.
Focusing our attention to the three other voting systems, voters were more likely to agree that traditional paper ballots made it easy for dishonest people to steal elections and were less likely to agree that paper was easy for county officials to count accurately. In the telephone sample, 65.0% of voters agreed that it was easy for dishonest people to steal elections with paper ballots, compared to the 41.2% who said the same thing about opscans and 42.7% who said the same about DREs. (A very similar comparison is evident in the Internet sample.) At the same time, responses concerning the usability of hand-counted paper were similar to responses concerning opscans and DREs. For instance, 62.3% of the telephone sample stated that paper was easy for people with disabilities to vote on, compared to 64.0% who said the same about opscans and 63.1% about DREs. Thus, in the minds of voters, paper offers no usability advantages over the two computer-assisted methods while presenting more problems in terms of security and accuracy.
2 As a general matter, Internet respondents were significantly more likely to answer “don’t know” than telephone respondents. The pattern of “don’t know” responses across the two survey modes was analyzed. In general, items that had a large percentage of “don’t know” responses in one mode also had a large percentage of “don’t know” responses in the other mode. (Correlation across items is .93.) In addition, correlations in the percentage of respondents agreeing and disagreeing across the two modes was very high (.95 for “agree” responses and .91 for “disagree” responses). Therefore, while there does appear to be a “mode effect, ” with Internet respondents more prone to answer “don’t know,” this does not affect the relative tendency of respondents to agree or disagree with statements about voting systems.
6
We finally focus on differences in the voters’ responses between opscans and DREs. The numbers reported in Table 1 admit to no obvious differences in attitudes about these two voting methods. The differences that do exist are either substantively minor or inconsistent across survey modes. For instance, voters in the telephone sample saw almost no difference between opscans and DREs in terms of usability for voters with disabilities, whereas voters in the Internet sample gave a nod to DREs (66.1%) over opscans (59.1%). On the whole, it does not appear that LA County voters regard generic DRE and opscan systems very differently, as far as usability, security, and accuracy are concerned.
Should InkaVote Plus be replaced?
Respondents were asked “Do you think that Los Angeles County should replace the current InkaVote Plus system?” As with attitudes toward the different voting systems that were explored in the previous section, respondents in the Internet sample were much less like to answer “don’t know” (49.4%) than in the phone sample (24.9%). With the different “don’t know” responses in mind, it is still telling that only minorities of respondents in both samples agreed that the InkaVote Plus should be replaced — 20.8% in the phone sample and 14.0% in the Internet sample.
Table 2 breaks the responses to this question down into demographic categories. There is some variability in the responses across demographic groups, but the most important pattern is that in all demographic categories, the percentage of respondents agreeing that the InkaVote Plussystem should be replaced is less than 30%.
Preferred systems for making and counting ballots
Respondents were asked two questions intended to understand which system they most desired to mark and count ballots.3 The questions were these:
� Which kind of voting machine or method would you most prefer to use to mark your ballot?
� Which kind of voting machine or method would you most prefer to use to have your ballot counted?
The response categories for both questions, which were randomized for each respondent, were as follows:
� Paper ballot counted by hand � Paper ballot scanned and counted by a computer � Electronic voting machine with a touchscreen � InkaVote Plus system
3 In the telephone sample, these questions were only asked of respondents who had answered “yes” to the question about whether InkaVote should be replaced.
7
� Don’t know � Other (specify ___________)
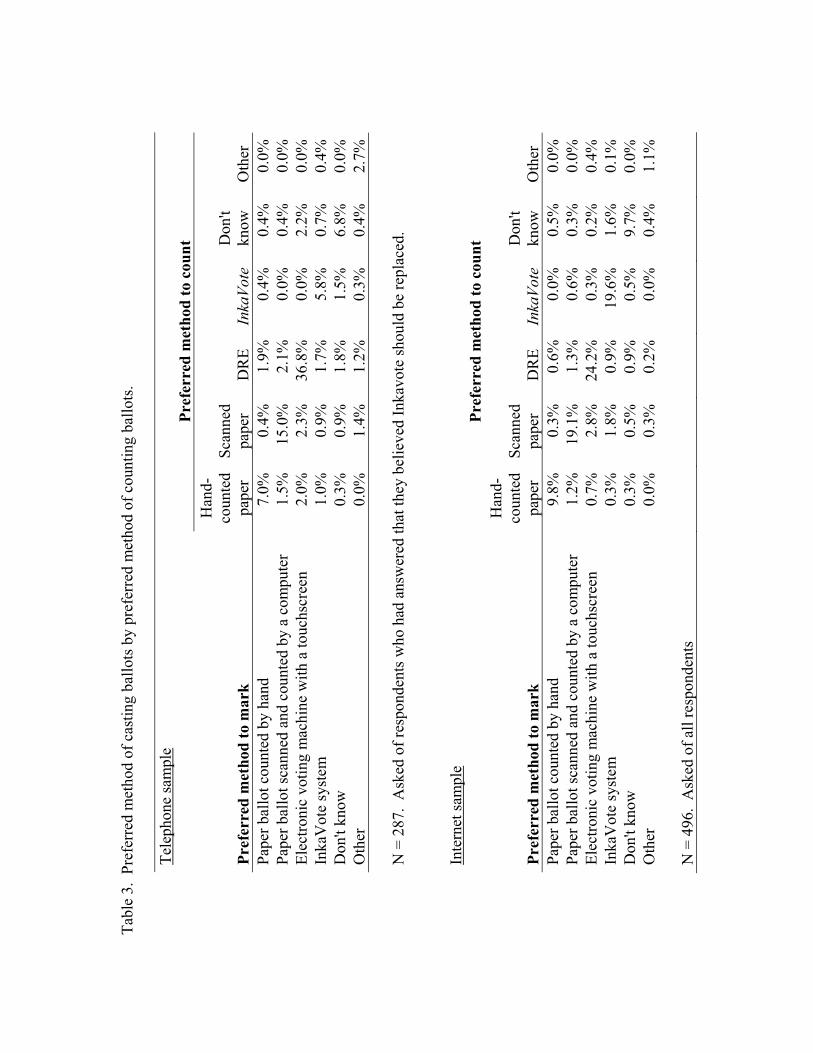
Table 3 reports a simple cross-tabulation of responses for the two questions.
Respondents by-and-large did not distinguish between how they would like their ballots marked and counted: 83.5% of respondents in the Internet sample and 74.1% of the phone sample chose the same methods for casting and counting ballots.
As noted in the previous footnote, in the Internet sample, respondents were asked about their most-preferred voting system, even if they answered “no” to the question about whether InkaVote Plus should be replaced. This allows us to probe attitudes of voters who may have expressed a preference for InkaVote Plus for non-performance reasons, for instance, because they believed that replacing the county’s voting system was not a high priority, compared to other uses of tax dollars.
Restricting our analysis to Internet respondents who stated that InkaVote Plus should be replaced, nearly half (48.7%) also reported that InkaVote Plus was their most preferred way to cast and count ballots. In addition to these respondents, 12.5% expressed a preference for using optical scanning to cast and count ballots, 9.5% expressed a preference for DREs, 5.4% preferred hand-counted paper, and 4.01% stated “don’t know” to both items.4 Almost 10% (9.5%) expressed a preference for casting ballots on InkaVote Plus while having them counted using another means. Other “mix-and-match” combinations occurred much less frequently.
Returning to attitudes about how InkaVote Plus might be replaced, we focus here on answers to the question about the preferred method to cast ballots. We do not focus on the question of counting ballots because the high correlation between the two sets of answers would make that analysis redundant.
Table 4 reports the preferred method of marking ballots for both the telephone and Internet samples. Even more than the other questions concerning preferred voting methods, the results depend on which survey method we use. Among respondents to the telephone survey, the most preferred method by far was the electronic voting machine (43.2%), followed by scanned paper ballot (19.0%), InkaVote Plus (10.5%), and hand-counted paper (10.2%). Opinions were more evenly spread among Internet respondents, with the electronic voting machine preferred by a small plurality (28.2%), followed by InkaVote Plus (24.3%), scanned paper (22.3%), and hand-counted paper (11.6%).
Attitudes broken down by demographics are reported in Tables 5 (telephone) and 6 (Internet). Some demographic variability in preferences for voting systems appears in the data, but the patterns are not always consistent across the two samples. Looking for the moment at the phone sample, there is little significant difference in preferences according to sex, disability status, or race. Respondents with less than a high school education are the rare category that gives substantial support to hand-counted paper — 26.0%, compared to 7.5% among those with a
4 Among those in the Internet survey who stated that InkaVote should be replaced, 43.4% expressed a preference for DREs, 22.2% for opscans, and 13.6% for hand-counted paper.
8
college degree. Low-income voters also provided some support for hand-counted paper (20.1% for those with incomes less than $15,000) compared to high-income voters (5.9% for incomes over $100,000). Older voters are more likely to support hand-counted paper and less likely to support electronic voting. Only 2.5% of voters in the 18-to-29 age category most preferred paper, compared to 22.2% of those in the 65+ category. Conversely, 52.4% of votes in the 18-to-29 age category most preferred DREs, compared to 22.0% in the 65+ category. Finally, 12.8% of Democrats favored paper, compared to 5.7% of Republicans, while 39.4% of Democrats favored electronic machines, compared to 58.4% of Republicans.
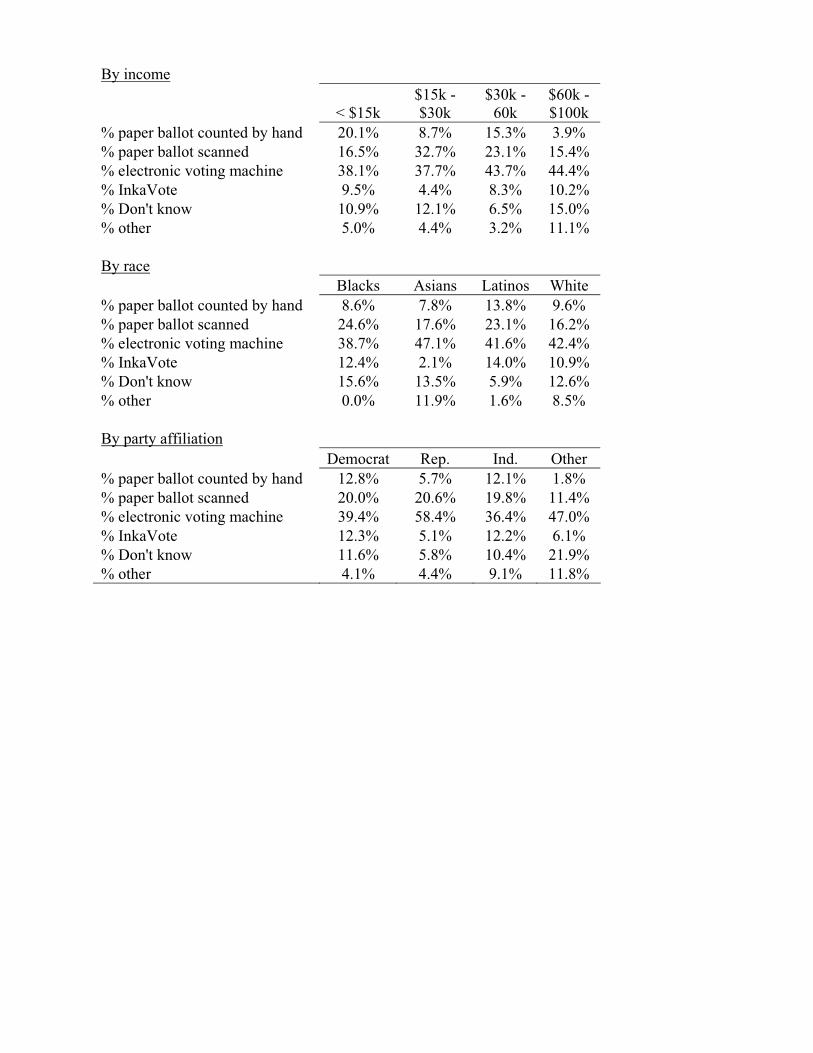
Turning our attention now to the Internet sample, there are significant differences in most of the demographic categories. Women were more supportive of electronic machines (33.7%) than men (21.9%), while men were more supportive of hand-counted paper (15.0% vs. 8.6%) and InkaVote Plus (29.1% vs. 20.2%). Non-disabled voters were more likely to express a top preference for electronic machines (30.2%), compared to disabled voters (18.8%). As with the phone sample, there was a trend in favor of hand-counted paper among respondents with less than a high school education and incomes less than $15,000 per year, and a similar trend among voters with a college degree or post-college education to be more likely to support electronic machines. Unlike the phone survey, older voters in the Internet sample were not more favorably inclined to hand-counted paper, but older voters were similarly less inclined toward electronic machines. Black and Asian respondents gave plurality support to electronic voting machines (37.6% and 43.5%, respectively), while Latino and White respondents were more evenly divided in their responses. (Latinos gave 16.1% support to hand-counted paper, 29.0% to scanned ballots, 23.8% to electronic machines, and 22.6% to InkaVote Plus. The White support numbers were 7.1%, 20.7%, 27.6%, and 28.5%, respectively.) Finally, there was a similar difference in support for paper along partisan lines. Among Democrats, 15.6% most supported hand-counted paper, compared to 1.6% of Republicans. While Republicans tended to favor the InkaVote Plus(38.9%) more than Democrats (22.3%), there was no appreciable difference in how voters from the two parties preferred electronic machines (28.0% for Democrats vs. 25.2% for Republicans.)
Voting System Attributes
In both the telephone and Internet surveys, we asked voters to rank their voting system values. The question we used was worded: “From the following list, which attribute do you feel is the most important in a voting method (examples of voting methods are electronic voting machines, paper ballots counted by hand, and paper ballots that are scanned and counted by a computer).” Voters were then given the following list of attributes: secure, cost-effective, easy to use, easy to use for voters with disabilities, easy to use for voters for whom English is not a first language, reliable, accurately counts votes, allows you to vote quickly, lets you easily check your ballot for errors, produce results faster on election night. Once they provided the first ranked response, voters were asked for a second attribute. In this section of the report, we discuss voter rankings of these voting system attributes.
We begin with the first and second rankings from the two surveys, provided in Table 7. The responses are ordered in this, and all remaining tables in this section, by their first rankings given by voters in the telephone survey.
9
Accuracy is the most important first-ranking attribute, in both of our surveys. In the telephone survey, 24.7% of voters ranked accuracy as their first priority, while in the Internet survey 35.5% of those voters ranked accuracy first. Accuracy was ranked second by 15% in the telephone survey, and 19.2% in the Internet survey. These results indicate that Los Angeles County voters see accuracy as a very important voting system attribute.
In the telephone survey, the next three first rankings were secure (19.3%), reliable (17.0%) and easy to use (14.6%). These were also the next highest-ranked in the Internet survey, though their relative order was somewhat different in the Internet survey (32.6% secure, 10.2% easy to use, and 7.4% reliable).
Perhaps as important as the attributes that were high in voter’s rankings are those that were low in voter’s overall rankings. As seen in Table 7, in both surveys, voting quickly, being able to easily check one’s ballot, producing fast results, being cost effective, and being easy to use for both voters for whom English is not a first language and those with disabilities, were given a first ranking by few Los Angeles County voters. This is not to say that these are not important voting system attributes, but only that when we examine the distributions of responses for the broad population of Los Angeles County voters that they are not the highest ranked attributes.
In Table 8 we provide the same information on first-ranked voting system attributes for each survey sample, by voter gender and disability status.5 In both samples we see that men are more likely to prioritize accuracy, a difference that is more pronounced in the telephone sample than the Internet sample. The other important difference we see by gender is that women are more likely to prioritize easy to use in both samples.
For those voters who are disabled or who have a disabled person in their household, we see a greater emphasis on ease-of-use for voters with disabilities (especially in the Internet sample) and ease of use for voters for whom English is not their primary language (especially in the telephone sample). We also see that disabled voters are less likely to prioritize voting system security, primarily in the telephone sample.
Next we examine voting system attribute priorities by age (Table 9). We classify voters into five age groups; 18-to-29, 30-to-35, 36-to-50, 51-to-65 and older than 65. The data are presented in Table 9, with the telephone respondents given in the top panel and the Internet respondents in the bottom panel. The young (18 to 29 year old) voters in the telephone sample were less likely to rank accuracy, security or ease of use as top-ranked attributes than the voters older than 29. The young voters in the telephone sample were more likely to say that voting quickly, cost-effectiveness, and ease of use for voters with disabilities or those from whom English was not their primary language were top-ranked. But in the Internet sample, young voters were very likely to rank security as a top attribute (43%), followed by accuracy.
5 In our surveys we asked voters “Does a health problem, disability, or handicap currently keep you or a member of your household from participating fully in work, school, housework, or other activities?” If the voter responded “yes” to the first three (indicating that they, a member of their household, or both themselves and a member of their household had a disability, health problem or handicap) they were categorized for the purposes of this analysis as disabled or with a disabled member in their household.
10
In Table 10 we present voting system attributes by educational attainment. In the telephone survey (top panel) we see that those with a high school degree or less were less likely to rank accuracy, security, or reliability first, relative to those with higher levels of educational attainment. On the other hand, the voters with a high school education or less were more likely to rank first ease of use for voters with disabilities and those for whom English is not their primary language. In the Internet sample (bottom panel) we see that voters with post-graduate education were very focused on accuracy (41.9%) and security (41.3%); voters with a high school education or less were more likely to rank overall ease of use first in the Internet sample.
The responses on voting system attributes by voter income are given in Table 11; here we classify voters into five income categories, with a household income of less than $15,000, between $15,000 and $29,999, between $30,000 and $59,999, between $60,000 and $99,999, and greater than $100,000. Starting with the telephone sample in the top panel, we see results that are generally consistent with the results in Table 10 (educational attainment). Voters who had a household income of less than $15,000 were less likely to rank accuracy, security or reliability first; they were more likely to rank first ease of use for voters with disabilities or those for whom English is not their primary language. In the bottom panel (Internet sample), we also see results consistent with those seen in Table 10; voters who had household incomes of greater than $100,000 were very likely to rank accuracy (44.5%) or security (33.1%) first.
Next, in Table 12 we provide the first-rankings of voting system attributes by partisanship (Democratic, Republican, Independent or Other). The top panel gives the telephone survey responses. There we see that Democratic voters in the telephone survey ranked accuracy, security, reliability, and general ease-of-use first (in that respective order). Republicans, though, ranked reliability first, slightly more frequently than accuracy, followed by security and general ease of use. Like Democrats, Independents were most likely to rank accuracy and security first.
In the Internet sample, see that those voters are much more likely to first-rank accuracy or security, regardless of partisanship. Thirty-four percent of Democratic voters ranked security first, with 31.7% ranking accuracy first. Forth percent of Republicans, 36.8% of Independents and 67.1% of Other partisans ranked accuracy first in the Internet sample. It is also worth noting here that in the Internet sample (like the telephone sample) general ease of use was ranked by a number of Democratic voters first.
Last, we examine the first-rankings of voting system attributes by the racial/ethnic identity of the voters in the two samples. In Table 13 we look at Black, Asian, Latino and White voters, with telephone survey respondents in the top panel and Internet survey respondents in the bottom panel. Starting with the telephone survey respondents, we see that Black voters ranked reliability most frequently (28.4%), followed by accuracy (24.1%) and general ease of use. Asians voters, though, most frequently ranked accuracy first (29.9%), followed by security, reliability, ease of use and ease of use for voters for whom English is not the primary language. Interestingly, Latino voters were very heterogeneous in their first-rankings of voting system attributes, with nearly equal percentages ranking accuracy, security, reliability, and general ease of use. Also, 10.8% of Latino voters in the telephone sample ranked ease of use for voters for whom English is not their primary language. In the Internet sample, we see that Black voters rated security and
11
accuracy first most frequently, followed by general ease of use. Latinos, Asians and Whites were similar, though both of those groups of voters in the Internet sample were more likely to rate accuracy higher than security.
Discussion and Conclusions
The surveys of Los Angeles County registered voters that we implemented yield important information regarding voter opinions about the voting system they now use when they cast ballots, as well as their opinions about future alternative voting systems. Critically, our survey revealed that registered voters in Los Angeles County are currently quite positive in their assessment about how elections are administered; in the surveys we implemented, at least 8 out of every 10 registered voters expressed confidence that their vote was counted as they intended.
At the same time, our analysis also indicates that attitudes and evaluations of the existing InkaVote Plus system used in Los Angeles County, while positive, are subject to some uncertainty. For example, when we asked registered voters to evaluate InkaVote Plus (relative to other potential voting systems), we found that many registered voters were unable or unwilling to give a response about InkaVote Plus: in our telephone survey, between 20% and 27% of registered voters did not provide an opinion about whether InkaVote Plus made it easy for dishonest people to steal votes, whether it made it easy for people with disabilities to vote, if it is easy for voters without disabilities to use, and whether it is accurate. Higher percentages of registered voters who did not express an opinion on these same questions were seen in our Internet survey.
Overall, when in we asked registered voters about their values regarding voting systems, we found two values predominated --- accuracy and security. In both samples, registered voters were most likely to rank accuracy first (24.7% in our telephone sample and 35.5% in our Internet sample), with security a close second in terms of first rankings (19.3% in the telephone survey and 32.6% in the Internet survey). We also found that many registered voters valued reliability and general ease of use.
These survey results are preliminary, in the sense that this is the first time that we are aware that surveys of this nature have been conducted in Los Angeles County. These results should thus be seen as a preliminary baseline, and as the VSAP effort evolves voter evaluation surveys like these should be conducted to assess how and in what ways voter opinions are changing over time.
12
Survey Methodologies
Telephone Survey
The telephone survey component of the 2010 VSAP voter survey was in the field between March 11, 2010 and March 29, 2010. The questionnaire was developed using similar voter experience surveys that have been fielded in recent years. The 2010 VSAP voter survey was a mixed mode survey, with some of the interviewing being done by telephone and some over the Internet. This section discusses the telephone survey methodology.
For the telephone survey, the population consisted of registered voters in Los Angeles County. Interviewing Services of America, Inc. (ISA) provided research support for the telephone survey. ISA obtained a randomly selected sample of 43,652 Los Angeles County voters whose voting record had been matched to a telephone number. Of those, 7,096 were cell phones and the remainder were landlines. Trained interviewers from ISA contacted potential respondents on both cell and land lines; 651 interviews were completed, 80 from cell phone numbers and 571 from landlines. Respondents were given the opportunity to take the interview in English, Spanish or Mandarin. Twenty-five Mandarin interviews were conducted, 51 Spanish-language interviews were conducted, and 575 were completed in English. The overall incidence rate for the survey was 0.8950.
The telephone survey data have been weighted on gender and age, using population information provided by the Los Angeles Registrar/Recorder County Clerk staff.
Internet Survey
The Internet survey component of the 2010 VSAP voter survey was in the field from March 16, 2010 through March 28, 2010. The survey was administered by YouGov/Polimetrix, using their PollingPoint panel. This report discusses the methodology of the Internet portion of the survey.
Sampling and Weighting Methodology for the Los Angeles County Study Survey Panel Data
The PollingPoint panel, a proprietary opt-in survey panel, is comprised of 1.6 million U.S. residents who have agreed to participate in YouGov/Polimetrix's Web surveys. At any given time, YouGov/Polimetrix maintains a minimum of five recruitment campaigns based on salient current events. Panel members are recruited by a number of methods and on a variety of topics to help ensure diversity in the panel population. Recruiting methods include Web advertising campaigns (public surveys), permission-based email campaigns, partner sponsored solicitations, telephone-to-Web recruitment (RDD based sampling), and mail-to-Web recruitment (Voter Registration Based Sampling).
The primary method of recruitment for the PollingPoint Panel is Web advertising campaigns that appear based on keyword searches. In practice, a search in Google may prompt an active PollingPoint advertisement soliciting opinion on the search topic. At the conclusion of the short
13
survey respondents are invited to join the PollingPoint panel in order to receive and participate in additional surveys. After a double opt-in procedure, where respondents must confirm their consent by responding to an email, the database checks to ensure the newly recruited panelist is in fact new and that the address information provided is valid.
Additionally, YouGov/Polimetrix augments their panel with difficult-to-recruit respondents by soliciting panelists in telephone and mail surveys. For example, in the fall and winter of 2006, YouGov/Polimetrix completed telephone interviews using RDD sampling and invited respondents to join the online panel. Respondents provided a working email where they could confirm their consent and request to receive online survey invitations. YouGov/Polimetrix also employed registration based sampling, inviting respondents to complete a pre-election survey online. At the conclusion of that survey, respondents were invited to become PollingPoint members and receive additional survey invitations at their email address.
Sampling and Sample Matching
Sample matching is a methodology for selection of “representative” samples from non-randomly selected pools of respondents. It is ideally suited for Web access panels, but could also be used for other types of surveys, such as phone surveys. Sample matching starts with an enumeration of the target population. For general population studies, the target population is all adults, and can be enumerated through the use of the decennial Census or a high quality survey, such as the American Community Survey. In other contexts, this is known as the sampling frame, though, unlike conventional sampling, the sample is not drawn from the frame. Traditional sampling, then, selects individuals from the sampling frame at random for participation in the study. This may not be feasible or economical as the contact information, especially email addresses, is not available for all individuals in the frame and refusals to participate increase the costs of sampling in this way.
Sample selection using the matching methodology is a two-stage process. First, a random sample is drawn from the target population. We can call this sample the target sample. Details on how the target sample is drawn are provided below, but the essential idea is that this sample is a true probability sample and thus representative of the frame from which it was drawn.
Second, for each member of the target sample, we can select one or more matching members from our pool of opt-in respondents. This is called the matched sample. Matching is accomplished using a large set of variables that are available in consumer and voter databases for both the target population and the opt-in panel.
The purpose of matching is to find an available respondent who is as similar as possible to the selected member of the target sample. The result is a sample of respondents who have the same measured characteristics as the target sample. Under certain conditions, described below, the matched sample will have similar properties to a true random sample. That is, the matched sample mimics the characteristics of the target sample. It is, as far as can be told, “representative” of the target population (because it is similar to the target sample).
14
When choosing the matched sample, it is necessary to find the closest matching respondent in the panel of opt-ins to each member of the target sample. YouGov/Polimetrix employs the proximity matching method to find the closest matching respondent. For each variable used for matching, we can define a distance function, d(x,y), which describes how “close” the values xand y are on a particular attribute. The overall distance between a member of the target sample and a member of the panel is a weighted sum of the individual distance functions on each attribute. The weights can be adjusted for each study based upon which variables are thought to be important for that study, though, for the most part, YouGov/Polimetrix has not found the matching procedure to be sensitive to small adjustments of the weights. A large weight, on the other hand, forces the algorithm toward an exact match on that dimension.
Sampling Frame and Target Sample
YouGov/Polimetrix constructed a national sampling frame from the 2007 American Community Survey, including data on age, race, gender, education, marital status, number of children under 18, family income, employment status, citizenship, state, and metropolitan area. The frame was constructed by stratified sampling from the full 2007 ACS sample with selection within strata by weighted sampling with replacements (using the person weights on the public use file). Data on voter registration status and turnout were matched to this frame using the November 2006 Current Population Survey. Data on interest in politics and party identification were then matched to this frame from the 2007 Pew Religious Life survey, using the following variables for the match: age, race, gender, education, marital status, number of children under 18, family income, employment status, citizenship, state. The target sample of 500 Los Angeles County registered voters was selected with stratification by age, race, gender, education, and with simple random sampling within strata.
Weighting
Because matching is approximate, rather than exact, and response rates vary by group, the sample of completed interviews normally shows small amounts of imbalance that can be corrected by post-stratification weighting.
Raking, first proposed in 1940 by Deming and Stephan,6 adjusts an initial set of weights to match a known set of population marginals, using a method of iterative proportional fitting.7 In this procedure, the weights are adjusted sequentially to match the marginal distribution of each weight variable. The process proceeds until all marginals are matched. It does not require any information about the joint distribution of the variables (though, if these data are available and believed to be important, they can be employed by defining a marginal distribution involving a cross-classification of two variables).
6 W. Edwards Deming and Frederick F. Stephan, “On least squares adjustment of a sampled frequency table when the expected marginal totals are known,” The Annals of Mathematical Statistics, vol. 11 no. 4 (Dec. 1940), pp. 427–444.7 See Yvonne M.M. Bishop, Stephen E. Fienberg, and Paul W. Holland, Discrete multivariate analysis: Theory and practice, Cambridge, Mass., MIT, for details.
15
YouGov/Polimetrix calculated post-stratification weights by raking the completed interviews to known marginals for registered voters in Los Angeles County from the November 2006 Current Population Survey and Pew Religious Life survey for the following variables: age, race, gender, and education.
Other Information
Additional details, including a topline report, can be obtained from the authors.
16
Table 1. Attitudes about security, usability and accuracy toward optical scanning, DRE, hand-counted paper, and InkaVote Plus voting methods.
Telephone sample Internet sample
% agree %
disagree % don't know % agree % disagree
% donknow
Opscans 41.2% 38.7% 20.1% 39.4% 26.7% 33.9% DREs 42.7% 40.2% 17.1% 42.3% 22.8% 34.9% Paper 65.0% 24.7% 10.3% 60.2% 22.1% 17.8%
It is easy for dishonest people to steal votes
Inkavote 29.5% 43.5% 26.9% 22.1% 29.9% 48.0%
% agree %
disagree % don't know % agree % disagree
% donknow
Opscans 64.0% 17.6% 18.5% 59.1% 7.6% 33.3% DREs 63.1% 17.0% 19.9% 66.1% 7.4% 26.5% Paper 62.3% 21.0% 16.8% 57.3% 13.8% 28.9%
It is easy for people with disabilities to vote on Inkavote 56.4% 16.4% 27.2% 45.5% 12.2% 42.3%
% agree %
disagree % don't know % agree % disagree
% donknow
Opscans 82.4% 7.9% 9.7% 75.8% 4.4% 19.8% DREs 81.0% 10.2% 8.8% 76.0% 5.1% 19.0% Paper 83.0% 8.4% 8.7% 77.0% 5.7% 17.4%
It is easy for people without disabilities to vote on Inkavote 71.2% 8.3% 20.5% 60.9% 5.5% 33.6%
% agree %
disagree % don't know % agree % disagree
% donknow
Opscans 72.4% 12.7% 15.0% 61.1% 10.3% 28.6% DREs 65.0% 24.7% 10.3% 59.3% 12.6% 28.1% Paper 55.9% 34.5% 9.7% 46.3% 35.6% 18.0%
It is easy for election officials to count votes accurately Inkavote 66.2% 9.8% 24.1% 50.0% 8.7% 41.4%
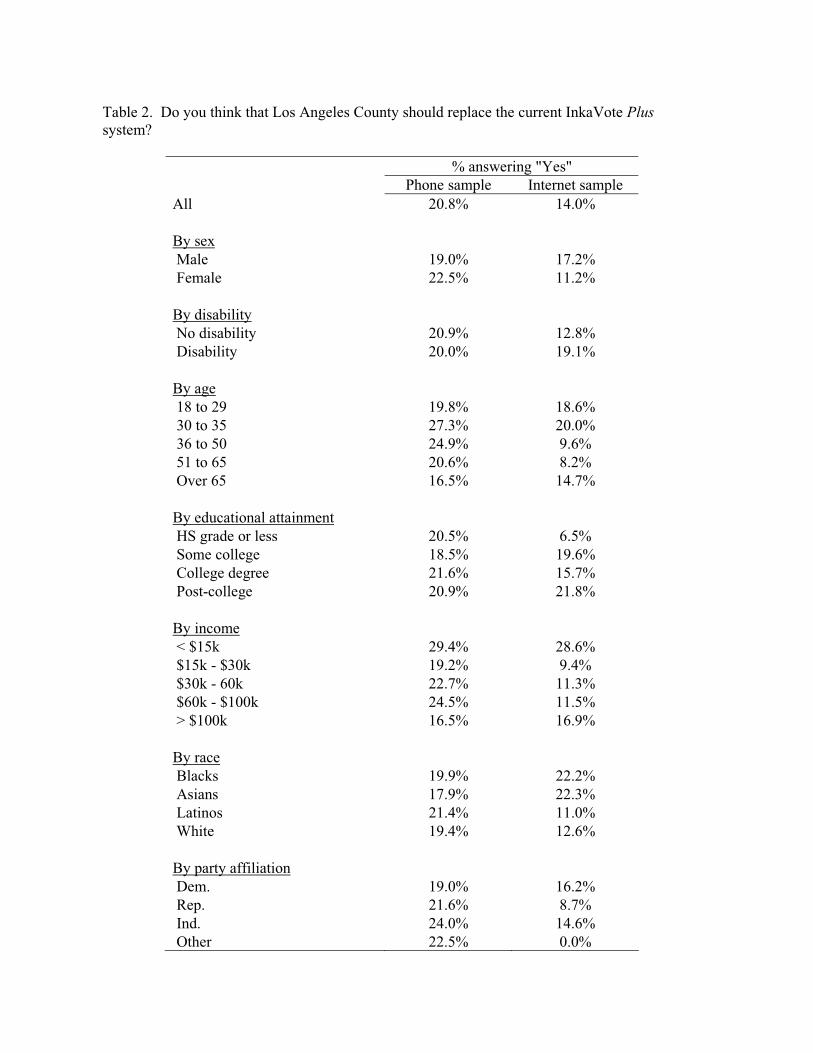
Table 2. Do you think that Los Angeles County should replace the current InkaVote Plussystem?
% answering "Yes" Phone sample Internet sample
All 20.8% 14.0%
By sex Male 19.0% 17.2% Female 22.5% 11.2% By disability No disability 20.9% 12.8% Disability 20.0% 19.1% By age 18 to 29 19.8% 18.6% 30 to 35 27.3% 20.0% 36 to 50 24.9% 9.6% 51 to 65 20.6% 8.2% Over 65 16.5% 14.7% By educational attainment HS grade or less 20.5% 6.5% Some college 18.5% 19.6% College degree 21.6% 15.7% Post-college 20.9% 21.8% By income < $15k 29.4% 28.6% $15k - $30k 19.2% 9.4% $30k - 60k 22.7% 11.3% $60k - $100k 24.5% 11.5% > $100k 16.5% 16.9% By race Blacks 19.9% 22.2% Asians 17.9% 22.3% Latinos 21.4% 11.0% White 19.4% 12.6% By party affiliation Dem. 19.0% 16.2% Rep. 21.6% 8.7% Ind. 24.0% 14.6% Other 22.5% 0.0%
Tabl
e 3.
Pre
ferr
ed m
etho
d of
cas
ting
ballo
ts b
y pr
efer
red
met
hod
of c
ount
ing
ballo
ts.
Tele
phon
e sa
mpl
e
Pr
efer
red
met
hod
to c
ount
Pref
erre
d m
etho
d to
mar
k
Han
d-co
unte
dpa
per
Scan
ned
pape
r D
RE
Inka
Vote
Don
'tkn
ow
Oth
er
Pape
r bal
lot c
ount
ed b
y ha
nd
7.0%
0.4%
1.9%
0.4%
0.4%
0.0%
Pape
r bal
lot s
cann
ed a
nd c
ount
ed b
y a
com
pute
r 1.
5%15
.0%
2.1%
0.0%
0.4%
0.0%
Elec
troni
c vo
ting
mac
hine
with
a to
uchs
cree
n 2.
0%2.
3%36
.8%
0.0%
2.2%
0.0%
Inka
Vot
e sy
stem
1.
0%0.
9%1.
7%5.
8%0.
7%0.
4%D
on't
know
0.
3%0.
9%1.
8%1.
5%6.
8%0.
0%O
ther
0.
0%1.
4%1.
2%0.
3%0.
4%2.
7%
N =
287
. A
sked
of r
espo
nden
ts w
ho h
ad a
nsw
ered
that
they
bel
ieve
d In
kavo
te sh
ould
be
repl
aced
.
Inte
rnet
sam
ple
Pref
erre
d m
etho
d to
cou
nt
Pref
erre
d m
etho
d to
mar
k
Han
d-co
unte
dpa
per
Scan
ned
pape
r D
RE
Inka
Vote
Don
'tkn
ow
Oth
er
Pape
r bal
lot c
ount
ed b
y ha
nd
9.8%
0.3%
0.6%
0.0%
0.5%
0.0%
Pape
r bal
lot s
cann
ed a
nd c
ount
ed b
y a
com
pute
r 1.
2%19
.1%
1.3%
0.6%
0.3%
0.0%
Elec
troni
c vo
ting
mac
hine
with
a to
uchs
cree
n 0.
7%2.
8%24
.2%
0.3%
0.2%
0.4%
Inka
Vot
e sy
stem
0.
3%1.
8%0.
9%19
.6%
1.6%
0.1%
Don
't kn
ow
0.3%
0.5%
0.9%
0.5%
9.7%
0.0%
Oth
er
0.0%
0.3%
0.2%
0.0%
0.4%
1.1%
N
= 4
96.
Ask
ed o
f all
resp
onde
nts
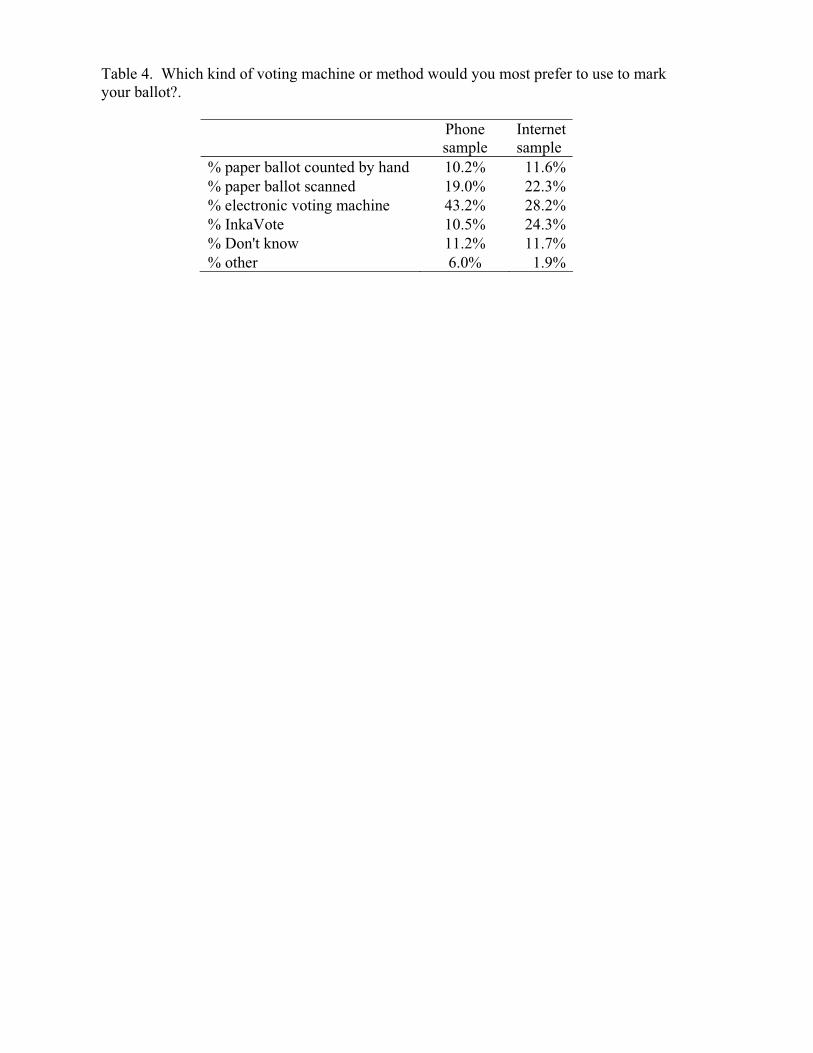
Table 4. Which kind of voting machine or method would you most prefer to use to mark your ballot?.
Phone sample
Internet sample
% paper ballot counted by hand 10.2% 11.6%% paper ballot scanned 19.0% 22.3%% electronic voting machine 43.2% 28.2%% InkaVote 10.5% 24.3%% Don't know 11.2% 11.7%% other 6.0% 1.9%
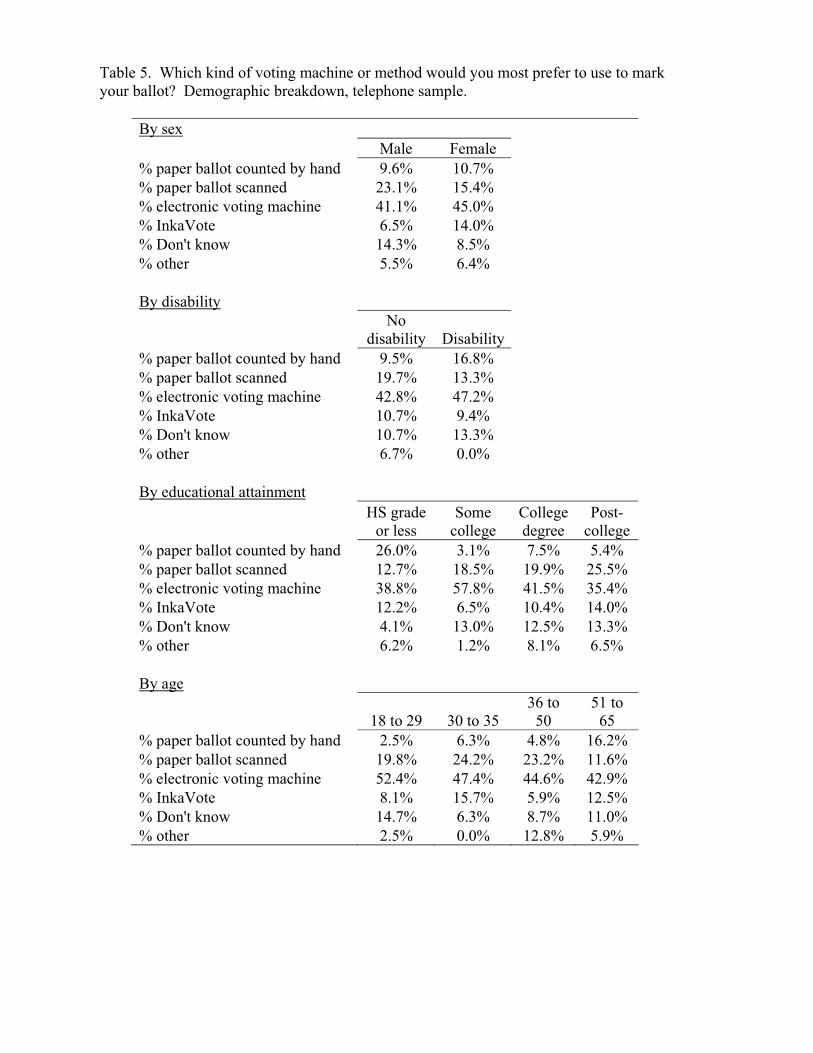
Table 5. Which kind of voting machine or method would you most prefer to use to mark your ballot? Demographic breakdown, telephone sample.
By sex Male Female % paper ballot counted by hand 9.6% 10.7% % paper ballot scanned 23.1% 15.4% % electronic voting machine 41.1% 45.0% % InkaVote 6.5% 14.0% % Don't know 14.3% 8.5% % other 5.5% 6.4% By disability
No disability Disability
% paper ballot counted by hand 9.5% 16.8% % paper ballot scanned 19.7% 13.3% % electronic voting machine 42.8% 47.2% % InkaVote 10.7% 9.4% % Don't know 10.7% 13.3% % other 6.7% 0.0% By educational attainment
HS grade or less
Some college
College degree
Post-college
% paper ballot counted by hand 26.0% 3.1% 7.5% 5.4% % paper ballot scanned 12.7% 18.5% 19.9% 25.5% % electronic voting machine 38.8% 57.8% 41.5% 35.4% % InkaVote 12.2% 6.5% 10.4% 14.0% % Don't know 4.1% 13.0% 12.5% 13.3% % other 6.2% 1.2% 8.1% 6.5% By age
18 to 29 30 to 35 36 to
5051 to
65 % paper ballot counted by hand 2.5% 6.3% 4.8% 16.2% % paper ballot scanned 19.8% 24.2% 23.2% 11.6% % electronic voting machine 52.4% 47.4% 44.6% 42.9% % InkaVote 8.1% 15.7% 5.9% 12.5% % Don't know 14.7% 6.3% 8.7% 11.0% % other 2.5% 0.0% 12.8% 5.9%
By income
< $15k $15k - $30k
$30k - 60k
$60k - $100k
% paper ballot counted by hand 20.1% 8.7% 15.3% 3.9% % paper ballot scanned 16.5% 32.7% 23.1% 15.4% % electronic voting machine 38.1% 37.7% 43.7% 44.4% % InkaVote 9.5% 4.4% 8.3% 10.2% % Don't know 10.9% 12.1% 6.5% 15.0% % other 5.0% 4.4% 3.2% 11.1% By race Blacks Asians Latinos White % paper ballot counted by hand 8.6% 7.8% 13.8% 9.6% % paper ballot scanned 24.6% 17.6% 23.1% 16.2% % electronic voting machine 38.7% 47.1% 41.6% 42.4% % InkaVote 12.4% 2.1% 14.0% 10.9% % Don't know 15.6% 13.5% 5.9% 12.6% % other 0.0% 11.9% 1.6% 8.5% By party affiliation Democrat Rep. Ind. Other % paper ballot counted by hand 12.8% 5.7% 12.1% 1.8% % paper ballot scanned 20.0% 20.6% 19.8% 11.4% % electronic voting machine 39.4% 58.4% 36.4% 47.0% % InkaVote 12.3% 5.1% 12.2% 6.1% % Don't know 11.6% 5.8% 10.4% 21.9% % other 4.1% 4.4% 9.1% 11.8%
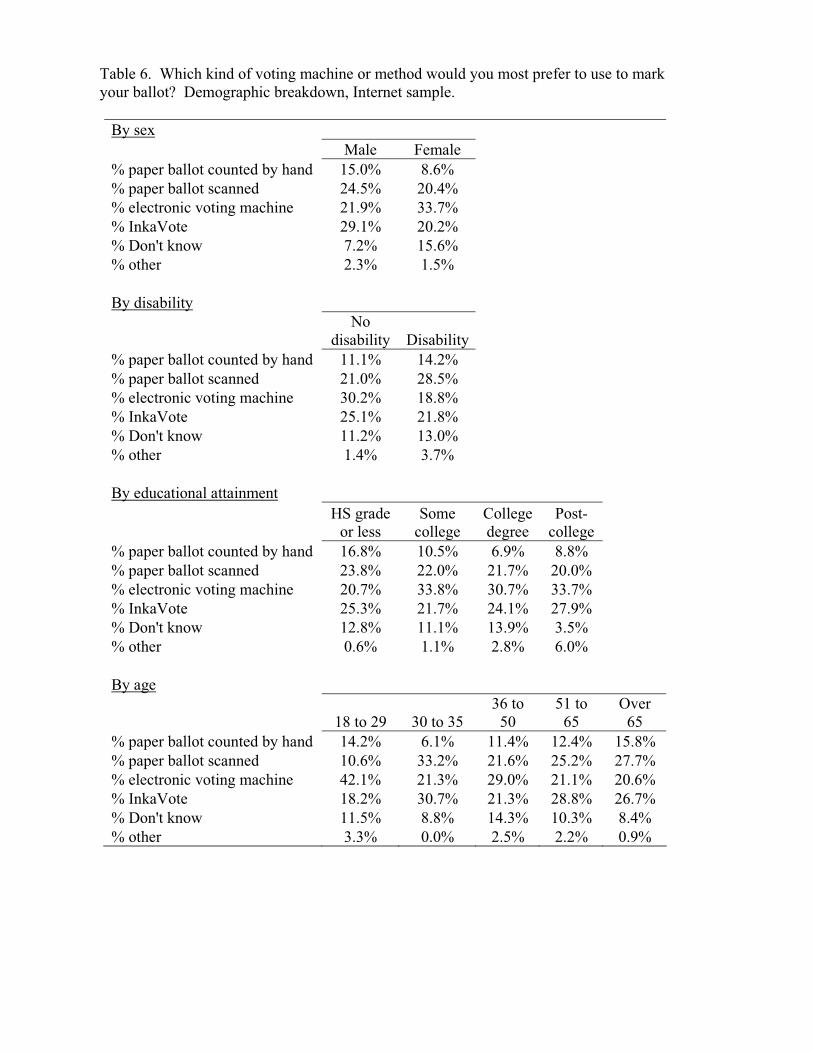
Table 6. Which kind of voting machine or method would you most prefer to use to mark your ballot? Demographic breakdown, Internet sample.
By sex Male Female % paper ballot counted by hand 15.0% 8.6% % paper ballot scanned 24.5% 20.4% % electronic voting machine 21.9% 33.7% % InkaVote 29.1% 20.2% % Don't know 7.2% 15.6% % other 2.3% 1.5% By disability
Nodisability Disability
% paper ballot counted by hand 11.1% 14.2% % paper ballot scanned 21.0% 28.5% % electronic voting machine 30.2% 18.8% % InkaVote 25.1% 21.8% % Don't know 11.2% 13.0% % other 1.4% 3.7% By educational attainment
HS grade or less
Some college
College degree
Post-college
% paper ballot counted by hand 16.8% 10.5% 6.9% 8.8% % paper ballot scanned 23.8% 22.0% 21.7% 20.0% % electronic voting machine 20.7% 33.8% 30.7% 33.7% % InkaVote 25.3% 21.7% 24.1% 27.9% % Don't know 12.8% 11.1% 13.9% 3.5% % other 0.6% 1.1% 2.8% 6.0% By age
18 to 29 30 to 35 36 to
5051 to
65Over
65% paper ballot counted by hand 14.2% 6.1% 11.4% 12.4% 15.8% % paper ballot scanned 10.6% 33.2% 21.6% 25.2% 27.7% % electronic voting machine 42.1% 21.3% 29.0% 21.1% 20.6% % InkaVote 18.2% 30.7% 21.3% 28.8% 26.7% % Don't know 11.5% 8.8% 14.3% 10.3% 8.4% % other 3.3% 0.0% 2.5% 2.2% 0.9%
By income
< $15k $15k - $30k
$30k - 60k
$60k - $100k
>$100k
% paper ballot counted by hand 17.9% 17.3% 11.8% 12.5% 6.7% % paper ballot scanned 37.6% 21.1% 19.6% 21.9% 18.1% % electronic voting machine 22.4% 24.3% 31.7% 29.4% 29.9% % InkaVote 7.8% 21.2% 28.3% 18.1% 35.4% % Don't know 13.1% 14.2% 8.2% 16.5% 6.9% % other 1.3% 1.9% 0.5% 1.6% 3.1% By race Blacks Asians Latinos White % paper ballot counted by hand 13.0% 3.8% 16.1% 7.1% % paper ballot scanned 18.5% 5.5% 29.0% 20.7% % electronic voting machine 37.6% 43.5% 23.8% 27.6% % InkaVote 17.8% 20.7% 22.6% 28.5% % Don't know 13.1% 26.6% 8.5% 13.0% % other 0.0% 0.0% 0.0% 3.2% By party affiliation Democrat Rep. Ind. Other % paper ballot counted by hand 15.6% 1.6% 13.0% 0.0% % paper ballot scanned 18.8% 22.1% 29.7% 5.0% % electronic voting machine 28.0% 25.2% 31.1% 2.4% % InkaVote 22.3% 38.9% 18.3% 0.8% % Don't know 13.4% 10.5% 6.5% 0.0% % other 2.1% 1.8% 1.4% 0.0%
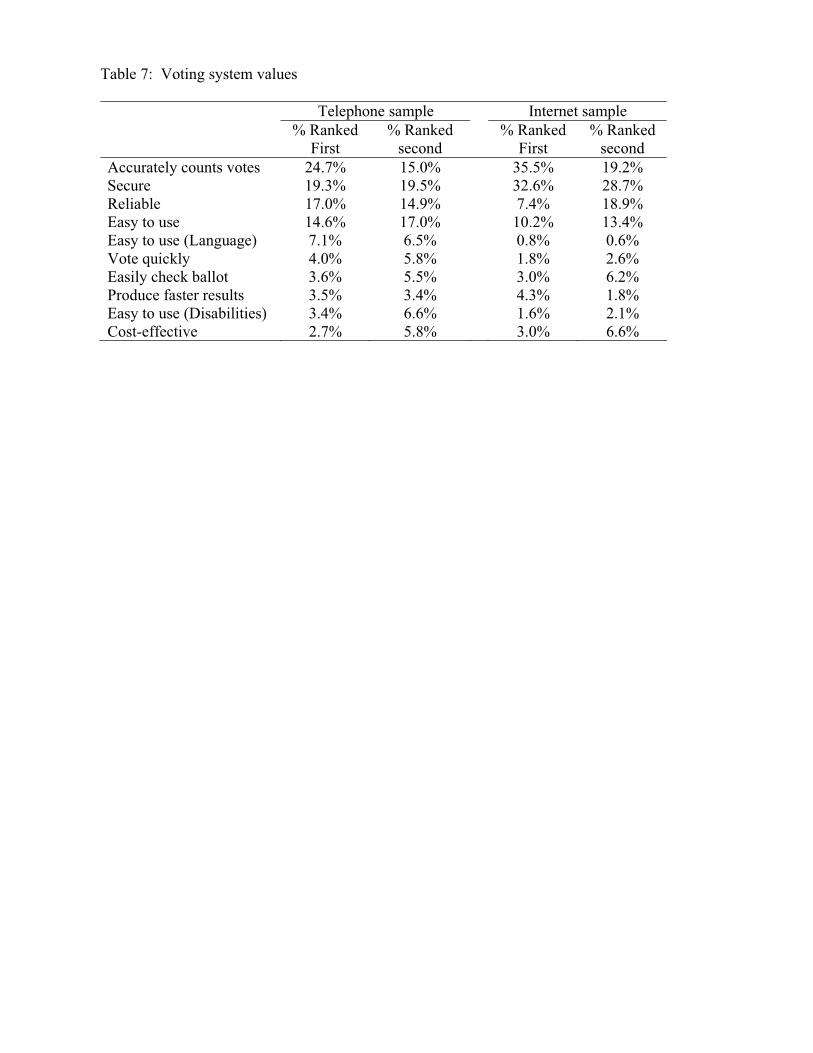
Table 7: Voting system values
Telephone sample Internet sample % Ranked
First % Ranked
second % Ranked
First % Ranked
secondAccurately counts votes 24.7% 15.0% 35.5% 19.2% Secure 19.3% 19.5% 32.6% 28.7% Reliable 17.0% 14.9% 7.4% 18.9% Easy to use 14.6% 17.0% 10.2% 13.4% Easy to use (Language) 7.1% 6.5% 0.8% 0.6% Vote quickly 4.0% 5.8% 1.8% 2.6% Easily check ballot 3.6% 5.5% 3.0% 6.2% Produce faster results 3.5% 3.4% 4.3% 1.8% Easy to use (Disabilities) 3.4% 6.6% 1.6% 2.1% Cost-effective 2.7% 5.8% 3.0% 6.6%
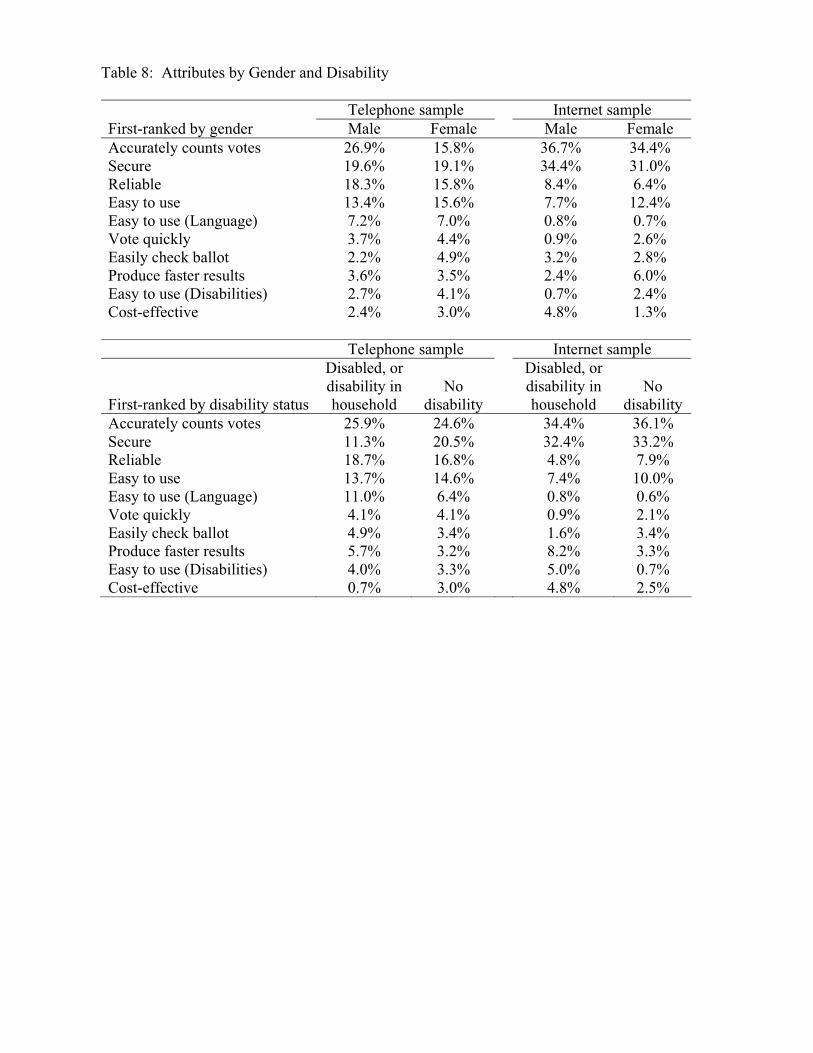
Table 8: Attributes by Gender and Disability
Telephone sample Internet sample First-ranked by gender Male Female Male Female Accurately counts votes 26.9% 15.8% 36.7% 34.4% Secure 19.6% 19.1% 34.4% 31.0% Reliable 18.3% 15.8% 8.4% 6.4% Easy to use 13.4% 15.6% 7.7% 12.4% Easy to use (Language) 7.2% 7.0% 0.8% 0.7% Vote quickly 3.7% 4.4% 0.9% 2.6% Easily check ballot 2.2% 4.9% 3.2% 2.8% Produce faster results 3.6% 3.5% 2.4% 6.0% Easy to use (Disabilities) 2.7% 4.1% 0.7% 2.4% Cost-effective 2.4% 3.0% 4.8% 1.3% Telephone sample Internet sample
First-ranked by disability status
Disabled, or disability in household
Nodisability
Disabled, or disability in household
No disability
Accurately counts votes 25.9% 24.6% 34.4% 36.1% Secure 11.3% 20.5% 32.4% 33.2% Reliable 18.7% 16.8% 4.8% 7.9% Easy to use 13.7% 14.6% 7.4% 10.0% Easy to use (Language) 11.0% 6.4% 0.8% 0.6% Vote quickly 4.1% 4.1% 0.9% 2.1% Easily check ballot 4.9% 3.4% 1.6% 3.4% Produce faster results 5.7% 3.2% 8.2% 3.3% Easy to use (Disabilities) 4.0% 3.3% 5.0% 0.7% Cost-effective 0.7% 3.0% 4.8% 2.5%
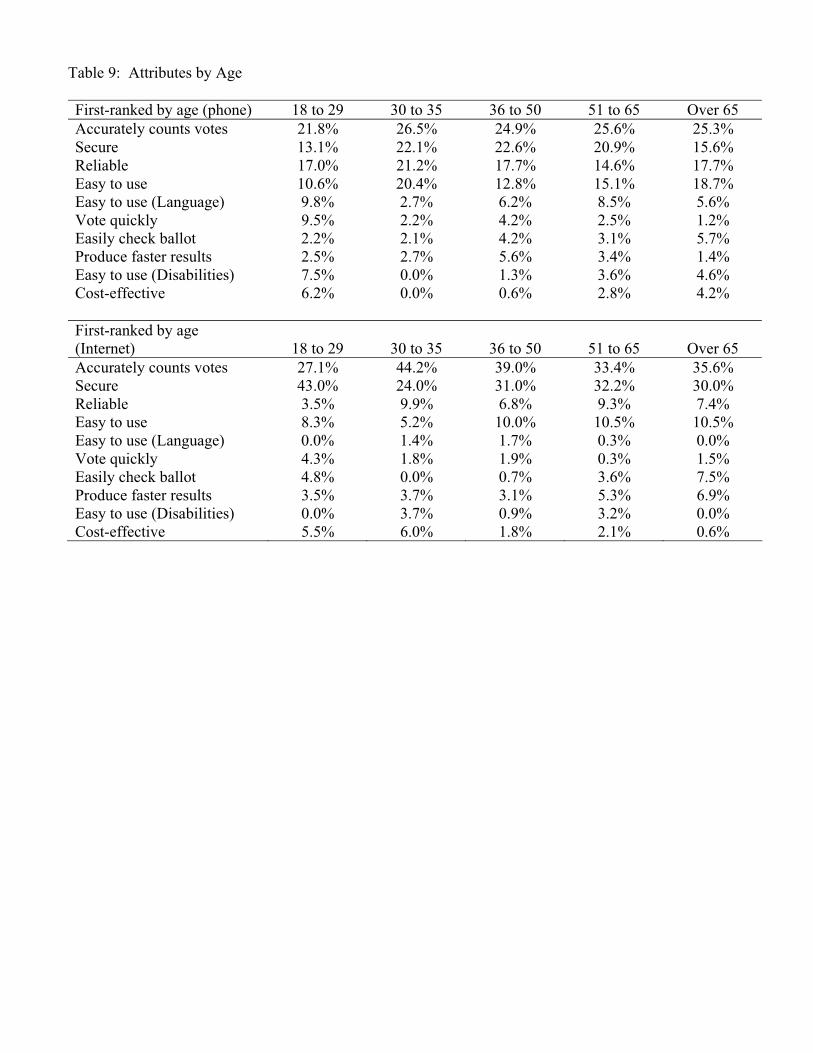
Table 9: Attributes by Age
First-ranked by age (phone) 18 to 29 30 to 35 36 to 50 51 to 65 Over 65 Accurately counts votes 21.8% 26.5% 24.9% 25.6% 25.3% Secure 13.1% 22.1% 22.6% 20.9% 15.6% Reliable 17.0% 21.2% 17.7% 14.6% 17.7% Easy to use 10.6% 20.4% 12.8% 15.1% 18.7% Easy to use (Language) 9.8% 2.7% 6.2% 8.5% 5.6% Vote quickly 9.5% 2.2% 4.2% 2.5% 1.2% Easily check ballot 2.2% 2.1% 4.2% 3.1% 5.7% Produce faster results 2.5% 2.7% 5.6% 3.4% 1.4% Easy to use (Disabilities) 7.5% 0.0% 1.3% 3.6% 4.6% Cost-effective 6.2% 0.0% 0.6% 2.8% 4.2% First-ranked by age (Internet) 18 to 29 30 to 35 36 to 50 51 to 65 Over 65 Accurately counts votes 27.1% 44.2% 39.0% 33.4% 35.6% Secure 43.0% 24.0% 31.0% 32.2% 30.0% Reliable 3.5% 9.9% 6.8% 9.3% 7.4% Easy to use 8.3% 5.2% 10.0% 10.5% 10.5% Easy to use (Language) 0.0% 1.4% 1.7% 0.3% 0.0% Vote quickly 4.3% 1.8% 1.9% 0.3% 1.5% Easily check ballot 4.8% 0.0% 0.7% 3.6% 7.5% Produce faster results 3.5% 3.7% 3.1% 5.3% 6.9% Easy to use (Disabilities) 0.0% 3.7% 0.9% 3.2% 0.0% Cost-effective 5.5% 6.0% 1.8% 2.1% 0.6%
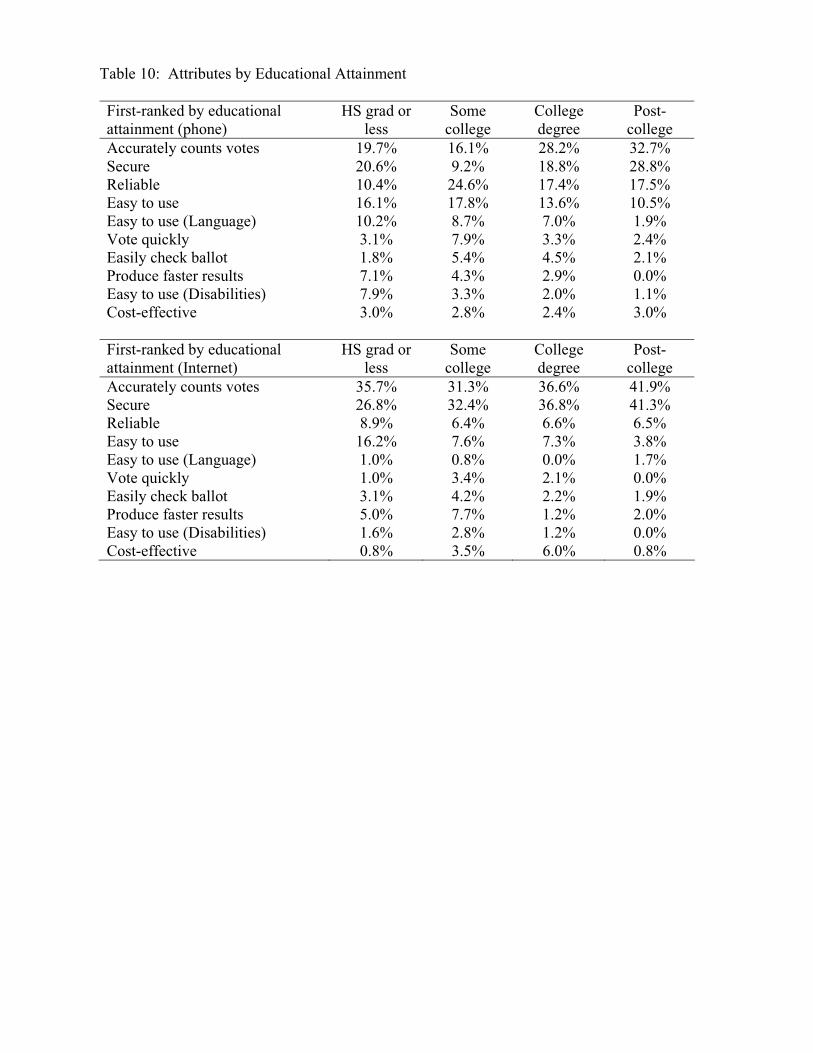
Table 10: Attributes by Educational Attainment
First-ranked by educational attainment (phone)
HS grad or less
Some college
College degree
Post-college
Accurately counts votes 19.7% 16.1% 28.2% 32.7% Secure 20.6% 9.2% 18.8% 28.8% Reliable 10.4% 24.6% 17.4% 17.5% Easy to use 16.1% 17.8% 13.6% 10.5% Easy to use (Language) 10.2% 8.7% 7.0% 1.9% Vote quickly 3.1% 7.9% 3.3% 2.4% Easily check ballot 1.8% 5.4% 4.5% 2.1% Produce faster results 7.1% 4.3% 2.9% 0.0% Easy to use (Disabilities) 7.9% 3.3% 2.0% 1.1% Cost-effective 3.0% 2.8% 2.4% 3.0% First-ranked by educational attainment (Internet)
HS grad or less
Some college
College degree
Post-college
Accurately counts votes 35.7% 31.3% 36.6% 41.9% Secure 26.8% 32.4% 36.8% 41.3% Reliable 8.9% 6.4% 6.6% 6.5% Easy to use 16.2% 7.6% 7.3% 3.8% Easy to use (Language) 1.0% 0.8% 0.0% 1.7% Vote quickly 1.0% 3.4% 2.1% 0.0% Easily check ballot 3.1% 4.2% 2.2% 1.9% Produce faster results 5.0% 7.7% 1.2% 2.0% Easy to use (Disabilities) 1.6% 2.8% 1.2% 0.0% Cost-effective 0.8% 3.5% 6.0% 0.8%
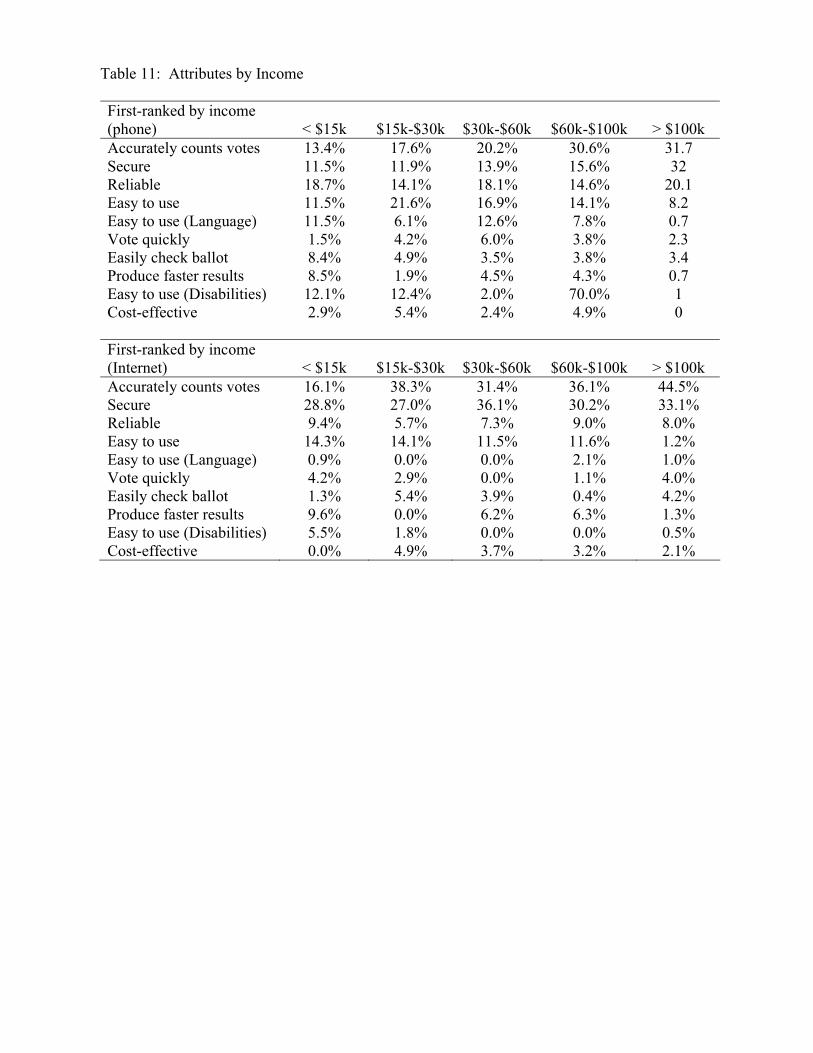
Table 11: Attributes by Income
First-ranked by income (phone) < $15k $15k-$30k $30k-$60k $60k-$100k > $100k Accurately counts votes 13.4% 17.6% 20.2% 30.6% 31.7 Secure 11.5% 11.9% 13.9% 15.6% 32 Reliable 18.7% 14.1% 18.1% 14.6% 20.1 Easy to use 11.5% 21.6% 16.9% 14.1% 8.2 Easy to use (Language) 11.5% 6.1% 12.6% 7.8% 0.7 Vote quickly 1.5% 4.2% 6.0% 3.8% 2.3 Easily check ballot 8.4% 4.9% 3.5% 3.8% 3.4 Produce faster results 8.5% 1.9% 4.5% 4.3% 0.7 Easy to use (Disabilities) 12.1% 12.4% 2.0% 70.0% 1 Cost-effective 2.9% 5.4% 2.4% 4.9% 0 First-ranked by income (Internet) < $15k $15k-$30k $30k-$60k $60k-$100k > $100k Accurately counts votes 16.1% 38.3% 31.4% 36.1% 44.5% Secure 28.8% 27.0% 36.1% 30.2% 33.1% Reliable 9.4% 5.7% 7.3% 9.0% 8.0% Easy to use 14.3% 14.1% 11.5% 11.6% 1.2% Easy to use (Language) 0.9% 0.0% 0.0% 2.1% 1.0% Vote quickly 4.2% 2.9% 0.0% 1.1% 4.0% Easily check ballot 1.3% 5.4% 3.9% 0.4% 4.2% Produce faster results 9.6% 0.0% 6.2% 6.3% 1.3% Easy to use (Disabilities) 5.5% 1.8% 0.0% 0.0% 0.5% Cost-effective 0.0% 4.9% 3.7% 3.2% 2.1%
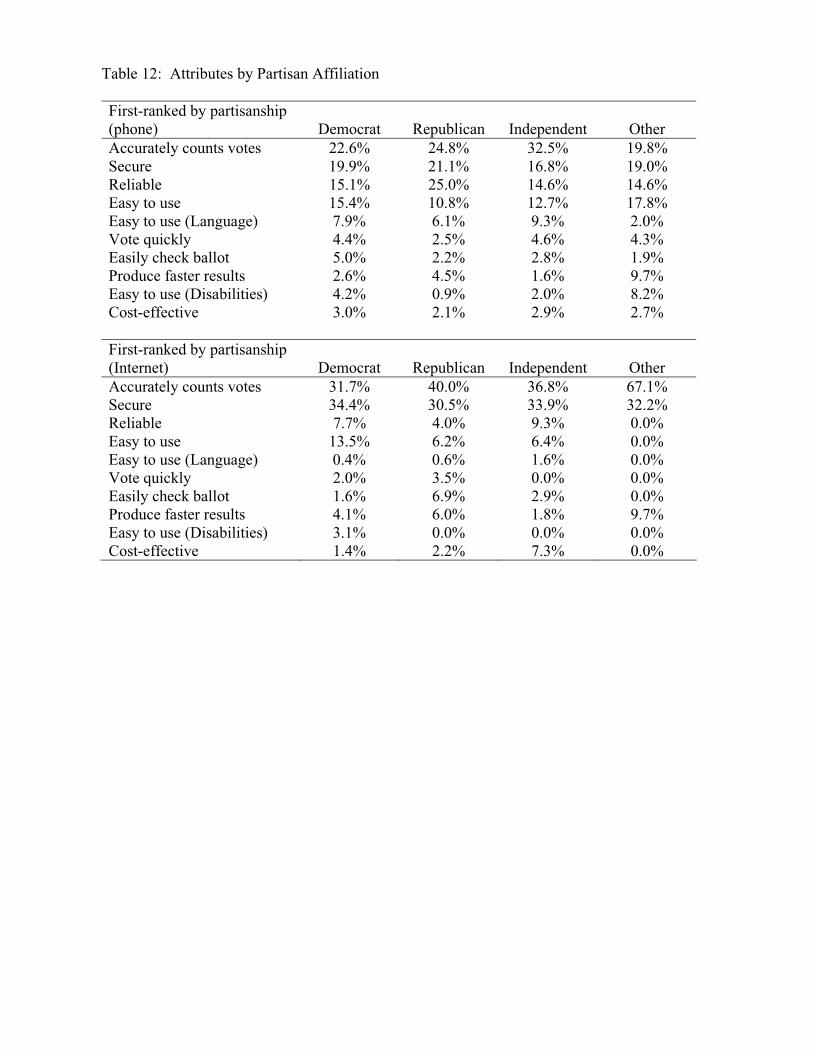
Table 12: Attributes by Partisan Affiliation
First-ranked by partisanship (phone) Democrat Republican Independent Other Accurately counts votes 22.6% 24.8% 32.5% 19.8% Secure 19.9% 21.1% 16.8% 19.0% Reliable 15.1% 25.0% 14.6% 14.6% Easy to use 15.4% 10.8% 12.7% 17.8% Easy to use (Language) 7.9% 6.1% 9.3% 2.0% Vote quickly 4.4% 2.5% 4.6% 4.3% Easily check ballot 5.0% 2.2% 2.8% 1.9% Produce faster results 2.6% 4.5% 1.6% 9.7% Easy to use (Disabilities) 4.2% 0.9% 2.0% 8.2% Cost-effective 3.0% 2.1% 2.9% 2.7% First-ranked by partisanship (Internet) Democrat Republican Independent Other Accurately counts votes 31.7% 40.0% 36.8% 67.1% Secure 34.4% 30.5% 33.9% 32.2% Reliable 7.7% 4.0% 9.3% 0.0% Easy to use 13.5% 6.2% 6.4% 0.0% Easy to use (Language) 0.4% 0.6% 1.6% 0.0% Vote quickly 2.0% 3.5% 0.0% 0.0% Easily check ballot 1.6% 6.9% 2.9% 0.0% Produce faster results 4.1% 6.0% 1.8% 9.7% Easy to use (Disabilities) 3.1% 0.0% 0.0% 0.0% Cost-effective 1.4% 2.2% 7.3% 0.0%
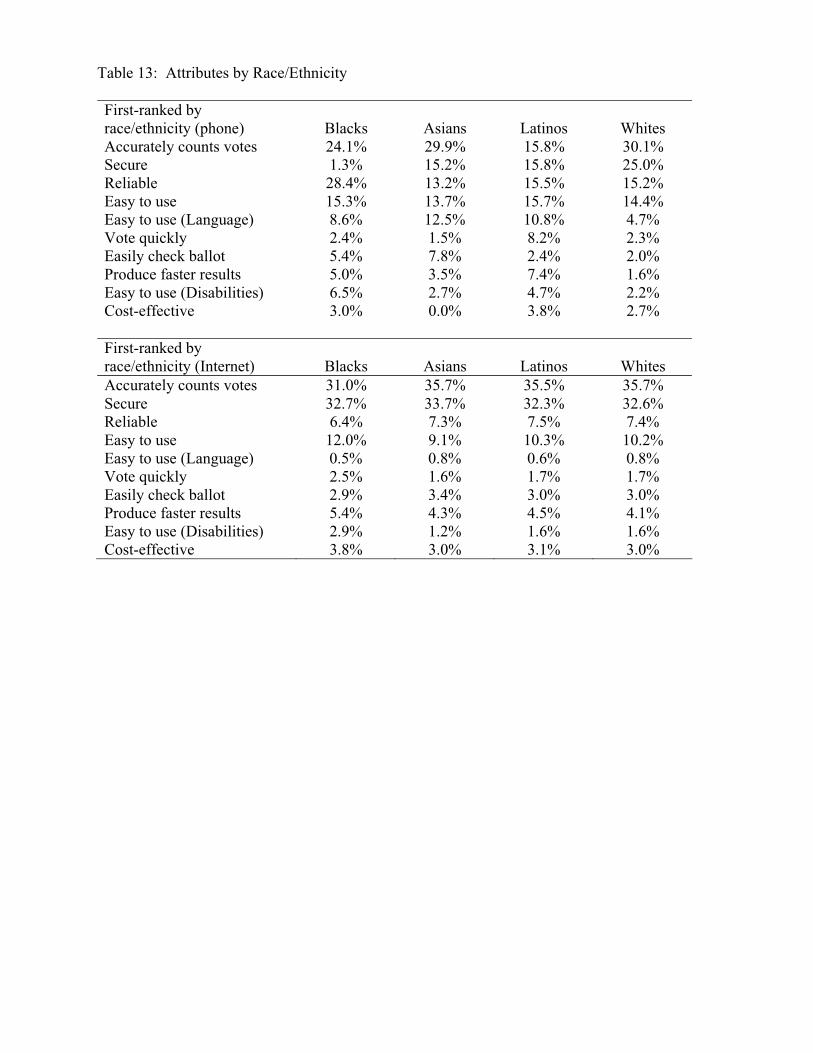
Table 13: Attributes by Race/Ethnicity
First-ranked by race/ethnicity (phone) Blacks Asians Latinos Whites Accurately counts votes 24.1% 29.9% 15.8% 30.1% Secure 1.3% 15.2% 15.8% 25.0% Reliable 28.4% 13.2% 15.5% 15.2% Easy to use 15.3% 13.7% 15.7% 14.4% Easy to use (Language) 8.6% 12.5% 10.8% 4.7% Vote quickly 2.4% 1.5% 8.2% 2.3% Easily check ballot 5.4% 7.8% 2.4% 2.0% Produce faster results 5.0% 3.5% 7.4% 1.6% Easy to use (Disabilities) 6.5% 2.7% 4.7% 2.2% Cost-effective 3.0% 0.0% 3.8% 2.7% First-ranked by race/ethnicity (Internet) Blacks Asians Latinos Whites Accurately counts votes 31.0% 35.7% 35.5% 35.7% Secure 32.7% 33.7% 32.3% 32.6% Reliable 6.4% 7.3% 7.5% 7.4% Easy to use 12.0% 9.1% 10.3% 10.2% Easy to use (Language) 0.5% 0.8% 0.6% 0.8% Vote quickly 2.5% 1.6% 1.7% 1.7% Easily check ballot 2.9% 3.4% 3.0% 3.0% Produce faster results 5.4% 4.3% 4.5% 4.1% Easy to use (Disabilities) 2.9% 1.2% 1.6% 1.6% Cost-effective 3.8% 3.0% 3.1% 3.0%
Getting Ready for Tomorrow’s Voters Los Angeles County Registrar-Recorder/County Clerk (RR/CC)
Voting Systems Assessment Project Focus Group Report April – June 2010
Overview
What will voters want when they vote in the future? First and foremost, whatever the system, the process, the machines, the locations, the technology, the time allowed to vote, and other standards yet proposed, voters of diverse ethnicities and physical abilities are more determined than ever to vote. And, they would prefer as much advance notice as possible to be educated and to adjust to the changes coming in order to be able to execute their vote properly.
To make voting easier for voters, they advise we don’t have one rigid system and more finite regulations which work towards conformity. They want flexibility, not only for themselves but for neighbors they may never meet, especially people with disabilities.
They reflect the realities of the shrinking clock in which we live our lives: they want their voting to be in their neighborhoods with plenty of parking places and mass transit to get them in and out of the voting process; they want longer hours, early voting and more Vote by Mail opportunities. They acknowledge some form of online voting is probably in their future, but young and old worry about the security and prospective hacking into systems which might result in compromising such a system.
Flexibility: they believe they have it in LA County RR/CC, and if it were their choice, they want more in the future.
There are 88 cities with 10.4 million residents in Los Angeles County, with more than 140 cultures and as many as 224 languages. LA County is the nation’s largest and most diverse county – more importantly, it could easily serve as a window to the world in looking at elections’ system reform.
Providing services to such a diverse population is challenging, evidenced by the required printing of ballots in seven languages. Each year Los Angeles County Department of Registrar-Recorder/County Clerk participates in approximately 200 elections for schools, cities and special districts. There are approximately 4.5 million registered voters, and 5,000 voting precincts established for countywide elections.
How do you plan for a future voting population to make it easy, accessible, as inclusive as possible and secure from problems which erode the public’s confidence and question projected outcomes?
As part of the Los Angeles County Voting System Assessment Project, twelve focus groups representing a range of LA County voters were assembled for two hour question and answer sessions between April 5th
through May 5th, 2010 to talk about the current and prospective future of voting. These focus groups included poll voters, Vote by Mail voters, voters with disabilities, Mandarin Chinese speaking voters, English and Spanish speaking Latino/Latina voters, Korean speaking voters, young voters, voters where English was their second language, registered voters who have yet to vote, and longtime consistent voters.
In total, 113 randomly selected voters participated in the focus groups and contributed their thoughts, experiences, and expectations regarding the current and future voting system and electoral processes.
This research is a first of its kind – a look towards the future at what would make our elections process better for the voters who use it and some who do not yet use it. Our approach: talk to a dozen focus groups filled with voters of various backgrounds and seek a values-driven reality check on where we are going – and where we might go – in the evolution of American elections.
Methodology
Working with Los Angeles County Registrar-Recorder/County Clerk (RR/CC), The Connections Group assembled registered voters and recruited participants using the most recent voter registration rolls. A variety of different demographics (listed in the table below) were engaged, recognizing the cultural, racial, economic, and geographic diversity of Los Angeles County. Because geography and location are significant factors in a 4,000+ square-mile county, we ensured recruited participants represented not only demographic diversity, but geographic diversity as well. We also conducted the same focus group study with two groups of representative voters from the general electorate, who would serve as comparison and control groups.
Targeted Groups Description/Language Total Groups General Electorate � Registered voters 2Race/Ethnicity (One in English for each multilingual group)
� African Americans � English speaking Asian Pacific
Islanders� English speaking Latino � Mandarin Chinese speaking � Korean speaking � Spanish speaking Latino
6
Voters with Disabilities � Voters with a range of disabilities 2
Permanent Vote-by-Mail Voters
� Established for some time � Recently declared
1
Young Voters � 18 to 25 1
All twelve focus groups were held at a professional focus group facility and no participants were recruited who work in the fields of market research, elections, advertising or the media. Most of the recruitment was carried out by a professional focus group facility. In consultation with local disability organizations, The Connections Group did the recruiting and screening of voters with disabilities directly.
The optimum number of participants for the focus groups was determined to be between eight and ten. More than ten people were recruited for each group to ensure a large enough group in case of cancellations or no shows.
The Voting Process Conclusions
Elections are more about people than a process.
The voters we talked to believe voting is a major privilege of democracy – a value which supersedes any contentious aspects of its systems, processes, machines or tabulations. They think voting is a patriotic act; one that people embrace as a responsibility, a right, and privilege. They treasure it, but it is not the most important concern on their list of things to change. The average voters we tested liked how they voted, and were enthusiastic when offered ideas about what could make the voting process better. They were easily persuaded to want more education about how the elections process works.
For example, they want to know more about the safeguards in place in all steps of the election process, and, in fact, wanted the Los Angeles County Registrar-Recorder/County Clerk (RR/CC) to prove its transparency. However, they were not certain they would ever use added transparency to see if their votes counted. They wanted more information accessible for those who wanted it, but they did not want more imposed onto voters who did not want more information or access to the process.
Although it has been a decade since the first real major national stumble in how the elections process was perceived, the voters still have a visceral distrust of election systems in terms of whether they deliver their votes accurately and securely. Those who have expert knowledge on elections systems are far more confident in our election processes than our voters, especially Latino and African American voters.
However, even those who are suspicious of the process are voting because of the value, the privilege, and the basic democracy it represents to them as Americans. No glitch – not even the threat that their vote may not be counted – would keep them from voting in the future.
Voting System Values
In the twelve focus groups, we asked voters for a list of goals for designing a voting system. Here are the 10 most important values (in order of priority) voters believe the Los Angeles County Registrar-Recorder/County Clerk (RR/CC) need to consider and focus upon:
1. Exercising Our Democratic Rights
No matter what problems, changes, confusions or other concerns about the process of voting either here or elsewhere, voters take great pride in exercising their democratic rights; they believe it’s a privilege to be able to vote in America – and one they will not be daunted from doing.
“I think it’s the democratic process.”
“I like the privilege of being able to vote and have a voice.”
Many voters also acknowledge the valiant history of fighting for the right to vote in this country; we have earned these rights as citizens. It’s our duty, responsibility and pride to participate and vote.
“50 years ago none of us would be able to vote in this room. We would not be able to vote. And now that we have the opportunity to give our voice, it’s important that people vote.”
“You have to have a say in what’s going on in our country.”
“I don't think we really have the right to complain if we don't take our responsibility, and even though we did question how many our voices are heard… we can see that we're all passionate about having that privilege, and taking that privilege.”
2. Convenience
Convenience, especially as our time is increasingly strapped with other commitments, is consistently ranked a top priority by many voters.
For poll voters, they prefer to have voting locations close to where they live.
“It’s local, it’s right where I live.”
“Okay I like my convenient polling place because I can just walk down there and just basically I feel like it's green, I can just walk down there, don’t even have to use my car, so that's good.”
Many Vote by Mail voters like having the ability to vote early and choose when and how they vote. They also like having more time to research, debate their choices, and engage in more conversations with other voters.
“Figured I’d send mine early, get it over with.”
“I do an absentee ballot because I travel. So that's convenient for me. It's my way of participating.”
“I see it as a convenience. It’s more convenient for me just to receive the ballot in the mail and just fill it out and send it back.”
“You don’t have to go there. All you have to do is just mail it in; it’s convenient.”
“It just gives me more options to stay home and review all the, you know all the issues and I can discuss it…”
3. Ability to Vote Quickly/Easy to Vote
Voters are increasingly demanding a simple, easy, and quick process to vote. They want voting systems to be well-organized, consistent, and easy to understand to allow them to vote quickly.
“If it's not easy to use, it's not going to be a good process. It won't work.”
“Well, the voting is to express my own independent opinion, not others. So, to have it access very quickly, seems to be very good… voters are generally working people. So we have to go in, vote quickly, and then get out quickly.”
For different voters, however, the definitions of ability to vote quickly and easy to vote could mean different things. Here are some examples:
A vote by mail voter: “Well, it’s faster than going to the voting place, so I don’t have to take the time off or figure out how to plan the time in the day.”
A poll voter thought the voting process is simple enough but wanted more voting hours or days:“And procedure wise, it is quite simple. But the time constraints make it less convenient.”
A Spanish speaking voter commented on the need to have language assistance to make it easier to vote: “Because there’re a lot of people even though we are American citizens, we don’t understand the language, the dexterity, and the language to be able to understand… You don’t want anything to surprise you, so then I think it should be easier for those that don’t speak English very well.”
A voter with visual impairment: “Last time the voting booths were darker than normal to me and I had a really hard time reading my ballot and normally I don’t have too much trouble, but, you know, I thought maybe a task lamp in at least one of the booths might be helpful to people who have vision problems.”
4. Security
Security was important to many voters. For those who ranked it amongst the top priorities, they were adamant security was a key priority for any voting system.
“Most important thing about the voting process is the security... That’s almost basic.”
Most voters generally have “faith” in the voting systems and trust that they are secured.
“Well, you know, because it couldn’t be anything else. I say that you have to have faith in the system that’s what it is. That’s what I think, and I believe in the system. You have to have faith in the system.”
Most voters have little idea about what happens to their ballots after they vote. Without clear knowledge of the ballot process itself, some voters did express doubts and lack of confidence as a result.
“It's not that secure in the sense that yes I put the paper in and I put into the machine. It's what happens after it's taken out of the machine from my hand and placed into the box or the little drop thing. It's what happens after that.”
“I don’t understand the full process after I’m done doing it. So I don’t know what whether it would be secure or not.”
“I’m not sure how much confidence I have in the process. Perhaps this is me admitting to my ugly conspiracy theories, but there are vested interests that desire to influence elections, and if when we start debating things such as electronic voting or online voting, I don’t know how much confidence I have that the votes are being recorded accurately.”
“I believe everything is questionable because there’s not a real way to really track it from the conception.”
Though voters believe voting online and the use of computer voting will become more available in the future, they are not yet convinced security will be up to the standard.
“I don't know. I don't see how it would work. I mean, having a secure website so you're lucky your computer didn't get hacked and they couldn't hack the vote. Other than that, I don't know how it would work. There is no verification after you vote. Like you know what happens, you know.”
“I don’t think that will be very secure. Anything can happen with your computer, a virus, somebody can hack into it. It’s kind of weird.”
5. Flexibility and Having Options in Voting
Voters want more choices – not less. Voting systems need to remain flexible. Just as the country is not likely to move to a one size fits all elections process, voters want as much flexibility to suit their own schedules. They prefer having more than one option on how to vote: at the polls, by mail, early voting, multiple days, and at multiple locations.
Voters also believe one voting system may not fit the needs of all. The patriotism for voting leads them to fend for others besides themselves in making voting easy and accessible. From older voters who might not be able to operate the latest touch screen voting machines, to voters speaking different languages who might not understand the voting process, to voters with disabilities not being able to vote independently, all our focus groups lent their support to flexibility for all.
“To me it’s about inclusion… to make sure that the system is usable by all…”
“I like the option of being able to vote my mail should I be not in my state or whenever I do traveling I can vote by mail. I like that option a lot.”
“I think my ideal one system would not be one system.”
“All the languages that you need.”
“Well I think there should always be choices.”
“But if you have different options, you can engage more people in the political process.”
6. Privacy
Privacy is definitely in the eye of the beholder. The definition of privacy, and whether it is a priority varies between different voter groups.
“I put privacy as No. 1 because it’s something private that you don’t even reveal it to your wife because it’s so important… Because it’s something personal.”
“I feel sometimes everybody has, you know, their privacy. I personally don’t care.”
“Well I think it’s important only because in terms of the wonderful world we live in and all the information, the super highway, you know, they look at your credit rating when they’re looking to hire you for a job… it should be a private ballot.”
For voters with disabilities, privacy and voting in private were ranked as one of the highest priorities:
“It’s dignity, it’s respect, it’s self consideration what I chose. It should be a private matter at that moment just like everyone else years ago, it was, everybody had a curtain around and, you know, it was considered private. Then many of us don’t get to make private choices in our life. Our voting should be one of those times where we make that private decision and let it be just that, okay.”
“What I kind of noticed is the fact that when you are voting like at a disable place, people are lining up, like right behind you they look over your shoulder. I don’t like that ‘cause that to me is breaking my privacy.”
For other voters, especially young voters, privacy may not be as important.
“If you put stuff on Facebook and you put pictures of like you, like backing up or going out and barking all over the place, I would, you know, like you don’t want any privacy. And our society nowadays, like that’s how we are. We’re so open that we know everything about everything, you know.”
“I think that the privacy issue will become less of a problem, and that if people want to keep it private they could go to the polling places, or vote by mail, and the generation of people that update their Facebook status every thirteen seconds and tweet their every thought probably don’t care as much about the privacy issue.”
7. Voter Confidence and Accuracy
Most voters have little idea about what happens to their ballots after they vote. Many stressed they want to know what happens and whether their votes are counted, even though they agree they may never check for it unless the election results are close.
“I'll vote with the intention and hopes that all of the votes will be, everything will be really done fairly, but we never know. And how do you get accountability?”
“Just not knowing if my vote matters? You know, not knowing if it's being counted.”
“That it gets counted, that it gets tracked, that it actually counts.”
“How will we know? How does the public know that it is what it is? That it’s an honest system? I mean how do we really know?”
“Well I have to. What choice do we have?”
Some voters believe greater transparency is needed.
“… the lack of transparency. We’re asked to go out and vote and believe that often times the argument is put forth that people die for our opportunities to vote so we’re given this reason why we should go out there but at the same time, we’re not really given any solid indication of accuracy and transparency. We have to simply trust that maybe you know, they might be counting it all right… I like to think that there were several processes in effect that really showed me and convinced me beyond a shadow of a doubt that votes were being counted, tabulated and watched,
unlike you know, we see these foreign countries, gunmen stormed in and took the boxes or held people, you know but in America we don’t see that but we still don’t really, I don’t know that these votes are being counted accurately.”
And for some voters, Vote by Mail can present potential obstacles for being counted.
“I mean my bills get there on time, and so I assume that the ballot would get there also.”
“I don’t vote by mail for the simple fact that I’ve had just regular letters get lost and not try to worry about my ballot getting lost, you know.”
8. Able to Verify and Having Paper Trail
The ability to verify and have a paper trail for one’s votes is important to many voters. Although it has been 10 years, over three-quarters of all the voters we selected could still recall irregularities in Florida in the Presidential election and cite various possible flaws in the voting system.
Human errors, problems with “hackers”, computer malfunctions, re-enforced with voters that there be a back-up for the votes they cast at polling places.
“That's the most important one because that's how you count all your votes, and you can verify it.”
“I still want a paper trail because none of the computers have paper trails and then it's not verifiable.”
“They can go back and recount all the paper and not have a problem.”
“It is important because look like what happened in Florida when they had to actually count them.”
"Your vote has been counted. Here's the proof."
“It's more trustworthy than the machine.”
9. Technology
Voters have mixed feelings towards the use of technology (current or new) like computers and touch screens in voting systems. Their attitudes generally correspond with their own private understanding, use and familiarity with computers in their professional and personal life. There are generation, gender, ethnic and class gaps in tolerance for the role technology in voting. Most agree that these will be less prevalent in years to come, but almost all hold onto the position that we should be flexible in offering alternatives: no one should be forced into technology in order to vote.
For many voters, technology can represent ease of use, flexibility and convenience.
“If people were to go to the voting polls I’m sure you know I’m sure it’s going to be like little computers set up. Very user friendly for people that really have not used computers and make it very, very simple. Kind of like an ATM.”
“I would love to see a system kind of like the day you know where they give you a specific kind of pin number that you use to vote on line.”
“You go to welfare office, they have a computer that shows a file, and you can access whatever you want to. English, Korean, Spanish. If you go to poll center, they should have a screen there, and like having the headphone, Korean, press the Korean button. So we can just vote using Korean.”
But for other voters, technology can represent barriers and potential problem with security, and lacks paper trail.
“There’s something that I feel that gets lost in the whole election process, getting out there to vote and then it’s a computer screen and you just don’t have that sense of being able to trace it back… it just devalues the process for me.”
“I would definitely worry about the computers. What I’m hoping is this, if we can’t fix what we have, how in the world are we gonna fix, come up with something we think it’s gonna work?”
“I think you know if you pushed it like this you’re going to lose your voters. So you’ve got to give them you know options.”
10. Cost Efficiency
Cost efficiency matters but it’s just not a key concern; achieving the most convenient, most accessible, most accurate, most secure, and most easy to understand system is the priority.
“It’s too important to worry about money.”
“Just because it’s more cost effective doesn’t mean that it’s going to be better.”
What will the Future Voting System Looks Like?
We asked voters how they think the voting process and voting systems are likely to change in the next 10 years and how they see the voting process and voting systems of the future would do. Here are the three common themes discussed in the focus groups.
1. Use of Computers like ATMs
Voters believe our election system is changing or is in need of change. They think future voting systems will likely involve wider use and acceptance of computers. Many voters actually compare voting in the future to using ATMs.
“I think that they’re all going to have computers there.”
“The computerized system like an ATM machine.”
“Not that I know a lot about computers, but I’m looking forward because that’s what’s coming. As an ATM, it’s easy to use.”
2. Flexibility to Deal with Languages and Disabilities
Most voters believe it is important for us to be flexible, inclusive of all voters, and have options when considering new voting systems. They have specific examples of how we can make future voting systems user friendly to those who speak different languages and/or those with disabilities.
“If you go to the poll center. If you, like a computer, if you put in English, press a button, it changes to Chinese, changes to Korean. Like ATM machine. If you put in your card, you have your native language pop up on the screen.”
“Like you go to welfare office, they have a computer that shows a file, and you can access whatever you want to. English, Korean, Spanish. If you go to poll center, they should have a screen there, and like having the headphone, Korean, press the Korean button. So we can just vote using Korean.”
“When it becomes computerized, it’s best if there’s translations. Oh, pre-translated software. It’s like a book.”
“I think it would be, as long as it’s a touch screen with pictures and it’s as easy as possible.”
“I think the touch screen would be a lot easier, like on this process here I don’t like the fact that we have to really punch down because it feels like you’re not even registering your vote and you’re not looking down on it. It would be a lot better if it was touch screen, especially with disabilities; I think it would be a lot easier.”
“Electronic media can be displayed through a brail display?”
3. Voting Online
Many voters, especially younger voters and voters wanting to vote quickly would like to have an option to vote online. As long as it can be secure, they think voting online is easier and could potentially attract a higher turnout. It could also be cheaper and faster to count votes.
“You could just do it online from home.” “It's like American Idol or something.”
“Electronic voting, meaning via Internet, the text messaging, shoot, you can, they can text and you donate ten dollars to the Haiti fund, you know. That was no effort at all and it was secure, they already have my phone, nobody else does. Do I see that going through like a presidential election and the local elections and stuff like that? I don’t see why not. I see it going there.”
“Absolutely if they’re secure, I think I would because then you know it goes straight to the source where it’s meant to be and they’re probably going to be able to count it faster maybe the minute that you send it in ‘cause that’s the way they count it, it’s already being counted.”
Voters also discussed current examples of online transactions and how to make online voting more secure.
“I mean look at the credit card. I mean there are a lot of transactions going around all over the world. I mean how can they keep track of that? If they can do that, and we're talking worldwide, on a global scale here, why can't we do that for voting on a local scale?”
“You go to a secure web site, a government web site of course. You sign in, you put in, you know, they’ll make you sign up, put your social in there, your information, all your information that verifies that you are, they’ll probably send something in the mail, a confirmation code or an e-mail and then you enter it, secure, make sure it’s you and then you’ll be getting e-mails.”
“So we have so many web sites now, I mean, people order all kinds of stuff on line and you’re entering your information and you enter your credit card number and you trust it. Web sites are telling you its 100% secure and they’re doing everything to keep your information secure and how many times you go on line and enter, you know, your driver’s license number or anything.”
In the focus groups, we also asked voters what they thought about three different methods for marking and casting their ballots (Paper Ballot, Ballot Marking Device, and Direct Recording Electronic). We explained in detail what the three systems look like with photos and graphics, how voters might interact with the systems and vote, and how their votes would be cast and counted at the end.
1. Paper Ballot System – where voters mark the ballot by hand in a voting booth and votes are tallied by hand at the polls and then manually reported up to the County.
The most important attributes voters like about a paper ballot system are having paper trails and the ease of verifying the votes.
“Paper trail.”
"Your vote has been counted. Here's the proof."
“That's the most important one because that's how you count all your votes, and you can verify it.”
“They can go back and recount all the paper and not have a problem.”
However, majority of voters believe a paper ballot system is outdated, slow and prone to human counting errors.
“That’s like going back. Taking a step back.”
“This is the most original, most primitive.”
“This is not acceptable. That’s very time consuming.”
“Who’s going to open this up one by one to count them? That’s too much time.”
“Human error. Potential for human error and counting.”
2. Ballot Marking Device – A ballot marking device blends touchscreen with paper ballot. Voter marks the ballot using touchscreen, reviews vote choices, prints full ballot and hands it to the pollworkers.
Voters like the ease of voting and increased flexibility of a ballot making device. They like the printed ballots so that they can check for themselves. They also believe by having printed ballots there will be paper trails for verifying votes if needed.
“I, the second system makes a lot of sense to me because it has, the older adult could access that piece of paper, see what they did, be happy with that. The younger person would be happy with the part that they have a screen that they’re using.”
“Either electronic system has advantages in terms of being able to hook displays up to it, audio systems, the physical display, you can change contrast, colors, that kind of thing. So somebody needs different colors, they can use it.”
“This is more reliable.”
“It is accurate, not because there’s a link to the computer and there won’t be room for error and the printout, now it’s printed.”
“So I just think this is, it’s going to be safer and like you said that the, you can print out something and have that proof.”
“It goes back to the attendant and that's a hard copy. I want my vote to be a hard copy because non-hard copies are very easy to tamper with. The Internet is very easy to tamper with. It's already been done.”
“You know maybe it will be scanned wrongly. There’s a possibility of error here. That is in the scanning process or the reading process. There may be room for error.”
Some voters do have concerns about the use of computers and new technology. Others also have concerns about privacy and costs of new voting systems.
“The disadvantage would probably be not too many people are tech savvy, so they probably have a hard time with it.”
“I like it as far as I like technology. But like they were saying, you know, older people might not like it.”
“Also, the privacy because with that screen, that screen is too big, anybody can see what you’re voting for.”
“It’s a really expensive pencil.”
3. Direct Recording Electronic (DRE) – A DRE voting system is one where the ballot is displayed on a video monitor and votes are recorded using a touch screen – like going to the ATM. A paper record of the vote is produced.
Voters compare a DRE voting system to an ATM. They generally think a DRE system will help them to vote and be counted quickly.
“It counts quicker instead of somebody counting it.”
“You don't have to wait for it. You just do it automatically. You just get a receipt and that's pretty good.”
Voters, however, do have many questions and issues with a DRE voting system such as: Will a DRE system have a “receipt” for their votes; will a DRE voting system be online and connected to a central system; and who will program the software for a DRE system?
“So what would happen if that wasn’t accurate?”
“I think you have many different means. I don’t know if any of you have used the ATM machine before. There you get a receipt printed out. And that confirms your vote. And if you get, issues a receipt like the bank, if you go to the balloting center, the ATM machine does have that record.”
“The issue is whether it’s Internet connected or not, inter linked. It should be linked. If you take it away, there’s also a problem if you’re talking about problems, they can inter hack into your system, right? There’s a memory card and it’s, this should be acceptable and it’s also stored in the computer.”
“The third system I have questions about who’s programming that, how is that programming being controlled? What’s the security of the programming of the language of the computer?”
Who Should We Rely Upon to Build the Voting Systems of the Future?
Public and Private Partnership
Most voters believe there should be a public and private partnership to design and make the new voting systems.
Voters do have many and diverse views about this public and private partnership, and how this partnership potentially could work. In the focus groups, they name many reasons to have such a partnership including costs, security, check and balance, and accountability.
“I would go with a combination only because just like they have a series of checks and balances in the government, the executive branch and the Congress, but, you know, everybody has always been checking up on each other. If you only are the private sector, it can monitor and mess with the software and whatever.”
“I'll be a devil's advocate here. Private industry, we see Microsoft, look at what they're doing. I mean you're talking about monopolies here. I do not think that that's the solution either. I would kind of like to throw probably a hybrid.”
“But it also needs legislation, something from the federal government to say look, you guys have to do something about it.”
“The system should be developed by a public/private combo and there should be an independent board or something who watch that.”
“I think it should be a combination. The private company, but supervised by the county, by the government.”
“The government is going to pay for it. The government is going to look for a company that gives it the best products that it needs or things that it needs. It’s not the government that’s going to be making it, it’s gonna be another company.”
“To me the private sector has skin in the game in terms of what election outcomes may be and I feel uncomfortable with the fact that, especially given what some of the stuff we’ve seen in the financial industry recently, I feel uncomfortable with the fact that private industry, you know, there’s been some questions about Debolt’s practices and that kind of thing. So I’m uncomfortable with it being private. I really would like to see the government be the person that controls the software, controls the machinery, obviously they can contract the machinery out to a private and that’s fine, but it still makes the money, but the control of the machines and the software is done by the government.”
“The basic factor of the public owning it because of the fact it is a public entity that we’re working with. Private industry can produce something, but they have to give up all the rights to it to the public.”
“It should be the public authority coming forth with a system and with the participation of the private sector to develop a software.”
Phased In Approach/Promotional Period
No matter which future voting system(s) we choose, most voters think we need to give time for people and the election system to adjust and learn the new way. We have to make sure voters have a chance to be familiar with the new system and that the new voting system is working properly.
“I think like a phased in approach.”
“Anything new you have to try it out and find the law and then fix the flaw in order to get what you want. So no matter what they put together it’s going to have to be a, you know, a training period, not just for us, but for the computer.”
“It’ll be good to have some kind of training or some kind of training to help people, who don’t know about the machine.”
“So in terms of technical aspect, for younger generation, they are very apt to it. They are very familiar with the new changed system. See, if we automated computerized voting system for the young people, it may increase the young people’s voting process, voting participation. But for senior people, it’s like inconvenience. It’s like more burden. So having the both system. Having it computerized to increase the young generations voting participation, and for older people, to have another system, who are not familiar with the computer system. So maybe giving certain like promotional period, and educate people, register voter.”
Voting Systems Assessment Project
2010 Pollworker Survey of the Performance of LA County Elections Spring 2010 Study
Initial Survey Report
June 24, 2010
R. Michael Alvarez Thad E. Hall
Kathleen Moore
The James Irvine Foundation provided financial support for this study through a grant to the Caltech/MIT Voting Technology Project in support of the Voting Systems Assessment Project.
1
Executive Summary
As part of the Voting Systems Assessment Project (VSAP) we developed and implemented an online survey of pollworkers in Los Angeles County, which was completed after these individuals finished their online pollworker training. This survey was largely patterned on previous pollworkers surveys that we have fielded since 2006; it was conducted in May and June 2010. In this report we present preliminary results from two sections of this survey. First, we examine the experiences of pollworkers regarding their experiences with the existing InkaVotesystem. Second, we ask them to rate different types of voting systems in a number of ways to identify their attitudes regarding various types of voting systems.
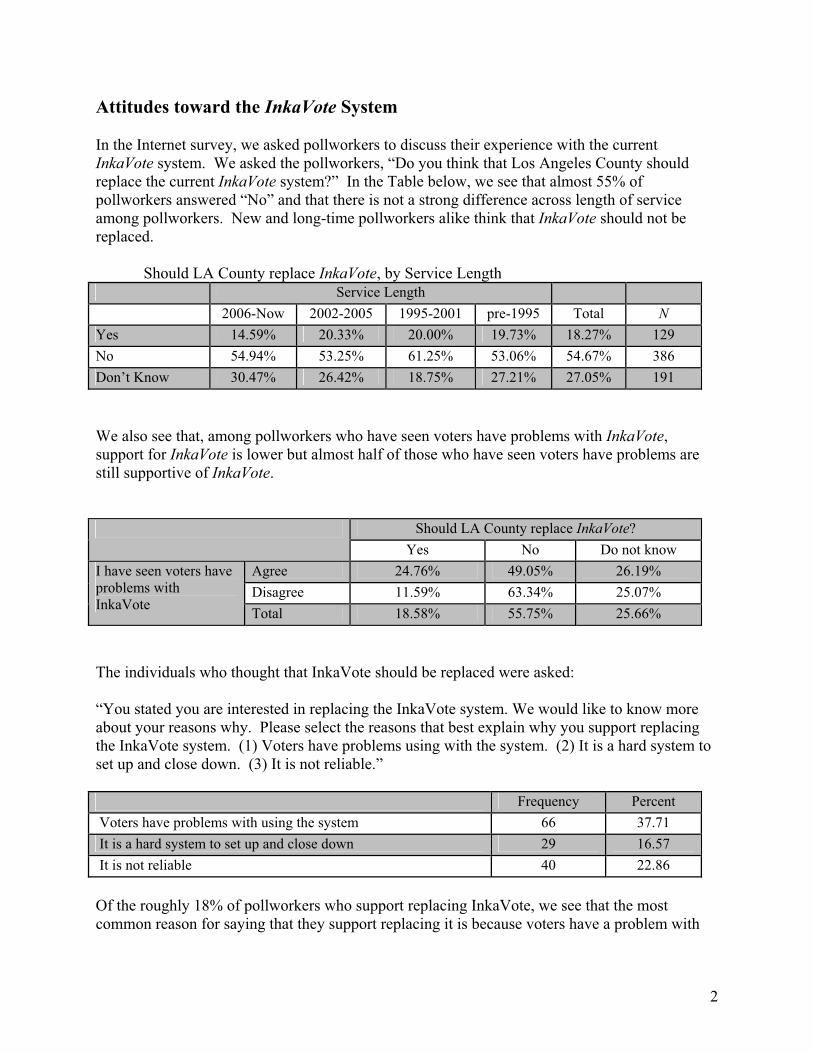
2
Attitudes toward the InkaVote System
In the Internet survey, we asked pollworkers to discuss their experience with the current InkaVote system. We asked the pollworkers, “Do you think that Los Angeles County should replace the current InkaVote system?” In the Table below, we see that almost 55% of pollworkers answered “No” and that there is not a strong difference across length of service among pollworkers. New and long-time pollworkers alike think that InkaVote should not be replaced.
Should LA County replace InkaVote, by Service Length Service Length
2006-Now 2002-2005 1995-2001 pre-1995 Total NYes 14.59% 20.33% 20.00% 19.73% 18.27% 129No 54.94% 53.25% 61.25% 53.06% 54.67% 386Don’t Know 30.47% 26.42% 18.75% 27.21% 27.05% 191
We also see that, among pollworkers who have seen voters have problems with InkaVote,support for InkaVote is lower but almost half of those who have seen voters have problems are still supportive of InkaVote.
Should LA County replace InkaVote?Yes No Do not know
Agree 24.76% 49.05% 26.19%Disagree 11.59% 63.34% 25.07%
I have seen voters have problems with InkaVote Total 18.58% 55.75% 25.66%
The individuals who thought that InkaVote should be replaced were asked:
“You stated you are interested in replacing the InkaVote system. We would like to know more about your reasons why. Please select the reasons that best explain why you support replacing the InkaVote system. (1) Voters have problems using with the system. (2) It is a hard system to set up and close down. (3) It is not reliable.”
Frequency Percent Voters have problems with using the system 66 37.71 It is a hard system to set up and close down 29 16.57 It is not reliable 40 22.86
Of the roughly 18% of pollworkers who support replacing InkaVote, we see that the most common reason for saying that they support replacing it is because voters have a problem with
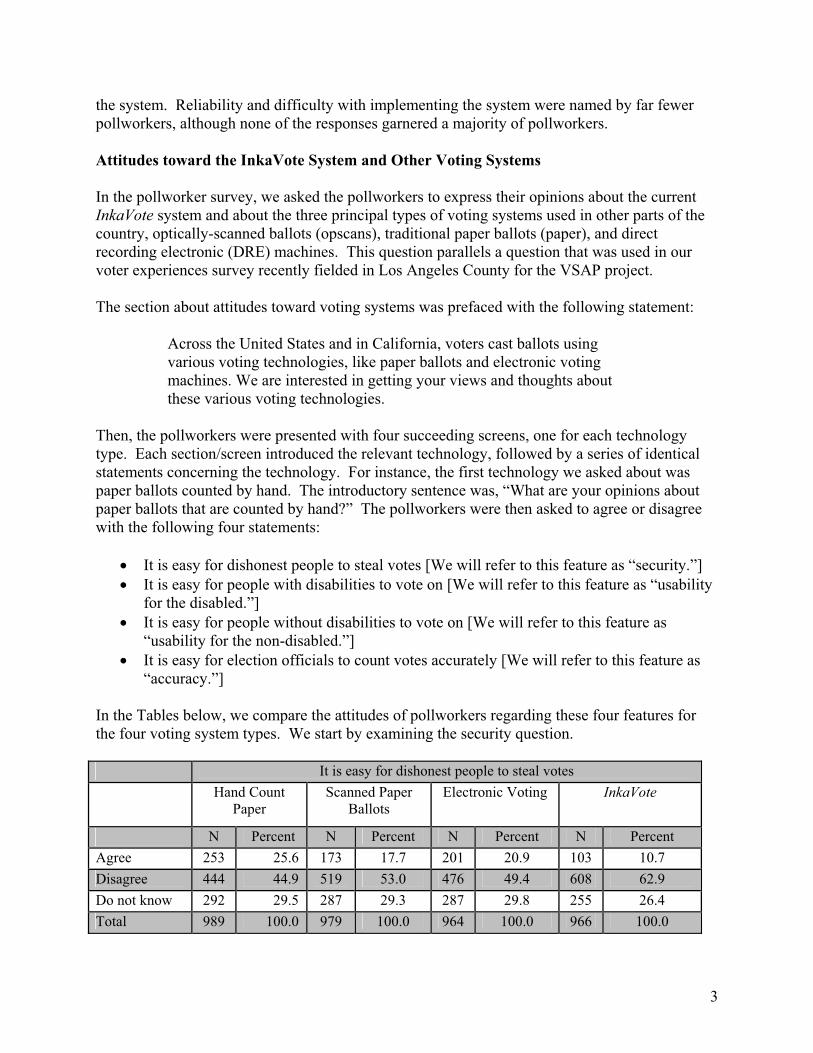
3
the system. Reliability and difficulty with implementing the system were named by far fewer pollworkers, although none of the responses garnered a majority of pollworkers.
Attitudes toward the InkaVote System and Other Voting Systems
In the pollworker survey, we asked the pollworkers to express their opinions about the current InkaVote system and about the three principal types of voting systems used in other parts of the country, optically-scanned ballots (opscans), traditional paper ballots (paper), and direct recording electronic (DRE) machines. This question parallels a question that was used in our voter experiences survey recently fielded in Los Angeles County for the VSAP project.
The section about attitudes toward voting systems was prefaced with the following statement:
Across the United States and in California, voters cast ballots using various voting technologies, like paper ballots and electronic voting machines. We are interested in getting your views and thoughts about these various voting technologies.
Then, the pollworkers were presented with four succeeding screens, one for each technology type. Each section/screen introduced the relevant technology, followed by a series of identical statements concerning the technology. For instance, the first technology we asked about was paper ballots counted by hand. The introductory sentence was, “What are your opinions about paper ballots that are counted by hand?” The pollworkers were then asked to agree or disagree with the following four statements:
� It is easy for dishonest people to steal votes [We will refer to this feature as “security.”] � It is easy for people with disabilities to vote on [We will refer to this feature as “usability
for the disabled.”] � It is easy for people without disabilities to vote on [We will refer to this feature as
“usability for the non-disabled.”] � It is easy for election officials to count votes accurately [We will refer to this feature as
“accuracy.”]
In the Tables below, we compare the attitudes of pollworkers regarding these four features for the four voting system types. We start by examining the security question.
It is easy for dishonest people to steal votesHand Count
PaperScanned Paper
BallotsElectronic Voting InkaVote
N Percent N Percent N Percent N PercentAgree 253 25.6 173 17.7 201 20.9 103 10.7Disagree 444 44.9 519 53.0 476 49.4 608 62.9Do not know 292 29.5 287 29.3 287 29.8 255 26.4Total 989 100.0 979 100.0 964 100.0 966 100.0
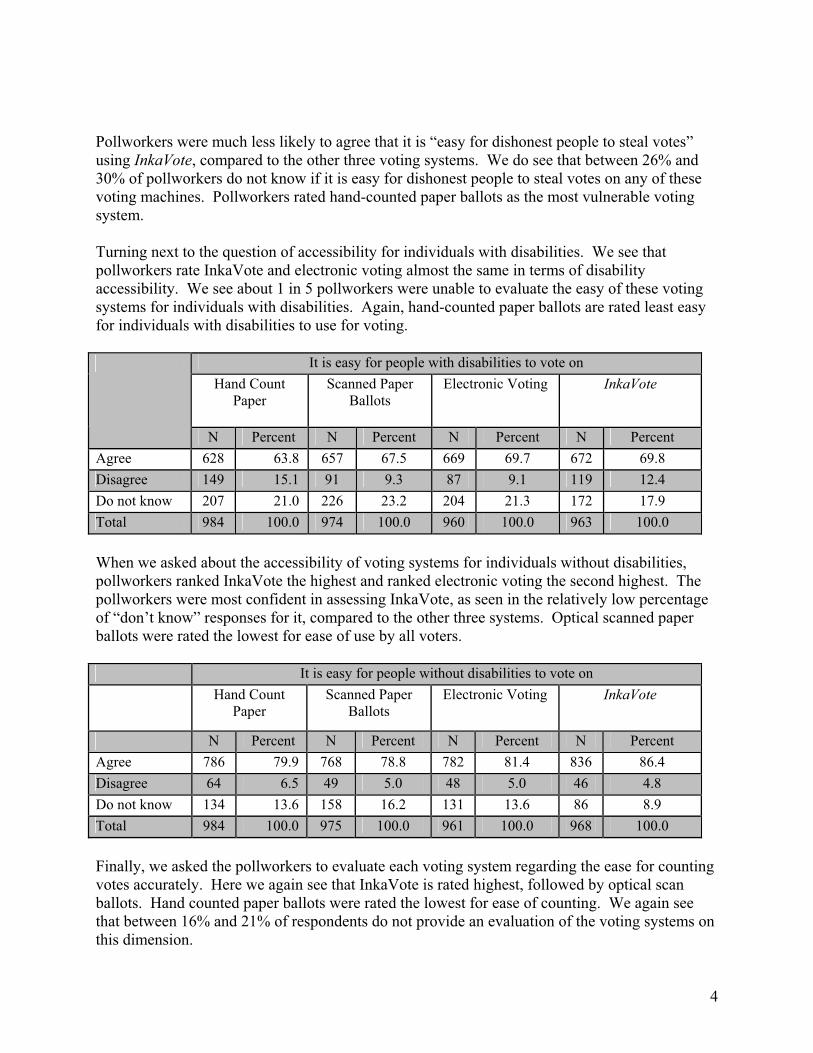
4
Pollworkers were much less likely to agree that it is “easy for dishonest people to steal votes” using InkaVote, compared to the other three voting systems. We do see that between 26% and 30% of pollworkers do not know if it is easy for dishonest people to steal votes on any of these voting machines. Pollworkers rated hand-counted paper ballots as the most vulnerable voting system.
Turning next to the question of accessibility for individuals with disabilities. We see that pollworkers rate InkaVote and electronic voting almost the same in terms of disability accessibility. We see about 1 in 5 pollworkers were unable to evaluate the easy of these voting systems for individuals with disabilities. Again, hand-counted paper ballots are rated least easy for individuals with disabilities to use for voting.
It is easy for people with disabilities to vote onHand Count
PaperScanned Paper
BallotsElectronic Voting InkaVote
N Percent N Percent N Percent N PercentAgree 628 63.8 657 67.5 669 69.7 672 69.8Disagree 149 15.1 91 9.3 87 9.1 119 12.4Do not know 207 21.0 226 23.2 204 21.3 172 17.9Total 984 100.0 974 100.0 960 100.0 963 100.0
When we asked about the accessibility of voting systems for individuals without disabilities, pollworkers ranked InkaVote the highest and ranked electronic voting the second highest. The pollworkers were most confident in assessing InkaVote, as seen in the relatively low percentage of “don’t know” responses for it, compared to the other three systems. Optical scanned paper ballots were rated the lowest for ease of use by all voters.
It is easy for people without disabilities to vote onHand Count
PaperScanned Paper
BallotsElectronic Voting InkaVote
N Percent N Percent N Percent N PercentAgree 786 79.9 768 78.8 782 81.4 836 86.4Disagree 64 6.5 49 5.0 48 5.0 46 4.8Do not know 134 13.6 158 16.2 131 13.6 86 8.9Total 984 100.0 975 100.0 961 100.0 968 100.0
Finally, we asked the pollworkers to evaluate each voting system regarding the ease for counting votes accurately. Here we again see that InkaVote is rated highest, followed by optical scan ballots. Hand counted paper ballots were rated the lowest for ease of counting. We again see that between 16% and 21% of respondents do not provide an evaluation of the voting systems on this dimension.
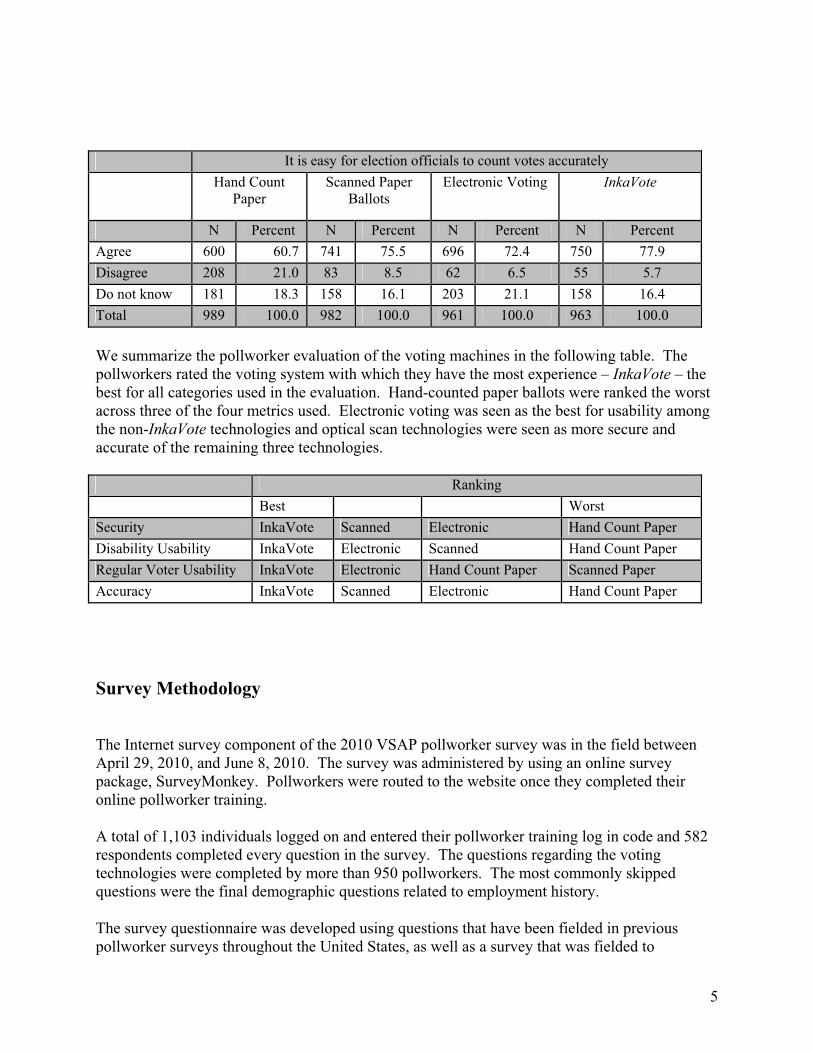
5
It is easy for election officials to count votes accuratelyHand Count
PaperScanned Paper
BallotsElectronic Voting InkaVote
N Percent N Percent N Percent N PercentAgree 600 60.7 741 75.5 696 72.4 750 77.9Disagree 208 21.0 83 8.5 62 6.5 55 5.7Do not know 181 18.3 158 16.1 203 21.1 158 16.4Total 989 100.0 982 100.0 961 100.0 963 100.0
We summarize the pollworker evaluation of the voting machines in the following table. The pollworkers rated the voting system with which they have the most experience – InkaVote – the best for all categories used in the evaluation. Hand-counted paper ballots were ranked the worst across three of the four metrics used. Electronic voting was seen as the best for usability among the non-InkaVote technologies and optical scan technologies were seen as more secure and accurate of the remaining three technologies.
RankingBest Worst
Security InkaVote Scanned Electronic Hand Count PaperDisability Usability InkaVote Electronic Scanned Hand Count PaperRegular Voter Usability InkaVote Electronic Hand Count Paper Scanned PaperAccuracy InkaVote Scanned Electronic Hand Count Paper
Survey Methodology
The Internet survey component of the 2010 VSAP pollworker survey was in the field between April 29, 2010, and June 8, 2010. The survey was administered by using an online survey package, SurveyMonkey. Pollworkers were routed to the website once they completed their online pollworker training.
A total of 1,103 individuals logged on and entered their pollworker training log in code and 582 respondents completed every question in the survey. The questions regarding the voting technologies were completed by more than 950 pollworkers. The most commonly skipped questions were the final demographic questions related to employment history.
The survey questionnaire was developed using questions that have been fielded in previous pollworker surveys throughout the United States, as well as a survey that was fielded to

6
registered voters in Los Angeles County earlier in 2010. In future reports we will discuss other results from this pollworker survey in more detail.
MEMORANDUM
TO: Dean C. Logan, Registrar-Recorder/County Clerk
FROM: Voting System Assessment Project
DATE: June 29, 2010
SUBJECT: INTERNAL RR/CC STAFF DISCUSSION GROUPS
Background
As part of the Los Angeles County Voting System Assessment Project, a series of informal focus group discussions were held with Registrar-Recorder/County Clerk staff. During March 31, 2010 through April 2, 2010 the project conducted seven discussion groups, each approximately two hours in length. In total, 64 staff had the opportunity to participate in the discussion groups and contribute their thoughts, experiences, and expectations regarding the current and future voting system and electoral processes.Participating staff included a variety of levels and operational functions, from line staff to division managers; operations like vote by mail, technical services, poll worker training, warehouse operations, and other sections. The goal of these discussions was to gather key informant data from Registrar-Recorder/County Clerk Staff regarding their outlook of the current elections environment, advantages and disadvantages of the current voting system.
Current Challenges to Elections
Frequent changes to the election code and other regulations governing the conduct of elections was a persistent challenge cited by staff. The significant increase in election related legislation means frequent and constant changes or new requirements that the voting system and election processes must comply with. These frequent changes have created an extremely fluid elections environment that means practices and requirements can change from election to election. More importantly, with Los Angeles County’s aging InkaVote Plus voting system, this environment is becoming increasingly taxiing due to the system’s inflexibility. Technical staff cited serious concerns with the
Voting System Assessment Project
Los Angeles County
systems inflexibility and the increasing demands being placed on it due to legislative and/or regulatory changes.
Advantages of Current Voting System
During the discussion groups, staff was asked to share what they saw as advantages of conducting elections using the current InkaVote Plus voting system. In general, staff observations focused on the advantages of the systems use of a small ballot card (IBM 312).
The IBM 312 ballot cards help election officials manage the large volume of ballots cast in a jurisdiction the size of Los Angeles County. The ballot cards allow for high speed processing and easy storage. They are also cost effective to produce. Most importantly, the current InkaVote Plus voting system provides an auditable paper record of the vote.
Disadvantages
When asked to think about disadvantages of the current voting system, some of the same characteristics that provide for advantages were also cited as disadvantages. The overarching theme of the disadvantages articulated in the discussion groups focused on the age of the voting system, its flexibility, and the complexities a jurisdiction the size and with the diversity of Los Angeles presents. Specifically, staff shared the following key disadvantages:
� The size of the ballot card limits us to 312 vote positions and 12 voter recorder pages.
� Limitations placed on the Precinct Ballot Reader units by provisions of our conditional certification, whereby the units are limited in their use to only be used to check for blank ballots or “overvotes,” makes the cost of maintenance and deployment inefficient.
� The voting and tally systems utilize old hardware and software platforms that limit its compatibility with new technologies and overall system flexibility.
� The blended nature of the system also means that by nature it is a fragmented system. This inherent fragmentation requires multiple processes that add to difficulties in maintaining streamlined processes and quality assurance.
� Accessibility can’t be easily enhanced. The InkaVote Plus Audio Ballot Booth component is limited in deployment to just one per precinct. It would be great if all units were accessible at the polling place.
� Language assistance could be enhanced by a new system. Currently InkaVote Plus vote recorders are printed in English and multilingual sample ballots are used to assist with translation for voters who need language assistance (ABB is also available).
� Scantron-type ballot card used with InkaVote system presents challenges for Vote by Mail voters.
New voting System Implementation
Registrar-Recorder/County Clerk staff acknowledged that the expertise and efficiencies that the Department has been able to achieve is based primarily on their experience with the various adaptations of the InkaVote Plus system over time. Current operations and layout are centered on the needs of InkaVote Plus. However, in all discussion groups there was general agreement that the aging technology and evolving landscape of elections is stretching the current voting system beyond its limits. The future of elections in Los Angeles County is one they envision will require a new voting system that can accommodate the County’s diversity and offer voters and elections officials more options and new possibilities. These changes, according to staff, will not come without challenges.
Los Angeles County faces a number of challenges in implementing new voting systems, as result of our scale. The size of our voter population and also the logistics involved in preparing and deploying thousands of voting equipment components, will likely present a number of challenges. During the discussion groups, staff identified a number of important considerations. A number of principles to keep in mind as the County seeks out a new voting system also emerged.
General Principles
� New voting system must provide options. Staff believes that there is no one single voting method that can accommodate all the voters and communities that the County serves. Making a number of different voting methods available to voters is important.
� Future voting systems must be flexible enough to be modified and adapted easily to meet growing demands of elections (e.g. new legislation).
� New systems should provide for greater automation of election preparation processes like candidate filing. Not only for greater efficiency. Staff made note of how important it is to have an integrated elections management system to enhance quality control as well.
� Our voting system needs to be compatible with the life and culture of our voter populations. Life styles and cultures have changed significantly; elections must be relevant to these new life-styles.
� Staff felt strongly that any new system must have the ability to ensure that voting can continue no matter what unforeseen challenge might arise (e.g. power outages). This is a characteristic that they value from our current InkaVote Plus voting system.
Important Considerations
Los Angeles County’s size makes some practices impractical and extremely risky. For example, precinct based or central hand counting of votes is risky and potentially extremely inaccurate in a county the size and complexity of Los Angeles County.
Full face optical scan ballot does not afford the practicality that the 312 ballot does but, it is more intuitive and possibly user friendly for voters.
Moving to a new ballot format may mean that speed in tabulating votes may decrease from the speed achieved with the 312 IBM ballot. Estimate is that implementation of a larger (full face) or multi-page ballot would likely require additional reader equipment, meaning more space and costs, in order to compensate for processing speed.
Any voting system will require that poll workers and voters understand it. Training poll workers during a 2.5 hour training session will be challenging.
Poll worker pool is an important variable in voting system acquisition. Ability to have access to and retain quality poll workers is critical to the successful implementation of any voting system.
Transportability of the system is important. LA County is 4,000 square miles and manages nearly 5,000 polling places. Ability to deploy the system and continue use of the Inspector Supply Pick-Up model is important. Prior to Inspector Supply Pick-Up the delivery method used by the County required as much as 30 days for full deployment.
System must be easy to handle, light, compact; enough so that the voter interface can be transported by inspectors to the polling place.
It is important to gauge how drastic the voting system change will be. Will the new voting system blend with any existing elements or will this be a total replacement without any continuity with the past system? These factors will have a significant impact.
It is important to recognize that the current staffing and physical layout of LA County elections is architected around the current voting system. Storage, maintenance, and expertise all revolve around the current voting system. A new voting system entails much more than purchasing new units. It will mean revisioning our entire operations and space.
New voting systems will have a significant impact on Vote by Mail ballot operations. Currently, the growing demand for Vote by Mail requires the full use of floor layout and maximum staffing. A new voting system may likely require added space, staffing, and insertion/sorting/extraction technologies.
The envisioning of a new voting system for Los Angeles County must take into account not only equipment but also the methods by which we currently conduct elections. There was consistent discussion about exploring different methods that might help enhance voting system options and the overall voting experience for Los Angeles County voters. Staff suggested exploring a vote center model that would allow for more polling locations with greater access, larger spaces, and possibly more permanent locations. The voter center model was also thought to offer greater security and reliability. Early voting was also an option suggested by staff. These and other options were identified as relevant considerations in the development/procurement of a new voting system. According to staff, any new system should be flexible enough to accommodate existing and future voting methods that enhance the electoral process.
Procurement/Development Recommendations
Internal staff is vital to the successful implementation and ongoing operation of any voting system. In group discussions, staff made several recommendations regarding the acquisition/development of a new voting system.
� The County should consider in-house development of the new voting system.
� In order to ensure that the County has the adequate control over security, operational, and maintenance of a new voting system the County needs to have full access to source codes and other programming tools.
� At the end of the project the County should be full owner of the voting system.�
Related Documents