2013 Annual Report 2013 09:13 14:38 16:52 17:16

Welcome message from author
This document is posted to help you gain knowledge. Please leave a comment to let me know what you think about it! Share it to your friends and learn new things together.
Transcript
2013Annual Report 2013
09:1314:38
16:5217:16
2013 As a leading technology and services company, we take advantage of our global opportuni-ties for a strong and meaningful development. Our ambition is to enhance the quality of life with solutions that are both innovative and beneficial. We focus on our core competencies in automotive and industrial technologies as well as in products and services for professional and private use.
We strive for sustained economic success and a leading market position in all that we do. Entrepreneurial freedom and financial independence allow our actions to be guided by a long-term perspective. In the spirit of our founder, we particularly demonstrate social and environmental responsibility — wherever we do business.
Our customers choose us for our innovative strength and efficiency, for our reliability and quality of work. Our organizational structures, processes, and leadership tools are clear and effective, and support the requirements of our various businesses. We act according to com-mon principles. We are strongly determined to jointly achieve the goals we have agreed upon.
As associates worldwide, we feel a special bond in the values we live by – day for day. The diversity of our cultures is a source of additional strength. We experience our task as chal-lenging, we are dedicated to our work, and we are proud to be part of Bosch.
The Bosch VisionA.1
Creating value – sharing values
A.2
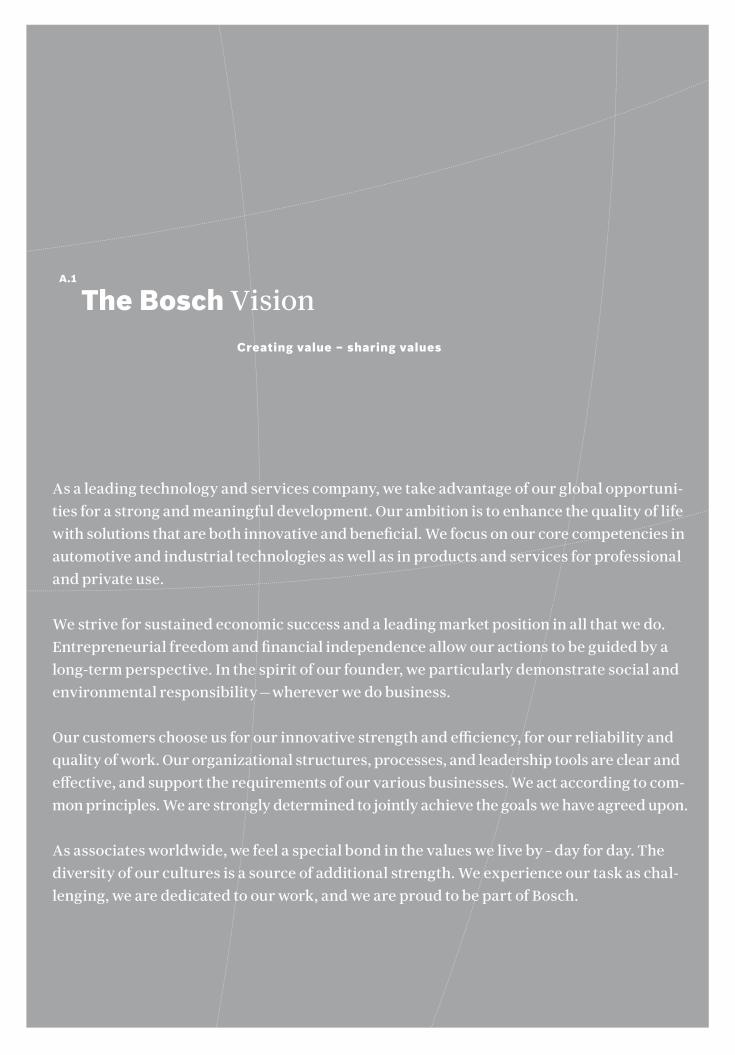
Key Data
Currency figures in millions of euros 2013 2012 1
Sales revenue 46,068 44,703
percentage change from previous year 3.1 – 3
percentage of sales revenue generated outside Germany 77 77
Research and development cost 2 4,543 4,442
as a percentage of sales revenue 9.9 9.9
Capital expenditure 2,539 2,714
as a percentage of depreciation 126 101
Associates
average for the year 279,739 273,091
as of December 31, 2013 281,381 272,830
Total assets 55,725 52,611
Equity 27,686 26,900
as a percentage of total assets 50 51
Profit before tax 2,827 3,641
as a percentage of sales revenue 6.1 8.1
Profit after tax 1,251 2,304
Unappropriated earnings (dividend of Robert Bosch GmbH) 88 88
1 Figures following adjustment for new methods of accounting and valuation2 Including development work charged directly to customers3 Year-on-year comparison is not meaningful, as figures for 2012 sales revenue have been adjusted
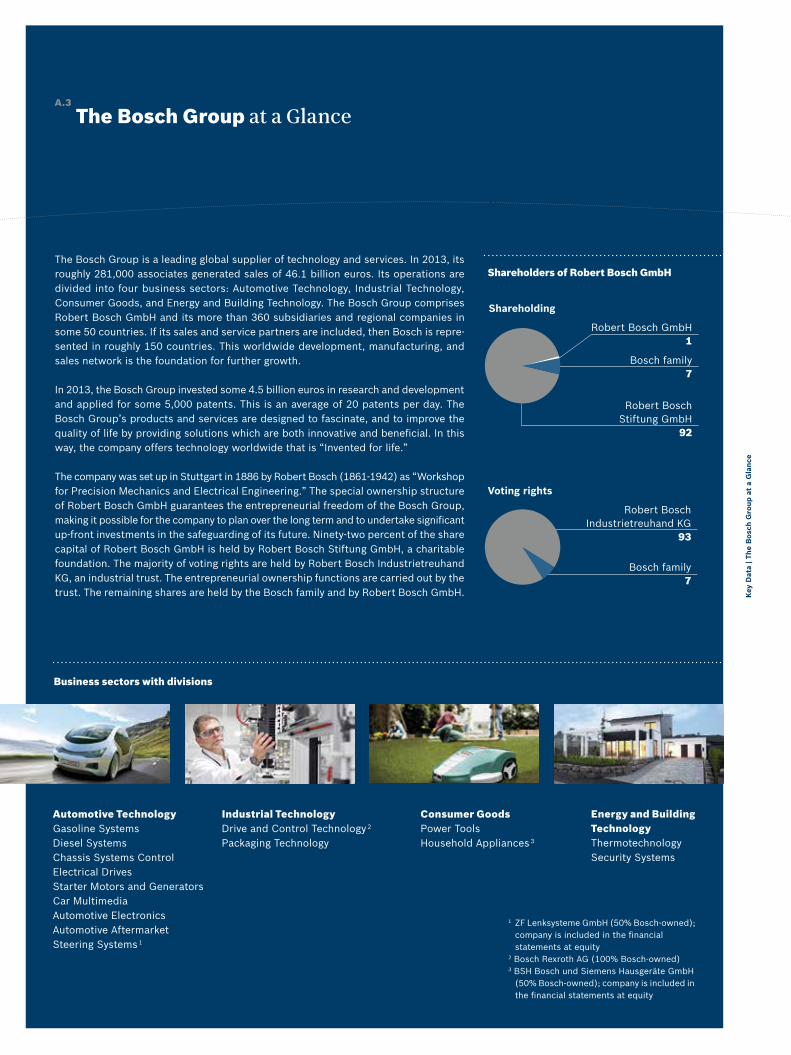
The Bosch Group is a leading global supplier of technology and services. In 2013, its roughly 281,000 associates generated sales of 46.1 billion euros. Its operations are divided into four business sectors: Automotive Technology, Industrial Technology, Consumer Goods, and Energy and Building Technology. The Bosch Group comprises Robert Bosch GmbH and its more than 360 subsidiaries and regional companies in some 50 countries. If its sales and service partners are included, then Bosch is repre-sented in roughly 150 countries. This worldwide development, manufacturing, and sales network is the foundation for further growth.
In 2013, the Bosch Group invested some 4.5 billion euros in research and development and applied for some 5,000 patents. This is an average of 20 patents per day. The Bosch Group’s products and services are designed to fascinate, and to improve the quality of life by providing solutions which are both innovative and beneficial. In this way, the company offers technology worldwide that is “Invented for life.”
The company was set up in Stuttgart in 1886 by Robert Bosch (1861-1942) as “Workshop for Precision Mechanics and Electrical Engineering.” The special ownership structure of Robert Bosch GmbH guarantees the entrepreneurial freedom of the Bosch Group, making it possible for the company to plan over the long term and to undertake significant up-front investments in the safeguarding of its future. Ninety-two percent of the share capital of Robert Bosch GmbH is held by Robert Bosch Stiftung GmbH, a charitable foundation. The majority of voting rights are held by Robert Bosch Industrietreuhand KG, an industrial trust. The entrepreneurial ownership functions are carried out by the trust. The remaining shares are held by the Bosch family and by Robert Bosch GmbH.
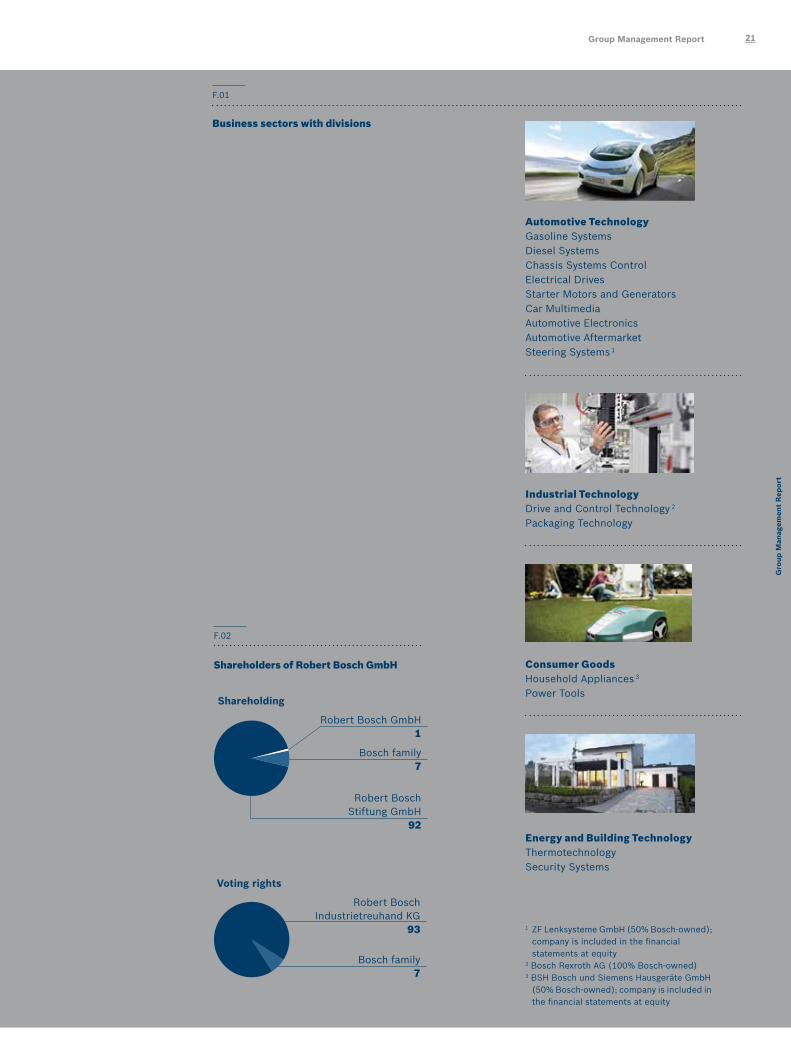
Business sectors with divisions
Automotive Technology Gasoline SystemsDiesel SystemsChassis Systems ControlElectrical DrivesStarter Motors and GeneratorsCar MultimediaAutomotive ElectronicsAutomotive AftermarketSteering Systems 1
Industrial Technology Drive and Control Technology 2
Packaging Technology
Consumer Goods Power ToolsHousehold Appliances 3
Energy and Building Technology ThermotechnologySecurity Systems
A.3
The Bosch Group at a Glance
Shareholders of Robert Bosch GmbH
Shareholding
Robert Bosch GmbH1
Bosch family7
Robert Bosch Stiftung GmbH
92
Voting rights
Robert Bosch Industrietreuhand KG
93
Bosch family7
1 ZF Lenksysteme GmbH (50% Bosch-owned); company is included in the financial statements at equity2 Bosch Rexroth AG (100% Bosch-owned)3 BSH Bosch und Siemens Hausgeräte GmbH (50% Bosch-owned); company is included in the financial statements at equity
Key
Dat
a | T
he B
osch
Gro
up a
t a
Gla
nce
Contents Annual Report 2013
A A.1 The Bosch Vision
II
A.2 Key Data
III
A.3 The Bosch Group at a Glance
IV
B B.1 Foreword
04
B.2 Board of Management
06
B.3 Supervisory Board Report
10 B.4 Supervisory Board, Industrial Trust, and International Advisory Committee
12
B.5 Highlights of the Year
14
B.6 Robert Bosch Stiftung
18
C Group Management Report
20
D Consolidated Financial Statements of the Bosch Group
54
Auditor’s Report136
Ten-Year Summary of the Bosch Group
138
List of Graphs and Tables
139
Publishing Details140
www.bosch.com/annual-reportAnnual Report 2013 online
BBosch 2013
Bosch Annual Report 20132
B.1 Foreword
04
B.2 Board of Management
06
B.3 Supervisory Board Report
10 B.4 Supervisory Board, Industrial Trust, and International Advisory Committee
12
B.5 Highlights of the Year
14
B.6 Robert Bosch Stiftung
18
3Bosch 2013
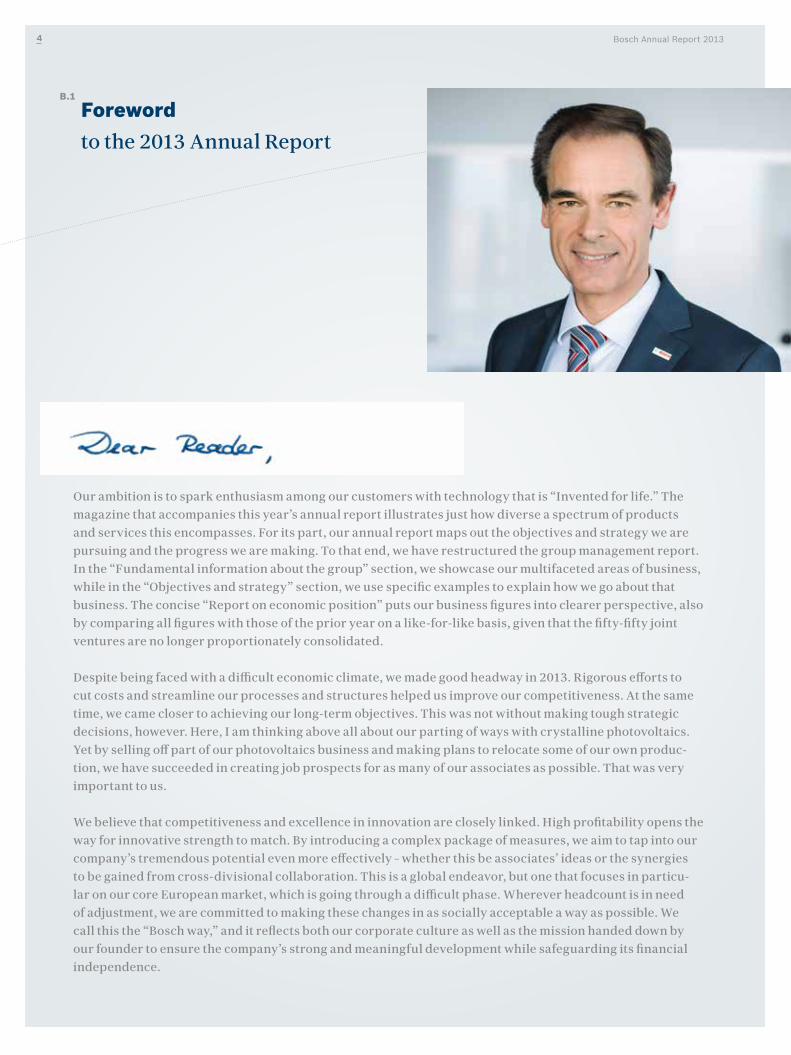
Our ambition is to spark enthusiasm among our customers with technology that is “Invented for life.” The magazine that accompanies this year’s annual report illustrates just how diverse a spectrum of products and services this encompasses. For its part, our annual report maps out the objectives and strategy we are pursuing and the progress we are making. To that end, we have restructured the group management report. In the “Fundamental information about the group” section, we showcase our multifaceted areas of business, while in the “Objectives and strategy” section, we use specific examples to explain how we go about that business. The concise “Report on economic position” puts our business figures into clearer perspective, also by comparing all figures with those of the prior year on a like-for-like basis, given that the fifty-fifty joint ventures are no longer proportionately consolidated.
Despite being faced with a difficult economic climate, we made good headway in 2013. Rigorous efforts to cut costs and streamline our processes and structures helped us improve our competitiveness. At the same time, we came closer to achieving our long-term objectives. This was not without making tough strategic decisions, however. Here, I am thinking above all about our parting of ways with crystalline photovoltaics. Yet by selling off part of our photovoltaics business and making plans to relocate some of our own produc-tion, we have succeeded in creating job prospects for as many of our associates as possible. That was very important to us.
We believe that competitiveness and excellence in innovation are closely linked. High profitability opens the way for innovative strength to match. By introducing a complex package of measures, we aim to tap into our company’s tremendous potential even more effectively – whether this be associates’ ideas or the synergies to be gained from cross-divisional collaboration. This is a global endeavor, but one that focuses in particu-lar on our core European market, which is going through a difficult phase. Wherever headcount is in need of adjustment, we are committed to making these changes in as socially acceptable a way as possible. We call this the “Bosch way,” and it reflects both our corporate culture as well as the mission handed down by our founder to ensure the company’s strong and meaningful development while safeguarding its financial independence.
B.1
Foreword to the 2013 Annual Report
Bosch Annual Report 20134
Scarcely any other company matches Bosch’s depth and breadth of technological expertise. This is why we consider the opportunities for successful development to be good – from a global perspective – and are engaged in expanding our international presence in all our areas of activity. In our automotive technology business, our substantial investments are paying dividends. One example is the powertrain, where we are enjoying great success with products that help manufacturers meet the stringent Euro 6 emissions require-ments. Another example is driver assistance systems, which are paving the way for automated driving. At the same time, our intensive efforts are continuing in the growth field of electromobility, where we have set our sights on becoming one of the leading suppliers. Although our industrial technology business is feeling the impact of the difficult economic environment, this segment still offers attractive prospects. Connected manufacturing looks set to revolutionize industrial production as we know it, and we are involved here as both a supplier and a user. And besides the aspect of energy efficiency, connectivity over the internet is also a driver of growth in our Consumer Goods and Energy and Building Technology business sectors. In this sense, “Invented for life” also stands for interconnected life. An unwavering customer focus is of vital and ever greater importance – in all that we do and wherever we do it.
On behalf of the board of management, I would like to thank all our associates around the world for the achievements and successes they have made possible. We are also very grateful to the employee represen-tatives for their constructive help in finding solutions, as well as to our business partners, shareholders, and supervisory board members for their support.
With best regards,
Dr. Volkmar DennerChairman of the board of management
11:47_ “Scarcely any other company matches Bosch’s depth and breadth of technological expertise. This is why we consider the opportunities for successful development to be good – from a global perspective.”
Dr. Volkmar Denner
5Foreword
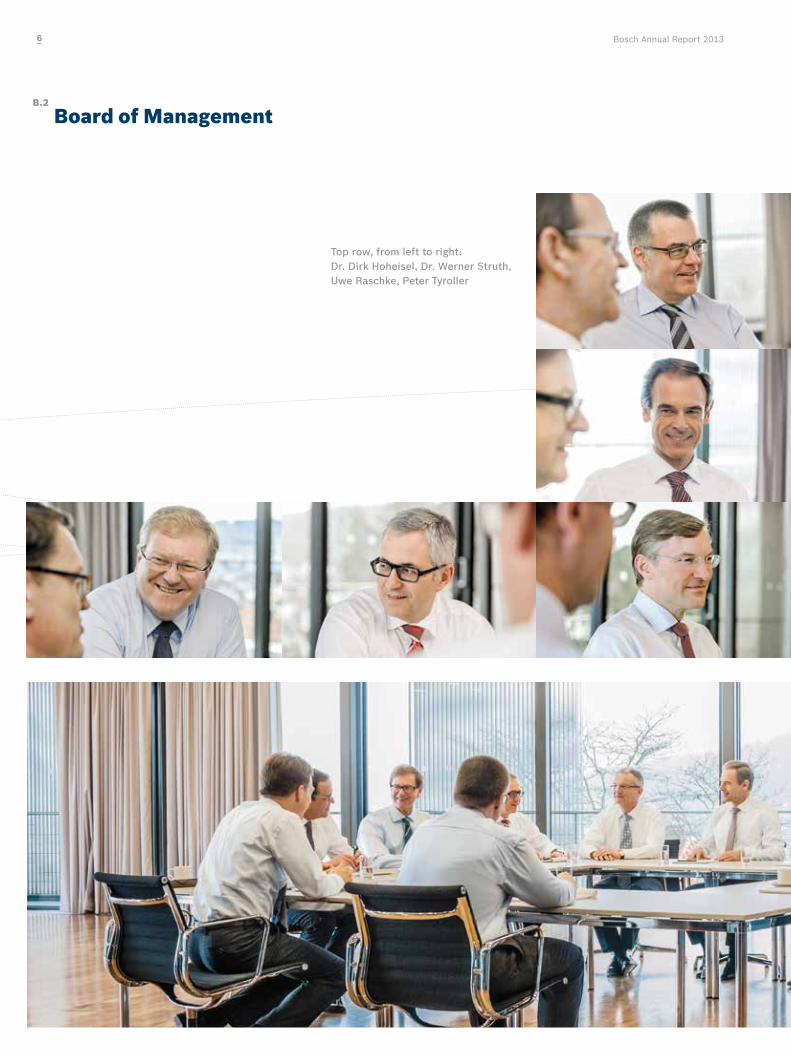
B.2
Board of Management
Top row, from left to right: Dr. Dirk Hoheisel, Dr. Werner Struth, Uwe Raschke, Peter Tyroller
Bosch Annual Report 20136
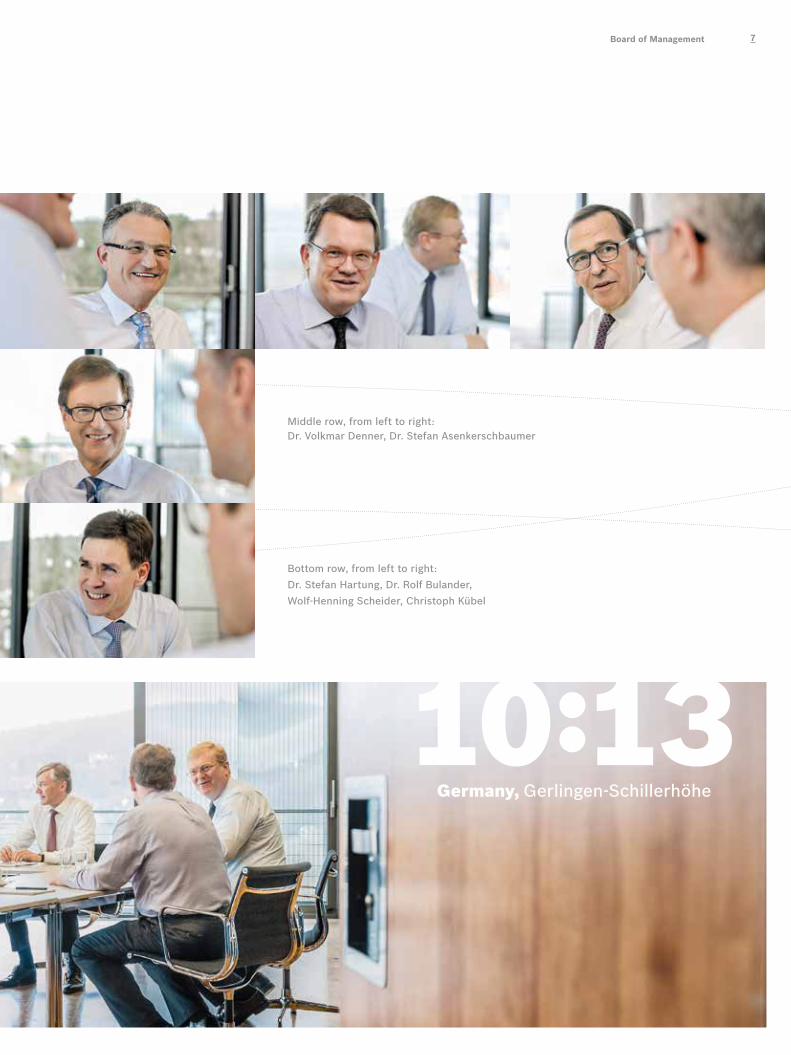
10:13Germany, Gerlingen-Schillerhöhe
Bottom row, from left to right:
Dr. Stefan Hartung, Dr. Rolf Bulander,
Wolf-Henning Scheider, Christoph Kübel
Middle row, from left to right:Dr. Volkmar Denner, Dr. Stefan Asenkerschbaumer
7Board of Management
Dr. Stefan Hartung
Corporate Responsibilities• Energy and Building Technology
Divisions • Security Systems• Solar Energy• Thermotechnology
Subsidiaries• Bosch Energy and Building Solutions GmbH
1 until June 30, 20132 from July 1, 2013
Uwe Raschke
Corporate Responsibilities• Consumer Goods• User Experience
Divisions • Power Tools
Subsidiaries• BSH Bosch und Siemens Hausgeräte GmbH 3
Regional ResponsibilitiesAsia Pacific 1, Western Europe, Central and Eastern Europe, Russia, Middle East, Africa
Dr. Dirk Hoheisel
Corporate Responsibilities• Automotive Systems Integration 2
Divisions• Chassis Systems Control 2
• Car Multimedia• Automotive Electronics
Subsidiaries • ETAS GmbH
Dr. Rolf Bulander 2
Corporate Responsibilities• Quality
Divisions • Gasoline Systems• Diesel Systems• Starter Motors and Generators
Subsidiaries • Bosch Engineering GmbH
Wolf-Henning Scheider
Corporate Responsibilities 2
• Automotive Group• Original Equipment Sales• Marketing and Sales
Divisions• Chassis Systems Control 1
• Electrical Drives• Starter Motors and Generators 1
• Automotive Aftermarket 2
Subsidiaries 2
• ZF Lenksysteme GmbH 3
Dr. Volkmar DennerChairman
Corporate Responsibilities• Corporate Strategy• Corporate Communications• Research and Advance Engineering• Engineering Coordination• Senior Executives 5
• Real Estate and Facilities
Subsidiaries• Bosch Software Innovations GmbH• Healthcare Telemedicine• Bosch Venture Capital GmbH• Bosch Energy Storage Solutions LLC
Dr. Stefan AsenkerschbaumerDeputy Chairman 2
Corporate Responsibilities• Finance and Financial Statements• Planning and Management Accounting• Internal Accounting and Organization• Purchasing and Logistics • Information Technology • In-house Consultancy
B.2
Board of Management
3 joint ventures previously managed as the “ZF Steering Systems“ and “Household Appliances” divisions4 from January 1, 2014
5 until December 31, 2013 6 from April 1, 20137 until March 31, 2013
Bosch Annual Report 20138
Dr. Bernd Bohr 1
Corporate Responsibilities• Chairman, Automotive Group• Automotive Systems Integration• Quality
Divisions • Gasoline Systems• Diesel Systems
Subsidiaries• Bosch Engineering Systems GmbH• ZF Lenksysteme GmbH 3
Regional ResponsibilitiesIndia
Dr. Werner Struth
Corporate Responsibilities• Industrial Technology 2
• Manufacturing Coordination, Production System Development, and Investment Planning• Environmental Protection
Divisions • Drive and Control Technology • Packaging Technology
Regional ResponsibilitiesNorth America, South America
Christoph Kübel
Corporate Responsibilities• Human Resources and Social Welfare, incl. Senior Executives4
• External Affairs, Governmental, and Political Relations• Legal Services and Compliance• Taxes• Internal Auditing• Intellectual Property• Insurance
Presidents of the Divisions
Manfred Baden Car Multimedia 2 Henning von Boxberg Power Tools
Dr. Rolf Bulander Gasoline Systems 1
Uwe Glock Thermotechnology
Dr. Steffen Haack Solar Energy 6
Robert Hanser Automotive Aftermarket 1
Peter Tyroller
Corporate Responsibilities 1
• Original Equipment Sales • Marketing and Sales
Divisions 1
• Automotive Aftermarket
Regional Responsibilities 2
Asia Pacific, India
Holger von Hebel Solar Energy 7
Dr. Markus Heyn Diesel Systems
Gert van Iperen Security Systems Dr. Ulrich Kirschner Starter Motors and Generators
Friedbert Klefenz Packaging Technology
Klaus Meder Automotive Electronics
Stefan Seiberth Gasoline Systems 2
Gerhard Johannes SteigerChassis Systems Control Dr. Bernhard StraubElectrical Drives 4
Dr. Uwe Thomas Car Multimedia 1 Automotive Aftermarket 2
Dr. Karl Tragl Drive and Control Technology
Dr. Udo WolzElectrical Drives 5
9Board of Management
B.3
Supervisory Board Report
The Bosch Group can look back on a year in which, despite some difficult decisions, we came closer to the objectives we have set ourselves.
As supervisory board members, we are obliged by law and the statutes to fulfill a number of tasks – an obli-gation which we fulfilled once more with the utmost care in fiscal 2013. We regularly monitored the work of the board of management and, in an advisory capacity, supported it in its management tasks, in its work to further develop the Bosch Group strategy, and above all, in its efforts to put critical elements of that strategy into practice. This collaboration took place in an atmosphere of trust and of open, constructive exchange. Both the supervisory board and the board of management share the objective of securing the Bosch Group’s sustainable development, so that it is successful over the long term. In this way, we fulfill the mission handed down to us in the will of the company founder, Robert Bosch. Beyond the meetings of the supervisory board, the chairman of the supervisory board had the chairman of the board of management inform him about cur-rent developments and events of relevance for the company.
The exit from crystalline photovoltaics is a watershed for the Bosch Group. The supervisory board had the rationale behind this decision presented to us in detail, and discussed it at length with the board of manage-ment. Our consultations also focused on the fundamental strategic direction of the Bosch Group, looking in depth at the future opportunities in mature markets such as Europe and North America, as well as in the global growth regions of Asia and South America. One issue in this context was safeguarding existing busi-ness and the creation of additional opportunities for growth as a result of connectivity over the internet of things and services. The supervisory board devoted special attention to the integration of the diagnostics business of SPX Corporation, acquired at the end of 2012, and to driver assistance systems as a preliminary stage of automated driving.
In 2013, the newly composed supervisory board looked in detail at the financial and capital expenditure plans drawn up by the board of management, and also at risk management issues. The board of management also reported on major individual risks. There was no evidence of existential risks. The auditor also exam-ined the structure and function of the risk management system, and raised no objections.
Bosch Annual Report 201310
PricewaterhouseCoopers Aktiengesellschaft Wirtschaftsprüfungsgesellschaft (PwC) audited and issued an unqualified audit opinion on the Robert Bosch GmbH annual financial statements, the Bosch Group consolidated financial statements, and the accompanying management reports as of and for the year ended December 31, 2013. The supervisory board discussed these documents at length and subjected them to its own examination. All members of the supervisory board had access to the auditor’s reports. Moreover, at the supervisory board meeting, the auditor reported on the main findings of the audit, which were then discussed in detail in the auditor’s presence. The supervisory board raised no objections, concurred with the results of the audit, and approved the Robert Bosch GmbH annual financial statements and the Bosch Group consolidated financial statements. The supervisory board recommended that the shareholders adopt the annual financial statements, approve the consolidated financial statements, and endorse the board of management’s proposal for the appropriation of net profit.
The supervisory board would like to thank the board of management and all Bosch Group associates for their dedication and hard work over the past year, as well as for the many ideas that will sustain the company’s continuing success.
Stuttgart, March 2014For the supervisory board
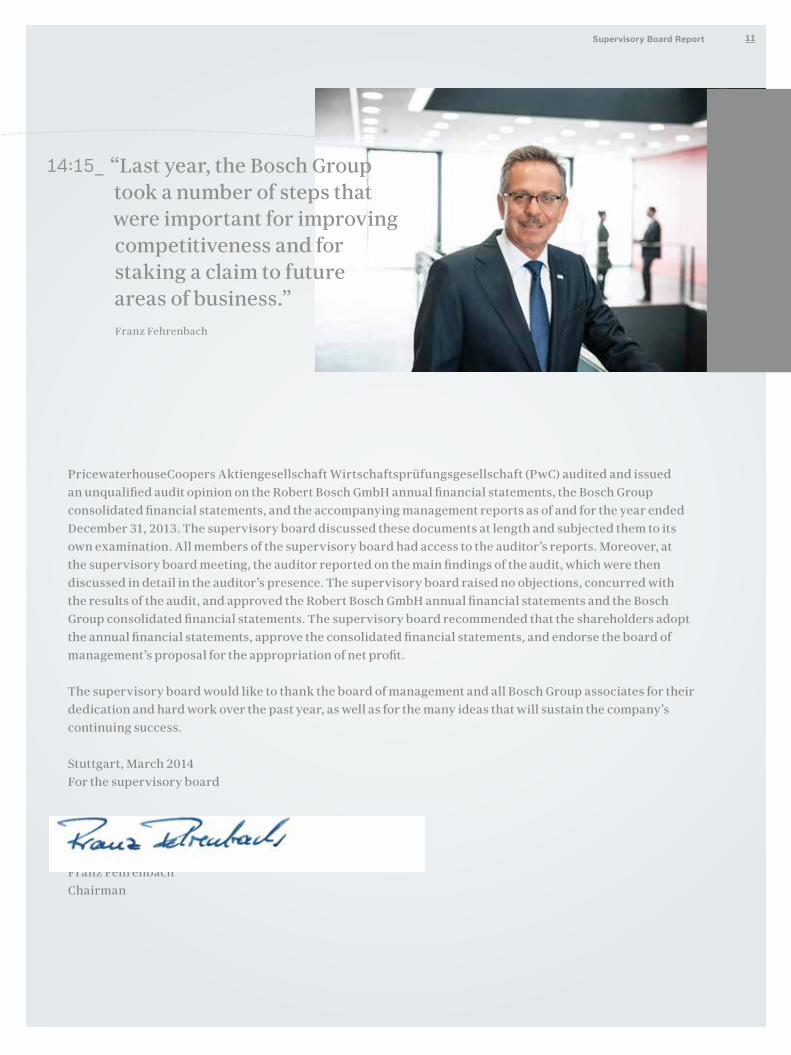
Franz FehrenbachChairman
14:15_ “Last year, the Bosch Group took a number of steps that were important for improving competitiveness and for staking a claim to future areas of business.”Franz Fehrenbach
11Supervisory Board Report
Franz Fehrenbach Stuttgart Chairman former Chairman of the Board of Managementof Robert Bosch GmbH
Alfred LöckleLudwigsburgDeputy ChairmanMember of the Works Council of the Schwie-berdingen Plant, and Chairman of the Central Works Council as well as of the Combined Works Council of Robert Bosch GmbH
Christiane BennerFrankfurt(from March 22, 2013)Managing Partner on the Executive Board of Industriegewerkschaft Metall
Dr. Christof BoschKönigsdorf Spokesperson for the Bosch family
Christian BrunkhorstMühltalRepresentative of the Chairman of Industriegewerkschaft Metall
Klaus FriedrichLohr Chairman of the Works Council of Bosch Rexroth AG, Lohr am Main, Chairman of the Central Works Council of Bosch Rexroth AG, and Member of the Combined Works Council of Robert Bosch GmbH
Hartwig GeiselLeinfelden-EchterdingenChairman of the Works Council of the Feuer-bach Plant and Deputy Chairman of the Central Works Council as well as of the Combined Works Council of Robert Bosch GmbH
Jörg HofmannEsslingenCo-chairman of Industriegewerkschaft Metall, Frankfurt
Prof. Lars G. JosefssonStockholmformer President and Chief Executive Officer of Vattenfall AB
Dieter KleinWolfersheimChairman of the Works Council of the Homburg Plant and Member of the Central Works Council of Robert Bosch GmbH
Prof. Dr. Renate KöcherKonstanzManaging Director, Allensbach Institute for Public Opinion Research
Prof. Dr. Hermut KormannUlm(until March 22, 2013)former Chairman of the Board of Management of Voith AG
Prof. Dr. Olaf KüblerZurichformer Director, Eidgenössische Technische Hochschule (ETH) Zurich
Matthias Georg MadelungMunichMember of the Board of Trustees of Robert Bosch Stiftung GmbH
Kerstin MaiHildesheim(from March 22, 2013)Chairperson of the Works Council of Robert Bosch Car Multimedia GmbH, Hildesheim, and Member of the Combined Works Council of Robert Bosch GmbH
Dr. Wolfgang MalchowPliezhausenformer Member of the Board of Management of Robert Bosch GmbH
Daniel MüllerMetzingen(until March 22, 2013)Chairman of the Works Council of the Reutlin-gen Plant and Member of the Central Works Council of Robert Bosch GmbH
Urs B. RinderknechtZurichformer Chief Executive of UBS AG
Wolf Jürgen RöderHofheim/Taunus(until March 22, 2013)former Executive Director, Otto Brenner Stiftung der Industriegewerkschaft Metall, Frankfurt
Tilman TodenhöferMadrid Managing Partner of Robert Bosch Industrietreuhand KG
Dr. Richard VogtBühl Department Head, Deployment of Business Excellence, Electrical Drives Division, Chairman of the Central Executives Committee of Robert Bosch GmbH, and Chairman of the Combined Executives Committee of the Bosch Group in Germany
Prof. Dr. Beatrice Weder di MauroFrankfurt(from March 22, 2013)Chair of International Macroeconomics at the Johannes Gutenberg University of Mainz
Hans WolffBamberg Chairman of the Works Council of the Bamberg Plant and Member of the Central Works Council of Robert Bosch GmbH
B.4
Supervisory Board
Bosch Annual Report 201312
General partners
Franz FehrenbachStuttgartChairman of the Shareholders Meeting
Tilman TodenhöferMadrid
Limited partners
Dr. Christof BoschKönigsdorf
Dr. Siegfried DaisStuttgart
Dr. Volkmar DennerPfullingen
Dr. Jürgen HambrechtLudwigshafen
Prof. Lars G. JosefssonStockholm
Prof. Dr. Olaf KüblerZurich
Dr. Michael OttoHamburg
Urs B. RinderknechtZurich
Robert Bosch Industrietreuhand KG
Franz FehrenbachStuttgartChairman
Dott. Alessandro BenettonTreviso
Dr. Hugo BütlerZurich
HRH Prince El Hassan bin TalalAmman
Prof. Ryozo HayashiTokyo
Baba N. KalyaniPune
Dr. Henry A. Kissinger KCMGWashington
Friedrich MerzDüsseldorf
Ingo PlögerSão Paulo
Dr. Hans-Friedrich von PloetzBerlin(until December 31, 2013)
Erwin SchurtenbergerAscona, Beijing
Louis SchweitzerParis
Prof. Dr. Igor YurgensMoscow(from January 1, 2014)
Robert Bosch International Advisory Committee
Industrial Trust and International Advisory Committee
Supervisory Board, Industrial Trust, and International Advisory Committee 13
Feb. 21 Tokyo, Japan
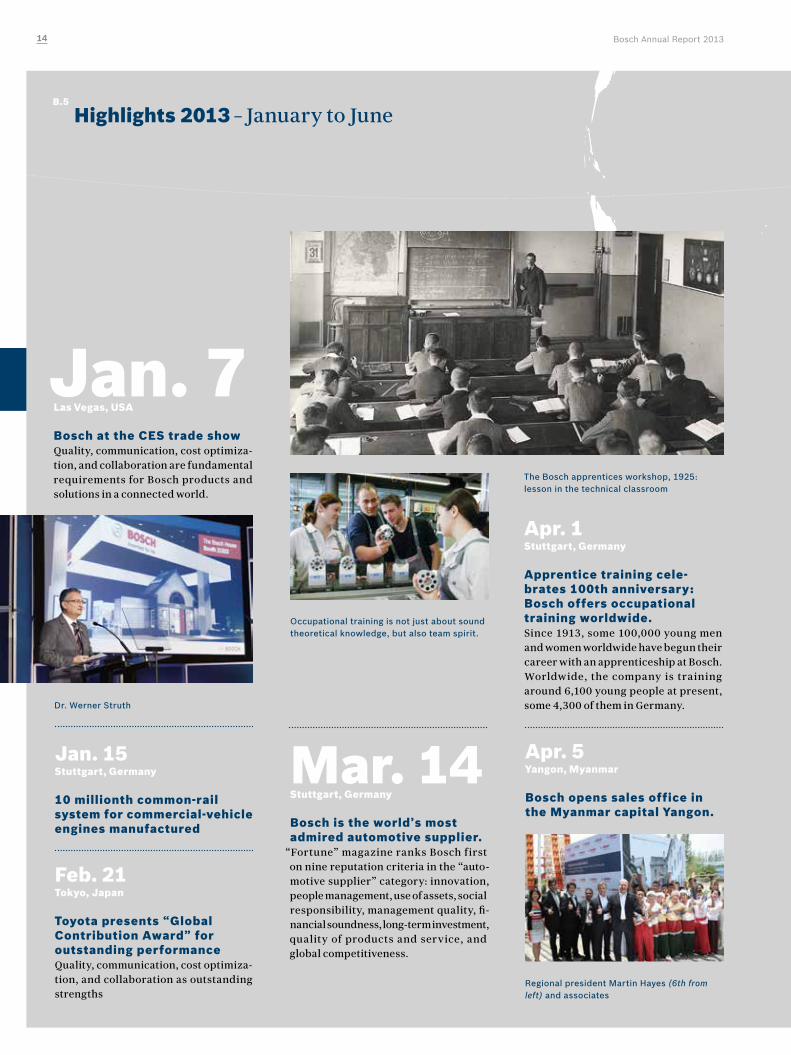
Toyota presents “Global Contribution Award” for outstanding performanceQuality, communication, cost optimiza-tion, and collaboration as outstanding strengths
Jan. 15 Stuttgart, Germany
10 millionth common-rail system for commercial-vehicle engines manufactured
Jan. 7 Las Vegas, USA
Bosch at the CES trade showQuality, communication, cost optimiza-tion, and collaboration are fundamental requirements for Bosch products and solutions in a connected world.
Mar. 14Stuttgart, Germany
Bosch is the world’s most admired automotive supplier.
“Fortune” magazine ranks Bosch first on nine reputation criteria in the “auto-motive supplier” category: innovation, people management, use of assets, social responsibility, management quality, fi-nancial soundness, long-term investment, quality of products and service, and global competitiveness.
B.5
Highlights 2013 – January to June
Apr. 5 Yangon, Myanmar
Bosch opens sales office in the Myanmar capital Yangon.
Regional president Martin Hayes (6th from left) and associates
Apr. 1 Stuttgart, Germany
Apprentice training cele-brates 100th anniversary: Bosch offers occupational training worldwide.Since 1913, some 100,000 young men and women worldwide have begun their career with an apprenticeship at Bosch. Worldwide, the company is training around 6,100 young people at present, some 4,300 of them in Germany.
The Bosch apprentices workshop, 1925: lesson in the technical classroom
Occupational training is not just about sound theoretical knowledge, but also team spirit.
Dr. Werner Struth
Bosch Annual Report 201314
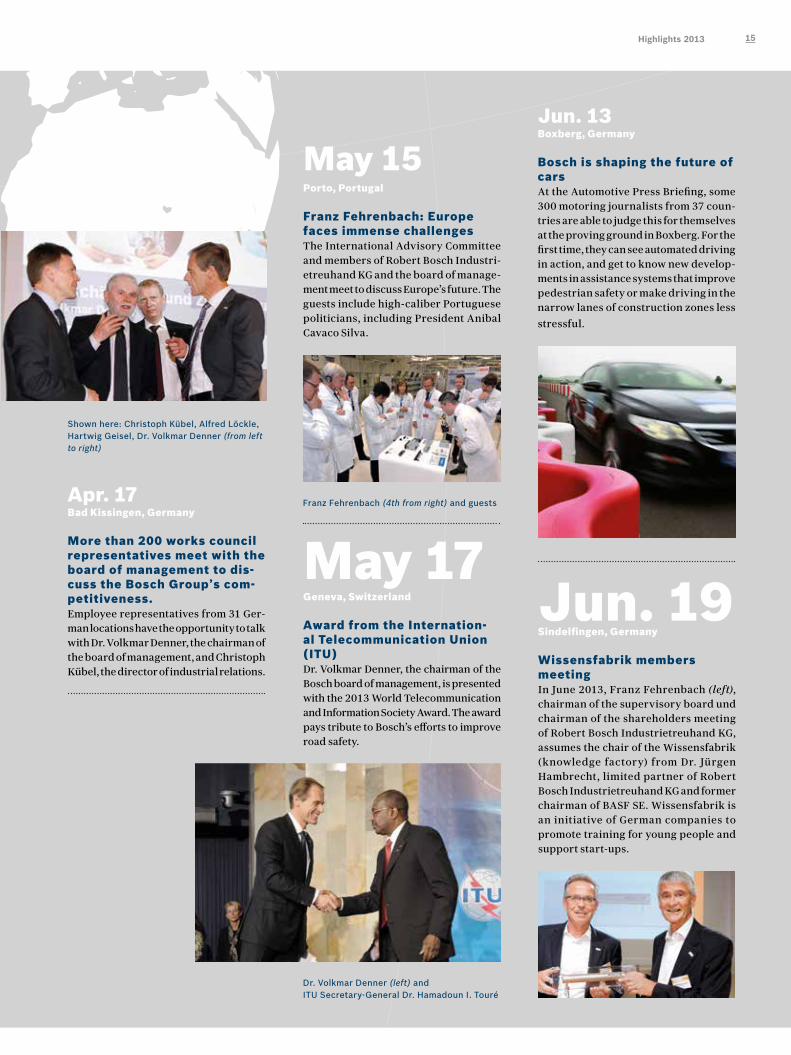
Jun. 13 Boxberg, Germany
Bosch is shaping the future of carsAt the Automotive Press Briefing, some 300 motoring journalists from 37 coun-tries are able to judge this for themselves at the proving ground in Boxberg. For the first time, they can see automated driving in action, and get to know new develop-ments in assistance systems that improve pedestrian safety or make driving in the narrow lanes of construction zones less stressful.
May 17 Geneva, Switzerland
Award from the Internation-al Telecommunication Union (ITU)Dr. Volkmar Denner, the chairman of the Bosch board of management, is presented with the 2013 World Telecommunication and Information Society Award. The award pays tribute to Bosch’s efforts to improve road safety.
Dr. Volkmar Denner (left) and ITU Secretary-General Dr. Hamadoun I. Touré
Jun. 19 Sindelfingen, Germany
Wissensfabrik members meetingIn June 2013, Franz Fehrenbach (left), chairman of the supervisory board und chairman of the shareholders meeting of Robert Bosch Industrietreuhand KG, assumes the chair of the Wissensfabrik (knowledge factory) from Dr. Jürgen Hambrecht, limited partner of Robert Bosch Industrietreuhand KG and former chairman of BASF SE. Wissensfabrik is an initiative of German companies to promote training for young people and support start-ups.
Shown here: Christoph Kübel, Alfred Löckle, Hartwig Geisel, Dr. Volkmar Denner (from left to right)
Apr. 17 Bad Kissingen, Germany
More than 200 works council representatives meet with the board of management to dis-cuss the Bosch Group’s com-petitiveness. Employee representatives from 31 Ger-man locations have the opportunity to talk with Dr. Volkmar Denner, the chairman of the board of management, and Christoph Kübel, the director of industrial relations.
Franz Fehrenbach (4th from right) and guests
May 15 Porto, Portugal
Franz Fehrenbach: Europe faces immense challenges The International Advisory Committee and members of Robert Bosch Industri-etreuhand KG and the board of manage-ment meet to discuss Europe’s future. The guests include high-caliber Portuguese politicians, including President Anibal Cavaco Silva.
15Highlights 2013
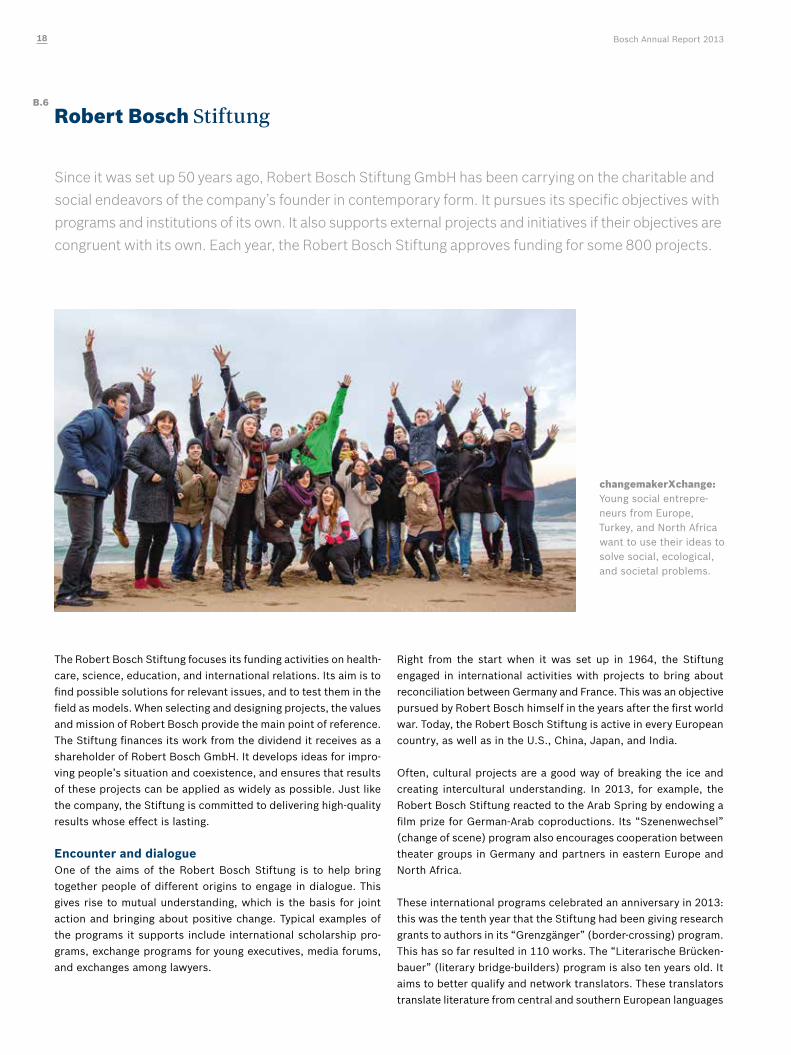
Sep. 10 Leinfelden, Germany
Smallest laser rangefinder launchedPLR 15, based on single-photon avalanche diode technology
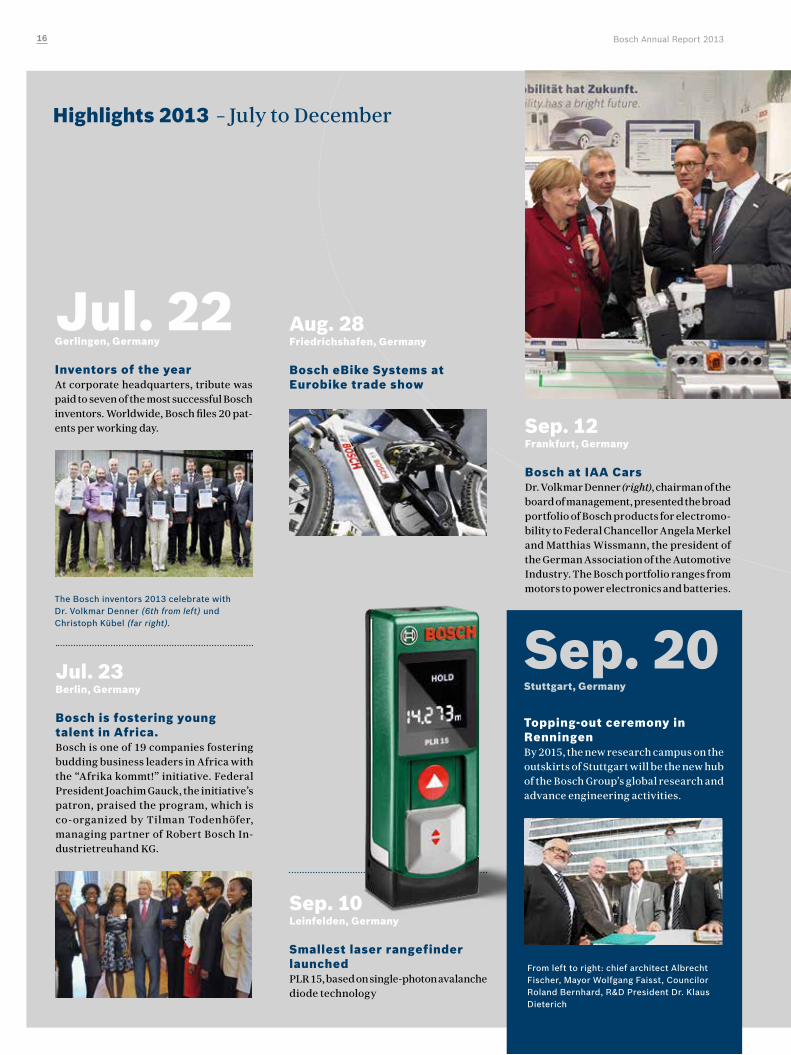
Jul. 22 Gerlingen, Germany
Inventors of the yearAt corporate headquarters, tribute was paid to seven of the most successful Bosch inventors. Worldwide, Bosch files 20 pat-ents per working day.
The Bosch inventors 2013 celebrate with Dr. Volkmar Denner (6th from left) und Christoph Kübel (far right).
Jul. 23 Berlin, Germany
Bosch is fostering young talent in Africa.Bosch is one of 19 companies fostering budding business leaders in Africa with the “Afrika kommt!” initiative. Federal President Joachim Gauck, the initiative’s patron, praised the program, which is co-organized by Tilman Todenhöfer, managing partner of Robert Bosch In-dustrietreuhand KG.
Highlights 2013 – July to December
Aug. 28 Friedrichshafen, Germany
Bosch eBike Systems at Eurobike trade show
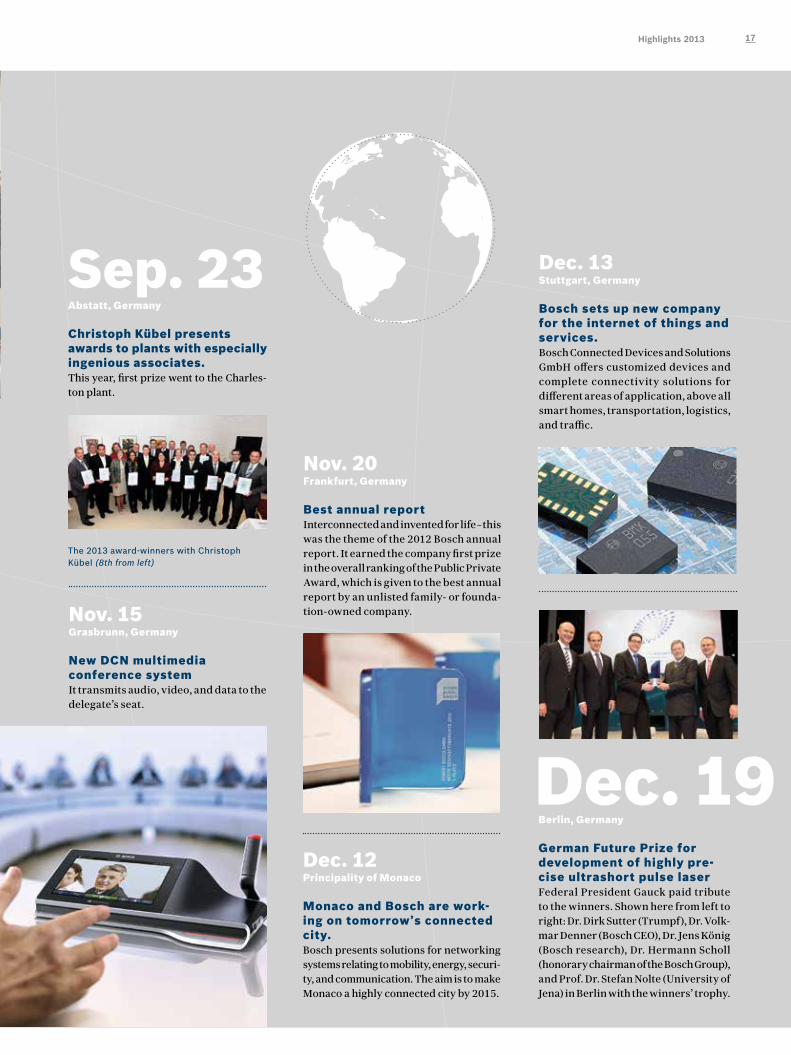
Sep. 12 Frankfurt, Germany
Bosch at IAA Cars Dr. Volkmar Denner (right), chairman of the board of management, presented the broad portfolio of Bosch products for electromo-bility to Federal Chancellor Angela Merkel and Matthias Wissmann, the president of the German Association of the Automotive Industry. The Bosch portfolio ranges from motors to power electronics and batteries.
Sep. 20 Stuttgart, Germany
Topping-out ceremony in Renningen By 2015, the new research campus on the outskirts of Stuttgart will be the new hub of the Bosch Group’s global research and advance engineering activities.
From left to right: chief architect Albrecht Fischer, Mayor Wolfgang Faisst, Councilor Roland Bernhard, R&D President Dr. Klaus Dieterich
Bosch Annual Report 201316
Nov. 20 Frankfurt, Germany
Best annual reportInterconnected and invented for life – this was the theme of the 2012 Bosch annual report. It earned the company first prize in the overall ranking of the Public Private Award, which is given to the best annual report by an unlisted family- or founda-tion-owned company.
Dec. 12 Principality of Monaco
Monaco and Bosch are work-ing on tomorrow’s connected city.Bosch presents solutions for networking systems relating to mobility, energy, securi-ty, and communication. The aim is to make Monaco a highly connected city by 2015.
Nov. 15 Grasbrunn, Germany
New DCN multimedia conference systemIt transmits audio, video, and data to the delegate’s seat.
Sep. 23 Abstatt, Germany
Christoph Kübel presents awards to plants with especially ingenious associates.This year, first prize went to the Charles-ton plant.
The 2013 award-winners with Christoph Kübel (8th from left)
Dec. 13 Stuttgart, Germany
Bosch sets up new company for the internet of things and services.Bosch Connected Devices and Solutions GmbH offers customized devices and complete connectivity solutions for different areas of application, above all smart homes, transportation, logistics, and traffic.
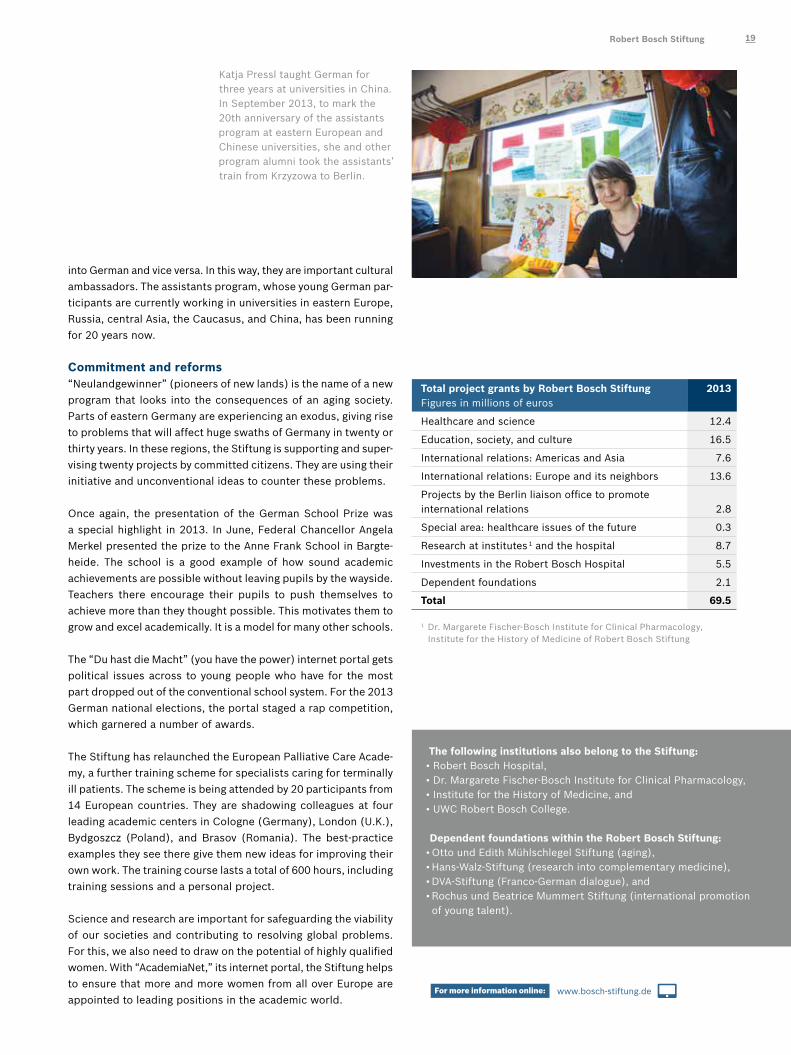
Berlin, Germany
German Future Prize for development of highly pre-cise ultrashort pulse laserFederal President Gauck paid tribute to the winners. Shown here from left to right: Dr. Dirk Sutter (Trumpf), Dr. Volk-mar Denner (Bosch CEO), Dr. Jens König (Bosch research), Dr. Hermann Scholl (honorary chairman of the Bosch Group), and Prof. Dr. Stefan Nolte (University of Jena) in Berlin with the winners’ trophy.
Dec. 19
17Highlights 2013
Since it was set up 50 years ago, Robert Bosch Stiftung GmbH has been carrying on the charitable and
social endeavors of the company’s founder in contemporary form. It pursues its specific objectives with
programs and institutions of its own. It also supports external projects and initiatives if their objectives are
congruent with its own. Each year, the Robert Bosch Stiftung approves funding for some 800 projects.
The Robert Bosch Stiftung focuses its funding activities on health-care, science, education, and international relations. Its aim is to find possible solutions for relevant issues, and to test them in the field as models. When selecting and designing projects, the values and mission of Robert Bosch provide the main point of reference. The Stiftung finances its work from the dividend it receives as a shareholder of Robert Bosch GmbH. It develops ideas for impro-ving people’s situation and coexistence, and ensures that results of these projects can be applied as widely as possible. Just like the company, the Stiftung is committed to delivering high-quality results whose effect is lasting.
Encounter and dialogueOne of the aims of the Robert Bosch Stiftung is to help bring together people of different origins to engage in dialogue. This gives rise to mutual understanding, which is the basis for joint action and bringing about positive change. Typical examples of the programs it supports include international scholarship pro-grams, exchange programs for young executives, media forums, and exchanges among lawyers.
Right from the start when it was set up in 1964, the Stiftung engaged in international activities with projects to bring about reconciliation between Germany and France. This was an objective pursued by Robert Bosch himself in the years after the first world war. Today, the Robert Bosch Stiftung is active in every European country, as well as in the U.S., China, Japan, and India.
Often, cultural projects are a good way of breaking the ice and creating intercultural understanding. In 2013, for example, the Robert Bosch Stiftung reacted to the Arab Spring by endowing a film prize for German-Arab coproductions. Its “Szenenwechsel” (change of scene) program also encourages cooperation between theater groups in Germany and partners in eastern Europe and North Africa.
These international programs celebrated an anniversary in 2013: this was the tenth year that the Stiftung had been giving research grants to authors in its “Grenzgänger” (border-crossing) program. This has so far resulted in 110 works. The “Literarische Brücken-bauer” (literary bridge-builders) program is also ten years old. It aims to better qualify and network translators. These translators translate literature from central and southern European languages
B.6
Robert Bosch Stiftung
changemakerXchange:Young social entrepre-neurs from Europe, Turkey, and North Africa want to use their ideas to solve social, ecological, and societal problems.
Bosch Annual Report 201318
into German and vice versa. In this way, they are important cultural ambassadors. The assistants program, whose young German par-ticipants are currently working in universities in eastern Europe, Russia, central Asia, the Caucasus, and China, has been running for 20 years now.
Commitment and reforms“Neulandgewinner” (pioneers of new lands) is the name of a new program that looks into the consequences of an aging society. Parts of eastern Germany are experiencing an exodus, giving rise to problems that will affect huge swaths of Germany in twenty or thirty years. In these regions, the Stiftung is supporting and super-vising twenty projects by committed citizens. They are using their initiative and unconventional ideas to counter these problems.
Once again, the presentation of the German School Prize was a special highlight in 2013. In June, Federal Chancellor Angela Merkel presented the prize to the Anne Frank School in Bargte-heide. The school is a good example of how sound academic achievements are possible without leaving pupils by the wayside. Teachers there encourage their pupils to push themselves to achieve more than they thought possible. This motivates them to grow and excel academically. It is a model for many other schools.
The “Du hast die Macht” (you have the power) internet portal gets political issues across to young people who have for the most part dropped out of the conventional school system. For the 2013 German national elections, the portal staged a rap competition, which garnered a number of awards.
The Stiftung has relaunched the European Palliative Care Acade-my, a further training scheme for specialists caring for terminally ill patients. The scheme is being attended by 20 participants from 14 European countries. They are shadowing colleagues at four leading academic centers in Cologne (Germany), London (U.K.), Bydgoszcz (Poland), and Brasov (Romania). The best-practice examples they see there give them new ideas for improving their own work. The training course lasts a total of 600 hours, including training sessions and a personal project.
Science and research are important for safeguarding the viability of our societies and contributing to resolving global problems. For this, we also need to draw on the potential of highly qualified women. With “AcademiaNet,” its internet portal, the Stiftung helps to ensure that more and more women from all over Europe are appointed to leading positions in the academic world.
Total project grants by Robert Bosch Stiftung Figures in millions of euros
2013
Healthcare and science 12.4
Education, society, and culture 16.5
International relations: Americas and Asia 7.6
International relations: Europe and its neighbors 13.6
Projects by the Berlin liaison office to promote international relations 2.8
Special area: healthcare issues of the future 0.3
Research at institutes 1 and the hospital 8.7
Investments in the Robert Bosch Hospital 5.5
Dependent foundations 2.1
Total 69.5
1 Dr. Margarete Fischer-Bosch Institute for Clinical Pharmacology, Institute for the History of Medicine of Robert Bosch Stiftung
The following institutions also belong to the Stiftung:• Robert Bosch Hospital,• Dr. Margarete Fischer-Bosch Institute for Clinical Pharmacology, • Institute for the History of Medicine, and • UWC Robert Bosch College.
Dependent foundations within the Robert Bosch Stiftung:• Otto und Edith Mühlschlegel Stiftung (aging), • Hans-Walz-Stiftung (research into complementary medicine), • DVA-Stiftung (Franco-German dialogue), and• Rochus und Beatrice Mummert Stiftung (international promotion of young talent).
www.bosch-stiftung.de For more information online:
Katja Pressl taught German for three years at universities in China. In September 2013, to mark the 20th anniversary of the assistants program at eastern European and Chinese universities, she and other program alumni took the assistants’ train from Krzyzowa to Berlin.
Robert Bosch Stiftung 19
CGroup Management Report
Overall, 2013 was a positive year for the Bosch Group. Despite the weak economic environment, it
managed to increase both sales and earnings. This accomplishment was due partly to innovative
products in all business sectors, and partly to a rigorous focus on costs. The Automotive Technology
business sector was particularly successful, while Industrial Technology was severely impacted
by the tough environment in the mechanical engineering industry. In addition, important strategic
groundwork was laid. This included developing the new Energy and Building Technology business
sector, realigning the battery businesses for electric cars, and increasingly taking advantage of the
potential for connecting products and services over the internet. We also withdrew from the crys-
talline photovoltaics business. In some cases, its activities are presented separately in this report.
The change in the way we consolidate our fifty-fifty joint ventures also had a substantial impact on
the way figures are presented. They are no longer included on a pro-rata basis in the consolidated
financial statements using the proportionate consolidation method. Instead, they are recognized
using the equity method. That is to say that their pro-rata share of equity is reported on the state-
ment of financial position and their after-tax income is reported in operating profit. The 2012 data
have been adjusted accordingly.
Fundamental information about the group 22
Objectives and strategy 26
Report on economic position 35
Controlling system 35 Macroeconomic and sector-specific environment 36
Course of business and sales trend 38
Results of operations 41
Net assets and financial position 43
Liquidity 45
Report on post-balance sheet date events 46
Outlook 46
Report on opportunities and risks 48
Bosch Annual Report 201320
Business sectors with divisions
1 ZF Lenksysteme GmbH (50% Bosch-owned); company is included in the financial statements at equity2 Bosch Rexroth AG (100% Bosch-owned)3 BSH Bosch und Siemens Hausgeräte GmbH (50% Bosch-owned); company is included in the financial statements at equity
Shareholders of Robert Bosch GmbH
Automotive Technology Gasoline SystemsDiesel SystemsChassis Systems ControlElectrical DrivesStarter Motors and GeneratorsCar MultimediaAutomotive ElectronicsAutomotive AftermarketSteering Systems 1
Consumer Goods Household Appliances 3
Power Tools
Energy and Building Technology ThermotechnologySecurity Systems
F.02
F.01
Shareholding
Robert Bosch GmbH1
Bosch family7
Robert Bosch Stiftung GmbH
92
Voting rights
Robert Bosch Industrietreuhand KG
93
Bosch family7
Industrial Technology Drive and Control Technology 2
Packaging Technology
Gro
up M
anag
emen
t R
epor
t
Group Management Report 21
Fundamental information about the group
The group
The Bosch Group encompasses around 360 subsidiaries and regional companies in approximately 50 countries. Including its trading and service partners, the group is represented in some 150 countries. The parent company is Robert Bosch GmbH, which is headquartered in Stuttgart. It started out as “Workshop for Precision Mechanics and Electrical Engineering,” founded in Stuttgart in 1886 by Robert Bosch (1861-1942). In 1917, the company temporarily changed its legal form into that of a stock corporation (Aktiengesellschaft); in 1937, it reorganized as a limited liability company, Robert Bosch GmbH. Since 1964, the charitable foundation, Robert Bosch Stiftung GmbH, has been the majority shareholder, currently with 92 percent of the shares. An industrial trust, Robert Bosch Industrietreuhand KG, carries out the entrepreneurial ownership functions and exercises corresponding voting rights. Most of the remaining shares and voting rights are held by the founder’s descendants. This ownership structure guarantees the Bosch Group’s business independence, making it possible for the company to plan over the long term and to undertake significant up-front investments in its future.
Businesses
Since the start of 2013, the Bosch Group has been divided into four business sectors that correspond to the reporting segments: Automotive Technology, Industrial Technol-ogy, Consumer Goods, and Energy and Building Technology. The former business sector Consumer Goods and Building Technology was split into two new business sectors, Consumer Goods on the one hand and Energy and Building Technology on the other. We expect the new Energy and Building Technology business sector to add further growth by intelligently linking products and services from the increasingly integrated fields of energy and building technology.
Moreover, the Solar Energy division was initially reclassified from Industrial Technology to the Energy and Building Technology business sector. However, we plan to eliminate the Solar Energy division. The crystalline photovoltaics business is reported separately under discontinued operations in the consolidated financial statements. An agreement was signed at the end of November 2013 to sell the cell and module production of Bosch Solar Energy AG at the site in Arnstadt, Germany. The subsidiary aleo solar AG in Oldenburg and Prenzlau, Germany, in which Bosch has a 90.7 percent stake, announced the sale of its module production to an investor group in February 2014. In Bosch’s view, there is no realistic chance that the remainder of the aleo solar AG business can survive on its own. As a result, we have proposed that the upcoming extraordinary general shareholders meeting adopt a resolution liquidating the company. In addition, negotiations are currently underway to sell the site in Vénissieux, France. The reason for exiting crystalline photovoltaics is that the massive and persistent drop in prices has led to heavy losses in this segment. Only Bosch Solar CISTech GmbH, in Brandenburg an der Havel, Germany, will be retained as a development unit for thin-film technology.
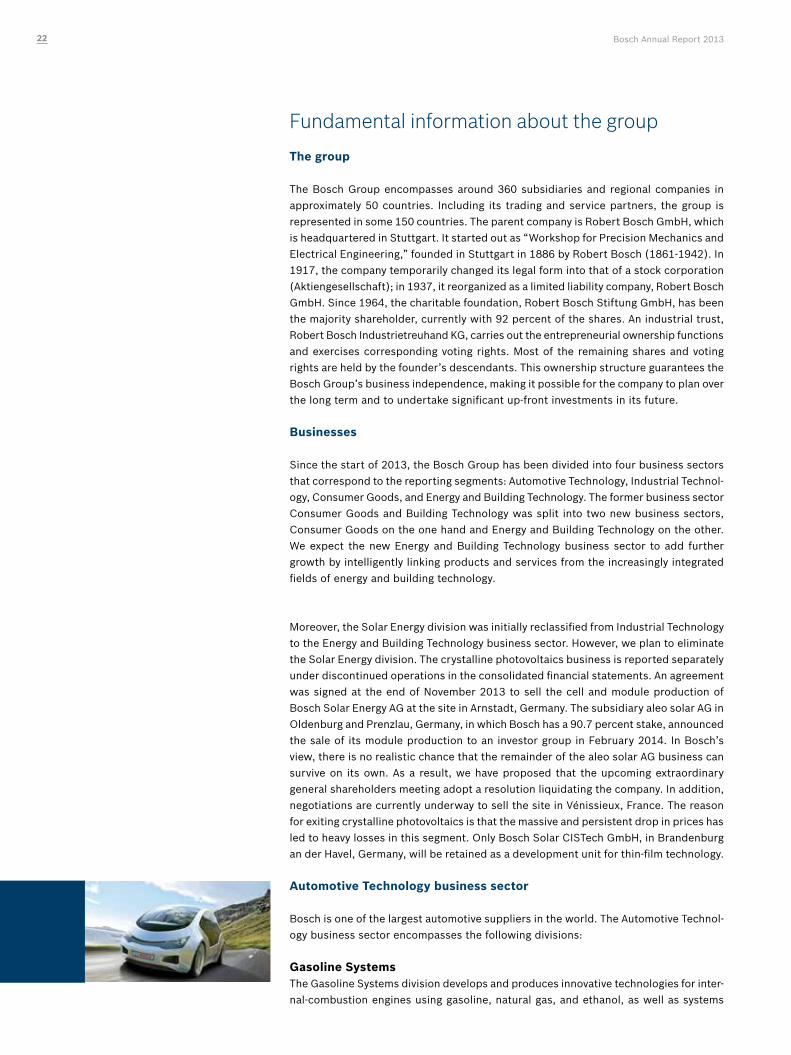
Automotive Technology business sector
Bosch is one of the largest automotive suppliers in the world. The Automotive Technol-ogy business sector encompasses the following divisions:
Gasoline SystemsThe Gasoline Systems division develops and produces innovative technologies for inter-nal-combustion engines using gasoline, natural gas, and ethanol, as well as systems
Bosch Annual Report 201322
and components for hybrid and electric vehicles. These include engine management systems, fuel supply systems, fuel injection systems, ignition systems, sensors, con-nectors, electric drive units, power electronics, battery systems, and transmission technology. The trend here is from component supplier to systems provider – from controlling internal-combustion engines and electric drive units, to combining both drive units in the hybrid and plug-in hybrid, through to the interplay of the electric motor with the braking system and energy recovery. United Automotive Electronic Systems Co. Ltd., in Shanghai, China, which has been fully consolidated since 2013, operates in the Chinese market.
This division also includes the fifty-fifty joint venture Bosch Mahle Turbo Systems GmbH & Co. KG, Stuttgart. It develops and manufactures exhaust gas turbochargers for both gasoline and diesel engines for use in passenger cars, commercial vehicles, and large-scale industrial power units.
Diesel Systems The Diesel Systems division offers an extensive range of energy-efficient, eco-friendly diesel injection systems for passenger cars and commercial vehicles, regardless of engine size, as well as for other applications. Bosch’s diesel segment is a systems sup-plier of important powertrain components. It focuses on injection systems, primarily the common-rail system. This comprises high-pressure pumps injecting at pressures of up to 2,500 bar, the rail, and various injectors (solenoid and piezo). The division also provides air management systems, such as mass air-flow sensors, EDC electronic diesel control, and exhaust-gas management systems such as Denoxtronic, as well as solutions for diesel hybrid vehicles.
Chassis Systems ControlThe Chassis Systems Control division develops and manufactures innovative compo-nents, features, and systems aimed at improving driving safety and comfort. These include brake-actuation products such as the master cylinder, hydraulic units, and brake boost-ers, including braking assistance systems. The ABS, TCS, and ESP® electronic braking control systems constitute an important business activity. The division also supplies sensors such as speed, steering-angle, and yaw-rate sensors, and electronics to protect passengers and pedestrians, including airbag control units and crash sensors. Another area is driver-assistance systems based on ultrasound, radar, and video sensors. This includes products such as radar-based speed control (ACC adaptive cruise control), predictive emergency braking systems, and lane-keeping systems.
Electrical DrivesThe broad array of products offered by the Electrical Drives division stretches from a wide variety of electromechanical components to entire systems for bodywork appli-cations, including innovative and energy-efficient actuators and systems and compo-nents for engine thermal management, air-conditioning, and windshield cleaning. The product range also includes actuators for electric windows, seat adjustment systems, and sunroofs, fan modules and engine-cooling drive systems, pumps and valves for cooling systems, air-conditioning components, front and rear wiper systems, as well as wiper arms and blades. Electrical Drives also makes motors for electrical steering systems, for ABS and ESP® pumps, as well as for e-bikes and e-scooters, i.e. electrically powered bicycles and scooters.
Starter Motors and Generators This division develops and manufactures starters and alternators for passenger cars and commercial vehicles. The extensive product catalog includes long-life starters for gasoline and diesel engines, especially for use in fuel-saving – and therefore CO2-
Group Management Report 23
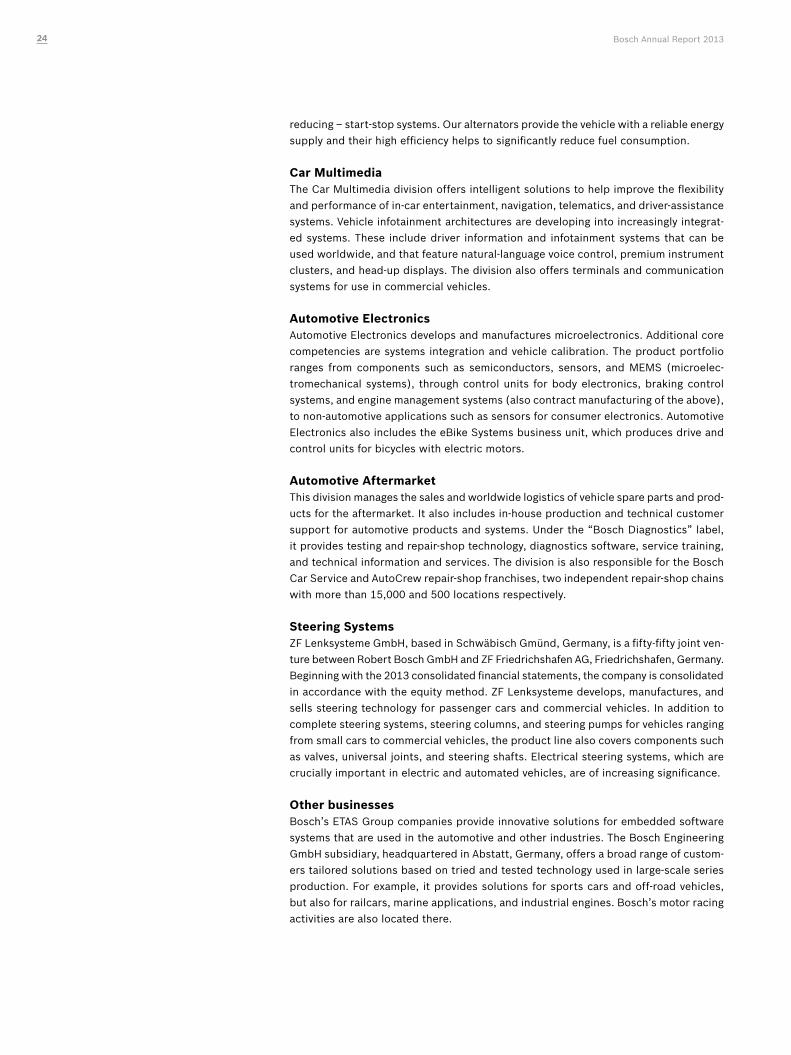
reducing – start-stop systems. Our alternators provide the vehicle with a reliable energy supply and their high efficiency helps to significantly reduce fuel consumption.
Car MultimediaThe Car Multimedia division offers intelligent solutions to help improve the flexibility and performance of in-car entertainment, navigation, telematics, and driver-assistance systems. Vehicle infotainment architectures are developing into increasingly integrat-ed systems. These include driver information and infotainment systems that can be used worldwide, and that feature natural-language voice control, premium instrument clusters, and head-up displays. The division also offers terminals and communication systems for use in commercial vehicles.
Automotive ElectronicsAutomotive Electronics develops and manufactures microelectronics. Additional core competencies are systems integration and vehicle calibration. The product portfolio ranges from components such as semiconductors, sensors, and MEMS (microelec-tromechanical systems), through control units for body electronics, braking control systems, and engine management systems (also contract manufacturing of the above), to non-automotive applications such as sensors for consumer electronics. Automotive Electronics also includes the eBike Systems business unit, which produces drive and control units for bicycles with electric motors.
Automotive AftermarketThis division manages the sales and worldwide logistics of vehicle spare parts and prod-ucts for the aftermarket. It also includes in-house production and technical customer support for automotive products and systems. Under the “Bosch Diagnostics” label, it provides testing and repair-shop technology, diagnostics software, service training, and technical information and services. The division is also responsible for the Bosch Car Service and AutoCrew repair-shop franchises, two independent repair-shop chains with more than 15,000 and 500 locations respectively.
Steering SystemsZF Lenksysteme GmbH, based in Schwäbisch Gmünd, Germany, is a fifty-fifty joint ven-ture between Robert Bosch GmbH and ZF Friedrichshafen AG, Friedrichshafen, Germany. Beginning with the 2013 consolidated financial statements, the company is consolidated in accordance with the equity method. ZF Lenksysteme develops, manufactures, and sells steering technology for passenger cars and commercial vehicles. In addition to complete steering systems, steering columns, and steering pumps for vehicles ranging from small cars to commercial vehicles, the product line also covers components such as valves, universal joints, and steering shafts. Electrical steering systems, which are crucially important in electric and automated vehicles, are of increasing significance.
Other businessesBosch’s ETAS Group companies provide innovative solutions for embedded software systems that are used in the automotive and other industries. The Bosch Engineering GmbH subsidiary, headquartered in Abstatt, Germany, offers a broad range of custom-ers tailored solutions based on tried and tested technology used in large-scale series production. For example, it provides solutions for sports cars and off-road vehicles, but also for railcars, marine applications, and industrial engines. Bosch’s motor racing activities are also located there.
Bosch Annual Report 201324
Industrial Technology business sector
Since fiscal year 2013, our Industrial Technology business sector has focused on two divisions.
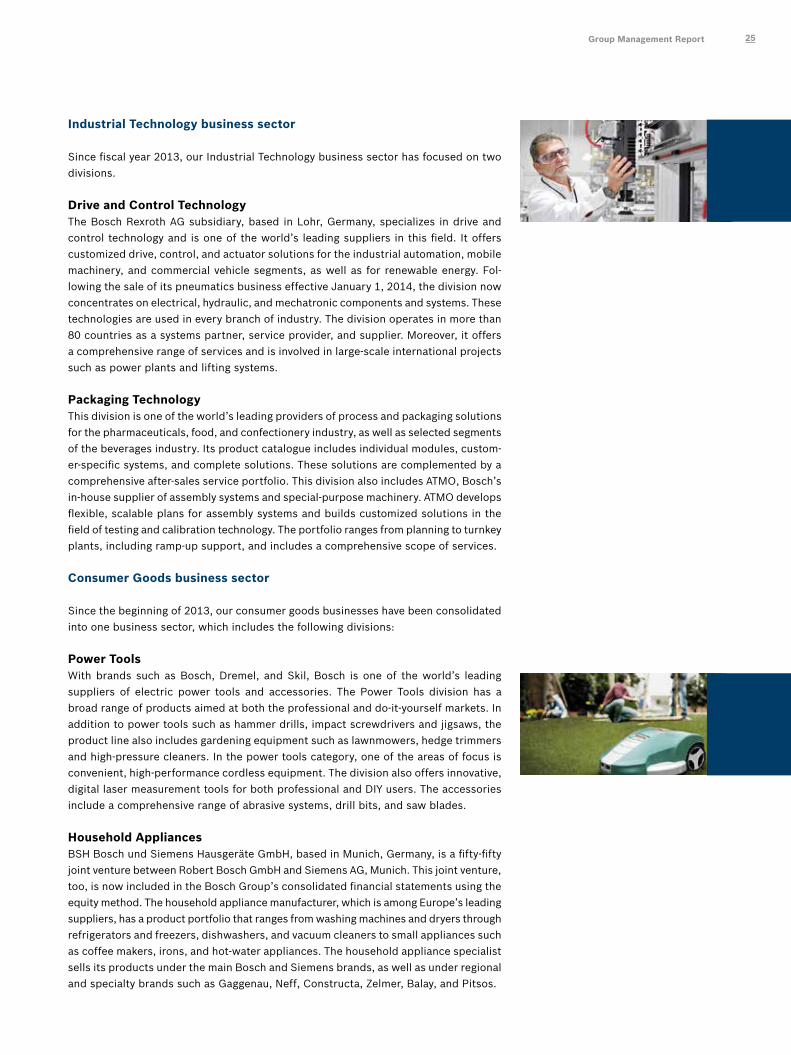
Drive and Control TechnologyThe Bosch Rexroth AG subsidiary, based in Lohr, Germany, specializes in drive and control technology and is one of the world’s leading suppliers in this field. It offers customized drive, control, and actuator solutions for the industrial automation, mobile machinery, and commercial vehicle segments, as well as for renewable energy. Fol-lowing the sale of its pneumatics business effective January 1, 2014, the division now concentrates on electrical, hydraulic, and mechatronic components and systems. These technologies are used in every branch of industry. The division operates in more than 80 countries as a systems partner, service provider, and supplier. Moreover, it offers a comprehensive range of services and is involved in large-scale international projects such as power plants and lifting systems.
Packaging Technology This division is one of the world’s leading providers of process and packaging solutions for the pharmaceuticals, food, and confectionery industry, as well as selected segments of the beverages industry. Its product catalogue includes individual modules, custom-er-specific systems, and complete solutions. These solutions are complemented by a comprehensive after-sales service portfolio. This division also includes ATMO, Bosch’s in-house supplier of assembly systems and special-purpose machinery. ATMO develops flexible, scalable plans for assembly systems and builds customized solutions in the field of testing and calibration technology. The portfolio ranges from planning to turnkey plants, including ramp-up support, and includes a comprehensive scope of services.
Consumer Goods business sector
Since the beginning of 2013, our consumer goods businesses have been consolidated into one business sector, which includes the following divisions: Power ToolsWith brands such as Bosch, Dremel, and Skil, Bosch is one of the world’s leading suppliers of electric power tools and accessories. The Power Tools division has a broad range of products aimed at both the professional and do-it-yourself markets. In addition to power tools such as hammer drills, impact screwdrivers and jigsaws, the product line also includes gardening equipment such as lawnmowers, hedge trimmers and high-pressure cleaners. In the power tools category, one of the areas of focus is convenient, high-performance cordless equipment. The division also offers innovative, digital laser measurement tools for both professional and DIY users. The accessories include a comprehensive range of abrasive systems, drill bits, and saw blades.
Household Appliances BSH Bosch und Siemens Hausgeräte GmbH, based in Munich, Germany, is a fifty-fifty joint venture between Robert Bosch GmbH and Siemens AG, Munich. This joint venture, too, is now included in the Bosch Group’s consolidated financial statements using the equity method. The household appliance manufacturer, which is among Europe’s leading suppliers, has a product portfolio that ranges from washing machines and dryers through refrigerators and freezers, dishwashers, and vacuum cleaners to small appliances such as coffee makers, irons, and hot-water appliances. The household appliance specialist sells its products under the main Bosch and Siemens brands, as well as under regional and specialty brands such as Gaggenau, Neff, Constructa, Zelmer, Balay, and Pitsos.
Group Management Report 25
Energy and Building Technology business sector
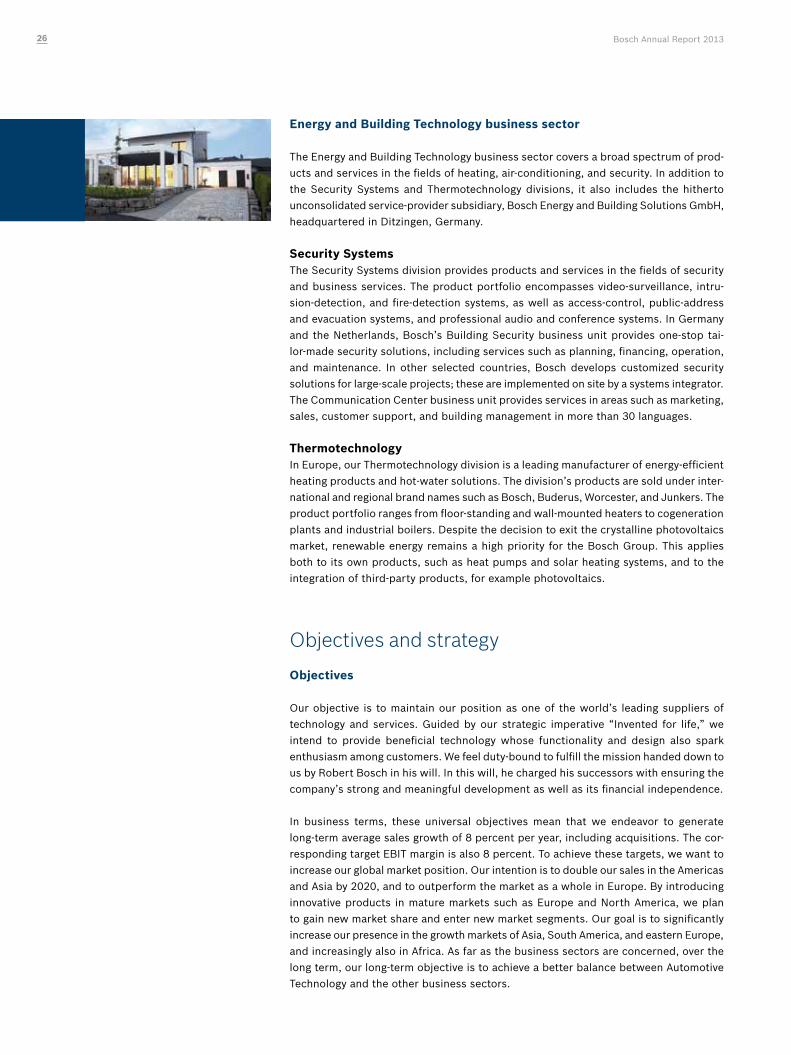
The Energy and Building Technology business sector covers a broad spectrum of prod-ucts and services in the fields of heating, air-conditioning, and security. In addition to the Security Systems and Thermotechnology divisions, it also includes the hitherto unconsolidated service-provider subsidiary, Bosch Energy and Building Solutions GmbH, headquartered in Ditzingen, Germany.
Security Systems The Security Systems division provides products and services in the fields of security and business services. The product portfolio encompasses video-surveillance, intru-sion-detection, and fire-detection systems, as well as access-control, public-address and evacuation systems, and professional audio and conference systems. In Germany and the Netherlands, Bosch’s Building Security business unit provides one-stop tai-lor-made security solutions, including services such as planning, financing, operation, and maintenance. In other selected countries, Bosch develops customized security solutions for large-scale projects; these are implemented on site by a systems integrator. The Communication Center business unit provides services in areas such as marketing, sales, customer support, and building management in more than 30 languages.
Thermotechnology In Europe, our Thermotechnology division is a leading manufacturer of energy-efficient heating products and hot-water solutions. The division’s products are sold under inter-national and regional brand names such as Bosch, Buderus, Worcester, and Junkers. The product portfolio ranges from floor-standing and wall-mounted heaters to cogeneration plants and industrial boilers. Despite the decision to exit the crystalline photovoltaics market, renewable energy remains a high priority for the Bosch Group. This applies both to its own products, such as heat pumps and solar heating systems, and to the integration of third-party products, for example photovoltaics.
Objectives and strategy
Objectives
Our objective is to maintain our position as one of the world’s leading suppliers of technology and services. Guided by our strategic imperative “Invented for life,” we intend to provide beneficial technology whose functionality and design also spark enthusiasm among customers. We feel duty-bound to fulfill the mission handed down to us by Robert Bosch in his will. In this will, he charged his successors with ensuring the company’s strong and meaningful development as well as its financial independence.
In business terms, these universal objectives mean that we endeavor to generate long-term average sales growth of 8 percent per year, including acquisitions. The cor-responding target EBIT margin is also 8 percent. To achieve these targets, we want to increase our global market position. Our intention is to double our sales in the Americas and Asia by 2020, and to outperform the market as a whole in Europe. By introducing innovative products in mature markets such as Europe and North America, we plan to gain new market share and enter new market segments. Our goal is to significantly increase our presence in the growth markets of Asia, South America, and eastern Europe, and increasingly also in Africa. As far as the business sectors are concerned, over the long term, our long-term objective is to achieve a better balance between Automotive Technology and the other business sectors.
Bosch Annual Report 201326
In pursuing these objectives, we will build on our core strengths: our high level of innovativeness, excellent quality, global presence, and distinctive corporate culture. We will also work systematically to improve operating excellence. This does not only apply to profitability. Given the rapidly changing business environment, it increasingly also applies to our company’s agility. In this respect, consistent customer focus is a crucial foundation for innovations and new business models. The “Bosch way,” which was given concrete shape in 2013, is designed to help us put these objectives into practice. It sets out a number of options for increasing growth and enhancing competitiveness. We want to work together with our associates to unlock the company’s great potential, while at the same time improving the way we integrate local expertise and creativity.
Strategy and innovation
Fundamental directionIn our growth strategy, we are guided by significant megatrends. For example, we are continuing to expand our business internationally, especially in Asia. The economic importance of this region will continue to grow, due to the high growth potential in China, India, and also southeast Asia. We intend to focus more strongly on Africa in the future. In all our business sectors, the growing need to conserve resources, protect the environment, and increase energy efficiency is highly important – both in terms of products and services as well as within our own company. Another important trend is increasing urbanization, which means more and more conurbations. This creates additional tasks in terms of mobility, security, and environmental protection. An aging population also creates new challenges for products and services. The increasing connectivity of things and services over the internet is leading to far-reaching changes, making innovative products, services, and business models possible. As a result, we are systematically pushing ahead to make all our business sectors’ products and solutions web-enabled. In the future as well, we will be guided by the aim to make every product we offer “Invented for life,” helping improve quality of life.
The main focus here is on creating a competitive advantage through innovative prod-ucts and customer focus. At the same time, megatrends involve a significant level of uncertainty, due to the unpredictability of the pace of change, but also to the increasing complexity brought about by technological change, as well as changes in the competitive landscape as a result of new competitors and business models. Against this backdrop, it is becoming more and more important to develop products that are tailored to cus-tomers’ needs. At the same time, alliances and agile units will play an increasing role in developing new business fields. On a more general level as well, agility and flexibility are becoming more important for the company as a whole.
Environmental protection and energy efficiency as drivers of growthToday, the Bosch Group already spends around half its research and development budget on environmental protection, including energy efficiency and resource conser-vation. This is because these areas offer great potential in all four business sectors. They are a decisive driver of growth for Automotive Technology, the biggest business sector, in part due to increasingly strict emissions standards worldwide. We believe there is still considerable potential in internal-combustion engines. By 2020, by further developing our injection systems, but also through a series of other measures, such as turbocharging downsized engines, we intend to reduce gasoline- and diesel-powered vehicles’ fuel consumption by a further 20 percent from their 2012 levels. At the same time, we provide solutions for the growing demand for natural gas-powered engines.
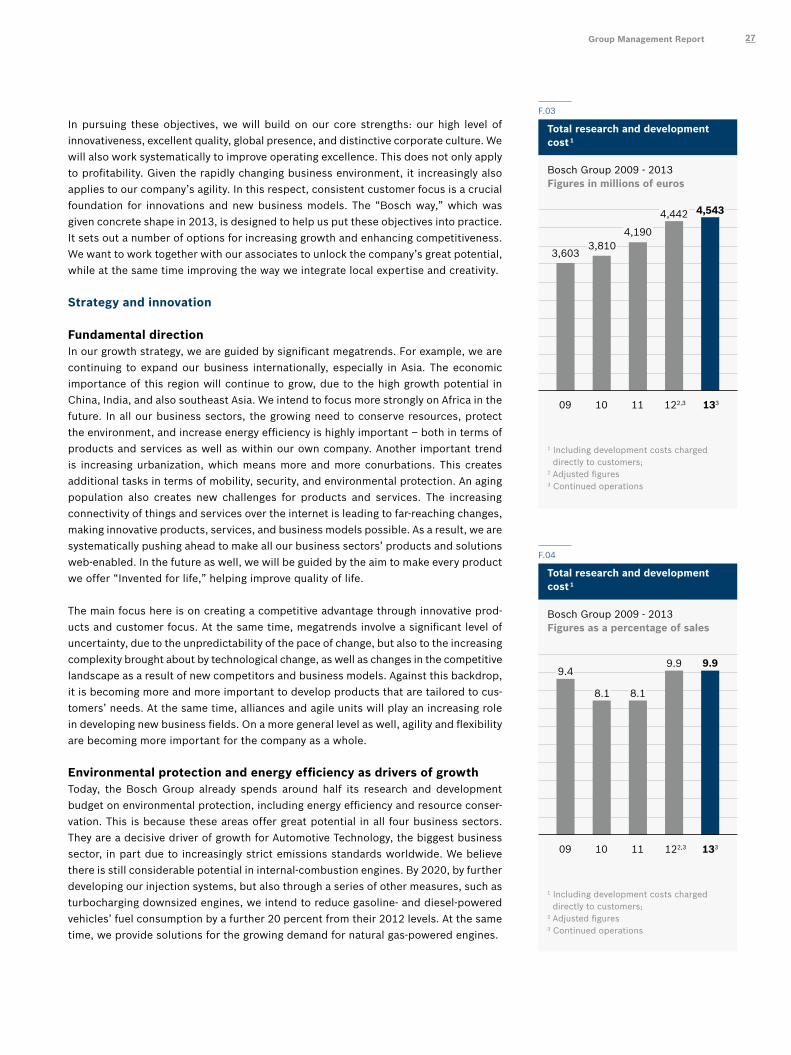
F.03
Total research and development cost 1
Bosch Group 2009 - 2013Figures in millions of euros
09 10 11 122,3 133
1 Including development costs charged directly to customers; 2 Adjusted figures3 Continued operations
3,6033,810
4,190
4,442 4,543
F.04
Total research and development cost 1
1 Including development costs charged directly to customers; 2 Adjusted figures3 Continued operations
Bosch Group 2009 - 2013Figures as a percentage of sales
09 10 11 122,3 133
9.9 9.99.4
8.18.1
Group Management Report 27
Beyond injection systems, we intend to offer a number of new products to reduce con-sumption and emissions by internal-combustion engines. This includes our BRS boost recuperation system, a 48-volt entry-level hybrid with a highly efficient generator that can support the internal-combustion engine with extra torque. This makes the new system an affordable option for electrifying mid-range vehicles. In addition, it offers a fuel-saving coasting function that shuts off the internal-combustion engine for up to 30 percent of the driving time, allowing the vehicle to coast silently, with zero emissions.
The eClutch electronic clutch makes this coasting function available for cars equipped with manual transmission as well. In this no-fuss solution, the eClutch disengages auto-matically as soon as coasting is possible. In addition, by using the navigation system as a sensor for conditions outside the vehicle, we are expanding the start-stop system to include a coasting assistant. The navigation system gives an advance preview of speed limits and the topography along the route, thereby making additional fuel savings possi-ble. At the end of 2013, a system that uses GPS data to adjust the battery charge state in hybrid vehicles won recognition from the EU as an “eco innovation.” This technology thus provides a credit that can be used to offset emissions by the respective automaker’s passenger-car fleet. Another innovation is the iBooster, an electronically controlled brake booster that no longer needs any vacuum from the internal-combustion engine. This is important not only when cars powered by internal-combustion engines are coasting, but also for the electric cars of the future. The iBooster also builds up brake pressure three times faster than traditional pumps, thereby shortening the braking distance by several crucial meters.
In mid-2014, moreover, the Euro 6 standard’s much stricter legal restrictions on nitrogen oxide emissions will come into effect in the European Union. This will mainly affect large sedans, 4-wheel-drive leisure vehicles (SUVs), and diesel-powered commercial vehicles. Once again, increasingly innovative technology is needed. We have solutions for every vehicle class and are working on smaller versions as well as affordable systems such as Denoxtronic, which reduces nitrogen oxide emissions by 95 percent. For compact vehicles, progress is being made through improved combustion.
Reducing emissions is also important in the other business sectors. In Industrial Tech-nology, the trend is toward greater automation, an overall increase in the utilization rate of machinery and facilities, and an increase in energy efficiency. One result is the partial electrification of automatic functions. With its 4EE (“For Energy Efficiency”) program, the Drive and Control Technology division provides advice on energy efficiency to its customers under its Bosch Rexroth brand. Here, energy use is optimized not only for individual stages of production, but also for entire manufacturing systems.
The same applies to the company’s own production. In 2013, Bosch Rexroth opened a groundbreaking paint shop in Mellansel, Sweden, that reduces energy consumption by around 75 percent. At the same time, it sets new standards for connectivity: every component has an RFID (radio-frequency identification) chip that has been encoded by the order fulfillment system. This provides precise instructions at each separate stage for customized paintwork. The heavy-duty engines manufactured by Bosch Rexroth in Mellansel are used on ships and for offshore applications, in the extraction of raw materials, for handling heavy cargo, and in recycling plants.
Bosch Annual Report 201328
In the pharmaceuticals industry, legal requirements for manufacturers are being tight-ened worldwide, particularly with regard to hygiene and increasingly complex products. Stricter standards, in turn, require more and more high-tech processes. In the food industry, too, both consumers and lawmakers around the world are making increasing demands on the safety of product packaging. This trend is opening up additional growth opportunities worldwide. We are meeting these trends with easy-to-deploy equipment and high-quality packaging. At the same time, we coordinate the components in such a way that customers can create their own customized solutions. Through acquisitions in this area, we have systematically expanded our portfolio of process and inspection technology in recent years. We are also gradually expanding our service portfolio, for example by offering condition monitoring and maintenance capabilities with our MAVUS system. Thanks to a special headset, technicians can establish online contact with an expert at a central location. This makes it easier for them to carry out maintenance and repair work.
A third major area where we want to help reduce emissions is energy and building technology. In the Thermotechnology division, we are focusing on further developing today’s heating technology, especially by combining conventional and renewable energy sources, and on fundamental innovations. For example, we have introduced a power-generating heating system. Based on a ceramic solid-oxide fuel cell, it enables the decentralized production of electric power and heat for single-family homes and duplexes. The system can lower electricity costs by up to 40 percent while reducing CO2 emissions by up to 50 percent compared to conventional power and heat generation. As a participant in the ene.field project, Bosch Thermotechnology will install around 70 of these power-generating heating devices in Germany, the United Kingdom, the Netherlands, and France beginning in 2014. This will help prepare for the market launch.
Moreover, energy efficiency and environmental protection continue to be very import-ant for consumer goods such as power tools and household appliances. In the Power Tools division, we develop cordless equipment for professional and DIY users, and in particular for gardening equipment as well. 18-volt lithium-ion batteries are a new development here. While battery weight and volume are the same, capacity is higher. They also feature the “Smart Li-ion+” electronic control system, which guarantees that the lithium-ion battery always provides exactly the amount of power needed by the respective application. A current example of Bosch’s innovative lithium-ion gardening tools is the Indego robotic lawnmower. As occupational health and safety consider-ations are increasingly important for power tools, we are now, for example, launching an improved dust-collection system for drilling and chiseling tools.
In Household Appliances, we are also developing efficient solutions that conserve resources. For example, BSH Bosch und Siemens Hausgeräte GmbH has further expand-ed its range of appliances with the best energy-efficiency rating, A+++. More attention is also being paid to noise emissions – in part because of new architectural designs in which the living areas and the kitchen increasingly tend to merge into a single space. The issue of noise emissions is relevant not only for large appliances such as washing machines and dishwashers, but also for vacuum cleaners. At the same time, customers are also demanding more attractive styling. One of the ways Bosch has responded is through its Color Glass Edition for fridge-freezers.
Group Management Report 29
Mobility is becoming electric, automated, and connectedWe only expect a major breakthrough in electric driving in the next decade. According to our projections, electric cars, including plug-in hybrids, will not exceed 10 percent of the market until after 2020. Nonetheless, we are already working today in this field, which we consider important for our future. For large passenger cars in particular, future emissions limits will only be attainable with greater electrification. Bosch invests around 400 million euros annually in the electromobility of the future. Over the course of 2014, we will be working on 30 projects relating to electromobility – from an all-electric system for sub-compact cars to an electrified sports car. With these projects, we have approximately 1,800 associates working on all three areas of the electrical powertrain: battery technology, an electric traction machine, and power electronics.
In terms of cost and range, broad market penetration of electric cars will depend mainly on progress in battery technology. Following the disbandment of the SB LiMotive joint venture in 2012, we have reorganized our battery technology work, shifting it from the Gasoline Systems division to our subsidiary Robert Bosch Battery Systems GmbH, Stuttgart. In 2013, we also announced a partnership with the Japanese companies GS Yuasa and Mitsubishi Corporation to develop the next generation of highly efficient lithium-ion batteries. After receiving approval from the antitrust authorities, the new Stuttgart-based company Lithium Energy and Power GmbH & Co. KG started operating in early 2014.
But these are not the only areas in which we are working on the pioneering field of electromobility. Our e-bikes product portfolio, which ranges from highly efficient drive units (engines and transmissions) through high-quality batteries to easy-to-use, smart on-board and bike computers, quickly made us the leading provider in Europe. In 2013, we also launched a newly developed drive system for electric scooters and mopeds, which we offer mainly in China. The electronic control unit improves energy recovery from braking and has additional security features such as a seat occupancy detection function that switches the engine to lower power when the e-scooter is being pushed manually.
In addition, we are also involved in alliances to develop the necessary infrastructure for electric cars. For example, on behalf of the Berlin-based Hubject GmbH – a consortium of automotive and energy companies – our internet specialist Bosch Software Innova-tions GmbH, based in Immenstaad, Germany, has developed “e-roaming” software to help locate charge spots run by various providers.
The goal of improving traffic safety is also growing in importance worldwide. As a result, more and more initiatives are aimed at protecting road users. More than 90 percent of road accidents are caused by human error. One factor driving innovation is the vision of accident-free driving, toward which driverless cars (“automated driving”) can make an important contribution. It is our belief that automated driving will develop gradually, becoming more widespread only in the next decade. Before that can happen, major progress needs to be made in several R&D fields. These include highly efficient methods for ensuring reliability, sensors capable of more precise 3D environment recognition, and securing the electronics architecture, e.g., through constant plausibility checks on the data supplied by the sensors. In addition, there are legal issues in many countries that have not yet been resolved. We are already driving several pilot vehicles on public roads in the U.S. and Germany.
Bosch Annual Report 201330
The driver-assistance market will grow considerably in the years to come. One reason for this is a new rating scheme for vehicle safety. Starting in 2014, the Euro NCAP test will only provide a vehicle with a five-star rating if it has at least one driver-assistance feature, which means at least one environment sensor. This will create additional growth, especially in the sensor segment. In 2014, we will be starting series production of a video camera that can see objects in stereo. This means that a single sensor is now sufficient for an automatic emergency braking system for pedestrian protection – when children suddenly run out on to the street, for example.
In 2014, we will also launch a traffic jam assistant that keeps the vehicle in its lane in congested traffic. Later, this will serve as a traffic jam pilot that will also be capable of automatically changing lanes. We are also planning to launch an enhanced parking assistant in 2015 that will include a remote control for maneuvering the car into tight spaces such as garages or parking spaces. In the future, a 360-degree video sensor system will enable a car to look for a space in parking garages on its own.
For automated driving, information about the car’s surroundings has to be up to date. In many cases, this will only be possible if vehicles continuously share information on their surroundings with one another. This might include information about icy roads or construction zones, for instance. At the same time, though, drivers must not be over-loaded with information. Given the increase in information and entertainment systems available for cars, ease of use is becoming more and more important. As an example, we developed a driver information system for General Motors that can be precisely controlled using natural-voice commands.
In addition, we are promoting the spread of head-up displays. Thanks to a new solution, projecting navigation arrows onto the windshield, and thus directly into the driver’s line of sight, will be affordable even in mid-range cars. The demand for easy-to-use infotain-ment systems, including systems that also link to smartphones, is also rising. Developing such innovative solutions is part of our strategy. We have launched a new system called MySpin that integrates smartphone apps from various producers and systems into the driver information system so that they look the same as on the smartphone.
Connectivity not only means accident-free driving and greater convenience; it also opens up opportunities for new services. Here, too, we intend to develop new markets for Bosch. For example, for fleet operators such as leasing companies and insurance companies, we offer new telematics services for remote vehicle diagnosis. In this way, faults can be analyzed and preventive maintenance carried out. Another feature we offer is an electronic logbook. Based on a new connectivity control unit, it enables the vehicle’s systems to connect with external IT systems.
Increasing connectivity over the internet as a driver of innovation The growing importance of connectivity can be seen not just in Automotive Technology, but also in our other business sectors. Each of our electronic products is gradually becoming internet-capable. When it comes to connectivity, we can draw on our broad technological expertise and presence in diverse fields of activity.
Moreover, we are continuing to expand our sensor activities. Even now, Bosch is one of the leading global suppliers of MEMS sensors for the automotive industry. MEMS are tiny components that combine sensors and micromechanical structures on a single chip. For example, our Bosch Sensortec GmbH subsidiary in Reutlingen offers MEMS
Group Management Report 31
sensors for consumer electronics applications such as smartphones. In the future, MEMS sensors will be an important building block for connectivity on the internet of things and services. Containing signal processing and battery in one unit, they will be so small, energy efficient, and inexpensive that they can be used in their billions. At the same time, mobile networks are practically ubiquitous.
At the end of 2013, we set up a subsidiary to develop and sell networked devices for end users, as well as solutions based on those devices. The headquarters of this sub-sidiary, Bosch Connected Devices and Solutions GmbH, is located at the Electronics Competence Center in Reutlingen, Germany. An initial area of focus is on sensors for the “smart home,” for example for use in security systems for doors and windows. The company developed out of one of the “innovation clusters” through which we pool our skills and resources in order to develop new business ideas for the connected world. Other clusters have been set up for connected buildings, connected mobility, and connected energy. We have also expanded our internet expertise in recent years by acquiring specialist internet companies and integrating them into Bosch Software Innovations. This subsidiary currently has around 600 associates.
For smart homes, our Thermotechnology division will gradually offer both gas-fired and oil-fired boilers with an IP interface. In 2013, we also launched the internet-ca-pable Nefit Easy thermostat, initially in the Netherlands; its features include energy monitoring, the use of online weather data, and the ability to detect when nobody is at home. We have also developed apps that make it easy for users to control the heating via a smartphone or a tablet computer and enable installers to adjust settings and to troubleshoot. Predictive condition monitoring is playing an increasingly important role, especially for commercial boiler systems. Moreover, in the Energy and Building Tech-nology business sector, our Bosch Energy and Building Solutions subsidiary offers an internet-based energy platform for commercial buildings and industrial sites that uses information and communication technologies to create opportunities for additional increases in efficiency.
Connected industrial production will play an increasing role for Bosch – both as a user and as a supplier. One of the preconditions for industrial connectivity is open software systems, as these will allow equipment and systems made by different companies to connect to each other and their surroundings. In 2013, our Bosch Rexroth subsidiary received the Hermes Award, one of the most prestigious international technology prizes for the capital goods industry, for its Open Core Engineering software concept. With Open Core Engineering, engineers can for the first time create new software functions in many different programming languages, thereby accessing the control core directly.
At the same time, it is important to further expand customer contact over the internet. Here, too, we are pushing ahead with numerous initiatives. One current example in the Thermotechnology business is an online portal, www.effizienzhaus-online.de, for advice on refurbishing buildings to make them energy efficient. At its core is a multidisciplinary building configuration system with a manufacturer-independent computation module from the Fraunhofer Institute. This allows end customers to pre-plan their renovation project, from the heating system to the roof. Experts such as heating contractors, energy consultants, and architects can then use this planning information to prepare quotes. Meanwhile, the Bosch Toolbox App for power tools is now one of the world’s most suc-cessful apps for DIY users. One of its new features is “Building Documentation,” which
Bosch Annual Report 201332
enables do-it-yourselfers to document their current project quickly and completely using their smartphone or tablet computer. BSH Bosch und Siemens Hausgeräte offers the “myBosch” service app. It provides tips on appliance use, user manuals and technical data, helpful videos, and information on accessories for household appliances. Alliances are increasingly importantAlliances and fields tests are increasingly important for developing these complex future markets. In 2013, along with our partner companies ABB, Cisco, and LG, we announced the creation of a consortium that will develop a software platform for smart homes. A memorandum of understanding has been signed. However, the project is still subject to approval by the antitrust authorities. As part of the agreement, the participating companies intend to develop an open architecture for data exchange. The goal of the software platform is to make it possible for devices and services from different manu- facturers to exchange information with each other.
We are working with the Principality of Monaco on a connected city project. Since November 2013, new Bosch technologies have been used there for digital connectivity. The initial focus is on mobility and will later switch to energy-saving solutions. These are the first steps to implementing the cooperation agreement signed by the Principality of Monaco and the Bosch Group in July 2012.
Since January 2012, Bosch has been working alongside other industrial companies and experts in information and communication technology and manufacturing research as part of the Industry 4.0 working group, which is looking at how the internet of things will affect manufacturing and logistics in the future. Moreover, since 2013, Bosch Rexroth and our Thermotechnology division have been working together as industrial and research partners on a project headed up by the University of Darmstadt. The participants in this project, called “Energy-efficient factory for interdisciplinary tech-nology and application research – the eta factory,” believe that energy savings of up to 40 percent are possible in future industrial production.
Alliances to develop new production technologies have also been successful. For exam-ple, we have helped develop ultrashort pulse lasers, which are revolutionizing precision machining. Together with the Ditzingen-based machine-tool manufacturer Trumpf and the University of Jena, Bosch received the German President’s Future Prize, one of the most important innovation awards in Germany.
In addition, we are increasingly staking our hopes on cross-divisional collaboration within the company. One of the products successfully developed in this way is eCall, the automatic emergency call system for vehicles. eCall was primarily the result of collabo-ration by the Security Systems, Chassis Systems Control, and Car Multimedia divisions, as well as Bosch Software Innovations. The emergency call system is activated by the same sensors that deploy airbags. The car’s infotainment system is used to contact the Bosch security operations center. We are also expanding our cross-selling activities, which we believe offer significant potential. For example, the various divisions of our Energy and Building Technology business sector are often involved in large-scale projects from a very early stage. This means they can set up contacts for other divisions. We are currently focusing our activities on seven areas: airports, automobile production, hotels, mining, railways (including railway stations), sports stadiums, and theaters.
Group Management Report 33
Further expanding the company’s international presenceExpanding our international presence is another important part of our strategy. To accomplish this, we are reinforcing our global presence, for example through new distribution companies in promising markets in Africa and through new production sites in major growth markets in Asia, eastern Europe, and South America. The first Automotive Technology manufacturing facility in Indonesia is slated to go into produc-tion in 2014. Southeast Asia is precisely one of the areas where we want to establish a stronger presence. We already have five manufacturing sites in southeast Asia, located in Thailand, Malaysia, and Vietnam. We are currently expanding significantly in Vietnam, as well as in Russia and Mexico.
It is becoming more and more important to offer products that are tailored to each customer’s needs, and to better exploit the innovation potential of our engineering centers around the world. With this in mind, we have pooled our methodological expertise in a corporate “User Experience” department. Its job is to help the divisions take a more customer-centric approach when developing their products and services. Such an approach is in evidence in our new Nefit Easy thermostat and the new Nyon user interface for e-bikes. These requirements apply equally to mature markets –such as Europe, North America, and Japan – and to the emerging markets. One example of a product for mature markets is MSC motorcycle stability control, the technical foun-dation for which was laid by Bosch engineers at the engineering center for two-wheeler safety in Japan. MSC, an ESP® for motorcycles, reduces the risk of accidents in bends.
In emerging markets such as India and China, prices in the fast-growing mid-price segments continue to be 30 to 60 percent lower than in developed countries. In order to develop this market potential, we are focusing increasingly not just on local manu-facturing, but also on local development. We have, for instance, developed a navigation system for the Chinese automotive market. We have also come up with an affordable antilock braking system for two-wheelers, which controls the front wheel only. Offering consumer goods such as power tools and household appliances with mid-range prices is also an integral part of the growth strategy for these markets. Moreover, in 2013 the Thermotechnology division launched a new gas-fired instantaneous water heater, developed and manufactured in China.
Further, we want to involve our local customers more. Working closely with a leading Indian tractor manufacturer, our Drive and Control Technology division developed an electrohydraulic hitch control for tractors. It meets the local market’s requirements for efficiency, functionality, and robustness. We are also expanding our engineering capacity in Mexico. We plan to set up a development and software center for the Americas in Guadalajara, comparable to similar centers we have already set up in India and Vietnam. Our site in Campinas, Brazil, demonstrates how successful such local development activities are: ten years ago, it developed flex fuel technology, which makes it possible for vehicles to run on different blends of gasoline and ethanol.
Quality as the basis for sustained successHigh quality standards are fundamental to our corporate strategy. They start with a deep understanding of products and processes. Such an understanding leads to good solutions for our customers. In order to continue further developing our methods, we are currently expanding active field observation and analysis, in part by strengthening networks with our customers on such issues. We have set up a problem-solving program to expand our international team of internal consultants and experts. Especially in the Automotive Technology divisions, these people develop an in-depth understanding of technical interrelationships, and in this way find lasting solutions to problems. Our performance indicators and a series of awards also attest to the quality of our products.
Bosch Annual Report 201334
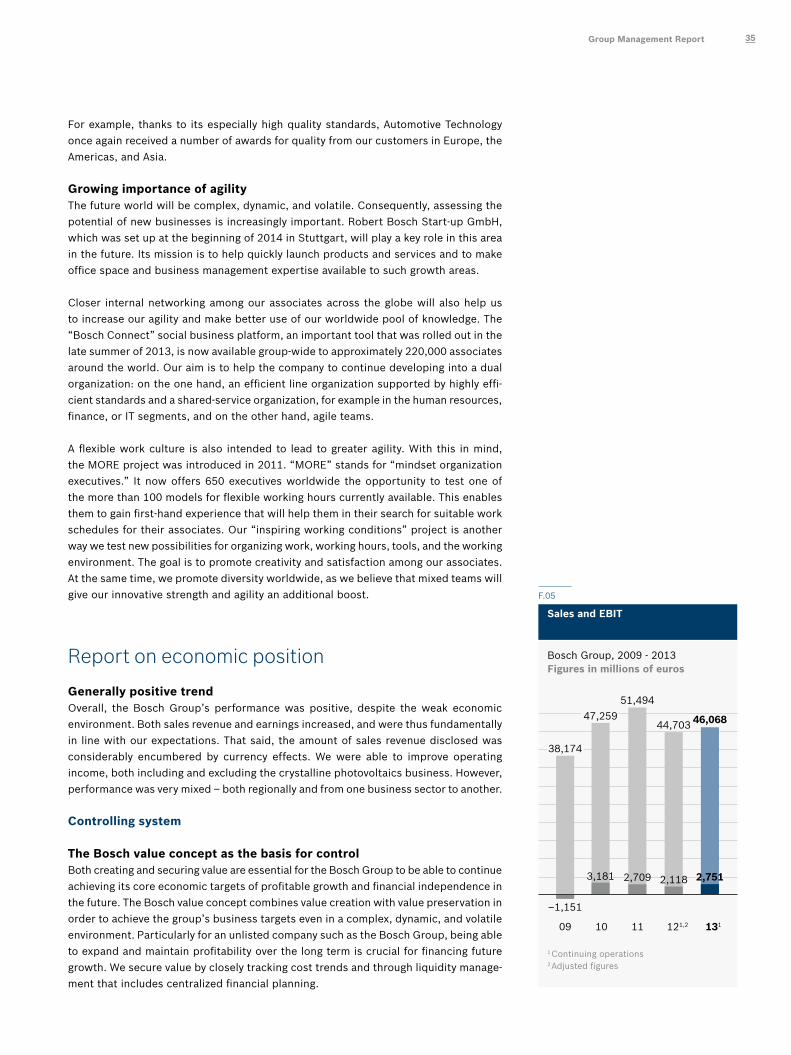
For example, thanks to its especially high quality standards, Automotive Technology once again received a number of awards for quality from our customers in Europe, the Americas, and Asia.
Growing importance of agilityThe future world will be complex, dynamic, and volatile. Consequently, assessing the potential of new businesses is increasingly important. Robert Bosch Start-up GmbH, which was set up at the beginning of 2014 in Stuttgart, will play a key role in this area in the future. Its mission is to help quickly launch products and services and to make office space and business management expertise available to such growth areas.
Closer internal networking among our associates across the globe will also help us to increase our agility and make better use of our worldwide pool of knowledge. The “Bosch Connect” social business platform, an important tool that was rolled out in the late summer of 2013, is now available group-wide to approximately 220,000 associates around the world. Our aim is to help the company to continue developing into a dual organization: on the one hand, an efficient line organization supported by highly effi-cient standards and a shared-service organization, for example in the human resources, finance, or IT segments, and on the other hand, agile teams.
A flexible work culture is also intended to lead to greater agility. With this in mind, the MORE project was introduced in 2011. “MORE” stands for “mindset organization executives.” It now offers 650 executives worldwide the opportunity to test one of the more than 100 models for flexible working hours currently available. This enables them to gain first-hand experience that will help them in their search for suitable work schedules for their associates. Our “inspiring working conditions” project is another way we test new possibilities for organizing work, working hours, tools, and the working environment. The goal is to promote creativity and satisfaction among our associates. At the same time, we promote diversity worldwide, as we believe that mixed teams will give our innovative strength and agility an additional boost.
Report on economic position
Generally positive trendOverall, the Bosch Group’s performance was positive, despite the weak economic environment. Both sales revenue and earnings increased, and were thus fundamentally in line with our expectations. That said, the amount of sales revenue disclosed was considerably encumbered by currency effects. We were able to improve operating income, both including and excluding the crystalline photovoltaics business. However, performance was very mixed – both regionally and from one business sector to another.
Controlling system
The Bosch value concept as the basis for controlBoth creating and securing value are essential for the Bosch Group to be able to continue achieving its core economic targets of profitable growth and financial independence in the future. The Bosch value concept combines value creation with value preservation in order to achieve the group’s business targets even in a complex, dynamic, and volatile environment. Particularly for an unlisted company such as the Bosch Group, being able to expand and maintain profitability over the long term is crucial for financing future growth. We secure value by closely tracking cost trends and through liquidity manage-ment that includes centralized financial planning.
F.05
Sales and EBIT
Bosch Group, 2009 - 2013 Figures in millions of euros
1 Continuing operations2 Adjusted figures
44,703
51,494
09 10 11 121,2 131
47,259
38,174
46,068
3,181
–1,151
2,709 2,118 2,751
Group Management Report 35
The main control parameters are sales growth, earnings before interest and taxes (EBIT), and the internal “operating value contribution” indicator. The operating value contribution is calculated in the same way as EBIT, but also deducts the cost of capital. Internal reporting is in principle also based on International Financial Reporting Stan-dards (IFRS). However, in certain respects, such as recognition of impairment losses, pension provisions, and provisions for losses arising from delivery commitments, internal reporting deviates from external accounting. The earnings fluctuations associated with these factors are adjusted for operational control and the executive incentive program. Beginning in fiscal year 2013, our value-based management switched from the after-tax figure used previously to the (pre-tax) operating value contribution, since tax issues cannot be influenced by the operating units. In addition, the calculation of the value contribution has been simplified.
Value contribution targets are used to calculate the result-based portion of executives’ variable remuneration, from section-manager level to the board of management. They are also used for calculating associates’ performance-related bonuses. The value con-tribution is also the basis for portfolio management. The central internal reporting tool is a monthly business report, which contains an up-to-date overview of the operating units’ performance indicators. It provides both a variance analysis of target versus actual figures and a year-on-year comparison. The report is based on the business plan, which draws on comprehensive market forecasts and is embedded into longer-term strategic corporate planning.
Macroeconomic and sector-specific environment
Only moderate economic growth in 2013As measured by global gross domestic product, economic growth was 2.5 percent in 2013, owing above all to the subdued first half of the year, and thus lagged behind our expectations of 2.7 percent. This was the weakest growth rate since 2009. The rea-sons for this initially sluggish performance included the effects of the sovereign debt crisis in Europe and the strained public finances in the United States. Above all, there were growing structural problems in a number of emerging markets. These also led to currency devaluations, which in some cases were massive. As the year progressed, the stabilization of the financial markets in North America, Europe, and Japan had a positive effect on economic performance.
Despite the difficult situation in Europe, overall economic output in the developed countries increased by 1.3 percent, in line with our expectations. In the European Union, 2013 economic performance was flat, contrary to our expectations of a slight increase. The weaker performance was attributable to the continuing recession in southern Europe. In the U.S., growth for 2013 stood at 1.9 percent – in line with our expectations. By contrast, the decline was sharper than expected in Japan.
At 4.6 percent, growth in the emerging markets fell short of our 5.2 percent forecast. Although they continue to be the biggest drivers of growth worldwide, the pace of growth has gradually slowed in recent years. The slowdown in 2013 mainly affected Asia and major economies in eastern Europe. On the other hand, South American countries saw higher economic growth.
Bosch Annual Report 201336
On average, commodity prices developed more weakly than we had originally expect-ed. Prices for oil and other fuels were robust, as expected. Conversely, industrial and precious metal prices were in some cases substantially lower than the previous year. In our view, this was because of slower growth in emerging markets and dynamic supply-side developments. The euro was considerably stronger than forecast. We had expected the euro to be weaker due to slower economic growth in the euro zone. Over the course of the year, however, it strengthened against a number of currencies that are important for us.
In our core markets, the total number of passenger cars and commercial vehicles pro-duced worldwide in 2013 – some 87.6 million units – was approximately 4 percent higher than the previous year, and therefore above our projected growth rate of 3 percent. The heavy-truck production included in this figure grew only slightly, by 2 percent to 3.1 million units. As expected, therefore, the prior-year slump in sales was only slightly made up for. However, there were substantial regional differences in the heavy-truck figures, with strong growth in China and South America, stagnation in North America and Europe, and significant declines in India and Russia.
Production figures for passenger cars and commercial vehicles in the European Union remained unchanged from the previous year – and were thus somewhat better than expected. This was partly because vehicle production increased slightly in Germany. Although vehicle production in North America was up 4 percent –and thus stronger than expected – it still lagged behind the double-digit growth posted the previous year. In South America, production figures improved markedly, following the prior-year slump. While vehicle production in China was significantly higher than expected, growing by 15 percent, production in India declined by 6 percent, contrary to our expectations. We had anticipated 7 percent growth for China and 10 percent growth for India.
The generally weak economic trend also affected global capital expenditure. This result-ed in another weak year for the mechanical engineering sector, where production rose only 1.2 percent, even less than the previous year. This trend not only affected developed countries, but also major emerging markets such as China. In our important European core market, production in the mechanical engineering sector actually shrank. Order intake only began to rise in the second half of the year; this will only have an effect on production in the mechanical engineering sector after a certain delay.
As expected, growth in global private consumption was somewhat slower in 2013 than in 2012; in the southern European countries that have been particularly hard hit by the debt crisis, consumption declined further, albeit not as sharply as in the previous year. At the same time, the situation showed a slight improvement as the year progressed. Global construction activity, as measured by construction expenditure, was somewhat weaker than we had expected, and also somewhat slower than in 2012. Especially in the euro zone, capital expenditure again dropped significantly, although the decline was not as steep as in 2012. In the Americas and Asia, as well, construction activity did not grow as strongly as in 2012.
Group Management Report 37
Course of business and sales trend
Substantial exchange-rate effects influence sales figuresDespite the weak economic environment, and relative to the 2012 basis for comparison, the Bosch Group’s sales rose 3.1 percent to 46.1 billion euros (excluding crystalline photovoltaics). After adjusting for exchange-rate effects, sales exceeded the comparable prior-year figure by 6.3 percent. Exchange-rate losses caused by the strong appreciation of the euro against a number of currencies totaled approximately 1.5 billion euros.
The target range of 2 to 4 percent we had forecast the previous year reflected the heavy burdens of exchange-rate effects to a limited extent only. Moreover, that forecast had used a 2012 basis of comparison of 45.6 billion euros. That figure still included crystalline photovoltaics as well as a 51 percent pro-rata share of the sales of United Automotive Electronic Systems. Using the basis of comparison applied in the original forecast, sales increased by 1.7 percent in nominal terms, and somewhat more than 4 percent after adjusting for exchange-rate effects..
The effects of eliminating use of the proportionate consolidation method total approx-imately 7 billion euros for 2012. Apart from the major joint venture companies BSH Bosch und Siemens Hausgeräte GmbH and ZF Lenksysteme GmbH, this also includes the 50 percent investments in Kefico Corp., in Gunpo, Korea, and Purolator Filters North America LLC, in Fayetteville, North Carolina (U.S.) which we sold to our former joint-venture partners in 2012 and 2013.
It should also be noted that the shareholding in the Chinese company United Automo-tive Electronic Systems, which was originally consolidated at 51 percent, is no longer included in the new comparable sales figures for 2012. However, it is consolidated in the 2013 figures at 100 percent, i.e. at 1.3 billion euros. The crystalline photovoltaics business, which is now disclosed separately, accounted for sales of around 480 million euros in 2012 and around 310 million euros in 2013.
Additional consolidation effects of around 610 million euros in 2013 resulted from the first-time full consolidation of the Service Solutions division acquired from SPX Corporation in Charlotte, North Carolina (U.S.) at the end of 2012. This acquisition strengthened our spare parts and diagnostics business in the Automotive Technology business sector. Compared to 2012, 2013 sales once again included delayed negative effects from the sale of the foundation brakes business. The Drive and Control Technol-ogy division’s pneumatics segment was sold at the beginning of the year but is still fully consolidated in the 2013 consolidated financial statements. No substantial acquisitions that could affect the reported sales figure were completed in 2013.
Strong regional differences in performance Although the tough economic situation persisted, we managed to increase sales in Europe slightly in nominal terms, by 2.2 percent to 25.5 billion euros, and by 2.9 percent after adjusting for currency effects. Our Asia Pacific operations posted the strongest growth, at 5.8 percent in nominal terms to 11.1 billion euros (13.8 percent after adjusting for currency effects). The severe exchange-rate effects were caused primarily by the depreciation of the Japanese yen and the Indian rupee. In China especially, business picked up considerably throughout the year, mainly in Automotive Technology, but also in Industrial Technology during the second half of the year. By contrast, because of the deterioration in economic conditions, our business in India was only sluggish. Our oper-ations in southeast Asia reported strong growth, especially in Automotive Technology. In Japan, by contrast, business in almost all areas lagged behind expectations – even after taking the strong currency effects into account.
Bosch Annual Report 201338
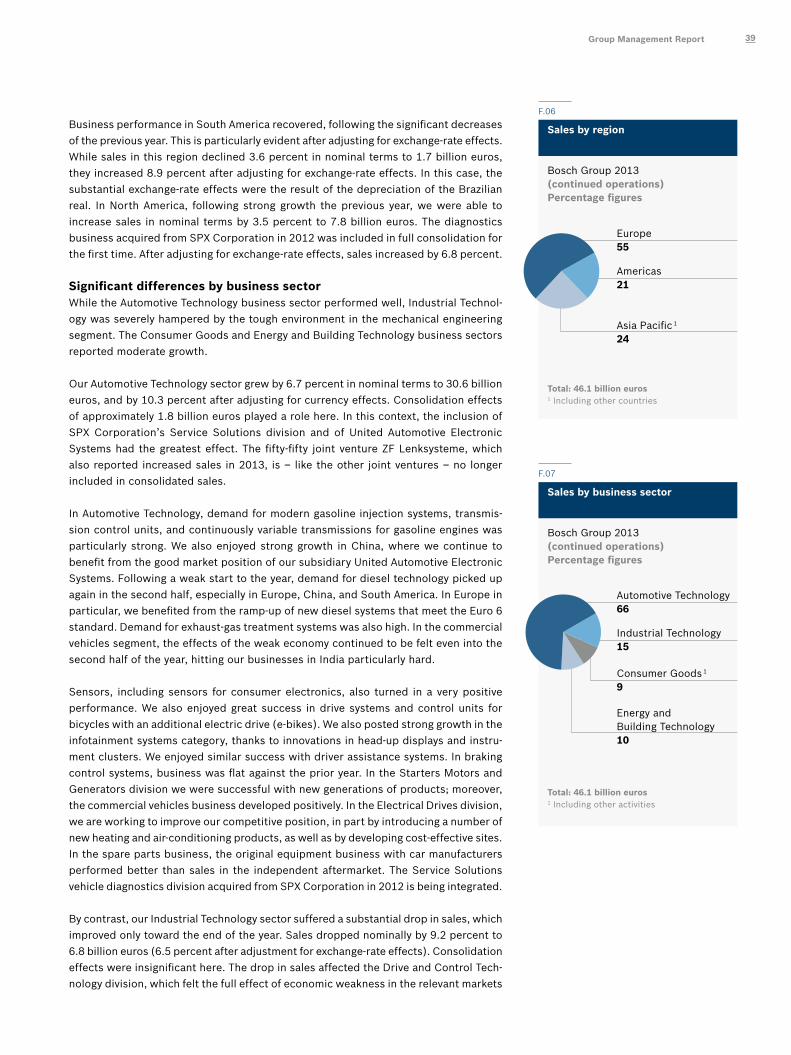
Business performance in South America recovered, following the significant decreases of the previous year. This is particularly evident after adjusting for exchange-rate effects. While sales in this region declined 3.6 percent in nominal terms to 1.7 billion euros, they increased 8.9 percent after adjusting for exchange-rate effects. In this case, the substantial exchange-rate effects were the result of the depreciation of the Brazilian real. In North America, following strong growth the previous year, we were able to increase sales in nominal terms by 3.5 percent to 7.8 billion euros. The diagnostics business acquired from SPX Corporation in 2012 was included in full consolidation for the first time. After adjusting for exchange-rate effects, sales increased by 6.8 percent.
Significant differences by business sectorWhile the Automotive Technology business sector performed well, Industrial Technol-ogy was severely hampered by the tough environment in the mechanical engineering segment. The Consumer Goods and Energy and Building Technology business sectors reported moderate growth.
Our Automotive Technology sector grew by 6.7 percent in nominal terms to 30.6 billion euros, and by 10.3 percent after adjusting for currency effects. Consolidation effects of approximately 1.8 billion euros played a role here. In this context, the inclusion of SPX Corporation’s Service Solutions division and of United Automotive Electronic Systems had the greatest effect. The fifty-fifty joint venture ZF Lenksysteme, which also reported increased sales in 2013, is – like the other joint ventures – no longer included in consolidated sales.
In Automotive Technology, demand for modern gasoline injection systems, transmis-sion control units, and continuously variable transmissions for gasoline engines was particularly strong. We also enjoyed strong growth in China, where we continue to benefit from the good market position of our subsidiary United Automotive Electronic Systems. Following a weak start to the year, demand for diesel technology picked up again in the second half, especially in Europe, China, and South America. In Europe in particular, we benefited from the ramp-up of new diesel systems that meet the Euro 6 standard. Demand for exhaust-gas treatment systems was also high. In the commercial vehicles segment, the effects of the weak economy continued to be felt even into the second half of the year, hitting our businesses in India particularly hard.
Sensors, including sensors for consumer electronics, also turned in a very positive performance. We also enjoyed great success in drive systems and control units for bicycles with an additional electric drive (e-bikes). We also posted strong growth in the infotainment systems category, thanks to innovations in head-up displays and instru-ment clusters. We enjoyed similar success with driver assistance systems. In braking control systems, business was flat against the prior year. In the Starters Motors and Generators division we were successful with new generations of products; moreover, the commercial vehicles business developed positively. In the Electrical Drives division, we are working to improve our competitive position, in part by introducing a number of new heating and air-conditioning products, as well as by developing cost-effective sites. In the spare parts business, the original equipment business with car manufacturers performed better than sales in the independent aftermarket. The Service Solutions vehicle diagnostics division acquired from SPX Corporation in 2012 is being integrated.
By contrast, our Industrial Technology sector suffered a substantial drop in sales, which improved only toward the end of the year. Sales dropped nominally by 9.2 percent to 6.8 billion euros (6.5 percent after adjustment for exchange-rate effects). Consolidation effects were insignificant here. The drop in sales affected the Drive and Control Tech-nology division, which felt the full effect of economic weakness in the relevant markets
Bosch Group 2013 (continued operations)Percentage figures
Automotive Technology66
Industrial Technology15
Consumer Goods 1
9
Total: 46.1 billion euros1 Including other activities
Sales by business sector
F.07
Energy and Building Technology10
Sales by region
F.06
Bosch Group 2013 (continued operations)Percentage figures
Europe55
Americas21
Total: 46.1 billion euros1 Including other countries
Asia Pacific 1
24
Group Management Report 39
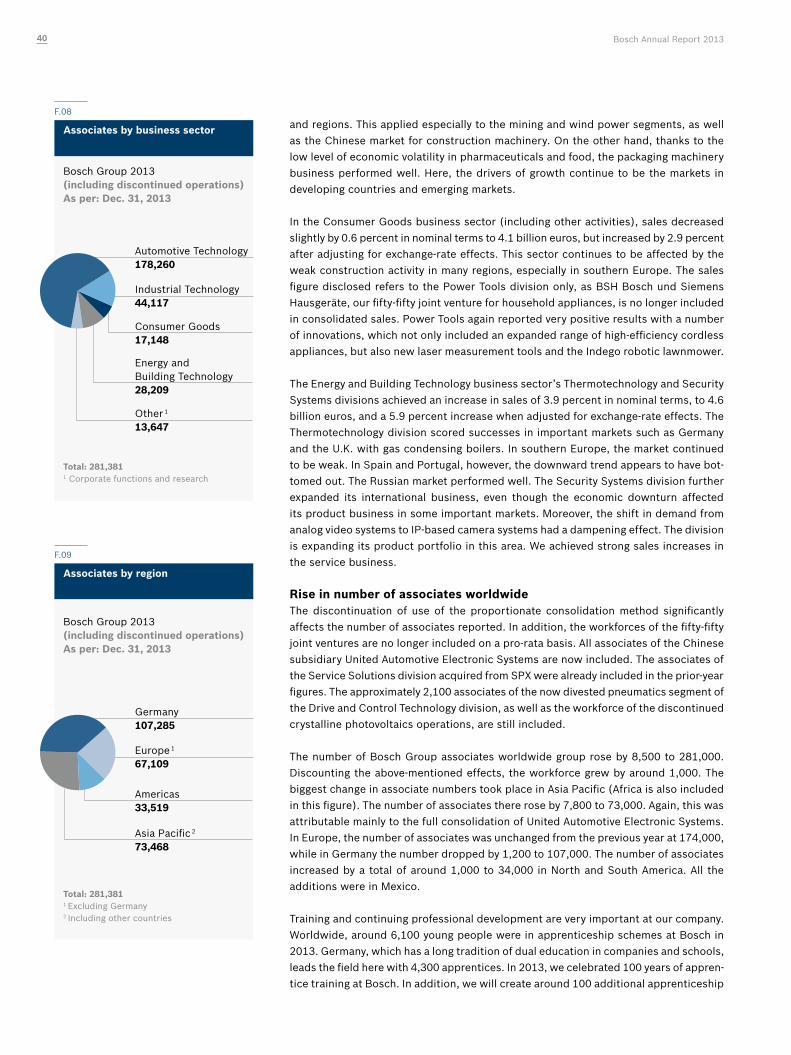
and regions. This applied especially to the mining and wind power segments, as well as the Chinese market for construction machinery. On the other hand, thanks to the low level of economic volatility in pharmaceuticals and food, the packaging machinery business performed well. Here, the drivers of growth continue to be the markets in developing countries and emerging markets.
In the Consumer Goods business sector (including other activities), sales decreased slightly by 0.6 percent in nominal terms to 4.1 billion euros, but increased by 2.9 percent after adjusting for exchange-rate effects. This sector continues to be affected by the weak construction activity in many regions, especially in southern Europe. The sales figure disclosed refers to the Power Tools division only, as BSH Bosch und Siemens Hausgeräte, our fifty-fifty joint venture for household appliances, is no longer included in consolidated sales. Power Tools again reported very positive results with a number of innovations, which not only included an expanded range of high-efficiency cordless appliances, but also new laser measurement tools and the Indego robotic lawnmower.
The Energy and Building Technology business sector’s Thermotechnology and Security Systems divisions achieved an increase in sales of 3.9 percent in nominal terms, to 4.6 billion euros, and a 5.9 percent increase when adjusted for exchange-rate effects. The Thermotechnology division scored successes in important markets such as Germany and the U.K. with gas condensing boilers. In southern Europe, the market continued to be weak. In Spain and Portugal, however, the downward trend appears to have bot-tomed out. The Russian market performed well. The Security Systems division further expanded its international business, even though the economic downturn affected its product business in some important markets. Moreover, the shift in demand from analog video systems to IP-based camera systems had a dampening effect. The division is expanding its product portfolio in this area. We achieved strong sales increases in the service business.
Rise in number of associates worldwideThe discontinuation of use of the proportionate consolidation method significantly affects the number of associates reported. In addition, the workforces of the fifty-fifty joint ventures are no longer included on a pro-rata basis. All associates of the Chinese subsidiary United Automotive Electronic Systems are now included. The associates of the Service Solutions division acquired from SPX were already included in the prior-year figures. The approximately 2,100 associates of the now divested pneumatics segment of the Drive and Control Technology division, as well as the workforce of the discontinued crystalline photovoltaics operations, are still included.
The number of Bosch Group associates worldwide group rose by 8,500 to 281,000. Discounting the above-mentioned effects, the workforce grew by around 1,000. The biggest change in associate numbers took place in Asia Pacific (Africa is also included in this figure). The number of associates there rose by 7,800 to 73,000. Again, this was attributable mainly to the full consolidation of United Automotive Electronic Systems. In Europe, the number of associates was unchanged from the previous year at 174,000, while in Germany the number dropped by 1,200 to 107,000. The number of associates increased by a total of around 1,000 to 34,000 in North and South America. All the additions were in Mexico.
Training and continuing professional development are very important at our company. Worldwide, around 6,100 young people were in apprenticeship schemes at Bosch in 2013. Germany, which has a long tradition of dual education in companies and schools, leads the field here with 4,300 apprentices. In 2013, we celebrated 100 years of appren-tice training at Bosch. In addition, we will create around 100 additional apprenticeship
Associates by business sector
F.08
Bosch Group 2013(including discontinued operations) As per: Dec. 31, 2013
Total: 281,381 1 Corporate functions and research
Automotive Technology178,260
Industrial Technology44,117
Consumer Goods17,148
Other 1
13,647
Energy and Building Technology28,209
Associates by region
F.09
Bosch Group 2013(including discontinued operations) As per: Dec. 31, 2013
Total: 281,3811 Excluding Germany2 Including other countries
Germany107,285
Europe 1
67,109
Americas33,519
Asia Pacific 2
73,468
Bosch Annual Report 201340
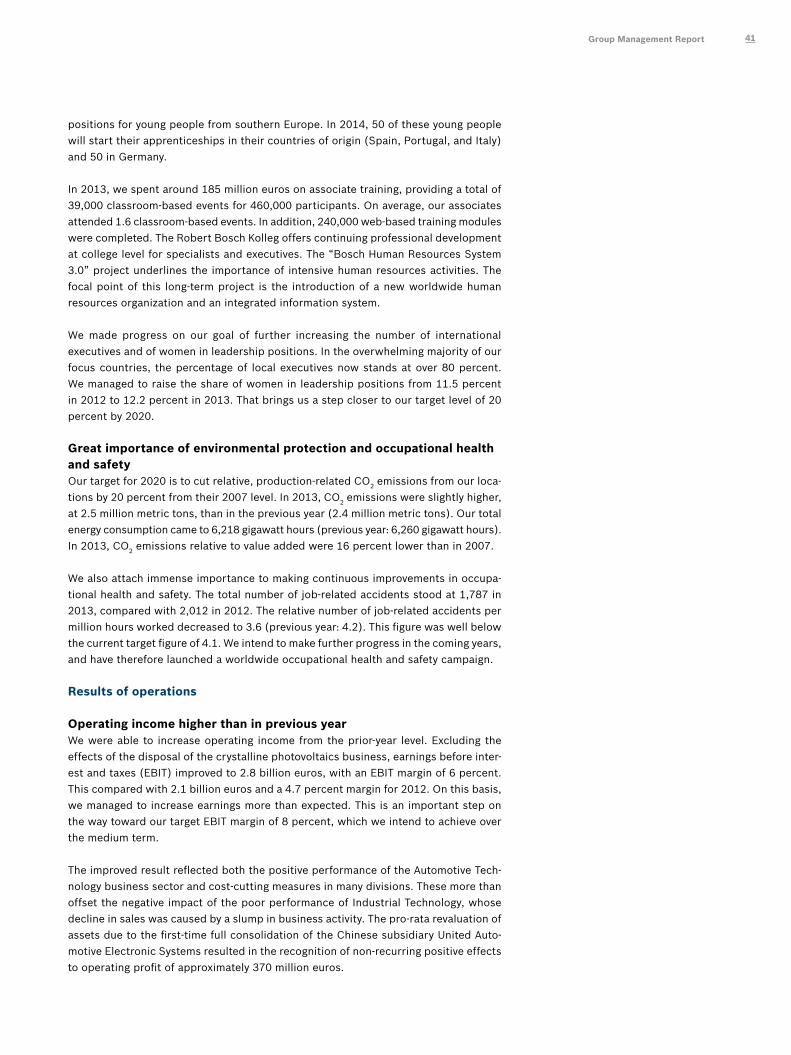
positions for young people from southern Europe. In 2014, 50 of these young people will start their apprenticeships in their countries of origin (Spain, Portugal, and Italy) and 50 in Germany.
In 2013, we spent around 185 million euros on associate training, providing a total of 39,000 classroom-based events for 460,000 participants. On average, our associates attended 1.6 classroom-based events. In addition, 240,000 web-based training modules were completed. The Robert Bosch Kolleg offers continuing professional development at college level for specialists and executives. The “Bosch Human Resources System 3.0” project underlines the importance of intensive human resources activities. The focal point of this long-term project is the introduction of a new worldwide human resources organization and an integrated information system.
We made progress on our goal of further increasing the number of international executives and of women in leadership positions. In the overwhelming majority of our focus countries, the percentage of local executives now stands at over 80 percent. We managed to raise the share of women in leadership positions from 11.5 percent in 2012 to 12.2 percent in 2013. That brings us a step closer to our target level of 20 percent by 2020.
Great importance of environmental protection and occupational health and safety Our target for 2020 is to cut relative, production-related CO2 emissions from our loca-tions by 20 percent from their 2007 level. In 2013, CO2 emissions were slightly higher, at 2.5 million metric tons, than in the previous year (2.4 million metric tons). Our total energy consumption came to 6,218 gigawatt hours (previous year: 6,260 gigawatt hours). In 2013, CO2 emissions relative to value added were 16 percent lower than in 2007.
We also attach immense importance to making continuous improvements in occupa-tional health and safety. The total number of job-related accidents stood at 1,787 in 2013, compared with 2,012 in 2012. The relative number of job-related accidents per million hours worked decreased to 3.6 (previous year: 4.2). This figure was well below the current target figure of 4.1. We intend to make further progress in the coming years, and have therefore launched a worldwide occupational health and safety campaign.
Results of operations
Operating income higher than in previous yearWe were able to increase operating income from the prior-year level. Excluding the effects of the disposal of the crystalline photovoltaics business, earnings before inter-est and taxes (EBIT) improved to 2.8 billion euros, with an EBIT margin of 6 percent. This compared with 2.1 billion euros and a 4.7 percent margin for 2012. On this basis, we managed to increase earnings more than expected. This is an important step on the way toward our target EBIT margin of 8 percent, which we intend to achieve over the medium term.
The improved result reflected both the positive performance of the Automotive Tech-nology business sector and cost-cutting measures in many divisions. These more than offset the negative impact of the poor performance of Industrial Technology, whose decline in sales was caused by a slump in business activity. The pro-rata revaluation of assets due to the first-time full consolidation of the Chinese subsidiary United Auto-motive Electronic Systems resulted in the recognition of non-recurring positive effects to operating profit of approximately 370 million euros.
Group Management Report 41
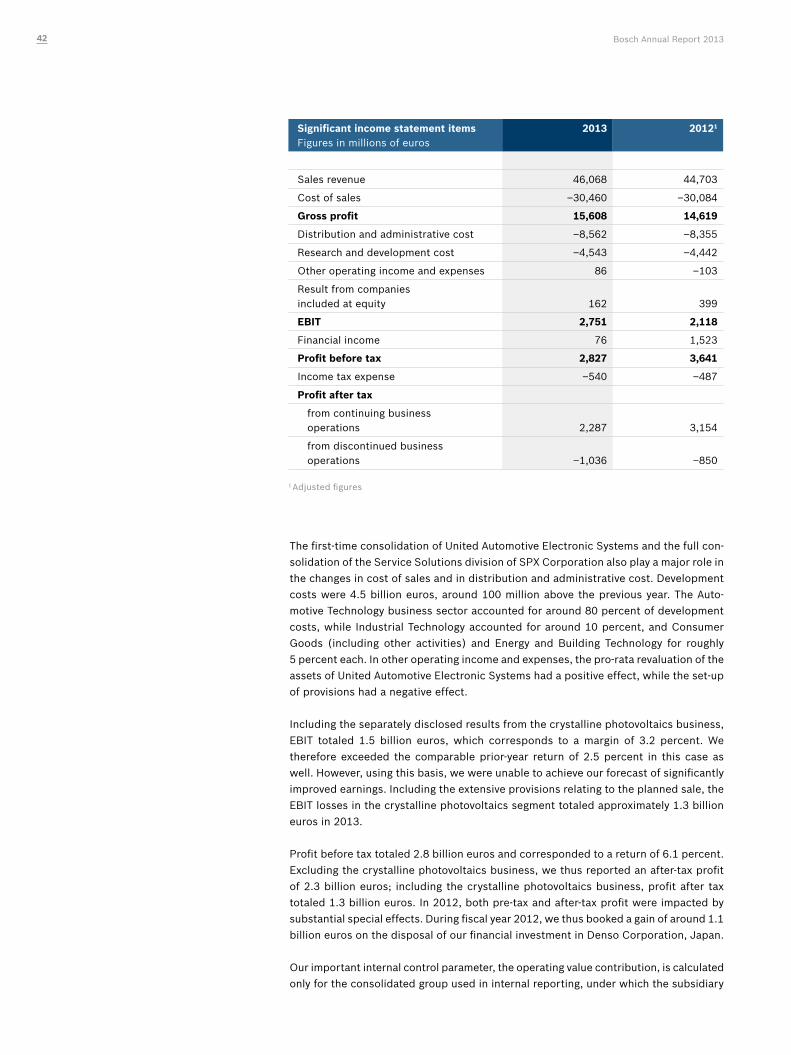
The first-time consolidation of United Automotive Electronic Systems and the full con-solidation of the Service Solutions division of SPX Corporation also play a major role in the changes in cost of sales and in distribution and administrative cost. Development costs were 4.5 billion euros, around 100 million above the previous year. The Auto-motive Technology business sector accounted for around 80 percent of development costs, while Industrial Technology accounted for around 10 percent, and Consumer Goods (including other activities) and Energy and Building Technology for roughly 5 percent each. In other operating income and expenses, the pro-rata revaluation of the assets of United Automotive Electronic Systems had a positive effect, while the set-up of provisions had a negative effect.
Including the separately disclosed results from the crystalline photovoltaics business, EBIT totaled 1.5 billion euros, which corresponds to a margin of 3.2 percent. We therefore exceeded the comparable prior-year return of 2.5 percent in this case as well. However, using this basis, we were unable to achieve our forecast of significantly improved earnings. Including the extensive provisions relating to the planned sale, the EBIT losses in the crystalline photovoltaics segment totaled approximately 1.3 billion euros in 2013.
Profit before tax totaled 2.8 billion euros and corresponded to a return of 6.1 percent. Excluding the crystalline photovoltaics business, we thus reported an after-tax profit of 2.3 billion euros; including the crystalline photovoltaics business, profit after tax totaled 1.3 billion euros. In 2012, both pre-tax and after-tax profit were impacted by substantial special effects. During fiscal year 2012, we thus booked a gain of around 1.1 billion euros on the disposal of our financial investment in Denso Corporation, Japan.
Our important internal control parameter, the operating value contribution, is calculated only for the consolidated group used in internal reporting, under which the subsidiary
Significant income statement items Figures in millions of euros
2013 20121
Sales revenue 46,068 44,703
Cost of sales –30,460 –30,084
Gross profit 15,608 14,619
Distribution and administrative cost –8,562 –8,355
Research and development cost –4,543 –4,442
Other operating income and expenses 86 –103
Result from companiesincluded at equity 162 399
EBIT 2,751 2,118
Financial income 76 1,523
Profit before tax 2,827 3,641
Income tax expense –540 –487
Profit after tax
from continuing businessoperations 2,287 3,154
from discontinued businessoperations –1,036 –850
1 Adjusted figures
Bosch Annual Report 201342
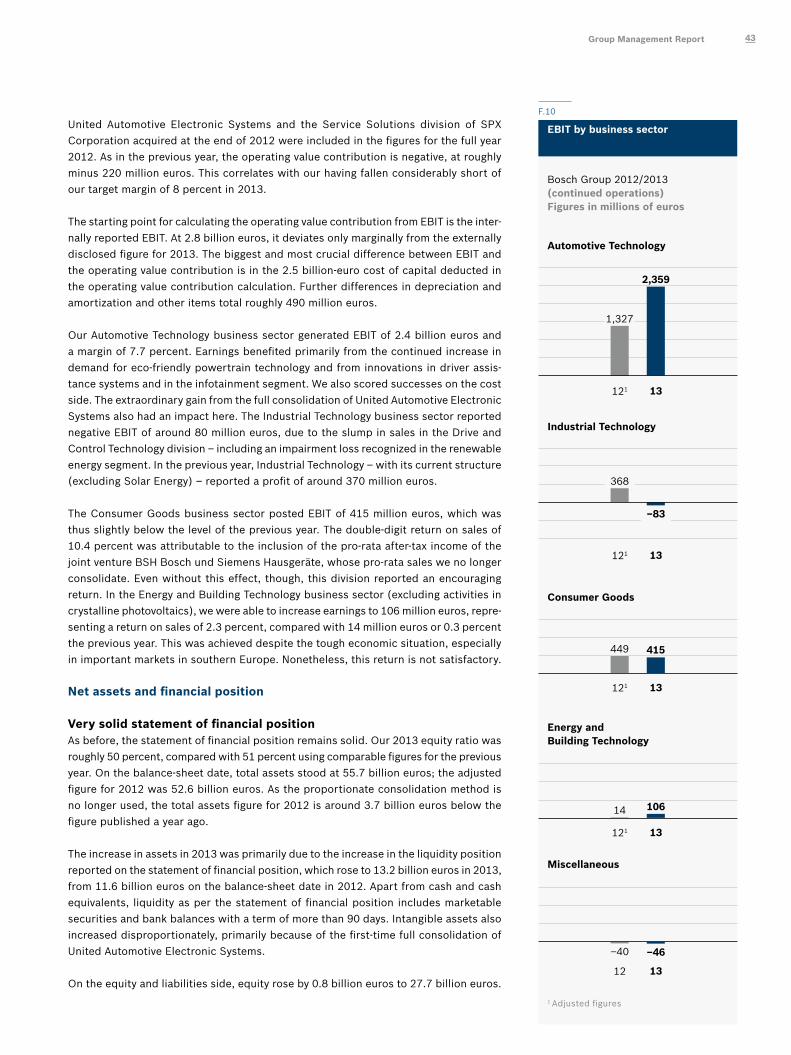
United Automotive Electronic Systems and the Service Solutions division of SPX Corporation acquired at the end of 2012 were included in the figures for the full year 2012. As in the previous year, the operating value contribution is negative, at roughly minus 220 million euros. This correlates with our having fallen considerably short of our target margin of 8 percent in 2013.
The starting point for calculating the operating value contribution from EBIT is the inter-nally reported EBIT. At 2.8 billion euros, it deviates only marginally from the externally disclosed figure for 2013. The biggest and most crucial difference between EBIT and the operating value contribution is in the 2.5 billion-euro cost of capital deducted in the operating value contribution calculation. Further differences in depreciation and amortization and other items total roughly 490 million euros.
Our Automotive Technology business sector generated EBIT of 2.4 billion euros and a margin of 7.7 percent. Earnings benefited primarily from the continued increase in demand for eco-friendly powertrain technology and from innovations in driver assis-tance systems and in the infotainment segment. We also scored successes on the cost side. The extraordinary gain from the full consolidation of United Automotive Electronic Systems also had an impact here. The Industrial Technology business sector reported negative EBIT of around 80 million euros, due to the slump in sales in the Drive and Control Technology division – including an impairment loss recognized in the renewable energy segment. In the previous year, Industrial Technology – with its current structure (excluding Solar Energy) – reported a profit of around 370 million euros.
The Consumer Goods business sector posted EBIT of 415 million euros, which was thus slightly below the level of the previous year. The double-digit return on sales of 10.4 percent was attributable to the inclusion of the pro-rata after-tax income of the joint venture BSH Bosch und Siemens Hausgeräte, whose pro-rata sales we no longer consolidate. Even without this effect, though, this division reported an encouraging return. In the Energy and Building Technology business sector (excluding activities in crystalline photovoltaics), we were able to increase earnings to 106 million euros, repre-senting a return on sales of 2.3 percent, compared with 14 million euros or 0.3 percent the previous year. This was achieved despite the tough economic situation, especially in important markets in southern Europe. Nonetheless, this return is not satisfactory.
Net assets and financial position
Very solid statement of financial positionAs before, the statement of financial position remains solid. Our 2013 equity ratio was roughly 50 percent, compared with 51 percent using comparable figures for the previous year. On the balance-sheet date, total assets stood at 55.7 billion euros; the adjusted figure for 2012 was 52.6 billion euros. As the proportionate consolidation method is no longer used, the total assets figure for 2012 is around 3.7 billion euros below the figure published a year ago.
The increase in assets in 2013 was primarily due to the increase in the liquidity position reported on the statement of financial position, which rose to 13.2 billion euros in 2013, from 11.6 billion euros on the balance-sheet date in 2012. Apart from cash and cash equivalents, liquidity as per the statement of financial position includes marketable securities and bank balances with a term of more than 90 days. Intangible assets also increased disproportionately, primarily because of the first-time full consolidation of United Automotive Electronic Systems.
On the equity and liabilities side, equity rose by 0.8 billion euros to 27.7 billion euros.
F.10
EBIT by business sector
Bosch Group 2012/2013(continued operations)Figures in millions of euros
Consumer Goods
121 13
449 415
Energy and Building Technology
121 13
14 106
Automotive Technology
121 13
1,327
2,359
Industrial Technology
121 13
368
–83
Miscellaneous
12 13
–40 –46
1 Adjusted figures
Group Management Report 43
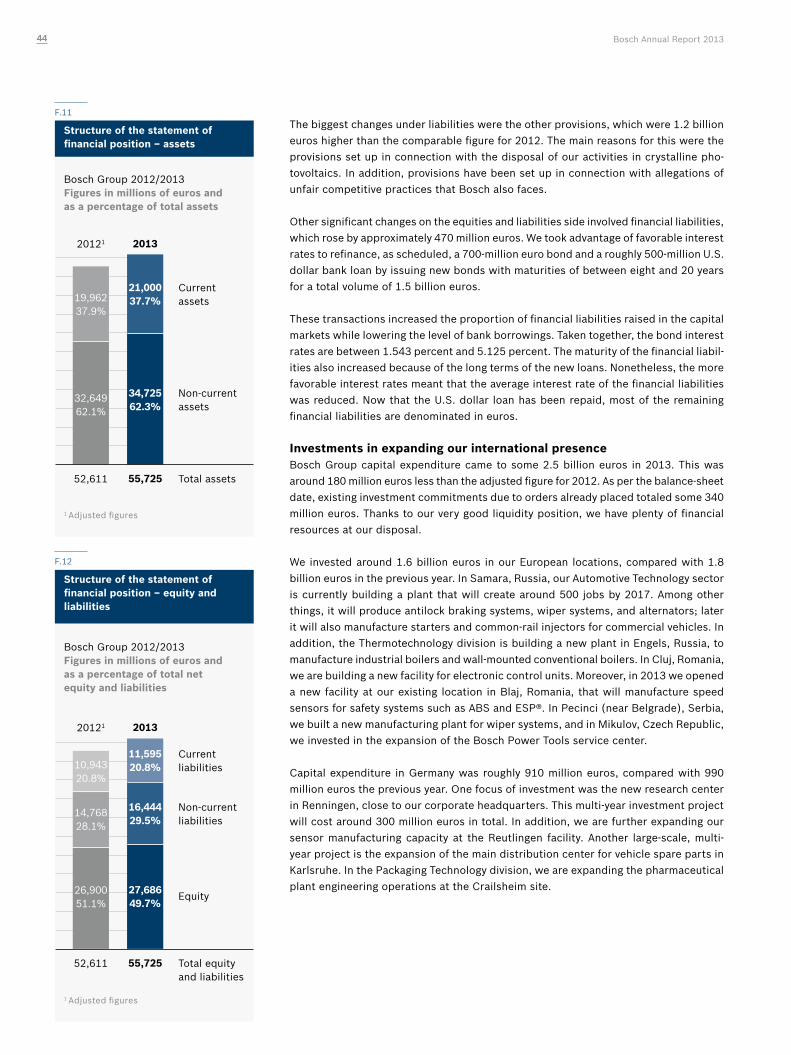
The biggest changes under liabilities were the other provisions, which were 1.2 billion euros higher than the comparable figure for 2012. The main reasons for this were the provisions set up in connection with the disposal of our activities in crystalline pho-tovoltaics. In addition, provisions have been set up in connection with allegations of unfair competitive practices that Bosch also faces.
Other significant changes on the equities and liabilities side involved financial liabilities, which rose by approximately 470 million euros. We took advantage of favorable interest rates to refinance, as scheduled, a 700-million euro bond and a roughly 500-million U.S. dollar bank loan by issuing new bonds with maturities of between eight and 20 years for a total volume of 1.5 billion euros.
These transactions increased the proportion of financial liabilities raised in the capital markets while lowering the level of bank borrowings. Taken together, the bond interest rates are between 1.543 percent and 5.125 percent. The maturity of the financial liabil-ities also increased because of the long terms of the new loans. Nonetheless, the more favorable interest rates meant that the average interest rate of the financial liabilities was reduced. Now that the U.S. dollar loan has been repaid, most of the remaining financial liabilities are denominated in euros.
Investments in expanding our international presenceBosch Group capital expenditure came to some 2.5 billion euros in 2013. This was around 180 million euros less than the adjusted figure for 2012. As per the balance-sheet date, existing investment commitments due to orders already placed totaled some 340 million euros. Thanks to our very good liquidity position, we have plenty of financial resources at our disposal.
We invested around 1.6 billion euros in our European locations, compared with 1.8 billion euros in the previous year. In Samara, Russia, our Automotive Technology sector is currently building a plant that will create around 500 jobs by 2017. Among other things, it will produce antilock braking systems, wiper systems, and alternators; later it will also manufacture starters and common-rail injectors for commercial vehicles. In addition, the Thermotechnology division is building a new plant in Engels, Russia, to manufacture industrial boilers and wall-mounted conventional boilers. In Cluj, Romania, we are building a new facility for electronic control units. Moreover, in 2013 we opened a new facility at our existing location in Blaj, Romania, that will manufacture speed sensors for safety systems such as ABS and ESP®. In Pecinci (near Belgrade), Serbia, we built a new manufacturing plant for wiper systems, and in Mikulov, Czech Republic, we invested in the expansion of the Bosch Power Tools service center.
Capital expenditure in Germany was roughly 910 million euros, compared with 990 million euros the previous year. One focus of investment was the new research center in Renningen, close to our corporate headquarters. This multi-year investment project will cost around 300 million euros in total. In addition, we are further expanding our sensor manufacturing capacity at the Reutlingen facility. Another large-scale, multi-year project is the expansion of the main distribution center for vehicle spare parts in Karlsruhe. In the Packaging Technology division, we are expanding the pharmaceutical plant engineering operations at the Crailsheim site.
F.12
Structure of the statement of financial position – equity and liabilities
Bosch Group 2012/2013Figures in millions of euros and as a percentage of total net equity and liabilities
20121
Current liabilities
Non-current liabilities
Equity
Total equity and liabilities
26,90051.1%
14,76828.1%
10,94320.8%
2013
27,68649.7%
16,44429.5%
11,59520.8%
52,611 55,725
1 Adjusted figures
F.11
Bosch Group 2012/2013Figures in millions of euros and as a percentage of total assets
20121
Current assets
Non-current assets
Total assets
32,64962.1%
19,96237.9%
34,72562.3%
21,00037.7%
52,611 55,725
2013
1 Adjusted figures
Structure of the statement of financial position – assets
Bosch Annual Report 201344
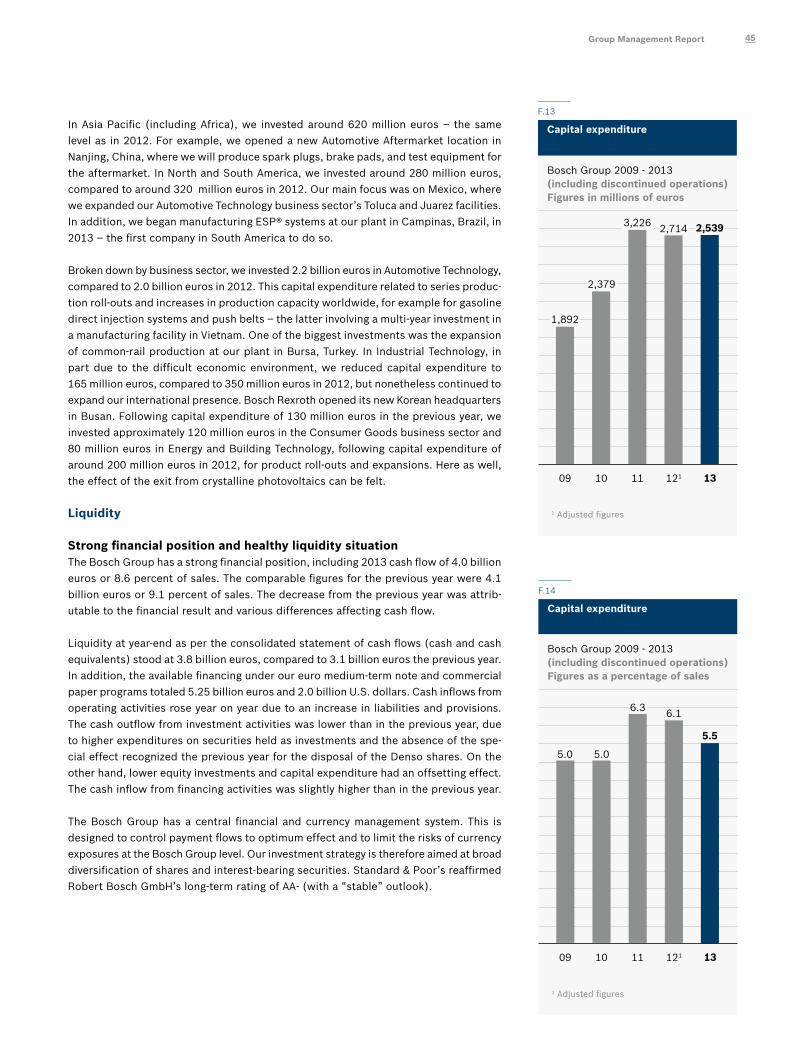
In Asia Pacific (including Africa), we invested around 620 million euros – the same level as in 2012. For example, we opened a new Automotive Aftermarket location in Nanjing, China, where we will produce spark plugs, brake pads, and test equipment for the aftermarket. In North and South America, we invested around 280 million euros, compared to around 320 million euros in 2012. Our main focus was on Mexico, where we expanded our Automotive Technology business sector’s Toluca and Juarez facilities. In addition, we began manufacturing ESP® systems at our plant in Campinas, Brazil, in 2013 – the first company in South America to do so.
Broken down by business sector, we invested 2.2 billion euros in Automotive Technology, compared to 2.0 billion euros in 2012. This capital expenditure related to series produc-tion roll-outs and increases in production capacity worldwide, for example for gasoline direct injection systems and push belts – the latter involving a multi-year investment in a manufacturing facility in Vietnam. One of the biggest investments was the expansion of common-rail production at our plant in Bursa, Turkey. In Industrial Technology, in part due to the difficult economic environment, we reduced capital expenditure to 165 million euros, compared to 350 million euros in 2012, but nonetheless continued to expand our international presence. Bosch Rexroth opened its new Korean headquarters in Busan. Following capital expenditure of 130 million euros in the previous year, we invested approximately 120 million euros in the Consumer Goods business sector and 80 million euros in Energy and Building Technology, following capital expenditure of around 200 million euros in 2012, for product roll-outs and expansions. Here as well, the effect of the exit from crystalline photovoltaics can be felt.
Liquidity
Strong financial position and healthy liquidity situation The Bosch Group has a strong financial position, including 2013 cash flow of 4.0 billion euros or 8.6 percent of sales. The comparable figures for the previous year were 4.1 billion euros or 9.1 percent of sales. The decrease from the previous year was attrib-utable to the financial result and various differences affecting cash flow.
Liquidity at year-end as per the consolidated statement of cash flows (cash and cash equivalents) stood at 3.8 billion euros, compared to 3.1 billion euros the previous year. In addition, the available financing under our euro medium-term note and commercial paper programs totaled 5.25 billion euros and 2.0 billion U.S. dollars. Cash inflows from operating activities rose year on year due to an increase in liabilities and provisions. The cash outflow from investment activities was lower than in the previous year, due to higher expenditures on securities held as investments and the absence of the spe-cial effect recognized the previous year for the disposal of the Denso shares. On the other hand, lower equity investments and capital expenditure had an offsetting effect. The cash inflow from financing activities was slightly higher than in the previous year.
The Bosch Group has a central financial and currency management system. This is designed to control payment flows to optimum effect and to limit the risks of currency exposures at the Bosch Group level. Our investment strategy is therefore aimed at broad diversification of shares and interest-bearing securities. Standard & Poor’s reaffirmed Robert Bosch GmbH’s long-term rating of AA- (with a “stable” outlook).
F.13
Capital expenditure
Bosch Group 2009 - 2013(including discontinued operations) Figures in millions of euros
1 Adjusted figures
1309 10 11 121
2,714 2,539
2,379
1,892
3,226
F.14
Capital expenditure
Bosch Group 2009 - 2013(including discontinued operations)Figures as a percentage of sales
1 Adjusted figures
09 10 11 121 13
5.0
6.3
5.0
6.1
5.5
Group Management Report 45
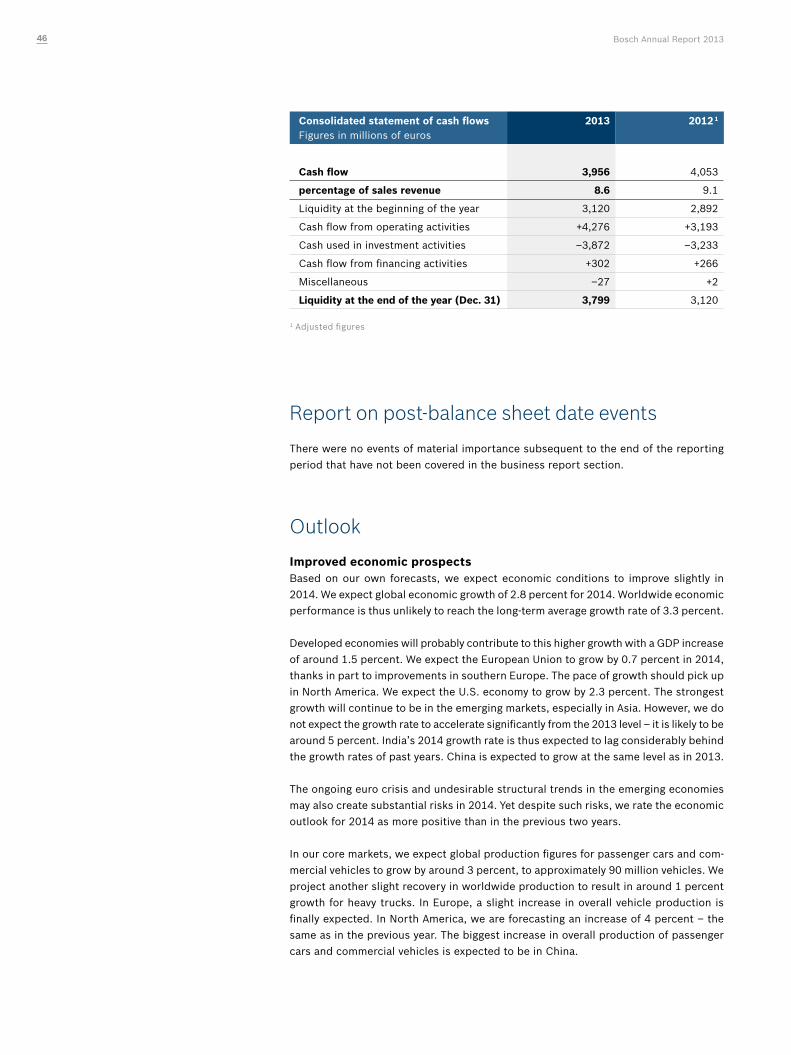
Report on post-balance sheet date events
There were no events of material importance subsequent to the end of the reporting period that have not been covered in the business report section.
Outlook
Improved economic prospects Based on our own forecasts, we expect economic conditions to improve slightly in 2014. We expect global economic growth of 2.8 percent for 2014. Worldwide economic performance is thus unlikely to reach the long-term average growth rate of 3.3 percent.
Developed economies will probably contribute to this higher growth with a GDP increase of around 1.5 percent. We expect the European Union to grow by 0.7 percent in 2014, thanks in part to improvements in southern Europe. The pace of growth should pick up in North America. We expect the U.S. economy to grow by 2.3 percent. The strongest growth will continue to be in the emerging markets, especially in Asia. However, we do not expect the growth rate to accelerate significantly from the 2013 level – it is likely to be around 5 percent. India’s 2014 growth rate is thus expected to lag considerably behind the growth rates of past years. China is expected to grow at the same level as in 2013.
The ongoing euro crisis and undesirable structural trends in the emerging economies may also create substantial risks in 2014. Yet despite such risks, we rate the economic outlook for 2014 as more positive than in the previous two years.
In our core markets, we expect global production figures for passenger cars and com-mercial vehicles to grow by around 3 percent, to approximately 90 million vehicles. We project another slight recovery in worldwide production to result in around 1 percent growth for heavy trucks. In Europe, a slight increase in overall vehicle production is finally expected. In North America, we are forecasting an increase of 4 percent – the same as in the previous year. The biggest increase in overall production of passenger cars and commercial vehicles is expected to be in China.
Consolidated statement of cash flowsFigures in millions of euros
2013 2012 1
Cash flow 3,956 4,053
percentage of sales revenue 8.6 9.1
Liquidity at the beginning of the year 3,120 2,892
Cash flow from operating activities +4,276 +3,193
Cash used in investment activities –3,872 –3,233
Cash flow from financing activities +302 +266
Miscellaneous –27 +2
Liquidity at the end of the year (Dec. 31) 3,799 3,120
1 Adjusted figures
Bosch Annual Report 201346
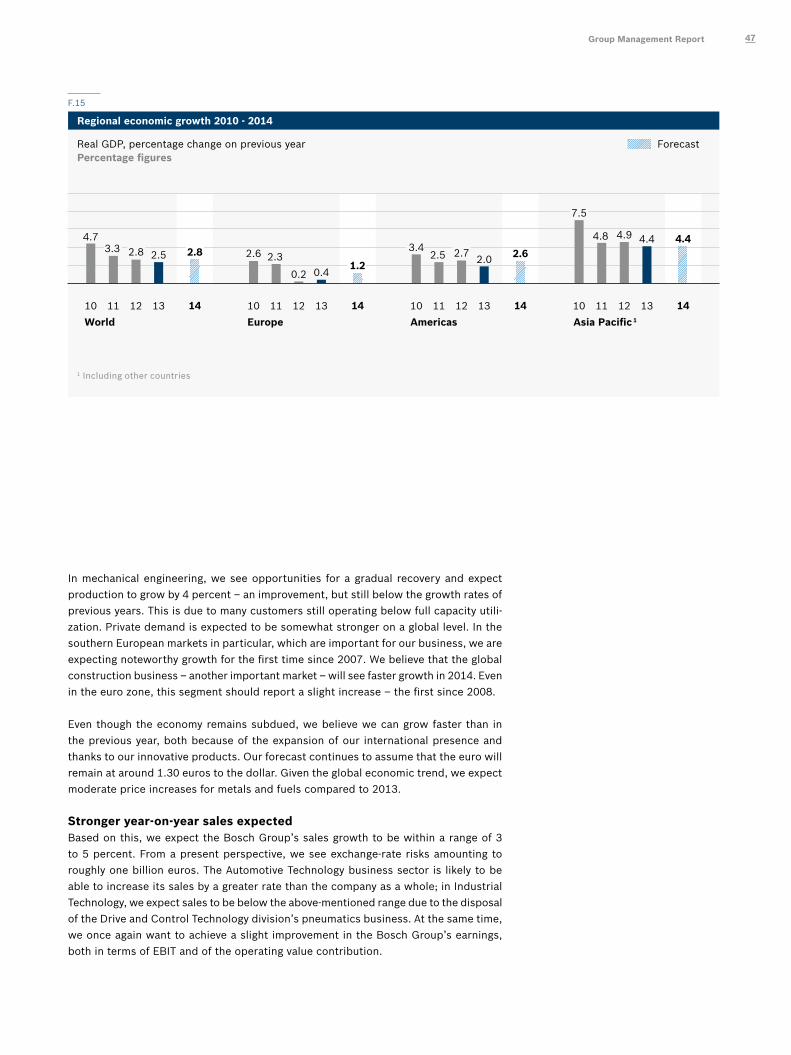
In mechanical engineering, we see opportunities for a gradual recovery and expect production to grow by 4 percent – an improvement, but still below the growth rates of previous years. This is due to many customers still operating below full capacity utili-zation. Private demand is expected to be somewhat stronger on a global level. In the southern European markets in particular, which are important for our business, we are expecting noteworthy growth for the first time since 2007. We believe that the global construction business – another important market – will see faster growth in 2014. Even in the euro zone, this segment should report a slight increase – the first since 2008.
Even though the economy remains subdued, we believe we can grow faster than in the previous year, both because of the expansion of our international presence and thanks to our innovative products. Our forecast continues to assume that the euro will remain at around 1.30 euros to the dollar. Given the global economic trend, we expect moderate price increases for metals and fuels compared to 2013.
Stronger year-on-year sales expectedBased on this, we expect the Bosch Group’s sales growth to be within a range of 3 to 5 percent. From a present perspective, we see exchange-rate risks amounting to roughly one billion euros. The Automotive Technology business sector is likely to be able to increase its sales by a greater rate than the company as a whole; in Industrial Technology, we expect sales to be below the above-mentioned range due to the disposal of the Drive and Control Technology division’s pneumatics business. At the same time, we once again want to achieve a slight improvement in the Bosch Group’s earnings, both in terms of EBIT and of the operating value contribution.
F.15
Regional economic growth 2010 - 2014
Real GDP, percentage change on previous yearPercentage figures
Forecast
10 11 12 13 14
World Europe Americas Asia Pacific 110 11 12 13 14 10 11 12 13 14 10 11 12 13 14
1 Including other countries
2 634 2 6342.6
0.2 0.42 6342.0 2.6 2 634
4.83.3
4.7
2.5 2.8 2.31.2
2.5 2.74.44.44.9
7.5
3.42.8
Group Management Report 47
Report on opportunities and risks
Opportunities
Well positioned with a focus on “Invented for life”We believe that we are well positioned with our portfolio, offering products and services that are “Invented for life.” In addition, over both the medium and long term there are additional opportunities for growth in all our business sectors through expanding our already strong international presence. We thus want to participate especially in the above-average economic growth in Asia, South America, and increasingly also in Africa. To do so, we are increasingly offering products in those markets that are designed to meet customers’ specific requirements. Beyond that, we believe that there are significant opportunities for us if we offer further innovations – especially for mature markets such as Europe and North America, where the pace of economic growth is slower.
In the Automotive Technology business sector, increasingly strict emissions standards and the resulting increase in demand for eco-friendly powertrain technology will yield additional opportunities. This applies both to internal-combustion engines and, in the future, to electromobility, where we intend to establish a broad-based market presence. We see similar trends in vehicle safety technology – an area where standards are also becoming stricter. Yet regulatory requirements are not the only factor playing a role. Our customers as well are increasingly calling for eco-friendly products. This will provide us with opportunities in the Industrial Technology, Consumer Goods, and Energy and Building Technology sectors as well. In every business sector, greater connectivity via the internet of things and services will provide further opportunities for growth. We want to participate in this growth as well, and are developing a number of solutions and new business models. We believe that our broad product range is an advantage here, since it gives us profound insights into many industries and technical fields. At the same time, alliances offer further opportunities to develop new areas of business for the company.
Bosch Annual Report 201348
Risks
Comprehensive risk management systemThe Bosch Group’s risk management system is part of strategic and operations control. From strategic planning at the group level through medium-term planning by the oper-ating units to our operational controlling, we consistently use risk management tools.
For strategic planning at the group level, risks of group-wide importance are considered by analyzing the strategic portfolio, the technological portfolio, and the customer port-folio. Major medium-term risks are detected by the divisions, mainly through systematic business segment, competitor, and technology analyses.
As part of the operational controlling, an overview of all economically relevant transac-tions is compiled every month on the basis of a comprehensive reporting system, along with a list of major opportunities and risks. At meetings of committees such as the foreign exchange, raw materials, and investment committees, specific risks are examined on a regular basis. We use strategic financial planning and deploy standardized tools group-wide to minimize risks related to equity investments.
At all levels of risk management, a key element is defining and implementing measures derived from the risk management system. The board of management of Robert Bosch GmbH – with support from the corporate departments – is responsible for risks of group-wide importance. The executive management of the divisions and the presidents of the regional organizations are responsible for identifying risks at the point of origin and for managing any necessary measures.
Risk management in group accountingThe internal control and risk management system for group accounting ensures proper accounting and financial reporting. The main components are a mandatory group-wide chart of accounts, mandatory standards for bookkeeping systems, group-wide accounting manuals, and software for recording the necessary data and for consoli-dation. Changes in legislation or accounting standards are examined in regard to their relevance to the consolidated financial statements and are included during regular updating in the accounting manuals, charts of accounts, and consolidation software. Group-wide compliance is ensured though controls and technical advice from the cor-porate accounting department.
Group Management Report 49
The consolidated financial statements are prepared centrally on the basis of data reported by subsidiaries. The data are initially checked for plausibility by the corporate accounting department, with the data being reviewed from different regional and spe-cialist perspectives. Consolidation then follows. The principle of dual control applies at every level. The quality of data recording and consolidation is ensured by means of authorization and access regulations. The system is supplemented by internal control measures which are implemented locally according to uniform group-wide standards, in which financially critical processes are spot-checked for accuracy.
Overall risk assessmentOn the basis of the information currently available and the individual risks listed in this report, there are no additional discernible opportunities or risks, apart from the market-related opportunities and risks listed in the outlook above, that could materially affect the net assets, financial position, and results of operations of the Bosch Group in fiscal 2014. Overall, the Bosch Group has no specific individual risk exposures that could jeopardize the group’s continued existence as a going concern. An overall assessment of all risks shows that our forecast is plausible. There are no significant differences from the previous year that would affect this overall assessment.
Strategic and operating risks We analyze risks to the business sectors by risk area. In particular, the areas monitored include sales, purchasing, technology, value-creation model, and business environment. We assess the risks identified. An important criterion here is the product of the esti-mated economic impact and the estimated probability of occurrence.
For the probability of occurrence, we use the categories “low” (up to 17 percent probability), “medium” (up to 32 percent probability), and “high” (up to 50 percent probability). Risks whose probability of occurrence is higher than 50 percent are given due consideration in our annual business planning. We categorize these risks’ economic impact as low, medium, and high in terms of their relation to the anticipated accumu-lated EBIT of the respective business sector over a period of four years.
Particular risks – risks with at least a medium economic impact and probability of occurrence – relate in the case of the Automotive Technology business sector above all to achieving target market shares and delivery shares, and additionally to the market position in emerging countries, price trends, and market changes due to new busi-ness models, technologies, and competitors. We counter these risks through carefully coordinated, extensive planning and monthly tracking of acquisition results for long-term delivery contracts, intensive market surveillance, a broad customer portfolio, the deliberate expansion of our presence in emerging markets, and global trend scouting. Added to this is our extensive warranty exposure, which we counter with our quality management system.
Bosch Annual Report 201350
In the Industrial Technology business sector, particular mention should be made of the high volatility of the markets in which the Drive and Control Technology division does business. This calls for additional flexibility, which we are constantly working to improve. We have also developed an early warning system to improve the speed with which we react to market changes. Depending on the forecast, we take operational control measures. Additional potential risks in this division include slow expansion of power generation from renewables and price erosion due to increasing competition. The particular risks in the Consumer Goods business sector are increases in prices of specific commodities, such as rare earth metals, and increasing price pressure on the market side. Measures include looking for alternative raw materials and sources of supply, and numerous projects aimed at lowering manufacturing costs before and after the market launch. In the Energy and Building Technology business sector, particular mention should be made of risks of price erosion in parts of the product portfolio and of a salability risk due to the high pace of innovation of IP technologies. Other risks include increasing costs for the services business. These risks can be countered by measures such as increasing productivity by expanding remote diagnostics and main-tenance in the services sector and making quick adjustments to our product portfolio.
Due to our broad regional and sectoral presence, strategic and operating risks are on the whole broadly diversified. In every business sector, existing risks are transparent thanks to our risk management system. By implementing deliberate measures, we limit both the probability of occurrence and the economic impact of the risks.
IT risks: We have put in place comprehensive measures, valid throughout the compa-ny, to provide organizational and technical protection against all types of data loss, manipulation, and theft. We respond to the constantly growing demands and increasing awareness of data protection in social networks with our broad-based and well trained data-protection organization. We also protect our data against IT system failures by using redundant systems that run independently of location.
Legal risks, compliance: We do not anticipate any risks as a result of current or impend-ing litigation or compliance issues that could materially impair the net assets, financial position, or results of operations of the Bosch Group in fiscal 2014. The principle of legality is an integral part of Bosch’s values and is reinforced through a global compliance organization. There is a global hotline system that associates and third parties can use to report critical incidents. Worldwide classroom-based programs, web-based training courses, and a great number of publications are used to ensure that everyone in the group is aware of the need to comply with existing laws, rules, and regulations. We deal rigorously with violations of applicable laws or the Bosch Code of Business Conduct.
51Group Management Report
Since 2010, the EU Competition Commission and other antitrust authorities have been investigating a number of automotive suppliers for violations of antitrust laws. Bosch, too, faces such allegations and has set aside provisions totaling 150 million euros. The company is cooperating with the authorities in their investigations into these charges. In 2013, the Korean Fair Trade Commission imposed a fine of around 3.8 million euros on Bosch Electrical Drives Co., Ltd., Buyong, Korea, for exchanging prohibited information. Bosch has appealed the decision.
Financial risks: The operating business of the Bosch Group is affected by fluctuations in exchange and interest rates. The aim of business policy is to limit these risks. Our strategy of maintaining a strong global presence with local production and worldwide purchasing activities generally reduces currency risks. A foreign exchange balance plan showing net positions per foreign currency is used as the basis for controlling currency risks. If necessary, these risks are hedged through centralized transactions. Internal regulations and guidelines set down a mandatory framework and define responsibili-ties relating to payment transactions, investments, and hedging activities. According to these regulations, financial tools such as forward transactions and interest swaps may only be used in connection with the operating business, financial investments, or financing transactions; speculative transactions are not allowed. Hedging transactions are entered into solely via banks whose creditworthiness is regarded as impeccable. Their credit ratings are constantly monitored and limits are adjusted accordingly.
We have extensive financial assets. These are subject to interest-rate and exchange-rate risks. We control these risks by means of an investment process geared to our financial exposure. The objective is to secure appropriate, risk-adjusted returns on invested capital. Here, we endeavor to spread our investments as widely as possible. A limit system is used to closely monitor investment risk. Prescribed risk limits for the specific investment categories limit the potential loss. The impact of changes in interest rates on borrowed funds is sharply limited over the short and medium term by balancing the maturities of financial liabilities. Changes in financial assets and liabilities are monitored on an ongoing basis. We identify liquidity risks as part of our liquidity planning. Thanks to our good credit rating and existing financing arrangements, we have good access to the capital markets.
Bosch Annual Report 201352

53Group Management Report
DConsolidated Financial Statements of the Bosch Group
Income statement 56
Statement of comprehensive income 57
Statement of financial position 58
Statement of changes in equity 60
Statement of cash flows 62
Notes to the financial statements 63
Auditor’s Report 136
Ten-Year Summary of the Bosch Group 138
Bosch Annual Report 201354
Fina
ncia
l Sta
tem
ents
55Consolidated Financial Statements
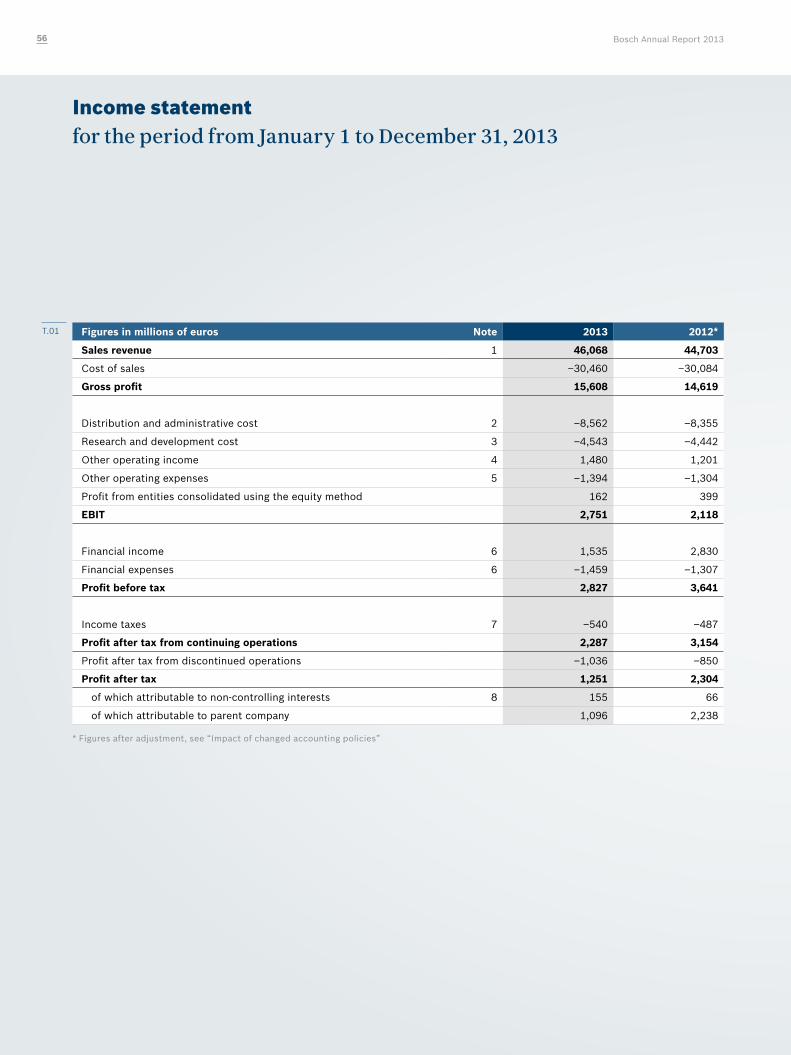
T.01
Income statement for the period from January 1 to December 31, 2013
Figures in millions of euros Note 2013 2012*
Sales revenue 1 46,068 44,703
Cost of sales –30,460 –30,084
Gross profit 15,608 14,619
Distribution and administrative cost 2 –8,562 –8,355
Research and development cost 3 –4,543 –4,442
Other operating income 4 1,480 1,201
Other operating expenses 5 –1,394 –1,304
Profit from entities consolidated using the equity method 162 399
EBIT 2,751 2,118
Financial income 6 1,535 2,830
Financial expenses 6 –1,459 –1,307
Profit before tax 2,827 3,641
Income taxes 7 –540 –487
Profit after tax from continuing operations 2,287 3,154
Profit after tax from discontinued operations –1,036 –850
Profit after tax 1,251 2,304
of which attributable to non-controlling interests 8 155 66
of which attributable to parent company 1,096 2,238
* Figures after adjustment, see “Impact of changed accounting policies”
Bosch Annual Report 201356
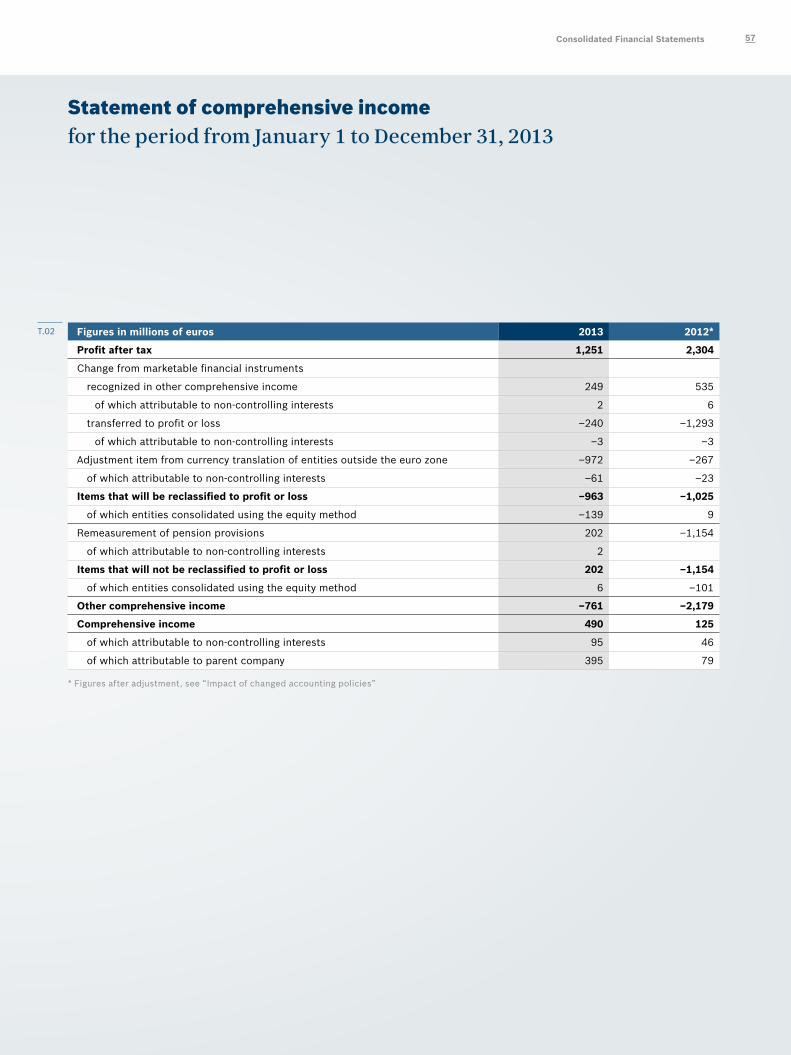
T.02
Statement of comprehensive income for the period from January 1 to December 31, 2013
Figures in millions of euros 2013 2012*
Profit after tax 1,251 2,304
Change from marketable financial instruments
recognized in other comprehensive income 249 535
of which attributable to non-controlling interests 2 6
transferred to profit or loss –240 –1,293
of which attributable to non-controlling interests –3 –3
Adjustment item from currency translation of entities outside the euro zone –972 –267
of which attributable to non-controlling interests –61 –23
Items that will be reclassified to profit or loss –963 –1,025
of which entities consolidated using the equity method –139 9
Remeasurement of pension provisions 202 –1,154
of which attributable to non-controlling interests 2
Items that will not be reclassified to profit or loss 202 –1,154
of which entities consolidated using the equity method 6 –101
Other comprehensive income –761 –2,179
Comprehensive income 490 125
of which attributable to non-controlling interests 95 46
of which attributable to parent company 395 79
* Figures after adjustment, see “Impact of changed accounting policies”
Consolidated Financial Statements 57
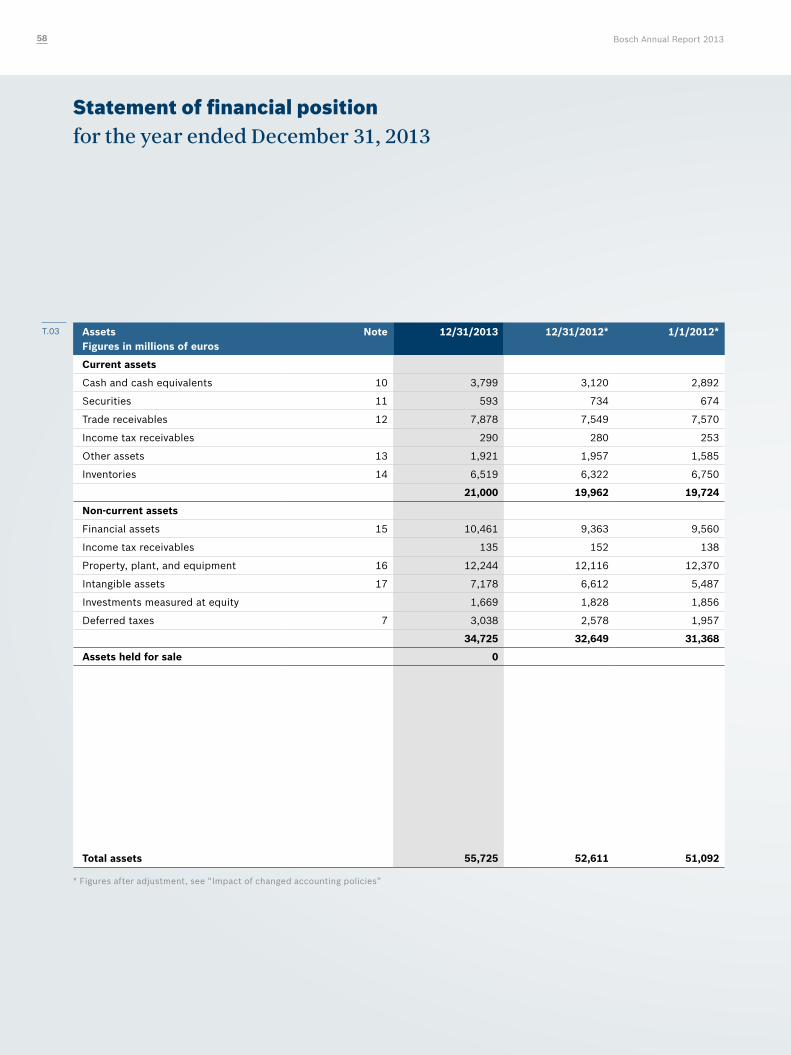
Statement of financial position for the year ended December 31, 2013
AssetsFigures in millions of euros
Note 12/31/2013 12/31/2012* 1/1/2012*
Current assets
Cash and cash equivalents 10 3,799 3,120 2,892
Securities 11 593 734 674
Trade receivables 12 7,878 7,549 7,570
Income tax receivables 290 280 253
Other assets 13 1,921 1,957 1,585
Inventories 14 6,519 6,322 6,750
21,000 19,962 19,724
Non-current assets
Financial assets 15 10,461 9,363 9,560
Income tax receivables 135 152 138
Property, plant, and equipment 16 12,244 12,116 12,370
Intangible assets 17 7,178 6,612 5,487
Investments measured at equity 1,669 1,828 1,856
Deferred taxes 7 3,038 2,578 1,957
34,725 32,649 31,368
Assets held for sale 0
Total assets 55,725 52,611 51,092
* Figures after adjustment, see “Impact of changed accounting policies”
T.03
Bosch Annual Report 201358
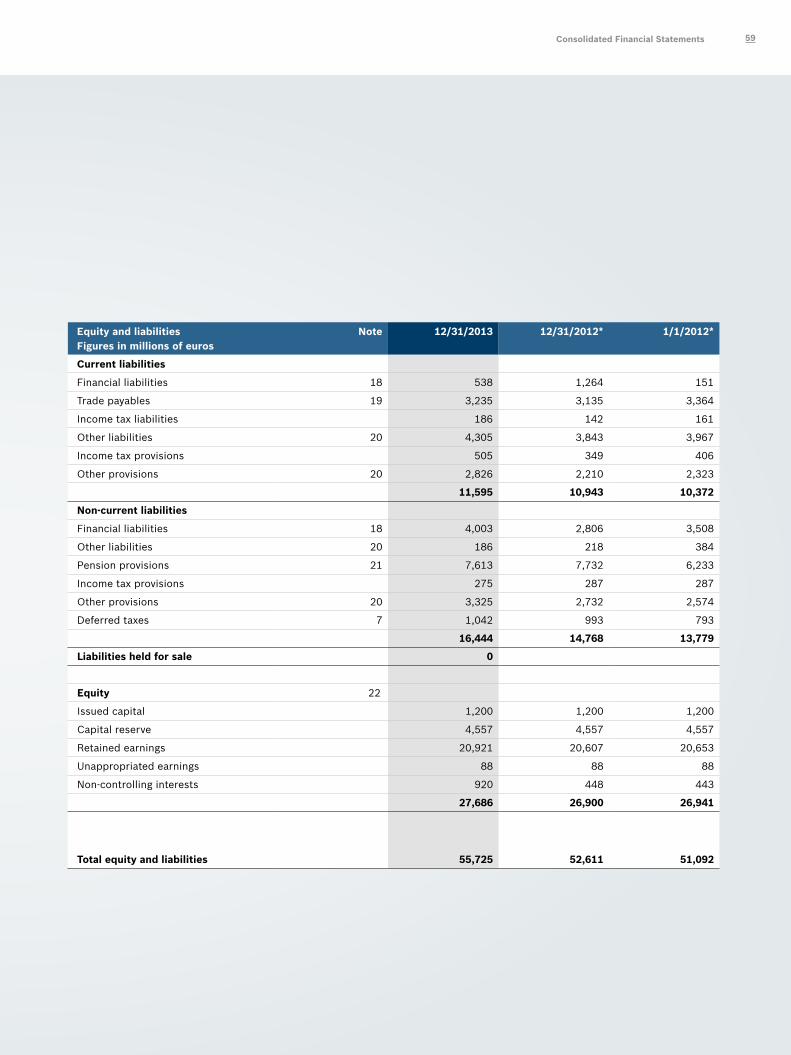
Equity and liabilities Figures in millions of euros
Note 12/31/2013 12/31/2012* 1/1/2012*
Current liabilities
Financial liabilities 18 538 1,264 151
Trade payables 19 3,235 3,135 3,364
Income tax liabilities 186 142 161
Other liabilities 20 4,305 3,843 3,967
Income tax provisions 505 349 406
Other provisions 20 2,826 2,210 2,323
11,595 10,943 10,372
Non-current liabilities
Financial liabilities 18 4,003 2,806 3,508
Other liabilities 20 186 218 384
Pension provisions 21 7,613 7,732 6,233
Income tax provisions 275 287 287
Other provisions 20 3,325 2,732 2,574
Deferred taxes 7 1,042 993 793
16,444 14,768 13,779
Liabilities held for sale 0
Equity 22
Issued capital 1,200 1,200 1,200
Capital reserve 4,557 4,557 4,557
Retained earnings 20,921 20,607 20,653
Unappropriated earnings 88 88 88
Non-controlling interests 920 448 443
27,686 26,900 26,941
Total equity and liabilities 55,725 52,611 51,092
Consolidated Financial Statements 59
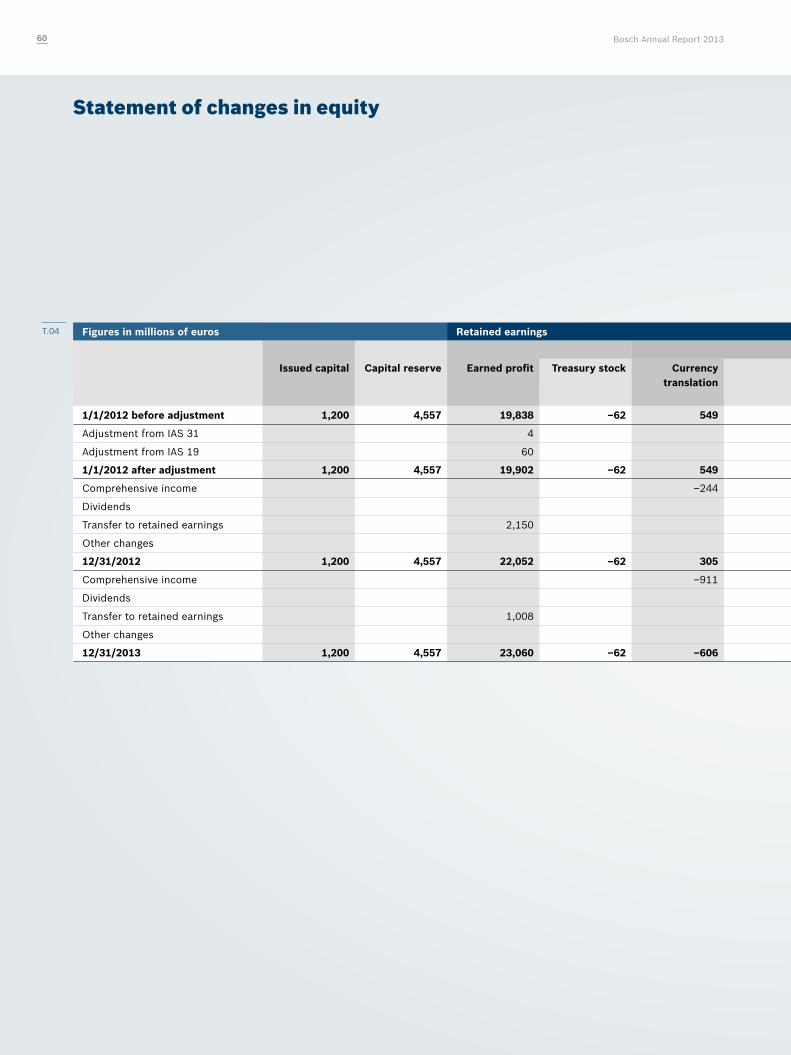
Statement of changes in equity
Figures in millions of euros Retained earnings
Other comprehensive income
Issued capital Capital reserve Earned profit Treasury stock Currencytranslation
Securities Other Total Unappropriated earnings
Equity parent company
Equity non-controlling
interests
Group equity
1/1/2012 before adjustment 1,200 4,557 19,838 –62 549 1,278 –1,014 813 88 26,434 483 26,917
Adjustment from IAS 31 4 4 –40 –36
Adjustment from IAS 19 60 60 60
1/1/2012 after adjustment 1,200 4,557 19,902 –62 549 1,278 –1,014 813 88 26,498 443 26,941
Comprehensive income –244 –761 –1,154 –2,159 2,238 79 46 125
Dividends –88 –88 –27 –115
Transfer to retained earnings 2,150 –2,150
Other changes –37 –37 –37 –14 –51
12/31/2012 1,200 4,557 22,052 –62 305 517 –2,205 –1,383 88 26,452 448 26,900
Comprehensive income –911 10 200 –701 1,096 395 95 490
Dividends –88 –88 –81 –169
Transfer to retained earnings 1,008 –1,008
Other changes 7 7 7 458 465
12/31/2013 1,200 4,557 23,060 –62 –606 527 –1,998 –2,077 88 26,766 920 27,686
T.04
Bosch Annual Report 201360
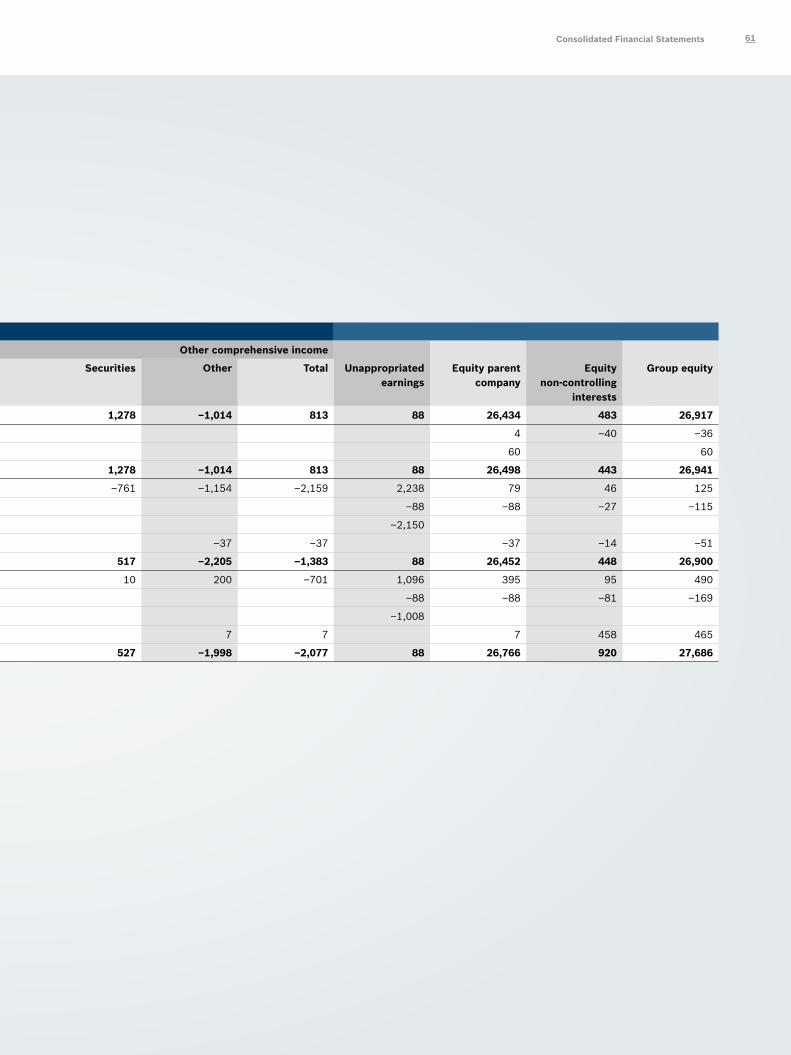
Statement of changes in equity
Figures in millions of euros Retained earnings
Other comprehensive income
Issued capital Capital reserve Earned profit Treasury stock Currencytranslation
Securities Other Total Unappropriated earnings
Equity parent company
Equity non-controlling
interests
Group equity
1/1/2012 before adjustment 1,200 4,557 19,838 –62 549 1,278 –1,014 813 88 26,434 483 26,917
Adjustment from IAS 31 4 4 –40 –36
Adjustment from IAS 19 60 60 60
1/1/2012 after adjustment 1,200 4,557 19,902 –62 549 1,278 –1,014 813 88 26,498 443 26,941
Comprehensive income –244 –761 –1,154 –2,159 2,238 79 46 125
Dividends –88 –88 –27 –115
Transfer to retained earnings 2,150 –2,150
Other changes –37 –37 –37 –14 –51
12/31/2012 1,200 4,557 22,052 –62 305 517 –2,205 –1,383 88 26,452 448 26,900
Comprehensive income –911 10 200 –701 1,096 395 95 490
Dividends –88 –88 –81 –169
Transfer to retained earnings 1,008 –1,008
Other changes 7 7 7 458 465
12/31/2013 1,200 4,557 23,060 –62 –606 527 –1,998 –2,077 88 26,766 920 27,686
Consolidated Financial Statements 61
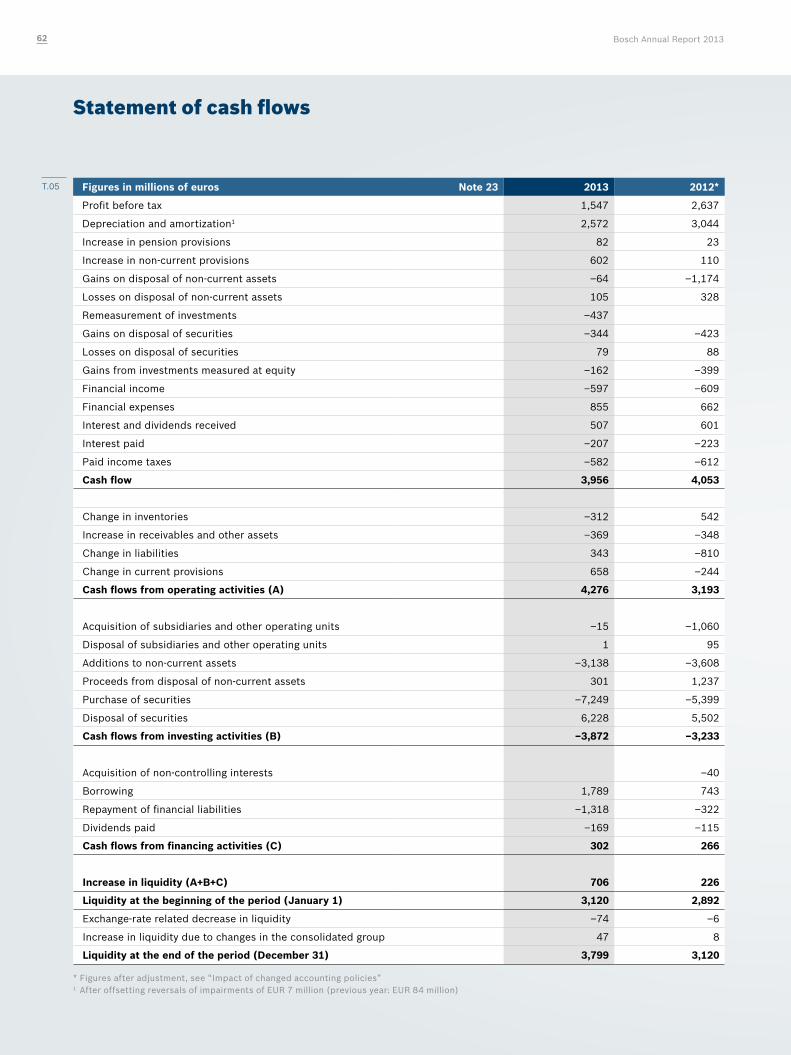
Statement of cash flows
Figures in millions of euros Note 23 2013 2012*
Profit before tax 1,547 2,637
Depreciation and amortization1 2,572 3,044
Increase in pension provisions 82 23
Increase in non-current provisions 602 110
Gains on disposal of non-current assets –64 –1,174
Losses on disposal of non-current assets 105 328
Remeasurement of investments –437
Gains on disposal of securities –344 –423
Losses on disposal of securities 79 88
Gains from investments measured at equity –162 –399
Financial income –597 –609
Financial expenses 855 662
Interest and dividends received 507 601
Interest paid –207 –223
Paid income taxes –582 –612
Cash flow 3,956 4,053
Change in inventories –312 542
Increase in receivables and other assets –369 –348
Change in liabilities 343 –810
Change in current provisions 658 –244
Cash flows from operating activities (A) 4,276 3,193
Acquisition of subsidiaries and other operating units –15 –1,060
Disposal of subsidiaries and other operating units 1 95
Additions to non-current assets –3,138 –3,608
Proceeds from disposal of non-current assets 301 1,237
Purchase of securities –7,249 –5,399
Disposal of securities 6,228 5,502
Cash flows from investing activities (B) –3,872 –3,233
Acquisition of non-controlling interests –40
Borrowing 1,789 743
Repayment of financial liabilities –1,318 –322
Dividends paid –169 –115
Cash flows from financing activities (C) 302 266
Increase in liquidity (A+B+C) 706 226
Liquidity at the beginning of the period (January 1) 3,120 2,892
Exchange-rate related decrease in liquidity –74 –6
Increase in liquidity due to changes in the consolidated group 47 8
Liquidity at the end of the period (December 31) 3,799 3,120
* Figures after adjustment, see “Impact of changed accounting policies”1 After offsetting reversals of impairments of EUR 7 million (previous year: EUR 84 million)
T.05
Bosch Annual Report 201362
Notes to the financial statementsPrinciples and methods
General explanations The consolidated financial statements of the Bosch Group for the year ended December 31, 2013, have been prepared according to the standards issued by the International Accounting Standards Board (IASB), London. The International Financial Reporting Standards (IFRSs) and the Interpretations of the International Financial Reporting Interpretations Committee (IFRS IC) applicable in the EU at the end of the reporting period have been applied. The previous-year figures have been determined using the same principles.
The consolidated financial statements are in line with the provisions of Sec. 315a HGB [“Handelsgesetzbuch”: German Commercial Code] and Regulation (EC) No 1606/2002 of the European Parliament and of the Council of July 19, 2002, on the application of international accounting standards.
The EU-endorsed standards IFRS 10 Consolidated Financial Statements, IFRS 11 Joint Arran-gements, and IFRS 12 Disclosures of Interests in Other Entities (mandatory adoption for fiscal years beginning on or after January 1, 2014), as well as the amendments to IAS 27 Separate Financial Statements, IAS 28 Investments in Associates and Joint Ventures, and IAS 32 Financial Instruments: Presentation (mandatory adoption for fiscal years beginning on or after January 1, 2014) will not be early adopted. The first-time adoption of these standards is not expected to have any significant effects on the consolidated financial statements of the Bosch Group.
Effects of amended accounting and measurement methods are explained in the section “Impact of changes in accounting policies.”
To enhance the clarity and transparency of the consolidated financial statements, individual items of the consolidated income statement and the consolidated statement of financial position have been combined. These items are explained separately in the notes to the consolidated financial statements. The income statement has been prepared using the function of expense method.
The preparation of consolidated financial statements in accordance with IFRSs requires that assumptions be made for some items. These assumptions have an effect on the amount of the assets and liabilities, income and expenses, and contingent liabilities disclosed in the consolidated statement of financial position.
The group currency is the euro (EUR). Unless otherwise stated, all figures are in millions of euros (EUR million).
The consolidated financial statements prepared as of December 31, 2013, were authorized for disclosure by management on March 13, 2014. The consolidated financial statements and group management report will be filed with the Federal Gazette [Bundesanzeiger] and published there.
Basis of consolidation Besides Robert Bosch GmbH, the consolidated financial statements include all subsidi- aries for which Robert Bosch GmbH fulfills the criteria pursuant to IAS 27 Consolidated and Separate Financial Statements, or to which the interpretation of the Standing Interpretations Committee SIC 12 Consolidation – Special Purpose Entities apply. These entities are included in the consolidated financial statements from the date on which the Bosch Group obtains control. Conversely, subsidiaries are no longer included when control of the entity is lost.
The capital of the companies consolidated in the fiscal year for the first time is consolidated pursuant to IFRS 3 Business Combinations using the purchase method of accounting. At the time of combination, the purchase cost of the shares acquired is offset against pro-rata revalued equity. Assets, liabilities, and contingent liabilities are carried at fair value. Remain-
Consolidated Financial Statements 63
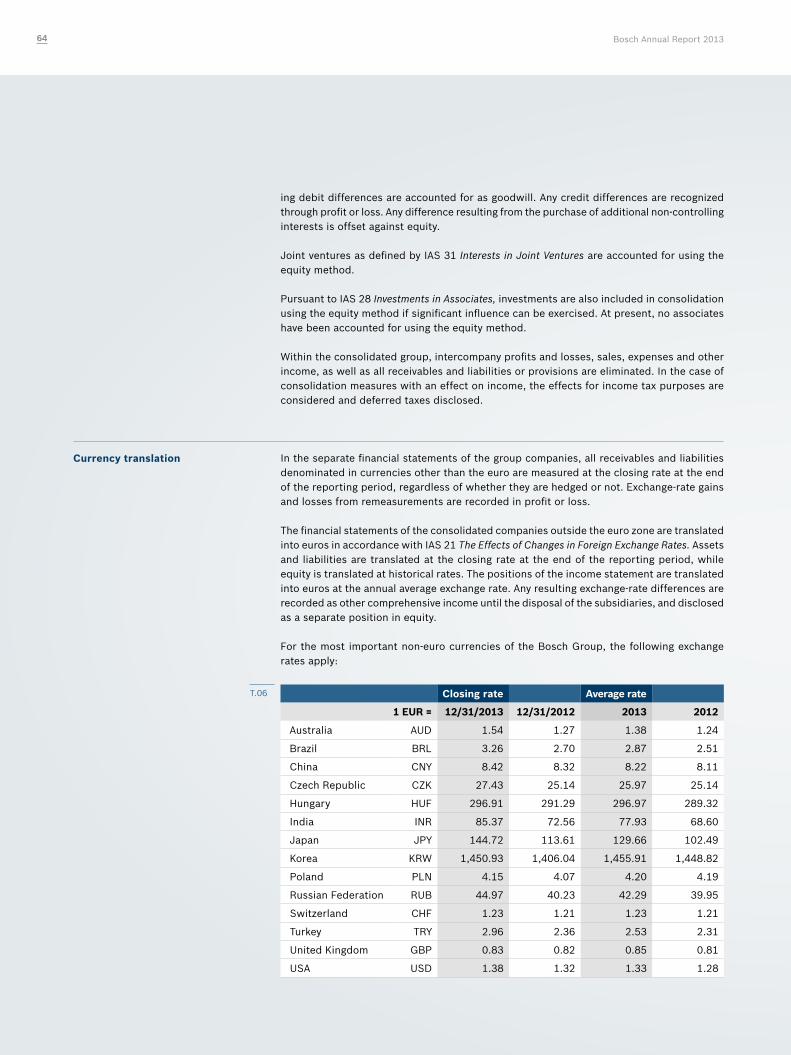
ing debit differences are accounted for as goodwill. Any credit differences are recognized through profit or loss. Any difference resulting from the purchase of additional non-controlling interests is offset against equity.
Joint ventures as defined by IAS 31 Interests in Joint Ventures are accounted for using the equity method.
Pursuant to IAS 28 Investments in Associates, investments are also included in consolidation using the equity method if significant influence can be exercised. At present, no associates have been accounted for using the equity method.
Within the consolidated group, intercompany profits and losses, sales, expenses and other income, as well as all receivables and liabilities or provisions are eliminated. In the case of consolidation measures with an effect on income, the effects for income tax purposes are considered and deferred taxes disclosed.
Currency translation In the separate financial statements of the group companies, all receivables and liabilities denominated in currencies other than the euro are measured at the closing rate at the end of the reporting period, regardless of whether they are hedged or not. Exchange-rate gains and losses from remeasurements are recorded in profit or loss. The financial statements of the consolidated companies outside the euro zone are translated into euros in accordance with IAS 21 The Effects of Changes in Foreign Exchange Rates. Assets and liabilities are translated at the closing rate at the end of the reporting period, while equity is translated at historical rates. The positions of the income statement are translated into euros at the annual average exchange rate. Any resulting exchange-rate differences are recorded as other comprehensive income until the disposal of the subsidiaries, and disclosed as a separate position in equity. For the most important non-euro currencies of the Bosch Group, the following exchange rates apply:
Closing rate Average rate
1 EUR = 12/31/2013 12/31/2012 2013 2012
Australia AUD 1.54 1.27 1.38 1.24
Brazil BRL 3.26 2.70 2.87 2.51
China CNY 8.42 8.32 8.22 8.11
Czech Republic CZK 27.43 25.14 25.97 25.14
Hungary HUF 296.91 291.29 296.97 289.32
India INR 85.37 72.56 77.93 68.60
Japan JPY 144.72 113.61 129.66 102.49
Korea KRW 1,450.93 1,406.04 1,455.91 1,448.82
Poland PLN 4.15 4.07 4.20 4.19
Russian Federation RUB 44.97 40.23 42.29 39.95
Switzerland CHF 1.23 1.21 1.23 1.21
Turkey TRY 2.96 2.36 2.53 2.31
United Kingdom GBP 0.83 0.82 0.85 0.81
USA USD 1.38 1.32 1.33 1.28
T.06
Bosch Annual Report 201364
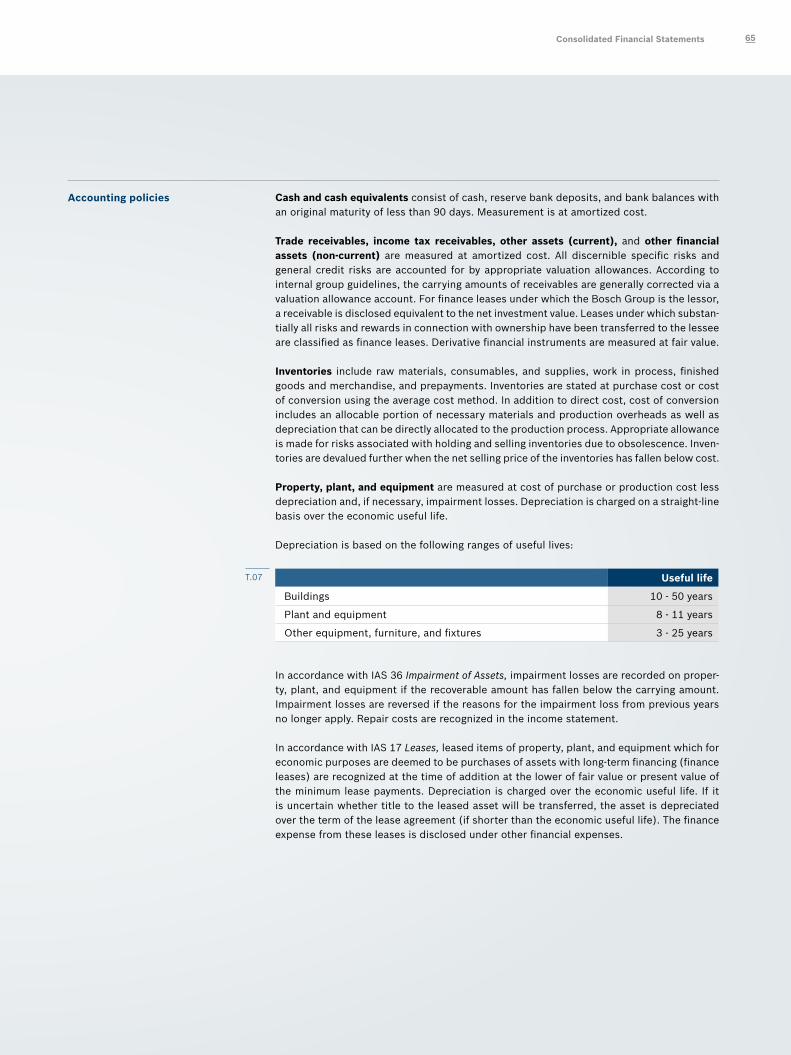
Accounting policies Cash and cash equivalents consist of cash, reserve bank deposits, and bank balances with an original maturity of less than 90 days. Measurement is at amortized cost.
Trade receivables, income tax receivables, other assets (current), and other financial assets (non-current) are measured at amortized cost. All discernible specific risks and general credit risks are accounted for by appropriate valuation allowances. According to internal group guidelines, the carrying amounts of receivables are generally corrected via a valuation allowance account. For finance leases under which the Bosch Group is the lessor, a receivable is disclosed equivalent to the net investment value. Leases under which substan-tially all risks and rewards in connection with ownership have been transferred to the lessee are classified as finance leases. Derivative financial instruments are measured at fair value.
Inventories include raw materials, consumables, and supplies, work in process, finished goods and merchandise, and prepayments. Inventories are stated at purchase cost or cost of conversion using the average cost method. In addition to direct cost, cost of conversion includes an allocable portion of necessary materials and production overheads as well as depreciation that can be directly allocated to the production process. Appropriate allowance is made for risks associated with holding and selling inventories due to obsolescence. Inven-tories are devalued further when the net selling price of the inventories has fallen below cost.
Property, plant, and equipment are measured at cost of purchase or production cost less depreciation and, if necessary, impairment losses. Depreciation is charged on a straight-line basis over the economic useful life.
Depreciation is based on the following ranges of useful lives:
Useful life
Buildings 10 - 50 years
Plant and equipment 8 - 11 years
Other equipment, furniture, and fixtures 3 - 25 years
In accordance with IAS 36 Impairment of Assets, impairment losses are recorded on proper-ty, plant, and equipment if the recoverable amount has fallen below the carrying amount. Impairment losses are reversed if the reasons for the impairment loss from previous years no longer apply. Repair costs are recognized in the income statement.
In accordance with IAS 17 Leases, leased items of property, plant, and equipment which for economic purposes are deemed to be purchases of assets with long-term financing (finance leases) are recognized at the time of addition at the lower of fair value or present value of the minimum lease payments. Depreciation is charged over the economic useful life. If it is uncertain whether title to the leased asset will be transferred, the asset is depreciated over the term of the lease agreement (if shorter than the economic useful life). The finance expense from these leases is disclosed under other financial expenses.
T.07
Consolidated Financial Statements 65
Investment property is measured at depreciated cost in accordance with IAS 40 Investment Property.
Government grants are only recognized pursuant to IAS 20 Accounting for Government Grants and Disclosure of Government Assistance if it is sufficiently certain that the assistance will be granted and the conditions attached to the assistance are satisfied. Grants related to assets are deducted in order to calculate the carrying amount of the asset. Grants related to income are recognized in the income statement of the period in which the expenses are incurred which the grants are intended to cover.
Purchased and internally generated intangible assets are capitalized pursuant to IAS 38 Intangible Assets if a future economic benefit will flow to the entity from the use of the asset and the cost of the asset can be reliably determined. These assets are generally carried at cost and amortized using the straight-line method over their economic useful life. As a rule, the useful life is four years. Intangible assets accounted for in the course of business combinations have a useful life of up to 20 years.
Borrowing costs incurred in connection with the acquisition, construction, or production of qualifying assets are included in the cost of this asset for the period of time until the asset is commissioned and subsequently written off with the asset concerned. Other borrowing costs are recorded as expenses.
Goodwill from business combinations represents the difference between the purchase price on the one hand and the pro-rata fair value of the equity at the time of acquisition on the other. Goodwill is allocated to the cash-generating units and tested annually for impairment. If the recoverable amount of the cash-generating unit does not cover the carrying amount of the net asset, impairment losses are charged in accordance with the requirements of IAS 36.
Pursuant to IFRS 1 First-time Adoption of International Financial Reporting Standards, goodwill existing as of January 1, 2004 (date of transition) was transferred at the carrying amount in accordance with the provisions of the German Commercial Code. Goodwill is also tested for impairment pursuant to the provisions of IAS 36.
Intangible assets with an indefinite useful life are tested annually for impairment. Intangible assets subject to wear and tear are only tested for impairment if there is any indication that they may be impaired. Impairment losses are recorded in accordance with IAS 36 Impairment of Assets if the recoverable amount of the asset concerned has fallen below the carrying amount. Impairment losses are reversed if the reasons for the impairment loss from previous years no longer apply.
Shares in jointly controlled entities are consolidated using the equity method. The carrying amount of these shares is subsequently measured in accordance with the change in equity of the jointly controlled entity attributable to the Bosch Group.
Bosch Annual Report 201366
Financial instrumentsA financial instrument is any contract that gives rise to a financial asset of one entity on the one hand and to a financial liability or equity instrument of a second entity on the other. As a rule, financial instruments are determined as of the settlement date. Financial instruments are accounted for at amortized cost or fair value. In the case of a financial asset or financial liability not accounted for at fair value through profit or loss, transaction costs that are directly attributable to the acquisition or issue of the financial asset or financial liability are taken into account.
When determining the fair value, the input factors of the valuation methods pursuant to IFRS 13 Fair Value Measurement are categorized as follows:
f Level 1: Quoted prices (unadjusted) in active markets for identical assets or liabilities that the accounting entity can access at the measurement date f Level 2: Inputs other than quoted prices included within level 1 that are observable for the asset or liability, either directly or indirectly f Level 3: Inputs that are not based on observable market data
The fair value of current financial assets and liabilities corresponds to the carrying amount.
Under IAS 39 Financial Instruments: Recognition and Measurement, the following categories of financial instruments are used in the Bosch Group:
fHeld-to-maturity investments f Loans and receivables f Financial liabilities measured at amortized cost f Assets and liabilities held for trading f Available-for-sale financial assets
The fair-value option pursuant to IAS 39 is not exercised.
Financial investments held to maturity, loans and receivables, and current and non-current financial liabilities are measured at amortized cost using the effective interest method. These are mainly loans, trade receivables, and current and non-current other financial assets and liabilities. Impairments of loans and receivables to allow for credit risks based on past experience are recognized in the form of specific and general doubtful debt allowances. When determining valuation allowances for the general credit risk, financial assets that could potentially be impaired are grouped together by similar credit risk characteristics and collectively tested for impairment and, if necessary, written down.
Financial assets and liabilities held for trading are measured at fair value. Changes in value are recognized in profit or loss. These are derivative financial instruments which are mainly used to limit currency, interest, and commodity risks in accordance with internal risk man-agement. Hedge accounting is not used in the Bosch Group.
Consolidated Financial Statements 67
Available-for-sale financial assets are those non-derivative financial assets that cannot be allocated to any of the preceding categories. They are carried at fair value. Unrealized gains and losses from changes in market value are disclosed in equity, net of deferred taxes, until they are realized. Interest received is generally recognized through profit and loss using the effective interest method. Dividends are recognized through profit and loss as soon as payment is legally enforceable. If impairment losses are necessary, the accumulated net loss is eliminated from equity and disclosed in profit or loss. If an impairment loss recorded on equity instruments is reversed in accordance with IAS 39, this is offset directly against equity. Reversals of impairment losses on debt instruments are recognized in profit or loss. They may not exceed the amount for which the impairment loss was recorded.
If the fair value of available-for-sale financial assets cannot be reliably determined, they are accounted for at acquisition cost. These are investments for which there is no active market. Necessary impairment losses are recognized in profit or loss and are not reversed.
As of the end of every reporting period, the carrying amounts of the financial assets which are not measured at fair value through profit or loss are examined for substantial objective indications that an asset may be impaired. Such indications may, for instance, be serious financial difficulties suffered by the debtor, the high probability that insolvency proceedings will be instituted against the debtor, the loss of an active market for the financial asset, a permanent drop in the fair value of the financial asset below amortized cost, or significant changes in the technological, economic, or legal environment, or in the market of the issuer. A possible impairment loss is given if the fair value of the asset is lower than the carrying amount. The fair value of loans and receivables is the present value of the estimated future cash flows discounted using the original effective interest rate.
In accordance with IAS 12 Income Taxes, deferred tax assets and liabilities are recorded for temporary differences between the tax carrying amounts and the carrying amounts in the consolidated statement of financial position unless they arise from the initial recognition of an asset or liability in a transaction that is not a business combination and, at the time of the transaction, affect neither the profit before tax nor the taxable profit. This also applies to unused tax losses and tax credits if there is assurance beyond reasonable doubt that future taxable profit will be available against which they can be utilized. The deferred tax item equals the estimated tax burden/relief in later periods. The tax rate applicable at the time of realization is taken as a basis. Tax implications from profit distributions are generally not considered until the resolution for the appropriation of profits has been adopted. If it is uncertain whether recognized deferred taxes can be realized, they are adjusted accordingly.
Non-current assets and liabilities held for sale are classified as held for sale if most of their carrying amount will be redeemed by a sale and the sale is highly likely to be effected. They are valued at the lower of carrying amount or fair value, less selling cost.
Liabilities are measured at amortized cost. Liabilities from finance leases are disclosed under other liabilities, at the present value of the future lease installments. The effective interest method is applied when measuring bonds.
Pursuant to IAS 19 Employee Benefits, pension provisions are recognized using the projected unit credit method, taking into account future estimated increases in pensions and salaries, among other things.
Bosch Annual Report 201368
Tax provisions pertain to obligations relating to income tax and other taxes. Deferred taxes are disclosed in separate positions of the statement of financial position.
Pursuant to IAS 37 Provisions, Contingent Liabilities, and Contingent Assets, other provisions are recognized if there is a current obligation from a past event which will probably lead to an outflow of resources in the future. In addition, it must be possible to reliably estimate the amount of this outflow. Other provisions are measured at full cost. Provisions due in more than one year are stated at their discounted settlement amount.
Revenue from the supply of products and goods or from the provision of services is recog-nized when title and risk is transferred to the purchaser, less sales deductions. Interest and lease income is recorded according to the contractual agreement and, where appropriate, accrued pro rata temporis. In the case of finance leases, the payments are divided up using actuarial methods.
Cost of sales contains the cost of internally manufactured goods and the cost price of resold merchandise. The production cost of internally manufactured goods contains materials and production cost that can be allocated directly, the allocable parts of indirect overheads, including the depreciation of production equipment and the amortization of other intangible assets, and the devaluation of inventories.
Development cost that cannot be recognized is charged against income in the period incurred.
Impact of changed accounting policies
From the beginning of the fiscal year 2013, jointly controlled entities are no longer consol-idated proportionately but by using the equity method. This amendment was made by way of exercising the option of IAS 31. Consolidation using the equity method provides more reliable information about the Bosch Group’s share in jointly controlled entities. Reporting on these entities to management has been changed accordingly.
In addition, the provisions of the revised IAS 19 were also applied from January 1, 2013. Without this change, the provision for pensions and similar obligations would have been EUR 31 million higher, the provision for early phased retirement EUR 88 million higher, and EBIT would have been EUR 46 million lower in the fiscal year 2013.
In accordance with IAS 8, the previous-year figures for the 2013 consolidated financial statements were presented on a comparable basis in the income statement, the statement of comprehensive income, the statement of financial position, the statement of changes in equity, the statement of cash flows, and the notes to the consolidated financial statements.
The effects of applying the equity method in accordance with IAS 31 and the amended provisions of IAS 19 are presented in the following tables.
Consolidated Financial Statements 69
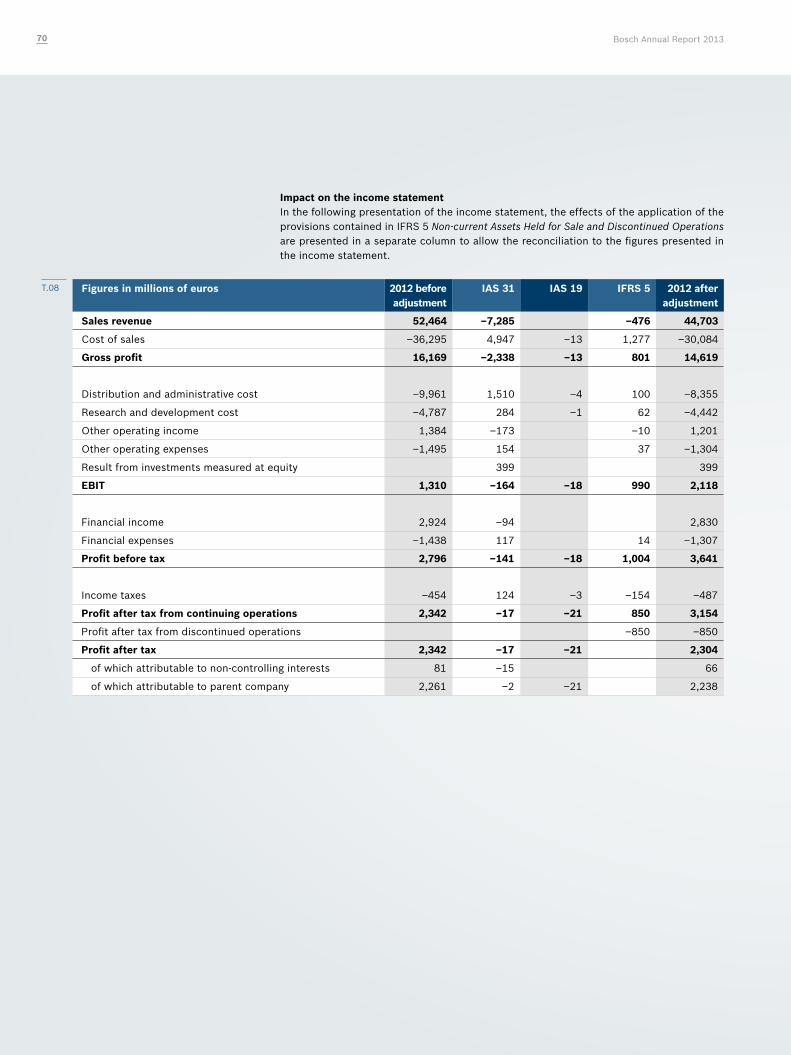
Impact on the income statementIn the following presentation of the income statement, the effects of the application of the provisions contained in IFRS 5 Non-current Assets Held for Sale and Discontinued Operations are presented in a separate column to allow the reconciliation to the figures presented in the income statement.
Figures in millions of euros 2012 before adjustment
IAS 31 IAS 19 IFRS 5 2012 after adjustment
Sales revenue 52,464 –7,285 –476 44,703
Cost of sales –36,295 4,947 –13 1,277 –30,084
Gross profit 16,169 –2,338 –13 801 14,619
Distribution and administrative cost –9,961 1,510 –4 100 –8,355
Research and development cost –4,787 284 –1 62 –4,442
Other operating income 1,384 –173 –10 1,201
Other operating expenses –1,495 154 37 –1,304
Result from investments measured at equity 399 399
EBIT 1,310 –164 –18 990 2,118
Financial income 2,924 –94 2,830
Financial expenses –1,438 117 14 –1,307
Profit before tax 2,796 –141 –18 1,004 3,641
Income taxes –454 124 –3 –154 –487
Profit after tax from continuing operations 2,342 –17 –21 850 3,154
Profit after tax from discontinued operations –850 –850
Profit after tax 2,342 –17 –21 2,304
of which attributable to non-controlling interests 81 –15 66
of which attributable to parent company 2,261 –2 –21 2,238
T.08
Bosch Annual Report 201370
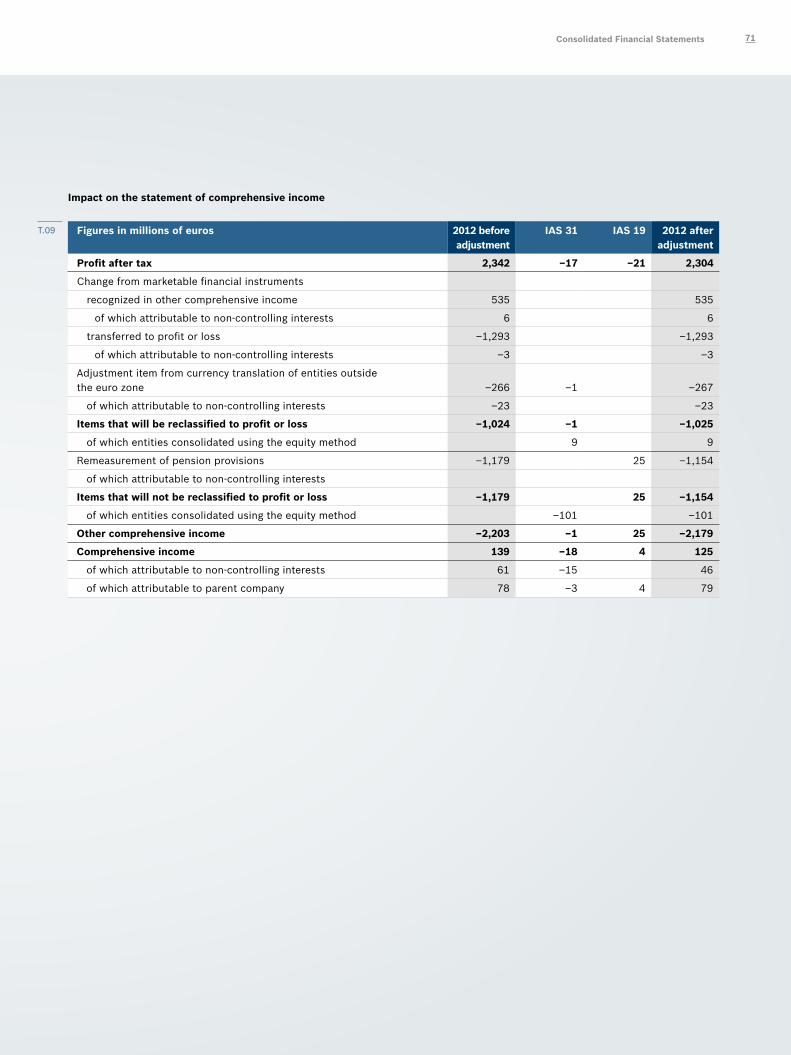
Impact on the statement of comprehensive income
Figures in millions of euros 2012 before adjustment
IAS 31 IAS 19 2012 after adjustment
Profit after tax 2,342 –17 –21 2,304
Change from marketable financial instruments
recognized in other comprehensive income 535 535
of which attributable to non-controlling interests 6 6
transferred to profit or loss –1,293 –1,293
of which attributable to non-controlling interests –3 –3
Adjustment item from currency translation of entities outside the euro zone –266 –1 –267
of which attributable to non-controlling interests –23 –23
Items that will be reclassified to profit or loss –1,024 –1 –1,025
of which entities consolidated using the equity method 9 9
Remeasurement of pension provisions –1,179 25 –1,154
of which attributable to non-controlling interests
Items that will not be reclassified to profit or loss –1,179 25 –1,154
of which entities consolidated using the equity method –101 –101
Other comprehensive income –2,203 –1 25 –2,179
Comprehensive income 139 –18 4 125
of which attributable to non-controlling interests 61 –15 46
of which attributable to parent company 78 –3 4 79
T.09
Consolidated Financial Statements 71
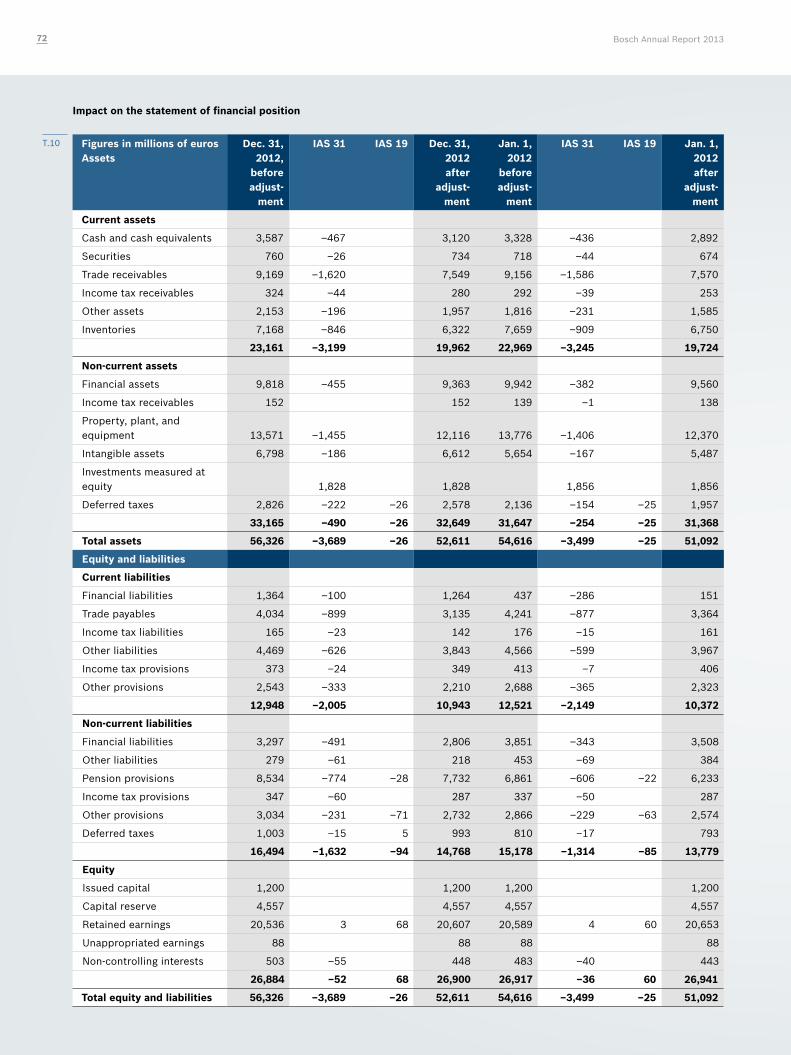
Impact on the statement of financial position
Figures in millions of euros Assets
Dec. 31, 2012,
before adjust-
ment
IAS 31 IAS 19 Dec. 31, 2012 after
adjust-ment
Jan. 1, 2012
before adjust-
ment
IAS 31 IAS 19 Jan. 1, 2012 after
adjust-ment
Current assets
Cash and cash equivalents 3,587 –467 3,120 3,328 –436 2,892
Securities 760 –26 734 718 –44 674
Trade receivables 9,169 –1,620 7,549 9,156 –1,586 7,570
Income tax receivables 324 –44 280 292 –39 253
Other assets 2,153 –196 1,957 1,816 –231 1,585
Inventories 7,168 –846 6,322 7,659 –909 6,750
23,161 –3,199 19,962 22,969 –3,245 19,724
Non-current assets
Financial assets 9,818 –455 9,363 9,942 –382 9,560
Income tax receivables 152 152 139 –1 138
Property, plant, and equipment 13,571 –1,455 12,116 13,776 –1,406 12,370
Intangible assets 6,798 –186 6,612 5,654 –167 5,487
Investments measured at equity 1,828 1,828 1,856 1,856
Deferred taxes 2,826 –222 –26 2,578 2,136 –154 –25 1,957
33,165 –490 –26 32,649 31,647 –254 –25 31,368
Total assets 56,326 –3,689 –26 52,611 54,616 –3,499 –25 51,092
Equity and liabilities
Current liabilities
Financial liabilities 1,364 –100 1,264 437 –286 151
Trade payables 4,034 –899 3,135 4,241 –877 3,364
Income tax liabilities 165 –23 142 176 –15 161
Other liabilities 4,469 –626 3,843 4,566 –599 3,967
Income tax provisions 373 –24 349 413 –7 406
Other provisions 2,543 –333 2,210 2,688 –365 2,323
12,948 –2,005 10,943 12,521 –2,149 10,372
Non-current liabilities
Financial liabilities 3,297 –491 2,806 3,851 –343 3,508
Other liabilities 279 –61 218 453 –69 384
Pension provisions 8,534 –774 –28 7,732 6,861 –606 –22 6,233
Income tax provisions 347 –60 287 337 –50 287
Other provisions 3,034 –231 –71 2,732 2,866 –229 –63 2,574
Deferred taxes 1,003 –15 5 993 810 –17 793
16,494 –1,632 –94 14,768 15,178 –1,314 –85 13,779
Equity
Issued capital 1,200 1,200 1,200 1,200
Capital reserve 4,557 4,557 4,557 4,557
Retained earnings 20,536 3 68 20,607 20,589 4 60 20,653
Unappropriated earnings 88 88 88 88
Non-controlling interests 503 –55 448 483 –40 443
26,884 –52 68 26,900 26,917 –36 60 26,941
Total equity and liabilities 56,326 –3,689 –26 52,611 54,616 –3,499 –25 51,092
T.10
Bosch Annual Report 201372
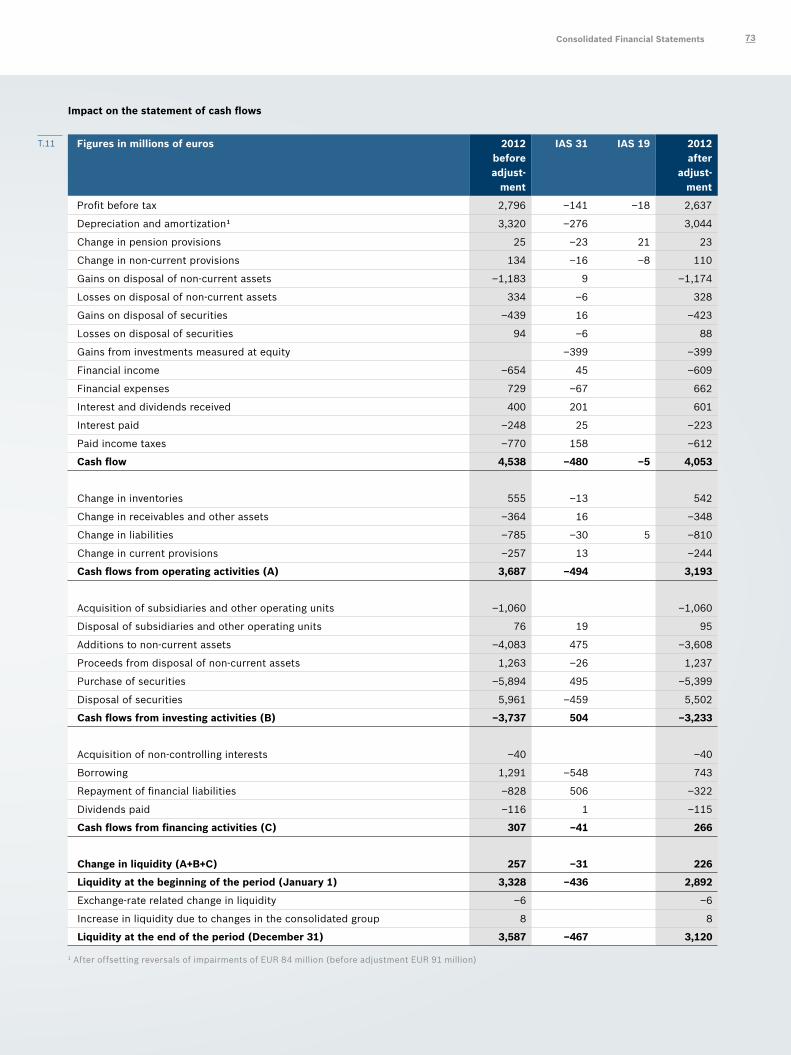
Impact on the statement of cash flows
Figures in millions of euros 2012 before adjust-
ment
IAS 31 IAS 19 2012 after
adjust-ment
Profit before tax 2,796 –141 –18 2,637
Depreciation and amortization¹ 3,320 –276 3,044
Change in pension provisions 25 –23 21 23
Change in non-current provisions 134 –16 –8 110
Gains on disposal of non-current assets –1,183 9 –1,174
Losses on disposal of non-current assets 334 –6 328
Gains on disposal of securities –439 16 –423
Losses on disposal of securities 94 –6 88
Gains from investments measured at equity –399 –399
Financial income –654 45 –609
Financial expenses 729 –67 662
Interest and dividends received 400 201 601
Interest paid –248 25 –223
Paid income taxes –770 158 –612
Cash flow 4,538 –480 –5 4,053
Change in inventories 555 –13 542
Change in receivables and other assets –364 16 –348
Change in liabilities –785 –30 5 –810
Change in current provisions –257 13 –244
Cash flows from operating activities (A) 3,687 –494 3,193
Acquisition of subsidiaries and other operating units –1,060 –1,060
Disposal of subsidiaries and other operating units 76 19 95
Additions to non-current assets –4,083 475 –3,608
Proceeds from disposal of non-current assets 1,263 –26 1,237
Purchase of securities –5,894 495 –5,399
Disposal of securities 5,961 –459 5,502
Cash flows from investing activities (B) –3,737 504 –3,233
Acquisition of non-controlling interests –40 –40
Borrowing 1,291 –548 743
Repayment of financial liabilities –828 506 –322
Dividends paid –116 1 –115
Cash flows from financing activities (C) 307 –41 266
Change in liquidity (A+B+C) 257 –31 226
Liquidity at the beginning of the period (January 1) 3,328 –436 2,892
Exchange-rate related change in liquidity –6 –6
Increase in liquidity due to changes in the consolidated group 8 8
Liquidity at the end of the period (December 31) 3,587 –467 3,120
1 After offsetting reversals of impairments of EUR 84 million (before adjustment EUR 91 million)
T.11
Consolidated Financial Statements 73
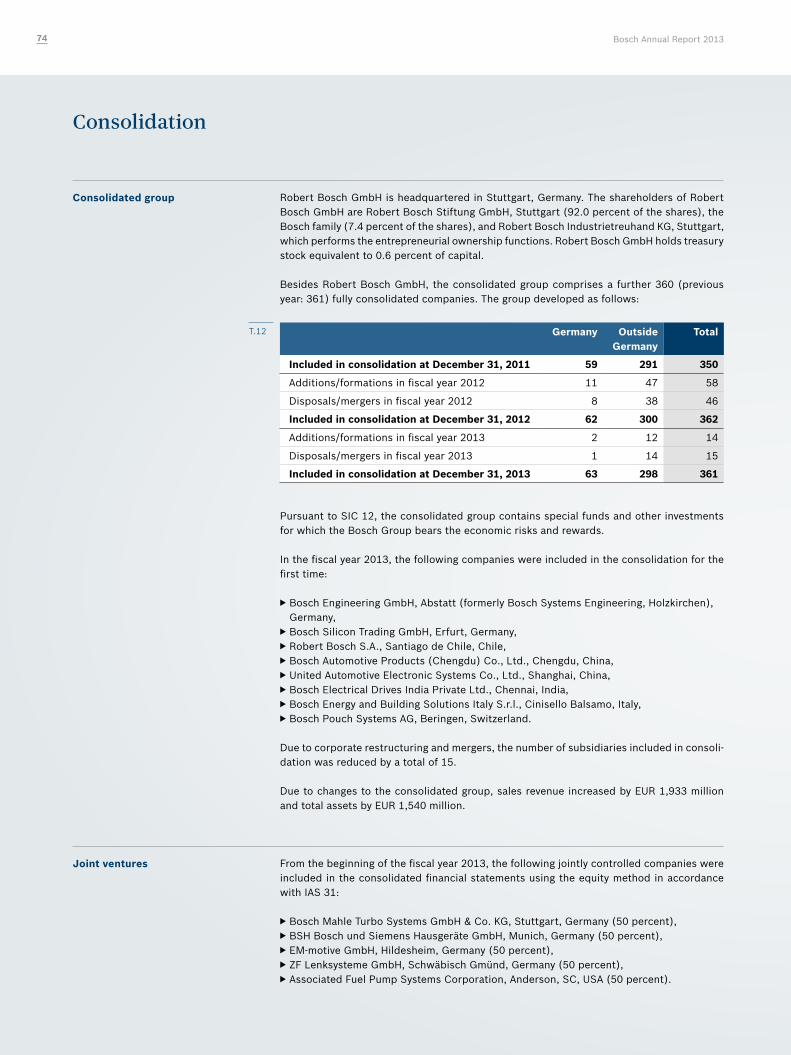
Consolidation
Consolidated group Robert Bosch GmbH is headquartered in Stuttgart, Germany. The shareholders of Robert Bosch GmbH are Robert Bosch Stiftung GmbH, Stuttgart (92.0 percent of the shares), the Bosch family (7.4 percent of the shares), and Robert Bosch Industrietreuhand KG, Stuttgart, which performs the entrepreneurial ownership functions. Robert Bosch GmbH holds treasury stock equivalent to 0.6 percent of capital. Besides Robert Bosch GmbH, the consolidated group comprises a further 360 (previous year: 361) fully consolidated companies. The group developed as follows:
Germany Outside Germany
Total
Included in consolidation at December 31, 2011 59 291 350
Additions/formations in fiscal year 2012 11 47 58
Disposals/mergers in fiscal year 2012 8 38 46
Included in consolidation at December 31, 2012 62 300 362
Additions/formations in fiscal year 2013 2 12 14
Disposals/mergers in fiscal year 2013 1 14 15
Included in consolidation at December 31, 2013 63 298 361
Pursuant to SIC 12, the consolidated group contains special funds and other investments for which the Bosch Group bears the economic risks and rewards.
In the fiscal year 2013, the following companies were included in the consolidation for the first time:
f Bosch Engineering GmbH, Abstatt (formerly Bosch Systems Engineering, Holzkirchen), Germany, f Bosch Silicon Trading GmbH, Erfurt, Germany, f Robert Bosch S.A., Santiago de Chile, Chile, f Bosch Automotive Products (Chengdu) Co., Ltd., Chengdu, China, f United Automotive Electronic Systems Co., Ltd., Shanghai, China, f Bosch Electrical Drives India Private Ltd., Chennai, India, f Bosch Energy and Building Solutions Italy S.r.l., Cinisello Balsamo, Italy, f Bosch Pouch Systems AG, Beringen, Switzerland.
Due to corporate restructuring and mergers, the number of subsidiaries included in consoli- dation was reduced by a total of 15.
Due to changes to the consolidated group, sales revenue increased by EUR 1,933 million and total assets by EUR 1,540 million.
Joint ventures From the beginning of the fiscal year 2013, the following jointly controlled companies were included in the consolidated financial statements using the equity method in accordance with IAS 31:
f Bosch Mahle Turbo Systems GmbH & Co. KG, Stuttgart, Germany (50 percent), f BSH Bosch und Siemens Hausgeräte GmbH, Munich, Germany (50 percent), f EM-motive GmbH, Hildesheim, Germany (50 percent), f ZF Lenksysteme GmbH, Schwäbisch Gmünd, Germany (50 percent), f Associated Fuel Pump Systems Corporation, Anderson, SC, USA (50 percent).
T.12
Bosch Annual Report 201374
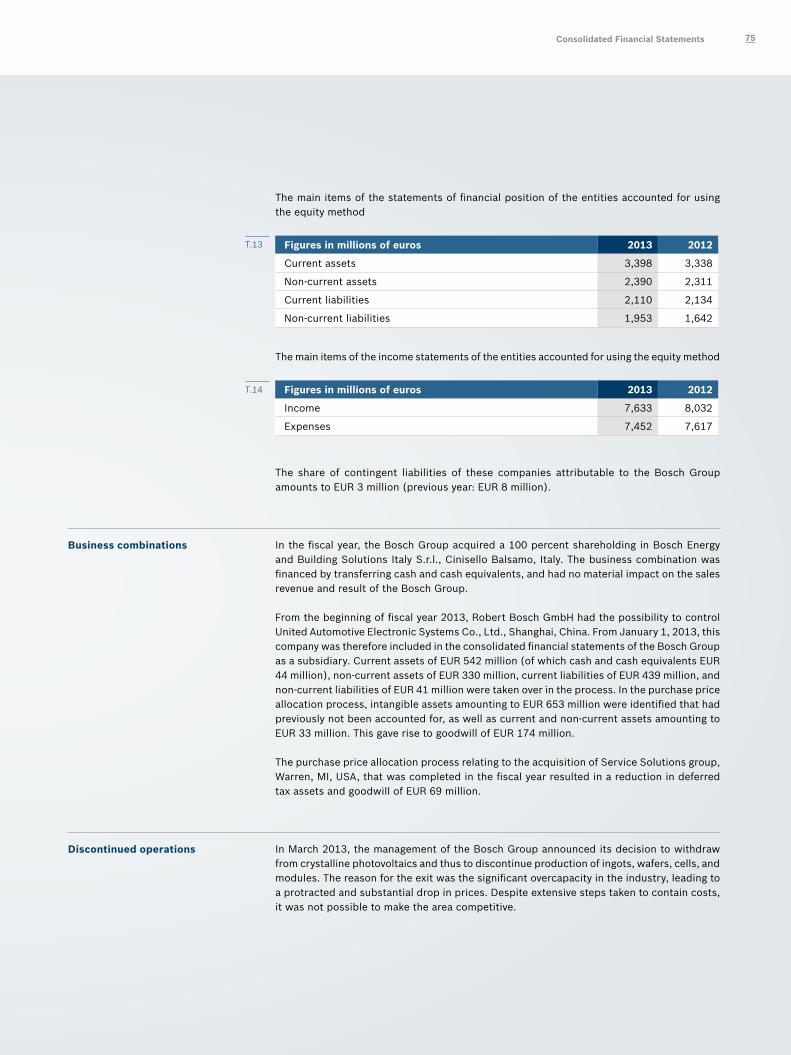
The main items of the statements of financial position of the entities accounted for using the equity method
Figures in millions of euros 2013 2012
Current assets 3,398 3,338
Non-current assets 2,390 2,311
Current liabilities 2,110 2,134
Non-current liabilities 1,953 1,642
The main items of the income statements of the entities accounted for using the equity method
Figures in millions of euros 2013 2012
Income 7,633 8,032
Expenses 7,452 7,617
The share of contingent liabilities of these companies attributable to the Bosch Group amounts to EUR 3 million (previous year: EUR 8 million).
Business combinations In the fiscal year, the Bosch Group acquired a 100 percent shareholding in Bosch Energy and Building Solutions Italy S.r.l., Cinisello Balsamo, Italy. The business combination was financed by transferring cash and cash equivalents, and had no material impact on the sales revenue and result of the Bosch Group.
From the beginning of fiscal year 2013, Robert Bosch GmbH had the possibility to control United Automotive Electronic Systems Co., Ltd., Shanghai, China. From January 1, 2013, this company was therefore included in the consolidated financial statements of the Bosch Group as a subsidiary. Current assets of EUR 542 million (of which cash and cash equivalents EUR 44 million), non-current assets of EUR 330 million, current liabilities of EUR 439 million, and non-current liabilities of EUR 41 million were taken over in the process. In the purchase price allocation process, intangible assets amounting to EUR 653 million were identified that had previously not been accounted for, as well as current and non-current assets amounting to EUR 33 million. This gave rise to goodwill of EUR 174 million.
The purchase price allocation process relating to the acquisition of Service Solutions group, Warren, MI, USA, that was completed in the fiscal year resulted in a reduction in deferred tax assets and goodwill of EUR 69 million.
Discontinued operations In March 2013, the management of the Bosch Group announced its decision to withdraw from crystalline photovoltaics and thus to discontinue production of ingots, wafers, cells, and modules. The reason for the exit was the significant overcapacity in the industry, leading to a protracted and substantial drop in prices. Despite extensive steps taken to contain costs, it was not possible to make the area competitive.
T.13
T.14
Consolidated Financial Statements 75
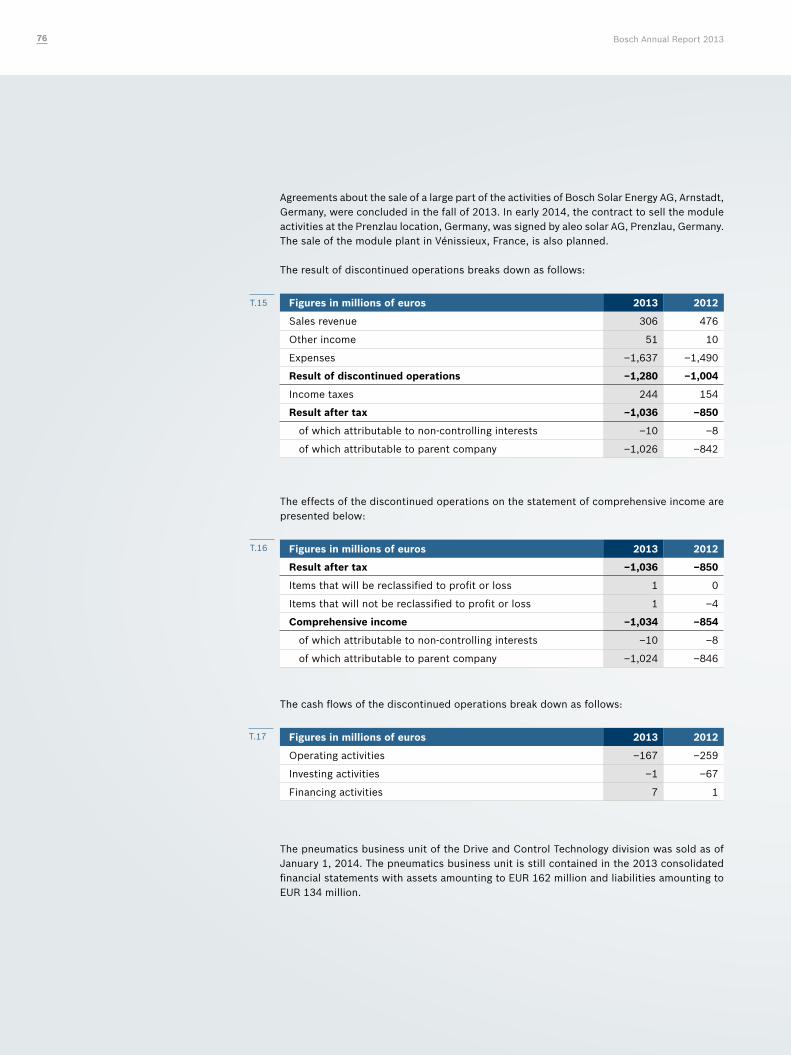
Agreements about the sale of a large part of the activities of Bosch Solar Energy AG, Arnstadt, Germany, were concluded in the fall of 2013. In early 2014, the contract to sell the module activities at the Prenzlau location, Germany, was signed by aleo solar AG, Prenzlau, Germany. The sale of the module plant in Vénissieux, France, is also planned.
The result of discontinued operations breaks down as follows:
Figures in millions of euros 2013 2012
Sales revenue 306 476
Other income 51 10
Expenses –1,637 –1,490
Result of discontinued operations –1,280 –1,004
Income taxes 244 154
Result after tax –1,036 –850
of which attributable to non-controlling interests –10 –8
of which attributable to parent company –1,026 –842
The effects of the discontinued operations on the statement of comprehensive income are presented below:
Figures in millions of euros 2013 2012
Result after tax –1,036 –850
Items that will be reclassified to profit or loss 1 0
Items that will not be reclassified to profit or loss 1 –4
Comprehensive income –1,034 –854
of which attributable to non-controlling interests –10 –8
of which attributable to parent company –1,024 –846
The cash flows of the discontinued operations break down as follows:
Figures in millions of euros 2013 2012
Operating activities –167 –259
Investing activities –1 –67
Financing activities 7 1
The pneumatics business unit of the Drive and Control Technology division was sold as of January 1, 2014. The pneumatics business unit is still contained in the 2013 consolidated financial statements with assets amounting to EUR 162 million and liabilities amounting to EUR 134 million.
T.15
T.16
T.17
Bosch Annual Report 201376
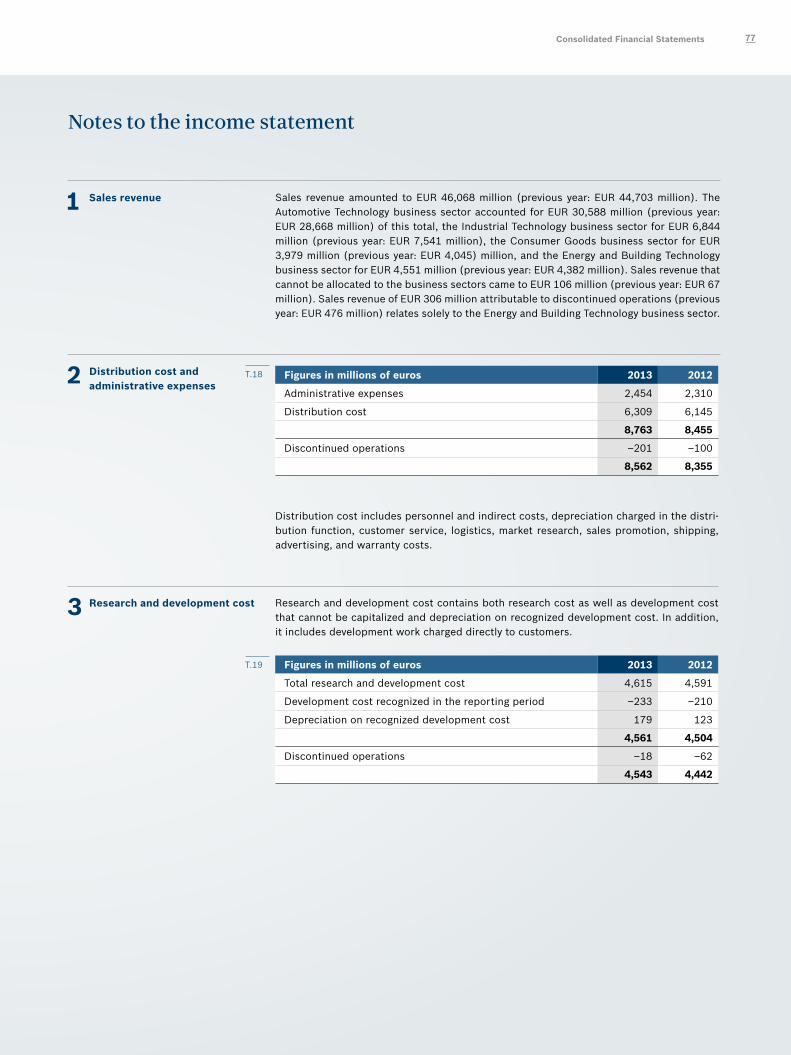
Notes to the income statement
1 Sales revenue Sales revenue amounted to EUR 46,068 million (previous year: EUR 44,703 million). The Automotive Technology business sector accounted for EUR 30,588 million (previous year: EUR 28,668 million) of this total, the Industrial Technology business sector for EUR 6,844 million (previous year: EUR 7,541 million), the Consumer Goods business sector for EUR 3,979 million (previous year: EUR 4,045) million, and the Energy and Building Technology business sector for EUR 4,551 million (previous year: EUR 4,382 million). Sales revenue that cannot be allocated to the business sectors came to EUR 106 million (previous year: EUR 67 million). Sales revenue of EUR 306 million attributable to discontinued operations (previous year: EUR 476 million) relates solely to the Energy and Building Technology business sector.
2 Distribution cost and administrative expenses
Figures in millions of euros 2013 2012
Administrative expenses 2,454 2,310
Distribution cost 6,309 6,145
8,763 8,455
Discontinued operations –201 –100
8,562 8,355
Distribution cost includes personnel and indirect costs, depreciation charged in the distri-bution function, customer service, logistics, market research, sales promotion, shipping, advertising, and warranty costs.
3 Research and development cost Research and development cost contains both research cost as well as development cost that cannot be capitalized and depreciation on recognized development cost. In addition, it includes development work charged directly to customers.
Figures in millions of euros 2013 2012
Total research and development cost 4,615 4,591
Development cost recognized in the reporting period –233 –210
Depreciation on recognized development cost 179 123
4,561 4,504
Discontinued operations –18 –62
4,543 4,442
T.18
T.19
Consolidated Financial Statements 77
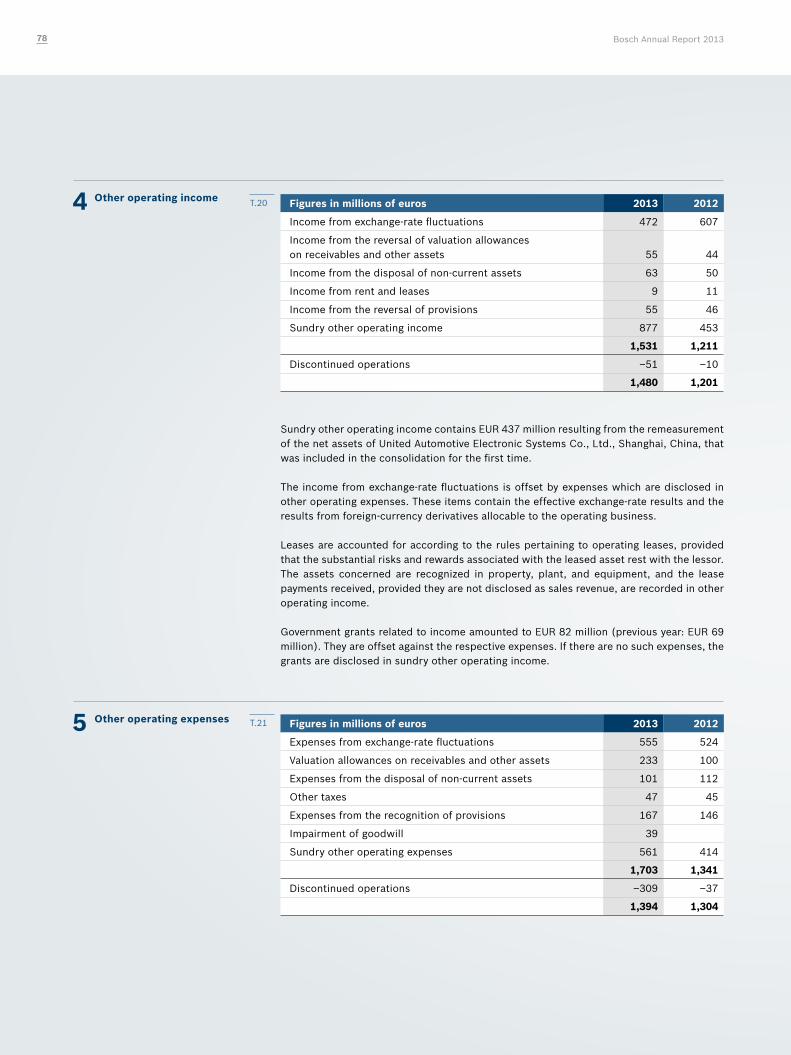
4 Other operating income Figures in millions of euros 2013 2012
Income from exchange-rate fluctuations 472 607
Income from the reversal of valuation allowances on receivables and other assets 55 44
Income from the disposal of non-current assets 63 50
Income from rent and leases 9 11
Income from the reversal of provisions 55 46
Sundry other operating income 877 453
1,531 1,211
Discontinued operations –51 –10
1,480 1,201
Sundry other operating income contains EUR 437 million resulting from the remeasurement of the net assets of United Automotive Electronic Systems Co., Ltd., Shanghai, China, that was included in the consolidation for the first time. The income from exchange-rate fluctuations is offset by expenses which are disclosed in other operating expenses. These items contain the effective exchange-rate results and the results from foreign-currency derivatives allocable to the operating business. Leases are accounted for according to the rules pertaining to operating leases, provided that the substantial risks and rewards associated with the leased asset rest with the lessor. The assets concerned are recognized in property, plant, and equipment, and the lease payments received, provided they are not disclosed as sales revenue, are recorded in other operating income. Government grants related to income amounted to EUR 82 million (previous year: EUR 69 million). They are offset against the respective expenses. If there are no such expenses, the grants are disclosed in sundry other operating income.
5 Other operating expenses Figures in millions of euros 2013 2012
Expenses from exchange-rate fluctuations 555 524
Valuation allowances on receivables and other assets 233 100
Expenses from the disposal of non-current assets 101 112
Other taxes 47 45
Expenses from the recognition of provisions 167 146
Impairment of goodwill 39
Sundry other operating expenses 561 414
1,703 1,341
Discontinued operations –309 –37
1,394 1,304
T.20
T.21
Bosch Annual Report 201378
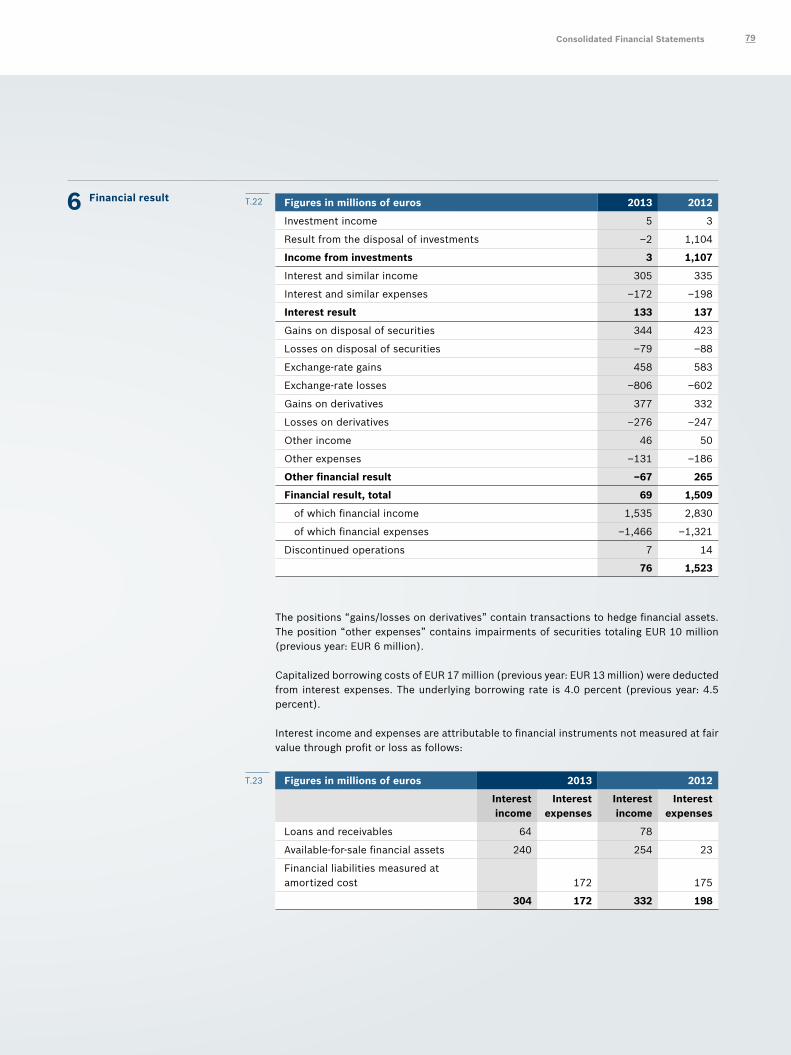
6 Financial result Figures in millions of euros 2013 2012
Investment income 5 3
Result from the disposal of investments –2 1,104
Income from investments 3 1,107
Interest and similar income 305 335
Interest and similar expenses –172 –198
Interest result 133 137
Gains on disposal of securities 344 423
Losses on disposal of securities –79 –88
Exchange-rate gains 458 583
Exchange-rate losses –806 –602
Gains on derivatives 377 332
Losses on derivatives –276 –247
Other income 46 50
Other expenses –131 –186
Other financial result –67 265
Financial result, total 69 1,509
of which financial income 1,535 2,830
of which financial expenses –1,466 –1,321
Discontinued operations 7 14
76 1,523
The positions “gains/losses on derivatives” contain transactions to hedge financial assets. The position “other expenses” contains impairments of securities totaling EUR 10 million (previous year: EUR 6 million).
Capitalized borrowing costs of EUR 17 million (previous year: EUR 13 million) were deducted from interest expenses. The underlying borrowing rate is 4.0 percent (previous year: 4.5 percent).
Interest income and expenses are attributable to financial instruments not measured at fair value through profit or loss as follows:
Figures in millions of euros 2013 2012
Interest income
Interest expenses
Interest income
Interest expenses
Loans and receivables 64 78
Available-for-sale financial assets 240 254 23
Financial liabilities measured at amortized cost 172 175
304 172 332 198
T.22
T.23
Consolidated Financial Statements 79
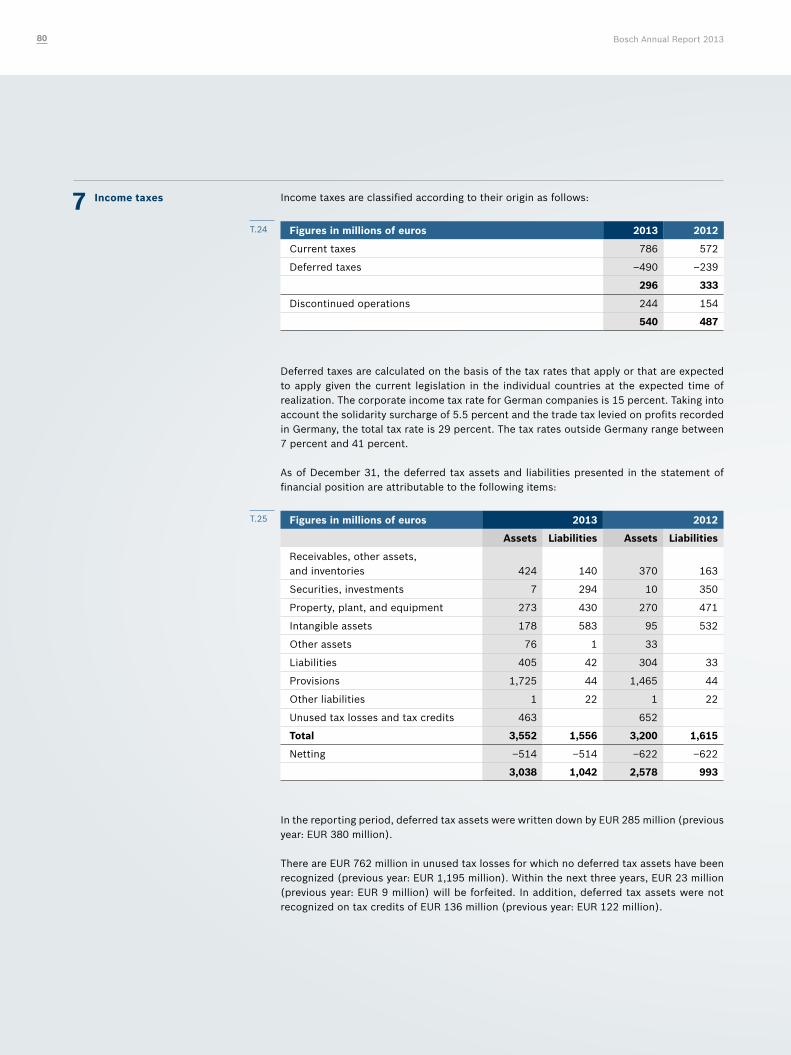
7 Income taxes Income taxes are classified according to their origin as follows:
Figures in millions of euros 2013 2012
Current taxes 786 572
Deferred taxes –490 –239
296 333
Discontinued operations 244 154
540 487
Deferred taxes are calculated on the basis of the tax rates that apply or that are expected to apply given the current legislation in the individual countries at the expected time of realization. The corporate income tax rate for German companies is 15 percent. Taking into account the solidarity surcharge of 5.5 percent and the trade tax levied on profits recorded in Germany, the total tax rate is 29 percent. The tax rates outside Germany range between 7 percent and 41 percent.
As of December 31, the deferred tax assets and liabilities presented in the statement of financial position are attributable to the following items:
Figures in millions of euros 2013 2012
Assets Liabilities Assets Liabilities
Receivables, other assets, and inventories 424 140 370 163
Securities, investments 7 294 10 350
Property, plant, and equipment 273 430 270 471
Intangible assets 178 583 95 532
Other assets 76 1 33
Liabilities 405 42 304 33
Provisions 1,725 44 1,465 44
Other liabilities 1 22 1 22
Unused tax losses and tax credits 463 652
Total 3,552 1,556 3,200 1,615
Netting –514 –514 –622 –622
3,038 1,042 2,578 993
In the reporting period, deferred tax assets were written down by EUR 285 million (previous year: EUR 380 million). There are EUR 762 million in unused tax losses for which no deferred tax assets have been recognized (previous year: EUR 1,195 million). Within the next three years, EUR 23 million (previous year: EUR 9 million) will be forfeited. In addition, deferred tax assets were not recognized on tax credits of EUR 136 million (previous year: EUR 122 million).
T.24
T.25
Bosch Annual Report 201380
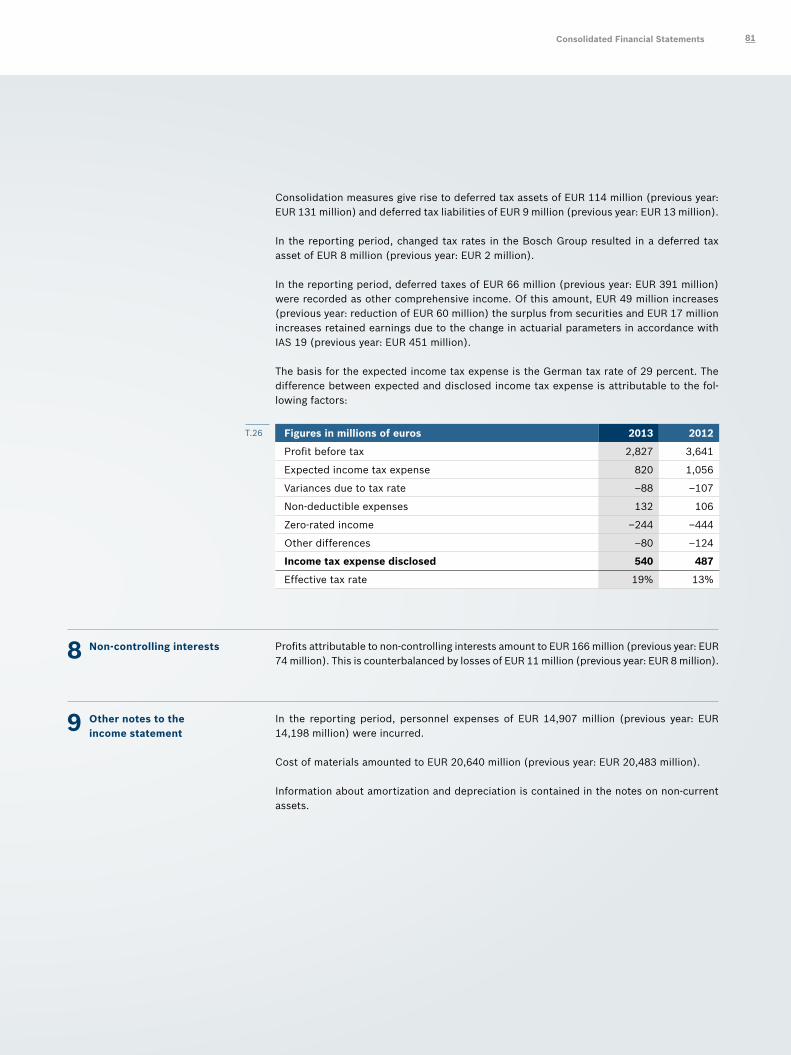
Consolidation measures give rise to deferred tax assets of EUR 114 million (previous year: EUR 131 million) and deferred tax liabilities of EUR 9 million (previous year: EUR 13 million). In the reporting period, changed tax rates in the Bosch Group resulted in a deferred tax asset of EUR 8 million (previous year: EUR 2 million). In the reporting period, deferred taxes of EUR 66 million (previous year: EUR 391 million) were recorded as other comprehensive income. Of this amount, EUR 49 million increases (previous year: reduction of EUR 60 million) the surplus from securities and EUR 17 million increases retained earnings due to the change in actuarial parameters in accordance with IAS 19 (previous year: EUR 451 million).
The basis for the expected income tax expense is the German tax rate of 29 percent. The difference between expected and disclosed income tax expense is attributable to the fol-lowing factors:
Figures in millions of euros 2013 2012
Profit before tax 2,827 3,641
Expected income tax expense 820 1,056
Variances due to tax rate –88 –107
Non-deductible expenses 132 106
Zero-rated income –244 –444
Other differences –80 –124
Income tax expense disclosed 540 487
Effective tax rate 19% 13%
8 Non-controlling interests Profits attributable to non-controlling interests amount to EUR 166 million (previous year: EUR 74 million). This is counterbalanced by losses of EUR 11 million (previous year: EUR 8 million).
9 Other notes to the income statement
In the reporting period, personnel expenses of EUR 14,907 million (previous year: EUR 14,198 million) were incurred. Cost of materials amounted to EUR 20,640 million (previous year: EUR 20,483 million). Information about amortization and depreciation is contained in the notes on non-current assets.
T.26
Consolidated Financial Statements 81
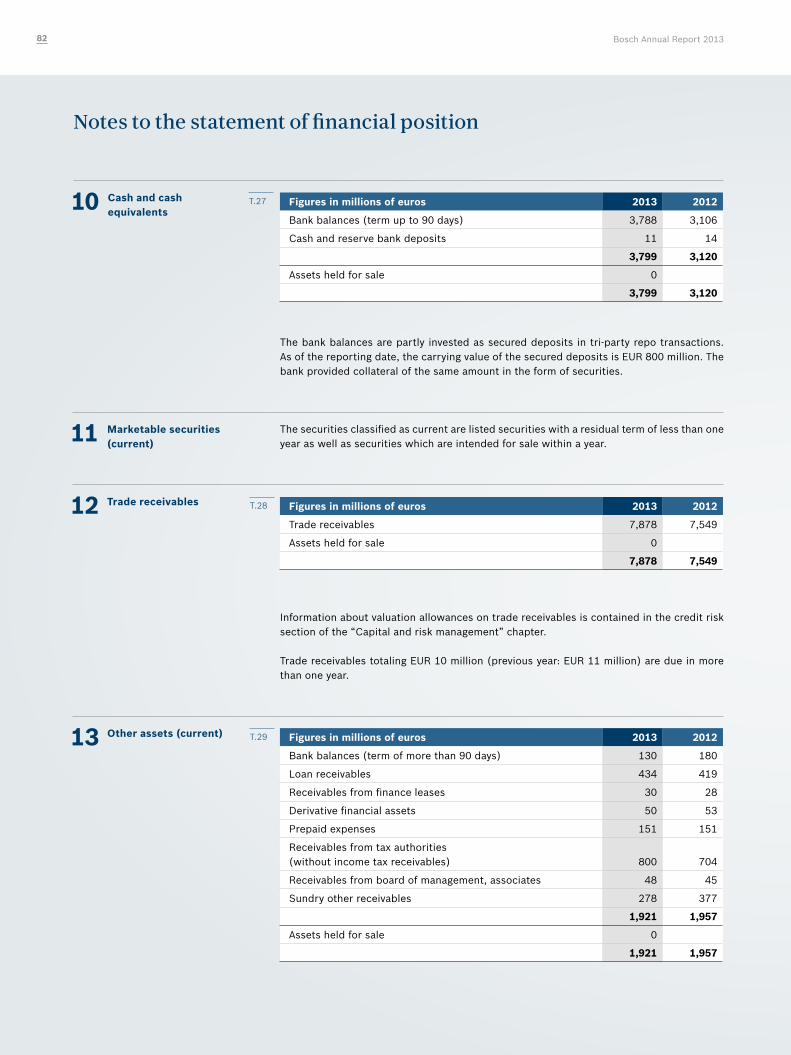
Notes to the statement of financial position
10 Cash and cash equivalents
Figures in millions of euros 2013 2012
Bank balances (term up to 90 days) 3,788 3,106
Cash and reserve bank deposits 11 14
3,799 3,120
Assets held for sale 0
3,799 3,120
The bank balances are partly invested as secured deposits in tri-party repo transactions. As of the reporting date, the carrying value of the secured deposits is EUR 800 million. The bank provided collateral of the same amount in the form of securities.
11 Marketable securities (current)
The securities classified as current are listed securities with a residual term of less than one year as well as securities which are intended for sale within a year.
12 Trade receivables Figures in millions of euros 2013 2012
Trade receivables 7,878 7,549
Assets held for sale 0
7,878 7,549
Information about valuation allowances on trade receivables is contained in the credit risk section of the “Capital and risk management” chapter. Trade receivables totaling EUR 10 million (previous year: EUR 11 million) are due in more than one year.
13 Other assets (current) Figures in millions of euros 2013 2012
Bank balances (term of more than 90 days) 130 180
Loan receivables 434 419
Receivables from finance leases 30 28
Derivative financial assets 50 53
Prepaid expenses 151 151
Receivables from tax authorities (without income tax receivables) 800 704
Receivables from board of management, associates 48 45
Sundry other receivables 278 377
1,921 1,957
Assets held for sale 0
1,921 1,957
T.27
T.28
T.29
Bosch Annual Report 201382
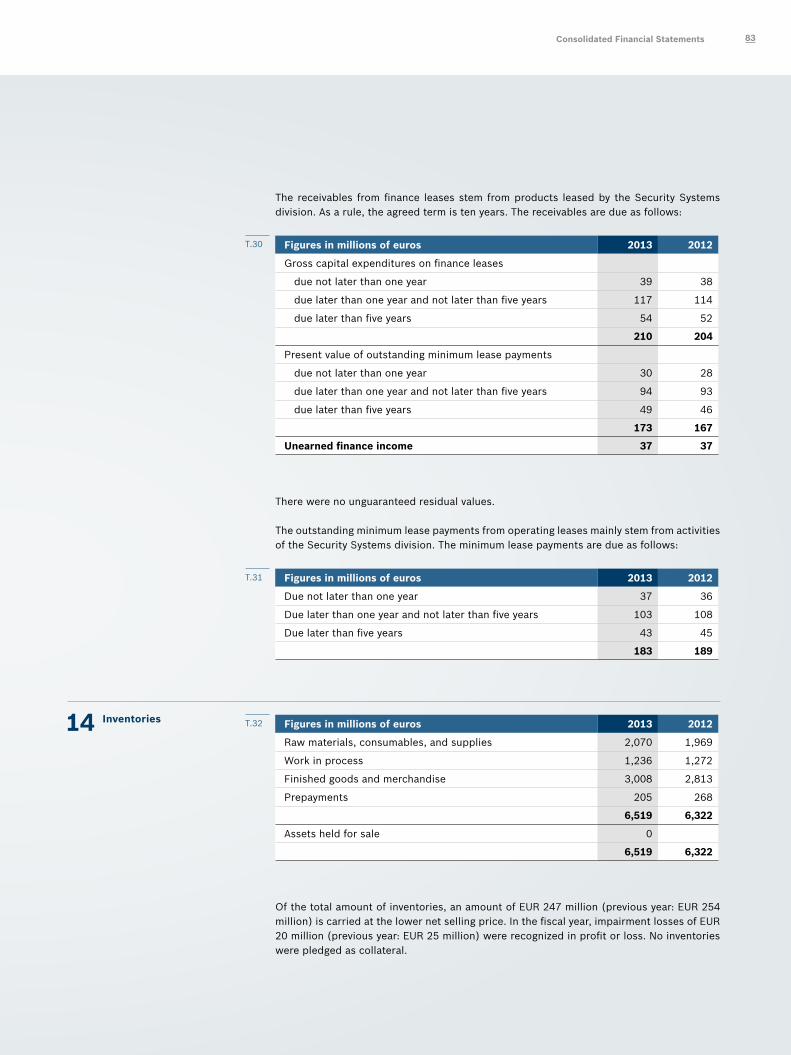
The receivables from finance leases stem from products leased by the Security Systems division. As a rule, the agreed term is ten years. The receivables are due as follows:
Figures in millions of euros 2013 2012
Gross capital expenditures on finance leases
due not later than one year 39 38
due later than one year and not later than five years 117 114
due later than five years 54 52
210 204
Present value of outstanding minimum lease payments
due not later than one year 30 28
due later than one year and not later than five years 94 93
due later than five years 49 46
173 167
Unearned finance income 37 37
There were no unguaranteed residual values.
The outstanding minimum lease payments from operating leases mainly stem from activities of the Security Systems division. The minimum lease payments are due as follows:
Figures in millions of euros 2013 2012
Due not later than one year 37 36
Due later than one year and not later than five years 103 108
Due later than five years 43 45
183 189
14 Inventories Figures in millions of euros 2013 2012
Raw materials, consumables, and supplies 2,070 1,969
Work in process 1,236 1,272
Finished goods and merchandise 3,008 2,813
Prepayments 205 268
6,519 6,322
Assets held for sale 0
6,519 6,322
Of the total amount of inventories, an amount of EUR 247 million (previous year: EUR 254 million) is carried at the lower net selling price. In the fiscal year, impairment losses of EUR 20 million (previous year: EUR 25 million) were recognized in profit or loss. No inventories were pledged as collateral.
T.30
T.31
T.32
Consolidated Financial Statements 83
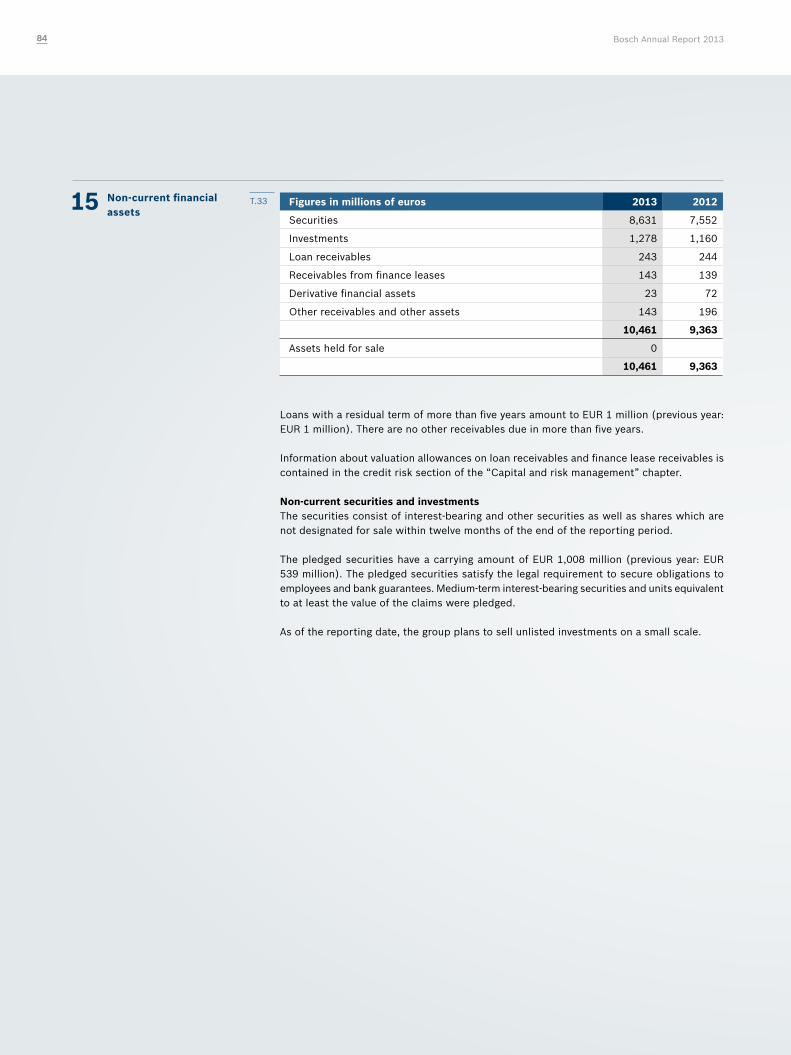
15 Non-current financial assets
Figures in millions of euros 2013 2012
Securities 8,631 7,552
Investments 1,278 1,160
Loan receivables 243 244
Receivables from finance leases 143 139
Derivative financial assets 23 72
Other receivables and other assets 143 196
10,461 9,363
Assets held for sale 0
10,461 9,363
Loans with a residual term of more than five years amount to EUR 1 million (previous year: EUR 1 million). There are no other receivables due in more than five years.
Information about valuation allowances on loan receivables and finance lease receivables is contained in the credit risk section of the “Capital and risk management” chapter.
Non-current securities and investmentsThe securities consist of interest-bearing and other securities as well as shares which are not designated for sale within twelve months of the end of the reporting period.
The pledged securities have a carrying amount of EUR 1,008 million (previous year: EUR 539 million). The pledged securities satisfy the legal requirement to secure obligations to employees and bank guarantees. Medium-term interest-bearing securities and units equivalent to at least the value of the claims were pledged.
As of the reporting date, the group plans to sell unlisted investments on a small scale.
T.33
Bosch Annual Report 201384
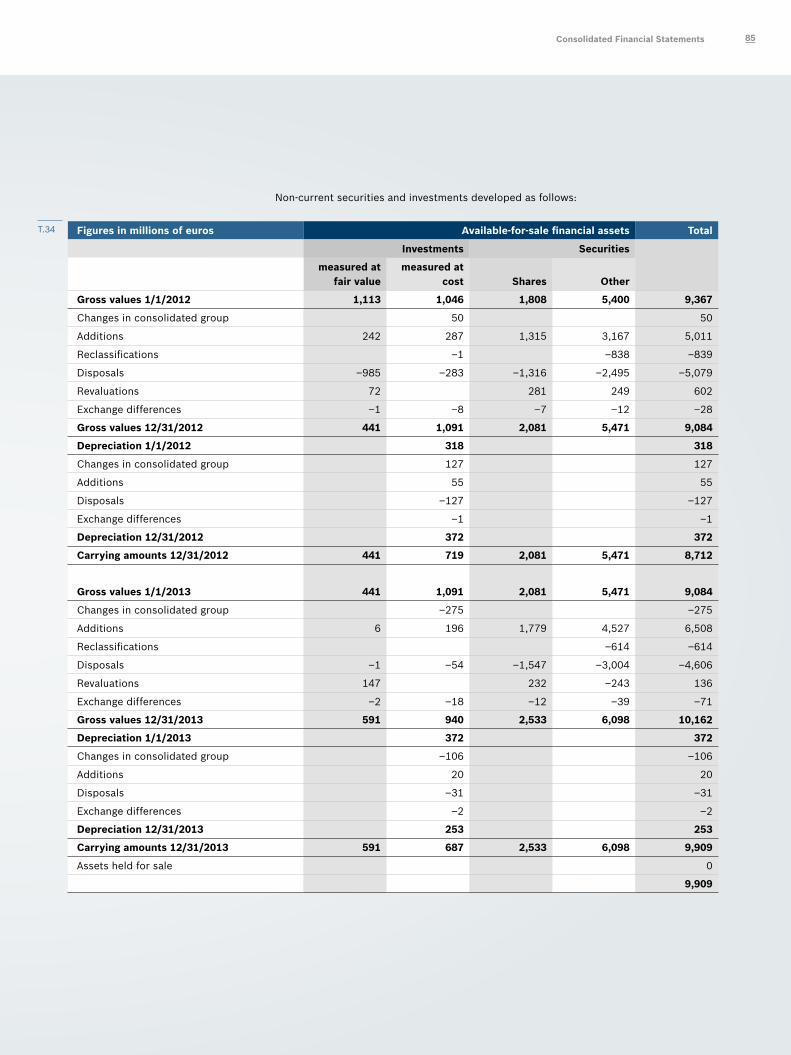
Non-current securities and investments developed as follows:
Figures in millions of euros Available-for-sale financial assets Total
Investments Securities
measured at
fair valuemeasured at
cost Shares Other
Gross values 1/1/2012 1,113 1,046 1,808 5,400 9,367
Changes in consolidated group 50 50
Additions 242 287 1,315 3,167 5,011
Reclassifications –1 –838 –839
Disposals –985 –283 –1,316 –2,495 –5,079
Revaluations 72 281 249 602
Exchange differences –1 –8 –7 –12 –28
Gross values 12/31/2012 441 1,091 2,081 5,471 9,084
Depreciation 1/1/2012 318 318
Changes in consolidated group 127 127
Additions 55 55
Disposals –127 –127
Exchange differences –1 –1
Depreciation 12/31/2012 372 372
Carrying amounts 12/31/2012 441 719 2,081 5,471 8,712
Gross values 1/1/2013 441 1,091 2,081 5,471 9,084
Changes in consolidated group –275 –275
Additions 6 196 1,779 4,527 6,508
Reclassifications –614 –614
Disposals –1 –54 –1,547 –3,004 –4,606
Revaluations 147 232 –243 136
Exchange differences –2 –18 –12 –39 –71
Gross values 12/31/2013 591 940 2,533 6,098 10,162
Depreciation 1/1/2013 372 372
Changes in consolidated group –106 –106
Additions 20 20
Disposals –31 –31
Exchange differences –2 –2
Depreciation 12/31/2013 253 253
Carrying amounts 12/31/2013 591 687 2,533 6,098 9,909
Assets held for sale 0
9,909
T.34
Consolidated Financial Statements 85
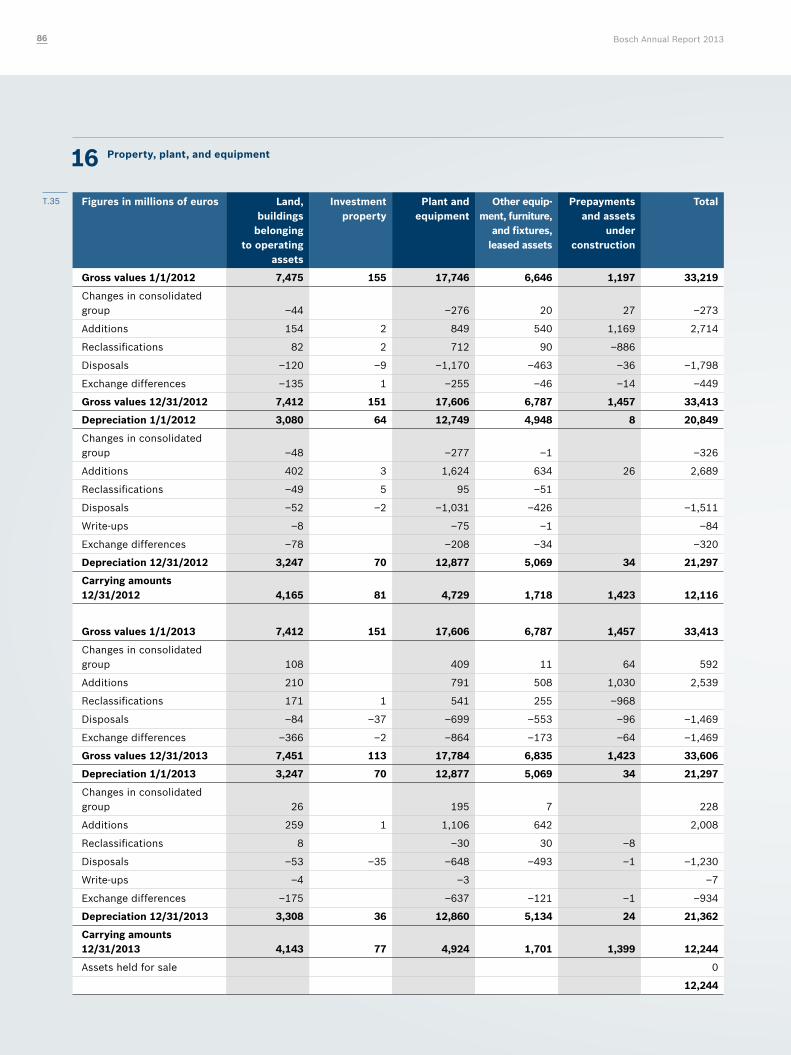
16 Property, plant, and equipment
Figures in millions of euros Land, buildings
belonging to operating
assets
Investment property
Plant and equipment
Other equip-ment, furniture,
and fixtures, leased assets
Prepayments and assets
under construction
Total
Gross values 1/1/2012 7,475 155 17,746 6,646 1,197 33,219
Changes in consolidated group –44 –276 20 27 –273
Additions 154 2 849 540 1,169 2,714
Reclassifications 82 2 712 90 –886
Disposals –120 –9 –1,170 –463 –36 –1,798
Exchange differences –135 1 –255 –46 –14 –449
Gross values 12/31/2012 7,412 151 17,606 6,787 1,457 33,413
Depreciation 1/1/2012 3,080 64 12,749 4,948 8 20,849
Changes in consolidated group –48 –277 –1 –326
Additions 402 3 1,624 634 26 2,689
Reclassifications –49 5 95 –51
Disposals –52 –2 –1,031 –426 –1,511
Write-ups –8 –75 –1 –84
Exchange differences –78 –208 –34 –320
Depreciation 12/31/2012 3,247 70 12,877 5,069 34 21,297
Carrying amounts 12/31/2012 4,165 81 4,729 1,718 1,423 12,116
Gross values 1/1/2013 7,412 151 17,606 6,787 1,457 33,413
Changes in consolidated group 108 409 11 64 592
Additions 210 791 508 1,030 2,539
Reclassifications 171 1 541 255 –968
Disposals –84 –37 –699 –553 –96 –1,469
Exchange differences –366 –2 –864 –173 –64 –1,469
Gross values 12/31/2013 7,451 113 17,784 6,835 1,423 33,606
Depreciation 1/1/2013 3,247 70 12,877 5,069 34 21,297
Changes in consolidated group 26 195 7 228
Additions 259 1 1,106 642 2,008
Reclassifications 8 –30 30 –8
Disposals –53 –35 –648 –493 –1 –1,230
Write-ups –4 –3 –7
Exchange differences –175 –637 –121 –1 –934
Depreciation 12/31/2013 3,308 36 12,860 5,134 24 21,362
Carrying amounts 12/31/2013 4,143 77 4,924 1,701 1,399 12,244
Assets held for sale 0
12,244
T.35
Bosch Annual Report 201386
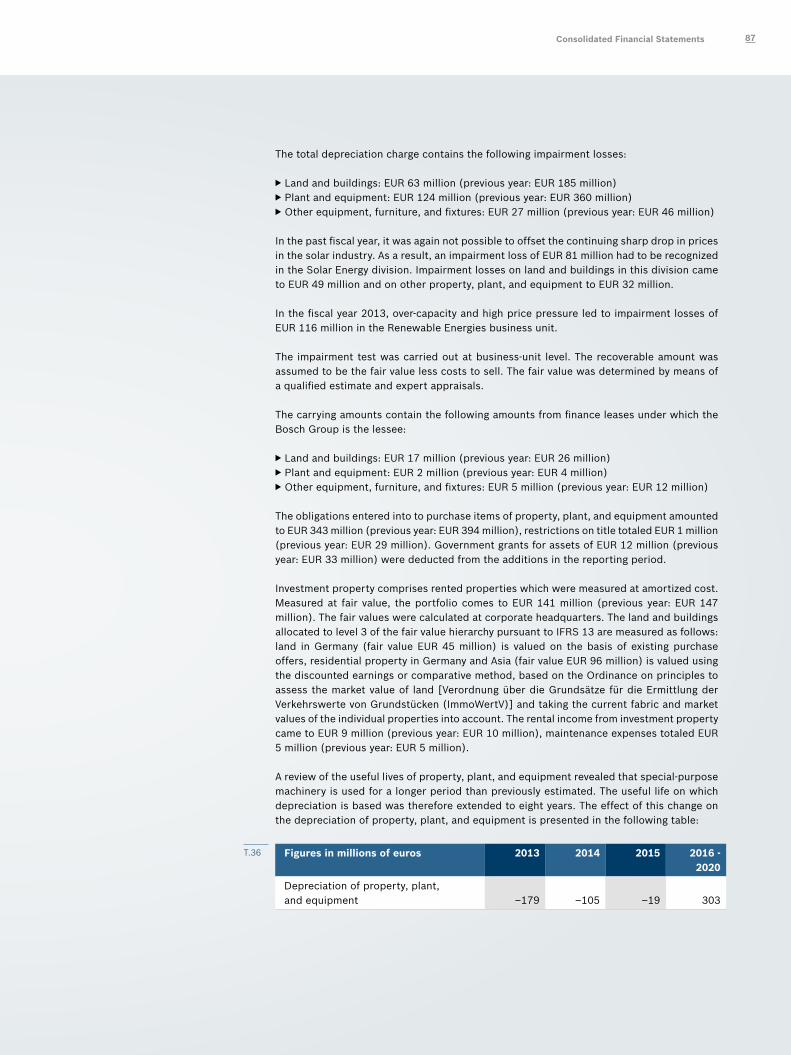
The total depreciation charge contains the following impairment losses:
f Land and buildings: EUR 63 million (previous year: EUR 185 million) f Plant and equipment: EUR 124 million (previous year: EUR 360 million) fOther equipment, furniture, and fixtures: EUR 27 million (previous year: EUR 46 million)
In the past fiscal year, it was again not possible to offset the continuing sharp drop in prices in the solar industry. As a result, an impairment loss of EUR 81 million had to be recognized in the Solar Energy division. Impairment losses on land and buildings in this division came to EUR 49 million and on other property, plant, and equipment to EUR 32 million.
In the fiscal year 2013, over-capacity and high price pressure led to impairment losses of EUR 116 million in the Renewable Energies business unit.
The impairment test was carried out at business-unit level. The recoverable amount was assumed to be the fair value less costs to sell. The fair value was determined by means of a qualified estimate and expert appraisals.
The carrying amounts contain the following amounts from finance leases under which the Bosch Group is the lessee:
f Land and buildings: EUR 17 million (previous year: EUR 26 million) f Plant and equipment: EUR 2 million (previous year: EUR 4 million) fOther equipment, furniture, and fixtures: EUR 5 million (previous year: EUR 12 million)
The obligations entered into to purchase items of property, plant, and equipment amounted to EUR 343 million (previous year: EUR 394 million), restrictions on title totaled EUR 1 million (previous year: EUR 29 million). Government grants for assets of EUR 12 million (previous year: EUR 33 million) were deducted from the additions in the reporting period.
Investment property comprises rented properties which were measured at amortized cost. Measured at fair value, the portfolio comes to EUR 141 million (previous year: EUR 147 million). The fair values were calculated at corporate headquarters. The land and buildings allocated to level 3 of the fair value hierarchy pursuant to IFRS 13 are measured as follows: land in Germany (fair value EUR 45 million) is valued on the basis of existing purchase offers, residential property in Germany and Asia (fair value EUR 96 million) is valued using the discounted earnings or comparative method, based on the Ordinance on principles to assess the market value of land [Verordnung über die Grundsätze für die Ermittlung der Verkehrswerte von Grundstücken (ImmoWertV)] and taking the current fabric and market values of the individual properties into account. The rental income from investment property came to EUR 9 million (previous year: EUR 10 million), maintenance expenses totaled EUR 5 million (previous year: EUR 5 million).
A review of the useful lives of property, plant, and equipment revealed that special-purpose machinery is used for a longer period than previously estimated. The useful life on which depreciation is based was therefore extended to eight years. The effect of this change on the depreciation of property, plant, and equipment is presented in the following table:
Figures in millions of euros 2013 2014 2015 2016 - 2020
Depreciation of property, plant, and equipment –179 –105 –19 303
T.36
Consolidated Financial Statements 87
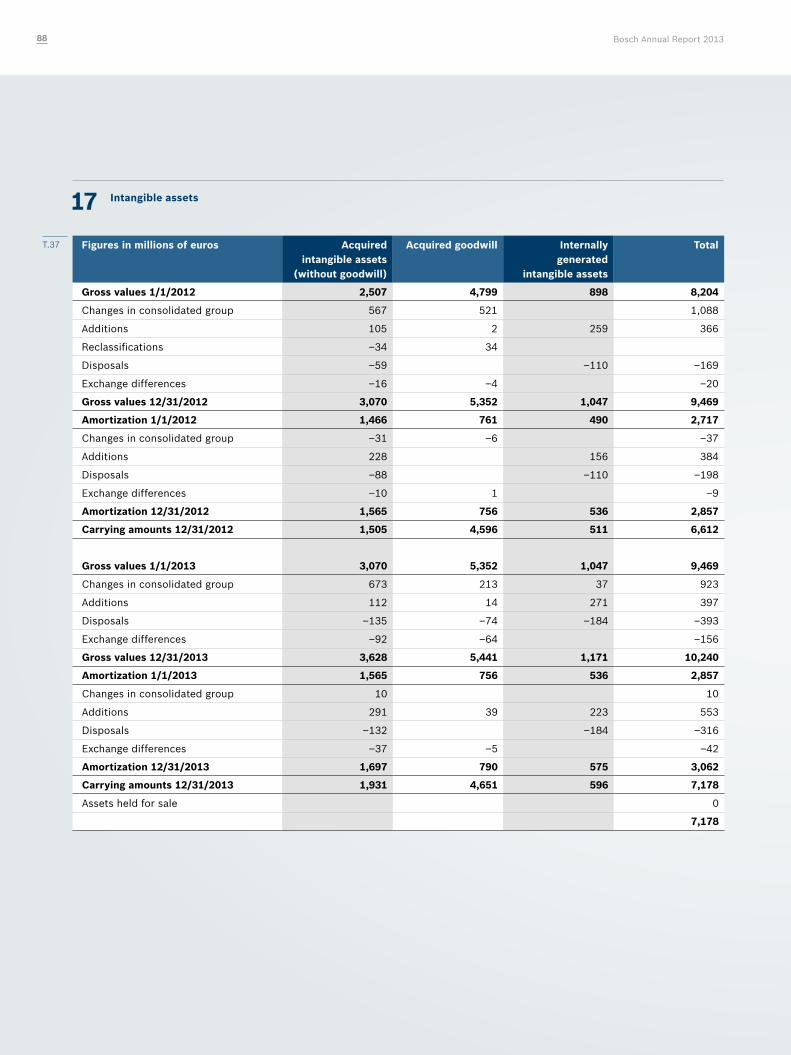
17 Intangible assets
Figures in millions of euros Acquired intangible assets
(without goodwill)
Acquired goodwill Internally generated
intangible assets
Total
Gross values 1/1/2012 2,507 4,799 898 8,204
Changes in consolidated group 567 521 1,088
Additions 105 2 259 366
Reclassifications –34 34
Disposals –59 –110 –169
Exchange differences –16 –4 –20
Gross values 12/31/2012 3,070 5,352 1,047 9,469
Amortization 1/1/2012 1,466 761 490 2,717
Changes in consolidated group –31 –6 –37
Additions 228 156 384
Disposals –88 –110 –198
Exchange differences –10 1 –9
Amortization 12/31/2012 1,565 756 536 2,857
Carrying amounts 12/31/2012 1,505 4,596 511 6,612
Gross values 1/1/2013 3,070 5,352 1,047 9,469
Changes in consolidated group 673 213 37 923
Additions 112 14 271 397
Disposals –135 –74 –184 –393
Exchange differences –92 –64 –156
Gross values 12/31/2013 3,628 5,441 1,171 10,240
Amortization 1/1/2013 1,565 756 536 2,857
Changes in consolidated group 10 10
Additions 291 39 223 553
Disposals –132 –184 –316
Exchange differences –37 –5 –42
Amortization 12/31/2013 1,697 790 575 3,062
Carrying amounts 12/31/2013 1,931 4,651 596 7,178
Assets held for sale 0
7,178
T.37
Bosch Annual Report 201388
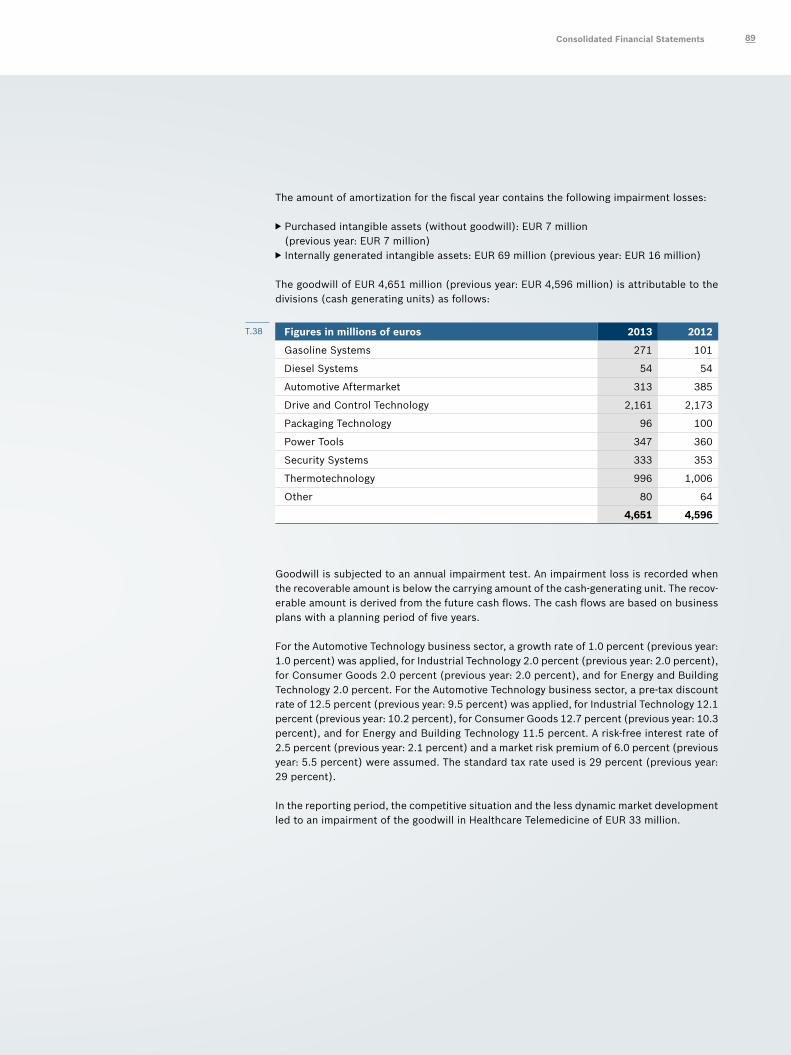
The amount of amortization for the fiscal year contains the following impairment losses:
f Purchased intangible assets (without goodwill): EUR 7 million (previous year: EUR 7 million) f Internally generated intangible assets: EUR 69 million (previous year: EUR 16 million)
The goodwill of EUR 4,651 million (previous year: EUR 4,596 million) is attributable to the divisions (cash generating units) as follows:
Figures in millions of euros 2013 2012
Gasoline Systems 271 101
Diesel Systems 54 54
Automotive Aftermarket 313 385
Drive and Control Technology 2,161 2,173
Packaging Technology 96 100
Power Tools 347 360
Security Systems 333 353
Thermotechnology 996 1,006
Other 80 64
4,651 4,596
Goodwill is subjected to an annual impairment test. An impairment loss is recorded when the recoverable amount is below the carrying amount of the cash-generating unit. The recov-erable amount is derived from the future cash flows. The cash flows are based on business plans with a planning period of five years.
For the Automotive Technology business sector, a growth rate of 1.0 percent (previous year: 1.0 percent) was applied, for Industrial Technology 2.0 percent (previous year: 2.0 percent), for Consumer Goods 2.0 percent (previous year: 2.0 percent), and for Energy and Building Technology 2.0 percent. For the Automotive Technology business sector, a pre-tax discount rate of 12.5 percent (previous year: 9.5 percent) was applied, for Industrial Technology 12.1 percent (previous year: 10.2 percent), for Consumer Goods 12.7 percent (previous year: 10.3 percent), and for Energy and Building Technology 11.5 percent. A risk-free interest rate of 2.5 percent (previous year: 2.1 percent) and a market risk premium of 6.0 percent (previous year: 5.5 percent) were assumed. The standard tax rate used is 29 percent (previous year: 29 percent).
In the reporting period, the competitive situation and the less dynamic market development led to an impairment of the goodwill in Healthcare Telemedicine of EUR 33 million.
T.38
Consolidated Financial Statements 89
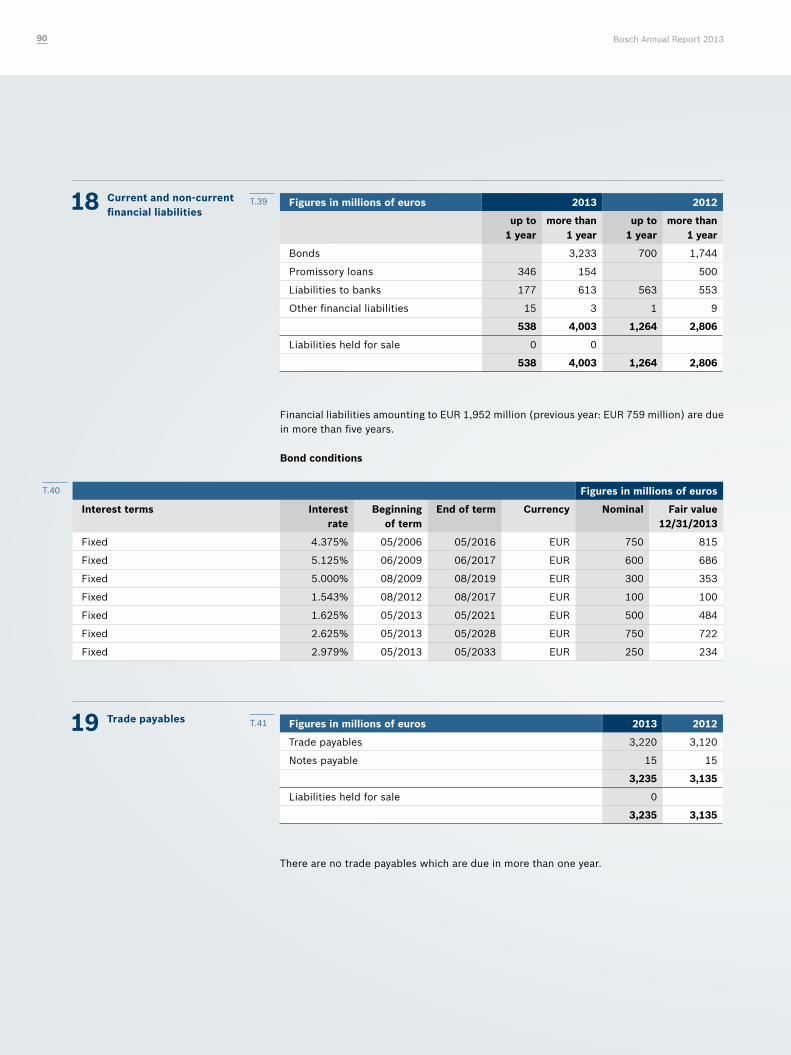
18 Current and non-current financial liabilities
Figures in millions of euros 2013 2012
up to 1 year
more than 1 year
up to 1 year
more than 1 year
Bonds 3,233 700 1,744
Promissory loans 346 154 500
Liabilities to banks 177 613 563 553
Other financial liabilities 15 3 1 9
538 4,003 1,264 2,806
Liabilities held for sale 0 0
538 4,003 1,264 2,806
Financial liabilities amounting to EUR 1,952 million (previous year: EUR 759 million) are due in more than five years.
Bond conditions
Figures in millions of euros
Interest terms Interest rate
Beginning of term
End of term Currency Nominal Fair value 12/31/2013
Fixed 4.375% 05/2006 05/2016 EUR 750 815
Fixed 5.125% 06/2009 06/2017 EUR 600 686
Fixed 5.000% 08/2009 08/2019 EUR 300 353
Fixed 1.543% 08/2012 08/2017 EUR 100 100
Fixed 1.625% 05/2013 05/2021 EUR 500 484
Fixed 2.625% 05/2013 05/2028 EUR 750 722
Fixed 2.979% 05/2013 05/2033 EUR 250 234
19 Trade payables Figures in millions of euros 2013 2012
Trade payables 3,220 3,120
Notes payable 15 15
3,235 3,135
Liabilities held for sale 0
3,235 3,135
There are no trade payables which are due in more than one year.
T.39
T.40
T.41
Bosch Annual Report 201390
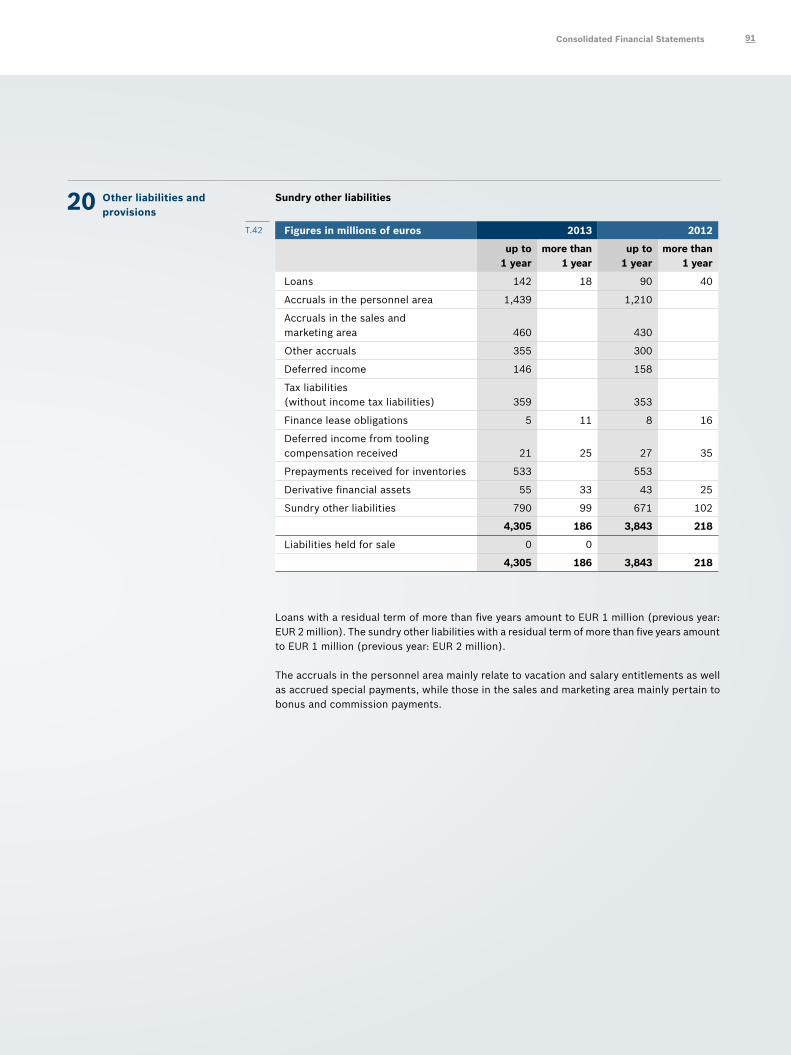
20 Other liabilities and provisions
Sundry other liabilities
Figures in millions of euros 2013 2012
up to 1 year
more than 1 year
up to 1 year
more than 1 year
Loans 142 18 90 40
Accruals in the personnel area 1,439 1,210
Accruals in the sales and marketing area 460 430
Other accruals 355 300
Deferred income 146 158
Tax liabilities (without income tax liabilities) 359 353
Finance lease obligations 5 11 8 16
Deferred income from tooling compensation received 21 25 27 35
Prepayments received for inventories 533 553
Derivative financial assets 55 33 43 25
Sundry other liabilities 790 99 671 102
4,305 186 3,843 218
Liabilities held for sale 0 0
4,305 186 3,843 218
Loans with a residual term of more than five years amount to EUR 1 million (previous year: EUR 2 million). The sundry other liabilities with a residual term of more than five years amount to EUR 1 million (previous year: EUR 2 million).
The accruals in the personnel area mainly relate to vacation and salary entitlements as well as accrued special payments, while those in the sales and marketing area mainly pertain to bonus and commission payments.
T.42
Consolidated Financial Statements 91
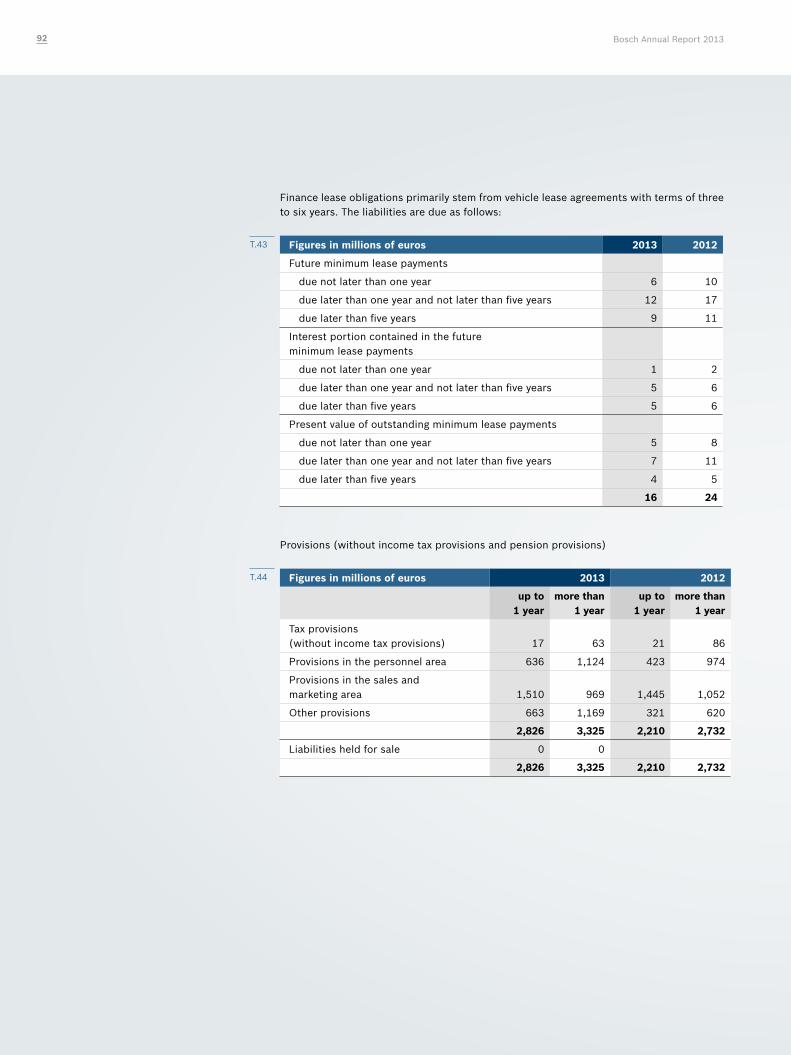
Finance lease obligations primarily stem from vehicle lease agreements with terms of three to six years. The liabilities are due as follows:
Figures in millions of euros 2013 2012
Future minimum lease payments
due not later than one year 6 10
due later than one year and not later than five years 12 17
due later than five years 9 11
Interest portion contained in the future minimum lease payments
due not later than one year 1 2
due later than one year and not later than five years 5 6
due later than five years 5 6
Present value of outstanding minimum lease payments
due not later than one year 5 8
due later than one year and not later than five years 7 11
due later than five years 4 5
16 24
Provisions (without income tax provisions and pension provisions)
Figures in millions of euros 2013 2012
up to 1 year
more than 1 year
up to 1 year
more than 1 year
Tax provisions (without income tax provisions) 17 63 21 86
Provisions in the personnel area 636 1,124 423 974
Provisions in the sales and marketing area 1,510 969 1,445 1,052
Other provisions 663 1,169 321 620
2,826 3,325 2,210 2,732
Liabilities held for sale 0 0
2,826 3,325 2,210 2,732
T.43
T.44
Bosch Annual Report 201392
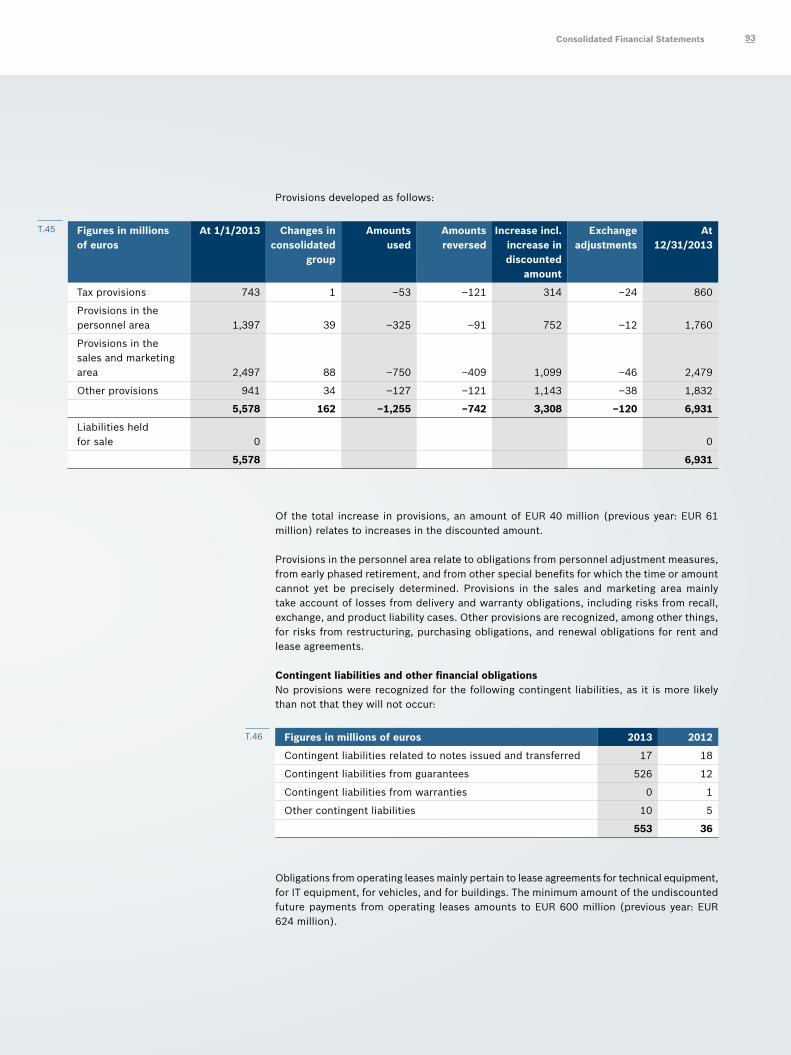
Provisions developed as follows:
Figures in millions of euros
At 1/1/2013 Changes in consolidated
group
Amounts used
Amounts reversed
Increase incl. increase in discounted
amount
Exchange adjustments
At 12/31/2013
Tax provisions 743 1 –53 –121 314 –24 860
Provisions in the personnel area 1,397 39 –325 –91 752 –12 1,760
Provisions in the sales and marketing area 2,497 88 –750 –409 1,099 –46 2,479
Other provisions 941 34 –127 –121 1,143 –38 1,832
5,578 162 –1,255 –742 3,308 –120 6,931
Liabilities held for sale 0 0
5,578 6,931
Of the total increase in provisions, an amount of EUR 40 million (previous year: EUR 61 million) relates to increases in the discounted amount.
Provisions in the personnel area relate to obligations from personnel adjustment measures, from early phased retirement, and from other special benefits for which the time or amount cannot yet be precisely determined. Provisions in the sales and marketing area mainly take account of losses from delivery and warranty obligations, including risks from recall, exchange, and product liability cases. Other provisions are recognized, among other things, for risks from restructuring, purchasing obligations, and renewal obligations for rent and lease agreements.
Contingent liabilities and other financial obligationsNo provisions were recognized for the following contingent liabilities, as it is more likely than not that they will not occur:
Figures in millions of euros 2013 2012
Contingent liabilities related to notes issued and transferred 17 18
Contingent liabilities from guarantees 526 12
Contingent liabilities from warranties 0 1
Other contingent liabilities 10 5
553 36
Obligations from operating leases mainly pertain to lease agreements for technical equipment, for IT equipment, for vehicles, and for buildings. The minimum amount of the undiscounted future payments from operating leases amounts to EUR 600 million (previous year: EUR 624 million).
T.45
T.46
Consolidated Financial Statements 93
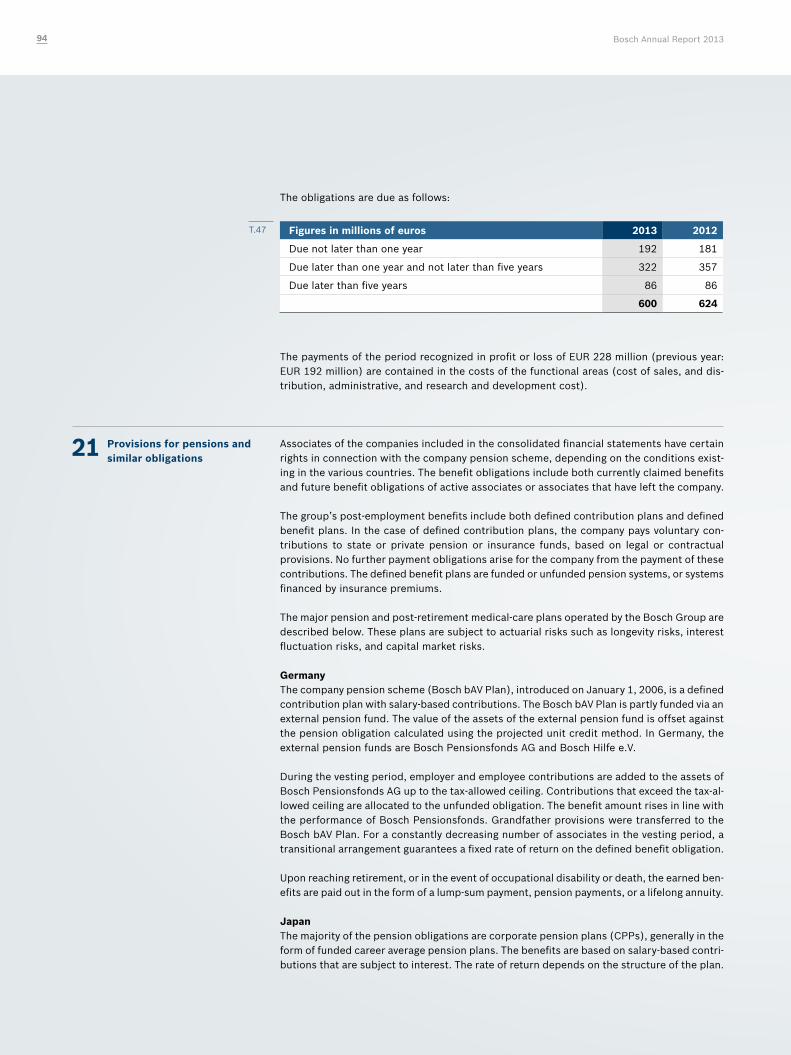
The obligations are due as follows:
Figures in millions of euros 2013 2012
Due not later than one year 192 181
Due later than one year and not later than five years 322 357
Due later than five years 86 86
600 624
The payments of the period recognized in profit or loss of EUR 228 million (previous year: EUR 192 million) are contained in the costs of the functional areas (cost of sales, and dis-tribution, administrative, and research and development cost).
21 Provisions for pensions and similar obligations
Associates of the companies included in the consolidated financial statements have certain rights in connection with the company pension scheme, depending on the conditions exist-ing in the various countries. The benefit obligations include both currently claimed benefits and future benefit obligations of active associates or associates that have left the company.
The group’s post-employment benefits include both defined contribution plans and defined benefit plans. In the case of defined contribution plans, the company pays voluntary con-tributions to state or private pension or insurance funds, based on legal or contractual provisions. No further payment obligations arise for the company from the payment of these contributions. The defined benefit plans are funded or unfunded pension systems, or systems financed by insurance premiums.
The major pension and post-retirement medical-care plans operated by the Bosch Group are described below. These plans are subject to actuarial risks such as longevity risks, interest fluctuation risks, and capital market risks.
GermanyThe company pension scheme (Bosch bAV Plan), introduced on January 1, 2006, is a defined contribution plan with salary-based contributions. The Bosch bAV Plan is partly funded via an external pension fund. The value of the assets of the external pension fund is offset against the pension obligation calculated using the projected unit credit method. In Germany, the external pension funds are Bosch Pensionsfonds AG and Bosch Hilfe e.V.
During the vesting period, employer and employee contributions are added to the assets of Bosch Pensionsfonds AG up to the tax-allowed ceiling. Contributions that exceed the tax-al-lowed ceiling are allocated to the unfunded obligation. The benefit amount rises in line with the performance of Bosch Pensionsfonds. Grandfather provisions were transferred to the Bosch bAV Plan. For a constantly decreasing number of associates in the vesting period, a transitional arrangement guarantees a fixed rate of return on the defined benefit obligation.
Upon reaching retirement, or in the event of occupational disability or death, the earned ben-efits are paid out in the form of a lump-sum payment, pension payments, or a lifelong annuity.
JapanThe majority of the pension obligations are corporate pension plans (CPPs), generally in the form of funded career average pension plans. The benefits are based on salary-based contri-butions that are subject to interest. The rate of return depends on the structure of the plan.
T.47
Bosch Annual Report 201394
There are also obligations from unfunded retirement allowance plans (RAPs), the benefits of which are based on years of service and final salary.
All the benefits are paid out in the form of lump-sum payments on termination, death, or reaching retirement age. Annuity payments are possible for associates in some CPPs after a certain period of service.
SwitzerlandBosch has a funded pension plan. The Bosch pension plan is organized as a foundation. All the demographic and financial risks are borne by the foundation and regularly assessed by the foundation’s board of trustees. In the case of underfunding, adjustments can be made such as a change in the pension factors or an increase in future contributions.
Pension plans are governed by the Swiss Pension Fund Law (Bundesgesetz über die beru-fliche Alters-, Hinterlassenen- und Invalidenvorsorge (BVG)). All benefits are defined by law, and the BVG stipulates the minimum benefits to be paid. The Bosch pension plan meets all legal requirements.
Both employer and associates make contributions to the Bosch pension plan. The benefits are paid out either as a lump sum or a lifelong annuity.
United KingdomBosch operates a frozen final-salary pension plan. The obligation is funded via a trust asso-ciation which is legally independent of Bosch, and which is operated in accordance with the law. The trustees are required to comply with the legal requirements. The plan is in deficit and is being restructured.
The benefits earned are paid out on reaching retirement age, or in the event of occupational disability or death.
United StatesBosch maintains the Bosch pension plan and eight additional smaller pension plans, all of which are funded and in line with the ERISA requirements. The legal minimum funding provisions therefore apply to these plans. The Bosch pension plan is a cash balance plan under which the benefits depend on age, term of service, and salary. Benefits are paid out on reaching retirement age or in the event of death. The plan does not accept new members.
Two unfunded pension plans are also closed for new members; these provide benefits for certain members of management or for members of the Bosch pension plan whose income lies above the statutory contribution assessment basis. The benefits depend on age, term of service, and salary, and are paid out on reaching retirement age or in the event of death.
In addition, Bosch finances thirteen unfunded plans for post-employment medical care. Eight plans are already closed. The level of benefits and the contributions for pensioners vary depending on location, age, and term of service. The benefits include healthcare benefits and life assurance contributions for pensioners and their spouses. Actuarial calculations and estimates are made for all defined benefit plans. Besides assump-tions about life expectancy, and taking index-linked developments into account, the cal-
Consolidated Financial Statements 95
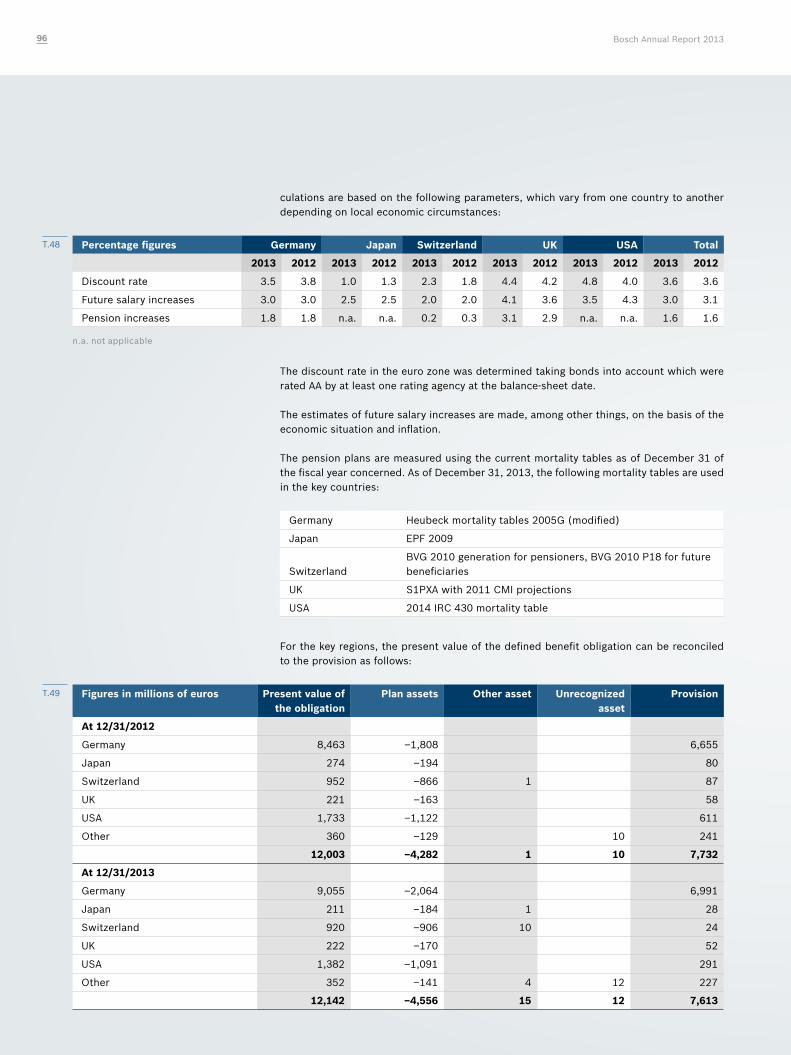
culations are based on the following parameters, which vary from one country to another depending on local economic circumstances:
Percentage figures Germany Japan Switzerland UK USA Total
2013 2012 2013 2012 2013 2012 2013 2012 2013 2012 2013 2012
Discount rate 3.5 3.8 1.0 1.3 2.3 1.8 4.4 4.2 4.8 4.0 3.6 3.6
Future salary increases 3.0 3.0 2.5 2.5 2.0 2.0 4.1 3.6 3.5 4.3 3.0 3.1
Pension increases 1.8 1.8 n.a. n.a. 0.2 0.3 3.1 2.9 n.a. n.a. 1.6 1.6
n.a. not applicable
The discount rate in the euro zone was determined taking bonds into account which were rated AA by at least one rating agency at the balance-sheet date.
The estimates of future salary increases are made, among other things, on the basis of the economic situation and inflation.
The pension plans are measured using the current mortality tables as of December 31 of the fiscal year concerned. As of December 31, 2013, the following mortality tables are used in the key countries:
Germany Heubeck mortality tables 2005G (modified)
Japan EPF 2009
SwitzerlandBVG 2010 generation for pensioners, BVG 2010 P18 for future beneficiaries
UK S1PXA with 2011 CMI projections
USA 2014 IRC 430 mortality table
For the key regions, the present value of the defined benefit obligation can be reconciled to the provision as follows:
Figures in millions of euros Present value of the obligation
Plan assets Other asset Unrecognized asset
Provision
At 12/31/2012
Germany 8,463 –1,808 6,655
Japan 274 –194 80
Switzerland 952 –866 1 87
UK 221 –163 58
USA 1,733 –1,122 611
Other 360 –129 10 241
12,003 –4,282 1 10 7,732
At 12/31/2013
Germany 9,055 –2,064 6,991
Japan 211 –184 1 28
Switzerland 920 –906 10 24
UK 222 –170 52
USA 1,382 –1,091 291
Other 352 –141 4 12 227
12,142 –4,556 15 12 7,613
T.48
T.49
Bosch Annual Report 201396
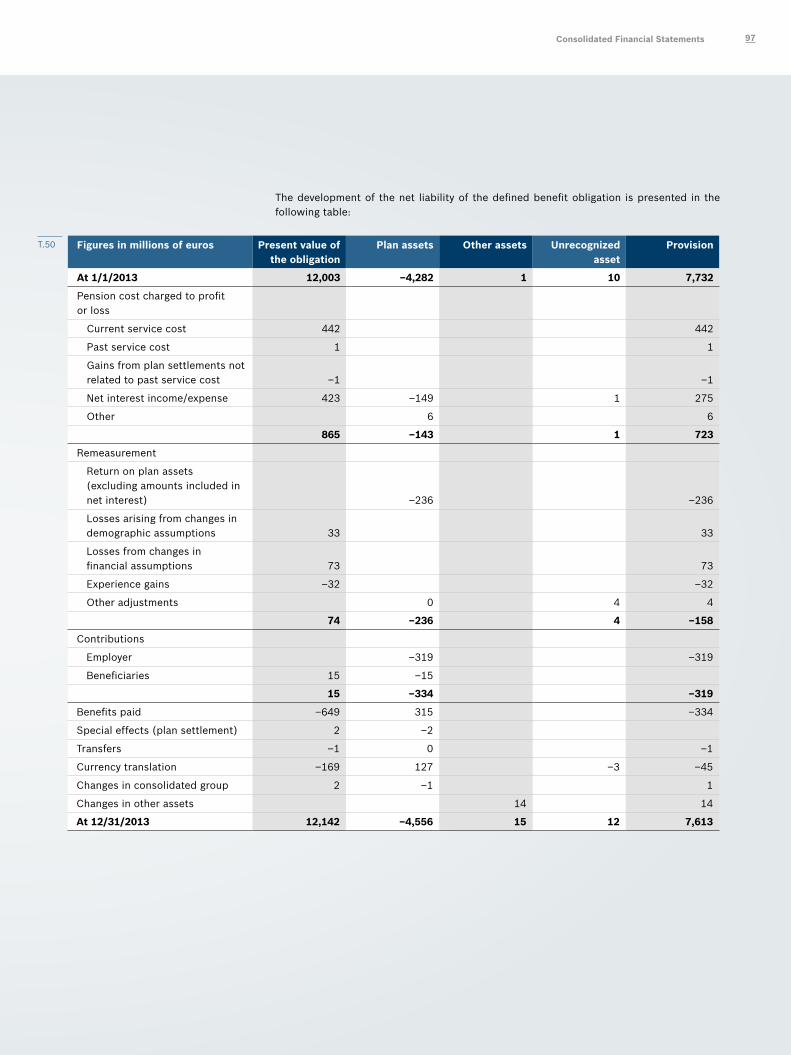
The development of the net liability of the defined benefit obligation is presented in the following table:
Figures in millions of euros Present value of the obligation
Plan assets Other assets Unrecognized asset
Provision
At 1/1/2013 12,003 –4,282 1 10 7,732
Pension cost charged to profit or loss
Current service cost 442 442
Past service cost 1 1
Gains from plan settlements not related to past service cost –1 –1
Net interest income/expense 423 –149 1 275
Other 6 6
865 –143 1 723
Remeasurement
Return on plan assets (excluding amounts included in net interest) –236 –236
Losses arising from changes in demographic assumptions 33 33
Losses from changes in financial assumptions 73 73
Experience gains –32 –32
Other adjustments 0 4 4
74 –236 4 –158
Contributions
Employer –319 –319
Beneficiaries 15 –15
15 –334 –319
Benefits paid –649 315 –334
Special effects (plan settlement) 2 –2
Transfers –1 0 –1
Currency translation –169 127 –3 –45
Changes in consolidated group 2 –1 1
Changes in other assets 14 14
At 12/31/2013 12,142 –4,556 15 12 7,613
T.50
Consolidated Financial Statements 97
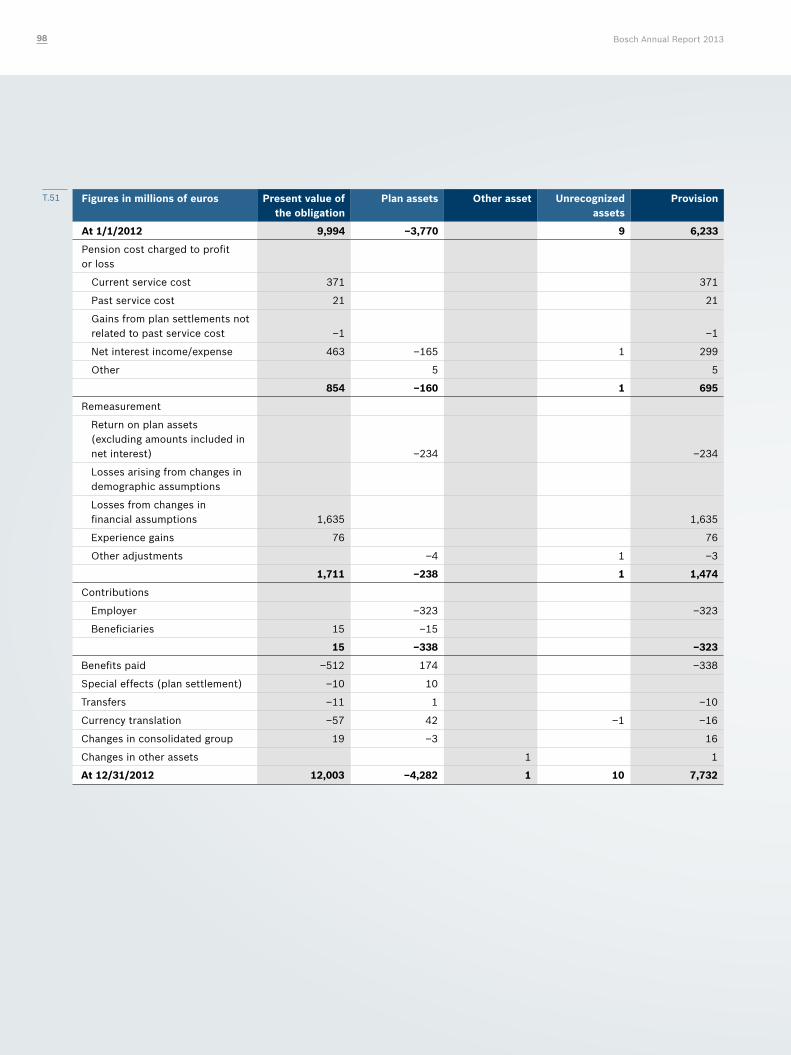
Figures in millions of euros Present value of the obligation
Plan assets Other asset Unrecognized assets
Provision
At 1/1/2012 9,994 –3,770 9 6,233
Pension cost charged to profit or loss
Current service cost 371 371
Past service cost 21 21
Gains from plan settlements not related to past service cost –1 –1
Net interest income/expense 463 –165 1 299
Other 5 5
854 –160 1 695
Remeasurement
Return on plan assets (excluding amounts included in net interest) –234 –234
Losses arising from changes in demographic assumptions
Losses from changes in financial assumptions 1,635 1,635
Experience gains 76 76
Other adjustments –4 1 –3
1,711 –238 1 1,474
Contributions
Employer –323 –323
Beneficiaries 15 –15
15 –338 –323
Benefits paid –512 174 –338
Special effects (plan settlement) –10 10
Transfers –11 1 –10
Currency translation –57 42 –1 –16
Changes in consolidated group 19 –3 16
Changes in other assets 1 1
At 12/31/2012 12,003 –4,282 1 10 7,732
T.51
Bosch Annual Report 201398
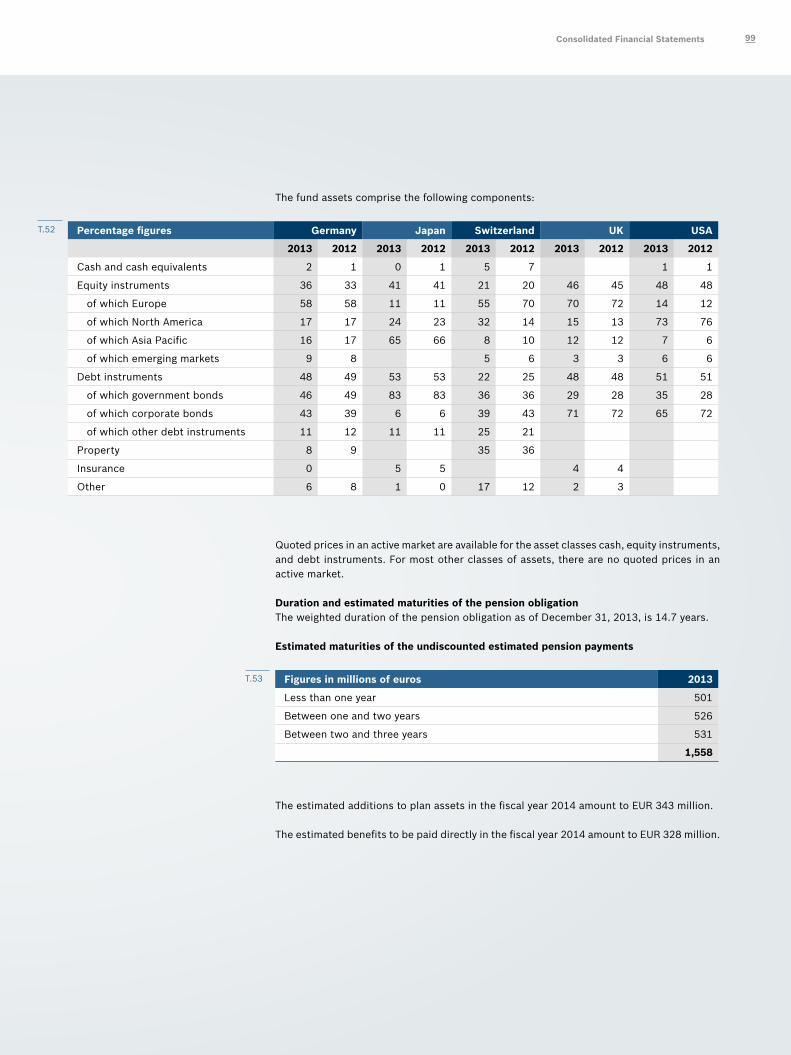
The fund assets comprise the following components:
Percentage figures Germany Japan Switzerland UK USA
2013 2012 2013 2012 2013 2012 2013 2012 2013 2012
Cash and cash equivalents 2 1 0 1 5 7 1 1
Equity instruments 36 33 41 41 21 20 46 45 48 48
of which Europe 58 58 11 11 55 70 70 72 14 12
of which North America 17 17 24 23 32 14 15 13 73 76
of which Asia Pacific 16 17 65 66 8 10 12 12 7 6
of which emerging markets 9 8 5 6 3 3 6 6
Debt instruments 48 49 53 53 22 25 48 48 51 51
of which government bonds 46 49 83 83 36 36 29 28 35 28
of which corporate bonds 43 39 6 6 39 43 71 72 65 72
of which other debt instruments 11 12 11 11 25 21
Property 8 9 35 36
Insurance 0 5 5 4 4
Other 6 8 1 0 17 12 2 3
Quoted prices in an active market are available for the asset classes cash, equity instruments, and debt instruments. For most other classes of assets, there are no quoted prices in an active market.
Duration and estimated maturities of the pension obligationThe weighted duration of the pension obligation as of December 31, 2013, is 14.7 years.
Estimated maturities of the undiscounted estimated pension payments
Figures in millions of euros 2013
Less than one year 501
Between one and two years 526
Between two and three years 531
1,558
The estimated additions to plan assets in the fiscal year 2014 amount to EUR 343 million.
The estimated benefits to be paid directly in the fiscal year 2014 amount to EUR 328 million.
T.52
T.53
Consolidated Financial Statements 99
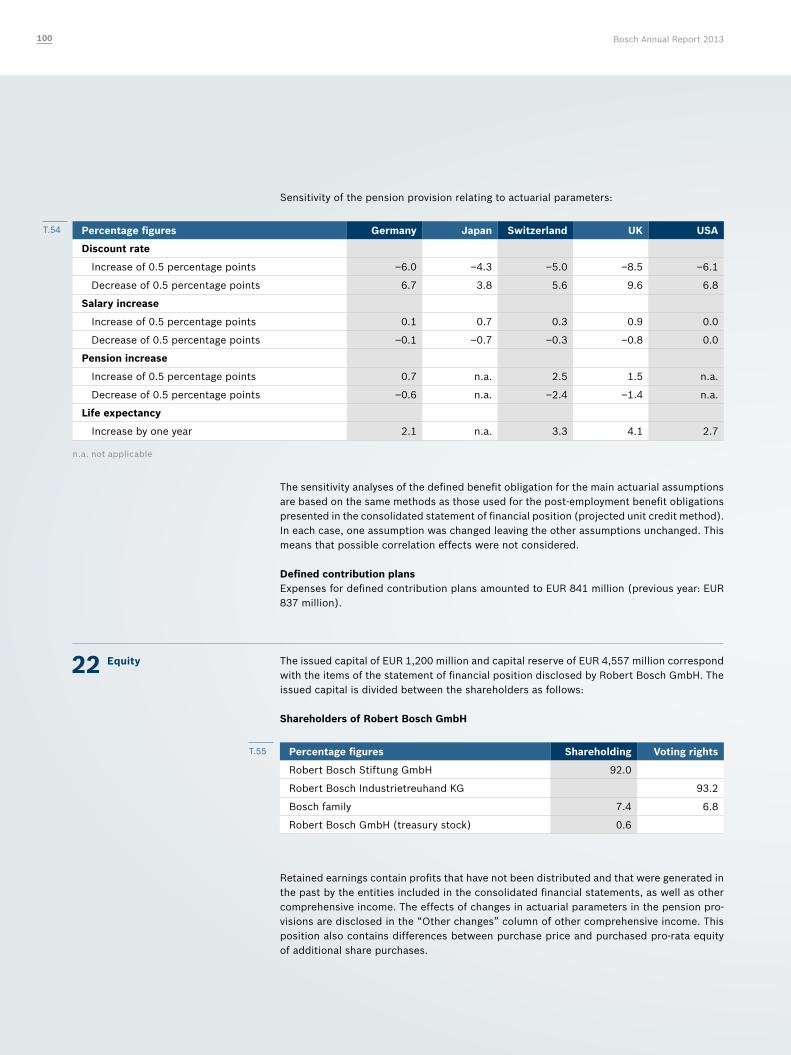
Sensitivity of the pension provision relating to actuarial parameters:
Percentage figures Germany Japan Switzerland UK USA
Discount rate
Increase of 0.5 percentage points –6.0 –4.3 –5.0 –8.5 –6.1
Decrease of 0.5 percentage points 6.7 3.8 5.6 9.6 6.8
Salary increase
Increase of 0.5 percentage points 0.1 0.7 0.3 0.9 0.0
Decrease of 0.5 percentage points –0.1 –0.7 –0.3 –0.8 0.0
Pension increase
Increase of 0.5 percentage points 0.7 n.a. 2.5 1.5 n.a.
Decrease of 0.5 percentage points –0.6 n.a. –2.4 –1.4 n.a.
Life expectancy
Increase by one year 2.1 n.a. 3.3 4.1 2.7
n.a. not applicable
The sensitivity analyses of the defined benefit obligation for the main actuarial assumptions are based on the same methods as those used for the post-employment benefit obligations presented in the consolidated statement of financial position (projected unit credit method). In each case, one assumption was changed leaving the other assumptions unchanged. This means that possible correlation effects were not considered.
Defined contribution plansExpenses for defined contribution plans amounted to EUR 841 million (previous year: EUR 837 million).
22 Equity The issued capital of EUR 1,200 million and capital reserve of EUR 4,557 million correspond with the items of the statement of financial position disclosed by Robert Bosch GmbH. The issued capital is divided between the shareholders as follows:
Shareholders of Robert Bosch GmbH
Percentage figures Shareholding Voting rights
Robert Bosch Stiftung GmbH 92.0
Robert Bosch Industrietreuhand KG 93.2
Bosch family 7.4 6.8
Robert Bosch GmbH (treasury stock) 0.6
Retained earnings contain profits that have not been distributed and that were generated in the past by the entities included in the consolidated financial statements, as well as other comprehensive income. The effects of changes in actuarial parameters in the pension pro-visions are disclosed in the “Other changes” column of other comprehensive income. This position also contains differences between purchase price and purchased pro-rata equity of additional share purchases.
T.54
T.55
Bosch Annual Report 2013100
Retained earnings also consider treasury stock of EUR 62 million.
The unappropriated earnings of the group match those of Robert Bosch GmbH.
Non-controlling interestsThe shares of non-controlling interests in the equity of the consolidated subsidiaries mainly comprise the non-controlling interests in United Automotive Electronic Systems Co., Ltd., Shanghai, Bosch Automotive Diesel Systems Co., Ltd., Wuxi, both China, and Bosch Ltd., Bangalore, India.
Changes mainly resulted from the first-time consolidation of United Automotive Electronic Systems Co., Ltd., Shanghai, China.
Other notes
23 Statement of cash flows The statement of cash flows presents cash inflows and outflows from operating activities, investing activities, and financing activities.
The cash flow is derived indirectly, starting from the profit before tax. Cash inflows from operating activities are adjusted for non-cash expenses and income (mainly depreciation of non-current assets), and take changes in working capital into account.
The investing activities mainly consist of additions to non-current assets, including leased assets and the purchase and disposal of subsidiaries and other operating units, as well as of securities.
Financing activities combine the inflows and outflows of cash and cash equivalents from borrowing and repayment of financial liabilities, from dividends, and from the acquisition of non-controlling interests.
Changes in positions of the statement of financial position contained in the statement of cash flows cannot be directly derived from the statement of financial position, as these have been adjusted for exchange-rate effects and changes in the consolidated group. The change in accounting for pensions is adjusted to eliminate actuarial gains and losses.
The cash and cash equivalents contained in the statement of cash flows contain cash of EUR 3,799 million (previous year: EUR 3,120 million). In the reporting period, there was no transfer restriction for cash and cash equivalents.
Effects of acquisitions on the cash flow are explained in the section on business combinations.
Consolidated Financial Statements 101
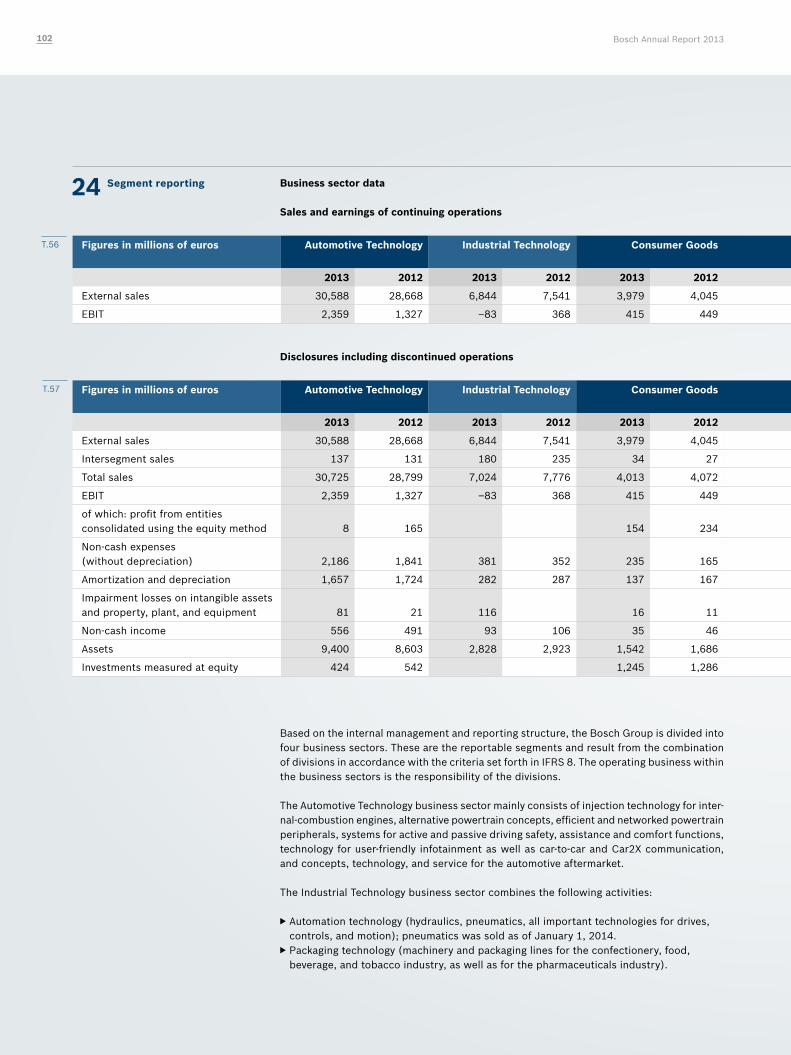
24 Segment reporting Business sector data Sales and earnings of continuing operations
Figures in millions of euros Automotive Technology Industrial Technology Consumer Goods Energy and Building Technology
All other segments Consolidation Group
2013 2012 2013 2012 2013 2012 2013 2012 2013 2012 2013 2012 2013 2012
External sales 30,588 28,668 6,844 7,541 3,979 4,045 4,551 4,382 106 67 46,068 44,703
EBIT 2,359 1,327 –83 368 415 449 106 14 –46 –40 2,751 2,118
Disclosures including discontinued operations
Figures in millions of euros Automotive Technology Industrial Technology Consumer Goods Energy and Building Technology
All other segments Consolidation Group
2013 2012 2013 2012 2013 2012 2013 2012 2013 2012 2013 2012 2013 2012
External sales 30,588 28,668 6,844 7,541 3,979 4,045 4,857 4,858 106 67 46,374 45,179
Intersegment sales 137 131 180 235 34 27 21 –372 –393
Total sales 30,725 28,799 7,024 7,776 4,013 4,072 4,878 4,858 106 67 –372 –393 46,374 45,179
EBIT 2,359 1,327 –83 368 415 449 –1,167 –976 –46 –40 1,478 1,128
of which: profit from entities consolidated using the equity method 8 165 154 234 162 399
Non-cash expenses (without depreciation) 2,186 1,841 381 352 235 165 1,118 259 9 6 3,929 2,623
Amortization and depreciation 1,657 1,724 282 287 137 167 140 268 16 13 2,232 2,459
Impairment losses on intangible assets and property, plant, and equipment 81 21 116 16 11 83 561 33 21 329 614
Non-cash income 556 491 93 106 35 46 64 34 15 2 763 679
Assets 9,400 8,603 2,828 2,923 1,542 1,686 1,913 1,944 58 18 15,741 15,174
Investments measured at equity 424 542 1,245 1,286 1,669 1,828
Based on the internal management and reporting structure, the Bosch Group is divided into four business sectors. These are the reportable segments and result from the combination of divisions in accordance with the criteria set forth in IFRS 8. The operating business within the business sectors is the responsibility of the divisions.
The Automotive Technology business sector mainly consists of injection technology for inter-nal-combustion engines, alternative powertrain concepts, efficient and networked powertrain peripherals, systems for active and passive driving safety, assistance and comfort functions, technology for user-friendly infotainment as well as car-to-car and Car2X communication, and concepts, technology, and service for the automotive aftermarket.
The Industrial Technology business sector combines the following activities:
f Automation technology (hydraulics, pneumatics, all important technologies for drives, controls, and motion); pneumatics was sold as of January 1, 2014. f Packaging technology (machinery and packaging lines for the confectionery, food, beverage, and tobacco industry, as well as for the pharmaceuticals industry).
T.56
T.57
Bosch Annual Report 2013102
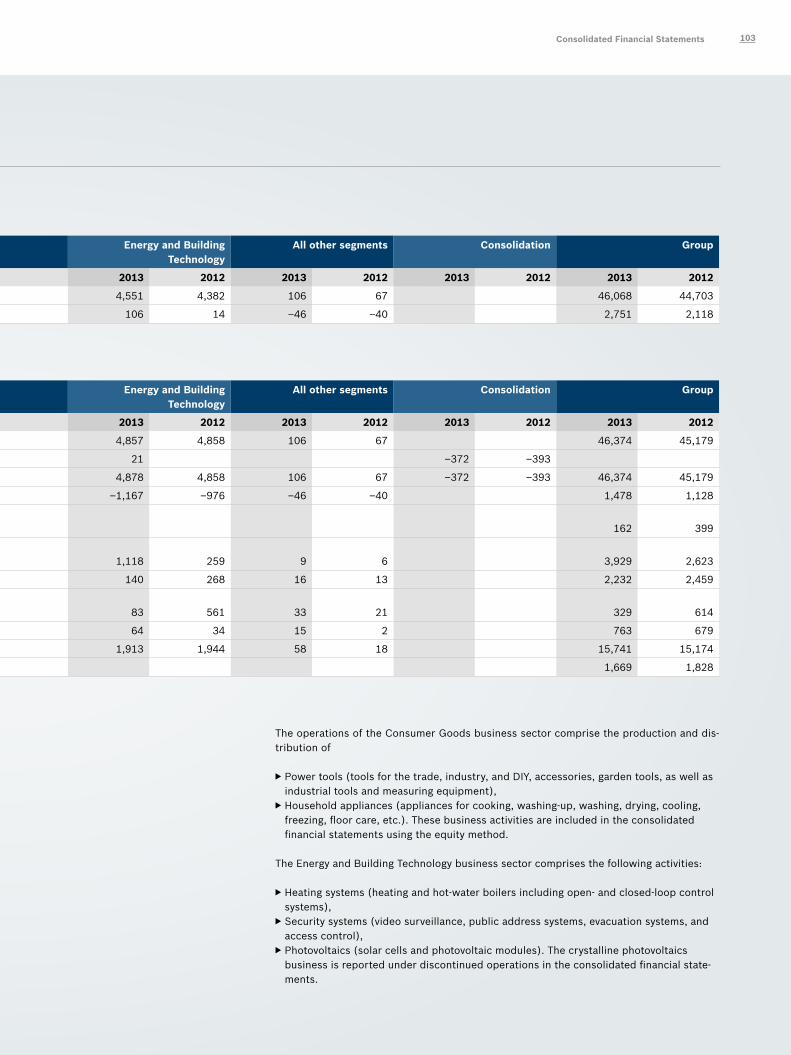
24 Segment reporting Business sector data Sales and earnings of continuing operations
Figures in millions of euros Automotive Technology Industrial Technology Consumer Goods Energy and Building Technology
All other segments Consolidation Group
2013 2012 2013 2012 2013 2012 2013 2012 2013 2012 2013 2012 2013 2012
External sales 30,588 28,668 6,844 7,541 3,979 4,045 4,551 4,382 106 67 46,068 44,703
EBIT 2,359 1,327 –83 368 415 449 106 14 –46 –40 2,751 2,118
Disclosures including discontinued operations
Figures in millions of euros Automotive Technology Industrial Technology Consumer Goods Energy and Building Technology
All other segments Consolidation Group
2013 2012 2013 2012 2013 2012 2013 2012 2013 2012 2013 2012 2013 2012
External sales 30,588 28,668 6,844 7,541 3,979 4,045 4,857 4,858 106 67 46,374 45,179
Intersegment sales 137 131 180 235 34 27 21 –372 –393
Total sales 30,725 28,799 7,024 7,776 4,013 4,072 4,878 4,858 106 67 –372 –393 46,374 45,179
EBIT 2,359 1,327 –83 368 415 449 –1,167 –976 –46 –40 1,478 1,128
of which: profit from entities consolidated using the equity method 8 165 154 234 162 399
Non-cash expenses (without depreciation) 2,186 1,841 381 352 235 165 1,118 259 9 6 3,929 2,623
Amortization and depreciation 1,657 1,724 282 287 137 167 140 268 16 13 2,232 2,459
Impairment losses on intangible assets and property, plant, and equipment 81 21 116 16 11 83 561 33 21 329 614
Non-cash income 556 491 93 106 35 46 64 34 15 2 763 679
Assets 9,400 8,603 2,828 2,923 1,542 1,686 1,913 1,944 58 18 15,741 15,174
Investments measured at equity 424 542 1,245 1,286 1,669 1,828
The operations of the Consumer Goods business sector comprise the production and dis-tribution of
f Power tools (tools for the trade, industry, and DIY, accessories, garden tools, as well as industrial tools and measuring equipment), fHousehold appliances (appliances for cooking, washing-up, washing, drying, cooling, freezing, floor care, etc.). These business activities are included in the consolidated financial statements using the equity method.
The Energy and Building Technology business sector comprises the following activities:
fHeating systems (heating and hot-water boilers including open- and closed-loop control systems), f Security systems (video surveillance, public address systems, evacuation systems, and access control), f Photovoltaics (solar cells and photovoltaic modules). The crystalline photovoltaics business is reported under discontinued operations in the consolidated financial state-ments.
Consolidated Financial Statements 103
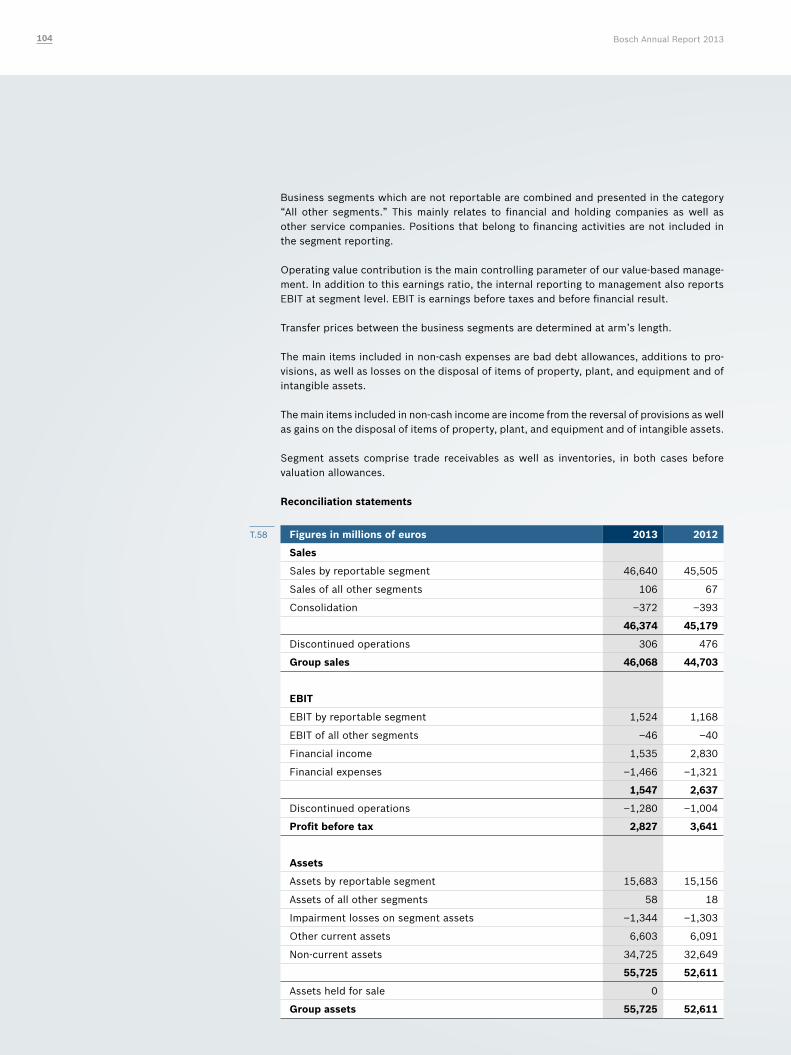
Business segments which are not reportable are combined and presented in the category “All other segments.” This mainly relates to financial and holding companies as well as other service companies. Positions that belong to financing activities are not included in the segment reporting.
Operating value contribution is the main controlling parameter of our value-based manage-ment. In addition to this earnings ratio, the internal reporting to management also reports EBIT at segment level. EBIT is earnings before taxes and before financial result.
Transfer prices between the business segments are determined at arm’s length.
The main items included in non-cash expenses are bad debt allowances, additions to pro-visions, as well as losses on the disposal of items of property, plant, and equipment and of intangible assets.
The main items included in non-cash income are income from the reversal of provisions as well as gains on the disposal of items of property, plant, and equipment and of intangible assets.
Segment assets comprise trade receivables as well as inventories, in both cases before valuation allowances. Reconciliation statements
Figures in millions of euros 2013 2012
Sales
Sales by reportable segment 46,640 45,505
Sales of all other segments 106 67
Consolidation –372 –393
46,374 45,179
Discontinued operations 306 476
Group sales 46,068 44,703
EBIT
EBIT by reportable segment 1,524 1,168
EBIT of all other segments –46 –40
Financial income 1,535 2,830
Financial expenses –1,466 –1,321
1,547 2,637
Discontinued operations –1,280 –1,004
Profit before tax 2,827 3,641
Assets
Assets by reportable segment 15,683 15,156
Assets of all other segments 58 18
Impairment losses on segment assets –1,344 –1,303
Other current assets 6,603 6,091
Non-current assets 34,725 32,649
55,725 52,611
Assets held for sale 0
Group assets 55,725 52,611
T.58
Bosch Annual Report 2013104
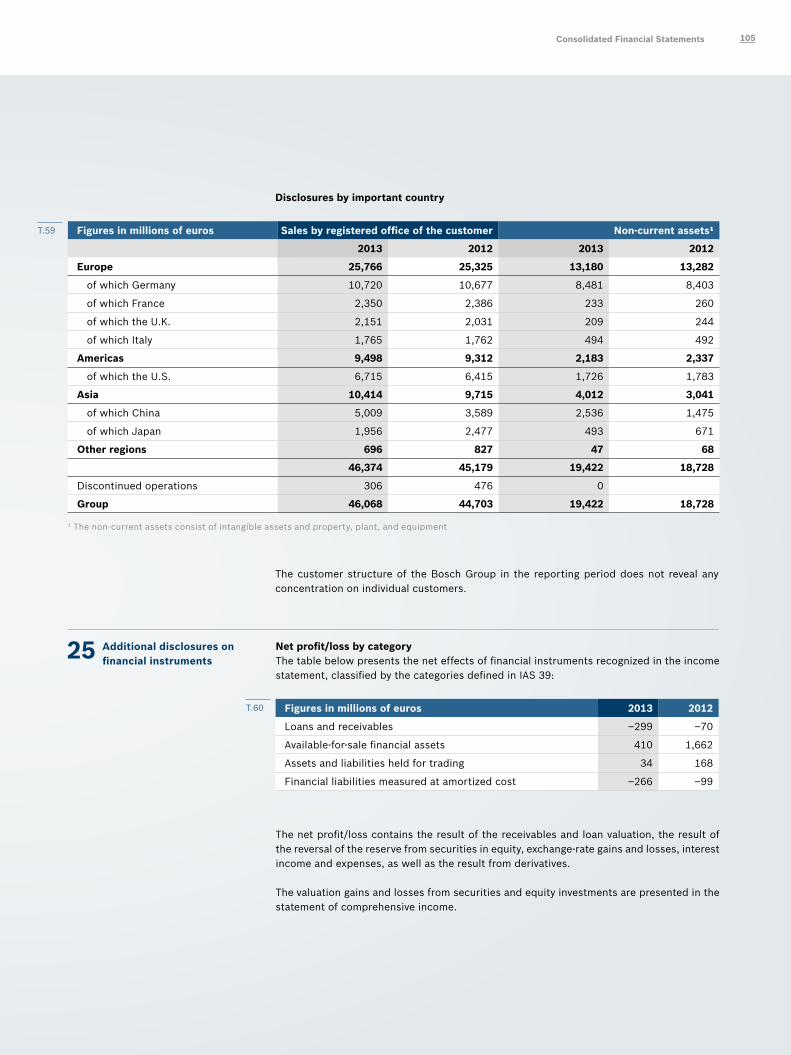
Disclosures by important country
Figures in millions of euros Sales by registered office of the customer Non-current assets¹
2013 2012 2013 2012
Europe 25,766 25,325 13,180 13,282
of which Germany 10,720 10,677 8,481 8,403
of which France 2,350 2,386 233 260
of which the U.K. 2,151 2,031 209 244
of which Italy 1,765 1,762 494 492
Americas 9,498 9,312 2,183 2,337
of which the U.S. 6,715 6,415 1,726 1,783
Asia 10,414 9,715 4,012 3,041
of which China 5,009 3,589 2,536 1,475
of which Japan 1,956 2,477 493 671
Other regions 696 827 47 68
46,374 45,179 19,422 18,728
Discontinued operations 306 476 0
Group 46,068 44,703 19,422 18,728
1 The non-current assets consist of intangible assets and property, plant, and equipment
The customer structure of the Bosch Group in the reporting period does not reveal any concentration on individual customers.
25 Additional disclosures on financial instruments
Net profit/loss by categoryThe table below presents the net effects of financial instruments recognized in the income statement, classified by the categories defined in IAS 39:
Figures in millions of euros 2013 2012
Loans and receivables –299 –70
Available-for-sale financial assets 410 1,662
Assets and liabilities held for trading 34 168
Financial liabilities measured at amortized cost –266 –99
The net profit/loss contains the result of the receivables and loan valuation, the result of the reversal of the reserve from securities in equity, exchange-rate gains and losses, interest income and expenses, as well as the result from derivatives.
The valuation gains and losses from securities and equity investments are presented in the statement of comprehensive income.
T.59
T.60
Consolidated Financial Statements 105
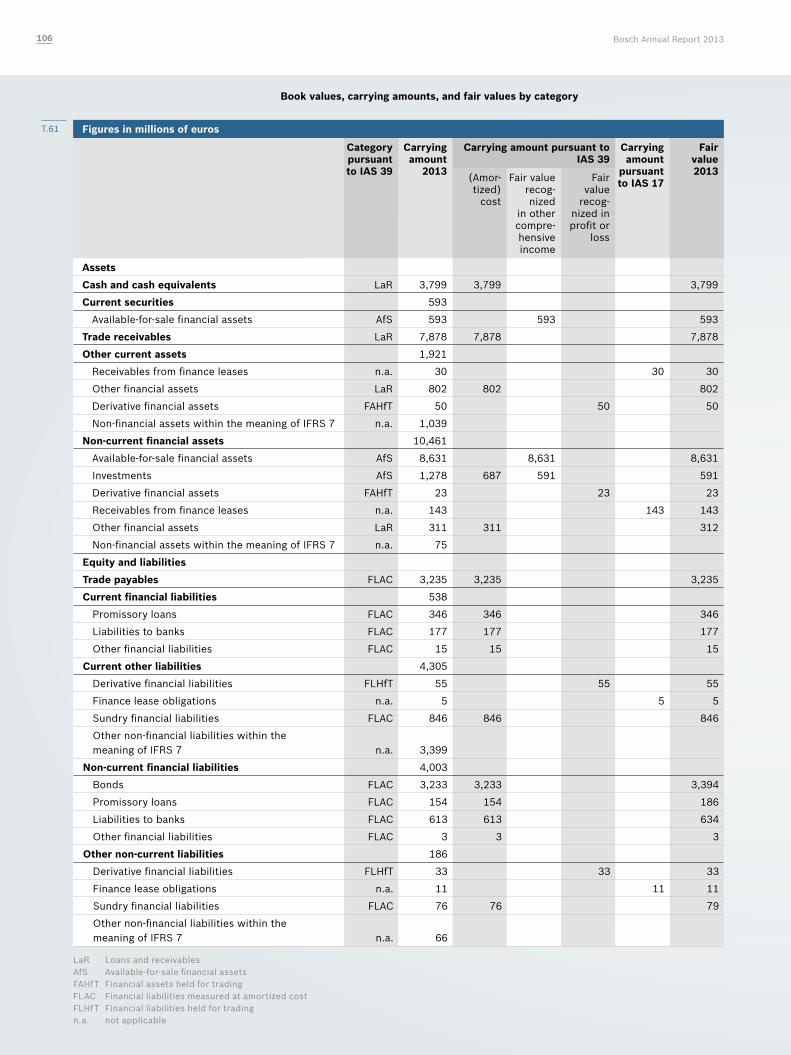
Book values, carrying amounts, and fair values by category
Figures in millions of euros
Category pursuant to IAS 39
Carrying amount
2013
Carrying amount pursuant to IAS 39
Carrying amount
pursuant to IAS 17
Fair value 2013 (Amor-
tized) cost
Fair value recog-nized
in other compre-hensive income
Fair value
recog-nized in profit or
loss
Assets
Cash and cash equivalents LaR 3,799 3,799 3,799
Current securities 593
Available-for-sale financial assets AfS 593 593 593
Trade receivables LaR 7,878 7,878 7,878
Other current assets 1,921
Receivables from finance leases n.a. 30 30 30
Other financial assets LaR 802 802 802
Derivative financial assets FAHfT 50 50 50
Non-financial assets within the meaning of IFRS 7 n.a. 1,039
Non-current financial assets 10,461
Available-for-sale financial assets AfS 8,631 8,631 8,631
Investments AfS 1,278 687 591 591
Derivative financial assets FAHfT 23 23 23
Receivables from finance leases n.a. 143 143 143
Other financial assets LaR 311 311 312
Non-financial assets within the meaning of IFRS 7 n.a. 75
Equity and liabilities
Trade payables FLAC 3,235 3,235 3,235
Current financial liabilities 538
Promissory loans FLAC 346 346 346
Liabilities to banks FLAC 177 177 177
Other financial liabilities FLAC 15 15 15
Current other liabilities 4,305
Derivative financial liabilities FLHfT 55 55 55
Finance lease obligations n.a. 5 5 5
Sundry financial liabilities FLAC 846 846 846
Other non-financial liabilities within the meaning of IFRS 7 n.a. 3,399
Non-current financial liabilities 4,003
Bonds FLAC 3,233 3,233 3,394
Promissory loans FLAC 154 154 186
Liabilities to banks FLAC 613 613 634
Other financial liabilities FLAC 3 3 3
Other non-current liabilities 186
Derivative financial liabilities FLHfT 33 33 33
Finance lease obligations n.a. 11 11 11
Sundry financial liabilities FLAC 76 76 79
Other non-financial liabilities within the meaning of IFRS 7 n.a. 66
LaR Loans and receivablesAfS Available-for-sale financial assetsFAHfT Financial assets held for tradingFLAC Financial liabilities measured at amortized costFLHfT Financial liabilities held for tradingn.a. not applicable
T.61
Bosch Annual Report 2013106
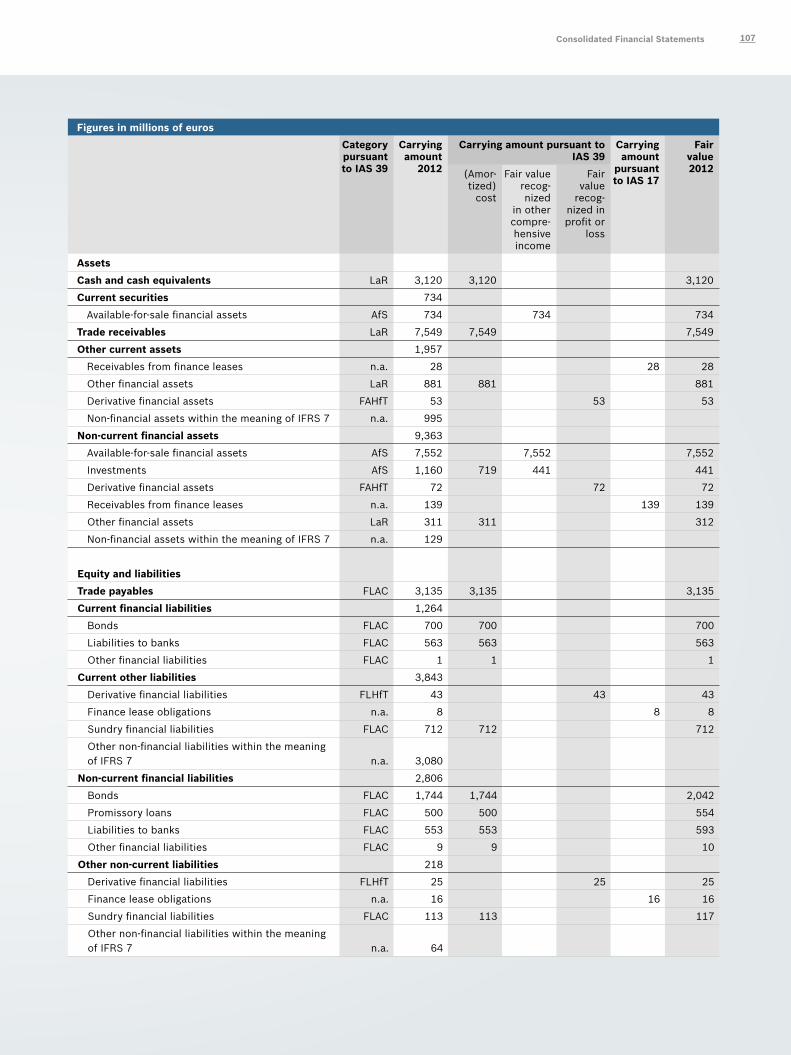
Figures in millions of euros
Category pursuant to IAS 39
Carrying amount
2012
Carrying amount pursuant to IAS 39
Carrying amount
pursuant to IAS 17
Fair value 2012 (Amor-
tized) cost
Fair value recog-nized
in other compre-hensive income
Fair value
recog-nized in profit or
loss
Assets
Cash and cash equivalents LaR 3,120 3,120 3,120
Current securities 734
Available-for-sale financial assets AfS 734 734 734
Trade receivables LaR 7,549 7,549 7,549
Other current assets 1,957
Receivables from finance leases n.a. 28 28 28
Other financial assets LaR 881 881 881
Derivative financial assets FAHfT 53 53 53
Non-financial assets within the meaning of IFRS 7 n.a. 995
Non-current financial assets 9,363
Available-for-sale financial assets AfS 7,552 7,552 7,552
Investments AfS 1,160 719 441 441
Derivative financial assets FAHfT 72 72 72
Receivables from finance leases n.a. 139 139 139
Other financial assets LaR 311 311 312
Non-financial assets within the meaning of IFRS 7 n.a. 129
Equity and liabilities
Trade payables FLAC 3,135 3,135 3,135
Current financial liabilities 1,264
Bonds FLAC 700 700 700
Liabilities to banks FLAC 563 563 563
Other financial liabilities FLAC 1 1 1
Current other liabilities 3,843
Derivative financial liabilities FLHfT 43 43 43
Finance lease obligations n.a. 8 8 8
Sundry financial liabilities FLAC 712 712 712
Other non-financial liabilities within the meaning of IFRS 7 n.a. 3,080
Non-current financial liabilities 2,806
Bonds FLAC 1,744 1,744 2,042
Promissory loans FLAC 500 500 554
Liabilities to banks FLAC 553 553 593
Other financial liabilities FLAC 9 9 10
Other non-current liabilities 218
Derivative financial liabilities FLHfT 25 25 25
Finance lease obligations n.a. 16 16 16
Sundry financial liabilities FLAC 113 113 117
Other non-financial liabilities within the meaning of IFRS 7 n.a. 64
Consolidated Financial Statements 107
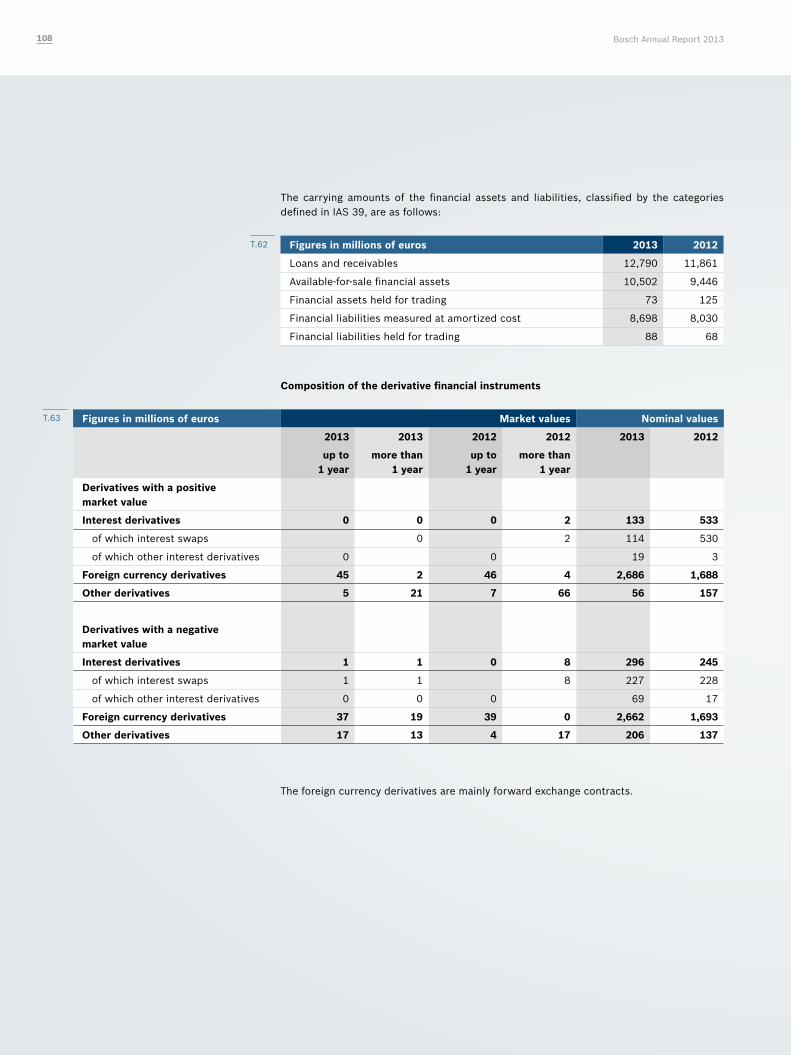
The carrying amounts of the financial assets and liabilities, classified by the categories defined in IAS 39, are as follows:
Figures in millions of euros 2013 2012
Loans and receivables 12,790 11,861
Available-for-sale financial assets 10,502 9,446
Financial assets held for trading 73 125
Financial liabilities measured at amortized cost 8,698 8,030
Financial liabilities held for trading 88 68
Composition of the derivative financial instruments
Figures in millions of euros Market values Nominal values
2013 2013 2012 2012 2013 2012
up to 1 year
more than 1 year
up to 1 year
more than 1 year
Derivatives with a positive market value
Interest derivatives 0 0 0 2 133 533
of which interest swaps 0 2 114 530
of which other interest derivatives 0 0 19 3
Foreign currency derivatives 45 2 46 4 2,686 1,688
Other derivatives 5 21 7 66 56 157
Derivatives with a negative market value
Interest derivatives 1 1 0 8 296 245
of which interest swaps 1 1 8 227 228
of which other interest derivatives 0 0 0 69 17
Foreign currency derivatives 37 19 39 0 2,662 1,693
Other derivatives 17 13 4 17 206 137
The foreign currency derivatives are mainly forward exchange contracts.
T.62
T.63
Bosch Annual Report 2013108
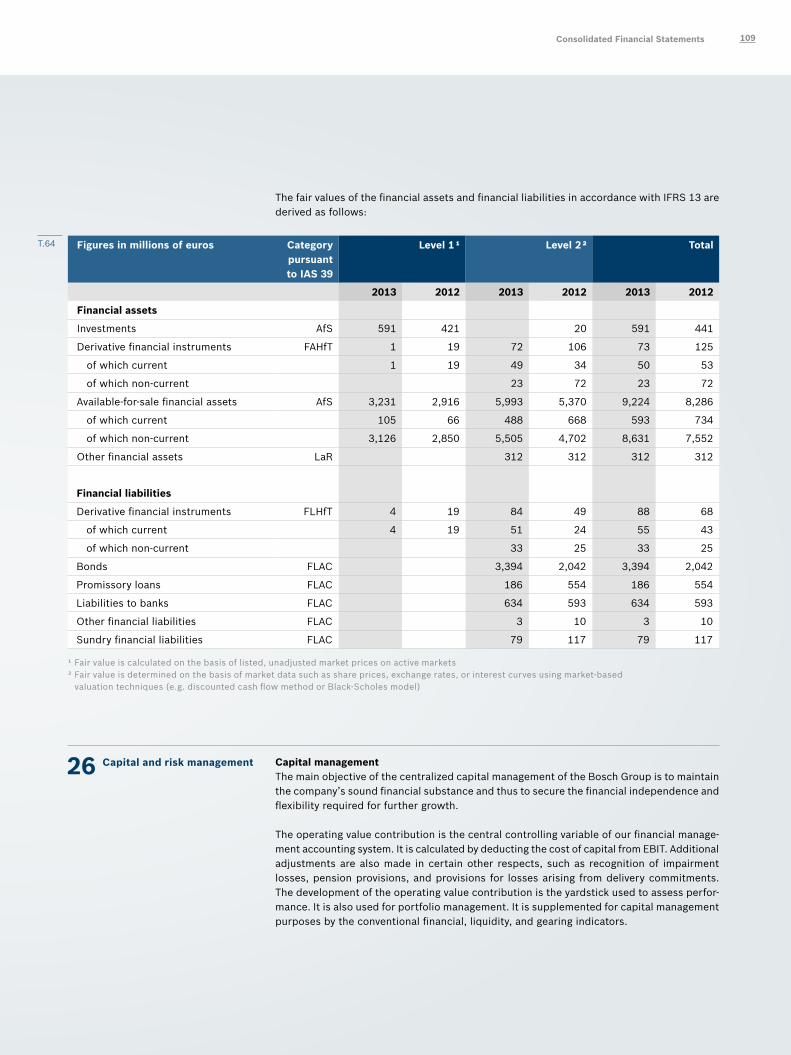
The fair values of the financial assets and financial liabilities in accordance with IFRS 13 are derived as follows:
Figures in millions of euros Category pursuant to IAS 39
Level 1 ¹ Level 2 ² Total
2013 2012 2013 2012 2013 2012
Financial assets
Investments AfS 591 421 20 591 441
Derivative financial instruments FAHfT 1 19 72 106 73 125
of which current 1 19 49 34 50 53
of which non-current 23 72 23 72
Available-for-sale financial assets AfS 3,231 2,916 5,993 5,370 9,224 8,286
of which current 105 66 488 668 593 734
of which non-current 3,126 2,850 5,505 4,702 8,631 7,552
Other financial assets LaR 312 312 312 312
Financial liabilities
Derivative financial instruments FLHfT 4 19 84 49 88 68
of which current 4 19 51 24 55 43
of which non-current 33 25 33 25
Bonds FLAC 3,394 2,042 3,394 2,042
Promissory loans FLAC 186 554 186 554
Liabilities to banks FLAC 634 593 634 593
Other financial liabilities FLAC 3 10 3 10
Sundry financial liabilities FLAC 79 117 79 117
¹ Fair value is calculated on the basis of listed, unadjusted market prices on active markets² Fair value is determined on the basis of market data such as share prices, exchange rates, or interest curves using market-based valuation techniques (e.g. discounted cash flow method or Black-Scholes model)
26 Capital and risk management Capital managementThe main objective of the centralized capital management of the Bosch Group is to maintain the company’s sound financial substance and thus to secure the financial independence and flexibility required for further growth.
The operating value contribution is the central controlling variable of our financial manage-ment accounting system. It is calculated by deducting the cost of capital from EBIT. Additional adjustments are also made in certain other respects, such as recognition of impairment losses, pension provisions, and provisions for losses arising from delivery commitments. The development of the operating value contribution is the yardstick used to assess perfor-mance. It is also used for portfolio management. It is supplemented for capital management purposes by the conventional financial, liquidity, and gearing indicators.
T.64
Consolidated Financial Statements 109
Hedging policy and financial derivativesThe operative business of the Bosch Group is impacted in particular by fluctuations in exchange and interest rates. Business policy aims to limit these risks by means of hedging. All hedging transactions are implemented at corporate level.
Internal regulations and guidelines set down a mandatory framework and define the respon-sibilities related to investment and hedging transactions. According to these regulations, derivatives may only be used in connection with operative business, financial investments, or financing transactions; speculative transactions are not allowed. Trading limits are an important component of the guidelines. Hedges are closed solely via banks whose credit- worthiness is regarded as impeccable. The rating given by leading agencies as well as cur-rent developments in the financial markets are taken into account. The creditworthiness of the banking partners of the Bosch Group is closely monitored and the risk mitigated by counterparty limits.
To reduce the credit risk of the bank, fixed term deposits are in some cases entered into as secured deposits in tri-party repo transactions. In such cases, the bank provides predefined securities as collateral. The transactions themselves, as well as the management and valuation of the securities, are managed by a clearing center. For details, please refer to the section on “Cash and cash equivalents.”
Within the corporate finance department, there is a spatial and functional segregation of trading, settlement, and control functions. Key tasks of the control function include deter-mining risks using the value-at-risk method as well as the basis-point-value method, and ongoing compliance checks with instructions and guidelines.
Each month, the risk of financial investments is calculated using the value-at-risk concept for the next month. Prescribed risk limits for the various investment categories limit the potential loss. The forecast quality of the value-at-risk method is tested by means of monthly backtesting. Management is informed monthly about risk analyses and the results of invest-ments and hedges.
Currency risksCurrency risks of the operative business are mitigated by the central management of selling and purchasing currencies. The currency risk is determined on the basis of the worldwide consolidated cash flow in the respective currencies. Based on the business plan, estimated inflows and outflows in the various countries for the planning period are aggregated in a foreign-exchange balance plan. The resulting net position is used for the central management of currency exposures.
The largest net currency position of the planned currency cash flow is in USD.
Hedging largely takes the form of forward exchange contracts; currency options and currency swaps to secure group financing are used to a lesser extent. These transactions, which are only entered into with banks, are subject to certain minimum requirements.
The risk of the entire operative foreign-currency position is determined using the value-at-risk concept, supplemented by worst-case analyses. These risk analyses and the hedge result are determined monthly and presented to management.
To present the currency risks in accordance with IFRS 7 for the most important foreign currencies, all monetary assets and monetary liabilities denominated in foreign currency for all consolidated companies were analyzed at the end of the reporting period and sensitivity analyses carried out for the respective currency pairs, in terms of the net risk.
Bosch Annual Report 2013110
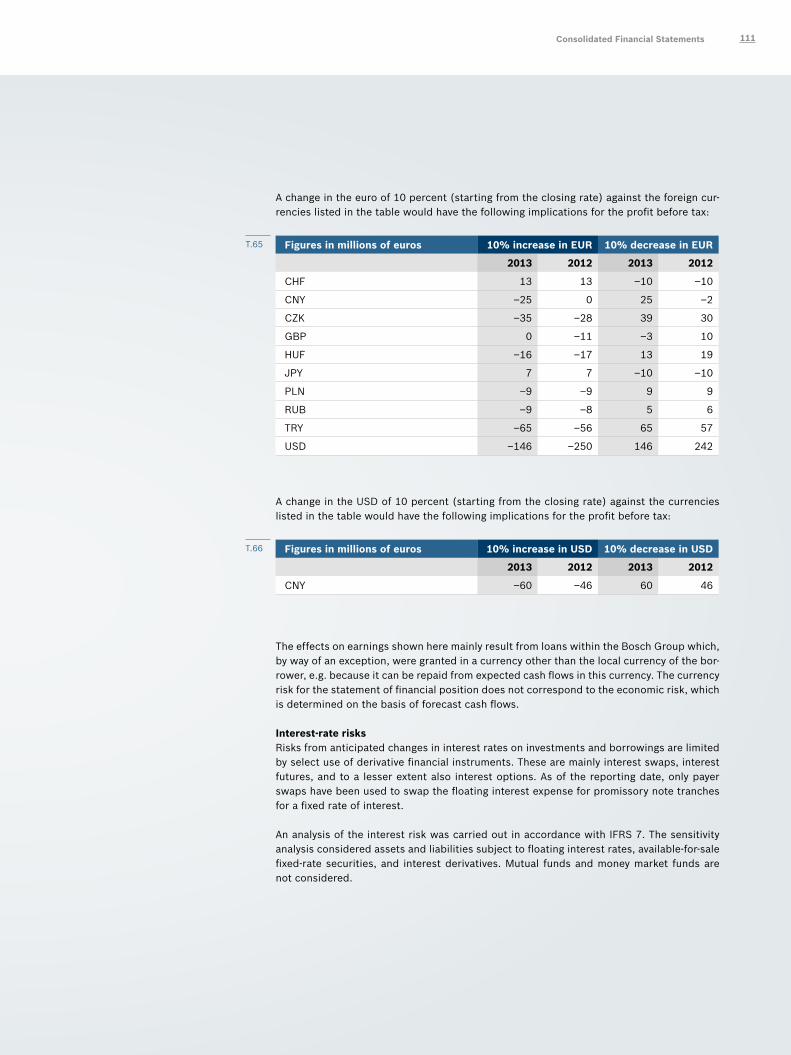
A change in the euro of 10 percent (starting from the closing rate) against the foreign cur-rencies listed in the table would have the following implications for the profit before tax:
Figures in millions of euros 10% increase in EUR 10% decrease in EUR
2013 2012 2013 2012
CHF 13 13 –10 –10
CNY –25 0 25 –2
CZK –35 –28 39 30
GBP 0 –11 –3 10
HUF –16 –17 13 19
JPY 7 7 –10 –10
PLN –9 –9 9 9
RUB –9 –8 5 6
TRY –65 –56 65 57
USD –146 –250 146 242
A change in the USD of 10 percent (starting from the closing rate) against the currencies listed in the table would have the following implications for the profit before tax:
Figures in millions of euros 10% increase in USD 10% decrease in USD
2013 2012 2013 2012
CNY –60 –46 60 46
The effects on earnings shown here mainly result from loans within the Bosch Group which, by way of an exception, were granted in a currency other than the local currency of the bor-rower, e.g. because it can be repaid from expected cash flows in this currency. The currency risk for the statement of financial position does not correspond to the economic risk, which is determined on the basis of forecast cash flows.
Interest-rate risks Risks from anticipated changes in interest rates on investments and borrowings are limited by select use of derivative financial instruments. These are mainly interest swaps, interest futures, and to a lesser extent also interest options. As of the reporting date, only payer swaps have been used to swap the floating interest expense for promissory note tranches for a fixed rate of interest.
An analysis of the interest risk was carried out in accordance with IFRS 7. The sensitivity analysis considered assets and liabilities subject to floating interest rates, available-for-sale fixed-rate securities, and interest derivatives. Mutual funds and money market funds are not considered.
T.65
T.66
Consolidated Financial Statements 111
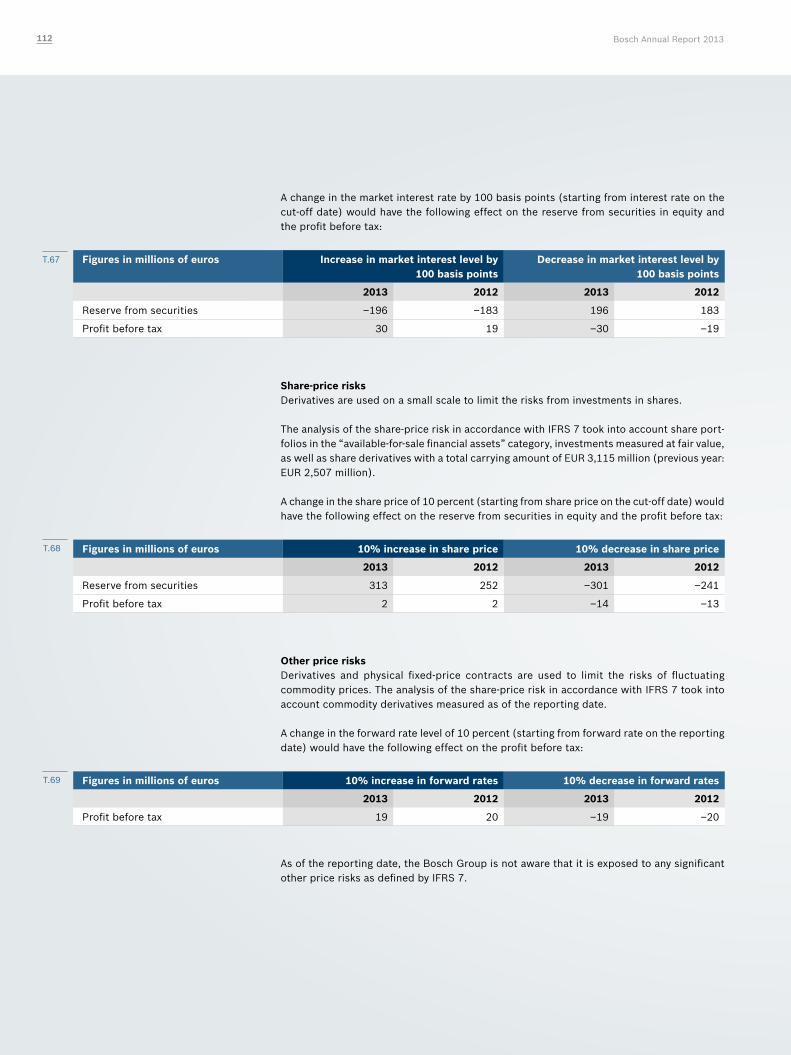
A change in the market interest rate by 100 basis points (starting from interest rate on the cut-off date) would have the following effect on the reserve from securities in equity and the profit before tax:
Figures in millions of euros Increase in market interest level by 100 basis points
Decrease in market interest level by 100 basis points
2013 2012 2013 2012
Reserve from securities –196 –183 196 183
Profit before tax 30 19 –30 –19
Share-price risksDerivatives are used on a small scale to limit the risks from investments in shares.
The analysis of the share-price risk in accordance with IFRS 7 took into account share port-folios in the “available-for-sale financial assets” category, investments measured at fair value, as well as share derivatives with a total carrying amount of EUR 3,115 million (previous year: EUR 2,507 million).
A change in the share price of 10 percent (starting from share price on the cut-off date) would have the following effect on the reserve from securities in equity and the profit before tax:
Figures in millions of euros 10% increase in share price 10% decrease in share price
2013 2012 2013 2012
Reserve from securities 313 252 –301 –241
Profit before tax 2 2 –14 –13
Other price risksDerivatives and physical fixed-price contracts are used to limit the risks of fluctuating commodity prices. The analysis of the share-price risk in accordance with IFRS 7 took into account commodity derivatives measured as of the reporting date.
A change in the forward rate level of 10 percent (starting from forward rate on the reporting date) would have the following effect on the profit before tax:
Figures in millions of euros 10% increase in forward rates 10% decrease in forward rates
2013 2012 2013 2012
Profit before tax 19 20 –19 –20
As of the reporting date, the Bosch Group is not aware that it is exposed to any significant other price risks as defined by IFRS 7.
T.67
T.68
T.69
Bosch Annual Report 2013112
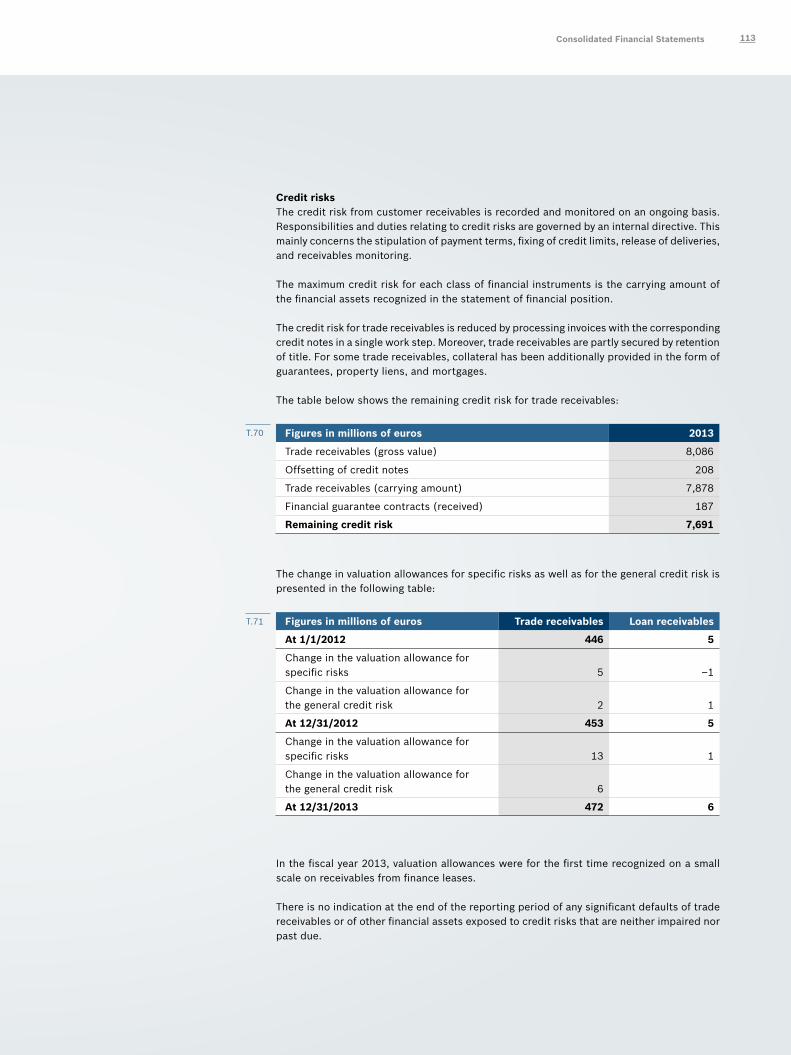
Credit risksThe credit risk from customer receivables is recorded and monitored on an ongoing basis. Responsibilities and duties relating to credit risks are governed by an internal directive. This mainly concerns the stipulation of payment terms, fixing of credit limits, release of deliveries, and receivables monitoring.
The maximum credit risk for each class of financial instruments is the carrying amount of the financial assets recognized in the statement of financial position.
The credit risk for trade receivables is reduced by processing invoices with the corresponding credit notes in a single work step. Moreover, trade receivables are partly secured by retention of title. For some trade receivables, collateral has been additionally provided in the form of guarantees, property liens, and mortgages.
The table below shows the remaining credit risk for trade receivables:
Figures in millions of euros 2013
Trade receivables (gross value) 8,086
Offsetting of credit notes 208
Trade receivables (carrying amount) 7,878
Financial guarantee contracts (received) 187
Remaining credit risk 7,691
The change in valuation allowances for specific risks as well as for the general credit risk is presented in the following table:
Figures in millions of euros Trade receivables Loan receivables
At 1/1/2012 446 5
Change in the valuation allowance for specific risks 5 –1
Change in the valuation allowance for the general credit risk 2 1
At 12/31/2012 453 5
Change in the valuation allowance for specific risks 13 1
Change in the valuation allowance for the general credit risk 6
At 12/31/2013 472 6
In the fiscal year 2013, valuation allowances were for the first time recognized on a small scale on receivables from finance leases.
There is no indication at the end of the reporting period of any significant defaults of trade receivables or of other financial assets exposed to credit risks that are neither impaired nor past due.
T.70
T.71
Consolidated Financial Statements 113
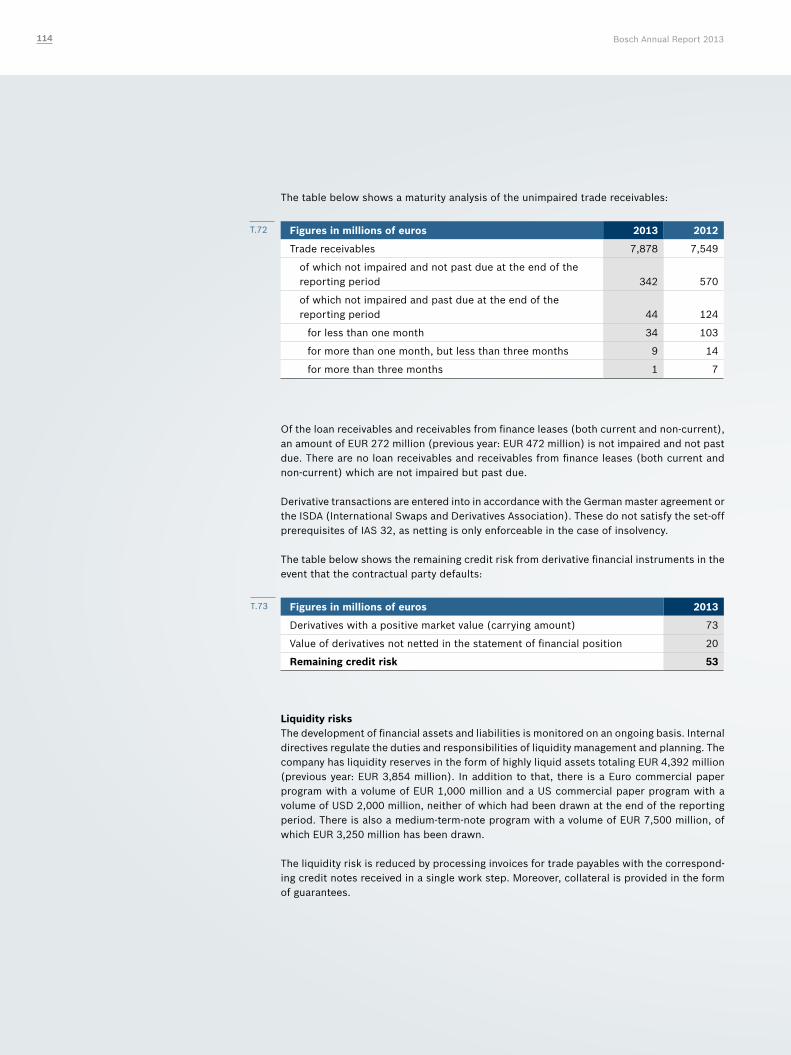
The table below shows a maturity analysis of the unimpaired trade receivables:
Figures in millions of euros 2013 2012
Trade receivables 7,878 7,549
of which not impaired and not past due at the end of the reporting period 342 570
of which not impaired and past due at the end of the reporting period 44 124
for less than one month 34 103
for more than one month, but less than three months 9 14
for more than three months 1 7
Of the loan receivables and receivables from finance leases (both current and non-current), an amount of EUR 272 million (previous year: EUR 472 million) is not impaired and not past due. There are no loan receivables and receivables from finance leases (both current and non-current) which are not impaired but past due.
Derivative transactions are entered into in accordance with the German master agreement or the ISDA (International Swaps and Derivatives Association). These do not satisfy the set-off prerequisites of IAS 32, as netting is only enforceable in the case of insolvency.
The table below shows the remaining credit risk from derivative financial instruments in the event that the contractual party defaults:
Figures in millions of euros 2013
Derivatives with a positive market value (carrying amount) 73
Value of derivatives not netted in the statement of financial position 20
Remaining credit risk 53
Liquidity risksThe development of financial assets and liabilities is monitored on an ongoing basis. Internal directives regulate the duties and responsibilities of liquidity management and planning. The company has liquidity reserves in the form of highly liquid assets totaling EUR 4,392 million (previous year: EUR 3,854 million). In addition to that, there is a Euro commercial paper program with a volume of EUR 1,000 million and a US commercial paper program with a volume of USD 2,000 million, neither of which had been drawn at the end of the reporting period. There is also a medium-term-note program with a volume of EUR 7,500 million, of which EUR 3,250 million has been drawn.
The liquidity risk is reduced by processing invoices for trade payables with the correspond-ing credit notes received in a single work step. Moreover, collateral is provided in the form of guarantees.
T.72
T.73
Bosch Annual Report 2013114
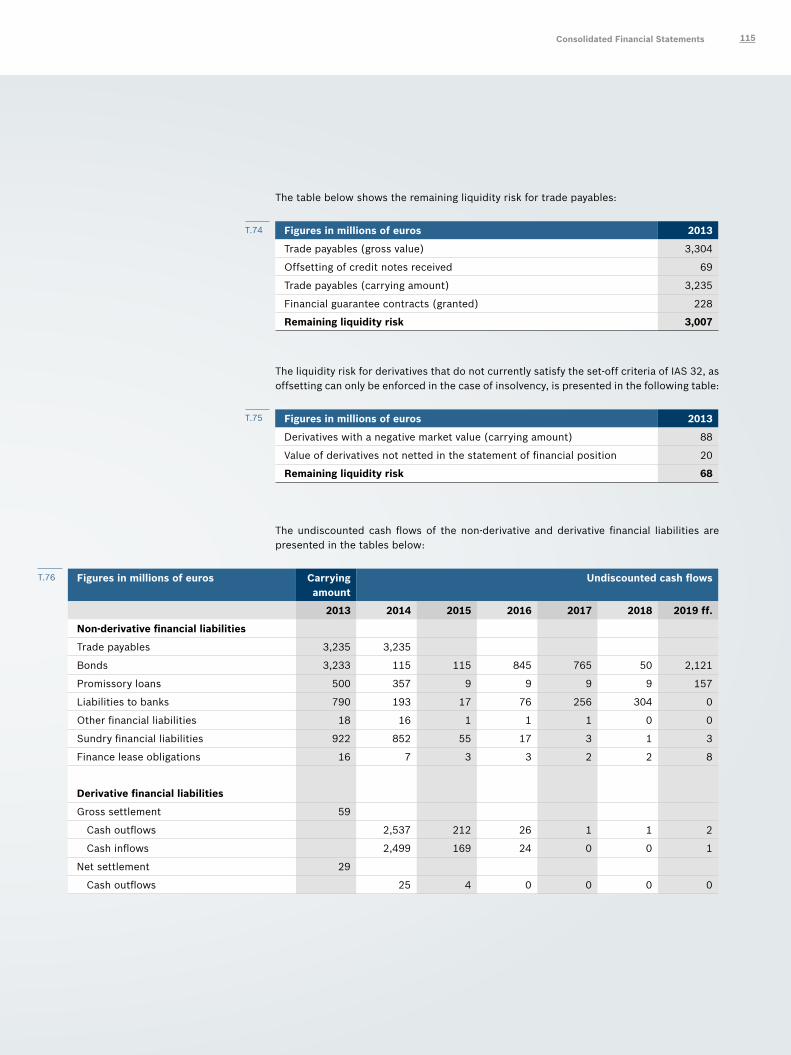
The table below shows the remaining liquidity risk for trade payables:
Figures in millions of euros 2013
Trade payables (gross value) 3,304
Offsetting of credit notes received 69
Trade payables (carrying amount) 3,235
Financial guarantee contracts (granted) 228
Remaining liquidity risk 3,007
The liquidity risk for derivatives that do not currently satisfy the set-off criteria of IAS 32, as offsetting can only be enforced in the case of insolvency, is presented in the following table:
Figures in millions of euros 2013
Derivatives with a negative market value (carrying amount) 88
Value of derivatives not netted in the statement of financial position 20
Remaining liquidity risk 68
The undiscounted cash flows of the non-derivative and derivative financial liabilities are presented in the tables below:
Figures in millions of euros Carrying amount
Undiscounted cash flows
2013 2014 2015 2016 2017 2018 2019 ff.
Non-derivative financial liabilities
Trade payables 3,235 3,235
Bonds 3,233 115 115 845 765 50 2,121
Promissory loans 500 357 9 9 9 9 157
Liabilities to banks 790 193 17 76 256 304 0
Other financial liabilities 18 16 1 1 1 0 0
Sundry financial liabilities 922 852 55 17 3 1 3
Finance lease obligations 16 7 3 3 2 2 8
Derivative financial liabilities
Gross settlement 59
Cash outflows 2,537 212 26 1 1 2
Cash inflows 2,499 169 24 0 0 1
Net settlement 29
Cash outflows 25 4 0 0 0 0
T.74
T.75
T.76
Consolidated Financial Statements 115
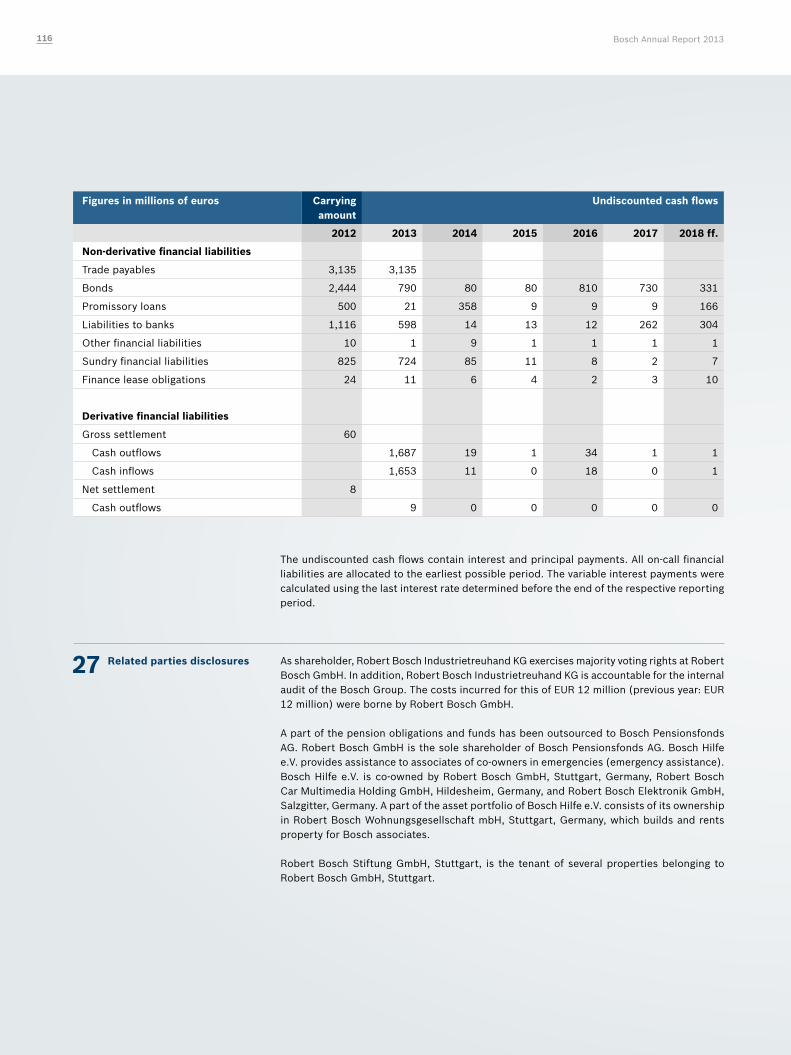
Figures in millions of euros Carrying amount
Undiscounted cash flows
2012 2013 2014 2015 2016 2017 2018 ff.
Non-derivative financial liabilities
Trade payables 3,135 3,135
Bonds 2,444 790 80 80 810 730 331
Promissory loans 500 21 358 9 9 9 166
Liabilities to banks 1,116 598 14 13 12 262 304
Other financial liabilities 10 1 9 1 1 1 1
Sundry financial liabilities 825 724 85 11 8 2 7
Finance lease obligations 24 11 6 4 2 3 10
Derivative financial liabilities
Gross settlement 60
Cash outflows 1,687 19 1 34 1 1
Cash inflows 1,653 11 0 18 0 1
Net settlement 8
Cash outflows 9 0 0 0 0 0
The undiscounted cash flows contain interest and principal payments. All on-call financial liabilities are allocated to the earliest possible period. The variable interest payments were calculated using the last interest rate determined before the end of the respective reporting period.
27 Related parties disclosures As shareholder, Robert Bosch Industrietreuhand KG exercises majority voting rights at Robert Bosch GmbH. In addition, Robert Bosch Industrietreuhand KG is accountable for the internal audit of the Bosch Group. The costs incurred for this of EUR 12 million (previous year: EUR 12 million) were borne by Robert Bosch GmbH.
A part of the pension obligations and funds has been outsourced to Bosch Pensionsfonds AG. Robert Bosch GmbH is the sole shareholder of Bosch Pensionsfonds AG. Bosch Hilfe e.V. provides assistance to associates of co-owners in emergencies (emergency assistance). Bosch Hilfe e.V. is co-owned by Robert Bosch GmbH, Stuttgart, Germany, Robert Bosch Car Multimedia Holding GmbH, Hildesheim, Germany, and Robert Bosch Elektronik GmbH, Salzgitter, Germany. A part of the asset portfolio of Bosch Hilfe e.V. consists of its ownership in Robert Bosch Wohnungsgesellschaft mbH, Stuttgart, Germany, which builds and rents property for Bosch associates.
Robert Bosch Stiftung GmbH, Stuttgart, is the tenant of several properties belonging to Robert Bosch GmbH, Stuttgart.
Bosch Annual Report 2013116
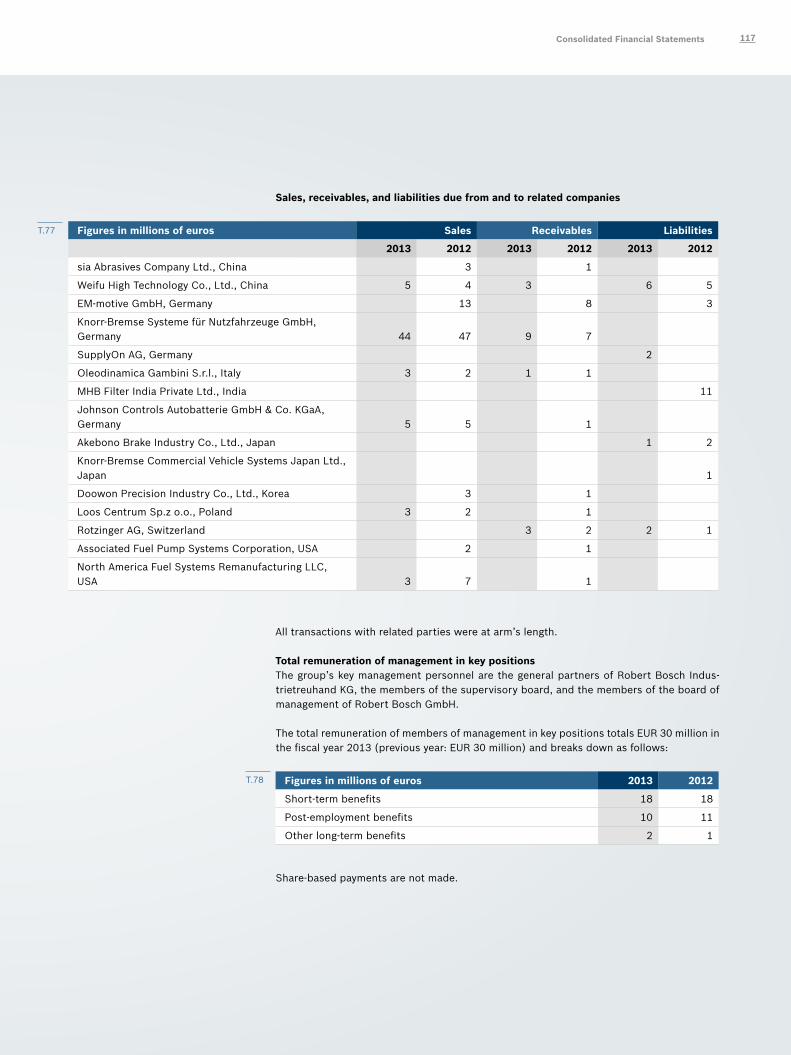
Sales, receivables, and liabilities due from and to related companies
Figures in millions of euros Sales Receivables Liabilities
2013 2012 2013 2012 2013 2012
sia Abrasives Company Ltd., China 3 1
Weifu High Technology Co., Ltd., China 5 4 3 6 5
EM-motive GmbH, Germany 13 8 3
Knorr-Bremse Systeme für Nutzfahrzeuge GmbH, Germany 44 47 9 7
SupplyOn AG, Germany 2
Oleodinamica Gambini S.r.l., Italy 3 2 1 1
MHB Filter India Private Ltd., India 11
Johnson Controls Autobatterie GmbH & Co. KGaA, Germany 5 5 1
Akebono Brake Industry Co., Ltd., Japan 1 2
Knorr-Bremse Commercial Vehicle Systems Japan Ltd., Japan 1
Doowon Precision Industry Co., Ltd., Korea 3 1
Loos Centrum Sp.z o.o., Poland 3 2 1
Rotzinger AG, Switzerland 3 2 2 1
Associated Fuel Pump Systems Corporation, USA 2 1
North America Fuel Systems Remanufacturing LLC, USA 3 7 1
All transactions with related parties were at arm’s length.
Total remuneration of management in key positionsThe group’s key management personnel are the general partners of Robert Bosch Indus-trietreuhand KG, the members of the supervisory board, and the members of the board of management of Robert Bosch GmbH.
The total remuneration of members of management in key positions totals EUR 30 million in the fiscal year 2013 (previous year: EUR 30 million) and breaks down as follows:
Figures in millions of euros 2013 2012
Short-term benefits 18 18
Post-employment benefits 10 11
Other long-term benefits 2 1
Share-based payments are not made.
T.77
T.78
Consolidated Financial Statements 117
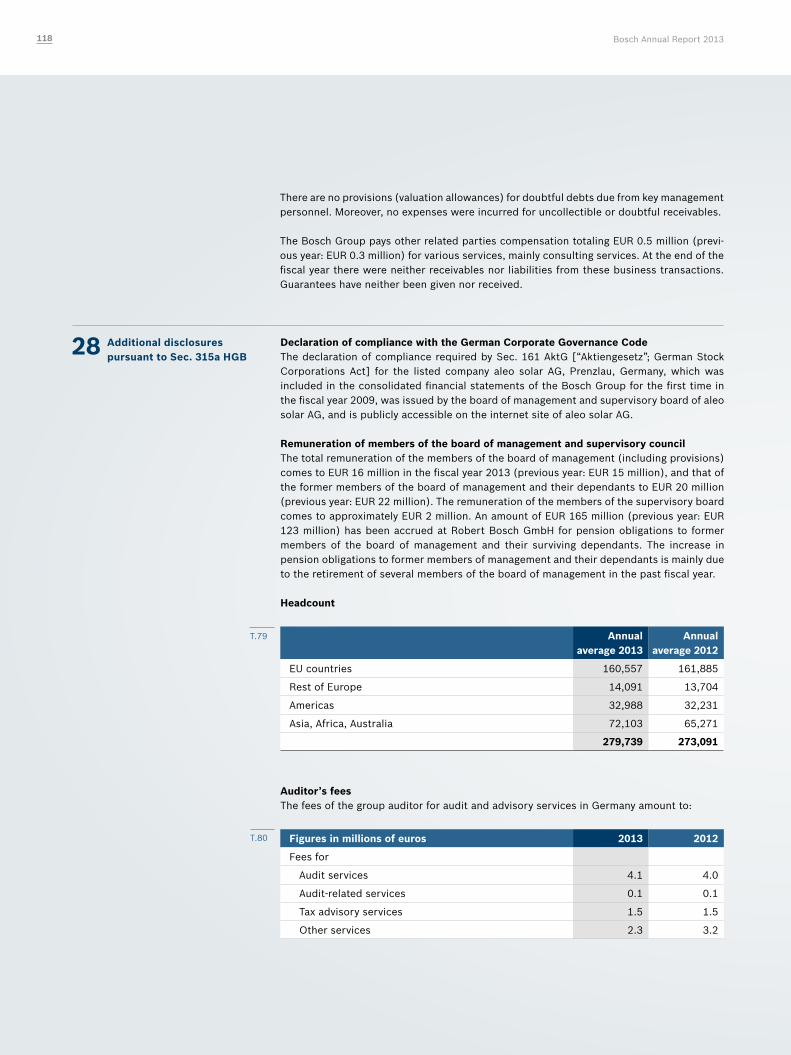
There are no provisions (valuation allowances) for doubtful debts due from key management personnel. Moreover, no expenses were incurred for uncollectible or doubtful receivables.
The Bosch Group pays other related parties compensation totaling EUR 0.5 million (previ-ous year: EUR 0.3 million) for various services, mainly consulting services. At the end of the fiscal year there were neither receivables nor liabilities from these business transactions. Guarantees have neither been given nor received.
28 Additional disclosures pursuant to Sec. 315a HGB
Declaration of compliance with the German Corporate Governance CodeThe declaration of compliance required by Sec. 161 AktG [“Aktiengesetz”; German Stock Corporations Act] for the listed company aleo solar AG, Prenzlau, Germany, which was included in the consolidated financial statements of the Bosch Group for the first time in the fiscal year 2009, was issued by the board of management and supervisory board of aleo solar AG, and is publicly accessible on the internet site of aleo solar AG.
Remuneration of members of the board of management and supervisory councilThe total remuneration of the members of the board of management (including provisions) comes to EUR 16 million in the fiscal year 2013 (previous year: EUR 15 million), and that of the former members of the board of management and their dependants to EUR 20 million (previous year: EUR 22 million). The remuneration of the members of the supervisory board comes to approximately EUR 2 million. An amount of EUR 165 million (previous year: EUR 123 million) has been accrued at Robert Bosch GmbH for pension obligations to former members of the board of management and their surviving dependants. The increase in pension obligations to former members of management and their dependants is mainly due to the retirement of several members of the board of management in the past fiscal year. Headcount
Annual average 2013
Annual average 2012
EU countries 160,557 161,885
Rest of Europe 14,091 13,704
Americas 32,988 32,231
Asia, Africa, Australia 72,103 65,271
279,739 273,091
Auditor’s feesThe fees of the group auditor for audit and advisory services in Germany amount to:
Figures in millions of euros 2013 2012
Fees for
Audit services 4.1 4.0
Audit-related services 0.1 0.1
Tax advisory services 1.5 1.5
Other services 2.3 3.2
T.79
T.80
Bosch Annual Report 2013118
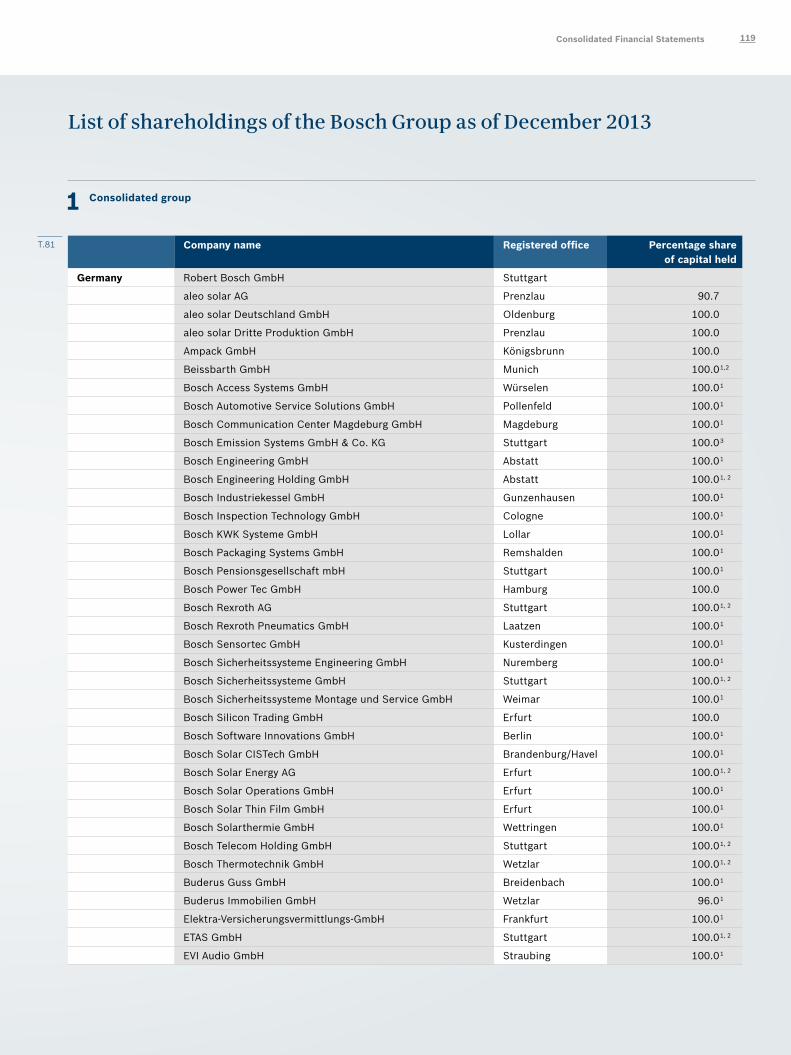
List of shareholdings of the Bosch Group as of December 2013
1 Consolidated group
Company name Registered office Percentage share of capital held
Germany Robert Bosch GmbH Stuttgart
aleo solar AG Prenzlau 90.7
aleo solar Deutschland GmbH Oldenburg 100.0
aleo solar Dritte Produktion GmbH Prenzlau 100.0
Ampack GmbH Königsbrunn 100.0
Beissbarth GmbH Munich 100.01,2
Bosch Access Systems GmbH Würselen 100.01
Bosch Automotive Service Solutions GmbH Pollenfeld 100.01
Bosch Communication Center Magdeburg GmbH Magdeburg 100.01
Bosch Emission Systems GmbH & Co. KG Stuttgart 100.03
Bosch Engineering GmbH Abstatt 100.01
Bosch Engineering Holding GmbH Abstatt 100.01, 2
Bosch Industriekessel GmbH Gunzenhausen 100.01
Bosch Inspection Technology GmbH Cologne 100.01
Bosch KWK Systeme GmbH Lollar 100.01
Bosch Packaging Systems GmbH Remshalden 100.01
Bosch Pensionsgesellschaft mbH Stuttgart 100.01
Bosch Power Tec GmbH Hamburg 100.0
Bosch Rexroth AG Stuttgart 100.01, 2
Bosch Rexroth Pneumatics GmbH Laatzen 100.01
Bosch Sensortec GmbH Kusterdingen 100.01
Bosch Sicherheitssysteme Engineering GmbH Nuremberg 100.01
Bosch Sicherheitssysteme GmbH Stuttgart 100.01, 2
Bosch Sicherheitssysteme Montage und Service GmbH Weimar 100.01
Bosch Silicon Trading GmbH Erfurt 100.0
Bosch Software Innovations GmbH Berlin 100.01
Bosch Solar CISTech GmbH Brandenburg/Havel 100.01
Bosch Solar Energy AG Erfurt 100.01, 2
Bosch Solar Operations GmbH Erfurt 100.01
Bosch Solar Thin Film GmbH Erfurt 100.01
Bosch Solarthermie GmbH Wettringen 100.01
Bosch Telecom Holding GmbH Stuttgart 100.01, 2
Bosch Thermotechnik GmbH Wetzlar 100.01, 2
Buderus Guss GmbH Breidenbach 100.01
Buderus Immobilien GmbH Wetzlar 96.01
Elektra-Versicherungsvermittlungs-GmbH Frankfurt 100.01
ETAS GmbH Stuttgart 100.01, 2
EVI Audio GmbH Straubing 100.01
T.81
Consolidated Financial Statements 119
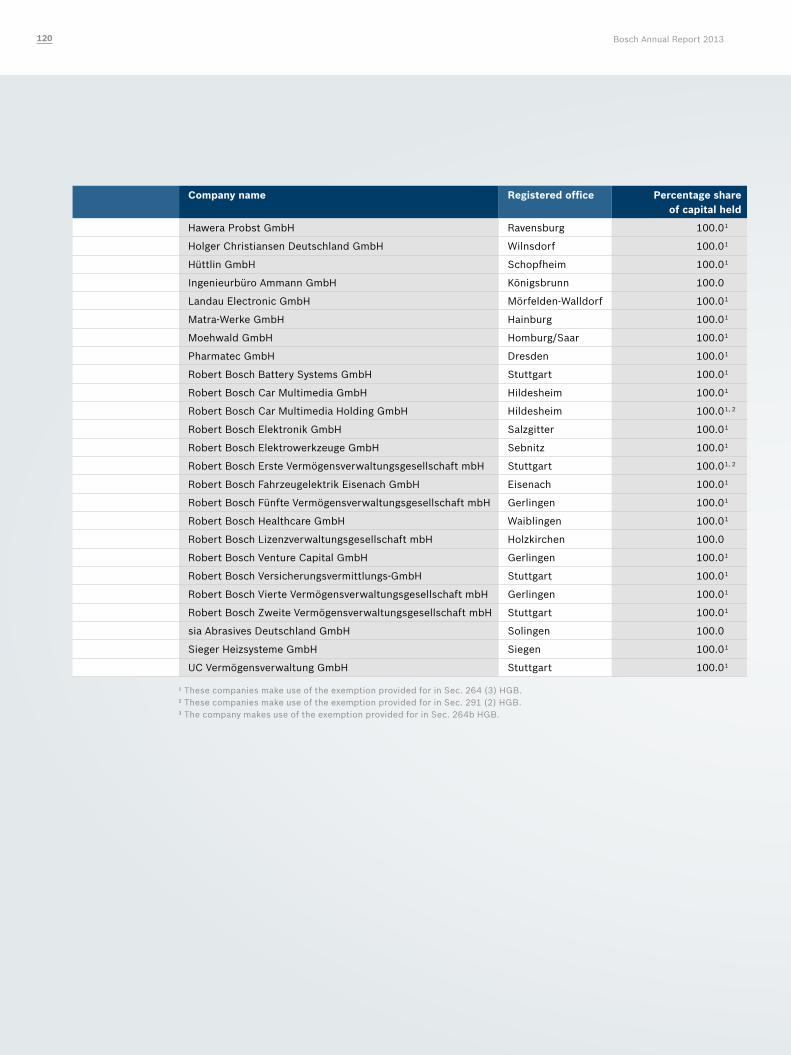
Company name Registered office Percentage share of capital held
Hawera Probst GmbH Ravensburg 100.01
Holger Christiansen Deutschland GmbH Wilnsdorf 100.01
Hüttlin GmbH Schopfheim 100.01
Ingenieurbüro Ammann GmbH Königsbrunn 100.0
Landau Electronic GmbH Mörfelden-Walldorf 100.01
Matra-Werke GmbH Hainburg 100.01
Moehwald GmbH Homburg/Saar 100.01
Pharmatec GmbH Dresden 100.01
Robert Bosch Battery Systems GmbH Stuttgart 100.01
Robert Bosch Car Multimedia GmbH Hildesheim 100.01
Robert Bosch Car Multimedia Holding GmbH Hildesheim 100.01, 2
Robert Bosch Elektronik GmbH Salzgitter 100.01
Robert Bosch Elektrowerkzeuge GmbH Sebnitz 100.01
Robert Bosch Erste Vermögensverwaltungsgesellschaft mbH Stuttgart 100.01, 2
Robert Bosch Fahrzeugelektrik Eisenach GmbH Eisenach 100.01
Robert Bosch Fünfte Vermögensverwaltungsgesellschaft mbH Gerlingen 100.01
Robert Bosch Healthcare GmbH Waiblingen 100.01
Robert Bosch Lizenzverwaltungsgesellschaft mbH Holzkirchen 100.0
Robert Bosch Venture Capital GmbH Gerlingen 100.01
Robert Bosch Versicherungsvermittlungs-GmbH Stuttgart 100.01
Robert Bosch Vierte Vermögensverwaltungsgesellschaft mbH Gerlingen 100.01
Robert Bosch Zweite Vermögensverwaltungsgesellschaft mbH Stuttgart 100.01
sia Abrasives Deutschland GmbH Solingen 100.0
Sieger Heizsysteme GmbH Siegen 100.01
UC Vermögensverwaltung GmbH Stuttgart 100.01
¹ These companies make use of the exemption provided for in Sec. 264 (3) HGB.² These companies make use of the exemption provided for in Sec. 291 (2) HGB.³ The company makes use of the exemption provided for in Sec. 264b HGB.
Bosch Annual Report 2013120
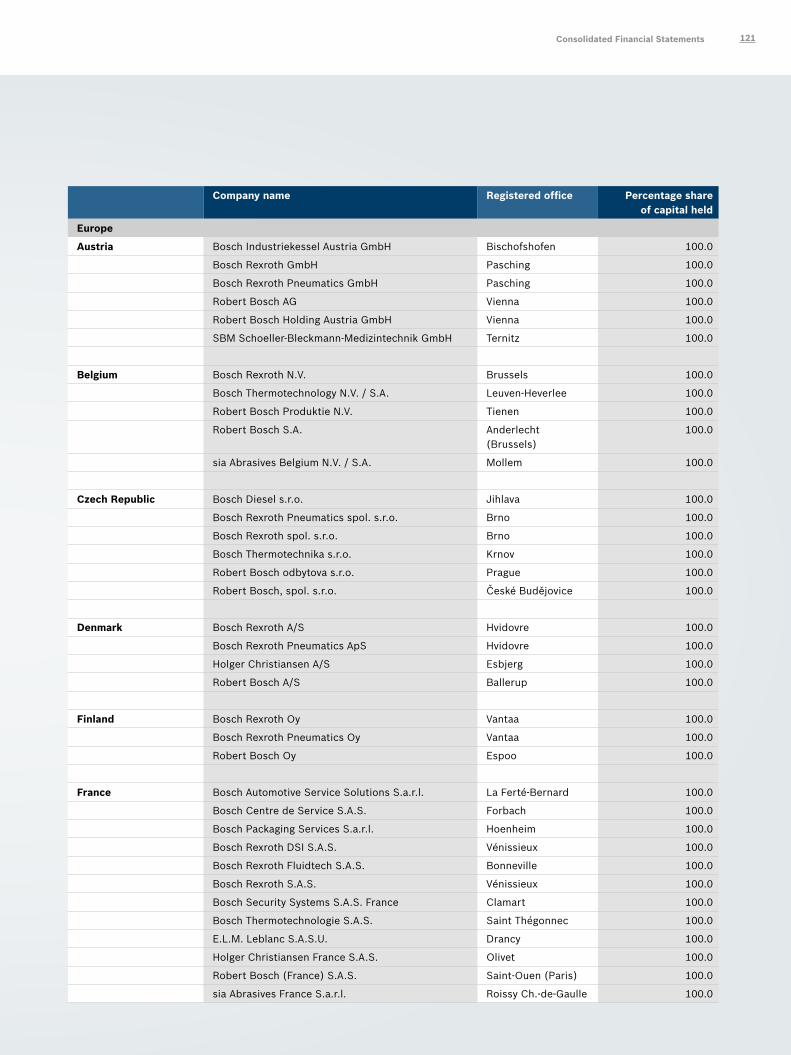
Company name Registered office Percentage share of capital held
Europe
Austria Bosch Industriekessel Austria GmbH Bischofshofen 100.0
Bosch Rexroth GmbH Pasching 100.0
Bosch Rexroth Pneumatics GmbH Pasching 100.0
Robert Bosch AG Vienna 100.0
Robert Bosch Holding Austria GmbH Vienna 100.0
SBM Schoeller-Bleckmann-Medizintechnik GmbH Ternitz 100.0
Belgium Bosch Rexroth N.V. Brussels 100.0
Bosch Thermotechnology N.V. / S.A. Leuven-Heverlee 100.0
Robert Bosch Produktie N.V. Tienen 100.0
Robert Bosch S.A. Anderlecht (Brussels)
100.0
sia Abrasives Belgium N.V. / S.A. Mollem 100.0
Czech Republic Bosch Diesel s.r.o. Jihlava 100.0
Bosch Rexroth Pneumatics spol. s.r.o. Brno 100.0
Bosch Rexroth spol. s.r.o. Brno 100.0
Bosch Thermotechnika s.r.o. Krnov 100.0
Robert Bosch odbytova s.r.o. Prague 100.0
Robert Bosch, spol. s.r.o. České Budějovice 100.0
Denmark Bosch Rexroth A/S Hvidovre 100.0
Bosch Rexroth Pneumatics ApS Hvidovre 100.0
Holger Christiansen A/S Esbjerg 100.0
Robert Bosch A/S Ballerup 100.0
Finland Bosch Rexroth Oy Vantaa 100.0
Bosch Rexroth Pneumatics Oy Vantaa 100.0
Robert Bosch Oy Espoo 100.0
France Bosch Automotive Service Solutions S.a.r.l. La Ferté-Bernard 100.0
Bosch Centre de Service S.A.S. Forbach 100.0
Bosch Packaging Services S.a.r.l. Hoenheim 100.0
Bosch Rexroth DSI S.A.S. Vénissieux 100.0
Bosch Rexroth Fluidtech S.A.S. Bonneville 100.0
Bosch Rexroth S.A.S. Vénissieux 100.0
Bosch Security Systems S.A.S. France Clamart 100.0
Bosch Thermotechnologie S.A.S. Saint Thégonnec 100.0
E.L.M. Leblanc S.A.S.U. Drancy 100.0
Holger Christiansen France S.A.S. Olivet 100.0
Robert Bosch (France) S.A.S. Saint-Ouen (Paris) 100.0
sia Abrasives France S.a.r.l. Roissy Ch.-de-Gaulle 100.0
Consolidated Financial Statements 121
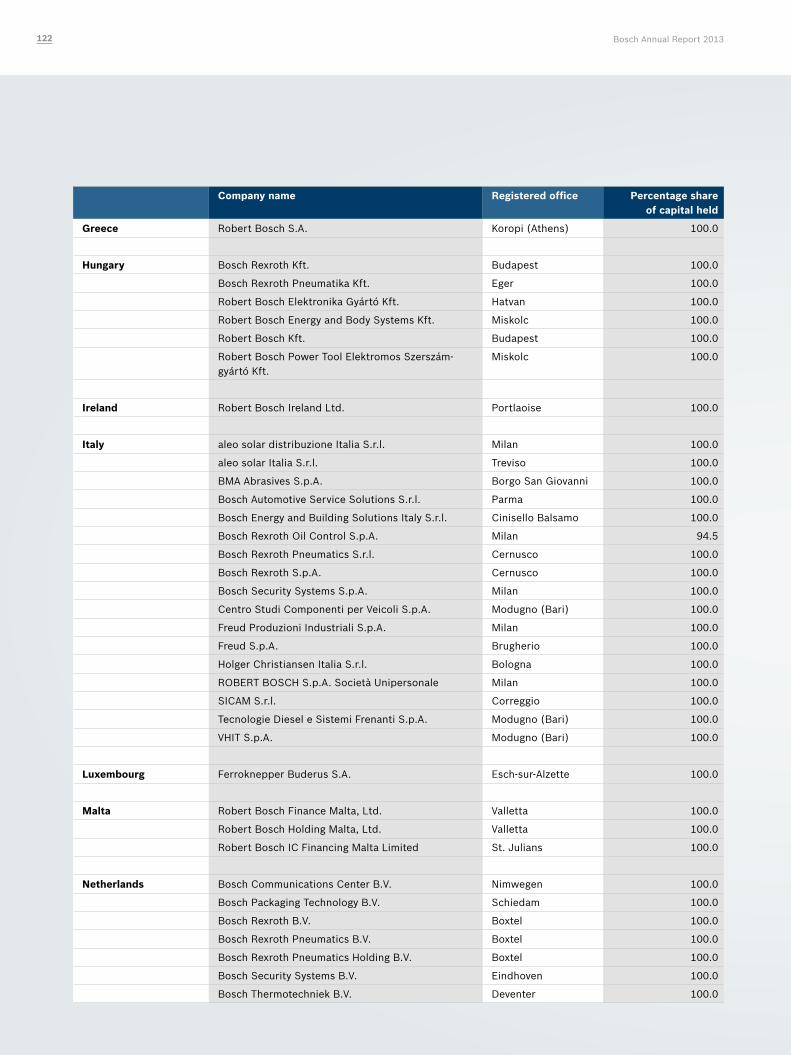
Company name Registered office Percentage share of capital held
Greece Robert Bosch S.A. Koropi (Athens) 100.0
Hungary Bosch Rexroth Kft. Budapest 100.0
Bosch Rexroth Pneumatika Kft. Eger 100.0
Robert Bosch Elektronika Gyártó Kft. Hatvan 100.0
Robert Bosch Energy and Body Systems Kft. Miskolc 100.0
Robert Bosch Kft. Budapest 100.0
Robert Bosch Power Tool Elektromos Szerszám-gyártó Kft.
Miskolc 100.0
Ireland Robert Bosch Ireland Ltd. Portlaoise 100.0
Italy aleo solar distribuzione Italia S.r.l. Milan 100.0
aleo solar Italia S.r.l. Treviso 100.0
BMA Abrasives S.p.A. Borgo San Giovanni 100.0
Bosch Automotive Service Solutions S.r.l. Parma 100.0
Bosch Energy and Building Solutions Italy S.r.l. Cinisello Balsamo 100.0
Bosch Rexroth Oil Control S.p.A. Milan 94.5
Bosch Rexroth Pneumatics S.r.l. Cernusco 100.0
Bosch Rexroth S.p.A. Cernusco 100.0
Bosch Security Systems S.p.A. Milan 100.0
Centro Studi Componenti per Veicoli S.p.A. Modugno (Bari) 100.0
Freud Produzioni Industriali S.p.A. Milan 100.0
Freud S.p.A. Brugherio 100.0
Holger Christiansen Italia S.r.l. Bologna 100.0
ROBERT BOSCH S.p.A. Società Unipersonale Milan 100.0
SICAM S.r.l. Correggio 100.0
Tecnologie Diesel e Sistemi Frenanti S.p.A. Modugno (Bari) 100.0
VHIT S.p.A. Modugno (Bari) 100.0
Luxembourg Ferroknepper Buderus S.A. Esch-sur-Alzette 100.0
Malta Robert Bosch Finance Malta, Ltd. Valletta 100.0
Robert Bosch Holding Malta, Ltd. Valletta 100.0
Robert Bosch IC Financing Malta Limited St. Julians 100.0
Netherlands Bosch Communications Center B.V. Nimwegen 100.0
Bosch Packaging Technology B.V. Schiedam 100.0
Bosch Rexroth B.V. Boxtel 100.0
Bosch Rexroth Pneumatics B.V. Boxtel 100.0
Bosch Rexroth Pneumatics Holding B.V. Boxtel 100.0
Bosch Security Systems B.V. Eindhoven 100.0
Bosch Thermotechniek B.V. Deventer 100.0
Bosch Annual Report 2013122
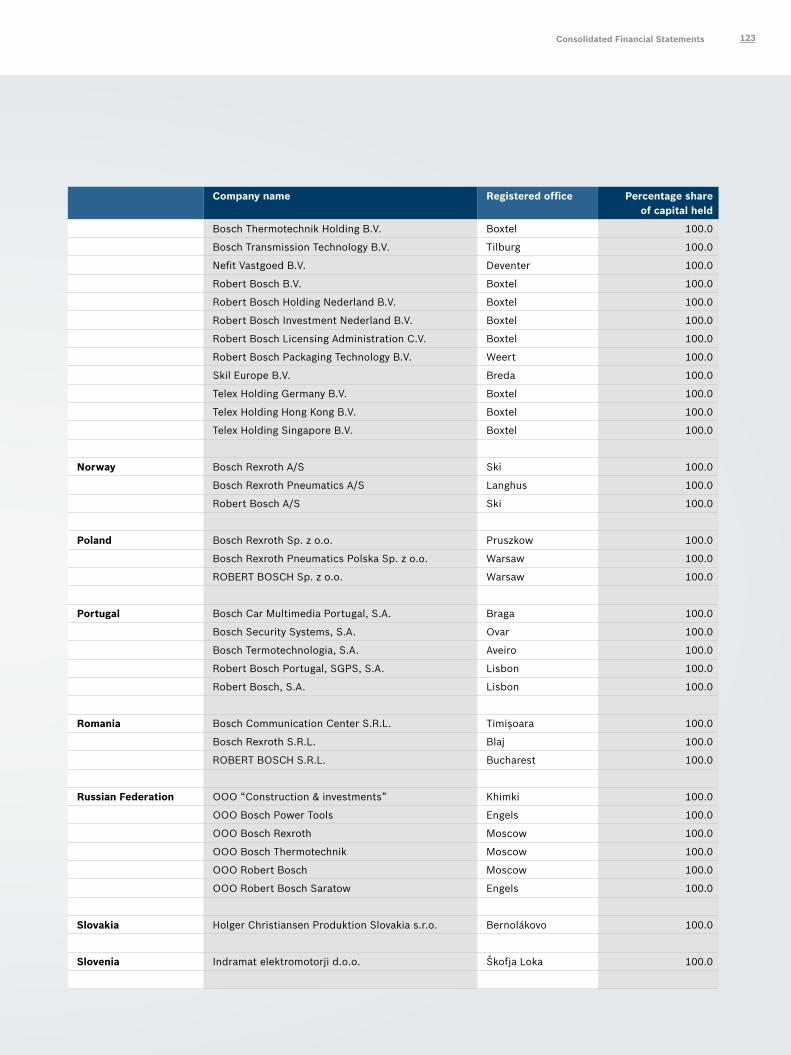
Company name Registered office Percentage share of capital held
Bosch Thermotechnik Holding B.V. Boxtel 100.0
Bosch Transmission Technology B.V. Tilburg 100.0
Nefit Vastgoed B.V. Deventer 100.0
Robert Bosch B.V. Boxtel 100.0
Robert Bosch Holding Nederland B.V. Boxtel 100.0
Robert Bosch Investment Nederland B.V. Boxtel 100.0
Robert Bosch Licensing Administration C.V. Boxtel 100.0
Robert Bosch Packaging Technology B.V. Weert 100.0
Skil Europe B.V. Breda 100.0
Telex Holding Germany B.V. Boxtel 100.0
Telex Holding Hong Kong B.V. Boxtel 100.0
Telex Holding Singapore B.V. Boxtel 100.0
Norway Bosch Rexroth A/S Ski 100.0
Bosch Rexroth Pneumatics A/S Langhus 100.0
Robert Bosch A/S Ski 100.0
Poland Bosch Rexroth Sp. z o.o. Pruszkow 100.0
Bosch Rexroth Pneumatics Polska Sp. z o.o. Warsaw 100.0
ROBERT BOSCH Sp. z o.o. Warsaw 100.0
Portugal Bosch Car Multimedia Portugal, S.A. Braga 100.0
Bosch Security Systems, S.A. Ovar 100.0
Bosch Termotechnologia, S.A. Aveiro 100.0
Robert Bosch Portugal, SGPS, S.A. Lisbon 100.0
Robert Bosch, S.A. Lisbon 100.0
Romania Bosch Communication Center S.R.L. Timișoara 100.0
Bosch Rexroth S.R.L. Blaj 100.0
ROBERT BOSCH S.R.L. Bucharest 100.0
Russian Federation OOO “Construction & investments” Khimki 100.0
OOO Bosch Power Tools Engels 100.0
OOO Bosch Rexroth Moscow 100.0
OOO Bosch Thermotechnik Moscow 100.0
OOO Robert Bosch Moscow 100.0
OOO Robert Bosch Saratow Engels 100.0
Slovakia Holger Christiansen Produktion Slovakia s.r.o. Bernolákovo 100.0
Slovenia Indramat elektromotorji d.o.o. Škofja Loka 100.0
Consolidated Financial Statements 123
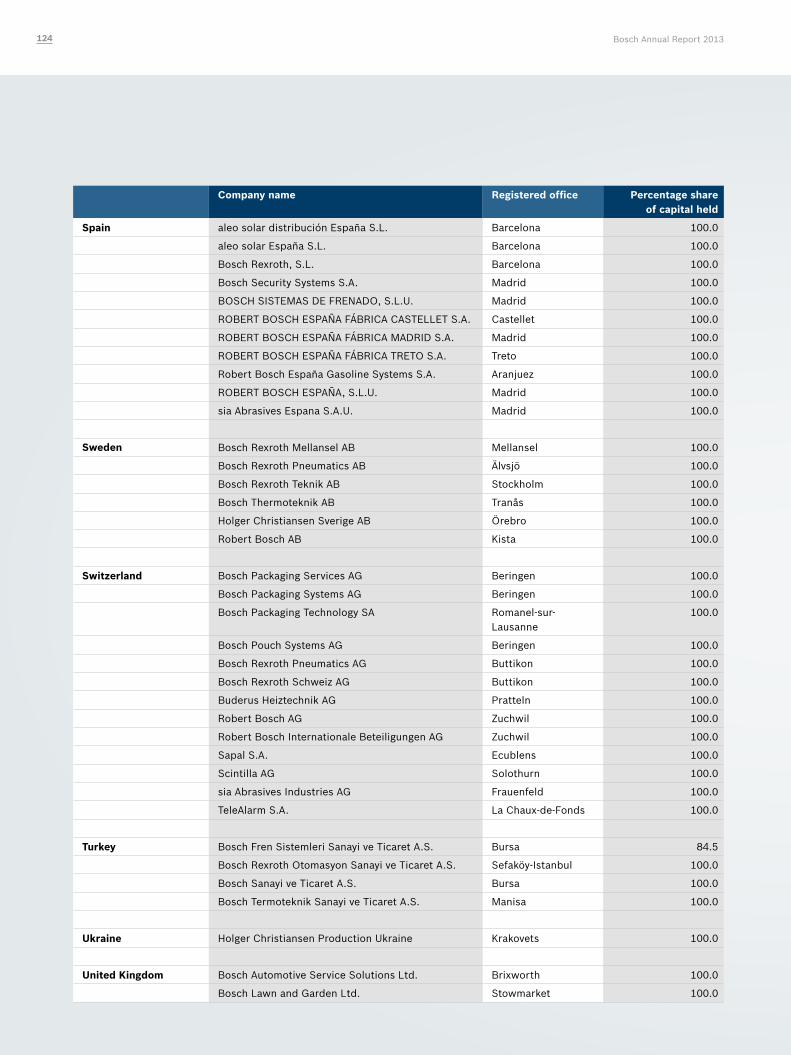
Company name Registered office Percentage share of capital held
Spain aleo solar distribución España S.L. Barcelona 100.0
aleo solar España S.L. Barcelona 100.0
Bosch Rexroth, S.L. Barcelona 100.0
Bosch Security Systems S.A. Madrid 100.0
BOSCH SISTEMAS DE FRENADO, S.L.U. Madrid 100.0
ROBERT BOSCH ESPAÑA FÁBRICA CASTELLET S.A. Castellet 100.0
ROBERT BOSCH ESPAÑA FÁBRICA MADRID S.A. Madrid 100.0
ROBERT BOSCH ESPAÑA FÁBRICA TRETO S.A. Treto 100.0
Robert Bosch España Gasoline Systems S.A. Aranjuez 100.0
ROBERT BOSCH ESPAÑA, S.L.U. Madrid 100.0
sia Abrasives Espana S.A.U. Madrid 100.0
Sweden Bosch Rexroth Mellansel AB Mellansel 100.0
Bosch Rexroth Pneumatics AB Älvsjö 100.0
Bosch Rexroth Teknik AB Stockholm 100.0
Bosch Thermoteknik AB Tranås 100.0
Holger Christiansen Sverige AB Örebro 100.0
Robert Bosch AB Kista 100.0
Switzerland Bosch Packaging Services AG Beringen 100.0
Bosch Packaging Systems AG Beringen 100.0
Bosch Packaging Technology SA Romanel-sur- Lausanne
100.0
Bosch Pouch Systems AG Beringen 100.0
Bosch Rexroth Pneumatics AG Buttikon 100.0
Bosch Rexroth Schweiz AG Buttikon 100.0
Buderus Heiztechnik AG Pratteln 100.0
Robert Bosch AG Zuchwil 100.0
Robert Bosch Internationale Beteiligungen AG Zuchwil 100.0
Sapal S.A. Ecublens 100.0
Scintilla AG Solothurn 100.0
sia Abrasives Industries AG Frauenfeld 100.0
TeleAlarm S.A. La Chaux-de-Fonds 100.0
Turkey Bosch Fren Sistemleri Sanayi ve Ticaret A.S. Bursa 84.5
Bosch Rexroth Otomasyon Sanayi ve Ticaret A.S. Sefaköy-Istanbul 100.0
Bosch Sanayi ve Ticaret A.S. Bursa 100.0
Bosch Termoteknik Sanayi ve Ticaret A.S. Manisa 100.0
Ukraine Holger Christiansen Production Ukraine Krakovets 100.0
United Kingdom Bosch Automotive Service Solutions Ltd. Brixworth 100.0
Bosch Lawn and Garden Ltd. Stowmarket 100.0
Bosch Annual Report 2013124
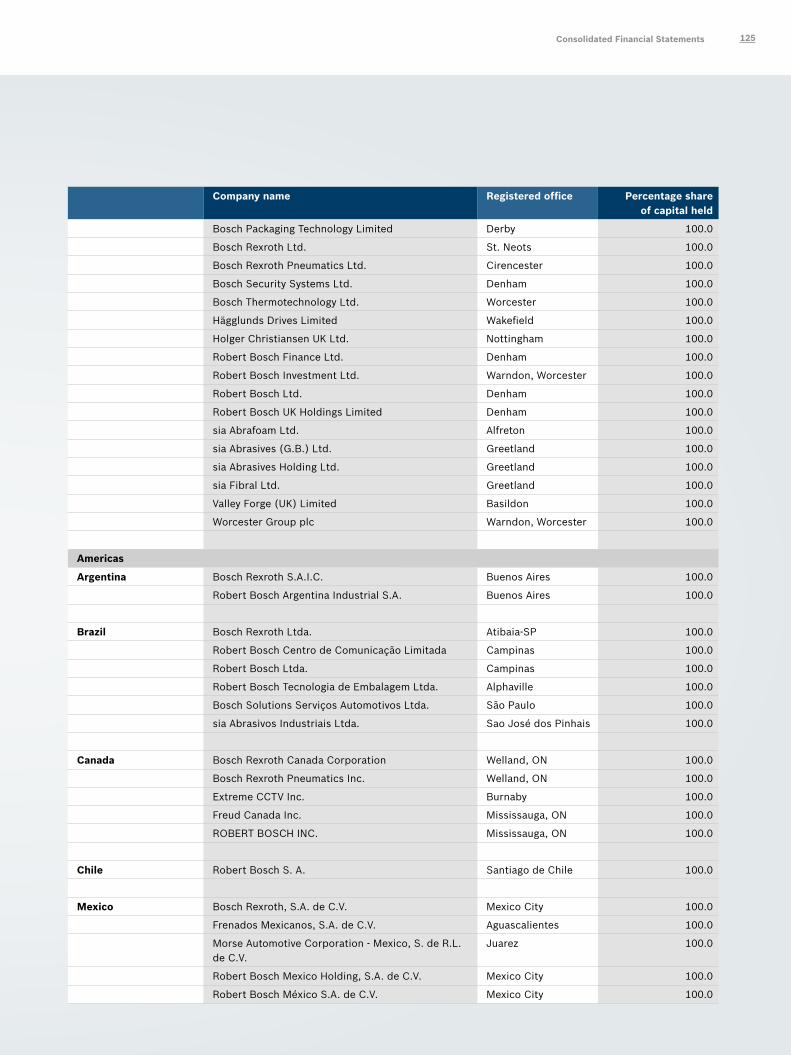
Company name Registered office Percentage share of capital held
Bosch Packaging Technology Limited Derby 100.0
Bosch Rexroth Ltd. St. Neots 100.0
Bosch Rexroth Pneumatics Ltd. Cirencester 100.0
Bosch Security Systems Ltd. Denham 100.0
Bosch Thermotechnology Ltd. Worcester 100.0
Hägglunds Drives Limited Wakefield 100.0
Holger Christiansen UK Ltd. Nottingham 100.0
Robert Bosch Finance Ltd. Denham 100.0
Robert Bosch Investment Ltd. Warndon, Worcester 100.0
Robert Bosch Ltd. Denham 100.0
Robert Bosch UK Holdings Limited Denham 100.0
sia Abrafoam Ltd. Alfreton 100.0
sia Abrasives (G.B.) Ltd. Greetland 100.0
sia Abrasives Holding Ltd. Greetland 100.0
sia Fibral Ltd. Greetland 100.0
Valley Forge (UK) Limited Basildon 100.0
Worcester Group plc Warndon, Worcester 100.0
Americas
Argentina Bosch Rexroth S.A.I.C. Buenos Aires 100.0
Robert Bosch Argentina Industrial S.A. Buenos Aires 100.0
Brazil Bosch Rexroth Ltda. Atibaia-SP 100.0
Robert Bosch Centro de Comunicação Limitada Campinas 100.0
Robert Bosch Ltda. Campinas 100.0
Robert Bosch Tecnologia de Embalagem Ltda. Alphaville 100.0
Bosch Solutions Serviços Automotivos Ltda. São Paulo 100.0
sia Abrasivos Industriais Ltda. Sao José dos Pinhais 100.0
Canada Bosch Rexroth Canada Corporation Welland, ON 100.0
Bosch Rexroth Pneumatics Inc. Welland, ON 100.0
Extreme CCTV Inc. Burnaby 100.0
Freud Canada Inc. Mississauga, ON 100.0
ROBERT BOSCH INC. Mississauga, ON 100.0
Chile Robert Bosch S. A. Santiago de Chile 100.0
Mexico Bosch Rexroth, S.A. de C.V. Mexico City 100.0
Frenados Mexicanos, S.A. de C.V. Aguascalientes 100.0
Morse Automotive Corporation - Mexico, S. de R.L. de C.V.
Juarez 100.0
Robert Bosch Mexico Holding, S.A. de C.V. Mexico City 100.0
Robert Bosch México S.A. de C.V. Mexico City 100.0
Consolidated Financial Statements 125
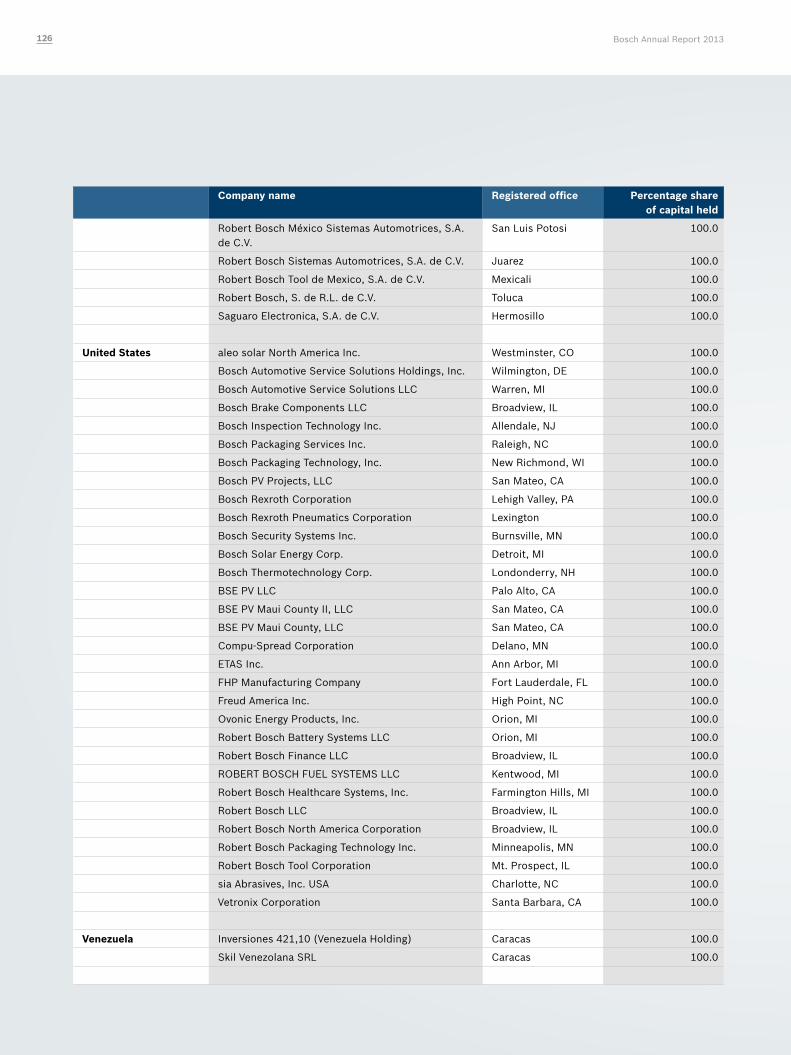
Company name Registered office Percentage share of capital held
Robert Bosch México Sistemas Automotrices, S.A. de C.V.
San Luis Potosi 100.0
Robert Bosch Sistemas Automotrices, S.A. de C.V. Juarez 100.0
Robert Bosch Tool de Mexico, S.A. de C.V. Mexicali 100.0
Robert Bosch, S. de R.L. de C.V. Toluca 100.0
Saguaro Electronica, S.A. de C.V. Hermosillo 100.0
United States aleo solar North America Inc. Westminster, CO 100.0
Bosch Automotive Service Solutions Holdings, Inc. Wilmington, DE 100.0
Bosch Automotive Service Solutions LLC Warren, MI 100.0
Bosch Brake Components LLC Broadview, IL 100.0
Bosch Inspection Technology Inc. Allendale, NJ 100.0
Bosch Packaging Services Inc. Raleigh, NC 100.0
Bosch Packaging Technology, Inc. New Richmond, WI 100.0
Bosch PV Projects, LLC San Mateo, CA 100.0
Bosch Rexroth Corporation Lehigh Valley, PA 100.0
Bosch Rexroth Pneumatics Corporation Lexington 100.0
Bosch Security Systems Inc. Burnsville, MN 100.0
Bosch Solar Energy Corp. Detroit, MI 100.0
Bosch Thermotechnology Corp. Londonderry, NH 100.0
BSE PV LLC Palo Alto, CA 100.0
BSE PV Maui County II, LLC San Mateo, CA 100.0
BSE PV Maui County, LLC San Mateo, CA 100.0
Compu-Spread Corporation Delano, MN 100.0
ETAS Inc. Ann Arbor, MI 100.0
FHP Manufacturing Company Fort Lauderdale, FL 100.0
Freud America Inc. High Point, NC 100.0
Ovonic Energy Products, Inc. Orion, MI 100.0
Robert Bosch Battery Systems LLC Orion, MI 100.0
Robert Bosch Finance LLC Broadview, IL 100.0
ROBERT BOSCH FUEL SYSTEMS LLC Kentwood, MI 100.0
Robert Bosch Healthcare Systems, Inc. Farmington Hills, MI 100.0
Robert Bosch LLC Broadview, IL 100.0
Robert Bosch North America Corporation Broadview, IL 100.0
Robert Bosch Packaging Technology Inc. Minneapolis, MN 100.0
Robert Bosch Tool Corporation Mt. Prospect, IL 100.0
sia Abrasives, Inc. USA Charlotte, NC 100.0
Vetronix Corporation Santa Barbara, CA 100.0
Venezuela Inversiones 421,10 (Venezuela Holding) Caracas 100.0
Skil Venezolana SRL Caracas 100.0
Bosch Annual Report 2013126
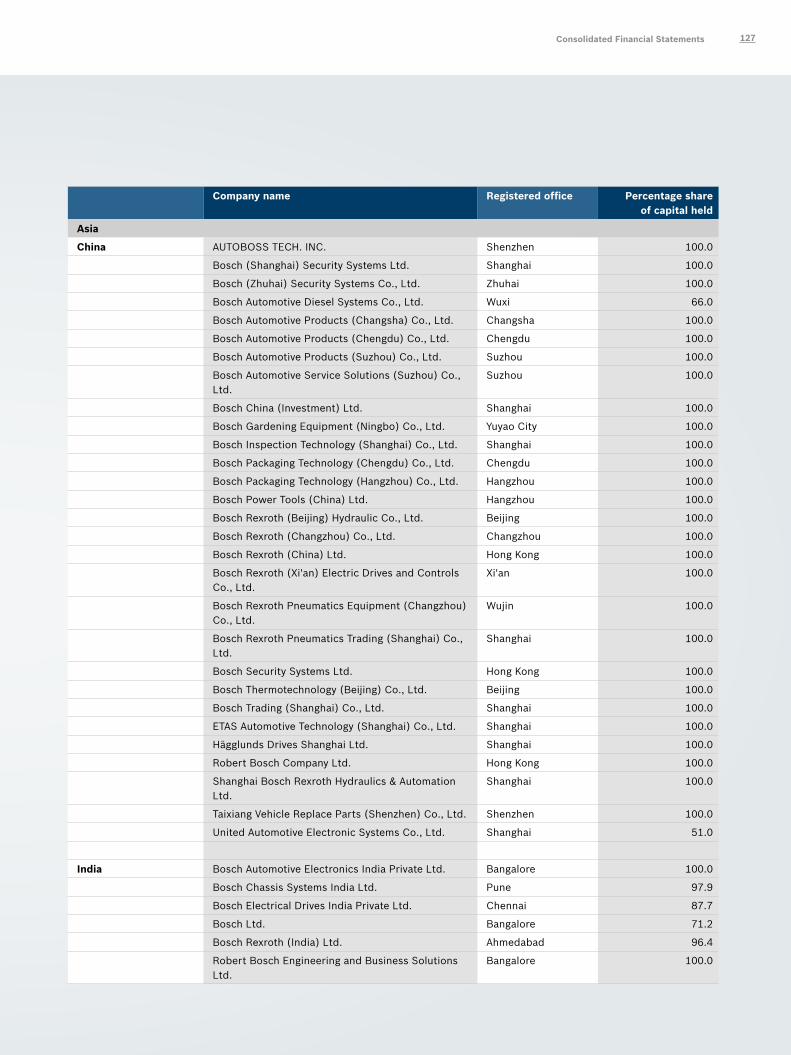
Company name Registered office Percentage share of capital held
Asia
China AUTOBOSS TECH. INC. Shenzhen 100.0
Bosch (Shanghai) Security Systems Ltd. Shanghai 100.0
Bosch (Zhuhai) Security Systems Co., Ltd. Zhuhai 100.0
Bosch Automotive Diesel Systems Co., Ltd. Wuxi 66.0
Bosch Automotive Products (Changsha) Co., Ltd. Changsha 100.0
Bosch Automotive Products (Chengdu) Co., Ltd. Chengdu 100.0
Bosch Automotive Products (Suzhou) Co., Ltd. Suzhou 100.0
Bosch Automotive Service Solutions (Suzhou) Co., Ltd.
Suzhou 100.0
Bosch China (Investment) Ltd. Shanghai 100.0
Bosch Gardening Equipment (Ningbo) Co., Ltd. Yuyao City 100.0
Bosch Inspection Technology (Shanghai) Co., Ltd. Shanghai 100.0
Bosch Packaging Technology (Chengdu) Co., Ltd. Chengdu 100.0
Bosch Packaging Technology (Hangzhou) Co., Ltd. Hangzhou 100.0
Bosch Power Tools (China) Ltd. Hangzhou 100.0
Bosch Rexroth (Beijing) Hydraulic Co., Ltd. Beijing 100.0
Bosch Rexroth (Changzhou) Co., Ltd. Changzhou 100.0
Bosch Rexroth (China) Ltd. Hong Kong 100.0
Bosch Rexroth (Xi'an) Electric Drives and Controls Co., Ltd.
Xi'an 100.0
Bosch Rexroth Pneumatics Equipment (Changzhou) Co., Ltd.
Wujin 100.0
Bosch Rexroth Pneumatics Trading (Shanghai) Co., Ltd.
Shanghai 100.0
Bosch Security Systems Ltd. Hong Kong 100.0
Bosch Thermotechnology (Beijing) Co., Ltd. Beijing 100.0
Bosch Trading (Shanghai) Co., Ltd. Shanghai 100.0
ETAS Automotive Technology (Shanghai) Co., Ltd. Shanghai 100.0
Hägglunds Drives Shanghai Ltd. Shanghai 100.0
Robert Bosch Company Ltd. Hong Kong 100.0
Shanghai Bosch Rexroth Hydraulics & Automation Ltd.
Shanghai 100.0
Taixiang Vehicle Replace Parts (Shenzhen) Co., Ltd. Shenzhen 100.0
United Automotive Electronic Systems Co., Ltd. Shanghai 51.0
India Bosch Automotive Electronics India Private Ltd. Bangalore 100.0
Bosch Chassis Systems India Ltd. Pune 97.9
Bosch Electrical Drives India Private Ltd. Chennai 87.7
Bosch Ltd. Bangalore 71.2
Bosch Rexroth (India) Ltd. Ahmedabad 96.4
Robert Bosch Engineering and Business Solutions Ltd.
Bangalore 100.0
Consolidated Financial Statements 127
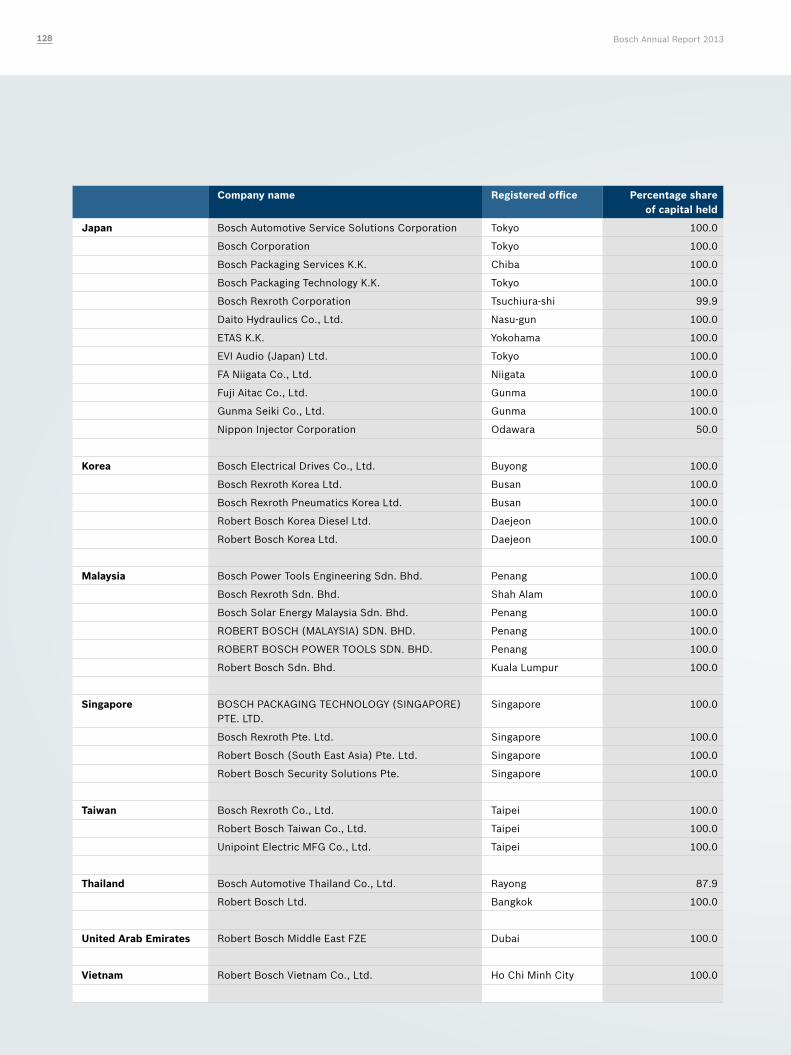
Company name Registered office Percentage share of capital held
Japan Bosch Automotive Service Solutions Corporation Tokyo 100.0
Bosch Corporation Tokyo 100.0
Bosch Packaging Services K.K. Chiba 100.0
Bosch Packaging Technology K.K. Tokyo 100.0
Bosch Rexroth Corporation Tsuchiura-shi 99.9
Daito Hydraulics Co., Ltd. Nasu-gun 100.0
ETAS K.K. Yokohama 100.0
EVI Audio (Japan) Ltd. Tokyo 100.0
FA Niigata Co., Ltd. Niigata 100.0
Fuji Aitac Co., Ltd. Gunma 100.0
Gunma Seiki Co., Ltd. Gunma 100.0
Nippon Injector Corporation Odawara 50.0
Korea Bosch Electrical Drives Co., Ltd. Buyong 100.0
Bosch Rexroth Korea Ltd. Busan 100.0
Bosch Rexroth Pneumatics Korea Ltd. Busan 100.0
Robert Bosch Korea Diesel Ltd. Daejeon 100.0
Robert Bosch Korea Ltd. Daejeon 100.0
Malaysia Bosch Power Tools Engineering Sdn. Bhd. Penang 100.0
Bosch Rexroth Sdn. Bhd. Shah Alam 100.0
Bosch Solar Energy Malaysia Sdn. Bhd. Penang 100.0
ROBERT BOSCH (MALAYSIA) SDN. BHD. Penang 100.0
ROBERT BOSCH POWER TOOLS SDN. BHD. Penang 100.0
Robert Bosch Sdn. Bhd. Kuala Lumpur 100.0
Singapore BOSCH PACKAGING TECHNOLOGY (SINGAPORE) PTE. LTD.
Singapore 100.0
Bosch Rexroth Pte. Ltd. Singapore 100.0
Robert Bosch (South East Asia) Pte. Ltd. Singapore 100.0
Robert Bosch Security Solutions Pte. Singapore 100.0
Taiwan Bosch Rexroth Co., Ltd. Taipei 100.0
Robert Bosch Taiwan Co., Ltd. Taipei 100.0
Unipoint Electric MFG Co., Ltd. Taipei 100.0
Thailand Bosch Automotive Thailand Co., Ltd. Rayong 87.9
Robert Bosch Ltd. Bangkok 100.0
United Arab Emirates Robert Bosch Middle East FZE Dubai 100.0
Vietnam Robert Bosch Vietnam Co., Ltd. Ho Chi Minh City 100.0
Bosch Annual Report 2013128
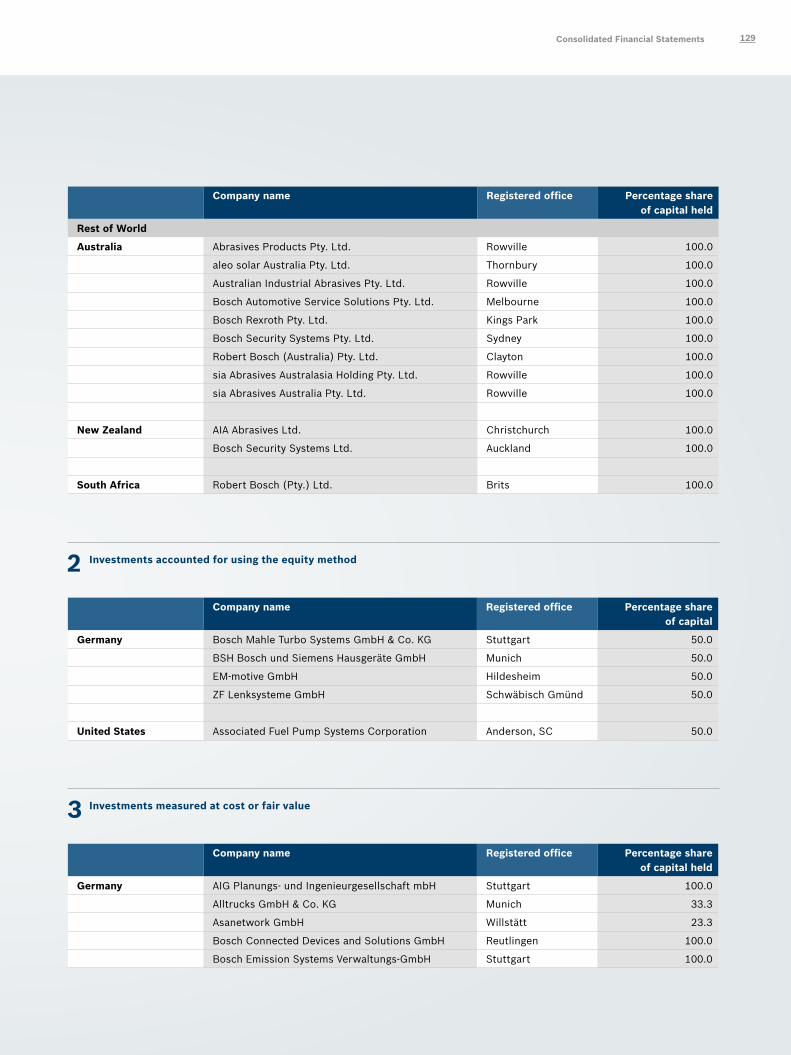
Company name Registered office Percentage share of capital held
Rest of World
Australia Abrasives Products Pty. Ltd. Rowville 100.0
aleo solar Australia Pty. Ltd. Thornbury 100.0
Australian Industrial Abrasives Pty. Ltd. Rowville 100.0
Bosch Automotive Service Solutions Pty. Ltd. Melbourne 100.0
Bosch Rexroth Pty. Ltd. Kings Park 100.0
Bosch Security Systems Pty. Ltd. Sydney 100.0
Robert Bosch (Australia) Pty. Ltd. Clayton 100.0
sia Abrasives Australasia Holding Pty. Ltd. Rowville 100.0
sia Abrasives Australia Pty. Ltd. Rowville 100.0
New Zealand AIA Abrasives Ltd. Christchurch 100.0
Bosch Security Systems Ltd. Auckland 100.0
South Africa Robert Bosch (Pty.) Ltd. Brits 100.0
2 Investments accounted for using the equity method
Company name Registered office Percentage share of capital
Germany Bosch Mahle Turbo Systems GmbH & Co. KG Stuttgart 50.0
BSH Bosch und Siemens Hausgeräte GmbH Munich 50.0
EM-motive GmbH Hildesheim 50.0
ZF Lenksysteme GmbH Schwäbisch Gmünd 50.0
United States Associated Fuel Pump Systems Corporation Anderson, SC 50.0
3 Investments measured at cost or fair value
Company name Registered office Percentage share of capital held
Germany AIG Planungs- und Ingenieurgesellschaft mbH Stuttgart 100.0
Alltrucks GmbH & Co. KG Munich 33.3
Asanetwork GmbH Willstätt 23.3
Bosch Connected Devices and Solutions GmbH Reutlingen 100.0
Bosch Emission Systems Verwaltungs-GmbH Stuttgart 100.0
Consolidated Financial Statements 129
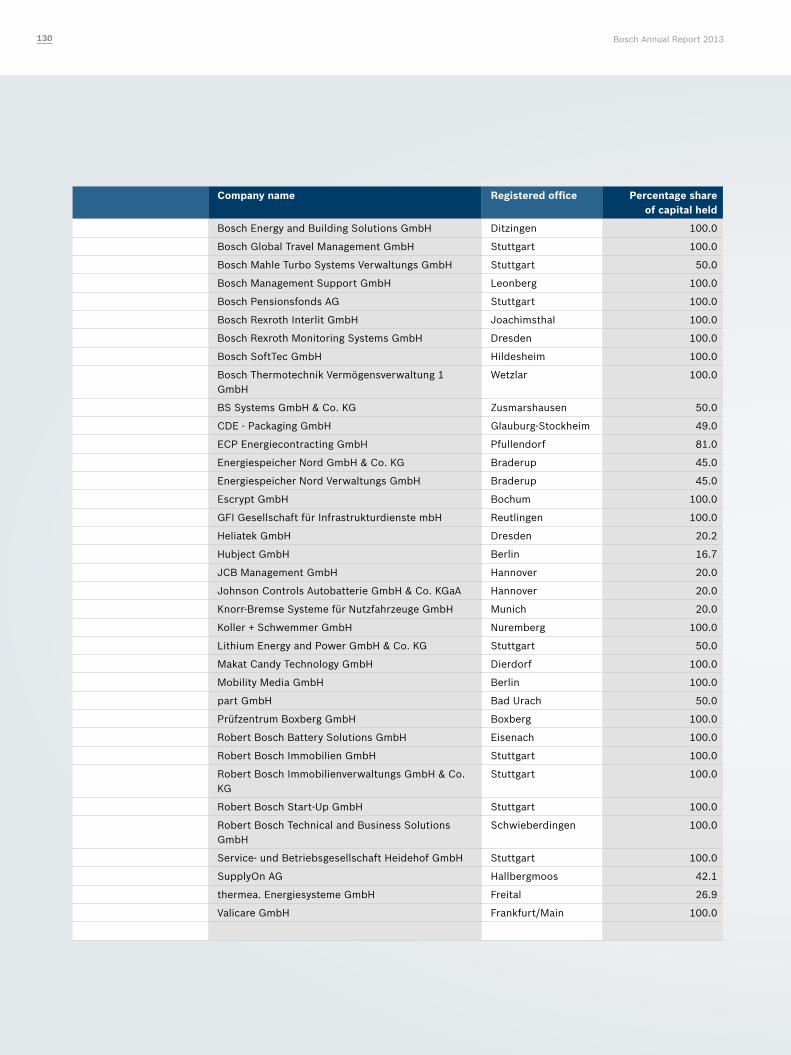
Company name Registered office Percentage share of capital held
Bosch Energy and Building Solutions GmbH Ditzingen 100.0
Bosch Global Travel Management GmbH Stuttgart 100.0
Bosch Mahle Turbo Systems Verwaltungs GmbH Stuttgart 50.0
Bosch Management Support GmbH Leonberg 100.0
Bosch Pensionsfonds AG Stuttgart 100.0
Bosch Rexroth Interlit GmbH Joachimsthal 100.0
Bosch Rexroth Monitoring Systems GmbH Dresden 100.0
Bosch SoftTec GmbH Hildesheim 100.0
Bosch Thermotechnik Vermögensverwaltung 1 GmbH
Wetzlar 100.0
BS Systems GmbH & Co. KG Zusmarshausen 50.0
CDE - Packaging GmbH Glauburg-Stockheim 49.0
ECP Energiecontracting GmbH Pfullendorf 81.0
Energiespeicher Nord GmbH & Co. KG Braderup 45.0
Energiespeicher Nord Verwaltungs GmbH Braderup 45.0
Escrypt GmbH Bochum 100.0
GFI Gesellschaft für Infrastrukturdienste mbH Reutlingen 100.0
Heliatek GmbH Dresden 20.2
Hubject GmbH Berlin 16.7
JCB Management GmbH Hannover 20.0
Johnson Controls Autobatterie GmbH & Co. KGaA Hannover 20.0
Knorr-Bremse Systeme für Nutzfahrzeuge GmbH Munich 20.0
Koller + Schwemmer GmbH Nuremberg 100.0
Lithium Energy and Power GmbH & Co. KG Stuttgart 50.0
Makat Candy Technology GmbH Dierdorf 100.0
Mobility Media GmbH Berlin 100.0
part GmbH Bad Urach 50.0
Prüfzentrum Boxberg GmbH Boxberg 100.0
Robert Bosch Battery Solutions GmbH Eisenach 100.0
Robert Bosch Immobilien GmbH Stuttgart 100.0
Robert Bosch Immobilienverwaltungs GmbH & Co. KG
Stuttgart 100.0
Robert Bosch Start-Up GmbH Stuttgart 100.0
Robert Bosch Technical and Business Solutions GmbH
Schwieberdingen 100.0
Service- und Betriebsgesellschaft Heidehof GmbH Stuttgart 100.0
SupplyOn AG Hallbergmoos 42.1
thermea. Energiesysteme GmbH Freital 26.9
Valicare GmbH Frankfurt/Main 100.0
Bosch Annual Report 2013130
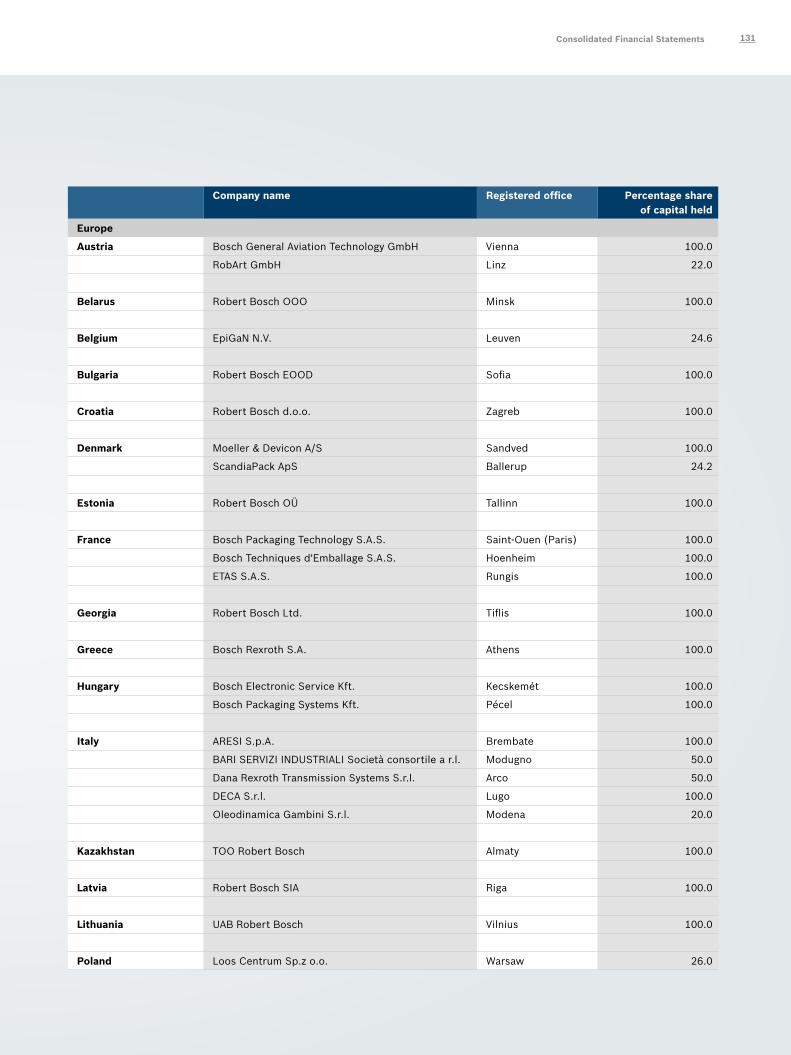
Company name Registered office Percentage share of capital held
Europe
Austria Bosch General Aviation Technology GmbH Vienna 100.0
RobArt GmbH Linz 22.0
Belarus Robert Bosch OOO Minsk 100.0
Belgium EpiGaN N.V. Leuven 24.6
Bulgaria Robert Bosch EOOD Sofia 100.0
Croatia Robert Bosch d.o.o. Zagreb 100.0
Denmark Moeller & Devicon A/S Sandved 100.0
ScandiaPack ApS Ballerup 24.2
Estonia Robert Bosch OÜ Tallinn 100.0
France Bosch Packaging Technology S.A.S. Saint-Ouen (Paris) 100.0
Bosch Techniques d'Emballage S.A.S. Hoenheim 100.0
ETAS S.A.S. Rungis 100.0
Georgia Robert Bosch Ltd. Tiflis 100.0
Greece Bosch Rexroth S.A. Athens 100.0
Hungary Bosch Electronic Service Kft. Kecskemét 100.0
Bosch Packaging Systems Kft. Pécel 100.0
Italy ARESI S.p.A. Brembate 100.0
BARI SERVIZI INDUSTRIALI Società consortile a r.l. Modugno 50.0
Dana Rexroth Transmission Systems S.r.l. Arco 50.0
DECA S.r.l. Lugo 100.0
Oleodinamica Gambini S.r.l. Modena 20.0
Kazakhstan TOO Robert Bosch Almaty 100.0
Latvia Robert Bosch SIA Riga 100.0
Lithuania UAB Robert Bosch Vilnius 100.0
Poland Loos Centrum Sp.z o.o. Warsaw 26.0
Consolidated Financial Statements 131
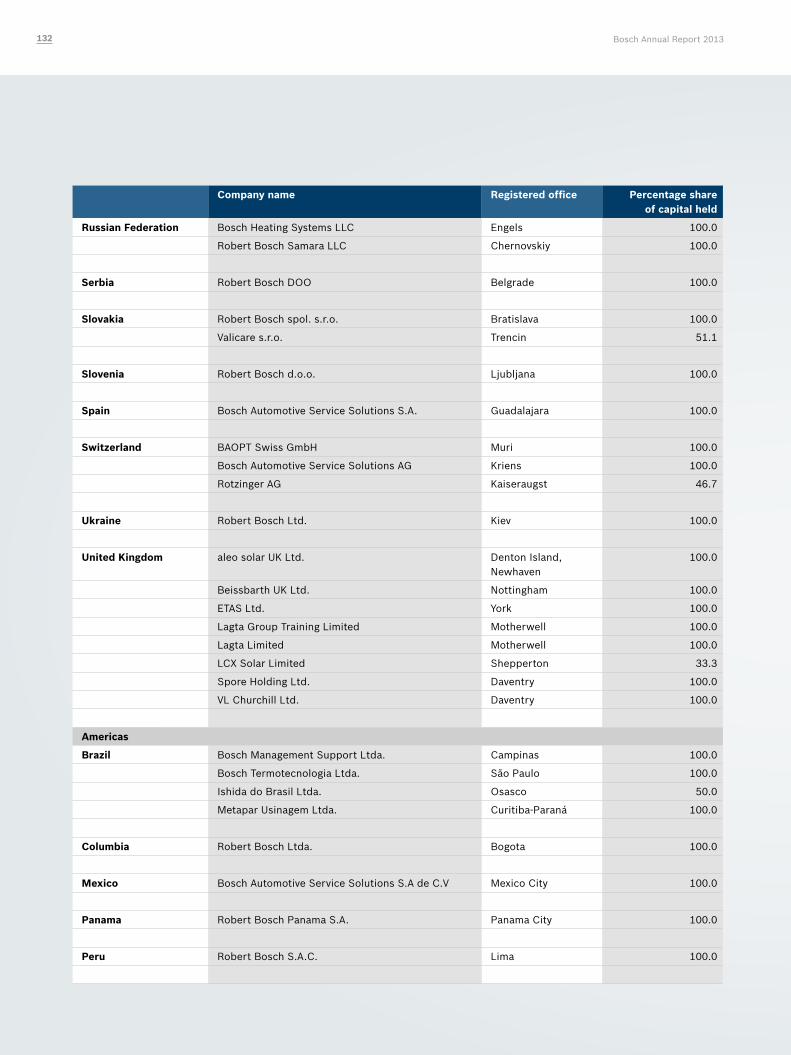
Company name Registered office Percentage share of capital held
Russian Federation Bosch Heating Systems LLC Engels 100.0
Robert Bosch Samara LLC Chernovskiy 100.0
Serbia Robert Bosch DOO Belgrade 100.0
Slovakia Robert Bosch spol. s.r.o. Bratislava 100.0
Valicare s.r.o. Trencin 51.1
Slovenia Robert Bosch d.o.o. Ljubljana 100.0
Spain Bosch Automotive Service Solutions S.A. Guadalajara 100.0
Switzerland BAOPT Swiss GmbH Muri 100.0
Bosch Automotive Service Solutions AG Kriens 100.0
Rotzinger AG Kaiseraugst 46.7
Ukraine Robert Bosch Ltd. Kiev 100.0
United Kingdom aleo solar UK Ltd. Denton Island, Newhaven
100.0
Beissbarth UK Ltd. Nottingham 100.0
ETAS Ltd. York 100.0
Lagta Group Training Limited Motherwell 100.0
Lagta Limited Motherwell 100.0
LCX Solar Limited Shepperton 33.3
Spore Holding Ltd. Daventry 100.0
VL Churchill Ltd. Daventry 100.0
Americas
Brazil Bosch Management Support Ltda. Campinas 100.0
Bosch Termotecnologia Ltda. São Paulo 100.0
Ishida do Brasil Ltda. Osasco 50.0
Metapar Usinagem Ltda. Curitiba-Paraná 100.0
Columbia Robert Bosch Ltda. Bogota 100.0
Mexico Bosch Automotive Service Solutions S.A de C.V Mexico City 100.0
Panama Robert Bosch Panama S.A. Panama City 100.0
Peru Robert Bosch S.A.C. Lima 100.0
Bosch Annual Report 2013132
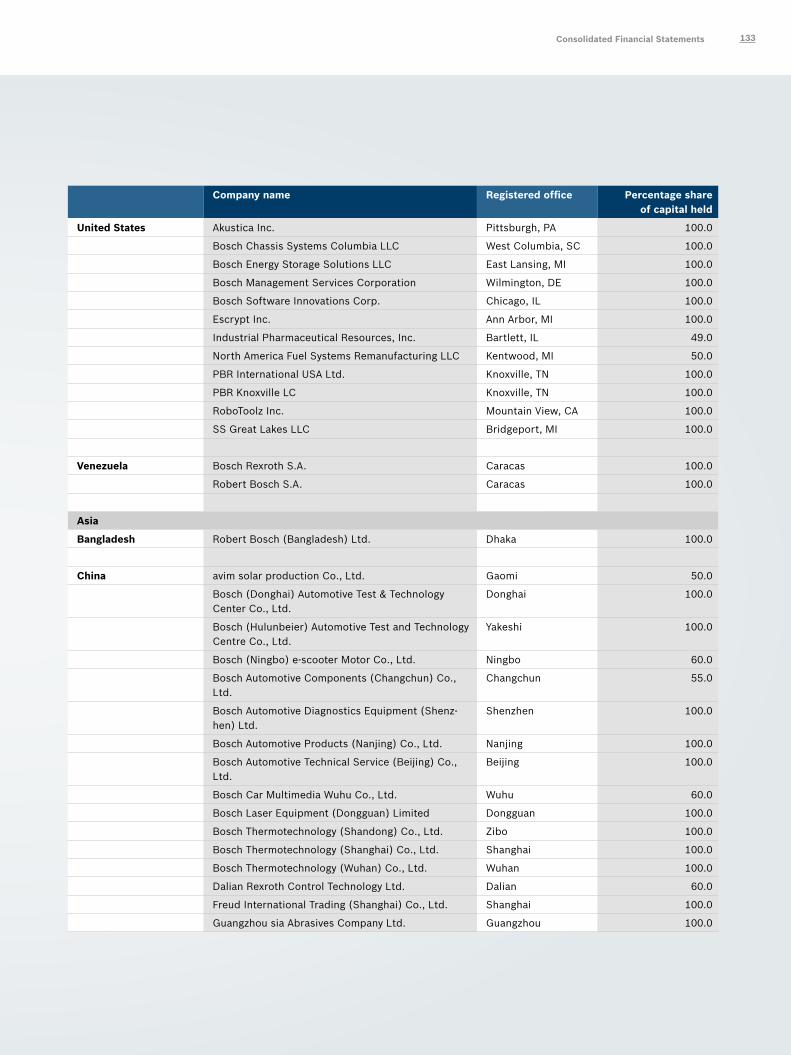
Company name Registered office Percentage share of capital held
United States Akustica Inc. Pittsburgh, PA 100.0
Bosch Chassis Systems Columbia LLC West Columbia, SC 100.0
Bosch Energy Storage Solutions LLC East Lansing, MI 100.0
Bosch Management Services Corporation Wilmington, DE 100.0
Bosch Software Innovations Corp. Chicago, IL 100.0
Escrypt Inc. Ann Arbor, MI 100.0
Industrial Pharmaceutical Resources, Inc. Bartlett, IL 49.0
North America Fuel Systems Remanufacturing LLC Kentwood, MI 50.0
PBR International USA Ltd. Knoxville, TN 100.0
PBR Knoxville LC Knoxville, TN 100.0
RoboToolz Inc. Mountain View, CA 100.0
SS Great Lakes LLC Bridgeport, MI 100.0
Venezuela Bosch Rexroth S.A. Caracas 100.0
Robert Bosch S.A. Caracas 100.0
Asia
Bangladesh Robert Bosch (Bangladesh) Ltd. Dhaka 100.0
China avim solar production Co., Ltd. Gaomi 50.0
Bosch (Donghai) Automotive Test & Technology Center Co., Ltd.
Donghai 100.0
Bosch (Hulunbeier) Automotive Test and Technology Centre Co., Ltd.
Yakeshi 100.0
Bosch (Ningbo) e-scooter Motor Co., Ltd. Ningbo 60.0
Bosch Automotive Components (Changchun) Co., Ltd.
Changchun 55.0
Bosch Automotive Diagnostics Equipment (Shenz-hen) Ltd.
Shenzhen 100.0
Bosch Automotive Products (Nanjing) Co., Ltd. Nanjing 100.0
Bosch Automotive Technical Service (Beijing) Co., Ltd.
Beijing 100.0
Bosch Car Multimedia Wuhu Co., Ltd. Wuhu 60.0
Bosch Laser Equipment (Dongguan) Limited Dongguan 100.0
Bosch Thermotechnology (Shandong) Co., Ltd. Zibo 100.0
Bosch Thermotechnology (Shanghai) Co., Ltd. Shanghai 100.0
Bosch Thermotechnology (Wuhan) Co., Ltd. Wuhan 100.0
Dalian Rexroth Control Technology Ltd. Dalian 60.0
Freud International Trading (Shanghai) Co., Ltd. Shanghai 100.0
Guangzhou sia Abrasives Company Ltd. Guangzhou 100.0
Consolidated Financial Statements 133
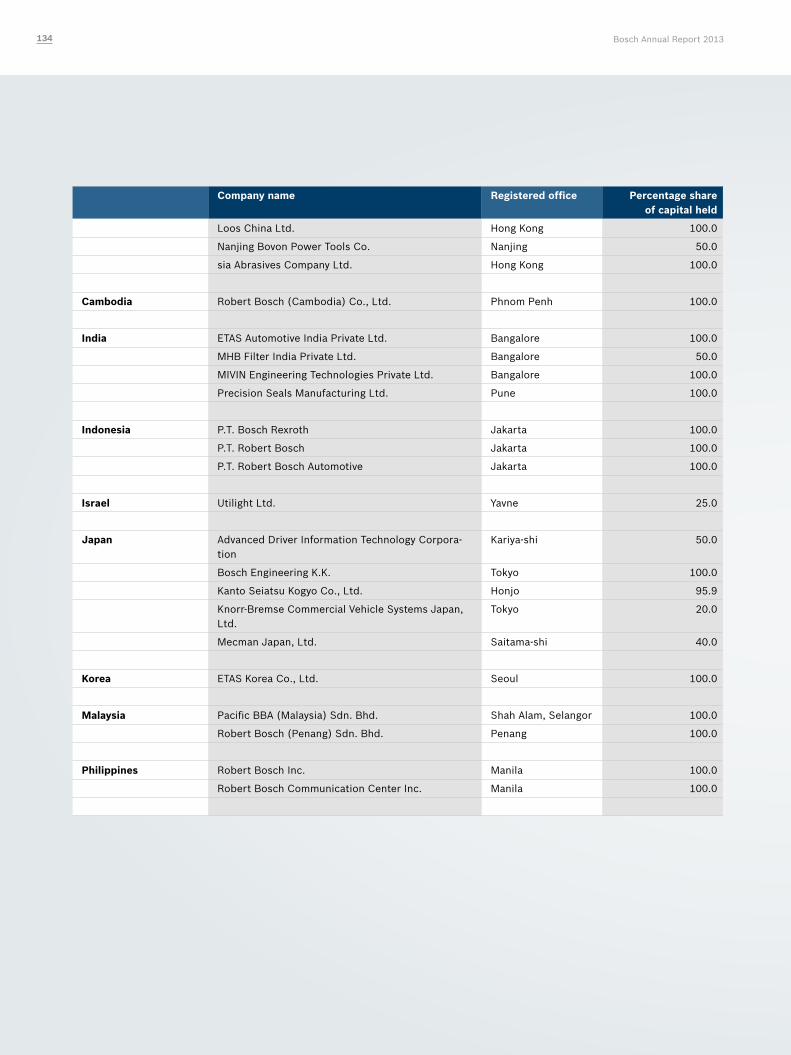
Company name Registered office Percentage share of capital held
Loos China Ltd. Hong Kong 100.0
Nanjing Bovon Power Tools Co. Nanjing 50.0
sia Abrasives Company Ltd. Hong Kong 100.0
Cambodia Robert Bosch (Cambodia) Co., Ltd. Phnom Penh 100.0
India ETAS Automotive India Private Ltd. Bangalore 100.0
MHB Filter India Private Ltd. Bangalore 50.0
MIVIN Engineering Technologies Private Ltd. Bangalore 100.0
Precision Seals Manufacturing Ltd. Pune 100.0
Indonesia P.T. Bosch Rexroth Jakarta 100.0
P.T. Robert Bosch Jakarta 100.0
P.T. Robert Bosch Automotive Jakarta 100.0
Israel Utilight Ltd. Yavne 25.0
Japan Advanced Driver Information Technology Corpora-tion
Kariya-shi 50.0
Bosch Engineering K.K. Tokyo 100.0
Kanto Seiatsu Kogyo Co., Ltd. Honjo 95.9
Knorr-Bremse Commercial Vehicle Systems Japan, Ltd.
Tokyo 20.0
Mecman Japan, Ltd. Saitama-shi 40.0
Korea ETAS Korea Co., Ltd. Seoul 100.0
Malaysia Pacific BBA (Malaysia) Sdn. Bhd. Shah Alam, Selangor 100.0
Robert Bosch (Penang) Sdn. Bhd. Penang 100.0
Philippines Robert Bosch Inc. Manila 100.0
Robert Bosch Communication Center Inc. Manila 100.0
Bosch Annual Report 2013134
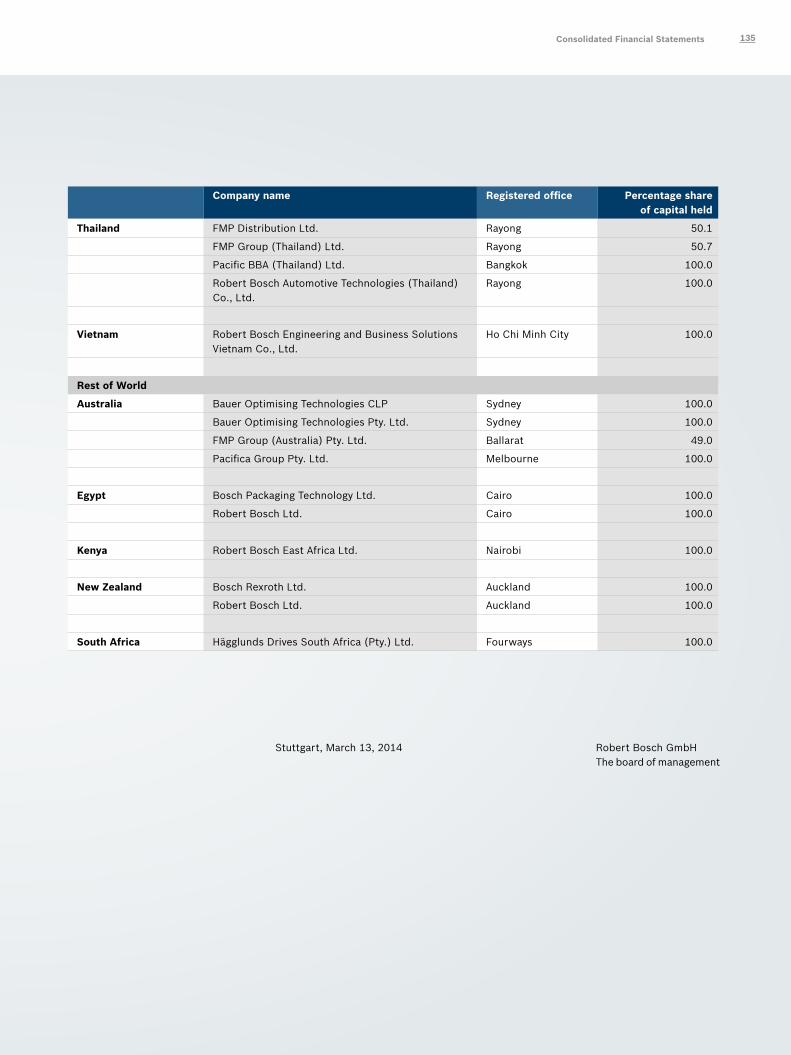
Company name Registered office Percentage share of capital held
Thailand FMP Distribution Ltd. Rayong 50.1
FMP Group (Thailand) Ltd. Rayong 50.7
Pacific BBA (Thailand) Ltd. Bangkok 100.0
Robert Bosch Automotive Technologies (Thailand) Co., Ltd.
Rayong 100.0
Vietnam Robert Bosch Engineering and Business Solutions Vietnam Co., Ltd.
Ho Chi Minh City 100.0
Rest of World
Australia Bauer Optimising Technologies CLP Sydney 100.0
Bauer Optimising Technologies Pty. Ltd. Sydney 100.0
FMP Group (Australia) Pty. Ltd. Ballarat 49.0
Pacifica Group Pty. Ltd. Melbourne 100.0
Egypt Bosch Packaging Technology Ltd. Cairo 100.0
Robert Bosch Ltd. Cairo 100.0
Kenya Robert Bosch East Africa Ltd. Nairobi 100.0
New Zealand Bosch Rexroth Ltd. Auckland 100.0
Robert Bosch Ltd. Auckland 100.0
South Africa Hägglunds Drives South Africa (Pty.) Ltd. Fourways 100.0
Stuttgart, March 13, 2014 Robert Bosch GmbH The board of management
Consolidated Financial Statements 135
Auditor’s Report
Independent Auditors’ ReportTo Robert Bosch Gesellschaft mit beschränkter Haftung, Stuttgart
Report on the Consolidated Financial StatementsWe have audited the accompanying consolidated financial statements of Robert Bosch Gesellschaft mit beschränkter Haftung, Stuttgart, and its subsidiaries, which comprise the income statement, the statement of comprehensive income, the statement of financial posi-tion, the statement of changes in equity, the statement of cash flows and the notes to the consolidated financial statements for the business year from January 1, 2013 to December 31, 2013.
Managing Directors‘ Responsibility for the Consolidated Financial Statements
The Managing Directors of Robert Bosch Gesellschaft mit beschränkter Haftung are responsi-ble for the preparation of these consolidated financial statements. This responsibility includes that these consolidated financial statements are prepared in accordance with International Financial Reporting Standards, as adopted by the EU, and the additional requirements of German commercial law pursuant to § (Article) 315a Abs. (paragraph) 1 HGB („Handelsgesetz-buch“: German Commercial Code) and that these consolidated financial statements give a true and fair view of the net assets, financial position and results of operations of the group in accordance with these requirements. The Managing Directors are also responsible for the internal controls Management deems necessary to enable the preparation of consolidated financial statements that are free from material misstatement, whether due to fraud or error.
Auditor’s Responsibility
Our responsibility is to express an opinion on these consolidated financial statements based on our audit. We conducted our audit in accordance with § 317 HGB and German generally accepted standards for the audit of financial statements promulgated by the Institut der Wirtschaftsprüfer (Institute of Public Auditors in Germany) (IDW) and additionally observed the International Standards on Auditing (ISA). Accordingly, we are required to comply with ethical requirements and plan and perform the audit to obtain reasonable assurance about whether the consolidated financial statements are free from material misstatement.
An audit involves performing audit procedures to obtain audit evidence about the amounts and disclosures in the consolidated financial statements. The selection of audit procedures depends on the auditor’s professional judgment. This includes the assessment of the risks of material misstatement of the consolidated financial statements, whether due to fraud or error. In assessing those risks, the auditor considers the internal control system relevant to the entity’s preparation of consolidated financial statements that give a true and fair view. The aim of this is to plan and perform audit procedures that are appropriate in the given circumstances, but not for the purpose of expressing an opinion on the effectiveness of the group‘s internal control system. An audit also includes evaluating the appropriateness of accounting policies used and the reasonableness of accounting estimates made by the Managing Directors, as well as evaluating the overall presentation of the consolidated financial statements.
Bosch Annual Report 2013136
Auditor’s Report 137
We believe that the audit evidence we have obtained is sufficient and appropriate to provide a basis for our audit opinion.
Audit Opinion
According to § 322 Abs. 3 Satz (sentence) 1 HGB, we state that our audit of the consolidated financial statements has not led to any reservations.
In our opinion based on the findings of our audit, the consolidated financial statements comply, in all material respects, with IFRSs, as adopted by the EU, and the additional requirements of German commercial law pursuant to § 315a Abs. 1 HGB and give a true and fair view of the net assets and financial position of the Group as at December 31, 2013 as well as the results of operations for the business year then ended, in accordance with these requirements.
Report on the Group Management ReportWe have audited the accompanying group management report of Robert Bosch Gesellschaft mit beschränkter Haftung for the business year from January 1, 2013 to December 31, 2013. The Managing Directors of Robert Bosch Gesellschaft mit beschränkter Haftung are responsi-ble for the preparation of the group management report in accordance with the requirements of German commercial law applicable pursuant to § 315a Abs. 1 HGB. We conducted our audit in accordance with § 317 Abs. 2 HGB and German generally accepted standards for the audit of the group management report promulgated by the Institut der Wirtschaftsprüfer (Institute of Public Auditors in Germany) (IDW). Accordingly, we are required to plan and perform the audit of the group management report to obtain reasonable assurance about whether the group management report is consistent with the consolidated financial state-ments and the audit findings, as a whole provides a suitable view of the Group‘s position and suitably presents the opportunities and risks of future development.
According to § 322 Abs. 3 Satz 1 HGB we state that our audit of the group management report has not led to any reservations.
In our opinion based on the findings of our audit of the consolidated financial statements and group management report, the group management report is consistent with the con-solidated financial statements, as a whole provides a suitable view of the Group‘s position and suitably presents the opportunities and risks of future development.
Stuttgart, March 13, 2014 PricewaterhouseCoopers Aktiengesellschaft Wirtschaftsprüfungsgesellschaft
Harald Kayser Dieter Wißfeld Wirtschaftsprüfer Wirtschaftsprüfer
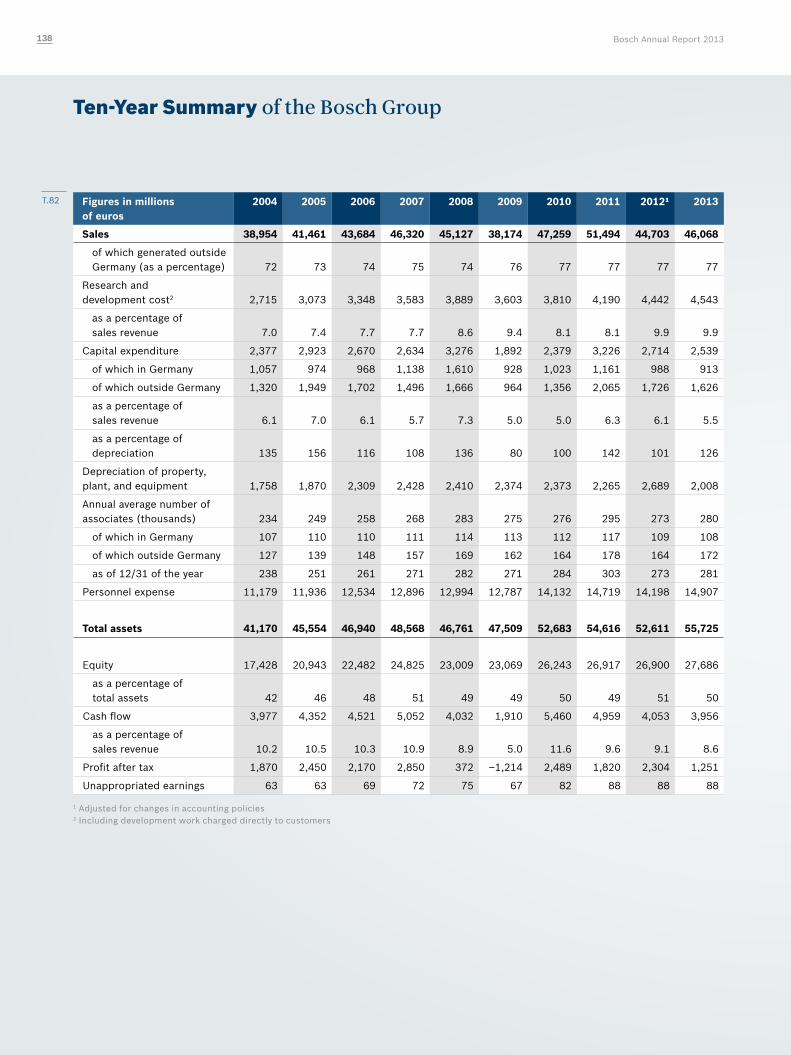
Ten-Year Summary of the Bosch Group
Figures in millions of euros
2004 2005 2006 2007 2008 2009 2010 2011 2012¹ 2013
Sales 38,954 41,461 43,684 46,320 45,127 38,174 47,259 51,494 44,703 46,068
of which generated outside Germany (as a percentage) 72 73 74 75 74 76 77 77 77 77
Research and development cost2 2,715 3,073 3,348 3,583 3,889 3,603 3,810 4,190 4,442 4,543
as a percentage of sales revenue 7.0 7.4 7.7 7.7 8.6 9.4 8.1 8.1 9.9 9.9
Capital expenditure 2,377 2,923 2,670 2,634 3,276 1,892 2,379 3,226 2,714 2,539
of which in Germany 1,057 974 968 1,138 1,610 928 1,023 1,161 988 913
of which outside Germany 1,320 1,949 1,702 1,496 1,666 964 1,356 2,065 1,726 1,626
as a percentage of sales revenue 6.1 7.0 6.1 5.7 7.3 5.0 5.0 6.3 6.1 5.5
as a percentage of depreciation 135 156 116 108 136 80 100 142 101 126
Depreciation of property, plant, and equipment 1,758 1,870 2,309 2,428 2,410 2,374 2,373 2,265 2,689 2,008
Annual average number of associates (thousands) 234 249 258 268 283 275 276 295 273 280
of which in Germany 107 110 110 111 114 113 112 117 109 108
of which outside Germany 127 139 148 157 169 162 164 178 164 172
as of 12/31 of the year 238 251 261 271 282 271 284 303 273 281
Personnel expense 11,179 11,936 12,534 12,896 12,994 12,787 14,132 14,719 14,198 14,907
Total assets 41,170 45,554 46,940 48,568 46,761 47,509 52,683 54,616 52,611 55,725
Equity 17,428 20,943 22,482 24,825 23,009 23,069 26,243 26,917 26,900 27,686
as a percentage of total assets 42 46 48 51 49 49 50 49 51 50
Cash flow 3,977 4,352 4,521 5,052 4,032 1,910 5,460 4,959 4,053 3,956
as a percentage of sales revenue 10.2 10.5 10.3 10.9 8.9 5.0 11.6 9.6 9.1 8.6
Profit after tax 1,870 2,450 2,170 2,850 372 –1,214 2,489 1,820 2,304 1,251
Unappropriated earnings 63 63 69 72 75 67 82 88 88 88
1 Adjusted for changes in accounting policies2 Including development work charged directly to customers
T.82
Bosch Annual Report 2013138
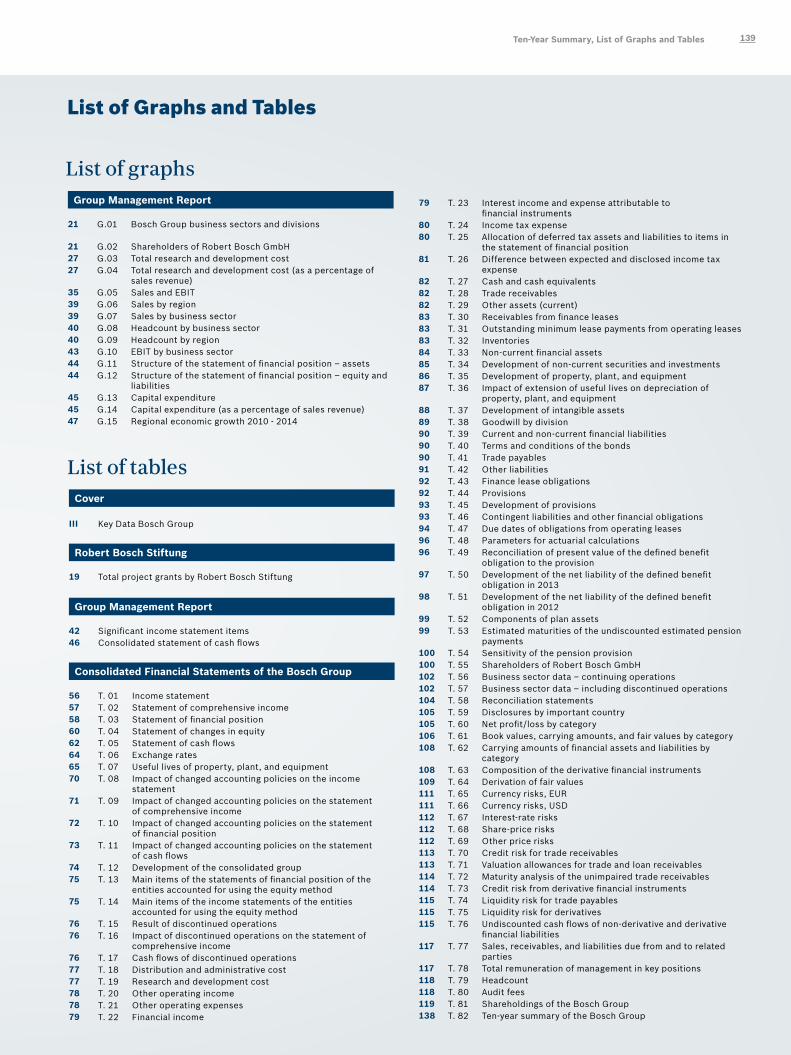
List of Graphs and Tables
List of graphs
List of tablesCover
III Key Data Bosch Group
Robert Bosch Stiftung
19 Total project grants by Robert Bosch Stiftung
Group Management Report
42 Significant income statement items46 Consolidated statement of cash flows
Consolidated Financial Statements of the Bosch Group
56 T. 01 Income statement57 T. 02 Statement of comprehensive income58 T. 03 Statement of financial position60 T. 04 Statement of changes in equity62 T. 05 Statement of cash flows64 T. 06 Exchange rates65 T. 07 Useful lives of property, plant, and equipment70 T. 08 Impact of changed accounting policies on the income
statement71 T. 09 Impact of changed accounting policies on the statement
of comprehensive income72 T. 10 Impact of changed accounting policies on the statement
of financial position73 T. 11 Impact of changed accounting policies on the statement
of cash flows74 T. 12 Development of the consolidated group75 T. 13 Main items of the statements of financial position of the
entities accounted for using the equity method75 T. 14 Main items of the income statements of the entities
accounted for using the equity method76 T. 15 Result of discontinued operations76 T. 16 Impact of discontinued operations on the statement of
comprehensive income76 T. 17 Cash flows of discontinued operations77 T. 18 Distribution and administrative cost77 T. 19 Research and development cost78 T. 20 Other operating income78 T. 21 Other operating expenses79 T. 22 Financial income
Group Management Report
21 G.01 Bosch Group business sectors and divisions
21 G.02 Shareholders of Robert Bosch GmbH27 G.03 Total research and development cost27 G.04 Total research and development cost (as a percentage of
sales revenue)35 G.05 Sales and EBIT39 G.06 Sales by region39 G.07 Sales by business sector40 G.08 Headcount by business sector40 G.09 Headcount by region43 G.10 EBIT by business sector44 G.11 Structure of the statement of financial position – assets44 G.12 Structure of the statement of financial position – equity and
liabilities45 G.13 Capital expenditure45 G.14 Capital expenditure (as a percentage of sales revenue)47 G.15 Regional economic growth 2010 - 2014
79 T. 23 Interest income and expense attributable to financial instruments
80 T. 24 Income tax expense80 T. 25 Allocation of deferred tax assets and liabilities to items in
the statement of financial position81 T. 26 Difference between expected and disclosed income tax
expense82 T. 27 Cash and cash equivalents82 T. 28 Trade receivables82 T. 29 Other assets (current)83 T. 30 Receivables from finance leases83 T. 31 Outstanding minimum lease payments from operating leases83 T. 32 Inventories84 T. 33 Non-current financial assets85 T. 34 Development of non-current securities and investments 86 T. 35 Development of property, plant, and equipment87 T. 36 Impact of extension of useful lives on depreciation of
property, plant, and equipment 88 T. 37 Development of intangible assets89 T. 38 Goodwill by division90 T. 39 Current and non-current financial liabilities90 T. 40 Terms and conditions of the bonds90 T. 41 Trade payables91 T. 42 Other liabilities92 T. 43 Finance lease obligations 92 T. 44 Provisions93 T. 45 Development of provisions93 T. 46 Contingent liabilities and other financial obligations 94 T. 47 Due dates of obligations from operating leases96 T. 48 Parameters for actuarial calculations96 T. 49 Reconciliation of present value of the defined benefit
obligation to the provision 97 T. 50 Development of the net liability of the defined benefit
obligation in 201398 T. 51 Development of the net liability of the defined benefit
obligation in 201299 T. 52 Components of plan assets99 T. 53 Estimated maturities of the undiscounted estimated pension
payments100 T. 54 Sensitivity of the pension provision100 T. 55 Shareholders of Robert Bosch GmbH102 T. 56 Business sector data – continuing operations102 T. 57 Business sector data – including discontinued operations104 T. 58 Reconciliation statements105 T. 59 Disclosures by important country105 T. 60 Net profit/loss by category106 T. 61 Book values, carrying amounts, and fair values by category108 T. 62 Carrying amounts of financial assets and liabilities by
category108 T. 63 Composition of the derivative financial instruments109 T. 64 Derivation of fair values111 T. 65 Currency risks, EUR111 T. 66 Currency risks, USD112 T. 67 Interest-rate risks112 T. 68 Share-price risks112 T. 69 Other price risks113 T. 70 Credit risk for trade receivables113 T. 71 Valuation allowances for trade and loan receivables114 T. 72 Maturity analysis of the unimpaired trade receivables114 T. 73 Credit risk from derivative financial instruments 115 T. 74 Liquidity risk for trade payables115 T. 75 Liquidity risk for derivatives115 T. 76 Undiscounted cash flows of non-derivative and derivative
financial liabilities117 T. 77 Sales, receivables, and liabilities due from and to related
parties117 T. 78 Total remuneration of management in key positions118 T. 79 Headcount118 T. 80 Audit fees119 T. 81 Shareholdings of the Bosch Group138 T. 82 Ten-year summary of the Bosch Group
Ten-Year Summary, List of Graphs and Tables 139
Published byRobert Bosch GmbHCorporate Communications,Brand Management, andSustainability (C/CC)
Postfach 10 60 5070049 StuttgartGermanyPhone +49 711 [email protected]
Senior Vice PresidentUta-Micaela Dürig
www.bosch.com
Additional information about the company can be taken from the brochureBosch today, as well as from the internet at csr.bosch.com
For an online version of this Annual Report, go to:www.bosch.com/annual-report
Idea, coordination, design, and prepress Dr. Andrej Heinke (C/CCM) and heureka GmbH – einfach kommunizieren, Essen
Printdruckpartner – Druck- und Medienhaus GmbH, Essen
Bosch Annual Report 2013140

141
4,964first-filed patents
worldwide in 2013
Robert Bosch GmbH
Postfach 10 60 5070049 StuttgartGermanyPhone +49 711 811-0www.bosch.com
Printed in Germany
Related Documents