Voting and Participating: Political Parties, Interest Groups, and Elections Chapter 3

Welcome message from author
This document is posted to help you gain knowledge. Please leave a comment to let me know what you think about it! Share it to your friends and learn new things together.
Transcript
Voting and Participating: Political Parties, Interest Groups, and Elections
Chapter 3

Political Parties: What they do
Electing their members to public office Representing the groups that make up the
party’s coalition Organizing the party’s members and the
government so that the policy preferences of the party’s members become public policy
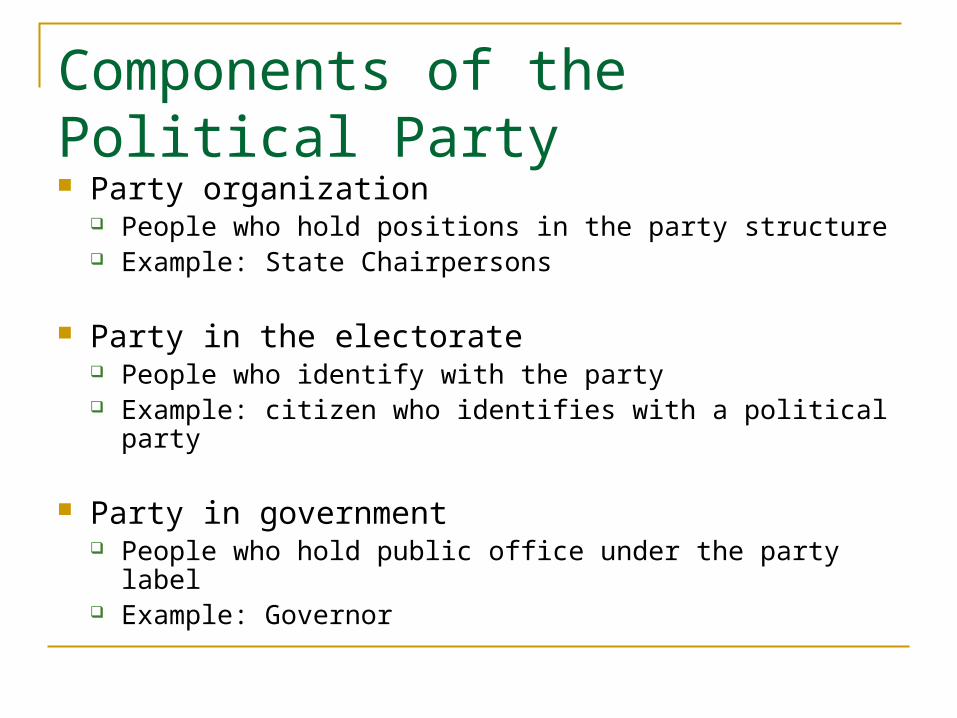
Components of the Political Party Party organization
People who hold positions in the party structure Example: State Chairpersons
Party in the electorate People who identify with the party Example: citizen who identifies with a political party
Party in government People who hold public office under the party label Example: Governor
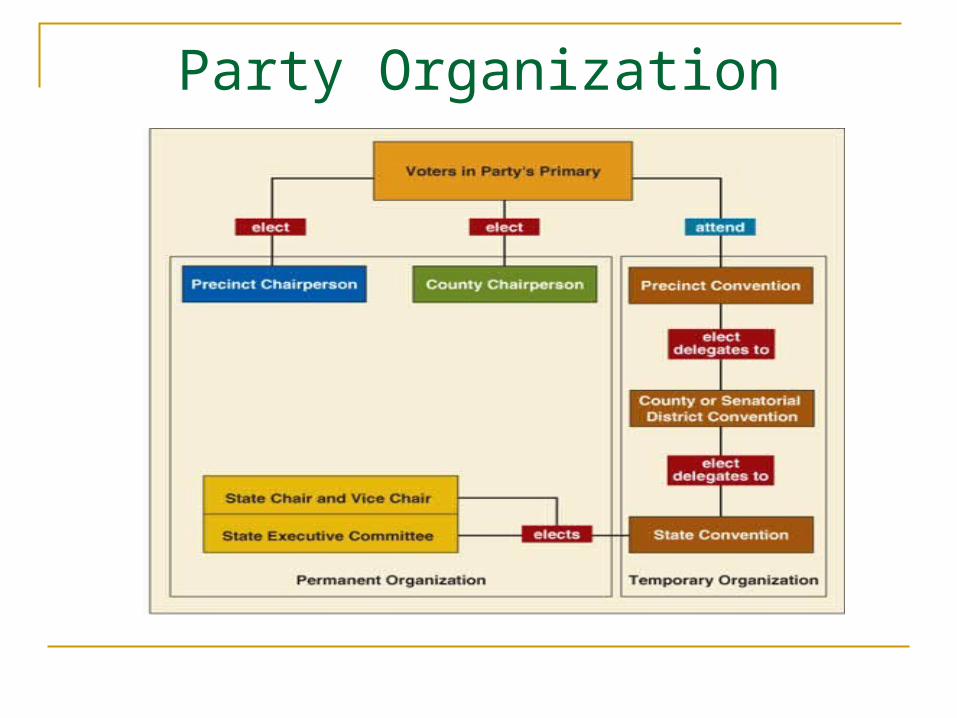
Party Organization

Formal Party Organization
Established in state law Temporary Organization
Precinct conventions County or state senatorial district conventions State convention
Certifies results of party’s primary Drafts and adopts the party’s platform Selects state party executive committee, party chair and
vice chair
Formal Party Organization
Permanent Organization Precinct Chair
Elected in primary Information to party members Getting party members to vote Serving on county executive committee

Formal Party Organization
County Chair Elected in primary Conduct party’s primary election Arranging for the party’s county convention Raising funds for the county organization Campaigning for party candidates Promoting precinct organization efforts
Formal Party Organization
State executive committee 62 members – one man, one woman from each of
the state’s senatorial district. Democrats have additional members from state officers and constituent groups–92 total members.
State chair and vice chair Certify party’s candidates for general election Conduct the state convention Promoting party candidates and issue positions

Functional Organization
Party unity Democratic Party
Factions: ideological Issues Liberals vs. conservatives
Republican Party Factions: party function Win elections or represent party members Pragmatists vs. Ideologues
Functional Organization
Party Effectiveness State level
Complexity of the party’s organization Accessible headquarters Division of labor Party budget Professional leadership
Capacity to perform party-building activities Institutional support—fundraising, mobilization, polls, newsletter Candidate-centered activities—contributions, recruitment, endorsements
County level Campaigning
Precinct level Campaigning
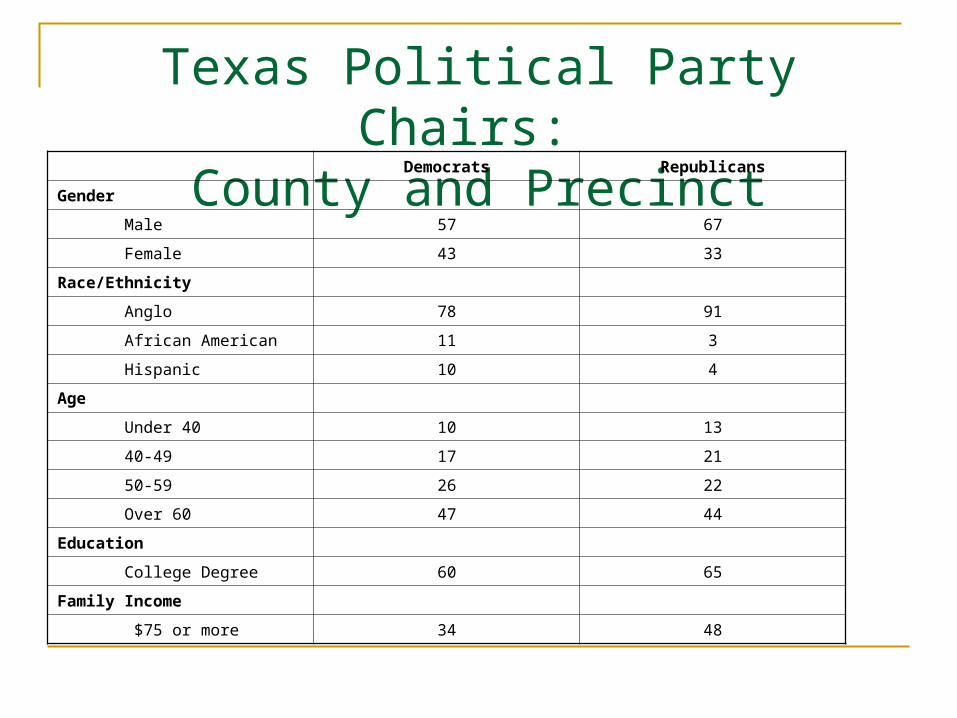
Texas Political Party Chairs: County and Precinct
Democrats Republicans
Gender
Male 57 67
Female 43 33
Race/Ethnicity
Anglo 78 91
African American 11 3
Hispanic 10 4
Age
Under 40 10 13
40-49 17 21
50-59 26 22
Over 60 47 44
Education
College Degree 60 65
Family Income
$75 or more 34 48
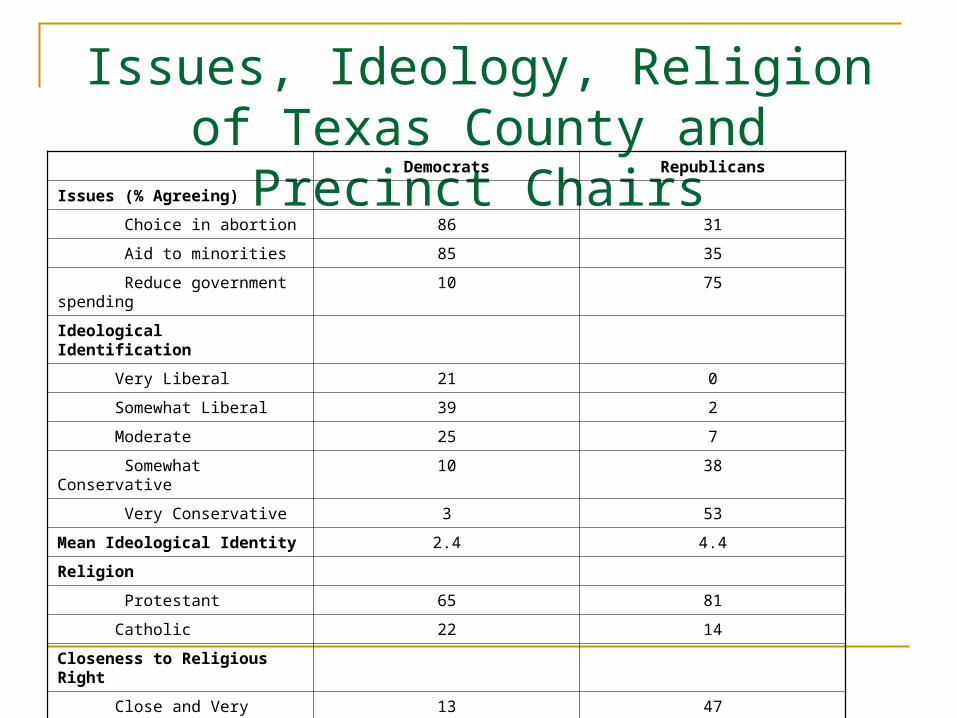
Issues, Ideology, Religion of Texas County and Precinct
ChairsDemocrats Republicans
Issues (% Agreeing)
Choice in abortion 86 31
Aid to minorities 85 35
Reduce government spending
10 75
Ideological Identification
Very Liberal 21 0
Somewhat Liberal 39 2
Moderate 25 7
Somewhat Conservative 10 38
Very Conservative 3 53
Mean Ideological Identity 2.4 4.4
Religion
Protestant 65 81
Catholic 22 14
Closeness to Religious Right
Close and Very Close 13 47
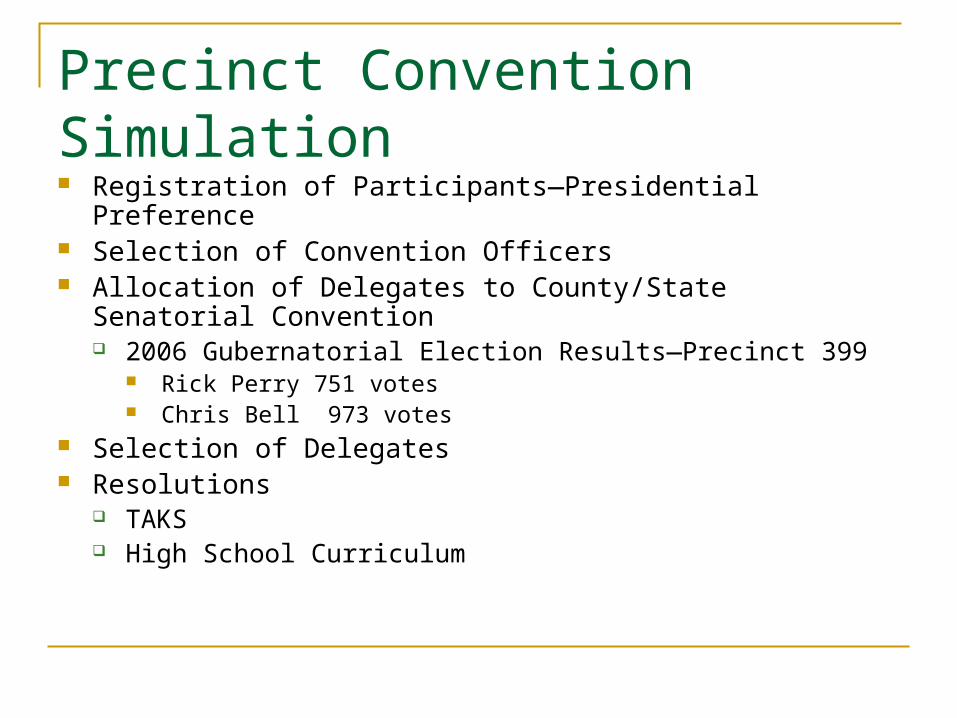
Precinct Convention Simulation Registration of Participants—Presidential Preference Selection of Convention Officers Allocation of Delegates to County/State Senatorial Convention
2006 Gubernatorial Election Results—Precinct 399 Rick Perry 751 votes Chris Bell 973 votes
Selection of Delegates Resolutions
TAKS High School Curriculum

Party in the Electorate
No registration of party members Party identification is a psychological
attachment formed early and is quite stable In politics, as of today, do you consider
yourself a Republican, a Democrat, or an Independent? (Asked of independents: As of today, do you lean more to the Democratic Party or the Republican Party?)

Party in the Electorate
Conservative Democrats West of line connecting Ft. Worth, San Antonio,
and Laredo Small, rural counties where most people were
ranchers and farmers Supporters of traditional social values, suspicious
of change, and almost entirely Anglo In urban areas, upper income and well educated.
Less heavily populated, slower growing, fewer minorities

Party in the Electorate
Liberal Democrats 1940s-1950s, east of line connecting Ft. Worth,
San Antonio, Laredo. 1960s-1970s, better in southwestern Texas Counties were heavily populated, urbanized, and
growing rapidly in population Counties also contained poorer and less educated
voters.
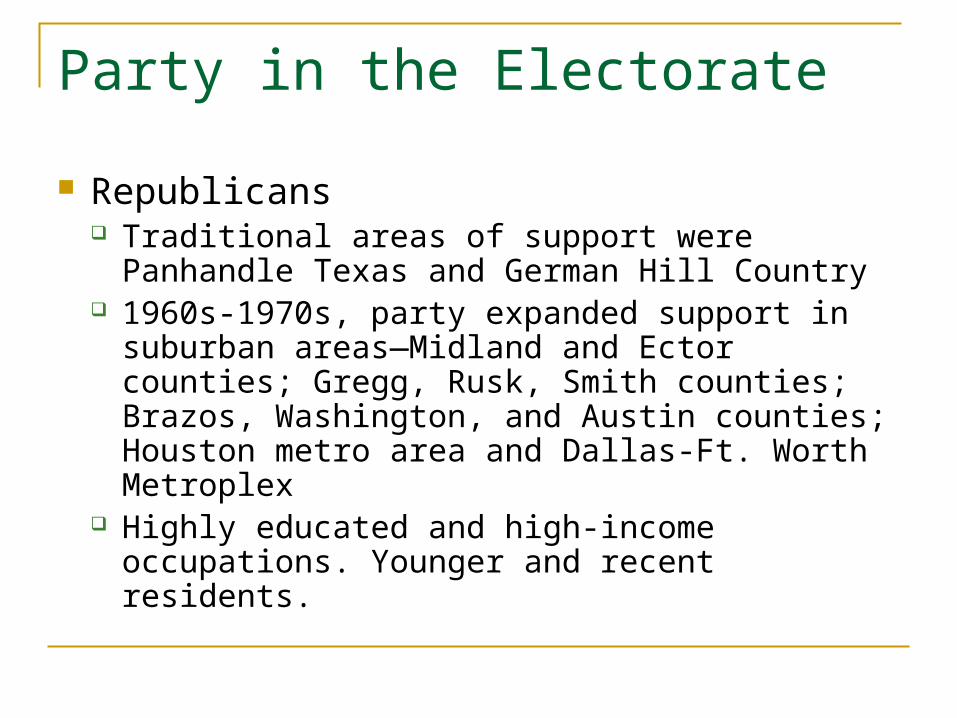
Party in the Electorate
Republicans Traditional areas of support were Panhandle
Texas and German Hill Country 1960s-1970s, party expanded support in
suburban areas—Midland and Ector counties; Gregg, Rusk, Smith counties; Brazos, Washington, and Austin counties; Houston metro area and Dallas-Ft. Worth Metroplex
Highly educated and high-income occupations. Younger and recent residents.

Party in the Electorate
Trends in Party Attachments More Republicans
1952, fewer than 10 percent 2007, 32 percent
Fewer Democrats 1952, 66 percent 2007, 28 percent
More Independents 1952, 25 percent 2007, 39 percent

Party in the Electorate: Contemporary Coalitions Democrats
Women African Americans Hispanics Liberals and populists
Republicans Anglos Conservatives and libertarians Christian Right Males

Party Identification and Ideology2008
9 12 9
21
6458
88
49
60 66 45
3441
9
42
28 2534
2 1 3
0
10
20
30
40
50
60
70
80
90
100
StrongDemocrat
Weak Democrat DemocraticLeaning
Independent
Independent RepublicanLeaning
Independent
WeakRepublican
StrongRepublican
Party Identification
Percent
Conservative Moderate Liberal
Parties and Political Change
Realignment Durable alteration in the balance of party
identifiers Changes in electoral behavior Changes in the parties’ coalitions
Dealignment Decline in the central position of political parties in
voters’ orientations and behaviors
Case for Realignment
Durable shifts in party identification Mobilization
New voters who adopt party affiliation Immigrants who have party affiliation
Conversion Shift in partisanship from one party to the other party Independents choose a party affiliation
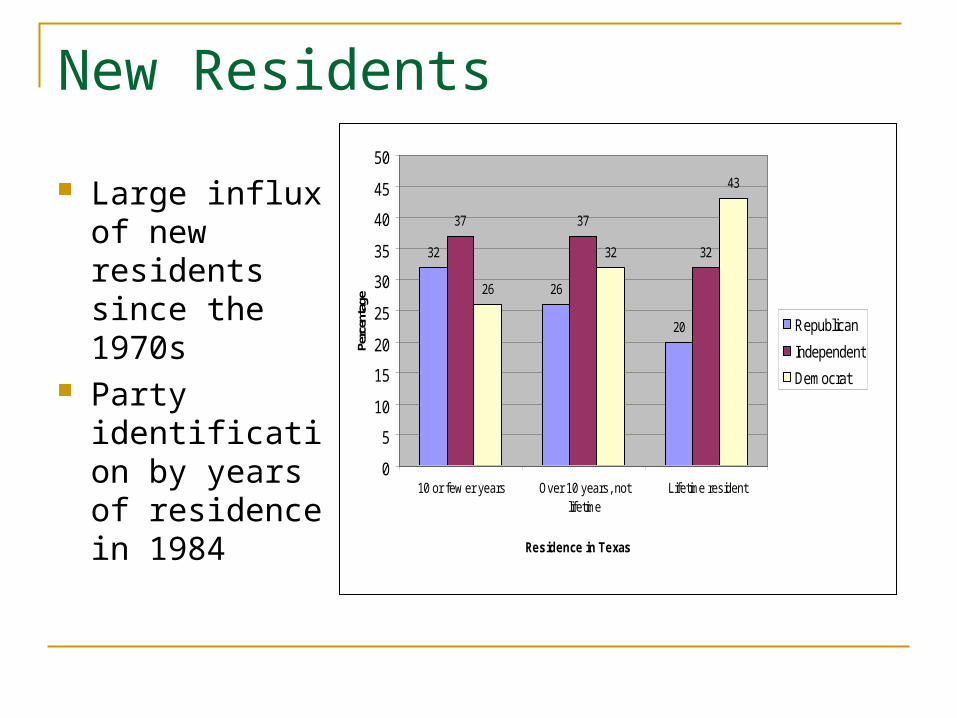
New Residents
Large influx of new residents since the 1970s
Party identification by years of residence in 1984
050
100
1stQtr
3rdQtr
32
26
20
37 37
32
26
32
43
0
5
10
15
20
25
30
35
40
45
50
10 or few er years Over 10 years, notlifetime
Lifetime resident
Residence in Texas
Perc
enta
ge
Republican
Independent
Democrat
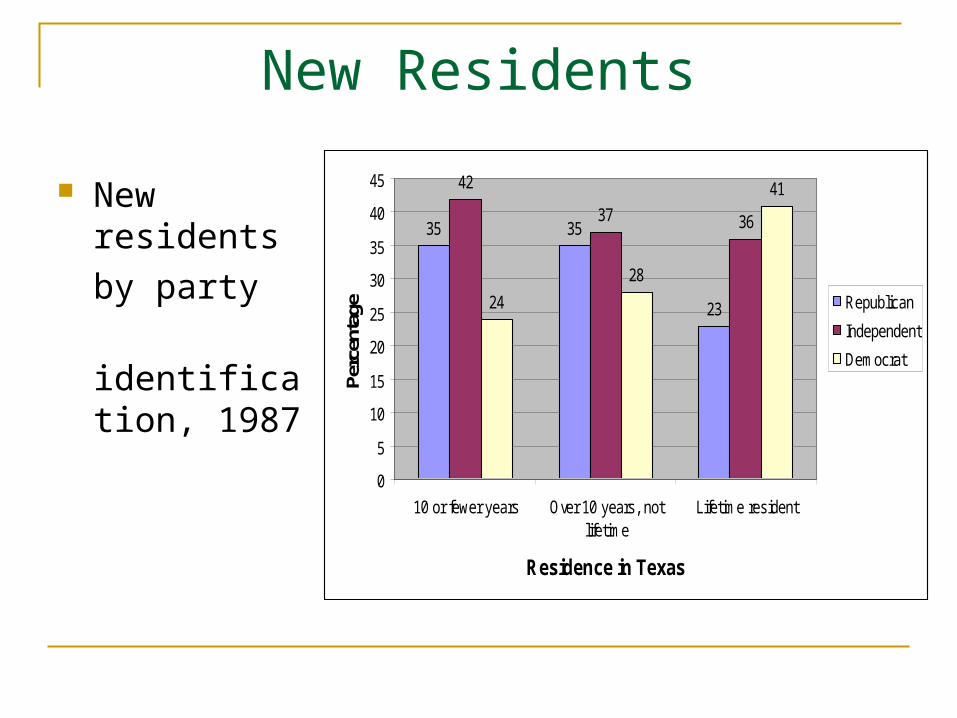
New Residents
New residents
by party
identification, 1987
35 35
23
42
37 36
24
28
41
0
5
10
15
20
25
30
35
40
45
10 or fewer years Over 10 years, notlifetime
Lifetime resident
Residence in Texas
Perc
enta
ge Republican
Independent
Democrat

New Residents – 1980s Immigrants
32
38
2830
32
28
32
22
38
0
5
10
15
20
25
30
35
40
All Texans 1980s Immigrants Lifelong Texans
Time of Residence
Pe
rce
nta
ge
Republican
Independent
Democrat
New Voters
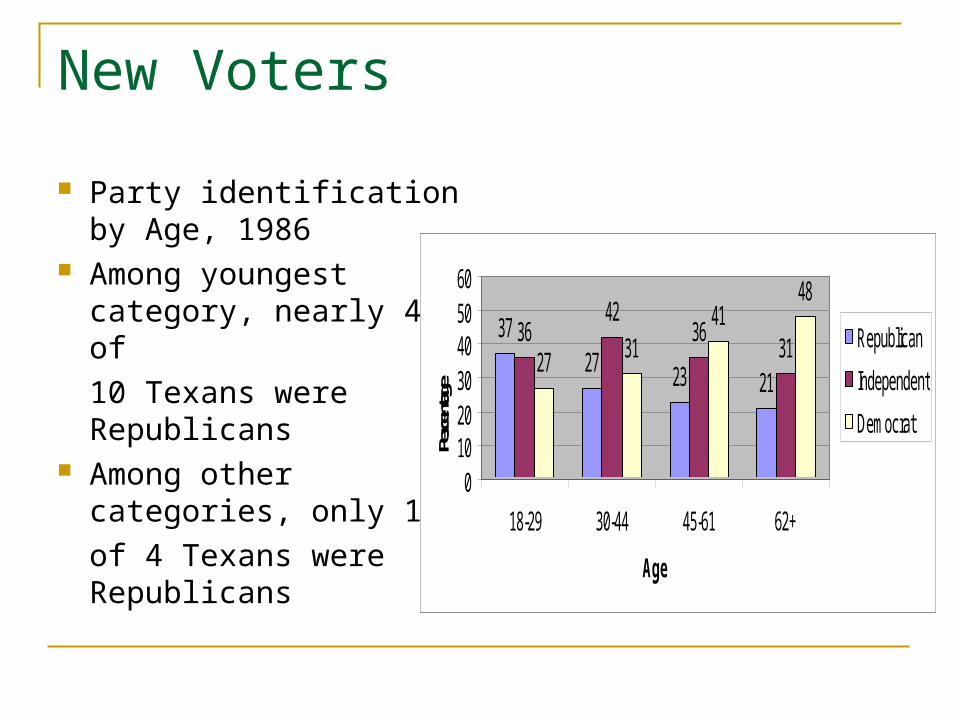
Party identification by Age, 1986
Among youngest category, nearly 4 of
10 Texans were Republicans
Among other categories, only 1
of 4 Texans were Republicans
3727 23 21
3642
363127 31
4148
0102030405060
18-29 30-44 45-61 62+
Age
Perce
ntage
Republican
Independent
Democrat

Party Switchers
In 1986, 32 percent of Democratic Party Identifiers had abandoned their party identification
In 1986, 21 percent of Republican Party identifiers had abandoned their party identification
Switchers just as likely to choose the other party as become independents

Party Switchers - Ideology
Conservative Democrats most likely to switch – 37 percent left the Democratic Party (23 percent became Republicans; 14 percent became independents)
Moderate Democrats next most likely switchers – 35 percent left the Democratic Party (20 percent became independents; 15 percent became Republicans)
Party Switchers – Income levels High income Democrats most likely to switch
– 48 percent abandoned the Democratic Party (28 percent became Republicans; 21 percent became independents)
Moderate income Democrats next most likely to switch – 26 percent abandoned the Democratic Party (16 percent became independents; 10 percent became Republicans)

Party Switchers - Ethnicity
Anglo Democrats most likely to abandon the Democratic Party – 43 percent switched (23 percent became Republicans; 20 percent became independents)
African-American Democrats least likely to switch – 6 percent abandoned the Democratic Party (3 percent became independents; 3 percent became Republicans)
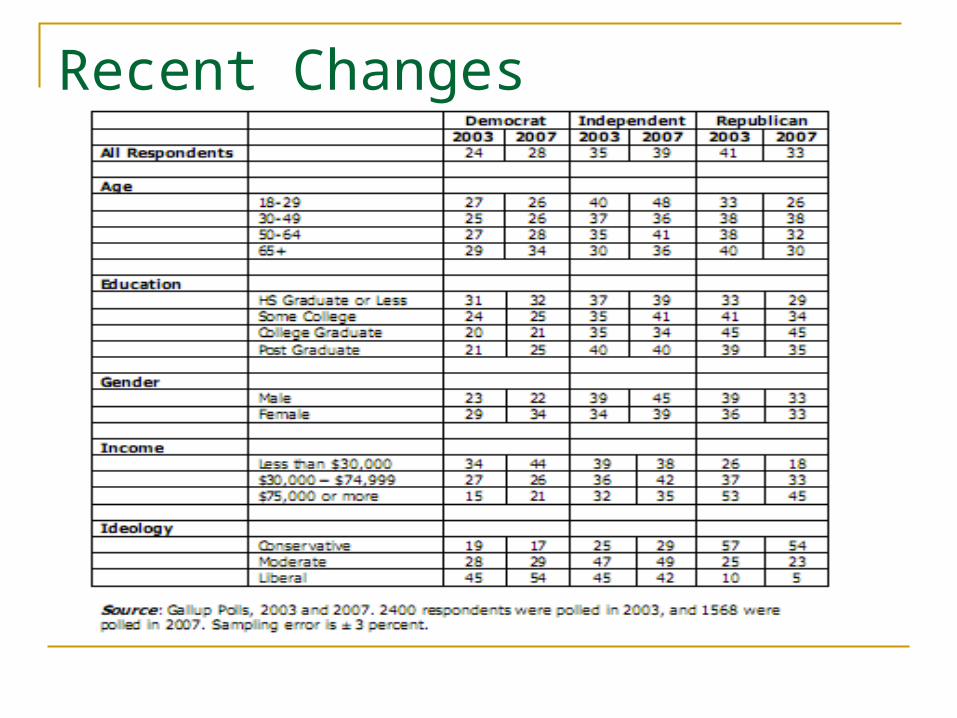
Recent Changes

Case for Realignment
Parties become more distinct ideologically Greatest differences on increased spending for poor and
health Democrats increase taxes; Republicans cut programs
Party affiliations are the basis for the vote choice 1986-1994, Republican gubernatorial candidates received
between 86% and 93% of strong Republicans’ votes; Democratic candidate between 88% and 92% of strong Democrats’ votes.
2006, Perry received 73 percent of Republican vote 2006, Bell received 67 percent of Democratic vote
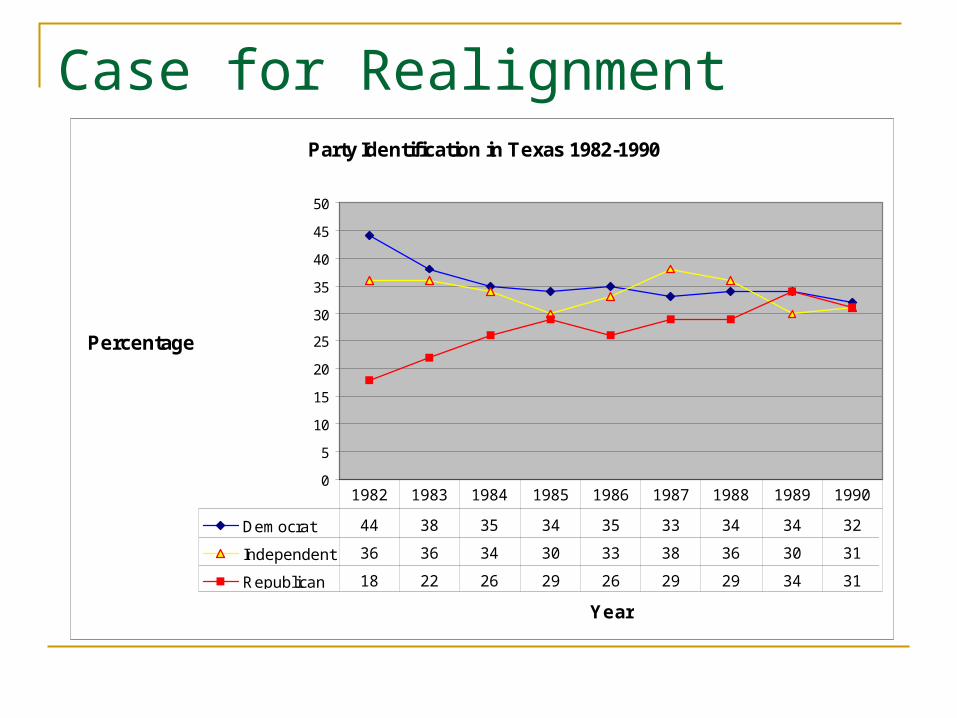
Case for RealignmentParty Identification in Texas 1982-1990
0
5
10
15
20
25
30
35
40
45
50
Year
Percentage
Democrat 44 38 35 34 35 33 34 34 32
Independent 36 36 34 30 33 38 36 30 31
Republican 18 22 26 29 26 29 29 34 31
1982 1983 1984 1985 1986 1987 1988 1989 1990
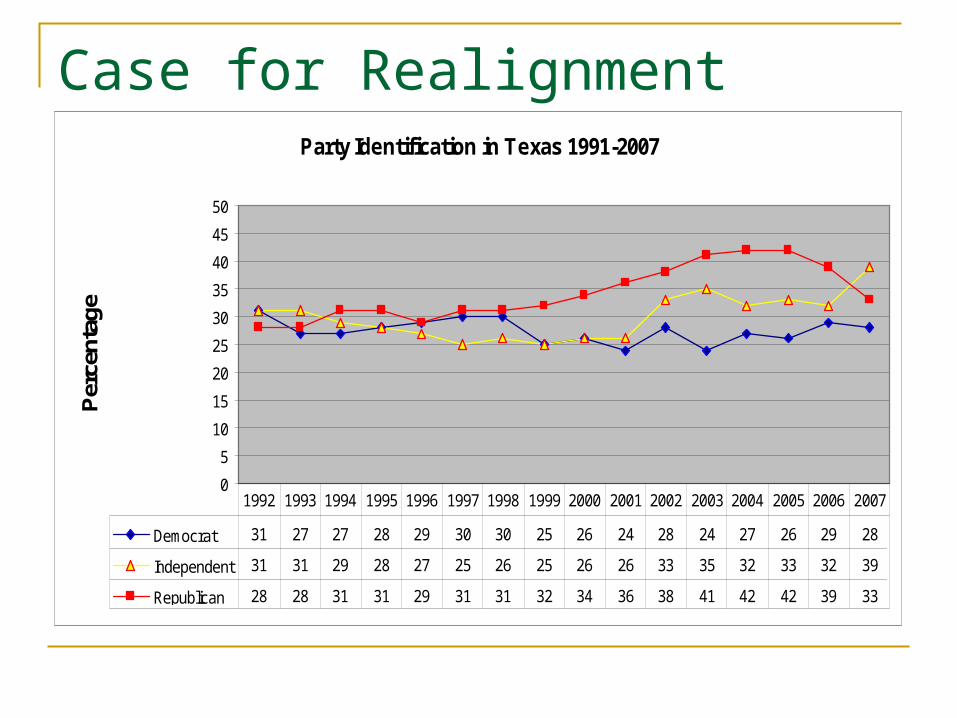
Case for RealignmentParty Identification in Texas 1991-2007
0
5
10
15
20
25
30
35
40
45
50
Per
cent
age
Democrat 31 27 27 28 29 30 30 25 26 24 28 24 27 26 29 28
Independent 31 31 29 28 27 25 26 25 26 26 33 35 32 33 32 39
Republican 28 28 31 31 29 31 31 32 34 36 38 41 42 42 39 33
1992 1993 1994 1995 1996 1997 1998 1999 2000 2001 2002 2003 2004 2005 2006 2007
Case for Dealignment
An increase in independents 1952, 25 percent were independents 2007, 39 percent were independents
More split-ticket voting
Candidates and issues are more important than parties in voters’ choices Elections of 1978 through 1990 especially

Party in Government: Executive Constitution establishes independent
elections of executive officials Candidates for executive offices run
independent campaigns Once in office, competition among executives
whether members of same party or different parties
Party in Government: Legislature History of bipartisanship Republican minority until 2002 Democratic Party organization
Democratic caucus in House in 1981; all Democrats by 1987
Leadership and Democratic caucus worked together from 1993-2003
Senate Democratic caucus more active since 1999.

Party in Government: Legislature Republican Party organization
No organization prior to 1989. Caucus organized in 1989 Caucus became more important as Republican
membership in House passed one-third threshold Partisan organizations still less important
than legislative leaders
Party in Government: Judiciary Difference between Republican judges and
Democratic judges Civil cases, Republican judges favor defendants
and Democratic judges favor plaintiffs Criminal cases, Republican judges favor
prosecution, and Democratic judges favor defendants
Governors appoint party members to fill vacancies
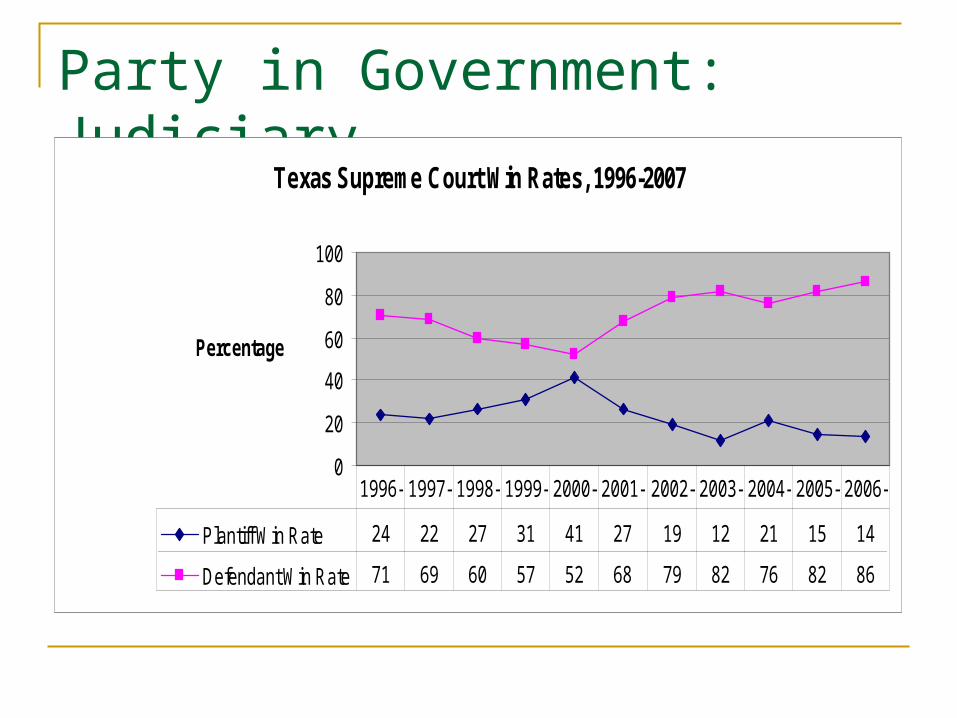
Party in Government: Judiciary
Texas Supreme Court Win Rates, 1996-2007
0
20
40
60
80
100
Percentage
Plantiff Win Rate 24 22 27 31 41 27 19 12 21 15 14
Defendant Win Rate 71 69 60 57 52 68 79 82 76 82 86
1996- 1997- 1998- 1999- 2000- 2001- 2002- 2003- 2004- 2005- 2006-

Political Parties and Democracy Strong and cohesive political parties support
majoritarian democracy Hierarchically structured Coherent party platform Control candidate nominations Require candidates to support the party’s platform Mobilize their members to vote Organize the government to turn the party’s
platform into public policy
Political Parties and Democracy Weak and decentralized parties promote
pluralist democracy Parties are coalitions of interests Represent a fairly narrow spectrum in their
membership Demand little of party members Influence the operation of government rather than
controlling government
Goals of Interest Groups
Primary goals Public policy TMRA II - 2009
Helmet Law Failure to Yield Equal Access Sobriety Checkpoints
Secondary Goals Changing the policy
process inputs Review of decisions Decentralize authority
Changing Social Values Targets society Change perceptions
Types of Interest Groups
Business and Trade Associations Texas Association of Business Texas Gaming Association Texas Automobile Dealers Association
Professional Associations Texas Trial Lawyers Association Texas Medical Association

Types of Interest Groups
Labor Groups Communication Workers of America (CWA) American Federation of State, County, Municipal
Employees (AFSCME) Racial and Ethnic Groups
African Americans–NAACP Hispanics–LULAC, MALDEF
Public Interest Groups Consumers Union

Interest Group Resources
Money Information, expertise, skills Group’s members
Number Cohesiveness
Reputation of the Group
Political Activities of Groups
Lobbying Direct lobbying
Lobbyists 2007, 1,629 registered lobbyists Characteristics of lobbyists Principal job – access and providing information Targets
Indirect or grassroots lobbying Members contact policymakers Public relations campaigns

Political Activities of Groups
Electioneering Political Action
Committees (PACs) 2006, 1.132 general
purpose PACs spent $99.1 million
Sources of PAC money PAC contributions
Incumbents Open-seat contests challengers
PAC Spending by Sector, 2006
0%
5%
58%37%Business
Ideological
Labor
Unknown
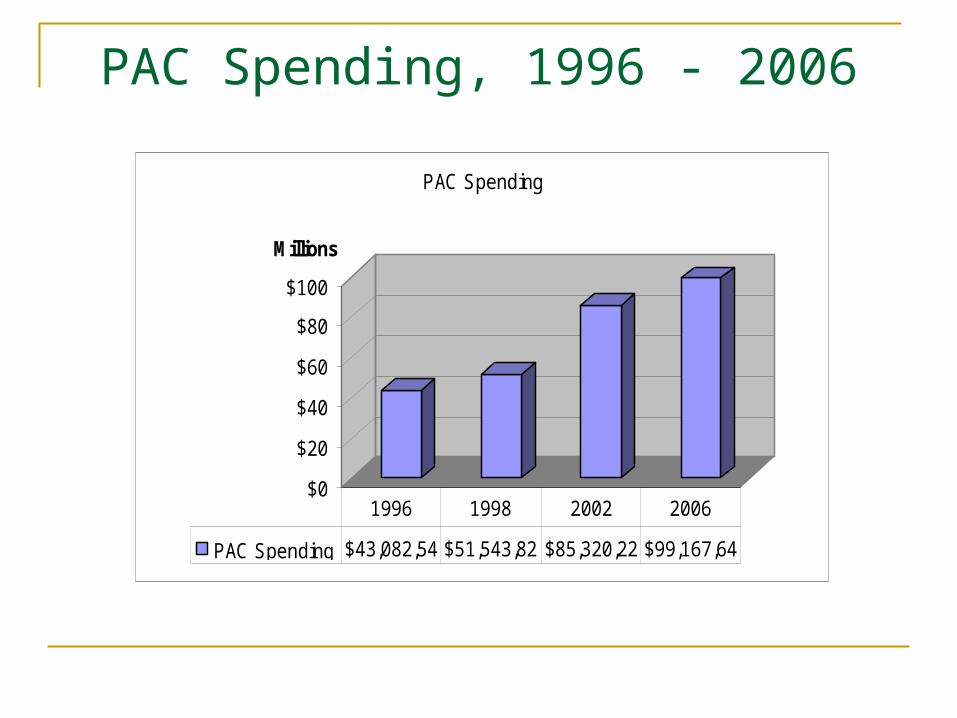
PAC Spending, 1996 - 2006
$0
$20
$40
$60
$80
$100
Millions
PAC Spending
PAC Spending $43,082,54 $51,543,82 $85,320,22 $99,167,64
1996 1998 2002 2006
Political Activities of Groups
Litigation – use of the judicial system to advance the group’s goals
Increased since the 1970s and the “new judicial federalism”
Can be used to effect change, to prevent change, or to slow change
expensive

Interest Groups and Democracy Business enjoys the best representation in Texas Some interests have no representation Groups do not compete on many issues Policymaking in administrative agencies is becoming
more contentious and competitive Iron triangles Issue networks
Interest Groups and Democracy When majority of interest groups agree, their side
usually wins When interest groups oppose political leaders, the
interest groups’ influence decreases greatly Which is it: Pluralism or Elitism? Perspective is
important. Processes and activities vs. results or outcomes
Political Participation
Definition: Any actions, by individuals or groups, to influence or support government and its policies
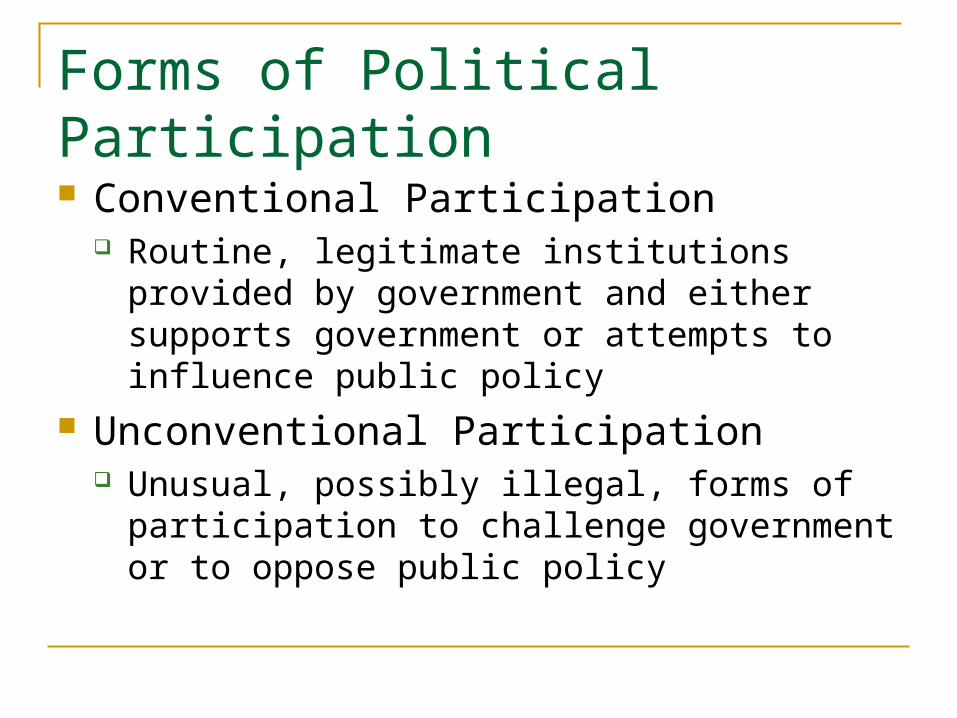
Forms of Political Participation Conventional Participation
Routine, legitimate institutions provided by government and either supports government or attempts to influence public policy
Unconventional Participation Unusual, possibly illegal, forms of participation to
challenge government or to oppose public policy

Attitudes and Forms of Political Participation Internal Political Efficacy
Feeling that person has the skills necessary to influence government
Political Trust Feeling that public officials do the “right thing”
most of the time – decisions are made in the public interest and public officials are honest and trustworthy
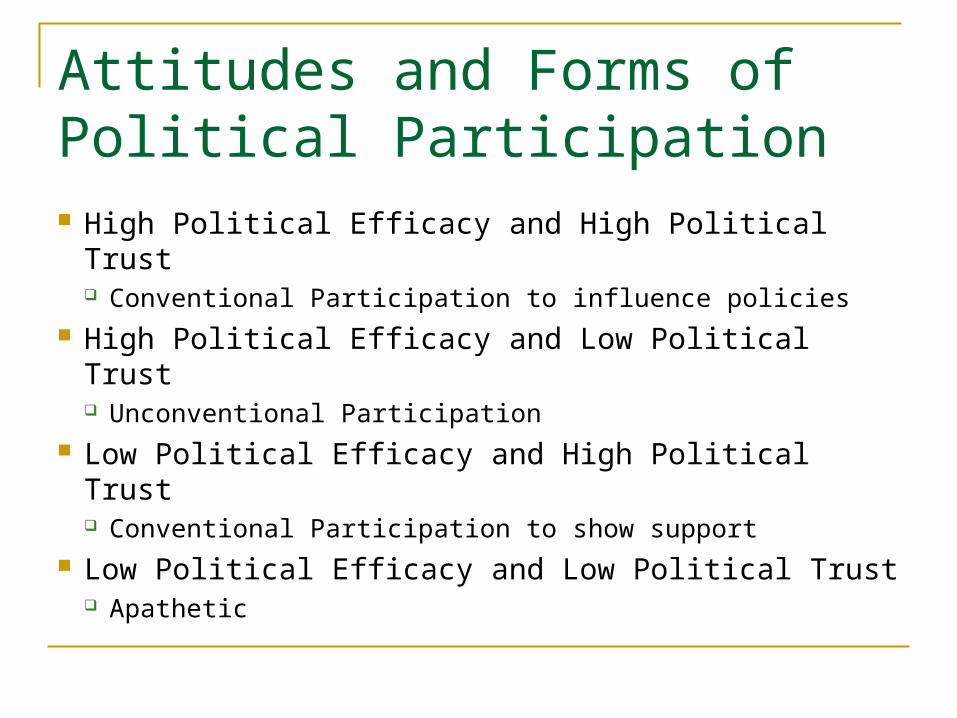
Attitudes and Forms of Political Participation High Political Efficacy and High Political Trust
Conventional Participation to influence policies High Political Efficacy and Low Political Trust
Unconventional Participation Low Political Efficacy and High Political Trust
Conventional Participation to show support Low Political Efficacy and Low Political Trust
Apathetic
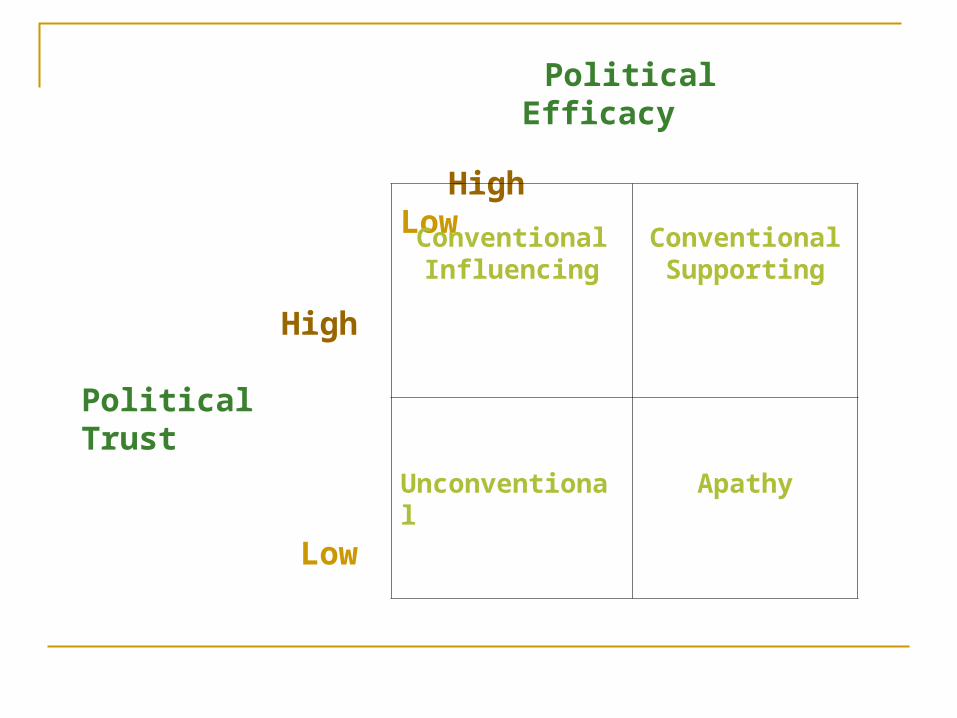
Political Efficacy
High Low
ConventionalInfluencing
ConventionalSupporting
Unconventional
Apathy
High
Political Trust
Low
Elections in Texas
Primary Elections Intraparty contests to determine the party’s
nominees for public offices Held on the first Tuesday in March Legally a closed primary but operates like an
open primary Majority vote necessary to win Ballot access through petition or filing fee Election costs funded by parties and public
monies

Elections in Texas
General Elections Interparty contests to determine which candidates
will hold public office Held on the first Tuesday after the first Monday in
November in even numbered years Plurality vote necessary to win Ballot access through nomination by a party or
petitions Election costs funded by public monies
Elections in Texas
Special Elections Partisan and non-partisan contests to fill vacancies in
state legislative and congressional offices, approve bond proposals, and approve constitutional amendments
Held on one of two uniform dates: May–2nd Saturday or November–First Tuesday after First Monday
Majority vote necessary to win Ballot access through petitions or filing fees Election costs funded by public monies
Political Campaigns in Texas
Money High cost of Texas campaigns
Perry raised 24 million in 2006 47 percent in contributions of $25,000 or more 9 percent in contributions under $100
Sources of campaign contributions Individuals PACs Candidate-financed
Few limitations on campaign contributions Treasurer appointed Limits on cash contributions–$100 Reporting required–Texas Ethics Commission

Political Campaigns in Texas
Media Television is the dominant medium Campaign effects
Changed the way candidates appeal to voters Spawned a new industry – campaign consultants
Political Campaigns in Texas
Marketing Opinion Polling
Benchmark poll Tracking polls Focus groups
Media Services Commercial advertisements
Promotional spots Attack spots
News Coverage

Voter Turnout
Costs of Voting Registration is remaining cost
Registration 30 days prior to election required Motor-voter registration system reduces cost
Register when getting driver’s license Early voting reduces cost
Voting allowed at permanent and temporary sites throughout county 17 days prior to election and ending 4 days prior to election

Voter Turnout
Benefits of Voting Instrumental—person’s vote determines election
outcome Expressive – person finds his or her vote meaningful
Symbolic – expresses a general commitment to a group Instrumental – expresses concern about the election and
its outcome Factors making the vote meaningful
Social Connectedness Political Connectedness

Voter Turnout: Historical Results
1890s – 75 percent voted 1910 – 24 percent voted 1920s - declining turnout into low teens 1950s and 1960s – increasing turnout
reaching 35 percent in 1970 1970s – decline to 20 percent range 1980s and 1990s – increase to 30 percent
range

Vote Choice
Party Identification Vote determined by party identification—straight-ticket
voting Issues
Vote determined by candidates’ positions on issues important to the voter
Candidate Characteristics Vote determined by candidates’ personal characteristics—
most important are competence, integrity, reliability

Vote Choice
Prospective VotingVoting based on what candidates promise to do if elected
Retrospective VotingVoting based on candidate’s past performance

Texas Gubernatorial Elections
1982 – Clements vs. White 1986 – White vs. Clements 1994 – Richards vs. Bush 2002 – Perry vs. Sanchez 2006 – Perry vs. Bell, Strayhorn, Friedman
1982 Gubernatorial Election
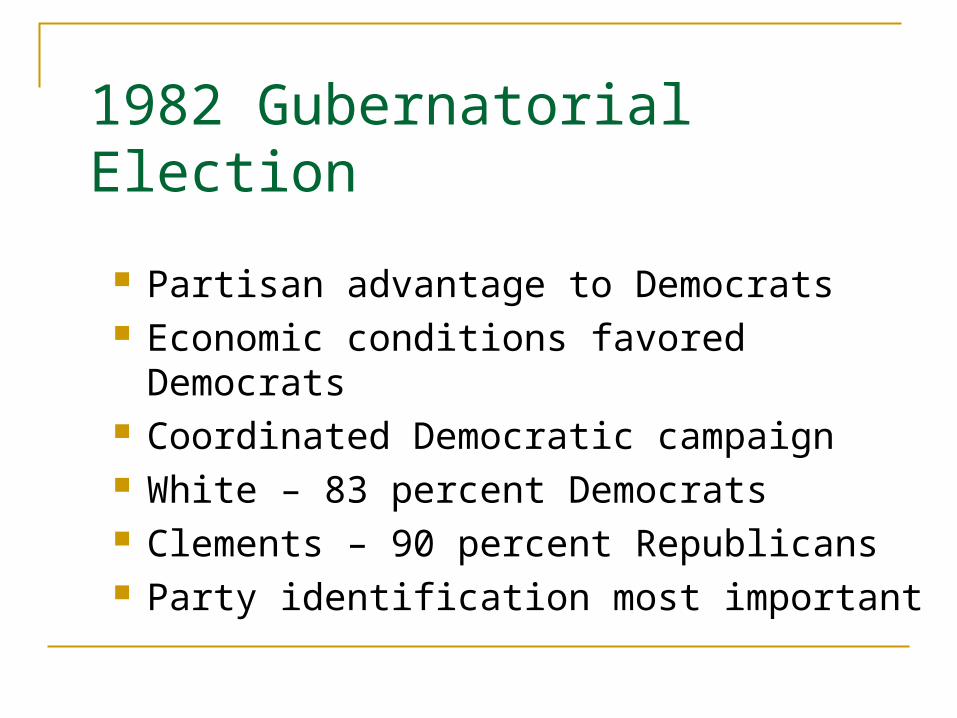
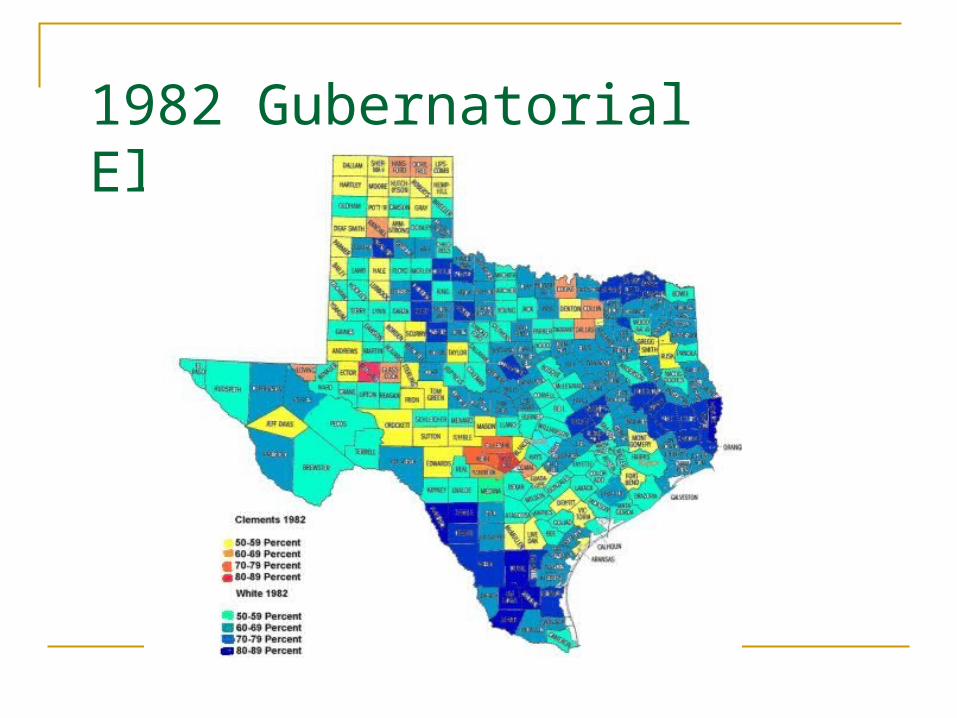
Partisan advantage to Democrats Economic conditions favored Democrats Coordinated Democratic campaign White – 83 percent Democrats Clements – 90 percent Republicans Party identification most important
1982 Gubernatorial Election
1986 Gubernatorial Election
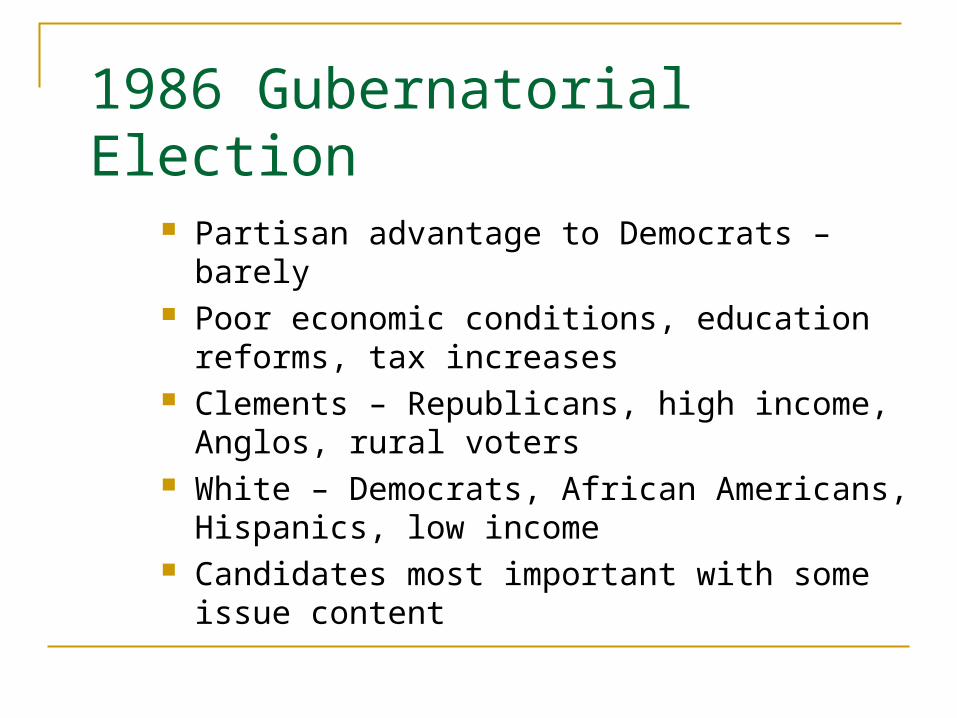
Partisan advantage to Democrats – barely Poor economic conditions, education reforms,
tax increases Clements – Republicans, high income, Anglos,
rural voters White – Democrats, African Americans,
Hispanics, low income Candidates most important with some issue
content

1986 Gubernatorial Election
1994 Gubernatorial Election
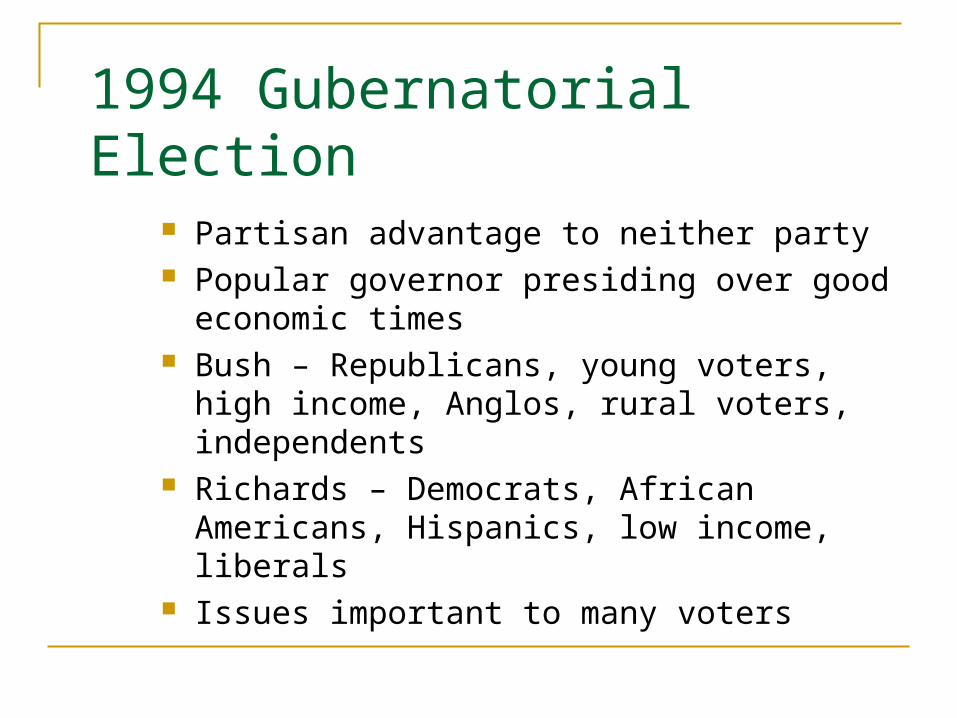
Partisan advantage to neither party Popular governor presiding over good
economic times Bush – Republicans, young voters, high
income, Anglos, rural voters, independents Richards – Democrats, African Americans,
Hispanics, low income, liberals Issues important to many voters

1994 Gubernatorial Election
Blue=Bush (R)Red=Richards (D)

2002 Gubernatorial Election
Republican Party advantage Divisive Democratic Primary Sanchez
78 percent Democrats 83 percent African Americans 68 percent liberals 65 percent Hispanics

2002 Gubernatorial Election
Perry 92 percent Republicans 49 percent independents Majority of Anglos; rural, urban, suburban
dwellers; 30 years old and older Incomes over $35,000 annually
Negative campaigns

2002 Gubernatorial Election
Blue=Perry (R)Red=Sanchez (D)

2006 Gubernatorial Election
Republican Party advantage Five Candidates
Republican incumbent Rick Perry Democrat Chris Bell Independent Carole Keeton Strayhorn Independent Kinky Friedman Libertarian James Werner

2006 Gubernatorial Election
Perry’s Support 73 percent of Republicans 64 percent of Conservatives 44 percent of Anglos Plurality of incomes over $30,000 Plurality of all age categories Plurality of suburban and rural residents
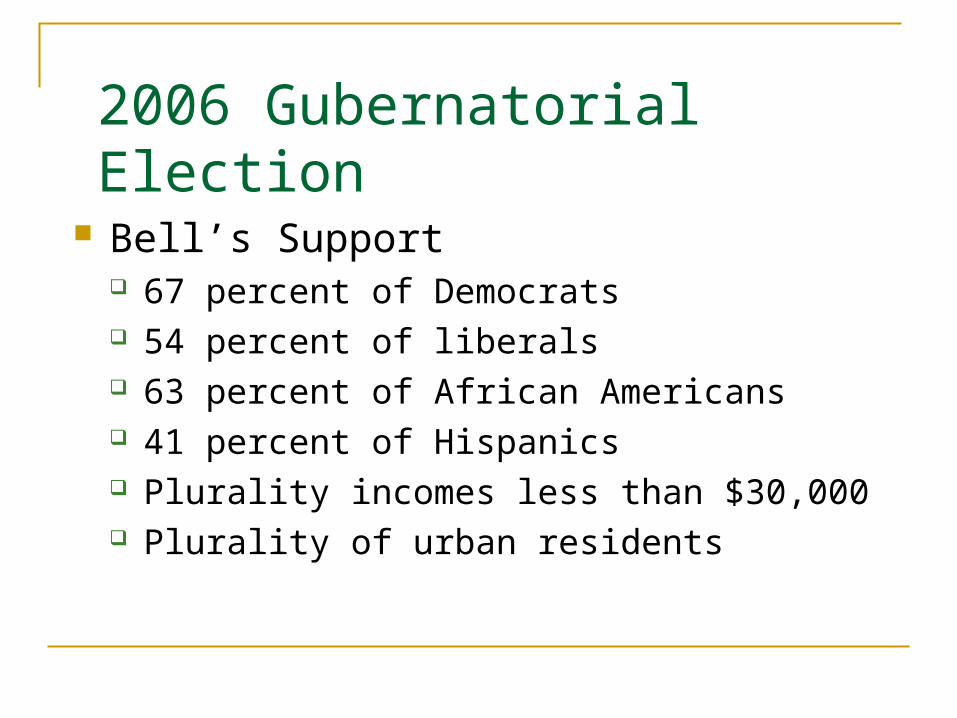
2006 Gubernatorial Election
Bell’s Support 67 percent of Democrats 54 percent of liberals 63 percent of African Americans 41 percent of Hispanics Plurality incomes less than $30,000 Plurality of urban residents
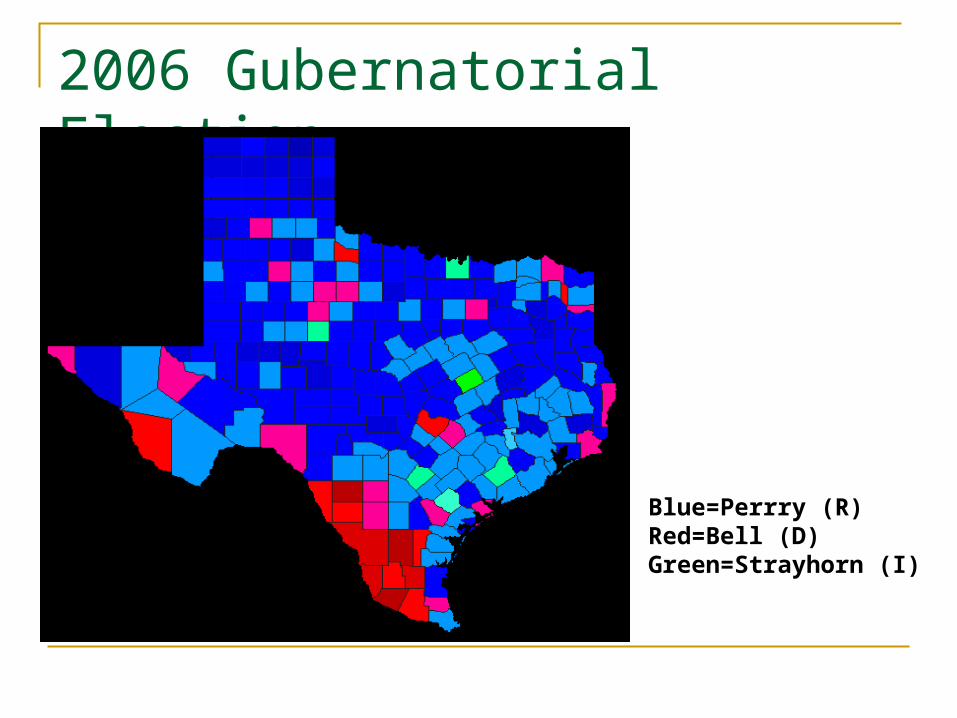
2006 Gubernatorial Election
Blue=Perrry (R)Red=Bell (D)Green=Strayhorn (I)

2006 Gubernatorial Election
What if Strayhorn and Friedman had not run? Perry would have won 47 percent
About equally split between Strayhorn and Friedman Bell would have won 42 percent
Strayhorn hurt Bell more than Friedman did Ten percent would not have voted

Join the Debate: Voting Systems Electronic voting systems vs. paper ballots
Arguments for electronic voting Secret ballots possible for disabled Eliminate some problems of other systems Easy to use and allow rapid tabulation
Arguments against electronic voting No paper trail for recounts Voting is not secure Systems prone to viruses and other computer glitches
Texas Elections and Democracy
Limitations on voting Voting Procedures
Related Documents