WATER AND SANITATION VOTE 41 BUDGET 2020

Welcome message from author
This document is posted to help you gain knowledge. Please leave a comment to let me know what you think about it! Share it to your friends and learn new things together.
Transcript

WATER AND SANITATION
VOTE
41
BUDGET2020

Estimates of
National Expenditure
2020
National Treasury
Republic of South Africa

ISBN: 978‐0‐621‐48100‐6 RP: 18/2020
The 2020 Estimates of National Expenditure is compiled with the latest available information from departmental and other sources. Some of this information is unaudited or subject to revision.
The Estimates of National Expenditure e‐publications for individual votes are available at www.treasury.gov.za. Compared to the abridged Estimates of National Expenditure publication, the e‐publications for each vote contain more comprehensive coverage of all public entities, transfers and subsidies and information on programme specific personnel expenditure.

Foreword
The Estimates of National Expenditure (ENE) publications remain an integral part of the annual budgeting process. In light of the prevailing economic climate, which requires careful consideration around the management of public funds, it has become necessary to focus our efforts on reprioritising existing government resources to areas where the most value can be derived for the benefit of all South Africans. To alleviate fiscal pressures, reductions have been effected on the baseline budgets of departments and public entities. The budgets unpacked in this document reflect the outcome of a robust negotiation process, which was led by a committee of senior officials in central government departments under the political guidance of the Ministers’ Committee on the Budget. There was also wide‐ranging intergovernmental consultation on budgets in the provincial and local spheres of government. Ultimately, the budgetary proposals emanating from these negotiations and consultations were considered and approved by Cabinet.
The abridged ENE provides a comprehensive account of the priorities, spending plans and service delivery commitments of the 41 national government votes, and for selected public entities. The e‐publications for each vote, which are available on National Treasury’s website, contain further details on goods and services, transfers and subsidies, other public entities, and lower‐level spending information on service delivery. In addition, the Vulekamali online portal serves as a transparent, user‐friendly source of information that includes supplementary detailed data as contained in the ENE publications. The portal is a valuable resource for anyone to learn about how government compiles its budget and spends public funds.
The Open Budget Survey, which is published biannually by the International Budget Partnership, assesses and ranks countries based on the availability of 8 key budget documents and the comprehensiveness of the data presented in these documents. In the latest survey, published in 2017, South Africa ranked joint first out of 102 countries with a score of 89 per cent. The next survey is expected to be published in 2020/21 and hopefully South Africa will retain that first position.
All information presented in the ENE publications and Vulekamali promotes a culture of public engagement, accountability in state institutions, and the appropriate spending of public funds to achieve the outcomes as envisaged in the National Development Plan.
A special thanks is extended to all contributors and government colleagues who assisted in making this possible, especially the political leadership shown by the executive and the spirited efforts of the National Treasury team.
Dondo Mogajane Director‐General: National Treasury


Introduction
Estimates of National Expenditure publications
Estimates of National Expenditure (ENE) publications describe in detail government’s expenditure plans over the next three financial years, also known as the medium‐term expenditure framework (MTEF) period. The 2020 MTEF period is from 2020/21 to 2022/23.
The ENE publications contain detailed information regarding the allocations set out in the Appropriation Bill, for the current financial year. Government’s proposed spending plans for the full MTEF period, are shown. Information on how government institutions have spent their budgets in previous years is also included. Explanations are provided on how institutions intend to use their allocations over the medium term to achieve their goals, and the outputs and outcomes to which their spending is expected to lead. Tables present non‐financial performance indicators and targets, departmental receipts, and detailed expenditure trends and estimates by programme, subprogramme and economic classification, and programme personnel data tables for each vote and all entities. Brief explanatory narratives set out the institution’s purpose (and that of its programmes), mandate, programme‐level objectives and descriptions of subprogrammes. An in‐depth narrative analyses the institution’s expected expenditure over the MTEF period.
Additional data tables containing information on provincial and municipal conditional grants, public‐private partnerships, donor funding, infrastructure spending and information at the level of site service delivery, where applicable, are available on the National Treasury website and the Vulekamali online portal.
A separate 2020 ENE Overview publication is also available on the National Treasury website and summarises the ENE information across all votes. The 2020 ENE Overview contains a narrative explanation and budget‐wide summary tables; and it also has a write‐up on how to interpret the information that is contained in each section of the publications.


Water and Sanitation
National Treasury
Republic of South Africa
Contents
Vote purpose .......................................................................................................................................... 1
Mandate ................................................................................................................................................. 1
Selected performance indicators ........................................................................................................... 1
Expenditure analysis ............................................................................................................................... 2
Expenditure trends and estimates ......................................................................................................... 3
Transfers and subsidies expenditure trends and estimates ................................................................... 4
Personnel information ............................................................................................................................ 5
Departmental receipts ............................................................................................................................ 6
Programme 1: Administration ................................................................................................................ 6
Programme 2: Water Planning and Information Management ............................................................. 8
Programme 3: Water Infrastructure Development .............................................................................. 10
Programme 4: Water Sector Regulation .............................................................................................. 13
Entities .................................................................................................................................................. 15

1
Vote 41
Water and Sanitation Budget summary
2020/21 2021/22 2022/23
R million TotalCurrent
paymentsTransfers and
subsidiesPayments for capital assets Total Total
MTEF allocation Administration 1 976.5 1 856.9 28.9 90.8 2 114.9 2 192.8Water Planning and Information Management 1 026.4 961.5 2.3 62.6 1 088.1 1 129.9Water Infrastructure Development 13 795.8 412.1 8 942.1 4 441.5 13 643.0 14 160.0Water Sector Regulation 417.5 405.2 0.8 11.4 424.4 442.3
Total expenditure estimates 17 216.2 3 635.7 8 974.1 4 606.4 17 270.4 17 924.9
Executive authority Minister of Human Settlements, Water and Sanitation Accounting officer Director‐General of Water and Sanitation Website www.dwa.gov.za The Estimates of National Expenditure e‐publications for individual votes are available at www.treasury.gov.za. These publications provide more comprehensive coverage of vote‐specific information, particularly about transfers and subsidies, personnel and other public institutions. Additional tables in Excel format can be found at www.treasury.gov.za and www.vulekamali.gov.za.
Vote purpose
Ensure the availability of water resources to facilitate equitable and sustainable socioeconomic development, and ensure universal access to water and sanitation services.
Mandate
The mandate of the Department of Water and Sanitation is set out in the National Water Act (1998) and the Water Services Act (1997). The department’s legislative mandate is to ensure that the country’s water resources are protected, managed, used, developed, conserved and controlled by regulating and supporting the delivery of effective water supply and sanitation. This is done in accordance with the requirements of water‐related policies and legislation that are critical in delivering on people’s right to have sufficient food and water, growing the economy, and eradicating poverty.
Selected performance indicators Table 41.1 Vote performance indicators by programme and related priority Indicator Programme MTSF priority Past Current Projections
2016/17 2017/18 2018/19 2019/20 2020/21 2021/22 2022/23
Number of reports on progress analysed against the approved annual international relations implementation plan per year
Administration
Departmental mandate
4 4 1 1 1 1 1
Number of river systems with water resources classes and determined resource quality objectives per year
Water Planning and Information Management
Priority 4: Spatial integration, human settlements and local government
2 1 4 3 0 0 1

2020 Estimates of National Expenditure
2
Table 41.1 Vote performance indicators by programme and related priority Indicator Programme MTSF priority Past Current Projections
2016/17 2017/18 2018/19 2019/20 2020/21 2021/22 2022/23
Number of mega regional bulk infrastructure project phases completed per year
Water Infrastructure Development
Priority 4: Spatial integration, human settlements and local government
0 0 1 2 0 1 1
Number of large regional bulk infrastructure project phases completed per year
Water Infrastructure Development
2 5 5 12 10 8 8
Number of small regional bulk infrastructure project phases completed per year
Water Infrastructure Development
31 6 9 13 4 5 3
Number of small projects completed through the water services infrastructure grant per year
Water Infrastructure Development
316 47 0 131 83 90 95
Number of existing bucket sanitation backlog systems in formal settlements replaced with adequate sanitation services per year
Water Infrastructure Development
6 978 8 313 7 031 12 221 10 798 –1 –1
Number of wastewater systems assessed for compliance with green drop regulatory standards per year
Water Sector Regulation 0 0 0 0 963 0 963
Number of water supply systems assessed for compliance with blue drop regulatory standards per year
Water Sector Regulation 763 788 0 0 0 1 010 0
Percentage of water use authorisation applications finalised within 120 working days of application
Water Sector Regulation Priority 1: Economic transformation and job creation
68%(275/404)
96%(447/467)
81%(476/588)
80% 80% 80% 80%
1. Indicator discontinued.
Expenditure analysis
Chapter 4 of the National Development Plan envisages a South Africa that recognises the importance of secure and equitable access to water and sanitation as catalysts for socioeconomic development. This is given expression by priority 1 (economic transformation and job creation) and priority 4 (spatial integration, human settlements and local government) of government’s 2019‐24 medium‐term strategic framework, with which the work of the Department of Water and Sanitation is aligned. Accordingly, the department will continue to focus on integrated water resources management, infrastructure planning and development; and regulating water services.
Expenditure is expected to increase at an average annual rate of 2.9 per cent, from R16.5 billion in 2019/20 to R17.9 billion in 2022/23. Transfers and subsidies, and payments for capital assets account for 78.1 per cent (R40.9 billion) of the department’s total expenditure over the MTEF period. The bulk of the department’s remaining expenditure over the same period is on compensation of employees, which amounts to R6.3 billion; and goods and services, which amounts to R5.2 billion.
Spending in the Water Infrastructure Development programme accounts for 79.4 per cent (R41.6 billion) of the department’s total expenditure over the medium term. This is despite Cabinet having approved reductions amounting to R2.2 billion over the same period on the regional bulk infrastructure grant and the water services infrastructure grant, which are funded through the programme. As a result of these reductions, direct transfers to municipalities are expected to increase at an average annual rate of 1.4 per cent, from R5.7 billion in 2019/20 to R6 billion in 2022/23.

Vote 41: Water and Sanitation
3
Water resources management, infrastructure planning and development
The water and sanitation master plan details the requirements for appropriate investment into water resources and services, and sets targets for adequate water conservation and demand management. To support the implementation of the master plan, the Water Infrastructure Development programme is expected to receive allocations amounting to R41.6 billion over the MTEF period. These allocations will provide funding to the regional bulk infrastructure grant, the water services infrastructure grant and transfers to the Water Trading Entity for the development of key water infrastructure. Funding in the regional bulk infrastructure grant and the water services infrastructure grant for new and existing projects amount to R33.2 billion over the medium term. Funding from these grants will be used to implement 2 mega projects and 26 large regional bulk infrastructure projects. Over the medium term, 280 small regional bulk and water services infrastructure projects will be implemented.
To address water infrastructure backlogs and improve operational sustainability, over the medium term, the department will continue to plan and maintain infrastructure. Related activities will be carried out in the Water Planning and Information Management programme, spending in which is expected to increase at an average annual rate of 7.6 per cent, from R907.9 million in 2019/20 to R1.1 billion in 2022/23. To continue funding short‐term and long‐term interventions in new and existing projects, the Water Trading Entity will receive transfers amounting to R7.2 billion over the medium term. Projects include acid mine drainage operations in Gauteng, phase 2D of the Olifants River water resources development project, the Mokolo‐Crocodile River water augmentation project, the raising of Tzaneen Dam, the Umdloti River development project, and the raising of the Hazelmere Dam.
Regulating water services
Over the period ahead, the department plans to reintroduce regulatory quality valuations on the provision of water services. These valuations are intended to measure the level of compliance with the green drop and blue drop standards. Accordingly, the department plans to assess 963 wastewater in 2020/21 and 1 010 water supply systems in 2021/22. To improve equitable access to water resources, the department plans to process 80 per cent of the water use licence applications it receives within 120 days. In addition, the department plans to assess and determine the resource quality of the uThukela River system. These activities will be carried out in the Water Sector Regulation programme, which is expected to receive allocations amounting to R1.3 billion over the medium term.
Expenditure trends and estimates Table 41.2 Vote expenditure trends and estimates by programme and economic classification Programmes 1. Administration 2. Water Planning and Information Management 3. Water Infrastructure Development 4. Water Sector Regulation Programme
Audited outcome Adjusted
appropriation
Averagegrowth
rate(%)
Average:Expen‐diture/Total(%)
Medium‐term expenditure estimate
Averagegrowth
rate(%)
Average:Expen‐diture/Total(%)
R million 2016/17 2017/18 2018/19 2019/20 2016/17 ‐ 2019/20 2020/21 2021/22 2022/23 2019/20 ‐ 2022/23
Programme 1 1 557.9 1 998.7 1 634.0 1 836.2 0.1 0.1 1 976.5 2 114.9 2 192.8 0.1 0.1Programme 2 815.4 653.3 689.7 907.9 0.0 0.0 1 026.4 1 088.1 1 129.9 0.1 0.1Programme 3 12 953.9 12 146.2 14 013.1 13 287.0 0.0 0.8 13 795.8 13 643.0 14 160.0 0.0 0.8Programme 4 308.2 308.1 282.6 436.3 0.1 0.0 417.5 424.4 442.3 0.0 0.0
Total 15 635.4 15 106.3 16 619.4 16 467.3 0.0 1.0 17 216.2 17 270.4 17 924.9 0.0 1.0
Change to 2019 Budget estimate
26.9 (165.2) (1 281.7) (1 597.3)

2020 Estimates of National Expenditure
4
Table 41.2 Vote expenditure trends and estimates by programme and economic classification Economic classification
Audited outcome Adjusted
appropriation
Averagegrowth
rate(%)
Average:Expen‐diture/Total(%)
Medium‐term expenditure estimate
Averagegrowth
rate(%)
Average:Expen‐diture/Total(%)
R million 2016/17 2017/18 2018/19 2019/20 2016/17 ‐ 2019/20 2020/21 2021/22 2022/23 2019/20 ‐ 2022/23 Current payments 3 139.9 3 546.9 3 625.3 3 486.1 0.0 0.2 3 635.7 3 845.9 4 003.8 0.0 0.2
Compensation of employees 1 439.9 1 535.6 1 604.0 1 821.3 0.1 0.1 1 988.3 2 116.8 2 208.5 0.1 0.1Goods and services1 1 699.9 1 999.7 2 021.2 1 664.8 (0.0) 0.1 1 647.5 1 729.0 1 795.4 0.0 0.1of which: Computer services 148.7 97.9 133.8 148.9 – 0.0 172.7 184.4 184.9 0.1 0.0Consultants: Business and advisory services
154.8 182.2 57.8 227.6 0.1 0.0 156.3 135.8 141.6 (0.1) 0.0
Infrastructure and planning services
145.4 304.7 109.9 232.0 0.2 0.0 215.3 234.9 243.7 0.0 0.0
Operating leases 304.9 311.0 414.5 418.2 0.1 0.0 452.7 486.0 503.6 0.1 0.0Property payments 90.2 102.5 111.5 123.8 0.1 0.0 126.9 131.6 138.7 0.0 0.0Travel and subsistence 235.4 202.9 121.8 168.3 (0.1) 0.0 167.6 175.1 183.4 0.0 0.0Interest and rent on land 0.1 11.5 0.0 – (1.0) – – – – – –
Transfers and subsidies1 7 482.2 8 185.7 9 933.9 9 149.5 0.1 0.5 8 974.1 9 226.2 9 493.0 0.0 0.5
Provinces and municipalities 4 681.3 5 134.8 6 741.0 5 736.5 0.1 0.3 5 451.4 5 777.0 5 982.5 0.0 0.3Departmental agencies and accounts
1 725.9 1 885.6 2 269.8 2 370.0 0.1 0.1 2 450.5 2 380.7 2 423.5 0.0 0.1
Foreign governments and international organisations
188.3 112.1 209.3 227.0 0.1 0.0 236.4 247.2 256.3 0.0 0.0
Public corporations and private enterprises
844.8 1 022.3 694.7 782.9 (0.0) 0.1 809.3 793.8 802.5 0.0 0.0
Non‐profit institutions 3.3 0.8 1.2 2.9 (0.0) – 1.6 1.4 1.5 (0.2) –Households 38.6 30.1 17.9 30.2 (0.1) 0.0 24.9 26.0 26.7 (0.0) 0.0Payments for capital assets 5 013.3 3 373.7 3 060.3 3 830.9 (0.1) 0.2 4 606.4 4 198.3 4 428.1 0.0 0.2
Buildings and other fixed structures
4 927.4 3 301.1 2 977.4 3 698.6 ‐9.1% 23.4% 4 467.6 4 037.6 4 261.2 4.8% 23.9%
Machinery and equipment 62.0 45.1 51.6 98.9 16.8% 0.4% 99.3 112.3 119.3 6.4% 0.6%Software and other intangible assets
24.0 27.4 31.3 33.4 0.1 0.0 39.4 48.4 47.6 0.1 0.0
Payments for financial assets 0.0 – – 0.7 5.3 – – – – (1.0) –
Total 15 635.4 15 106.3 16 619.4 16 467.3 0.0 1.0 17 216.2 17 270.4 17 924.9 0.0 1.0
1. Tables that detail expenditure trends, annual budget, adjusted appropriation and audited outcome are available at www.treasury.gov.za and www.vulekamali.gov.za.
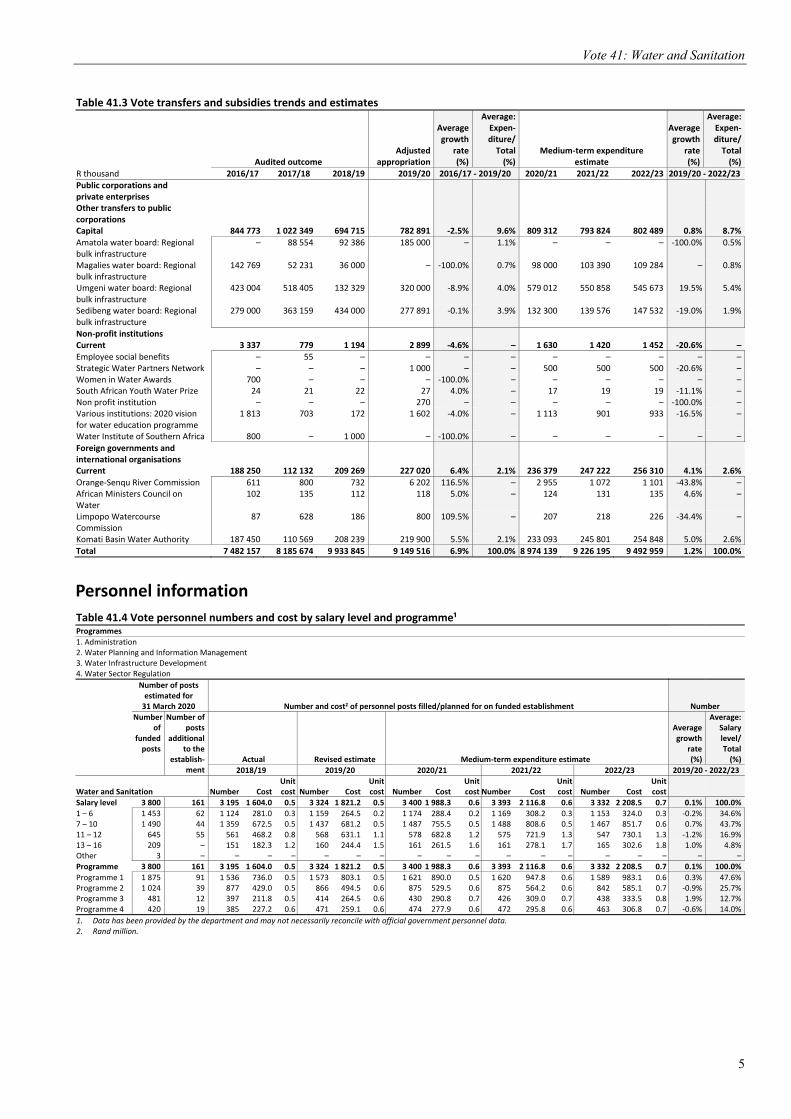
Transfers and subsidies expenditure trends and estimates Table 41.3 Vote transfers and subsidies trends and estimates
Audited outcome Adjusted
appropriation
Averagegrowth
rate(%)
Average:Expen‐diture/Total(%)
Medium‐term expenditure estimate
Averagegrowth
rate(%)
Average:Expen‐diture/Total(%)
R thousand 2016/17 2017/18 2018/19 2019/20 2016/17 ‐ 2019/20 2020/21 2021/22 2022/23 2019/20 ‐ 2022/23
Departmental agencies and accounts Departmental agencies (non‐business entities)
Current 181 408 175 678 185 865 196 270 2.7% 2.1% 207 002 218 387 230 474 5.5% 2.3%
Energy and Water Services Sector Education and Training Authority
2 202 2 676 2 829 2 986 10.7% – 3 087 3 257 3 437 4.8% –
Water information management 12 206 2 2 – ‐100.0% – – – – – –Water Trading Entity 165 000 173 000 183 034 193 284 5.4% 2.1% 203 915 215 130 227 037 5.5% 2.3%Water Research Commission 2 000 – – – ‐100.0% – – – – – –
Capital 1 544 461 1 709 881 2 083 894 2 173 752 12.1% 21.6% 2 243 474 2 162 329 2 193 062 0.3% 23.8%Water Trading Entity 1 544 461 1 709 881 2 083 894 2 173 752 12.1% 21.6% 2 243 474 2 162 329 2 193 062 0.3% 23.8%
Households Social benefits Current 10 450 8 759 9 858 10 724 0.9% 0.1% 4 401 4 298 4 188 ‐26.9% 0.1%Employee social benefits 10 450 8 759 9 858 10 503 0.2% 0.1% 4 401 4 298 4 188 ‐26.4% 0.1%Social Benefit – – – 221 – – – – – ‐100.0% –Provinces and municipalities Municipal bank accounts Current 546 553 762 819 14.5% – 664 697 721 ‐4.2% –
Vehicle licences 546 553 762 819 14.5% – 664 697 721 ‐4.2% –
Capital 4 680 773 5 134 239 6 740 267 5 735 679 7.0% 64.1% 5 450 770 5 776 352 5 981 791 1.4% 62.3%
Regional bulk infrastructure grant 1 849 791 1 829 002 1 963 000 2 066 360 3.8% 22.2% 2 005 605 2 156 025 2 280 772 3.3% 23.1%Water services infrastructure grant 2 830 982 3 305 237 4 777 267 3 669 319 9.0% 42.0% 3 445 165 3 620 327 3 701 019 0.3% 39.2%
Households Other transfers to households Current 28 159 21 304 8 021 19 462 ‐11.6% 0.2% 20 507 21 666 22 472 4.9% 0.2%
Employee social benefits 12 624 4 470 2 624 202 ‐74.8% 0.1% 183 225 234 5.0% –Bursaries for non‐employees 15 535 16 834 5 397 19 260 7.4% 0.2% 20 324 21 441 22 238 4.9% 0.2%
Vote 41: Water and Sanitation
5
Table 41.3 Vote transfers and subsidies trends and estimates
Audited outcome Adjusted
appropriation
Averagegrowth
rate(%)
Average:Expen‐diture/Total(%)
Medium‐term expenditure estimate
Averagegrowth
rate(%)
Average:Expen‐diture/Total(%)
R thousand 2016/17 2017/18 2018/19 2019/20 2016/17 ‐ 2019/20 2020/21 2021/22 2022/23 2019/20 ‐ 2022/23Public corporations and private enterprises
Other transfers to public corporations
Capital 844 773 1 022 349 694 715 782 891 ‐2.5% 9.6% 809 312 793 824 802 489 0.8% 8.7%
Amatola water board: Regional bulk infrastructure
– 88 554 92 386 185 000 – 1.1% – – – ‐100.0% 0.5%
Magalies water board: Regional bulk infrastructure
142 769 52 231 36 000 – ‐100.0% 0.7% 98 000 103 390 109 284 – 0.8%
Umgeni water board: Regional bulk infrastructure
423 004 518 405 132 329 320 000 ‐8.9% 4.0% 579 012 550 858 545 673 19.5% 5.4%
Sedibeng water board: Regional bulk infrastructure
279 000 363 159 434 000 277 891 ‐0.1% 3.9% 132 300 139 576 147 532 ‐19.0% 1.9%
Non‐profit institutions Current 3 337 779 1 194 2 899 ‐4.6% – 1 630 1 420 1 452 ‐20.6% –Employee social benefits – 55 – – – – – – – – –Strategic Water Partners Network – – – 1 000 – – 500 500 500 ‐20.6% –Women in Water Awards 700 – – – ‐100.0% – – – – – –South African Youth Water Prize 24 21 22 27 4.0% – 17 19 19 ‐11.1% –Non profit institution – – – 270 – – – – – ‐100.0% –Various institutions: 2020 vision for water education programme
1 813 703 172 1 602 ‐4.0% – 1 113 901 933 ‐16.5% –
Water Institute of Southern Africa 800 – 1 000 – ‐100.0% – – – – – –
Foreign governments and international organisations
Current 188 250 112 132 209 269 227 020 6.4% 2.1% 236 379 247 222 256 310 4.1% 2.6%
Orange‐Senqu River Commission 611 800 732 6 202 116.5% – 2 955 1 072 1 101 ‐43.8% –African Ministers Council on Water
102 135 112 118 5.0% – 124 131 135 4.6% –
Limpopo Watercourse Commission
87 628 186 800 109.5% – 207 218 226 ‐34.4% –
Komati Basin Water Authority 187 450 110 569 208 239 219 900 5.5% 2.1% 233 093 245 801 254 848 5.0% 2.6%
Total 7 482 157 8 185 674 9 933 845 9 149 516 6.9% 100.0% 8 974 139 9 226 195 9 492 959 1.2% 100.0%
Personnel information
Table 41.4 Vote personnel numbers and cost by salary level and programme¹
Programmes
1. Administration 2. Water Planning and Information Management 3. Water Infrastructure Development 4. Water Sector Regulation
Number of posts estimated for 31 March 2020 Number and cost2 of personnel posts filled/planned for on funded establishment Number
Number of
funded posts
Number of posts
additional to the
establish‐ ment
Actual Revised estimate Medium‐term expenditure estimate
Average growth
rate(%)
Average: Salarylevel/Total(%)
2018/19 2019/20 2020/21 2021/22 2022/23 2019/20 ‐ 2022/23
Water and Sanitation Number Cost Unit cost Number Cost
Unitcost Number Cost
Unitcost Number Cost
Unit cost Number Cost
Unitcost
Salary level 3 800 161 3 195 1 604.0 0.5 3 324 1 821.2 0.5 3 400 1 988.3 0.6 3 393 2 116.8 0.6 3 332 2 208.5 0.7 0.1% 100.0%
1 – 6 1 453 62 1 124 281.0 0.3 1 159 264.5 0.2 1 174 288.4 0.2 1 169 308.2 0.3 1 153 324.0 0.3 ‐0.2% 34.6%7 – 10 1 490 44 1 359 672.5 0.5 1 437 681.2 0.5 1 487 755.5 0.5 1 488 808.6 0.5 1 467 851.7 0.6 0.7% 43.7%11 – 12 645 55 561 468.2 0.8 568 631.1 1.1 578 682.8 1.2 575 721.9 1.3 547 730.1 1.3 ‐1.2% 16.9%13 – 16 209 – 151 182.3 1.2 160 244.4 1.5 161 261.5 1.6 161 278.1 1.7 165 302.6 1.8 1.0% 4.8%Other 3 – – – – – – – – – – – – – – – – – –
Programme 3 800 161 3 195 1 604.0 0.5 3 324 1 821.2 0.5 3 400 1 988.3 0.6 3 393 2 116.8 0.6 3 332 2 208.5 0.7 0.1% 100.0%
Programme 1 1 875 91 1 536 736.0 0.5 1 573 803.1 0.5 1 621 890.0 0.5 1 620 947.8 0.6 1 589 983.1 0.6 0.3% 47.6%Programme 2 1 024 39 877 429.0 0.5 866 494.5 0.6 875 529.5 0.6 875 564.2 0.6 842 585.1 0.7 ‐0.9% 25.7%Programme 3 481 12 397 211.8 0.5 414 264.5 0.6 430 290.8 0.7 426 309.0 0.7 438 333.5 0.8 1.9% 12.7%Programme 4 420 19 385 227.2 0.6 471 259.1 0.6 474 277.9 0.6 472 295.8 0.6 463 306.8 0.7 ‐0.6% 14.0%
1. Data has been provided by the department and may not necessarily reconcile with official government personnel data. 2. Rand million.

2020 Estimates of National Expenditure
6
Departmental receipts Table 41.5 Departmental receipts by economic classification
Audited outcome Adjustedestimate
Revisedestimate
Averagegrowth
rate(%)
Average:Receiptitem/Total(%) Medium‐term receipts estimate
Averagegrowth
rate(%)
Average:Receiptitem/Total(%)
R thousand 2016/17 2017/18 2018/19 2019/20 2016/17 ‐ 2019/20 2020/21 2021/22 2022/23 2019/20 ‐ 2022/23 Departmental receipts 20 964 12 876 66 410 15 285 11 503 ‐18.1% 100.0% 14 524 16 515 18 024 16.1% 100.0%Sales of goods and services produced by department
3 164 1 871 2 339 2 070 991 ‐32.1% 7.5% 2 414 2 603 2 711 39.9% 14.4%
Sales by market establishments 877 699 851 784 396 ‐23.3% 2.5% 750 836 875 30.2% 4.7%of which:
Market establishment: Rental dwelling
567 509 641 572 289 ‐20.1% 1.8% 550 577 600 27.6% 3.3%
Market establishment: Non‐residential building
123 6 17 2 2 ‐74.7% 0.1% 10 69 75 234.7% 0.3%
Market establishment: Rental parking
187 184 193 210 105 ‐17.5% 0.6% 190 190 200 24.0% 1.1%
Administrative fees 65 58 63 67 – ‐100.0% 0.2% 65 95 74 – 0.4%of which: Services rendered: Transport fees 50 48 52 62 – ‐100.0% 0.1% 50 49 50 – 0.2%Sales: Tender documents – – – – – – – – 25 – – –Sales: Maps 10 7 7 3 – ‐100.0% – 10 15 18 – 0.1%Replacement of security cards 4 3 4 2 – ‐100.0% – 5 5 5 – –Sales: Water potable 1 – – – – ‐100.0% – – 1 1 – –
Other sales 2 222 1 114 1 425 1 219 595 ‐35.5% 4.8% 1 599 1 672 1 762 43.6% 9.3%of which:
Rental capital assets 70 75 112 192 72 0.9% 0.3% 78 75 86 6.1% 0.5%Sales: Departmental publications and production
7 3 10 10 7 – – 2 3 7 – –
Services rendered: Commission on insurance and garnishee
748 759 782 937 399 ‐18.9% 2.4% 764 770 800 26.1% 4.5%
Sales: Meals and refreshments 989 175 443 10 3 ‐85.5% 1.4% 505 558 600 484.8% 2.8%Services rendered: Boarding service 408 98 78 70 68 ‐45.0% 0.6% 200 216 219 47.7% 1.2%Sales: Assets less than R5 000 – 4 – – 44 – – 50 50 50 4.4% 0.3%List item – – – – 2 – – – – – ‐100.0% –Sales of scrap, waste, arms and other used current goods
– 6 15 60 11 – – 10 12 13 5.7% 0.1%
of which:
Sales: Scrap – 6 15 60 11 – – 10 12 13 5.7% 0.1%Fines, penalties and forfeits – – 400 1 580 1 310 – 1.5% – – – ‐100.0% 2.2%Interest, dividends and rent on land
1 384 2 992 2 921 3 199 1 785 8.9% 8.1% 2 900 2 900 3 000 18.9% 17.5%
Interest 1 384 2 992 2 921 3 199 1 785 8.9% 8.1% 2 900 2 900 3 000 18.9% 17.5%Sales of capital assets – 197 – 247 246 – 0.4% 200 200 200 ‐6.7% 1.4%Transactions in financial assets and liabilities
16 416 7 810 60 735 8 129 7 160 ‐24.2% 82.4% 9 000 10 800 12 100 19.1% 64.5%
Total 20 964 12 876 66 410 15 285 11 503 ‐18.1% 100.0% 14 524 16 515 18 024 16.1% 100.0%
Programme 1: Administration
Programme purpose
Provide strategic leadership, management and support services to the department. Develop and promote international relations on water resources with neighbouring countries.
Objective
Facilitate cooperation by implementing and evaluating the approved African and global international relations plan annually, in support of the national water and sanitation agenda.
Subprogramme
Ministry provides administrative and logistical support to the minister and deputy minister, and their support staff, and makes provision for their salaries.
Departmental Management provides policy and strategic direction for water and sanitation management. This includes enterprise‐wide support services comprising administrative support to the director‐general, corporate planning, and monitoring and evaluation; and the provision of salaries and operational budgets for the department’s regional office heads.

Vote 41: Water and Sanitation
7
Internal Audit provides independent, objective assurance and advisory services to improve the department’s operations.
Corporate Services provides enterprise‐wide support comprising human resources, legal services, communications, the learning and development academy, and transformation policy and coordination.
Financial Management ensures the efficient management of daily financial operations, processes and systems.
Office Accommodation makes payments for rental charges on all leased office space occupied by the department; and for municipal services such as electricity, water, and sewage and waste removal.
Programme Management Unit provides for improved coordination and governance in the management of departmental projects.
International Water Support strategically coordinates, promotes and manages international relations on water and sanitation between countries through bilateral and multilateral cooperation instruments and organisations, in line with legislative provisions. This subprogramme also pursues national interests in African
and global multilateral organisations and forums.
Expenditure trends and estimates
Table 41.6 Administration expenditure trends and estimates by subprogramme and economic classification Subprogramme
Audited outcome Adjusted
appropriation
Averagegrowth
rate(%)
Average:Expen‐diture/Total(%)
Medium‐term expenditure estimate
Averagegrowth
rate(%)
Average:Expen‐diture/Total(%)
R million 2016/17 2017/18 2018/19 2019/20 2016/17 ‐ 2019/20 2020/21 2021/22 2022/23 2019/20 ‐ 2022/23 Ministry 52.3 56.1 57.1 56.4 2.6% 3.2% 55.0 58.3 60.5 2.4% 2.8%Departmental Management 105.5 61.8 65.7 104.3 ‐0.4% 4.8% 108.4 115.3 119.8 4.7% 5.5%Internal Audit 36.3 34.3 32.6 38.5 2.0% 2.0% 48.9 51.8 54.6 12.3% 2.4%Corporate Services 718.6 1 197.3 671.4 764.2 2.1% 47.7% 849.6 913.4 945.9 7.4% 42.8%Financial Management 232.0 204.7 254.1 267.1 4.8% 13.6% 282.6 300.6 311.9 5.3% 14.3%Office Accommodation 346.9 367.5 475.0 481.4 11.5% 23.8% 519.0 555.8 576.0 6.2% 26.3%Programme Management Unit 28.1 39.3 40.3 65.6 32.7% 2.5% 55.9 59.3 61.5 ‐2.1% 3.0%International Water Support 38.2 37.7 37.7 58.7 15.4% 2.5% 57.3 60.4 62.7 2.2% 2.9%
Total 1 557.9 1 998.7 1 634.0 1 836.2 5.6% 100.0% 1 976.5 2 114.9 2 192.8 6.1% 100.0%
Change to 2019 Budget estimate
3.8 (17.0) (11.6) (13.7)
Economic classification
Current payments 1 483.9 1 925.1 1 571.6 1 727.5 5.2% 95.5% 1 856.9 1 982.0 2 055.7 6.0% 93.9%Compensation of employees 670.2 695.0 736.0 803.1 6.2% 41.3% 890.0 947.8 983.1 7.0% 44.6%Goods and services1 813.7 1 230.2 835.6 924.3 4.3% 54.1% 966.9 1 034.2 1 072.7 5.1% 49.2%of which: Audit costs: External 36.2 22.0 40.7 35.2 ‐0.9% 1.9% 41.4 43.8 45.5 8.9% 2.0%Communication 24.1 23.8 21.9 18.9 ‐7.7% 1.3% 27.0 27.3 31.3 18.3% 1.3%Computer services 58.4 47.1 71.6 85.1 13.4% 3.7% 94.1 101.2 98.6 5.0% 4.7%Operating leases 302.1 310.8 414.5 417.8 11.4% 20.6% 451.9 485.0 502.5 6.4% 22.9%Property payments 78.6 86.4 95.4 108.2 11.3% 5.2% 113.3 117.2 123.7 4.5% 5.7%Travel and subsistence 72.3 67.1 54.6 73.8 0.7% 3.8% 77.8 82.9 85.9 5.2% 3.9%Interest and rent on land – – 0.0 – – – – – – – –
Transfers and subsidies1 21.9 23.6 12.6 35.1 17.0% 1.3% 28.9 28.4 29.5 ‐5.6% 1.5%Provinces and municipalities 0.0 0.0 0.0 0.1 52.7% – 0.1 0.1 0.1 15.2% –Departmental agencies and accounts
2.2 2.7 2.8 3.0 10.7% 0.2% 3.1 3.3 3.4 4.8% 0.2%
Foreign governments and international organisations
0.8 1.6 1.0 7.1 107.2% 0.1% 3.3 1.4 1.5 ‐41.0% 0.2%
Non‐profit institutions 0.7 – – 1.0 12.6% – 0.5 0.5 0.5 ‐20.6% –Households 18.2 19.4 8.7 23.9 9.6% 1.0% 21.9 23.1 24.0 0.1% 1.1%Payments for capital assets 52.1 49.9 49.8 72.9 11.8% 3.2% 90.8 104.4 107.5 13.8% 4.6%
Buildings and other fixed structures
– 0.0 – – – – – – – – –
Machinery and equipment 29.1 22.5 18.5 39.7 10.9% 1.6% 52.0 56.8 60.6 15.2% 2.6%Software and other intangible assets
23.0 27.4 31.3 33.2 13.0% 1.6% 38.8 47.7 46.9 12.2% 2.1%
Payments for financial assets 0.0 – – 0.7 521.7% – – – – ‐100.0% –
Total 1 557.9 1 998.7 1 634.0 1 836.2 5.6% 100.0% 1 976.5 2 114.9 2 192.8 6.1% 100.0%
Proportion of total programme expenditure to vote expenditure
10.0% 13.2% 9.8% 11.2% – – 11.5% 12.2% 12.2% – –

2020 Estimates of National Expenditure
8
Table 41.6 Administration expenditure trends and estimates by subprogramme and economic classification Details of transfers and subsidies
Audited outcome Adjusted
appropriation
Averagegrowth
rate(%)
Average:Expen‐diture/Total(%)
Medium‐term expenditure estimate
Averagegrowth
rate(%)
Average:Expen‐diture/Total(%)
R million 2016/17 2017/18 2018/19 2019/20 2016/17 ‐ 2019/20 2020/21 2021/22 2022/23 2019/20 ‐ 2022/23 Households Social benefits Current 2.7 2.5 3.3 4.5 18.8% 0.2% 1.6 1.7 1.8 ‐26.7% 0.1%
Employee social benefits 2.7 2.5 3.3 4.5 18.8% 0.2% 1.6 1.7 1.8 ‐26.7% 0.1%Households Other transfers to households Current 15.5 16.8 5.4 19.3 7.4% 0.8% 20.3 21.4 22.2 4.9% 1.0%
Bursaries for non‐employees 15.5 16.8 5.4 19.3 7.4% 0.8% 20.3 21.4 22.2 4.9% 1.0%Departmental agencies and accounts Departmental agencies (non‐business entities)
Current 2.2 2.7 2.8 3.0 10.7% 0.2% 3.1 3.3 3.4 4.8% 0.2%
Energy and Water Services Sector Education and Training Authority
2.2 2.7 2.8 3.0 10.7% 0.2% 3.1 3.3 3.4 4.8% 0.2%
Non‐profit institutions Current – – – 1.0 – – 0.5 0.5 0.5 ‐20.6% –
Strategic Water Partners Network – – – 1.0 – – 0.5 0.5 0.5 ‐20.6% –
Foreign governments and international organisations
Current 0.7 1.4 0.9 7.0 115.7% 0.1% 3.2 1.3 1.3 ‐42.6% 0.2%
Orange‐Senqu River Commission 0.6 0.8 0.7 6.2 116.5% 0.1% 3.0 1.1 1.1 ‐43.8% 0.1%Limpopo Watercourse Commission 0.1 0.6 0.2 0.8 109.5% – 0.2 0.2 0.2 ‐34.4% –
Provinces and municipalities Municipalities Municipal bank accounts Current 0.0 0.0 0.0 0.1 52.7% – 0.1 0.1 0.1 15.2% –
Vehicle licences 0.0 0.0 0.0 0.1 52.7% – 0.1 0.1 0.1 15.2% –
1. Estimates of National Expenditure data tables can be downloaded from www.treasury.gov.za. These tables contain detailed information by goods and services, and transfers and subsidies items by programme.
Personnel information
Table 41.7 Administration personnel numbers and cost by salary level¹
Number of posts estimated for 31 March 2020 Number and cost2 of personnel posts filled/planned for on funded establishment Number
Number of
funded posts
Number of posts
additional to the
establishment Actual Revised estimate Medium‐term expenditure estimate
Averagegrowth
rate(%)
Average: Salary
level/Total(%)
2018/19 2019/20 2020/21 2021/22 2022/23 2019/20 ‐ 2022/23
Administration Number Cost Unit cost Number Cost
Unitcost Number Cost
Unitcost Number Cost
Unitcost Number Cost
Unit cost
Salary level 1 875 91 1 536 736.0 0.5 1 573 803.1 0.5 1 621 890.0 0.5 1 620 947.8 0.6 1 589 983.1 0.6 0.3% 100.0%
1 – 6 794 59 604 151.6 0.3 622 145.2 0.2 632 158.7 0.3 633 170.5 0.3 631 182.0 0.3 0.5% 39.3%7 – 10 781 12 699 348.3 0.5 717 345.1 0.5 743 383.7 0.5 743 410.5 0.6 725 426.4 0.6 0.4% 45.7%11 – 12 190 20 153 139.1 0.9 149 172.9 1.2 159 195.6 1.2 157 205.2 1.3 146 202.9 1.4 ‐0.7% 9.5%13 – 16 107 – 80 97.1 1.2 85 139.9 1.6 87 152.0 1.7 87 161.7 1.9 87 171.7 2.0 0.8% 5.4%Other 3 – – – – – – – – – – – – – – – – – –
1. Data has been provided by the department and may not necessarily reconcile with official government personnel data. 2. Rand million.
Programme 2: Water Planning and Information Management
Programme purpose
Ensure that South Africa’s water resources are protected, used, developed, conserved, managed and controlled in a sustainable manner for the benefit of all people and the environment by developing a knowledge base and implementing effective policies, procedures and integrated planning strategies for both water resources and water services.
Objectives
Enhance the efficiency of water use and the management of water quality by assessing 18 large water systems for water losses by March 2023.

Vote 41: Water and Sanitation
9
Effectively manage water demand and supply by:
– reviewing 6 water resource monitoring programmes by March 2023
– maintaining 6 water information systems on an ongoing basis.
Effectively manage water and sanitation services by implementing and monitoring progress on the priorities of the water and sanitation master plan on an ongoing basis.
Subprogrammes
Water Planning, Information Management and Support provides strategic leadership and overall management to the programme.
Integrated Planning develops comprehensive plans that guide infrastructure development, systems and services management in the water sector.
Water Ecosystems develops and implements measures to protect water resources. This entails determining measures to manage water resources by classifying water resource systems, determining reserves, conducting resource quality assessments and determining resource‐directed measures by developing pollution control guidelines, and rehabilitation measures and protocols.
Water Information Management ensures the development and maintenance of data and information management systems to enable informed decisions on water management.
Water Services and Local Water Management formulates and develops strategies, guidelines and plans for water services and the management of water at the local level.
Sanitation Planning and Management provides a national strategy for the planning of sanitation services and supports municipalities in planning for the provision of sustainable sanitation services.
Policy and Strategy develops, monitors and reviews the implementation of water and sanitation sector policies and strategies.
Expenditure trends and estimates
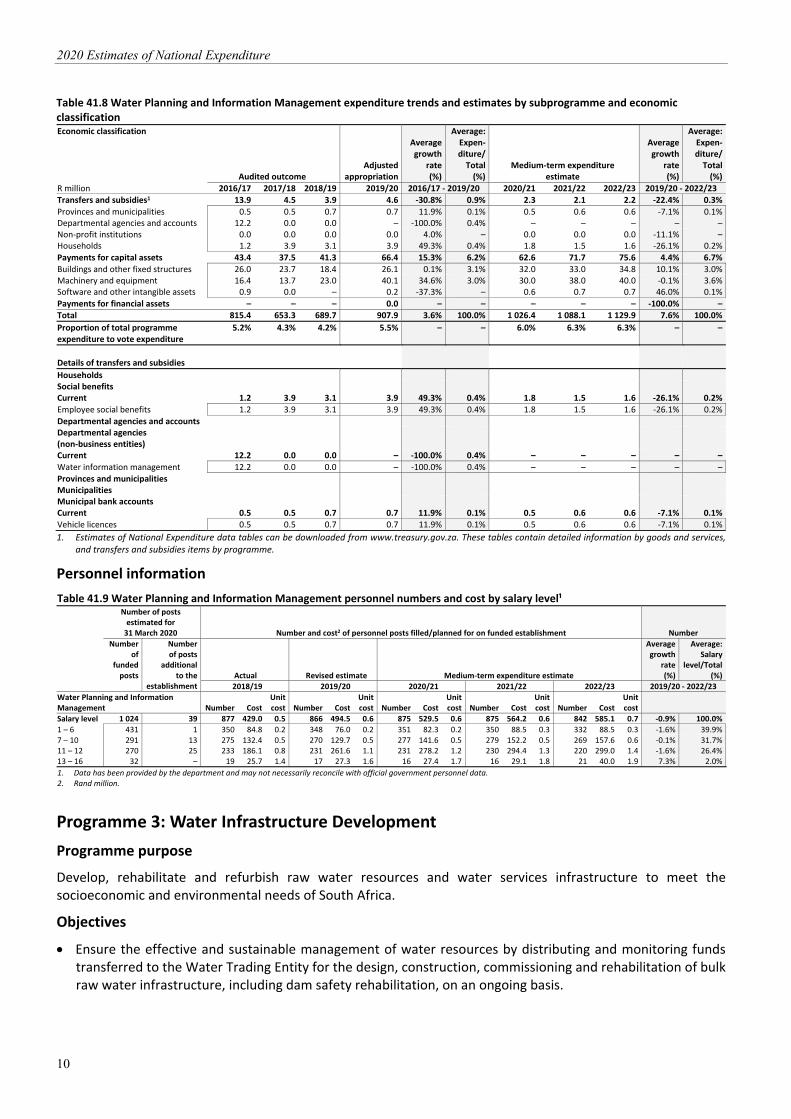
Table 41.8 Water Planning and Information Management expenditure trends and estimates by subprogramme and economic classification Subprogramme
Audited outcome Adjusted
appropriation
Averagegrowth
rate(%)
Average:Expen‐diture/Total(%)
Medium‐term expenditure estimate
Averagegrowth
rate(%)
Average:Expen‐diture/Total(%)
R million 2016/17 2017/18 2018/19 2019/20 2016/17 ‐ 2019/20 2020/21 2021/22 2022/23 2019/20 ‐ 2022/23 Water Planning, Information Management and Support
5.0 5.7 6.1 7.1 12.0% 0.8% 7.4 7.9 8.2 5.0% 0.7%
Integrated Planning 93.0 88.6 68.8 84.2 ‐3.3% 10.9% 101.9 110.2 114.6 10.9% 9.9%Water Ecosystems 50.4 43.2 47.9 40.0 ‐7.4% 5.9% 60.2 52.9 54.8 11.0% 5.0%Water Information Management 517.7 421.6 434.5 519.4 0.1% 61.7% 575.4 614.0 637.6 7.1% 56.5%Water Services and Local Water Management
112.6 63.1 108.7 224.0 25.8% 16.6% 239.1 257.9 267.7 6.1% 23.8%
Sanitation Planning and Management 11.6 15.8 11.4 15.1 9.2% 1.8% 20.5 22.0 22.8 14.7% 1.9%Policy and Strategy 25.1 15.3 12.3 18.2 ‐10.1% 2.3% 21.9 23.2 24.1 9.8% 2.1%Total 815.4 653.3 689.7 907.9 3.6% 100.0% 1 026.4 1 088.1 1 129.9 7.6% 100.0%
Change to 2019 Budget estimate
(62.5) (8.3) (8.7) (9.3)
Economic classification Current payments 758.1 611.3 644.5 836.9 3.4% 93.0% 961.5 1 014.4 1 052.1 7.9% 93.1%
Compensation of employees 390.3 407.8 429.0 494.5 8.2% 56.1% 529.5 564.2 585.1 5.8% 52.3%Goods and services1 367.7 203.5 215.5 342.3 ‐2.4% 36.8% 432.0 450.2 467.0 10.9% 40.7%of which: Communication 6.6 4.6 4.8 5.6 ‐5.0% 0.7% 9.9 10.7 10.8 24.4% 0.9%Computer services 78.4 50.7 48.9 49.6 ‐14.1% 7.4% 67.0 71.0 73.6 14.1% 6.3%Consultants: Business and advisory services
20.4 5.1 7.1 8.1 ‐26.4% 1.3% 55.6 47.4 49.2 82.2% 3.9%
Infrastructure and planning services 100.1 59.9 91.9 181.5 21.9% 14.1% 196.6 215.2 223.2 7.1% 19.7%Fleet services (including government motor transport)
2.3 12.0 14.5 12.0 73.7% 1.3% 10.6 11.2 11.5 ‐1.4% 1.1%
Travel and subsistence 72.1 46.5 32.4 43.0 ‐15.9% 6.3% 41.7 41.8 44.5 1.2% 4.1%Interest and rent on land – – 0.0 – – – – – – – –
2020 Estimates of National Expenditure
10
Table 41.8 Water Planning and Information Management expenditure trends and estimates by subprogramme and economic classification Economic classification
Audited outcome Adjusted
appropriation
Averagegrowth
rate(%)
Average:Expen‐diture/Total(%)
Medium‐term expenditure estimate
Averagegrowth
rate(%)
Average:Expen‐diture/Total(%)
R million 2016/17 2017/18 2018/19 2019/20 2016/17 ‐ 2019/20 2020/21 2021/22 2022/23 2019/20 ‐ 2022/23 Transfers and subsidies1 13.9 4.5 3.9 4.6 ‐30.8% 0.9% 2.3 2.1 2.2 ‐22.4% 0.3%
Provinces and municipalities 0.5 0.5 0.7 0.7 11.9% 0.1% 0.5 0.6 0.6 ‐7.1% 0.1%Departmental agencies and accounts 12.2 0.0 0.0 – ‐100.0% 0.4% – – – – –Non‐profit institutions 0.0 0.0 0.0 0.0 4.0% – 0.0 0.0 0.0 ‐11.1% –Households 1.2 3.9 3.1 3.9 49.3% 0.4% 1.8 1.5 1.6 ‐26.1% 0.2%
Payments for capital assets 43.4 37.5 41.3 66.4 15.3% 6.2% 62.6 71.7 75.6 4.4% 6.7%Buildings and other fixed structures 26.0 23.7 18.4 26.1 0.1% 3.1% 32.0 33.0 34.8 10.1% 3.0%Machinery and equipment 16.4 13.7 23.0 40.1 34.6% 3.0% 30.0 38.0 40.0 ‐0.1% 3.6%Software and other intangible assets 0.9 0.0 – 0.2 ‐37.3% – 0.6 0.7 0.7 46.0% 0.1%
Payments for financial assets – – – 0.0 – – – – – ‐100.0% –Total 815.4 653.3 689.7 907.9 3.6% 100.0% 1 026.4 1 088.1 1 129.9 7.6% 100.0%
Proportion of total programme expenditure to vote expenditure
5.2% 4.3% 4.2% 5.5% – – 6.0% 6.3% 6.3% – –
Details of transfers and subsidies
Households Social benefits Current 1.2 3.9 3.1 3.9 49.3% 0.4% 1.8 1.5 1.6 ‐26.1% 0.2%Employee social benefits 1.2 3.9 3.1 3.9 49.3% 0.4% 1.8 1.5 1.6 ‐26.1% 0.2%
Departmental agencies and accounts Departmental agencies (non‐business entities)
Current 12.2 0.0 0.0 – ‐100.0% 0.4% – – – – –
Water information management 12.2 0.0 0.0 – ‐100.0% 0.4% – – – – –Provinces and municipalities Municipalities Municipal bank accounts Current 0.5 0.5 0.7 0.7 11.9% 0.1% 0.5 0.6 0.6 ‐7.1% 0.1%Vehicle licences 0.5 0.5 0.7 0.7 11.9% 0.1% 0.5 0.6 0.6 ‐7.1% 0.1%
1. Estimates of National Expenditure data tables can be downloaded from www.treasury.gov.za. These tables contain detailed information by goods and services, and transfers and subsidies items by programme.
Personnel information
Table 41.9 Water Planning and Information Management personnel numbers and cost by salary level¹
Number of posts estimated for 31 March 2020 Number and cost2 of personnel posts filled/planned for on funded establishment Number
Number of
funded posts
Number of posts
additional to the
establishment Actual Revised estimate Medium‐term expenditure estimate
Averagegrowth
rate(%)
Average: Salary
level/Total(%)
2018/19 2019/20 2020/21 2021/22 2022/23 2019/20 ‐ 2022/23
Water Planning and Information Management Number Cost
Unit cost Number Cost
Unitcost Number Cost
Unitcost Number Cost
Unitcost Number Cost
Unit cost
Salary level 1 024 39 877 429.0 0.5 866 494.5 0.6 875 529.5 0.6 875 564.2 0.6 842 585.1 0.7 ‐0.9% 100.0%
1 – 6 431 1 350 84.8 0.2 348 76.0 0.2 351 82.3 0.2 350 88.5 0.3 332 88.5 0.3 ‐1.6% 39.9%7 – 10 291 13 275 132.4 0.5 270 129.7 0.5 277 141.6 0.5 279 152.2 0.5 269 157.6 0.6 ‐0.1% 31.7%11 – 12 270 25 233 186.1 0.8 231 261.6 1.1 231 278.2 1.2 230 294.4 1.3 220 299.0 1.4 ‐1.6% 26.4%13 – 16 32 – 19 25.7 1.4 17 27.3 1.6 16 27.4 1.7 16 29.1 1.8 21 40.0 1.9 7.3% 2.0%
1. Data has been provided by the department and may not necessarily reconcile with official government personnel data. 2. Rand million.
Programme 3: Water Infrastructure Development
Programme purpose
Develop, rehabilitate and refurbish raw water resources and water services infrastructure to meet the socioeconomic and environmental needs of South Africa.
Objectives
Ensure the effective and sustainable management of water resources by distributing and monitoring funds transferred to the Water Trading Entity for the design, construction, commissioning and rehabilitation of bulk raw water infrastructure, including dam safety rehabilitation, on an ongoing basis.
Vote 41: Water and Sanitation
11
Ensure adequate water availability through the development and management of infrastructure for water resources, and enhance the provision of sustainable and reliable water supply and sanitation by:
– implementing 26 large regional bulk infrastructure projects over the medium term
– transferring funds and monitoring the performance of municipalities on the regional bulk infrastructure grant and water services infrastructure grant in terms of the annual Division of Revenue Act.
Subprogrammes
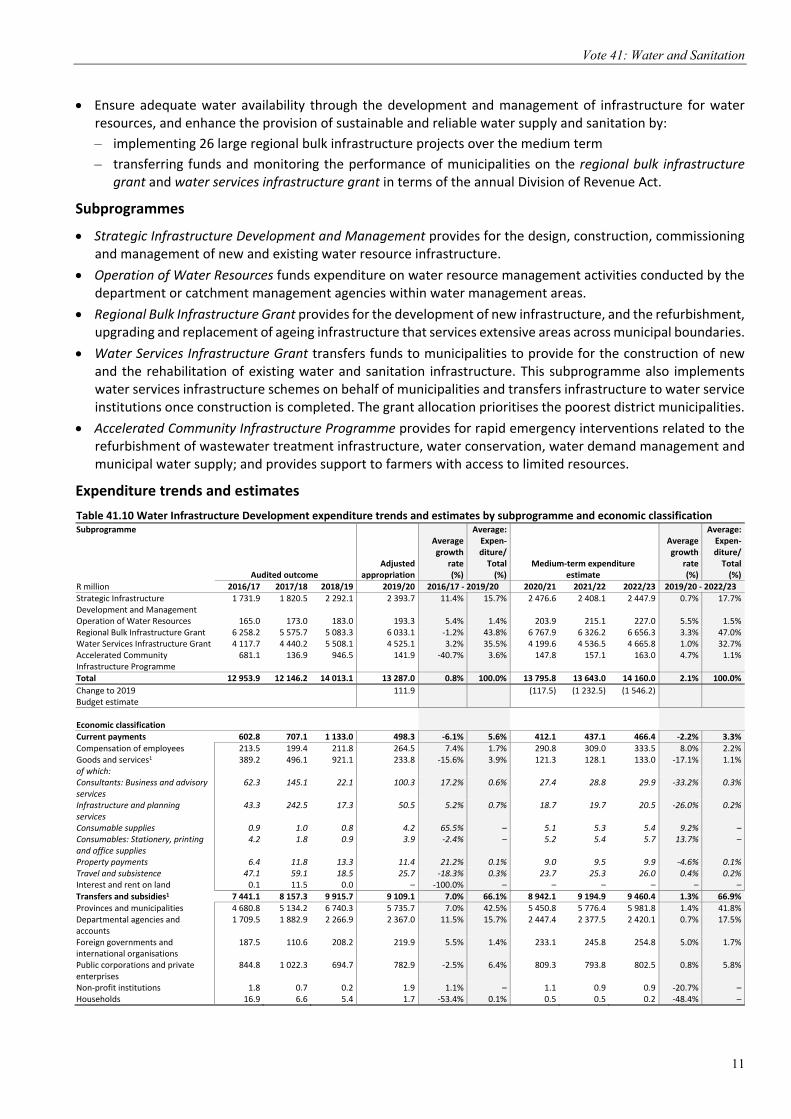
Strategic Infrastructure Development and Management provides for the design, construction, commissioning and management of new and existing water resource infrastructure.
Operation of Water Resources funds expenditure on water resource management activities conducted by the department or catchment management agencies within water management areas.
Regional Bulk Infrastructure Grant provides for the development of new infrastructure, and the refurbishment, upgrading and replacement of ageing infrastructure that services extensive areas across municipal boundaries.
Water Services Infrastructure Grant transfers funds to municipalities to provide for the construction of new and the rehabilitation of existing water and sanitation infrastructure. This subprogramme also implements water services infrastructure schemes on behalf of municipalities and transfers infrastructure to water service institutions once construction is completed. The grant allocation prioritises the poorest district municipalities.
Accelerated Community Infrastructure Programme provides for rapid emergency interventions related to the refurbishment of wastewater treatment infrastructure, water conservation, water demand management and municipal water supply; and provides support to farmers with access to limited resources.
Expenditure trends and estimates
Table 41.10 Water Infrastructure Development expenditure trends and estimates by subprogramme and economic classification Subprogramme
Audited outcome Adjusted
appropriation
Averagegrowth
rate(%)
Average:Expen‐diture/Total(%)
Medium‐term expenditure estimate
Averagegrowth
rate(%)
Average:Expen‐diture/Total(%)
R million 2016/17 2017/18 2018/19 2019/20 2016/17 ‐ 2019/20 2020/21 2021/22 2022/23 2019/20 ‐ 2022/23
Strategic Infrastructure Development and Management
1 731.9 1 820.5 2 292.1 2 393.7 11.4% 15.7% 2 476.6 2 408.1 2 447.9 0.7% 17.7%
Operation of Water Resources 165.0 173.0 183.0 193.3 5.4% 1.4% 203.9 215.1 227.0 5.5% 1.5%Regional Bulk Infrastructure Grant 6 258.2 5 575.7 5 083.3 6 033.1 ‐1.2% 43.8% 6 767.9 6 326.2 6 656.3 3.3% 47.0%Water Services Infrastructure Grant 4 117.7 4 440.2 5 508.1 4 525.1 3.2% 35.5% 4 199.6 4 536.5 4 665.8 1.0% 32.7%Accelerated Community Infrastructure Programme
681.1 136.9 946.5 141.9 ‐40.7% 3.6% 147.8 157.1 163.0 4.7% 1.1%
Total 12 953.9 12 146.2 14 013.1 13 287.0 0.8% 100.0% 13 795.8 13 643.0 14 160.0 2.1% 100.0%
Change to 2019 Budget estimate
111.9 (117.5) (1 232.5) (1 546.2)
Economic classification
Current payments 602.8 707.1 1 133.0 498.3 ‐6.1% 5.6% 412.1 437.1 466.4 ‐2.2% 3.3%Compensation of employees 213.5 199.4 211.8 264.5 7.4% 1.7% 290.8 309.0 333.5 8.0% 2.2%Goods and services1 389.2 496.1 921.1 233.8 ‐15.6% 3.9% 121.3 128.1 133.0 ‐17.1% 1.1%of which: Consultants: Business and advisory services
62.3 145.1 22.1 100.3 17.2% 0.6% 27.4 28.8 29.9 ‐33.2% 0.3%
Infrastructure and planning services
43.3 242.5 17.3 50.5 5.2% 0.7% 18.7 19.7 20.5 ‐26.0% 0.2%
Consumable supplies 0.9 1.0 0.8 4.2 65.5% – 5.1 5.3 5.4 9.2% –Consumables: Stationery, printing and office supplies
4.2 1.8 0.9 3.9 ‐2.4% – 5.2 5.4 5.7 13.7% –
Property payments 6.4 11.8 13.3 11.4 21.2% 0.1% 9.0 9.5 9.9 ‐4.6% 0.1%Travel and subsistence 47.1 59.1 18.5 25.7 ‐18.3% 0.3% 23.7 25.3 26.0 0.4% 0.2%Interest and rent on land 0.1 11.5 0.0 – ‐100.0% – – – – – –
Transfers and subsidies1 7 441.1 8 157.3 9 915.7 9 109.1 7.0% 66.1% 8 942.1 9 194.9 9 460.4 1.3% 66.9%Provinces and municipalities 4 680.8 5 134.2 6 740.3 5 735.7 7.0% 42.5% 5 450.8 5 776.4 5 981.8 1.4% 41.8%Departmental agencies and accounts
1 709.5 1 882.9 2 266.9 2 367.0 11.5% 15.7% 2 447.4 2 377.5 2 420.1 0.7% 17.5%
Foreign governments and international organisations
187.5 110.6 208.2 219.9 5.5% 1.4% 233.1 245.8 254.8 5.0% 1.7%
Public corporations and private enterprises
844.8 1 022.3 694.7 782.9 ‐2.5% 6.4% 809.3 793.8 802.5 0.8% 5.8%
Non‐profit institutions 1.8 0.7 0.2 1.9 1.1% – 1.1 0.9 0.9 ‐20.7% –Households 16.9 6.6 5.4 1.7 ‐53.4% 0.1% 0.5 0.5 0.2 ‐48.4% –

2020 Estimates of National Expenditure
12
Table 41.10 Water Infrastructure Development expenditure trends and estimates by subprogramme and economic classification Economic classification
Audited outcome Adjusted
appropriation
Averagegrowth
rate(%)
Average:Expen‐diture/Total(%)
Medium‐term expenditure estimate
Averagegrowth
rate(%)
Average:Expen‐diture/Total(%)
R million 2016/17 2017/18 2018/19 2019/20 2016/17 ‐ 2019/20 2020/21 2021/22 2022/23 2019/20 ‐ 2022/23 Payments for capital assets 4 910.0 3 281.9 2 964.4 3 679.6 ‐9.2% 28.3% 4 441.5 4 011.0 4 233.1 4.8% 29.8%
Buildings and other fixed structures 4 901.4 3 277.4 2 959.0 3 672.5 ‐9.2% 28.3% 4 435.6 4 004.6 4 226.4 4.8% 29.8%Machinery and equipment 8.7 4.5 5.4 7.0 ‐6.7% – 5.9 6.3 6.7 ‐1.5% –Software and other intangible assets – – – 0.0 – – – – – ‐100.0% –Payments for financial assets – – – 0.0 – – – – – ‐100.0% –
Total 12 953.9 12 146.2 14 013.1 13 287.0 0.8% 100.0% 13 795.8 13 643.0 14 160.0 2.1% 100.0%
Proportion of total programme expenditure to vote expenditure
82.8% 80.4% 84.3% 80.7% – – 80.1% 79.0% 79.0% – –
Details of transfers and subsidies
Households Social benefits Current 4.2 2.1 2.8 1.5 ‐29.3% – 0.3 0.3 – ‐100.0% –
Employee social benefits 4.2 2.1 2.8 1.5 ‐29.3% – 0.3 0.3 – ‐100.0% –Households Other transfers to households Current 12.6 4.5 2.5 0.2 ‐74.8% – 0.2 0.2 0.2 5.0% –
Employee social benefits 12.6 4.5 2.5 0.2 ‐74.8% – 0.2 0.2 0.2 5.0% –Departmental agencies and accounts Departmental agencies (non‐business entities) Current 165.0 173.0 183.0 193.3 5.4% 1.4% 203.9 215.1 227.0 5.5% 1.5%
Water Trading Entity 165.0 173.0 183.0 193.3 5.4% 1.4% 203.9 215.1 227.0 5.5% 1.5%Capital 1 544.5 1 709.9 2 083.9 2 173.8 12.1% 14.3% 2 243.5 2 162.3 2 193.1 0.3% 16.0%
Water Trading Entity 1 544.5 1 709.9 2 083.9 2 173.8 12.1% 14.3% 2 243.5 2 162.3 2 193.1 0.3% 16.0%
Non‐profit institutions Current 1.8 0.7 0.2 1.6 ‐4.0% – 1.1 0.9 0.9 ‐16.5% –
Various institutions: 2020 vision for water education programme
1.8 0.7 0.2 1.6 ‐4.0% – 1.1 0.9 0.9 ‐16.5% –
Foreign governments and international organisations
Current 187.5 110.6 208.2 219.9 5.5% 1.4% 233.1 245.8 254.8 5.0% 1.7%
Komati Basin Water Authority 187.5 110.6 208.2 219.9 5.5% 1.4% 233.1 245.8 254.8 5.0% 1.7%
Provinces and municipalities Municipalities Municipal bank accounts Capital 4 680.8 5 134.2 6 740.3 5 735.7 7.0% 42.5% 5 450.8 5 776.4 5 981.8 1.4% 41.8%Regional bulk infrastructure grant 1 849.8 1 829.0 1 963.0 2 066.4 3.8% 14.7% 2 005.6 2 156.0 2 280.8 3.3% 15.5%Water services infrastructure grant 2 831.0 3 305.2 4 777.3 3 669.3 9.0% 27.8% 3 445.2 3 620.3 3 701.0 0.3% 26.3%Public corporations and private enterprises Public corporations Other transfers to public corporations Capital 844.8 1 022.3 694.7 782.9 ‐2.5% 6.4% 809.3 793.8 802.5 0.8% 5.8%Amatola water board: Regional bulk infrastructure
– 88.6 92.4 185.0 – 0.7% – – – ‐100.0% 0.3%
Magalies water board: Regional bulk infrastructure
142.8 52.2 36.0 – ‐100.0% 0.4% 98.0 103.4 109.3 – 0.6%
Umgeni water board: Regional bulk infrastructure
423.0 518.4 132.3 320.0 ‐8.9% 2.7% 579.0 550.9 545.7 19.5% 3.6%
Sedibeng water board: Regional bulk infrastructure
279.0 363.2 434.0 277.9 ‐0.1% 2.6% 132.3 139.6 147.5 ‐19.0% 1.3%
1. Estimates of National Expenditure data tables can be downloaded from www.treasury.gov.za. These tables contain detailed information by goods and services, and transfers and subsidies items by programme.
Personnel information
Table 41.11 Water Infrastructure Development personnel numbers and cost by salary level¹
Number of posts estimated for 31 March 2020 Number and cost2 of personnel posts filled/planned for on funded establishment Number
Number of
funded posts
Number of posts
additional to the
establishment Actual Revised estimate Medium‐term expenditure estimate
Averagegrowth
rate(%)
Average: Salary
level/Total(%)
2018/19 2019/20 2020/21 2021/22 2022/23 2019/20 ‐ 2022/23
Water Infrastructure Development Number Cost Unit cost Number Cost
Unitcost Number Cost
Unitcost Number Cost
Unitcost Number Cost
Unit cost
Salary level 481 12 397 211.8 0.5 414 264.5 0.6 430 290.8 0.7 426 309.0 0.7 438 333.5 0.8 1.9% 100.0%
1 – 6 164 – 116 30.2 0.3 119 29.3 0.2 123 32.7 0.3 119 33.9 0.3 121 36.5 0.3 0.6% 28.2%7 – 10 204 10 185 91.3 0.5 195 102.0 0.5 207 116.5 0.6 207 124.6 0.6 219 140.5 0.6 3.9% 48.5%11 – 12 86 2 75 66.6 0.9 78 98.2 1.3 78 104.5 1.3 78 111.1 1.4 77 116.4 1.5 ‐0.4% 18.2%13 – 16 27 – 21 23.8 1.1 22 34.9 1.6 22 37.1 1.7 22 39.5 1.8 21 40.0 1.9 ‐1.5% 5.1%
1. Data has been provided by the department and may not necessarily reconcile with official government personnel data. 2. Rand million.
Vote 41: Water and Sanitation
13
Programme 4: Water Sector Regulation
Programme purpose
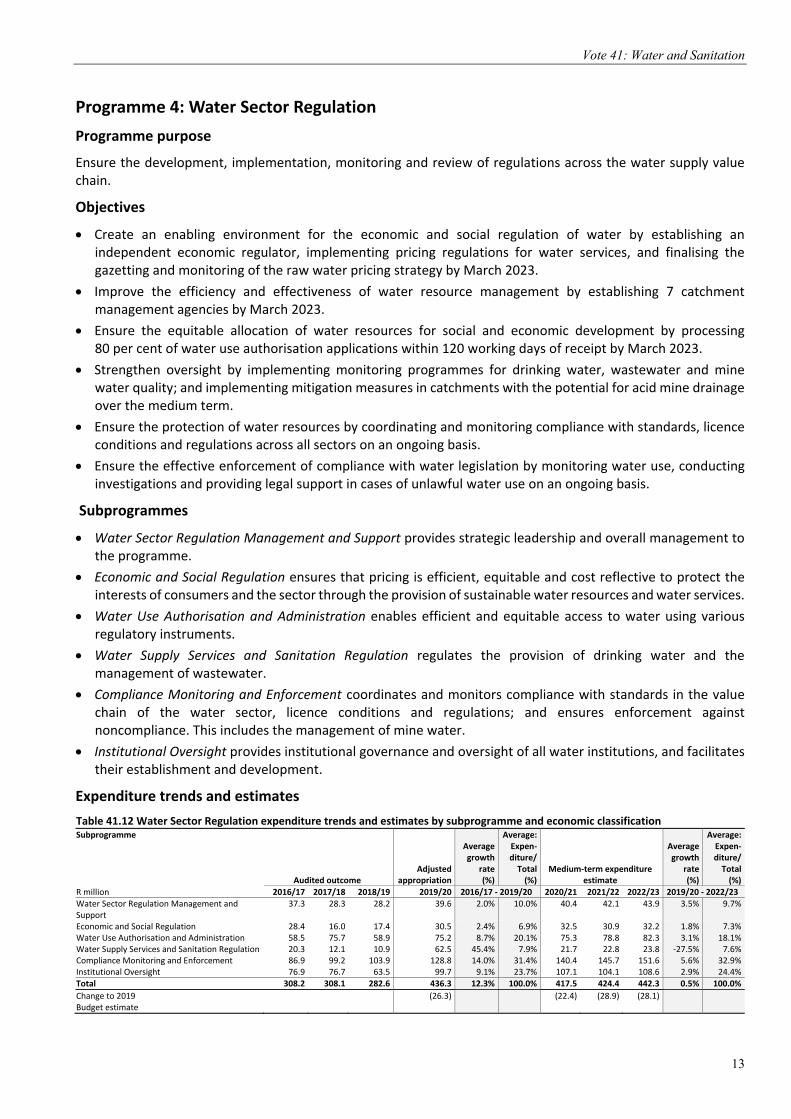
Ensure the development, implementation, monitoring and review of regulations across the water supply value chain.
Objectives
Create an enabling environment for the economic and social regulation of water by establishing an independent economic regulator, implementing pricing regulations for water services, and finalising the gazetting and monitoring of the raw water pricing strategy by March 2023.
Improve the efficiency and effectiveness of water resource management by establishing 7 catchment management agencies by March 2023.
Ensure the equitable allocation of water resources for social and economic development by processing 80 per cent of water use authorisation applications within 120 working days of receipt by March 2023.
Strengthen oversight by implementing monitoring programmes for drinking water, wastewater and mine water quality; and implementing mitigation measures in catchments with the potential for acid mine drainage over the medium term.
Ensure the protection of water resources by coordinating and monitoring compliance with standards, licence conditions and regulations across all sectors on an ongoing basis.
Ensure the effective enforcement of compliance with water legislation by monitoring water use, conducting investigations and providing legal support in cases of unlawful water use on an ongoing basis.
Subprogrammes
Water Sector Regulation Management and Support provides strategic leadership and overall management to the programme.
Economic and Social Regulation ensures that pricing is efficient, equitable and cost reflective to protect the interests of consumers and the sector through the provision of sustainable water resources and water services.
Water Use Authorisation and Administration enables efficient and equitable access to water using various regulatory instruments.
Water Supply Services and Sanitation Regulation regulates the provision of drinking water and the management of wastewater.
Compliance Monitoring and Enforcement coordinates and monitors compliance with standards in the value chain of the water sector, licence conditions and regulations; and ensures enforcement against noncompliance. This includes the management of mine water.
Institutional Oversight provides institutional governance and oversight of all water institutions, and facilitates their establishment and development.
Expenditure trends and estimates
Table 41.12 Water Sector Regulation expenditure trends and estimates by subprogramme and economic classification Subprogramme
Audited outcome Adjusted
appropriation
Averagegrowth
rate(%)
Average:Expen‐diture/Total(%)
Medium‐term expenditure estimate
Averagegrowth
rate(%)
Average:Expen‐diture/Total(%)
R million 2016/17 2017/18 2018/19 2019/20 2016/17 ‐ 2019/20 2020/21 2021/22 2022/23 2019/20 ‐ 2022/23 Water Sector Regulation Management and Support
37.3 28.3 28.2 39.6 2.0% 10.0% 40.4 42.1 43.9 3.5% 9.7%
Economic and Social Regulation 28.4 16.0 17.4 30.5 2.4% 6.9% 32.5 30.9 32.2 1.8% 7.3%Water Use Authorisation and Administration 58.5 75.7 58.9 75.2 8.7% 20.1% 75.3 78.8 82.3 3.1% 18.1%Water Supply Services and Sanitation Regulation 20.3 12.1 10.9 62.5 45.4% 7.9% 21.7 22.8 23.8 ‐27.5% 7.6%Compliance Monitoring and Enforcement 86.9 99.2 103.9 128.8 14.0% 31.4% 140.4 145.7 151.6 5.6% 32.9%Institutional Oversight 76.9 76.7 63.5 99.7 9.1% 23.7% 107.1 104.1 108.6 2.9% 24.4%Total 308.2 308.1 282.6 436.3 12.3% 100.0% 417.5 424.4 442.3 0.5% 100.0%
Change to 2019 Budget estimate
(26.3) (22.4) (28.9) (28.1)

2020 Estimates of National Expenditure
14
Table 41.12 Water Sector Regulation expenditure trends and estimates by subprogramme and economic classification Economic classification
Audited outcome Adjusted
appropriation
Averagegrowth
rate(%)
Average:Expen‐diture/Total(%)
Medium‐term expenditure estimate
Averagegrowth
rate(%)
Average:Expen‐diture/Total(%)
R million 2016/17 2017/18 2018/19 2019/20 2016/17 ‐ 2019/20 2020/21 2021/22 2022/23 2019/20 ‐ 2022/23 Current payments 295.2 303.4 276.2 423.5 12.8% 97.2% 405.2 412.4 429.5 0.5% 97.1%
Compensation of employees 165.9 233.5 227.2 259.2 16.0% 66.3% 277.9 295.8 306.8 5.8% 66.2%Goods and services1 129.3 70.0 49.0 164.3 8.3% 30.9% 127.3 116.6 122.7 ‐9.3% 30.9%of which: Computer services 0.2 – 13.2 14.2 296.1% 2.1% 11.6 12.2 12.7 ‐3.6% 3.0%Consultants: Business and advisory services 37.3 20.2 5.5 92.1 35.2% 11.6% 51.6 36.9 39.0 ‐24.9% 12.8%Laboratory services 1.6 0.8 1.4 4.7 42.2% 0.6% 3.6 5.5 5.8 6.8% 1.1%Consumables: Stationery, printing and office supplies
3.9 1.9 0.6 3.8 ‐1.1% 0.8% 4.7 5.2 5.4 12.4% 1.1%
Travel and subsistence 43.9 30.3 16.2 25.8 ‐16.2% 8.7% 24.4 25.1 26.9 1.4% 5.9%Training and development 5.9 0.7 0.2 2.3 ‐27.1% 0.7% 3.4 4.3 4.4 24.8% 0.8%Transfers and subsidies1 5.2 0.2 1.7 0.7 ‐49.1% 0.6% 0.8 0.8 0.9 8.8% 0.2%
Departmental agencies and accounts 2.0 – – – ‐100.0% 0.1% – – – – –Non‐profit institutions 0.8 0.1 1.0 – ‐100.0% 0.1% – – – – –Households 2.4 0.2 0.7 0.7 ‐34.0% 0.3% 0.8 0.8 0.9 8.8% 0.2%Payments for capital assets 7.8 4.4 4.8 12.1 15.6% 2.2% 11.4 11.2 11.9 ‐0.5% 2.7%
Machinery and equipment 7.8 4.4 4.8 12.1 15.6% 2.2% 11.4 11.2 11.9 ‐0.5% 2.7%Total 308.2 308.1 282.6 436.3 12.3% 100.0% 417.5 424.4 442.3 0.5% 100.0%
Proportion of total programme expenditure to vote expenditure
2.0% 2.0% 1.7% 2.6% – – 2.4% 2.5% 2.5% – –
Details of transfers and subsidies
Households Social benefits Current 2.4 0.2 0.6 0.7 ‐34.0% 0.3% 0.8 0.8 0.9 8.8% 0.2%Employee social benefits 2.4 0.2 0.6 0.7 ‐34.0% 0.3% 0.8 0.8 0.9 8.8% 0.2%
Households Other transfers to households Current – – 0.1 – – – – – – – –Employee social benefits – – 0.1 – – – – – – – –
Departmental agencies and accounts Departmental agencies (non‐business entities)
Current 2.0 – – – ‐100.0% 0.1% – – – – –
Water Research Commission 2.0 – – – ‐100.0% 0.1% – – – – –Non‐profit institutions Current 0.8 0.1 1.0 – ‐100.0% 0.1% – – – – –Employee social benefits – 0.1 – – – – – – – – –Water Institute of Southern Africa 0.8 – 1.0 – ‐100.0% 0.1% – – – – –
1. Estimates of National Expenditure data tables can be downloaded from www.treasury.gov.za. These tables contain detailed information by goods and services, and transfers and subsidies items by programme.
Personnel information
Table 41.13 Water Sector Regulation personnel numbers and cost by salary level¹
Number of posts estimated for 31 March 2020 Number and cost2 of personnel posts filled/planned for on funded establishment Number
Number of
funded posts
Number of posts
additional to the
establishment Actual Revised estimate Medium‐term expenditure estimate
Averagegrowth
rate(%)
Average: Salary
level/Total(%)
2018/19 2019/20 2020/21 2021/22 2022/23 2019/20 ‐ 2022/23
Water Sector Regulation Number Cost Unit cost Number Cost
Unitcost Number Cost
Unitcost Number Cost
Unitcost Number Cost
Unit cost
Salary level 420 19 385 227.2 0.6 471 259.1 0.6 474 277.9 0.6 472 295.8 0.6 463 306.8 0.7 ‐0.6% 100.0%
1 – 6 64 2 54 14.5 0.3 70 14.0 0.2 68 14.6 0.2 67 15.4 0.2 69 17.0 0.2 ‐0.5% 14.6%7 – 10 214 9 200 100.5 0.5 255 104.4 0.4 260 113.7 0.4 259 121.3 0.5 254 127.2 0.5 ‐0.1% 54.7%11 – 12 99 8 100 76.5 0.8 110 98.4 0.9 110 104.6 1.0 110 111.2 1.0 104 111.8 1.1 ‐1.9% 23.1%13 – 16 43 – 31 35.7 1.2 36 42.3 1.2 36 45.0 1.3 36 47.9 1.3 36 50.9 1.4 – 7.7%
1. Data has been provided by the department and may not necessarily reconcile with official government personnel data. 2. Rand million.
Vote 41: Water and Sanitation
15
Entities
Consolidated water boards
Selected performance indicators
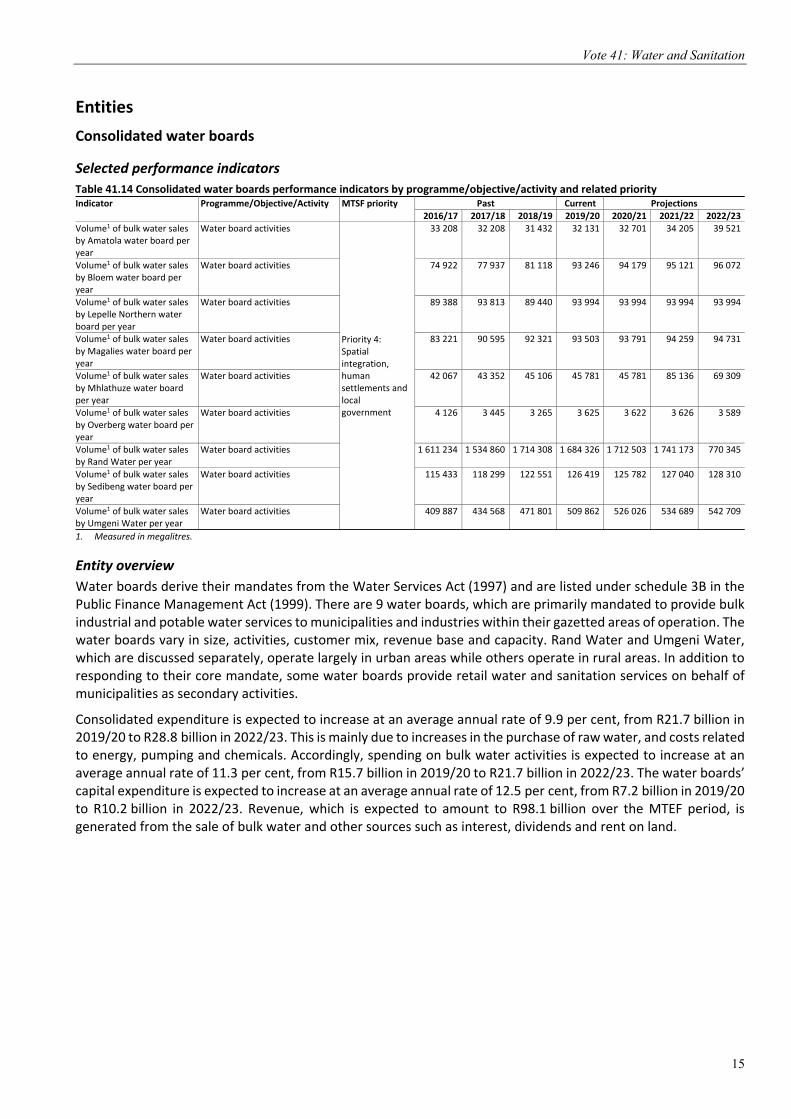
Table 41.14 Consolidated water boards performance indicators by programme/objective/activity and related priority Indicator Programme/Objective/Activity MTSF priority Past Current Projections
2016/17 2017/18 2018/19 2019/20 2020/21 2021/22 2022/23
Volume1 of bulk water sales by Amatola water board per year
Water board activities
Priority 4: Spatial integration, human settlements and local government
33 208 32 208 31 432 32 131 32 701 34 205 39 521
Volume1 of bulk water sales by Bloem water board per year
Water board activities 74 922 77 937 81 118 93 246 94 179 95 121 96 072
Volume1 of bulk water sales by Lepelle Northern water board per year
Water board activities 89 388 93 813 89 440 93 994 93 994 93 994 93 994
Volume1 of bulk water sales by Magalies water board per year
Water board activities 83 221 90 595 92 321 93 503 93 791 94 259 94 731
Volume1 of bulk water sales by Mhlathuze water board per year
Water board activities 42 067 43 352 45 106 45 781 45 781 85 136 69 309
Volume1 of bulk water sales by Overberg water board per year
Water board activities 4 126 3 445 3 265 3 625 3 622 3 626 3 589
Volume1 of bulk water sales by Rand Water per year
Water board activities 1 611 234 1 534 860 1 714 308 1 684 326 1 712 503 1 741 173 770 345
Volume1 of bulk water sales by Sedibeng water board per year
Water board activities 115 433 118 299 122 551 126 419 125 782 127 040 128 310
Volume1 of bulk water sales by Umgeni Water per year
Water board activities 409 887 434 568 471 801 509 862 526 026 534 689 542 709
1. Measured in megalitres.
Entity overview
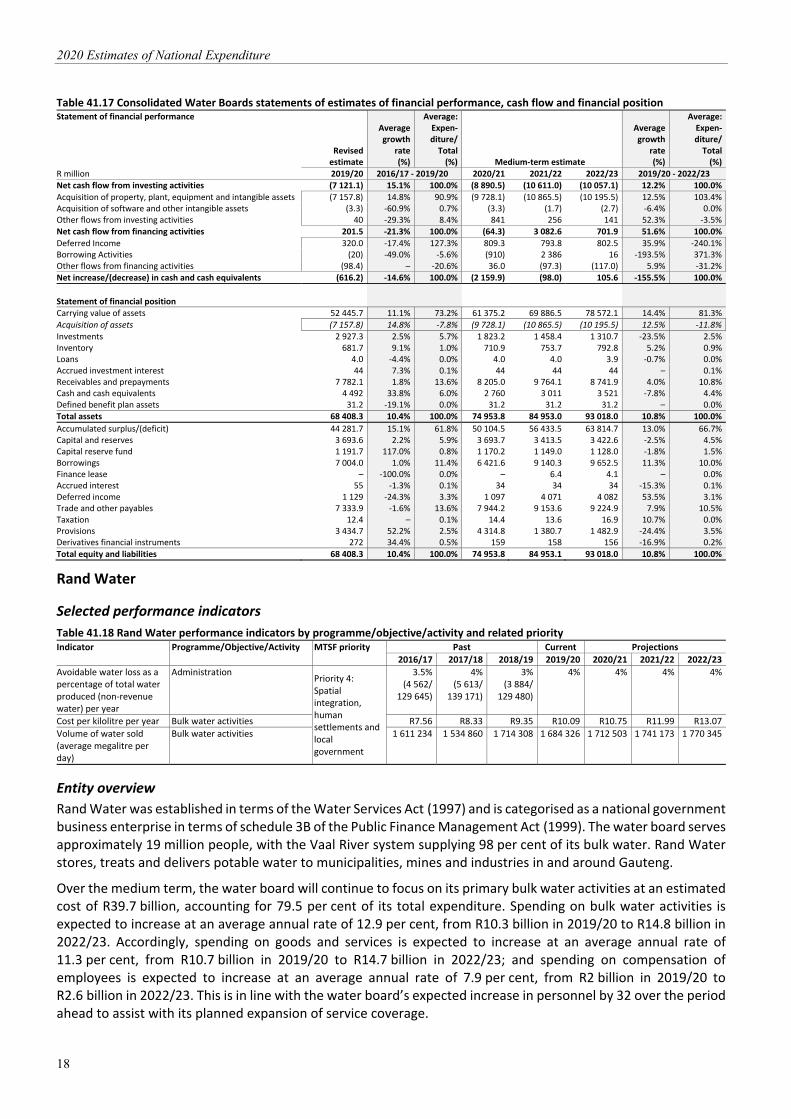
Water boards derive their mandates from the Water Services Act (1997) and are listed under schedule 3B in the Public Finance Management Act (1999). There are 9 water boards, which are primarily mandated to provide bulk industrial and potable water services to municipalities and industries within their gazetted areas of operation. The water boards vary in size, activities, customer mix, revenue base and capacity. Rand Water and Umgeni Water, which are discussed separately, operate largely in urban areas while others operate in rural areas. In addition to responding to their core mandate, some water boards provide retail water and sanitation services on behalf of municipalities as secondary activities.
Consolidated expenditure is expected to increase at an average annual rate of 9.9 per cent, from R21.7 billion in 2019/20 to R28.8 billion in 2022/23. This is mainly due to increases in the purchase of raw water, and costs related to energy, pumping and chemicals. Accordingly, spending on bulk water activities is expected to increase at an average annual rate of 11.3 per cent, from R15.7 billion in 2019/20 to R21.7 billion in 2022/23. The water boards’ capital expenditure is expected to increase at an average annual rate of 12.5 per cent, from R7.2 billion in 2019/20 to R10.2 billion in 2022/23. Revenue, which is expected to amount to R98.1 billion over the MTEF period, is generated from the sale of bulk water and other sources such as interest, dividends and rent on land.
2020 Estimates of National Expenditure
16
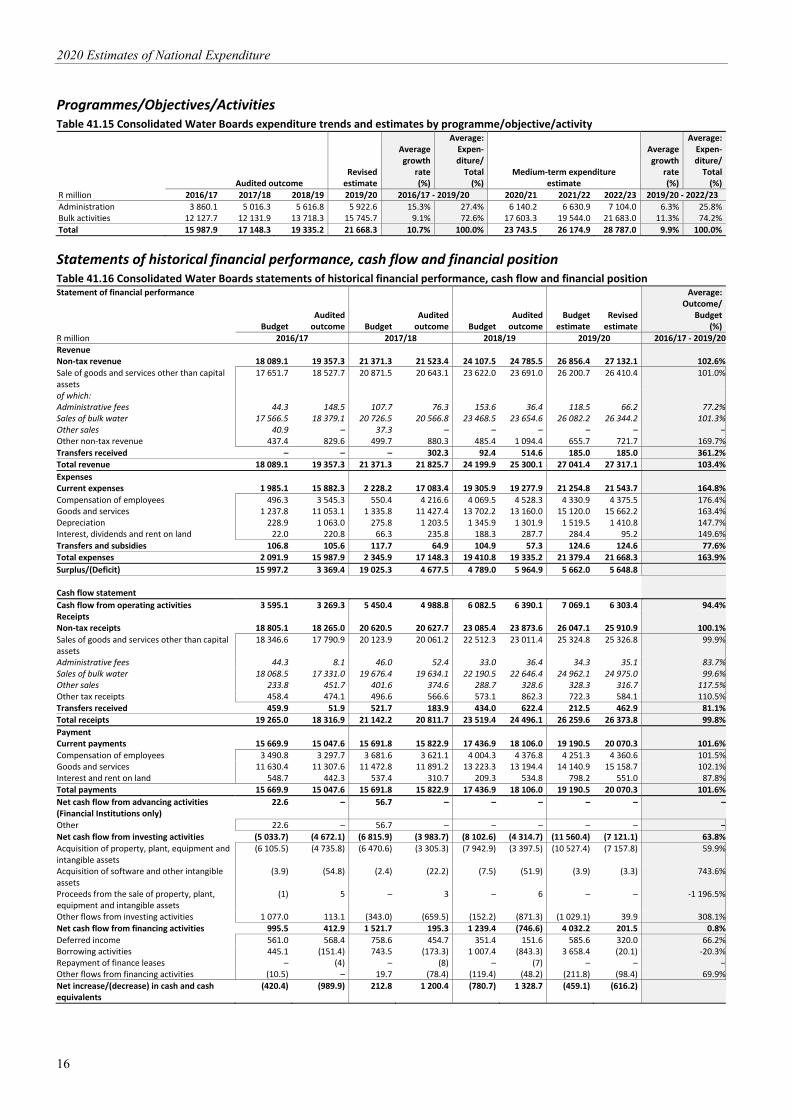
Programmes/Objectives/Activities Table 41.15 Consolidated Water Boards expenditure trends and estimates by programme/objective/activity
Audited outcome Revisedestimate
Averagegrowth
rate(%)
Average:Expen‐diture/Total(%)
Medium‐term expenditure estimate
Averagegrowth
rate(%)
Average:Expen‐diture/Total(%)
R million 2016/17 2017/18 2018/19 2019/20 2016/17 ‐ 2019/20 2020/21 2021/22 2022/23 2019/20 ‐ 2022/23
Administration 3 860.1 5 016.3 5 616.8 5 922.6 15.3% 27.4% 6 140.2 6 630.9 7 104.0 6.3% 25.8%Bulk activities 12 127.7 12 131.9 13 718.3 15 745.7 9.1% 72.6% 17 603.3 19 544.0 21 683.0 11.3% 74.2%
Total 15 987.9 17 148.3 19 335.2 21 668.3 10.7% 100.0% 23 743.5 26 174.9 28 787.0 9.9% 100.0%
Statements of historical financial performance, cash flow and financial position Table 41.16 Consolidated Water Boards statements of historical financial performance, cash flow and financial position Statement of financial performance
Budget Auditedoutcome Budget
Auditedoutcome Budget
Auditedoutcome
Budget estimate
Revised estimate
Average:Outcome/
Budget(%)
R million 2016/17 2017/18 2018/19 2019/20 2016/17 ‐ 2019/20Revenue Non‐tax revenue 18 089.1 19 357.3 21 371.3 21 523.4 24 107.5 24 785.5 26 856.4 27 132.1 102.6%Sale of goods and services other than capital assets
17 651.7 18 527.7 20 871.5 20 643.1 23 622.0 23 691.0 26 200.7 26 410.4 101.0%
of which: Administrative fees 44.3 148.5 107.7 76.3 153.6 36.4 118.5 66.2 77.2%Sales of bulk water 17 566.5 18 379.1 20 726.5 20 566.8 23 468.5 23 654.6 26 082.2 26 344.2 101.3%Other sales 40.9 – 37.3 – – – – – –Other non‐tax revenue 437.4 829.6 499.7 880.3 485.4 1 094.4 655.7 721.7 169.7%
Transfers received – – – 302.3 92.4 514.6 185.0 185.0 361.2%Total revenue 18 089.1 19 357.3 21 371.3 21 825.7 24 199.9 25 300.1 27 041.4 27 317.1 103.4%
Expenses Current expenses 1 985.1 15 882.3 2 228.2 17 083.4 19 305.9 19 277.9 21 254.8 21 543.7 164.8%
Compensation of employees 496.3 3 545.3 550.4 4 216.6 4 069.5 4 528.3 4 330.9 4 375.5 176.4%Goods and services 1 237.8 11 053.1 1 335.8 11 427.4 13 702.2 13 160.0 15 120.0 15 662.2 163.4%Depreciation 228.9 1 063.0 275.8 1 203.5 1 345.9 1 301.9 1 519.5 1 410.8 147.7%Interest, dividends and rent on land 22.0 220.8 66.3 235.8 188.3 287.7 284.4 95.2 149.6%
Transfers and subsidies 106.8 105.6 117.7 64.9 104.9 57.3 124.6 124.6 77.6%Total expenses 2 091.9 15 987.9 2 345.9 17 148.3 19 410.8 19 335.2 21 379.4 21 668.3 163.9%
Surplus/(Deficit) 15 997.2 3 369.4 19 025.3 4 677.5 4 789.0 5 964.9 5 662.0 5 648.8
Cash flow statement Cash flow from operating activities 3 595.1 3 269.3 5 450.4 4 988.8 6 082.5 6 390.1 7 069.1 6 303.4 94.4%Receipts Non‐tax receipts 18 805.1 18 265.0 20 620.5 20 627.7 23 085.4 23 873.6 26 047.1 25 910.9 100.1%
Sales of goods and services other than capital assets
18 346.6 17 790.9 20 123.9 20 061.2 22 512.3 23 011.4 25 324.8 25 326.8 99.9%
Administrative fees 44.3 8.1 46.0 52.4 33.0 36.4 34.3 35.1 83.7%Sales of bulk water 18 068.5 17 331.0 19 676.4 19 634.1 22 190.5 22 646.4 24 962.1 24 975.0 99.6%Other sales 233.8 451.7 401.6 374.6 288.7 328.6 328.3 316.7 117.5%Other tax receipts 458.4 474.1 496.6 566.6 573.1 862.3 722.3 584.1 110.5%Transfers received 459.9 51.9 521.7 183.9 434.0 622.4 212.5 462.9 81.1%
Total receipts 19 265.0 18 316.9 21 142.2 20 811.7 23 519.4 24 496.1 26 259.6 26 373.8 99.8%
Payment Current payments 15 669.9 15 047.6 15 691.8 15 822.9 17 436.9 18 106.0 19 190.5 20 070.3 101.6%
Compensation of employees 3 490.8 3 297.7 3 681.6 3 621.1 4 004.3 4 376.8 4 251.3 4 360.6 101.5%Goods and services 11 630.4 11 307.6 11 472.8 11 891.2 13 223.3 13 194.4 14 140.9 15 158.7 102.1%Interest and rent on land 548.7 442.3 537.4 310.7 209.3 534.8 798.2 551.0 87.8%Total payments 15 669.9 15 047.6 15 691.8 15 822.9 17 436.9 18 106.0 19 190.5 20 070.3 101.6%
Net cash flow from advancing activities (Financial Institutions only)
22.6 – 56.7 – – – – – –
Other 22.6 – 56.7 – – – – – –
Net cash flow from investing activities (5 033.7) (4 672.1) (6 815.9) (3 983.7) (8 102.6) (4 314.7) (11 560.4) (7 121.1) 63.8%Acquisition of property, plant, equipment and intangible assets
(6 105.5) (4 735.8) (6 470.6) (3 305.3) (7 942.9) (3 397.5) (10 527.4) (7 157.8) 59.9%
Acquisition of software and other intangible assets
(3.9) (54.8) (2.4) (22.2) (7.5) (51.9) (3.9) (3.3) 743.6%
Proceeds from the sale of property, plant, equipment and intangible assets
(1) 5 – 3 – 6 – – ‐1 196.5%
Other flows from investing activities 1 077.0 113.1 (343.0) (659.5) (152.2) (871.3) (1 029.1) 39.9 308.1%Net cash flow from financing activities 995.5 412.9 1 521.7 195.3 1 239.4 (746.6) 4 032.2 201.5 0.8%
Deferred income 561.0 568.4 758.6 454.7 351.4 151.6 585.6 320.0 66.2%Borrowing activities 445.1 (151.4) 743.5 (173.3) 1 007.4 (843.3) 3 658.4 (20.1) ‐20.3%Repayment of finance leases – (4) – (8) – (7) – – –Other flows from financing activities (10.5) – 19.7 (78.4) (119.4) (48.2) (211.8) (98.4) 69.9%
Net increase/(decrease) in cash and cash equivalents
(420.4) (989.9) 212.8 1 200.4 (780.7) 1 328.7 (459.1) (616.2)

Vote 41: Water and Sanitation
17
Table 41.16 Consolidated Water Boards statements of historical financial performance, cash flow and financial position Statement of financial position
Budget Auditedoutcome Budget
Auditedoutcome Budget
Audited outcome
Budget estimate
Revisedestimate
Average:Outcome/
Budget(%)
R million 2016/17 2017/18 2018/19 2019/20 2016/17 ‐ 2019/20
Carrying value of assets 37 954.5 38 225.3 42 567.1 40 909.0 47 630.8 43 110.3 56 749.8 52 445.7 94.5%
Acquisition of assets (6 105.5) (4 735.8) (6 470.6) (3 305.3) (7 942.9) (3 397.5) (10 527.4) (7 157.8) 59.9%Investments 1 729.9 2 718.1 2 518.5 3 557.6 2 840.3 4 264.1 3 972.6 2 927.3 121.7%Inventory 216.8 525.0 234.3 632.8 586.0 660.7 614.5 681.7 151.4%Loans 85.1 4.6 5.1 4.1 4.5 3.8 4.5 4.0 16.7%Accrued investment interest 28.4 35.6 28.4 44.0 38.0 79.4 38.0 44.0 152.9%Receivables and prepayments 4 673.7 7 367.8 5 123.0 8 214.7 7 581.8 8 888.7 7 381.4 7 782.1 130.3%Cash and cash equivalents 2 466.7 1 876.7 2 833.3 2 954.1 3 021.6 5 459.4 3 903.7 4 492.3 120.9%Non‐current assets held for sale – 1 – 2 – 329 – – –Defined benefit plan assets 45.4 58.9 61.9 16.7 45.6 2.2 45.6 31.2 55.0%Taxation – 40.1 – 188.7 – 194.5 – – –Total assets 47 200.4 50 852.6 53 371.5 56 524.0 61 748.7 62 991.8 72 710.0 68 408.3 101.6%
Accumulated surplus/(deficit) 25 397.7 29 016.9 29 848.8 34 670.7 37 420.7 40 445.0 42 780.0 44 281.7 109.6%Capital and reserves 4 039.8 3 456.8 4 535.9 3 420.7 4 124.5 3 430.9 4 124.6 3 693.6 83.2%Capital reserve fund 70.2 116.6 70.2 492.4 919.4 165.1 1 183.9 1 191.7 87.6%Borrowings 7 771.8 6 793.3 7 565.8 6 610.2 7 623.6 6 454.8 11 699.1 7 004.0 77.5%Finance lease 1.3 20.6 – 12.9 – 8.3 – – 3 347.4%Accrued interest 58.2 57.5 56.8 56.0 76.0 53.7 77.0 55.3 83.0%Deferred income 2 126 2 606 2 563 1 769 1 435 2 068 1 422 1 129 100.3%Trade and other payables 6 683.9 7 698.7 7 377.3 8 215.3 7 299.4 8 721.3 7 705.2 7 333.9 110.0%Benefits payable 1.5 – 1.6 – – – – – –Taxation 7.1 – 6.5 102.3 8.4 79.8 9.2 12.4 624.1%Provisions 967.4 973.5 1 139.4 938.3 2 648.5 956.9 3 511.2 3 434.7 76.3%Managed funds (e.g. poverty alleviation fund)
5 – – – – – – – –
Derivatives financial instruments 71 112 106 236 193 608 198 272 216.3%
Total equity and liabilities 47 200.4 50 852.6 53 271.5 56 524.0 61 748.7 62 991.8 72 710.0 68 408.3 101.6%
Statements of estimates of financial performance, cash flow and financial position Table 41.17 Consolidated Water Boards statements of estimates of financial performance, cash flow and financial position Statement of financial performance
Revised estimate
Averagegrowth
rate(%)
Average:Expen‐diture/Total(%) Medium‐term estimate
Averagegrowth
rate(%)
Average:Expen‐diture/Total(%)
R million 2019/20 2016/17 ‐ 2019/20 2020/21 2021/22 2022/23 2019/20 ‐ 2022/23 Revenue Non‐tax revenue 27 132.1 11.9% 99.0% 29 479.9 32 573.0 36 042.6 9.9% 99.8%Sale of goods and services other than capital assets
26 410.4 12.5% 95.2% 28 852.8 31 939.4 35 400.5 10.3% 97.7%
Administrative fees 66.2 ‐23.6% 0.4% 70.7 75.5 80.6 6.8% 0.2%Sales of bulk water 26 344.2 12.8% 94.8% 28 782.1 31 863.9 35 319.9 10.3% 97.5%Other non‐tax revenue 721.7 ‐4.5% 3.8% 627.0 633.6 642.2 ‐3.8% 2.1%
Transfers received 185.0 – 1.0% – – – ‐100.0% 0.2%Total revenue 27 317.1 12.2% 100.0% 29 479.9 32 573.0 36 042.6 9.7% 100.0%
Current expenses 21 543.7 10.7% 99.5% 23 607.8 26 027.1 28 626.0 9.9% 99.4%
Compensation of employees 4 375.5 7.3% 22.6% 4 653.5 5 019.4 5 412.7 7.3% 19.4%Goods and services 15 662.2 12.3% 69.0% 17 249.1 19 095.9 21 127.3 10.5% 72.8%Depreciation 1 410.8 9.9% 6.7% 1 559.0 1 756.1 1 931.2 11.0% 6.6%Interest, dividends and rent on land 95.2 ‐24.5% 1.2% 146.2 155.7 154.9 17.6% 0.5%Transfers and subsidies 124.6 5.7% 0.5% 135.7 147.8 161.0 8.9% 0.6%
Total expenses 21 668.3 10.7% 100.0% 23 743.5 26 174.9 28 787.0 9.9% 100.0%
Surplus/(Deficit) 5 648.8 5 736.4 6 398.1 7 255.6
Cash flow statement
Cash flow from operating activities 6 303.4 24.5% 290.4% 6 794.9 7 430.5 9 460.7 63.0% 295.4%Receipts Non‐tax receipts 25 910.9 12.4% 98.6% 28 575.6 31 562.9 34 900.5 10.4% 99.6%Sales of goods and services other than capital assets
25 326.8 12.5% 95.9% 28 126.2 31 064.9 34 449.2 10.8% 97.9%
Administrative fees 35.1 63.0% 0.1% 37.4 45.4 39.5 4.0% 0.1%Sales of bulk water 24 975.0 13.0% 94.0% 27 568.7 30 404.7 33 758.5 10.6% 96.1%Other sales 316.7 ‐11.2% 1.7% 520.0 614.8 651.1 27.2% 1.7%Other tax receipts 584.1 7.2% 2.8% 449.4 498.0 451.4 ‐8.2% 1.7%
Transfers received 462.9 107.3% 1.4% – – – ‐100.0% 0.4%
Total receipts 26 373.8 12.9% 100.0% 28 575.6 31 562.9 34 900.5 9.8% 100.0%
Current payments 20 070.3 10.1% 93.2% 21 780.6 24 132.5 25 439.8 8.2% 100.0%
Compensation of employees 4 360.6 9.8% 21.1% 4 542.3 4 933.4 5 327.1 6.9% 21.0%Goods and services 15 158.7 10.3% 69.6% 16 549.7 18 432.9 19 178.8 8.2% 75.8%Interest and rent on land 551.0 7.6% 2.5% 688.6 766.1 933.9 19.2% 3.2%Total payment 20 070.3 10.1% 100.0% 21 780.6 24 132.5 25 439.8 8.2% 100.0%
2020 Estimates of National Expenditure
18
Table 41.17 Consolidated Water Boards statements of estimates of financial performance, cash flow and financial position Statement of financial performance
Revisedestimate
Averagegrowth
rate(%)
Average:Expen‐diture/Total(%) Medium‐term estimate
Averagegrowth
rate(%)
Average:Expen‐diture/Total(%)
R million 2019/20 2016/17 ‐ 2019/20 2020/21 2021/22 2022/23 2019/20 ‐ 2022/23 Net cash flow from investing activities (7 121.1) 15.1% 100.0% (8 890.5) (10 611.0) (10 057.1) 12.2% 100.0%
Acquisition of property, plant, equipment and intangible assets (7 157.8) 14.8% 90.9% (9 728.1) (10 865.5) (10 195.5) 12.5% 103.4%Acquisition of software and other intangible assets (3.3) ‐60.9% 0.7% (3.3) (1.7) (2.7) ‐6.4% 0.0%Other flows from investing activities 40 ‐29.3% 8.4% 841 256 141 52.3% ‐3.5%Net cash flow from financing activities 201.5 ‐21.3% 100.0% (64.3) 3 082.6 701.9 51.6% 100.0%
Deferred Income 320.0 ‐17.4% 127.3% 809.3 793.8 802.5 35.9% ‐240.1%Borrowing Activities (20) ‐49.0% ‐5.6% (910) 2 386 16 ‐193.5% 371.3%Other flows from financing activities (98.4) – ‐20.6% 36.0 (97.3) (117.0) 5.9% ‐31.2%Net increase/(decrease) in cash and cash equivalents (616.2) ‐14.6% 100.0% (2 159.9) (98.0) 105.6 ‐155.5% 100.0%
Statement of financial position Carrying value of assets 52 445.7 11.1% 73.2% 61 375.2 69 886.5 78 572.1 14.4% 81.3%
Acquisition of assets (7 157.8) 14.8% ‐7.8% (9 728.1) (10 865.5) (10 195.5) 12.5% ‐11.8%Investments 2 927.3 2.5% 5.7% 1 823.2 1 458.4 1 310.7 ‐23.5% 2.5%Inventory 681.7 9.1% 1.0% 710.9 753.7 792.8 5.2% 0.9%Loans 4.0 ‐4.4% 0.0% 4.0 4.0 3.9 ‐0.7% 0.0%Accrued investment interest 44 7.3% 0.1% 44 44 44 – 0.1%Receivables and prepayments 7 782.1 1.8% 13.6% 8 205.0 9 764.1 8 741.9 4.0% 10.8%Cash and cash equivalents 4 492 33.8% 6.0% 2 760 3 011 3 521 ‐7.8% 4.4%Defined benefit plan assets 31.2 ‐19.1% 0.0% 31.2 31.2 31.2 – 0.0%Total assets 68 408.3 10.4% 100.0% 74 953.8 84 953.0 93 018.0 10.8% 100.0%
Accumulated surplus/(deficit) 44 281.7 15.1% 61.8% 50 104.5 56 433.5 63 814.7 13.0% 66.7%Capital and reserves 3 693.6 2.2% 5.9% 3 693.7 3 413.5 3 422.6 ‐2.5% 4.5%Capital reserve fund 1 191.7 117.0% 0.8% 1 170.2 1 149.0 1 128.0 ‐1.8% 1.5%Borrowings 7 004.0 1.0% 11.4% 6 421.6 9 140.3 9 652.5 11.3% 10.0%Finance lease – ‐100.0% 0.0% – 6.4 4.1 – 0.0%Accrued interest 55 ‐1.3% 0.1% 34 34 34 ‐15.3% 0.1%Deferred income 1 129 ‐24.3% 3.3% 1 097 4 071 4 082 53.5% 3.1%Trade and other payables 7 333.9 ‐1.6% 13.6% 7 944.2 9 153.6 9 224.9 7.9% 10.5%Taxation 12.4 – 0.1% 14.4 13.6 16.9 10.7% 0.0%Provisions 3 434.7 52.2% 2.5% 4 314.8 1 380.7 1 482.9 ‐24.4% 3.5%Derivatives financial instruments 272 34.4% 0.5% 159 158 156 ‐16.9% 0.2%
Total equity and liabilities 68 408.3 10.4% 100.0% 74 953.8 84 953.1 93 018.0 10.8% 100.0%
Rand Water
Selected performance indicators
Table 41.18 Rand Water performance indicators by programme/objective/activity and related priority Indicator Programme/Objective/Activity MTSF priority Past Current Projections
2016/17 2017/18 2018/19 2019/20 2020/21 2021/22 2022/23
Avoidable water loss as a percentage of total water produced (non‐revenue water) per year
Administration Priority 4: Spatial integration, human settlements and local government
3.5%(4 562/
129 645)
4%(5 613/
139 171)
3% (3 884/
129 480)
4% 4% 4% 4%
Cost per kilolitre per year Bulk water activities R7.56 R8.33 R9.35 R10.09 R10.75 R11.99 R13.07
Volume of water sold (average megalitre per day)
Bulk water activities 1 611 234 1 534 860 1 714 308 1 684 326 1 712 503 1 741 173 1 770 345
Entity overview
Rand Water was established in terms of the Water Services Act (1997) and is categorised as a national government business enterprise in terms of schedule 3B of the Public Finance Management Act (1999). The water board serves approximately 19 million people, with the Vaal River system supplying 98 per cent of its bulk water. Rand Water stores, treats and delivers potable water to municipalities, mines and industries in and around Gauteng.
Over the medium term, the water board will continue to focus on its primary bulk water activities at an estimated cost of R39.7 billion, accounting for 79.5 per cent of its total expenditure. Spending on bulk water activities is expected to increase at an average annual rate of 12.9 per cent, from R10.3 billion in 2019/20 to R14.8 billion in 2022/23. Accordingly, spending on goods and services is expected to increase at an average annual rate of 11.3 per cent, from R10.7 billion in 2019/20 to R14.7 billion in 2022/23; and spending on compensation of employees is expected to increase at an average annual rate of 7.9 per cent, from R2 billion in 2019/20 to R2.6 billion in 2022/23. This is in line with the water board’s expected increase in personnel by 32 over the period ahead to assist with its planned expansion of service coverage.
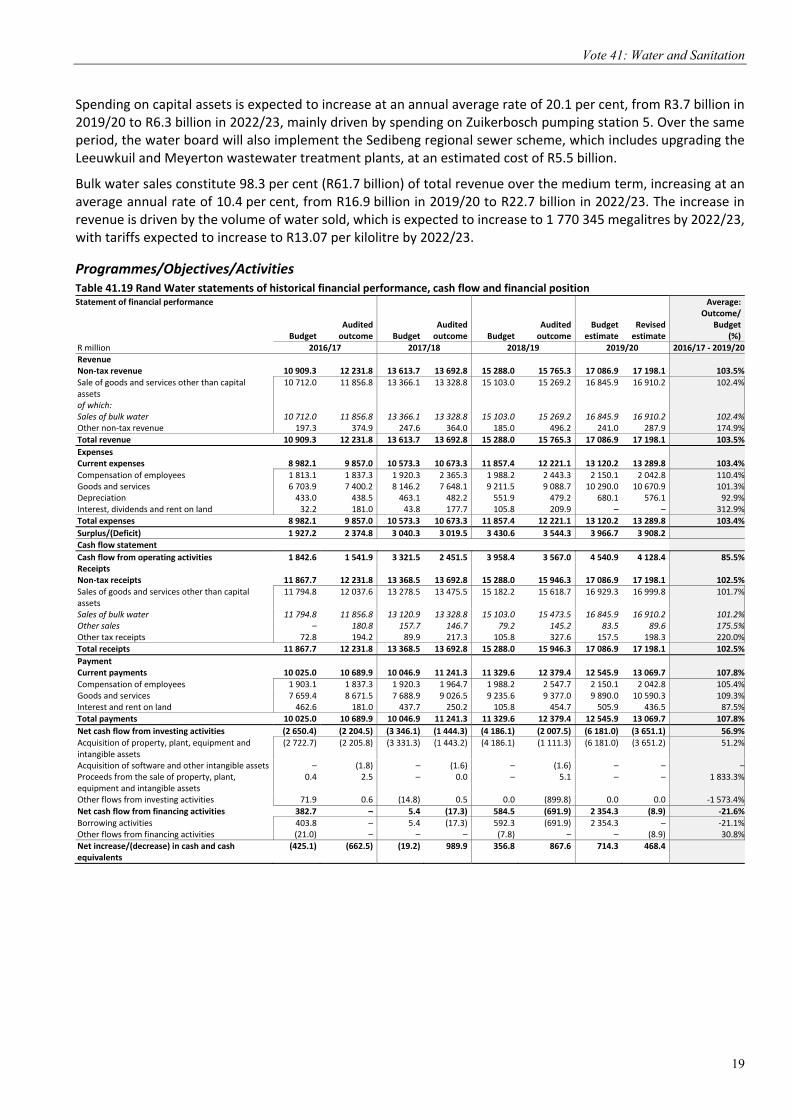
Vote 41: Water and Sanitation
19
Spending on capital assets is expected to increase at an annual average rate of 20.1 per cent, from R3.7 billion in 2019/20 to R6.3 billion in 2022/23, mainly driven by spending on Zuikerbosch pumping station 5. Over the same period, the water board will also implement the Sedibeng regional sewer scheme, which includes upgrading the Leeuwkuil and Meyerton wastewater treatment plants, at an estimated cost of R5.5 billion.
Bulk water sales constitute 98.3 per cent (R61.7 billion) of total revenue over the medium term, increasing at an average annual rate of 10.4 per cent, from R16.9 billion in 2019/20 to R22.7 billion in 2022/23. The increase in revenue is driven by the volume of water sold, which is expected to increase to 1 770 345 megalitres by 2022/23, with tariffs expected to increase to R13.07 per kilolitre by 2022/23.
Programmes/Objectives/Activities Table 41.19 Rand Water statements of historical financial performance, cash flow and financial position Statement of financial performance
Budget Auditedoutcome Budget
Auditedoutcome Budget
Audited outcome
Budget estimate
Revisedestimate
Average:Outcome/
Budget(%)
R million 2016/17 2017/18 2018/19 2019/20 2016/17 ‐ 2019/20Revenue Non‐tax revenue 10 909.3 12 231.8 13 613.7 13 692.8 15 288.0 15 765.3 17 086.9 17 198.1 103.5%Sale of goods and services other than capital assets
10 712.0 11 856.8 13 366.1 13 328.8 15 103.0 15 269.2 16 845.9 16 910.2 102.4%
of which: Sales of bulk water 10 712.0 11 856.8 13 366.1 13 328.8 15 103.0 15 269.2 16 845.9 16 910.2 102.4%Other non‐tax revenue 197.3 374.9 247.6 364.0 185.0 496.2 241.0 287.9 174.9%
Total revenue 10 909.3 12 231.8 13 613.7 13 692.8 15 288.0 15 765.3 17 086.9 17 198.1 103.5%
Expenses Current expenses 8 982.1 9 857.0 10 573.3 10 673.3 11 857.4 12 221.1 13 120.2 13 289.8 103.4%
Compensation of employees 1 813.1 1 837.3 1 920.3 2 365.3 1 988.2 2 443.3 2 150.1 2 042.8 110.4%Goods and services 6 703.9 7 400.2 8 146.2 7 648.1 9 211.5 9 088.7 10 290.0 10 670.9 101.3%Depreciation 433.0 438.5 463.1 482.2 551.9 479.2 680.1 576.1 92.9%Interest, dividends and rent on land 32.2 181.0 43.8 177.7 105.8 209.9 – – 312.9%Total expenses 8 982.1 9 857.0 10 573.3 10 673.3 11 857.4 12 221.1 13 120.2 13 289.8 103.4%
Surplus/(Deficit) 1 927.2 2 374.8 3 040.3 3 019.5 3 430.6 3 544.3 3 966.7 3 908.2
Cash flow statement Cash flow from operating activities 1 842.6 1 541.9 3 321.5 2 451.5 3 958.4 3 567.0 4 540.9 4 128.4 85.5%Receipts Non‐tax receipts 11 867.7 12 231.8 13 368.5 13 692.8 15 288.0 15 946.3 17 086.9 17 198.1 102.5%Sales of goods and services other than capital assets
11 794.8 12 037.6 13 278.5 13 475.5 15 182.2 15 618.7 16 929.3 16 999.8 101.7%
Sales of bulk water 11 794.8 11 856.8 13 120.9 13 328.8 15 103.0 15 473.5 16 845.9 16 910.2 101.2%Other sales – 180.8 157.7 146.7 79.2 145.2 83.5 89.6 175.5%Other tax receipts 72.8 194.2 89.9 217.3 105.8 327.6 157.5 198.3 220.0%Total receipts 11 867.7 12 231.8 13 368.5 13 692.8 15 288.0 15 946.3 17 086.9 17 198.1 102.5%
Payment Current payments 10 025.0 10 689.9 10 046.9 11 241.3 11 329.6 12 379.4 12 545.9 13 069.7 107.8%Compensation of employees 1 903.1 1 837.3 1 920.3 1 964.7 1 988.2 2 547.7 2 150.1 2 042.8 105.4%Goods and services 7 659.4 8 671.5 7 688.9 9 026.5 9 235.6 9 377.0 9 890.0 10 590.3 109.3%Interest and rent on land 462.6 181.0 437.7 250.2 105.8 454.7 505.9 436.5 87.5%
Total payments 10 025.0 10 689.9 10 046.9 11 241.3 11 329.6 12 379.4 12 545.9 13 069.7 107.8%
Net cash flow from investing activities (2 650.4) (2 204.5) (3 346.1) (1 444.3) (4 186.1) (2 007.5) (6 181.0) (3 651.1) 56.9%Acquisition of property, plant, equipment and intangible assets
(2 722.7) (2 205.8) (3 331.3) (1 443.2) (4 186.1) (1 111.3) (6 181.0) (3 651.2) 51.2%
Acquisition of software and other intangible assets – (1.8) – (1.6) – (1.6) – – –Proceeds from the sale of property, plant, equipment and intangible assets
0.4 2.5 – 0.0 – 5.1 – – 1 833.3%
Other flows from investing activities 71.9 0.6 (14.8) 0.5 0.0 (899.8) 0.0 0.0 ‐1 573.4%
Net cash flow from financing activities 382.7 – 5.4 (17.3) 584.5 (691.9) 2 354.3 (8.9) ‐21.6%Borrowing activities 403.8 – 5.4 (17.3) 592.3 (691.9) 2 354.3 – ‐21.1%Other flows from financing activities (21.0) – – – (7.8) – – (8.9) 30.8%Net increase/(decrease) in cash and cash equivalents
(425.1) (662.5) (19.2) 989.9 356.8 867.6 714.3 468.4

2020 Estimates of National Expenditure
20
Table 41.19 Rand Water statements of historical financial performance, cash flow and financial position Statement of financial position
Budget Auditedoutcome Budget
Auditedoutcome Budget
Auditedoutcome
Budget estimate
Revised estimate
Average:Outcome/
Budget(%)
R million 2016/17 2017/18 2018/19 2019/20 2016/17 ‐ 2019/20
Carrying value of assets 20 727.4 20 117.6 23 708.0 21 319.0 26 008.2 22 131.0 32 108.8 27 722.6 89.0%Acquisition of assets (2 722.7) (2 205.8) (3 331.3) (1 443.2) (4 186.1) (1 111.3) (6 181.0) (3 651.2) 51.2%
Investments 389.8 466.0 354.9 463.9 402.3 1 163.9 449.0 457.4 159.9%Inventory 137.3 409.7 144.1 485.4 453.8 493.7 478.3 538.6 158.8%Loans 5.1 4.6 5.1 4.1 4.5 3.8 4.5 4.0 85.7%Receivables and prepayments 1 825.0 2 244.5 2 036.8 2 482.0 2 754.1 2 222.7 2 864.0 3 275.3 107.9%Cash and cash equivalents 1 045.0 780.2 1 473.5 1 770.1 1 842.9 3 535.8 2 510.3 3 232.8 135.6%Non‐current assets held for sale – 0.5 – 2.4 – 328.7 – – –Defined benefit plan assets 21.4 10.4 37.9 15.6 45.6 2.2 45.6 30.2 38.9%
Total assets 24 151.0 24 033.5 27 760.3 26 542.5 31 511.3 29 881.9 38 460.5 35 260.9 94.9%
Accumulated surplus/(deficit) 15 272.3 15 688.8 18 664.6 18 452.1 22 189.1 21 769.6 26 155.8 26 651.1 100.3%Borrowings 4 815.6 4 414.7 4 431.5 4 393.4 4 997.9 4 389.4 7 347.6 4 384.3 81.4%Deferred income 503.6 401.0 528.5 392.8 444.2 106.3 468.2 445.5 69.2%Trade and other payables 3 458.2 3 459.8 4 012.8 3 230.1 3 763.1 3 232.2 4 365.6 3 677.2 87.2%Provisions 30.7 – 46.8 – 35.1 – 35.1 14.5 9.8%Derivatives financial instruments 70.6 69.2 76.0 74.1 81.9 384.4 88.2 88.2 194.4%
Total equity and liabilities 24 151.0 24 033.5 27 760.3 26 542.5 31 511.3 29 881.9 38 460.5 35 260.9 94.9%
Statements of estimates of financial performance, cash flow and financial position Table 41.20 Rand Water statements of estimates of financial performance, cash flow and financial position Statement of financial performance
Revised estimate
Averagegrowth
rate(%)
Average:Expen‐diture/Total(%) Medium‐term estimate
Averagegrowth
rate(%)
Average:Expen‐diture/Total(%)
R million 2019/20 2016/17 ‐ 2019/20 2020/21 2021/22 2022/23 2019/20 ‐ 2022/23
Revenue Non‐tax revenue 17 198.1 12.0% 100.0% 18 756.7 20 891.4 23 164.4 10.4% 100.0%
Sale of goods and services other than capital assets 16 910.2 12.6% 97.4% 18 491.1 20 504.8 22 737.9 10.4% 98.3%Sales of bulk water 16 910.2 12.6% 97.4% 18 491.1 20 504.8 22 737.9 10.4% 98.3%Other non‐tax revenue 287.9 ‐8.4% 2.6% 265.6 386.6 426.6 14.0% 1.7%Total revenue 17 198.1 12.0% 100.0% 18 756.7 20 891.4 23 164.4 10.4% 100.0%
Expenses Current expenses 13 289.8 10.5% 100.0% 14 727.7 16 422.1 18 272.7 11.2% 100.0%Compensation of employees 2 042.8 3.6% 19.0% 2 197.8 2 373.4 2 568.5 7.9% 14.7%Goods and services 10 670.9 13.0% 75.3% 11 843.1 13 207.9 14 726.8 11.3% 80.4%Depreciation 576.1 9.5% 4.3% 686.7 840.8 977.4 19.3% 4.9%
Total expenses 13 289.8 10.5% 100.0% 14 727.7 16 422.1 18 272.7 11.2% 100.0%
Surplus/(Deficit) 3 908.2 4 029.0 4 469.2 4 891.8 Cash flow statement
Cash flow from operating activities 4 128.4 38.9% 296.8% 4 442.6 4 730.3 6 326.5 78.1% 298.6%Receipts Non‐tax receipts 17 198.1 12.0% 100.0% 18 756.7 20 891.4 23 164.4 10.4% 100.0%Sales of goods and services other than capital assets 16 999.8 12.2% 98.4% 18 668.3 20 772.8 23 020.2 10.6% 99.3%Sales of bulk water 16 910.2 12.6% 97.4% 18 491.1 20 504.8 22 737.9 10.4% 98.3%Other sales 89.6 ‐20.9% 1.0% 177.2 268.0 282.4 46.6% 1.0%Other tax receipts 198.3 0.7% 1.6% 88.5 118.6 144.2 ‐10.1% 0.7%
Total receipts 17 198.1 12.0% 100.0% 18 756.7 20 891.4 23 164.4 10.4% 100.0%
Current payments 13 069.7 6.9% 103.4% 14 314.1 16 161.0 16 837.9 8.8% 100.0%
Compensation of employees 2 042.8 3.6% 18.3% 2 197.8 2 373.4 2 568.5 7.9% 15.2%Goods and services 10 590.3 6.9% 82.2% 11 587.5 13 191.2 13 504.4 8.4% 81.0%Interest and rent on land 436.5 34.1% 2.8% 528.8 596.4 765.0 20.6% 3.8%
Total payment 13 069.7 6.9% 100.0% 14 314.1 16 161.0 16 837.9 8.8% 100.0%
Net cash flow from investing activities (3 651.1) 18.3% 100.0% (6 101.1) (6 995.6) (6 329.6) 20.1% 100.0%Acquisition of property, plant, equipment and intangible assets
(3 651.2) 18.3% 88.8% (6 108.5) (6 995.7) (6 329.6) 20.1% 100.0%
Other flows from investing activities 0.0 ‐64.6% 11.2% 7.4 0.0 0.0 2.6% ‐0.0%
Net cash flow from financing activities (8.9) – – (40.1) 2 761.5 389.9 ‐453.0% 100.0%Borrowing Activities – – – 48.2 2 761.5 389.9 – 20.0%Other flows from financing activities (8.9) – – (88.2) – – ‐100.0% 80.0%Net increase/(decrease) in cash and cash equivalents 468.4 ‐189.1% 100.0% (1 698.6) 496.2 386.9 ‐6.2% 100.0%
Statement of financial position Carrying value of assets 27 722.6 11.3% 79.2% 33 668.5 40 419.4 46 536.2 18.8% 83.8%
Acquisition of assets (3 651.2) 18.3% ‐7.2% (6 108.5) (6 995.7) (6 329.6) 20.1% ‐13.1%Investments 457.4 ‐0.6% 2.2% 450.0 450.0 450.0 ‐0.5% 1.1%Inventory 538.6 9.6% 1.7% 566.1 594.4 624.7 5.1% 1.3%Loans 4.0 ‐4.4% 0.0% 4.0 4.0 3.9 ‐0.7% 0.0%Receivables and prepayments 3 275.3 13.4% 8.9% 3 736.7 4 177.9 3 084.8 ‐2.0% 8.3%Cash and cash equivalents 3 232.8 60.6% 7.7% 1 534.2 2 030.4 2 417.3 ‐9.2% 5.5%Defined benefit plan assets 30.2 42.6% 0.0% 30.2 30.2 30.2 – 0.1%Total assets 35 260.9 13.6% 100.0% 39 989.7 47 706.2 53 147.1 14.7% 100.0%

Vote 41: Water and Sanitation
21
Table 41.20 Rand Water statements of estimates of financial performance, cash flow and financial position Statement of financial position
Revisedestimate
Averagegrowth
rate(%)
Average:Expen‐diture/Total(%) Medium‐term estimate
Averagegrowth
rate(%)
Average:Expen‐diture/Total(%)
R million 2019/20 2016/17 ‐ 2019/20 2020/21 2021/22 2022/23 2019/20 ‐ 2022/23 Accumulated surplus/(deficit) 26 651.1 19.3% 70.8% 30 680.2 35 149.4 40 041.2 14.5% 75.3%Borrowings 4 384.3 ‐0.2% 15.5% 4 427.8 7 188.9 7 578.4 20.0% 13.2%Deferred income 445.5 3.6% 1.2% 468.2 491.6 516.7 5.1% 1.1%Trade and other payables 3 677.2 2.1% 12.0% 4 399.0 4 861.8 4 996.3 10.8% 10.3%Provisions 14.5 – 0.0% 14.5 14.5 14.5 – 0.0%Derivatives financial instruments 88.2 8.4% 0.5% – – – ‐100.0% 0.1%Total equity and liabilities 35 260.9 13.6% 100.0% 39 989.7 47 706.2 53 147.1 14.7% 100.0%
Personnel information Table 41.21 Rand Water personnel numbers and cost by salary level
Number of posts estimated for 31 March 2020 Number and cost1 of personnel posts filled/planned for on funded establishment Number
Number of
funded posts
Number of
posts on approved
establishment Actual Revised estimate Medium‐term expenditure estimate
Averagegrowth
rate(%)
Average:Salary
level/Total(%)
2018/19 2019/20 2020/21 2021/22 2022/23 2019/20 ‐ 2022/23
Rand Water Number Cost Unit cost Number Cost
Unitcost Number Cost
Unitcost Number Cost
Unit cost Number Cost
Unitcost
Salary level
3 482 3 482 3 468 2 443.3 0.7 3 486 2 042.8 0.6 3 502 2 197.8 0.6 3 512 2 373.4 0.7 3 518 2 568.5 0.7 7.9% 100.0%
1 – 6 691 691 681 182.7 0.3 691 168.0 0.2 691 181.5 0.3 691 196.0 0.3 690 211.7 0.3 8.0% 19.7%7 – 10 1 882 1 882 1 882 1 168.7 0.6 1 882 859.9 0.5 1 902 934.0 0.5 1 912 1 008.4 0.5 1 912 1 084.3 0.6 8.0% 54.3%11 – 12 500 500 500 464.2 0.9 500 426.9 0.9 500 461.0 0.9 500 497.9 1.0 500 537.7 1.1 8.0% 14.3%13 – 16 396 396 391 585.3 1.5 400 550.9 1.4 396 581.3 1.5 396 627.8 1.6 403 688.1 1.7 7.7% 11.4%17 – 22 13 13 14 42.3 3.0 13 37.1 2.9 13 40.1 3.1 13 43.3 3.3 13 46.8 3.6 8.0% 0.4%
1. Rand million.
Trans‐Caledon Tunnel Authority
Selected performance indicators Table 41.22 Trans‐Caledon Tunnel Authority performance indicators by programme/objective/activity and related priority Indicator Programme/Objective/Activity MTSF priority Past Current Projections
2016/17 2017/18 2018/19 2019/20 2020/21 2021/22 2022/23Percentage completion of 160km pipeline per year
Mokolo‐Crocodile River water augmentation project
Priority 1: Economic transformation and job creation
–1 –1 –1 –1 –1 20% 40%
Average volume of acid mine water pumped from the western basin (megalitres per day)
Acid mine drainage –1 –1 –1 30‐33 30‐33 24‐27 24‐27
Environmental critical level of acid mine water within mine voids in the central basin
Acid mine drainage –1 –1 –1 ≥8 metres 6‐10 metres
6‐10metres
6‐10metres
Environmental critical level of acid mine water within mine voids in the eastern basin
Acid mine drainage –1 –1 –1 10‐15 metres
10‐15 metres
10‐15metres
10‐15metres
1. No historical data available.
Entity overview
The Trans‐Caledon Tunnel Authority was established in 1986 as a specialised liability management entity, deriving its mandate from the National Water Act (1998). It is responsible for financing and implementing the development of bulk raw water infrastructure, and providing treasury management services to the Department of Water and Sanitation. The authority plays an important role in providing: financial advisory services such as structuring and raising project finance, managing debt and setting tariffs; project implementation services; and other technical support to the department and water boards. As such, the authority will continue with the planning and implementation of the Vaal River system through phase 2 of the Lesotho Highlands water project, providing a short‐term solution to acid mine drainage in Gauteng, and phase 2A of the Mokolo‐Crocodile River water augmentation project.
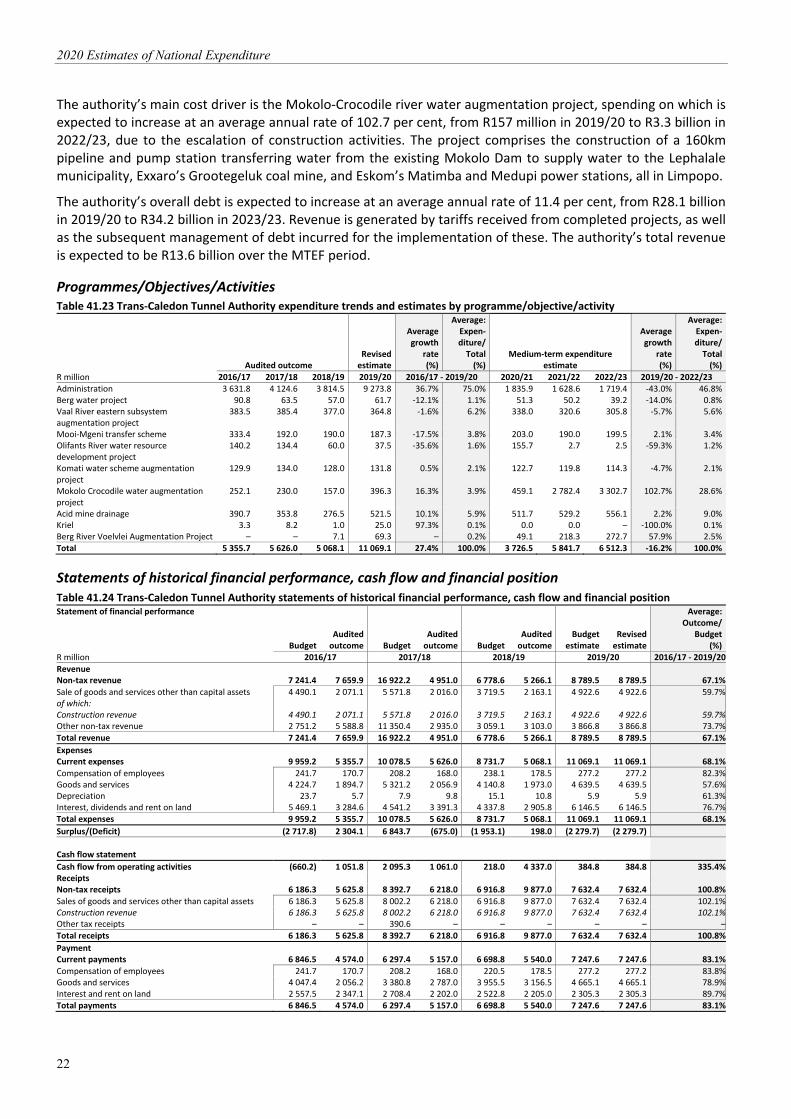
2020 Estimates of National Expenditure
22
The authority’s main cost driver is the Mokolo‐Crocodile river water augmentation project, spending on which is expected to increase at an average annual rate of 102.7 per cent, from R157 million in 2019/20 to R3.3 billion in 2022/23, due to the escalation of construction activities. The project comprises the construction of a 160km pipeline and pump station transferring water from the existing Mokolo Dam to supply water to the Lephalale municipality, Exxaro’s Grootegeluk coal mine, and Eskom’s Matimba and Medupi power stations, all in Limpopo.
The authority’s overall debt is expected to increase at an average annual rate of 11.4 per cent, from R28.1 billion in 2019/20 to R34.2 billion in 2023/23. Revenue is generated by tariffs received from completed projects, as well as the subsequent management of debt incurred for the implementation of these. The authority’s total revenue is expected to be R13.6 billion over the MTEF period.
Programmes/Objectives/Activities Table 41.23 Trans‐Caledon Tunnel Authority expenditure trends and estimates by programme/objective/activity
Audited outcome Revisedestimate
Averagegrowth
rate(%)
Average:Expen‐diture/Total(%)
Medium‐term expenditure estimate
Averagegrowth
rate(%)
Average:Expen‐diture/Total(%)
R million 2016/17 2017/18 2018/19 2019/20 2016/17 ‐ 2019/20 2020/21 2021/22 2022/23 2019/20 ‐ 2022/23 Administration 3 631.8 4 124.6 3 814.5 9 273.8 36.7% 75.0% 1 835.9 1 628.6 1 719.4 ‐43.0% 46.8%Berg water project 90.8 63.5 57.0 61.7 ‐12.1% 1.1% 51.3 50.2 39.2 ‐14.0% 0.8%Vaal River eastern subsystem augmentation project
383.5 385.4 377.0 364.8 ‐1.6% 6.2% 338.0 320.6 305.8 ‐5.7% 5.6%
Mooi‐Mgeni transfer scheme 333.4 192.0 190.0 187.3 ‐17.5% 3.8% 203.0 190.0 199.5 2.1% 3.4%Olifants River water resource development project
140.2 134.4 60.0 37.5 ‐35.6% 1.6% 155.7 2.7 2.5 ‐59.3% 1.2%
Komati water scheme augmentation project
129.9 134.0 128.0 131.8 0.5% 2.1% 122.7 119.8 114.3 ‐4.7% 2.1%
Mokolo Crocodile water augmentation project
252.1 230.0 157.0 396.3 16.3% 3.9% 459.1 2 782.4 3 302.7 102.7% 28.6%
Acid mine drainage 390.7 353.8 276.5 521.5 10.1% 5.9% 511.7 529.2 556.1 2.2% 9.0%Kriel 3.3 8.2 1.0 25.0 97.3% 0.1% 0.0 0.0 – ‐100.0% 0.1%Berg River Voelvlei Augmentation Project – – 7.1 69.3 – 0.2% 49.1 218.3 272.7 57.9% 2.5%Total 5 355.7 5 626.0 5 068.1 11 069.1 27.4% 100.0% 3 726.5 5 841.7 6 512.3 ‐16.2% 100.0%
Statements of historical financial performance, cash flow and financial position Table 41.24 Trans‐Caledon Tunnel Authority statements of historical financial performance, cash flow and financial position Statement of financial performance
Budget Auditedoutcome Budget
Auditedoutcome Budget
Auditedoutcome
Budget estimate
Revised estimate
Average:Outcome/
Budget(%)
R million 2016/17 2017/18 2018/19 2019/20 2016/17 ‐ 2019/20
Revenue Non‐tax revenue 7 241.4 7 659.9 16 922.2 4 951.0 6 778.6 5 266.1 8 789.5 8 789.5 67.1%
Sale of goods and services other than capital assets 4 490.1 2 071.1 5 571.8 2 016.0 3 719.5 2 163.1 4 922.6 4 922.6 59.7%of which: Construction revenue 4 490.1 2 071.1 5 571.8 2 016.0 3 719.5 2 163.1 4 922.6 4 922.6 59.7%Other non‐tax revenue 2 751.2 5 588.8 11 350.4 2 935.0 3 059.1 3 103.0 3 866.8 3 866.8 73.7%
Total revenue 7 241.4 7 659.9 16 922.2 4 951.0 6 778.6 5 266.1 8 789.5 8 789.5 67.1%
Expenses Current expenses 9 959.2 5 355.7 10 078.5 5 626.0 8 731.7 5 068.1 11 069.1 11 069.1 68.1%
Compensation of employees 241.7 170.7 208.2 168.0 238.1 178.5 277.2 277.2 82.3%Goods and services 4 224.7 1 894.7 5 321.2 2 056.9 4 140.8 1 973.0 4 639.5 4 639.5 57.6%Depreciation 23.7 5.7 7.9 9.8 15.1 10.8 5.9 5.9 61.3%Interest, dividends and rent on land 5 469.1 3 284.6 4 541.2 3 391.3 4 337.8 2 905.8 6 146.5 6 146.5 76.7%Total expenses 9 959.2 5 355.7 10 078.5 5 626.0 8 731.7 5 068.1 11 069.1 11 069.1 68.1%
Surplus/(Deficit) (2 717.8) 2 304.1 6 843.7 (675.0) (1 953.1) 198.0 (2 279.7) (2 279.7)
Cash flow statement
Cash flow from operating activities (660.2) 1 051.8 2 095.3 1 061.0 218.0 4 337.0 384.8 384.8 335.4%Receipts Non‐tax receipts 6 186.3 5 625.8 8 392.7 6 218.0 6 916.8 9 877.0 7 632.4 7 632.4 100.8%
Sales of goods and services other than capital assets 6 186.3 5 625.8 8 002.2 6 218.0 6 916.8 9 877.0 7 632.4 7 632.4 102.1%Construction revenue 6 186.3 5 625.8 8 002.2 6 218.0 6 916.8 9 877.0 7 632.4 7 632.4 102.1%Other tax receipts – – 390.6 – – – – – –
Total receipts 6 186.3 5 625.8 8 392.7 6 218.0 6 916.8 9 877.0 7 632.4 7 632.4 100.8%
Payment Current payments 6 846.5 4 574.0 6 297.4 5 157.0 6 698.8 5 540.0 7 247.6 7 247.6 83.1%
Compensation of employees 241.7 170.7 208.2 168.0 220.5 178.5 277.2 277.2 83.8%Goods and services 4 047.4 2 056.2 3 380.8 2 787.0 3 955.5 3 156.5 4 665.1 4 665.1 78.9%Interest and rent on land 2 557.5 2 347.1 2 708.4 2 202.0 2 522.8 2 205.0 2 305.3 2 305.3 89.7%Total payments 6 846.5 4 574.0 6 297.4 5 157.0 6 698.8 5 540.0 7 247.6 7 247.6 83.1%

Vote 41: Water and Sanitation
23
Table 41.24 Trans‐Caledon Tunnel Authority statements of historical financial performance, cash flow and financial position Statement of financial performance
BudgetAuditedoutcome Budget
Auditedoutcome Budget
Audited outcome
Budget estimate
Revisedestimate
Average:Outcome/
Budget(%)
R million 2016/17 2017/18 2018/19 2019/20 2016/17 ‐ 2019/20
Net cash flow from investing activities (2 887.8) (1 087.5) – 2 994.0 427.0 139.0 190.1 191.0 ‐98.5%Acquisition of property, plant, equipment and intangible assets
– (5.2) – (1.0) (0.5) (1.0) (3.8) (2.9) 238.3%
Acquisition of software and other intangible assets – (16.2) – (4.0) (1.5) – (1.3) (1.3) 760.6%Proceeds from the sale of property, plant, equipment and intangible assets
– 9.9 – 1.0 – – – – –
Other flows from investing activities (2 887.8) (1 076.0) – 2 998.0 429.0 140.0 195.2 195.2 ‐99.7%
Net cash flow from financing activities 3 548.2 (523.1) 2 553.0 (2 765.0) (4 226.8) (5 276.0) 4 393.8 4 393.8 ‐66.5%Borrowing activities 3 548.2 (523.1) 2 553.0 (2 765.0) (4 226.8) (5 276.0) 4 393.8 4 393.8 ‐66.5%
Net increase/(decrease) in cash and cash equivalents 0.3 (558.8) 4 648.3 1 290.0 (3 581.8) (800.0) 4 968.7 4 969.6
Statement of financial position
Carrying value of assets 23.0 26.2 14.1 20.0 6.5 10.0 21.0 21.0 119.2%Acquisition of assets – (5.2) – (1.0) (0.5) (1.0) (3.8) (2.9) 238.3%
Investments 9 346.2 3 052.1 – 371.0 1 055.2 482.0 – – 37.5%Receivables and prepayments 29 489.5 27 389.4 35 598.8 25 030.0 25 072.5 21 591.0 22 365.4 22 365.4 85.6%Cash and cash equivalents – 2 558.9 8 012.4 3 849.0 4 256.5 3 048.0 6 200.9 6 200.9 84.8%Taxation – 2.1 – – – – – – –
Total assets 38 858.7 33 028.7 43 625.4 29 270.0 30 390.7 25 131.0 28 587.3 28 587.3 82.0%
Accumulated surplus/(deficit) (2 596.3) 2 667.4 7 944.0 640.0 1 526.1 836.0 (15.8) (15.8) 60.2%Capital and reserves – – 34.5 – – – – – –Capital reserve fund – – – – 1 219.1 – – – –Borrowings 40 849.5 28 741.0 33 184.7 27 149.0 26 706.6 22 554.0 28 077.3 28 077.3 82.7%Trade and other payables 605.5 1 164.5 2 462.2 1 044.0 938.9 1 142.0 525.8 525.8 85.5%Taxation – 116.2 – 75.0 – 187.0 – – –Provisions – 339.6 – 362.0 – 412.0 – – –Derivatives financial instruments – (0.0) – – – – – – –Total equity and liabilities 38 858.7 33 028.7 43 625.4 29 270.0 30 390.7 25 131.0 28 587.3 28 587.3 82.0%
Statements of estimates of financial performance, cash flow and financial position Table 41.25 Trans‐Caledon Tunnel Authority statements of estimates of financial performance, cash flow and financial position Statement of financial performance
Revisedestimate
Averagegrowth
rate(%)
Average:Expen‐diture/Total(%) Medium‐term estimate
Averagegrowth
rate(%)
Average:Expen‐diture/Total(%)
R million 2019/20 2016/17 ‐ 2019/20 2020/21 2021/22 2022/23 2019/20 ‐ 2022/23 Revenue Non‐tax revenue 8 789.5 4.7% 100.0% 3 621.0 4 768.1 5 219.7 ‐15.9% 100.0%Sale of goods and services other than capital assets 4 922.6 33.5% 41.2% 1 363.0 3 610.4 4 021.4 ‐6.5% 61.6%Construction revenue 4 922.6 33.5% 41.2% 1 363.0 3 610.4 4 021.4 ‐6.5% 61.6%Other non‐tax revenue 3 866.8 ‐11.6% 58.8% 2 258.0 1 157.7 1 198.3 ‐32.3% 38.4%
Total revenue 8 789.5 4.7% 100.0% 3 621.0 4 768.1 5 219.7 ‐15.9% 100.0%
Current expenses 11 069.1 27.4% 100.0% 3 726.5 5 841.7 6 512.3 ‐16.2% 100.0%
Compensation of employees 277.2 17.5% 3.0% 299.9 322.3 338.8 6.9% 5.3%Goods and services 4 639.5 34.8% 38.2% 1 050.2 3 273.9 3 672.2 ‐7.5% 45.6%Depreciation 5.9 1.5% 0.1% 13.0 14.1 10.4 20.6% 0.2%Interest, dividends and rent on land 6 146.5 23.2% 58.6% 2 363.5 2 231.3 2 490.9 ‐26.0% 48.8%
Total expenses 11 069.1 27.4% 100.0% 3 726.5 5 841.7 6 512.3 ‐16.2% 100.0%
Surplus/(Deficit) (2 279.7) (105.5) (1 073.6) (1 292.6)
Cash flow statement
Cash flow from operating activities 384.8 ‐28.5% 300.0% (327.6) (1 664.5) (12 429.1) 25.0% 300.0%Receipts Non‐tax receipts 7 632.4 10.7% 100.0% 9 112.1 9 806.3 9 703.9 8.3% 100.0%Sales of goods and services other than capital assets 7 632.4 10.7% 100.0% 9 112.1 9 806.3 9 703.9 8.3% 100.0%Construction revenue 7 632.4 10.7% 100.0% 9 112.1 9 806.3 9 703.9 8.3% 100.0%Total receipts 7 632.4 10.7% 100.0% 9 112.1 9 806.3 9 703.9 8.3% 100.0%
Current payments 7 247.6 16.6% 88.0% 9 439.7 11 470.7 22 133.0 45.1% 100.0%
Compensation of employees 277.2 17.5% 3.0% 299.9 322.3 338.8 6.9% 2.8%Goods and services 4 665.1 31.4% 48.1% 6 833.1 9 085.7 19 802.8 61.9% 76.4%Interest and rent on land 2 305.3 ‐0.6% 36.8% 2 306.8 2 062.7 1 991.4 ‐4.8% 20.8%
Total payment 7 247.6 16.6% 100.0% 9 439.7 11 470.7 22 133.0 45.1% 100.0%
Net cash flow from investing activities 191.0 ‐156.0% 100.0% 442.3 289.0 155.4 ‐6.6% 100.0%
Acquisition of property, plant, equipment and intangible assets (2.9) ‐17.3% ‐0.5% (3.2) (2.0) (5.6) 24.3% ‐1.6%Acquisition of software and other intangible assets (1.3) ‐56.5% 0.2% (13.5) (3.0) (3.0) 31.1% ‐1.7%
Net cash flow from financing activities 4 393.8 ‐303.3% 100.0% 9 545.0 (7 311.0) 12 563.0 41.9% 100.0%Borrowing Activities 4 393.8 ‐303.3% 100.0% 9 545.0 (7 311.0) 12 563.0 41.9% 100.0%
Net increase/(decrease) in cash and cash equivalents 4 969.6 ‐307.2% 100.0% 9 659.8 (8 686.5) 289.3 ‐61.2% 100.0%

2020 Estimates of National Expenditure
24
Table 41.25 Trans‐Caledon Tunnel Authority statements of estimates of financial performance, cash flow and financial position Statement of financial position
Revisedestimate
Averagegrowth
rate(%)
Average:Expen‐diture/Total(%) Medium‐term estimate
Averagegrowth
rate(%)
Average:Expen‐diture/Total(%)
R million 2019/20 2016/17 ‐ 2019/20 2020/21 2021/22 2022/23 2019/20 ‐ 2022/23
Carrying value of assets 21.0 ‐7.0% 0.1% 16.7 7.6 5.9 ‐34.6% 0.0%Acquisition of assets (2.9) ‐17.3% ‐0.0% (3.2) (2.0) (5.6) 24.3% ‐0.0%
Receivables and prepayments 22 365.4 ‐6.5% 83.1% 21 488.6 22 421.5 34 559.7 15.6% 78.4%Cash and cash equivalents 6 200.9 34.3% 13.7% 12 875.6 4 131.7 4 420.9 ‐10.7% 21.5%
Total assets 28 587.3 ‐4.7% 100.0% 34 381.0 26 560.9 38 986.5 10.9% 100.0%
Accumulated surplus/(deficit) (15.8) ‐118.1% 3.4% 972.9 (86.6) (1 339.8) 339.1% ‐0.2%Borrowings 28 077.3 ‐0.8% 91.9% 32 145.5 25 435.0 38 855.8 11.4% 96.8%Trade and other payables 525.8 ‐23.3% 3.4% 887.5 837.4 1 095.4 27.7% 2.6%Provisions – ‐100.0% 1.0% 375.1 375.1 375.1 – 0.9%
Total equity and liabilities 28 587.3 ‐4.7% 100.0% 34 381.0 26 560.9 38 986.5 10.9% 100.0%
Personnel information Table 41.26 Trans‐Caledon Tunnel Authority personnel numbers and cost by salary level
Number of posts estimated for 31 March 2020 Number and cost1 of personnel posts filled/planned for on funded establishment Number
Number of
funded posts
Number of
posts on approved
establishment Actual Revised estimate Medium‐term expenditure estimate
Averagegrowth
rate(%)
Average:Salary
level/Total(%)
2018/19 2019/20 2020/21 2021/22 2022/23 2019/20 ‐ 2022/23
Trans‐Caledon Tunnel Authority Number CostUnit cost Number Cost
Unitcost Number Cost
Unitcost Number Cost
Unitcost Number Cost
Unit cost
Salary level
200 200 146 178.5 1.2 200 277.2 1.4 200 299.9 1.5 200 322.3 1.6 200 338.8 1.7 6.9% 100.0%
1 – 6 5 5 1 0.1 0.1 5 1.8 0.4 5 1.9 0.4 5 2.1 0.4 5 2.2 0.4 6.9% 2.5%7 – 10 70 70 47 25.5 0.5 70 46.6 0.7 70 49.9 0.7 70 54.2 0.8 70 57.0 0.8 6.9% 35.0%11 – 12 26 26 20 20.3 1.0 26 27.7 1.1 26 29.6 1.1 26 32.2 1.2 26 33.8 1.3 6.9% 13.0%13 – 16 88 88 68 95.9 1.4 88 159.4 1.8 88 173.8 2.0 88 185.3 2.1 88 194.8 2.2 6.9% 44.0%17 – 22 11 11 10 36.7 3.7 11 41.7 3.8 11 44.7 4.1 11 48.5 4.4 11 51.0 4.6 6.9% 5.5%
1. Rand million.
Umgeni Water
Selected performance indicators Table 41.27 Umgeni Water performance indicators by programme/objective/activity and related priority Indicator Programme/Objective/Activity MTSF priority Past Current Projections
2016/17 2017/18 2018/19 2019/20 2020/21 2021/22 2022/23
Cost per kilolitre per year Bulk water activities Priority 4: Spatial integration, human settlements and local government
R3.66 R3.53 R4.12 R5.32 R5.76 R6.31 R6.76Weighted average cost of capital per year
Bulk water activities 10.59% 10.63% 10.64% 10.71% 10.86% 10.92% 10.99%
Volume of water sold (megalitres) per year
Bulk water activities 409 887 434 568 471 801 509 862 526 026 534 689 542 709
Entity overview
Umgeni Water was established in terms of the Water Services Act (1997) to provide water and sanitation services in its service area, which comprises mostly rural areas in KwaZulu‐Natal and the eThekwini metropolitan area. The water board supplies water to approximately 6 million consumers. Its ongoing objective is to support socioeconomic development through water infrastructure investment in its area of operation. Accordingly, over the medium term, the water board will construct: phase 1 of the Greater Mpofana regional water scheme, the Impendle bulk water supply scheme, and phase 3 of the Maphumulo bulk water supply scheme, targeting largely indigent municipal areas. In addition, to ensure water security, the water board will target augmentation, upgrades and the rehabilitation of projects such as the Lower Umkhomazi bulk water supply scheme and phase 1 of the Umkhomazi water project. As a result, capital expenditure is expected to increase at an average annual rate of 17.4 per cent, from R1.5 billion in 2019/20 to R2.4 billion in 2022/23.

Vote 41: Water and Sanitation
25
Total expenditure is expected to increase at an average annual rate of 8.5 per cent, from R3.1 billion in 2019/20 to R4 billion in 2022/23. Spending on bulk water activities amounts to R5.8 billion over the medium term, largely driven by goods and services for the purification and transportation of bulk water. Revenue from the sale of bulk water is expected to increase at an average annual rate of 10.1 per cent, from R3 billion in 2019/20 to R5.8 billion in 2022/23. The water board’s revenue is mainly generated by the sale of bulk water to customers.
Programmes/Objectives/Activities Table 41.28 Umgeni Water expenditure trends and estimates by programme/objective/activity
Audited outcome Revisedestimate
Averagegrowth
rate(%)
Average:Expen‐diture/Total(%)
Medium‐term expenditure estimate
Averagegrowth
rate(%)
Average:Expen‐diture/Total(%)
R million 2016/17 2017/18 2018/19 2019/20 2016/17 ‐ 2019/20 2020/21 2021/22 2022/23 2019/20 ‐ 2022/23
Administration 771.5 743.2 1 059.8 1 300.8 19.0% 41.1% 1 440.1 1 582.2 1 688.1 9.1% 42.6%Bulk activities 937.0 1 051.4 1 198.2 1 635.0 20.4% 51.3% 1 772.3 1 903.4 2 074.5 8.3% 52.4%Waste water 88.2 96.5 103.8 132.5 14.5% 4.5% 142.2 151.5 163.8 7.3% 4.2%Other activities 153.7 43.7 26.7 30.1 ‐41.9% 3.1% 25.6 27.2 28.8 ‐1.5% 0.8%
Total 1 950.4 1 934.7 2 388.4 3 098.4 16.7% 100.0% 3 380.2 3 664.2 3 955.1 8.5% 100.0%
Statements of historical financial performance, cash flow and financial position Table 41.29 Umgeni Water statements of historical financial performance, cash flow and financial position Statement of financial performance
BudgetAuditedoutcome Budget
Auditedoutcome Budget
Audited outcome
Budget estimate
Revisedestimate
Average:Outcome/
Budget(%)
R million 2016/17 2017/18 2018/19 2019/20 2016/17 ‐ 2019/20Revenue Non‐tax revenue 2 686.7 2 696.5 3 090.0 3 100.7 3 527.4 3 800.8 4 154.7 4 334.2 103.5%Sale of goods and services other than capital assets 2 599.9 2 509.5 3 001.8 2 903.7 3 397.6 3 538.5 3 952.6 4 190.9 101.5%of which: Sales of bulk water 2 599.9 2 509.5 3 001.8 2 903.7 3 397.6 3 538.5 3 952.6 4 190.9 101.5%Other non‐tax revenue 86.7 187.0 88.1 196.9 129.9 262.4 202.1 143.4 155.8%
Total revenue 2 686.7 2 696.5 3 090.0 3 100.7 3 527.4 3 800.8 4 154.7 4 334.2 103.5%
Expenses Current expenses 1 985.1 1 844.8 2 228.2 1 869.8 2 491.6 2 331.1 2 855.3 2 973.8 94.3%
Compensation of employees 496.3 560.2 550.4 592.4 609.2 674.3 649.9 798.2 113.8%Goods and services 1 237.8 1 112.7 1 335.8 982.5 1 547.7 1 307.0 1 696.6 1 773.6 89.0%Depreciation 228.9 170.6 275.8 293.2 293.2 335.8 311.8 382.6 106.5%Interest, dividends and rent on land 22.0 1.4 66.3 1.7 41.5 14.0 197.1 19.3 11.1%
Transfers and subsidies 106.8 105.6 117.7 64.9 104.9 57.3 124.6 124.6 77.6%Total expenses 2 091.9 1 950.4 2 345.9 1 934.7 2 596.5 2 388.4 2 980.0 3 098.4 93.6%
Surplus/(Deficit) 594.8 746.1 744.0 1 166.0 930.9 1 412.4 1 174.8 1 235.9
Cash flow statement Cash flow from operating activities 625.1 702.5 1 146.7 1 334.1 1 356.7 1 568.7 1 707.1 1 496.8 105.5%Receipts Non‐tax receipts 2 678.2 2 527.6 3 090.0 3 100.7 3 527.4 3 800.8 4 154.7 4 334.2 102.3%
Sales of goods and services other than capital assets 2 599.9 2 423.6 3 001.8 2 903.7 3 397.6 3 538.5 3 952.6 4 190.9 100.8%Sales of bulk water 2 599.9 2 423.6 3 001.8 2 903.7 3 397.6 3 538.5 3 952.6 4 190.9 100.8%Other tax receipts 78.3 104.0 88.1 196.9 129.9 262.4 202.1 143.4 141.8%
Transfers received – 51.9 – – – – – – –
Total receipts 2 678.2 2 579.5 3 090.0 3 100.7 3 527.4 3 800.8 4 154.7 4 334.2 102.7%
Payment Current payments 2 053.1 1 877.0 1 943.3 1 766.5 2 170.7 2 232.2 2 447.6 2 837.5 101.1%
Compensation of employees 496.3 560.2 550.4 592.4 609.2 674.3 649.9 798.2 113.8%Goods and services 1 534.7 1 103.2 1 326.7 1 172.4 1 520.1 1 543.9 1 600.6 2 020.0 97.6%Interest and rent on land 22.0 213.7 66.3 1.7 41.5 14.0 197.1 19.3 76.1%
Total payments 2 053.1 1 877.0 1 943.3 1 766.5 2 170.7 2 232.2 2 447.6 2 837.5 101.1%
Net cash flow from investing activities (749.9) (1 013.9) (1 632.4) (1 630.5) (1 734.5) (1 530.8) (3 865.3) (1 365.9) 69.4%Acquisition of property, plant, equipment and intangible assets
(1 977.9) (1 126.0) (1 503.4) (972.3) (1 652.3) (1 161.7) (2 847.9) (1 510.7) 59.8%
Acquisition of software and other intangible assets – (46.2) – (17.3) – (42.2) (0.2) (0.2) 61 952.6%Proceeds from the sale of property, plant, equipment and intangible assets
– 2.1 – 0.4 – – – – –
Other flows from investing activities 1 228.0 156.3 (129.0) (641.3) (82.2) (326.9) (1 017.2) 145.0 149 866.7%Net cash flow from financing activities 344.4 292.4 888.8 297.6 (64.1) 22.8 1 564.7 187.1 29.3%
Deferred income 423.0 371.1 518.4 454.7 132.3 151.6 320.0 320.0 93.1%Borrowing activities (78.6) (78.6) 370.4 (78.8) (80.6) (79.0) 1 469.3 (30.5) ‐15.9%Other flows from financing activities – – – (78.4) (115.9) (49.8) (224.6) (102.4) 67.7%Net increase/(decrease) in cash and cash equivalents 219.7 (19.0) 403.1 1.2 (441.9) 60.7 (593.5) 317.9

2020 Estimates of National Expenditure
26
Table 41.29 Umgeni Water statements of historical financial performance, cash flow and financial position Statement of financial position
Budget Auditedoutcome Budget
Auditedoutcome Budget
Auditedoutcome
Budget estimate
Revised estimate
Average:Outcome/
Budget(%)
R million 2016/17 2017/18 2018/19 2019/20 2016/17 ‐ 2019/20Carrying value of assets 8 892.7 8 029.3 9 404.7 8 544.8 9 572.3 9 403.9 11 151.6 11 096.4 95.0%
Acquisition of assets (1 977.9) (1 126.0) (1 503.4) (972.3) (1 652.3) (1 161.7) (2 847.9) (1 510.7) 59.8%
Investments 729.3 1 807.7 1 362.7 2 486.5 1 939.0 2 865.4 3 007.9 1 966.7 129.7%Inventory 17.5 15.7 20.5 19.0 17.9 19.0 19.1 25.9 106.0%Accrued investment interest 28.4 35.6 28.4 44.0 38.0 79.4 38.0 44.0 152.9%Receivables and prepayments 411.2 427.9 476.1 514.3 535.7 739.9 589.2 617.8 114.3%Cash and cash equivalents 13.2 24.9 16.8 26.1 9.8 86.8 9.3 16.0 313.9%
Total assets 10 092.4 10 341.1 11 309.2 11 634.6 12 112.7 13 194.5 14 815.0 13 766.7 101.3%
Accumulated surplus/(deficit) 6 100.2 6 374.9 6 901.1 7 617.9 8 286.0 9 080.3 9 460.4 9 868.3 107.1%Capital and reserves 442.8 442.8 442.8 442.9 442.8 442.8 442.8 442.8 100.0%Borrowings 1 950.6 1 950.7 2 320.9 1 871.9 1 791.9 1 792.9 3 262.7 1 762.7 79.1%Accrued interest 58.2 57.5 56.8 56.0 76.0 53.7 77.0 55.3 83.0%Trade and other payables 769.6 781.8 713.9 871.9 604.2 966.8 589.3 680.7 123.3%Provisions 770.8 690.2 843.3 678.1 868.6 698.7 939.8 861.1 85.6%Derivatives financial instruments – 43.1 30.3 95.9 43.1 159.1 43.1 95.9 338.1%
Total equity and liabilities 10 092.4 10 341.1 11 309.2 11 634.6 12 112.7 13 194.5 14 815.0 13 766.7 101.3%
Statements of estimates of financial performance, cash flow and financial position Table 41.30 Umgeni Water statements of estimates of financial performance, cash flow and financial position Statement of financial performance
Revisedestimate
Averagegrowth
rate(%)
Average:Expen‐diture/Total(%) Medium‐term estimate
Averagegrowth
rate(%)
Average:Expen‐diture/Total(%)
R million 2019/20 2016/17 ‐ 2019/20 2020/21 2021/22 2022/23 2019/20 ‐ 2022/23
Revenue Non‐tax revenue 4 334.2 17.1% 100.0% 4 804.8 5 250.3 5 779.3 10.1% 100.0%
Sale of goods and services other than capital assets 4 190.9 18.6% 94.1% 4 703.7 5 219.8 5 770.5 11.3% 98.5%Sales of bulk water 4 190.9 18.6% 94.1% 4 703.7 5 219.8 5 770.5 11.3% 98.5%Other non‐tax revenue 143.4 ‐8.5% 5.9% 101.2 30.5 8.8 ‐60.5% 1.5%
Total revenue 4 334.2 17.1% 100.0% 4 804.8 5 250.3 5 779.3 10.1% 100.0%
Current expenses 2 973.8 17.3% 96.2% 3 244.5 3 516.4 3 794.2 8.5% 96.0%
Compensation of employees 798.2 12.5% 28.3% 799.1 852.6 912.0 4.5% 23.9%Goods and services 1 773.6 16.8% 54.9% 2 029.7 2 239.5 2 439.1 11.2% 60.0%Depreciation 382.6 30.9% 12.6% 398.8 412.0 430.9 4.0% 11.6%Interest, dividends and rent on land 19.3 139.9% 0.3% 16.9 12.3 12.1 ‐14.4% 0.4%Transfers and subsidies 124.6 5.7% 3.8% 135.7 147.8 161.0 8.9% 4.0%
Total expenses 3 098.4 16.7% 100.0% 3 380.2 3 664.2 3 955.1 8.5% 100.0%
Surplus/(Deficit) 1 235.9 1 424.6 1 586.1 1 824.2
Cash flow statement
Cash flow from operating activities 1 496.8 28.7% 288.2% 1 758.1 2 065.9 2 384.2 32.6% 296.9%Receipts Non‐tax receipts 4 334.2 19.7% 99.5% 4 804.8 5 250.3 5 779.3 10.1% 100.0%Sales of goods and services other than capital assets 4 190.9 20.0% 94.3% 4 703.7 5 219.8 5 770.5 11.3% 98.5%Sales of bulk water 4 190.9 20.0% 94.3% 4 703.7 5 219.8 5 770.5 11.3% 98.5%Other tax receipts 143.4 11.3% 5.1% 101.2 30.5 8.8 ‐60.5% 1.5%
Total receipts 4 334.2 18.9% 100.0% 4 804.8 5 250.3 5 779.3 10.1% 100.0%
Current payments 2 837.5 14.8% 93.1% 3 046.7 3 184.4 3 395.1 6.2% 100.0%Compensation of employees 798.2 12.5% 28.3% 799.1 852.6 912.0 4.5% 27.0%Goods and services 2 020.0 22.3% 61.7% 2 230.7 2 319.5 2 471.0 6.9% 72.5%Interest and rent on land 19.3 ‐55.1% 3.1% 16.9 12.3 12.1 ‐14.4% 0.5%
Total payment 2 837.5 14.8% 100.0% 3 046.7 3 184.4 3 395.1 6.2% 100.0%
Net cash flow from investing activities (1 365.9) 10.4% 100.0% (1 250.8) (1 941.3) (2 235.8) 17.9% 100.0%
Acquisition of property, plant, equipment and intangible assets (1 510.7) 10.3% 89.3% (2 145.4) (2 263.1) (2 446.2) 17.4% 127.0%Acquisition of software and other intangible assets (0.2) ‐83.7% 2.1% (0.2) (0.2) (0.2) – 0.0%Other flows from investing activities 145.0 ‐2.5% 8.7% 894.9 322.0 210.6 13.2% ‐27.0%Net cash flow from financing activities 187.1 ‐13.8% 100.0% 72.3 427.2 402.3 29.1% 100.0%
Deferred Income 320.0 ‐4.8% 278.7% 579.0 550.9 545.7 19.5% 309.2%Borrowing Activities (30.5) ‐27.0% ‐104.0% (631.0) (26.4) (26.4) ‐4.7% ‐225.5%Other flows from financing activities (102.4) – ‐74.8% 124.3 (97.3) (117.0) 4.5% 16.3%Net increase/(decrease) in cash and cash equivalents 317.9 ‐355.9% 100.0% 579.6 551.8 550.7 20.1% 100.0%
Statement of financial position Carrying value of assets 11 096.4 11.4% 75.7% 12 975.3 14 853.3 16 869.6 15.0% 88.4%
Acquisition of assets (1 510.7) 10.3% ‐9.8% (2 145.4) (2 263.1) (2 446.2) 17.4% ‐13.3%
Investments 1 966.7 2.9% 18.7% 855.7 535.3 367.5 ‐42.8% 6.4%Inventory 25.9 18.1% 0.2% 29.7 33.6 37.7 13.4% 0.2%Accrued investment interest 44.0 7.3% 0.4% 44.0 44.0 44.0 – 0.3%Receivables and prepayments 617.8 13.0% 4.7% 689.5 759.9 823.5 10.1% 4.6%Cash and cash equivalents 16.0 ‐13.7% 0.3% 16.7 17.6 22.6 12.2% 0.1%
Total assets 13 766.7 10.0% 100.0% 14 610.8 16 243.6 18 164.9 9.7% 100.0%

Vote 41: Water and Sanitation
27
Table 41.30 Umgeni Water statements of estimates of financial performance, cash flow and financial position Statement of financial position
Revisedestimate
Averagegrowth
rate(%)
Average:Expen‐diture/Total(%) Medium‐term estimate
Averagegrowth
rate(%)
Average:Expen‐diture/Total(%)
R million 2019/20 2016/17 ‐ 2019/20 2020/21 2021/22 2022/23 2019/20 ‐ 2022/23
Accumulated surplus/(deficit) 9 868.3 15.7% 66.9% 11 293.0 12 879.2 14 703.5 14.2% 77.3%Capital and reserves 442.8 0.0% 3.7% 442.8 442.8 442.8 ‐0.0% 2.9%Borrowings 1 762.7 ‐3.3% 15.3% 1 133.2 1 108.4 1 124.5 ‐13.9% 8.4%Accrued interest 55.3 ‐1.3% 0.5% 33.8 33.7 33.6 ‐15.3% 0.3%Trade and other payables 680.7 ‐4.5% 6.8% 665.9 645.2 626.2 ‐2.7% 4.2%Provisions 861.1 7.7% 6.0% 946.2 1 038.5 1 138.4 9.8% 6.3%Derivatives financial instruments 95.9 30.5% 0.8% 95.9 95.9 95.9 – 0.6%
Total equity and liabilities 13 766.7 10.0% 100.0% 14 610.8 16 243.6 18 164.9 9.7% 100.0%
Personnel information Table 41.31 Umgeni Water personnel numbers and cost by salary level
Number of posts estimated for 31 March 2020 Number and cost1 of personnel posts filled/planned for on funded establishment Number
Number of
funded posts
Number of
posts on approved
establishment Actual Revised estimate Medium‐term expenditure estimate
Averagegrowth
rate(%)
Average:Salary
level/Total(%)
2018/19 2019/20 2020/21 2021/22 2022/23 2019/20 ‐ 2022/23
Umgeni Water Number Cost Unit cost Number Cost
Unitcost Number Cost
Unitcost Number Cost
Unit cost Number Cost
Unitcost
Salary level
1 376 1 376 1 288 674.3 0.5 1 376 798.2 0.6 1 376 799.1 0.6 1 378 852.6 0.6 1 378 912.0 0.7 4.5% 100.0%
1 – 6 329 329 276 89.3 0.3 329 110.0 0.3 329 110.5 0.3 331 117.3 0.4 331 124.6 0.4 4.2% 24.0%7 – 10 792 792 757 336.3 0.4 792 390.7 0.5 792 390.7 0.5 792 417.2 0.5 792 446.7 0.6 4.6% 57.5%11 – 12 167 167 167 140.6 0.8 167 166.6 1.0 167 166.6 1.0 167 177.9 1.1 167 190.5 1.1 4.6% 12.1%13 – 16 87 87 87 104.7 1.2 87 127.3 1.5 87 127.4 1.5 87 136.1 1.6 87 145.8 1.7 4.6% 6.3%17 – 22 1 1 1 3.4 3.4 1 3.6 3.6 1 3.8 3.8 1 4.1 4.1 1 4.4 4.4 7.0% 0.1%
1. Rand million.
Water Trading Entity
Selected performance indicators Table 41.32 Water Trading Entity performance indicators by programme/objective/activity and related priority Indicator Programme/Objective/Activity MTSF priority Past Current Projections 2016/17 2017/18 2018/19 2019/20 2020/21 2021/22 2022/23
Reduction in the number of days for the collection of outstanding debt per year
Administration
Priority 1: Economic transformation and job creation
120 100 100 100 100 100 100
Percentage of total maintenance budget spent on asset refurbishment and betterment against budget per year
Administration 86%(343 796/400 000)
85%(270 488/316 613)
46% (130 792/ 284 000)
100% 100% 100% 100%
Number of raw water projects completed per year
Operations, maintenance and refurbishment of national water resources schemes
0 1 0 1 2 1 0
Percentage of water users validated within catchment area per year
Implementation of water resources management activities
–1 –1 –1 –1 100% 100% 100%
Number of rivers where the monitoring programme has been implemented per year
Implementation of water resources management activities
66 92 71 71 71 71 71
Percentage of planned maintenance projects completed per year as per the approved asset management plan
Operations, maintenance and refurbishment of national water resources schemes
60%(152/255)
36%(140/390)
46% (267/579)
90% 80% 90% 90%
Percentage of unscheduled maintenance projects completed per year as a proportion of planned maintenance projects
Operations, maintenance and refurbishment of national water resources schemes
–2 ≤20% ≤10% ≤10% ≤10% ≤10% ≤10%
Number of dam safety rehabilitation projects completed per year
Implementation of dam safety projects
0 0 3 3 3 3 3
1. New indicator 2. No historical data available
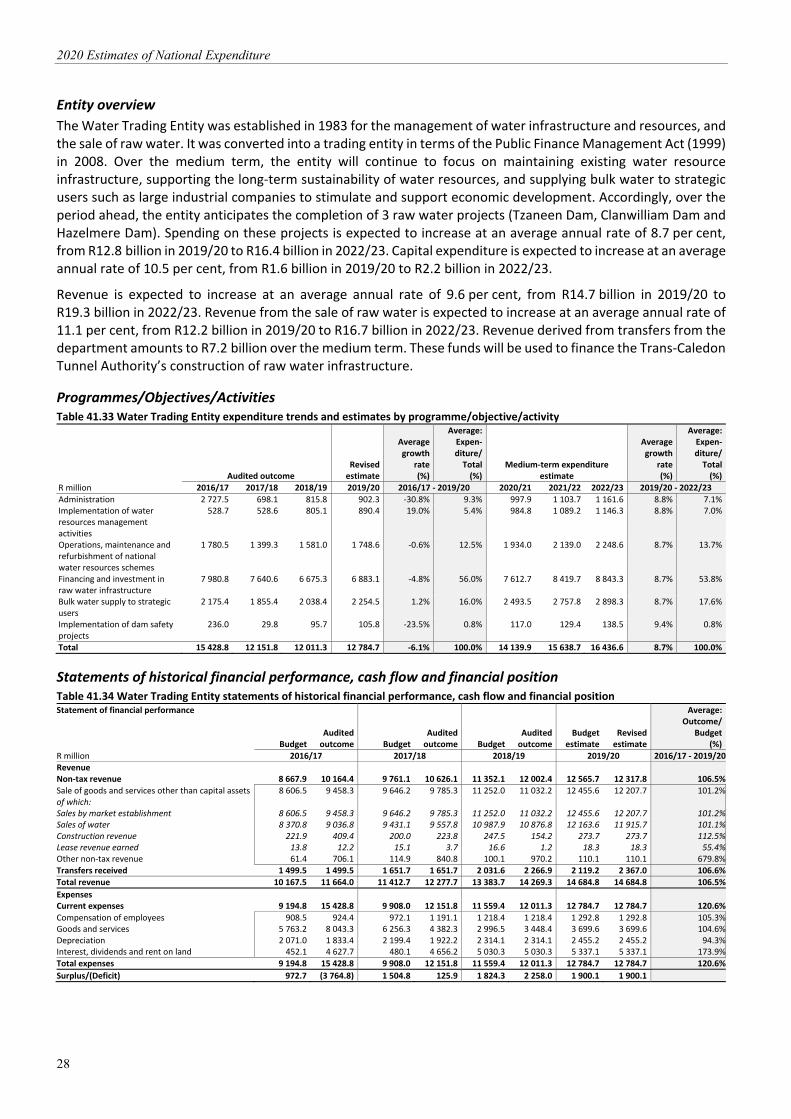
2020 Estimates of National Expenditure
28
Entity overview
The Water Trading Entity was established in 1983 for the management of water infrastructure and resources, and the sale of raw water. It was converted into a trading entity in terms of the Public Finance Management Act (1999) in 2008. Over the medium term, the entity will continue to focus on maintaining existing water resource infrastructure, supporting the long‐term sustainability of water resources, and supplying bulk water to strategic users such as large industrial companies to stimulate and support economic development. Accordingly, over the period ahead, the entity anticipates the completion of 3 raw water projects (Tzaneen Dam, Clanwilliam Dam and Hazelmere Dam). Spending on these projects is expected to increase at an average annual rate of 8.7 per cent, from R12.8 billion in 2019/20 to R16.4 billion in 2022/23. Capital expenditure is expected to increase at an average annual rate of 10.5 per cent, from R1.6 billion in 2019/20 to R2.2 billion in 2022/23.
Revenue is expected to increase at an average annual rate of 9.6 per cent, from R14.7 billion in 2019/20 to R19.3 billion in 2022/23. Revenue from the sale of raw water is expected to increase at an average annual rate of 11.1 per cent, from R12.2 billion in 2019/20 to R16.7 billion in 2022/23. Revenue derived from transfers from the department amounts to R7.2 billion over the medium term. These funds will be used to finance the Trans‐Caledon Tunnel Authority’s construction of raw water infrastructure.
Programmes/Objectives/Activities Table 41.33 Water Trading Entity expenditure trends and estimates by programme/objective/activity
Audited outcome Revisedestimate
Averagegrowth
rate(%)
Average:Expen‐diture/Total(%)
Medium‐term expenditure estimate
Averagegrowth
rate(%)
Average:Expen‐diture/Total(%)
R million 2016/17 2017/18 2018/19 2019/20 2016/17 ‐ 2019/20 2020/21 2021/22 2022/23 2019/20 ‐ 2022/23
Administration 2 727.5 698.1 815.8 902.3 ‐30.8% 9.3% 997.9 1 103.7 1 161.6 8.8% 7.1%Implementation of water resources management activities
528.7 528.6 805.1 890.4 19.0% 5.4% 984.8 1 089.2 1 146.3 8.8% 7.0%
Operations, maintenance and refurbishment of national water resources schemes
1 780.5 1 399.3 1 581.0 1 748.6 ‐0.6% 12.5% 1 934.0 2 139.0 2 248.6 8.7% 13.7%
Financing and investment in raw water infrastructure
7 980.8 7 640.6 6 675.3 6 883.1 ‐4.8% 56.0% 7 612.7 8 419.7 8 843.3 8.7% 53.8%
Bulk water supply to strategic users
2 175.4 1 855.4 2 038.4 2 254.5 1.2% 16.0% 2 493.5 2 757.8 2 898.3 8.7% 17.6%
Implementation of dam safety projects
236.0 29.8 95.7 105.8 ‐23.5% 0.8% 117.0 129.4 138.5 9.4% 0.8%
Total 15 428.8 12 151.8 12 011.3 12 784.7 ‐6.1% 100.0% 14 139.9 15 638.7 16 436.6 8.7% 100.0%
Statements of historical financial performance, cash flow and financial position Table 41.34 Water Trading Entity statements of historical financial performance, cash flow and financial position Statement of financial performance
Budget Audited outcome Budget
Audited outcome Budget
Audited outcome
Budget estimate
Revised estimate
Average:Outcome/
Budget(%)
R million 2016/17 2017/18 2018/19 2019/20 2016/17 ‐ 2019/20Revenue Non‐tax revenue 8 667.9 10 164.4 9 761.1 10 626.1 11 352.1 12 002.4 12 565.7 12 317.8 106.5%Sale of goods and services other than capital assets 8 606.5 9 458.3 9 646.2 9 785.3 11 252.0 11 032.2 12 455.6 12 207.7 101.2%of which: Sales by market establishment 8 606.5 9 458.3 9 646.2 9 785.3 11 252.0 11 032.2 12 455.6 12 207.7 101.2%Sales of water 8 370.8 9 036.8 9 431.1 9 557.8 10 987.9 10 876.8 12 163.6 11 915.7 101.1%Construction revenue 221.9 409.4 200.0 223.8 247.5 154.2 273.7 273.7 112.5%Lease revenue earned 13.8 12.2 15.1 3.7 16.6 1.2 18.3 18.3 55.4%Other non‐tax revenue 61.4 706.1 114.9 840.8 100.1 970.2 110.1 110.1 679.8%Transfers received 1 499.5 1 499.5 1 651.7 1 651.7 2 031.6 2 266.9 2 119.2 2 367.0 106.6%
Total revenue 10 167.5 11 664.0 11 412.7 12 277.7 13 383.7 14 269.3 14 684.8 14 684.8 106.5%
Expenses Current expenses 9 194.8 15 428.8 9 908.0 12 151.8 11 559.4 12 011.3 12 784.7 12 784.7 120.6%
Compensation of employees 908.5 924.4 972.1 1 191.1 1 218.4 1 218.4 1 292.8 1 292.8 105.3%Goods and services 5 763.2 8 043.3 6 256.3 4 382.3 2 996.5 3 448.4 3 699.6 3 699.6 104.6%Depreciation 2 071.0 1 833.4 2 199.4 1 922.2 2 314.1 2 314.1 2 455.2 2 455.2 94.3%Interest, dividends and rent on land 452.1 4 627.7 480.1 4 656.2 5 030.3 5 030.3 5 337.1 5 337.1 173.9%
Total expenses 9 194.8 15 428.8 9 908.0 12 151.8 11 559.4 12 011.3 12 784.7 12 784.7 120.6%
Surplus/(Deficit) 972.7 (3 764.8) 1 504.8 125.9 1 824.3 2 258.0 1 900.1 1 900.1

Vote 41: Water and Sanitation
29
Table 41.34 Water Trading Entity statements of historical financial performance, cash flow and financial position Statement of financial performance
Budget Audited outcome Budget
Audited outcome Budget
Audited outcome
Budget estimate
Revisedestimate
Average:Outcome/
Budget(%)
R million 2016/17 2017/18 2018/19 2019/20 2016/17 ‐ 2019/20Cash flow statement Cash flow from operating activities 6 411.1 3 456.6 6 366.6 4 187.3 7 472.1 4 859.3 9 003.3 9 003.3 73.5%Receipts Non‐tax receipts 8 150.6 8 246.6 8 435.3 9 317.5 8 909.8 11 418.5 9 816.9 9 816.9 109.9%
Sales of goods and services other than capital assets 7 813.7 8 246.6 8 165.8 9 317.5 8 909.8 11 418.5 9 816.9 9 816.9 111.8%Sales by market establishment 7 532.2 8 069.2 7 870.2 9 003.2 8 631.1 11 139.8 9 593.9 9 593.9 112.4%Other sales 281.6 177.4 295.6 314.3 278.7 278.7 222.9 222.9 92.1%Other tax receipts 336.9 – 269.5 – – – – – –
Transfers received 1 709.5 1 709.5 1 882.9 1 651.7 2 266.9 1 971.3 2 367.0 2 367.0 93.6%
Total receipts 9 860.1 9 956.1 10 318.2 10 969.2 11 176.7 13 389.8 12 183.9 12 183.9 106.8%
Payment Current payments 3 449.0 6 499.5 3 951.6 6 781.9 3 704.7 8 530.5 3 180.6 3 180.6 174.9%
Compensation of employees 908.5 822.6 972.1 1 232.6 1 344.0 1 482.9 1 292.8 1 292.8 106.9%Goods and services 2 460.3 3 550.6 2 895.2 2 540.4 2 360.7 4 172.9 1 887.9 1 887.9 126.5%Interest and rent on land 80.2 2 126.3 84.2 3 008.9 – 2 874.7 – – 4 872.4%
Total payments 3 449.0 6 499.5 3 951.6 6 781.9 3 704.7 8 530.5 3 180.6 3 180.6 174.9%
Net cash flow from investing activities (1 950.2) (1 553.4) (1 899.2) (500.6) (1 227.1) (172.6) (1 623.5) (1 623.5) 57.5%
Acquisition of property, plant, equipment and intangible assets
(1 899.2) (1 313.2) (1 899.2) (500.6) (1 227.1) (172.6) (1 623.5) (1 623.5) 54.3%
Acquisition of software and other intangible assets (51.0) (250.2) – – – – – – 490.7%Proceeds from the sale of property, plant, equipment and intangible assets
– 10.1 – – – – – – –
Net cash flow from financing activities (4 364.9) (4 132.5) (4 583.3) (2 911.8) (6 244.9) (4 726.2) (6 905.8) (6 905.8) 84.5%
Borrowing activities (4 345.6) (4 085.9) (4 562.9) (2 909.2) (6 223.4) (4 724.2) (6 883.1) (6 883.1) 84.5%Repayment of finance leases (19.3) (46.5) (20.4) (2.5) (21.5) (2.0) (22.7) (22.7) 88.0%
Net increase/(decrease) in cash and cash equivalents 95.9 (2 229.2) (115.9) 774.9 (0.0) (39.6) 473.9 473.9
Statement of financial position
Carrying value of assets 95 275.7 95 913.9 96 784.4 95 221.1 92 973.3 93 733.1 93 231.0 93 231.0 100.0%
Acquisition of assets (1 899.2) (1 313.2) (1 899.2) (500.6) (1 227.1) (172.6) (1 623.5) (1 623.5) 54.3%
Inventory 134.3 158.8 120.8 145.7 108.8 148.2 97.9 97.9 119.3%Receivables and prepayments 5 083.7 6 002.3 4 159.9 5 381.6 5 468.9 5 205.4 4 949.8 4 949.8 109.5%Cash and cash equivalents 138.9 0.2 538.9 0.3 – 0.2 – – 0.1%
Total assets 100 632.6 102 075.3 101 603.9 100 748.7 98 550.9 99 086.9 98 278.7 98 278.7 100.3%
Accumulated surplus/(deficit) 71 294.5 70 508.7 69 686.8 71 145.1 63 727.7 73 349.9 65 619.4 65 619.4 103.8%Capital and reserves 326.3 279.6 313.0 407.2 407.2 460.4 407.2 407.2 106.9%Borrowings 27 873.8 29 548.3 30 667.4 25 517.7 29 496.4 22 180.4 28 303.5 28 303.5 90.7%Finance lease 48.7 4.7 46.8 5.7 6.0 3.9 6.3 6.3 19.1%Trade and other payables 914.4 1 519.3 701.6 3 558.9 4 643.2 2 911.6 3 643.2 3 643.2 117.5%Benefits payable – – – 114.1 – 180.6 – – –Provisions 175.0 214.6 188.3 – 270.4 – 299.1 299.1 55.1%
Total equity and liabilities 100 632.6 102 075.3 101 603.9 100 748.7 98 550.9 99 086.9 98 278.7 98 278.7 100.3%
Statements of estimates of financial performance, cash flow and financial position Table 41.35 Water Trading Entity statements of estimates of financial performance, cash flow and financial position Statement of financial performance
Revisedestimate
Averagegrowth
rate(%)
Average:Expen‐diture/Total(%) Medium‐term estimate
Averagegrowth
rate(%)
Average:Expen‐diture/Total(%)
R million 2019/20 2016/17 ‐ 2019/20 2020/21 2021/22 2022/23 2019/20 ‐ 2022/23
Revenue Non‐tax revenue 12 317.8 6.6% 85.4% 13 732.3 15 198.3 16 928.6 11.2% 85.7%
Sale of goods and services other than capital assets 12 207.7 8.9% 80.3% 13 583.1 15 033.3 16 747.1 11.1% 84.8%Sales by market establishment 12 207.7 8.9% 80.3% 13 583.1 15 033.3 16 747.1 11.1% 84.8%Sales of water 11 915.7 9.7% 78.2% 13 261.1 14 677.2 16 145.0 10.7% 82.5%Construction revenue 273.7 ‐12.6% 2.1% 302.8 334.8 368.3 10.4% 1.9%Lease revenue earned 18.3 14.6% 0.1% 19.2 21.3 233.8 133.8% 0.4%Other non‐tax revenue 110.1 ‐46.2% 5.1% 149.2 165.0 181.5 18.1% 0.9%
Transfers received 2 367.0 16.4% 14.6% 2 447.4 2 377.5 2 420.1 0.7% 14.3%
Total revenue 14 684.8 8.0% 100.0% 16 179.7 17 575.8 19 348.7 9.6% 100.0%
Current expenses 12 784.7 ‐6.1% 100.0% 14 139.9 15 638.7 16 436.6 8.7% 100.0%
Compensation of employees 1 292.8 11.8% 9.0% 1 370.3 1 451.2 1 539.7 6.0% 9.6%Goods and services 3 699.6 ‐22.8% 36.5% 4 509.6 4 771.8 5 010.4 10.6% 30.5%Depreciation 2 455.2 10.2% 16.5% 2 602.6 2 756.2 2 894.0 5.6% 18.2%Interest, dividends and rent on land 5 337.1 4.9% 38.0% 5 657.4 6 659.6 6 992.5 9.4% 41.7%
Total expenses 12 784.7 ‐6.1% 100.0% 14 139.9 15 638.7 16 436.6 8.7% 100.0%
Surplus/(Deficit) 1 900.1 2 039.8 1 937.1 2 912.1

2020 Estimates of National Expenditure
30
Table 41.35 Water Trading Entity statements of estimates of financial performance, cash flow and financial position Statement of financial performance
Revisedestimate
Averagegrowth
rate(%)
Average:Expen‐diture/Total(%) Medium‐term estimate
Averagegrowth
rate(%)
Average:Expen‐diture/Total(%)
R million 2019/20 2016/17 ‐ 2019/20 2020/21 2021/22 2022/23 2019/20 ‐ 2022/23
Cash flow statement
Cash flow from operating activities 9 003.3 37.6% 250.2% 9 390.0 10 343.5 11 182.7 17.8% 246.8%Receipts Non‐tax receipts 9 816.9 6.0% 83.4% 10 573.1 11 710.6 12 881.6 9.5% 82.3%
Sales of goods and services other than capital assets 9 816.9 6.0% 83.4% 10 573.1 11 710.6 12 881.6 9.5% 82.3%Sales by market establishment 9 593.9 5.9% 81.3% 10 394.7 11 567.9 12 724.7 9.9% 81.0%Other sales 222.9 7.9% 2.1% 178.4 142.7 157.0 ‐11.0% 1.3%
Transfers received 2 367.0 11.5% 16.6% 2 447.4 2 377.5 2 420.1 0.7% 17.7%
Total receipts 12 183.9 7.0% 100.0% 13 020.5 14 088.0 15 301.7 7.9% 100.0%
Current payments 3 180.6 ‐21.2% 48.5% 3 630.5 3 744.5 4 119.0 9.0% 100.0%
Compensation of employees 1 292.8 16.3% 9.5% 1 370.3 1 451.2 1 596.3 7.3% 39.0%Goods and services 1 887.9 ‐19.0% 23.4% 2 260.2 2 293.3 2 522.7 10.1% 61.0%
Total payment 3 180.6 ‐21.2% 100.0% 3 630.5 3 744.5 4 119.0 9.0% 100.0%
Net cash flow from investing activities (1 623.5) 1.5% 100.0% (1 612.6) (1 993.8) (2 193.2) 10.5% 100.0%
Acquisition of property, plant, equipment and intangible assets (1 623.5) 7.3% 96.1% (1 612.6) (1 993.8) (2 193.2) 10.5% 100.0%
Net cash flow from financing activities (6 905.8) 18.7% 100.0% (7 636.6) (8 446.1) (9 290.8) 10.4% 100.0%
Borrowing Activities (6 883.1) 19.0% 99.6% (7 612.7) (8 419.7) (9 261.6) 10.4% 99.7%Repayment of finance leases (22.7) ‐21.3% 0.4% (23.9) (26.5) (29.1) 8.6% 0.3%
Net increase/(decrease) in cash and cash equivalents 473.9 ‐159.7% 100.0% 140.9 (96.5) (301.2) ‐186.0% 100.0%
Statement of financial position
Carrying value of assets 93 231.0 ‐0.9% 94.5% 93 646.7 91 487.9 91 487.9 ‐0.6% 95.5%
Acquisition of assets (1 623.5) 7.3% ‐0.9% (1 612.6) (1 993.8) (2 193.2) 10.5% ‐1.9%
Inventory 97.9 ‐14.9% 0.1% 102.8 101.8 101.8 1.3% 0.1%Receivables and prepayments 4 949.8 ‐6.2% 5.4% 4 482.4 3 165.8 3 165.8 ‐13.8% 4.1%Cash and cash equivalents – ‐100.0% 0.0% 84.4 663.6 663.6 – 0.4%
Total assets 98 278.7 ‐1.3% 100.0% 98 316.2 95 419.0 95 419.0 ‐1.0% 100.0%
Accumulated surplus/(deficit) 65 619.4 ‐2.4% 70.1% 67 715.3 60 686.2 60 686.2 ‐2.6% 65.7%Capital and reserves 407.2 13.4% 0.4% 407.2 407.2 407.2 ‐0.0% 0.4%Borrowings 28 303.5 ‐1.4% 26.4% 27 213.1 32 309.6 32 309.6 4.5% 31.0%Finance lease 6.3 9.7% 0.0% 6.6 7.0 7.0 3.8% 0.0%Trade and other payables 3 643.2 33.8% 2.9% 2 643.2 1 643.2 1 643.2 ‐23.3% 2.5%Provisions 299.1 11.7% 0.1% 330.8 365.8 365.8 6.9% 0.4%
Total equity and liabilities 98 278.7 ‐1.3% 100.0% 98 316.2 95 419.0 95 419.0 ‐1.0% 100.0%
Personnel information Table 41.36 Water Trading Entity personnel numbers and cost by salary level
Number of posts estimated for 31 March 2020 Number and cost1 of personnel posts filled/planned for on funded establishment Number
Number of
funded posts
Number of
posts on approved
establishment Actual Revised estimate Medium‐term expenditure estimate
Averagegrowth
rate(%)
Average:Salary
level/Total(%)
2018/19 2019/20 2020/21 2021/22 2022/23 2019/20 ‐ 2022/23
Water Trading Entity Number CostUnit cost Number Cost
Unitcost Number Cost
Unitcost Number Cost
Unitcost Number Cost
Unit cost
Salary level
3 358 3 358 4 208 1 218.4 0.3 3 358 1 292.8 0.4 3 358 1 370.3 0.4 3 358 1 451.2 0.4 3 358 1 539.7 0.5 6.0% 100.0%
1 – 6 1 993 1 993 2 543 411.1 0.2 1 993 436.2 0.2 1 993 461.9 0.2 1 993 489.2 0.2 1 993 519.0 0.3 6.0% 59.4%7 – 10 1 258 1 258 1 544 650.2 0.4 1 258 689.8 0.5 1 258 731.8 0.6 1 258 775.0 0.6 1 258 822.3 0.7 6.0% 37.5%11 – 12 102 102 116 148.1 1.3 102 157.1 1.5 102 166.4 1.6 102 176.2 1.7 102 187.0 1.8 6.0% 3.0%13 – 16 5 5 5 9.1 1.8 5 9.6 1.9 5 10.2 2.0 5 10.8 2.2 5 11.4 2.3 6.0% 0.1%
1. Rand million.
Breede‐Gouritz Catchment Management Agency
Selected performance indicators Table 41.37 Breede‐Gouritz Catchment Management Agency performance indicators by programme/objective/activity and related priority Indicator Programme/Objective/Activity MTSF priority Past Current Projections 2016/17 2017/18 2018/19 2019/20 2020/21 2021/22 2022/23
Percentage of water registrations finalised per year
Water projects Priority 1: Economic transformation and job creation
36%(288/800)
85%(680/800)
66%(528/800)
85% 85% 85% 85%
Entity overview
The Breede‐Gouritz Catchment Management Agency was established in terms of the National Water Act (1998). The agency plays a key role in protecting, using, developing, conserving, managing and controlling water resources in a cooperative manner within the boundaries of the Breede‐Gouritz catchment area. Over the medium term,

Vote 41: Water and Sanitation
31
the agency will continue providing water resources management activities to support economic development and social wellbeing. This will be achieved by conserving and maintaining ecosystems, promoting tourism and encouraging residential developments within its water management area.
Expenditure is expected to increase at an average annual rate of 9.5 per cent, from R67.5 million in 2019/20 to R88.6 million in 2022/23. Revenue is expected to increase at an average annual rate of 9.5 per cent, from R68.9 million in 2019/20 to R88.6 million in 2022/23. The agency derives most of its revenue from the water resource management charge, which is collected by the department and transferred to the agency. Transfers from the department account for 54.3 per cent (R138 million) of total revenue over the MTEF period. Remaining revenue is generated from fees for water use licence applications.
Programmes/Objectives/Activities Table 41.38 Breede‐Gouritz Catchment Management Agency expenditure trends and estimates by programme/objective/activity
Audited outcome Revisedestimate
Averagegrowth
rate(%)
Average:Expen‐diture/Total(%)
Medium‐term expenditure estimate
Averagegrowth
rate(%)
Average:Expen‐diture/Total(%)
R million 2016/17 2017/18 2018/19 2019/20 2016/17 ‐ 2019/20 2020/21 2021/22 2022/23 2019/20 ‐ 2022/23
Administration 23.6 23.7 27.3 29.6 7.8% 43.5% 34.9 36.5 38.2 8.9% 43.3%Water projects 22.5 24.8 29.9 28.2 7.8% 43.9% 37.0 38.7 40.5 12.8% 44.7%Public participation 7.8 5.8 7.1 9.7 7.8% 12.6% 9.1 9.5 9.9 0.8% 12.0%
Total 53.9 54.4 64.3 67.5 7.8% 100.0% 81.0 84.7 88.6 9.5% 100.0%
Statements of historical financial performance, cash flow and financial position Table 41.39 Breede‐Gouritz Catchment Management Agency statements of historical financial performance Statement of financial performance
BudgetAudited outcome Budget
Audited outcome Budget
Audited outcome
Budget estimate
Revisedestimate
Average:Outcome/
Budget(%)
R million 2016/17 2017/18 2018/19 2019/20 2016/17 ‐ 2019/20Revenue Non‐tax revenue 0.5 0.6 0.5 16.5 21.5 50.0 24.5 32.1 211.1%Sale of goods and services other than capital assets – – – 10.1 21.0 41.5 24.0 30.7 182.9%of which: Other sales – – – 10.1 21.0 41.5 24.0 30.7 182.9%Other non‐tax revenue 0.5 0.6 0.5 6.3 0.5 8.6 0.5 1.4 846.1%
Transfers received 45.3 47.9 82.4 60.0 44.3 65.8 43.0 36.8 97.9%
Total revenue 45.8 48.5 82.9 76.5 65.8 115.8 67.5 68.9 118.2%
Expenses Current expenses 45.8 53.9 82.7 54.4 65.8 64.3 67.5 67.5 91.7%Compensation of employees 22.9 29.3 31.4 31.7 35.8 39.9 36.7 40.2 111.3%Goods and services 22.0 22.6 50.2 20.5 30.0 23.2 28.1 26.1 70.8%Depreciation 0.9 2.0 1.1 2.2 – 1.2 2.7 1.2 140.4%
Total expenses 45.8 53.9 82.7 54.4 65.8 64.3 67.5 67.5 91.7%
Surplus/(Deficit) – (5.4) – 22.1 – 51.5 – 1.4
Statements of estimates of financial performance, cash flow and financial position Table 41.40 Breede‐Gouritz Catchment Management Agency statements of estimates financial performance Statement of financial performance
Revisedestimate
Averagegrowth
rate(%)
Average:Expen‐diture/Total(%) Medium‐term estimate
Averagegrowth
rate(%)
Average:Expen‐diture/Total(%)
R million 2019/20 2016/17 ‐ 2019/20 2020/21 2021/22 2022/23 2019/20 ‐ 2022/23 Revenue Non‐tax revenue 32.1 269.0% 28.1% 36.8 38.5 40.2 7.9% 45.7%Sale of goods and services other than capital assets 30.7 – 23.4% 36.8 38.5 40.2 9.5% 45.2%Other sales 30.7 – 23.4% 36.8 38.5 40.2 9.5% 45.2%Other non‐tax revenue 1.4 29.9% 4.8% – – – ‐100.0% 0.5%
Transfers received 36.8 ‐8.4% 71.9% 44.2 46.2 48.4 9.5% 54.3%Total revenue 68.9 12.4% 100.0% 81.0 84.7 88.6 8.8% 100.0%
Current expenses 67.5 7.8% 100.0% 81.0 84.7 88.6 9.5% 100.0%
Compensation of employees 40.2 11.1% 58.6% 47.8 50.0 52.3 9.2% 59.1%Goods and services 26.1 4.9% 38.6% 31.5 33.0 34.5 9.7% 38.9%Depreciation 1.2 ‐15.4% 2.9% 1.7 1.8 1.8 14.7% 2.0%
Total expenses 67.5 7.8% 100.0% 81.0 84.7 88.6 9.5% 100.0%
Surplus/(Deficit) 1.4 – – –

2020 Estimates of National Expenditure
32
Personnel information Table 41.41 Breede‐Gouritz Catchment Management Agency personnel numbers and cost by salary level
Number of posts estimated for 31 March 2020 Number and cost1 of personnel posts filled/planned for on funded establishment Number
Number of
funded posts
Number of
posts on approved
establishment Actual Revised estimate Medium‐term expenditure estimate
Averagegrowth
rate(%)
Average:Salary
level/Total(%)
2018/19 2019/20 2020/21 2021/22 2022/23 2019/20 ‐ 2022/23
Breede‐Gouritz Catchment Management Agency Number Cost
Unit cost Number Cost
Unitcost Number Cost
Unitcost Number Cost
Unitcost Number Cost
Unit cost
Salary level
52 52 52 39.9 0.8 52 40.2 0.8 52 47.8 0.9 52 50.0 1.0 52 52.3 1.0 9.2% 100.0%
7 – 10 38 38 38 23.7 0.6 38 23.9 0.6 38 28.4 0.7 38 29.7 0.8 38 31.1 0.8 9.2% 73.1%11 – 12 4 4 4 3.6 0.9 4 3.6 0.9 4 4.3 1.1 4 4.5 1.1 4 4.7 1.2 9.2% 7.7%13 – 16 10 10 10 12.6 1.3 10 12.7 1.3 10 15.1 1.5 10 15.8 1.6 10 16.5 1.7 9.2% 19.2%
1. Rand million.
Inkomati‐Usuthu Catchment Management Agency
Selected performance indicators Table 41.42 Inkomati‐Usuthu Catchment Management Agency performance indicators by programme/objective/activity and related priority Indicator Programme/Objective/Activity MTSF priority Past Current Projections 2016/17 2017/18 2018/19 2019/20 2020/21 2021/22 2022/23
Number of quarterly routine maintenance performed on the installed river flow data loggers
Promote and pursue an international developmental agenda
Priority 1: Economic transformation and job creation
112 112 112 140 140 140 114
Hydrology reports produced to update the Inkomati hydrology
Promote and pursue an international developmental agenda
0 23 24 24 24 24 24
Number of river cleaning exercises conducted to support the Adopt a River campaign with duly submitted reports
Promote knowledge generation and distribution
45 50 32 32 32 32 32
Percentage of water users effectively validated per year for the Usuthu and Inkomati catchment areas
Ensure the effective, efficient and sustainable management of water resources
100%(1 372)
100%(34)
69%(854/1 237)
100% –1 –1 –1
Percentage of water quality‐related authorisations and recommendations forwarded to the department
Ensure the effective, efficient and sustainable management of water resources
–2 100%(34)
80%(39/49)
100% 100% 100% 100%
1. Indicator discontinued. 2. No historical data available.
Entity overview
The Inkomati‐Usuthu Catchment Management Agency was established in 2004 in terms of the National Water Act (1998). The agency plays a key role in the use, protection and development of water resources in the Inkomati‐Usuthu water management area. The agency also aims to ensure that water is used and managed to support equitable and sustainable socioeconomic transformation and development. Accordingly, the agency’s focus over the medium term remains meeting water demand for the domestic, agriculture and commercial sectors by processing water use licence applications and ensuring that the area’s quality of water resources remains high.
Expenditure is expected to increase at an average annual rate of 10.4 per cent, from R130.4 million in 2019/20 to R175.6 million in 2022/23. Revenue is expected to increase at an average annual rate of 10.4 per cent, from R130.4 million in 2019/20 to R175.6 million in 2022/23. The agency derives most of its revenue from the water resource management charge, which is collected by the department and transferred to the agency. Transfers from the department account for 68.7 per cent (R342 million) of the agency’s total revenue over the MTEF period. Remaining revenue is generated from fees for water use licence applications.

Vote 41: Water and Sanitation
33
Programmes/Objectives/Activities Table 41.43 Inkomati‐Usuthu Catchment Management Agency expenditure trends and estimates by programme/objective/activity
Audited outcome Revisedestimate
Averagegrowth
rate(%)
Average:Expen‐diture/Total(%)
Medium‐term expenditure estimate
Averagegrowth
rate(%)
Average:Expen‐diture/Total(%)
R million 2016/17 2017/18 2018/19 2019/20 2016/17 ‐ 2019/20 2020/21 2021/22 2022/23 2019/20 ‐ 2022/23
Administration 34.3 46.5 54.3 56.3 18.0% 46.9% 75.1 79.4 84.0 14.3% 46.7%Ensure the effective, efficient and sustainable management of water resources
20.2 20.7 20.9 35.5 20.6% 23.7% 33.7 35.7 37.8 2.1% 22.9%
Ensure collaborative and coordinated integrated water resources management for wise socioeconomic development
5.3 9.0 11.5 11.8 31.0% 9.0% 14.1 14.9 15.8 10.2% 9.0%
Promote and pursue an international developmental agenda
7.9 8.4 10.6 16.3 27.4% 10.4% 17.0 18.0 19.0 5.4% 11.3%
Promote knowledge generation and distribution
8.9 9.3 11.3 10.5 5.7% 10.0% 16.9 17.9 19.0 21.8% 10.1%
Total 76.5 93.9 108.6 130.4 19.5% 100.0% 156.8 165.9 175.6 10.4% 100.0%
Statements of historical financial performance, cash flow and financial position Table 41.44 Inkomati‐Usuthu Catchment Management Agency statements of historical financial performance Statement of financial performance
Budget Auditedoutcome Budget
Auditedoutcome Budget
Audited outcome
Budget estimate
Revisedestimate
Average:Outcome/
Budget(%)
R million 2016/17 2017/18 2018/19 2019/20 2016/17 ‐ 2019/20Revenue Non‐tax revenue 43.2 45.2 71.3 20.4 35.3 38.9 40.3 40.3 76.1%Sale of goods and services other than capital assets 43.2 43.2 71.3 17.5 35.3 35.5 40.3 40.3 71.8%of which: Administrative fees 43.2 43.2 71.3 17.5 35.3 35.5 40.3 40.3 71.8%Other non‐tax revenue – 2.0 – 2.9 – 3.4 – – –
Transfers received 36.4 37.0 55.1 74.2 88.2 73.0 90.2 90.2 101.6%
Total revenue 79.6 82.1 126.4 94.6 123.5 111.9 130.4 130.4 91.1%
Expenses Current expenses 79.6 76.5 126.4 93.9 123.5 108.6 130.4 130.4 89.0%
Compensation of employees 47.7 46.5 59.6 60.0 68.5 62.1 83.1 83.1 97.2%Goods and services 31.9 30.0 66.9 33.9 55.0 46.4 47.3 47.3 78.4%Interest, dividends and rent on land – – – – – 0.0 – – –
Total expenses 79.6 76.5 126.4 93.9 123.5 108.6 130.4 130.4 89.0%
Surplus/(Deficit) – 5.6 – – – 3.3 – –
Statements of estimates of financial performance, cash flow and financial position Table 41.45 Inkomati‐Usuthu Catchment Management Agency statements of estimates financial performance Statement of financial performance
Revisedestimate
Averagegrowth
rate(%)
Average:Expen‐diture/Total(%) Medium‐term estimate
Averagegrowth
rate(%)
Average:Expen‐diture/Total(%)
R million 2019/20 2016/17 ‐ 2019/20 2020/21 2021/22 2022/23 2019/20 ‐ 2022/23 Revenue Non‐tax revenue 40.3 ‐3.8% 35.5% 50.8 50.7 54.5 10.6% 31.2%Sale of goods and services other than capital assets 40.3 ‐2.3% 33.4% 47.2 50.7 54.5 10.6% 30.6%Administrative fees 40.3 ‐2.3% 33.4% 47.2 50.7 54.5 10.6% 30.6%Other non‐tax revenue – ‐100.0% 2.1% 3.6 – – – 0.6%
Transfers received 90.2 34.6% 64.5% 106.0 115.2 121.1 10.3% 68.8%Total revenue 130.4 16.7% 100.0% 156.8 165.9 175.6 10.4% 100.0%
Current expenses 130.4 19.5% 100.0% 156.8 165.9 175.6 10.4% 100.0%
Compensation of employees 83.1 21.4% 61.4% 105.7 112.1 118.8 12.7% 66.6%Goods and services 47.3 16.4% 38.6% 51.0 53.8 56.8 6.3% 33.4%
Total expenses 130.4 19.5% 100.0% 156.8 165.9 175.6 10.4% 100.0%
Surplus/(Deficit) – – – –

2020 Estimates of National Expenditure
34
Personnel information Table 41.46 Inkomati‐Usuthu Catchment Management Agency personnel numbers and cost by salary level
Number of posts estimated for 31 March 2020 Number and cost1 of personnel posts filled/planned for on funded establishment Number
Number of
funded posts
Number of
posts on approved
establishment Actual Revised estimate Medium‐term expenditure estimate
Averagegrowth
rate(%)
Average:Salary
level/Total(%)
2018/19 2019/20 2020/21 2021/22 2022/23 2019/20 ‐ 2022/23
Inkomati‐Usuthu Catchment Management Agency Number Cost
Unit cost Number Cost
Unitcost Number Cost
Unitcost Number Cost
Unitcost Number Cost
Unit cost
Salary level
111 111 106 62.1 0.6 111 83.1 0.7 136 105.7 0.8 135 112.1 0.8 135 118.8 0.9 12.7% 100.0%
1 – 6 14 14 13 1.8 0.1 14 1.7 0.1 18 2.4 0.1 18 2.5 0.1 18 2.7 0.1 15.9% 13.1%7 – 10 38 38 33 14.2 0.4 38 18.3 0.5 50 26.0 0.5 50 27.5 0.6 50 29.3 0.6 17.0% 36.3%11 – 12 36 36 36 22.9 0.6 36 32.3 0.9 42 40.2 1.0 42 42.4 1.0 42 45.2 1.1 11.9% 31.4%13 – 16 23 23 24 23.1 1.0 23 30.8 1.3 26 37.2 1.4 25 39.6 1.6 25 41.6 1.7 10.5% 19.2%
1. Rand million.
Water Research Commission
Selected performance indicators Table 41.47 Water Research Commission performance indicators by programme/objective/activity and related priority Indicator Programme/Objective/Activity MTSF priority Past Current Projections 2016/17 2017/18 2018/19 2019/20 2020/21 2021/22 2022/23
Number of research projects completed per year
Research and development
Entity mandate
87 106 104 80 85 85 85
Total amount of leverage income per year
Research and development R 82.8m R 63.1m R42.3m R50.8m R53.4m R56.1m R58.8m
Number of students financially and technically supported (including historically disadvantaged students) per year
Research and development 495 452 411 250 300 200 310
Entity overview
The Water Research Commission is a schedule 3A public entity established in terms of the Water Research Act (1971). The commission is mandated to conduct research in the water sector by: determining needs and priorities for research; promoting coordination, cooperation and communication in the area of water research development; stimulating and funding water research; promoting the effective transfer of information and technology; and enhancing knowledge and building capacity in the water sector.
Over the medium term, the commission will continue to enhance knowledge within the water sector by supporting 810 students in research‐related fields. The commission also expects to expand and empower the science community through the development of 85 researchers per year over the medium term.
Expenditure is expected to increase at an average annual rate of 3.8 per cent, from R325.2 million in 2019/20 to R364.2 million in 2022/23. Spending on research and development, and innovation and impact account for 53.5 per cent (R533.1 million) of the commission’s total expenditure over the MTEF period. Revenue is expected to increase at an average annual rate of 3.8 per cent, from R325.2 million in 2019/20 to R364.2 million in 2022/23. The commission’s revenue is mainly generated from the water research levy, which is expected to amount to R1 billion over the MTEF period.
Programmes/Objectives/Activities Table 41.48 Water Research Commission expenditure trends and estimates by programme/objective/activity
Audited outcome Revisedestimate
Averagegrowth
rate(%)
Average:Expen‐diture/Total(%)
Medium‐term expenditure estimate
Averagegrowth
rate(%)
Average:Expen‐diture/Total(%)
R million 2016/17 2017/18 2018/19 2019/20 2016/17 ‐ 2019/20 2020/21 2021/22 2022/23 2019/20 ‐ 2022/23 Administration 89.7 104.8 113.4 127.9 12.6% 35.9% 154.9 169.3 186.8 13.4% 46.5%Research and development 203.1 161.7 138.4 129.7 ‐13.9% 52.2% 121.1 95.4 90.0 ‐11.5% 32.1%Innovation and impact 16.3 31.9 31.6 67.5 60.5% 12.0% 56.0 83.2 87.4 9.0% 21.4%
Total 309.1 298.5 283.4 325.2 1.7% 100.0% 332.0 348.0 364.2 3.8% 100.0%

Vote 41: Water and Sanitation
35
Statements of historical financial performance, cash flow and financial position Table 41.49 Water Research Commission statements of historical financial performance Statement of financial performance
BudgetAuditedoutcome Budget
Auditedoutcome Budget
Audited outcome
Budget estimate
Revisedestimate
Average:Outcome/
Budget(%)
R million 2016/17 2017/18 2018/19 2019/20 2016/17 ‐ 2019/20Revenue Non‐tax revenue 310.5 303.0 306.6 292.8 296.8 284.3 318.0 325.2 97.8%Sale of goods and services other than capital assets 302.3 294.0 299.3 286.4 291.3 279.3 312.9 320.0 97.8%of which: Sales by market establishment 282.3 294.0 299.3 286.4 291.3 279.3 312.9 320.0 99.5%Water research levies 209.4 207.3 218.8 224.7 239.7 236.6 261.9 259.7 99.8%Leverage income 71.7 83.5 74.0 61.1 45.5 42.3 50.9 50.9 98.2%Miscellaneous income 1.2 3.2 6.5 0.6 6.1 0.4 0.1 9.4 97.7%Other sales 20.0 – – – – – – – –Other non‐tax revenue 8.2 9.0 7.3 6.4 5.5 5.0 5.2 5.2 97.8%
Total revenue 310.5 303.0 306.6 292.8 296.8 284.3 318.0 325.2 97.8%
Expenses Current expenses 310.5 309.1 306.6 298.5 296.8 283.4 318.0 325.2 98.7%
Compensation of employees 63.3 58.6 72.1 69.8 87.1 80.8 102.0 93.2 93.2%Goods and services 239.4 235.2 225.5 222.9 200.0 197.3 205.8 231.9 101.9%Depreciation – 4.1 – 5.1 – 4.7 – – –Interest, dividends and rent on land 7.8 11.1 9.0 0.7 9.6 0.5 10.2 – 33.8%
Total expenses 310.5 309.1 306.6 298.5 296.8 283.4 318.0 325.2 98.7%
Surplus/(Deficit) – (6.1) – (5.7) – – – –
Statements of estimates of financial performance, cash flow and financial position Table 41.50 Water Research Commission statements of estimates financial performance Statement of financial performance
Revisedestimate
Averagegrowth
rate(%)
Average:Expen‐diture/Total(%) Medium‐term estimate
Averagegrowth
rate(%)
Average:Expen‐diture/Total(%)
R million 2019/20 2016/17 ‐ 2019/20 2020/21 2021/22 2022/23 2019/20 ‐ 2022/23
Revenue Non‐tax revenue 325.2 2.4% 100.0% 332.0 348.0 364.2 3.8% 100.0%
Sale of goods and services other than capital assets 320.0 2.9% 97.9% 327.3 343.8 360.4 4.0% 98.7%Sales by market establishment 320.0 2.9% 97.9% 327.3 343.8 360.4 4.0% 98.7%Water research levies 259.7 7.8% 77.1% 273.7 287.5 301.4 5.1% 81.9%Leverage income 50.9 ‐15.2% 19.7% 53.5 56.1 58.8 5.0% 16.0%Miscellaneous income 9.4 43.4% 1.1% 0.1 0.1 0.2 ‐74.8% 0.8%Other non‐tax revenue 5.2 ‐16.8% 2.1% 4.7 4.2 3.8 ‐10.0% 1.3%Total revenue 325.2 2.4% 100.0% 332.0 348.0 364.2 3.8% 100.0%
Current expenses 325.2 1.7% 100.0% 332.0 348.0 364.2 3.8% 100.0%
Compensation of employees 93.2 16.7% 24.9% 114.3 127.5 141.5 14.9% 34.6%Goods and services 231.9 ‐0.5% 72.9% 217.7 220.5 222.7 ‐1.3% 65.4%
Total expenses 325.2 1.7% 100.0% 332.0 348.0 364.2 3.8% 100.0%
Surplus/(Deficit) – – – –
Personnel information Table 41.51 Water Research Commission personnel numbers and cost by salary level
Number of posts estimated for 31 March 2020 Number and cost1 of personnel posts filled/planned for on funded establishment Number
Number of
funded posts
Number of
posts on approved
establishment Actual Revised estimate Medium‐term expenditure estimate
Averagegrowth
rate(%)
Average:Salary
level/Total(%)
2018/19 2019/20 2020/21 2021/22 2022/23 2019/20 ‐ 2022/23
Water Research Commission Number Cost Unit cost Number Cost
Unitcost Number Cost
Unitcost Number Cost
Unit cost Number Cost
Unitcost
Salary level
101 101 101 80.8 0.8 101 93.2 0.9 110 114.3 1.0 109 127.5 1.2 109 141.5 1.3 14.9% 100.0%
1 – 6 21 21 17 2.0 0.1 21 3.1 0.1 23 8.8 0.4 23 13.5 0.6 23 18.3 0.8 81.2% 21.0%7 – 10 34 34 34 16.1 0.5 34 20.1 0.6 36 24.5 0.7 35 26.4 0.8 35 28.5 0.8 12.3% 32.7%11 – 12 16 16 17 11.4 0.7 16 15.6 1.0 19 19.5 1.0 19 21.0 1.1 19 22.6 1.2 13.0% 17.0%13 – 16 24 24 27 34.5 1.3 24 36.6 1.5 26 42.2 1.6 26 45.8 1.8 26 49.6 1.9 10.7% 23.8%17 – 22 6 6 6 16.9 2.8 6 17.8 3.0 6 19.2 3.2 6 20.8 3.5 6 22.6 3.8 8.2% 5.6%
1. Rand million.

ESTIMATES OF NATIONAL EXPENDITURE
BUDGET2020
Related Documents


