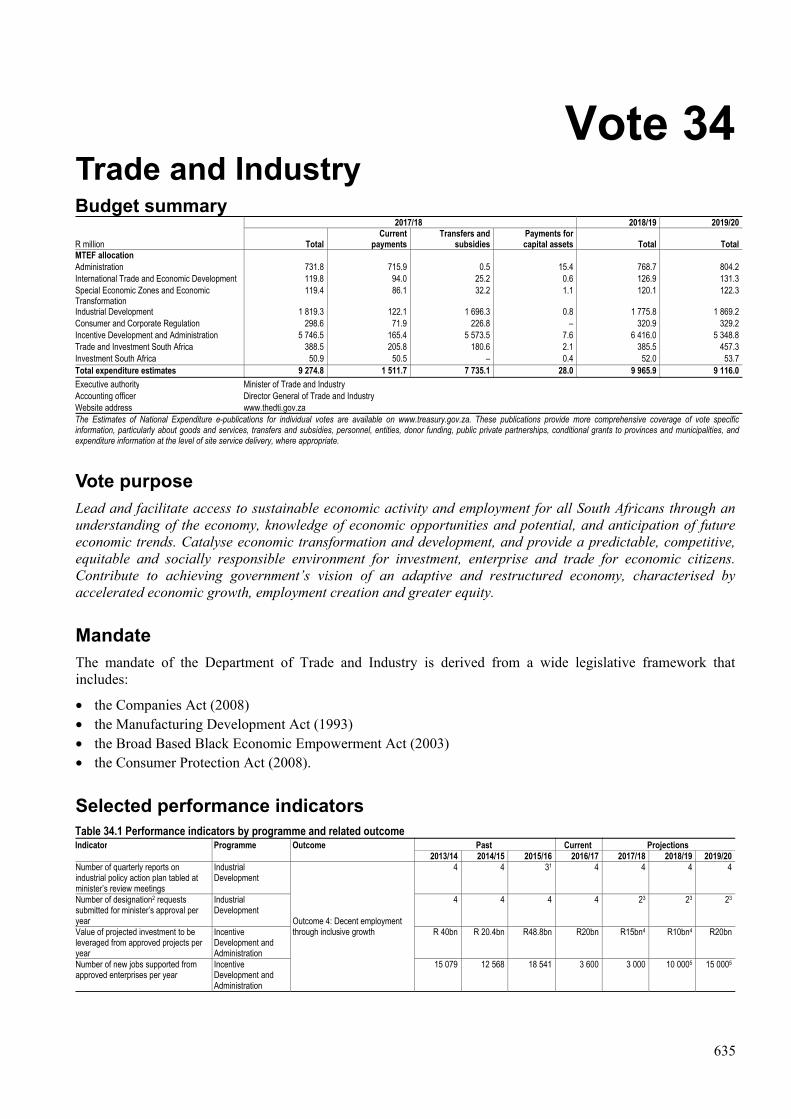
635 Vote 34 Trade and Industry Budget summary 2017/18 2018/19 2019/20 R million Total Current payments Transfers and subsidies Payments for capital assets Total Total MTEF allocation Administration 731.8 715.9 0.5 15.4 768.7 804.2 International Trade and Economic Development 119.8 94.0 25.2 0.6 126.9 131.3 Special Economic Zones and Economic Transformation 119.4 86.1 32.2 1.1 120.1 122.3 Industrial Development 1 819.3 122.1 1 696.3 0.8 1 775.8 1 869.2 Consumer and Corporate Regulation 298.6 71.9 226.8 – 320.9 329.2 Incentive Development and Administration 5 746.5 165.4 5 573.5 7.6 6 416.0 5 348.8 Trade and Investment South Africa 388.5 205.8 180.6 2.1 385.5 457.3 Investment South Africa 50.9 50.5 – 0.4 52.0 53.7 Total expenditure estimates 9 274.8 1 511.7 7 735.1 28.0 9 965.9 9 116.0 Executive authority Minister of Trade and Industry Accounting officer Director General of Trade and Industry Website address www.thedti.gov.za The Estimates of National Expenditure e-publications for individual votes are available on www.treasury.gov.za. These publications provide more comprehensive coverage of vote specific information, particularly about goods and services, transfers and subsidies, personnel, entities, donor funding, public private partnerships, conditional grants to provinces and municipalities, and expenditure information at the level of site service delivery, where appropriate. Vote purpose Lead and facilitate access to sustainable economic activity and employment for all South Africans through an understanding of the economy, knowledge of economic opportunities and potential, and anticipation of future economic trends. Catalyse economic transformation and development, and provide a predictable, competitive, equitable and socially responsible environment for investment, enterprise and trade for economic citizens. Contribute to achieving government’s vision of an adaptive and restructured economy, characterised by accelerated economic growth, employment creation and greater equity. Mandate The mandate of the Department of Trade and Industry is derived from a wide legislative framework that includes: • the Companies Act (2008) • the Manufacturing Development Act (1993) • the Broad Based Black Economic Empowerment Act (2003) • the Consumer Protection Act (2008). Selected performance indicators Table 34.1 Performance indicators by programme and related outcome Indicator Programme Outcome Past Current Projections 2013/14 2014/15 2015/16 2016/17 2017/18 2018/19 2019/20 Number of quarterly reports on industrial policy action plan tabled at minister’s review meetings Industrial Development Outcome 4: Decent employment through inclusive growth 4 4 3 1 4 4 4 4 Number of designation 2 requests submitted for minister’s approval per year Industrial Development 4 4 4 4 2 3 2 3 2 3 Value of projected investment to be leveraged from approved projects per year Incentive Development and Administration R 40bn R 20.4bn R48.8bn R20bn R15bn 4 R10bn 4 R20bn Number of new jobs supported from approved enterprises per year Incentive Development and Administration 15 079 12 568 18 541 3 600 3 000 10 000 5 15 000 5

Welcome message from author
This document is posted to help you gain knowledge. Please leave a comment to let me know what you think about it! Share it to your friends and learn new things together.
Transcript
635
Vote 34 Trade and Industry Budget summary
2017/18 2018/19 2019/20
R million Total Current
payments Transfers and
subsidies Payments for capital assets Total Total
MTEF allocation Administration 731.8 715.9 0.5 15.4 768.7 804.2International Trade and Economic Development 119.8 94.0 25.2 0.6 126.9 131.3Special Economic Zones and Economic Transformation
119.4 86.1 32.2 1.1 120.1 122.3
Industrial Development 1 819.3 122.1 1 696.3 0.8 1 775.8 1 869.2Consumer and Corporate Regulation 298.6 71.9 226.8 – 320.9 329.2Incentive Development and Administration 5 746.5 165.4 5 573.5 7.6 6 416.0 5 348.8Trade and Investment South Africa 388.5 205.8 180.6 2.1 385.5 457.3Investment South Africa 50.9 50.5 – 0.4 52.0 53.7Total expenditure estimates 9 274.8 1 511.7 7 735.1 28.0 9 965.9 9 116.0Executive authority Minister of Trade and Industry Accounting officer Director General of Trade and Industry Website address www.thedti.gov.za The Estimates of National Expenditure e-publications for individual votes are available on www.treasury.gov.za. These publications provide more comprehensive coverage of vote specific information, particularly about goods and services, transfers and subsidies, personnel, entities, donor funding, public private partnerships, conditional grants to provinces and municipalities, and expenditure information at the level of site service delivery, where appropriate.
Vote purpose Lead and facilitate access to sustainable economic activity and employment for all South Africans through an understanding of the economy, knowledge of economic opportunities and potential, and anticipation of future economic trends. Catalyse economic transformation and development, and provide a predictable, competitive, equitable and socially responsible environment for investment, enterprise and trade for economic citizens. Contribute to achieving government’s vision of an adaptive and restructured economy, characterised by accelerated economic growth, employment creation and greater equity.
Mandate The mandate of the Department of Trade and Industry is derived from a wide legislative framework that includes:
• the Companies Act (2008) • the Manufacturing Development Act (1993) • the Broad Based Black Economic Empowerment Act (2003) • the Consumer Protection Act (2008).
Selected performance indicators Table 34.1 Performance indicators by programme and related outcomeIndicator Programme Outcome Past Current Projections
2013/14 2014/15 2015/16 2016/17 2017/18 2018/19 2019/20 Number of quarterly reports on industrial policy action plan tabled at minister’s review meetings
Industrial Development
Outcome 4: Decent employment through inclusive growth
4 4 31 4 4 4 4
Number of designation2 requests submitted for minister’s approval per year
Industrial Development
4 4 4 4 23 23 23
Value of projected investment to be leveraged from approved projects per year
Incentive Development and Administration
R 40bn R 20.4bn R48.8bn R20bn R15bn4 R10bn4 R20bn
Number of new jobs supported from approved enterprises per year
Incentive Development and Administration
15 079 12 568 18 541 3 600 3 000 10 0005 15 0005
2017 Estimates of National Expenditure
636
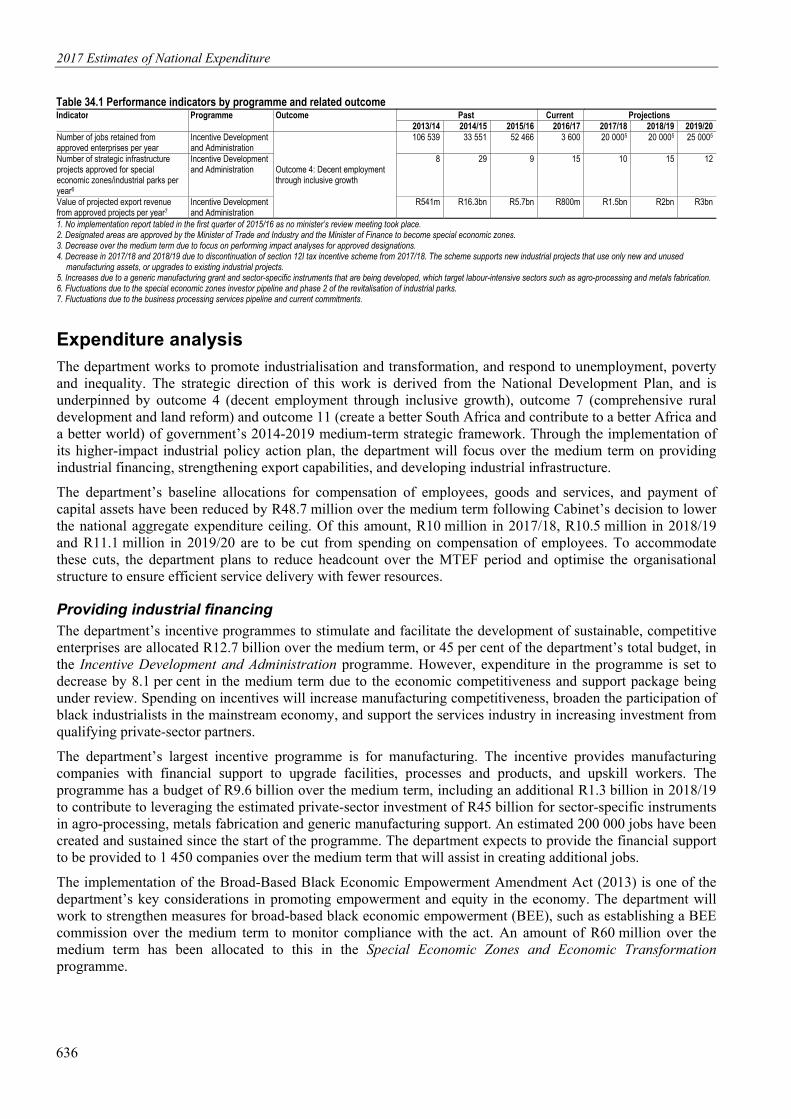
Table 34.1 Performance indicators by programme and related outcomeIndicator Programme Outcome Past Current Projections
2013/14 2014/15 2015/16 2016/17 2017/18 2018/19 2019/20 Number of jobs retained from approved enterprises per year
Incentive Development and Administration
Outcome 4: Decent employment through inclusive growth
106 539 33 551 52 466 3 600 20 0005 20 0005 25 0005
Number of strategic infrastructure projects approved for special economic zones/industrial parks per year6
Incentive Development and Administration
8 29 9 15 10 15 12
Value of projected export revenue from approved projects per year7
Incentive Development and Administration
R541m R16.3bn R5.7bn R800m R1.5bn R2bn R3bn
1. No implementation report tabled in the first quarter of 2015/16 as no minister’s review meeting took place. 2. Designated areas are approved by the Minister of Trade and Industry and the Minister of Finance to become special economic zones. 3. Decrease over the medium term due to focus on performing impact analyses for approved designations. 4. Decrease in 2017/18 and 2018/19 due to discontinuation of section 12I tax incentive scheme from 2017/18. The scheme supports new industrial projects that use only new and unused
manufacturing assets, or upgrades to existing industrial projects. 5. Increases due to a generic manufacturing grant and sector-specific instruments that are being developed, which target labour-intensive sectors such as agro-processing and metals fabrication. 6. Fluctuations due to the special economic zones investor pipeline and phase 2 of the revitalisation of industrial parks. 7. Fluctuations due to the business processing services pipeline and current commitments.
Expenditure analysis The department works to promote industrialisation and transformation, and respond to unemployment, poverty and inequality. The strategic direction of this work is derived from the National Development Plan, and is underpinned by outcome 4 (decent employment through inclusive growth), outcome 7 (comprehensive rural development and land reform) and outcome 11 (create a better South Africa and contribute to a better Africa and a better world) of government’s 2014-2019 medium-term strategic framework. Through the implementation of its higher-impact industrial policy action plan, the department will focus over the medium term on providing industrial financing, strengthening export capabilities, and developing industrial infrastructure.
The department’s baseline allocations for compensation of employees, goods and services, and payment of capital assets have been reduced by R48.7 million over the medium term following Cabinet’s decision to lower the national aggregate expenditure ceiling. Of this amount, R10 million in 2017/18, R10.5 million in 2018/19 and R11.1 million in 2019/20 are to be cut from spending on compensation of employees. To accommodate these cuts, the department plans to reduce headcount over the MTEF period and optimise the organisational structure to ensure efficient service delivery with fewer resources.
Providing industrial financing The department’s incentive programmes to stimulate and facilitate the development of sustainable, competitive enterprises are allocated R12.7 billion over the medium term, or 45 per cent of the department’s total budget, in the Incentive Development and Administration programme. However, expenditure in the programme is set to decrease by 8.1 per cent in the medium term due to the economic competitiveness and support package being under review. Spending on incentives will increase manufacturing competitiveness, broaden the participation of black industrialists in the mainstream economy, and support the services industry in increasing investment from qualifying private-sector partners.
The department’s largest incentive programme is for manufacturing. The incentive provides manufacturing companies with financial support to upgrade facilities, processes and products, and upskill workers. The programme has a budget of R9.6 billion over the medium term, including an additional R1.3 billion in 2018/19 to contribute to leveraging the estimated private-sector investment of R45 billion for sector-specific instruments in agro-processing, metals fabrication and generic manufacturing support. An estimated 200 000 jobs have been created and sustained since the start of the programme. The department expects to provide the financial support to be provided to 1 450 companies over the medium term that will assist in creating additional jobs.
The implementation of the Broad-Based Black Economic Empowerment Amendment Act (2013) is one of the department’s key considerations in promoting empowerment and equity in the economy. The department will work to strengthen measures for broad-based black economic empowerment (BEE), such as establishing a BEE commission over the medium term to monitor compliance with the act. An amount of R60 million over the medium term has been allocated to this in the Special Economic Zones and Economic Transformation programme.

Vote 34: Trade and Industry
637
Strengthening export capabilities The department plans over the medium term to develop and implement products for target markets, in collaboration with stakeholders such as export councils, trade and investment provincial agencies, and other national and provincial government departments in the export value chain. It aims to provide financial assistance to 3 290 companies in the medium term to strengthen their export capabilities, including facilitating their participation at national pavilions, trade missions, and trade and investment initiatives. In providing this assistance, the department plans to balance supporting large, leading and dynamic companies with maintaining support provided to emerging exporters, small, medium and micro enterprises (SMMEs), and black industrialists. Spending on financial assistance is projected to be R680.7 million over the medium term in the Incentive Development and Administration programme.
Developing industrial infrastructure The department’s spending on infrastructure aims to promote industrialisation across the country. Spending on industrial infrastructure projects over the medium term is estimated at R4.3 billion, funded through the Infrastructure Investment Support subprogramme in the Incentive Development and Administration programme. The funding should allow for the revitalisation of government-owned industrial parks, investment in critical infrastructure projects, and the development of infrastructure in special economic zones.
The department will contribute towards the spatial transformation of the economy through planning, developing and managing special economic zones within the legal framework of the Special Economic Zones Act (2014). The special economic zones programme attracts foreign and domestic direct investment in designated zones and regions to build strategic industrial capabilities that promote industrial development, investment, competitiveness and employment creation. At least one new zone will be designated in 2017/18 and the zones collectively are expected to increase value-added exports throughout the country over the medium term. To attract foreign and direct investment, the department plans to provide a one-stop shop and aftercare support for investors over the medium term to facilitate doing business in South Africa. These activities are funded in the Investment South Africa programme, which is allocated R156.5 million over the medium term.
The critical infrastructure programme aims to contribute to attracting an estimated R45 billion in investment over the medium term by supporting the development of critical infrastructure such as power substations, cogeneration power plants, bulk infrastructure, and technical testing facilities for aerospace and defence. By lowering the cost of doing business, the programme aims to stimulate investment growth in line with the national industrial policy framework and industrial policy action plan. Over the medium term, 32 strategic infrastructure projects are expected to be approved for bulk infrastructure for industrial parks and R643.5 million has been allocated towards the critical infrastructure programme for this.
The department will continue to expand economic opportunities in underdeveloped and marginalised regions. The revitalisation of state-owned industrial parks across the country is an important part of this approach, and is expected to promote industrialisation and increase the parks’ contributions to job creation and economic growth. Parks will be revitalised in all provinces, but with a focus on marginalised regions in Eastern Cape, North West and Mpumalanga. As per the industrial policy action plan, the department will focus on key prioritised areas such as plastics, chemicals, cosmetics and pharmaceuticals, agro-processing, green and energy-savings industries, and boatbuilding. These activities are funded by an allocation of R80 million over the medium term in the cluster development programme in the Incentive Development and Administration programme.

2017 Estimates of National Expenditure
638
Expenditure trends Table 34.2 Vote expenditure trends by programme and economic classificationProgrammes 1. Administration 2. International Trade and Economic Development 3. Special Economic Zones and Economic Transformation 4. Industrial Development 5. Consumer and Corporate Regulation 6. Incentive Development and Administration 7. Trade and Investment South Africa 8. Investment South Africa Programme
Ann
ual b
udge
t
Adj
uste
d
appr
opria
tion
Aud
ited
ou
tcom
e
Ann
ual b
udge
t
Adj
uste
d
appr
opria
tion
Aud
ited
ou
tcom
e
Ann
ual b
udge
t
Adj
uste
d
appr
opria
tion
Aud
ited
ou
tcom
e
Ann
ual b
udge
t
Adj
uste
d
appr
opria
tion
Rev
ised
es
timat
e
Aver
age:
Ou
tcom
e/Ann
ual
budg
et
(%)
Aver
age:
Ou
tcom
e/Adj
uste
d
appr
opria
tion
(%)
R million 2013/14 2014/15 2015/16 2016/17 2013/14 - 2016/17 Programme 1 690.1 725.9 686.9 695.6 750.8 699.9 689.7 768.3 727.6 736.6 777.1 777.1 102.8% 95.7%Programme 2 138.6 141.6 121.0 147.2 124.7 124.1 164.8 116.6 113.6 126.4 118.7 118.7 82.7% 95.2%Programme 3 968.3 1 010.3 231.2 307.2 243.3 235.1 263.2 89.7 92.5 108.3 121.9 121.9 41.3% 46.5%Programme 4 1 617.1 1 616.2 1 591.2 1 792.5 1 786.0 1 775.2 1 973.5 1 964.3 1 953.6 1 735.7 1 727.0 1 727.0 99.0% 99.3%Programme 5 256.2 256.2 256.7 277.3 285.6 281.1 294.5 296.4 287.4 313.5 294.3 294.3 98.1% 98.9%Programme 6 5 543.1 5 443.1 5 101.9 5 120.3 5 264.6 5 176.7 5 795.6 5 827.6 5 795.8 6 922.4 6 891.7 6 891.7 98.2% 98.0%Programme 7 329.7 284.4 306.6 309.1 323.5 329.6 364.1 386.8 462.9 336.5 410.9 410.9 112.7% 107.4%Programme 8 29.5 37.8 32.4 37.9 39.9 38.0 48.3 48.3 38.3 48.1 47.8 47.8 95.5% 90.0%Total 9 572.6 9 515.6 8 327.9 8 687.0 8 818.4 8 659.8 9 593.7 9 497.8 9 471.7 10 327.5 10 389.5 10 389.5 96.5% 96.4%Change to 2016 Budget estimate
62.0
Economic classification Current payments 1 493.3 1 527.7 1 392.5 1 441.0 1 544.4 1 442.6 1 475.7 1 561.0 1 485.7 1 529.0 1 582.2 1 582.2 99.4% 95.0%Compensation of employees 854.2 818.3 734.0 848.0 857.4 815.3 897.7 897.7 874.2 930.3 930.3 930.3 95.0% 95.7%Goods and services 639.1 709.4 658.5 593.0 687.0 627.3 577.9 663.3 611.5 598.7 651.9 651.9 105.8% 94.0%Transfers and subsidies 8 059.3 7 950.0 6 916.7 7 222.3 7 240.9 7 192.5 8 083.9 7 901.2 7 936.5 8 765.3 8 774.0 8 774.0 95.9% 96.7%Departmental agencies and accounts
1 234.7 1 285.7 639.9 724.3 732.8 731.8 761.5 591.9 591.9 601.4 856.0 856.0 – –
Higher education institutions 12.8 12.8 – 15.8 0.0 – 12.5 0.0 – – – – – –Foreign governments and international organisations
39.7 34.5 38.2 34.6 31.7 26.6 31.7 31.7 34.8 33.6 32.6 32.6 94.6% 101.3%
Public corporations and private enterprises
6 751.2 6 586.4 6 139.4 6 325.5 6 349.9 6 295.2 7 131.6 7 128.6 7 156.2 7 970.2 7 720.4 7 720.4 96.9% 98.3%
Non-profit institutions 18.9 27.9 94.8 120.4 124.0 134.0 144.1 146.6 148.9 158.1 163.1 163.1 122.5% 117.1%Households 1.9 2.6 4.3 1.8 2.5 5.0 2.5 2.4 4.8 2.1 1.9 1.9 196.4% 170.0%Payments for capital assets 20.0 37.9 17.6 23.7 33.2 19.9 34.2 35.7 37.4 33.2 33.3 33.3 97.5% 77.3%Machinery and equipment 10.9 13.5 11.0 12.0 21.2 19.4 24.1 30.7 33.0 20.6 25.4 25.4 131.6% 97.8%Software and other intangible assets
9.2 24.3 6.6 11.7 11.9 0.5 10.1 5.0 4.4 12.6 7.9 7.9 44.6% 39.5%
Payments for financial assets – 0.0 1.2 – 0.0 4.7 – – 12.1 – – – – 598 866.7%Total 9 572.6 9 515.6 8 327.9 8 687.0 8 818.4 8 659.8 9 593.7 9 497.8 9 471.7 10 327.5 10 389.5 10 389.5 96.5% 96.4%
Expenditure estimates Table 34.3 Vote expenditure estimates by programme and economic classificationProgrammes 1. Administration 2. International Trade and Economic Development 3. Special Economic Zones and Economic Transformation 4. Industrial Development 5. Consumer and Corporate Regulation 6. Incentive Development and Administration 7. Trade and Investment South Africa 8. Investment South Africa Programme
Revised estimate
Averagegrowth
rate(%)
Average:Expen-diture/
Total(%) Medium-term expenditure estimate
Averagegrowth
rate(%)
Average:Expen-diture/
Total(%)
R million 2016/17 2013/14 - 2016/17 2017/18 2018/19 2019/20 2016/17 - 2019/20 Programme 1 777.1 2.3% 7.8% 731.8 768.7 804.2 1.2% 8.0%Programme 2 118.7 -5.7% 1.3% 119.8 126.9 131.3 3.4% 1.3%Programme 3 121.9 -50.6% 1.8% 119.4 120.1 122.3 0.1% 1.2%Programme 4 1 727.0 2.2% 19.1% 1 819.3 1 775.8 1 869.2 2.7% 18.6%Programme 5 294.3 4.7% 3.0% 298.6 320.9 329.2 3.8% 3.2%Programme 6 6 891.7 8.2% 62.3% 5 746.5 6 416.0 5 348.8 -8.1% 63.0%Programme 7 410.9 13.1% 4.1% 388.5 385.5 457.3 3.6% 4.2%Programme 8 47.8 8.1% 0.4% 50.9 52.0 53.7 3.9% 0.5%Total 10 389.5 3.0% 100.0% 9 274.8 9 965.9 9 116.0 -4.3% 100.0%Change to 2016 Budget estimate
(15.7) 1 334.5 (17.5)

Vote 34: Trade and Industry
639
Table 34.3 Vote expenditure estimates by programme and economic classification Economic classification
Revised estimate
Averagegrowth
rate(%)
Average:Expen-diture/
Total(%) Medium-term expenditure estimate
Averagegrowth
rate(%)
Average:Expen-diture/
Total(%)
R million 2016/17 2013/14 - 2016/17 2017/18 2018/19 2019/20 2016/17 - 2019/20 Current payments 1 582.2 1.2% 16.0% 1 511.7 1 560.5 1 659.8 1.6% 16.3%Compensation of employees 930.3 4.4% 9.1% 902.4 927.8 998.6 2.4% 9.7%Goods and services 651.9 -2.8% 6.9% 609.3 632.7 661.2 0.5% 6.6%Transfers and subsidies 8 774.0 3.3% 83.6% 7 735.1 8 377.5 7 420.4 -5.4% 83.4%Departmental agencies and accounts 856.0 -12.7% 7.7% 747.6 668.6 704.9 -6.3% 7.7%Foreign governments and international organisations
32.6 -1.9% 0.4% 36.3 38.4 40.6 7.6% 0.4%
Public corporations and private enterprises
7 720.4 5.4% 74.1% 6 789.0 7 519.0 6 514.5 -5.5% 73.7%
Non-profit institutions 163.1 80.2% 1.5% 160.8 150.1 159.0 -0.9% 1.6%Households 1.9 -9.6% 0.0% 1.3 1.4 1.5 -8.5% 0.0%Payments for capital assets 33.3 -4.2% 0.3% 28.0 27.9 35.8 2.4% 0.3%Machinery and equipment 25.4 23.4% 0.2% 19.9 20.2 21.3 -5.7% 0.2%Software and other intangible assets 7.9 -31.4% 0.1% 8.1 7.7 14.5 22.5% 0.1%Total 10 389.5 3.0% 100.0% 9 274.8 9 965.9 9 116.0 -4.3% 100.0%
Goods and services expenditure trends and estimates Table 34.4 Vote Goods and services expenditure trends and estimates
Audited outcome Adjusted
appropriation
Averagegrowth
rate(%)
Average: Expen-diture/
Total(%)
Medium-term expenditure estimate
Averagegrowth
rate(%)
Average:Expen-diture/
Total(%)
R thousand 2013/14 2014/15 2015/16 2016/17 2013/14 - 2016/17 2017/18 2018/19 2019/20 2016/17 - 2019/20 Administrative fees 5 243 3 625 3 318 3 994 -8.7% 0.6% 4 177 5 041 5 575 11.8% 0.7%Advertising 41 374 29 644 23 752 19 770 -21.8% 4.5% 31 144 32 413 34 119 19.9% 4.6%Minor assets 272 1 859 1 093 613 31.1% 0.2% 487 507 550 -3.6% 0.1%Audit costs: External 8 123 8 857 8 778 11 727 13.0% 1.5% 10 090 10 595 11 131 -1.7% 1.7%Bursaries: Employees 1 392 995 1 592 1 929 11.5% 0.2% 3 352 3 570 3 789 25.2% 0.5%Catering: Departmental activities 5 618 1 815 1 883 2 555 -23.1% 0.5% 4 716 5 313 5 701 30.7% 0.7%Communication 10 561 10 575 12 799 11 100 1.7% 1.8% 12 275 13 122 13 793 7.5% 2.0%Computer services 18 318 17 107 25 801 45 658 35.6% 4.2% 25 645 24 467 24 983 -18.2% 4.7%Consultants: Business and advisory services
38 294 82 654 28 352 40 637 2.0% 7.5% 59 572 62 706 61 670 14.9% 8.8%
Infrastructure and planning services – 281 – – – – – – – – – Legal services 10 536 22 474 21 070 21 604 27.0% 3.0% 10 979 11 042 11 659 -18.6% 2.2%Contractors 19 221 14 468 16 914 13 101 -12.0% 2.5% 16 522 17 225 18 137 11.5% 2.5%Agency and support/outsourced services
762 1 606 1 579 2 128 40.8% 0.2% 2 608 2 670 2 813 9.7% 0.4%
Entertainment 1 917 1 570 1 323 1 103 -16.8% 0.2% 1 272 1 321 1 346 6.9% 0.2%Fleet services (including government motor transport)
545 549 873 800 13.6% 0.1% 1 114 1 155 1 217 15.0% 0.2%
Consumable supplies 1 713 1 380 1 462 1 112 -13.4% 0.2% 5 992 6 549 6 885 83.6% 0.8%Consumables: Stationery, printing and office supplies
11 664 8 146 16 280 14 304 7.0% 2.0% 10 117 12 238 11 619 -6.7% 1.9%
Operating leases 276 979 279 077 281 191 300 942 2.8% 44.6% 230 846 236 378 249 222 -6.1% 39.8%Rental and hiring 171 134 199 1 454 104.1% 0.1% 208 189 206 -47.9% 0.1%Property payments 8 055 7 983 12 283 12 342 15.3% 1.6% 9 475 10 175 10 728 -4.6% 1.7%Transport provided: Departmental activity
– – – 22 – – 5 5 – -100.0% –
Travel and subsistence 110 709 84 301 95 984 89 846 -6.7% 14.9% 108 548 111 546 117 162 9.3% 16.7%Training and development 9 164 7 184 8 155 10 313 4.0% 1.4% 10 153 11 472 12 723 7.3% 1.7%Operating payments 33 048 23 973 28 223 21 640 -13.2% 4.2% 27 500 30 069 31 854 13.8% 4.3%Venues and facilities 44 798 17 045 18 573 23 197 -19.7% 4.1% 22 483 22 912 24 336 1.6% 3.6%Total 658 477 627 302 611 477 651 891 -0.3% 100.0% 609 280 632 680 661 218 0.5% 100.0%

2017 Estimates of National Expenditure
640
Transfers and subsidies expenditure trends and estimates Table 34.5 Vote transfers and subsidies trends and estimates
Audited outcome Adjusted
appropriation
Averagegrowth
rate(%)
Average: Expen-diture/
Total(%)
Medium-term expenditure estimate
Averagegrowth
rate(%)
Average: Expen-diture/
Total(%)
R thousand 2013/14 2014/15 2015/16 2016/17 2013/14 - 2016/17 2017/18 2018/19 2019/20 2016/17 - 2019/20 Departmental agencies and accounts Departmental agencies (non-business entities) Current 579 895 620 758 437 280 693 241 6.1% 7.6% 601 243 545 510 574 936 -6.0% 7.5%Independent Regulatory Board for Auditors – 1 800 500 – – – – – – – – Public Service Sector Education and Training Authority
– 1 711 – – – – – – – – –
Council for Geoscience 835 – 1 077 1 131 10.6% – 1 188 1 257 1 327 5.5% – National Research Foundation: Technology and human resources for industry programme
160 634 165 572 – – -100.0% 1.1% – – – – –
National Productivity Institute 13 651 9 170 8 094 8 523 -14.5% 0.1% 8 949 9 468 9 998 5.5% 0.1%Broad-Based Black Economic Empowerment Commission
– – – – – – 20 000 20 000 20 000 – 0.2%
South African National Accreditation System 33 473 35 712 26 025 22 208 -12.8% 0.4% 30 313 31 828 33 610 14.8% 0.4%National Metrology Institute of South Africa: Operations
85 942 91 564 96 296 101 400 5.7% 1.2% 106 470 112 645 118 953 5.5% 1.4%
National Regulator for Compulsory Specifications
103 000 109 734 91 732 86 418 -5.7% 1.3% 128 745 135 683 143 281 18.4% 1.5%
National Credit Regulator 63 691 68 845 66 727 69 577 3.0% 0.9% 73 056 77 293 81 621 5.5% 0.9%National Gambling Board 27 717 29 797 31 983 30 121 2.8% 0.4% 31 627 33 461 35 335 5.5% 0.4%National Consumer Tribunal 36 099 40 164 46 029 46 151 8.5% 0.5% 48 459 51 270 54 141 5.5% 0.6%National Consumer Commission 44 516 53 376 54 596 56 643 8.4% 0.7% 52 614 55 865 58 993 1.4% 0.7%Companies Tribunal 10 337 13 313 14 221 15 069 13.4% 0.2% 15 822 16 740 17 677 5.5% 0.2%National Research Foundation – – – 256 000 – 0.8% 84 000 – – -100.0% 1.1%Capital 60 000 111 000 154 599 162 793 39.5% 1.6% 146 333 123 086 129 979 -7.2% 1.7%National Metrology Institute of South Africa 60 000 111 000 154 599 162 793 39.5% 1.6% 146 333 123 086 129 979 -7.2% 1.7%Foreign governments and international organisations Current 38 214 26 598 34 774 32 571 -5.2% 0.4% 36 321 38 426 40 577 7.6% 0.5%Organisation for the Prohibition of Chemical Weapons
3 642 – 4 278 4 626 8.3% – 5 172 5 472 5 778 7.7% 0.1%
World Trade Organisation 13 228 17 172 17 267 14 501 3.1% 0.2% 14 500 15 341 16 200 3.8% 0.2%United Nations Industrial Development Organisation
5 853 5 071 6 405 6 459 3.3% 0.1% 6 767 7 159 7 560 5.4% 0.1%
Treaty Organisations for Metrology 1 477 – 1 537 2 058 11.7% – 1 798 1 902 2 009 -0.8% – World Intellectual Property Organisation 4 214 4 355 5 287 4 927 5.3% 0.1% 5 173 5 473 5 779 5.5% 0.1%Export consultancy trust funds: International Bank for Reconstruction and Development (World Bank)
4 900 – – – -100.0% – 1 456 1 540 1 626 – –
Export consultancy trust funds: International Finance Corporation
4 900 – – – -100.0% – 1 455 1 539 1 625 – –
Public corporations and private enterprises Other transfers to public corporations Current 1 129 466 1 301 471 1 492 874 1 225 356 2.8% 16.7% 1 280 038 1 261 694 1 332 405 2.8% 15.8%Industrial Development Corporation: Research into industrial development, growth and equity
650 1 983 – – -100.0% – – – – – –
Development Bank of Southern Africa: Regional Spatial development initiatives
9 303 20 689 – – -100.0% 0.1% – – – – –
Protechnik Laboratories: Operations 2 832 2 684 2 797 2 945 1.3% – 3 093 3 272 3 455 5.5% – Council for Scientific and Industrial Research 1 500 1 501 1 572 1 655 3.3% – 1 738 1 839 1 942 5.5% – Industrial Development Corporation of South Africa
822 791 878 244 1 000 937 758 266 -2.7% 11.2% 723 440 697 478 736 537 -1.0% 9.0%
Council for Scientific and Industrial Research: National Cleaner Production Centre
– 51 679 55 000 58 870 – 0.5% 62 951 63 008 66 592 4.2% 0.8%
South African Bureau of Standards 204 967 220 078 216 215 212 365 1.2% 2.8% 285 494 280 693 296 412 11.8% 3.3%Council for Scientific and Industrial Research: National Foundry Technology Network
14 130 14 243 16 384 19 689 11.7% 0.2% 25 678 27 457 28 995 13.8% 0.3%
Export Credit Insurance Corporation 73 293 110 370 199 969 171 566 32.8% 1.8% 177 644 187 947 198 472 5.0% 2.3%Capital 954 154 633 472 758 292 1 429 000 14.4% 12.2% 715 721 1 412 767 1 580 266 3.4% 15.9%Protechnik Laboratories: Capital 1 855 1 118 1 158 1 219 -13.1% – 1 280 1 354 1 430 5.5% – Council for Scientific and Industrial Research: Aerospace industry
21 226 22 500 21 534 17 781 -5.7% 0.3% 19 020 20 413 21 556 6.6% 0.2%
South African Bureau of Standards: Upgrading of vehicle testing facility
43 678 – – – -100.0% 0.1% – – – – –
South African Bureau of Standards – 1 611 – – – – – – – – – Coega Development Corporation 308 195 – – – -100.0% 1.0% – – – – – Various institutions: Special economic zones 449 200 608 243 735 600 1 310 000 42.9% 10.1% 605 421 1 300 000 1 457 280 3.6% 14.5%Various institutions: Critical infrastructure programme
– – – 100 000 – 0.3% 90 000 91 000 100 000 – 1.2%
East London industrial development zone 100 000 – – – -100.0% 0.3% – – – – – Richards Bay industrial development zone 30 000 – – – -100.0% 0.1% – – – – –

Vote 34: Trade and Industry
641
Table 34.5 Vote transfers and subsidies trends and estimates
Audited outcome Adjusted
appropriation
Averagegrowth
rate(%)
Average: Expen-diture/
Total(%)
Medium-term expenditure estimate
Averagegrowth
rate(%)
Average: Expen-diture/
Total(%)
R thousand 2013/14 2014/15 2015/16 2016/17 2013/14 - 2016/17 2017/18 2018/19 2019/20 2016/17 - 2019/20 Public corporations and private enterprises Subsidies on products and production Current 3 515 298 3 949 444 4 526 712 4 590 716 9.3% 53.8% 4 397 350 4 429 071 3 167 019 -11.6% 51.3%Various institutions: Services sector development incentives
555 000 715 000 789 663 600 000 2.6% 8.6% 692 500 732 069 704 425 5.5% 8.4%
Various institutions: Manufacturing development incentives
2 960 298 3 134 849 3 607 049 3 890 716 9.5% 44.1% 3 564 850 3 617 002 2 462 594 -14.1% 41.9%
Various institutions: Industrial development zones (other)
– 99 595 130 000 100 000 – 1.1% 140 000 80 000 – -100.0% 1.0%
Public corporations and private enterprises Other transfers to private enterprises Current 400 550 329 520 304 075 285 314 -10.7% 4.3% 276 437 295 370 311 911 3.0% 3.6%Broadening participation development incentives 72 872 – – – -100.0% 0.2% – – – – – Various Institutions: Support programme for industrial innovation
53 860 – 22 827 60 892 4.2% 0.4% 63 937 67 645 71 433 5.5% 0.8%
Various institutions: Export market and investment assistance
273 818 329 520 281 248 224 422 -6.4% 3.6% 212 500 227 725 240 478 2.3% 2.8%
Capital 139 968 81 269 74 203 190 000 10.7% 1.6% 119 500 120 071 122 891 -13.5% 1.7%Various institutions: Critical infrastructure programme 139 968 81 269 74 203 190 000 10.7% 1.6% 119 500 120 071 122 891 -13.5% 1.7%Non-profit institutions Current 94 784 134 018 148 850 163 107 19.8% 1.8% 160 814 150 092 158 963 -0.9% 2.0%Black Business Council – 5 000 1 000 1 000 – – 1 500 1 500 1 500 14.5% – Intsimbi national tooling initiative 54 434 67 700 70 353 74 082 10.8% 0.9% 75 786 82 298 86 907 5.5% 1.0%Automotive supply chain competitiveness initiative – – 14 000 15 000 – 0.1% 13 127 7 984 8 813 -16.2% 0.1%Trade and industrial policy strategies 6 000 14 570 20 772 22 712 55.8% 0.2% 21 423 12 086 12 763 -17.5% 0.2%Centurion Aerospace Village 15 800 16 748 17 517 18 445 5.3% 0.2% 19 367 15 490 16 357 -3.9% 0.2%Proudly South African campaign 18 550 30 000 25 208 31 868 19.8% 0.3% 29 611 30 734 32 623 0.8% 0.4%Households Social benefits Current 1 409 2 157 2 837 1 063 -9.0% – 800 846 893 -5.6% – Employee social benefits 1 402 2 157 2 837 1 063 -7.1% – 800 846 893 -5.6% – Gifts and donations 7 – – – -100.0% – – – – – – Households Other transfers to households Current 2 932 2 796 1 992 851 -33.8% – 539 536 575 -12.3% – Bursaries for non-employees 2 522 2 656 1 669 551 -39.8% – 539 536 575 1.4% – Gifts and donations 410 140 188 300 -9.9% – – – – -100.0% – Other transfers to households – – 135 – – – – – – – – Total 6 916 670 7 192 503 7 936 488 8 774 012 8.3% 100.0% 7 735 096 8 377 469 7 420 415 -5.4% 100.0%
Personnel information Table 34.6 Vote personnel numbers and cost by salary level and programme¹ Programmes 1. Administration 2. International Trade and Economic Development 3. Special Economic Zones and Economic Transformation 4. Industrial Development 5. Consumer and Corporate Regulation 6. Incentive Development and Administration 7. Trade and Investment South Africa 8. Investment South Africa
Number of posts estimated for
31 March 2017 Number and cost2 of personnel posts filled / planned for on funded establishment Number
Number of
funded posts
Number of posts
additional to the
establishment Actual Revised estimate Medium-term expenditure estimate
Average growth
rate(%)
Average: Salary
level/Total(%)
2015/16 2016/17 2017/18 2018/19 2019/20 2016/17 - 2019/20
Trade and Industry Number Cost Unit cost Number Cost
Unit cost Number Cost
Unit cost Number Cost
Unit cost
Number Cost
Unit cost
Salary level 1 361 98 1 482 874.2 0.6 1 416 930.3 0.7 1 379 902.4 0.7 1 341 927.8 0.7 1 307 998.6 0.8 -2.6% 100.0%1 – 6 169 59 189 38.0 0.2 182 35.9 0.2 179 37.3 0.2 175 39.0 0.2 173 41.2 0.2 -1.7% 13.0%7 – 10 624 21 645 251.8 0.4 613 287.6 0.5 595 287.1 0.5 578 298.4 0.5 564 310.4 0.6 -2.7% 43.2%11 – 12 316 11 333 266.1 0.8 321 259.7 0.8 312 262.7 0.8 303 271.0 0.9 295 284.7 1.0 -2.8% 22.6%13 – 16 250 7 247 258.5 1.0 232 309.0 1.3 225 258.8 1.2 217 297.1 1.4 207 297.7 1.4 -3.7% 16.2%Other 2 – 68 59.8 0.9 68 38.1 0.6 68 56.5 0.8 68 22.3 0.3 68 64.6 0.9 – 5.0%Programme 1 361 98 1 482 874.2 0.6 1 416 930.3 0.7 1 379 902.4 0.7 1 341 927.8 0.7 1 307 998.6 0.8 -2.6% 100.0%Programme 1 499 33 517 264.7 0.5 500 289.7 0.6 493 278.6 0.6 485 298.2 0.6 477 311.2 0.7 -1.6% 35.9%Programme 2 105 2 110 68.9 0.6 104 77.4 0.7 100 75.3 0.8 97 79.8 0.8 95 81.0 0.9 -3.0% 7.3%Programme 3 87 11 86 54.8 0.6 80 73.6 0.9 76 71.0 0.9 73 71.9 1.0 70 71.4 1.0 -4.4% 5.5%Programme 4 147 5 158 99.6 0.6 148 105.2 0.7 144 106.5 0.7 140 108.0 0.8 134 105.8 0.8 -3.3% 10.4%Programme 5 88 3 92 54.5 0.6 85 62.8 0.7 80 53.8 0.7 76 61.6 0.8 73 55.4 0.8 -4.9% 5.8%Programme 6 222 15 225 126.5 0.6 217 131.0 0.6 212 126.6 0.6 207 131.6 0.6 203 138.0 0.7 -2.2% 15.4%Programme 7 167 26 245 177.8 0.7 236 159.6 0.7 229 157.5 0.7 221 143.4 0.6 215 201.6 0.9 -3.1% 16.6%Programme 8 46 3 49 27.4 0.6 46 31.0 0.7 45 33.2 0.7 42 33.4 0.8 40 34.1 0.9 -4.6% 3.2%1. Data has been provided by the department and may not necessarily reconcile with official government personnel data. 2. Rand million.

2017 Estimates of National Expenditure
642
Departmental receipts Table 34.7 Departmental receipts by economic classification
Audited outcome Adjusted estimate
Revised estimate
Averagegrowth
rate (%)
Average: Receipt
item/Total
(%) Medium-term receipts estimate
Averagegrowth
rate (%)
Average: Receipt
item/Total
(%) R thousand 2013/14 2014/15 2015/16 2016/17 2013/14 - 2016/17 2017/18 2018/19 2019/20 2016/17 - 2019/20 Departmental receipts 71 741 82 551 61 979 82 155 65 457 -3.0% 100.0% 69 000 73 000 77 000 5.6% 100.0%Tax receipts 4 228 2 925 2 985 4 000 900 -40.3% 3.9% 5 200 5 400 5 500 82.8% 6.0%Sales of goods and services produced by department
482 524 535 616 500 1.2% 0.7% 616 669 721 13.0% 0.9%
Sales by market establishments 263 270 259 280 250 -1.7% 0.4% 300 320 350 11.9% 0.4%of which: Rental of parking 263 270 259 280 250 -1.7% 0.4% 300 320 350 11.9% 0.4%Administrative fees – – – 1 – – – 1 1 1 – – of which: Request information in terms of the Promotion of Access to Information Act (2000)
– – – 1 – – – 1 1 1 – –
Other sales 219 254 276 335 250 4.5% 0.4% 315 348 370 14.0% 0.5%of which: Commission on hand 159 183 181 320 180 4.2% 0.2% 250 280 300 18.6% 0.4%Academic services 60 71 95 15 70 5.3% 0.1% 65 68 70 – 0.1%Sales of scrap, waste, arms and other used current goods
– – 3 5 3 – – 1 1 1 -30.7% –
of which: Waste paper: Recycling of paper
– – 3 – – – – 1 1 1 – –
Cellphones: Old pool phones – – – 5 3 – – – – – -100.0% – Transfers received – – – 244 244 – 0.1% – – – -100.0% 0.1%Fines, penalties and forfeits 20 420 97 28 400 40 -87.5% 7.3% 220 225 280 91.3% 0.3%Interest, dividends and rent on land
95 1 348 3 561 3 570 3 570 235.0% 3.0% 550 650 700 -41.9% 1.9%
Interest 95 1 348 3 561 3 570 3 570 235.0% 3.0% 550 650 700 -41.9% 1.9%Sales of capital assets 38 223 360 300 300 99.1% 0.3% 300 350 400 10.1% 0.5%Transactions in financial assets and liabilities
46 478 77 434 54 507 73 020 59 900 8.8% 84.6% 62 113 65 705 69 398 5.0% 90.4%
Total 71 741 82 551 61 979 82 155 65 457 -3.0% 100.0% 69 000 73 000 77 000 5.6% 100.0%
Programme 1: Administration Programme purpose Provide strategic leadership, management and support services to the department, and conduct research on industrial development, growth and equity.
Expenditure trends and estimates Table 34.8 Administration expenditure trends and estimates by subprogramme and economic classificationSubprogramme
Audited outcome Adjusted
appropriation
Averagegrowth
rate(%)
Average: Expen-diture/
Total(%)
Medium-term expenditure estimate
Averagegrowth
rate(%)
Average:Expen-diture/
Total(%)
R million 2013/14 2014/15 2015/16 2016/17 2013/14 - 2016/17 2017/18 2018/19 2019/20 2016/17 - 2019/20 Ministry 27.3 27.6 32.1 32.5 6.0% 4.1% 31.6 37.7 40.8 7.8% 4.6%Office of the Director General 69.7 96.3 93.6 107.0 15.4% 12.7% 119.8 121.5 129.6 6.6% 15.5%Corporate Services 425.9 444.8 478.6 489.1 4.7% 63.6% 415.1 433.2 457.3 -2.2% 58.2%Office Accommodation – – 2.4 2.9 – 0.2% 2.5 2.2 2.4 -6.4% 0.3%Financial Management 46.4 57.5 51.4 73.1 16.4% 7.9% 69.5 73.3 72.7 -0.2% 9.4%Media and Public Relations 7.8 6.9 10.2 10.4 10.1% 1.2% 19.1 21.0 22.2 28.9% 2.4%Marketing Communication and Stakeholder Relations
109.8 66.7 59.2 62.1 -17.3% 10.3% 74.3 79.7 79.4 8.5% 9.6%
Total 686.9 699.9 727.6 777.1 4.2% 100.0% 731.8 768.7 804.2 1.2% 100.0%Change to 2016 Budget estimate
40.5 (24.6) (20.2) (28.8)
Economic classification Current payments 676.4 674.5 697.5 758.7 3.9% 97.1% 715.9 752.4 787.1 1.2% 97.8%Compensation of employees 226.1 257.4 264.7 289.7 8.6% 35.9% 278.6 298.2 311.2 2.4% 38.2%Goods and services1 450.3 417.1 432.7 469.0 1.4% 61.2% 437.3 454.2 475.9 0.5% 59.6%of which: Advertising 37.3 27.3 20.9 18.8 -20.5% 3.6% 28.8 30.4 32.0 19.5% 3.6%Computer services 17.2 16.3 24.7 40.8 33.4% 3.4% 24.9 23.7 24.2 -16.1% 3.7%
Vote 34: Trade and Industry
643
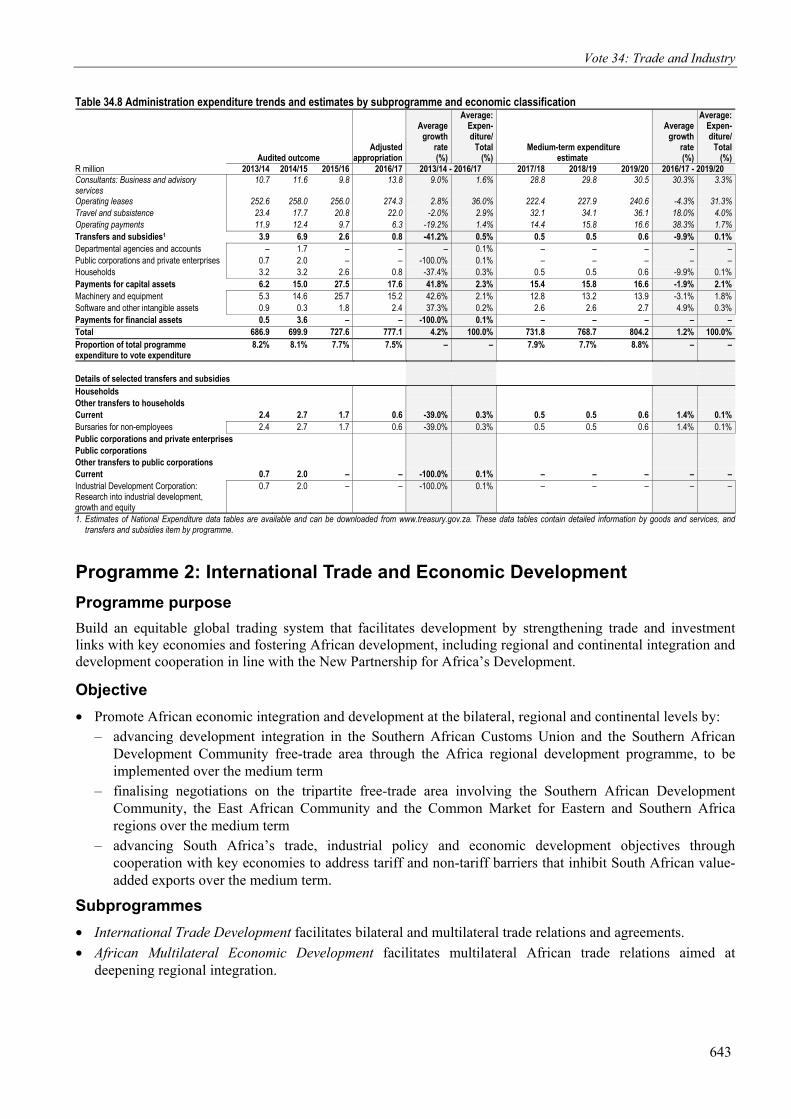
Table 34.8 Administration expenditure trends and estimates by subprogramme and economic classification
Audited outcome Adjusted
appropriation
Averagegrowth
rate(%)
Average: Expen-diture/
Total(%)
Medium-term expenditure estimate
Averagegrowth
rate(%)
Average:Expen-diture/
Total(%)
R million 2013/14 2014/15 2015/16 2016/17 2013/14 - 2016/17 2017/18 2018/19 2019/20 2016/17 - 2019/20 Consultants: Business and advisory services
10.7 11.6 9.8 13.8 9.0% 1.6% 28.8 29.8 30.5 30.3% 3.3%
Operating leases 252.6 258.0 256.0 274.3 2.8% 36.0% 222.4 227.9 240.6 -4.3% 31.3%Travel and subsistence 23.4 17.7 20.8 22.0 -2.0% 2.9% 32.1 34.1 36.1 18.0% 4.0%Operating payments 11.9 12.4 9.7 6.3 -19.2% 1.4% 14.4 15.8 16.6 38.3% 1.7%Transfers and subsidies1 3.9 6.9 2.6 0.8 -41.2% 0.5% 0.5 0.5 0.6 -9.9% 0.1%Departmental agencies and accounts – 1.7 – – – 0.1% – – – – – Public corporations and private enterprises 0.7 2.0 – – -100.0% 0.1% – – – – – Households 3.2 3.2 2.6 0.8 -37.4% 0.3% 0.5 0.5 0.6 -9.9% 0.1%Payments for capital assets 6.2 15.0 27.5 17.6 41.8% 2.3% 15.4 15.8 16.6 -1.9% 2.1%Machinery and equipment 5.3 14.6 25.7 15.2 42.6% 2.1% 12.8 13.2 13.9 -3.1% 1.8%Software and other intangible assets 0.9 0.3 1.8 2.4 37.3% 0.2% 2.6 2.6 2.7 4.9% 0.3%Payments for financial assets 0.5 3.6 – – -100.0% 0.1% – – – – – Total 686.9 699.9 727.6 777.1 4.2% 100.0% 731.8 768.7 804.2 1.2% 100.0%Proportion of total programme expenditure to vote expenditure
8.2% 8.1% 7.7% 7.5% – – 7.9% 7.7% 8.8% – –
Details of selected transfers and subsidies Households Other transfers to households Current 2.4 2.7 1.7 0.6 -39.0% 0.3% 0.5 0.5 0.6 1.4% 0.1%Bursaries for non-employees 2.4 2.7 1.7 0.6 -39.0% 0.3% 0.5 0.5 0.6 1.4% 0.1%Public corporations and private enterprises Public corporations Other transfers to public corporations Current 0.7 2.0 – – -100.0% 0.1% – – – – – Industrial Development Corporation: Research into industrial development, growth and equity
0.7 2.0 – – -100.0% 0.1% – – – – –
1. Estimates of National Expenditure data tables are available and can be downloaded from www.treasury.gov.za. These data tables contain detailed information by goods and services, and transfers and subsidies item by programme.
Programme 2: International Trade and Economic Development Programme purpose Build an equitable global trading system that facilitates development by strengthening trade and investment links with key economies and fostering African development, including regional and continental integration and development cooperation in line with the New Partnership for Africa’s Development.
Objective • Promote African economic integration and development at the bilateral, regional and continental levels by:
– advancing development integration in the Southern African Customs Union and the Southern African Development Community free-trade area through the Africa regional development programme, to be implemented over the medium term
– finalising negotiations on the tripartite free-trade area involving the Southern African Development Community, the East African Community and the Common Market for Eastern and Southern Africa regions over the medium term
– advancing South Africa’s trade, industrial policy and economic development objectives through cooperation with key economies to address tariff and non-tariff barriers that inhibit South African value-added exports over the medium term.
Subprogrammes • International Trade Development facilitates bilateral and multilateral trade relations and agreements. • African Multilateral Economic Development facilitates multilateral African trade relations aimed at
deepening regional integration.

2017 Estimates of National Expenditure
644
Expenditure trends and estimates Table 34.9 International Trade and Economic Development expenditure trends and estimates by subprogramme and economic classificationSubprogramme
Audited outcome Adjusted
appropriation
Averagegrowth
rate(%)
Average: Expen-diture/
Total(%)
Medium-term expenditure estimate
Averagegrowth
rate(%)
Average:Expen-diture/
Total(%)
R million 2013/14 2014/15 2015/16 2016/17 2013/14 - 2016/17 2017/18 2018/19 2019/20 2016/17 - 2019/20 International Trade Development 94.9 89.9 98.6 101.0 2.1% 80.5% 102.2 107.8 110.9 3.2% 84.9%African Multilateral Economic Development 26.1 34.2 15.0 17.7 -12.1% 19.5% 17.6 19.1 20.4 4.8% 15.1%Total 121.0 124.1 113.6 118.7 -0.6% 100.0% 119.8 126.9 131.3 3.4% 100.0%Change to 2016 Budget estimate
(7.7) (3.5) (1.0) (3.7)
Economic classification Current payments 88.7 81.7 86.1 93.6 1.8% 73.3% 94.0 99.4 102.1 2.9% 78.3%Compensation of employees 64.5 67.3 68.9 77.4 6.3% 58.3% 75.3 79.8 81.0 1.5% 63.1%Goods and services1 24.2 14.4 17.2 16.2 -12.5% 15.1% 18.7 19.6 21.1 9.2% 15.2%of which: Communication 1.0 0.7 0.7 0.4 -24.3% 0.6% 0.7 0.7 0.8 23.2% 0.5%Consultants: Business and advisory services 1.4 0.4 0.2 0.3 -38.8% 0.5% 0.3 0.2 0.3 -6.0% 0.2%Legal services 1.0 0.4 0.2 1.6 18.3% 0.6% 1.7 1.8 1.9 5.4% 1.4%Agency and support/outsourced services 0.5 0.3 – 0.3 -18.2% 0.3% 0.3 0.3 0.3 1.2% 0.2%Travel and subsistence 16.2 11.4 14.3 11.2 -11.6% 11.1% 13.5 13.9 14.8 9.7% 10.8%Venues and facilities 2.4 0.2 1.0 1.5 -15.4% 1.1% 1.4 1.8 1.8 6.3% 1.3%Transfers and subsidies1 31.7 41.7 26.8 24.4 -8.3% 26.1% 25.2 26.7 28.2 4.9% 21.0%Departmental agencies and accounts 0.8 – 1.1 1.1 10.6% 0.6% 1.2 1.3 1.3 5.5% 1.0%Foreign governments and international organisations
16.9 17.2 21.5 19.1 4.3% 15.7% 19.7 20.8 22.0 4.7% 16.4%
Public corporations and private enterprises 14.0 24.5 4.0 4.2 -33.2% 9.8% 4.4 4.6 4.9 5.5% 3.6%Households 0.0 0.1 0.3 – -100.0% 0.1% – – – – – Payments for capital assets 0.6 0.7 0.6 0.7 3.8% 0.5% 0.6 0.8 0.9 11.9% 0.6%Machinery and equipment 0.6 0.7 0.6 0.7 3.8% 0.5% 0.6 0.8 0.9 11.9% 0.6%Total 121.0 124.1 113.6 118.7 -0.6% 100.0% 119.8 126.9 131.3 3.4% 100.0%Proportion of total programme expenditure to vote expenditure
1.5% 1.4% 1.2% 1.1% – – 1.3% 1.3% 1.4% – –
Details of selected transfers and subsidies Foreign governments and international organisations Current 16.9 17.2 21.5 19.1 4.3% 15.7% 19.7 20.8 22.0 4.7% 16.4%Organisation for the Prohibition of Chemical Weapons
3.6 – 4.3 4.6 8.3% 2.6% 5.2 5.5 5.8 7.7% 4.2%
World Trade Organisation 13.2 17.2 17.3 14.5 3.1% 13.0% 14.5 15.3 16.2 3.8% 12.2%Public corporations and private enterprises Public corporations Other transfers to public corporations Current 12.1 23.4 2.8 2.9 -37.6% 8.6% 3.1 3.3 3.5 5.5% 2.6%Development Bank of Southern Africa: Regional Spatial development initiatives
9.3 20.7 – – -100.0% 6.3% – – – – –
Protechnik Laboratories: Operations 2.8 2.7 2.8 2.9 1.3% 2.4% 3.1 3.3 3.5 5.5% 2.6%Capital 1.9 1.1 1.2 1.2 -13.1% 1.1% 1.3 1.4 1.4 5.5% 1.1%Protechnik Laboratories: Capital 1.9 1.1 1.2 1.2 -13.1% 1.1% 1.3 1.4 1.4 5.5% 1.1%1. Estimates of National Expenditure data tables are available and can be downloaded from www.treasury.gov.za. These data tables contain detailed information by goods and services, and
transfers and subsidies item by programme.
Programme 3: Special Economic Zones and Economic Transformation Programme purpose Drive economic transformation and increase participation in industrialisation.
Objectives • Facilitate broad-based economic participation by implementing the Broad-Based Black Economic
Empowerment Amendment Act (2013) by: – implementing the black industrialists framework and action plan by 2018/19 – facilitating the revitalisation of 10 industrial parks by 2018/19 – implementing a national technology commercialisation strategy by 2017/18.
• Facilitate the transformation of the economy to promote industrial development, investment, competitiveness and employment creation by developing and implementing a strategy for special economic zones by 2017/18.

Vote 34: Trade and Industry
645
Subprogrammes • Enterprise Competitiveness fosters and stimulates industrialisation and structural change through the
development and deployment of technologies and skills development programmes. • Equity and Empowerment promotes B-BBEE and the growth of the economy through the black industrialists
programme. • Spatial Industrial Economic Development (Special Economic Zones) promotes a more spatially balanced
regional economy through the development of policies, strategies and programmes, and special economic zones, clusters and incubators, among other things.
Expenditure trends and estimates Table 34.10 Special Economic Zones and Economic Transformation expenditure trends and estimates by subprogramme and economic classification Subprogramme
Audited outcome Adjusted
appropriation
Averagegrowth
rate(%)
Average: Expen-diture/
Total(%)
Medium-term expenditure estimate
Averagegrowth
rate(%)
Average:Expen-diture/
Total(%)
R million 2013/14 2014/15 2015/16 2016/17 2013/14 - 2016/17 2017/18 2018/19 2019/20 2016/17 - 2019/20 Enterprise Competitiveness 188.8 189.1 23.3 26.7 -47.9% 62.9% 32.2 29.3 30.0 4.0% 24.4%Equity and Empowerment 13.0 20.6 30.9 49.4 56.3% 16.7% 39.2 38.9 43.6 -4.1% 35.4%Spatial Industrial Economic Development (Special Economic Zones)
29.5 25.4 38.3 45.8 15.8% 20.4% 48.0 51.9 48.8 2.2% 40.2%
Total 231.2 235.1 92.5 121.9 -19.2% 100.0% 119.4 120.1 122.3 0.1% 100.0%Change to 2016 Budget estimate
13.6 10.4 7.7 3.6
Economic classification Current payments 54.7 51.6 65.5 106.6 24.9% 40.9% 86.1 86.8 88.4 -6.0% 76.1%Compensation of employees 42.5 44.4 54.8 73.6 20.1% 31.6% 71.0 71.9 71.4 -1.0% 59.5%Goods and services1 12.2 7.2 10.7 33.1 39.4% 9.3% 15.1 15.0 17.0 -19.9% 16.6%of which: Catering: Departmental activities 0.4 0.1 0.2 0.5 9.0% 0.2% 0.4 0.4 0.4 -3.8% 0.4%Communication 0.3 0.5 0.5 0.6 28.0% 0.3% 0.4 0.5 0.5 -7.1% 0.4%Consultants: Business and advisory services 3.1 1.3 3.2 15.9 72.0% 3.4% 5.5 5.8 7.4 -22.6% 7.1%Consumables: Stationery, printing and office supplies
0.5 0.2 0.5 0.9 25.9% 0.3% 0.3 0.5 0.5 -21.1% 0.5%
Travel and subsistence 6.6 3.1 5.4 8.0 6.7% 3.4% 6.5 6.3 6.7 -5.3% 5.7%Venues and facilities 0.9 1.8 0.2 1.2 9.3% 0.6% 0.9 0.4 0.4 -30.1% 0.6%Transfers and subsidies1 176.0 183.2 11.3 11.5 -59.8% 56.1% 32.2 32.8 33.4 42.8% 22.7%Departmental agencies and accounts 174.3 176.5 8.6 8.5 -63.4% 54.0% 28.9 29.5 30.0 52.1% 20.0%Public corporations and private enterprises 1.5 1.5 1.6 1.7 3.3% 0.9% 1.7 1.8 1.9 5.5% 1.5%Non-profit institutions – 5.0 1.0 1.0 – 1.0% 1.5 1.5 1.5 14.5% 1.1%Households 0.2 0.2 0.1 0.3 7.4% 0.1% – – – -100.0% 0.1%Payments for capital assets 0.5 0.3 3.7 3.8 96.0% 1.2% 1.1 0.5 0.5 -50.3% 1.2%Machinery and equipment 0.5 0.3 3.7 3.6 92.5% 1.2% 1.1 0.5 0.5 -49.4% 1.2%Software and other intangible assets – – – 0.2 – – – – – -100.0% – Payments for financial assets – – 11.9 – – 1.8% – – – – – Total 231.2 235.1 92.5 121.9 -19.2% 100.0% 119.4 120.1 122.3 0.1% 100.0%Proportion of total programme expenditure to vote expenditure
2.8% 2.7% 1.0% 1.2% – – 1.3% 1.2% 1.3% – –
Details of selected transfers and subsidies Departmental agencies and accounts Departmental agencies (non-business entities)
Current 174.3 176.5 8.6 8.5 -63.4% 54.0% 28.9 29.5 30.0 52.1% 20.0%Independent Regulatory Board for Auditors – 1.8 0.5 – – 0.3% – – – – – National Research Foundation: Technology and human resources for industry programme
160.6 165.6 – – -100.0% 47.9% – – – – –
National Productivity Institute 13.7 9.2 8.1 8.5 -14.5% 5.8% 8.9 9.5 10.0 5.5% 7.6%Broad-Based Black Economic Empowerment Commission
– – – – – – 20.0 20.0 20.0 – 12.4%
Public corporations and private enterprises Public corporations Other transfers to public corporations Current 1.5 1.5 1.6 1.7 3.3% 0.9% 1.7 1.8 1.9 5.5% 1.5%Council for Scientific and Industrial Research 1.5 1.5 1.6 1.7 3.3% 0.9% 1.7 1.8 1.9 5.5% 1.5%1. Estimates of National Expenditure data tables are available and can be downloaded from www.treasury.gov.za. These data tables contain detailed information by goods and services, and
transfers and subsidies item by programme.

2017 Estimates of National Expenditure
646
Programme 4: Industrial Development Programme purpose Design and implement policies, strategies and programmes to strengthen the ability of the manufacturing and other sectors of the economy, to create decent jobs and increase value addition and competitiveness in both domestic and export markets.
Objective • Support the growth and diversification of South Africa’s manufacturing sector by:
– facilitating diversification beyond the current reliance on traditional commodities and non-tradable services through the promotion of increased value addition characterised by movement into non-traditional tradable goods and services that compete in export markets, as well as against imports, over the medium term
– promoting the long-term intensification of South Africa’s industrialisation process and movement towards a knowledge economy on an ongoing basis
– promoting a labour absorbing industrialisation path, with particular emphasis on tradable labour absorbing goods and services, and economic linkages that catalyse employment creation on an ongoing basis
– promoting a broad-based industrialisation path characterised by the increased participation of historically disadvantaged people and marginalised regions in the mainstream industrial economy on an ongoing basis
– contributing to industrial development in Africa, with an emphasis on building the continent’s productive capacity, on an ongoing basis.
Subprogrammes • Industrial Competitiveness develops policies, strategies and programmes to strengthen the ability of
manufacturing and other value-adding sectors to create decent jobs, and increase value addition and competitiveness in domestic and export markets, as set out in the annual three-year rolling industrial policy action plan.
• Customised Sector Programmes develops and implements high-impact sector strategies focused on manufacturing and other value-adding sectors to create decent jobs, and increases value addition and competitiveness in domestic and export markets, as set out in the annual three-year rolling industrial policy action plan.
Expenditure trends and estimates Table 34.11 Industrial Development expenditure trends and estimates by subprogramme and economic classification Subprogramme
Audited outcome Adjusted
appropriation
Averagegrowth
rate(%)
Average: Expen-diture/
Total(%)
Medium-term expenditure estimate
Averagegrowth
rate(%)
Average:Expen-diture/
Total(%)
R million 2013/14 2014/15 2015/16 2016/17 2013/14 - 2016/17 2017/18 2018/19 2019/20 2016/17 - 2019/20 Industrial Competitiveness 595.7 650.9 682.8 685.6 4.8% 37.1% 800.0 781.8 824.3 6.3% 43.0%Customised Sector Programmes 995.4 1 124.2 1 270.9 1 041.4 1.5% 62.9% 1 019.3 994.0 1 044.9 0.1% 57.0%Total 1 591.2 1 775.2 1 953.6 1 727.0 2.8% 100.0% 1 819.3 1 775.8 1 869.2 2.7% 100.0%Change to 2016 Budget estimate
(8.7) 5.2 (0.6) (6.7)
Economic classification Current payments 99.2 103.9 118.1 115.2 5.1% 6.2% 122.1 125.0 125.4 2.9% 6.8%Compensation of employees 82.3 88.9 99.6 105.2 8.5% 5.3% 106.5 108.0 105.8 0.2% 5.9%Goods and services1 16.9 15.0 18.5 10.0 -16.1% 0.9% 15.6 17.1 19.5 24.9% 0.9%of which: Communication 0.5 0.5 0.6 0.4 -9.3% – 0.7 0.8 0.8 31.6% – Consultants: Business and advisory services
3.8 3.5 7.1 1.0 -35.3% 0.2% 1.7 1.3 3.0 43.8% 0.1%
Consumables: Stationery, printing and office supplies
0.5 0.3 0.5 0.2 -26.4% – 0.0 0.0 1.0 68.4% –
Travel and subsistence 9.5 7.2 7.7 6.1 -13.8% 0.4% 10.6 11.4 11.6 24.2% 0.6%Operating payments 1.1 1.8 1.7 1.4 9.9% 0.1% 0.8 1.8 0.8 -15.9% 0.1%Venues and facilities 0.5 0.3 0.4 0.5 2.3% – 0.8 0.9 1.1 28.1% –

Vote 34: Trade and Industry
647
Table 34.11 Industrial Development expenditure trends and estimates by subprogramme and economic classification
Audited outcome Adjusted
appropriation
Averagegrowth
rate(%)
Average: Expen-diture/
Total(%)
Medium-term expenditure estimate
Averagegrowth
rate(%)
Average:Expen-diture/
Total(%)
R million 2013/14 2014/15 2015/16 2016/17 2013/14 - 2016/17 2017/18 2018/19 2019/20 2016/17 - 2019/20 Transfers and subsidies1 1 491.5 1 670.6 1 835.0 1 610.4 2.6% 93.8% 1 696.3 1 649.9 1 742.9 2.7% 93.2%Departmental agencies and accounts 282.4 348.0 368.7 372.8 9.7% 19.5% 411.9 403.2 425.8 4.5% 22.4%Foreign governments and international organisations
7.3 5.1 7.9 8.5 5.1% 0.4% 8.6 9.1 9.6 4.0% 0.5%
Public corporations and private enterprises
1 106.8 1 188.4 1 310.1 1 067.0 -1.2% 66.3% 1 116.6 1 089.0 1 150.1 2.5% 61.5%
Non-profit institutions 94.8 129.0 147.9 162.1 19.6% 7.6% 159.3 148.6 157.5 -1.0% 8.7%Households 0.2 0.1 0.5 0.0 -59.5% – – – – -100.0% – Payments for capital assets 0.4 0.7 0.3 1.4 50.0% – 0.8 0.9 0.9 -12.9% 0.1%Machinery and equipment 0.4 0.7 0.3 1.4 50.0% – 0.8 0.9 0.9 -12.9% 0.1%Payments for financial assets – – 0.1 – – – – – – – – Total 1 591.2 1 775.2 1 953.6 1 727.0 2.8% 100.0% 1 819.3 1 775.8 1 869.2 2.7% 100.0%Proportion of total programme expenditure to vote expenditure
19.1% 20.5% 20.6% 16.6% – – 19.6% 17.8% 20.5% – –
Details of selected transfers and subsidies Departmental agencies and accounts Departmental agencies (non-business entities)
Current 222.4 237.0 214.1 210.0 -1.9% 12.5% 265.5 280.2 295.8 12.1% 14.6%South African National Accreditation System
33.5 35.7 26.0 22.2 -12.8% 1.7% 30.3 31.8 33.6 14.8% 1.6%
National Metrology Institute of South Africa: Operations
85.9 91.6 96.3 101.4 5.7% 5.3% 106.5 112.6 119.0 5.5% 6.1%
National Regulator for Compulsory Specifications
103.0 109.7 91.7 86.4 -5.7% 5.5% 128.7 135.7 143.3 18.4% 6.9%
Capital 60.0 111.0 154.6 162.8 39.5% 6.9% 146.3 123.1 130.0 -7.2% 7.8%National Metrology Institute of South Africa
60.0 111.0 154.6 162.8 39.5% 6.9% 146.3 123.1 130.0 -7.2% 7.8%
Foreign governments and international organisations Current 7.3 5.1 7.9 8.5 5.1% 0.4% 8.6 9.1 9.6 4.0% 0.5%United Nations Industrial Development Organisation
5.9 5.1 6.4 6.5 3.3% 0.3% 6.8 7.2 7.6 5.4% 0.4%
Treaty Organisations for Metrology 1.5 – 1.5 2.1 11.7% 0.1% 1.8 1.9 2.0 -0.8% 0.1%Non-profit institutions Current 94.8 129.0 147.9 162.1 19.6% 7.6% 159.3 148.6 157.5 -1.0% 8.7%Intsimbi national tooling initiative 54.4 67.7 70.4 74.1 10.8% 3.8% 75.8 82.3 86.9 5.5% 4.4%Automotive supply chain competitiveness initiative
– – 14.0 15.0 – 0.4% 13.1 8.0 8.8 -16.2% 0.6%
Trade and industrial policy strategies 6.0 14.6 20.8 22.7 55.8% 0.9% 21.4 12.1 12.8 -17.5% 1.0%Centurion Aerospace Village 15.8 16.7 17.5 18.4 5.3% 1.0% 19.4 15.5 16.4 -3.9% 1.0%Proudly South African campaign 18.6 30.0 25.2 31.9 19.8% 1.5% 29.6 30.7 32.6 0.8% 1.7%Public corporations and private enterprises Public corporations Other transfers to public corporations Current 1 041.9 1 164.2 1 288.5 1 049.2 0.2% 64.5% 1 097.6 1 068.6 1 128.5 2.5% 60.4%Industrial Development Corporation of South Africa
822.8 878.2 1 000.9 758.3 -2.7% 49.1% 723.4 697.5 736.5 -1.0% 40.5%
Council for Scientific and Industrial Research: National Cleaner Production Centre
– 51.7 55.0 58.9 – 2.3% 63.0 63.0 66.6 4.2% 3.5%
South African Bureau of Standards 205.0 220.1 216.2 212.4 1.2% 12.1% 285.5 280.7 296.4 11.8% 14.9%Council for Scientific and Industrial Research: National foundry technology network
14.1 14.2 16.4 19.7 11.7% 0.9% 25.7 27.5 29.0 13.8% 1.4%
Capital 64.9 24.1 21.5 17.8 -35.1% 1.8% 19.0 20.4 21.6 6.6% 1.1%Council for Scientific and Industrial Research: Aerospace industry
21.2 22.5 21.5 17.8 -5.7% 1.2% 19.0 20.4 21.6 6.6% 1.1%
South African Bureau of Standards: Upgrading of vehicle testing facility
43.7 – – – -100.0% 0.6% – – – – –
South African Bureau of Standards – 1.6 – – – – – – – – – 1. Estimates of National Expenditure data tables are available and can be downloaded from www.treasury.gov.za. These data tables contain detailed information by goods and services, and
transfers and subsidies item by programme.
Programme 5: Consumer and Corporate Regulation Programme purpose Develop and implement coherent, predictable and transparent regulatory solutions that facilitate easy access to redress and efficient regulation for economic citizens.

2017 Estimates of National Expenditure
648
Objectives • Increase access to economic opportunities for small businesses and historically disadvantaged citizens by
developing and reviewing policies, bills and regulations; and conducting assessments of the impact of the regulations on businesses and economic citizens by 31 March 2020.
• Develop efficient regulation to reduce the regulatory burden on businesses, and increase confidence and certainty in South African business regulation by developing and reviewing policies, bills and regulations; and conducting assessments of the impact of the regulations on businesses and economic citizens by 31 March 2020.
• Create a business regulatory environment that promotes competitive, fair and efficient markets by developing and reviewing policies, bills and regulations; and conducting assessments of the impact of the regulations on businesses and economic citizens by 31 March 2020.
• Provide access to redress for economic citizens to increase confidence in markets by conducting research on the impact of the current legislation on economic citizens; developing and reviewing policies, bills and regulations; and conducting assessments of the impact of the regulations on businesses and economic citizens by 31 March 2020.
• Promote the awareness of rights, duties and responsibilities to increase activism and public participation by conducting capacity building sessions, workshops, and education and awareness campaigns by 31 March 2020.
• Share and exchange regulatory experience with partners and stakeholders nationally and internationally to promote simple, appropriate and more effective regulatory solutions by holding consultations, seminars and conferences on policy issues by 31 March 2020.
Subprogrammes • Policy and Legislative Development develops policies, laws and regulatory frameworks. • Enforcement and Compliance conducts trend analyses, impact assessments and market surveys; and monitors
the effectiveness of regulation. • Regulatory Services executes oversight of and transfers funds to the following regulatory agencies: the
National Consumer Tribunal, the National Credit Regulator, the National Gambling Board, the National Consumer Commission, the Companies and Intellectual Property Commission, and the Companies Tribunal. The department exercises oversight of, but does not transfer funds to: the National Lotteries Commission, which regulates the lotteries sector and facilitates the distribution of lottery funds to worthy organisations that serve the public interest; and the Takeover Regulation Panel and the Financial Reporting Standards Council, which are responsible for regulating applicable transactions and issuing standards.
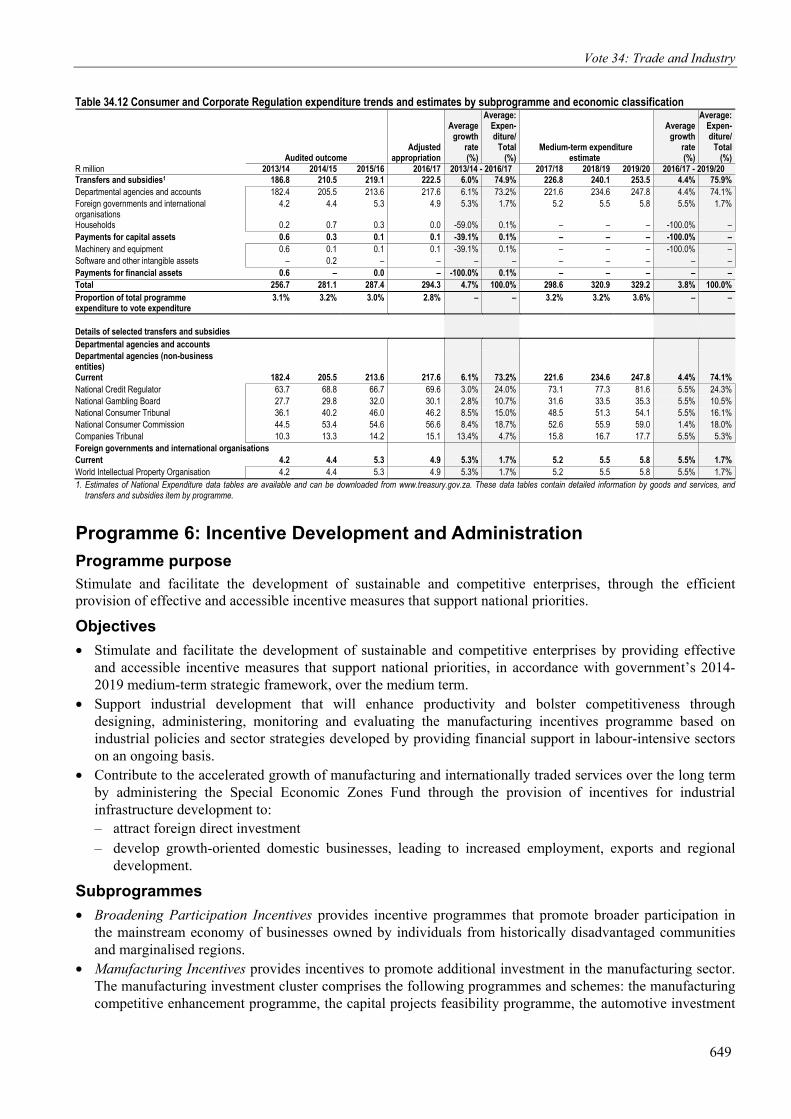
Expenditure trends and estimates Table 34.12 Consumer and Corporate Regulation expenditure trends and estimates by subprogramme and economic classificationSubprogramme
Audited outcome Adjusted
appropriation
Averagegrowth
rate(%)
Average: Expen-diture/
Total(%)
Medium-term expenditure estimate
Averagegrowth
rate(%)
Average:Expen-diture/
Total(%)
R million 2013/14 2014/15 2015/16 2016/17 2013/14 - 2016/17 2017/18 2018/19 2019/20 2016/17 - 2019/20 Policy and Legislative Development 19.2 17.6 14.7 14.9 -8.0% 5.9% 17.4 20.1 19.2 8.8% 5.8%Enforcement and Compliance 23.2 31.4 39.3 41.6 21.6% 12.1% 40.3 42.9 41.5 -0.1% 13.4%Regulatory Services 214.3 232.0 233.4 237.8 3.5% 82.0% 240.9 257.9 268.4 4.1% 80.8%Total 256.7 281.1 287.4 294.3 4.7% 100.0% 298.6 320.9 329.2 3.8% 100.0%Change to 2016 Budget estimate
(19.2) (28.3) (24.9) (35.9)
Economic classification Current payments 68.7 70.3 68.2 71.7 1.4% 24.9% 71.9 80.8 75.6 1.8% 24.1%Compensation of employees 48.7 57.2 54.5 62.8 8.9% 19.9% 53.8 61.6 55.4 -4.1% 18.8%Goods and services1 20.0 13.1 13.8 8.9 -23.7% 5.0% 18.1 19.1 20.2 31.6% 5.3%of which: Advertising 3.3 2.0 2.0 0.5 -46.7% 0.7% 2.1 1.7 1.8 55.2% 0.5%Catering: Departmental activities 0.6 0.3 0.1 0.2 -32.4% 0.1% 0.4 0.8 0.9 63.4% 0.2%Consultants: Business and advisory services 2.5 1.8 1.5 1.5 -16.7% 0.7% 4.3 5.2 5.5 55.1% 1.3%Travel and subsistence 7.5 4.1 6.2 4.7 -14.3% 2.0% 8.8 8.4 8.8 23.5% 2.5%Operating payments 0.7 0.6 0.7 – -100.0% 0.2% 0.7 0.8 0.8 – 0.2%Venues and facilities 1.1 0.9 0.8 0.3 -35.8% 0.3% 0.8 1.0 1.1 57.0% 0.3%
Vote 34: Trade and Industry
649
Table 34.12 Consumer and Corporate Regulation expenditure trends and estimates by subprogramme and economic classification
Audited outcome Adjusted
appropriation
Averagegrowth
rate(%)
Average: Expen-diture/
Total(%)
Medium-term expenditure estimate
Averagegrowth
rate(%)
Average:Expen-diture/
Total(%)
R million 2013/14 2014/15 2015/16 2016/17 2013/14 - 2016/17 2017/18 2018/19 2019/20 2016/17 - 2019/20 Transfers and subsidies1 186.8 210.5 219.1 222.5 6.0% 74.9% 226.8 240.1 253.5 4.4% 75.9%Departmental agencies and accounts 182.4 205.5 213.6 217.6 6.1% 73.2% 221.6 234.6 247.8 4.4% 74.1%Foreign governments and international organisations
4.2 4.4 5.3 4.9 5.3% 1.7% 5.2 5.5 5.8 5.5% 1.7%
Households 0.2 0.7 0.3 0.0 -59.0% 0.1% – – – -100.0% – Payments for capital assets 0.6 0.3 0.1 0.1 -39.1% 0.1% – – – -100.0% – Machinery and equipment 0.6 0.1 0.1 0.1 -39.1% 0.1% – – – -100.0% – Software and other intangible assets – 0.2 – – – – – – – – – Payments for financial assets 0.6 – 0.0 – -100.0% 0.1% – – – – – Total 256.7 281.1 287.4 294.3 4.7% 100.0% 298.6 320.9 329.2 3.8% 100.0%Proportion of total programme expenditure to vote expenditure
3.1% 3.2% 3.0% 2.8% – – 3.2% 3.2% 3.6% – –
Details of selected transfers and subsidies Departmental agencies and accounts Departmental agencies (non-business entities)
Current 182.4 205.5 213.6 217.6 6.1% 73.2% 221.6 234.6 247.8 4.4% 74.1%National Credit Regulator 63.7 68.8 66.7 69.6 3.0% 24.0% 73.1 77.3 81.6 5.5% 24.3%National Gambling Board 27.7 29.8 32.0 30.1 2.8% 10.7% 31.6 33.5 35.3 5.5% 10.5%National Consumer Tribunal 36.1 40.2 46.0 46.2 8.5% 15.0% 48.5 51.3 54.1 5.5% 16.1%National Consumer Commission 44.5 53.4 54.6 56.6 8.4% 18.7% 52.6 55.9 59.0 1.4% 18.0%Companies Tribunal 10.3 13.3 14.2 15.1 13.4% 4.7% 15.8 16.7 17.7 5.5% 5.3%Foreign governments and international organisations Current 4.2 4.4 5.3 4.9 5.3% 1.7% 5.2 5.5 5.8 5.5% 1.7%World Intellectual Property Organisation 4.2 4.4 5.3 4.9 5.3% 1.7% 5.2 5.5 5.8 5.5% 1.7%1. Estimates of National Expenditure data tables are available and can be downloaded from www.treasury.gov.za. These data tables contain detailed information by goods and services, and
transfers and subsidies item by programme.
Programme 6: Incentive Development and Administration Programme purpose Stimulate and facilitate the development of sustainable and competitive enterprises, through the efficient provision of effective and accessible incentive measures that support national priorities.
Objectives • Stimulate and facilitate the development of sustainable and competitive enterprises by providing effective
and accessible incentive measures that support national priorities, in accordance with government’s 2014-2019 medium-term strategic framework, over the medium term.
• Support industrial development that will enhance productivity and bolster competitiveness through designing, administering, monitoring and evaluating the manufacturing incentives programme based on industrial policies and sector strategies developed by providing financial support in labour-intensive sectors on an ongoing basis.
• Contribute to the accelerated growth of manufacturing and internationally traded services over the long term by administering the Special Economic Zones Fund through the provision of incentives for industrial infrastructure development to: – attract foreign direct investment – develop growth-oriented domestic businesses, leading to increased employment, exports and regional
development.
Subprogrammes • Broadening Participation Incentives provides incentive programmes that promote broader participation in
the mainstream economy of businesses owned by individuals from historically disadvantaged communities and marginalised regions.
• Manufacturing Incentives provides incentives to promote additional investment in the manufacturing sector. The manufacturing investment cluster comprises the following programmes and schemes: the manufacturing competitive enhancement programme, the capital projects feasibility programme, the automotive investment

2017 Estimates of National Expenditure
650
scheme, the export marketing and investment assistance scheme, the sector specific assistance scheme, and the section 12I tax incentive scheme.
• Services Investment Incentives provides incentive programmes that promote increased investment and job creation in the services sector. The programmes include the business process services programme, and the film and television production incentive support programme for South African and foreign productions.
• Infrastructure Investment Support provides grants for two industrial infrastructure initiatives: the special economic zones and the critical infrastructure programme, which are aimed at enhancing infrastructure and industrial development, and increasing investment and exports of value-added commodities.
• Product and Systems Development reviews, monitors and develops incentive programmes to support the industrial policy action plan, and develops sector strategies to address market failures.
• Strategic Partnership and Customer Care facilitates access to targeted enterprises by reviewing the success of incentive schemes and improving them where possible.
Expenditure trends and estimates Table 34.13 Incentive Development and Administration expenditure trends and estimates by subprogramme and economic classificationSubprogramme
Audited outcome Adjusted
appropriation
Averagegrowth
rate(%)
Average: Expen-diture/
Total(%)
Medium-term expenditure estimate
Averagegrowth
rate(%)
Average:Expen-diture/
Total(%)
R million 2013/14 2014/15 2015/16 2016/17 2013/14 - 2016/17 2017/18 2018/19 2019/20 2016/17 - 2019/20 Broadening Participation Incentives 129.3 2.4 26.6 65.3 -20.4% 1.0% 68.3 72.3 76.4 5.4% 1.2%Manufacturing Incentives 3 338.6 3 612.3 3 983.5 4 467.0 10.2% 67.1% 3 963.2 3 949.1 2 811.0 -14.3% 62.2%Services Investment Incentives 564.4 728.1 803.2 613.8 2.8% 11.8% 708.6 749.1 722.7 5.6% 11.4%Infrastructure Investment Support 1 038.6 801.4 949.7 1 711.4 18.1% 19.6% 965.0 1 601.7 1 691.6 -0.4% 24.5%Product and Systems Development 13.0 15.0 14.9 15.9 6.9% 0.3% 19.4 20.5 22.0 11.6% 0.3%Strategic Partnership and Customer Care
17.9 17.5 17.9 18.3 0.8% 0.3% 22.1 23.3 25.0 10.9% 0.4%
Total 5 101.9 5 176.7 5 795.8 6 891.7 10.5% 100.0% 5 746.5 6 416.0 5 348.8 -8.1% 100.0%Change to 2016 Budget estimate
(30.7) (26.4) 1 320.8 (31.8)
Economic classification `
Current payments 150.8 206.9 151.2 151.6 0.2% 2.9% 165.4 172.3 174.7 4.8% 2.7%Compensation of employees 112.5 125.8 126.5 131.0 5.2% 2.2% 126.6 131.6 138.0 1.8% 2.2%Goods and services1 38.4 81.1 24.8 20.6 -18.7% 0.7% 38.8 40.7 36.7 21.2% 0.6%of which: Communication 0.5 0.6 0.6 0.2 -21.2% – 0.6 0.7 0.7 42.6% – Consultants: Business and advisory services
15.0 62.2 5.1 5.4 -28.7% 0.4% 16.5 17.7 12.4 31.7% 0.2%
Legal services 2.7 4.1 3.9 3.2 6.0% 0.1% 3.6 3.8 4.0 7.6% 0.1%Operating leases 0.8 0.8 0.8 0.6 -9.0% – 0.9 0.9 1.0 17.5% – Travel and subsistence 14.8 11.3 9.7 10.3 -11.4% 0.2% 14.9 15.1 15.9 15.6% 0.2%Venues and facilities 1.7 0.1 0.4 – -100.0% – 0.8 0.9 0.9 – – Transfers and subsidies1 4 943.5 4 969.1 5 641.3 6 732.8 10.8% 97.0% 5 573.5 6 236.4 5 160.0 -8.5% 97.1%Departmental agencies and accounts
– – – 256.0 – 1.1% 84.0 – – -100.0% 1.4%
Public corporations and private enterprises
4 943.2 4 968.5 5 640.6 6 476.0 9.4% 95.9% 5 488.7 6 235.5 5 159.1 -7.3% 95.7%
Households 0.3 0.6 0.7 0.8 34.3% – 0.8 0.8 0.9 3.7% – Payments for capital assets 7.5 0.8 3.3 7.3 -0.7% 0.1% 7.6 7.3 14.1 24.4% 0.1%Machinery and equipment 1.8 0.8 0.7 2.0 4.7% – 2.1 2.2 2.3 5.2% – Software and other intangible assets
5.7 – 2.6 5.3 -2.4% 0.1% 5.5 5.1 11.7 30.4% 0.1%
Total 5 101.9 5 176.7 5 795.8 6 891.7 10.5% 100.0% 5 746.5 6 416.0 5 348.8 -8.1% 100.0%Proportion of total programme expenditure to vote expenditure
61.3% 59.8% 61.2% 66.3% – – 62.0% 64.4% 58.7% – –
Details of selected transfers and subsidies Departmental agencies and accounts
Departmental agencies (non-business entities)
Current – – – 256.0 – 1.1% 84.0 – – -100.0% 1.4%National Research Foundation – – – 256.0 – 1.1% 84.0 – – -100.0% 1.4%

Vote 34: Trade and Industry
651
Table 34.13 Incentive Development and Administration expenditure trends and estimates by subprogramme and economic classification
Audited outcome Adjusted
appropriation
Averagegrowth
rate(%)
Average: Expen-diture/
Total(%)
Medium-term expenditure estimate
Averagegrowth
rate(%)
Average:Expen-diture/
Total(%)
R million 2013/14 2014/15 2015/16 2016/17 2013/14 - 2016/17 2017/18 2018/19 2019/20 2016/17 - 2019/20 Public corporations and private enterprises Public corporations Other transfers to public corporations Capital 887.4 608.2 735.6 1 410.0 16.7% 15.9% 695.4 1 391.0 1 557.3 3.4% 20.7%Coega Development Corporation 308.2 – – – -100.0% 1.3% – – – – – Various institutions: Special economic zones
449.2 608.2 735.6 1 310.0 42.9% 13.5% 605.4 1 300.0 1 457.3 3.6% 19.1%
Various institutions: Critical infrastructure programme
– – – 100.0 – 0.4% 90.0 91.0 100.0 – 1.6%
East London industrial development zone
100.0 – – – -100.0% 0.4% – – – – –
Richards Bay industrial development zone
30.0 – – – -100.0% 0.1% – – – – –
Public corporations and private enterprises Private enterprises Other transfers to private enterprises Current 400.6 329.5 304.1 285.3 -10.7% 5.7% 276.4 295.4 311.9 3.0% 4.8%Broadening participation development incentives
72.9 – – – -100.0% 0.3% – – – – –
Various Institutions: Support programme for industrial innovation
53.9 – 22.8 60.9 4.2% 0.6% 63.9 67.6 71.4 5.5% 1.1%
Various institutions: Export market and investment assistance
273.8 329.5 281.2 224.4 -6.4% 4.8% 212.5 227.7 240.5 2.3% 3.7%
Capital 140.0 81.3 74.2 190.0 10.7% 2.1% 119.5 120.1 122.9 -13.5% 2.3%Various institutions: Critical infrastructure programme
140.0 81.3 74.2 190.0 10.7% 2.1% 119.5 120.1 122.9 -13.5% 2.3%
Public corporations and private enterprises Private enterprises Private enterprises (subsidies on products and production) Current 3 515.3 3 949.4 4 526.7 4 590.7 9.3% 72.2% 4 397.4 4 429.1 3 167.0 -11.6% 68.0%Various institutions: Services sector development incentives
555.0 715.0 789.7 600.0 2.6% 11.6% 692.5 732.1 704.4 5.5% 11.2%
Various institutions: Manufacturing development incentives
2 960.3 3 134.8 3 607.0 3 890.7 9.5% 59.2% 3 564.9 3 617.0 2 462.6 -14.1% 55.5%
Various institutions: Industrial development zones (other)
– 99.6 130.0 100.0 – 1.4% 140.0 80.0 – -100.0% 1.3%
1. Estimates of National Expenditure data tables are available and can be downloaded from www.treasury.gov.za. These data tables contain detailed information by goods and services, and transfers and subsidies item by programme.
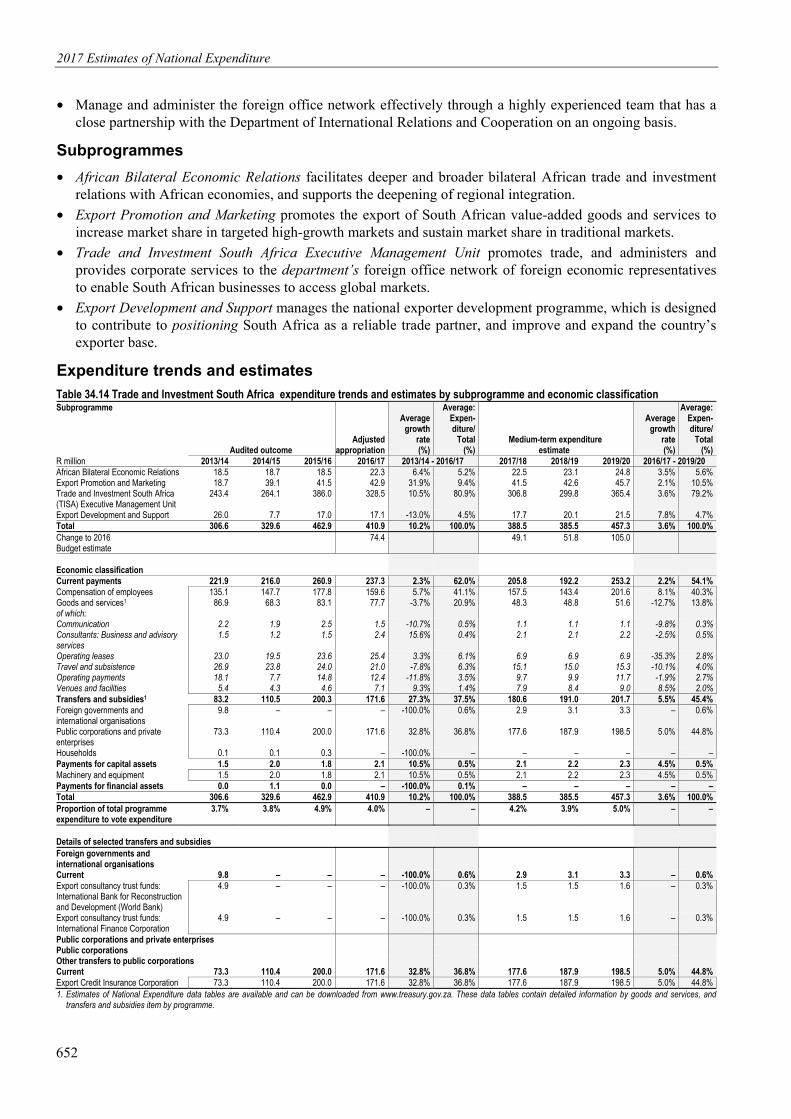
Programme 7: Trade and Investment South Africa Programme purpose Support export development and promote exports through targeted strategies, and effectively manage a network of foreign offices.
Objectives • Promote the export of South African value-added goods and services in targeted high-growth markets, and
sustain market share in traditional markets through the implementation of the integrated national export strategy and the market and product diversification strategy by participating in 17 national pavilions and 22 trade missions by March 2018.
• Facilitate markets for South African manufactured goods and services by promoting export and investment projects in high-yield targeted countries such as the Brazil-Russia-India-China-South Africa group of countries, African countries, and other developing countries by March 2018.
• Enhance the ongoing promotion of exports and investment by placing 48 foreign economic representatives in foreign economic missions to promote South Africa’s comparative advantage in goods and services internationally over the medium term.
• Develop new and existing South African export capabilities to grow manufactured exports by providing appropriate information, financial support and practical assistance to sustain organic growth in traditional markets, and penetrate new high-growth markets on an ongoing basis.
2017 Estimates of National Expenditure
652
• Manage and administer the foreign office network effectively through a highly experienced team that has a close partnership with the Department of International Relations and Cooperation on an ongoing basis.
Subprogrammes • African Bilateral Economic Relations facilitates deeper and broader bilateral African trade and investment
relations with African economies, and supports the deepening of regional integration. • Export Promotion and Marketing promotes the export of South African value-added goods and services to
increase market share in targeted high-growth markets and sustain market share in traditional markets. • Trade and Investment South Africa Executive Management Unit promotes trade, and administers and
provides corporate services to the department’s foreign office network of foreign economic representatives to enable South African businesses to access global markets.
• Export Development and Support manages the national exporter development programme, which is designed to contribute to positioning South Africa as a reliable trade partner, and improve and expand the country’s exporter base.
Expenditure trends and estimates Table 34.14 Trade and Investment South Africa expenditure trends and estimates by subprogramme and economic classificationSubprogramme
Audited outcome Adjusted
appropriation
Averagegrowth
rate(%)
Average: Expen-diture/
Total(%)
Medium-term expenditure estimate
Averagegrowth
rate(%)
Average:Expen-diture/
Total(%)
R million 2013/14 2014/15 2015/16 2016/17 2013/14 - 2016/17 2017/18 2018/19 2019/20 2016/17 - 2019/20 African Bilateral Economic Relations 18.5 18.7 18.5 22.3 6.4% 5.2% 22.5 23.1 24.8 3.5% 5.6%Export Promotion and Marketing 18.7 39.1 41.5 42.9 31.9% 9.4% 41.5 42.6 45.7 2.1% 10.5%Trade and Investment South Africa (TISA) Executive Management Unit
243.4 264.1 386.0 328.5 10.5% 80.9% 306.8 299.8 365.4 3.6% 79.2%
Export Development and Support 26.0 7.7 17.0 17.1 -13.0% 4.5% 17.7 20.1 21.5 7.8% 4.7%Total 306.6 329.6 462.9 410.9 10.2% 100.0% 388.5 385.5 457.3 3.6% 100.0%Change to 2016 Budget estimate
74.4 49.1 51.8 105.0
Economic classification
Current payments 221.9 216.0 260.9 237.3 2.3% 62.0% 205.8 192.2 253.2 2.2% 54.1%Compensation of employees 135.1 147.7 177.8 159.6 5.7% 41.1% 157.5 143.4 201.6 8.1% 40.3%Goods and services1 86.9 68.3 83.1 77.7 -3.7% 20.9% 48.3 48.8 51.6 -12.7% 13.8%of which: Communication 2.2 1.9 2.5 1.5 -10.7% 0.5% 1.1 1.1 1.1 -9.8% 0.3%Consultants: Business and advisory services
1.5 1.2 1.5 2.4 15.6% 0.4% 2.1 2.1 2.2 -2.5% 0.5%
Operating leases 23.0 19.5 23.6 25.4 3.3% 6.1% 6.9 6.9 6.9 -35.3% 2.8%Travel and subsistence 26.9 23.8 24.0 21.0 -7.8% 6.3% 15.1 15.0 15.3 -10.1% 4.0%Operating payments 18.1 7.7 14.8 12.4 -11.8% 3.5% 9.7 9.9 11.7 -1.9% 2.7%Venues and facilities 5.4 4.3 4.6 7.1 9.3% 1.4% 7.9 8.4 9.0 8.5% 2.0%Transfers and subsidies1 83.2 110.5 200.3 171.6 27.3% 37.5% 180.6 191.0 201.7 5.5% 45.4%Foreign governments and international organisations
9.8 – – – -100.0% 0.6% 2.9 3.1 3.3 – 0.6%
Public corporations and private enterprises
73.3 110.4 200.0 171.6 32.8% 36.8% 177.6 187.9 198.5 5.0% 44.8%
Households 0.1 0.1 0.3 – -100.0% – – – – – – Payments for capital assets 1.5 2.0 1.8 2.1 10.5% 0.5% 2.1 2.2 2.3 4.5% 0.5%Machinery and equipment 1.5 2.0 1.8 2.1 10.5% 0.5% 2.1 2.2 2.3 4.5% 0.5%Payments for financial assets 0.0 1.1 0.0 – -100.0% 0.1% – – – – – Total 306.6 329.6 462.9 410.9 10.2% 100.0% 388.5 385.5 457.3 3.6% 100.0%Proportion of total programme expenditure to vote expenditure
3.7% 3.8% 4.9% 4.0% – – 4.2% 3.9% 5.0% – –
Details of selected transfers and subsidies Foreign governments and international organisations
Current 9.8 – – – -100.0% 0.6% 2.9 3.1 3.3 – 0.6%Export consultancy trust funds: International Bank for Reconstruction and Development (World Bank)
4.9 – – – -100.0% 0.3% 1.5 1.5 1.6 – 0.3%
Export consultancy trust funds: International Finance Corporation
4.9 – – – -100.0% 0.3% 1.5 1.5 1.6 – 0.3%
Public corporations and private enterprises Public corporations Other transfers to public corporations Current 73.3 110.4 200.0 171.6 32.8% 36.8% 177.6 187.9 198.5 5.0% 44.8%Export Credit Insurance Corporation 73.3 110.4 200.0 171.6 32.8% 36.8% 177.6 187.9 198.5 5.0% 44.8%1. Estimates of National Expenditure data tables are available and can be downloaded from www.treasury.gov.za. These data tables contain detailed information by goods and services, and
transfers and subsidies item by programme.

Vote 34: Trade and Industry
653
Programme 8: Investment South Africa Programme purpose Support foreign direct investment flows and domestic investment by providing a one-stop shop for investment promotion, investor facilitation and aftercare support for investors.
Objectives • Increase the quality and quantum of South Africa’s fixed investment on an ongoing basis by:
– marketing and promoting the country to ensure investment opportunities through dedicated investment promotion, facilitation and aftercare services
– coordinating and leading the establishment of one-stop shops on behalf of government to facilitate investment for all investors
– coordinating and facilitating the investment climate reform with the World Bank on the ease of doing business
– developing a pipeline of potential projects and contributing to South Africa being a preferred destination for investment
– undertaking aftercare forums with investors to retain and expand investment. • Provide a dedicated service to all investors over the medium term by:
– facilitating the entire investment value chain – developing an investment pipeline of possible projects through lead creation, marketing, project
development, facilitation and aftercare. • Provide specialist advisory services and policy advocacy to improve the investment climate by fast-tracking
and unblocking investor issues to reduce red tape in government over the medium term.
Subprogrammes • Investment Promotion facilitates an increase in the quality and quantity of foreign direct investment, and
domestic and outward investment, by providing investment attraction, targeted lead generation and recruitment support.
• Investment and Interdepartmental Clearing House promotes and facilitates investment, and provides support services to the investment and interdepartmental clearing house. This subprogramme also provides a specialist advisory service, and fast-tracks, unblocks and reduces red tape for investors.
• Investment Support and Aftercare provides specialist advisory services through research, information marketing, aftercare and policy advocacy to facilitate new investment, and retain and expand existing investment.
Expenditure trends and estimates Table 34.15 Investment South Africa expenditure trends and estimates by subprogramme and economic classification Subprogramme
Audited outcome Adjusted
appropriation
Averagegrowth
rate(%)
Average: Expen-diture/
Total(%)
Medium-term expenditure estimate
Averagegrowth
rate(%)
Average:Expen-diture/
Total(%)
R million 2013/14 2014/15 2015/16 2016/17 2013/14 - 2016/17 2017/18 2018/19 2019/20 2016/17 - 2019/20 Investment Promotion 25.5 30.7 31.9 39.8 16.0% 81.8% 42.6 43.0 44.5 3.8% 83.1%Investment and Interdepartmental Clearing House 6.5 7.1 6.1 4.0 -14.8% 15.1% 4.2 4.5 4.6 4.7% 8.4%Investment Support and After Care 0.4 0.1 0.3 4.0 114.9% 3.1% 4.2 4.5 4.6 4.6% 8.4%Total 32.4 38.0 38.3 47.8 13.9% 100.0% 50.9 52.0 53.7 3.9% 100.0%Change to 2016 Budget estimate
(0.3) 2.4 0.8 (0.4)

2017 Estimates of National Expenditure
654
Table 34.15 Investment South Africa expenditure trends and estimates by subprogramme and economic classification Economic classification
Audited outcome Adjusted
appropriation
Averagegrowth
rate(%)
Average: Expen-diture/
Total(%)
Medium-term expenditure estimate
Averagegrowth
rate(%)
Average:Expen-diture/
Total(%)
R million 2013/14 2014/15 2015/16 2016/17 2013/14 - 2016/17 2017/18 2018/19 2019/20 2016/17 - 2019/20 Current payments 32.1 37.7 38.1 47.4 14.0% 99.3% 50.5 51.5 53.2 3.9% 99.2%Compensation of employees 22.4 26.6 27.4 31.0 11.4% 68.6% 33.2 33.4 34.1 3.2% 64.4%Goods and services1 9.6 11.1 10.8 16.4 19.5% 30.7% 17.2 18.2 19.2 5.3% 34.7%of which: Communication 0.1 0.2 0.2 0.2 7.2% 0.4% 0.2 0.2 0.2 5.1% 0.4%Consultants: Business and advisory services
0.3 0.6 0.0 0.4 1.8% 0.8% 0.4 0.4 0.4 5.5% 0.7%
Contractors – 0.0 – 6.3 – 4.0% 6.4 6.7 7.1 4.1% 13.0%Travel and subsistence 6.0 5.8 7.9 6.6 3.3% 16.8% 7.0 7.4 7.8 5.7% 14.0%Operating payments 0.7 0.9 0.5 0.7 -1.9% 1.8% 0.7 0.7 0.8 5.3% 1.4%Venues and facilities 1.8 2.9 1.4 2.0 3.3% 5.2% 2.2 2.3 2.4 6.6% 4.3%Transfers and subsidies1 0.0 0.0 0.1 – -100.0% 0.1% – – – – – Households 0.0 0.0 0.1 – -100.0% 0.1% – – – – – Payments for capital assets 0.3 0.3 0.0 0.4 8.5% 0.6% 0.4 0.4 0.5 6.3% 0.8%Machinery and equipment 0.3 0.3 0.0 0.4 8.5% 0.6% 0.4 0.4 0.5 6.3% 0.8%Total 32.4 38.0 38.3 47.8 13.9% 100.0% 50.9 52.0 53.7 3.9% 100.0%Proportion of total programme expenditure to vote expenditure
0.4% 0.4% 0.4% 0.5% – – 0.5% 0.5% 0.6% – –
1. Estimates of National Expenditure data tables are available and can be downloaded from www.treasury.gov.za. These data tables contain detailed information by goods and services, and transfers and subsidies item by programme.
Entity1 National Gambling Board
Mandate The National Gambling Board was established in terms of the National Gambling Act (2004), which makes provision for the coordination of concurrent national and provincial legislative competence over matters relating to casinos, racing, gambling and wagering; and provides for the regulation and development of uniform norms and standards. The board’s mandate is derived from the National Gambling Act (2004), anti-money laundering and anti-terrorism financing legislation, the Broad-Based Black Economic Empowerment Act (2003), the codes of good practice for BEE, and the Employment Equity Act (1998).
Selected performance indicators Table 34.16 National Gambling Board of South Africa performance indicators by programme/objective/activity and related outcomeIndicator Programme/objective/activity Outcome Past Current Projections
2013/14 2014/15 2015/16 2016/17 2017/18 2018/19 2019/20Number of research reports on impact of gambling presented to the accounting authority per year
Stakeholder and liaison
Entity mandate
–1 1 1 1 1 1 1
Number of consolidated three-tier compliance evaluation assessment reports produced per year
Compliance monitoring –1 9 9 9 9 9 9
Number of reports on intervention and support provided to regulators and law enforcement agencies per year
Compliance monitoring –1 8 8 8 8 8 8
Number of reports on illegal gambling produced per year
Compliance monitoring –1 4 4 4 4 4 4
1. No historical data available.
Expenditure analysis The National Gambling Board’s primary focus over the medium term will be on providing oversight and regulation of the gambling industry, creating a fair regulatory environment that promotes equitable and socially responsible behaviour, monitoring the industry’s market share and behaviour patterns, and eradicating illegal gambling. The national gambling policy was approved by Cabinet in 2016 as a response to hindrances to the
1. This section has been compiled with the latest available information from the entities concerned.

Vote 34: Trade and Industry
655
effectiveness of the National Gambling Act (2004). The National Gambling Amendment Bill has been approved for wider public consultation, and proposes reforming the regulatory structural framework to strengthen control mechanisms to minimise the abuse of gambling.
As part of providing oversight and regulation of the industry, the board plans to continue monitoring and evaluating the issuance of national and provincial licenses. This entails reviewing the revenue collection and audits of licensing authorities, ensuring their machines are certified and approved, and inspecting the compliance of licensees through provincial licensing authorities. The compliance monitoring programme is allocated R208 million over the medium term for this purpose. The allocation will fund the production of nine compliance evaluation assessment reports per year over the medium term. The staff complement is set to remain at 27 over the medium term to maintain the capacity of the compliance unit, with expenditure on compensation of employees projected to grow by 9.9 per cent, from R21.3 million in 2016/17 to R28.2 million in 2019/20.
The board plans to develop a national register of illegal gambling operators at a projected cost of R2 million. The register will become a central repository for all gambling operations, and allow the board to collaborate with law enforcement agencies to eradicate illegal gambling activities. To develop and roll out the register, the board aims to produce 12 reports on illegal gambling over the medium term. A national central electronic monitoring system, which manages and monitors the limited payout machine industry in South Africa, will allow the board to collect data on revenue made by machines, and ensure the industry is effectively monitored. The national central electronic monitoring system is projected to cost R159.3 million. Expenditure on goods and services is expected to increase from R24 million in 2016/17 to R127.7 million in 2019/20 as a result of the establishment of the national central electronic monitoring system and the national illegal gambling operators register, which are expected to account for 67.5 per cent of total spending on goods and services over the medium term.
To inform the public about legal and illegal forms of gambling, and address problem gambling, the board is planning to run five public awareness campaigns in each year over the MTEF period. The board will further conduct socioeconomic research on the benefits and dangers of gambling to inform and guide policy on gambling-related matters in the country. These activities are funded in the stakeholder and liaison programme, which has an allocation of R47.3 million over the medium term.
A projected 45.8 per cent, or R100.4 million, of the board’s revenue over the medium term will come from transfers from the department. This will be supplemented by revenue from the national central electronic monitoring system. Revenue is projected to grow by 49.2 per cent over the medium term, from R47.8 million in 2016/17 to R158.8 million in 2019/20, because of the revised revenue model for the national central electronic monitoring system, which will allow for monitoring fees from limited payout machines to accrue to the board.
Programmes/objectives/activities Table 34.17 National Gambling Board expenditure trends and estimates by programme/objective/activity
Audited outcome Revisedestimate
Averagegrowth
rate(%)
Average:Expen-diture/
Total(%)
Medium-term expenditure estimate
Averagegrowth
rate(%)
Average:Expen-diture/
Total(%)
R million 2013/14 2014/15 2015/16 2016/17 2013/14 - 2016/17 2017/18 2018/19 2019/20 2016/17 - 2019/20 Administration 19.2 22.0 19.6 23.3 6.5% 63.2% 22.5 24.6 24.2 1.3% 33.8%Stakeholder and liaison 8.1 5.1 2.8 13.1 17.5% 19.9% 12.5 20.6 14.2 2.8% 20.4%Compliance monitoring 6.3 2.1 5.1 11.0 20.3% 16.9% 9.2 79.0 119.8 121.4% 45.8%Total 33.7 29.2 27.5 47.4 12.1% 100.0% 44.3 124.2 158.2 49.5% 100.0%
Statements of historical financial performance and position Table 34.18 National Gambling Board statements of historical financial performance and positionStatement of financial performance
Budget Audited outcome Budget
Audited outcome Budget
Audited outcome
Budget estimate
Revisedestimate
Average:Outcome/
Budget (%)
R million 2013/14 2014/15 2015/16 2016/17 2013/14 - 2016/17 Revenue Non-tax revenue 0.4 2.3 2.7 2.7 8.8 8.7 13.6 17.7 123.1%Other non-tax revenue 0.4 2.3 2.7 2.7 8.8 8.7 13.6 17.7 123.1%Transfers received 27.7 27.7 29.8 29.8 32.0 32.0 30.1 30.1 100.0%Total revenue 28.1 30.0 32.5 32.5 40.8 40.7 43.7 47.8 104.1%

2017 Estimates of National Expenditure
656
Table 34.18 National Gambling Board statements of historical financial performance and positionStatement of financial performance
Budget Audited outcome Budget
Audited outcome Budget
Audited outcome
Budget estimate
Revised estimate
Average:Outcome/
Budget (%)
R million 2013/14 2014/15 2015/16 2016/17 2013/14 - 2016/17 Expenses Current expenses 28.1 33.7 27.5 29.2 39.0 27.5 42.5 47.4 100.4%Compensation of employees 15.2 11.4 12.3 9.2 11.3 8.9 22.9 21.3 82.0%Goods and services 12.8 20.2 14.4 18.1 25.5 16.5 17.4 24.0 112.5%Depreciation 0.2 2.1 0.9 1.9 2.2 2.2 2.2 2.1 153.6%Total expenses 28.1 33.7 27.5 29.2 39.0 27.5 42.5 47.4 100.4%Surplus/(Deficit) – (4.0) 5.0 3.0 2.0 13.0 1.0 –
Statement of financial position Carrying value of assets 5.0 14.3 15.3 12.9 13.7 11.8 14.5 14.5 110.3%of which: Acquisition of assets – (0.0) – (0.5) (1.6) (0.6) (0.1) (2.4) 210.2%Inventory 0.1 0.0 0.1 0.0 0.0 0.0 0.0 0.0 43.8%Receivables and prepayments 0.2 0.6 0.2 1.4 1.5 1.1 1.5 1.5 138.1%Cash and cash equivalents 4.7 0.0 2.1 9.2 9.8 26.4 10.4 10.4 171.1%Total assets 9.9 14.9 17.6 23.5 24.9 39.3 26.4 26.4 132.0%Accumulated surplus/(deficit) 3.8 5.7 8.6 9.0 9.6 22.2 10.2 10.2 146.2%Borrowings – 0.1 – – – – – – – Finance lease – 5.7 – – – – – – – Deferred income – – – 6.5 – 8.0 – – – Trade and other payables 5.7 2.7 6.5 7.1 14.3 7.3 15.2 15.2 77.5%Provisions 0.5 0.7 2.5 0.9 1.0 1.8 1.0 1.0 89.4%Total equity and liabilities 9.9 14.9 17.6 23.5 24.9 39.3 26.4 26.4 132.0%
Statements of estimates of financial performance and position Table 34.19 National Gambling Board statements of estimates of financial performance and position
Revised estimate
Averagegrowth
rate(%)
Average:Expen-diture/
Total(%) Medium-term estimate
Averagegrowth
rate(%)
Average:Expen-diture/
Total(%)
R million 2016/17 2013/14 - 2016/17 2017/18 2018/19 2019/20 2016/17 - 2019/20 Revenue Non-tax revenue 17.7 97.9% 18.6% 12.6 93.4 123.4 91.2% 54.2%Other non-tax revenue 17.7 97.9% 18.6% 12.6 93.4 123.4 91.2% 54.2%Transfers received 30.1 2.8% 81.4% 31.6 33.5 35.3 5.5% 45.8%Total revenue 47.8 16.8% 100.0% 44.3 126.9 158.8 49.2% 100.0%Expenses Current expenses 47.4 12.1% 100.0% 44.3 124.2 158.2 49.5% 303.3%Compensation of employees 21.3 23.3% 35.6% 24.3 26.7 28.2 9.9% 34.8%Goods and services 24.0 5.9% 58.1% 17.8 95.3 127.7 74.6% 62.0%Depreciation 2.1 0.7% 6.3% 2.2 2.2 2.3 2.9% 3.2%Total expenses 47.4 12.1% 100.0% 44.3 124.2 158.2 49.5% 100.0%Surplus/(Deficit) – (1.0) – 3.0 – – Carrying value of assets 14.5 0.6% 58.9% 15.4 16.3 17.2 5.9% 54.9%of which: Acquisition of assets (2.4) 377.8% -3.2% – – – -100.0% -2.3%Receivables and prepayments 1.5 39.0% 4.6% 1.6 1.7 1.8 5.9% 5.8%Cash and cash equivalents 10.4 593.8% 36.5% 11.0 11.6 12.3 5.9% 39.2%Total assets 26.4 21.1% 100.0% 28.0 29.7 31.3 5.9% 100.0%Accumulated surplus/(deficit) 10.2 21.4% 42.9% 10.8 11.5 12.1 5.9% 38.6%Trade and other payables 15.2 78.7% 31.0% 16.1 17.1 18.0 5.9% 57.5%Provisions 1.0 12.9% 4.3% 1.1 1.2 1.2 5.9% 3.9%Total equity and liabilities 26.4 21.1% 100.0% 28.0 29.7 31.3 5.9% 100.0%

Vote 34: Trade and Industry
657
Personnel information Table 34.20 National Gambling Board personnel numbers and cost by salary level
Number of posts estimated for 31 March 2017 Number and cost1 of personnel posts filled / planned for on funded establishment Number
Number of
funded posts
Number of
posts on approved
establishment Actual Revised estimate Medium-term expenditure estimate
Averagegrowth
rate(%)
Average:Salary
level/Total(%)
2015/16 2016/17 2017/18 2018/19 2019/20 2016/17 - 2019/20
National Gambling Board Number Cost Unit cost Number Cost
Unit cost Number Cost
Unit cost Number Cost
Unit cost Number Cost
Unit cost
Salary level
27 27 22 8.9 0.4 27 21.3 0.8 27 24.3 0.9 27 26.7 1.0 27 28.2 1.0 9.9% 100.0%
1 – 6 1 1 4 0.4 0.1 1 0.2 0.2 – – – – – – – – – -100.0% 0.9%7 – 10 10 10 8 2.3 0.3 10 4.3 0.4 11 4.9 0.4 10 4.6 0.5 10 4.9 0.5 4.1% 38.0%11 – 12 7 7 5 2.1 0.4 7 5.2 0.7 6 4.9 0.8 7 6.0 0.9 7 6.3 0.9 6.9% 25.0%13 – 16 9 9 5 4.1 0.8 9 11.5 1.3 10 14.5 1.4 10 16.1 1.6 10 17.0 1.7 13.9% 36.1%1. Rand million.
Other entities Comprehensive coverage of the following public entities is provided with the more detailed information for the vote at www.treasury.gov.za under the budget information link.
• The Companies and Intellectual Property Commission was established in terms of section 185 of the Companies Act (2008) to function as an organ of state within the public administration but outside the public service. The commission regulates companies, close corporations, cooperatives, trademarks, patents, designs and copyright; and enforces rules and regulations. The commission’s total budget for 2017/18 is R544.7 million.
• The Companies Tribunal was established in 2011 as a juristic entity in terms of the Companies Act (2008) and became operational in 2012. It is mandated to adjudicate and mediate disputes, and make orders. The tribunal is enjoined to deliver on this mandate in a manner that is simple, ethical, efficient, equitable, transparent, accountable and impartial, without fear, favour or prejudice. The tribunal’s total budget for 2017/18 is R23.9 million.
• The Export Credit Insurance Corporation of South Africa was established in terms of the Export Credit and Foreign Investments Insurance Act (1957) to facilitate and encourage South Africa’s export trade by underwriting export credit loans and investments outside South Africa. The corporation is mandated to evaluate export credit and foreign investment risks; provide export credit and foreign investment insurance cover on behalf of the South African government; and manage the interest make-up scheme for participating financial institutions to enable them to provide loans to South African firms that invest in capital projects abroad. The corporation’s total budget for 2017/18 is R820.1 million.
• The National Consumer Commission was established in terms of section 85 of the Consumer Protection Act (2008), with jurisdiction across South Africa. The act seeks to promote a fair, accessible and sustainable marketplace for consumer products and services, and for that purpose to establish national norms and standards relating to consumer protection. It further seeks to provide for improved standards of consumer information, prohibit certain unfair marketing and business practices, promote responsible consumer behaviour, and promote a consistent legislative framework. The commission’s total budget for 2017/18 is R54.3 million.
• The National Consumer Tribunal was established in terms of the National Credit Act (2005) as an independent adjudicative entity. It is mandated to review decisions made by the National Credit Regulator and the National Consumer Commission, as well as to adjudicate on applications and referrals in terms of the National Credit Act (2005) and the Consumer Protection Act (2008). The tribunal’s total budget for 2017/18 is R63.3 million.
• The National Credit Regulator was established in terms of the National Credit Act (2005) and is responsible for the regulation of the South African credit industry. It enforces the act, and carries out education, research, policy development, the registration of industry participants and the investigation of complaints. The regulator is mandated to promote the development of an accessible credit market, particularly to address the needs of historically disadvantaged and low-income individuals, and remote, isolated or low-density communities. The regulator’s total budget for 2017/18 is R130.7 million.

2017 Estimates of National Expenditure
658
• The National Empowerment Fund was established in terms of the National Empowerment Fund Act (1998) to promote and facilitate black economic equality and transformation. In providing financial and non-financial support to black businesses and structuring accessible retail savings products for black people, the fund is mandated to implement the empowerment codes of good practice for BEE. The fund has five core divisions: SMMEs, rural development, venture capital, corporate finance, and women empowerment funds. The fund’s total budget for 2017/18 is R470.3 million.
• The National Lotteries Commission was established in terms of the Lotteries Act (1997), and is mandated to regulate the national lottery and other lotteries, including fundraising society lotteries and promotional competitions. The commission also advises the Minister of Trade and Industry on policy matters relating to the national lottery and other lotteries. The commission ensures the protection of all participants, maximises revenue for good causes in a responsible manner, administers the National Lotteries Distribution Trust Fund, and disburses funds for good causes to the distributing agencies in an equitable and expeditious manner. The commission’s total budget for 2017/18 is R498.2 million.
• The National Metrology Institute of South Africa is mandated by the Measurement Units and Measurement Standards Act (2006) to ensure that South Africa has a scientifically valid and internationally comparable and accepted measurement system, and that the international system of units is correctly applied. This is of paramount importance for manufacturing, trade, health and safety, and law enforcement. To fulfil this mandate, the institute: develops and maintains national measurement standards for South Africa; ensures that these are traceable to the primary international system of units; benchmarks these measurement standards against the measurement standards of other countries; submits the calibration and measurement capabilities to the international database as the entry for South Africa; and distributes the national capability through calibration and certified reference materials to calibration and testing laboratories in Southern Africa. The institute’s total budget for 2017/18 is R171.1 million.
• The National Regulator for Compulsory Specifications was established in terms of the Measurement Unit and Measurement Standards Act (2006) as a public entity that administers compulsory specifications, otherwise known as technical regulations, on behalf of the Minister of Trade and Industry. The regulator is mandated to protect the health and safety of the public and the environment by administering and maintaining compulsory specifications, implementing a regulatory and compliance system, and engaging in market surveillance to ensure compliance. The regulator’s total budget for 2017/18 is R403.2 million.
• The South African Bureau of Standards was established as a statutory body in terms of the Standards Act (2008), and is part of South Africa’s standardisation, quality assurance, accreditation and metrology technical infrastructure. The bureau is mandated to provide standardisation and conformity assessment services to protect the integrity of the South African market, protect consumers, create a competitive advantage for South African industry, and facilitate access by South Africans to local and international markets. The bureau is the sole publisher of South African national standards, and is responsible for the technical work of the industrial policy action plan. Its total budget for 2017/18 is R962.4 million.
• The South African National Accreditation System was established in terms of the Accreditation for Conformity Assessment, Calibration and Good Laboratory Practice Act (2006). It is mandated to accredit or monitor for compliance with good laboratory practice; promote accreditation as a means of facilitating international trade to enhance South Africa’s economic performance and bring about economic transformation; promote the competence and equivalence of accredited bodies; and promote the competence and equivalence of good laboratory practice facilities compliant with the act. The entity’s total budget for 2017/18 is R100.1 million.

659
Vote 34: Trade and Industry
Additional table: Summary of expenditure on infrastructureProject name Service delivery
outputs Current project stage
Totalproject cost Audited outcome
Adjustedappropriation Medium-term expenditure estimate
R million 2013/14 2014/15 2015/16 2016/17 2017/18 2018/19 2019/20 Infrastructure transfers to other spheres, agencies and departments Mega projects (total project cost of at least R1 billion over the project life cycle) Coega Development Corporation Development of infrastructure
developments to enable investment in the zone
Various 5 689.0 308.2 – – – – – –
East London industrial development zone
Development of infrastructure developments to enable investment in the zone
Various 1 817.5 100.0 – – – – – –
Critical infrastructure programme Development of infrastructure projects to supporting investment in mining, tourism, manufacturing and services
Various 1 473.2 140.0 81.3 74.2 290.0 209.5 211.1 222.9
Special economic zones: Investment incentives
Development of infrastructure for special economic zone
Feasibility 3 719.5 449.2 608.2 735.6 1 310.0 605.4 1 300.0 1 457.3
Large projects (total project cost of at least R250 million but less than R1 billion over the project life cycle) Richards Bay industrial development zone
Development of infrastructure to enable investment in the zone
Various 672.0 30.0 – – – – – –
Centurion Aerospace Village Construction of aerospace industry infrastructure
Construction 407.3 15.8 16.7 17.5 18.4 19.4 15.5 16.4
Industrial development zone: Other Development of infrastructure for industrial zone
Feasibility – – 99.6 130.0 50.0 140.0 80.0 –
Total 13 778.5 1 043.2 805.9 957.3 1 668.4 974.3 1 606.6 1 696.5

660
2017 Estimates of National Expenditure
Related Documents