Vontobel Fund Vontobel Asset Management Société d'Investissement à Capital Variable Audited annual report for the financial year from September 1, 2017 until August 31, 2018 R.C.S. Luxembourg No. B38170

Welcome message from author
This document is posted to help you gain knowledge. Please leave a comment to let me know what you think about it! Share it to your friends and learn new things together.
Transcript
Vontobel FundVontobel Asset Management
Société d'Investissement à Capital Variable
Audited annual reportfor the financial year from September 1, 2017 until August 31, 2018
R.C.S. Luxembourg No. B38170
2
The following Sub-Funds are available to investors in the Federal Republic of Germany:
Vontobel Fund - Swiss Money
Vontobel Fund - Euro Short Term Bond
Vontobel Fund - US Dollar Money
Vontobel Fund - Swiss Franc Bond
Vontobel Fund - Euro Bond
Vontobel Fund - EUR Corporate Bond Mid Yield
Vontobel Fund - High Yield Bond
Vontobel Fund - Bond Global Aggregate
Vontobel Fund - Eastern European Bond
Vontobel Fund - Value Bond
Vontobel Fund - Absolute Return Bond (EUR)
Vontobel Fund - Absolute Return Bond Dynamic
Vontobel Fund - Global Convertible Bond
Vontobel Fund - Sustainable Emerging Markets Local Currency Bond
Vontobel Fund - Swiss Mid and Small Cap Equity
Vontobel Fund - European Mid and Small Cap Equity
Vontobel Fund - Japanese Equity
Vontobel Fund - mtx China Leaders
Vontobel Fund - European Equity
Vontobel Fund - US Equity
Vontobel Fund - Global Equity
Vontobel Fund - Global Equity Income
Vontobel Fund - Emerging Markets Equity
Vontobel Fund - Asia Pacific Equity
Vontobel Fund - New Power
Vontobel Fund - Clean Technology
Vontobel Fund - Future Resources
Vontobel Fund - mtx Sustainable Asian Leaders (ex Japan)
Vontobel Fund - mtx Sustainable Emerging Markets Leaders
Vontobel Fund - mtx Sustainable Global Leaders
Vontobel Fund - Commodity
Vontobel Fund - Dynamic Commodity
Vontobel Fund - Non-Food Commodity
Vontobel Fund - Emerging Markets Debt
Vontobel Fund - Global Bond
Vontobel Fund - Global Corporate Bond Mid Yield
Vontobel Fund - Emerging Markets Corporate Bond
Vontobel Fund - TwentyFour Absolute Return Credit Fund
Vontobel Fund - TwentyFour Strategic Income Fund
Vontobel Fund - LCR Global Bond
Vontobel Fund - Multi Asset Income
Vontobel Fund - TwentyFour Monument European Asset Backed Securities
Vontobel Fund - Multi Asset Defensive
Investors are informed that for the Sub-Funds
Vontobel Fund - Absolute Return Credit Fund (from 13 November 2018: Vontobel Fund – Credit Opportunities)
Vontobel Fund - Emerging Markets Blend
Vontobel Fund - Multi Asset Solution
Vontobel Fund - Emerging Markets Debt Defensive
no notice has been filed for the Sub-Funds pursuant to section 310 of the German Investment Code (KAGB).
Thus, shares in these Sub-Funds may not be sold to the public in the Federal Republic of Germany.
3
Audited annual report for the financial year from September 1, 2017 to August 31, 2018 This document does not constitute an offer to purchase or subscribe to shares. Subscription to shares of the
Sub-Funds of Vontobel Fund, a Luxembourg SICAV, should always be undertaken only on the basis of the
prospectus, the Key Investor Information Document (KIID), the Articles of Association, and the annual and semi-
annual reports (plus, in the case of Italy, the Modulo di Sottoscrizione). We also recommend that you contact your
relationship manager or other advisors prior to each investment. An investment in Sub-Funds of Vontobel Fund
involves risks, which are explained in the prospectus. All the above-mentioned documents and a list of the
changes in the portfolio during the financial year and the composition of the benchmarks are available free of
charge from Vontobel Fonds Services AG, Gotthardstrasse 43, CH-8022 Zurich (the representative in
Switzerland); Bank Vontobel AG, Gotthardstrasse 43, CH-8022 Zurich (the paying agent in Switzerland); Erste
Bank der oesterreichischen Sparkassen AG, Am Belvedere 1, A-1100 Vienna (the paying agent in Austria);
B. Metzler seel. Sohn & Co. KGaA, Untermainanlage 1, D-60329 Frankfurt am Main (the paying agent in Germany);
the authorised distributors, at the registered office of the Fund, 11-13, Boulevard de la Foire, L-1528
Luxembourg, or at www.vontobel.com/AM. The shareholders agree that Vontobel Fonds Services AG, Zurich, may consult entries in the register of shareholders in order to offer services to shareholders.
Vontobel Fund
4
Société d'Investissement à Capital Variable (SICAV), R.C.S. Luxembourg No. B38170
Organisation 6
Combined Umbrella Fund 9
Vontobel Fund - Swiss Money 11
Vontobel Fund - Euro Short Term Bond 15
Vontobel Fund - US Dollar Money 21
Vontobel Fund - Swiss Franc Bond 26
Vontobel Fund - Euro Bond 33
Vontobel Fund - EUR Corporate Bond Mid Yield 36
Vontobel Fund - High Yield Bond 44
Vontobel Fund - Bond Global Aggregate 49
Vontobel Fund - Eastern European Bond 55
Vontobel Fund - Value Bond 58
Vontobel Fund - Absolute Return Bond (EUR) 63
Vontobel Fund - Absolute Return Bond Dynamic 68
Vontobel Fund - Global Convertible Bond 72
Vontobel Fund - Sustainable Emerging Markets Local Currency Bond 77
Vontobel Fund - Swiss Mid and Small Cap Equity 82
Vontobel Fund - European Mid and Small Cap Equity 84
Vontobel Fund - Japanese Equity 86
Vontobel Fund - mtx China Leaders 88
Vontobel Fund - European Equity 90
Vontobel Fund - US Equity 93
Vontobel Fund - Global Equity 95
Vontobel Fund - Global Equity Income 98
Vontobel Fund - Emerging Markets Equity 101
Vontobel Fund - Asia Pacific Equity 105
Vontobel Fund - New Power 109
Vontobel Fund - Clean Technology 112
Vontobel Fund - Future Resources 116
Vontobel Fund - mtx Sustainable Asian Leaders (ex Japan) 119
Vontobel Fund - mtx Sustainable Emerging Markets Leaders 123
Vontobel Fund - mtx Sustainable Global Leaders 127
Vontobel Fund - Commodity 130
Vontobel Fund - Dynamic Commodity 134
Vontobel Fund - Non-Food Commodity 138
Vontobel Fund - Target Return Defensive 142
Vontobel Fund - Target Return Balanced 143
Vontobel Fund
5
Vontobel Fund - Emerging Markets Debt 144
Vontobel Fund - Global Bond 153
Vontobel Fund - Absolute Return Credit Fund 156
Vontobel Fund - Global Corporate Bond Mid Yield 161
Vontobel Fund - Emerging Markets Blend 168
Vontobel Fund - Emerging Markets Corporate Bond 173
Vontobel Fund - TwentyFour Absolute Return Credit Fund 179
Vontobel Fund - TwentyFour Strategic Income Fund 183
Vontobel Fund - LCR Global Bond 190
Vontobel Fund - Multi Asset Solution 192
Vontobel Fund - Multi Asset Income 194
Vontobel Fund - TwentyFour Monument European Asset Backed Securities 199
Vontobel Fund - Multi Asset Defensive 204
Shares Summary 211
Net Asset Value Summary 221
Report of the Board of Directors 231
Notes to the Financial Statements 235
Additional Unaudited Appendix 304
Report of the Réviseur d'entreprises agréé 312
Organisation
6
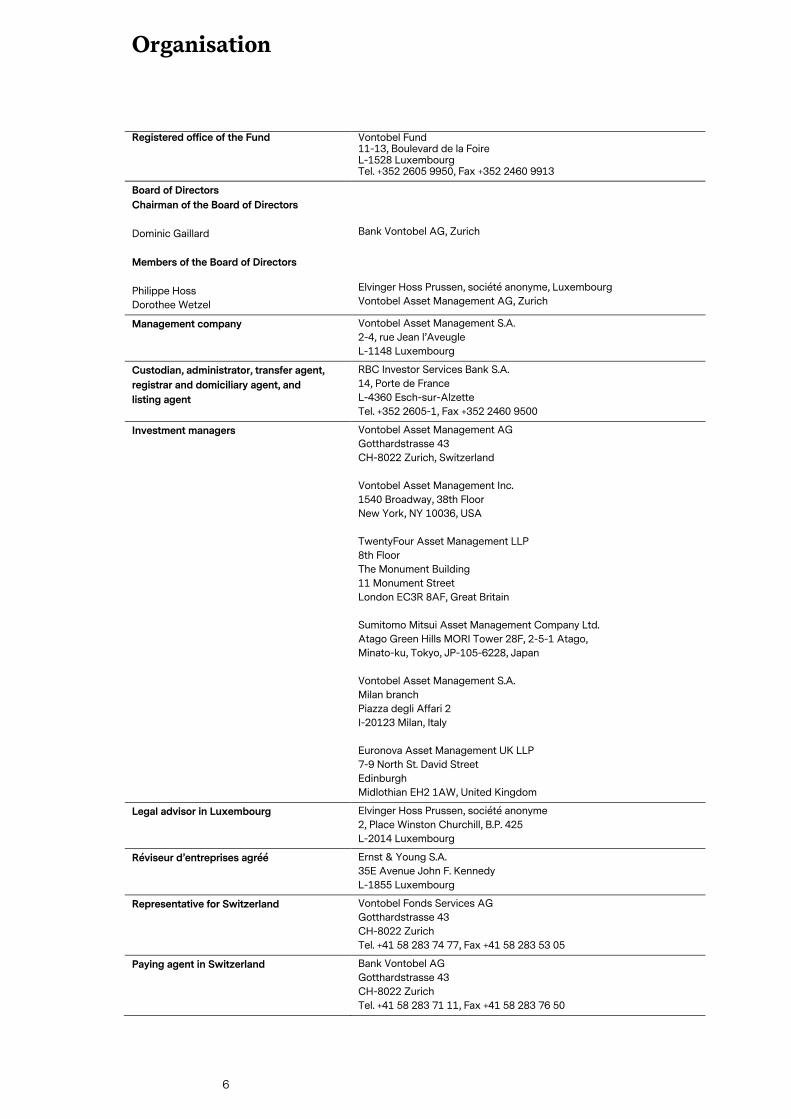
Registered office of the Fund Vontobel Fund 11-13, Boulevard de la Foire L-1528 Luxembourg Tel. +352 2605 9950, Fax +352 2460 9913
Board of Directors
Chairman of the Board of Directors
Dominic Gaillard
Members of the Board of Directors
Philippe Hoss
Dorothee Wetzel
Bank Vontobel AG, Zurich
Elvinger Hoss Prussen, société anonyme, Luxembourg
Vontobel Asset Management AG, Zurich
Management company Vontobel Asset Management S.A.
2-4, rue Jean l’Aveugle
L-1148 Luxembourg
Custodian, administrator, transfer agent,
registrar and domiciliary agent, and
listing agent
RBC Investor Services Bank S.A.
14, Porte de France
L-4360 Esch-sur-Alzette
Tel. +352 2605-1, Fax +352 2460 9500
Investment managers Vontobel Asset Management AG
Gotthardstrasse 43
CH-8022 Zurich, Switzerland
Vontobel Asset Management Inc.
1540 Broadway, 38th Floor
New York, NY 10036, USA
TwentyFour Asset Management LLP
8th Floor
The Monument Building
11 Monument Street
London EC3R 8AF, Great Britain
Sumitomo Mitsui Asset Management Company Ltd.
Atago Green Hills MORI Tower 28F, 2-5-1 Atago,
Minato-ku, Tokyo, JP-105-6228, Japan
Vontobel Asset Management S.A.
Milan branch
Piazza degli Affari 2
I-20123 Milan, Italy
Euronova Asset Management UK LLP
7-9 North St. David Street
Edinburgh
Midlothian EH2 1AW, United Kingdom
Legal advisor in Luxembourg Elvinger Hoss Prussen, société anonyme
2, Place Winston Churchill, B.P. 425
L-2014 Luxembourg
Réviseur d’entreprises agréé Ernst & Young S.A.
35E Avenue John F. Kennedy
L-1855 Luxembourg
Representative for Switzerland Vontobel Fonds Services AG
Gotthardstrasse 43
CH-8022 Zurich
Tel. +41 58 283 74 77, Fax +41 58 283 53 05
Paying agent in Switzerland Bank Vontobel AG
Gotthardstrasse 43
CH-8022 Zurich
Tel. +41 58 283 71 11, Fax +41 58 283 76 50
Organisation
7
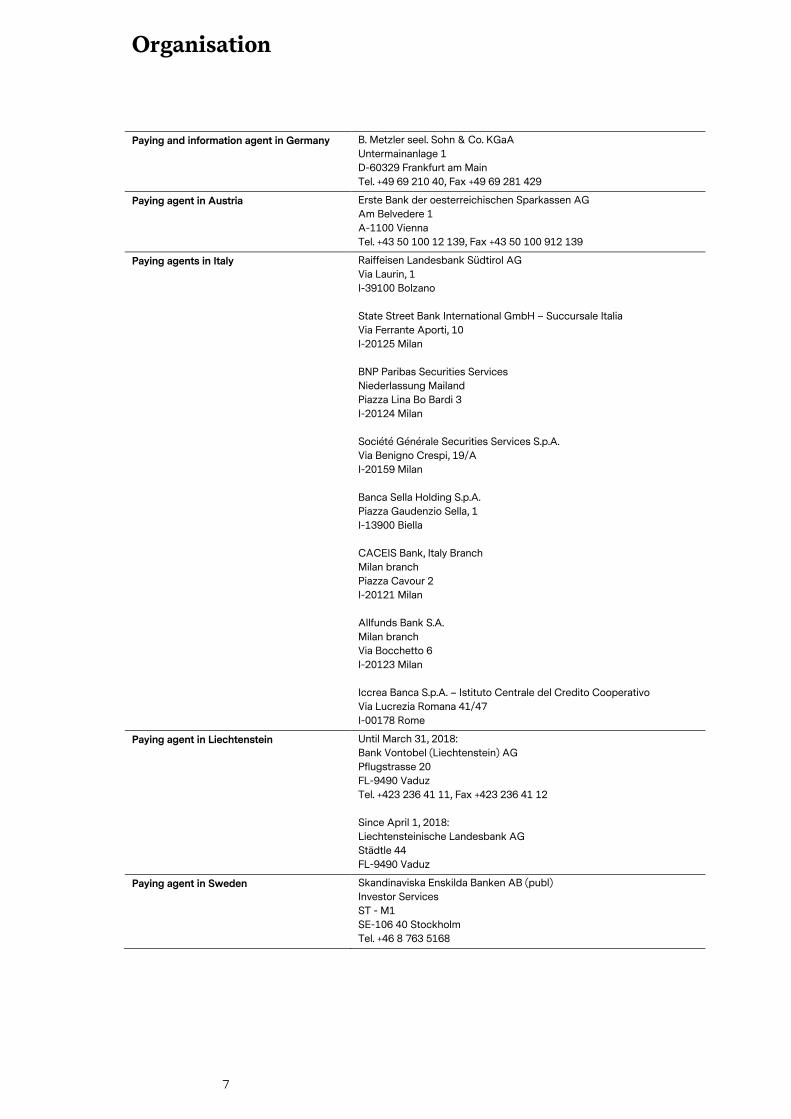
Paying and information agent in Germany B. Metzler seel. Sohn & Co. KGaA
Untermainanlage 1
D-60329 Frankfurt am Main
Tel. +49 69 210 40, Fax +49 69 281 429
Paying agent in Austria Erste Bank der oesterreichischen Sparkassen AG
Am Belvedere 1
A-1100 Vienna
Tel. +43 50 100 12 139, Fax +43 50 100 912 139
Paying agents in Italy Raiffeisen Landesbank Südtirol AG
Via Laurin, 1
I-39100 Bolzano
State Street Bank International GmbH – Succursale Italia
Via Ferrante Aporti, 10
I-20125 Milan
BNP Paribas Securities Services
Niederlassung Mailand
Piazza Lina Bo Bardi 3
I-20124 Milan
Société Générale Securities Services S.p.A.
Via Benigno Crespi, 19/A
I-20159 Milan
Banca Sella Holding S.p.A.
Piazza Gaudenzio Sella, 1
I-13900 Biella
CACEIS Bank, Italy Branch
Milan branch
Piazza Cavour 2
I-20121 Milan
Allfunds Bank S.A.
Milan branch
Via Bocchetto 6
I-20123 Milan
Iccrea Banca S.p.A. – Istituto Centrale del Credito Cooperativo
Via Lucrezia Romana 41/47
I-00178 Rome
Paying agent in Liechtenstein Until March 31, 2018:
Bank Vontobel (Liechtenstein) AG
Pflugstrasse 20
FL-9490 Vaduz
Tel. +423 236 41 11, Fax +423 236 41 12
Since April 1, 2018:
Liechtensteinische Landesbank AG
Städtle 44
FL-9490 Vaduz
Paying agent in Sweden Skandinaviska Enskilda Banken AB (publ)
Investor Services
ST - M1
SE-106 40 Stockholm
Tel. +46 8 763 5168
Organisation
8
Financial and central agent in France BNP Paribas Securities Services S.A.
3, Rue d’Antin
F-75002 Paris
Facilities agent for Great Britain Carne Financial Services (UK) LLP
Tallis House
2 Tallis Street
London EC4Y 0AB
Facilities Agent for Ireland Carne Global Financial Services Limited
2nd Floor Block E Iveagh Court
Harcourt Road
Dublin 2
9
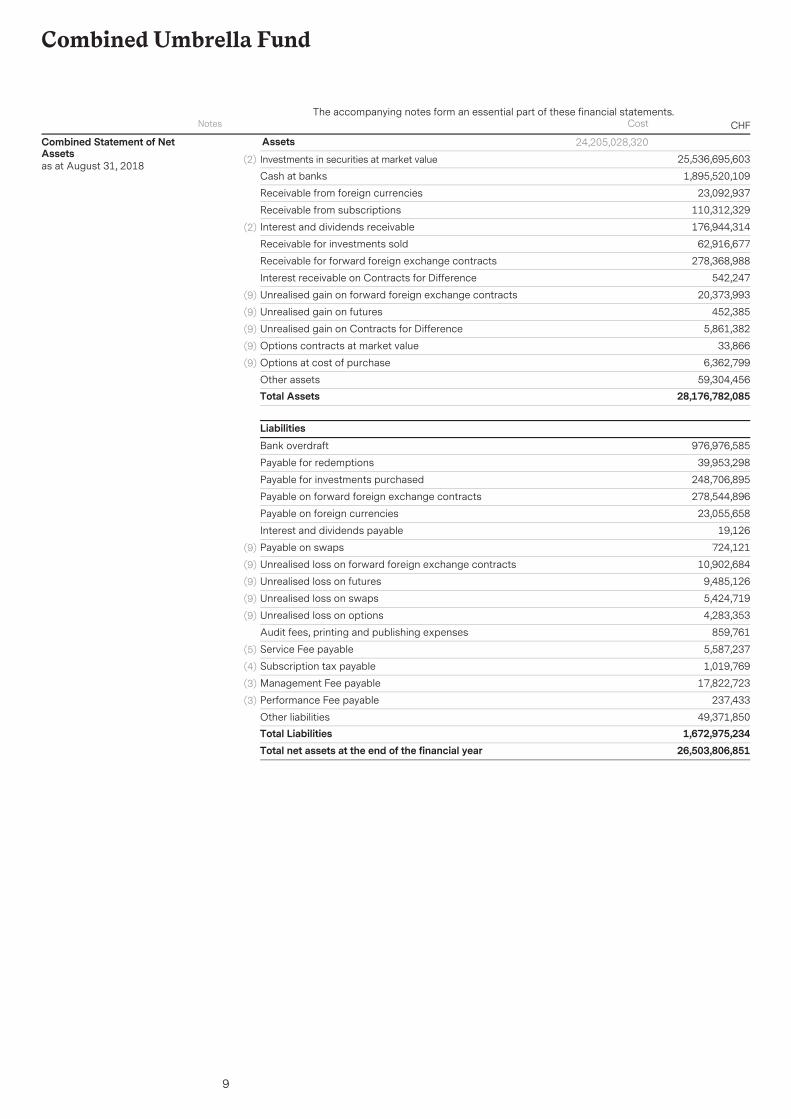
The accompanying notes form an essential part of these financial statements.CHF
Combined Umbrella Fund
Cost
Assets(2)
Investments in securities at market value 25,536,695,603
1,895,520,109Cash at banks
23,092,937Receivable from foreign currencies
110,312,329Receivable from subscriptions
(2) 176,944,314Interest and dividends receivable
62,916,677Receivable for investments sold
278,368,988Receivable for forward foreign exchange contracts
542,247Interest receivable on Contracts for Difference
(9) 20,373,993Unrealised gain on forward foreign exchange contracts
(9) 452,385Unrealised gain on futures
(9) 5,861,382Unrealised gain on Contracts for Difference
(9) 33,866Options contracts at market value
(9) 6,362,799Options at cost of purchase
59,304,456Other assetsTotal Assets 28,176,782,085
Combined Statement of NetAssetsas at August 31, 2018
24,205,028,320
Liabilities976,976,585Bank overdraft
39,953,298Payable for redemptions
248,706,895Payable for investments purchased
278,544,896Payable on forward foreign exchange contracts
23,055,658Payable on foreign currencies
19,126Interest and dividends payable
(9) 724,121Payable on swaps
(9) 10,902,684Unrealised loss on forward foreign exchange contracts
(9) 9,485,126Unrealised loss on futures
(9) 5,424,719Unrealised loss on swaps
(9) 4,283,353Unrealised loss on options
859,761Audit fees, printing and publishing expenses
(5) 5,587,237Service Fee payable
(4) 1,019,769Subscription tax payable
(3) 17,822,723Management Fee payable
(3) 237,433Performance Fee payable
49,371,850Other liabilitiesTotal Liabilities 1,672,975,234Total net assets at the end of the financial year 26,503,806,851
Notes
(2)
10
The accompanying notes form an essential part of these financial statements.CHF
Combined Umbrella Fund
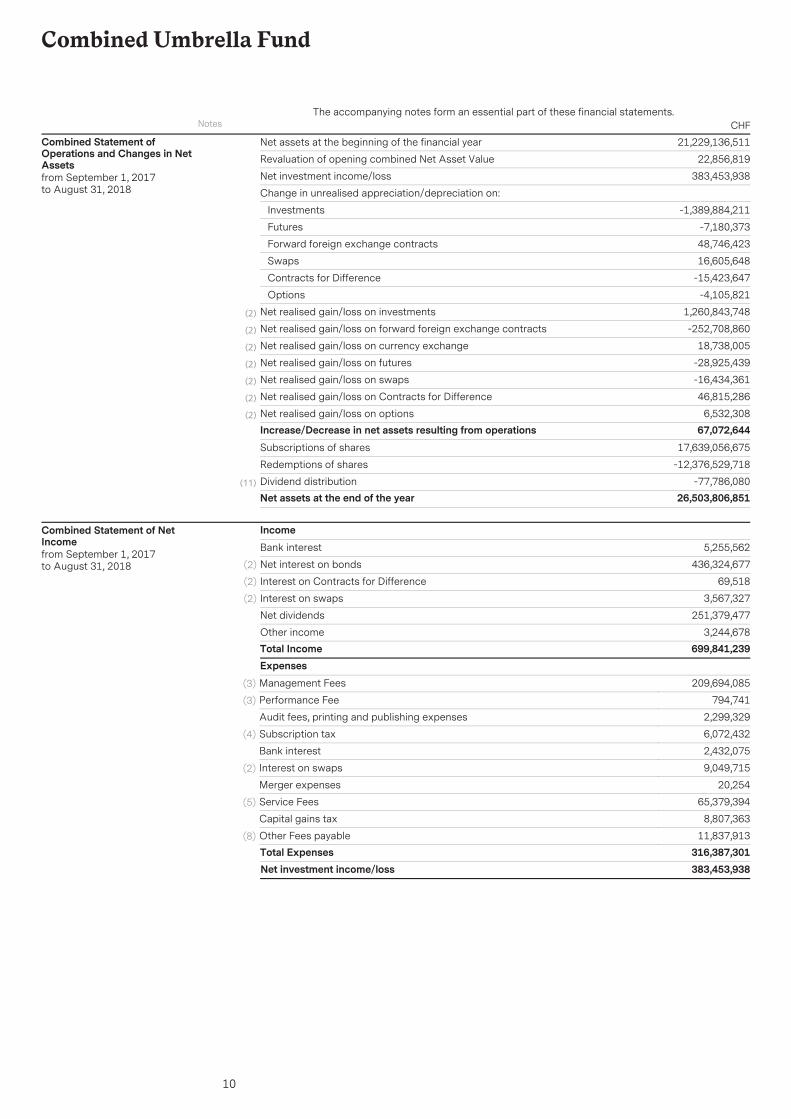
Net assets at the beginning of the financial year 21,229,136,511
Revaluation of opening combined Net Asset Value 22,856,819
Net investment income/loss 383,453,938
Change in unrealised appreciation/depreciation on:
Investments -1,389,884,211
Futures -7,180,373
Forward foreign exchange contracts 48,746,423
Swaps 16,605,648
Contracts for Difference -15,423,647
Options -4,105,821
Net realised gain/loss on investments 1,260,843,748(2)
Net realised gain/loss on forward foreign exchange contracts -252,708,860(2)
Net realised gain/loss on currency exchange 18,738,005(2)
Net realised gain/loss on futures -28,925,439(2)
Net realised gain/loss on swaps -16,434,361(2)
Net realised gain/loss on Contracts for Difference 46,815,286(2)
Net realised gain/loss on options 6,532,308(2)
Increase/Decrease in net assets resulting from operations 67,072,644Subscriptions of shares 17,639,056,675
Redemptions of shares -12,376,529,718
Dividend distribution -77,786,080(11)
Net assets at the end of the year 26,503,806,851
Combined Statement ofOperations and Changes in NetAssetsfrom September 1, 2017 to August 31, 2018
Bank interest 5,255,562
Income
Net interest on bonds 436,324,677(2)
Interest on Contracts for Difference 69,518(2)
Interest on swaps 3,567,327(2)
Net dividends 251,379,477
Other income 3,244,678Total Income 699,841,239
Combined Statement of NetIncomefrom September 1, 2017 to August 31, 2018
Management Fees 209,694,085(3)
Expenses
Performance Fee 794,741(3)
Audit fees, printing and publishing expenses 2,299,329
Subscription tax 6,072,432(4)
Bank interest 2,432,075
Interest on swaps 9,049,715(2)
Merger expenses 20,254
Service Fees 65,379,394(5)
Capital gains tax 8,807,363
Other Fees payable 11,837,913(8)
Total Expenses 316,387,301Net investment income/loss 383,453,938
Notes
11
Vontobel Fund - Swiss Money
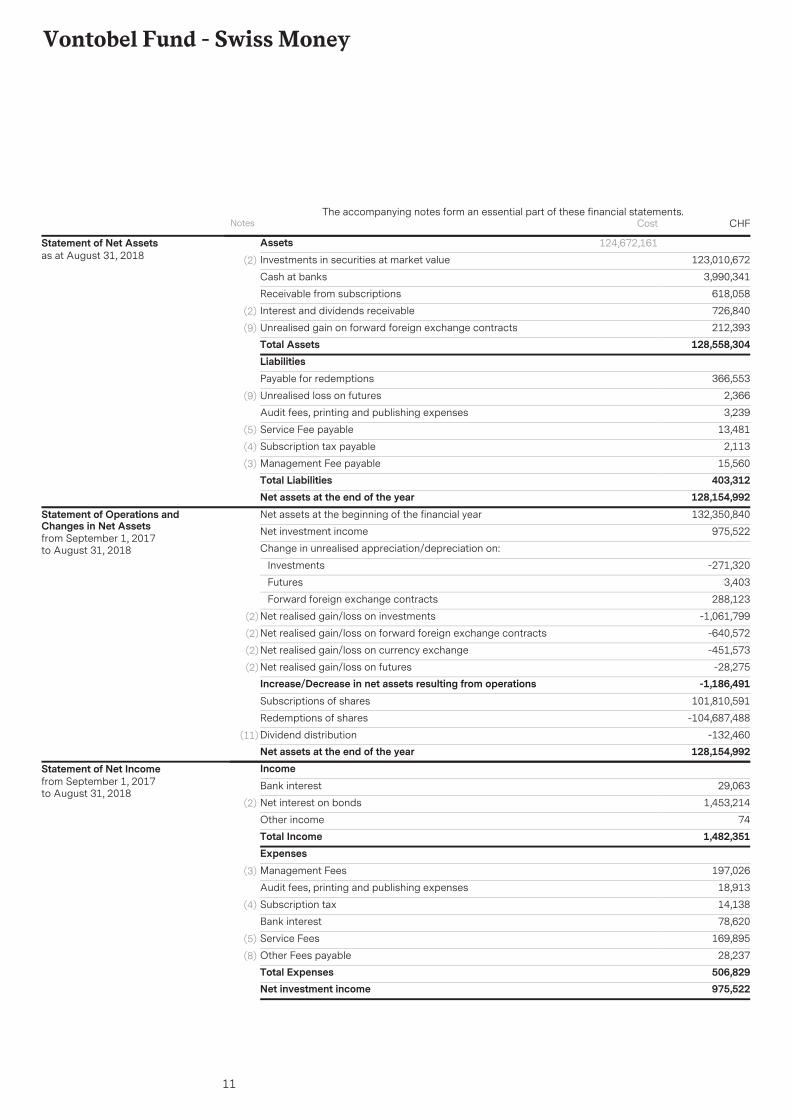
AssetsInvestments in securities at market value 123,010,672(2)
3,990,341Cash at banks
618,058Receivable from subscriptions
726,840Interest and dividends receivable(2)
212,393Unrealised gain on forward foreign exchange contracts(9)
Total Assets 128,558,304
124,672,161Statement of Net Assetsas at August 31, 2018
LiabilitiesPayable for redemptions 366,553
Unrealised loss on futures 2,366(9)
Audit fees, printing and publishing expenses 3,239
Service Fee payable 13,481(5)
Subscription tax payable 2,113(4)
Management Fee payable 15,560(3)
Total Liabilities 403,312Net assets at the end of the year 128,154,992Net assets at the beginning of the financial year 132,350,840
Net investment income 975,522
Change in unrealised appreciation/depreciation on:
Investments -271,320
Futures 3,403
Forward foreign exchange contracts 288,123
Net realised gain/loss on investments -1,061,799(2)
Net realised gain/loss on forward foreign exchange contracts -640,572(2)
Net realised gain/loss on currency exchange -451,573(2)
Net realised gain/loss on futures -28,275(2)
Increase/Decrease in net assets resulting from operations -1,186,491Subscriptions of shares 101,810,591
Redemptions of shares -104,687,488
Dividend distribution -132,460(11)
Net assets at the end of the year 128,154,992
Statement of Operations andChanges in Net Assetsfrom September 1, 2017to August 31, 2018
IncomeBank interest 29,063
Net interest on bonds 1,453,214(2)
Other income 74Total Income 1,482,351ExpensesManagement Fees 197,026(3)
Audit fees, printing and publishing expenses 18,913
Subscription tax 14,138(4)
Bank interest 78,620
Service Fees 169,895(5)
Other Fees payable 28,237(8)
Total Expenses 506,829Net investment income 975,522
Statement of Net Incomefrom September 1, 2017to August 31, 2018
Notes CHFThe accompanying notes form an essential part of these financial statements.
Cost
12
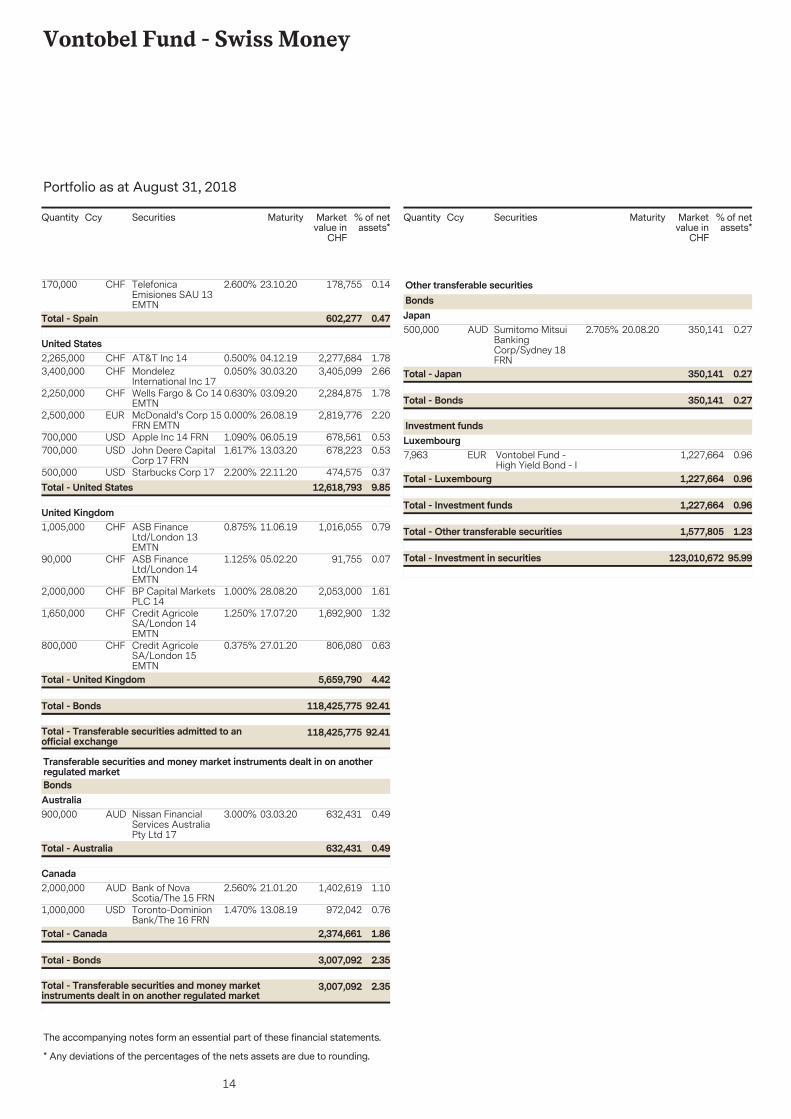
Vontobel Fund - Swiss Money
The accompanying notes form an essential part of these financial statements.
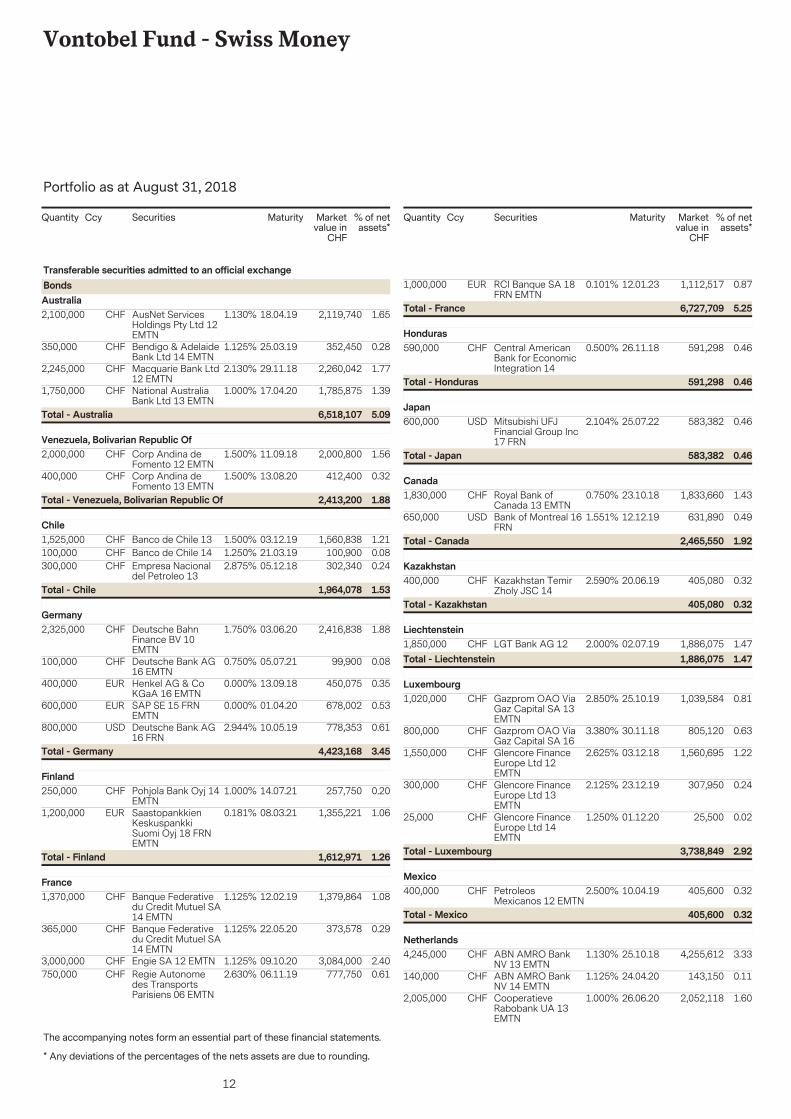
Portfolio as at August 31, 2018
* Any deviations of the percentages of the nets assets are due to rounding.
Securities Marketvalue in
CHF
% of netassets*
Quantity Ccy Maturity
2,100,000 2,119,740 1.6518.04.19AusNet ServicesHoldings Pty Ltd 12EMTN
CHF 1.130%
Transferable securities admitted to an official exchangeBondsAustralia
350,000 352,450 0.2825.03.19Bendigo & AdelaideBank Ltd 14 EMTN
CHF 1.125%
2,245,000 2,260,042 1.7729.11.18Macquarie Bank Ltd12 EMTN
CHF 2.130%
1,750,000 1,785,875 1.3917.04.20National AustraliaBank Ltd 13 EMTN
CHF 1.000%
5.096,518,107Total - Australia
2,000,000 2,000,800 1.5611.09.18Corp Andina deFomento 12 EMTN
CHF 1.500%Venezuela, Bolivarian Republic Of
400,000 412,400 0.3213.08.20Corp Andina deFomento 13 EMTN
CHF 1.500%
1.882,413,200Total - Venezuela, Bolivarian Republic Of
1,525,000 1,560,838 1.2103.12.19Banco de Chile 13CHF 1.500%Chile
100,000 100,900 0.0821.03.19Banco de Chile 14CHF 1.250%300,000 302,340 0.2405.12.18Empresa Nacional
del Petroleo 13CHF 2.875%
1.531,964,078Total - Chile
2,325,000 2,416,838 1.8803.06.20Deutsche BahnFinance BV 10EMTN
CHF 1.750%Germany
100,000 99,900 0.0805.07.21Deutsche Bank AG16 EMTN
CHF 0.750%
400,000 450,075 0.3513.09.18Henkel AG & CoKGaA 16 EMTN
EUR 0.000%
600,000 678,002 0.5301.04.20SAP SE 15 FRNEMTN
EUR 0.000%
800,000 778,353 0.6110.05.19Deutsche Bank AG16 FRN
USD 2.944%
3.454,423,168Total - Germany
250,000 257,750 0.2014.07.21Pohjola Bank Oyj 14EMTN
CHF 1.000%Finland
1,200,000 1,355,221 1.0608.03.21SaastopankkienKeskuspankkiSuomi Oyj 18 FRNEMTN
EUR 0.181%
1.261,612,971Total - Finland
1,370,000 1,379,864 1.0812.02.19Banque Federativedu Credit Mutuel SA14 EMTN
CHF 1.125%France
365,000 373,578 0.2922.05.20Banque Federativedu Credit Mutuel SA14 EMTN
CHF 1.125%
3,000,000 3,084,000 2.4009.10.20Engie SA 12 EMTNCHF 1.125%750,000 777,750 0.6106.11.19Regie Autonome
des TransportsParisiens 06 EMTN
CHF 2.630%
Securities Marketvalue in
CHF
% of netassets*
Quantity Ccy Maturity
1,000,000 1,112,517 0.8712.01.23RCI Banque SA 18FRN EMTN
EUR 0.101%
5.256,727,709Total - France
590,000 591,298 0.4626.11.18Central AmericanBank for EconomicIntegration 14
CHF 0.500%Honduras
0.46591,298Total - Honduras
600,000 583,382 0.4625.07.22Mitsubishi UFJFinancial Group Inc17 FRN
USD 2.104%Japan
0.46583,382Total - Japan
1,830,000 1,833,660 1.4323.10.18Royal Bank ofCanada 13 EMTN
CHF 0.750%Canada
650,000 631,890 0.4912.12.19Bank of Montreal 16FRN
USD 1.551%
1.922,465,550Total - Canada
400,000 405,080 0.3220.06.19Kazakhstan TemirZholy JSC 14
CHF 2.590%Kazakhstan
0.32405,080Total - Kazakhstan
1,850,000 1,886,075 1.4702.07.19LGT Bank AG 12CHF 2.000%Liechtenstein
1.471,886,075Total - Liechtenstein
1,020,000 1,039,584 0.8125.10.19Gazprom OAO ViaGaz Capital SA 13EMTN
CHF 2.850%Luxembourg
800,000 805,120 0.6330.11.18Gazprom OAO ViaGaz Capital SA 16
CHF 3.380%
1,550,000 1,560,695 1.2203.12.18Glencore FinanceEurope Ltd 12EMTN
CHF 2.625%
300,000 307,950 0.2423.12.19Glencore FinanceEurope Ltd 13EMTN
CHF 2.125%
25,000 25,500 0.0201.12.20Glencore FinanceEurope Ltd 14EMTN
CHF 1.250%
2.923,738,849Total - Luxembourg
400,000 405,600 0.3210.04.19PetroleosMexicanos 12 EMTN
CHF 2.500%Mexico
0.32405,600Total - Mexico
4,245,000 4,255,612 3.3325.10.18ABN AMRO BankNV 13 EMTN
CHF 1.130%Netherlands
140,000 143,150 0.1124.04.20ABN AMRO BankNV 14 EMTN
CHF 1.125%
2,005,000 2,052,118 1.6026.06.20CooperatieveRabobank UA 13EMTN
CHF 1.000%
13
Vontobel Fund - Swiss Money
The accompanying notes form an essential part of these financial statements.
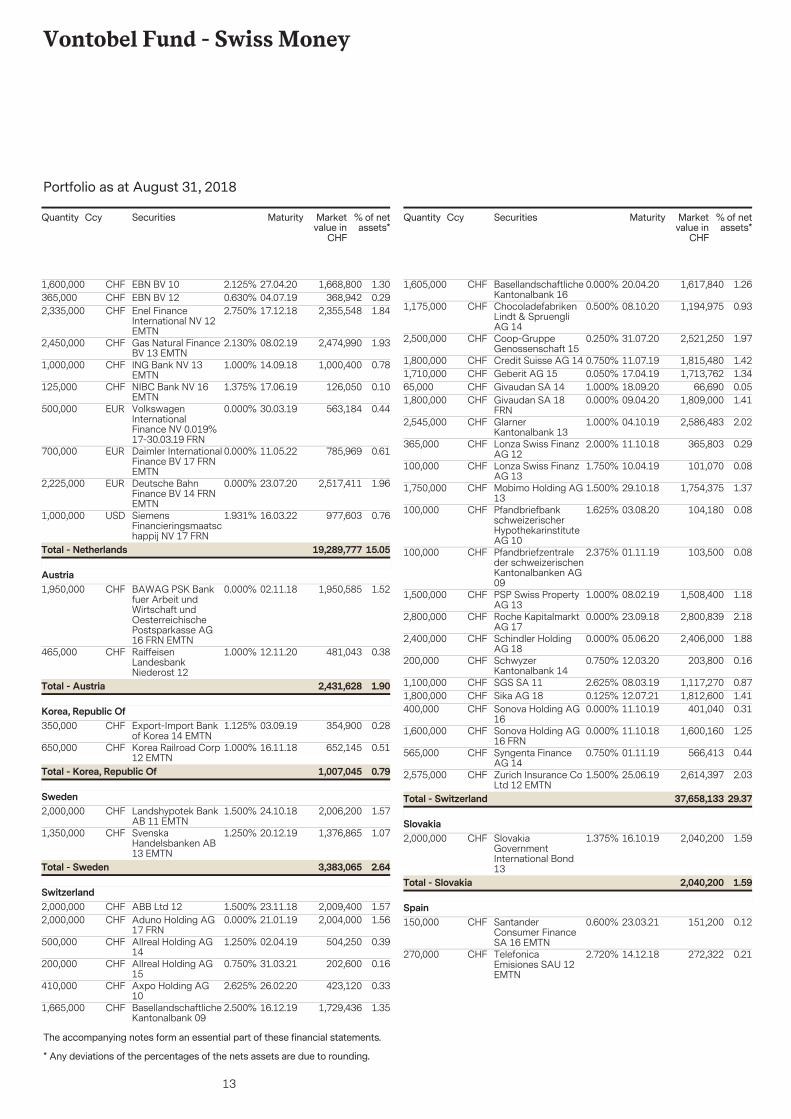
Portfolio as at August 31, 2018
* Any deviations of the percentages of the nets assets are due to rounding.
Securities Marketvalue in
CHF
% of netassets*
Quantity Ccy Maturity
1,600,000 1,668,800 1.3027.04.20EBN BV 10CHF 2.125%365,000 368,942 0.2904.07.19EBN BV 12CHF 0.630%2,335,000 2,355,548 1.8417.12.18Enel Finance
International NV 12EMTN
CHF 2.750%
2,450,000 2,474,990 1.9308.02.19Gas Natural FinanceBV 13 EMTN
CHF 2.130%
1,000,000 1,000,400 0.7814.09.18ING Bank NV 13EMTN
CHF 1.000%
125,000 126,050 0.1017.06.19NIBC Bank NV 16EMTN
CHF 1.375%
500,000 563,184 0.4430.03.19VolkswagenInternationalFinance NV 0.019%17-30.03.19 FRN
EUR 0.000%
700,000 785,969 0.6111.05.22Daimler InternationalFinance BV 17 FRNEMTN
EUR 0.000%
2,225,000 2,517,411 1.9623.07.20Deutsche BahnFinance BV 14 FRNEMTN
EUR 0.000%
1,000,000 977,603 0.7616.03.22SiemensFinancieringsmaatschappij NV 17 FRN
USD 1.931%
15.0519,289,777Total - Netherlands
1,950,000 1,950,585 1.5202.11.18BAWAG PSK Bankfuer Arbeit undWirtschaft undOesterreichischePostsparkasse AG16 FRN EMTN
CHF 0.000%Austria
465,000 481,043 0.3812.11.20RaiffeisenLandesbankNiederost 12
CHF 1.000%
1.902,431,628Total - Austria
350,000 354,900 0.2803.09.19Export-Import Bankof Korea 14 EMTN
CHF 1.125%Korea, Republic Of
650,000 652,145 0.5116.11.18Korea Railroad Corp12 EMTN
CHF 1.000%
0.791,007,045Total - Korea, Republic Of
2,000,000 2,006,200 1.5724.10.18Landshypotek BankAB 11 EMTN
CHF 1.500%Sweden
1,350,000 1,376,865 1.0720.12.19SvenskaHandelsbanken AB13 EMTN
CHF 1.250%
2.643,383,065Total - Sweden
2,000,000 2,009,400 1.5723.11.18ABB Ltd 12CHF 1.500%Switzerland
2,000,000 2,004,000 1.5621.01.19Aduno Holding AG17 FRN
CHF 0.000%
500,000 504,250 0.3902.04.19Allreal Holding AG14
CHF 1.250%
200,000 202,600 0.1631.03.21Allreal Holding AG15
CHF 0.750%
410,000 423,120 0.3326.02.20Axpo Holding AG10
CHF 2.625%
1,665,000 1,729,436 1.3516.12.19BasellandschaftlicheKantonalbank 09
CHF 2.500%
Securities Marketvalue in
CHF
% of netassets*
Quantity Ccy Maturity
1,605,000 1,617,840 1.2620.04.20BasellandschaftlicheKantonalbank 16
CHF 0.000%
1,175,000 1,194,975 0.9308.10.20ChocoladefabrikenLindt & SpruengliAG 14
CHF 0.500%
2,500,000 2,521,250 1.9731.07.20Coop-GruppeGenossenschaft 15
CHF 0.250%
1,800,000 1,815,480 1.4211.07.19Credit Suisse AG 14CHF 0.750%1,710,000 1,713,762 1.3417.04.19Geberit AG 15CHF 0.050%65,000 66,690 0.0518.09.20Givaudan SA 14CHF 1.000%1,800,000 1,809,000 1.4109.04.20Givaudan SA 18
FRNCHF 0.000%
2,545,000 2,586,483 2.0204.10.19GlarnerKantonalbank 13
CHF 1.000%
365,000 365,803 0.2911.10.18Lonza Swiss FinanzAG 12
CHF 2.000%
100,000 101,070 0.0810.04.19Lonza Swiss FinanzAG 13
CHF 1.750%
1,750,000 1,754,375 1.3729.10.18Mobimo Holding AG13
CHF 1.500%
100,000 104,180 0.0803.08.20PfandbriefbankschweizerischerHypothekarinstituteAG 10
CHF 1.625%
100,000 103,500 0.0801.11.19Pfandbriefzentraleder schweizerischenKantonalbanken AG09
CHF 2.375%
1,500,000 1,508,400 1.1808.02.19PSP Swiss PropertyAG 13
CHF 1.000%
2,800,000 2,800,839 2.1823.09.18Roche KapitalmarktAG 17
CHF 0.000%
2,400,000 2,406,000 1.8805.06.20Schindler HoldingAG 18
CHF 0.000%
200,000 203,800 0.1612.03.20SchwyzerKantonalbank 14
CHF 0.750%
1,100,000 1,117,270 0.8708.03.19SGS SA 11CHF 2.625%1,800,000 1,812,600 1.4112.07.21Sika AG 18CHF 0.125%400,000 401,040 0.3111.10.19Sonova Holding AG
16CHF 0.000%
1,600,000 1,600,160 1.2511.10.18Sonova Holding AG16 FRN
CHF 0.000%
565,000 566,413 0.4401.11.19Syngenta FinanceAG 14
CHF 0.750%
2,575,000 2,614,397 2.0325.06.19Zurich Insurance CoLtd 12 EMTN
CHF 1.500%
29.3737,658,133Total - Switzerland
2,000,000 2,040,200 1.5916.10.19SlovakiaGovernmentInternational Bond13
CHF 1.375%Slovakia
1.592,040,200Total - Slovakia
150,000 151,200 0.1223.03.21SantanderConsumer FinanceSA 16 EMTN
CHF 0.600%Spain
270,000 272,322 0.2114.12.18TelefonicaEmisiones SAU 12EMTN
CHF 2.720%
14
Vontobel Fund - Swiss Money
The accompanying notes form an essential part of these financial statements.
Portfolio as at August 31, 2018
* Any deviations of the percentages of the nets assets are due to rounding.
Securities Marketvalue in
CHF
% of netassets*
Quantity Ccy Maturity
170,000 178,755 0.1423.10.20TelefonicaEmisiones SAU 13EMTN
CHF 2.600%
0.47602,277Total - Spain
2,265,000 2,277,684 1.7804.12.19AT&T Inc 14CHF 0.500%United States
3,400,000 3,405,099 2.6630.03.20MondelezInternational Inc 17
CHF 0.050%
2,250,000 2,284,875 1.7803.09.20Wells Fargo & Co 14EMTN
CHF 0.630%
2,500,000 2,819,776 2.2026.08.19McDonald's Corp 15FRN EMTN
EUR 0.000%
700,000 678,561 0.5306.05.19Apple Inc 14 FRNUSD 1.090%700,000 678,223 0.5313.03.20John Deere Capital
Corp 17 FRNUSD 1.617%
500,000 474,575 0.3722.11.20Starbucks Corp 17USD 2.200%9.8512,618,793Total - United States
1,005,000 1,016,055 0.7911.06.19ASB FinanceLtd/London 13EMTN
CHF 0.875%United Kingdom
90,000 91,755 0.0705.02.20ASB FinanceLtd/London 14EMTN
CHF 1.125%
2,000,000 2,053,000 1.6128.08.20BP Capital MarketsPLC 14
CHF 1.000%
1,650,000 1,692,900 1.3217.07.20Credit AgricoleSA/London 14EMTN
CHF 1.250%
800,000 806,080 0.6327.01.20Credit AgricoleSA/London 15EMTN
CHF 0.375%
92.41118,425,775Total - Transferable securities admitted to anofficial exchange
92.41118,425,775Total - Bonds
4.425,659,790Total - United Kingdom
900,000 632,431 0.4903.03.20Nissan FinancialServices AustraliaPty Ltd 17
AUD 3.000%
Transferable securities and money market instruments dealt in on anotherregulated marketBondsAustralia
0.49632,431Total - Australia
2,000,000 1,402,619 1.1021.01.20Bank of NovaScotia/The 15 FRN
AUD 2.560%Canada
1,000,000 972,042 0.7613.08.19Toronto-DominionBank/The 16 FRN
USD 1.470%
2.353,007,092Total - Transferable securities and money marketinstruments dealt in on another regulated market
2.353,007,092Total - Bonds
1.862,374,661Total - Canada
Securities Marketvalue in
CHF
% of netassets*
Quantity Ccy Maturity
500,000 350,141 0.2720.08.20Sumitomo MitsuiBankingCorp/Sydney 18FRN
AUD 2.705%
Other transferable securitiesBondsJapan
0.27350,141Total - Bonds
0.27350,141Total - Japan
7,963 1,227,664 0.96Vontobel Fund -High Yield Bond - I
EUR
Investment fundsLuxembourg
1.231,577,805Total - Other transferable securities
0.961,227,664Total - Investment funds
0.961,227,664Total - Luxembourg
95.99123,010,672Total - Investment in securities
15
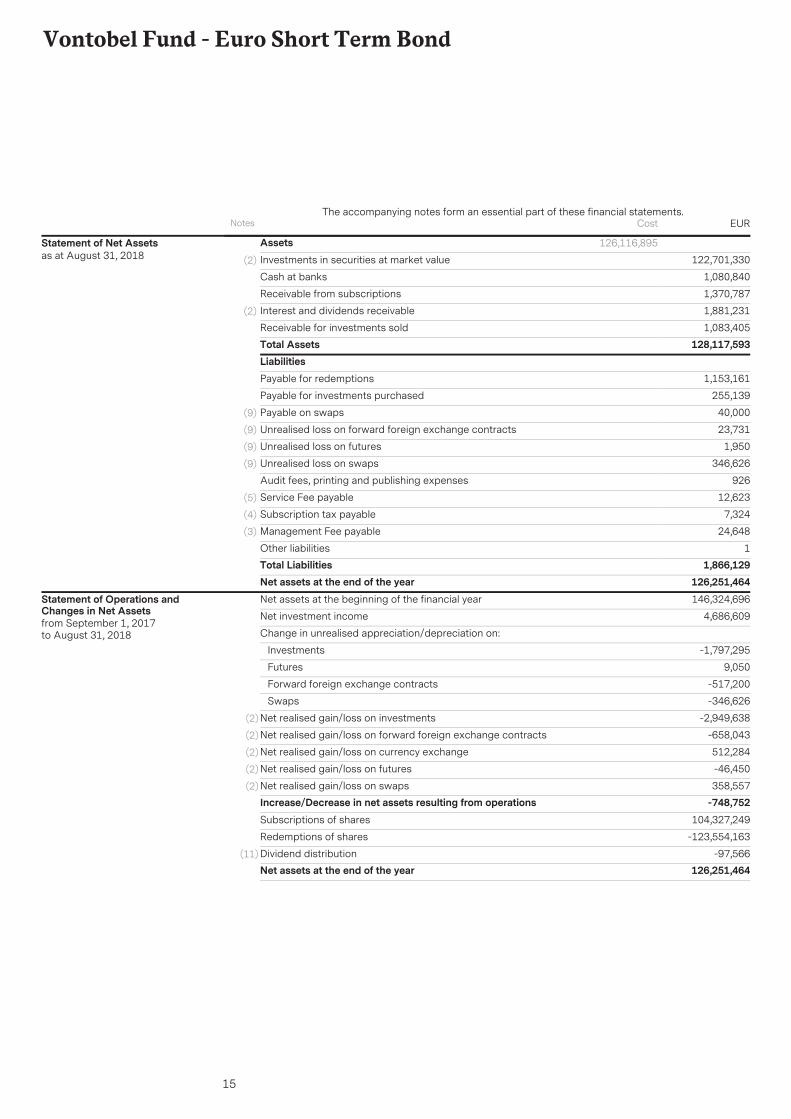
Vontobel Fund - Euro Short Term Bond
AssetsInvestments in securities at market value 122,701,330(2)
1,080,840Cash at banks
1,370,787Receivable from subscriptions
1,881,231Interest and dividends receivable(2)
1,083,405Receivable for investments soldTotal Assets 128,117,593
126,116,895Statement of Net Assetsas at August 31, 2018
LiabilitiesPayable for redemptions 1,153,161
Payable for investments purchased 255,139
Payable on swaps 40,000(9)
Unrealised loss on forward foreign exchange contracts 23,731(9)
Unrealised loss on futures 1,950(9)
Unrealised loss on swaps 346,626(9)
Audit fees, printing and publishing expenses 926
Service Fee payable 12,623(5)
Subscription tax payable 7,324(4)
Management Fee payable 24,648(3)
Other liabilities 1Total Liabilities 1,866,129Net assets at the end of the year 126,251,464Net assets at the beginning of the financial year 146,324,696
Net investment income 4,686,609
Change in unrealised appreciation/depreciation on:
Investments -1,797,295
Futures 9,050
Forward foreign exchange contracts -517,200
Swaps -346,626
Net realised gain/loss on investments -2,949,638(2)
Net realised gain/loss on forward foreign exchange contracts -658,043(2)
Net realised gain/loss on currency exchange 512,284(2)
Net realised gain/loss on futures -46,450(2)
Net realised gain/loss on swaps 358,557(2)
Increase/Decrease in net assets resulting from operations -748,752Subscriptions of shares 104,327,249
Redemptions of shares -123,554,163
Dividend distribution -97,566(11)
Net assets at the end of the year 126,251,464
Statement of Operations andChanges in Net Assetsfrom September 1, 2017to August 31, 2018
Notes EURThe accompanying notes form an essential part of these financial statements.
Cost
16
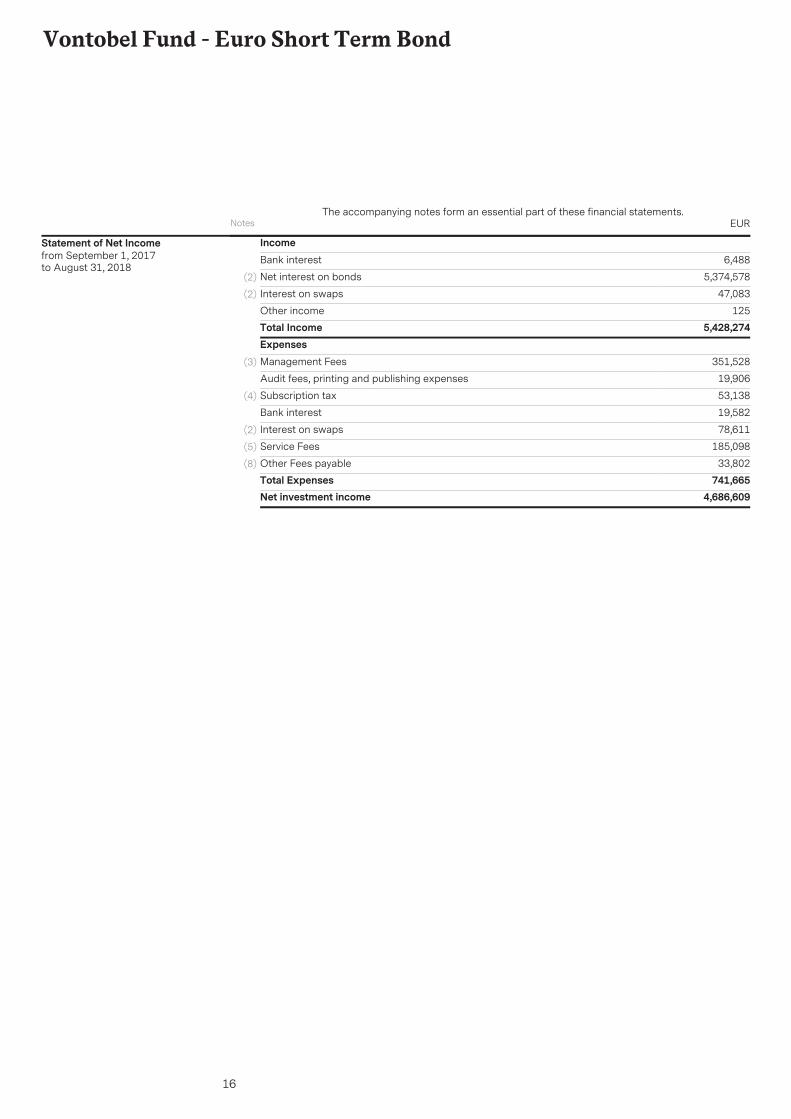
Vontobel Fund - Euro Short Term Bond
IncomeBank interest 6,488
Net interest on bonds 5,374,578(2)
Interest on swaps 47,083(2)
Other income 125Total Income 5,428,274ExpensesManagement Fees 351,528(3)
Audit fees, printing and publishing expenses 19,906
Subscription tax 53,138(4)
Bank interest 19,582
Interest on swaps 78,611(2)
Service Fees 185,098(5)
Other Fees payable 33,802(8)
Total Expenses 741,665Net investment income 4,686,609
Statement of Net Incomefrom September 1, 2017to August 31, 2018
Notes EURThe accompanying notes form an essential part of these financial statements.
17
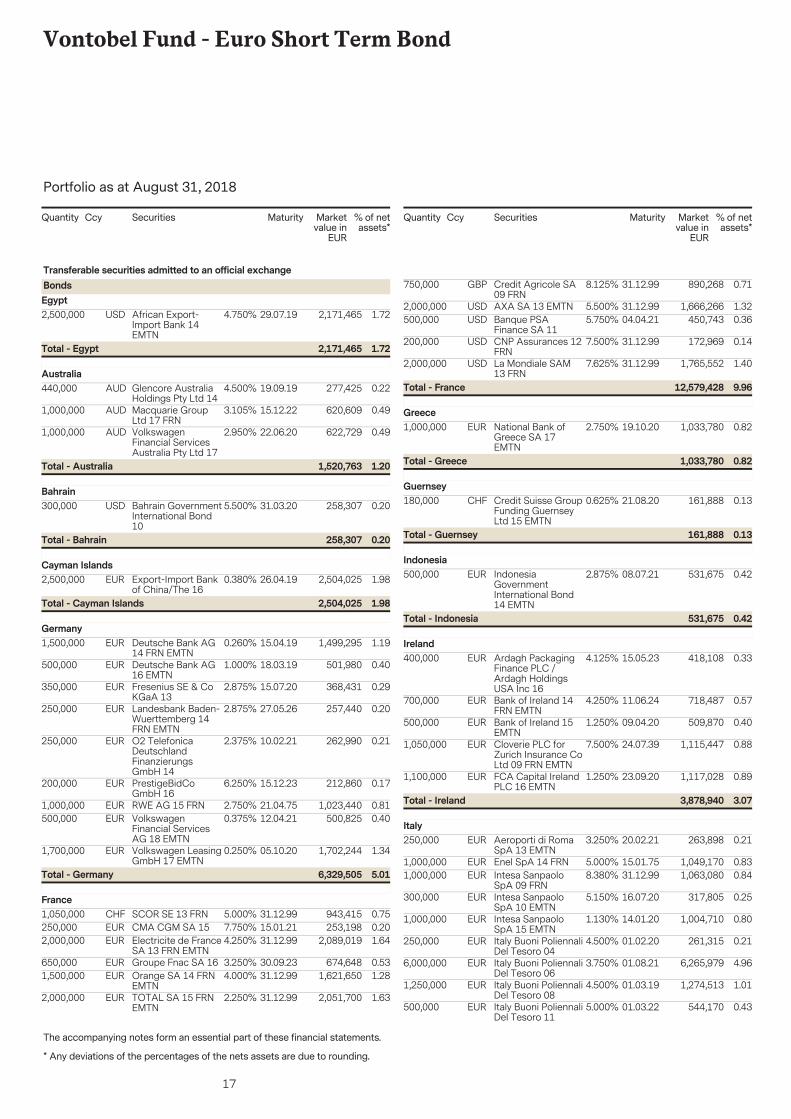
Vontobel Fund - Euro Short Term Bond
The accompanying notes form an essential part of these financial statements.
Portfolio as at August 31, 2018
* Any deviations of the percentages of the nets assets are due to rounding.
Securities Marketvalue in
EUR
% of netassets*
Quantity Ccy Maturity
2,500,000 2,171,465 1.7229.07.19African Export-Import Bank 14EMTN
USD 4.750%
Transferable securities admitted to an official exchangeBondsEgypt
1.722,171,465Total - Egypt
440,000 277,425 0.2219.09.19Glencore AustraliaHoldings Pty Ltd 14
AUD 4.500%Australia
1,000,000 620,609 0.4915.12.22Macquarie GroupLtd 17 FRN
AUD 3.105%
1,000,000 622,729 0.4922.06.20VolkswagenFinancial ServicesAustralia Pty Ltd 17
AUD 2.950%
1.201,520,763Total - Australia
300,000 258,307 0.2031.03.20Bahrain GovernmentInternational Bond10
USD 5.500%Bahrain
0.20258,307Total - Bahrain
2,500,000 2,504,025 1.9826.04.19Export-Import Bankof China/The 16
EUR 0.380%Cayman Islands
1.982,504,025Total - Cayman Islands
1,500,000 1,499,295 1.1915.04.19Deutsche Bank AG14 FRN EMTN
EUR 0.260%Germany
500,000 501,980 0.4018.03.19Deutsche Bank AG16 EMTN
EUR 1.000%
350,000 368,431 0.2915.07.20Fresenius SE & CoKGaA 13
EUR 2.875%
250,000 257,440 0.2027.05.26Landesbank Baden-Wuerttemberg 14FRN EMTN
EUR 2.875%
250,000 262,990 0.2110.02.21O2 TelefonicaDeutschlandFinanzierungsGmbH 14
EUR 2.375%
200,000 212,860 0.1715.12.23PrestigeBidCoGmbH 16
EUR 6.250%
1,000,000 1,023,440 0.8121.04.75RWE AG 15 FRNEUR 2.750%500,000 500,825 0.4012.04.21Volkswagen
Financial ServicesAG 18 EMTN
EUR 0.375%
1,700,000 1,702,244 1.3405.10.20Volkswagen LeasingGmbH 17 EMTN
EUR 0.250%
5.016,329,505Total - Germany
1,050,000 943,415 0.7531.12.99SCOR SE 13 FRNCHF 5.000%France
250,000 253,198 0.2015.01.21CMA CGM SA 15EUR 7.750%2,000,000 2,089,019 1.6431.12.99Electricite de France
SA 13 FRN EMTNEUR 4.250%
650,000 674,648 0.5330.09.23Groupe Fnac SA 16EUR 3.250%1,500,000 1,621,650 1.2831.12.99Orange SA 14 FRN
EMTNEUR 4.000%
2,000,000 2,051,700 1.6331.12.99TOTAL SA 15 FRNEMTN
EUR 2.250%
Securities Marketvalue in
EUR
% of netassets*
Quantity Ccy Maturity
750,000 890,268 0.7131.12.99Credit Agricole SA09 FRN
GBP 8.125%
2,000,000 1,666,266 1.3231.12.99AXA SA 13 EMTNUSD 5.500%500,000 450,743 0.3604.04.21Banque PSA
Finance SA 11USD 5.750%
200,000 172,969 0.1431.12.99CNP Assurances 12FRN
USD 7.500%
2,000,000 1,765,552 1.4031.12.99La Mondiale SAM13 FRN
USD 7.625%
9.9612,579,428Total - France
1,000,000 1,033,780 0.8219.10.20National Bank ofGreece SA 17EMTN
EUR 2.750%Greece
0.821,033,780Total - Greece
180,000 161,888 0.1321.08.20Credit Suisse GroupFunding GuernseyLtd 15 EMTN
CHF 0.625%Guernsey
0.13161,888Total - Guernsey
500,000 531,675 0.4208.07.21IndonesiaGovernmentInternational Bond14 EMTN
EUR 2.875%Indonesia
0.42531,675Total - Indonesia
400,000 418,108 0.3315.05.23Ardagh PackagingFinance PLC /Ardagh HoldingsUSA Inc 16
EUR 4.125%Ireland
700,000 718,487 0.5711.06.24Bank of Ireland 14FRN EMTN
EUR 4.250%
500,000 509,870 0.4009.04.20Bank of Ireland 15EMTN
EUR 1.250%
1,050,000 1,115,447 0.8824.07.39Cloverie PLC forZurich Insurance CoLtd 09 FRN EMTN
EUR 7.500%
1,100,000 1,117,028 0.8923.09.20FCA Capital IrelandPLC 16 EMTN
EUR 1.250%
3.073,878,940Total - Ireland
250,000 263,898 0.2120.02.21Aeroporti di RomaSpA 13 EMTN
EUR 3.250%Italy
1,000,000 1,049,170 0.8315.01.75Enel SpA 14 FRNEUR 5.000%1,000,000 1,063,080 0.8431.12.99Intesa Sanpaolo
SpA 09 FRNEUR 8.380%
300,000 317,805 0.2516.07.20Intesa SanpaoloSpA 10 EMTN
EUR 5.150%
1,000,000 1,004,710 0.8014.01.20Intesa SanpaoloSpA 15 EMTN
EUR 1.130%
250,000 261,315 0.2101.02.20Italy Buoni PoliennaliDel Tesoro 04
EUR 4.500%
6,000,000 6,265,979 4.9601.08.21Italy Buoni PoliennaliDel Tesoro 06
EUR 3.750%
1,250,000 1,274,513 1.0101.03.19Italy Buoni PoliennaliDel Tesoro 08
EUR 4.500%
500,000 544,170 0.4301.03.22Italy Buoni PoliennaliDel Tesoro 11
EUR 5.000%
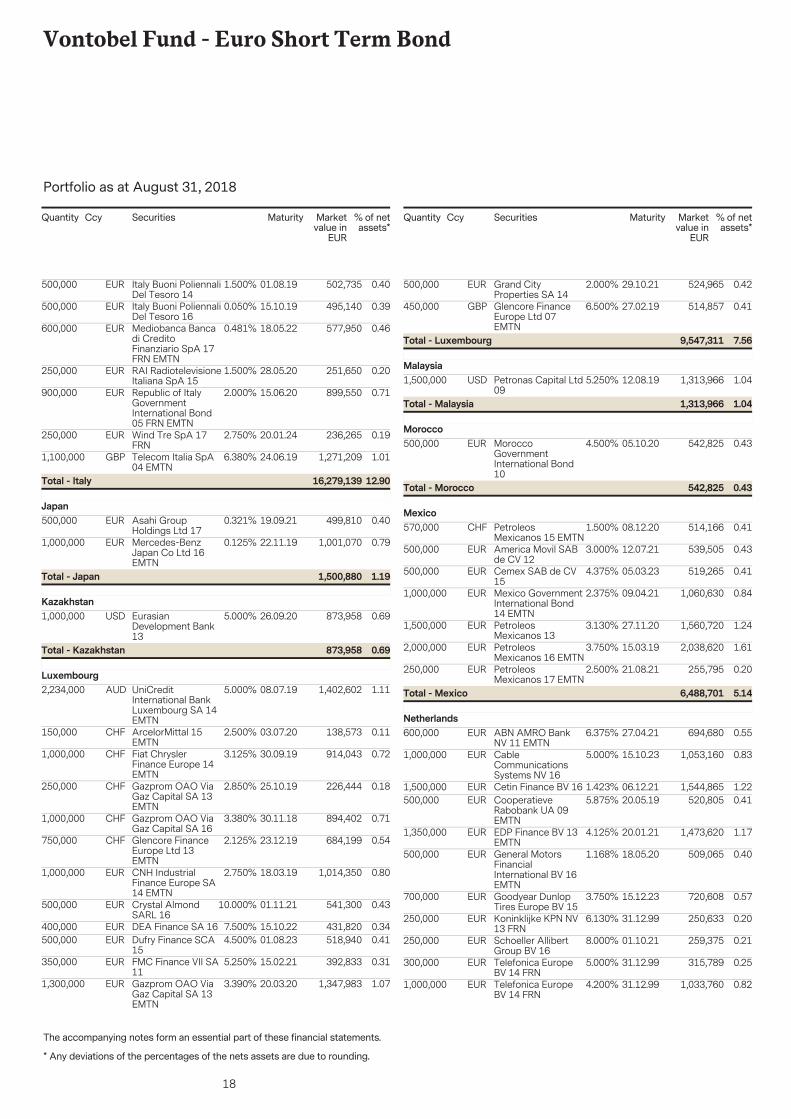
18
Vontobel Fund - Euro Short Term Bond
The accompanying notes form an essential part of these financial statements.
Portfolio as at August 31, 2018
* Any deviations of the percentages of the nets assets are due to rounding.
Securities Marketvalue in
EUR
% of netassets*
Quantity Ccy Maturity
500,000 502,735 0.4001.08.19Italy Buoni PoliennaliDel Tesoro 14
EUR 1.500%
500,000 495,140 0.3915.10.19Italy Buoni PoliennaliDel Tesoro 16
EUR 0.050%
600,000 577,950 0.4618.05.22Mediobanca Bancadi CreditoFinanziario SpA 17FRN EMTN
EUR 0.481%
250,000 251,650 0.2028.05.20RAI RadiotelevisioneItaliana SpA 15
EUR 1.500%
900,000 899,550 0.7115.06.20Republic of ItalyGovernmentInternational Bond05 FRN EMTN
EUR 2.000%
250,000 236,265 0.1920.01.24Wind Tre SpA 17FRN
EUR 2.750%
1,100,000 1,271,209 1.0124.06.19Telecom Italia SpA04 EMTN
GBP 6.380%
12.9016,279,139Total - Italy
500,000 499,810 0.4019.09.21Asahi GroupHoldings Ltd 17
EUR 0.321%Japan
1,000,000 1,001,070 0.7922.11.19Mercedes-BenzJapan Co Ltd 16EMTN
EUR 0.125%
1.191,500,880Total - Japan
1,000,000 873,958 0.6926.09.20EurasianDevelopment Bank13
USD 5.000%Kazakhstan
0.69873,958Total - Kazakhstan
2,234,000 1,402,602 1.1108.07.19UniCreditInternational BankLuxembourg SA 14EMTN
AUD 5.000%Luxembourg
150,000 138,573 0.1103.07.20ArcelorMittal 15EMTN
CHF 2.500%
1,000,000 914,043 0.7230.09.19Fiat ChryslerFinance Europe 14EMTN
CHF 3.125%
250,000 226,444 0.1825.10.19Gazprom OAO ViaGaz Capital SA 13EMTN
CHF 2.850%
1,000,000 894,402 0.7130.11.18Gazprom OAO ViaGaz Capital SA 16
CHF 3.380%
750,000 684,199 0.5423.12.19Glencore FinanceEurope Ltd 13EMTN
CHF 2.125%
1,000,000 1,014,350 0.8018.03.19CNH IndustrialFinance Europe SA14 EMTN
EUR 2.750%
500,000 541,300 0.4301.11.21Crystal AlmondSARL 16
EUR 10.000%
400,000 431,820 0.3415.10.22DEA Finance SA 16EUR 7.500%500,000 518,940 0.4101.08.23Dufry Finance SCA
15EUR 4.500%
350,000 392,833 0.3115.02.21FMC Finance VII SA11
EUR 5.250%
1,300,000 1,347,983 1.0720.03.20Gazprom OAO ViaGaz Capital SA 13EMTN
EUR 3.390%
Securities Marketvalue in
EUR
% of netassets*
Quantity Ccy Maturity
500,000 524,965 0.4229.10.21Grand CityProperties SA 14
EUR 2.000%
450,000 514,857 0.4127.02.19Glencore FinanceEurope Ltd 07EMTN
GBP 6.500%
7.569,547,311Total - Luxembourg
1,500,000 1,313,966 1.0412.08.19Petronas Capital Ltd09
USD 5.250%Malaysia
1.041,313,966Total - Malaysia
500,000 542,825 0.4305.10.20MoroccoGovernmentInternational Bond10
EUR 4.500%Morocco
0.43542,825Total - Morocco
570,000 514,166 0.4108.12.20PetroleosMexicanos 15 EMTN
CHF 1.500%Mexico
500,000 539,505 0.4312.07.21America Movil SABde CV 12
EUR 3.000%
500,000 519,265 0.4105.03.23Cemex SAB de CV15
EUR 4.375%
1,000,000 1,060,630 0.8409.04.21Mexico GovernmentInternational Bond14 EMTN
EUR 2.375%
1,500,000 1,560,720 1.2427.11.20PetroleosMexicanos 13
EUR 3.130%
2,000,000 2,038,620 1.6115.03.19PetroleosMexicanos 16 EMTN
EUR 3.750%
250,000 255,795 0.2021.08.21PetroleosMexicanos 17 EMTN
EUR 2.500%
5.146,488,701Total - Mexico
600,000 694,680 0.5527.04.21ABN AMRO BankNV 11 EMTN
EUR 6.375%Netherlands
1,000,000 1,053,160 0.8315.10.23CableCommunicationsSystems NV 16
EUR 5.000%
1,500,000 1,544,865 1.2206.12.21Cetin Finance BV 16EUR 1.423%500,000 520,805 0.4120.05.19Cooperatieve
Rabobank UA 09EMTN
EUR 5.875%
1,350,000 1,473,620 1.1720.01.21EDP Finance BV 13EMTN
EUR 4.125%
500,000 509,065 0.4018.05.20General MotorsFinancialInternational BV 16EMTN
EUR 1.168%
700,000 720,608 0.5715.12.23Goodyear DunlopTires Europe BV 15
EUR 3.750%
250,000 250,633 0.2031.12.99Koninklijke KPN NV13 FRN
EUR 6.130%
250,000 259,375 0.2101.10.21Schoeller AllibertGroup BV 16
EUR 8.000%
300,000 315,789 0.2531.12.99Telefonica EuropeBV 14 FRN
EUR 5.000%
1,000,000 1,033,760 0.8231.12.99Telefonica EuropeBV 14 FRN
EUR 4.200%
19
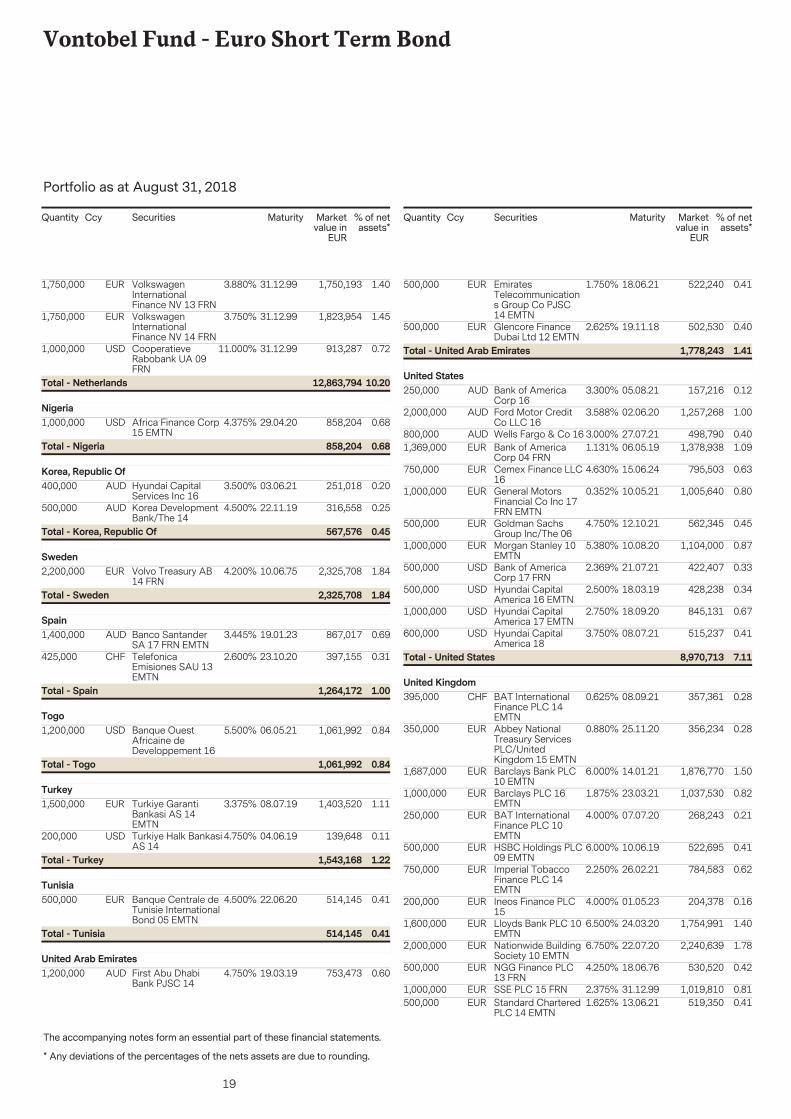
Vontobel Fund - Euro Short Term Bond
The accompanying notes form an essential part of these financial statements.
Portfolio as at August 31, 2018
* Any deviations of the percentages of the nets assets are due to rounding.
Securities Marketvalue in
EUR
% of netassets*
Quantity Ccy Maturity
1,750,000 1,750,193 1.4031.12.99VolkswagenInternationalFinance NV 13 FRN
EUR 3.880%
1,750,000 1,823,954 1.4531.12.99VolkswagenInternationalFinance NV 14 FRN
EUR 3.750%
1,000,000 913,287 0.7231.12.99CooperatieveRabobank UA 09FRN
USD 11.000%
10.2012,863,794Total - Netherlands
1,000,000 858,204 0.6829.04.20Africa Finance Corp15 EMTN
USD 4.375%Nigeria
0.68858,204Total - Nigeria
400,000 251,018 0.2003.06.21Hyundai CapitalServices Inc 16
AUD 3.500%Korea, Republic Of
500,000 316,558 0.2522.11.19Korea DevelopmentBank/The 14
AUD 4.500%
0.45567,576Total - Korea, Republic Of
2,200,000 2,325,708 1.8410.06.75Volvo Treasury AB14 FRN
EUR 4.200%Sweden
1.842,325,708Total - Sweden
1,400,000 867,017 0.6919.01.23Banco SantanderSA 17 FRN EMTN
AUD 3.445%Spain
425,000 397,155 0.3123.10.20TelefonicaEmisiones SAU 13EMTN
CHF 2.600%
1.001,264,172Total - Spain
1,200,000 1,061,992 0.8406.05.21Banque OuestAfricaine deDeveloppement 16
USD 5.500%Togo
0.841,061,992Total - Togo
1,500,000 1,403,520 1.1108.07.19Turkiye GarantiBankasi AS 14EMTN
EUR 3.375%Turkey
200,000 139,648 0.1104.06.19Turkiye Halk BankasiAS 14
USD 4.750%
1.221,543,168Total - Turkey
500,000 514,145 0.4122.06.20Banque Centrale deTunisie InternationalBond 05 EMTN
EUR 4.500%Tunisia
0.41514,145Total - Tunisia
1,200,000 753,473 0.6019.03.19First Abu DhabiBank PJSC 14
AUD 4.750%United Arab Emirates
Securities Marketvalue in
EUR
% of netassets*
Quantity Ccy Maturity
500,000 522,240 0.4118.06.21EmiratesTelecommunications Group Co PJSC14 EMTN
EUR 1.750%
500,000 502,530 0.4019.11.18Glencore FinanceDubai Ltd 12 EMTN
EUR 2.625%
1.411,778,243Total - United Arab Emirates
250,000 157,216 0.1205.08.21Bank of AmericaCorp 16
AUD 3.300%United States
2,000,000 1,257,268 1.0002.06.20Ford Motor CreditCo LLC 16
AUD 3.588%
800,000 498,790 0.4027.07.21Wells Fargo & Co 16AUD 3.000%1,369,000 1,378,938 1.0906.05.19Bank of America
Corp 04 FRNEUR 1.131%
750,000 795,503 0.6315.06.24Cemex Finance LLC16
EUR 4.630%
1,000,000 1,005,640 0.8010.05.21General MotorsFinancial Co Inc 17FRN EMTN
EUR 0.352%
500,000 562,345 0.4512.10.21Goldman SachsGroup Inc/The 06
EUR 4.750%
1,000,000 1,104,000 0.8710.08.20Morgan Stanley 10EMTN
EUR 5.380%
500,000 422,407 0.3321.07.21Bank of AmericaCorp 17 FRN
USD 2.369%
500,000 428,238 0.3418.03.19Hyundai CapitalAmerica 16 EMTN
USD 2.500%
1,000,000 845,131 0.6718.09.20Hyundai CapitalAmerica 17 EMTN
USD 2.750%
600,000 515,237 0.4108.07.21Hyundai CapitalAmerica 18
USD 3.750%
7.118,970,713Total - United States
395,000 357,361 0.2808.09.21BAT InternationalFinance PLC 14EMTN
CHF 0.625%United Kingdom
350,000 356,234 0.2825.11.20Abbey NationalTreasury ServicesPLC/UnitedKingdom 15 EMTN
EUR 0.880%
1,687,000 1,876,770 1.5014.01.21Barclays Bank PLC10 EMTN
EUR 6.000%
1,000,000 1,037,530 0.8223.03.21Barclays PLC 16EMTN
EUR 1.875%
250,000 268,243 0.2107.07.20BAT InternationalFinance PLC 10EMTN
EUR 4.000%
500,000 522,695 0.4110.06.19HSBC Holdings PLC09 EMTN
EUR 6.000%
750,000 784,583 0.6226.02.21Imperial TobaccoFinance PLC 14EMTN
EUR 2.250%
200,000 204,378 0.1601.05.23Ineos Finance PLC15
EUR 4.000%
1,600,000 1,754,991 1.4024.03.20Lloyds Bank PLC 10EMTN
EUR 6.500%
2,000,000 2,240,639 1.7822.07.20Nationwide BuildingSociety 10 EMTN
EUR 6.750%
500,000 530,520 0.4218.06.76NGG Finance PLC13 FRN
EUR 4.250%
1,000,000 1,019,810 0.8131.12.99SSE PLC 15 FRNEUR 2.375%500,000 519,350 0.4113.06.21Standard Chartered
PLC 14 EMTNEUR 1.625%
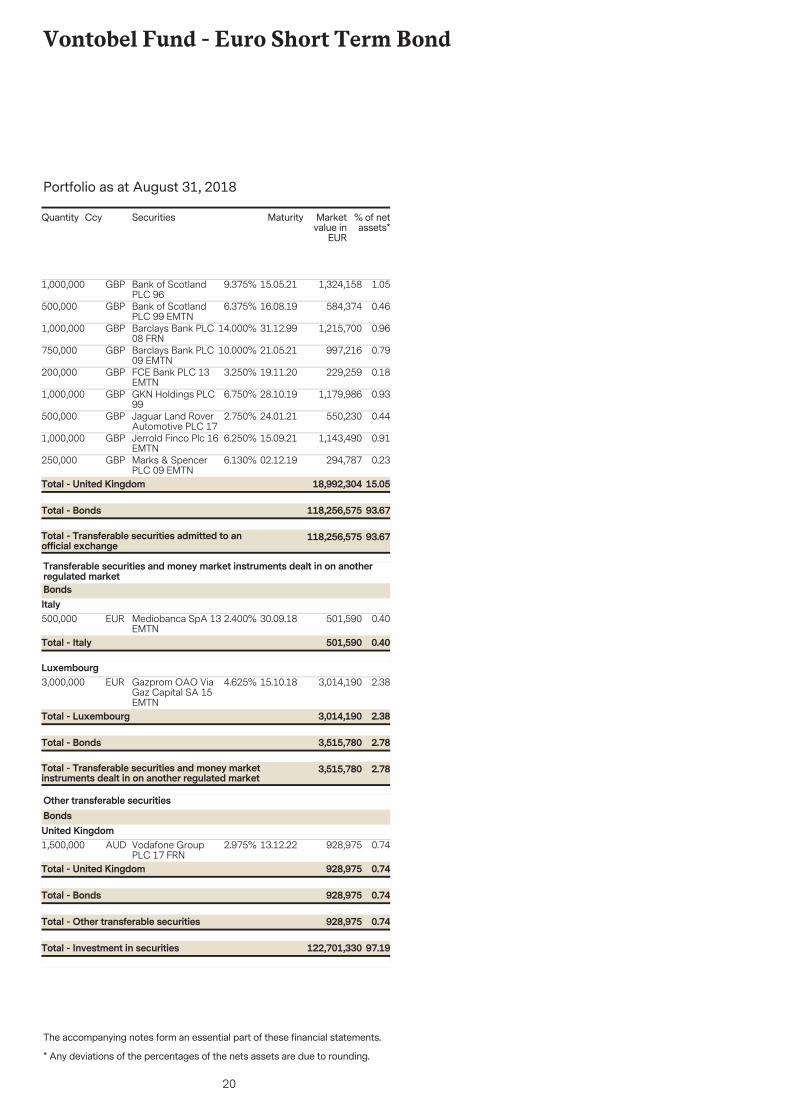
20
Vontobel Fund - Euro Short Term Bond
The accompanying notes form an essential part of these financial statements.
Portfolio as at August 31, 2018
* Any deviations of the percentages of the nets assets are due to rounding.
Securities Marketvalue in
EUR
% of netassets*
Quantity Ccy Maturity
1,000,000 1,324,158 1.0515.05.21Bank of ScotlandPLC 96
GBP 9.375%
500,000 584,374 0.4616.08.19Bank of ScotlandPLC 99 EMTN
GBP 6.375%
1,000,000 1,215,700 0.9631.12.99Barclays Bank PLC08 FRN
GBP 14.000%
750,000 997,216 0.7921.05.21Barclays Bank PLC09 EMTN
GBP 10.000%
200,000 229,259 0.1819.11.20FCE Bank PLC 13EMTN
GBP 3.250%
1,000,000 1,179,986 0.9328.10.19GKN Holdings PLC99
GBP 6.750%
500,000 550,230 0.4424.01.21Jaguar Land RoverAutomotive PLC 17
GBP 2.750%
1,000,000 1,143,490 0.9115.09.21Jerrold Finco Plc 16EMTN
GBP 6.250%
250,000 294,787 0.2302.12.19Marks & SpencerPLC 09 EMTN
GBP 6.130%
93.67118,256,575Total - Transferable securities admitted to anofficial exchange
93.67118,256,575Total - Bonds
15.0518,992,304Total - United Kingdom
500,000 501,590 0.4030.09.18Mediobanca SpA 13EMTN
EUR 2.400%
Transferable securities and money market instruments dealt in on anotherregulated marketBondsItaly
0.40501,590Total - Italy
3,000,000 3,014,190 2.3815.10.18Gazprom OAO ViaGaz Capital SA 15EMTN
EUR 4.625%Luxembourg
2.783,515,780Total - Transferable securities and money marketinstruments dealt in on another regulated market
2.783,515,780Total - Bonds
2.383,014,190Total - Luxembourg
1,500,000 928,975 0.7413.12.22Vodafone GroupPLC 17 FRN
AUD 2.975%
Other transferable securitiesBondsUnited Kingdom
0.74928,975Total - Other transferable securities
0.74928,975Total - Bonds
0.74928,975Total - United Kingdom
97.19122,701,330Total - Investment in securities
21
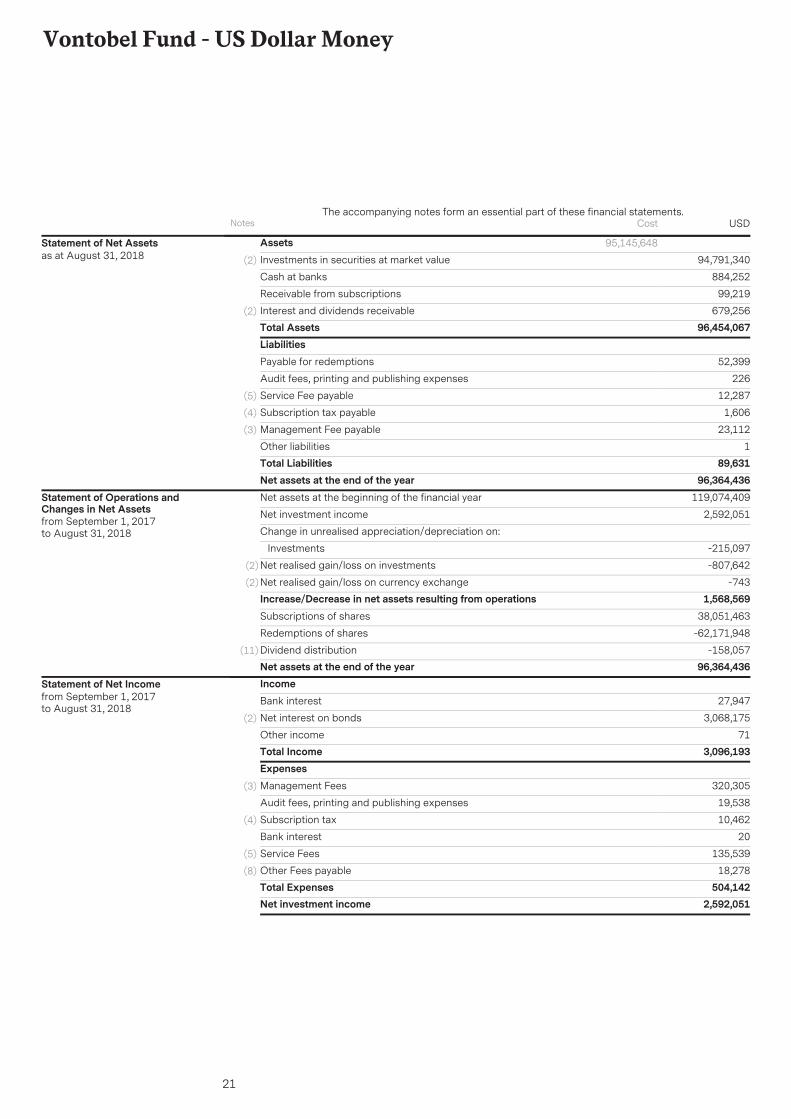
Vontobel Fund - US Dollar Money
AssetsInvestments in securities at market value 94,791,340(2)
884,252Cash at banks
99,219Receivable from subscriptions
679,256Interest and dividends receivable(2)
Total Assets 96,454,067
95,145,648Statement of Net Assetsas at August 31, 2018
LiabilitiesPayable for redemptions 52,399
Audit fees, printing and publishing expenses 226
Service Fee payable 12,287(5)
Subscription tax payable 1,606(4)
Management Fee payable 23,112(3)
Other liabilities 1Total Liabilities 89,631Net assets at the end of the year 96,364,436Net assets at the beginning of the financial year 119,074,409
Net investment income 2,592,051
Change in unrealised appreciation/depreciation on:
Investments -215,097
Net realised gain/loss on investments -807,642(2)
Net realised gain/loss on currency exchange -743(2)
Increase/Decrease in net assets resulting from operations 1,568,569Subscriptions of shares 38,051,463
Redemptions of shares -62,171,948
Dividend distribution -158,057(11)
Net assets at the end of the year 96,364,436
Statement of Operations andChanges in Net Assetsfrom September 1, 2017to August 31, 2018
IncomeBank interest 27,947
Net interest on bonds 3,068,175(2)
Other income 71Total Income 3,096,193ExpensesManagement Fees 320,305(3)
Audit fees, printing and publishing expenses 19,538
Subscription tax 10,462(4)
Bank interest 20
Service Fees 135,539(5)
Other Fees payable 18,278(8)
Total Expenses 504,142Net investment income 2,592,051
Statement of Net Incomefrom September 1, 2017to August 31, 2018
Notes USDThe accompanying notes form an essential part of these financial statements.
Cost
22
Vontobel Fund - US Dollar Money
The accompanying notes form an essential part of these financial statements.
Portfolio as at August 31, 2018
* Any deviations of the percentages of the nets assets are due to rounding.
Securities Marketvalue in
USD
% of netassets*
Quantity Ccy Maturity
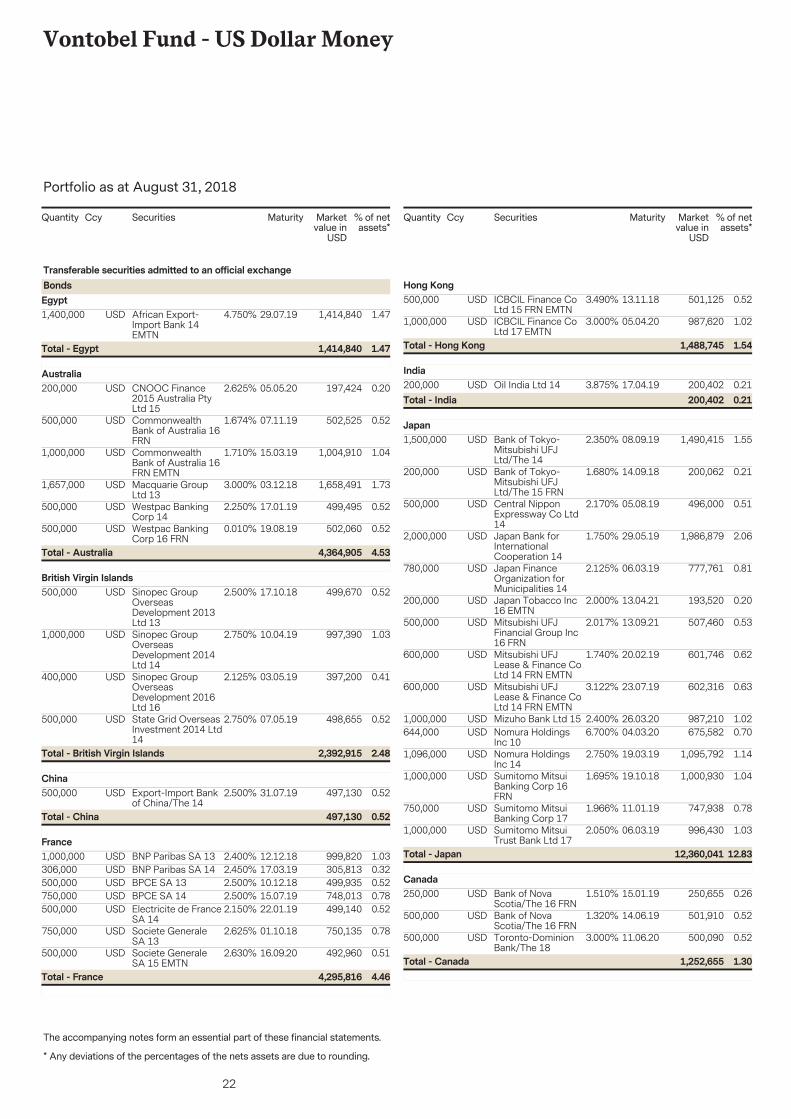
1,400,000 1,414,840 1.4729.07.19African Export-Import Bank 14EMTN
USD 4.750%
Transferable securities admitted to an official exchangeBondsEgypt
1.471,414,840Total - Egypt
200,000 197,424 0.2005.05.20CNOOC Finance2015 Australia PtyLtd 15
USD 2.625%Australia
500,000 502,525 0.5207.11.19CommonwealthBank of Australia 16FRN
USD 1.674%
1,000,000 1,004,910 1.0415.03.19CommonwealthBank of Australia 16FRN EMTN
USD 1.710%
1,657,000 1,658,491 1.7303.12.18Macquarie GroupLtd 13
USD 3.000%
500,000 499,495 0.5217.01.19Westpac BankingCorp 14
USD 2.250%
500,000 502,060 0.5219.08.19Westpac BankingCorp 16 FRN
USD 0.010%
4.534,364,905Total - Australia
500,000 499,670 0.5217.10.18Sinopec GroupOverseasDevelopment 2013Ltd 13
USD 2.500%British Virgin Islands
1,000,000 997,390 1.0310.04.19Sinopec GroupOverseasDevelopment 2014Ltd 14
USD 2.750%
400,000 397,200 0.4103.05.19Sinopec GroupOverseasDevelopment 2016Ltd 16
USD 2.125%
500,000 498,655 0.5207.05.19State Grid OverseasInvestment 2014 Ltd14
USD 2.750%
2.482,392,915Total - British Virgin Islands
500,000 497,130 0.5231.07.19Export-Import Bankof China/The 14
USD 2.500%China
0.52497,130Total - China
1,000,000 999,820 1.0312.12.18BNP Paribas SA 13USD 2.400%France
306,000 305,813 0.3217.03.19BNP Paribas SA 14USD 2.450%500,000 499,935 0.5210.12.18BPCE SA 13USD 2.500%750,000 748,013 0.7815.07.19BPCE SA 14USD 2.500%500,000 499,140 0.5222.01.19Electricite de France
SA 14USD 2.150%
750,000 750,135 0.7801.10.18Societe GeneraleSA 13
USD 2.625%
500,000 492,960 0.5116.09.20Societe GeneraleSA 15 EMTN
USD 2.630%
4.464,295,816Total - France
Securities Marketvalue in
USD
% of netassets*
Quantity Ccy Maturity
500,000 501,125 0.5213.11.18ICBCIL Finance CoLtd 15 FRN EMTN
USD 3.490%Hong Kong
1,000,000 987,620 1.0205.04.20ICBCIL Finance CoLtd 17 EMTN
USD 3.000%
1.541,488,745Total - Hong Kong
200,000 200,402 0.2117.04.19Oil India Ltd 14USD 3.875%India
0.21200,402Total - India
1,500,000 1,490,415 1.5508.09.19Bank of Tokyo-Mitsubishi UFJLtd/The 14
USD 2.350%Japan
200,000 200,062 0.2114.09.18Bank of Tokyo-Mitsubishi UFJLtd/The 15 FRN
USD 1.680%
500,000 496,000 0.5105.08.19Central NipponExpressway Co Ltd14
USD 2.170%
2,000,000 1,986,879 2.0629.05.19Japan Bank forInternationalCooperation 14
USD 1.750%
780,000 777,761 0.8106.03.19Japan FinanceOrganization forMunicipalities 14
USD 2.125%
200,000 193,520 0.2013.04.21Japan Tobacco Inc16 EMTN
USD 2.000%
500,000 507,460 0.5313.09.21Mitsubishi UFJFinancial Group Inc16 FRN
USD 2.017%
600,000 601,746 0.6220.02.19Mitsubishi UFJLease & Finance CoLtd 14 FRN EMTN
USD 1.740%
600,000 602,316 0.6323.07.19Mitsubishi UFJLease & Finance CoLtd 14 FRN EMTN
USD 3.122%
1,000,000 987,210 1.0226.03.20Mizuho Bank Ltd 15USD 2.400%644,000 675,582 0.7004.03.20Nomura Holdings
Inc 10USD 6.700%
1,096,000 1,095,792 1.1419.03.19Nomura HoldingsInc 14
USD 2.750%
1,000,000 1,000,930 1.0419.10.18Sumitomo MitsuiBanking Corp 16FRN
USD 1.695%
750,000 747,938 0.7811.01.19Sumitomo MitsuiBanking Corp 17
USD 1.966%
1,000,000 996,430 1.0306.03.19Sumitomo MitsuiTrust Bank Ltd 17
USD 2.050%
12.8312,360,041Total - Japan
250,000 250,655 0.2615.01.19Bank of NovaScotia/The 16 FRN
USD 1.510%Canada
500,000 501,910 0.5214.06.19Bank of NovaScotia/The 16 FRN
USD 1.320%
500,000 500,090 0.5211.06.20Toronto-DominionBank/The 18
USD 3.000%
1.301,252,655Total - Canada
23
Vontobel Fund - US Dollar Money
The accompanying notes form an essential part of these financial statements.
Portfolio as at August 31, 2018
* Any deviations of the percentages of the nets assets are due to rounding.
Securities Marketvalue in
USD
% of netassets*
Quantity Ccy Maturity
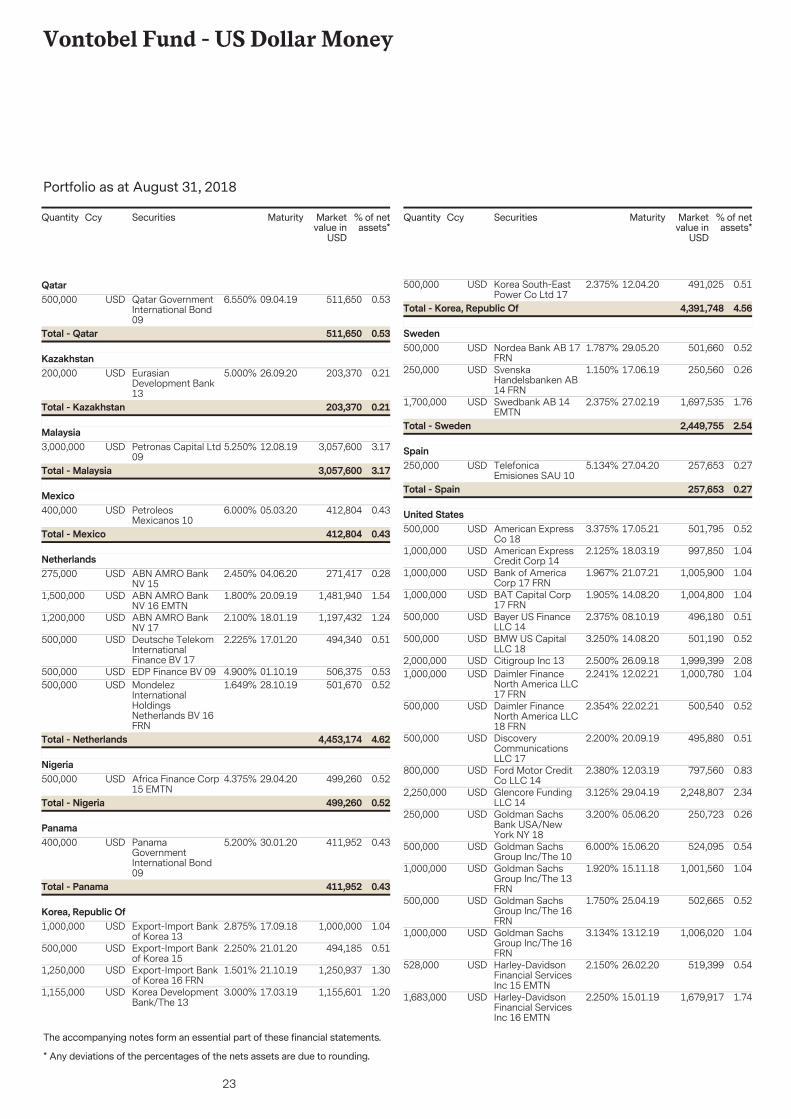
500,000 511,650 0.5309.04.19Qatar GovernmentInternational Bond09
USD 6.550%Qatar
0.53511,650Total - Qatar
200,000 203,370 0.2126.09.20EurasianDevelopment Bank13
USD 5.000%Kazakhstan
0.21203,370Total - Kazakhstan
3,000,000 3,057,600 3.1712.08.19Petronas Capital Ltd09
USD 5.250%Malaysia
3.173,057,600Total - Malaysia
400,000 412,804 0.4305.03.20PetroleosMexicanos 10
USD 6.000%Mexico
0.43412,804Total - Mexico
275,000 271,417 0.2804.06.20ABN AMRO BankNV 15
USD 2.450%Netherlands
1,500,000 1,481,940 1.5420.09.19ABN AMRO BankNV 16 EMTN
USD 1.800%
1,200,000 1,197,432 1.2418.01.19ABN AMRO BankNV 17
USD 2.100%
500,000 494,340 0.5117.01.20Deutsche TelekomInternationalFinance BV 17
USD 2.225%
500,000 506,375 0.5301.10.19EDP Finance BV 09USD 4.900%500,000 501,670 0.5228.10.19Mondelez
InternationalHoldingsNetherlands BV 16FRN
USD 1.649%
4.624,453,174Total - Netherlands
500,000 499,260 0.5229.04.20Africa Finance Corp15 EMTN
USD 4.375%Nigeria
0.52499,260Total - Nigeria
400,000 411,952 0.4330.01.20PanamaGovernmentInternational Bond09
USD 5.200%Panama
0.43411,952Total - Panama
1,000,000 1,000,000 1.0417.09.18Export-Import Bankof Korea 13
USD 2.875%Korea, Republic Of
500,000 494,185 0.5121.01.20Export-Import Bankof Korea 15
USD 2.250%
1,250,000 1,250,937 1.3021.10.19Export-Import Bankof Korea 16 FRN
USD 1.501%
1,155,000 1,155,601 1.2017.03.19Korea DevelopmentBank/The 13
USD 3.000%
Securities Marketvalue in
USD
% of netassets*
Quantity Ccy Maturity
500,000 491,025 0.5112.04.20Korea South-EastPower Co Ltd 17
USD 2.375%
4.564,391,748Total - Korea, Republic Of
500,000 501,660 0.5229.05.20Nordea Bank AB 17FRN
USD 1.787%Sweden
250,000 250,560 0.2617.06.19SvenskaHandelsbanken AB14 FRN
USD 1.150%
1,700,000 1,697,535 1.7627.02.19Swedbank AB 14EMTN
USD 2.375%
2.542,449,755Total - Sweden
250,000 257,653 0.2727.04.20TelefonicaEmisiones SAU 10
USD 5.134%Spain
0.27257,653Total - Spain
500,000 501,795 0.5217.05.21American ExpressCo 18
USD 3.375%United States
1,000,000 997,850 1.0418.03.19American ExpressCredit Corp 14
USD 2.125%
1,000,000 1,005,900 1.0421.07.21Bank of AmericaCorp 17 FRN
USD 1.967%
1,000,000 1,004,800 1.0414.08.20BAT Capital Corp17 FRN
USD 1.905%
500,000 496,180 0.5108.10.19Bayer US FinanceLLC 14
USD 2.375%
500,000 501,190 0.5214.08.20BMW US CapitalLLC 18
USD 3.250%
2,000,000 1,999,399 2.0826.09.18Citigroup Inc 13USD 2.500%1,000,000 1,000,780 1.0412.02.21Daimler Finance
North America LLC17 FRN
USD 2.241%
500,000 500,540 0.5222.02.21Daimler FinanceNorth America LLC18 FRN
USD 2.354%
500,000 495,880 0.5120.09.19DiscoveryCommunicationsLLC 17
USD 2.200%
800,000 797,560 0.8312.03.19Ford Motor CreditCo LLC 14
USD 2.380%
2,250,000 2,248,807 2.3429.04.19Glencore FundingLLC 14
USD 3.125%
250,000 250,723 0.2605.06.20Goldman SachsBank USA/NewYork NY 18
USD 3.200%
500,000 524,095 0.5415.06.20Goldman SachsGroup Inc/The 10
USD 6.000%
1,000,000 1,001,560 1.0415.11.18Goldman SachsGroup Inc/The 13FRN
USD 1.920%
500,000 502,665 0.5225.04.19Goldman SachsGroup Inc/The 16FRN
USD 1.750%
1,000,000 1,006,020 1.0413.12.19Goldman SachsGroup Inc/The 16FRN
USD 3.134%
528,000 519,399 0.5426.02.20Harley-DavidsonFinancial ServicesInc 15 EMTN
USD 2.150%
1,683,000 1,679,917 1.7415.01.19Harley-DavidsonFinancial ServicesInc 16 EMTN
USD 2.250%
24
Vontobel Fund - US Dollar Money
The accompanying notes form an essential part of these financial statements.
Portfolio as at August 31, 2018
* Any deviations of the percentages of the nets assets are due to rounding.
Securities Marketvalue in
USD
% of netassets*
Quantity Ccy Maturity
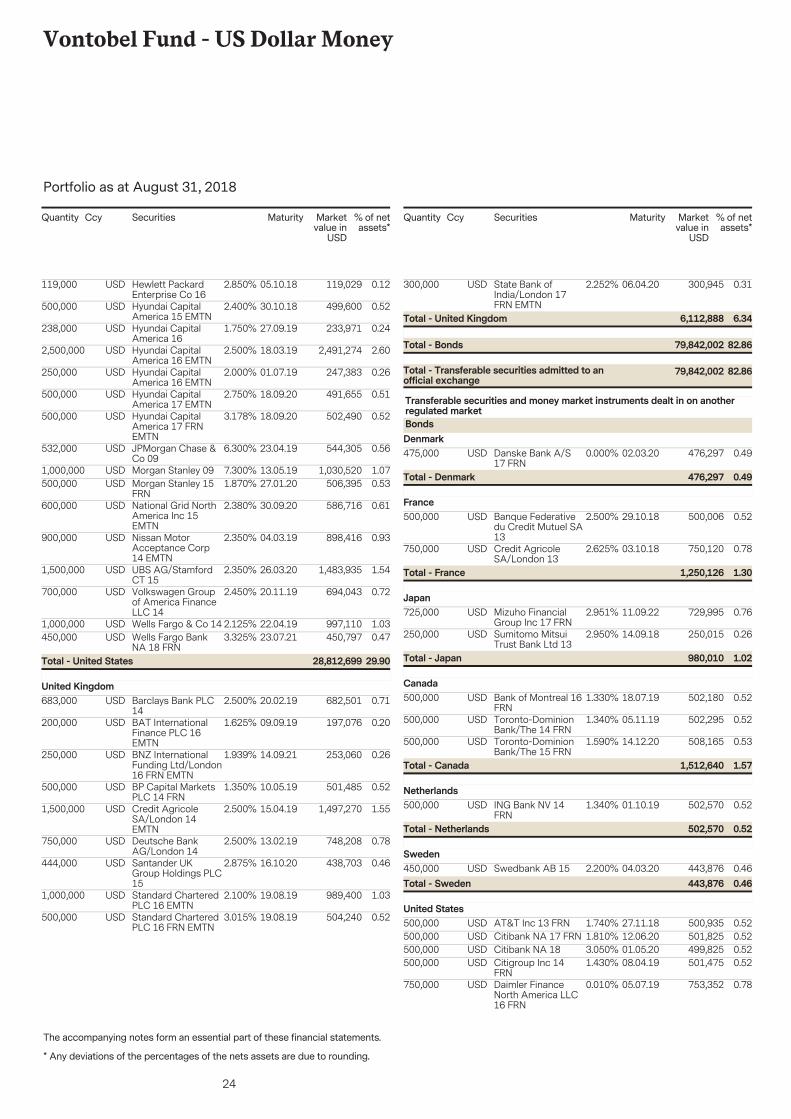
119,000 119,029 0.1205.10.18Hewlett PackardEnterprise Co 16
USD 2.850%
500,000 499,600 0.5230.10.18Hyundai CapitalAmerica 15 EMTN
USD 2.400%
238,000 233,971 0.2427.09.19Hyundai CapitalAmerica 16
USD 1.750%
2,500,000 2,491,274 2.6018.03.19Hyundai CapitalAmerica 16 EMTN
USD 2.500%
250,000 247,383 0.2601.07.19Hyundai CapitalAmerica 16 EMTN
USD 2.000%
500,000 491,655 0.5118.09.20Hyundai CapitalAmerica 17 EMTN
USD 2.750%
500,000 502,490 0.5218.09.20Hyundai CapitalAmerica 17 FRNEMTN
USD 3.178%
532,000 544,305 0.5623.04.19JPMorgan Chase &Co 09
USD 6.300%
1,000,000 1,030,520 1.0713.05.19Morgan Stanley 09USD 7.300%500,000 506,395 0.5327.01.20Morgan Stanley 15
FRNUSD 1.870%
600,000 586,716 0.6130.09.20National Grid NorthAmerica Inc 15EMTN
USD 2.380%
900,000 898,416 0.9304.03.19Nissan MotorAcceptance Corp14 EMTN
USD 2.350%
1,500,000 1,483,935 1.5426.03.20UBS AG/StamfordCT 15
USD 2.350%
700,000 694,043 0.7220.11.19Volkswagen Groupof America FinanceLLC 14
USD 2.450%
1,000,000 997,110 1.0322.04.19Wells Fargo & Co 14USD 2.125%450,000 450,797 0.4723.07.21Wells Fargo Bank
NA 18 FRNUSD 3.325%
29.9028,812,699Total - United States
683,000 682,501 0.7120.02.19Barclays Bank PLC14
USD 2.500%United Kingdom
200,000 197,076 0.2009.09.19BAT InternationalFinance PLC 16EMTN
USD 1.625%
250,000 253,060 0.2614.09.21BNZ InternationalFunding Ltd/London16 FRN EMTN
USD 1.939%
500,000 501,485 0.5210.05.19BP Capital MarketsPLC 14 FRN
USD 1.350%
1,500,000 1,497,270 1.5515.04.19Credit AgricoleSA/London 14EMTN
USD 2.500%
750,000 748,208 0.7813.02.19Deutsche BankAG/London 14
USD 2.500%
444,000 438,703 0.4616.10.20Santander UKGroup Holdings PLC15
USD 2.875%
1,000,000 989,400 1.0319.08.19Standard CharteredPLC 16 EMTN
USD 2.100%
500,000 504,240 0.5219.08.19Standard CharteredPLC 16 FRN EMTN
USD 3.015%
Securities Marketvalue in
USD
% of netassets*
Quantity Ccy Maturity
300,000 300,945 0.3106.04.20State Bank ofIndia/London 17FRN EMTN
USD 2.252%
82.8679,842,002Total - Transferable securities admitted to anofficial exchange
82.8679,842,002Total - Bonds
6.346,112,888Total - United Kingdom
475,000 476,297 0.4902.03.20Danske Bank A/S17 FRN
USD 0.000%
Transferable securities and money market instruments dealt in on anotherregulated marketBondsDenmark
0.49476,297Total - Denmark
500,000 500,006 0.5229.10.18Banque Federativedu Credit Mutuel SA13
USD 2.500%France
750,000 750,120 0.7803.10.18Credit AgricoleSA/London 13
USD 2.625%
1.301,250,126Total - France
725,000 729,995 0.7611.09.22Mizuho FinancialGroup Inc 17 FRN
USD 2.951%Japan
250,000 250,015 0.2614.09.18Sumitomo MitsuiTrust Bank Ltd 13
USD 2.950%
1.02980,010Total - Japan
500,000 502,180 0.5218.07.19Bank of Montreal 16FRN
USD 1.330%Canada
500,000 502,295 0.5205.11.19Toronto-DominionBank/The 14 FRN
USD 1.340%
500,000 508,165 0.5314.12.20Toronto-DominionBank/The 15 FRN
USD 1.590%
1.571,512,640Total - Canada
500,000 502,570 0.5201.10.19ING Bank NV 14FRN
USD 1.340%Netherlands
0.52502,570Total - Netherlands
450,000 443,876 0.4604.03.20Swedbank AB 15USD 2.200%Sweden
0.46443,876Total - Sweden
500,000 500,935 0.5227.11.18AT&T Inc 13 FRNUSD 1.740%United States
500,000 501,825 0.5212.06.20Citibank NA 17 FRNUSD 1.810%500,000 499,825 0.5201.05.20Citibank NA 18USD 3.050%500,000 501,475 0.5208.04.19Citigroup Inc 14
FRNUSD 1.430%
750,000 753,352 0.7805.07.19Daimler FinanceNorth America LLC16 FRN
USD 0.010%
25
Vontobel Fund - US Dollar Money
The accompanying notes form an essential part of these financial statements.
Portfolio as at August 31, 2018
* Any deviations of the percentages of the nets assets are due to rounding.
Securities Marketvalue in
USD
% of netassets*
Quantity Ccy Maturity
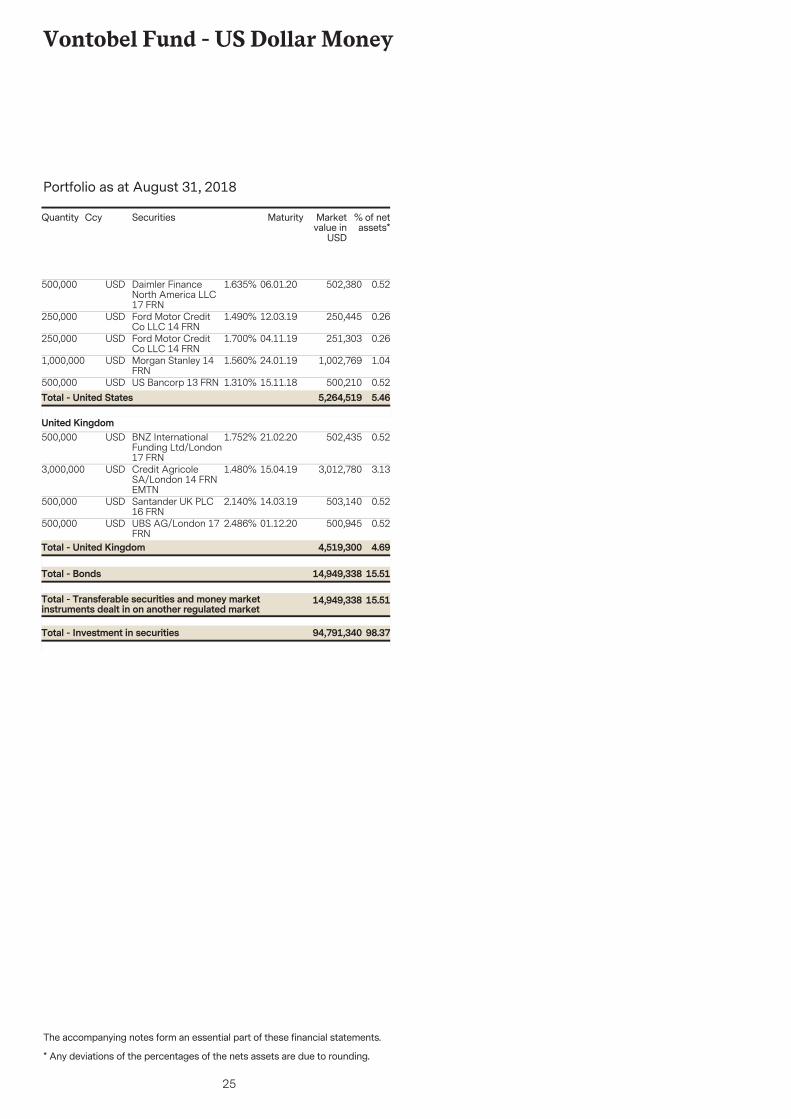
500,000 502,380 0.5206.01.20Daimler FinanceNorth America LLC17 FRN
USD 1.635%
250,000 250,445 0.2612.03.19Ford Motor CreditCo LLC 14 FRN
USD 1.490%
250,000 251,303 0.2604.11.19Ford Motor CreditCo LLC 14 FRN
USD 1.700%
1,000,000 1,002,769 1.0424.01.19Morgan Stanley 14FRN
USD 1.560%
500,000 500,210 0.5215.11.18US Bancorp 13 FRNUSD 1.310%5.465,264,519Total - United States
500,000 502,435 0.5221.02.20BNZ InternationalFunding Ltd/London17 FRN
USD 1.752%United Kingdom
3,000,000 3,012,780 3.1315.04.19Credit AgricoleSA/London 14 FRNEMTN
USD 1.480%
500,000 503,140 0.5214.03.19Santander UK PLC16 FRN
USD 2.140%
500,000 500,945 0.5201.12.20UBS AG/London 17FRN
USD 2.486%
15.5114,949,338Total - Transferable securities and money marketinstruments dealt in on another regulated market
15.5114,949,338Total - Bonds
4.694,519,300Total - United Kingdom
98.3794,791,340Total - Investment in securities
26
Vontobel Fund - Swiss Franc Bond
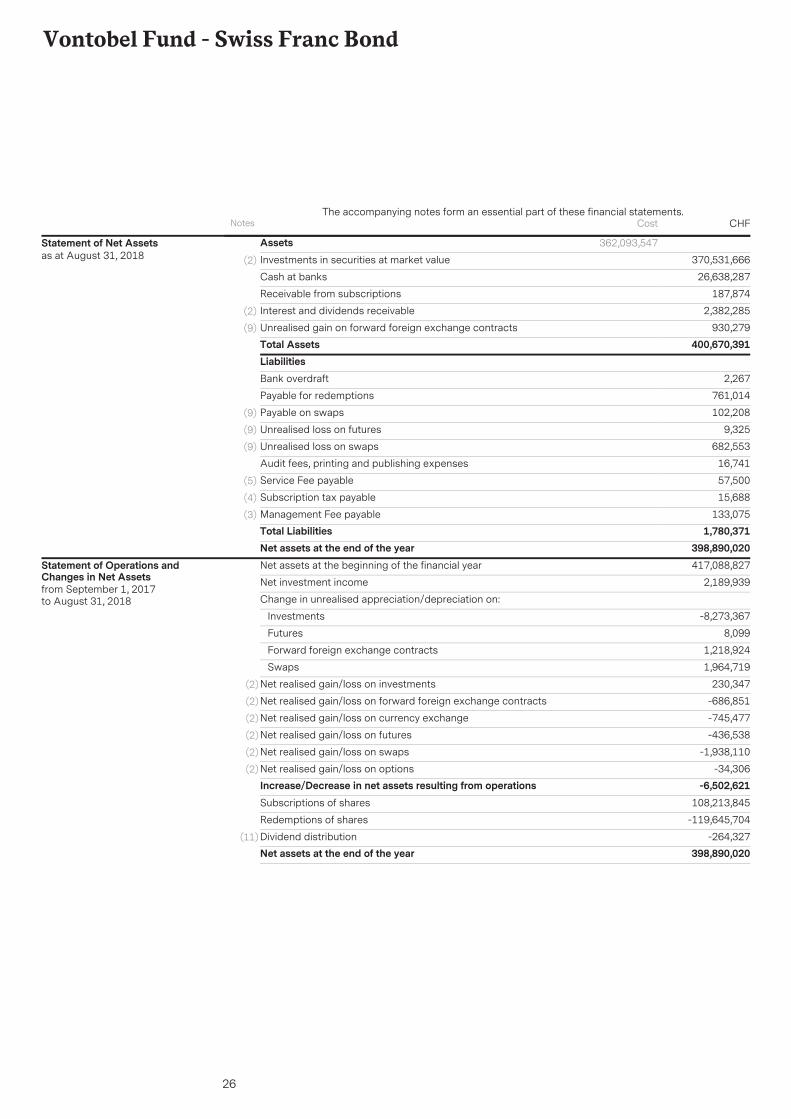
AssetsInvestments in securities at market value 370,531,666(2)
26,638,287Cash at banks
187,874Receivable from subscriptions
2,382,285Interest and dividends receivable(2)
930,279Unrealised gain on forward foreign exchange contracts(9)
Total Assets 400,670,391
362,093,547Statement of Net Assetsas at August 31, 2018
LiabilitiesBank overdraft 2,267
Payable for redemptions 761,014
Payable on swaps 102,208(9)
Unrealised loss on futures 9,325(9)
Unrealised loss on swaps 682,553(9)
Audit fees, printing and publishing expenses 16,741
Service Fee payable 57,500(5)
Subscription tax payable 15,688(4)
Management Fee payable 133,075(3)
Total Liabilities 1,780,371Net assets at the end of the year 398,890,020Net assets at the beginning of the financial year 417,088,827
Net investment income 2,189,939
Change in unrealised appreciation/depreciation on:
Investments -8,273,367
Futures 8,099
Forward foreign exchange contracts 1,218,924
Swaps 1,964,719
Net realised gain/loss on investments 230,347(2)
Net realised gain/loss on forward foreign exchange contracts -686,851(2)
Net realised gain/loss on currency exchange -745,477(2)
Net realised gain/loss on futures -436,538(2)
Net realised gain/loss on swaps -1,938,110(2)
Net realised gain/loss on options -34,306(2)
Increase/Decrease in net assets resulting from operations -6,502,621Subscriptions of shares 108,213,845
Redemptions of shares -119,645,704
Dividend distribution -264,327(11)
Net assets at the end of the year 398,890,020
Statement of Operations andChanges in Net Assetsfrom September 1, 2017to August 31, 2018
Notes CHFThe accompanying notes form an essential part of these financial statements.
Cost
27
Vontobel Fund - Swiss Franc Bond
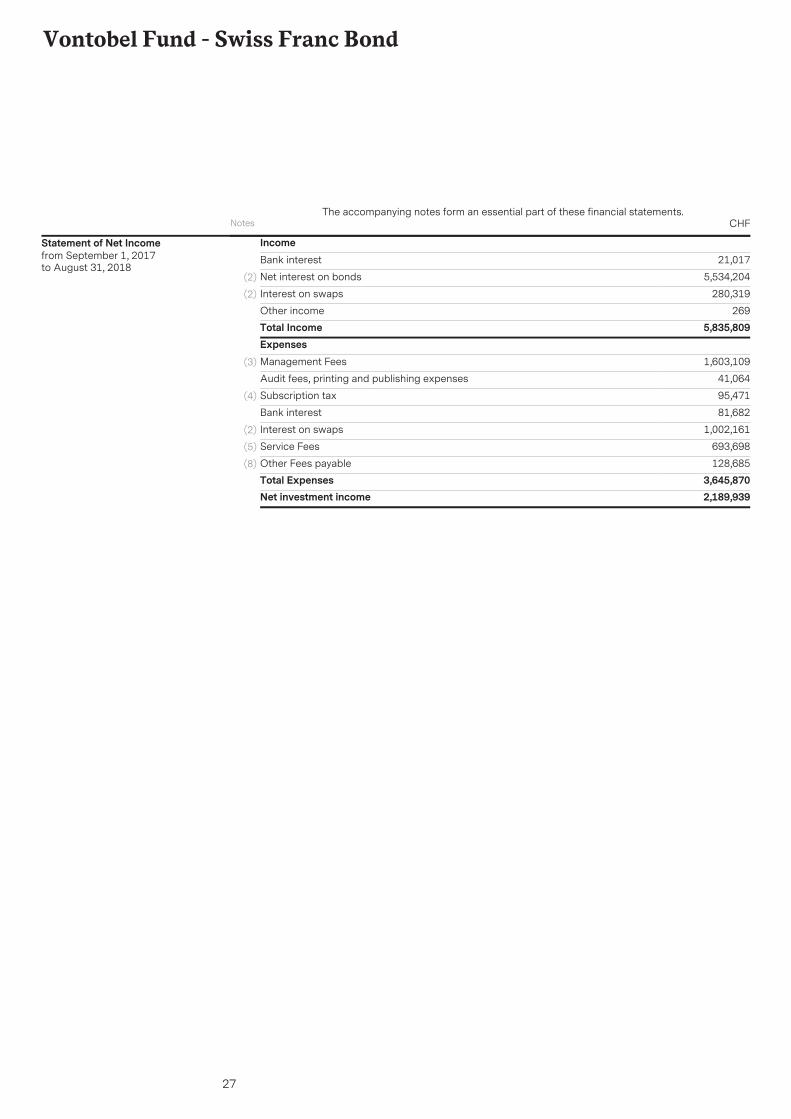
IncomeBank interest 21,017
Net interest on bonds 5,534,204(2)
Interest on swaps 280,319(2)
Other income 269Total Income 5,835,809ExpensesManagement Fees 1,603,109(3)
Audit fees, printing and publishing expenses 41,064
Subscription tax 95,471(4)
Bank interest 81,682
Interest on swaps 1,002,161(2)
Service Fees 693,698(5)
Other Fees payable 128,685(8)
Total Expenses 3,645,870Net investment income 2,189,939
Statement of Net Incomefrom September 1, 2017to August 31, 2018
Notes CHFThe accompanying notes form an essential part of these financial statements.
28
Vontobel Fund - Swiss Franc Bond
The accompanying notes form an essential part of these financial statements.
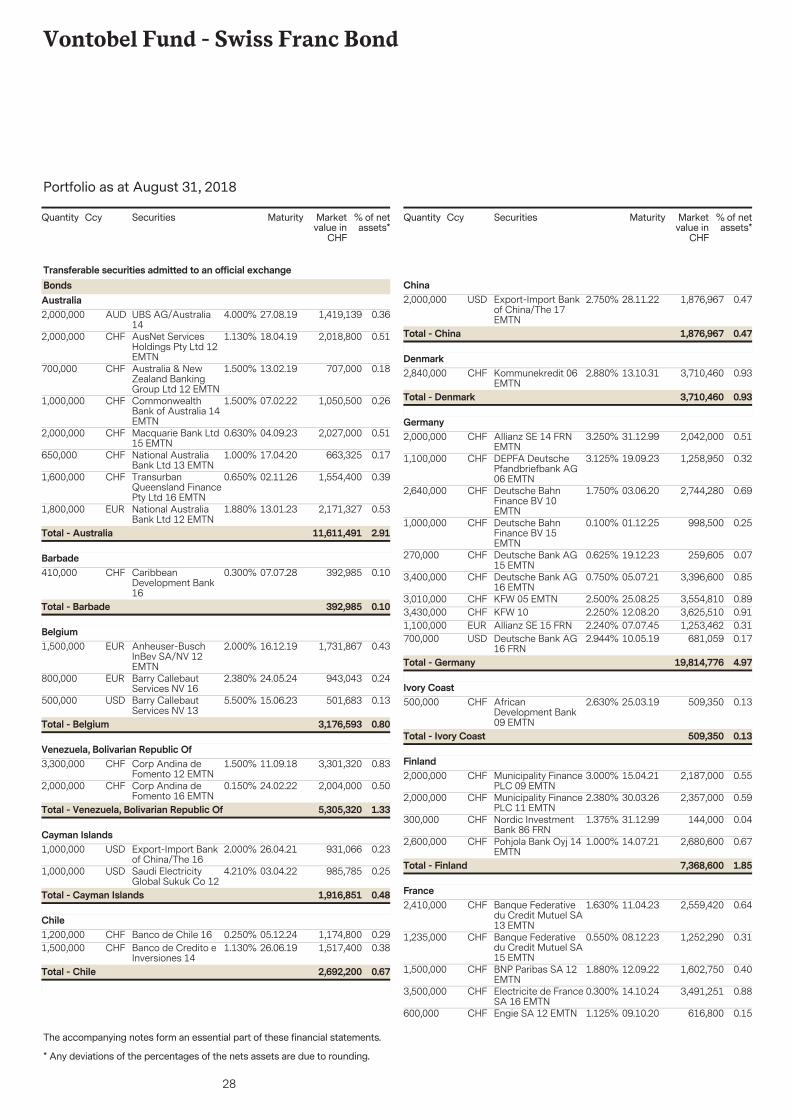
Portfolio as at August 31, 2018
* Any deviations of the percentages of the nets assets are due to rounding.
Securities Marketvalue in
CHF
% of netassets*
Quantity Ccy Maturity
2,000,000 1,419,139 0.3627.08.19UBS AG/Australia14
AUD 4.000%
Transferable securities admitted to an official exchangeBondsAustralia
2,000,000 2,018,800 0.5118.04.19AusNet ServicesHoldings Pty Ltd 12EMTN
CHF 1.130%
700,000 707,000 0.1813.02.19Australia & NewZealand BankingGroup Ltd 12 EMTN
CHF 1.500%
1,000,000 1,050,500 0.2607.02.22CommonwealthBank of Australia 14EMTN
CHF 1.500%
2,000,000 2,027,000 0.5104.09.23Macquarie Bank Ltd15 EMTN
CHF 0.630%
650,000 663,325 0.1717.04.20National AustraliaBank Ltd 13 EMTN
CHF 1.000%
1,600,000 1,554,400 0.3902.11.26TransurbanQueensland FinancePty Ltd 16 EMTN
CHF 0.650%
1,800,000 2,171,327 0.5313.01.23National AustraliaBank Ltd 12 EMTN
EUR 1.880%
2.9111,611,491Total - Australia
410,000 392,985 0.1007.07.28CaribbeanDevelopment Bank16
CHF 0.300%Barbade
0.10392,985Total - Barbade
1,500,000 1,731,867 0.4316.12.19Anheuser-BuschInBev SA/NV 12EMTN
EUR 2.000%Belgium
800,000 943,043 0.2424.05.24Barry CallebautServices NV 16
EUR 2.380%
500,000 501,683 0.1315.06.23Barry CallebautServices NV 13
USD 5.500%
0.803,176,593Total - Belgium
3,300,000 3,301,320 0.8311.09.18Corp Andina deFomento 12 EMTN
CHF 1.500%Venezuela, Bolivarian Republic Of
2,000,000 2,004,000 0.5024.02.22Corp Andina deFomento 16 EMTN
CHF 0.150%
1.335,305,320Total - Venezuela, Bolivarian Republic Of
1,000,000 931,066 0.2326.04.21Export-Import Bankof China/The 16
USD 2.000%Cayman Islands
1,000,000 985,785 0.2503.04.22Saudi ElectricityGlobal Sukuk Co 12
USD 4.210%
0.481,916,851Total - Cayman Islands
1,200,000 1,174,800 0.2905.12.24Banco de Chile 16CHF 0.250%Chile
1,500,000 1,517,400 0.3826.06.19Banco de Credito eInversiones 14
CHF 1.130%
0.672,692,200Total - Chile
Securities Marketvalue in
CHF
% of netassets*
Quantity Ccy Maturity
2,000,000 1,876,967 0.4728.11.22Export-Import Bankof China/The 17EMTN
USD 2.750%China
0.471,876,967Total - China
2,840,000 3,710,460 0.9313.10.31Kommunekredit 06EMTN
CHF 2.880%Denmark
0.933,710,460Total - Denmark
2,000,000 2,042,000 0.5131.12.99Allianz SE 14 FRNEMTN
CHF 3.250%Germany
1,100,000 1,258,950 0.3219.09.23DEPFA DeutschePfandbriefbank AG06 EMTN
CHF 3.125%
2,640,000 2,744,280 0.6903.06.20Deutsche BahnFinance BV 10EMTN
CHF 1.750%
1,000,000 998,500 0.2501.12.25Deutsche BahnFinance BV 15EMTN
CHF 0.100%
270,000 259,605 0.0719.12.23Deutsche Bank AG15 EMTN
CHF 0.625%
3,400,000 3,396,600 0.8505.07.21Deutsche Bank AG16 EMTN
CHF 0.750%
3,010,000 3,554,810 0.8925.08.25KFW 05 EMTNCHF 2.500%3,430,000 3,625,510 0.9112.08.20KFW 10CHF 2.250%1,100,000 1,253,462 0.3107.07.45Allianz SE 15 FRNEUR 2.240%700,000 681,059 0.1710.05.19Deutsche Bank AG
16 FRNUSD 2.944%
4.9719,814,776Total - Germany
500,000 509,350 0.1325.03.19AfricanDevelopment Bank09 EMTN
CHF 2.630%Ivory Coast
0.13509,350Total - Ivory Coast
2,000,000 2,187,000 0.5515.04.21Municipality FinancePLC 09 EMTN
CHF 3.000%Finland
2,000,000 2,357,000 0.5930.03.26Municipality FinancePLC 11 EMTN
CHF 2.380%
300,000 144,000 0.0431.12.99Nordic InvestmentBank 86 FRN
CHF 1.375%
2,600,000 2,680,600 0.6714.07.21Pohjola Bank Oyj 14EMTN
CHF 1.000%
1.857,368,600Total - Finland
2,410,000 2,559,420 0.6411.04.23Banque Federativedu Credit Mutuel SA13 EMTN
CHF 1.630%France
1,235,000 1,252,290 0.3108.12.23Banque Federativedu Credit Mutuel SA15 EMTN
CHF 0.550%
1,500,000 1,602,750 0.4012.09.22BNP Paribas SA 12EMTN
CHF 1.880%
3,500,000 3,491,251 0.8814.10.24Electricite de FranceSA 16 EMTN
CHF 0.300%
600,000 616,800 0.1509.10.20Engie SA 12 EMTNCHF 1.125%
29
Vontobel Fund - Swiss Franc Bond
The accompanying notes form an essential part of these financial statements.
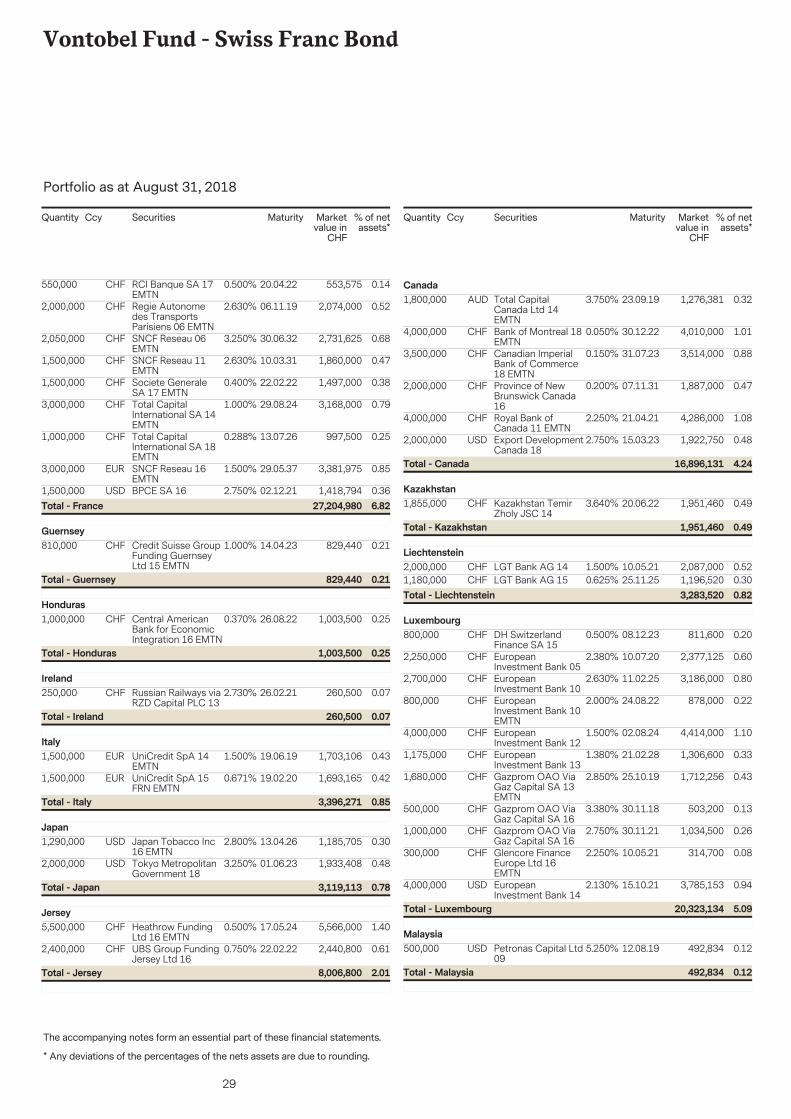
Portfolio as at August 31, 2018
* Any deviations of the percentages of the nets assets are due to rounding.
Securities Marketvalue in
CHF
% of netassets*
Quantity Ccy Maturity
550,000 553,575 0.1420.04.22RCI Banque SA 17EMTN
CHF 0.500%
2,000,000 2,074,000 0.5206.11.19Regie Autonomedes TransportsParisiens 06 EMTN
CHF 2.630%
2,050,000 2,731,625 0.6830.06.32SNCF Reseau 06EMTN
CHF 3.250%
1,500,000 1,860,000 0.4710.03.31SNCF Reseau 11EMTN
CHF 2.630%
1,500,000 1,497,000 0.3822.02.22Societe GeneraleSA 17 EMTN
CHF 0.400%
3,000,000 3,168,000 0.7929.08.24Total CapitalInternational SA 14EMTN
CHF 1.000%
1,000,000 997,500 0.2513.07.26Total CapitalInternational SA 18EMTN
CHF 0.288%
3,000,000 3,381,975 0.8529.05.37SNCF Reseau 16EMTN
EUR 1.500%
1,500,000 1,418,794 0.3602.12.21BPCE SA 16USD 2.750%6.8227,204,980Total - France
810,000 829,440 0.2114.04.23Credit Suisse GroupFunding GuernseyLtd 15 EMTN
CHF 1.000%Guernsey
0.21829,440Total - Guernsey
1,000,000 1,003,500 0.2526.08.22Central AmericanBank for EconomicIntegration 16 EMTN
CHF 0.370%Honduras
0.251,003,500Total - Honduras
250,000 260,500 0.0726.02.21Russian Railways viaRZD Capital PLC 13
CHF 2.730%Ireland
0.07260,500Total - Ireland
1,500,000 1,703,106 0.4319.06.19UniCredit SpA 14EMTN
EUR 1.500%Italy
1,500,000 1,693,165 0.4219.02.20UniCredit SpA 15FRN EMTN
EUR 0.671%
0.853,396,271Total - Italy
1,290,000 1,185,705 0.3013.04.26Japan Tobacco Inc16 EMTN
USD 2.800%Japan
2,000,000 1,933,408 0.4801.06.23Tokyo MetropolitanGovernment 18
USD 3.250%
0.783,119,113Total - Japan
5,500,000 5,566,000 1.4017.05.24Heathrow FundingLtd 16 EMTN
CHF 0.500%Jersey
2,400,000 2,440,800 0.6122.02.22UBS Group FundingJersey Ltd 16
CHF 0.750%
2.018,006,800Total - Jersey
Securities Marketvalue in
CHF
% of netassets*
Quantity Ccy Maturity
1,800,000 1,276,381 0.3223.09.19Total CapitalCanada Ltd 14EMTN
AUD 3.750%Canada
4,000,000 4,010,000 1.0130.12.22Bank of Montreal 18EMTN
CHF 0.050%
3,500,000 3,514,000 0.8831.07.23Canadian ImperialBank of Commerce18 EMTN
CHF 0.150%
2,000,000 1,887,000 0.4707.11.31Province of NewBrunswick Canada16
CHF 0.200%
4,000,000 4,286,000 1.0821.04.21Royal Bank ofCanada 11 EMTN
CHF 2.250%
2,000,000 1,922,750 0.4815.03.23Export DevelopmentCanada 18
USD 2.750%
4.2416,896,131Total - Canada
1,855,000 1,951,460 0.4920.06.22Kazakhstan TemirZholy JSC 14
CHF 3.640%Kazakhstan
0.491,951,460Total - Kazakhstan
2,000,000 2,087,000 0.5210.05.21LGT Bank AG 14CHF 1.500%Liechtenstein
1,180,000 1,196,520 0.3025.11.25LGT Bank AG 15CHF 0.625%0.823,283,520Total - Liechtenstein
800,000 811,600 0.2008.12.23DH SwitzerlandFinance SA 15
CHF 0.500%Luxembourg
2,250,000 2,377,125 0.6010.07.20EuropeanInvestment Bank 05
CHF 2.380%
2,700,000 3,186,000 0.8011.02.25EuropeanInvestment Bank 10
CHF 2.630%
800,000 878,000 0.2224.08.22EuropeanInvestment Bank 10EMTN
CHF 2.000%
4,000,000 4,414,000 1.1002.08.24EuropeanInvestment Bank 12
CHF 1.500%
1,175,000 1,306,600 0.3321.02.28EuropeanInvestment Bank 13
CHF 1.380%
1,680,000 1,712,256 0.4325.10.19Gazprom OAO ViaGaz Capital SA 13EMTN
CHF 2.850%
500,000 503,200 0.1330.11.18Gazprom OAO ViaGaz Capital SA 16
CHF 3.380%
1,000,000 1,034,500 0.2630.11.21Gazprom OAO ViaGaz Capital SA 16
CHF 2.750%
300,000 314,700 0.0810.05.21Glencore FinanceEurope Ltd 16EMTN
CHF 2.250%
4,000,000 3,785,153 0.9415.10.21EuropeanInvestment Bank 14
USD 2.130%
5.0920,323,134Total - Luxembourg
500,000 492,834 0.1212.08.19Petronas Capital Ltd09
USD 5.250%Malaysia
0.12492,834Total - Malaysia
30
Vontobel Fund - Swiss Franc Bond
The accompanying notes form an essential part of these financial statements.
Portfolio as at August 31, 2018
* Any deviations of the percentages of the nets assets are due to rounding.
Securities Marketvalue in
CHF
% of netassets*
Quantity Ccy Maturity
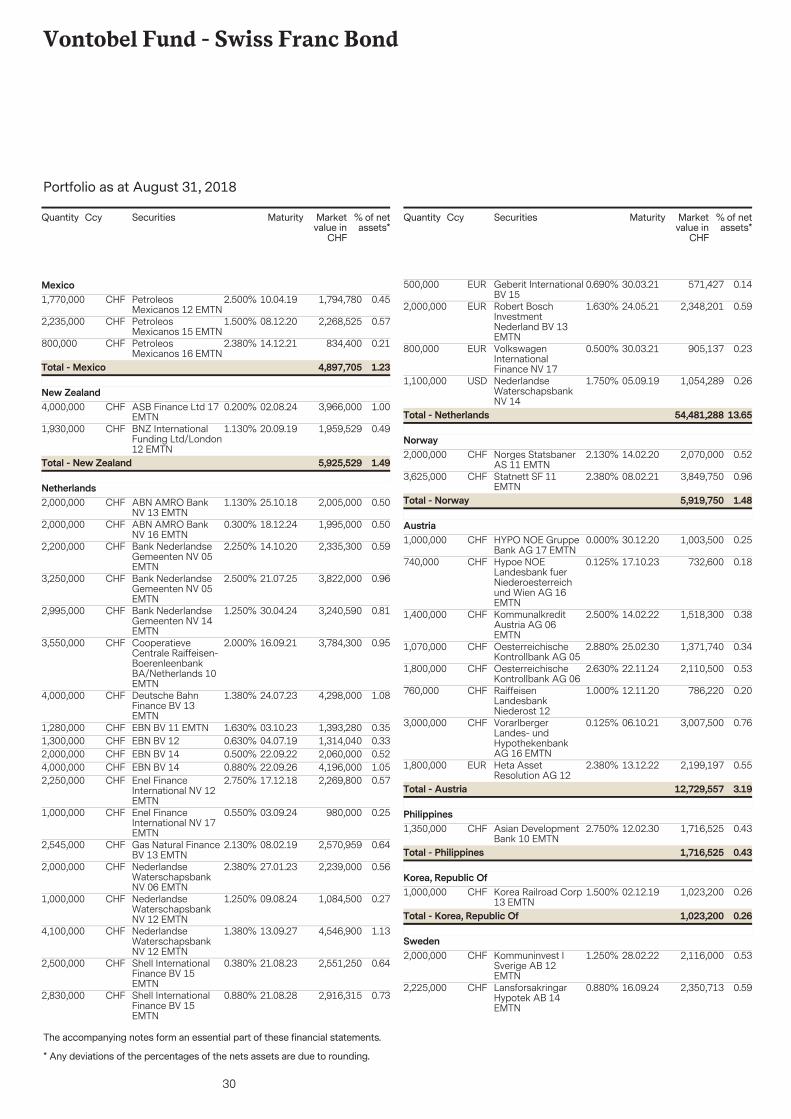
1,770,000 1,794,780 0.4510.04.19PetroleosMexicanos 12 EMTN
CHF 2.500%Mexico
2,235,000 2,268,525 0.5708.12.20PetroleosMexicanos 15 EMTN
CHF 1.500%
800,000 834,400 0.2114.12.21PetroleosMexicanos 16 EMTN
CHF 2.380%
1.234,897,705Total - Mexico
4,000,000 3,966,000 1.0002.08.24ASB Finance Ltd 17EMTN
CHF 0.200%New Zealand
1,930,000 1,959,529 0.4920.09.19BNZ InternationalFunding Ltd/London12 EMTN
CHF 1.130%
1.495,925,529Total - New Zealand
2,000,000 2,005,000 0.5025.10.18ABN AMRO BankNV 13 EMTN
CHF 1.130%Netherlands
2,000,000 1,995,000 0.5018.12.24ABN AMRO BankNV 16 EMTN
CHF 0.300%
2,200,000 2,335,300 0.5914.10.20Bank NederlandseGemeenten NV 05EMTN
CHF 2.250%
3,250,000 3,822,000 0.9621.07.25Bank NederlandseGemeenten NV 05EMTN
CHF 2.500%
2,995,000 3,240,590 0.8130.04.24Bank NederlandseGemeenten NV 14EMTN
CHF 1.250%
3,550,000 3,784,300 0.9516.09.21CooperatieveCentrale Raiffeisen-BoerenleenbankBA/Netherlands 10EMTN
CHF 2.000%
4,000,000 4,298,000 1.0824.07.23Deutsche BahnFinance BV 13EMTN
CHF 1.380%
1,280,000 1,393,280 0.3503.10.23EBN BV 11 EMTNCHF 1.630%1,300,000 1,314,040 0.3304.07.19EBN BV 12CHF 0.630%2,000,000 2,060,000 0.5222.09.22EBN BV 14CHF 0.500%4,000,000 4,196,000 1.0522.09.26EBN BV 14CHF 0.880%2,250,000 2,269,800 0.5717.12.18Enel Finance
International NV 12EMTN
CHF 2.750%
1,000,000 980,000 0.2503.09.24Enel FinanceInternational NV 17EMTN
CHF 0.550%
2,545,000 2,570,959 0.6408.02.19Gas Natural FinanceBV 13 EMTN
CHF 2.130%
2,000,000 2,239,000 0.5627.01.23NederlandseWaterschapsbankNV 06 EMTN
CHF 2.380%
1,000,000 1,084,500 0.2709.08.24NederlandseWaterschapsbankNV 12 EMTN
CHF 1.250%
4,100,000 4,546,900 1.1313.09.27NederlandseWaterschapsbankNV 12 EMTN
CHF 1.380%
2,500,000 2,551,250 0.6421.08.23Shell InternationalFinance BV 15EMTN
CHF 0.380%
2,830,000 2,916,315 0.7321.08.28Shell InternationalFinance BV 15EMTN
CHF 0.880%
Securities Marketvalue in
CHF
% of netassets*
Quantity Ccy Maturity
500,000 571,427 0.1430.03.21Geberit InternationalBV 15
EUR 0.690%
2,000,000 2,348,201 0.5924.05.21Robert BoschInvestmentNederland BV 13EMTN
EUR 1.630%
800,000 905,137 0.2330.03.21VolkswagenInternationalFinance NV 17
EUR 0.500%
1,100,000 1,054,289 0.2605.09.19NederlandseWaterschapsbankNV 14
USD 1.750%
13.6554,481,288Total - Netherlands
2,000,000 2,070,000 0.5214.02.20Norges StatsbanerAS 11 EMTN
CHF 2.130%Norway
3,625,000 3,849,750 0.9608.02.21Statnett SF 11EMTN
CHF 2.380%
1.485,919,750Total - Norway
1,000,000 1,003,500 0.2530.12.20HYPO NOE GruppeBank AG 17 EMTN
CHF 0.000%Austria
740,000 732,600 0.1817.10.23Hypoe NOELandesbank fuerNiederoesterreichund Wien AG 16EMTN
CHF 0.125%
1,400,000 1,518,300 0.3814.02.22KommunalkreditAustria AG 06EMTN
CHF 2.500%
1,070,000 1,371,740 0.3425.02.30OesterreichischeKontrollbank AG 05
CHF 2.880%
1,800,000 2,110,500 0.5322.11.24OesterreichischeKontrollbank AG 06
CHF 2.630%
760,000 786,220 0.2012.11.20RaiffeisenLandesbankNiederost 12
CHF 1.000%
3,000,000 3,007,500 0.7606.10.21VorarlbergerLandes- undHypothekenbankAG 16 EMTN
CHF 0.125%
1,800,000 2,199,197 0.5513.12.22Heta AssetResolution AG 12
EUR 2.380%
3.1912,729,557Total - Austria
1,350,000 1,716,525 0.4312.02.30Asian DevelopmentBank 10 EMTN
CHF 2.750%Philippines
0.431,716,525Total - Philippines
1,000,000 1,023,200 0.2602.12.19Korea Railroad Corp13 EMTN
CHF 1.500%Korea, Republic Of
0.261,023,200Total - Korea, Republic Of
2,000,000 2,116,000 0.5328.02.22Kommuninvest ISverige AB 12EMTN
CHF 1.250%Sweden
2,225,000 2,350,713 0.5916.09.24LansforsakringarHypotek AB 14EMTN
CHF 0.880%
31
Vontobel Fund - Swiss Franc Bond
The accompanying notes form an essential part of these financial statements.
Portfolio as at August 31, 2018
* Any deviations of the percentages of the nets assets are due to rounding.
Securities Marketvalue in
CHF
% of netassets*
Quantity Ccy Maturity
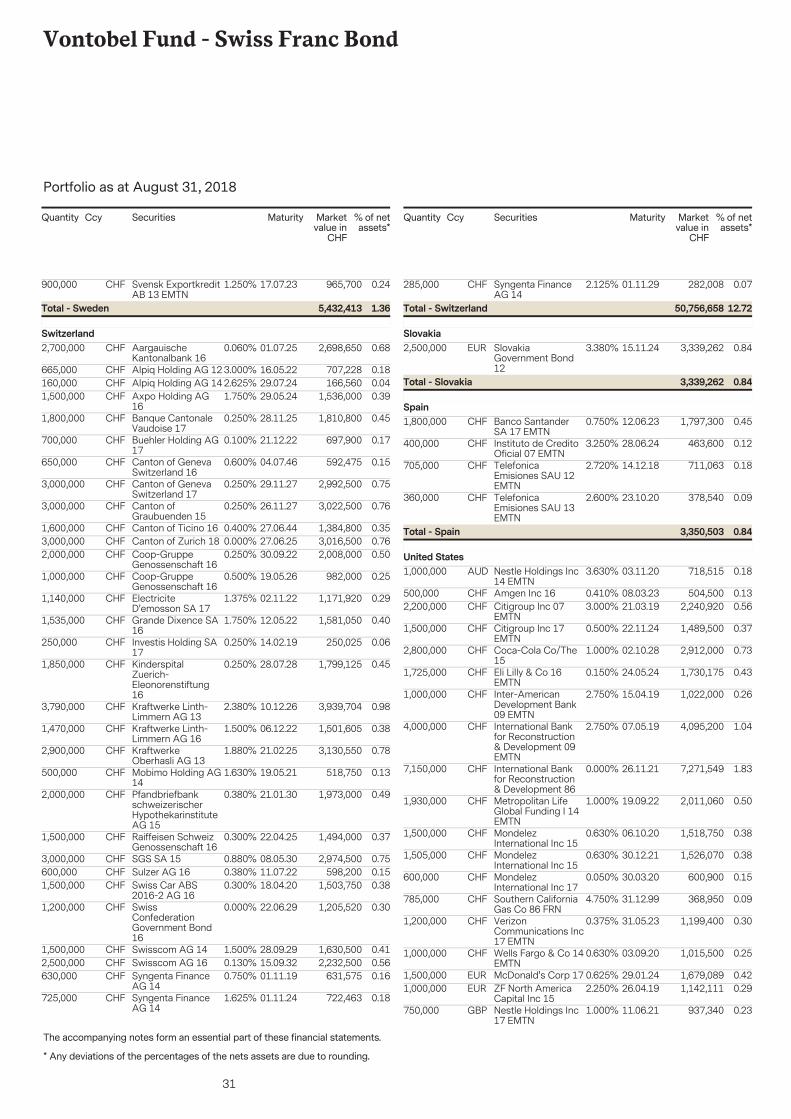
900,000 965,700 0.2417.07.23Svensk ExportkreditAB 13 EMTN
CHF 1.250%
1.365,432,413Total - Sweden
2,700,000 2,698,650 0.6801.07.25AargauischeKantonalbank 16
CHF 0.060%Switzerland
665,000 707,228 0.1816.05.22Alpiq Holding AG 12CHF 3.000%160,000 166,560 0.0429.07.24Alpiq Holding AG 14CHF 2.625%1,500,000 1,536,000 0.3929.05.24Axpo Holding AG
16CHF 1.750%
1,800,000 1,810,800 0.4528.11.25Banque CantonaleVaudoise 17
CHF 0.250%
700,000 697,900 0.1721.12.22Buehler Holding AG17
CHF 0.100%
650,000 592,475 0.1504.07.46Canton of GenevaSwitzerland 16
CHF 0.600%
3,000,000 2,992,500 0.7529.11.27Canton of GenevaSwitzerland 17
CHF 0.250%
3,000,000 3,022,500 0.7626.11.27Canton ofGraubuenden 15
CHF 0.250%
1,600,000 1,384,800 0.3527.06.44Canton of Ticino 16CHF 0.400%3,000,000 3,016,500 0.7627.06.25Canton of Zurich 18CHF 0.000%2,000,000 2,008,000 0.5030.09.22Coop-Gruppe
Genossenschaft 16CHF 0.250%
1,000,000 982,000 0.2519.05.26Coop-GruppeGenossenschaft 16
CHF 0.500%
1,140,000 1,171,920 0.2902.11.22ElectriciteD'emosson SA 17
CHF 1.375%
1,535,000 1,581,050 0.4012.05.22Grande Dixence SA16
CHF 1.750%
250,000 250,025 0.0614.02.19Investis Holding SA17
CHF 0.250%
1,850,000 1,799,125 0.4528.07.28KinderspitalZuerich-Eleonorenstiftung16
CHF 0.250%
3,790,000 3,939,704 0.9810.12.26Kraftwerke Linth-Limmern AG 13
CHF 2.380%
1,470,000 1,501,605 0.3806.12.22Kraftwerke Linth-Limmern AG 16
CHF 1.500%
2,900,000 3,130,550 0.7821.02.25KraftwerkeOberhasli AG 13
CHF 1.880%
500,000 518,750 0.1319.05.21Mobimo Holding AG14
CHF 1.630%
2,000,000 1,973,000 0.4921.01.30PfandbriefbankschweizerischerHypothekarinstituteAG 15
CHF 0.380%
1,500,000 1,494,000 0.3722.04.25Raiffeisen SchweizGenossenschaft 16
CHF 0.300%
3,000,000 2,974,500 0.7508.05.30SGS SA 15CHF 0.880%600,000 598,200 0.1511.07.22Sulzer AG 16CHF 0.380%1,500,000 1,503,750 0.3818.04.20Swiss Car ABS
2016-2 AG 16CHF 0.300%
1,200,000 1,205,520 0.3022.06.29SwissConfederationGovernment Bond16
CHF 0.000%
1,500,000 1,630,500 0.4128.09.29Swisscom AG 14CHF 1.500%2,500,000 2,232,500 0.5615.09.32Swisscom AG 16CHF 0.130%630,000 631,575 0.1601.11.19Syngenta Finance
AG 14CHF 0.750%
725,000 722,463 0.1801.11.24Syngenta FinanceAG 14
CHF 1.625%
Securities Marketvalue in
CHF
% of netassets*
Quantity Ccy Maturity
285,000 282,008 0.0701.11.29Syngenta FinanceAG 14
CHF 2.125%
12.7250,756,658Total - Switzerland
2,500,000 3,339,262 0.8415.11.24SlovakiaGovernment Bond12
EUR 3.380%Slovakia
0.843,339,262Total - Slovakia
1,800,000 1,797,300 0.4512.06.23Banco SantanderSA 17 EMTN
CHF 0.750%Spain
400,000 463,600 0.1228.06.24Instituto de CreditoOficial 07 EMTN
CHF 3.250%
705,000 711,063 0.1814.12.18TelefonicaEmisiones SAU 12EMTN
CHF 2.720%
360,000 378,540 0.0923.10.20TelefonicaEmisiones SAU 13EMTN
CHF 2.600%
0.843,350,503Total - Spain
1,000,000 718,515 0.1803.11.20Nestle Holdings Inc14 EMTN
AUD 3.630%United States
500,000 504,500 0.1308.03.23Amgen Inc 16CHF 0.410%2,200,000 2,240,920 0.5621.03.19Citigroup Inc 07
EMTNCHF 3.000%
1,500,000 1,489,500 0.3722.11.24Citigroup Inc 17EMTN
CHF 0.500%
2,800,000 2,912,000 0.7302.10.28Coca-Cola Co/The15
CHF 1.000%
1,725,000 1,730,175 0.4324.05.24Eli Lilly & Co 16EMTN
CHF 0.150%
1,000,000 1,022,000 0.2615.04.19Inter-AmericanDevelopment Bank09 EMTN
CHF 2.750%
4,000,000 4,095,200 1.0407.05.19International Bankfor Reconstruction& Development 09EMTN
CHF 2.750%
7,150,000 7,271,549 1.8326.11.21International Bankfor Reconstruction& Development 86
CHF 0.000%
1,930,000 2,011,060 0.5019.09.22Metropolitan LifeGlobal Funding I 14EMTN
CHF 1.000%
1,500,000 1,518,750 0.3806.10.20MondelezInternational Inc 15
CHF 0.630%
1,505,000 1,526,070 0.3830.12.21MondelezInternational Inc 15
CHF 0.630%
600,000 600,900 0.1530.03.20MondelezInternational Inc 17
CHF 0.050%
785,000 368,950 0.0931.12.99Southern CaliforniaGas Co 86 FRN
CHF 4.750%
1,200,000 1,199,400 0.3031.05.23VerizonCommunications Inc17 EMTN
CHF 0.375%
1,000,000 1,015,500 0.2503.09.20Wells Fargo & Co 14EMTN
CHF 0.630%
1,500,000 1,679,089 0.4229.01.24McDonald's Corp 17EUR 0.625%1,000,000 1,142,111 0.2926.04.19ZF North America
Capital Inc 15EUR 2.250%
750,000 937,340 0.2311.06.21Nestle Holdings Inc17 EMTN
GBP 1.000%
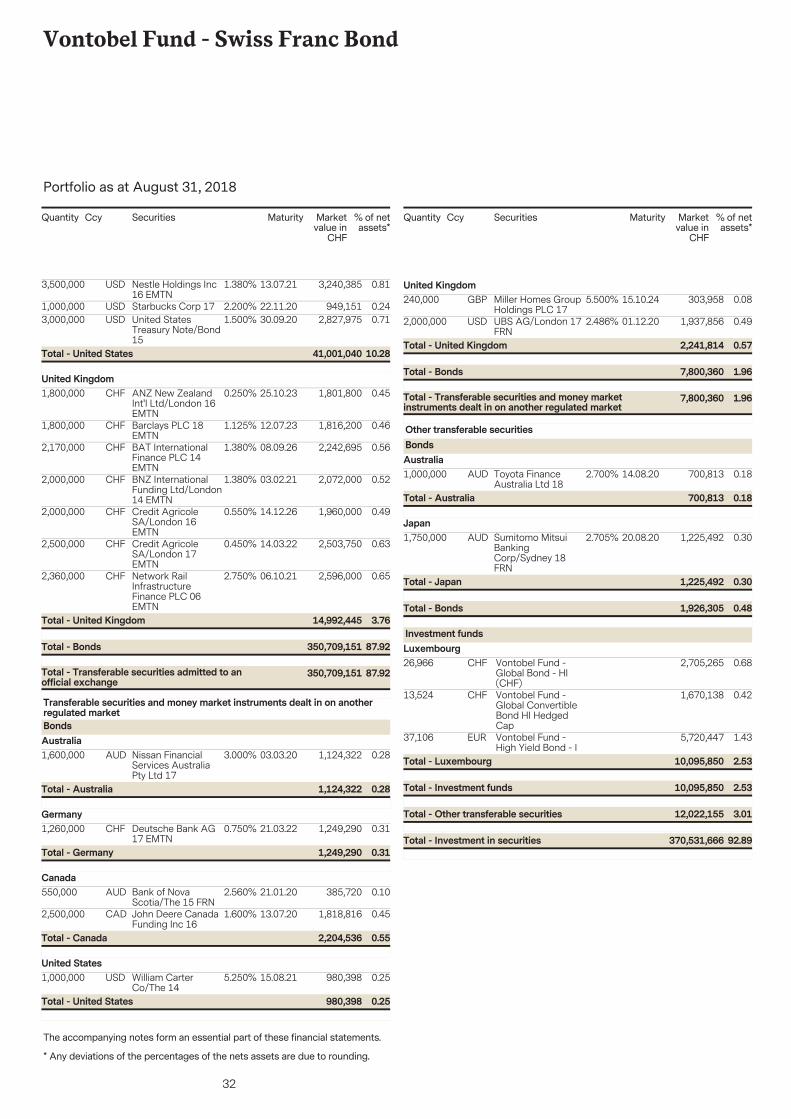
32
Vontobel Fund - Swiss Franc Bond
The accompanying notes form an essential part of these financial statements.
Portfolio as at August 31, 2018
* Any deviations of the percentages of the nets assets are due to rounding.
Securities Marketvalue in
CHF
% of netassets*
Quantity Ccy Maturity
3,500,000 3,240,385 0.8113.07.21Nestle Holdings Inc16 EMTN
USD 1.380%
1,000,000 949,151 0.2422.11.20Starbucks Corp 17USD 2.200%3,000,000 2,827,975 0.7130.09.20United States
Treasury Note/Bond15
USD 1.500%
10.2841,001,040Total - United States
1,800,000 1,801,800 0.4525.10.23ANZ New ZealandInt'l Ltd/London 16EMTN
CHF 0.250%United Kingdom
1,800,000 1,816,200 0.4612.07.23Barclays PLC 18EMTN
CHF 1.125%
2,170,000 2,242,695 0.5608.09.26BAT InternationalFinance PLC 14EMTN
CHF 1.380%
2,000,000 2,072,000 0.5203.02.21BNZ InternationalFunding Ltd/London14 EMTN
CHF 1.380%
2,000,000 1,960,000 0.4914.12.26Credit AgricoleSA/London 16EMTN
CHF 0.550%
2,500,000 2,503,750 0.6314.03.22Credit AgricoleSA/London 17EMTN
CHF 0.450%
2,360,000 2,596,000 0.6506.10.21Network RailInfrastructureFinance PLC 06EMTN
CHF 2.750%
87.92350,709,151Total - Transferable securities admitted to anofficial exchange
87.92350,709,151Total - Bonds
3.7614,992,445Total - United Kingdom
1,600,000 1,124,322 0.2803.03.20Nissan FinancialServices AustraliaPty Ltd 17
AUD 3.000%
Transferable securities and money market instruments dealt in on anotherregulated marketBondsAustralia
0.281,124,322Total - Australia
1,260,000 1,249,290 0.3121.03.22Deutsche Bank AG17 EMTN
CHF 0.750%Germany
0.311,249,290Total - Germany
550,000 385,720 0.1021.01.20Bank of NovaScotia/The 15 FRN
AUD 2.560%Canada
2,500,000 1,818,816 0.4513.07.20John Deere CanadaFunding Inc 16
CAD 1.600%
0.552,204,536Total - Canada
1,000,000 980,398 0.2515.08.21William CarterCo/The 14
USD 5.250%United States
0.25980,398Total - United States
Securities Marketvalue in
CHF
% of netassets*
Quantity Ccy Maturity
240,000 303,958 0.0815.10.24Miller Homes GroupHoldings PLC 17
GBP 5.500%United Kingdom
2,000,000 1,937,856 0.4901.12.20UBS AG/London 17FRN
USD 2.486%
1.967,800,360Total - Transferable securities and money marketinstruments dealt in on another regulated market
1.967,800,360Total - Bonds
0.572,241,814Total - United Kingdom
1,000,000 700,813 0.1814.08.20Toyota FinanceAustralia Ltd 18
AUD 2.700%
Other transferable securitiesBondsAustralia
0.18700,813Total - Australia
1,750,000 1,225,492 0.3020.08.20Sumitomo MitsuiBankingCorp/Sydney 18FRN
AUD 2.705%Japan
0.481,926,305Total - Bonds
0.301,225,492Total - Japan
26,966 2,705,265 0.68Vontobel Fund -Global Bond - HI(CHF)
CHF
Investment fundsLuxembourg
13,524 1,670,138 0.42Vontobel Fund -Global ConvertibleBond HI HedgedCap
CHF
37,106 5,720,447 1.43Vontobel Fund -High Yield Bond - I
EUR
3.0112,022,155Total - Other transferable securities
2.5310,095,850Total - Investment funds
2.5310,095,850Total - Luxembourg
92.89370,531,666Total - Investment in securities
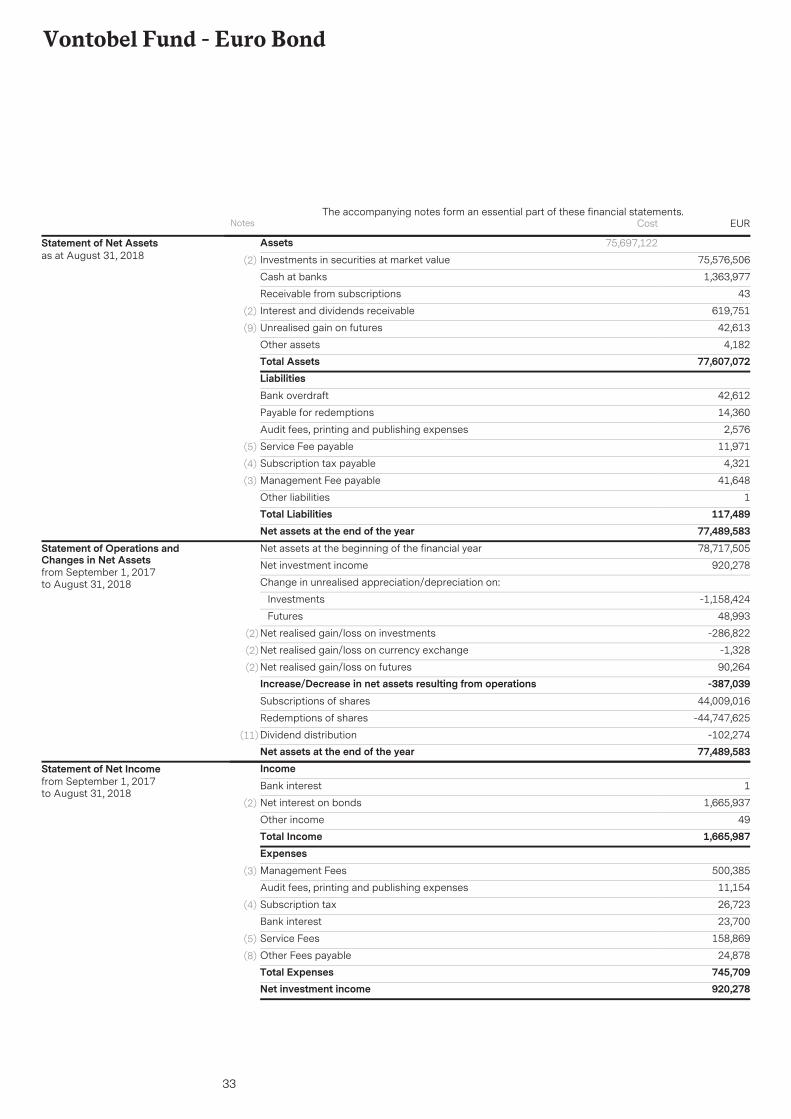
33
Vontobel Fund - Euro Bond
AssetsInvestments in securities at market value 75,576,506(2)
1,363,977Cash at banks
43Receivable from subscriptions
619,751Interest and dividends receivable(2)
42,613Unrealised gain on futures(9)
4,182Other assetsTotal Assets 77,607,072
75,697,122Statement of Net Assetsas at August 31, 2018
LiabilitiesBank overdraft 42,612
Payable for redemptions 14,360
Audit fees, printing and publishing expenses 2,576
Service Fee payable 11,971(5)
Subscription tax payable 4,321(4)
Management Fee payable 41,648(3)
Other liabilities 1Total Liabilities 117,489Net assets at the end of the year 77,489,583Net assets at the beginning of the financial year 78,717,505
Net investment income 920,278
Change in unrealised appreciation/depreciation on:
Investments -1,158,424
Futures 48,993
Net realised gain/loss on investments -286,822(2)
Net realised gain/loss on currency exchange -1,328(2)
Net realised gain/loss on futures 90,264(2)
Increase/Decrease in net assets resulting from operations -387,039Subscriptions of shares 44,009,016
Redemptions of shares -44,747,625
Dividend distribution -102,274(11)
Net assets at the end of the year 77,489,583
Statement of Operations andChanges in Net Assetsfrom September 1, 2017to August 31, 2018
IncomeBank interest 1
Net interest on bonds 1,665,937(2)
Other income 49Total Income 1,665,987ExpensesManagement Fees 500,385(3)
Audit fees, printing and publishing expenses 11,154
Subscription tax 26,723(4)
Bank interest 23,700
Service Fees 158,869(5)
Other Fees payable 24,878(8)
Total Expenses 745,709Net investment income 920,278
Statement of Net Incomefrom September 1, 2017to August 31, 2018
Notes EURThe accompanying notes form an essential part of these financial statements.
Cost
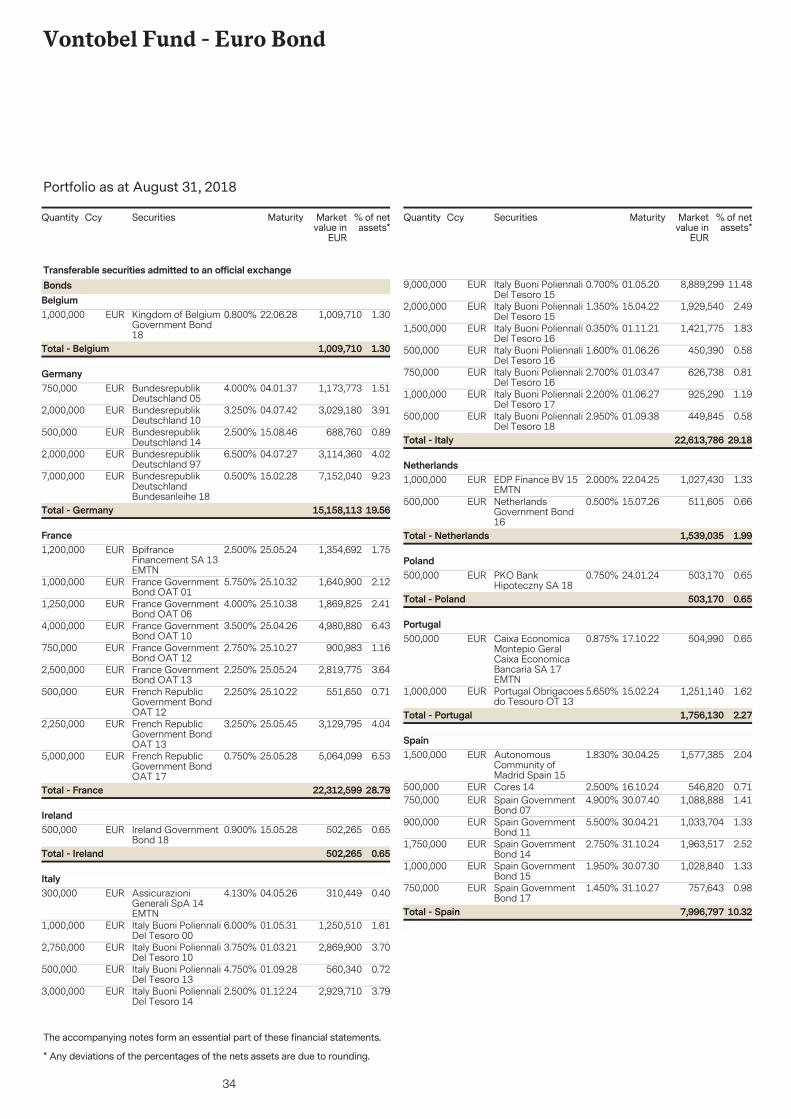
34
Vontobel Fund - Euro Bond
The accompanying notes form an essential part of these financial statements.
Portfolio as at August 31, 2018
* Any deviations of the percentages of the nets assets are due to rounding.
Securities Marketvalue in
EUR
% of netassets*
Quantity Ccy Maturity
1,000,000 1,009,710 1.3022.06.28Kingdom of BelgiumGovernment Bond18
EUR 0.800%
Transferable securities admitted to an official exchangeBondsBelgium
1.301,009,710Total - Belgium
750,000 1,173,773 1.5104.01.37BundesrepublikDeutschland 05
EUR 4.000%Germany
2,000,000 3,029,180 3.9104.07.42BundesrepublikDeutschland 10
EUR 3.250%
500,000 688,760 0.8915.08.46BundesrepublikDeutschland 14
EUR 2.500%
2,000,000 3,114,360 4.0204.07.27BundesrepublikDeutschland 97
EUR 6.500%
7,000,000 7,152,040 9.2315.02.28BundesrepublikDeutschlandBundesanleihe 18
EUR 0.500%
19.5615,158,113Total - Germany
1,200,000 1,354,692 1.7525.05.24BpifranceFinancement SA 13EMTN
EUR 2.500%France
1,000,000 1,640,900 2.1225.10.32France GovernmentBond OAT 01
EUR 5.750%
1,250,000 1,869,825 2.4125.10.38France GovernmentBond OAT 06
EUR 4.000%
4,000,000 4,980,880 6.4325.04.26France GovernmentBond OAT 10
EUR 3.500%
750,000 900,983 1.1625.10.27France GovernmentBond OAT 12
EUR 2.750%
2,500,000 2,819,775 3.6425.05.24France GovernmentBond OAT 13
EUR 2.250%
500,000 551,650 0.7125.10.22French RepublicGovernment BondOAT 12
EUR 2.250%
2,250,000 3,129,795 4.0425.05.45French RepublicGovernment BondOAT 13
EUR 3.250%
5,000,000 5,064,099 6.5325.05.28French RepublicGovernment BondOAT 17
EUR 0.750%
28.7922,312,599Total - France
500,000 502,265 0.6515.05.28Ireland GovernmentBond 18
EUR 0.900%Ireland
0.65502,265Total - Ireland
300,000 310,449 0.4004.05.26AssicurazioniGenerali SpA 14EMTN
EUR 4.130%Italy
1,000,000 1,250,510 1.6101.05.31Italy Buoni PoliennaliDel Tesoro 00
EUR 6.000%
2,750,000 2,869,900 3.7001.03.21Italy Buoni PoliennaliDel Tesoro 10
EUR 3.750%
500,000 560,340 0.7201.09.28Italy Buoni PoliennaliDel Tesoro 13
EUR 4.750%
3,000,000 2,929,710 3.7901.12.24Italy Buoni PoliennaliDel Tesoro 14
EUR 2.500%
Securities Marketvalue in
EUR
% of netassets*
Quantity Ccy Maturity
9,000,000 8,889,299 11.4801.05.20Italy Buoni PoliennaliDel Tesoro 15
EUR 0.700%
2,000,000 1,929,540 2.4915.04.22Italy Buoni PoliennaliDel Tesoro 15
EUR 1.350%
1,500,000 1,421,775 1.8301.11.21Italy Buoni PoliennaliDel Tesoro 16
EUR 0.350%
500,000 450,390 0.5801.06.26Italy Buoni PoliennaliDel Tesoro 16
EUR 1.600%
750,000 626,738 0.8101.03.47Italy Buoni PoliennaliDel Tesoro 16
EUR 2.700%
1,000,000 925,290 1.1901.06.27Italy Buoni PoliennaliDel Tesoro 17
EUR 2.200%
500,000 449,845 0.5801.09.38Italy Buoni PoliennaliDel Tesoro 18
EUR 2.950%
29.1822,613,786Total - Italy
1,000,000 1,027,430 1.3322.04.25EDP Finance BV 15EMTN
EUR 2.000%Netherlands
500,000 511,605 0.6615.07.26NetherlandsGovernment Bond16
EUR 0.500%
1.991,539,035Total - Netherlands
500,000 503,170 0.6524.01.24PKO BankHipoteczny SA 18
EUR 0.750%Poland
0.65503,170Total - Poland
500,000 504,990 0.6517.10.22Caixa EconomicaMontepio GeralCaixa EconomicaBancaria SA 17EMTN
EUR 0.875%Portugal
1,000,000 1,251,140 1.6215.02.24Portugal Obrigacoesdo Tesouro OT 13
EUR 5.650%
2.271,756,130Total - Portugal
1,500,000 1,577,385 2.0430.04.25AutonomousCommunity ofMadrid Spain 15
EUR 1.830%Spain
500,000 546,820 0.7116.10.24Cores 14EUR 2.500%750,000 1,088,888 1.4130.07.40Spain Government
Bond 07EUR 4.900%
900,000 1,033,704 1.3330.04.21Spain GovernmentBond 11
EUR 5.500%
1,750,000 1,963,517 2.5231.10.24Spain GovernmentBond 14
EUR 2.750%
1,000,000 1,028,840 1.3330.07.30Spain GovernmentBond 15
EUR 1.950%
750,000 757,643 0.9831.10.27Spain GovernmentBond 17
EUR 1.450%
10.327,996,797Total - Spain
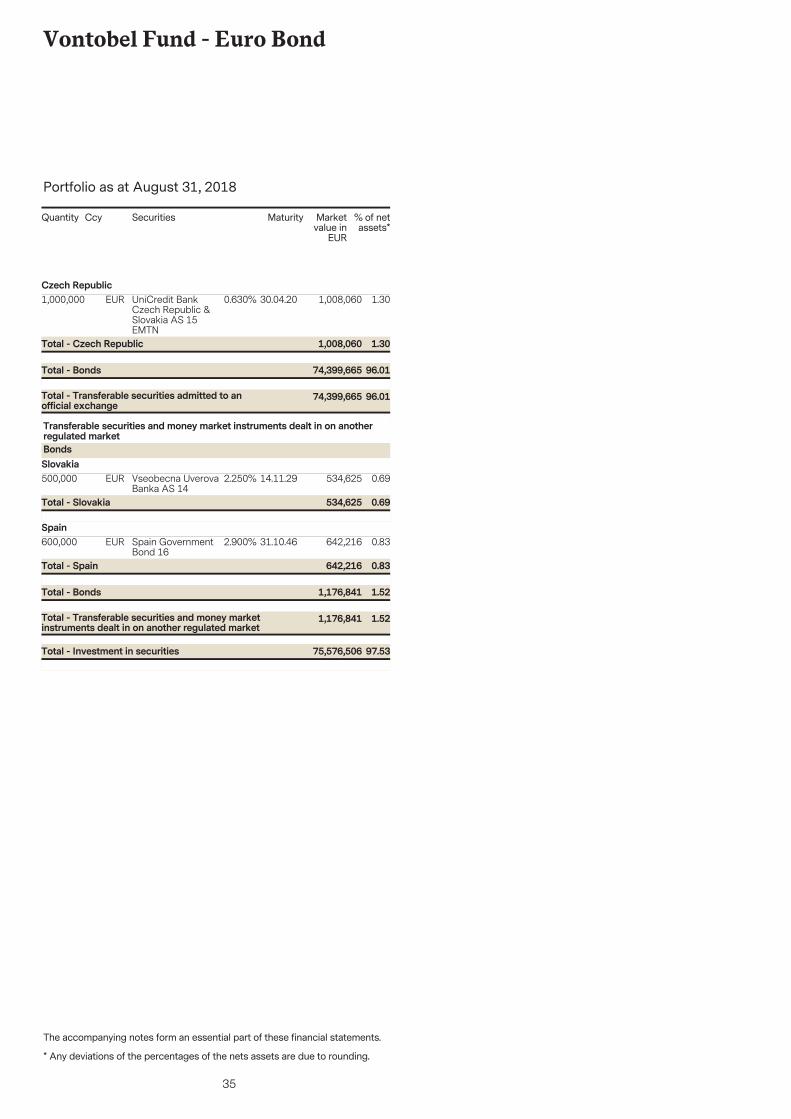
35
Vontobel Fund - Euro Bond
The accompanying notes form an essential part of these financial statements.
Portfolio as at August 31, 2018
* Any deviations of the percentages of the nets assets are due to rounding.
Securities Marketvalue in
EUR
% of netassets*
Quantity Ccy Maturity
1,000,000 1,008,060 1.3030.04.20UniCredit BankCzech Republic &Slovakia AS 15EMTN
EUR 0.630%Czech Republic
96.0174,399,665Total - Transferable securities admitted to anofficial exchange
96.0174,399,665Total - Bonds
1.301,008,060Total - Czech Republic
500,000 534,625 0.6914.11.29Vseobecna UverovaBanka AS 14
EUR 2.250%
Transferable securities and money market instruments dealt in on anotherregulated marketBondsSlovakia
0.69534,625Total - Slovakia
600,000 642,216 0.8331.10.46Spain GovernmentBond 16
EUR 2.900%Spain
1.521,176,841Total - Transferable securities and money marketinstruments dealt in on another regulated market
1.521,176,841Total - Bonds
0.83642,216Total - Spain
97.5375,576,506Total - Investment in securities
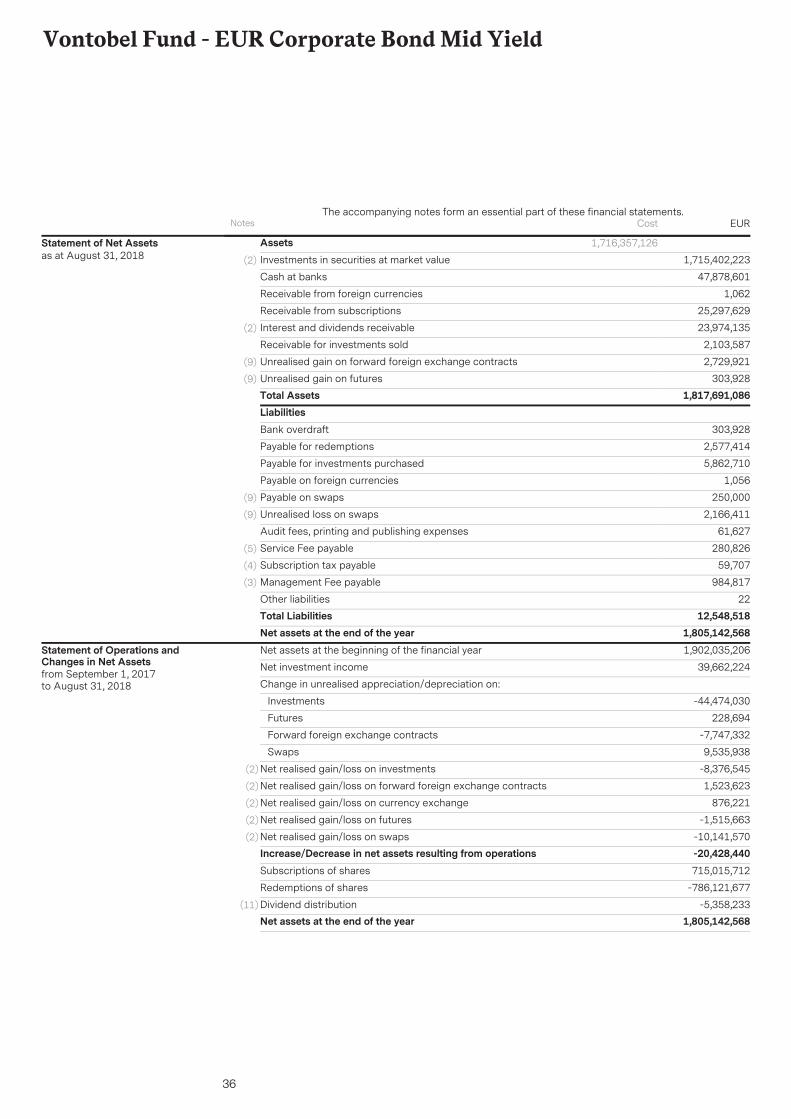
36
Vontobel Fund - EUR Corporate Bond Mid Yield
AssetsInvestments in securities at market value 1,715,402,223(2)
47,878,601Cash at banks
1,062Receivable from foreign currencies
25,297,629Receivable from subscriptions
23,974,135Interest and dividends receivable(2)
2,103,587Receivable for investments sold
2,729,921Unrealised gain on forward foreign exchange contracts(9)
303,928Unrealised gain on futures(9)
Total Assets 1,817,691,086
1,716,357,126Statement of Net Assetsas at August 31, 2018
LiabilitiesBank overdraft 303,928
Payable for redemptions 2,577,414
Payable for investments purchased 5,862,710
Payable on foreign currencies 1,056
Payable on swaps 250,000(9)
Unrealised loss on swaps 2,166,411(9)
Audit fees, printing and publishing expenses 61,627
Service Fee payable 280,826(5)
Subscription tax payable 59,707(4)
Management Fee payable 984,817(3)
Other liabilities 22Total Liabilities 12,548,518Net assets at the end of the year 1,805,142,568Net assets at the beginning of the financial year 1,902,035,206
Net investment income 39,662,224
Change in unrealised appreciation/depreciation on:
Investments -44,474,030
Futures 228,694
Forward foreign exchange contracts -7,747,332
Swaps 9,535,938
Net realised gain/loss on investments -8,376,545(2)
Net realised gain/loss on forward foreign exchange contracts 1,523,623(2)
Net realised gain/loss on currency exchange 876,221(2)
Net realised gain/loss on futures -1,515,663(2)
Net realised gain/loss on swaps -10,141,570(2)
Increase/Decrease in net assets resulting from operations -20,428,440Subscriptions of shares 715,015,712
Redemptions of shares -786,121,677
Dividend distribution -5,358,233(11)
Net assets at the end of the year 1,805,142,568
Statement of Operations andChanges in Net Assetsfrom September 1, 2017to August 31, 2018
Notes EURThe accompanying notes form an essential part of these financial statements.
Cost
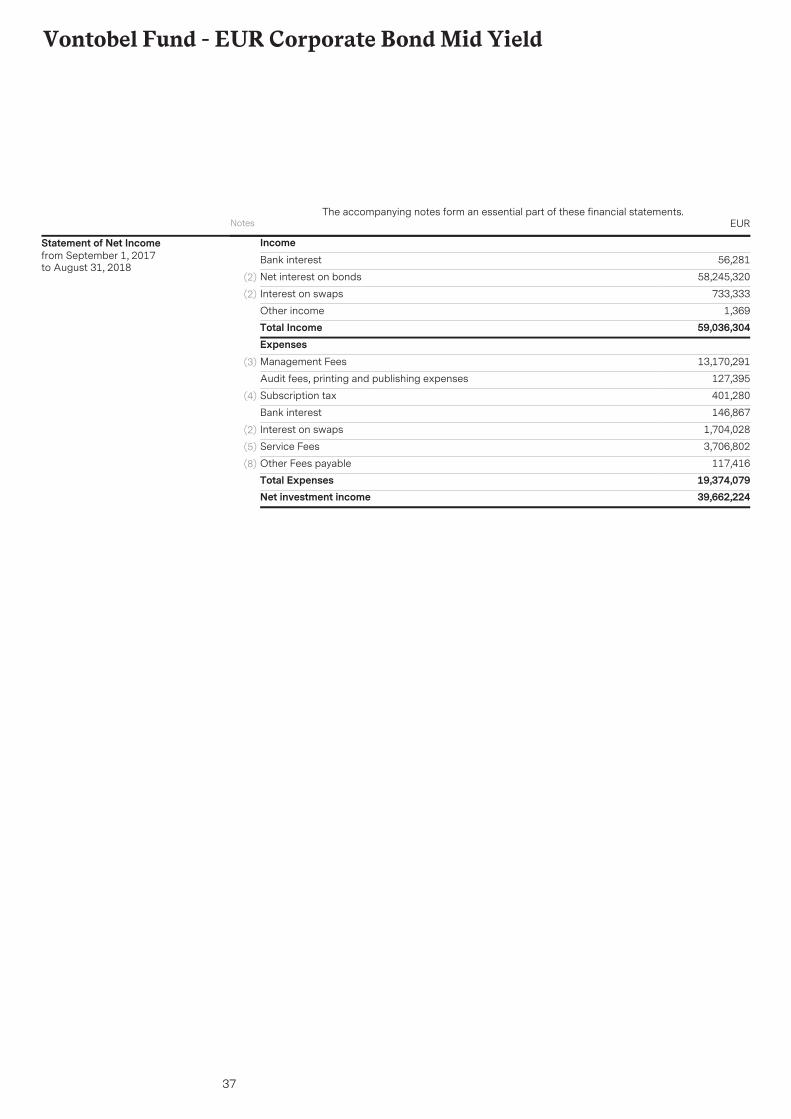
37
Vontobel Fund - EUR Corporate Bond Mid Yield
IncomeBank interest 56,281
Net interest on bonds 58,245,320(2)
Interest on swaps 733,333(2)
Other income 1,369Total Income 59,036,304ExpensesManagement Fees 13,170,291(3)
Audit fees, printing and publishing expenses 127,395
Subscription tax 401,280(4)
Bank interest 146,867
Interest on swaps 1,704,028(2)
Service Fees 3,706,802(5)
Other Fees payable 117,416(8)
Total Expenses 19,374,079Net investment income 39,662,224
Statement of Net Incomefrom September 1, 2017to August 31, 2018
Notes EURThe accompanying notes form an essential part of these financial statements.
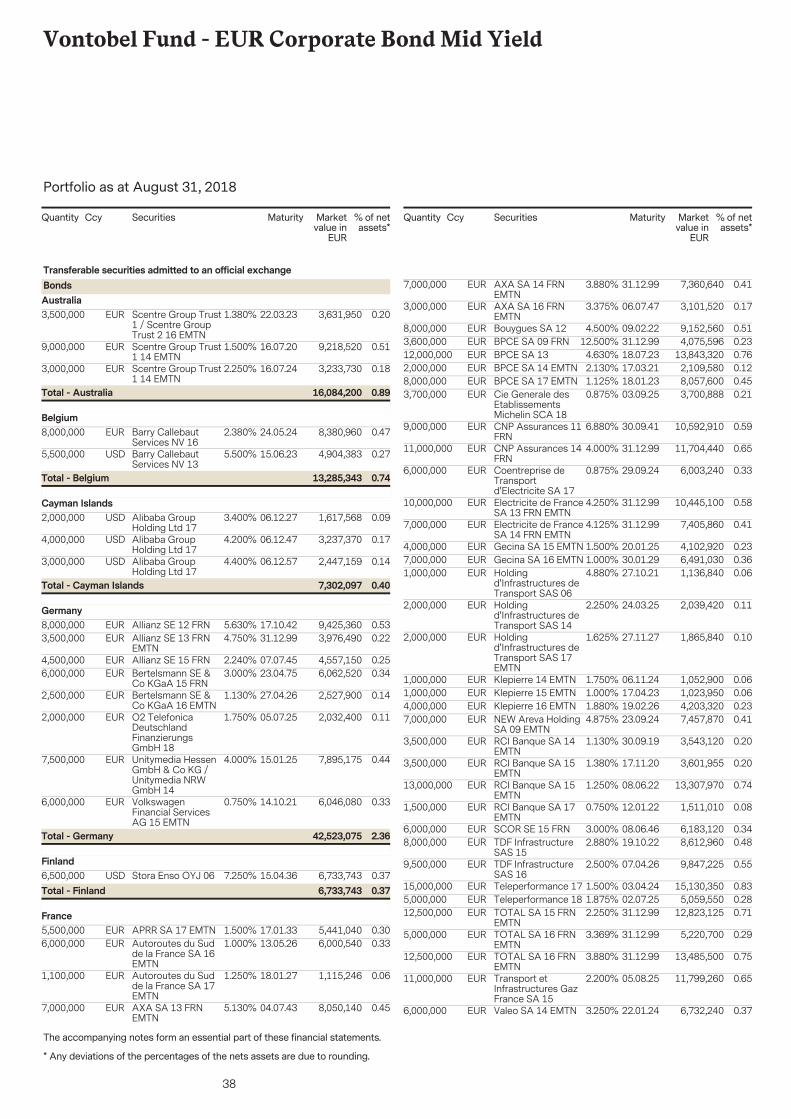
38
Vontobel Fund - EUR Corporate Bond Mid Yield
The accompanying notes form an essential part of these financial statements.
Portfolio as at August 31, 2018
* Any deviations of the percentages of the nets assets are due to rounding.
Securities Marketvalue in
EUR
% of netassets*
Quantity Ccy Maturity
3,500,000 3,631,950 0.2022.03.23Scentre Group Trust1 / Scentre GroupTrust 2 16 EMTN
EUR 1.380%
Transferable securities admitted to an official exchangeBondsAustralia
9,000,000 9,218,520 0.5116.07.20Scentre Group Trust1 14 EMTN
EUR 1.500%
3,000,000 3,233,730 0.1816.07.24Scentre Group Trust1 14 EMTN
EUR 2.250%
0.8916,084,200Total - Australia
8,000,000 8,380,960 0.4724.05.24Barry CallebautServices NV 16
EUR 2.380%Belgium
5,500,000 4,904,383 0.2715.06.23Barry CallebautServices NV 13
USD 5.500%
0.7413,285,343Total - Belgium
2,000,000 1,617,568 0.0906.12.27Alibaba GroupHolding Ltd 17
USD 3.400%Cayman Islands
4,000,000 3,237,370 0.1706.12.47Alibaba GroupHolding Ltd 17
USD 4.200%
3,000,000 2,447,159 0.1406.12.57Alibaba GroupHolding Ltd 17
USD 4.400%
0.407,302,097Total - Cayman Islands
8,000,000 9,425,360 0.5317.10.42Allianz SE 12 FRNEUR 5.630%Germany
3,500,000 3,976,490 0.2231.12.99Allianz SE 13 FRNEMTN
EUR 4.750%
4,500,000 4,557,150 0.2507.07.45Allianz SE 15 FRNEUR 2.240%6,000,000 6,062,520 0.3423.04.75Bertelsmann SE &
Co KGaA 15 FRNEUR 3.000%
2,500,000 2,527,900 0.1427.04.26Bertelsmann SE &Co KGaA 16 EMTN
EUR 1.130%
2,000,000 2,032,400 0.1105.07.25O2 TelefonicaDeutschlandFinanzierungsGmbH 18
EUR 1.750%
7,500,000 7,895,175 0.4415.01.25Unitymedia HessenGmbH & Co KG /Unitymedia NRWGmbH 14
EUR 4.000%
6,000,000 6,046,080 0.3314.10.21VolkswagenFinancial ServicesAG 15 EMTN
EUR 0.750%
2.3642,523,075Total - Germany
6,500,000 6,733,743 0.3715.04.36Stora Enso OYJ 06USD 7.250%Finland
0.376,733,743Total - Finland
5,500,000 5,441,040 0.3017.01.33APRR SA 17 EMTNEUR 1.500%France
6,000,000 6,000,540 0.3313.05.26Autoroutes du Sudde la France SA 16EMTN
EUR 1.000%
1,100,000 1,115,246 0.0618.01.27Autoroutes du Sudde la France SA 17EMTN
EUR 1.250%
7,000,000 8,050,140 0.4504.07.43AXA SA 13 FRNEMTN
EUR 5.130%
Securities Marketvalue in
EUR
% of netassets*
Quantity Ccy Maturity
7,000,000 7,360,640 0.4131.12.99AXA SA 14 FRNEMTN
EUR 3.880%
3,000,000 3,101,520 0.1706.07.47AXA SA 16 FRNEMTN
EUR 3.375%
8,000,000 9,152,560 0.5109.02.22Bouygues SA 12EUR 4.500%3,600,000 4,075,596 0.2331.12.99BPCE SA 09 FRNEUR 12.500%12,000,000 13,843,320 0.7618.07.23BPCE SA 13EUR 4.630%2,000,000 2,109,580 0.1217.03.21BPCE SA 14 EMTNEUR 2.130%8,000,000 8,057,600 0.4518.01.23BPCE SA 17 EMTNEUR 1.125%3,700,000 3,700,888 0.2103.09.25Cie Generale des
EtablissementsMichelin SCA 18
EUR 0.875%
9,000,000 10,592,910 0.5930.09.41CNP Assurances 11FRN
EUR 6.880%
11,000,000 11,704,440 0.6531.12.99CNP Assurances 14FRN
EUR 4.000%
6,000,000 6,003,240 0.3329.09.24Coentreprise deTransportd'Electricite SA 17
EUR 0.875%
10,000,000 10,445,100 0.5831.12.99Electricite de FranceSA 13 FRN EMTN
EUR 4.250%
7,000,000 7,405,860 0.4131.12.99Electricite de FranceSA 14 FRN EMTN
EUR 4.125%
4,000,000 4,102,920 0.2320.01.25Gecina SA 15 EMTNEUR 1.500%7,000,000 6,491,030 0.3630.01.29Gecina SA 16 EMTNEUR 1.000%1,000,000 1,136,840 0.0627.10.21Holding
d'Infrastructures deTransport SAS 06
EUR 4.880%
2,000,000 2,039,420 0.1124.03.25Holdingd'Infrastructures deTransport SAS 14
EUR 2.250%
2,000,000 1,865,840 0.1027.11.27Holdingd'Infrastructures deTransport SAS 17EMTN
EUR 1.625%
1,000,000 1,052,900 0.0606.11.24Klepierre 14 EMTNEUR 1.750%1,000,000 1,023,950 0.0617.04.23Klepierre 15 EMTNEUR 1.000%4,000,000 4,203,320 0.2319.02.26Klepierre 16 EMTNEUR 1.880%7,000,000 7,457,870 0.4123.09.24NEW Areva Holding
SA 09 EMTNEUR 4.875%
3,500,000 3,543,120 0.2030.09.19RCI Banque SA 14EMTN
EUR 1.130%
3,500,000 3,601,955 0.2017.11.20RCI Banque SA 15EMTN
EUR 1.380%
13,000,000 13,307,970 0.7408.06.22RCI Banque SA 15EMTN
EUR 1.250%
1,500,000 1,511,010 0.0812.01.22RCI Banque SA 17EMTN
EUR 0.750%
6,000,000 6,183,120 0.3408.06.46SCOR SE 15 FRNEUR 3.000%8,000,000 8,612,960 0.4819.10.22TDF Infrastructure
SAS 15EUR 2.880%
9,500,000 9,847,225 0.5507.04.26TDF InfrastructureSAS 16
EUR 2.500%
15,000,000 15,130,350 0.8303.04.24Teleperformance 17EUR 1.500%5,000,000 5,059,550 0.2802.07.25Teleperformance 18EUR 1.875%12,500,000 12,823,125 0.7131.12.99TOTAL SA 15 FRN
EMTNEUR 2.250%
5,000,000 5,220,700 0.2931.12.99TOTAL SA 16 FRNEMTN
EUR 3.369%
12,500,000 13,485,500 0.7531.12.99TOTAL SA 16 FRNEMTN
EUR 3.880%
11,000,000 11,799,260 0.6505.08.25Transport etInfrastructures GazFrance SA 15
EUR 2.200%
6,000,000 6,732,240 0.3722.01.24Valeo SA 14 EMTNEUR 3.250%
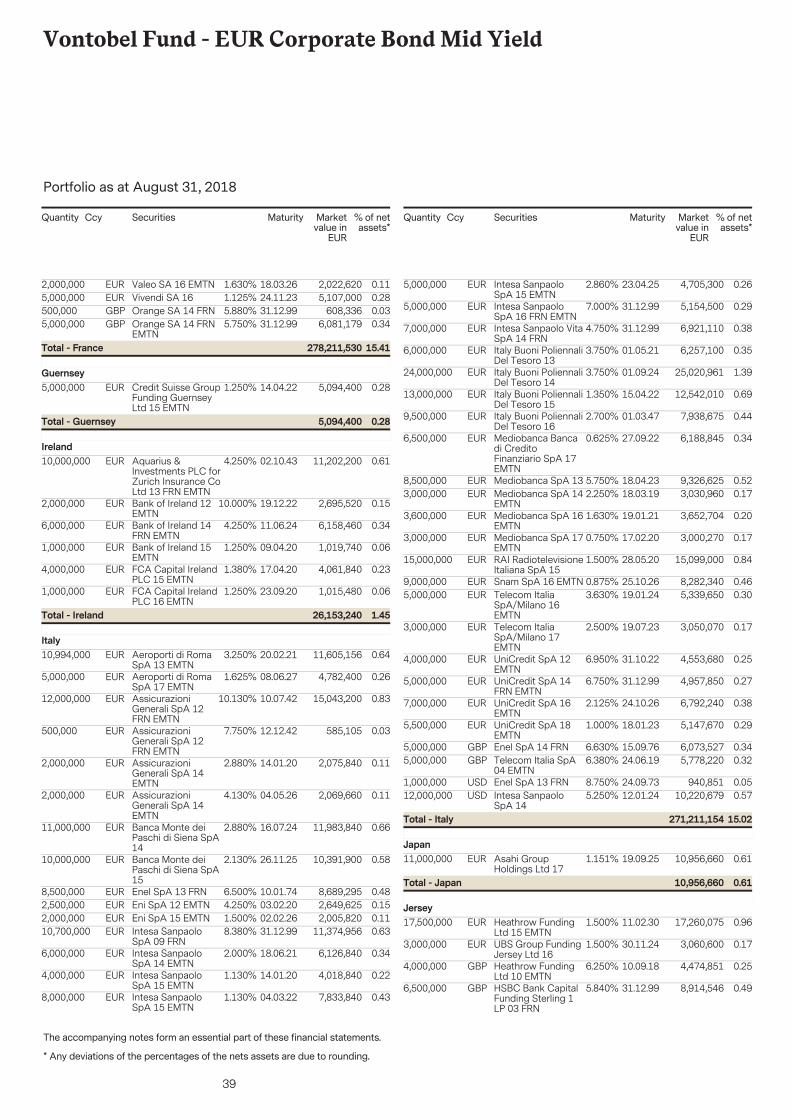
39
Vontobel Fund - EUR Corporate Bond Mid Yield
The accompanying notes form an essential part of these financial statements.
Portfolio as at August 31, 2018
* Any deviations of the percentages of the nets assets are due to rounding.
Securities Marketvalue in
EUR
% of netassets*
Quantity Ccy Maturity
2,000,000 2,022,620 0.1118.03.26Valeo SA 16 EMTNEUR 1.630%5,000,000 5,107,000 0.2824.11.23Vivendi SA 16EUR 1.125%500,000 608,336 0.0331.12.99Orange SA 14 FRNGBP 5.880%5,000,000 6,081,179 0.3431.12.99Orange SA 14 FRN
EMTNGBP 5.750%
15.41278,211,530Total - France
5,000,000 5,094,400 0.2814.04.22Credit Suisse GroupFunding GuernseyLtd 15 EMTN
EUR 1.250%Guernsey
0.285,094,400Total - Guernsey
10,000,000 11,202,200 0.6102.10.43Aquarius &Investments PLC forZurich Insurance CoLtd 13 FRN EMTN
EUR 4.250%Ireland
2,000,000 2,695,520 0.1519.12.22Bank of Ireland 12EMTN
EUR 10.000%
6,000,000 6,158,460 0.3411.06.24Bank of Ireland 14FRN EMTN
EUR 4.250%
1,000,000 1,019,740 0.0609.04.20Bank of Ireland 15EMTN
EUR 1.250%
4,000,000 4,061,840 0.2317.04.20FCA Capital IrelandPLC 15 EMTN
EUR 1.380%
1,000,000 1,015,480 0.0623.09.20FCA Capital IrelandPLC 16 EMTN
EUR 1.250%
1.4526,153,240Total - Ireland
10,994,000 11,605,156 0.6420.02.21Aeroporti di RomaSpA 13 EMTN
EUR 3.250%Italy
5,000,000 4,782,400 0.2608.06.27Aeroporti di RomaSpA 17 EMTN
EUR 1.625%
12,000,000 15,043,200 0.8310.07.42AssicurazioniGenerali SpA 12FRN EMTN
EUR 10.130%
500,000 585,105 0.0312.12.42AssicurazioniGenerali SpA 12FRN EMTN
EUR 7.750%
2,000,000 2,075,840 0.1114.01.20AssicurazioniGenerali SpA 14EMTN
EUR 2.880%
2,000,000 2,069,660 0.1104.05.26AssicurazioniGenerali SpA 14EMTN
EUR 4.130%
11,000,000 11,983,840 0.6616.07.24Banca Monte deiPaschi di Siena SpA14
EUR 2.880%
10,000,000 10,391,900 0.5826.11.25Banca Monte deiPaschi di Siena SpA15
EUR 2.130%
8,500,000 8,689,295 0.4810.01.74Enel SpA 13 FRNEUR 6.500%2,500,000 2,649,625 0.1503.02.20Eni SpA 12 EMTNEUR 4.250%2,000,000 2,005,820 0.1102.02.26Eni SpA 15 EMTNEUR 1.500%10,700,000 11,374,956 0.6331.12.99Intesa Sanpaolo
SpA 09 FRNEUR 8.380%
6,000,000 6,126,840 0.3418.06.21Intesa SanpaoloSpA 14 EMTN
EUR 2.000%
4,000,000 4,018,840 0.2214.01.20Intesa SanpaoloSpA 15 EMTN
EUR 1.130%
8,000,000 7,833,840 0.4304.03.22Intesa SanpaoloSpA 15 EMTN
EUR 1.130%
Securities Marketvalue in
EUR
% of netassets*
Quantity Ccy Maturity
5,000,000 4,705,300 0.2623.04.25Intesa SanpaoloSpA 15 EMTN
EUR 2.860%
5,000,000 5,154,500 0.2931.12.99Intesa SanpaoloSpA 16 FRN EMTN
EUR 7.000%
7,000,000 6,921,110 0.3831.12.99Intesa Sanpaolo VitaSpA 14 FRN
EUR 4.750%
6,000,000 6,257,100 0.3501.05.21Italy Buoni PoliennaliDel Tesoro 13
EUR 3.750%
24,000,000 25,020,961 1.3901.09.24Italy Buoni PoliennaliDel Tesoro 14
EUR 3.750%
13,000,000 12,542,010 0.6915.04.22Italy Buoni PoliennaliDel Tesoro 15
EUR 1.350%
9,500,000 7,938,675 0.4401.03.47Italy Buoni PoliennaliDel Tesoro 16
EUR 2.700%
6,500,000 6,188,845 0.3427.09.22Mediobanca Bancadi CreditoFinanziario SpA 17EMTN
EUR 0.625%
8,500,000 9,326,625 0.5218.04.23Mediobanca SpA 13EUR 5.750%3,000,000 3,030,960 0.1718.03.19Mediobanca SpA 14
EMTNEUR 2.250%
3,600,000 3,652,704 0.2019.01.21Mediobanca SpA 16EMTN
EUR 1.630%
3,000,000 3,000,270 0.1717.02.20Mediobanca SpA 17EMTN
EUR 0.750%
15,000,000 15,099,000 0.8428.05.20RAI RadiotelevisioneItaliana SpA 15
EUR 1.500%
9,000,000 8,282,340 0.4625.10.26Snam SpA 16 EMTNEUR 0.875%5,000,000 5,339,650 0.3019.01.24Telecom Italia
SpA/Milano 16EMTN
EUR 3.630%
3,000,000 3,050,070 0.1719.07.23Telecom ItaliaSpA/Milano 17EMTN
EUR 2.500%
4,000,000 4,553,680 0.2531.10.22UniCredit SpA 12EMTN
EUR 6.950%
5,000,000 4,957,850 0.2731.12.99UniCredit SpA 14FRN EMTN
EUR 6.750%
7,000,000 6,792,240 0.3824.10.26UniCredit SpA 16EMTN
EUR 2.125%
5,500,000 5,147,670 0.2918.01.23UniCredit SpA 18EMTN
EUR 1.000%
5,000,000 6,073,527 0.3415.09.76Enel SpA 14 FRNGBP 6.630%5,000,000 5,778,220 0.3224.06.19Telecom Italia SpA
04 EMTNGBP 6.380%
1,000,000 940,851 0.0524.09.73Enel SpA 13 FRNUSD 8.750%12,000,000 10,220,679 0.5712.01.24Intesa Sanpaolo
SpA 14USD 5.250%
15.02271,211,154Total - Italy
11,000,000 10,956,660 0.6119.09.25Asahi GroupHoldings Ltd 17
EUR 1.151%Japan
0.6110,956,660Total - Japan
17,500,000 17,260,075 0.9611.02.30Heathrow FundingLtd 15 EMTN
EUR 1.500%Jersey
3,000,000 3,060,600 0.1730.11.24UBS Group FundingJersey Ltd 16
EUR 1.500%
4,000,000 4,474,851 0.2510.09.18Heathrow FundingLtd 10 EMTN
GBP 6.250%
6,500,000 8,914,546 0.4931.12.99HSBC Bank CapitalFunding Sterling 1LP 03 FRN
GBP 5.840%
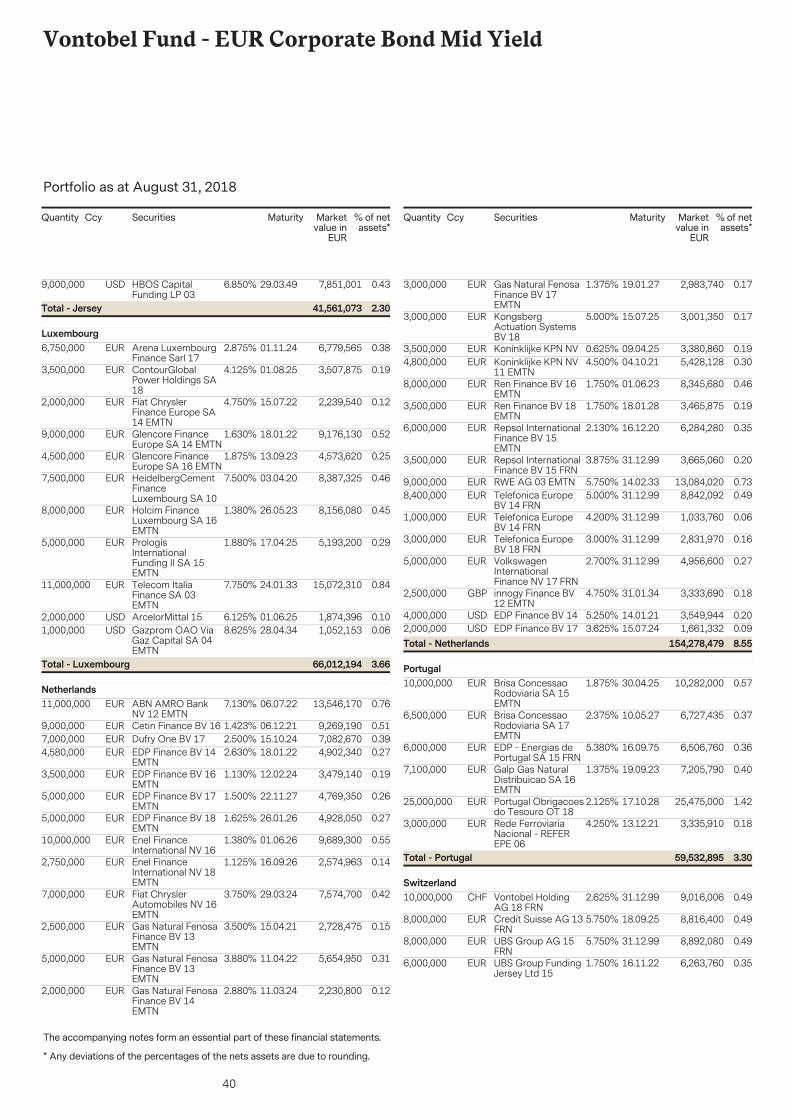
40
Vontobel Fund - EUR Corporate Bond Mid Yield
The accompanying notes form an essential part of these financial statements.
Portfolio as at August 31, 2018
* Any deviations of the percentages of the nets assets are due to rounding.
Securities Marketvalue in
EUR
% of netassets*
Quantity Ccy Maturity
9,000,000 7,851,001 0.4329.03.49HBOS CapitalFunding LP 03
USD 6.850%
2.3041,561,073Total - Jersey
6,750,000 6,779,565 0.3801.11.24Arena LuxembourgFinance Sarl 17
EUR 2.875%Luxembourg
3,500,000 3,507,875 0.1901.08.25ContourGlobalPower Holdings SA18
EUR 4.125%
2,000,000 2,239,540 0.1215.07.22Fiat ChryslerFinance Europe SA14 EMTN
EUR 4.750%
9,000,000 9,176,130 0.5218.01.22Glencore FinanceEurope SA 14 EMTN
EUR 1.630%
4,500,000 4,573,620 0.2513.09.23Glencore FinanceEurope SA 16 EMTN
EUR 1.875%
7,500,000 8,387,325 0.4603.04.20HeidelbergCementFinanceLuxembourg SA 10
EUR 7.500%
8,000,000 8,156,080 0.4526.05.23Holcim FinanceLuxembourg SA 16EMTN
EUR 1.380%
5,000,000 5,193,200 0.2917.04.25PrologisInternationalFunding II SA 15EMTN
EUR 1.880%
11,000,000 15,072,310 0.8424.01.33Telecom ItaliaFinance SA 03EMTN
EUR 7.750%
2,000,000 1,874,396 0.1001.06.25ArcelorMittal 15USD 6.125%1,000,000 1,052,153 0.0628.04.34Gazprom OAO Via
Gaz Capital SA 04EMTN
USD 8.625%
3.6666,012,194Total - Luxembourg
11,000,000 13,546,170 0.7606.07.22ABN AMRO BankNV 12 EMTN
EUR 7.130%Netherlands
9,000,000 9,269,190 0.5106.12.21Cetin Finance BV 16EUR 1.423%7,000,000 7,082,670 0.3915.10.24Dufry One BV 17EUR 2.500%4,580,000 4,902,340 0.2718.01.22EDP Finance BV 14
EMTNEUR 2.630%
3,500,000 3,479,140 0.1912.02.24EDP Finance BV 16EMTN
EUR 1.130%
5,000,000 4,769,350 0.2622.11.27EDP Finance BV 17EMTN
EUR 1.500%
5,000,000 4,928,050 0.2726.01.26EDP Finance BV 18EMTN
EUR 1.625%
10,000,000 9,689,300 0.5501.06.26Enel FinanceInternational NV 16
EUR 1.380%
2,750,000 2,574,963 0.1416.09.26Enel FinanceInternational NV 18EMTN
EUR 1.125%
7,000,000 7,574,700 0.4229.03.24Fiat ChryslerAutomobiles NV 16EMTN
EUR 3.750%
2,500,000 2,728,475 0.1515.04.21Gas Natural FenosaFinance BV 13EMTN
EUR 3.500%
5,000,000 5,654,950 0.3111.04.22Gas Natural FenosaFinance BV 13EMTN
EUR 3.880%
2,000,000 2,230,800 0.1211.03.24Gas Natural FenosaFinance BV 14EMTN
EUR 2.880%
Securities Marketvalue in
EUR
% of netassets*
Quantity Ccy Maturity
3,000,000 2,983,740 0.1719.01.27Gas Natural FenosaFinance BV 17EMTN
EUR 1.375%
3,000,000 3,001,350 0.1715.07.25KongsbergActuation SystemsBV 18
EUR 5.000%
3,500,000 3,380,860 0.1909.04.25Koninklijke KPN NVEUR 0.625%4,800,000 5,428,128 0.3004.10.21Koninklijke KPN NV
11 EMTNEUR 4.500%
8,000,000 8,345,680 0.4601.06.23Ren Finance BV 16EMTN
EUR 1.750%
3,500,000 3,465,875 0.1918.01.28Ren Finance BV 18EMTN
EUR 1.750%
6,000,000 6,284,280 0.3516.12.20Repsol InternationalFinance BV 15EMTN
EUR 2.130%
3,500,000 3,665,060 0.2031.12.99Repsol InternationalFinance BV 15 FRN
EUR 3.875%
9,000,000 13,084,020 0.7314.02.33RWE AG 03 EMTNEUR 5.750%8,400,000 8,842,092 0.4931.12.99Telefonica Europe
BV 14 FRNEUR 5.000%
1,000,000 1,033,760 0.0631.12.99Telefonica EuropeBV 14 FRN
EUR 4.200%
3,000,000 2,831,970 0.1631.12.99Telefonica EuropeBV 18 FRN
EUR 3.000%
5,000,000 4,956,600 0.2731.12.99VolkswagenInternationalFinance NV 17 FRN
EUR 2.700%
2,500,000 3,333,690 0.1831.01.34innogy Finance BV12 EMTN
GBP 4.750%
4,000,000 3,549,944 0.2014.01.21EDP Finance BV 14USD 5.250%2,000,000 1,661,332 0.0915.07.24EDP Finance BV 17USD 3.625%
8.55154,278,479Total - Netherlands
10,000,000 10,282,000 0.5730.04.25Brisa ConcessaoRodoviaria SA 15EMTN
EUR 1.875%Portugal
6,500,000 6,727,435 0.3710.05.27Brisa ConcessaoRodoviaria SA 17EMTN
EUR 2.375%
6,000,000 6,506,760 0.3616.09.75EDP - Energias dePortugal SA 15 FRN
EUR 5.380%
7,100,000 7,205,790 0.4019.09.23Galp Gas NaturalDistribuicao SA 16EMTN
EUR 1.375%
25,000,000 25,475,000 1.4217.10.28Portugal Obrigacoesdo Tesouro OT 18
EUR 2.125%
3,000,000 3,335,910 0.1813.12.21Rede FerroviariaNacional - REFEREPE 06
EUR 4.250%
3.3059,532,895Total - Portugal
10,000,000 9,016,006 0.4931.12.99Vontobel HoldingAG 18 FRN
CHF 2.625%Switzerland
8,000,000 8,816,400 0.4918.09.25Credit Suisse AG 13FRN
EUR 5.750%
8,000,000 8,892,080 0.4931.12.99UBS Group AG 15FRN
EUR 5.750%
6,000,000 6,263,760 0.3516.11.22UBS Group FundingJersey Ltd 15
EUR 1.750%
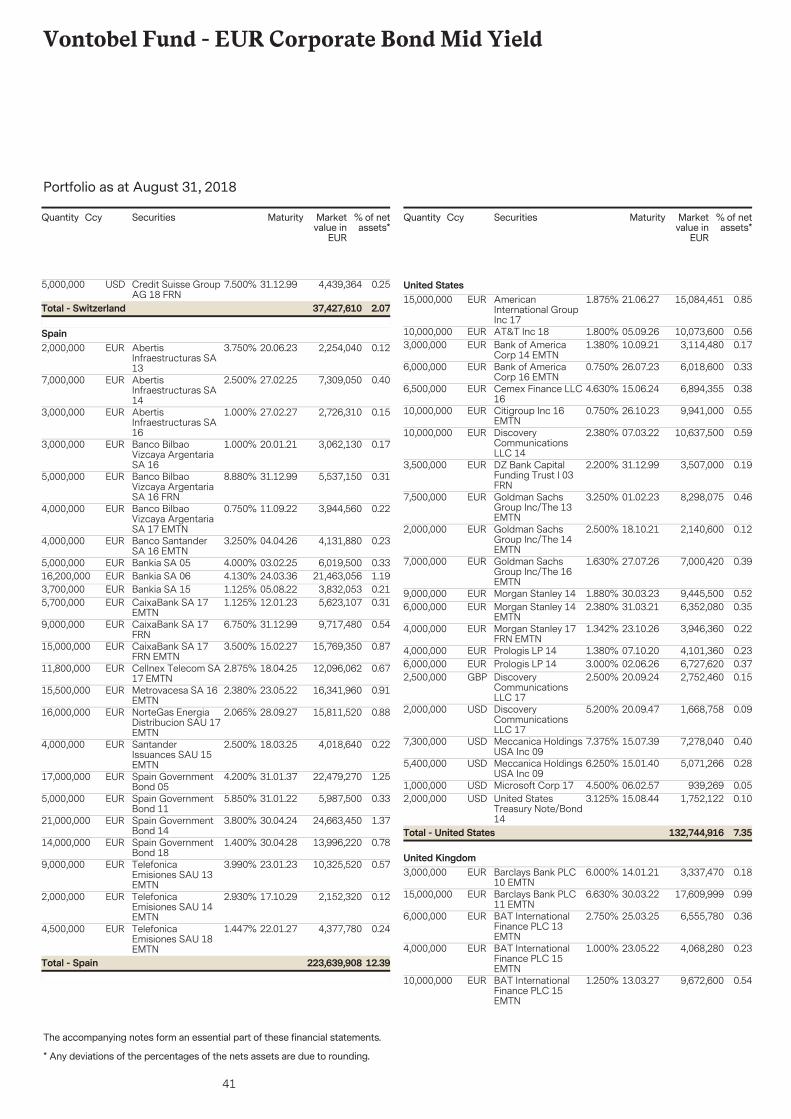
41
Vontobel Fund - EUR Corporate Bond Mid Yield
The accompanying notes form an essential part of these financial statements.
Portfolio as at August 31, 2018
* Any deviations of the percentages of the nets assets are due to rounding.
Securities Marketvalue in
EUR
% of netassets*
Quantity Ccy Maturity
5,000,000 4,439,364 0.2531.12.99Credit Suisse GroupAG 18 FRN
USD 7.500%
2.0737,427,610Total - Switzerland
2,000,000 2,254,040 0.1220.06.23AbertisInfraestructuras SA13
EUR 3.750%Spain
7,000,000 7,309,050 0.4027.02.25AbertisInfraestructuras SA14
EUR 2.500%
3,000,000 2,726,310 0.1527.02.27AbertisInfraestructuras SA16
EUR 1.000%
3,000,000 3,062,130 0.1720.01.21Banco BilbaoVizcaya ArgentariaSA 16
EUR 1.000%
5,000,000 5,537,150 0.3131.12.99Banco BilbaoVizcaya ArgentariaSA 16 FRN
EUR 8.880%
4,000,000 3,944,560 0.2211.09.22Banco BilbaoVizcaya ArgentariaSA 17 EMTN
EUR 0.750%
4,000,000 4,131,880 0.2304.04.26Banco SantanderSA 16 EMTN
EUR 3.250%
5,000,000 6,019,500 0.3303.02.25Bankia SA 05EUR 4.000%16,200,000 21,463,056 1.1924.03.36Bankia SA 06EUR 4.130%3,700,000 3,832,053 0.2105.08.22Bankia SA 15EUR 1.125%5,700,000 5,623,107 0.3112.01.23CaixaBank SA 17
EMTNEUR 1.125%
9,000,000 9,717,480 0.5431.12.99CaixaBank SA 17FRN
EUR 6.750%
15,000,000 15,769,350 0.8715.02.27CaixaBank SA 17FRN EMTN
EUR 3.500%
11,800,000 12,096,062 0.6718.04.25Cellnex Telecom SA17 EMTN
EUR 2.875%
15,500,000 16,341,960 0.9123.05.22Metrovacesa SA 16EMTN
EUR 2.380%
16,000,000 15,811,520 0.8828.09.27NorteGas EnergiaDistribucion SAU 17EMTN
EUR 2.065%
4,000,000 4,018,640 0.2218.03.25SantanderIssuances SAU 15EMTN
EUR 2.500%
17,000,000 22,479,270 1.2531.01.37Spain GovernmentBond 05
EUR 4.200%
5,000,000 5,987,500 0.3331.01.22Spain GovernmentBond 11
EUR 5.850%
21,000,000 24,663,450 1.3730.04.24Spain GovernmentBond 14
EUR 3.800%
14,000,000 13,996,220 0.7830.04.28Spain GovernmentBond 18
EUR 1.400%
9,000,000 10,325,520 0.5723.01.23TelefonicaEmisiones SAU 13EMTN
EUR 3.990%
2,000,000 2,152,320 0.1217.10.29TelefonicaEmisiones SAU 14EMTN
EUR 2.930%
4,500,000 4,377,780 0.2422.01.27TelefonicaEmisiones SAU 18EMTN
EUR 1.447%
12.39223,639,908Total - Spain
Securities Marketvalue in
EUR
% of netassets*
Quantity Ccy Maturity
15,000,000 15,084,451 0.8521.06.27AmericanInternational GroupInc 17
EUR 1.875%United States
10,000,000 10,073,600 0.5605.09.26AT&T Inc 18EUR 1.800%3,000,000 3,114,480 0.1710.09.21Bank of America
Corp 14 EMTNEUR 1.380%
6,000,000 6,018,600 0.3326.07.23Bank of AmericaCorp 16 EMTN
EUR 0.750%
6,500,000 6,894,355 0.3815.06.24Cemex Finance LLC16
EUR 4.630%
10,000,000 9,941,000 0.5526.10.23Citigroup Inc 16EMTN
EUR 0.750%
10,000,000 10,637,500 0.5907.03.22DiscoveryCommunicationsLLC 14
EUR 2.380%
3,500,000 3,507,000 0.1931.12.99DZ Bank CapitalFunding Trust I 03FRN
EUR 2.200%
7,500,000 8,298,075 0.4601.02.23Goldman SachsGroup Inc/The 13EMTN
EUR 3.250%
2,000,000 2,140,600 0.1218.10.21Goldman SachsGroup Inc/The 14EMTN
EUR 2.500%
7,000,000 7,000,420 0.3927.07.26Goldman SachsGroup Inc/The 16EMTN
EUR 1.630%
9,000,000 9,445,500 0.5230.03.23Morgan Stanley 14EUR 1.880%6,000,000 6,352,080 0.3531.03.21Morgan Stanley 14
EMTNEUR 2.380%
4,000,000 3,946,360 0.2223.10.26Morgan Stanley 17FRN EMTN
EUR 1.342%
4,000,000 4,101,360 0.2307.10.20Prologis LP 14EUR 1.380%6,000,000 6,727,620 0.3702.06.26Prologis LP 14EUR 3.000%2,500,000 2,752,460 0.1520.09.24Discovery
CommunicationsLLC 17
GBP 2.500%
2,000,000 1,668,758 0.0920.09.47DiscoveryCommunicationsLLC 17
USD 5.200%
7,300,000 7,278,040 0.4015.07.39Meccanica HoldingsUSA Inc 09
USD 7.375%
5,400,000 5,071,266 0.2815.01.40Meccanica HoldingsUSA Inc 09
USD 6.250%
1,000,000 939,269 0.0506.02.57Microsoft Corp 17USD 4.500%2,000,000 1,752,122 0.1015.08.44United States
Treasury Note/Bond14
USD 3.125%
7.35132,744,916Total - United States
3,000,000 3,337,470 0.1814.01.21Barclays Bank PLC10 EMTN
EUR 6.000%United Kingdom
15,000,000 17,609,999 0.9930.03.22Barclays Bank PLC11 EMTN
EUR 6.630%
6,000,000 6,555,780 0.3625.03.25BAT InternationalFinance PLC 13EMTN
EUR 2.750%
4,000,000 4,068,280 0.2323.05.22BAT InternationalFinance PLC 15EMTN
EUR 1.000%
10,000,000 9,672,600 0.5413.03.27BAT InternationalFinance PLC 15EMTN
EUR 1.250%
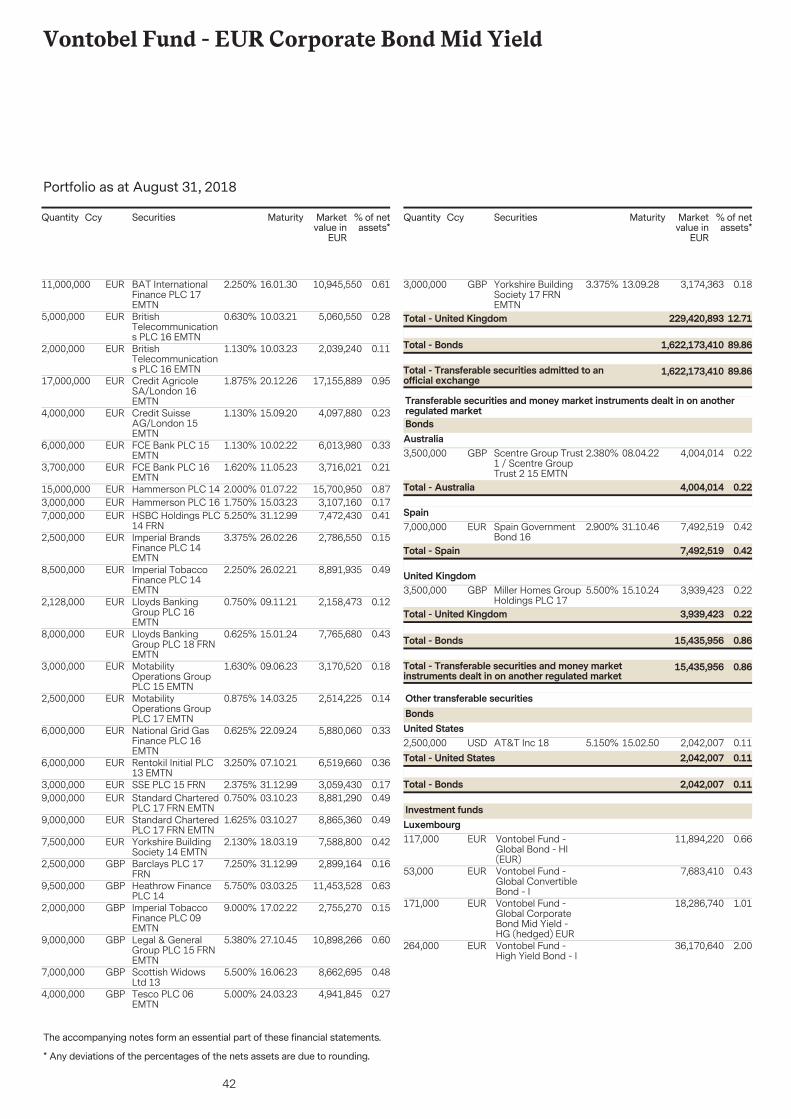
42
Vontobel Fund - EUR Corporate Bond Mid Yield
The accompanying notes form an essential part of these financial statements.
Portfolio as at August 31, 2018
* Any deviations of the percentages of the nets assets are due to rounding.
Securities Marketvalue in
EUR
% of netassets*
Quantity Ccy Maturity
11,000,000 10,945,550 0.6116.01.30BAT InternationalFinance PLC 17EMTN
EUR 2.250%
5,000,000 5,060,550 0.2810.03.21BritishTelecommunications PLC 16 EMTN
EUR 0.630%
2,000,000 2,039,240 0.1110.03.23BritishTelecommunications PLC 16 EMTN
EUR 1.130%
17,000,000 17,155,889 0.9520.12.26Credit AgricoleSA/London 16EMTN
EUR 1.875%
4,000,000 4,097,880 0.2315.09.20Credit SuisseAG/London 15EMTN
EUR 1.130%
6,000,000 6,013,980 0.3310.02.22FCE Bank PLC 15EMTN
EUR 1.130%
3,700,000 3,716,021 0.2111.05.23FCE Bank PLC 16EMTN
EUR 1.620%
15,000,000 15,700,950 0.8701.07.22Hammerson PLC 14EUR 2.000%3,000,000 3,107,160 0.1715.03.23Hammerson PLC 16EUR 1.750%7,000,000 7,472,430 0.4131.12.99HSBC Holdings PLC
14 FRNEUR 5.250%
2,500,000 2,786,550 0.1526.02.26Imperial BrandsFinance PLC 14EMTN
EUR 3.375%
8,500,000 8,891,935 0.4926.02.21Imperial TobaccoFinance PLC 14EMTN
EUR 2.250%
2,128,000 2,158,473 0.1209.11.21Lloyds BankingGroup PLC 16EMTN
EUR 0.750%
8,000,000 7,765,680 0.4315.01.24Lloyds BankingGroup PLC 18 FRNEMTN
EUR 0.625%
3,000,000 3,170,520 0.1809.06.23MotabilityOperations GroupPLC 15 EMTN
EUR 1.630%
2,500,000 2,514,225 0.1414.03.25MotabilityOperations GroupPLC 17 EMTN
EUR 0.875%
6,000,000 5,880,060 0.3322.09.24National Grid GasFinance PLC 16EMTN
EUR 0.625%
6,000,000 6,519,660 0.3607.10.21Rentokil Initial PLC13 EMTN
EUR 3.250%
3,000,000 3,059,430 0.1731.12.99SSE PLC 15 FRNEUR 2.375%9,000,000 8,881,290 0.4903.10.23Standard Chartered
PLC 17 FRN EMTNEUR 0.750%
9,000,000 8,865,360 0.4903.10.27Standard CharteredPLC 17 FRN EMTN
EUR 1.625%
7,500,000 7,588,800 0.4218.03.19Yorkshire BuildingSociety 14 EMTN
EUR 2.130%
2,500,000 2,899,164 0.1631.12.99Barclays PLC 17FRN
GBP 7.250%
9,500,000 11,453,528 0.6303.03.25Heathrow FinancePLC 14
GBP 5.750%
2,000,000 2,755,270 0.1517.02.22Imperial TobaccoFinance PLC 09EMTN
GBP 9.000%
9,000,000 10,898,266 0.6027.10.45Legal & GeneralGroup PLC 15 FRNEMTN
GBP 5.380%
7,000,000 8,662,695 0.4816.06.23Scottish WidowsLtd 13
GBP 5.500%
4,000,000 4,941,845 0.2724.03.23Tesco PLC 06EMTN
GBP 5.000%
Securities Marketvalue in
EUR
% of netassets*
Quantity Ccy Maturity
3,000,000 3,174,363 0.1813.09.28Yorkshire BuildingSociety 17 FRNEMTN
GBP 3.375%
89.861,622,173,410Total - Transferable securities admitted to anofficial exchange
89.861,622,173,410Total - Bonds
12.71229,420,893Total - United Kingdom
3,500,000 4,004,014 0.2208.04.22Scentre Group Trust1 / Scentre GroupTrust 2 15 EMTN
GBP 2.380%
Transferable securities and money market instruments dealt in on anotherregulated marketBondsAustralia
0.224,004,014Total - Australia
7,000,000 7,492,519 0.4231.10.46Spain GovernmentBond 16
EUR 2.900%Spain
0.427,492,519Total - Spain
3,500,000 3,939,423 0.2215.10.24Miller Homes GroupHoldings PLC 17
GBP 5.500%United Kingdom
0.8615,435,956Total - Transferable securities and money marketinstruments dealt in on another regulated market
0.8615,435,956Total - Bonds
0.223,939,423Total - United Kingdom
2,500,000 2,042,007 0.1115.02.50AT&T Inc 18USD 5.150%
Other transferable securitiesBondsUnited States
0.112,042,007Total - Bonds
0.112,042,007Total - United States
117,000 11,894,220 0.66Vontobel Fund -Global Bond - HI(EUR)
EUR
Investment fundsLuxembourg
53,000 7,683,410 0.43Vontobel Fund -Global ConvertibleBond - I
EUR
171,000 18,286,740 1.01Vontobel Fund -Global CorporateBond Mid Yield -HG (hedged) EUR
EUR
264,000 36,170,640 2.00Vontobel Fund -High Yield Bond - I
EUR
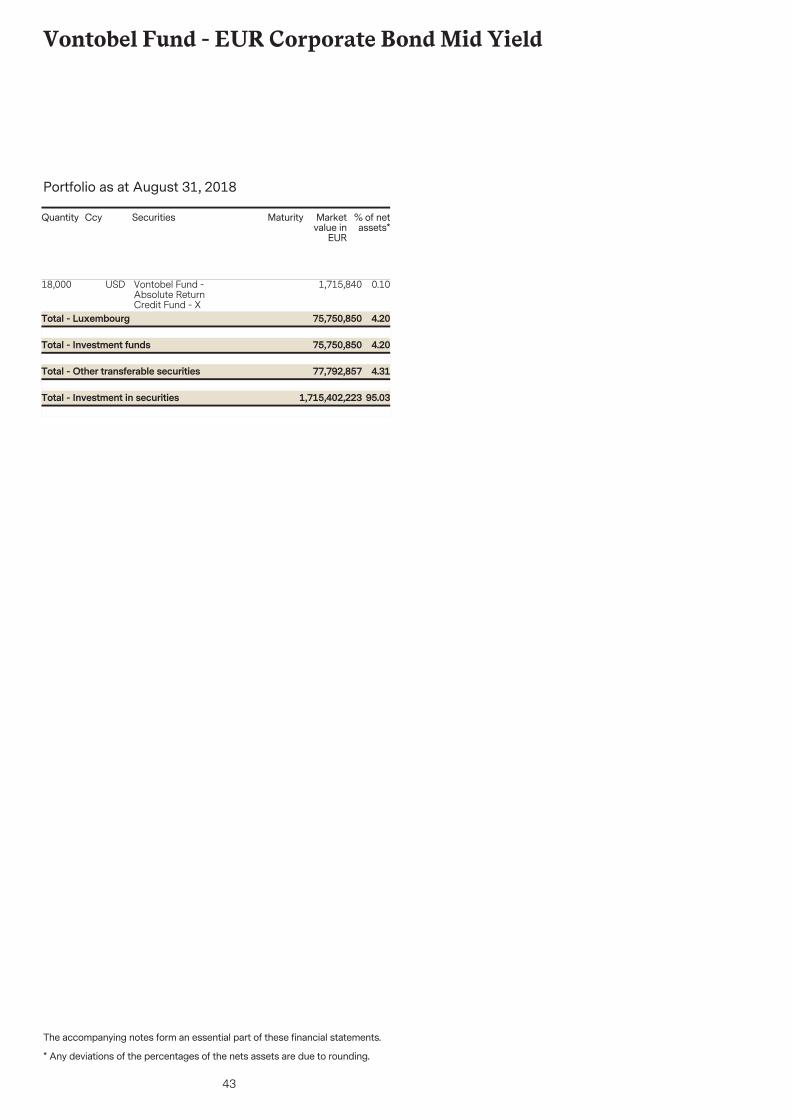
43
Vontobel Fund - EUR Corporate Bond Mid Yield
The accompanying notes form an essential part of these financial statements.
Portfolio as at August 31, 2018
* Any deviations of the percentages of the nets assets are due to rounding.
Securities Marketvalue in
EUR
% of netassets*
Quantity Ccy Maturity
18,000 1,715,840 0.10Vontobel Fund -Absolute ReturnCredit Fund - X
USD
4.3177,792,857Total - Other transferable securities
4.2075,750,850Total - Investment funds
4.2075,750,850Total - Luxembourg
95.031,715,402,223Total - Investment in securities
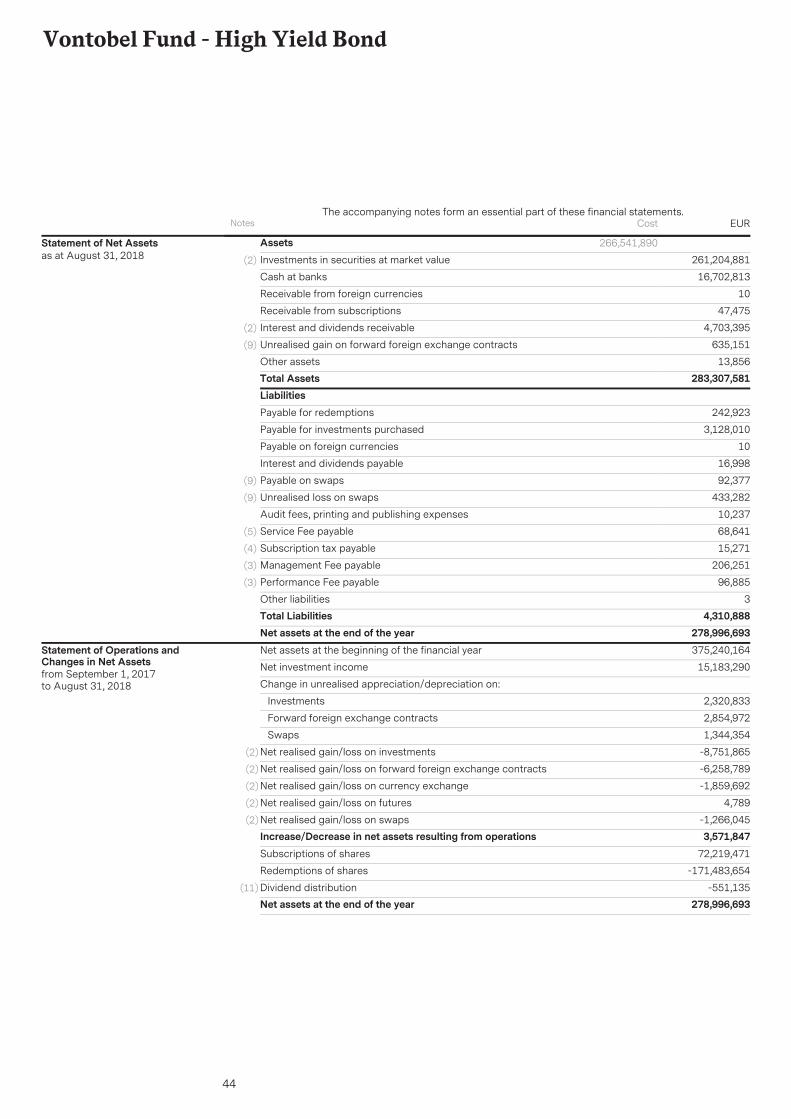
44
Vontobel Fund - High Yield Bond
AssetsInvestments in securities at market value 261,204,881(2)
16,702,813Cash at banks
10Receivable from foreign currencies
47,475Receivable from subscriptions
4,703,395Interest and dividends receivable(2)
635,151Unrealised gain on forward foreign exchange contracts(9)
13,856Other assetsTotal Assets 283,307,581
266,541,890Statement of Net Assetsas at August 31, 2018
LiabilitiesPayable for redemptions 242,923
Payable for investments purchased 3,128,010
Payable on foreign currencies 10
Interest and dividends payable 16,998
Payable on swaps 92,377(9)
Unrealised loss on swaps 433,282(9)
Audit fees, printing and publishing expenses 10,237
Service Fee payable 68,641(5)
Subscription tax payable 15,271(4)
Management Fee payable 206,251(3)
Performance Fee payable 96,885(3)
Other liabilities 3Total Liabilities 4,310,888Net assets at the end of the year 278,996,693Net assets at the beginning of the financial year 375,240,164
Net investment income 15,183,290
Change in unrealised appreciation/depreciation on:
Investments 2,320,833
Forward foreign exchange contracts 2,854,972
Swaps 1,344,354
Net realised gain/loss on investments -8,751,865(2)
Net realised gain/loss on forward foreign exchange contracts -6,258,789(2)
Net realised gain/loss on currency exchange -1,859,692(2)
Net realised gain/loss on futures 4,789(2)
Net realised gain/loss on swaps -1,266,045(2)
Increase/Decrease in net assets resulting from operations 3,571,847Subscriptions of shares 72,219,471
Redemptions of shares -171,483,654
Dividend distribution -551,135(11)
Net assets at the end of the year 278,996,693
Statement of Operations andChanges in Net Assetsfrom September 1, 2017to August 31, 2018
Notes EURThe accompanying notes form an essential part of these financial statements.
Cost
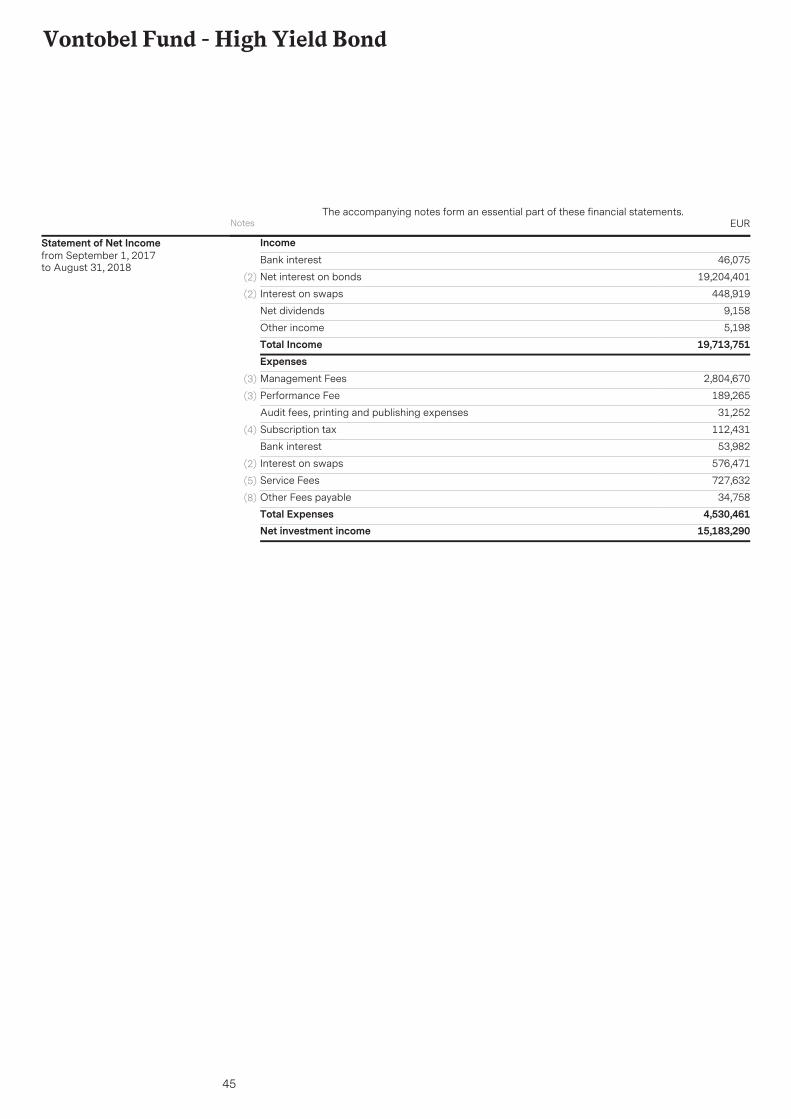
45
Vontobel Fund - High Yield Bond
IncomeBank interest 46,075
Net interest on bonds 19,204,401(2)
Interest on swaps 448,919(2)
Net dividends 9,158
Other income 5,198Total Income 19,713,751ExpensesManagement Fees 2,804,670(3)
Performance Fee 189,265(3)
Audit fees, printing and publishing expenses 31,252
Subscription tax 112,431(4)
Bank interest 53,982
Interest on swaps 576,471(2)
Service Fees 727,632(5)
Other Fees payable 34,758(8)
Total Expenses 4,530,461Net investment income 15,183,290
Statement of Net Incomefrom September 1, 2017to August 31, 2018
Notes EURThe accompanying notes form an essential part of these financial statements.
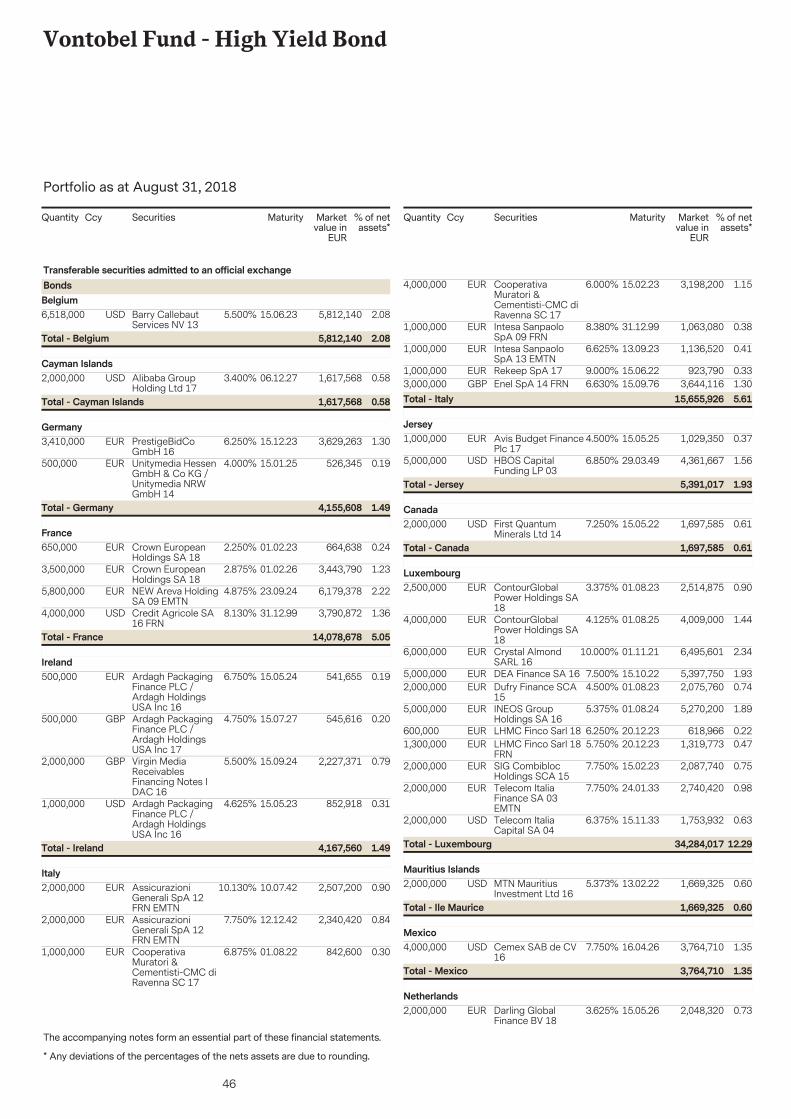
46
Vontobel Fund - High Yield Bond
The accompanying notes form an essential part of these financial statements.
Portfolio as at August 31, 2018
* Any deviations of the percentages of the nets assets are due to rounding.
Securities Marketvalue in
EUR
% of netassets*
Quantity Ccy Maturity
6,518,000 5,812,140 2.0815.06.23Barry CallebautServices NV 13
USD 5.500%
Transferable securities admitted to an official exchangeBondsBelgium
2.085,812,140Total - Belgium
2,000,000 1,617,568 0.5806.12.27Alibaba GroupHolding Ltd 17
USD 3.400%Cayman Islands
0.581,617,568Total - Cayman Islands
3,410,000 3,629,263 1.3015.12.23PrestigeBidCoGmbH 16
EUR 6.250%Germany
500,000 526,345 0.1915.01.25Unitymedia HessenGmbH & Co KG /Unitymedia NRWGmbH 14
EUR 4.000%
1.494,155,608Total - Germany
650,000 664,638 0.2401.02.23Crown EuropeanHoldings SA 18
EUR 2.250%France
3,500,000 3,443,790 1.2301.02.26Crown EuropeanHoldings SA 18
EUR 2.875%
5,800,000 6,179,378 2.2223.09.24NEW Areva HoldingSA 09 EMTN
EUR 4.875%
4,000,000 3,790,872 1.3631.12.99Credit Agricole SA16 FRN
USD 8.130%
5.0514,078,678Total - France
500,000 541,655 0.1915.05.24Ardagh PackagingFinance PLC /Ardagh HoldingsUSA Inc 16
EUR 6.750%Ireland
500,000 545,616 0.2015.07.27Ardagh PackagingFinance PLC /Ardagh HoldingsUSA Inc 17
GBP 4.750%
2,000,000 2,227,371 0.7915.09.24Virgin MediaReceivablesFinancing Notes IDAC 16
GBP 5.500%
1,000,000 852,918 0.3115.05.23Ardagh PackagingFinance PLC /Ardagh HoldingsUSA Inc 16
USD 4.625%
1.494,167,560Total - Ireland
2,000,000 2,507,200 0.9010.07.42AssicurazioniGenerali SpA 12FRN EMTN
EUR 10.130%Italy
2,000,000 2,340,420 0.8412.12.42AssicurazioniGenerali SpA 12FRN EMTN
EUR 7.750%
1,000,000 842,600 0.3001.08.22CooperativaMuratori &Cementisti-CMC diRavenna SC 17
EUR 6.875%
Securities Marketvalue in
EUR
% of netassets*
Quantity Ccy Maturity
4,000,000 3,198,200 1.1515.02.23CooperativaMuratori &Cementisti-CMC diRavenna SC 17
EUR 6.000%
1,000,000 1,063,080 0.3831.12.99Intesa SanpaoloSpA 09 FRN
EUR 8.380%
1,000,000 1,136,520 0.4113.09.23Intesa SanpaoloSpA 13 EMTN
EUR 6.625%
1,000,000 923,790 0.3315.06.22Rekeep SpA 17EUR 9.000%3,000,000 3,644,116 1.3015.09.76Enel SpA 14 FRNGBP 6.630%
5.6115,655,926Total - Italy
1,000,000 1,029,350 0.3715.05.25Avis Budget FinancePlc 17
EUR 4.500%Jersey
5,000,000 4,361,667 1.5629.03.49HBOS CapitalFunding LP 03
USD 6.850%
1.935,391,017Total - Jersey
2,000,000 1,697,585 0.6115.05.22First QuantumMinerals Ltd 14
USD 7.250%Canada
0.611,697,585Total - Canada
2,500,000 2,514,875 0.9001.08.23ContourGlobalPower Holdings SA18
EUR 3.375%Luxembourg
4,000,000 4,009,000 1.4401.08.25ContourGlobalPower Holdings SA18
EUR 4.125%
6,000,000 6,495,601 2.3401.11.21Crystal AlmondSARL 16
EUR 10.000%
5,000,000 5,397,750 1.9315.10.22DEA Finance SA 16EUR 7.500%2,000,000 2,075,760 0.7401.08.23Dufry Finance SCA
15EUR 4.500%
5,000,000 5,270,200 1.8901.08.24INEOS GroupHoldings SA 16
EUR 5.375%
600,000 618,966 0.2220.12.23LHMC Finco Sarl 18EUR 6.250%1,300,000 1,319,773 0.4720.12.23LHMC Finco Sarl 18
FRNEUR 5.750%
2,000,000 2,087,740 0.7515.02.23SIG CombiblocHoldings SCA 15
EUR 7.750%
2,000,000 2,740,420 0.9824.01.33Telecom ItaliaFinance SA 03EMTN
EUR 7.750%
2,000,000 1,753,932 0.6315.11.33Telecom ItaliaCapital SA 04
USD 6.375%
12.2934,284,017Total - Luxembourg
2,000,000 1,669,325 0.6013.02.22MTN MauritiusInvestment Ltd 16
USD 5.373%Mauritius Islands
0.601,669,325Total - Ile Maurice
4,000,000 3,764,710 1.3516.04.26Cemex SAB de CV16
USD 7.750%Mexico
1.353,764,710Total - Mexico
2,000,000 2,048,320 0.7315.05.26Darling GlobalFinance BV 18
EUR 3.625%Netherlands
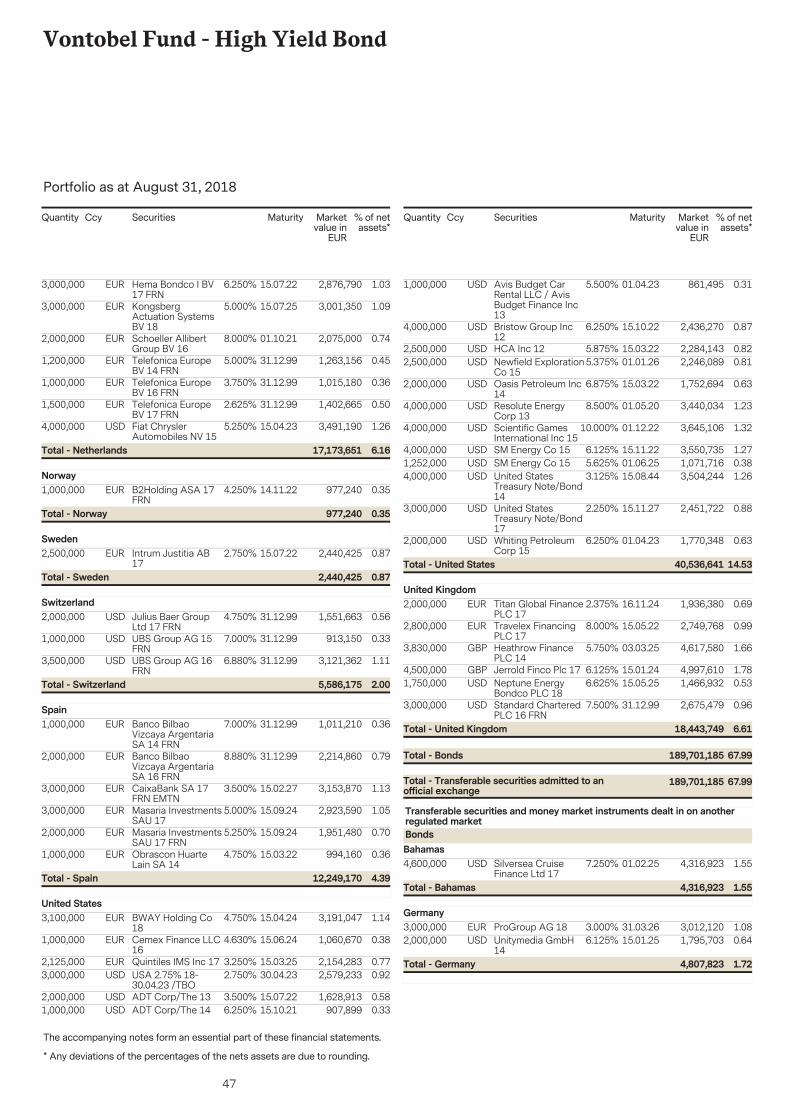
47
Vontobel Fund - High Yield Bond
The accompanying notes form an essential part of these financial statements.
Portfolio as at August 31, 2018
* Any deviations of the percentages of the nets assets are due to rounding.
Securities Marketvalue in
EUR
% of netassets*
Quantity Ccy Maturity
3,000,000 2,876,790 1.0315.07.22Hema Bondco I BV17 FRN
EUR 6.250%
3,000,000 3,001,350 1.0915.07.25KongsbergActuation SystemsBV 18
EUR 5.000%
2,000,000 2,075,000 0.7401.10.21Schoeller AllibertGroup BV 16
EUR 8.000%
1,200,000 1,263,156 0.4531.12.99Telefonica EuropeBV 14 FRN
EUR 5.000%
1,000,000 1,015,180 0.3631.12.99Telefonica EuropeBV 16 FRN
EUR 3.750%
1,500,000 1,402,665 0.5031.12.99Telefonica EuropeBV 17 FRN
EUR 2.625%
4,000,000 3,491,190 1.2615.04.23Fiat ChryslerAutomobiles NV 15
USD 5.250%
6.1617,173,651Total - Netherlands
1,000,000 977,240 0.3514.11.22B2Holding ASA 17FRN
EUR 4.250%Norway
0.35977,240Total - Norway
2,500,000 2,440,425 0.8715.07.22Intrum Justitia AB17
EUR 2.750%Sweden
0.872,440,425Total - Sweden
2,000,000 1,551,663 0.5631.12.99Julius Baer GroupLtd 17 FRN
USD 4.750%Switzerland
1,000,000 913,150 0.3331.12.99UBS Group AG 15FRN
USD 7.000%
3,500,000 3,121,362 1.1131.12.99UBS Group AG 16FRN
USD 6.880%
2.005,586,175Total - Switzerland
1,000,000 1,011,210 0.3631.12.99Banco BilbaoVizcaya ArgentariaSA 14 FRN
EUR 7.000%Spain
2,000,000 2,214,860 0.7931.12.99Banco BilbaoVizcaya ArgentariaSA 16 FRN
EUR 8.880%
3,000,000 3,153,870 1.1315.02.27CaixaBank SA 17FRN EMTN
EUR 3.500%
3,000,000 2,923,590 1.0515.09.24Masaria InvestmentsSAU 17
EUR 5.000%
2,000,000 1,951,480 0.7015.09.24Masaria InvestmentsSAU 17 FRN
EUR 5.250%
1,000,000 994,160 0.3615.03.22Obrascon HuarteLain SA 14
EUR 4.750%
4.3912,249,170Total - Spain
3,100,000 3,191,047 1.1415.04.24BWAY Holding Co18
EUR 4.750%United States
1,000,000 1,060,670 0.3815.06.24Cemex Finance LLC16
EUR 4.630%
2,125,000 2,154,283 0.7715.03.25Quintiles IMS Inc 17EUR 3.250%3,000,000 2,579,233 0.9230.04.23USA 2.75% 18-
30.04.23 /TBOUSD 2.750%
2,000,000 1,628,913 0.5815.07.22ADT Corp/The 13USD 3.500%1,000,000 907,899 0.3315.10.21ADT Corp/The 14USD 6.250%
Securities Marketvalue in
EUR
% of netassets*
Quantity Ccy Maturity
1,000,000 861,495 0.3101.04.23Avis Budget CarRental LLC / AvisBudget Finance Inc13
USD 5.500%
4,000,000 2,436,270 0.8715.10.22Bristow Group Inc12
USD 6.250%
2,500,000 2,284,143 0.8215.03.22HCA Inc 12USD 5.875%2,500,000 2,246,089 0.8101.01.26Newfield Exploration
Co 15USD 5.375%
2,000,000 1,752,694 0.6315.03.22Oasis Petroleum Inc14
USD 6.875%
4,000,000 3,440,034 1.2301.05.20Resolute EnergyCorp 13
USD 8.500%
4,000,000 3,645,106 1.3201.12.22Scientific GamesInternational Inc 15
USD 10.000%
4,000,000 3,550,735 1.2715.11.22SM Energy Co 15USD 6.125%1,252,000 1,071,716 0.3801.06.25SM Energy Co 15USD 5.625%4,000,000 3,504,244 1.2615.08.44United States
Treasury Note/Bond14
USD 3.125%
3,000,000 2,451,722 0.8815.11.27United StatesTreasury Note/Bond17
USD 2.250%
2,000,000 1,770,348 0.6301.04.23Whiting PetroleumCorp 15
USD 6.250%
14.5340,536,641Total - United States
2,000,000 1,936,380 0.6916.11.24Titan Global FinancePLC 17
EUR 2.375%United Kingdom
2,800,000 2,749,768 0.9915.05.22Travelex FinancingPLC 17
EUR 8.000%
3,830,000 4,617,580 1.6603.03.25Heathrow FinancePLC 14
GBP 5.750%
4,500,000 4,997,610 1.7815.01.24Jerrold Finco Plc 17GBP 6.125%1,750,000 1,466,932 0.5315.05.25Neptune Energy
Bondco PLC 18USD 6.625%
3,000,000 2,675,479 0.9631.12.99Standard CharteredPLC 16 FRN
USD 7.500%
67.99189,701,185Total - Transferable securities admitted to anofficial exchange
67.99189,701,185Total - Bonds
6.6118,443,749Total - United Kingdom
4,600,000 4,316,923 1.5501.02.25Silversea CruiseFinance Ltd 17
USD 7.250%
Transferable securities and money market instruments dealt in on anotherregulated marketBondsBahamas
1.554,316,923Total - Bahamas
3,000,000 3,012,120 1.0831.03.26ProGroup AG 18EUR 3.000%Germany
2,000,000 1,795,703 0.6415.01.25Unitymedia GmbH14
USD 6.125%
1.724,807,823Total - Germany
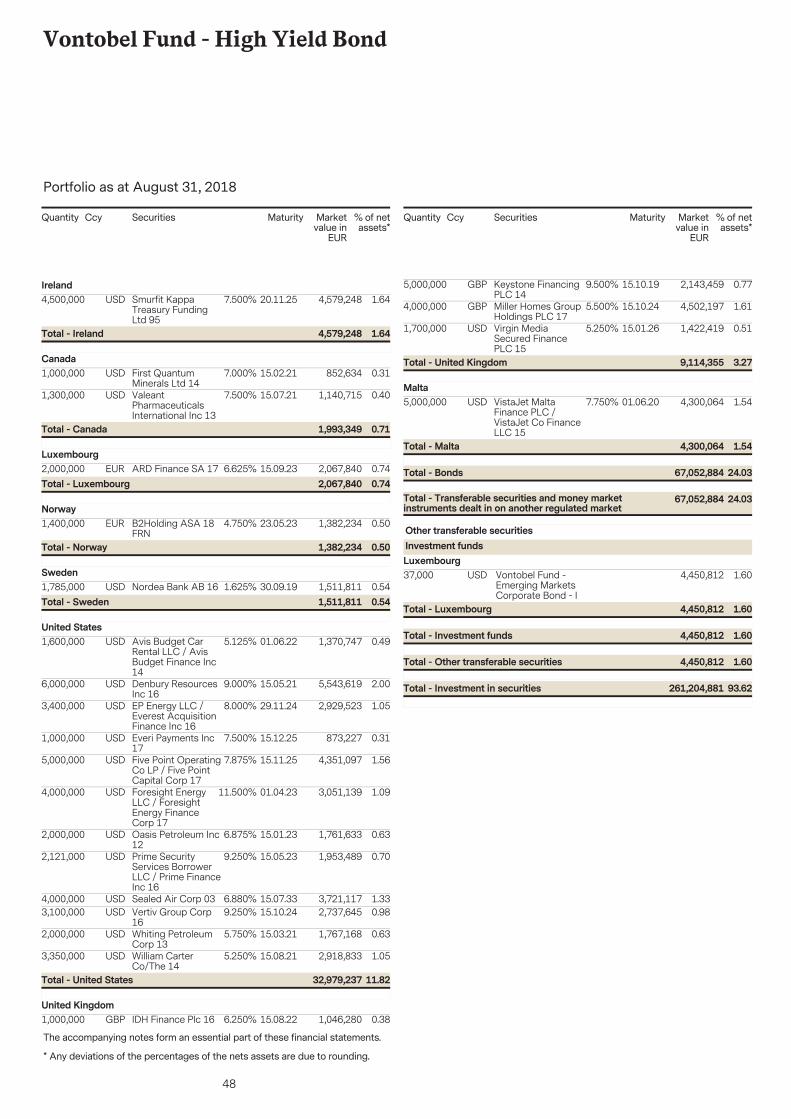
48
Vontobel Fund - High Yield Bond
The accompanying notes form an essential part of these financial statements.
Portfolio as at August 31, 2018
* Any deviations of the percentages of the nets assets are due to rounding.
Securities Marketvalue in
EUR
% of netassets*
Quantity Ccy Maturity
4,500,000 4,579,248 1.6420.11.25Smurfit KappaTreasury FundingLtd 95
USD 7.500%Ireland
1.644,579,248Total - Ireland
1,000,000 852,634 0.3115.02.21First QuantumMinerals Ltd 14
USD 7.000%Canada
1,300,000 1,140,715 0.4015.07.21ValeantPharmaceuticalsInternational Inc 13
USD 7.500%
0.711,993,349Total - Canada
2,000,000 2,067,840 0.7415.09.23ARD Finance SA 17EUR 6.625%Luxembourg
0.742,067,840Total - Luxembourg
1,400,000 1,382,234 0.5023.05.23B2Holding ASA 18FRN
EUR 4.750%Norway
0.501,382,234Total - Norway
1,785,000 1,511,811 0.5430.09.19Nordea Bank AB 16USD 1.625%Sweden
0.541,511,811Total - Sweden
1,600,000 1,370,747 0.4901.06.22Avis Budget CarRental LLC / AvisBudget Finance Inc14
USD 5.125%United States
6,000,000 5,543,619 2.0015.05.21Denbury ResourcesInc 16
USD 9.000%
3,400,000 2,929,523 1.0529.11.24EP Energy LLC /Everest AcquisitionFinance Inc 16
USD 8.000%
1,000,000 873,227 0.3115.12.25Everi Payments Inc17
USD 7.500%
5,000,000 4,351,097 1.5615.11.25Five Point OperatingCo LP / Five PointCapital Corp 17
USD 7.875%
4,000,000 3,051,139 1.0901.04.23Foresight EnergyLLC / ForesightEnergy FinanceCorp 17
USD 11.500%
2,000,000 1,761,633 0.6315.01.23Oasis Petroleum Inc12
USD 6.875%
2,121,000 1,953,489 0.7015.05.23Prime SecurityServices BorrowerLLC / Prime FinanceInc 16
USD 9.250%
4,000,000 3,721,117 1.3315.07.33Sealed Air Corp 03USD 6.880%3,100,000 2,737,645 0.9815.10.24Vertiv Group Corp
16USD 9.250%
2,000,000 1,767,168 0.6315.03.21Whiting PetroleumCorp 13
USD 5.750%
3,350,000 2,918,833 1.0515.08.21William CarterCo/The 14
USD 5.250%
11.8232,979,237Total - United States
1,000,000 1,046,280 0.3815.08.22IDH Finance Plc 16GBP 6.250%United Kingdom
Securities Marketvalue in
EUR
% of netassets*
Quantity Ccy Maturity
5,000,000 2,143,459 0.7715.10.19Keystone FinancingPLC 14
GBP 9.500%
4,000,000 4,502,197 1.6115.10.24Miller Homes GroupHoldings PLC 17
GBP 5.500%
1,700,000 1,422,419 0.5115.01.26Virgin MediaSecured FinancePLC 15
USD 5.250%
3.279,114,355Total - United Kingdom
5,000,000 4,300,064 1.5401.06.20VistaJet MaltaFinance PLC /VistaJet Co FinanceLLC 15
USD 7.750%Malta
24.0367,052,884Total - Transferable securities and money marketinstruments dealt in on another regulated market
24.0367,052,884Total - Bonds
1.544,300,064Total - Malta
37,000 4,450,812 1.60Vontobel Fund -Emerging MarketsCorporate Bond - I
USD
Other transferable securitiesInvestment fundsLuxembourg
1.604,450,812Total - Other transferable securities
1.604,450,812Total - Investment funds
1.604,450,812Total - Luxembourg
93.62261,204,881Total - Investment in securities
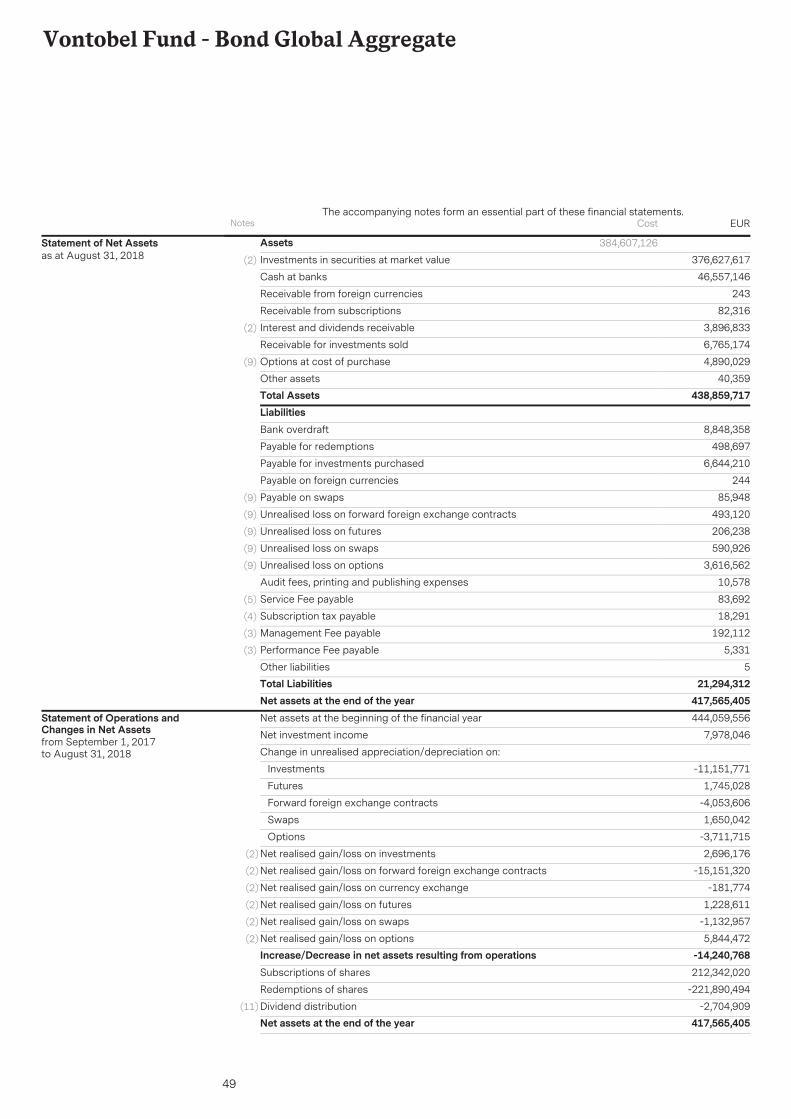
49
Vontobel Fund - Bond Global Aggregate
AssetsInvestments in securities at market value 376,627,617(2)
46,557,146Cash at banks
243Receivable from foreign currencies
82,316Receivable from subscriptions
3,896,833Interest and dividends receivable(2)
6,765,174Receivable for investments sold
4,890,029Options at cost of purchase(9)
40,359Other assetsTotal Assets 438,859,717
384,607,126Statement of Net Assetsas at August 31, 2018
LiabilitiesBank overdraft 8,848,358
Payable for redemptions 498,697
Payable for investments purchased 6,644,210
Payable on foreign currencies 244
Payable on swaps 85,948(9)
Unrealised loss on forward foreign exchange contracts 493,120(9)
Unrealised loss on futures 206,238(9)
Unrealised loss on swaps 590,926(9)
Unrealised loss on options 3,616,562(9)
Audit fees, printing and publishing expenses 10,578
Service Fee payable 83,692(5)
Subscription tax payable 18,291(4)
Management Fee payable 192,112(3)
Performance Fee payable 5,331(3)
Other liabilities 5Total Liabilities 21,294,312Net assets at the end of the year 417,565,405Net assets at the beginning of the financial year 444,059,556
Net investment income 7,978,046
Change in unrealised appreciation/depreciation on:
Investments -11,151,771
Futures 1,745,028
Forward foreign exchange contracts -4,053,606
Swaps 1,650,042
Options -3,711,715
Net realised gain/loss on investments 2,696,176(2)
Net realised gain/loss on forward foreign exchange contracts -15,151,320(2)
Net realised gain/loss on currency exchange -181,774(2)
Net realised gain/loss on futures 1,228,611(2)
Net realised gain/loss on swaps -1,132,957(2)
Net realised gain/loss on options 5,844,472(2)
Increase/Decrease in net assets resulting from operations -14,240,768Subscriptions of shares 212,342,020
Redemptions of shares -221,890,494
Dividend distribution -2,704,909(11)
Net assets at the end of the year 417,565,405
Statement of Operations andChanges in Net Assetsfrom September 1, 2017to August 31, 2018
Notes EURThe accompanying notes form an essential part of these financial statements.
Cost
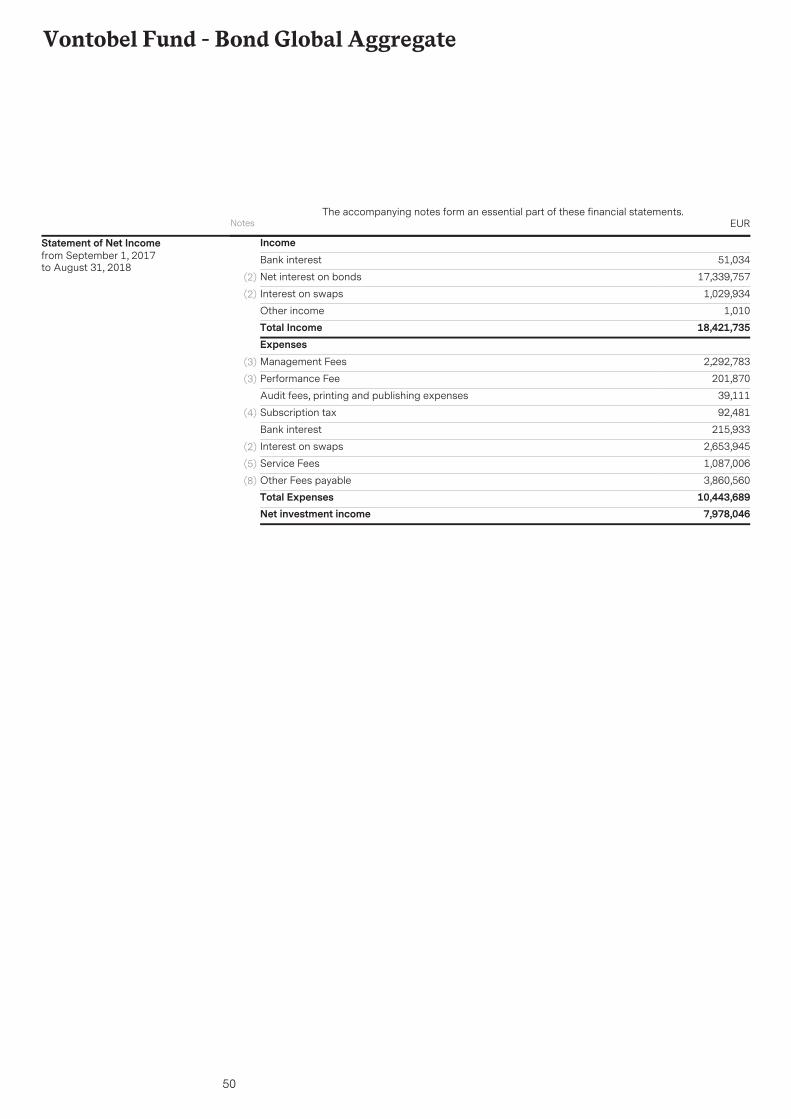
50
Vontobel Fund - Bond Global Aggregate
IncomeBank interest 51,034
Net interest on bonds 17,339,757(2)
Interest on swaps 1,029,934(2)
Other income 1,010Total Income 18,421,735ExpensesManagement Fees 2,292,783(3)
Performance Fee 201,870(3)
Audit fees, printing and publishing expenses 39,111
Subscription tax 92,481(4)
Bank interest 215,933
Interest on swaps 2,653,945(2)
Service Fees 1,087,006(5)
Other Fees payable 3,860,560(8)
Total Expenses 10,443,689Net investment income 7,978,046
Statement of Net Incomefrom September 1, 2017to August 31, 2018
Notes EURThe accompanying notes form an essential part of these financial statements.
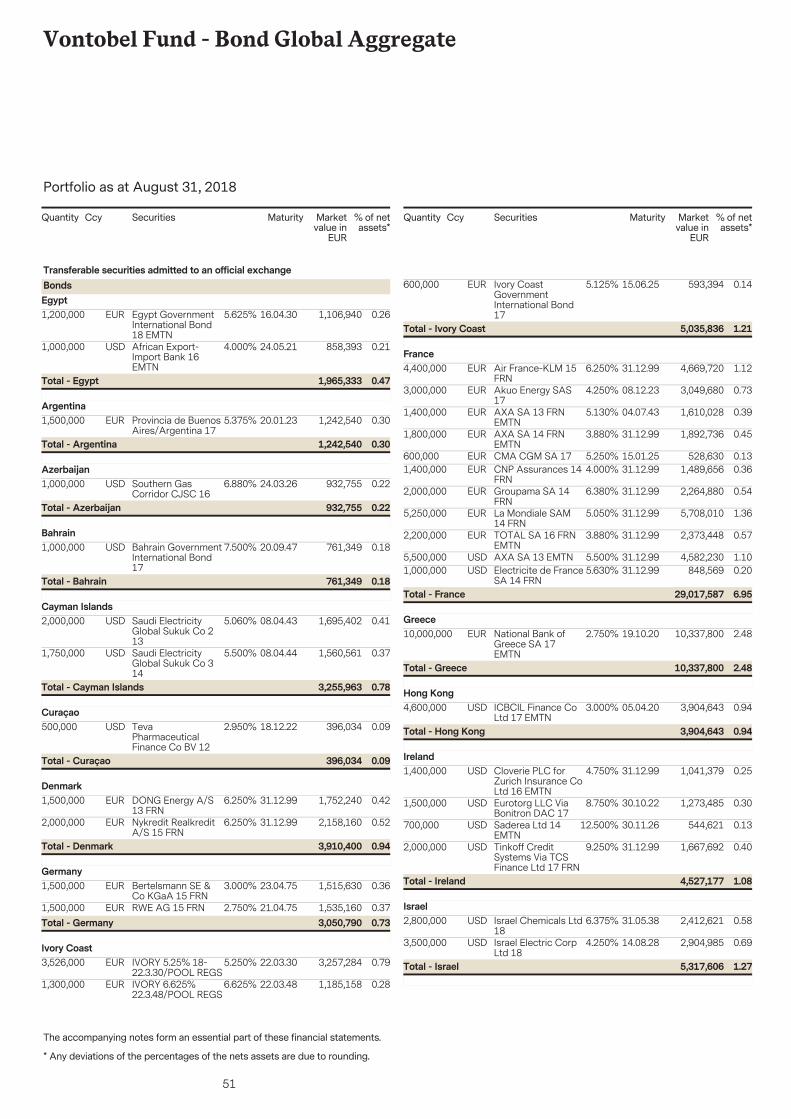
51
Vontobel Fund - Bond Global Aggregate
The accompanying notes form an essential part of these financial statements.
Portfolio as at August 31, 2018
* Any deviations of the percentages of the nets assets are due to rounding.
Securities Marketvalue in
EUR
% of netassets*
Quantity Ccy Maturity
1,200,000 1,106,940 0.2616.04.30Egypt GovernmentInternational Bond18 EMTN
EUR 5.625%
Transferable securities admitted to an official exchangeBondsEgypt
1,000,000 858,393 0.2124.05.21African Export-Import Bank 16EMTN
USD 4.000%
0.471,965,333Total - Egypt
1,500,000 1,242,540 0.3020.01.23Provincia de BuenosAires/Argentina 17
EUR 5.375%Argentina
0.301,242,540Total - Argentina
1,000,000 932,755 0.2224.03.26Southern GasCorridor CJSC 16
USD 6.880%Azerbaijan
0.22932,755Total - Azerbaijan
1,000,000 761,349 0.1820.09.47Bahrain GovernmentInternational Bond17
USD 7.500%Bahrain
0.18761,349Total - Bahrain
2,000,000 1,695,402 0.4108.04.43Saudi ElectricityGlobal Sukuk Co 213
USD 5.060%Cayman Islands
1,750,000 1,560,561 0.3708.04.44Saudi ElectricityGlobal Sukuk Co 314
USD 5.500%
0.783,255,963Total - Cayman Islands
500,000 396,034 0.0918.12.22TevaPharmaceuticalFinance Co BV 12
USD 2.950%Curaçao
0.09396,034Total - Curaçao
1,500,000 1,752,240 0.4231.12.99DONG Energy A/S13 FRN
EUR 6.250%Denmark
2,000,000 2,158,160 0.5231.12.99Nykredit RealkreditA/S 15 FRN
EUR 6.250%
0.943,910,400Total - Denmark
1,500,000 1,515,630 0.3623.04.75Bertelsmann SE &Co KGaA 15 FRN
EUR 3.000%Germany
1,500,000 1,535,160 0.3721.04.75RWE AG 15 FRNEUR 2.750%0.733,050,790Total - Germany
3,526,000 3,257,284 0.7922.03.30IVORY 5.25% 18-22.3.30/POOL REGS
EUR 5.250%Ivory Coast
1,300,000 1,185,158 0.2822.03.48IVORY 6.625%22.3.48/POOL REGS
EUR 6.625%
Securities Marketvalue in
EUR
% of netassets*
Quantity Ccy Maturity
600,000 593,394 0.1415.06.25Ivory CoastGovernmentInternational Bond17
EUR 5.125%
1.215,035,836Total - Ivory Coast
4,400,000 4,669,720 1.1231.12.99Air France-KLM 15FRN
EUR 6.250%France
3,000,000 3,049,680 0.7308.12.23Akuo Energy SAS17
EUR 4.250%
1,400,000 1,610,028 0.3904.07.43AXA SA 13 FRNEMTN
EUR 5.130%
1,800,000 1,892,736 0.4531.12.99AXA SA 14 FRNEMTN
EUR 3.880%
600,000 528,630 0.1315.01.25CMA CGM SA 17EUR 5.250%1,400,000 1,489,656 0.3631.12.99CNP Assurances 14
FRNEUR 4.000%
2,000,000 2,264,880 0.5431.12.99Groupama SA 14FRN
EUR 6.380%
5,250,000 5,708,010 1.3631.12.99La Mondiale SAM14 FRN
EUR 5.050%
2,200,000 2,373,448 0.5731.12.99TOTAL SA 16 FRNEMTN
EUR 3.880%
5,500,000 4,582,230 1.1031.12.99AXA SA 13 EMTNUSD 5.500%1,000,000 848,569 0.2031.12.99Electricite de France
SA 14 FRNUSD 5.630%
6.9529,017,587Total - France
10,000,000 10,337,800 2.4819.10.20National Bank ofGreece SA 17EMTN
EUR 2.750%Greece
2.4810,337,800Total - Greece
4,600,000 3,904,643 0.9405.04.20ICBCIL Finance CoLtd 17 EMTN
USD 3.000%Hong Kong
0.943,904,643Total - Hong Kong
1,400,000 1,041,379 0.2531.12.99Cloverie PLC forZurich Insurance CoLtd 16 EMTN
USD 4.750%Ireland
1,500,000 1,273,485 0.3030.10.22Eurotorg LLC ViaBonitron DAC 17
USD 8.750%
700,000 544,621 0.1330.11.26Saderea Ltd 14EMTN
USD 12.500%
2,000,000 1,667,692 0.4031.12.99Tinkoff CreditSystems Via TCSFinance Ltd 17 FRN
USD 9.250%
1.084,527,177Total - Ireland
2,800,000 2,412,621 0.5831.05.38Israel Chemicals Ltd18
USD 6.375%Israel
3,500,000 2,904,985 0.6914.08.28Israel Electric CorpLtd 18
USD 4.250%
1.275,317,606Total - Israel
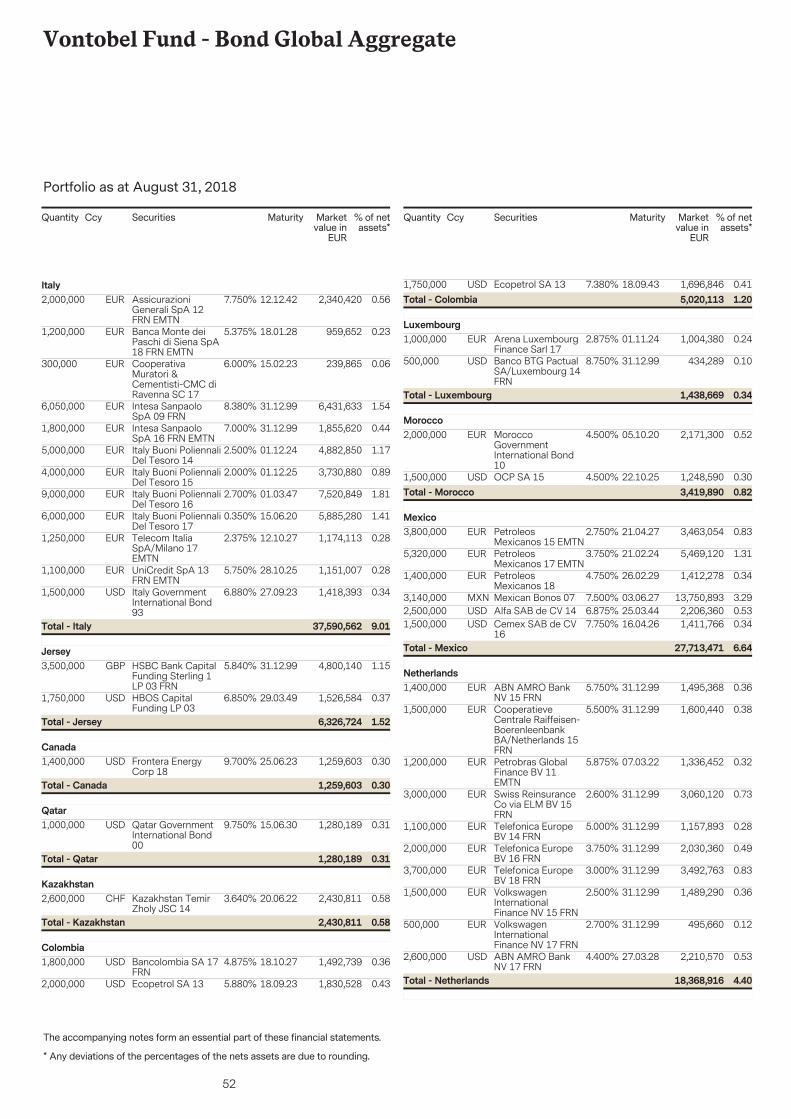
52
Vontobel Fund - Bond Global Aggregate
The accompanying notes form an essential part of these financial statements.
Portfolio as at August 31, 2018
* Any deviations of the percentages of the nets assets are due to rounding.
Securities Marketvalue in
EUR
% of netassets*
Quantity Ccy Maturity
2,000,000 2,340,420 0.5612.12.42AssicurazioniGenerali SpA 12FRN EMTN
EUR 7.750%Italy
1,200,000 959,652 0.2318.01.28Banca Monte deiPaschi di Siena SpA18 FRN EMTN
EUR 5.375%
300,000 239,865 0.0615.02.23CooperativaMuratori &Cementisti-CMC diRavenna SC 17
EUR 6.000%
6,050,000 6,431,633 1.5431.12.99Intesa SanpaoloSpA 09 FRN
EUR 8.380%
1,800,000 1,855,620 0.4431.12.99Intesa SanpaoloSpA 16 FRN EMTN
EUR 7.000%
5,000,000 4,882,850 1.1701.12.24Italy Buoni PoliennaliDel Tesoro 14
EUR 2.500%
4,000,000 3,730,880 0.8901.12.25Italy Buoni PoliennaliDel Tesoro 15
EUR 2.000%
9,000,000 7,520,849 1.8101.03.47Italy Buoni PoliennaliDel Tesoro 16
EUR 2.700%
6,000,000 5,885,280 1.4115.06.20Italy Buoni PoliennaliDel Tesoro 17
EUR 0.350%
1,250,000 1,174,113 0.2812.10.27Telecom ItaliaSpA/Milano 17EMTN
EUR 2.375%
1,100,000 1,151,007 0.2828.10.25UniCredit SpA 13FRN EMTN
EUR 5.750%
1,500,000 1,418,393 0.3427.09.23Italy GovernmentInternational Bond93
USD 6.880%
9.0137,590,562Total - Italy
3,500,000 4,800,140 1.1531.12.99HSBC Bank CapitalFunding Sterling 1LP 03 FRN
GBP 5.840%Jersey
1,750,000 1,526,584 0.3729.03.49HBOS CapitalFunding LP 03
USD 6.850%
1.526,326,724Total - Jersey
1,400,000 1,259,603 0.3025.06.23Frontera EnergyCorp 18
USD 9.700%Canada
0.301,259,603Total - Canada
1,000,000 1,280,189 0.3115.06.30Qatar GovernmentInternational Bond00
USD 9.750%Qatar
0.311,280,189Total - Qatar
2,600,000 2,430,811 0.5820.06.22Kazakhstan TemirZholy JSC 14
CHF 3.640%Kazakhstan
0.582,430,811Total - Kazakhstan
1,800,000 1,492,739 0.3618.10.27Bancolombia SA 17FRN
USD 4.875%Colombia
2,000,000 1,830,528 0.4318.09.23Ecopetrol SA 13USD 5.880%
Securities Marketvalue in
EUR
% of netassets*
Quantity Ccy Maturity
1,750,000 1,696,846 0.4118.09.43Ecopetrol SA 13USD 7.380%1.205,020,113Total - Colombia
1,000,000 1,004,380 0.2401.11.24Arena LuxembourgFinance Sarl 17
EUR 2.875%Luxembourg
500,000 434,289 0.1031.12.99Banco BTG PactualSA/Luxembourg 14FRN
USD 8.750%
0.341,438,669Total - Luxembourg
2,000,000 2,171,300 0.5205.10.20MoroccoGovernmentInternational Bond10
EUR 4.500%Morocco
1,500,000 1,248,590 0.3022.10.25OCP SA 15USD 4.500%0.823,419,890Total - Morocco
3,800,000 3,463,054 0.8321.04.27PetroleosMexicanos 15 EMTN
EUR 2.750%Mexico
5,320,000 5,469,120 1.3121.02.24PetroleosMexicanos 17 EMTN
EUR 3.750%
1,400,000 1,412,278 0.3426.02.29PetroleosMexicanos 18
EUR 4.750%
3,140,000 13,750,893 3.2903.06.27Mexican Bonos 07MXN 7.500%2,500,000 2,206,360 0.5325.03.44Alfa SAB de CV 14USD 6.875%1,500,000 1,411,766 0.3416.04.26Cemex SAB de CV
16USD 7.750%
6.6427,713,471Total - Mexico
1,400,000 1,495,368 0.3631.12.99ABN AMRO BankNV 15 FRN
EUR 5.750%Netherlands
1,500,000 1,600,440 0.3831.12.99CooperatieveCentrale Raiffeisen-BoerenleenbankBA/Netherlands 15FRN
EUR 5.500%
1,200,000 1,336,452 0.3207.03.22Petrobras GlobalFinance BV 11EMTN
EUR 5.875%
3,000,000 3,060,120 0.7331.12.99Swiss ReinsuranceCo via ELM BV 15FRN
EUR 2.600%
1,100,000 1,157,893 0.2831.12.99Telefonica EuropeBV 14 FRN
EUR 5.000%
2,000,000 2,030,360 0.4931.12.99Telefonica EuropeBV 16 FRN
EUR 3.750%
3,700,000 3,492,763 0.8331.12.99Telefonica EuropeBV 18 FRN
EUR 3.000%
1,500,000 1,489,290 0.3631.12.99VolkswagenInternationalFinance NV 15 FRN
EUR 2.500%
500,000 495,660 0.1231.12.99VolkswagenInternationalFinance NV 17 FRN
EUR 2.700%
2,600,000 2,210,570 0.5327.03.28ABN AMRO BankNV 17 FRN
USD 4.400%
4.4018,368,916Total - Netherlands
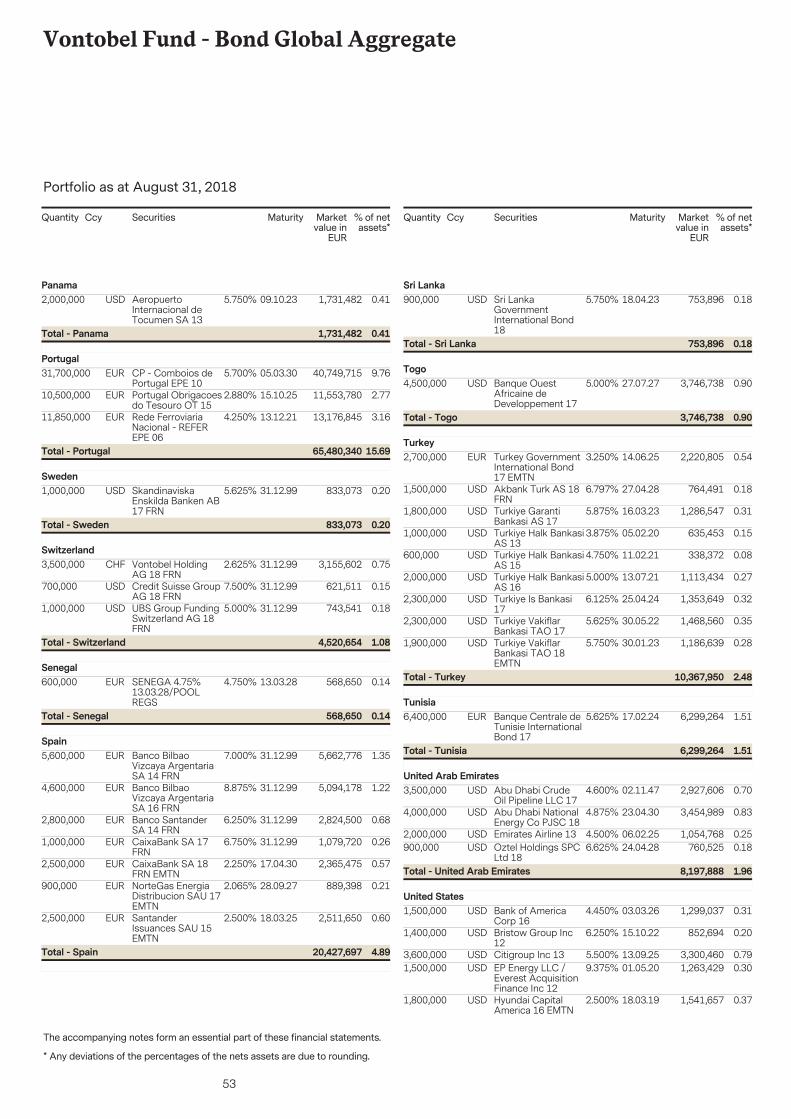
53
Vontobel Fund - Bond Global Aggregate
The accompanying notes form an essential part of these financial statements.
Portfolio as at August 31, 2018
* Any deviations of the percentages of the nets assets are due to rounding.
Securities Marketvalue in
EUR
% of netassets*
Quantity Ccy Maturity
2,000,000 1,731,482 0.4109.10.23AeropuertoInternacional deTocumen SA 13
USD 5.750%Panama
0.411,731,482Total - Panama
31,700,000 40,749,715 9.7605.03.30CP - Comboios dePortugal EPE 10
EUR 5.700%Portugal
10,500,000 11,553,780 2.7715.10.25Portugal Obrigacoesdo Tesouro OT 15
EUR 2.880%
11,850,000 13,176,845 3.1613.12.21Rede FerroviariaNacional - REFEREPE 06
EUR 4.250%
15.6965,480,340Total - Portugal
1,000,000 833,073 0.2031.12.99SkandinaviskaEnskilda Banken AB17 FRN
USD 5.625%Sweden
0.20833,073Total - Sweden
3,500,000 3,155,602 0.7531.12.99Vontobel HoldingAG 18 FRN
CHF 2.625%Switzerland
700,000 621,511 0.1531.12.99Credit Suisse GroupAG 18 FRN
USD 7.500%
1,000,000 743,541 0.1831.12.99UBS Group FundingSwitzerland AG 18FRN
USD 5.000%
1.084,520,654Total - Switzerland
600,000 568,650 0.1413.03.28SENEGA 4.75%13.03.28/POOLREGS
EUR 4.750%Senegal
0.14568,650Total - Senegal
5,600,000 5,662,776 1.3531.12.99Banco BilbaoVizcaya ArgentariaSA 14 FRN
EUR 7.000%Spain
4,600,000 5,094,178 1.2231.12.99Banco BilbaoVizcaya ArgentariaSA 16 FRN
EUR 8.875%
2,800,000 2,824,500 0.6831.12.99Banco SantanderSA 14 FRN
EUR 6.250%
1,000,000 1,079,720 0.2631.12.99CaixaBank SA 17FRN
EUR 6.750%
2,500,000 2,365,475 0.5717.04.30CaixaBank SA 18FRN EMTN
EUR 2.250%
900,000 889,398 0.2128.09.27NorteGas EnergiaDistribucion SAU 17EMTN
EUR 2.065%
2,500,000 2,511,650 0.6018.03.25SantanderIssuances SAU 15EMTN
EUR 2.500%
4.8920,427,697Total - Spain
Securities Marketvalue in
EUR
% of netassets*
Quantity Ccy Maturity
900,000 753,896 0.1818.04.23Sri LankaGovernmentInternational Bond18
USD 5.750%Sri Lanka
0.18753,896Total - Sri Lanka
4,500,000 3,746,738 0.9027.07.27Banque OuestAfricaine deDeveloppement 17
USD 5.000%Togo
0.903,746,738Total - Togo
2,700,000 2,220,805 0.5414.06.25Turkey GovernmentInternational Bond17 EMTN
EUR 3.250%Turkey
1,500,000 764,491 0.1827.04.28Akbank Turk AS 18FRN
USD 6.797%
1,800,000 1,286,547 0.3116.03.23Turkiye GarantiBankasi AS 17
USD 5.875%
1,000,000 635,453 0.1505.02.20Turkiye Halk BankasiAS 13
USD 3.875%
600,000 338,372 0.0811.02.21Turkiye Halk BankasiAS 15
USD 4.750%
2,000,000 1,113,434 0.2713.07.21Turkiye Halk BankasiAS 16
USD 5.000%
2,300,000 1,353,649 0.3225.04.24Turkiye Is Bankasi17
USD 6.125%
2,300,000 1,468,560 0.3530.05.22Turkiye VakiflarBankasi TAO 17
USD 5.625%
1,900,000 1,186,639 0.2830.01.23Turkiye VakiflarBankasi TAO 18EMTN
USD 5.750%
2.4810,367,950Total - Turkey
6,400,000 6,299,264 1.5117.02.24Banque Centrale deTunisie InternationalBond 17
EUR 5.625%Tunisia
1.516,299,264Total - Tunisia
3,500,000 2,927,606 0.7002.11.47Abu Dhabi CrudeOil Pipeline LLC 17
USD 4.600%United Arab Emirates
4,000,000 3,454,989 0.8323.04.30Abu Dhabi NationalEnergy Co PJSC 18
USD 4.875%
2,000,000 1,054,768 0.2506.02.25Emirates Airline 13USD 4.500%900,000 760,525 0.1824.04.28Oztel Holdings SPC
Ltd 18USD 6.625%
1.968,197,888Total - United Arab Emirates
1,500,000 1,299,037 0.3103.03.26Bank of AmericaCorp 16
USD 4.450%United States
1,400,000 852,694 0.2015.10.22Bristow Group Inc12
USD 6.250%
3,600,000 3,300,460 0.7913.09.25Citigroup Inc 13USD 5.500%1,500,000 1,263,429 0.3001.05.20EP Energy LLC /
Everest AcquisitionFinance Inc 12
USD 9.375%
1,800,000 1,541,657 0.3718.03.19Hyundai CapitalAmerica 16 EMTN
USD 2.500%
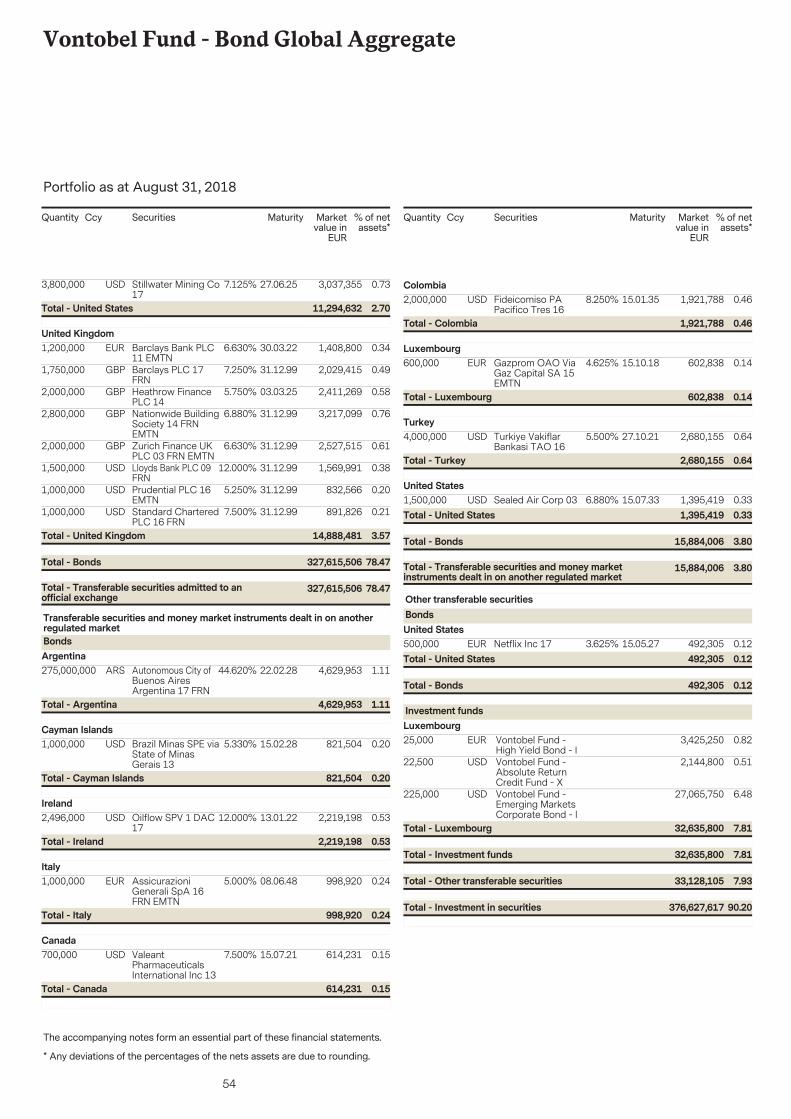
54
Vontobel Fund - Bond Global Aggregate
The accompanying notes form an essential part of these financial statements.
Portfolio as at August 31, 2018
* Any deviations of the percentages of the nets assets are due to rounding.
Securities Marketvalue in
EUR
% of netassets*
Quantity Ccy Maturity
3,800,000 3,037,355 0.7327.06.25Stillwater Mining Co17
USD 7.125%
2.7011,294,632Total - United States
1,200,000 1,408,800 0.3430.03.22Barclays Bank PLC11 EMTN
EUR 6.630%United Kingdom
1,750,000 2,029,415 0.4931.12.99Barclays PLC 17FRN
GBP 7.250%
2,000,000 2,411,269 0.5803.03.25Heathrow FinancePLC 14
GBP 5.750%
2,800,000 3,217,099 0.7631.12.99Nationwide BuildingSociety 14 FRNEMTN
GBP 6.880%
2,000,000 2,527,515 0.6131.12.99Zurich Finance UKPLC 03 FRN EMTN
GBP 6.630%
1,500,000 1,569,991 0.3831.12.99Lloyds Bank PLC 09FRN
USD 12.000%
1,000,000 832,566 0.2031.12.99Prudential PLC 16EMTN
USD 5.250%
1,000,000 891,826 0.2131.12.99Standard CharteredPLC 16 FRN
USD 7.500%
78.47327,615,506Total - Transferable securities admitted to anofficial exchange
78.47327,615,506Total - Bonds
3.5714,888,481Total - United Kingdom
275,000,000 4,629,953 1.1122.02.28Autonomous City ofBuenos AiresArgentina 17 FRN
ARS 44.620%
Transferable securities and money market instruments dealt in on anotherregulated marketBondsArgentina
1.114,629,953Total - Argentina
1,000,000 821,504 0.2015.02.28Brazil Minas SPE viaState of MinasGerais 13
USD 5.330%Cayman Islands
0.20821,504Total - Cayman Islands
2,496,000 2,219,198 0.5313.01.22Oilflow SPV 1 DAC17
USD 12.000%Ireland
0.532,219,198Total - Ireland
1,000,000 998,920 0.2408.06.48AssicurazioniGenerali SpA 16FRN EMTN
EUR 5.000%Italy
0.24998,920Total - Italy
700,000 614,231 0.1515.07.21ValeantPharmaceuticalsInternational Inc 13
USD 7.500%Canada
0.15614,231Total - Canada
Securities Marketvalue in
EUR
% of netassets*
Quantity Ccy Maturity
2,000,000 1,921,788 0.4615.01.35Fideicomiso PAPacifico Tres 16
USD 8.250%Colombia
0.461,921,788Total - Colombia
600,000 602,838 0.1415.10.18Gazprom OAO ViaGaz Capital SA 15EMTN
EUR 4.625%Luxembourg
0.14602,838Total - Luxembourg
4,000,000 2,680,155 0.6427.10.21Turkiye VakiflarBankasi TAO 16
USD 5.500%Turkey
0.642,680,155Total - Turkey
1,500,000 1,395,419 0.3315.07.33Sealed Air Corp 03USD 6.880%United States
3.8015,884,006Total - Transferable securities and money marketinstruments dealt in on another regulated market
3.8015,884,006Total - Bonds
0.331,395,419Total - United States
500,000 492,305 0.1215.05.27Netflix Inc 17EUR 3.625%
Other transferable securitiesBondsUnited States
0.12492,305Total - Bonds
0.12492,305Total - United States
25,000 3,425,250 0.82Vontobel Fund -High Yield Bond - I
EUR
Investment fundsLuxembourg
22,500 2,144,800 0.51Vontobel Fund -Absolute ReturnCredit Fund - X
USD
225,000 27,065,750 6.48Vontobel Fund -Emerging MarketsCorporate Bond - I
USD
7.9333,128,105Total - Other transferable securities
7.8132,635,800Total - Investment funds
7.8132,635,800Total - Luxembourg
90.20376,627,617Total - Investment in securities
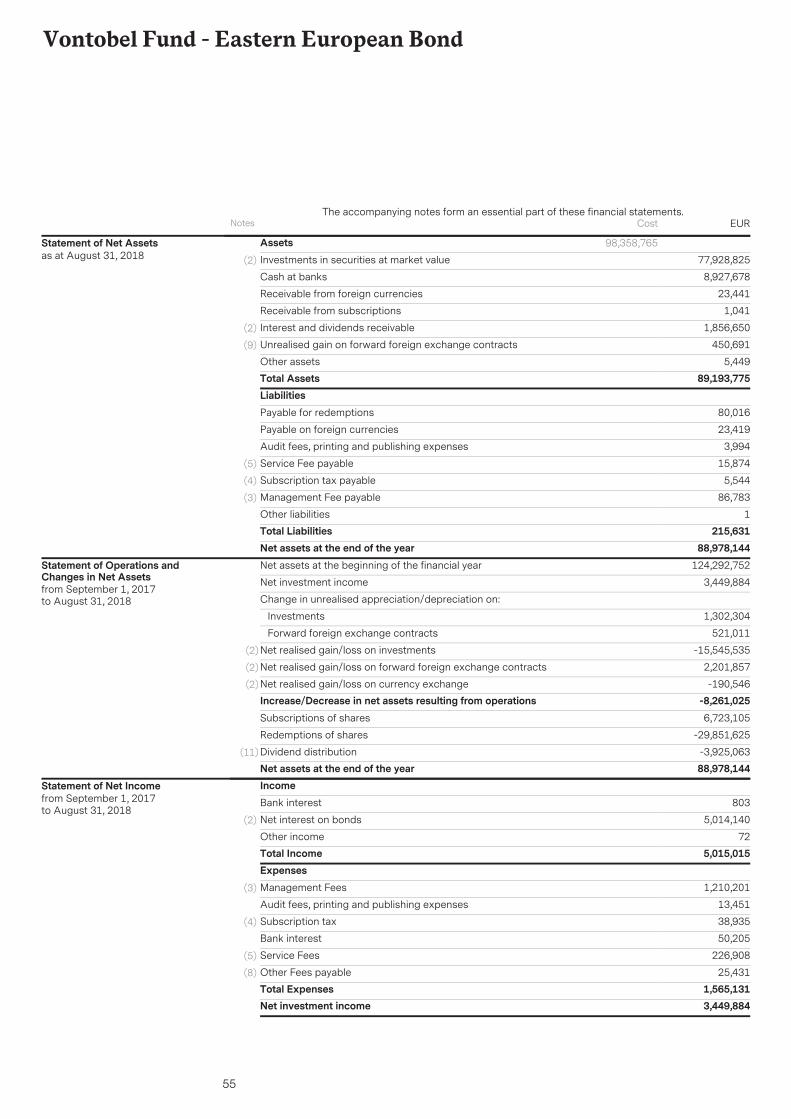
55
Vontobel Fund - Eastern European Bond
AssetsInvestments in securities at market value 77,928,825(2)
8,927,678Cash at banks
23,441Receivable from foreign currencies
1,041Receivable from subscriptions
1,856,650Interest and dividends receivable(2)
450,691Unrealised gain on forward foreign exchange contracts(9)
5,449Other assetsTotal Assets 89,193,775
98,358,765Statement of Net Assetsas at August 31, 2018
LiabilitiesPayable for redemptions 80,016
Payable on foreign currencies 23,419
Audit fees, printing and publishing expenses 3,994
Service Fee payable 15,874(5)
Subscription tax payable 5,544(4)
Management Fee payable 86,783(3)
Other liabilities 1Total Liabilities 215,631Net assets at the end of the year 88,978,144Net assets at the beginning of the financial year 124,292,752
Net investment income 3,449,884
Change in unrealised appreciation/depreciation on:
Investments 1,302,304
Forward foreign exchange contracts 521,011
Net realised gain/loss on investments -15,545,535(2)
Net realised gain/loss on forward foreign exchange contracts 2,201,857(2)
Net realised gain/loss on currency exchange -190,546(2)
Increase/Decrease in net assets resulting from operations -8,261,025Subscriptions of shares 6,723,105
Redemptions of shares -29,851,625
Dividend distribution -3,925,063(11)
Net assets at the end of the year 88,978,144
Statement of Operations andChanges in Net Assetsfrom September 1, 2017to August 31, 2018
IncomeBank interest 803
Net interest on bonds 5,014,140(2)
Other income 72Total Income 5,015,015ExpensesManagement Fees 1,210,201(3)
Audit fees, printing and publishing expenses 13,451
Subscription tax 38,935(4)
Bank interest 50,205
Service Fees 226,908(5)
Other Fees payable 25,431(8)
Total Expenses 1,565,131Net investment income 3,449,884
Statement of Net Incomefrom September 1, 2017to August 31, 2018
Notes EURThe accompanying notes form an essential part of these financial statements.
Cost
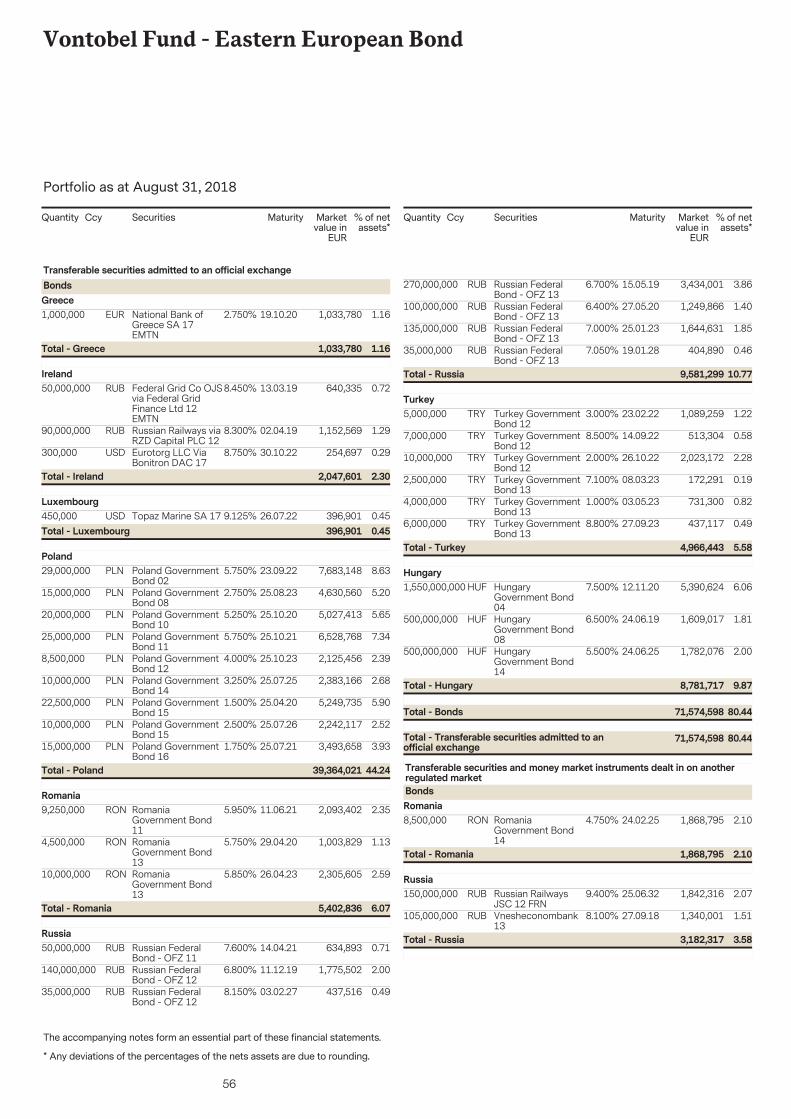
56
Vontobel Fund - Eastern European Bond
The accompanying notes form an essential part of these financial statements.
Portfolio as at August 31, 2018
* Any deviations of the percentages of the nets assets are due to rounding.
Securities Marketvalue in
EUR
% of netassets*
Quantity Ccy Maturity
1,000,000 1,033,780 1.1619.10.20National Bank ofGreece SA 17EMTN
EUR 2.750%
Transferable securities admitted to an official exchangeBondsGreece
1.161,033,780Total - Greece
50,000,000 640,335 0.7213.03.19Federal Grid Co OJSvia Federal GridFinance Ltd 12EMTN
RUB 8.450%Ireland
90,000,000 1,152,569 1.2902.04.19Russian Railways viaRZD Capital PLC 12
RUB 8.300%
300,000 254,697 0.2930.10.22Eurotorg LLC ViaBonitron DAC 17
USD 8.750%
2.302,047,601Total - Ireland
450,000 396,901 0.4526.07.22Topaz Marine SA 17USD 9.125%Luxembourg
0.45396,901Total - Luxembourg
29,000,000 7,683,148 8.6323.09.22Poland GovernmentBond 02
PLN 5.750%Poland
15,000,000 4,630,560 5.2025.08.23Poland GovernmentBond 08
PLN 2.750%
20,000,000 5,027,413 5.6525.10.20Poland GovernmentBond 10
PLN 5.250%
25,000,000 6,528,768 7.3425.10.21Poland GovernmentBond 11
PLN 5.750%
8,500,000 2,125,456 2.3925.10.23Poland GovernmentBond 12
PLN 4.000%
10,000,000 2,383,166 2.6825.07.25Poland GovernmentBond 14
PLN 3.250%
22,500,000 5,249,735 5.9025.04.20Poland GovernmentBond 15
PLN 1.500%
10,000,000 2,242,117 2.5225.07.26Poland GovernmentBond 15
PLN 2.500%
15,000,000 3,493,658 3.9325.07.21Poland GovernmentBond 16
PLN 1.750%
44.2439,364,021Total - Poland
9,250,000 2,093,402 2.3511.06.21RomaniaGovernment Bond11
RON 5.950%Romania
4,500,000 1,003,829 1.1329.04.20RomaniaGovernment Bond13
RON 5.750%
10,000,000 2,305,605 2.5926.04.23RomaniaGovernment Bond13
RON 5.850%
6.075,402,836Total - Romania
50,000,000 634,893 0.7114.04.21Russian FederalBond - OFZ 11
RUB 7.600%Russia
140,000,000 1,775,502 2.0011.12.19Russian FederalBond - OFZ 12
RUB 6.800%
35,000,000 437,516 0.4903.02.27Russian FederalBond - OFZ 12
RUB 8.150%
Securities Marketvalue in
EUR
% of netassets*
Quantity Ccy Maturity
270,000,000 3,434,001 3.8615.05.19Russian FederalBond - OFZ 13
RUB 6.700%
100,000,000 1,249,866 1.4027.05.20Russian FederalBond - OFZ 13
RUB 6.400%
135,000,000 1,644,631 1.8525.01.23Russian FederalBond - OFZ 13
RUB 7.000%
35,000,000 404,890 0.4619.01.28Russian FederalBond - OFZ 13
RUB 7.050%
10.779,581,299Total - Russia
5,000,000 1,089,259 1.2223.02.22Turkey GovernmentBond 12
TRY 3.000%Turkey
7,000,000 513,304 0.5814.09.22Turkey GovernmentBond 12
TRY 8.500%
10,000,000 2,023,172 2.2826.10.22Turkey GovernmentBond 12
TRY 2.000%
2,500,000 172,291 0.1908.03.23Turkey GovernmentBond 13
TRY 7.100%
4,000,000 731,300 0.8203.05.23Turkey GovernmentBond 13
TRY 1.000%
6,000,000 437,117 0.4927.09.23Turkey GovernmentBond 13
TRY 8.800%
5.584,966,443Total - Turkey
1,550,000,000 5,390,624 6.0612.11.20HungaryGovernment Bond04
HUF 7.500%Hungary
500,000,000 1,609,017 1.8124.06.19HungaryGovernment Bond08
HUF 6.500%
500,000,000 1,782,076 2.0024.06.25HungaryGovernment Bond14
HUF 5.500%
80.4471,574,598Total - Transferable securities admitted to anofficial exchange
80.4471,574,598Total - Bonds
9.878,781,717Total - Hungary
8,500,000 1,868,795 2.1024.02.25RomaniaGovernment Bond14
RON 4.750%
Transferable securities and money market instruments dealt in on anotherregulated marketBondsRomania
2.101,868,795Total - Romania
150,000,000 1,842,316 2.0725.06.32Russian RailwaysJSC 12 FRN
RUB 9.400%Russia
105,000,000 1,340,001 1.5127.09.18Vnesheconombank13
RUB 8.100%
3.583,182,317Total - Russia
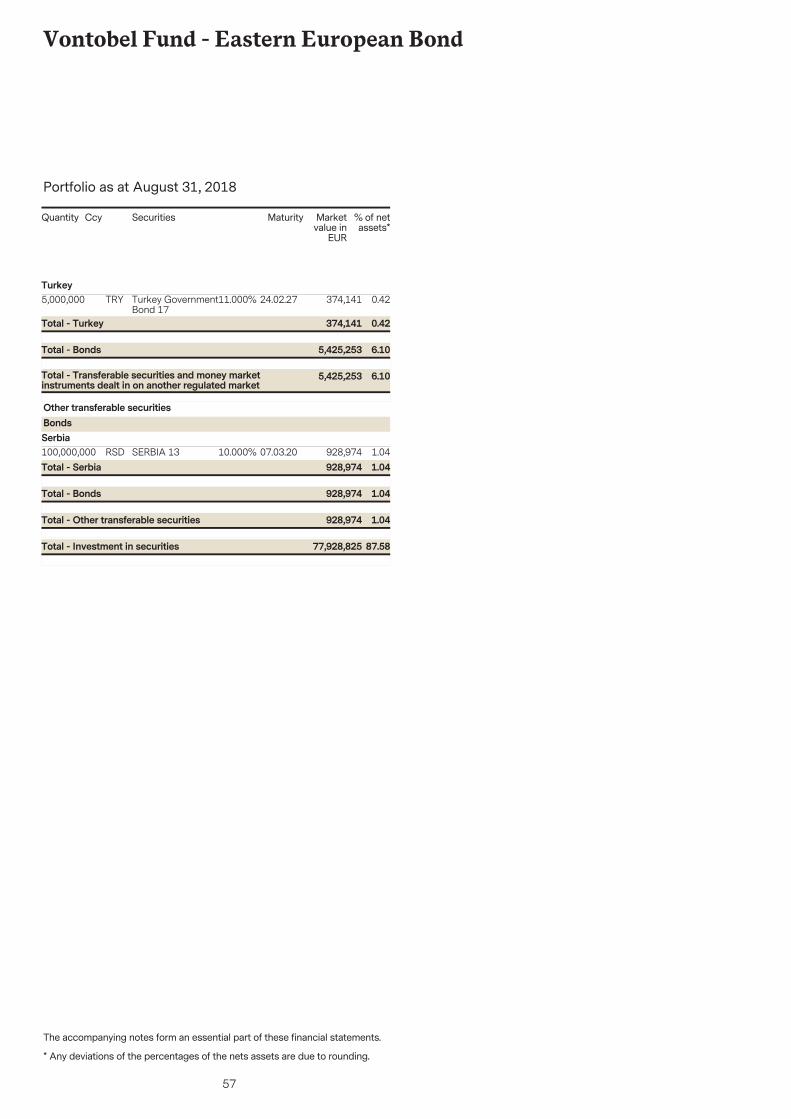
57
Vontobel Fund - Eastern European Bond
The accompanying notes form an essential part of these financial statements.
Portfolio as at August 31, 2018
* Any deviations of the percentages of the nets assets are due to rounding.
Securities Marketvalue in
EUR
% of netassets*
Quantity Ccy Maturity
5,000,000 374,141 0.4224.02.27Turkey GovernmentBond 17
TRY 11.000%Turkey
6.105,425,253Total - Transferable securities and money marketinstruments dealt in on another regulated market
6.105,425,253Total - Bonds
0.42374,141Total - Turkey
100,000,000 928,974 1.0407.03.20SERBIA 13RSD 10.000%
Other transferable securitiesBondsSerbia
1.04928,974Total - Other transferable securities
1.04928,974Total - Bonds
1.04928,974Total - Serbia
87.5877,928,825Total - Investment in securities
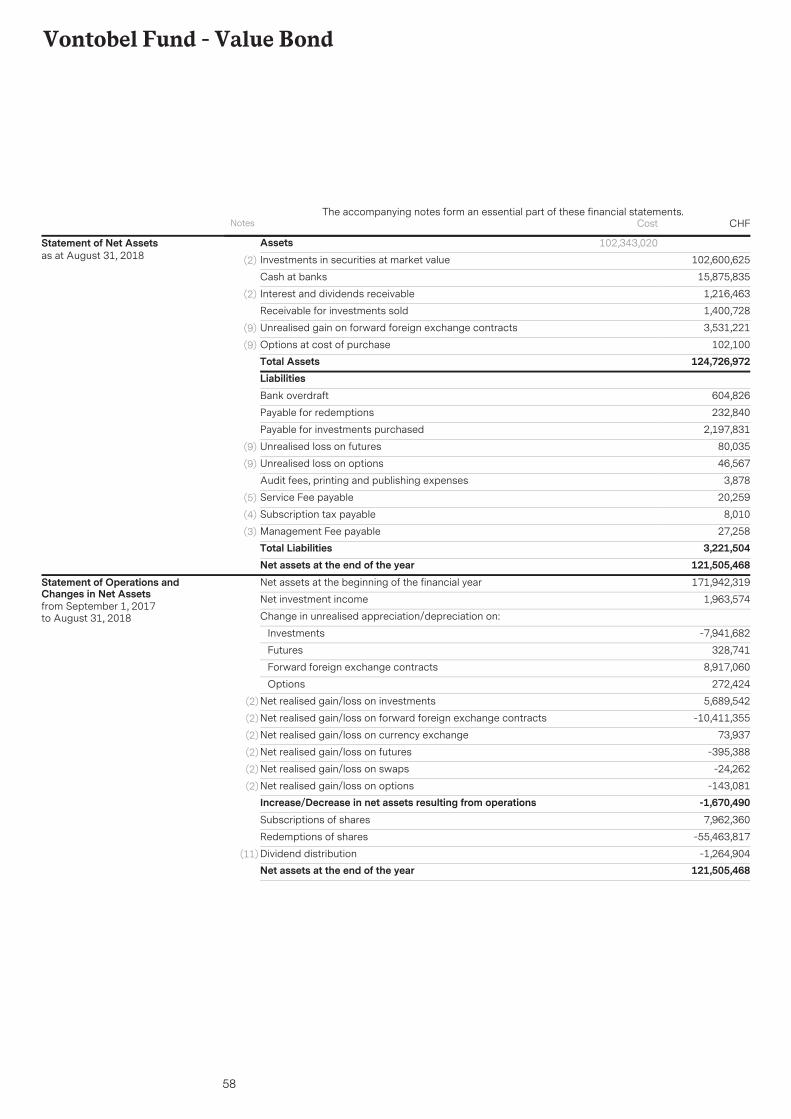
58
Vontobel Fund - Value Bond
AssetsInvestments in securities at market value 102,600,625(2)
15,875,835Cash at banks
1,216,463Interest and dividends receivable(2)
1,400,728Receivable for investments sold
3,531,221Unrealised gain on forward foreign exchange contracts(9)
102,100Options at cost of purchase(9)
Total Assets 124,726,972
102,343,020Statement of Net Assetsas at August 31, 2018
LiabilitiesBank overdraft 604,826
Payable for redemptions 232,840
Payable for investments purchased 2,197,831
Unrealised loss on futures 80,035(9)
Unrealised loss on options 46,567(9)
Audit fees, printing and publishing expenses 3,878
Service Fee payable 20,259(5)
Subscription tax payable 8,010(4)
Management Fee payable 27,258(3)
Total Liabilities 3,221,504Net assets at the end of the year 121,505,468Net assets at the beginning of the financial year 171,942,319
Net investment income 1,963,574
Change in unrealised appreciation/depreciation on:
Investments -7,941,682
Futures 328,741
Forward foreign exchange contracts 8,917,060
Options 272,424
Net realised gain/loss on investments 5,689,542(2)
Net realised gain/loss on forward foreign exchange contracts -10,411,355(2)
Net realised gain/loss on currency exchange 73,937(2)
Net realised gain/loss on futures -395,388(2)
Net realised gain/loss on swaps -24,262(2)
Net realised gain/loss on options -143,081(2)
Increase/Decrease in net assets resulting from operations -1,670,490Subscriptions of shares 7,962,360
Redemptions of shares -55,463,817
Dividend distribution -1,264,904(11)
Net assets at the end of the year 121,505,468
Statement of Operations andChanges in Net Assetsfrom September 1, 2017to August 31, 2018
Notes CHFThe accompanying notes form an essential part of these financial statements.
Cost
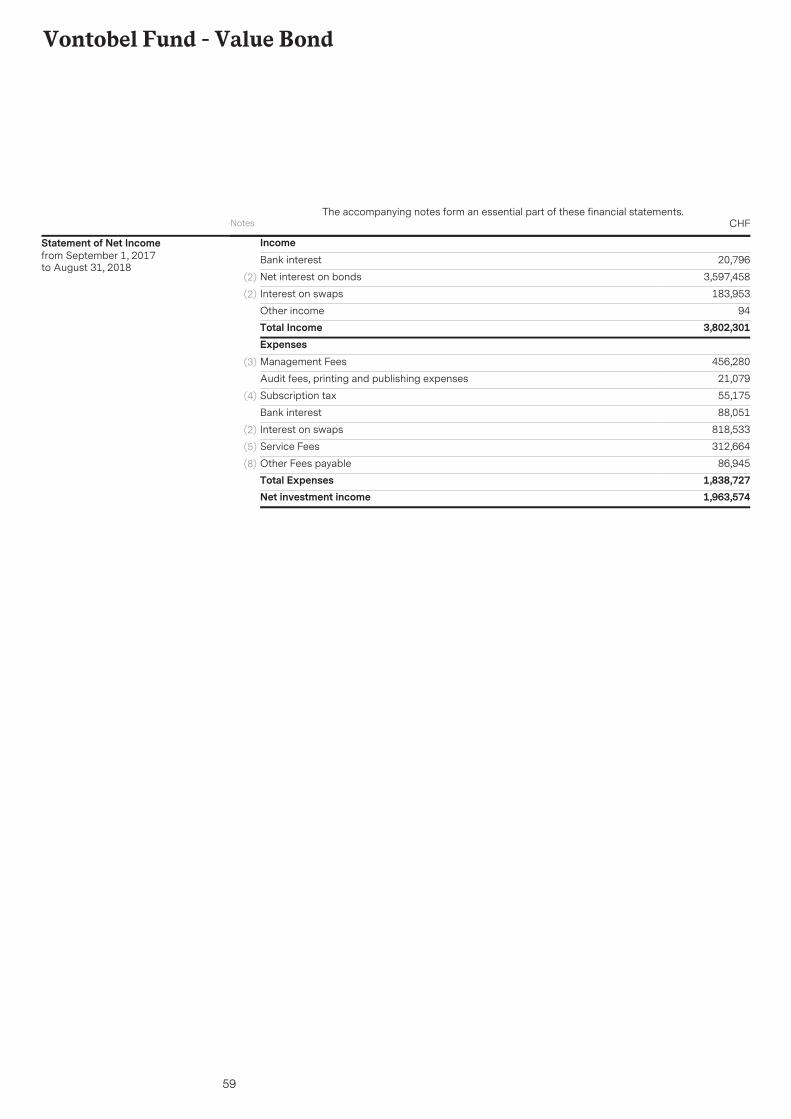
59
Vontobel Fund - Value Bond
IncomeBank interest 20,796
Net interest on bonds 3,597,458(2)
Interest on swaps 183,953(2)
Other income 94Total Income 3,802,301ExpensesManagement Fees 456,280(3)
Audit fees, printing and publishing expenses 21,079
Subscription tax 55,175(4)
Bank interest 88,051
Interest on swaps 818,533(2)
Service Fees 312,664(5)
Other Fees payable 86,945(8)
Total Expenses 1,838,727Net investment income 1,963,574
Statement of Net Incomefrom September 1, 2017to August 31, 2018
Notes CHFThe accompanying notes form an essential part of these financial statements.
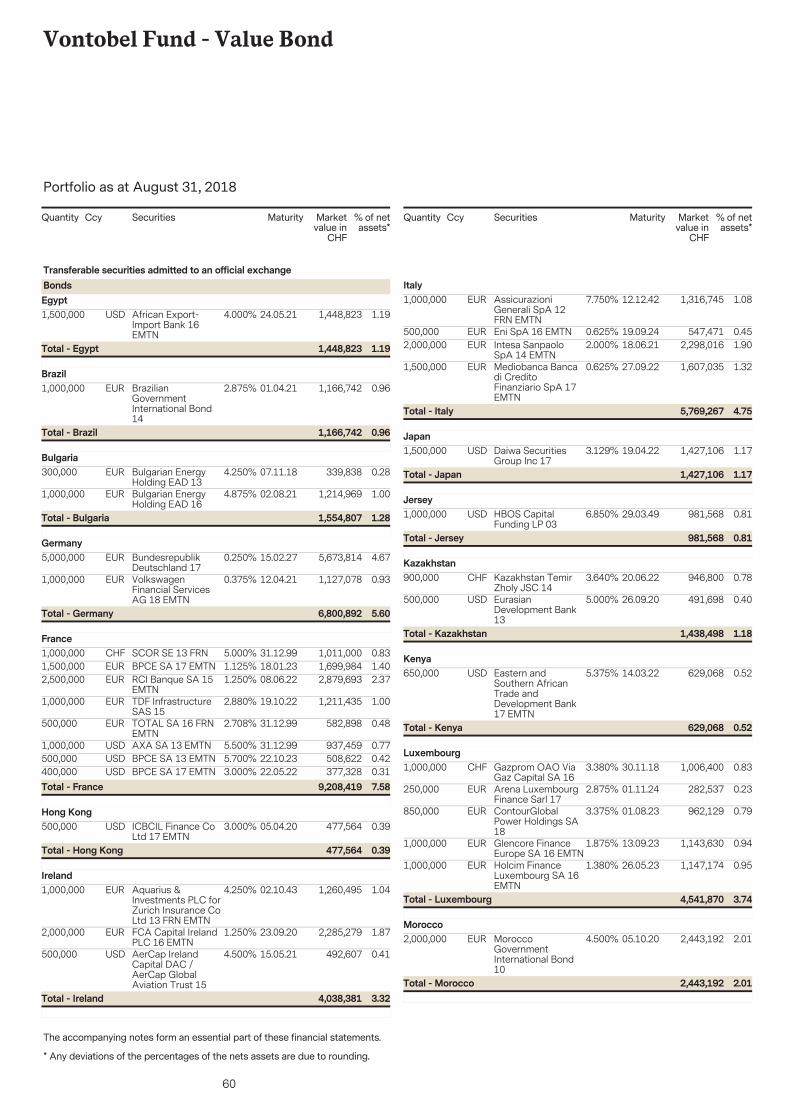
60
Vontobel Fund - Value Bond
The accompanying notes form an essential part of these financial statements.
Portfolio as at August 31, 2018
* Any deviations of the percentages of the nets assets are due to rounding.
Securities Marketvalue in
CHF
% of netassets*
Quantity Ccy Maturity
1,500,000 1,448,823 1.1924.05.21African Export-Import Bank 16EMTN
USD 4.000%
Transferable securities admitted to an official exchangeBondsEgypt
1.191,448,823Total - Egypt
1,000,000 1,166,742 0.9601.04.21BrazilianGovernmentInternational Bond14
EUR 2.875%Brazil
0.961,166,742Total - Brazil
300,000 339,838 0.2807.11.18Bulgarian EnergyHolding EAD 13
EUR 4.250%Bulgaria
1,000,000 1,214,969 1.0002.08.21Bulgarian EnergyHolding EAD 16
EUR 4.875%
1.281,554,807Total - Bulgaria
5,000,000 5,673,814 4.6715.02.27BundesrepublikDeutschland 17
EUR 0.250%Germany
1,000,000 1,127,078 0.9312.04.21VolkswagenFinancial ServicesAG 18 EMTN
EUR 0.375%
5.606,800,892Total - Germany
1,000,000 1,011,000 0.8331.12.99SCOR SE 13 FRNCHF 5.000%France
1,500,000 1,699,984 1.4018.01.23BPCE SA 17 EMTNEUR 1.125%2,500,000 2,879,693 2.3708.06.22RCI Banque SA 15
EMTNEUR 1.250%
1,000,000 1,211,435 1.0019.10.22TDF InfrastructureSAS 15
EUR 2.880%
500,000 582,898 0.4831.12.99TOTAL SA 16 FRNEMTN
EUR 2.708%
1,000,000 937,459 0.7731.12.99AXA SA 13 EMTNUSD 5.500%500,000 508,622 0.4222.10.23BPCE SA 13 EMTNUSD 5.700%400,000 377,328 0.3122.05.22BPCE SA 17 EMTNUSD 3.000%
7.589,208,419Total - France
500,000 477,564 0.3905.04.20ICBCIL Finance CoLtd 17 EMTN
USD 3.000%Hong Kong
0.39477,564Total - Hong Kong
1,000,000 1,260,495 1.0402.10.43Aquarius &Investments PLC forZurich Insurance CoLtd 13 FRN EMTN
EUR 4.250%Ireland
2,000,000 2,285,279 1.8723.09.20FCA Capital IrelandPLC 16 EMTN
EUR 1.250%
500,000 492,607 0.4115.05.21AerCap IrelandCapital DAC /AerCap GlobalAviation Trust 15
USD 4.500%
3.324,038,381Total - Ireland
Securities Marketvalue in
CHF
% of netassets*
Quantity Ccy Maturity
1,000,000 1,316,745 1.0812.12.42AssicurazioniGenerali SpA 12FRN EMTN
EUR 7.750%Italy
500,000 547,471 0.4519.09.24Eni SpA 16 EMTNEUR 0.625%2,000,000 2,298,016 1.9018.06.21Intesa Sanpaolo
SpA 14 EMTNEUR 2.000%
1,500,000 1,607,035 1.3227.09.22Mediobanca Bancadi CreditoFinanziario SpA 17EMTN
EUR 0.625%
4.755,769,267Total - Italy
1,500,000 1,427,106 1.1719.04.22Daiwa SecuritiesGroup Inc 17
USD 3.129%Japan
1.171,427,106Total - Japan
1,000,000 981,568 0.8129.03.49HBOS CapitalFunding LP 03
USD 6.850%Jersey
0.81981,568Total - Jersey
900,000 946,800 0.7820.06.22Kazakhstan TemirZholy JSC 14
CHF 3.640%Kazakhstan
500,000 491,698 0.4026.09.20EurasianDevelopment Bank13
USD 5.000%
1.181,438,498Total - Kazakhstan
650,000 629,068 0.5214.03.22Eastern andSouthern AfricanTrade andDevelopment Bank17 EMTN
USD 5.375%Kenya
0.52629,068Total - Kenya
1,000,000 1,006,400 0.8330.11.18Gazprom OAO ViaGaz Capital SA 16
CHF 3.380%Luxembourg
250,000 282,537 0.2301.11.24Arena LuxembourgFinance Sarl 17
EUR 2.875%
850,000 962,129 0.7901.08.23ContourGlobalPower Holdings SA18
EUR 3.375%
1,000,000 1,143,630 0.9413.09.23Glencore FinanceEurope SA 16 EMTN
EUR 1.875%
1,000,000 1,147,174 0.9526.05.23Holcim FinanceLuxembourg SA 16EMTN
EUR 1.380%
3.744,541,870Total - Luxembourg
2,000,000 2,443,192 2.0105.10.20MoroccoGovernmentInternational Bond10
EUR 4.500%Morocco
2.012,443,192Total - Morocco
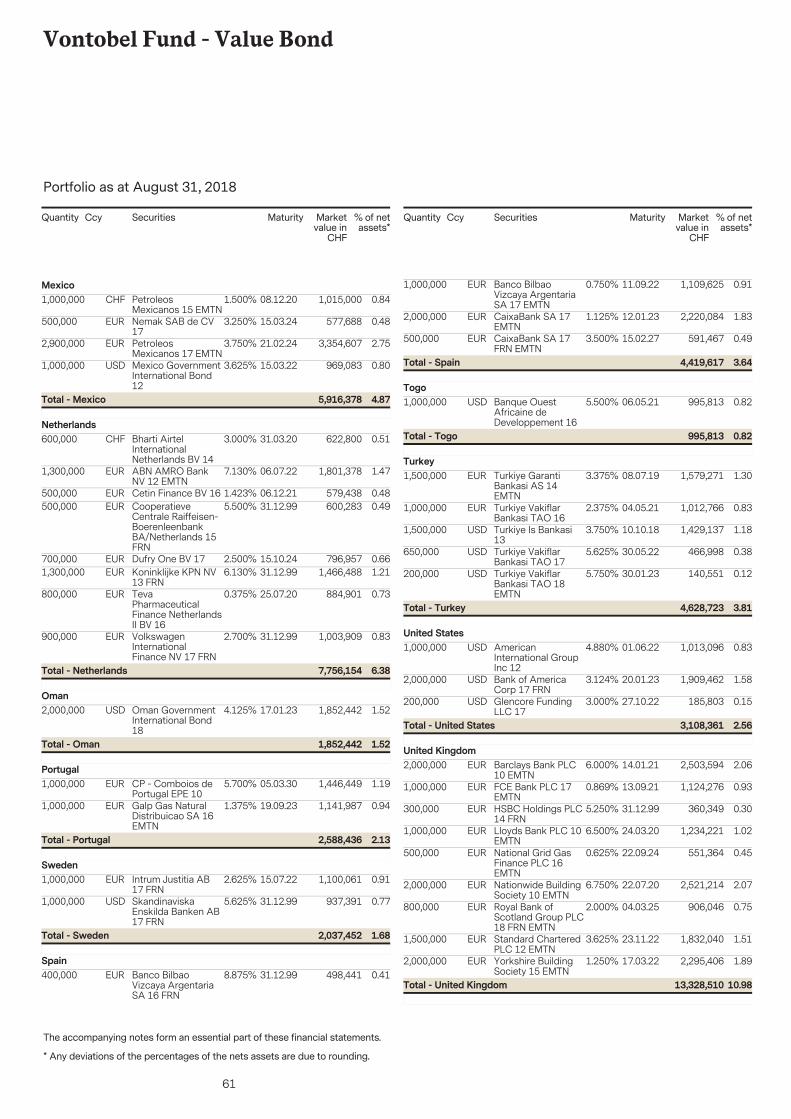
61
Vontobel Fund - Value Bond
The accompanying notes form an essential part of these financial statements.
Portfolio as at August 31, 2018
* Any deviations of the percentages of the nets assets are due to rounding.
Securities Marketvalue in
CHF
% of netassets*
Quantity Ccy Maturity
1,000,000 1,015,000 0.8408.12.20PetroleosMexicanos 15 EMTN
CHF 1.500%Mexico
500,000 577,688 0.4815.03.24Nemak SAB de CV17
EUR 3.250%
2,900,000 3,354,607 2.7521.02.24PetroleosMexicanos 17 EMTN
EUR 3.750%
1,000,000 969,083 0.8015.03.22Mexico GovernmentInternational Bond12
USD 3.625%
4.875,916,378Total - Mexico
600,000 622,800 0.5131.03.20Bharti AirtelInternationalNetherlands BV 14
CHF 3.000%Netherlands
1,300,000 1,801,378 1.4706.07.22ABN AMRO BankNV 12 EMTN
EUR 7.130%
500,000 579,438 0.4806.12.21Cetin Finance BV 16EUR 1.423%500,000 600,283 0.4931.12.99Cooperatieve
Centrale Raiffeisen-BoerenleenbankBA/Netherlands 15FRN
EUR 5.500%
700,000 796,957 0.6615.10.24Dufry One BV 17EUR 2.500%1,300,000 1,466,488 1.2131.12.99Koninklijke KPN NV
13 FRNEUR 6.130%
800,000 884,901 0.7325.07.20TevaPharmaceuticalFinance NetherlandsII BV 16
EUR 0.375%
900,000 1,003,909 0.8331.12.99VolkswagenInternationalFinance NV 17 FRN
EUR 2.700%
6.387,756,154Total - Netherlands
2,000,000 1,852,442 1.5217.01.23Oman GovernmentInternational Bond18
USD 4.125%Oman
1.521,852,442Total - Oman
1,000,000 1,446,449 1.1905.03.30CP - Comboios dePortugal EPE 10
EUR 5.700%Portugal
1,000,000 1,141,987 0.9419.09.23Galp Gas NaturalDistribuicao SA 16EMTN
EUR 1.375%
2.132,588,436Total - Portugal
1,000,000 1,100,061 0.9115.07.22Intrum Justitia AB17 FRN
EUR 2.625%Sweden
1,000,000 937,391 0.7731.12.99SkandinaviskaEnskilda Banken AB17 FRN
USD 5.625%
1.682,037,452Total - Sweden
400,000 498,441 0.4131.12.99Banco BilbaoVizcaya ArgentariaSA 16 FRN
EUR 8.875%Spain
Securities Marketvalue in
CHF
% of netassets*
Quantity Ccy Maturity
1,000,000 1,109,625 0.9111.09.22Banco BilbaoVizcaya ArgentariaSA 17 EMTN
EUR 0.750%
2,000,000 2,220,084 1.8312.01.23CaixaBank SA 17EMTN
EUR 1.125%
500,000 591,467 0.4915.02.27CaixaBank SA 17FRN EMTN
EUR 3.500%
3.644,419,617Total - Spain
1,000,000 995,813 0.8206.05.21Banque OuestAfricaine deDeveloppement 16
USD 5.500%Togo
0.82995,813Total - Togo
1,500,000 1,579,271 1.3008.07.19Turkiye GarantiBankasi AS 14EMTN
EUR 3.375%Turkey
1,000,000 1,012,766 0.8304.05.21Turkiye VakiflarBankasi TAO 16
EUR 2.375%
1,500,000 1,429,137 1.1810.10.18Turkiye Is Bankasi13
USD 3.750%
650,000 466,998 0.3830.05.22Turkiye VakiflarBankasi TAO 17
USD 5.625%
200,000 140,551 0.1230.01.23Turkiye VakiflarBankasi TAO 18EMTN
USD 5.750%
3.814,628,723Total - Turkey
1,000,000 1,013,096 0.8301.06.22AmericanInternational GroupInc 12
USD 4.880%United States
2,000,000 1,909,462 1.5820.01.23Bank of AmericaCorp 17 FRN
USD 3.124%
200,000 185,803 0.1527.10.22Glencore FundingLLC 17
USD 3.000%
2.563,108,361Total - United States
2,000,000 2,503,594 2.0614.01.21Barclays Bank PLC10 EMTN
EUR 6.000%United Kingdom
1,000,000 1,124,276 0.9313.09.21FCE Bank PLC 17EMTN
EUR 0.869%
300,000 360,349 0.3031.12.99HSBC Holdings PLC14 FRN
EUR 5.250%
1,000,000 1,234,221 1.0224.03.20Lloyds Bank PLC 10EMTN
EUR 6.500%
500,000 551,364 0.4522.09.24National Grid GasFinance PLC 16EMTN
EUR 0.625%
2,000,000 2,521,214 2.0722.07.20Nationwide BuildingSociety 10 EMTN
EUR 6.750%
800,000 906,046 0.7504.03.25Royal Bank ofScotland Group PLC18 FRN EMTN
EUR 2.000%
1,500,000 1,832,040 1.5123.11.22Standard CharteredPLC 12 EMTN
EUR 3.625%
2,000,000 2,295,406 1.8917.03.22Yorkshire BuildingSociety 15 EMTN
EUR 1.250%
10.9813,328,510Total - United Kingdom
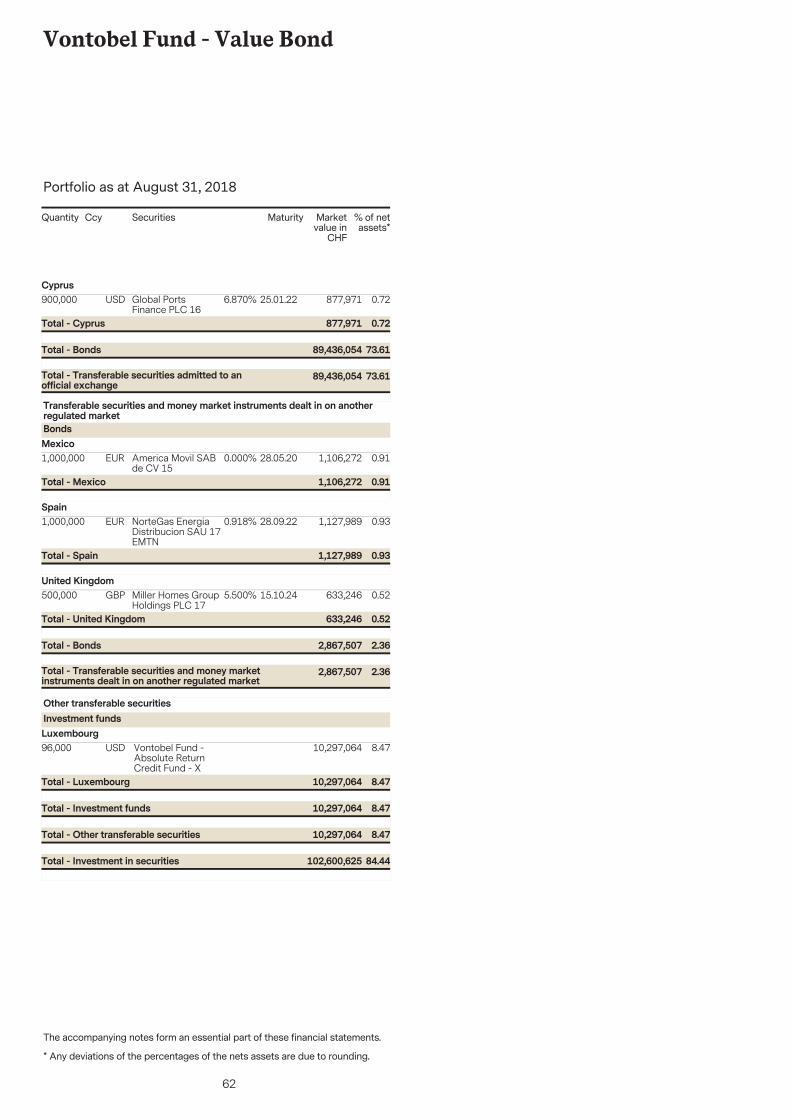
62
Vontobel Fund - Value Bond
The accompanying notes form an essential part of these financial statements.
Portfolio as at August 31, 2018
* Any deviations of the percentages of the nets assets are due to rounding.
Securities Marketvalue in
CHF
% of netassets*
Quantity Ccy Maturity
900,000 877,971 0.7225.01.22Global PortsFinance PLC 16
USD 6.870%Cyprus
73.6189,436,054Total - Transferable securities admitted to anofficial exchange
73.6189,436,054Total - Bonds
0.72877,971Total - Cyprus
1,000,000 1,106,272 0.9128.05.20America Movil SABde CV 15
EUR 0.000%
Transferable securities and money market instruments dealt in on anotherregulated marketBondsMexico
0.911,106,272Total - Mexico
1,000,000 1,127,989 0.9328.09.22NorteGas EnergiaDistribucion SAU 17EMTN
EUR 0.918%Spain
0.931,127,989Total - Spain
500,000 633,246 0.5215.10.24Miller Homes GroupHoldings PLC 17
GBP 5.500%United Kingdom
2.362,867,507Total - Transferable securities and money marketinstruments dealt in on another regulated market
2.362,867,507Total - Bonds
0.52633,246Total - United Kingdom
96,000 10,297,064 8.47Vontobel Fund -Absolute ReturnCredit Fund - X
USD
Other transferable securitiesInvestment fundsLuxembourg
8.4710,297,064Total - Other transferable securities
8.4710,297,064Total - Investment funds
8.4710,297,064Total - Luxembourg
84.44102,600,625Total - Investment in securities
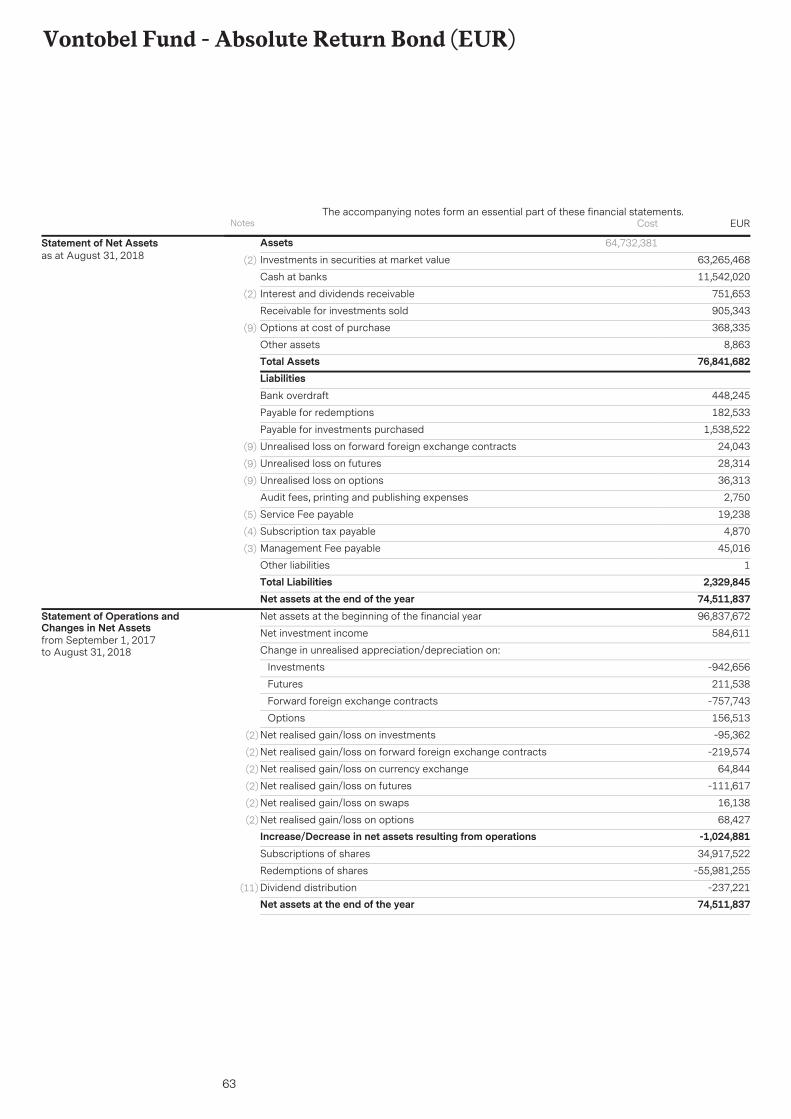
63
Vontobel Fund - Absolute Return Bond (EUR)
AssetsInvestments in securities at market value 63,265,468(2)
11,542,020Cash at banks
751,653Interest and dividends receivable(2)
905,343Receivable for investments sold
368,335Options at cost of purchase(9)
8,863Other assetsTotal Assets 76,841,682
64,732,381Statement of Net Assetsas at August 31, 2018
LiabilitiesBank overdraft 448,245
Payable for redemptions 182,533
Payable for investments purchased 1,538,522
Unrealised loss on forward foreign exchange contracts 24,043(9)
Unrealised loss on futures 28,314(9)
Unrealised loss on options 36,313(9)
Audit fees, printing and publishing expenses 2,750
Service Fee payable 19,238(5)
Subscription tax payable 4,870(4)
Management Fee payable 45,016(3)
Other liabilities 1Total Liabilities 2,329,845Net assets at the end of the year 74,511,837Net assets at the beginning of the financial year 96,837,672
Net investment income 584,611
Change in unrealised appreciation/depreciation on:
Investments -942,656
Futures 211,538
Forward foreign exchange contracts -757,743
Options 156,513
Net realised gain/loss on investments -95,362(2)
Net realised gain/loss on forward foreign exchange contracts -219,574(2)
Net realised gain/loss on currency exchange 64,844(2)
Net realised gain/loss on futures -111,617(2)
Net realised gain/loss on swaps 16,138(2)
Net realised gain/loss on options 68,427(2)
Increase/Decrease in net assets resulting from operations -1,024,881Subscriptions of shares 34,917,522
Redemptions of shares -55,981,255
Dividend distribution -237,221(11)
Net assets at the end of the year 74,511,837
Statement of Operations andChanges in Net Assetsfrom September 1, 2017to August 31, 2018
Notes EURThe accompanying notes form an essential part of these financial statements.
Cost
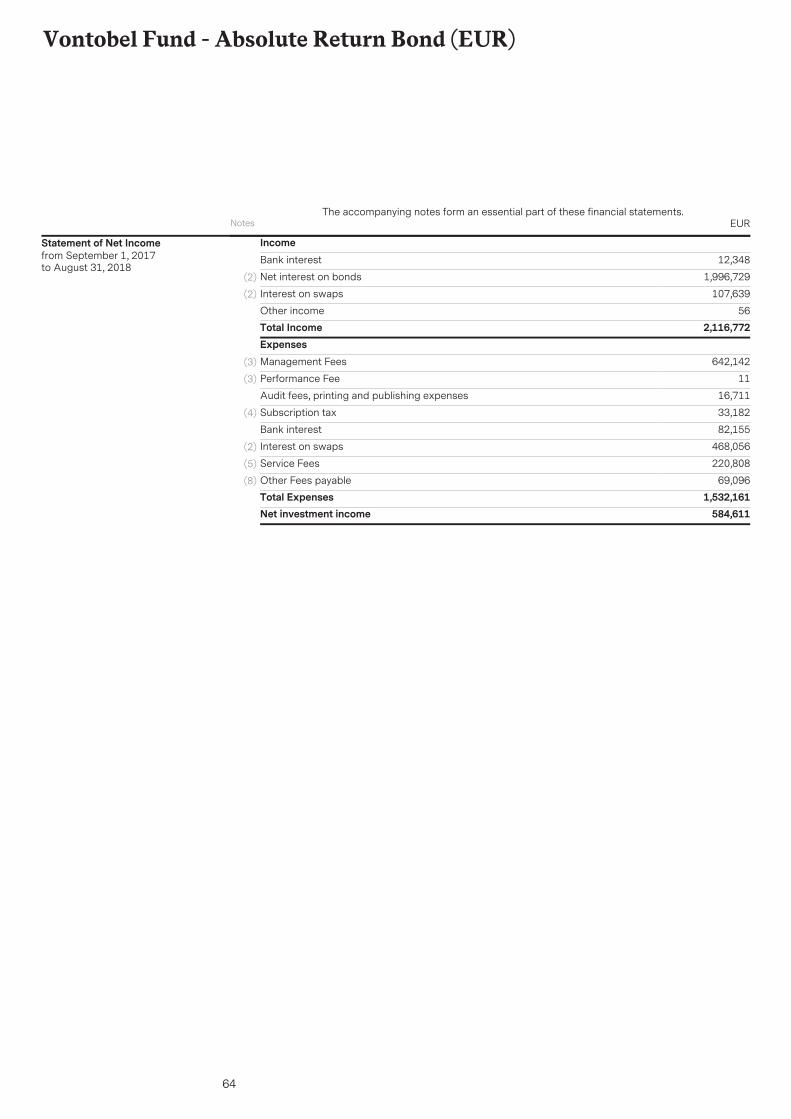
64
Vontobel Fund - Absolute Return Bond (EUR)
IncomeBank interest 12,348
Net interest on bonds 1,996,729(2)
Interest on swaps 107,639(2)
Other income 56Total Income 2,116,772ExpensesManagement Fees 642,142(3)
Performance Fee 11(3)
Audit fees, printing and publishing expenses 16,711
Subscription tax 33,182(4)
Bank interest 82,155
Interest on swaps 468,056(2)
Service Fees 220,808(5)
Other Fees payable 69,096(8)
Total Expenses 1,532,161Net investment income 584,611
Statement of Net Incomefrom September 1, 2017to August 31, 2018
Notes EURThe accompanying notes form an essential part of these financial statements.
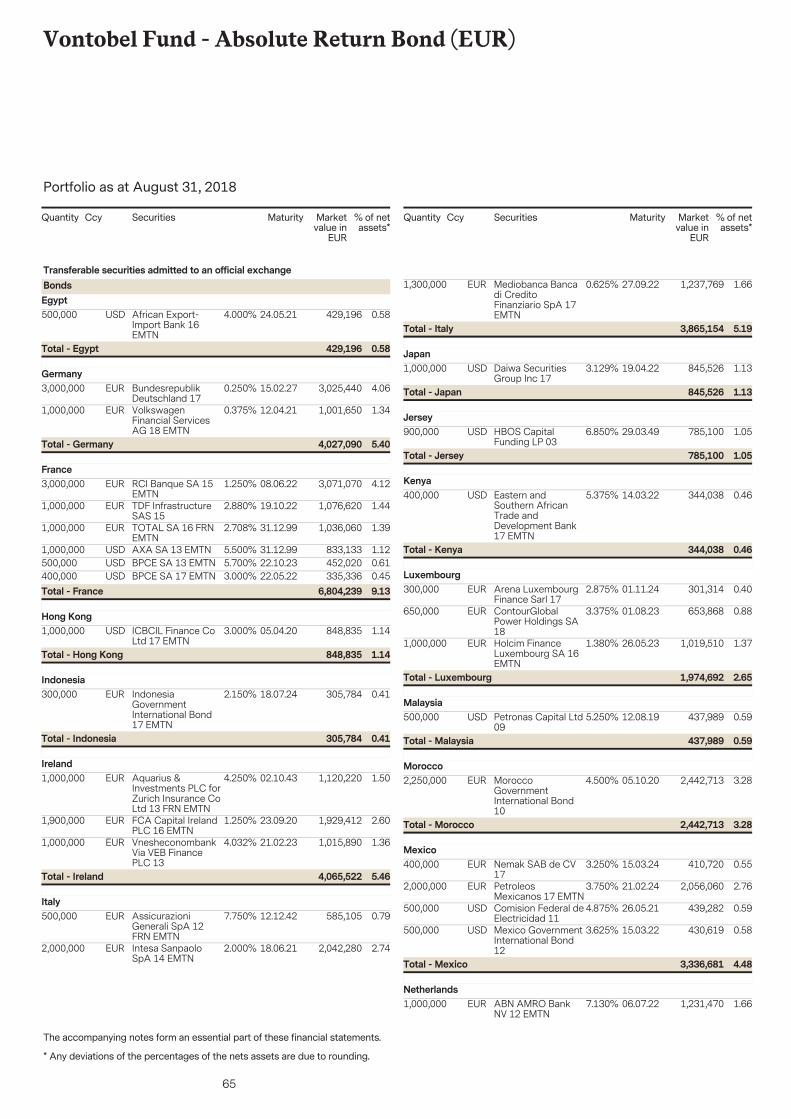
65
Vontobel Fund - Absolute Return Bond (EUR)
The accompanying notes form an essential part of these financial statements.
Portfolio as at August 31, 2018
* Any deviations of the percentages of the nets assets are due to rounding.
Securities Marketvalue in
EUR
% of netassets*
Quantity Ccy Maturity
500,000 429,196 0.5824.05.21African Export-Import Bank 16EMTN
USD 4.000%
Transferable securities admitted to an official exchangeBondsEgypt
0.58429,196Total - Egypt
3,000,000 3,025,440 4.0615.02.27BundesrepublikDeutschland 17
EUR 0.250%Germany
1,000,000 1,001,650 1.3412.04.21VolkswagenFinancial ServicesAG 18 EMTN
EUR 0.375%
5.404,027,090Total - Germany
3,000,000 3,071,070 4.1208.06.22RCI Banque SA 15EMTN
EUR 1.250%France
1,000,000 1,076,620 1.4419.10.22TDF InfrastructureSAS 15
EUR 2.880%
1,000,000 1,036,060 1.3931.12.99TOTAL SA 16 FRNEMTN
EUR 2.708%
1,000,000 833,133 1.1231.12.99AXA SA 13 EMTNUSD 5.500%500,000 452,020 0.6122.10.23BPCE SA 13 EMTNUSD 5.700%400,000 335,336 0.4522.05.22BPCE SA 17 EMTNUSD 3.000%
9.136,804,239Total - France
1,000,000 848,835 1.1405.04.20ICBCIL Finance CoLtd 17 EMTN
USD 3.000%Hong Kong
1.14848,835Total - Hong Kong
300,000 305,784 0.4118.07.24IndonesiaGovernmentInternational Bond17 EMTN
EUR 2.150%Indonesia
0.41305,784Total - Indonesia
1,000,000 1,120,220 1.5002.10.43Aquarius &Investments PLC forZurich Insurance CoLtd 13 FRN EMTN
EUR 4.250%Ireland
1,900,000 1,929,412 2.6023.09.20FCA Capital IrelandPLC 16 EMTN
EUR 1.250%
1,000,000 1,015,890 1.3621.02.23VnesheconombankVia VEB FinancePLC 13
EUR 4.032%
5.464,065,522Total - Ireland
500,000 585,105 0.7912.12.42AssicurazioniGenerali SpA 12FRN EMTN
EUR 7.750%Italy
2,000,000 2,042,280 2.7418.06.21Intesa SanpaoloSpA 14 EMTN
EUR 2.000%
Securities Marketvalue in
EUR
% of netassets*
Quantity Ccy Maturity
1,300,000 1,237,769 1.6627.09.22Mediobanca Bancadi CreditoFinanziario SpA 17EMTN
EUR 0.625%
5.193,865,154Total - Italy
1,000,000 845,526 1.1319.04.22Daiwa SecuritiesGroup Inc 17
USD 3.129%Japan
1.13845,526Total - Japan
900,000 785,100 1.0529.03.49HBOS CapitalFunding LP 03
USD 6.850%Jersey
1.05785,100Total - Jersey
400,000 344,038 0.4614.03.22Eastern andSouthern AfricanTrade andDevelopment Bank17 EMTN
USD 5.375%Kenya
0.46344,038Total - Kenya
300,000 301,314 0.4001.11.24Arena LuxembourgFinance Sarl 17
EUR 2.875%Luxembourg
650,000 653,868 0.8801.08.23ContourGlobalPower Holdings SA18
EUR 3.375%
1,000,000 1,019,510 1.3726.05.23Holcim FinanceLuxembourg SA 16EMTN
EUR 1.380%
2.651,974,692Total - Luxembourg
500,000 437,989 0.5912.08.19Petronas Capital Ltd09
USD 5.250%Malaysia
0.59437,989Total - Malaysia
2,250,000 2,442,713 3.2805.10.20MoroccoGovernmentInternational Bond10
EUR 4.500%Morocco
3.282,442,713Total - Morocco
400,000 410,720 0.5515.03.24Nemak SAB de CV17
EUR 3.250%Mexico
2,000,000 2,056,060 2.7621.02.24PetroleosMexicanos 17 EMTN
EUR 3.750%
500,000 439,282 0.5926.05.21Comision Federal deElectricidad 11
USD 4.875%
500,000 430,619 0.5815.03.22Mexico GovernmentInternational Bond12
USD 3.625%
4.483,336,681Total - Mexico
1,000,000 1,231,470 1.6606.07.22ABN AMRO BankNV 12 EMTN
EUR 7.130%Netherlands
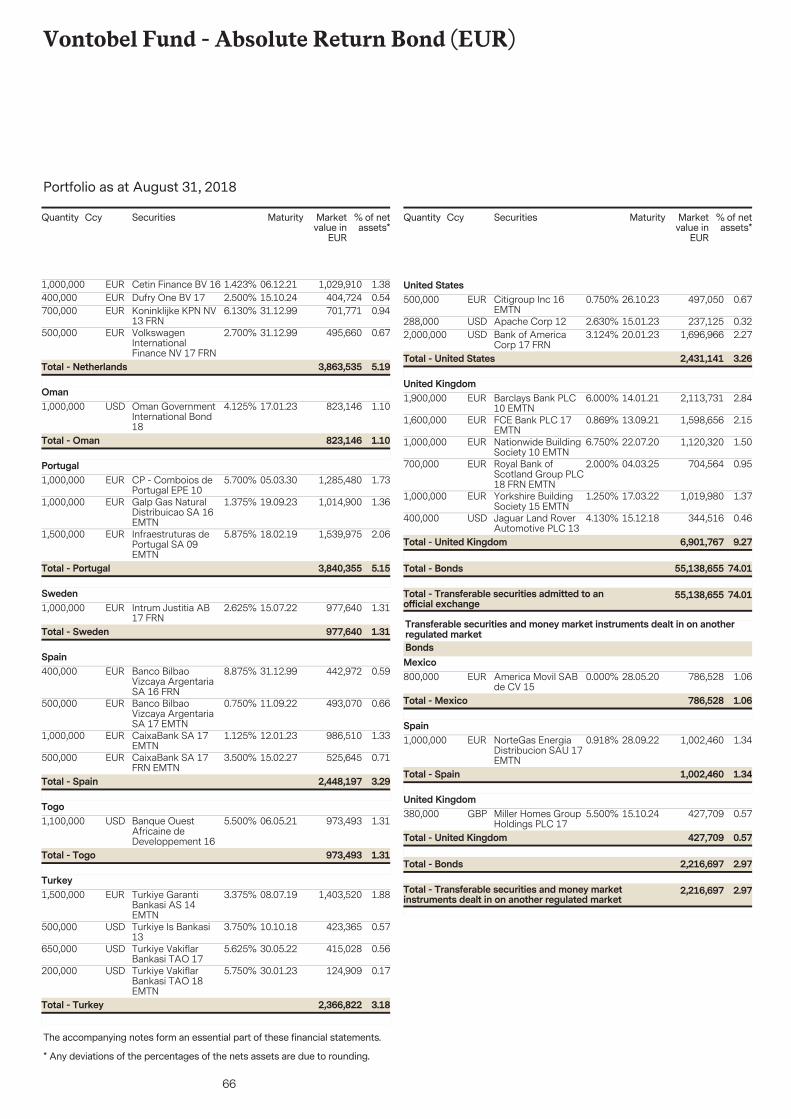
66
Vontobel Fund - Absolute Return Bond (EUR)
The accompanying notes form an essential part of these financial statements.
Portfolio as at August 31, 2018
* Any deviations of the percentages of the nets assets are due to rounding.
Securities Marketvalue in
EUR
% of netassets*
Quantity Ccy Maturity
1,000,000 1,029,910 1.3806.12.21Cetin Finance BV 16EUR 1.423%400,000 404,724 0.5415.10.24Dufry One BV 17EUR 2.500%700,000 701,771 0.9431.12.99Koninklijke KPN NV
13 FRNEUR 6.130%
500,000 495,660 0.6731.12.99VolkswagenInternationalFinance NV 17 FRN
EUR 2.700%
5.193,863,535Total - Netherlands
1,000,000 823,146 1.1017.01.23Oman GovernmentInternational Bond18
USD 4.125%Oman
1.10823,146Total - Oman
1,000,000 1,285,480 1.7305.03.30CP - Comboios dePortugal EPE 10
EUR 5.700%Portugal
1,000,000 1,014,900 1.3619.09.23Galp Gas NaturalDistribuicao SA 16EMTN
EUR 1.375%
1,500,000 1,539,975 2.0618.02.19Infraestruturas dePortugal SA 09EMTN
EUR 5.875%
5.153,840,355Total - Portugal
1,000,000 977,640 1.3115.07.22Intrum Justitia AB17 FRN
EUR 2.625%Sweden
1.31977,640Total - Sweden
400,000 442,972 0.5931.12.99Banco BilbaoVizcaya ArgentariaSA 16 FRN
EUR 8.875%Spain
500,000 493,070 0.6611.09.22Banco BilbaoVizcaya ArgentariaSA 17 EMTN
EUR 0.750%
1,000,000 986,510 1.3312.01.23CaixaBank SA 17EMTN
EUR 1.125%
500,000 525,645 0.7115.02.27CaixaBank SA 17FRN EMTN
EUR 3.500%
3.292,448,197Total - Spain
1,100,000 973,493 1.3106.05.21Banque OuestAfricaine deDeveloppement 16
USD 5.500%Togo
1.31973,493Total - Togo
1,500,000 1,403,520 1.8808.07.19Turkiye GarantiBankasi AS 14EMTN
EUR 3.375%Turkey
500,000 423,365 0.5710.10.18Turkiye Is Bankasi13
USD 3.750%
650,000 415,028 0.5630.05.22Turkiye VakiflarBankasi TAO 17
USD 5.625%
200,000 124,909 0.1730.01.23Turkiye VakiflarBankasi TAO 18EMTN
USD 5.750%
3.182,366,822Total - Turkey
Securities Marketvalue in
EUR
% of netassets*
Quantity Ccy Maturity
500,000 497,050 0.6726.10.23Citigroup Inc 16EMTN
EUR 0.750%United States
288,000 237,125 0.3215.01.23Apache Corp 12USD 2.630%2,000,000 1,696,966 2.2720.01.23Bank of America
Corp 17 FRNUSD 3.124%
3.262,431,141Total - United States
1,900,000 2,113,731 2.8414.01.21Barclays Bank PLC10 EMTN
EUR 6.000%United Kingdom
1,600,000 1,598,656 2.1513.09.21FCE Bank PLC 17EMTN
EUR 0.869%
1,000,000 1,120,320 1.5022.07.20Nationwide BuildingSociety 10 EMTN
EUR 6.750%
700,000 704,564 0.9504.03.25Royal Bank ofScotland Group PLC18 FRN EMTN
EUR 2.000%
1,000,000 1,019,980 1.3717.03.22Yorkshire BuildingSociety 15 EMTN
EUR 1.250%
400,000 344,516 0.4615.12.18Jaguar Land RoverAutomotive PLC 13
USD 4.130%
74.0155,138,655Total - Transferable securities admitted to anofficial exchange
74.0155,138,655Total - Bonds
9.276,901,767Total - United Kingdom
800,000 786,528 1.0628.05.20America Movil SABde CV 15
EUR 0.000%
Transferable securities and money market instruments dealt in on anotherregulated marketBondsMexico
1.06786,528Total - Mexico
1,000,000 1,002,460 1.3428.09.22NorteGas EnergiaDistribucion SAU 17EMTN
EUR 0.918%Spain
1.341,002,460Total - Spain
380,000 427,709 0.5715.10.24Miller Homes GroupHoldings PLC 17
GBP 5.500%United Kingdom
2.972,216,697Total - Transferable securities and money marketinstruments dealt in on another regulated market
2.972,216,697Total - Bonds
0.57427,709Total - United Kingdom
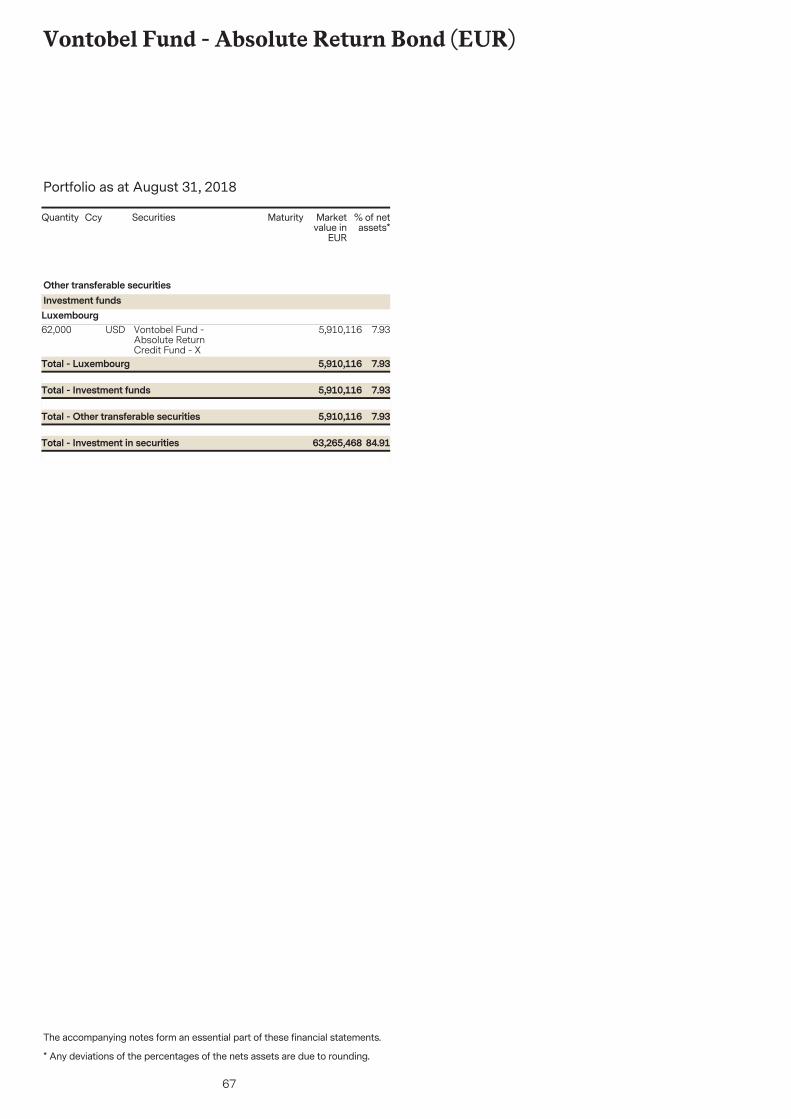
67
Vontobel Fund - Absolute Return Bond (EUR)
The accompanying notes form an essential part of these financial statements.
Portfolio as at August 31, 2018
* Any deviations of the percentages of the nets assets are due to rounding.
Securities Marketvalue in
EUR
% of netassets*
Quantity Ccy Maturity
62,000 5,910,116 7.93Vontobel Fund -Absolute ReturnCredit Fund - X
USD
Other transferable securitiesInvestment fundsLuxembourg
7.935,910,116Total - Other transferable securities
7.935,910,116Total - Investment funds
7.935,910,116Total - Luxembourg
84.9163,265,468Total - Investment in securities
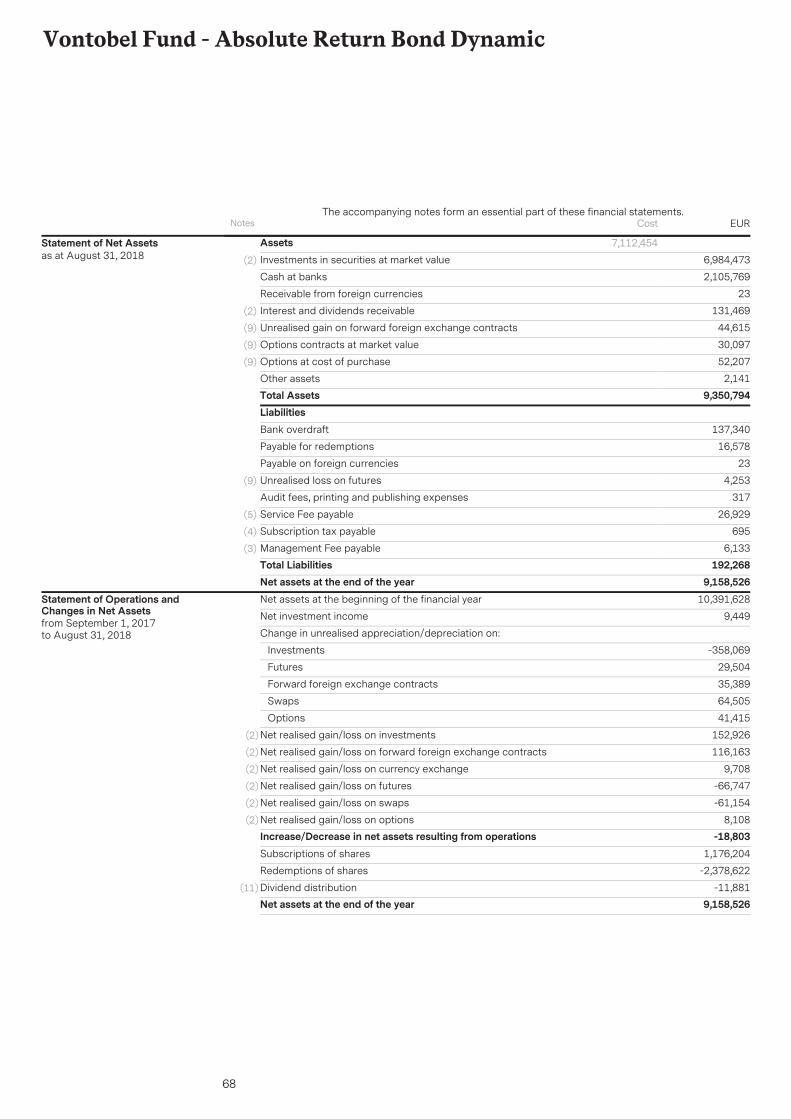
68
Vontobel Fund - Absolute Return Bond Dynamic
AssetsInvestments in securities at market value 6,984,473(2)
2,105,769Cash at banks
23Receivable from foreign currencies
131,469Interest and dividends receivable(2)
44,615Unrealised gain on forward foreign exchange contracts(9)
30,097Options contracts at market value(9)
52,207Options at cost of purchase(9)
2,141Other assetsTotal Assets 9,350,794
7,112,454Statement of Net Assetsas at August 31, 2018
LiabilitiesBank overdraft 137,340
Payable for redemptions 16,578
Payable on foreign currencies 23
Unrealised loss on futures 4,253(9)
Audit fees, printing and publishing expenses 317
Service Fee payable 26,929(5)
Subscription tax payable 695(4)
Management Fee payable 6,133(3)
Total Liabilities 192,268Net assets at the end of the year 9,158,526Net assets at the beginning of the financial year 10,391,628
Net investment income 9,449
Change in unrealised appreciation/depreciation on:
Investments -358,069
Futures 29,504
Forward foreign exchange contracts 35,389
Swaps 64,505
Options 41,415
Net realised gain/loss on investments 152,926(2)
Net realised gain/loss on forward foreign exchange contracts 116,163(2)
Net realised gain/loss on currency exchange 9,708(2)
Net realised gain/loss on futures -66,747(2)
Net realised gain/loss on swaps -61,154(2)
Net realised gain/loss on options 8,108(2)
Increase/Decrease in net assets resulting from operations -18,803Subscriptions of shares 1,176,204
Redemptions of shares -2,378,622
Dividend distribution -11,881(11)
Net assets at the end of the year 9,158,526
Statement of Operations andChanges in Net Assetsfrom September 1, 2017to August 31, 2018
Notes EURThe accompanying notes form an essential part of these financial statements.
Cost
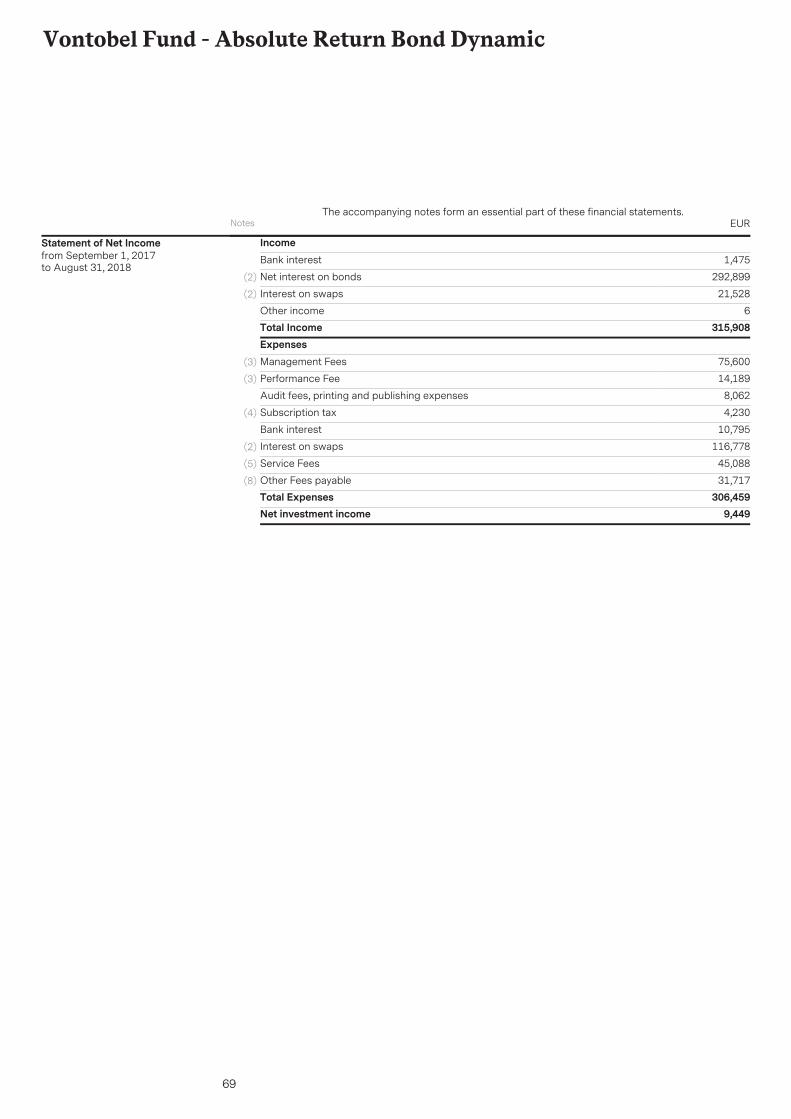
69
Vontobel Fund - Absolute Return Bond Dynamic
IncomeBank interest 1,475
Net interest on bonds 292,899(2)
Interest on swaps 21,528(2)
Other income 6Total Income 315,908ExpensesManagement Fees 75,600(3)
Performance Fee 14,189(3)
Audit fees, printing and publishing expenses 8,062
Subscription tax 4,230(4)
Bank interest 10,795
Interest on swaps 116,778(2)
Service Fees 45,088(5)
Other Fees payable 31,717(8)
Total Expenses 306,459Net investment income 9,449
Statement of Net Incomefrom September 1, 2017to August 31, 2018
Notes EURThe accompanying notes form an essential part of these financial statements.
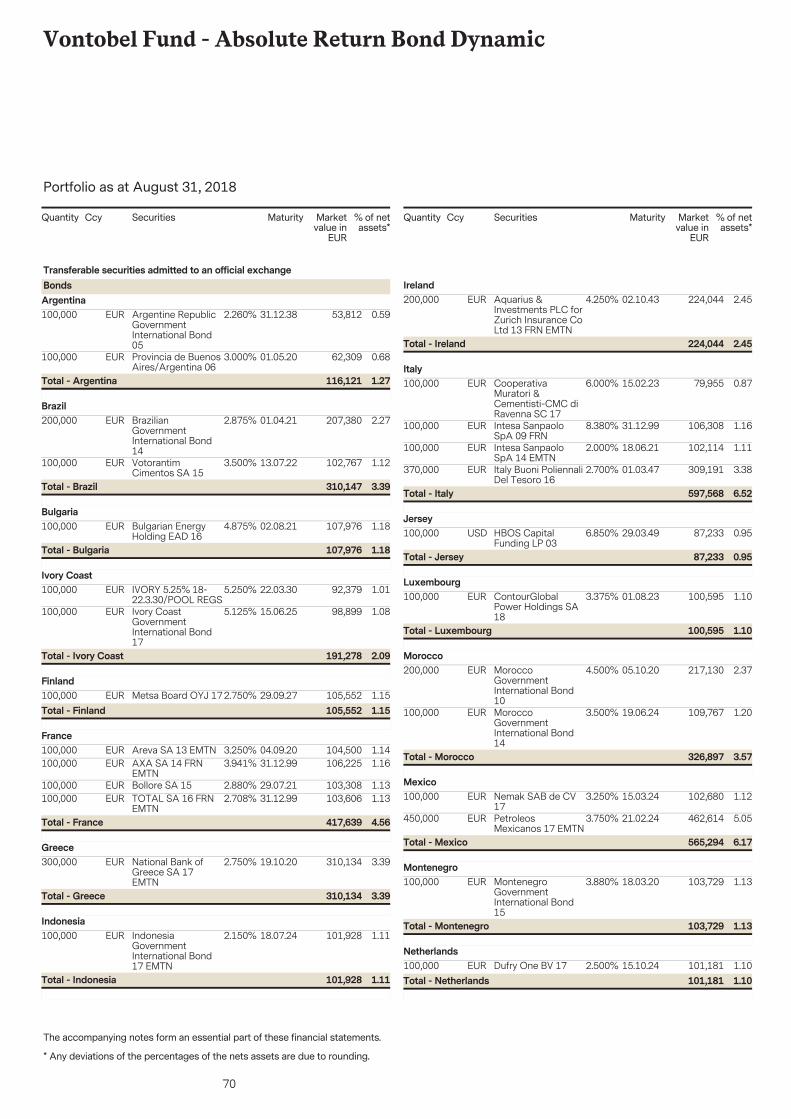
70
Vontobel Fund - Absolute Return Bond Dynamic
The accompanying notes form an essential part of these financial statements.
Portfolio as at August 31, 2018
* Any deviations of the percentages of the nets assets are due to rounding.
Securities Marketvalue in
EUR
% of netassets*
Quantity Ccy Maturity
100,000 53,812 0.5931.12.38Argentine RepublicGovernmentInternational Bond05
EUR 2.260%
Transferable securities admitted to an official exchangeBondsArgentina
100,000 62,309 0.6801.05.20Provincia de BuenosAires/Argentina 06
EUR 3.000%
1.27116,121Total - Argentina
200,000 207,380 2.2701.04.21BrazilianGovernmentInternational Bond14
EUR 2.875%Brazil
100,000 102,767 1.1213.07.22VotorantimCimentos SA 15
EUR 3.500%
3.39310,147Total - Brazil
100,000 107,976 1.1802.08.21Bulgarian EnergyHolding EAD 16
EUR 4.875%Bulgaria
1.18107,976Total - Bulgaria
100,000 92,379 1.0122.03.30IVORY 5.25% 18-22.3.30/POOL REGS
EUR 5.250%Ivory Coast
100,000 98,899 1.0815.06.25Ivory CoastGovernmentInternational Bond17
EUR 5.125%
2.09191,278Total - Ivory Coast
100,000 105,552 1.1529.09.27Metsa Board OYJ 17EUR 2.750%Finland
1.15105,552Total - Finland
100,000 104,500 1.1404.09.20Areva SA 13 EMTNEUR 3.250%France
100,000 106,225 1.1631.12.99AXA SA 14 FRNEMTN
EUR 3.941%
100,000 103,308 1.1329.07.21Bollore SA 15EUR 2.880%100,000 103,606 1.1331.12.99TOTAL SA 16 FRN
EMTNEUR 2.708%
4.56417,639Total - France
300,000 310,134 3.3919.10.20National Bank ofGreece SA 17EMTN
EUR 2.750%Greece
3.39310,134Total - Greece
100,000 101,928 1.1118.07.24IndonesiaGovernmentInternational Bond17 EMTN
EUR 2.150%Indonesia
1.11101,928Total - Indonesia
Securities Marketvalue in
EUR
% of netassets*
Quantity Ccy Maturity
200,000 224,044 2.4502.10.43Aquarius &Investments PLC forZurich Insurance CoLtd 13 FRN EMTN
EUR 4.250%Ireland
2.45224,044Total - Ireland
100,000 79,955 0.8715.02.23CooperativaMuratori &Cementisti-CMC diRavenna SC 17
EUR 6.000%Italy
100,000 106,308 1.1631.12.99Intesa SanpaoloSpA 09 FRN
EUR 8.380%
100,000 102,114 1.1118.06.21Intesa SanpaoloSpA 14 EMTN
EUR 2.000%
370,000 309,191 3.3801.03.47Italy Buoni PoliennaliDel Tesoro 16
EUR 2.700%
6.52597,568Total - Italy
100,000 87,233 0.9529.03.49HBOS CapitalFunding LP 03
USD 6.850%Jersey
0.9587,233Total - Jersey
100,000 100,595 1.1001.08.23ContourGlobalPower Holdings SA18
EUR 3.375%Luxembourg
1.10100,595Total - Luxembourg
200,000 217,130 2.3705.10.20MoroccoGovernmentInternational Bond10
EUR 4.500%Morocco
100,000 109,767 1.2019.06.24MoroccoGovernmentInternational Bond14
EUR 3.500%
3.57326,897Total - Morocco
100,000 102,680 1.1215.03.24Nemak SAB de CV17
EUR 3.250%Mexico
450,000 462,614 5.0521.02.24PetroleosMexicanos 17 EMTN
EUR 3.750%
6.17565,294Total - Mexico
100,000 103,729 1.1318.03.20MontenegroGovernmentInternational Bond15
EUR 3.880%Montenegro
1.13103,729Total - Montenegro
100,000 101,181 1.1015.10.24Dufry One BV 17EUR 2.500%Netherlands
1.10101,181Total - Netherlands
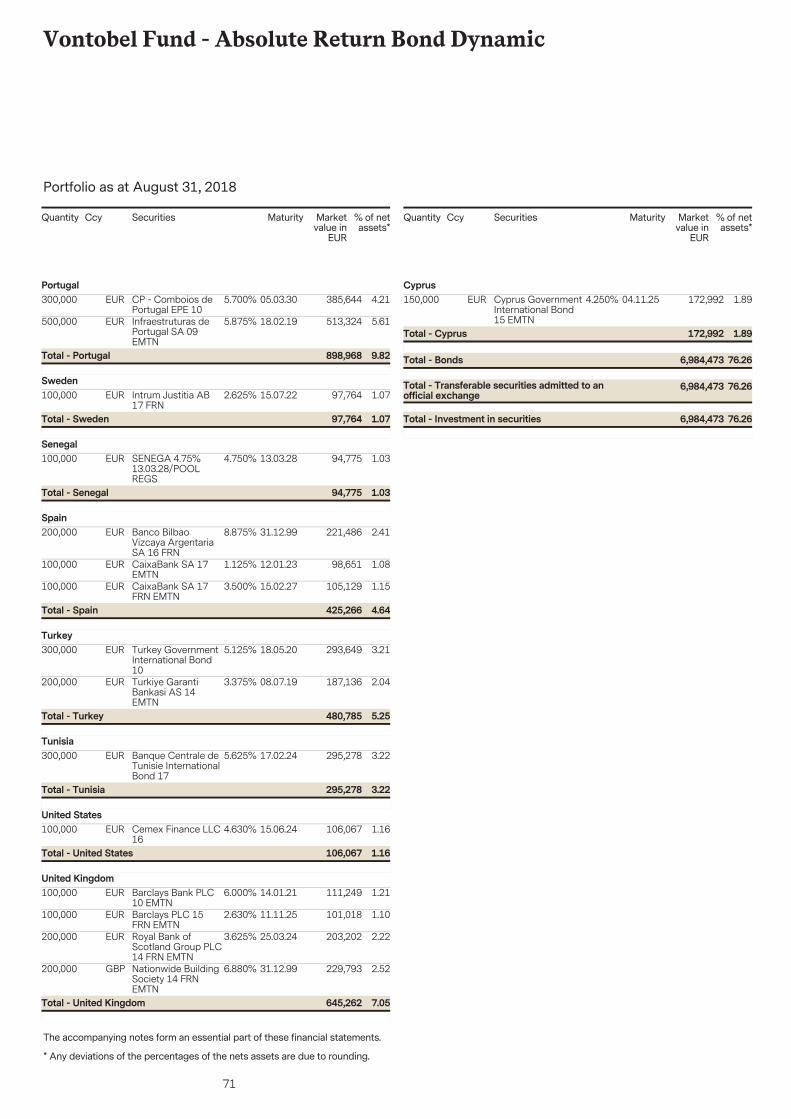
71
Vontobel Fund - Absolute Return Bond Dynamic
The accompanying notes form an essential part of these financial statements.
Portfolio as at August 31, 2018
* Any deviations of the percentages of the nets assets are due to rounding.
Securities Marketvalue in
EUR
% of netassets*
Quantity Ccy Maturity
300,000 385,644 4.2105.03.30CP - Comboios dePortugal EPE 10
EUR 5.700%Portugal
500,000 513,324 5.6118.02.19Infraestruturas dePortugal SA 09EMTN
EUR 5.875%
9.82898,968Total - Portugal
100,000 97,764 1.0715.07.22Intrum Justitia AB17 FRN
EUR 2.625%Sweden
1.0797,764Total - Sweden
100,000 94,775 1.0313.03.28SENEGA 4.75%13.03.28/POOLREGS
EUR 4.750%Senegal
1.0394,775Total - Senegal
200,000 221,486 2.4131.12.99Banco BilbaoVizcaya ArgentariaSA 16 FRN
EUR 8.875%Spain
100,000 98,651 1.0812.01.23CaixaBank SA 17EMTN
EUR 1.125%
100,000 105,129 1.1515.02.27CaixaBank SA 17FRN EMTN
EUR 3.500%
4.64425,266Total - Spain
300,000 293,649 3.2118.05.20Turkey GovernmentInternational Bond10
EUR 5.125%Turkey
200,000 187,136 2.0408.07.19Turkiye GarantiBankasi AS 14EMTN
EUR 3.375%
5.25480,785Total - Turkey
300,000 295,278 3.2217.02.24Banque Centrale deTunisie InternationalBond 17
EUR 5.625%Tunisia
3.22295,278Total - Tunisia
100,000 106,067 1.1615.06.24Cemex Finance LLC16
EUR 4.630%United States
1.16106,067Total - United States
100,000 111,249 1.2114.01.21Barclays Bank PLC10 EMTN
EUR 6.000%United Kingdom
100,000 101,018 1.1011.11.25Barclays PLC 15FRN EMTN
EUR 2.630%
200,000 203,202 2.2225.03.24Royal Bank ofScotland Group PLC14 FRN EMTN
EUR 3.625%
200,000 229,793 2.5231.12.99Nationwide BuildingSociety 14 FRNEMTN
GBP 6.880%
7.05645,262Total - United Kingdom
Securities Marketvalue in
EUR
% of netassets*
Quantity Ccy Maturity
150,000 172,992 1.8904.11.25Cyprus GovernmentInternational Bond15 EMTN
EUR 4.250%Cyprus
76.266,984,473Total - Transferable securities admitted to anofficial exchange
76.266,984,473Total - Bonds
1.89172,992Total - Cyprus
76.266,984,473Total - Investment in securities
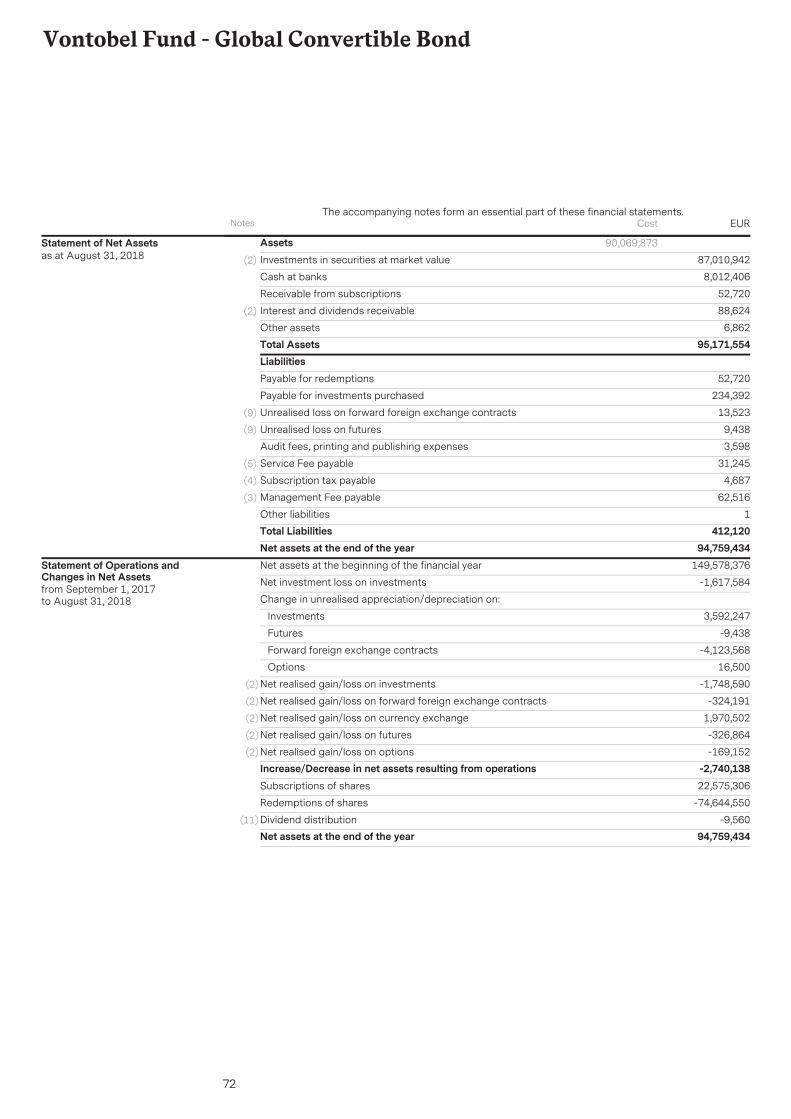
72
Vontobel Fund - Global Convertible Bond
AssetsInvestments in securities at market value 87,010,942(2)
8,012,406Cash at banks
52,720Receivable from subscriptions
88,624Interest and dividends receivable(2)
6,862Other assetsTotal Assets 95,171,554
90,069,873Statement of Net Assetsas at August 31, 2018
LiabilitiesPayable for redemptions 52,720
Payable for investments purchased 234,392
Unrealised loss on forward foreign exchange contracts 13,523(9)
Unrealised loss on futures 9,438(9)
Audit fees, printing and publishing expenses 3,598
Service Fee payable 31,245(5)
Subscription tax payable 4,687(4)
Management Fee payable 62,516(3)
Other liabilities 1Total Liabilities 412,120Net assets at the end of the year 94,759,434Net assets at the beginning of the financial year 149,578,376
Net investment loss on investments -1,617,584
Change in unrealised appreciation/depreciation on:
Investments 3,592,247
Futures -9,438
Forward foreign exchange contracts -4,123,568
Options 16,500
Net realised gain/loss on investments -1,748,590(2)
Net realised gain/loss on forward foreign exchange contracts -324,191(2)
Net realised gain/loss on currency exchange 1,970,502(2)
Net realised gain/loss on futures -326,864(2)
Net realised gain/loss on options -169,152(2)
Increase/Decrease in net assets resulting from operations -2,740,138Subscriptions of shares 22,575,306
Redemptions of shares -74,644,550
Dividend distribution -9,560(11)
Net assets at the end of the year 94,759,434
Statement of Operations andChanges in Net Assetsfrom September 1, 2017to August 31, 2018
Notes EURThe accompanying notes form an essential part of these financial statements.
Cost
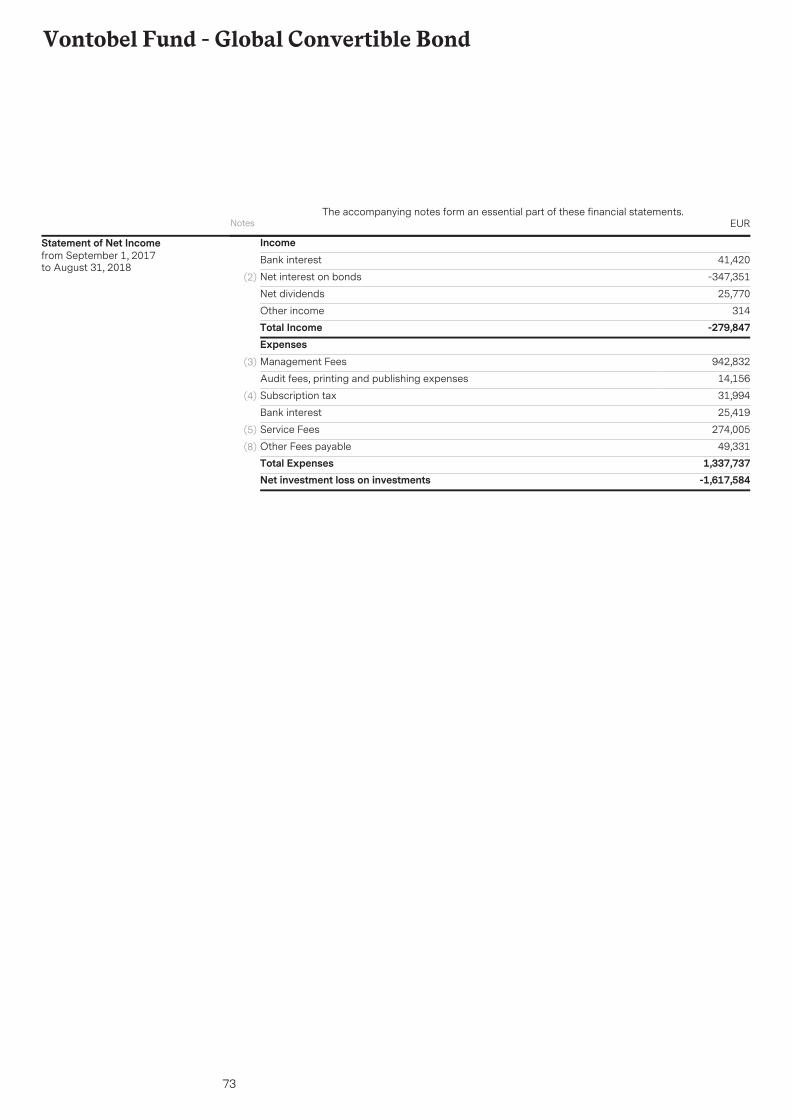
73
Vontobel Fund - Global Convertible Bond
IncomeBank interest 41,420
Net interest on bonds -347,351(2)
Net dividends 25,770
Other income 314Total Income -279,847ExpensesManagement Fees 942,832(3)
Audit fees, printing and publishing expenses 14,156
Subscription tax 31,994(4)
Bank interest 25,419
Service Fees 274,005(5)
Other Fees payable 49,331(8)
Total Expenses 1,337,737Net investment loss on investments -1,617,584
Statement of Net Incomefrom September 1, 2017to August 31, 2018
Notes EURThe accompanying notes form an essential part of these financial statements.
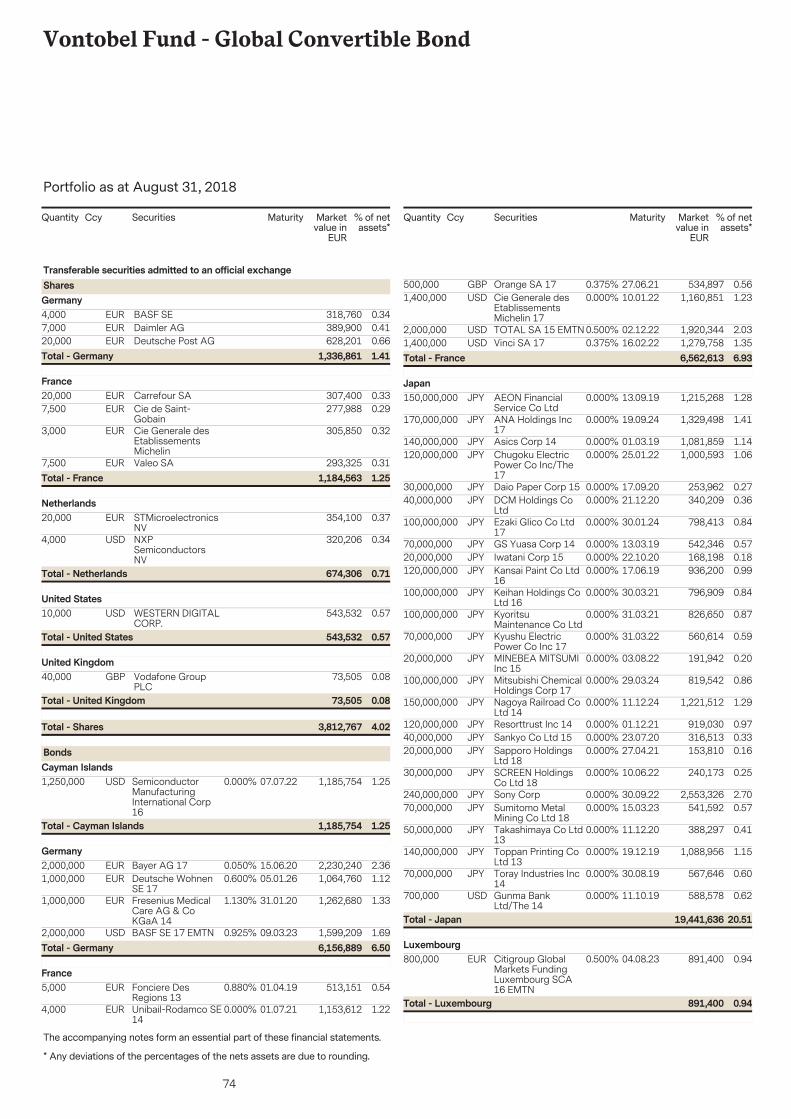
74
Vontobel Fund - Global Convertible Bond
The accompanying notes form an essential part of these financial statements.
Portfolio as at August 31, 2018
* Any deviations of the percentages of the nets assets are due to rounding.
Securities Marketvalue in
EUR
% of netassets*
Quantity Ccy Maturity
4,000 318,760 0.34BASF SEEUR
Transferable securities admitted to an official exchangeSharesGermany
7,000 389,900 0.41Daimler AGEUR20,000 628,201 0.66Deutsche Post AGEUR
1.411,336,861Total - Germany
20,000 307,400 0.33Carrefour SAEURFrance
7,500 277,988 0.29Cie de Saint-Gobain
EUR
3,000 305,850 0.32Cie Generale desEtablissementsMichelin
EUR
7,500 293,325 0.31Valeo SAEUR1.251,184,563Total - France
20,000 354,100 0.37STMicroelectronicsNV
EURNetherlands
4,000 320,206 0.34NXPSemiconductorsNV
USD
0.71674,306Total - Netherlands
10,000 543,532 0.57WESTERN DIGITALCORP.
USDUnited States
0.57543,532Total - United States
40,000 73,505 0.08Vodafone GroupPLC
GBPUnited Kingdom
4.023,812,767Total - Shares
0.0873,505Total - United Kingdom
1,250,000 1,185,754 1.2507.07.22SemiconductorManufacturingInternational Corp16
USD 0.000%
BondsCayman Islands
1.251,185,754Total - Cayman Islands
2,000,000 2,230,240 2.3615.06.20Bayer AG 17EUR 0.050%Germany
1,000,000 1,064,760 1.1205.01.26Deutsche WohnenSE 17
EUR 0.600%
1,000,000 1,262,680 1.3331.01.20Fresenius MedicalCare AG & CoKGaA 14
EUR 1.130%
2,000,000 1,599,209 1.6909.03.23BASF SE 17 EMTNUSD 0.925%6.506,156,889Total - Germany
5,000 513,151 0.5401.04.19Fonciere DesRegions 13
EUR 0.880%France
4,000 1,153,612 1.2201.07.21Unibail-Rodamco SE14
EUR 0.000%
Securities Marketvalue in
EUR
% of netassets*
Quantity Ccy Maturity
500,000 534,897 0.5627.06.21Orange SA 17GBP 0.375%1,400,000 1,160,851 1.2310.01.22Cie Generale des
EtablissementsMichelin 17
USD 0.000%
2,000,000 1,920,344 2.0302.12.22TOTAL SA 15 EMTNUSD 0.500%1,400,000 1,279,758 1.3516.02.22Vinci SA 17USD 0.375%
6.936,562,613Total - France
150,000,000 1,215,268 1.2813.09.19AEON FinancialService Co Ltd
JPY 0.000%Japan
170,000,000 1,329,498 1.4119.09.24ANA Holdings Inc17
JPY 0.000%
140,000,000 1,081,859 1.1401.03.19Asics Corp 14JPY 0.000%120,000,000 1,000,593 1.0625.01.22Chugoku Electric
Power Co Inc/The17
JPY 0.000%
30,000,000 253,962 0.2717.09.20Daio Paper Corp 15JPY 0.000%40,000,000 340,209 0.3621.12.20DCM Holdings Co
LtdJPY 0.000%
100,000,000 798,413 0.8430.01.24Ezaki Glico Co Ltd17
JPY 0.000%
70,000,000 542,346 0.5713.03.19GS Yuasa Corp 14JPY 0.000%20,000,000 168,198 0.1822.10.20Iwatani Corp 15JPY 0.000%120,000,000 936,200 0.9917.06.19Kansai Paint Co Ltd
16JPY 0.000%
100,000,000 796,909 0.8430.03.21Keihan Holdings CoLtd 16
JPY 0.000%
100,000,000 826,650 0.8731.03.21KyoritsuMaintenance Co Ltd
JPY 0.000%
70,000,000 560,614 0.5931.03.22Kyushu ElectricPower Co Inc 17
JPY 0.000%
20,000,000 191,942 0.2003.08.22MINEBEA MITSUMIInc 15
JPY 0.000%
100,000,000 819,542 0.8629.03.24Mitsubishi ChemicalHoldings Corp 17
JPY 0.000%
150,000,000 1,221,512 1.2911.12.24Nagoya Railroad CoLtd 14
JPY 0.000%
120,000,000 919,030 0.9701.12.21Resorttrust Inc 14JPY 0.000%40,000,000 316,513 0.3323.07.20Sankyo Co Ltd 15JPY 0.000%20,000,000 153,810 0.1627.04.21Sapporo Holdings
Ltd 18JPY 0.000%
30,000,000 240,173 0.2510.06.22SCREEN HoldingsCo Ltd 18
JPY 0.000%
240,000,000 2,553,326 2.7030.09.22Sony CorpJPY 0.000%70,000,000 541,592 0.5715.03.23Sumitomo Metal
Mining Co Ltd 18JPY 0.000%
50,000,000 388,297 0.4111.12.20Takashimaya Co Ltd13
JPY 0.000%
140,000,000 1,088,956 1.1519.12.19Toppan Printing CoLtd 13
JPY 0.000%
70,000,000 567,646 0.6030.08.19Toray Industries Inc14
JPY 0.000%
700,000 588,578 0.6211.10.19Gunma BankLtd/The 14
USD 0.000%
20.5119,441,636Total - Japan
800,000 891,400 0.9404.08.23Citigroup GlobalMarkets FundingLuxembourg SCA16 EMTN
EUR 0.500%Luxembourg
0.94891,400Total - Luxembourg
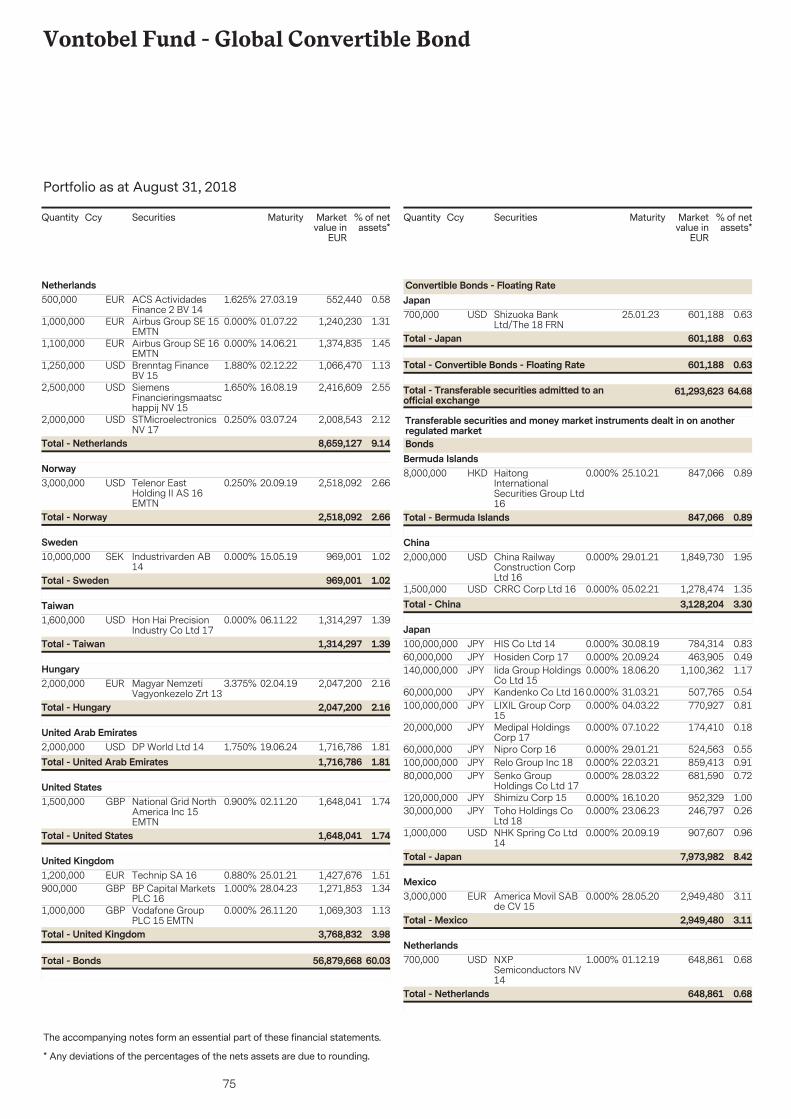
75
Vontobel Fund - Global Convertible Bond
The accompanying notes form an essential part of these financial statements.
Portfolio as at August 31, 2018
* Any deviations of the percentages of the nets assets are due to rounding.
Securities Marketvalue in
EUR
% of netassets*
Quantity Ccy Maturity
500,000 552,440 0.5827.03.19ACS ActividadesFinance 2 BV 14
EUR 1.625%Netherlands
1,000,000 1,240,230 1.3101.07.22Airbus Group SE 15EMTN
EUR 0.000%
1,100,000 1,374,835 1.4514.06.21Airbus Group SE 16EMTN
EUR 0.000%
1,250,000 1,066,470 1.1302.12.22Brenntag FinanceBV 15
USD 1.880%
2,500,000 2,416,609 2.5516.08.19SiemensFinancieringsmaatschappij NV 15
USD 1.650%
2,000,000 2,008,543 2.1203.07.24STMicroelectronicsNV 17
USD 0.250%
9.148,659,127Total - Netherlands
3,000,000 2,518,092 2.6620.09.19Telenor EastHolding II AS 16EMTN
USD 0.250%Norway
2.662,518,092Total - Norway
10,000,000 969,001 1.0215.05.19Industrivarden AB14
SEK 0.000%Sweden
1.02969,001Total - Sweden
1,600,000 1,314,297 1.3906.11.22Hon Hai PrecisionIndustry Co Ltd 17
USD 0.000%Taiwan
1.391,314,297Total - Taiwan
2,000,000 2,047,200 2.1602.04.19Magyar NemzetiVagyonkezelo Zrt 13
EUR 3.375%Hungary
2.162,047,200Total - Hungary
2,000,000 1,716,786 1.8119.06.24DP World Ltd 14USD 1.750%United Arab Emirates
1.811,716,786Total - United Arab Emirates
1,500,000 1,648,041 1.7402.11.20National Grid NorthAmerica Inc 15EMTN
GBP 0.900%United States
1.741,648,041Total - United States
1,200,000 1,427,676 1.5125.01.21Technip SA 16EUR 0.880%United Kingdom
900,000 1,271,853 1.3428.04.23BP Capital MarketsPLC 16
GBP 1.000%
1,000,000 1,069,303 1.1326.11.20Vodafone GroupPLC 15 EMTN
GBP 0.000%
60.0356,879,668Total - Bonds
3.983,768,832Total - United Kingdom
Securities Marketvalue in
EUR
% of netassets*
Quantity Ccy Maturity
700,000 601,188 0.6325.01.23Shizuoka BankLtd/The 18 FRN
USD
Convertible Bonds - Floating RateJapan
64.6861,293,623Total - Transferable securities admitted to anofficial exchange
0.63601,188Total - Convertible Bonds - Floating Rate
0.63601,188Total - Japan
8,000,000 847,066 0.8925.10.21HaitongInternationalSecurities Group Ltd16
HKD 0.000%
Transferable securities and money market instruments dealt in on anotherregulated marketBondsBermuda Islands
0.89847,066Total - Bermuda Islands
2,000,000 1,849,730 1.9529.01.21China RailwayConstruction CorpLtd 16
USD 0.000%China
1,500,000 1,278,474 1.3505.02.21CRRC Corp Ltd 16USD 0.000%3.303,128,204Total - China
100,000,000 784,314 0.8330.08.19HIS Co Ltd 14JPY 0.000%Japan
60,000,000 463,905 0.4920.09.24Hosiden Corp 17JPY 0.000%140,000,000 1,100,362 1.1718.06.20Iida Group Holdings
Co Ltd 15JPY 0.000%
60,000,000 507,765 0.5431.03.21Kandenko Co Ltd 16JPY 0.000%100,000,000 770,927 0.8104.03.22LIXIL Group Corp
15JPY 0.000%
20,000,000 174,410 0.1807.10.22Medipal HoldingsCorp 17
JPY 0.000%
60,000,000 524,563 0.5529.01.21Nipro Corp 16JPY 0.000%100,000,000 859,413 0.9122.03.21Relo Group Inc 18JPY 0.000%80,000,000 681,590 0.7228.03.22Senko Group
Holdings Co Ltd 17JPY 0.000%
120,000,000 952,329 1.0016.10.20Shimizu Corp 15JPY 0.000%30,000,000 246,797 0.2623.06.23Toho Holdings Co
Ltd 18JPY 0.000%
1,000,000 907,607 0.9620.09.19NHK Spring Co Ltd14
USD 0.000%
8.427,973,982Total - Japan
3,000,000 2,949,480 3.1128.05.20America Movil SABde CV 15
EUR 0.000%Mexico
3.112,949,480Total - Mexico
700,000 648,861 0.6801.12.19NXPSemiconductors NV14
USD 1.000%Netherlands
0.68648,861Total - Netherlands
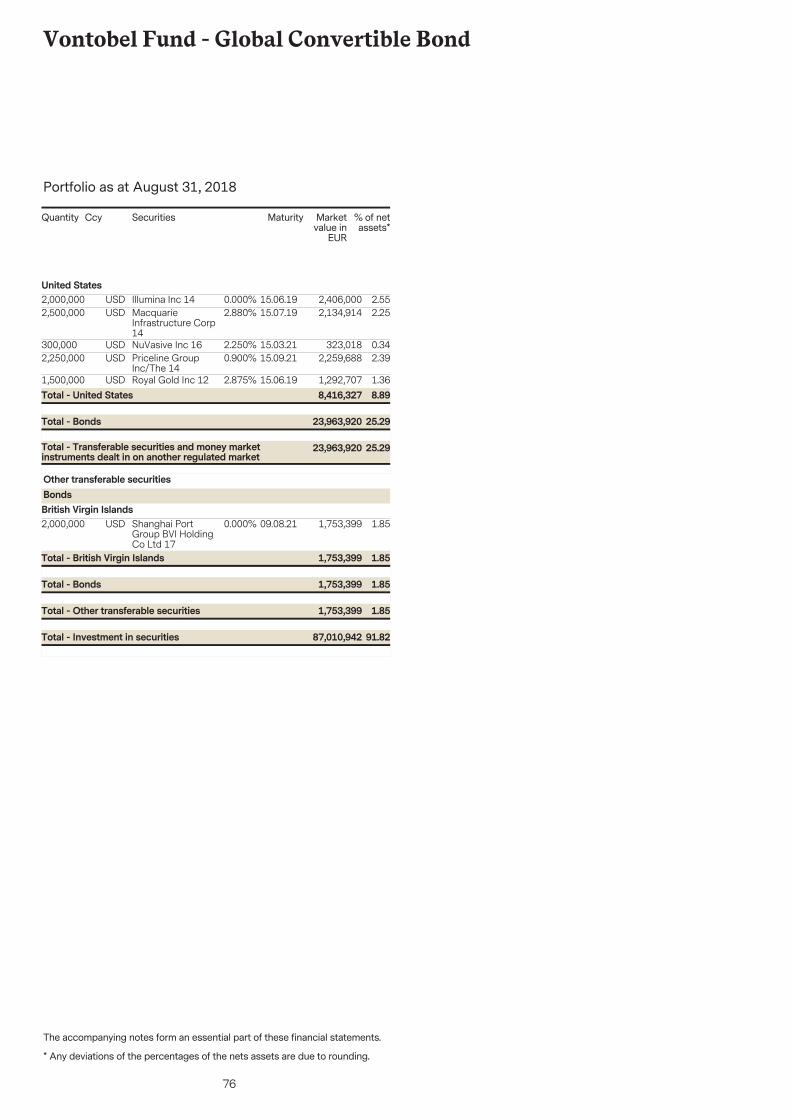
76
Vontobel Fund - Global Convertible Bond
The accompanying notes form an essential part of these financial statements.
Portfolio as at August 31, 2018
* Any deviations of the percentages of the nets assets are due to rounding.
Securities Marketvalue in
EUR
% of netassets*
Quantity Ccy Maturity
2,000,000 2,406,000 2.5515.06.19Illumina Inc 14USD 0.000%United States
2,500,000 2,134,914 2.2515.07.19MacquarieInfrastructure Corp14
USD 2.880%
300,000 323,018 0.3415.03.21NuVasive Inc 16USD 2.250%2,250,000 2,259,688 2.3915.09.21Priceline Group
Inc/The 14USD 0.900%
1,500,000 1,292,707 1.3615.06.19Royal Gold Inc 12USD 2.875%
25.2923,963,920Total - Transferable securities and money marketinstruments dealt in on another regulated market
25.2923,963,920Total - Bonds
8.898,416,327Total - United States
2,000,000 1,753,399 1.8509.08.21Shanghai PortGroup BVI HoldingCo Ltd 17
USD 0.000%
Other transferable securitiesBondsBritish Virgin Islands
1.851,753,399Total - Other transferable securities
1.851,753,399Total - Bonds
1.851,753,399Total - British Virgin Islands
91.8287,010,942Total - Investment in securities
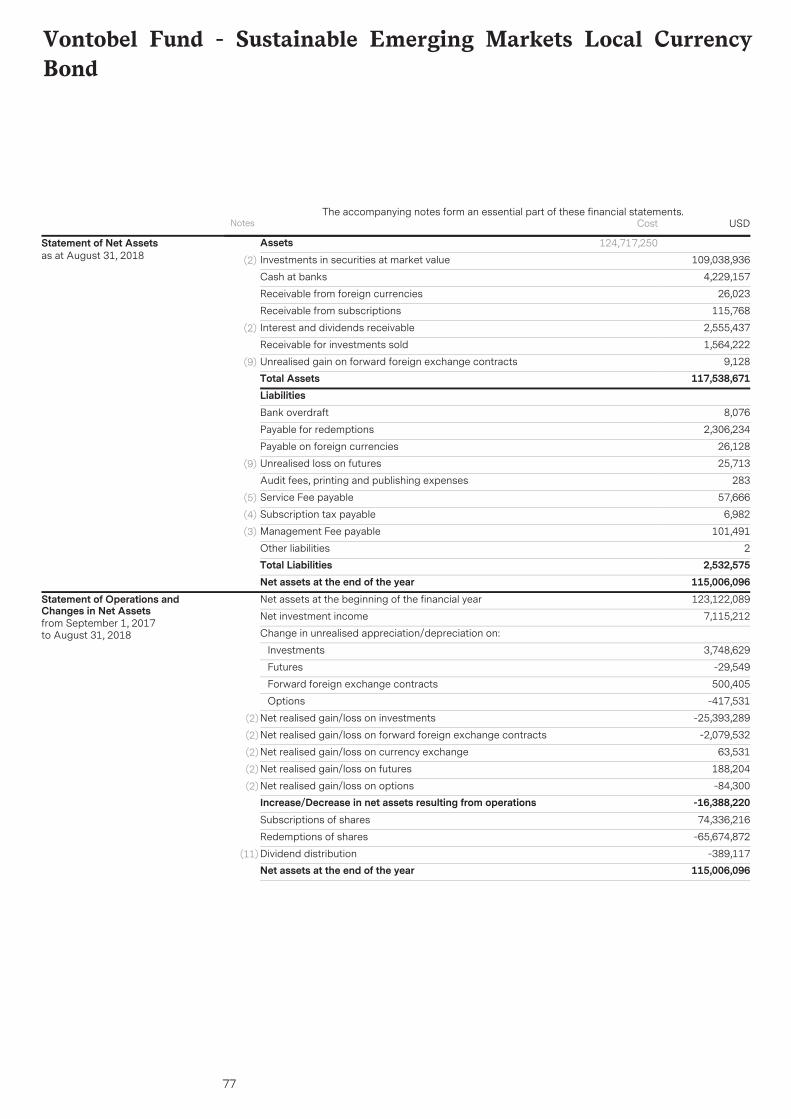
77
Vontobel Fund - Sustainable Emerging Markets Local CurrencyBond
AssetsInvestments in securities at market value 109,038,936(2)
4,229,157Cash at banks
26,023Receivable from foreign currencies
115,768Receivable from subscriptions
2,555,437Interest and dividends receivable(2)
1,564,222Receivable for investments sold
9,128Unrealised gain on forward foreign exchange contracts(9)
Total Assets 117,538,671
124,717,250Statement of Net Assetsas at August 31, 2018
LiabilitiesBank overdraft 8,076
Payable for redemptions 2,306,234
Payable on foreign currencies 26,128
Unrealised loss on futures 25,713(9)
Audit fees, printing and publishing expenses 283
Service Fee payable 57,666(5)
Subscription tax payable 6,982(4)
Management Fee payable 101,491(3)
Other liabilities 2Total Liabilities 2,532,575Net assets at the end of the year 115,006,096Net assets at the beginning of the financial year 123,122,089
Net investment income 7,115,212
Change in unrealised appreciation/depreciation on:
Investments 3,748,629
Futures -29,549
Forward foreign exchange contracts 500,405
Options -417,531
Net realised gain/loss on investments -25,393,289(2)
Net realised gain/loss on forward foreign exchange contracts -2,079,532(2)
Net realised gain/loss on currency exchange 63,531(2)
Net realised gain/loss on futures 188,204(2)
Net realised gain/loss on options -84,300(2)
Increase/Decrease in net assets resulting from operations -16,388,220Subscriptions of shares 74,336,216
Redemptions of shares -65,674,872
Dividend distribution -389,117(11)
Net assets at the end of the year 115,006,096
Statement of Operations andChanges in Net Assetsfrom September 1, 2017to August 31, 2018
Notes USDThe accompanying notes form an essential part of these financial statements.
Cost
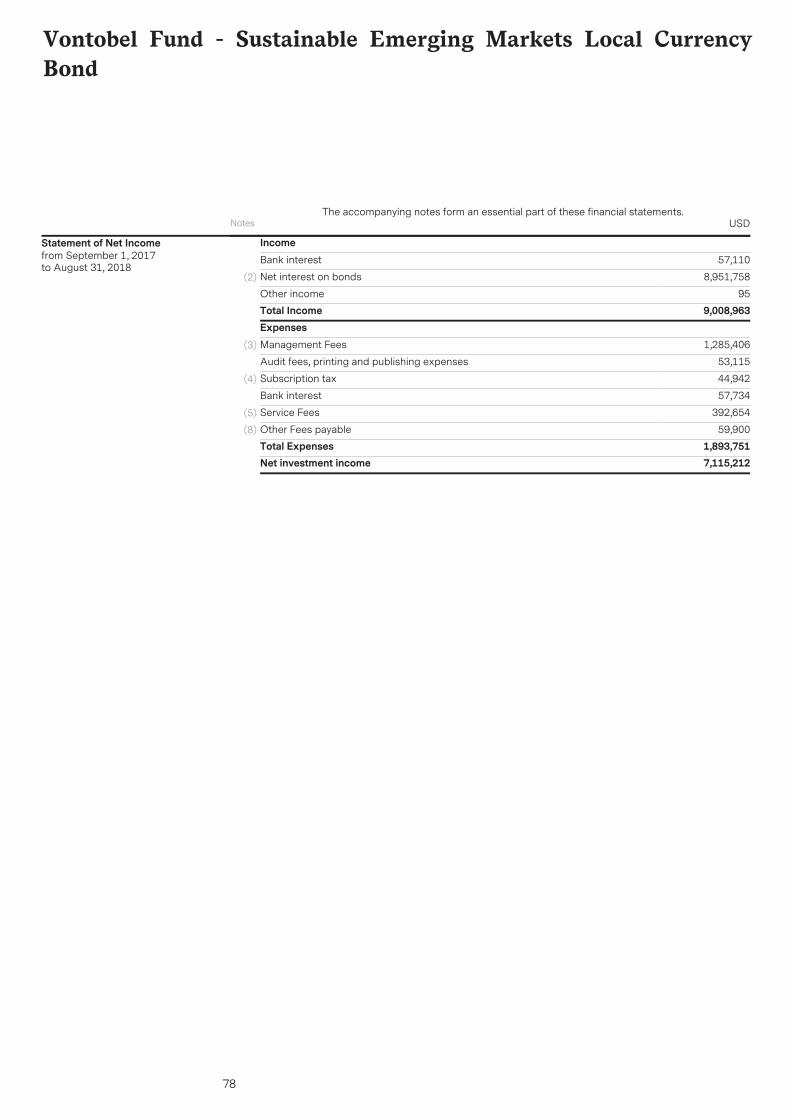
78
Vontobel Fund - Sustainable Emerging Markets Local CurrencyBond
IncomeBank interest 57,110
Net interest on bonds 8,951,758(2)
Other income 95Total Income 9,008,963ExpensesManagement Fees 1,285,406(3)
Audit fees, printing and publishing expenses 53,115
Subscription tax 44,942(4)
Bank interest 57,734
Service Fees 392,654(5)
Other Fees payable 59,900(8)
Total Expenses 1,893,751Net investment income 7,115,212
Statement of Net Incomefrom September 1, 2017to August 31, 2018
Notes USDThe accompanying notes form an essential part of these financial statements.
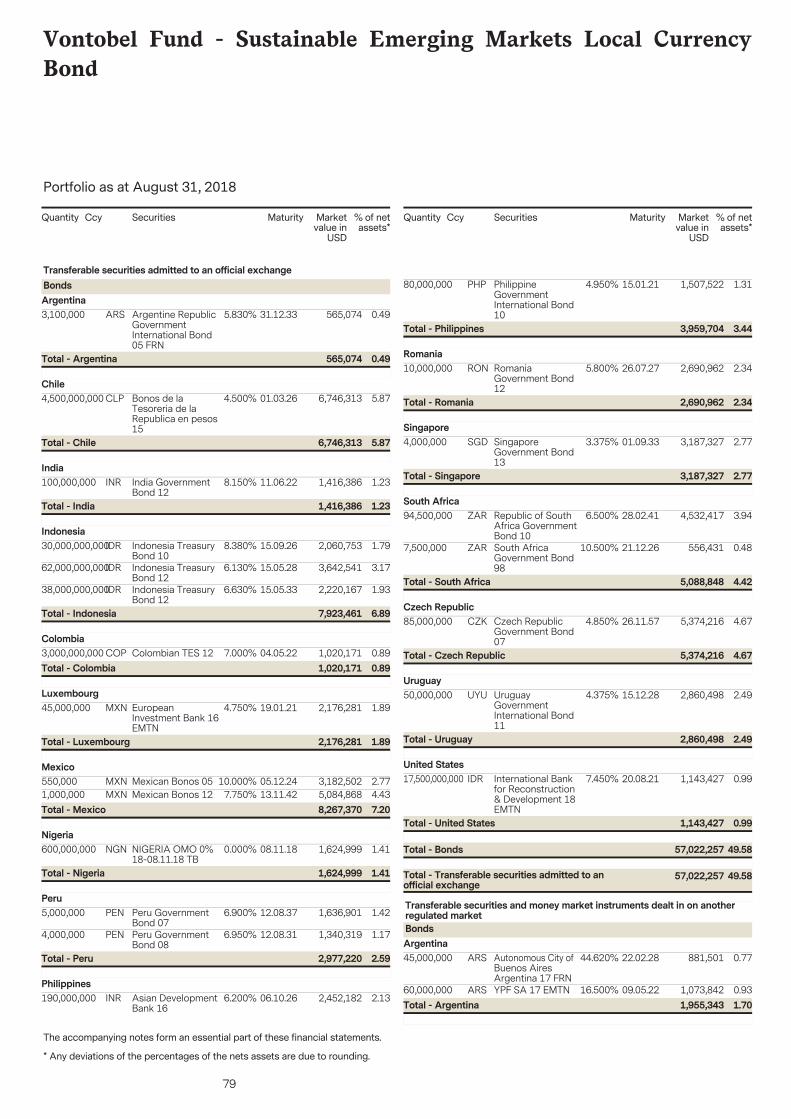
79
Vontobel Fund - Sustainable Emerging Markets Local CurrencyBond
The accompanying notes form an essential part of these financial statements.
Portfolio as at August 31, 2018
* Any deviations of the percentages of the nets assets are due to rounding.** See note 10
Securities Marketvalue in
USD
% of netassets*
Quantity Ccy Maturity
3,100,000 565,074 0.4931.12.33Argentine RepublicGovernmentInternational Bond05 FRN
ARS 5.830%
Transferable securities admitted to an official exchangeBondsArgentina
0.49565,074Total - Argentina
4,500,000,000 6,746,313 5.8701.03.26Bonos de laTesoreria de laRepublica en pesos15
CLP 4.500%Chile
5.876,746,313Total - Chile
100,000,000 1,416,386 1.2311.06.22India GovernmentBond 12
INR 8.150%India
1.231,416,386Total - India
30,000,000,000 2,060,753 1.7915.09.26Indonesia TreasuryBond 10
IDR 8.380%Indonesia
62,000,000,000 3,642,541 3.1715.05.28Indonesia TreasuryBond 12
IDR 6.130%
38,000,000,000 2,220,167 1.9315.05.33Indonesia TreasuryBond 12
IDR 6.630%
6.897,923,461Total - Indonesia
3,000,000,000 1,020,171 0.8904.05.22Colombian TES 12COP 7.000%Colombia
0.891,020,171Total - Colombia
45,000,000 2,176,281 1.8919.01.21EuropeanInvestment Bank 16EMTN
MXN 4.750%Luxembourg
1.892,176,281Total - Luxembourg
550,000 3,182,502 2.7705.12.24Mexican Bonos 05MXN 10.000%Mexico
1,000,000 5,084,868 4.4313.11.42Mexican Bonos 12MXN 7.750%7.208,267,370Total - Mexico
600,000,000 1,624,999 1.4108.11.18NIGERIA OMO 0%18-08.11.18 TB
NGN 0.000%Nigeria
1.411,624,999Total - Nigeria
5,000,000 1,636,901 1.4212.08.37Peru GovernmentBond 07
PEN 6.900%Peru
4,000,000 1,340,319 1.1712.08.31Peru GovernmentBond 08
PEN 6.950%
2.592,977,220Total - Peru
190,000,000 2,452,182 2.1306.10.26Asian DevelopmentBank 16
INR 6.200%Philippines
Securities Marketvalue in
USD
% of netassets*
Quantity Ccy Maturity
80,000,000 1,507,522 1.3115.01.21PhilippineGovernmentInternational Bond10
PHP 4.950%
3.443,959,704Total - Philippines
10,000,000 2,690,962 2.3426.07.27RomaniaGovernment Bond12
RON 5.800%Romania
2.342,690,962Total - Romania
4,000,000 3,187,327 2.7701.09.33SingaporeGovernment Bond13
SGD 3.375%Singapore
2.773,187,327Total - Singapore
94,500,000 4,532,417 3.9428.02.41Republic of SouthAfrica GovernmentBond 10
ZAR 6.500%South Africa
7,500,000 556,431 0.4821.12.26South AfricaGovernment Bond98
ZAR 10.500%
4.425,088,848Total - South Africa
85,000,000 5,374,216 4.6726.11.57Czech RepublicGovernment Bond07
CZK 4.850%Czech Republic
4.675,374,216Total - Czech Republic
50,000,000 2,860,498 2.4915.12.28UruguayGovernmentInternational Bond11
UYU 4.375%Uruguay
2.492,860,498Total - Uruguay
17,500,000,000 1,143,427 0.9920.08.21International Bankfor Reconstruction& Development 18EMTN
IDR 7.450%United States
49.5857,022,257Total - Transferable securities admitted to anofficial exchange
49.5857,022,257Total - Bonds
0.991,143,427Total - United States
45,000,000 881,501 0.7722.02.28Autonomous City ofBuenos AiresArgentina 17 FRN
ARS 44.620%
Transferable securities and money market instruments dealt in on anotherregulated marketBondsArgentina
60,000,000 1,073,842 0.9309.05.22YPF SA 17 EMTNARS 16.500%1.701,955,343Total - Argentina
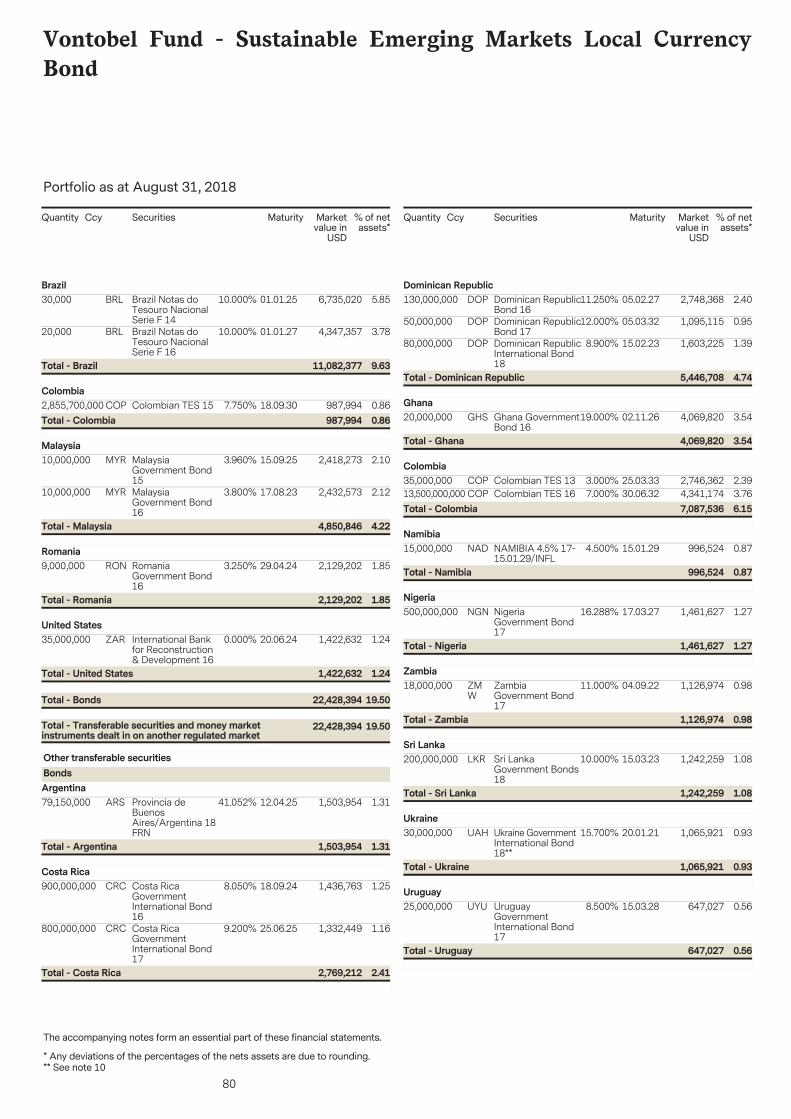
80
Vontobel Fund - Sustainable Emerging Markets Local CurrencyBond
The accompanying notes form an essential part of these financial statements.
Portfolio as at August 31, 2018
* Any deviations of the percentages of the nets assets are due to rounding.** See note 10
Securities Marketvalue in
USD
% of netassets*
Quantity Ccy Maturity
30,000 6,735,020 5.8501.01.25Brazil Notas doTesouro NacionalSerie F 14
BRL 10.000%Brazil
20,000 4,347,357 3.7801.01.27Brazil Notas doTesouro NacionalSerie F 16
BRL 10.000%
9.6311,082,377Total - Brazil
2,855,700,000 987,994 0.8618.09.30Colombian TES 15COP 7.750%Colombia
0.86987,994Total - Colombia
10,000,000 2,418,273 2.1015.09.25MalaysiaGovernment Bond15
MYR 3.960%Malaysia
10,000,000 2,432,573 2.1217.08.23MalaysiaGovernment Bond16
MYR 3.800%
4.224,850,846Total - Malaysia
9,000,000 2,129,202 1.8529.04.24RomaniaGovernment Bond16
RON 3.250%Romania
1.852,129,202Total - Romania
35,000,000 1,422,632 1.2420.06.24International Bankfor Reconstruction& Development 16
ZAR 0.000%United States
19.5022,428,394Total - Transferable securities and money marketinstruments dealt in on another regulated market
19.5022,428,394Total - Bonds
1.241,422,632Total - United States
79,150,000 1,503,954 1.3112.04.25Provincia deBuenosAires/Argentina 18FRN
ARS 41.052%
Other transferable securitiesBondsArgentina
1.311,503,954Total - Argentina
900,000,000 1,436,763 1.2518.09.24Costa RicaGovernmentInternational Bond16
CRC 8.050%Costa Rica
800,000,000 1,332,449 1.1625.06.25Costa RicaGovernmentInternational Bond17
CRC 9.200%
2.412,769,212Total - Costa Rica
Securities Marketvalue in
USD
% of netassets*
Quantity Ccy Maturity
130,000,000 2,748,368 2.4005.02.27Dominican RepublicBond 16
DOP 11.250%Dominican Republic
50,000,000 1,095,115 0.9505.03.32Dominican RepublicBond 17
DOP 12.000%
80,000,000 1,603,225 1.3915.02.23Dominican RepublicInternational Bond18
DOP 8.900%
4.745,446,708Total - Dominican Republic
20,000,000 4,069,820 3.5402.11.26Ghana GovernmentBond 16
GHS 19.000%Ghana
3.544,069,820Total - Ghana
35,000,000 2,746,362 2.3925.03.33Colombian TES 13COP 3.000%Colombia
13,500,000,000 4,341,174 3.7630.06.32Colombian TES 16COP 7.000%6.157,087,536Total - Colombia
15,000,000 996,524 0.8715.01.29NAMIBIA 4.5% 17-15.01.29/INFL
NAD 4.500%Namibia
0.87996,524Total - Namibia
500,000,000 1,461,627 1.2717.03.27NigeriaGovernment Bond17
NGN 16.288%Nigeria
1.271,461,627Total - Nigeria
18,000,000 1,126,974 0.9804.09.22ZambiaGovernment Bond17
ZMW
11.000%Zambia
0.981,126,974Total - Zambia
200,000,000 1,242,259 1.0815.03.23Sri LankaGovernment Bonds18
LKR 10.000%Sri Lanka
1.081,242,259Total - Sri Lanka
30,000,000 1,065,921 0.9320.01.21Ukraine GovernmentInternational Bond18**
UAH 15.700%Ukraine
0.931,065,921Total - Ukraine
25,000,000 647,027 0.5615.03.28UruguayGovernmentInternational Bond17
UYU 8.500%Uruguay
0.56647,027Total - Uruguay
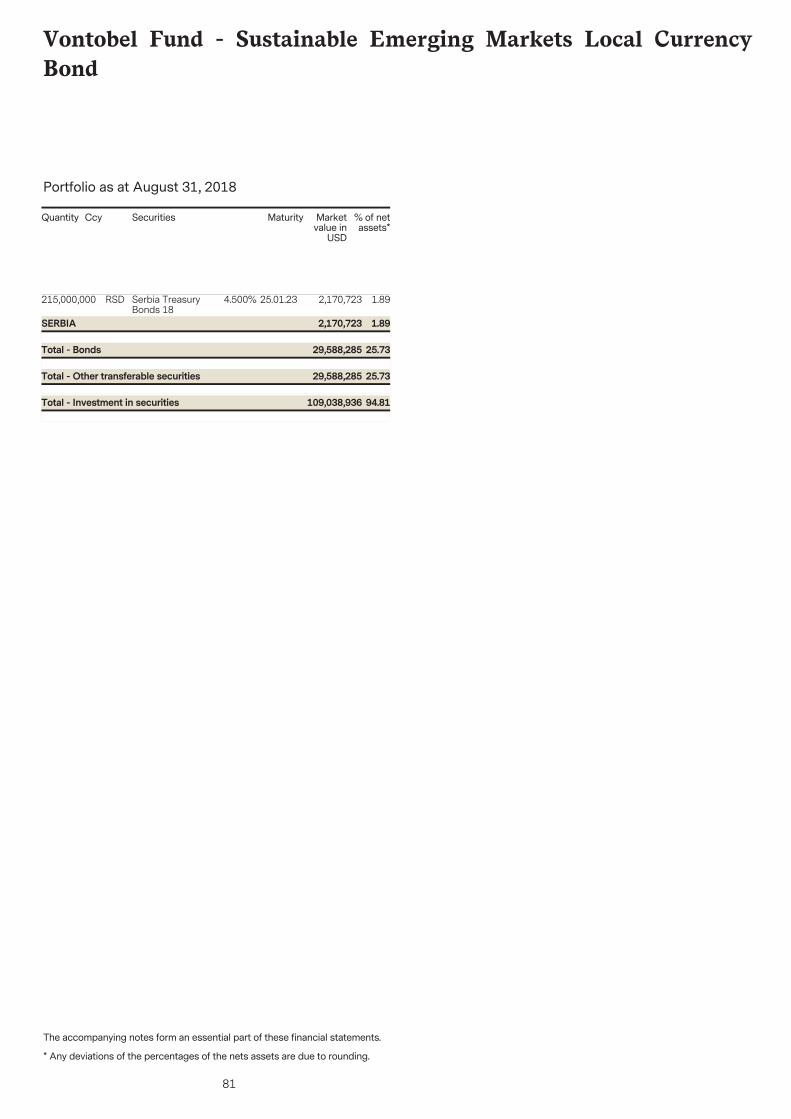
81
Vontobel Fund - Sustainable Emerging Markets Local CurrencyBond
The accompanying notes form an essential part of these financial statements.
Portfolio as at August 31, 2018
* Any deviations of the percentages of the nets assets are due to rounding.** See note 10
Securities Marketvalue in
USD
% of netassets*
Quantity Ccy Maturity
215,000,000 2,170,723 1.8925.01.23Serbia TreasuryBonds 18
RSD 4.500%
25.7329,588,285Total - Other transferable securities
25.7329,588,285Total - Bonds
1.892,170,723SERBIA
94.81109,038,936Total - Investment in securities
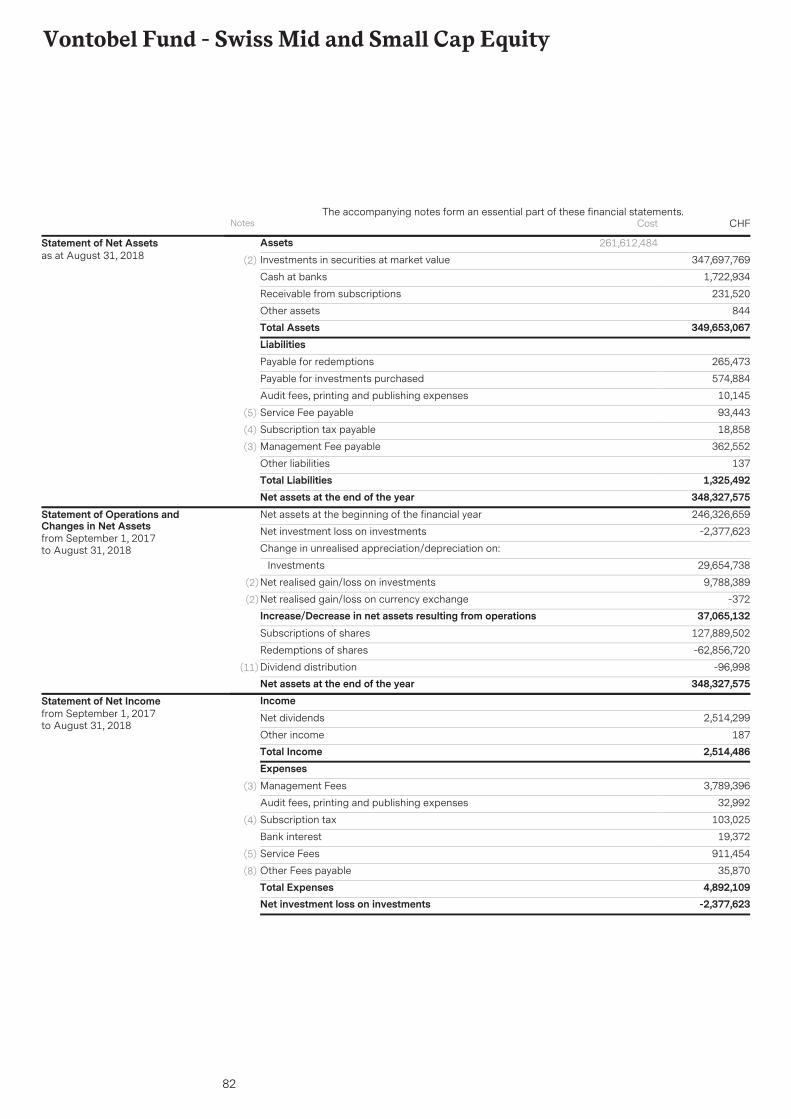
82
Vontobel Fund - Swiss Mid and Small Cap Equity
AssetsInvestments in securities at market value 347,697,769(2)
1,722,934Cash at banks
231,520Receivable from subscriptions
844Other assetsTotal Assets 349,653,067
261,612,484Statement of Net Assetsas at August 31, 2018
LiabilitiesPayable for redemptions 265,473
Payable for investments purchased 574,884
Audit fees, printing and publishing expenses 10,145
Service Fee payable 93,443(5)
Subscription tax payable 18,858(4)
Management Fee payable 362,552(3)
Other liabilities 137Total Liabilities 1,325,492Net assets at the end of the year 348,327,575Net assets at the beginning of the financial year 246,326,659
Net investment loss on investments -2,377,623
Change in unrealised appreciation/depreciation on:
Investments 29,654,738
Net realised gain/loss on investments 9,788,389(2)
Net realised gain/loss on currency exchange -372(2)
Increase/Decrease in net assets resulting from operations 37,065,132Subscriptions of shares 127,889,502
Redemptions of shares -62,856,720
Dividend distribution -96,998(11)
Net assets at the end of the year 348,327,575
Statement of Operations andChanges in Net Assetsfrom September 1, 2017to August 31, 2018
IncomeNet dividends 2,514,299
Other income 187Total Income 2,514,486ExpensesManagement Fees 3,789,396(3)
Audit fees, printing and publishing expenses 32,992
Subscription tax 103,025(4)
Bank interest 19,372
Service Fees 911,454(5)
Other Fees payable 35,870(8)
Total Expenses 4,892,109Net investment loss on investments -2,377,623
Statement of Net Incomefrom September 1, 2017to August 31, 2018
Notes CHFThe accompanying notes form an essential part of these financial statements.
Cost
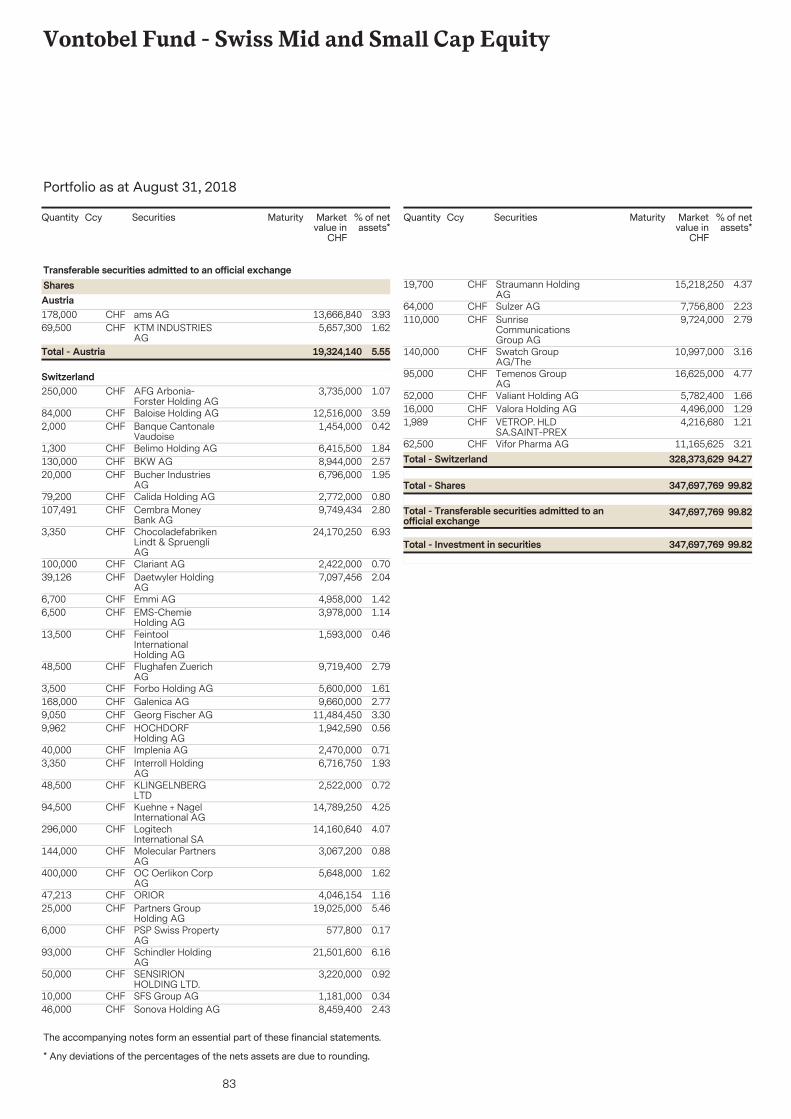
83
Vontobel Fund - Swiss Mid and Small Cap Equity
The accompanying notes form an essential part of these financial statements.
Portfolio as at August 31, 2018
* Any deviations of the percentages of the nets assets are due to rounding.
Securities Marketvalue in
CHF
% of netassets*
Quantity Ccy Maturity
178,000 13,666,840 3.93ams AGCHF
Transferable securities admitted to an official exchangeSharesAustria
69,500 5,657,300 1.62KTM INDUSTRIESAG
CHF
5.5519,324,140Total - Austria
250,000 3,735,000 1.07AFG Arbonia-Forster Holding AG
CHFSwitzerland
84,000 12,516,000 3.59Baloise Holding AGCHF2,000 1,454,000 0.42Banque Cantonale
VaudoiseCHF
1,300 6,415,500 1.84Belimo Holding AGCHF130,000 8,944,000 2.57BKW AGCHF20,000 6,796,000 1.95Bucher Industries
AGCHF
79,200 2,772,000 0.80Calida Holding AGCHF107,491 9,749,434 2.80Cembra Money
Bank AGCHF
3,350 24,170,250 6.93ChocoladefabrikenLindt & SpruengliAG
CHF
100,000 2,422,000 0.70Clariant AGCHF39,126 7,097,456 2.04Daetwyler Holding
AGCHF
6,700 4,958,000 1.42Emmi AGCHF6,500 3,978,000 1.14EMS-Chemie
Holding AGCHF
13,500 1,593,000 0.46FeintoolInternationalHolding AG
CHF
48,500 9,719,400 2.79Flughafen ZuerichAG
CHF
3,500 5,600,000 1.61Forbo Holding AGCHF168,000 9,660,000 2.77Galenica AGCHF9,050 11,484,450 3.30Georg Fischer AGCHF9,962 1,942,590 0.56HOCHDORF
Holding AGCHF
40,000 2,470,000 0.71Implenia AGCHF3,350 6,716,750 1.93Interroll Holding
AGCHF
48,500 2,522,000 0.72KLINGELNBERGLTD
CHF
94,500 14,789,250 4.25Kuehne + NagelInternational AG
CHF
296,000 14,160,640 4.07LogitechInternational SA
CHF
144,000 3,067,200 0.88Molecular PartnersAG
CHF
400,000 5,648,000 1.62OC Oerlikon CorpAG
CHF
47,213 4,046,154 1.16ORIORCHF25,000 19,025,000 5.46Partners Group
Holding AGCHF
6,000 577,800 0.17PSP Swiss PropertyAG
CHF
93,000 21,501,600 6.16Schindler HoldingAG
CHF
50,000 3,220,000 0.92SENSIRIONHOLDING LTD.
CHF
10,000 1,181,000 0.34SFS Group AGCHF46,000 8,459,400 2.43Sonova Holding AGCHF
Securities Marketvalue in
CHF
% of netassets*
Quantity Ccy Maturity
19,700 15,218,250 4.37Straumann HoldingAG
CHF
64,000 7,756,800 2.23Sulzer AGCHF110,000 9,724,000 2.79Sunrise
CommunicationsGroup AG
CHF
140,000 10,997,000 3.16Swatch GroupAG/The
CHF
95,000 16,625,000 4.77Temenos GroupAG
CHF
52,000 5,782,400 1.66Valiant Holding AGCHF16,000 4,496,000 1.29Valora Holding AGCHF1,989 4,216,680 1.21VETROP. HLD
SA.SAINT-PREXCHF
62,500 11,165,625 3.21Vifor Pharma AGCHF
99.82347,697,769Total - Transferable securities admitted to anofficial exchange
99.82347,697,769Total - Shares
94.27328,373,629Total - Switzerland
99.82347,697,769Total - Investment in securities
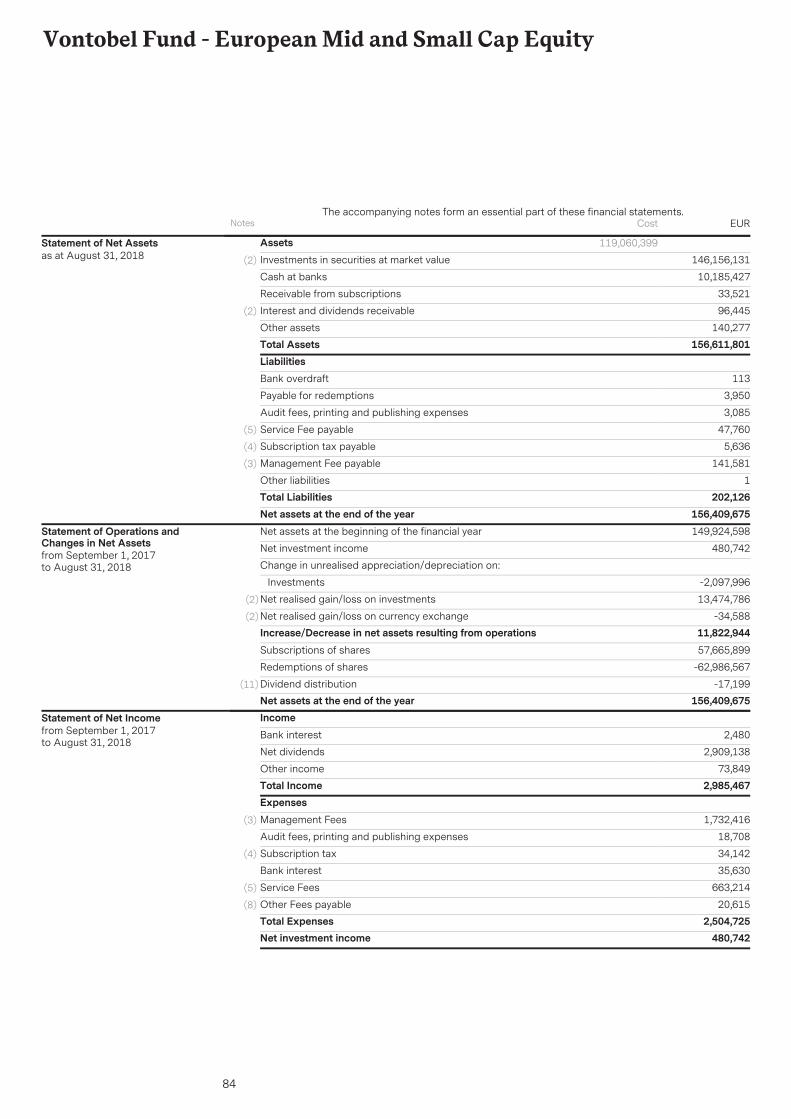
84
Vontobel Fund - European Mid and Small Cap Equity
AssetsInvestments in securities at market value 146,156,131(2)
10,185,427Cash at banks
33,521Receivable from subscriptions
96,445Interest and dividends receivable(2)
140,277Other assetsTotal Assets 156,611,801
119,060,399Statement of Net Assetsas at August 31, 2018
LiabilitiesBank overdraft 113
Payable for redemptions 3,950
Audit fees, printing and publishing expenses 3,085
Service Fee payable 47,760(5)
Subscription tax payable 5,636(4)
Management Fee payable 141,581(3)
Other liabilities 1Total Liabilities 202,126Net assets at the end of the year 156,409,675Net assets at the beginning of the financial year 149,924,598
Net investment income 480,742
Change in unrealised appreciation/depreciation on:
Investments -2,097,996
Net realised gain/loss on investments 13,474,786(2)
Net realised gain/loss on currency exchange -34,588(2)
Increase/Decrease in net assets resulting from operations 11,822,944Subscriptions of shares 57,665,899
Redemptions of shares -62,986,567
Dividend distribution -17,199(11)
Net assets at the end of the year 156,409,675
Statement of Operations andChanges in Net Assetsfrom September 1, 2017to August 31, 2018
IncomeBank interest 2,480
Net dividends 2,909,138
Other income 73,849Total Income 2,985,467ExpensesManagement Fees 1,732,416(3)
Audit fees, printing and publishing expenses 18,708
Subscription tax 34,142(4)
Bank interest 35,630
Service Fees 663,214(5)
Other Fees payable 20,615(8)
Total Expenses 2,504,725Net investment income 480,742
Statement of Net Incomefrom September 1, 2017to August 31, 2018
Notes EURThe accompanying notes form an essential part of these financial statements.
Cost
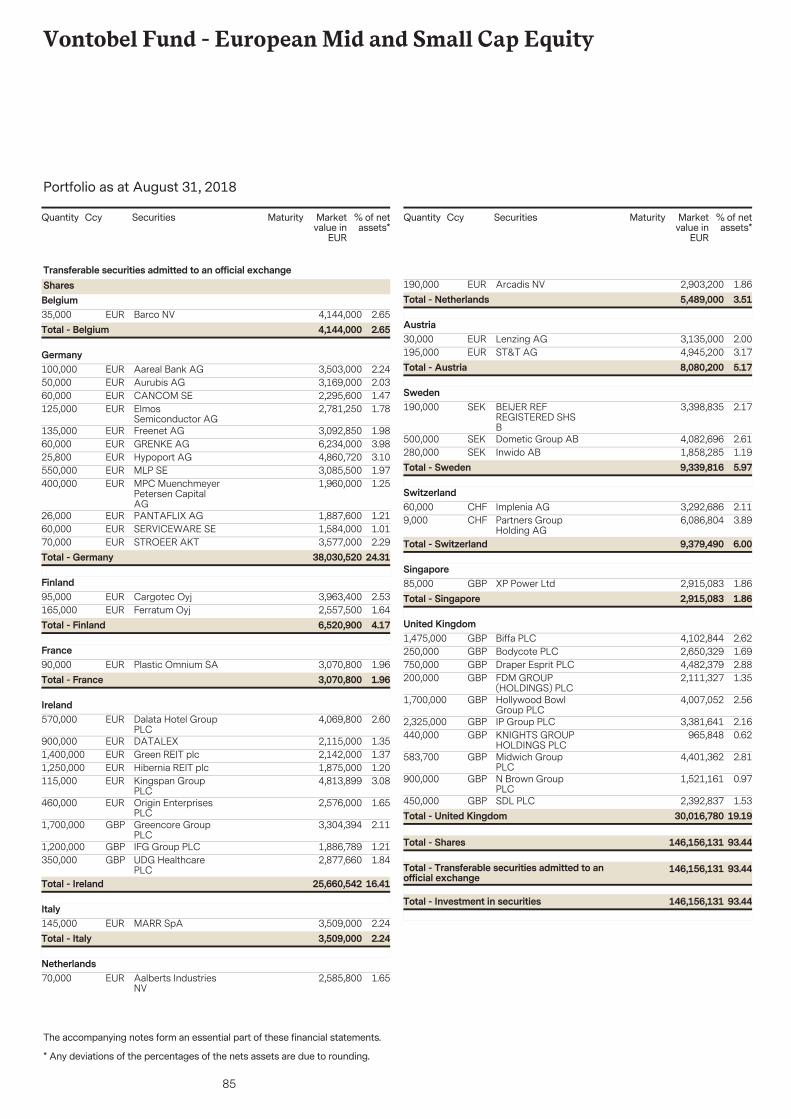
85
Vontobel Fund - European Mid and Small Cap Equity
The accompanying notes form an essential part of these financial statements.
Portfolio as at August 31, 2018
* Any deviations of the percentages of the nets assets are due to rounding.
Securities Marketvalue in
EUR
% of netassets*
Quantity Ccy Maturity
35,000 4,144,000 2.65Barco NVEUR
Transferable securities admitted to an official exchangeSharesBelgium
2.654,144,000Total - Belgium
100,000 3,503,000 2.24Aareal Bank AGEURGermany
50,000 3,169,000 2.03Aurubis AGEUR60,000 2,295,600 1.47CANCOM SEEUR125,000 2,781,250 1.78Elmos
Semiconductor AGEUR
135,000 3,092,850 1.98Freenet AGEUR60,000 6,234,000 3.98GRENKE AGEUR25,800 4,860,720 3.10Hypoport AGEUR550,000 3,085,500 1.97MLP SEEUR400,000 1,960,000 1.25MPC Muenchmeyer
Petersen CapitalAG
EUR
26,000 1,887,600 1.21PANTAFLIX AGEUR60,000 1,584,000 1.01SERVICEWARE SEEUR70,000 3,577,000 2.29STROEER AKTEUR
24.3138,030,520Total - Germany
95,000 3,963,400 2.53Cargotec OyjEURFinland
165,000 2,557,500 1.64Ferratum OyjEUR4.176,520,900Total - Finland
90,000 3,070,800 1.96Plastic Omnium SAEURFrance
1.963,070,800Total - France
570,000 4,069,800 2.60Dalata Hotel GroupPLC
EURIreland
900,000 2,115,000 1.35DATALEXEUR1,400,000 2,142,000 1.37Green REIT plcEUR1,250,000 1,875,000 1.20Hibernia REIT plcEUR115,000 4,813,899 3.08Kingspan Group
PLCEUR
460,000 2,576,000 1.65Origin EnterprisesPLC
EUR
1,700,000 3,304,394 2.11Greencore GroupPLC
GBP
1,200,000 1,886,789 1.21IFG Group PLCGBP350,000 2,877,660 1.84UDG Healthcare
PLCGBP
16.4125,660,542Total - Ireland
145,000 3,509,000 2.24MARR SpAEURItaly
2.243,509,000Total - Italy
70,000 2,585,800 1.65Aalberts IndustriesNV
EURNetherlands
Securities Marketvalue in
EUR
% of netassets*
Quantity Ccy Maturity
190,000 2,903,200 1.86Arcadis NVEUR3.515,489,000Total - Netherlands
30,000 3,135,000 2.00Lenzing AGEURAustria
195,000 4,945,200 3.17ST&T AGEUR5.178,080,200Total - Austria
190,000 3,398,835 2.17BEIJER REFREGISTERED SHSB
SEKSweden
500,000 4,082,696 2.61Dometic Group ABSEK280,000 1,858,285 1.19Inwido ABSEK
5.979,339,816Total - Sweden
60,000 3,292,686 2.11Implenia AGCHFSwitzerland
9,000 6,086,804 3.89Partners GroupHolding AG
CHF
6.009,379,490Total - Switzerland
85,000 2,915,083 1.86XP Power LtdGBPSingapore
1.862,915,083Total - Singapore
1,475,000 4,102,844 2.62Biffa PLCGBPUnited Kingdom
250,000 2,650,329 1.69Bodycote PLCGBP750,000 4,482,379 2.88Draper Esprit PLCGBP200,000 2,111,327 1.35FDM GROUP
(HOLDINGS) PLCGBP
1,700,000 4,007,052 2.56Hollywood BowlGroup PLC
GBP
2,325,000 3,381,641 2.16IP Group PLCGBP440,000 965,848 0.62KNIGHTS GROUP
HOLDINGS PLCGBP
583,700 4,401,362 2.81Midwich GroupPLC
GBP
900,000 1,521,161 0.97N Brown GroupPLC
GBP
450,000 2,392,837 1.53SDL PLCGBP
93.44146,156,131Total - Transferable securities admitted to anofficial exchange
93.44146,156,131Total - Shares
19.1930,016,780Total - United Kingdom
93.44146,156,131Total - Investment in securities
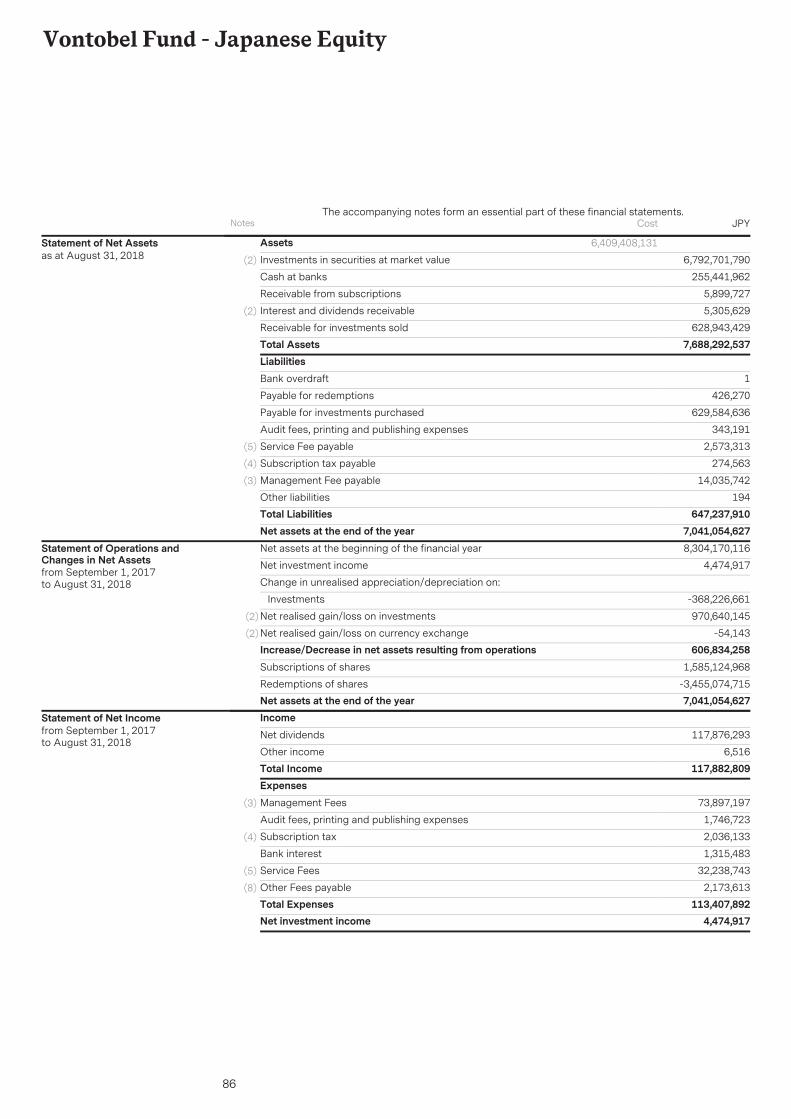
86
Vontobel Fund - Japanese Equity
AssetsInvestments in securities at market value 6,792,701,790(2)
255,441,962Cash at banks
5,899,727Receivable from subscriptions
5,305,629Interest and dividends receivable(2)
628,943,429Receivable for investments soldTotal Assets 7,688,292,537
6,409,408,131Statement of Net Assetsas at August 31, 2018
LiabilitiesBank overdraft 1
Payable for redemptions 426,270
Payable for investments purchased 629,584,636
Audit fees, printing and publishing expenses 343,191
Service Fee payable 2,573,313(5)
Subscription tax payable 274,563(4)
Management Fee payable 14,035,742(3)
Other liabilities 194Total Liabilities 647,237,910Net assets at the end of the year 7,041,054,627Net assets at the beginning of the financial year 8,304,170,116
Net investment income 4,474,917
Change in unrealised appreciation/depreciation on:
Investments -368,226,661
Net realised gain/loss on investments 970,640,145(2)
Net realised gain/loss on currency exchange -54,143(2)
Increase/Decrease in net assets resulting from operations 606,834,258Subscriptions of shares 1,585,124,968
Redemptions of shares -3,455,074,715Net assets at the end of the year 7,041,054,627
Statement of Operations andChanges in Net Assetsfrom September 1, 2017to August 31, 2018
IncomeNet dividends 117,876,293
Other income 6,516Total Income 117,882,809ExpensesManagement Fees 73,897,197(3)
Audit fees, printing and publishing expenses 1,746,723
Subscription tax 2,036,133(4)
Bank interest 1,315,483
Service Fees 32,238,743(5)
Other Fees payable 2,173,613(8)
Total Expenses 113,407,892Net investment income 4,474,917
Statement of Net Incomefrom September 1, 2017to August 31, 2018
Notes JPYThe accompanying notes form an essential part of these financial statements.
Cost
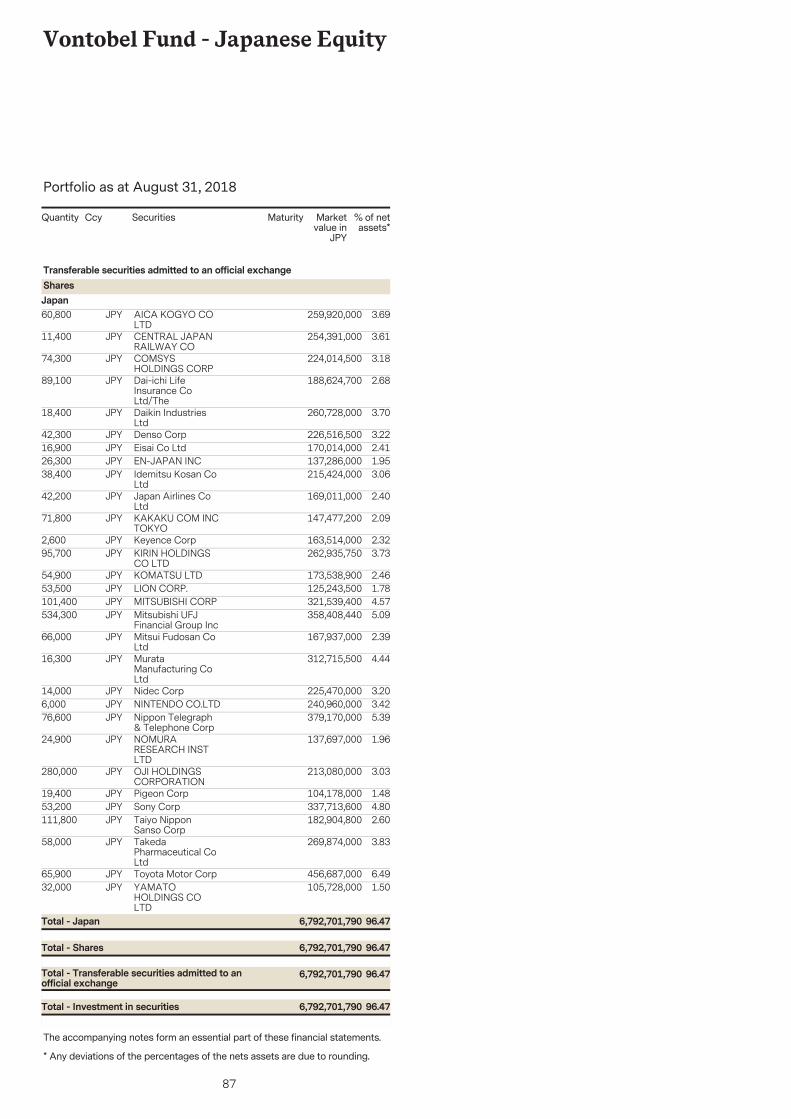
87
Vontobel Fund - Japanese Equity
The accompanying notes form an essential part of these financial statements.
Portfolio as at August 31, 2018
* Any deviations of the percentages of the nets assets are due to rounding.
Securities Marketvalue in
JPY
% of netassets*
Quantity Ccy Maturity
60,800 259,920,000 3.69AICA KOGYO COLTD
JPY
Transferable securities admitted to an official exchangeSharesJapan
11,400 254,391,000 3.61CENTRAL JAPANRAILWAY CO
JPY
74,300 224,014,500 3.18COMSYSHOLDINGS CORP
JPY
89,100 188,624,700 2.68Dai-ichi LifeInsurance CoLtd/The
JPY
18,400 260,728,000 3.70Daikin IndustriesLtd
JPY
42,300 226,516,500 3.22Denso CorpJPY16,900 170,014,000 2.41Eisai Co LtdJPY26,300 137,286,000 1.95EN-JAPAN INCJPY38,400 215,424,000 3.06Idemitsu Kosan Co
LtdJPY
42,200 169,011,000 2.40Japan Airlines CoLtd
JPY
71,800 147,477,200 2.09KAKAKU COM INCTOKYO
JPY
2,600 163,514,000 2.32Keyence CorpJPY95,700 262,935,750 3.73KIRIN HOLDINGS
CO LTDJPY
54,900 173,538,900 2.46KOMATSU LTDJPY53,500 125,243,500 1.78LION CORP.JPY101,400 321,539,400 4.57MITSUBISHI CORPJPY534,300 358,408,440 5.09Mitsubishi UFJ
Financial Group IncJPY
66,000 167,937,000 2.39Mitsui Fudosan CoLtd
JPY
16,300 312,715,500 4.44MurataManufacturing CoLtd
JPY
14,000 225,470,000 3.20Nidec CorpJPY6,000 240,960,000 3.42NINTENDO CO.LTDJPY76,600 379,170,000 5.39Nippon Telegraph
& Telephone CorpJPY
24,900 137,697,000 1.96NOMURARESEARCH INSTLTD
JPY
280,000 213,080,000 3.03OJI HOLDINGSCORPORATION
JPY
19,400 104,178,000 1.48Pigeon CorpJPY53,200 337,713,600 4.80Sony CorpJPY111,800 182,904,800 2.60Taiyo Nippon
Sanso CorpJPY
58,000 269,874,000 3.83TakedaPharmaceutical CoLtd
JPY
65,900 456,687,000 6.49Toyota Motor CorpJPY32,000 105,728,000 1.50YAMATO
HOLDINGS COLTD
JPY
96.476,792,701,790Total - Transferable securities admitted to anofficial exchange
96.476,792,701,790Total - Shares
96.476,792,701,790Total - Japan
96.476,792,701,790Total - Investment in securities
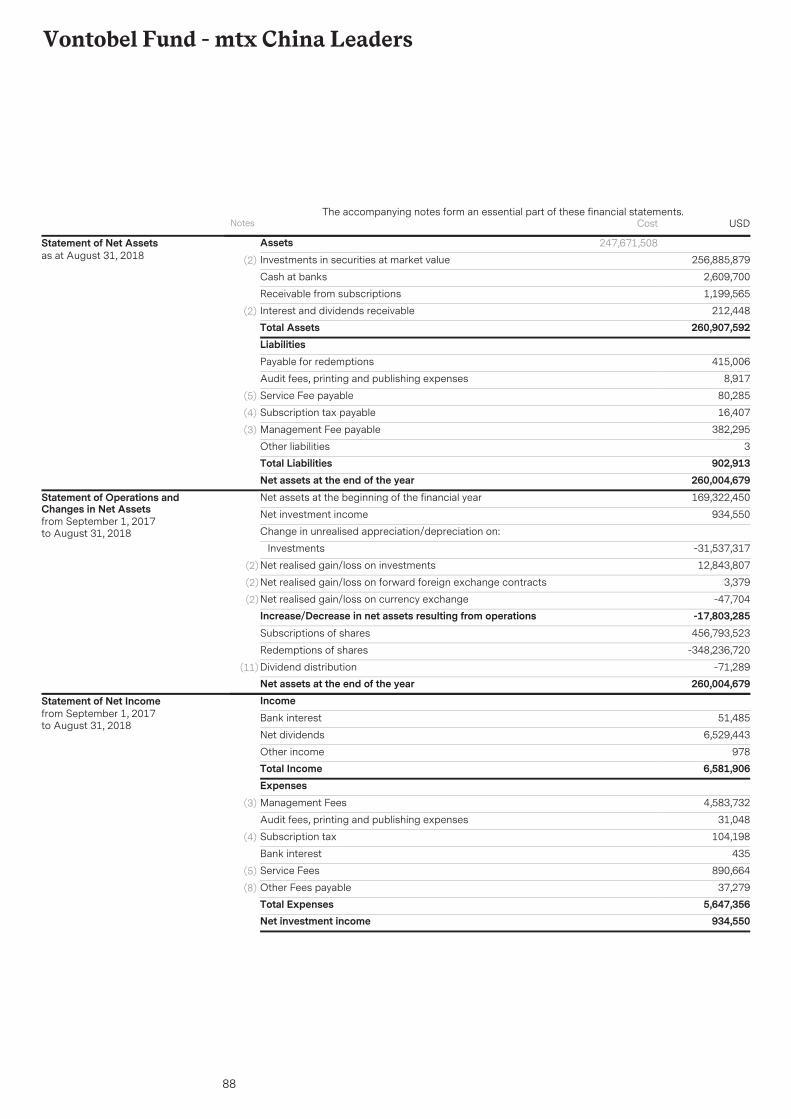
88
Vontobel Fund - mtx China Leaders
AssetsInvestments in securities at market value 256,885,879(2)
2,609,700Cash at banks
1,199,565Receivable from subscriptions
212,448Interest and dividends receivable(2)
Total Assets 260,907,592
247,671,508Statement of Net Assetsas at August 31, 2018
LiabilitiesPayable for redemptions 415,006
Audit fees, printing and publishing expenses 8,917
Service Fee payable 80,285(5)
Subscription tax payable 16,407(4)
Management Fee payable 382,295(3)
Other liabilities 3Total Liabilities 902,913Net assets at the end of the year 260,004,679Net assets at the beginning of the financial year 169,322,450
Net investment income 934,550
Change in unrealised appreciation/depreciation on:
Investments -31,537,317
Net realised gain/loss on investments 12,843,807(2)
Net realised gain/loss on forward foreign exchange contracts 3,379(2)
Net realised gain/loss on currency exchange -47,704(2)
Increase/Decrease in net assets resulting from operations -17,803,285Subscriptions of shares 456,793,523
Redemptions of shares -348,236,720
Dividend distribution -71,289(11)
Net assets at the end of the year 260,004,679
Statement of Operations andChanges in Net Assetsfrom September 1, 2017to August 31, 2018
IncomeBank interest 51,485
Net dividends 6,529,443
Other income 978Total Income 6,581,906ExpensesManagement Fees 4,583,732(3)
Audit fees, printing and publishing expenses 31,048
Subscription tax 104,198(4)
Bank interest 435
Service Fees 890,664(5)
Other Fees payable 37,279(8)
Total Expenses 5,647,356Net investment income 934,550
Statement of Net Incomefrom September 1, 2017to August 31, 2018
Notes USDThe accompanying notes form an essential part of these financial statements.
Cost
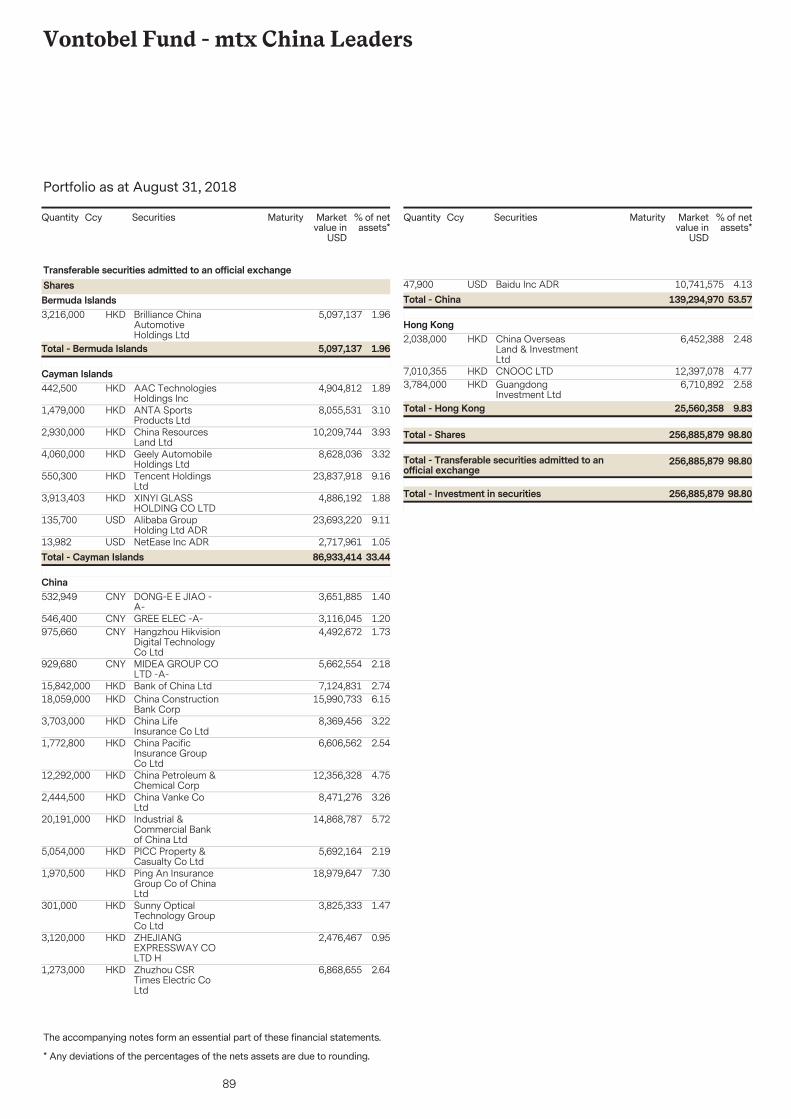
89
Vontobel Fund - mtx China Leaders
The accompanying notes form an essential part of these financial statements.
Portfolio as at August 31, 2018
* Any deviations of the percentages of the nets assets are due to rounding.
Securities Marketvalue in
USD
% of netassets*
Quantity Ccy Maturity
3,216,000 5,097,137 1.96Brilliance ChinaAutomotiveHoldings Ltd
HKD
Transferable securities admitted to an official exchangeSharesBermuda Islands
1.965,097,137Total - Bermuda Islands
442,500 4,904,812 1.89AAC TechnologiesHoldings Inc
HKDCayman Islands
1,479,000 8,055,531 3.10ANTA SportsProducts Ltd
HKD
2,930,000 10,209,744 3.93China ResourcesLand Ltd
HKD
4,060,000 8,628,036 3.32Geely AutomobileHoldings Ltd
HKD
550,300 23,837,918 9.16Tencent HoldingsLtd
HKD
3,913,403 4,886,192 1.88XINYI GLASSHOLDING CO LTD
HKD
135,700 23,693,220 9.11Alibaba GroupHolding Ltd ADR
USD
13,982 2,717,961 1.05NetEase Inc ADRUSD33.4486,933,414Total - Cayman Islands
532,949 3,651,885 1.40DONG-E E JIAO -A-
CNYChina
546,400 3,116,045 1.20GREE ELEC -A-CNY975,660 4,492,672 1.73Hangzhou Hikvision
Digital TechnologyCo Ltd
CNY
929,680 5,662,554 2.18MIDEA GROUP COLTD -A-
CNY
15,842,000 7,124,831 2.74Bank of China LtdHKD18,059,000 15,990,733 6.15China Construction
Bank CorpHKD
3,703,000 8,369,456 3.22China LifeInsurance Co Ltd
HKD
1,772,800 6,606,562 2.54China PacificInsurance GroupCo Ltd
HKD
12,292,000 12,356,328 4.75China Petroleum &Chemical Corp
HKD
2,444,500 8,471,276 3.26China Vanke CoLtd
HKD
20,191,000 14,868,787 5.72Industrial &Commercial Bankof China Ltd
HKD
5,054,000 5,692,164 2.19PICC Property &Casualty Co Ltd
HKD
1,970,500 18,979,647 7.30Ping An InsuranceGroup Co of ChinaLtd
HKD
301,000 3,825,333 1.47Sunny OpticalTechnology GroupCo Ltd
HKD
3,120,000 2,476,467 0.95ZHEJIANGEXPRESSWAY COLTD H
HKD
1,273,000 6,868,655 2.64Zhuzhou CSRTimes Electric CoLtd
HKD
Securities Marketvalue in
USD
% of netassets*
Quantity Ccy Maturity
47,900 10,741,575 4.13Baidu Inc ADRUSD53.57139,294,970Total - China
2,038,000 6,452,388 2.48China OverseasLand & InvestmentLtd
HKDHong Kong
7,010,355 12,397,078 4.77CNOOC LTDHKD3,784,000 6,710,892 2.58Guangdong
Investment LtdHKD
98.80256,885,879Total - Transferable securities admitted to anofficial exchange
98.80256,885,879Total - Shares
9.8325,560,358Total - Hong Kong
98.80256,885,879Total - Investment in securities
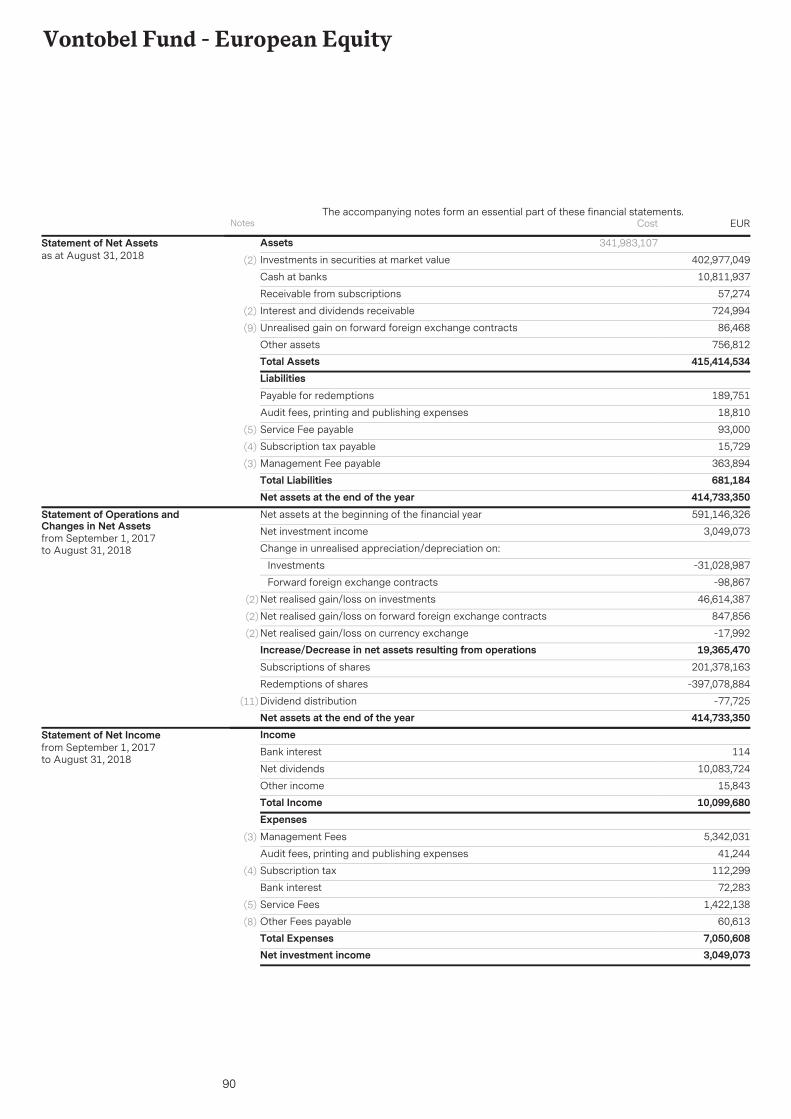
90
Vontobel Fund - European Equity
AssetsInvestments in securities at market value 402,977,049(2)
10,811,937Cash at banks
57,274Receivable from subscriptions
724,994Interest and dividends receivable(2)
86,468Unrealised gain on forward foreign exchange contracts(9)
756,812Other assetsTotal Assets 415,414,534
341,983,107Statement of Net Assetsas at August 31, 2018
LiabilitiesPayable for redemptions 189,751
Audit fees, printing and publishing expenses 18,810
Service Fee payable 93,000(5)
Subscription tax payable 15,729(4)
Management Fee payable 363,894(3)
Total Liabilities 681,184Net assets at the end of the year 414,733,350Net assets at the beginning of the financial year 591,146,326
Net investment income 3,049,073
Change in unrealised appreciation/depreciation on:
Investments -31,028,987
Forward foreign exchange contracts -98,867
Net realised gain/loss on investments 46,614,387(2)
Net realised gain/loss on forward foreign exchange contracts 847,856(2)
Net realised gain/loss on currency exchange -17,992(2)
Increase/Decrease in net assets resulting from operations 19,365,470Subscriptions of shares 201,378,163
Redemptions of shares -397,078,884
Dividend distribution -77,725(11)
Net assets at the end of the year 414,733,350
Statement of Operations andChanges in Net Assetsfrom September 1, 2017to August 31, 2018
IncomeBank interest 114
Net dividends 10,083,724
Other income 15,843Total Income 10,099,680ExpensesManagement Fees 5,342,031(3)
Audit fees, printing and publishing expenses 41,244
Subscription tax 112,299(4)
Bank interest 72,283
Service Fees 1,422,138(5)
Other Fees payable 60,613(8)
Total Expenses 7,050,608Net investment income 3,049,073
Statement of Net Incomefrom September 1, 2017to August 31, 2018
Notes EURThe accompanying notes form an essential part of these financial statements.
Cost
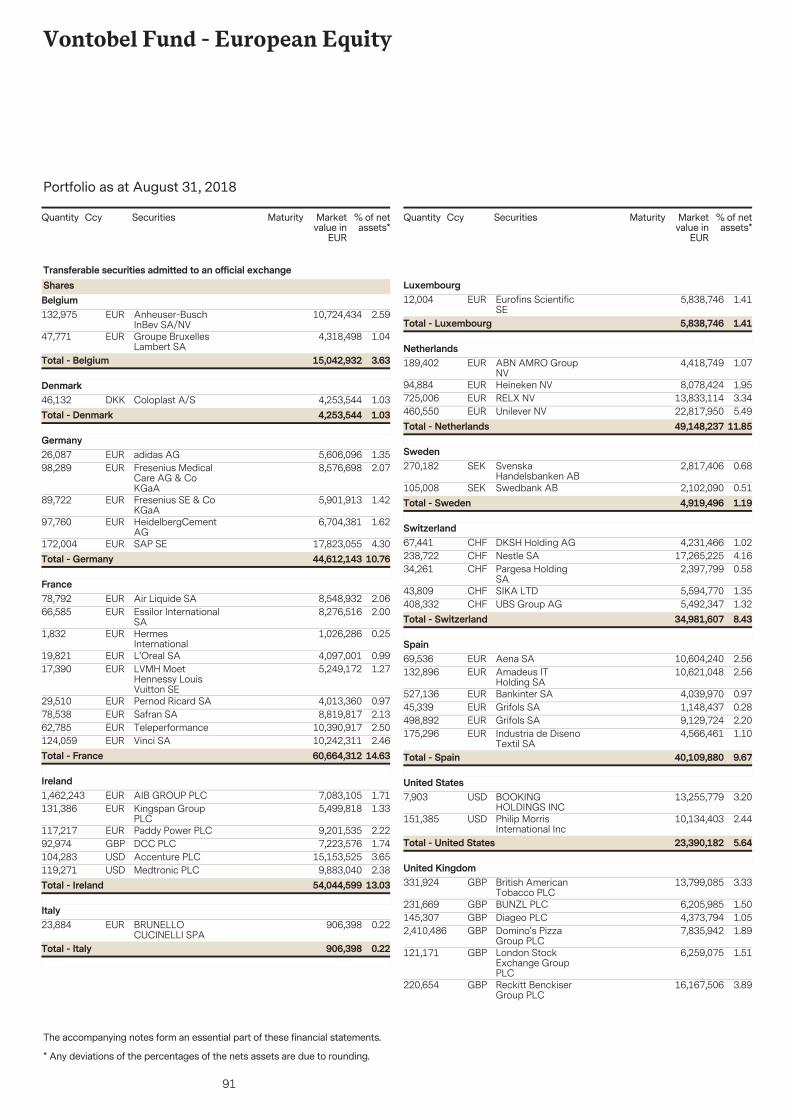
91
Vontobel Fund - European Equity
The accompanying notes form an essential part of these financial statements.
Portfolio as at August 31, 2018
* Any deviations of the percentages of the nets assets are due to rounding.
Securities Marketvalue in
EUR
% of netassets*
Quantity Ccy Maturity
132,975 10,724,434 2.59Anheuser-BuschInBev SA/NV
EUR
Transferable securities admitted to an official exchangeSharesBelgium
47,771 4,318,498 1.04Groupe BruxellesLambert SA
EUR
3.6315,042,932Total - Belgium
46,132 4,253,544 1.03Coloplast A/SDKKDenmark
1.034,253,544Total - Denmark
26,087 5,606,096 1.35adidas AGEURGermany
98,289 8,576,698 2.07Fresenius MedicalCare AG & CoKGaA
EUR
89,722 5,901,913 1.42Fresenius SE & CoKGaA
EUR
97,760 6,704,381 1.62HeidelbergCementAG
EUR
172,004 17,823,055 4.30SAP SEEUR10.7644,612,143Total - Germany
78,792 8,548,932 2.06Air Liquide SAEURFrance
66,585 8,276,516 2.00Essilor InternationalSA
EUR
1,832 1,026,286 0.25HermesInternational
EUR
19,821 4,097,001 0.99L'Oreal SAEUR17,390 5,249,172 1.27LVMH Moet
Hennessy LouisVuitton SE
EUR
29,510 4,013,360 0.97Pernod Ricard SAEUR78,538 8,819,817 2.13Safran SAEUR62,785 10,390,917 2.50TeleperformanceEUR124,059 10,242,311 2.46Vinci SAEUR
14.6360,664,312Total - France
1,462,243 7,083,105 1.71AIB GROUP PLCEURIreland
131,386 5,499,818 1.33Kingspan GroupPLC
EUR
117,217 9,201,535 2.22Paddy Power PLCEUR92,974 7,223,576 1.74DCC PLCGBP104,283 15,153,525 3.65Accenture PLCUSD119,271 9,883,040 2.38Medtronic PLCUSD
13.0354,044,599Total - Ireland
23,884 906,398 0.22BRUNELLOCUCINELLI SPA
EURItaly
0.22906,398Total - Italy
Securities Marketvalue in
EUR
% of netassets*
Quantity Ccy Maturity
12,004 5,838,746 1.41Eurofins ScientificSE
EURLuxembourg
1.415,838,746Total - Luxembourg
189,402 4,418,749 1.07ABN AMRO GroupNV
EURNetherlands
94,884 8,078,424 1.95Heineken NVEUR725,006 13,833,114 3.34RELX NVEUR460,550 22,817,950 5.49Unilever NVEUR
11.8549,148,237Total - Netherlands
270,182 2,817,406 0.68SvenskaHandelsbanken AB
SEKSweden
105,008 2,102,090 0.51Swedbank ABSEK1.194,919,496Total - Sweden
67,441 4,231,466 1.02DKSH Holding AGCHFSwitzerland
238,722 17,265,225 4.16Nestle SACHF34,261 2,397,799 0.58Pargesa Holding
SACHF
43,809 5,594,770 1.35SIKA LTDCHF408,332 5,492,347 1.32UBS Group AGCHF
8.4334,981,607Total - Switzerland
69,536 10,604,240 2.56Aena SAEURSpain
132,896 10,621,048 2.56Amadeus ITHolding SA
EUR
527,136 4,039,970 0.97Bankinter SAEUR45,339 1,148,437 0.28Grifols SAEUR498,892 9,129,724 2.20Grifols SAEUR175,296 4,566,461 1.10Industria de Diseno
Textil SAEUR
9.6740,109,880Total - Spain
7,903 13,255,779 3.20BOOKINGHOLDINGS INC
USDUnited States
151,385 10,134,403 2.44Philip MorrisInternational Inc
USD
5.6423,390,182Total - United States
331,924 13,799,085 3.33British AmericanTobacco PLC
GBPUnited Kingdom
231,669 6,205,985 1.50BUNZL PLCGBP145,307 4,373,794 1.05Diageo PLCGBP2,410,486 7,835,942 1.89Domino's Pizza
Group PLCGBP
121,171 6,259,075 1.51London StockExchange GroupPLC
GBP
220,654 16,167,506 3.89Reckitt BenckiserGroup PLC
GBP
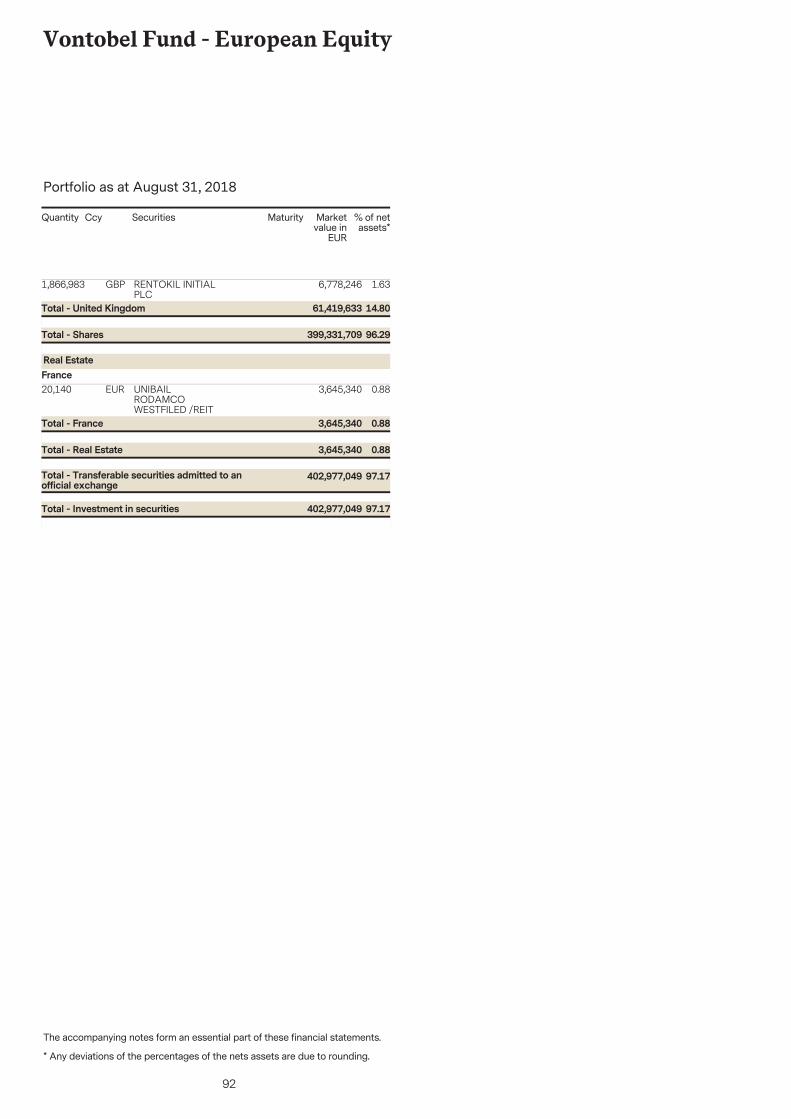
92
Vontobel Fund - European Equity
The accompanying notes form an essential part of these financial statements.
Portfolio as at August 31, 2018
* Any deviations of the percentages of the nets assets are due to rounding.
Securities Marketvalue in
EUR
% of netassets*
Quantity Ccy Maturity
1,866,983 6,778,246 1.63RENTOKIL INITIALPLC
GBP
96.29399,331,709Total - Shares
14.8061,419,633Total - United Kingdom
20,140 3,645,340 0.88UNIBAILRODAMCOWESTFILED /REIT
EUR
Real EstateFrance
97.17402,977,049Total - Transferable securities admitted to anofficial exchange
0.883,645,340Total - Real Estate
0.883,645,340Total - France
97.17402,977,049Total - Investment in securities
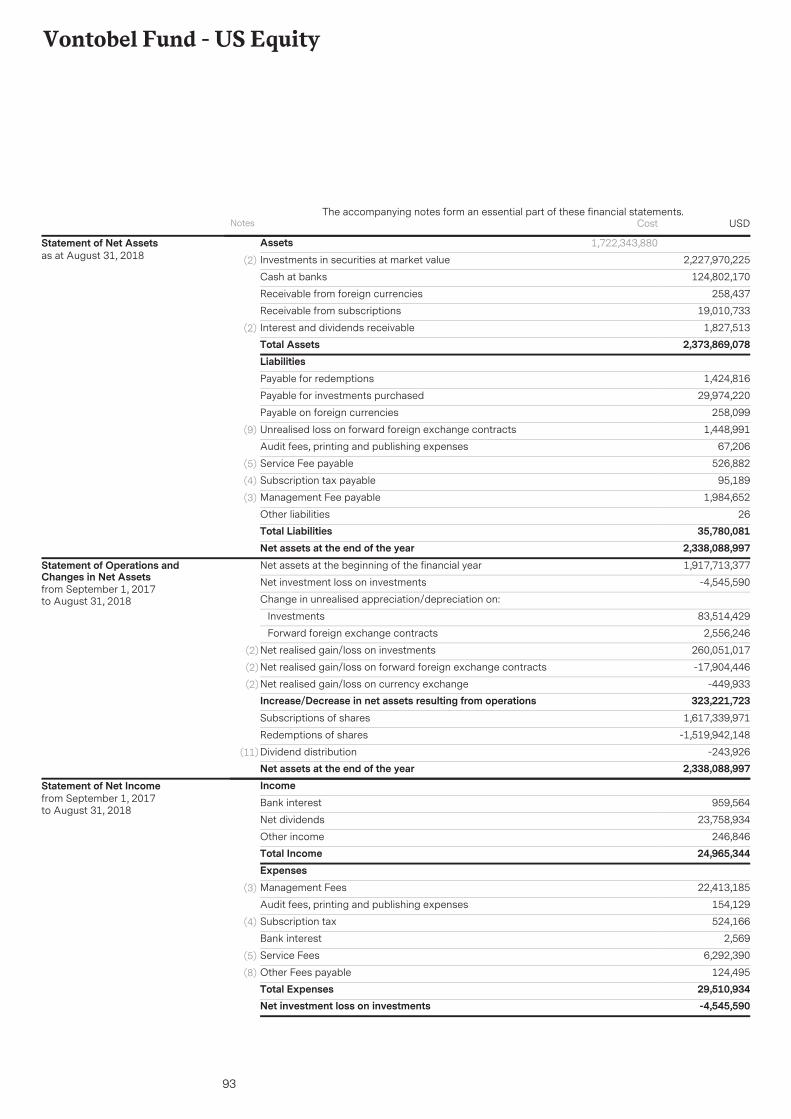
93
Vontobel Fund - US Equity
AssetsInvestments in securities at market value 2,227,970,225(2)
124,802,170Cash at banks
258,437Receivable from foreign currencies
19,010,733Receivable from subscriptions
1,827,513Interest and dividends receivable(2)
Total Assets 2,373,869,078
1,722,343,880Statement of Net Assetsas at August 31, 2018
LiabilitiesPayable for redemptions 1,424,816
Payable for investments purchased 29,974,220
Payable on foreign currencies 258,099
Unrealised loss on forward foreign exchange contracts 1,448,991(9)
Audit fees, printing and publishing expenses 67,206
Service Fee payable 526,882(5)
Subscription tax payable 95,189(4)
Management Fee payable 1,984,652(3)
Other liabilities 26Total Liabilities 35,780,081Net assets at the end of the year 2,338,088,997Net assets at the beginning of the financial year 1,917,713,377
Net investment loss on investments -4,545,590
Change in unrealised appreciation/depreciation on:
Investments 83,514,429
Forward foreign exchange contracts 2,556,246
Net realised gain/loss on investments 260,051,017(2)
Net realised gain/loss on forward foreign exchange contracts -17,904,446(2)
Net realised gain/loss on currency exchange -449,933(2)
Increase/Decrease in net assets resulting from operations 323,221,723Subscriptions of shares 1,617,339,971
Redemptions of shares -1,519,942,148
Dividend distribution -243,926(11)
Net assets at the end of the year 2,338,088,997
Statement of Operations andChanges in Net Assetsfrom September 1, 2017to August 31, 2018
IncomeBank interest 959,564
Net dividends 23,758,934
Other income 246,846Total Income 24,965,344ExpensesManagement Fees 22,413,185(3)
Audit fees, printing and publishing expenses 154,129
Subscription tax 524,166(4)
Bank interest 2,569
Service Fees 6,292,390(5)
Other Fees payable 124,495(8)
Total Expenses 29,510,934Net investment loss on investments -4,545,590
Statement of Net Incomefrom September 1, 2017to August 31, 2018
Notes USDThe accompanying notes form an essential part of these financial statements.
Cost
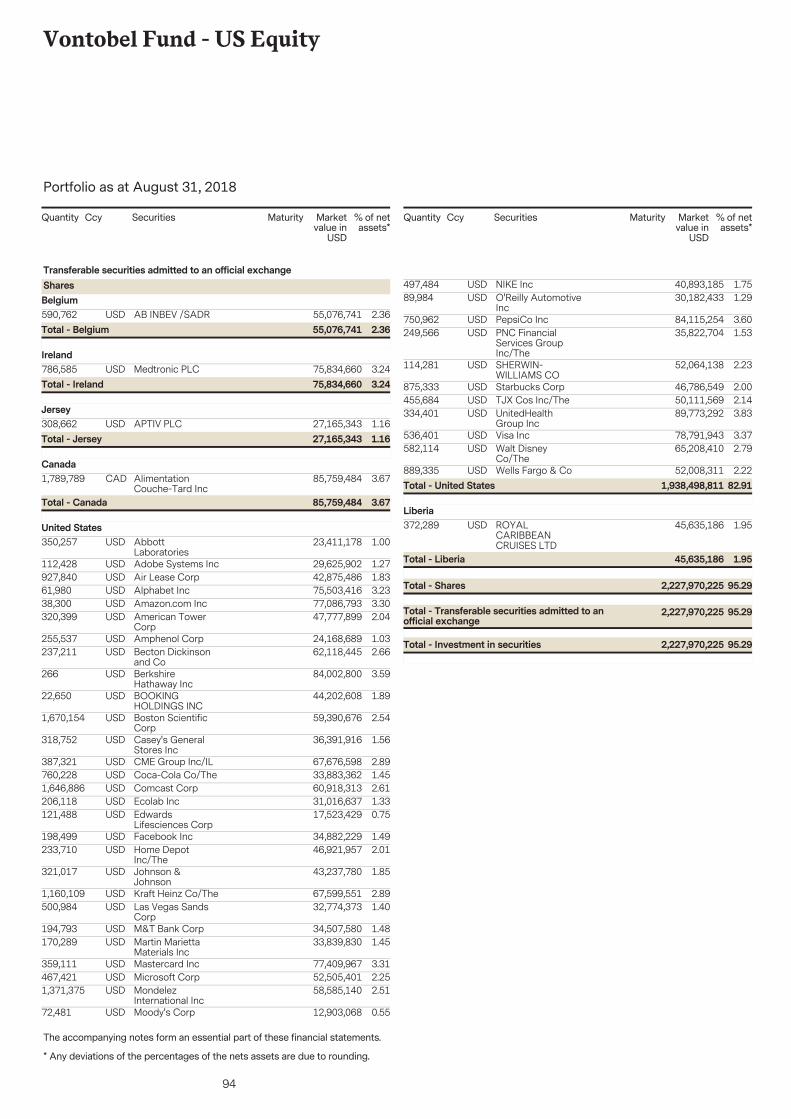
94
Vontobel Fund - US Equity
The accompanying notes form an essential part of these financial statements.
Portfolio as at August 31, 2018
* Any deviations of the percentages of the nets assets are due to rounding.
Securities Marketvalue in
USD
% of netassets*
Quantity Ccy Maturity
590,762 55,076,741 2.36AB INBEV /SADRUSD
Transferable securities admitted to an official exchangeSharesBelgium
2.3655,076,741Total - Belgium
786,585 75,834,660 3.24Medtronic PLCUSDIreland
3.2475,834,660Total - Ireland
308,662 27,165,343 1.16APTIV PLCUSDJersey
1.1627,165,343Total - Jersey
1,789,789 85,759,484 3.67AlimentationCouche-Tard Inc
CADCanada
3.6785,759,484Total - Canada
350,257 23,411,178 1.00AbbottLaboratories
USDUnited States
112,428 29,625,902 1.27Adobe Systems IncUSD927,840 42,875,486 1.83Air Lease CorpUSD61,980 75,503,416 3.23Alphabet IncUSD38,300 77,086,793 3.30Amazon.com IncUSD320,399 47,777,899 2.04American Tower
CorpUSD
255,537 24,168,689 1.03Amphenol CorpUSD237,211 62,118,445 2.66Becton Dickinson
and CoUSD
266 84,002,800 3.59BerkshireHathaway Inc
USD
22,650 44,202,608 1.89BOOKINGHOLDINGS INC
USD
1,670,154 59,390,676 2.54Boston ScientificCorp
USD
318,752 36,391,916 1.56Casey's GeneralStores Inc
USD
387,321 67,676,598 2.89CME Group Inc/ILUSD760,228 33,883,362 1.45Coca-Cola Co/TheUSD1,646,886 60,918,313 2.61Comcast CorpUSD206,118 31,016,637 1.33Ecolab IncUSD121,488 17,523,429 0.75Edwards
Lifesciences CorpUSD
198,499 34,882,229 1.49Facebook IncUSD233,710 46,921,957 2.01Home Depot
Inc/TheUSD
321,017 43,237,780 1.85Johnson &Johnson
USD
1,160,109 67,599,551 2.89Kraft Heinz Co/TheUSD500,984 32,774,373 1.40Las Vegas Sands
CorpUSD
194,793 34,507,580 1.48M&T Bank CorpUSD170,289 33,839,830 1.45Martin Marietta
Materials IncUSD
359,111 77,409,967 3.31Mastercard IncUSD467,421 52,505,401 2.25Microsoft CorpUSD1,371,375 58,585,140 2.51Mondelez
International IncUSD
72,481 12,903,068 0.55Moody's CorpUSD
Securities Marketvalue in
USD
% of netassets*
Quantity Ccy Maturity
497,484 40,893,185 1.75NIKE IncUSD89,984 30,182,433 1.29O'Reilly Automotive
IncUSD
750,962 84,115,254 3.60PepsiCo IncUSD249,566 35,822,704 1.53PNC Financial
Services GroupInc/The
USD
114,281 52,064,138 2.23SHERWIN-WILLIAMS CO
USD
875,333 46,786,549 2.00Starbucks CorpUSD455,684 50,111,569 2.14TJX Cos Inc/TheUSD334,401 89,773,292 3.83UnitedHealth
Group IncUSD
536,401 78,791,943 3.37Visa IncUSD582,114 65,208,410 2.79Walt Disney
Co/TheUSD
889,335 52,008,311 2.22Wells Fargo & CoUSD82.911,938,498,811Total - United States
372,289 45,635,186 1.95ROYALCARIBBEANCRUISES LTD
USDLiberia
95.292,227,970,225Total - Transferable securities admitted to anofficial exchange
95.292,227,970,225Total - Shares
1.9545,635,186Total - Liberia
95.292,227,970,225Total - Investment in securities
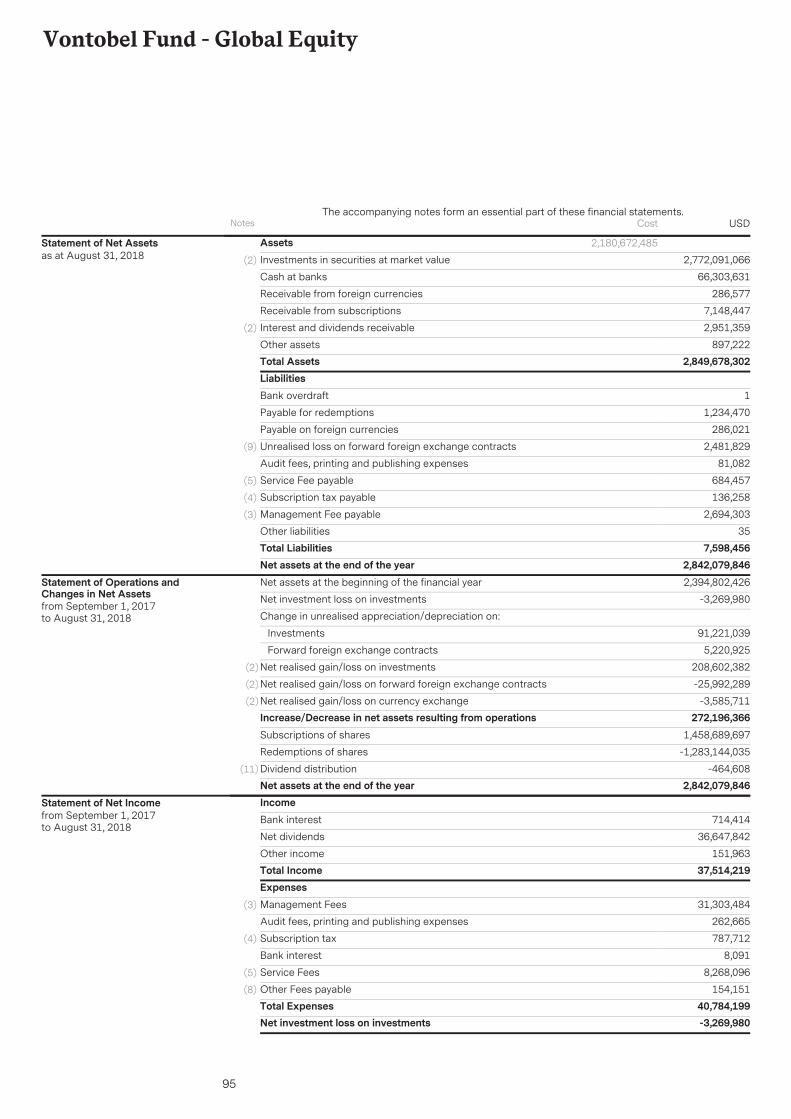
95
Vontobel Fund - Global Equity
AssetsInvestments in securities at market value 2,772,091,066(2)
66,303,631Cash at banks
286,577Receivable from foreign currencies
7,148,447Receivable from subscriptions
2,951,359Interest and dividends receivable(2)
897,222Other assetsTotal Assets 2,849,678,302
2,180,672,485Statement of Net Assetsas at August 31, 2018
LiabilitiesBank overdraft 1
Payable for redemptions 1,234,470
Payable on foreign currencies 286,021
Unrealised loss on forward foreign exchange contracts 2,481,829(9)
Audit fees, printing and publishing expenses 81,082
Service Fee payable 684,457(5)
Subscription tax payable 136,258(4)
Management Fee payable 2,694,303(3)
Other liabilities 35Total Liabilities 7,598,456Net assets at the end of the year 2,842,079,846Net assets at the beginning of the financial year 2,394,802,426
Net investment loss on investments -3,269,980
Change in unrealised appreciation/depreciation on:
Investments 91,221,039
Forward foreign exchange contracts 5,220,925
Net realised gain/loss on investments 208,602,382(2)
Net realised gain/loss on forward foreign exchange contracts -25,992,289(2)
Net realised gain/loss on currency exchange -3,585,711(2)
Increase/Decrease in net assets resulting from operations 272,196,366Subscriptions of shares 1,458,689,697
Redemptions of shares -1,283,144,035
Dividend distribution -464,608(11)
Net assets at the end of the year 2,842,079,846
Statement of Operations andChanges in Net Assetsfrom September 1, 2017to August 31, 2018
IncomeBank interest 714,414
Net dividends 36,647,842
Other income 151,963Total Income 37,514,219ExpensesManagement Fees 31,303,484(3)
Audit fees, printing and publishing expenses 262,665
Subscription tax 787,712(4)
Bank interest 8,091
Service Fees 8,268,096(5)
Other Fees payable 154,151(8)
Total Expenses 40,784,199Net investment loss on investments -3,269,980
Statement of Net Incomefrom September 1, 2017to August 31, 2018
Notes USDThe accompanying notes form an essential part of these financial statements.
Cost
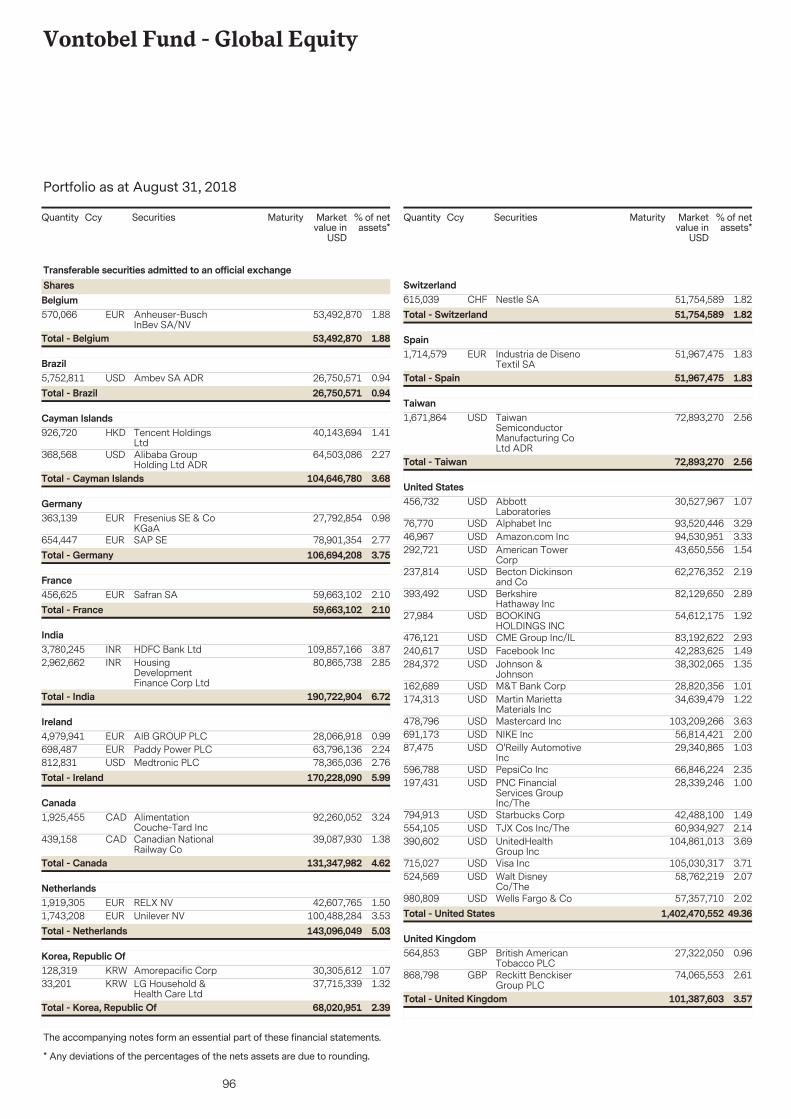
96
Vontobel Fund - Global Equity
The accompanying notes form an essential part of these financial statements.
Portfolio as at August 31, 2018
* Any deviations of the percentages of the nets assets are due to rounding.
Securities Marketvalue in
USD
% of netassets*
Quantity Ccy Maturity
570,066 53,492,870 1.88Anheuser-BuschInBev SA/NV
EUR
Transferable securities admitted to an official exchangeSharesBelgium
1.8853,492,870Total - Belgium
5,752,811 26,750,571 0.94Ambev SA ADRUSDBrazil
0.9426,750,571Total - Brazil
926,720 40,143,694 1.41Tencent HoldingsLtd
HKDCayman Islands
368,568 64,503,086 2.27Alibaba GroupHolding Ltd ADR
USD
3.68104,646,780Total - Cayman Islands
363,139 27,792,854 0.98Fresenius SE & CoKGaA
EURGermany
654,447 78,901,354 2.77SAP SEEUR3.75106,694,208Total - Germany
456,625 59,663,102 2.10Safran SAEURFrance
2.1059,663,102Total - France
3,780,245 109,857,166 3.87HDFC Bank LtdINRIndia
2,962,662 80,865,738 2.85HousingDevelopmentFinance Corp Ltd
INR
6.72190,722,904Total - India
4,979,941 28,066,918 0.99AIB GROUP PLCEURIreland
698,487 63,796,136 2.24Paddy Power PLCEUR812,831 78,365,036 2.76Medtronic PLCUSD
5.99170,228,090Total - Ireland
1,925,455 92,260,052 3.24AlimentationCouche-Tard Inc
CADCanada
439,158 39,087,930 1.38Canadian NationalRailway Co
CAD
4.62131,347,982Total - Canada
1,919,305 42,607,765 1.50RELX NVEURNetherlands
1,743,208 100,488,284 3.53Unilever NVEUR5.03143,096,049Total - Netherlands
128,319 30,305,612 1.07Amorepacific CorpKRWKorea, Republic Of
33,201 37,715,339 1.32LG Household &Health Care Ltd
KRW
2.3968,020,951Total - Korea, Republic Of
Securities Marketvalue in
USD
% of netassets*
Quantity Ccy Maturity
615,039 51,754,589 1.82Nestle SACHFSwitzerland
1.8251,754,589Total - Switzerland
1,714,579 51,967,475 1.83Industria de DisenoTextil SA
EURSpain
1.8351,967,475Total - Spain
1,671,864 72,893,270 2.56TaiwanSemiconductorManufacturing CoLtd ADR
USDTaiwan
2.5672,893,270Total - Taiwan
456,732 30,527,967 1.07AbbottLaboratories
USDUnited States
76,770 93,520,446 3.29Alphabet IncUSD46,967 94,530,951 3.33Amazon.com IncUSD292,721 43,650,556 1.54American Tower
CorpUSD
237,814 62,276,352 2.19Becton Dickinsonand Co
USD
393,492 82,129,650 2.89BerkshireHathaway Inc
USD
27,984 54,612,175 1.92BOOKINGHOLDINGS INC
USD
476,121 83,192,622 2.93CME Group Inc/ILUSD240,617 42,283,625 1.49Facebook IncUSD284,372 38,302,065 1.35Johnson &
JohnsonUSD
162,689 28,820,356 1.01M&T Bank CorpUSD174,313 34,639,479 1.22Martin Marietta
Materials IncUSD
478,796 103,209,266 3.63Mastercard IncUSD691,173 56,814,421 2.00NIKE IncUSD87,475 29,340,865 1.03O'Reilly Automotive
IncUSD
596,788 66,846,224 2.35PepsiCo IncUSD197,431 28,339,246 1.00PNC Financial
Services GroupInc/The
USD
794,913 42,488,100 1.49Starbucks CorpUSD554,105 60,934,927 2.14TJX Cos Inc/TheUSD390,602 104,861,013 3.69UnitedHealth
Group IncUSD
715,027 105,030,317 3.71Visa IncUSD524,569 58,762,219 2.07Walt Disney
Co/TheUSD
980,809 57,357,710 2.02Wells Fargo & CoUSD49.361,402,470,552Total - United States
564,853 27,322,050 0.96British AmericanTobacco PLC
GBPUnited Kingdom
868,798 74,065,553 2.61Reckitt BenckiserGroup PLC
GBP
3.57101,387,603Total - United Kingdom
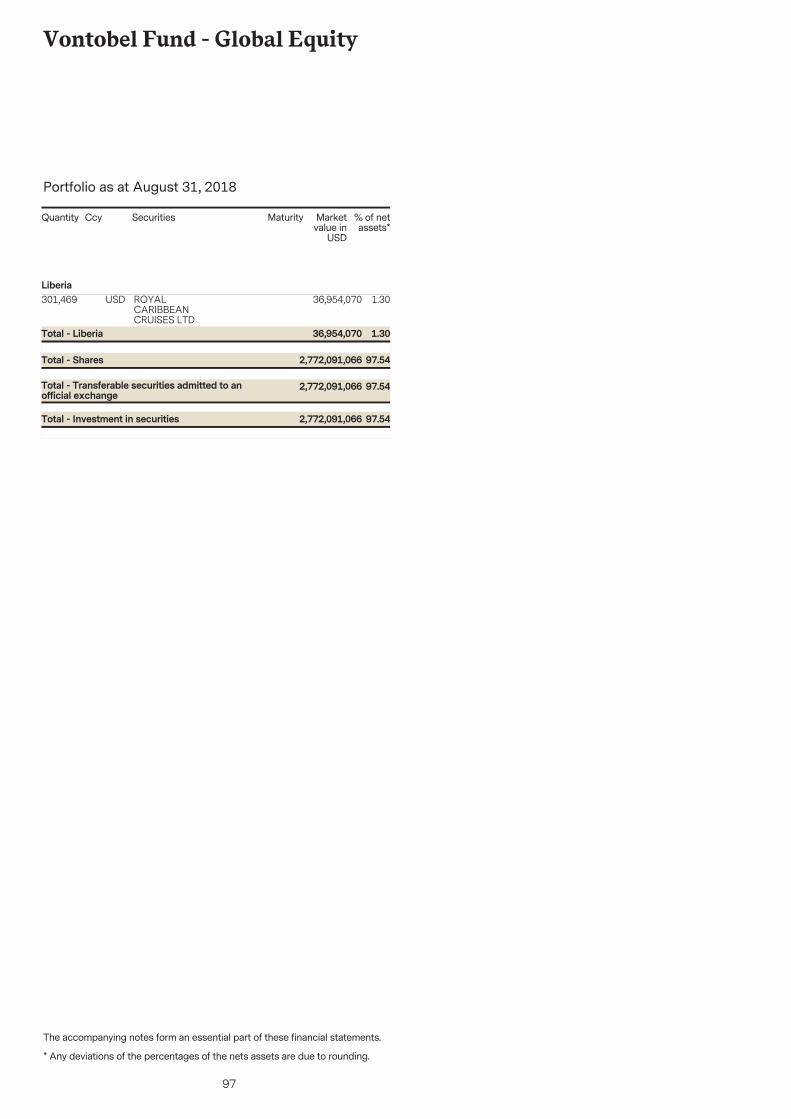
97
Vontobel Fund - Global Equity
The accompanying notes form an essential part of these financial statements.
Portfolio as at August 31, 2018
* Any deviations of the percentages of the nets assets are due to rounding.
Securities Marketvalue in
USD
% of netassets*
Quantity Ccy Maturity
301,469 36,954,070 1.30ROYALCARIBBEANCRUISES LTD
USDLiberia
97.542,772,091,066Total - Transferable securities admitted to anofficial exchange
97.542,772,091,066Total - Shares
1.3036,954,070Total - Liberia
97.542,772,091,066Total - Investment in securities
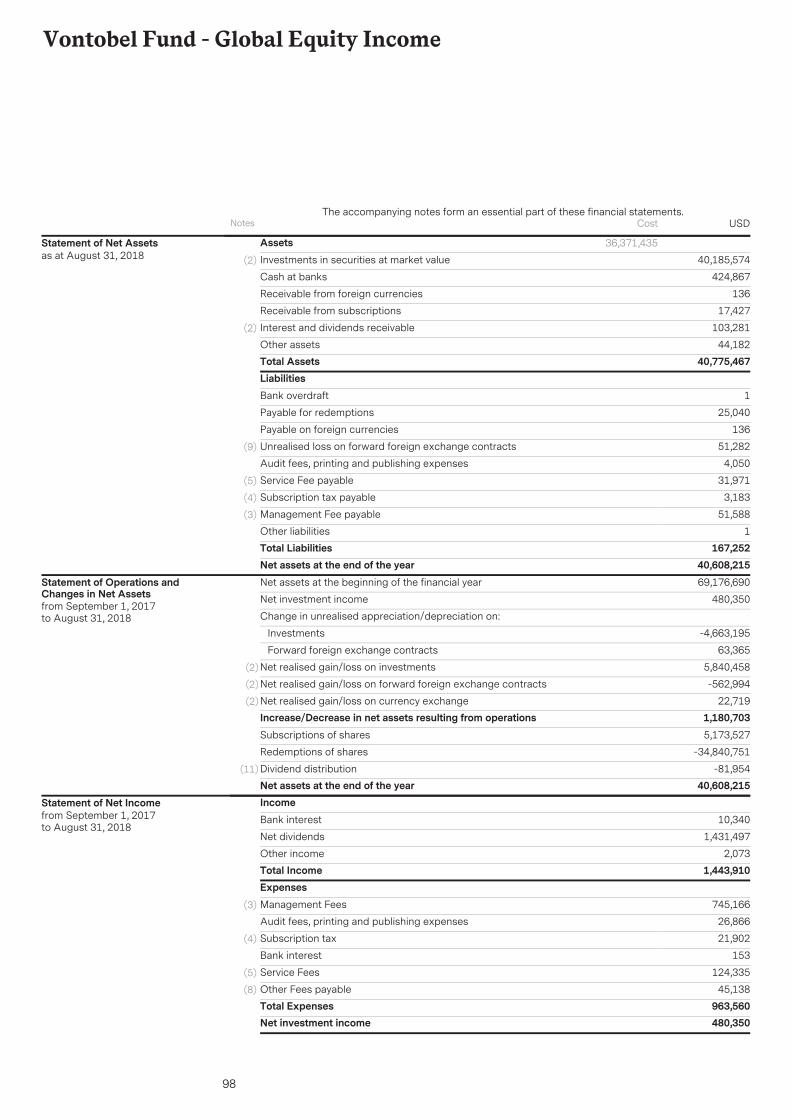
98
Vontobel Fund - Global Equity Income
AssetsInvestments in securities at market value 40,185,574(2)
424,867Cash at banks
136Receivable from foreign currencies
17,427Receivable from subscriptions
103,281Interest and dividends receivable(2)
44,182Other assetsTotal Assets 40,775,467
36,371,435Statement of Net Assetsas at August 31, 2018
LiabilitiesBank overdraft 1
Payable for redemptions 25,040
Payable on foreign currencies 136
Unrealised loss on forward foreign exchange contracts 51,282(9)
Audit fees, printing and publishing expenses 4,050
Service Fee payable 31,971(5)
Subscription tax payable 3,183(4)
Management Fee payable 51,588(3)
Other liabilities 1Total Liabilities 167,252Net assets at the end of the year 40,608,215Net assets at the beginning of the financial year 69,176,690
Net investment income 480,350
Change in unrealised appreciation/depreciation on:
Investments -4,663,195
Forward foreign exchange contracts 63,365
Net realised gain/loss on investments 5,840,458(2)
Net realised gain/loss on forward foreign exchange contracts -562,994(2)
Net realised gain/loss on currency exchange 22,719(2)
Increase/Decrease in net assets resulting from operations 1,180,703Subscriptions of shares 5,173,527
Redemptions of shares -34,840,751
Dividend distribution -81,954(11)
Net assets at the end of the year 40,608,215
Statement of Operations andChanges in Net Assetsfrom September 1, 2017to August 31, 2018
IncomeBank interest 10,340
Net dividends 1,431,497
Other income 2,073Total Income 1,443,910ExpensesManagement Fees 745,166(3)
Audit fees, printing and publishing expenses 26,866
Subscription tax 21,902(4)
Bank interest 153
Service Fees 124,335(5)
Other Fees payable 45,138(8)
Total Expenses 963,560Net investment income 480,350
Statement of Net Incomefrom September 1, 2017to August 31, 2018
Notes USDThe accompanying notes form an essential part of these financial statements.
Cost
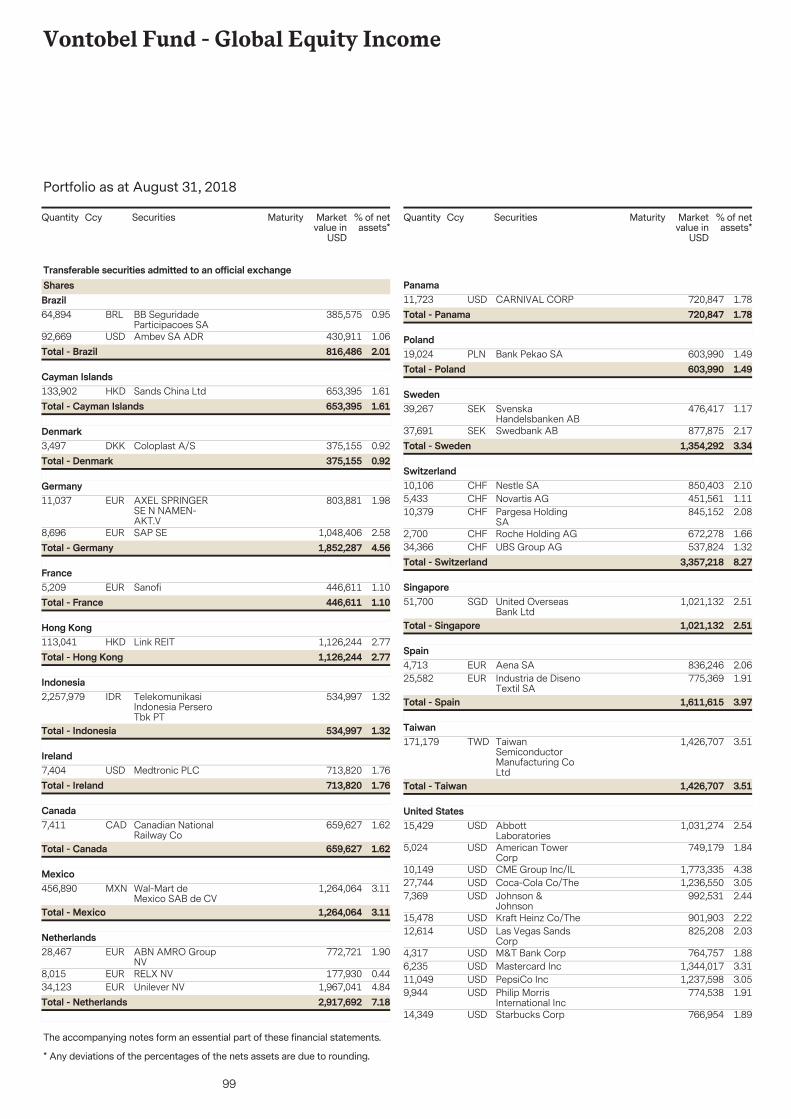
99
Vontobel Fund - Global Equity Income
The accompanying notes form an essential part of these financial statements.
Portfolio as at August 31, 2018
* Any deviations of the percentages of the nets assets are due to rounding.
Securities Marketvalue in
USD
% of netassets*
Quantity Ccy Maturity
64,894 385,575 0.95BB SeguridadeParticipacoes SA
BRL
Transferable securities admitted to an official exchangeSharesBrazil
92,669 430,911 1.06Ambev SA ADRUSD2.01816,486Total - Brazil
133,902 653,395 1.61Sands China LtdHKDCayman Islands
1.61653,395Total - Cayman Islands
3,497 375,155 0.92Coloplast A/SDKKDenmark
0.92375,155Total - Denmark
11,037 803,881 1.98AXEL SPRINGERSE N NAMEN-AKT.V
EURGermany
8,696 1,048,406 2.58SAP SEEUR4.561,852,287Total - Germany
5,209 446,611 1.10SanofiEURFrance
1.10446,611Total - France
113,041 1,126,244 2.77Link REITHKDHong Kong
2.771,126,244Total - Hong Kong
2,257,979 534,997 1.32TelekomunikasiIndonesia PerseroTbk PT
IDRIndonesia
1.32534,997Total - Indonesia
7,404 713,820 1.76Medtronic PLCUSDIreland
1.76713,820Total - Ireland
7,411 659,627 1.62Canadian NationalRailway Co
CADCanada
1.62659,627Total - Canada
456,890 1,264,064 3.11Wal-Mart deMexico SAB de CV
MXNMexico
3.111,264,064Total - Mexico
28,467 772,721 1.90ABN AMRO GroupNV
EURNetherlands
8,015 177,930 0.44RELX NVEUR34,123 1,967,041 4.84Unilever NVEUR
7.182,917,692Total - Netherlands
Securities Marketvalue in
USD
% of netassets*
Quantity Ccy Maturity
11,723 720,847 1.78CARNIVAL CORPUSDPanama
1.78720,847Total - Panama
19,024 603,990 1.49Bank Pekao SAPLNPoland
1.49603,990Total - Poland
39,267 476,417 1.17SvenskaHandelsbanken AB
SEKSweden
37,691 877,875 2.17Swedbank ABSEK3.341,354,292Total - Sweden
10,106 850,403 2.10Nestle SACHFSwitzerland
5,433 451,561 1.11Novartis AGCHF10,379 845,152 2.08Pargesa Holding
SACHF
2,700 672,278 1.66Roche Holding AGCHF34,366 537,824 1.32UBS Group AGCHF
8.273,357,218Total - Switzerland
51,700 1,021,132 2.51United OverseasBank Ltd
SGDSingapore
2.511,021,132Total - Singapore
4,713 836,246 2.06Aena SAEURSpain
25,582 775,369 1.91Industria de DisenoTextil SA
EUR
3.971,611,615Total - Spain
171,179 1,426,707 3.51TaiwanSemiconductorManufacturing CoLtd
TWDTaiwan
3.511,426,707Total - Taiwan
15,429 1,031,274 2.54AbbottLaboratories
USDUnited States
5,024 749,179 1.84American TowerCorp
USD
10,149 1,773,335 4.38CME Group Inc/ILUSD27,744 1,236,550 3.05Coca-Cola Co/TheUSD7,369 992,531 2.44Johnson &
JohnsonUSD
15,478 901,903 2.22Kraft Heinz Co/TheUSD12,614 825,208 2.03Las Vegas Sands
CorpUSD
4,317 764,757 1.88M&T Bank CorpUSD6,235 1,344,017 3.31Mastercard IncUSD11,049 1,237,598 3.05PepsiCo IncUSD9,944 774,538 1.91Philip Morris
International IncUSD
14,349 766,954 1.89Starbucks CorpUSD
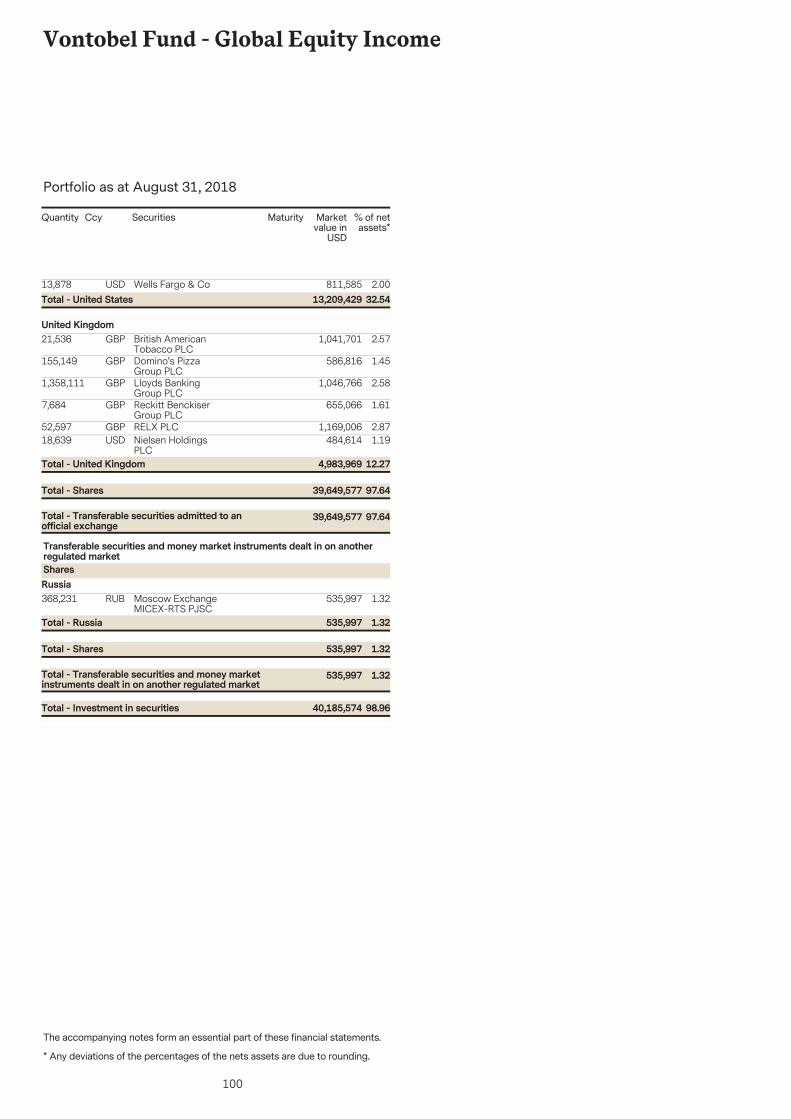
100
Vontobel Fund - Global Equity Income
The accompanying notes form an essential part of these financial statements.
Portfolio as at August 31, 2018
* Any deviations of the percentages of the nets assets are due to rounding.
Securities Marketvalue in
USD
% of netassets*
Quantity Ccy Maturity
13,878 811,585 2.00Wells Fargo & CoUSD32.5413,209,429Total - United States
21,536 1,041,701 2.57British AmericanTobacco PLC
GBPUnited Kingdom
155,149 586,816 1.45Domino's PizzaGroup PLC
GBP
1,358,111 1,046,766 2.58Lloyds BankingGroup PLC
GBP
7,684 655,066 1.61Reckitt BenckiserGroup PLC
GBP
52,597 1,169,006 2.87RELX PLCGBP18,639 484,614 1.19Nielsen Holdings
PLCUSD
97.6439,649,577Total - Transferable securities admitted to anofficial exchange
97.6439,649,577Total - Shares
12.274,983,969Total - United Kingdom
368,231 535,997 1.32Moscow ExchangeMICEX-RTS PJSC
RUB
Transferable securities and money market instruments dealt in on anotherregulated marketSharesRussia
1.32535,997Total - Transferable securities and money marketinstruments dealt in on another regulated market
1.32535,997Total - Shares
1.32535,997Total - Russia
98.9640,185,574Total - Investment in securities
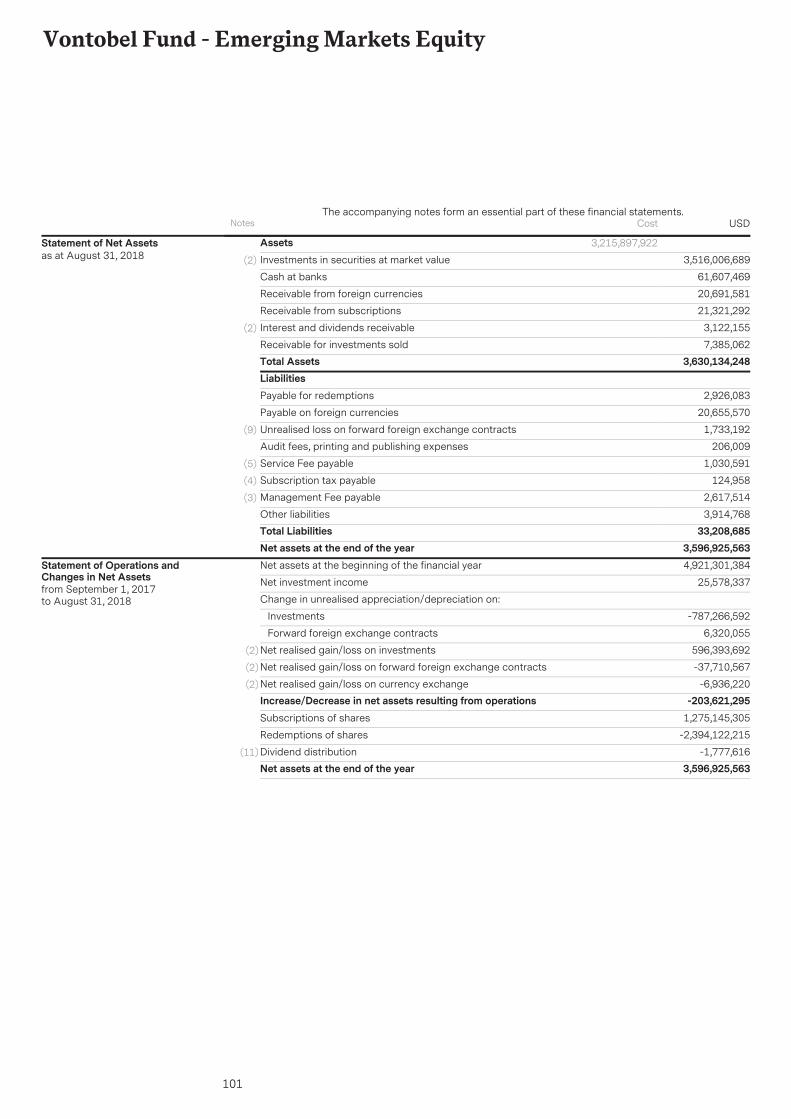
101
Vontobel Fund - Emerging Markets Equity
AssetsInvestments in securities at market value 3,516,006,689(2)
61,607,469Cash at banks
20,691,581Receivable from foreign currencies
21,321,292Receivable from subscriptions
3,122,155Interest and dividends receivable(2)
7,385,062Receivable for investments soldTotal Assets 3,630,134,248
3,215,897,922Statement of Net Assetsas at August 31, 2018
LiabilitiesPayable for redemptions 2,926,083
Payable on foreign currencies 20,655,570
Unrealised loss on forward foreign exchange contracts 1,733,192(9)
Audit fees, printing and publishing expenses 206,009
Service Fee payable 1,030,591(5)
Subscription tax payable 124,958(4)
Management Fee payable 2,617,514(3)
Other liabilities 3,914,768Total Liabilities 33,208,685Net assets at the end of the year 3,596,925,563Net assets at the beginning of the financial year 4,921,301,384
Net investment income 25,578,337
Change in unrealised appreciation/depreciation on:
Investments -787,266,592
Forward foreign exchange contracts 6,320,055
Net realised gain/loss on investments 596,393,692(2)
Net realised gain/loss on forward foreign exchange contracts -37,710,567(2)
Net realised gain/loss on currency exchange -6,936,220(2)
Increase/Decrease in net assets resulting from operations -203,621,295Subscriptions of shares 1,275,145,305
Redemptions of shares -2,394,122,215
Dividend distribution -1,777,616(11)
Net assets at the end of the year 3,596,925,563
Statement of Operations andChanges in Net Assetsfrom September 1, 2017to August 31, 2018
Notes USDThe accompanying notes form an essential part of these financial statements.
Cost
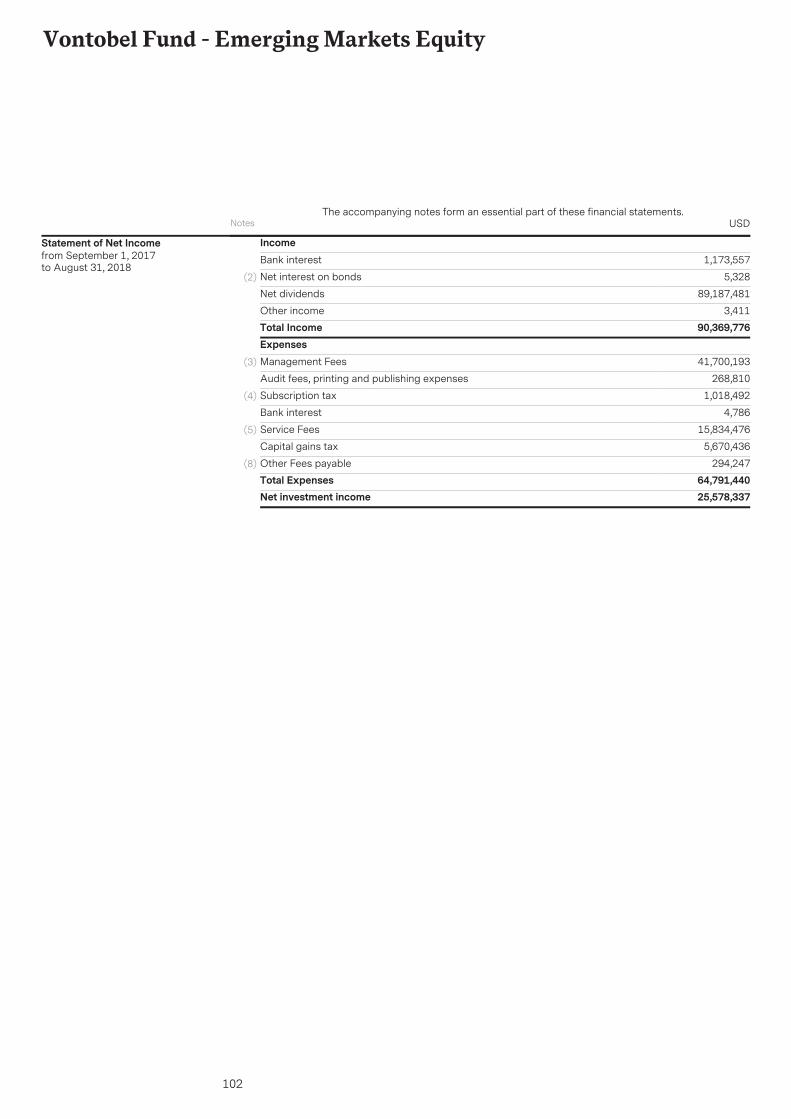
102
Vontobel Fund - Emerging Markets Equity
IncomeBank interest 1,173,557
Net interest on bonds 5,328(2)
Net dividends 89,187,481
Other income 3,411Total Income 90,369,776ExpensesManagement Fees 41,700,193(3)
Audit fees, printing and publishing expenses 268,810
Subscription tax 1,018,492(4)
Bank interest 4,786
Service Fees 15,834,476(5)
Capital gains tax 5,670,436
Other Fees payable 294,247(8)
Total Expenses 64,791,440Net investment income 25,578,337
Statement of Net Incomefrom September 1, 2017to August 31, 2018
Notes USDThe accompanying notes form an essential part of these financial statements.
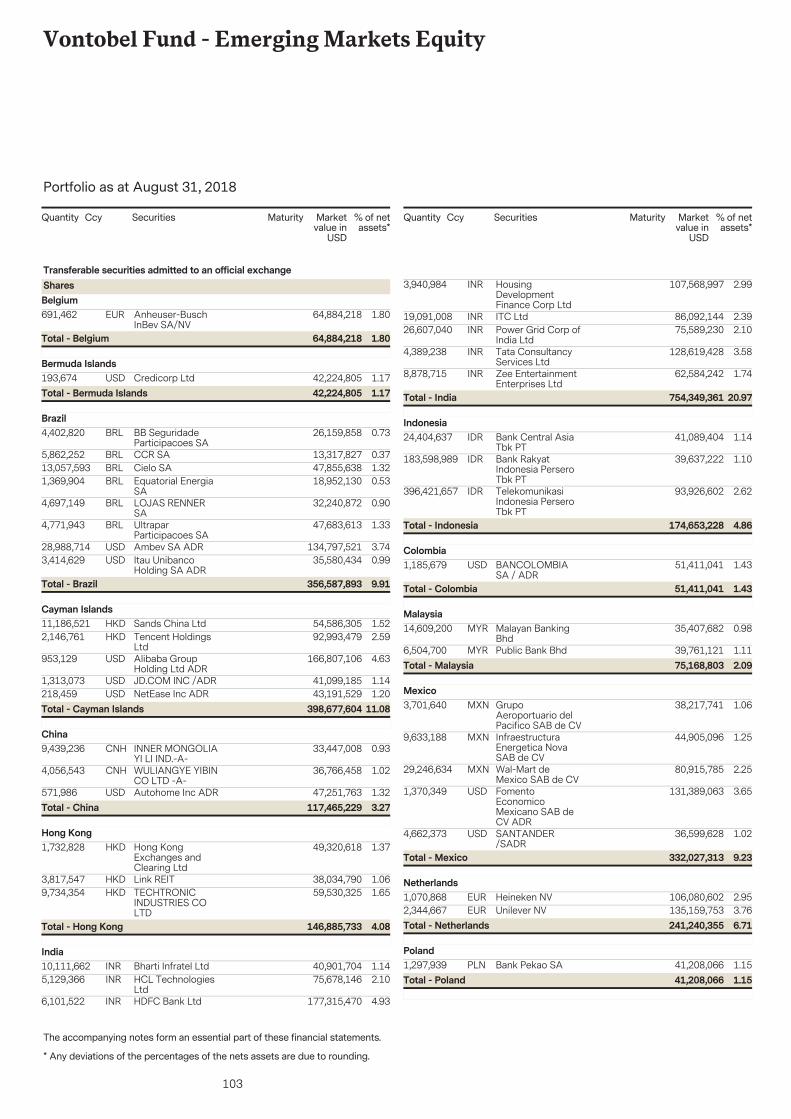
103
Vontobel Fund - Emerging Markets Equity
The accompanying notes form an essential part of these financial statements.
Portfolio as at August 31, 2018
* Any deviations of the percentages of the nets assets are due to rounding.** See note 10
Securities Marketvalue in
USD
% of netassets*
Quantity Ccy Maturity
691,462 64,884,218 1.80Anheuser-BuschInBev SA/NV
EUR
Transferable securities admitted to an official exchangeSharesBelgium
1.8064,884,218Total - Belgium
193,674 42,224,805 1.17Credicorp LtdUSDBermuda Islands
1.1742,224,805Total - Bermuda Islands
4,402,820 26,159,858 0.73BB SeguridadeParticipacoes SA
BRLBrazil
5,862,252 13,317,827 0.37CCR SABRL13,057,593 47,855,638 1.32Cielo SABRL1,369,904 18,952,130 0.53Equatorial Energia
SABRL
4,697,149 32,240,872 0.90LOJAS RENNERSA
BRL
4,771,943 47,683,613 1.33UltraparParticipacoes SA
BRL
28,988,714 134,797,521 3.74Ambev SA ADRUSD3,414,629 35,580,434 0.99Itau Unibanco
Holding SA ADRUSD
9.91356,587,893Total - Brazil
11,186,521 54,586,305 1.52Sands China LtdHKDCayman Islands
2,146,761 92,993,479 2.59Tencent HoldingsLtd
HKD
953,129 166,807,106 4.63Alibaba GroupHolding Ltd ADR
USD
1,313,073 41,099,185 1.14JD.COM INC /ADRUSD218,459 43,191,529 1.20NetEase Inc ADRUSD
11.08398,677,604Total - Cayman Islands
9,439,236 33,447,008 0.93INNER MONGOLIAYI LI IND.-A-
CNHChina
4,056,543 36,766,458 1.02WULIANGYE YIBINCO LTD -A-
CNH
571,986 47,251,763 1.32Autohome Inc ADRUSD3.27117,465,229Total - China
1,732,828 49,320,618 1.37Hong KongExchanges andClearing Ltd
HKDHong Kong
3,817,547 38,034,790 1.06Link REITHKD9,734,354 59,530,325 1.65TECHTRONIC
INDUSTRIES COLTD
HKD
4.08146,885,733Total - Hong Kong
10,111,662 40,901,704 1.14Bharti Infratel LtdINRIndia
5,129,366 75,678,146 2.10HCL TechnologiesLtd
INR
6,101,522 177,315,470 4.93HDFC Bank LtdINR
Securities Marketvalue in
USD
% of netassets*
Quantity Ccy Maturity
3,940,984 107,568,997 2.99HousingDevelopmentFinance Corp Ltd
INR
19,091,008 86,092,144 2.39ITC LtdINR26,607,040 75,589,230 2.10Power Grid Corp of
India LtdINR
4,389,238 128,619,428 3.58Tata ConsultancyServices Ltd
INR
8,878,715 62,584,242 1.74Zee EntertainmentEnterprises Ltd
INR
20.97754,349,361Total - India
24,404,637 41,089,404 1.14Bank Central AsiaTbk PT
IDRIndonesia
183,598,989 39,637,222 1.10Bank RakyatIndonesia PerseroTbk PT
IDR
396,421,657 93,926,602 2.62TelekomunikasiIndonesia PerseroTbk PT
IDR
4.86174,653,228Total - Indonesia
1,185,679 51,411,041 1.43BANCOLOMBIASA / ADR
USDColombia
1.4351,411,041Total - Colombia
14,609,200 35,407,682 0.98Malayan BankingBhd
MYRMalaysia
6,504,700 39,761,121 1.11Public Bank BhdMYR2.0975,168,803Total - Malaysia
3,701,640 38,217,741 1.06GrupoAeroportuario delPacifico SAB de CV
MXNMexico
9,633,188 44,905,096 1.25InfraestructuraEnergetica NovaSAB de CV
MXN
29,246,634 80,915,785 2.25Wal-Mart deMexico SAB de CV
MXN
1,370,349 131,389,063 3.65FomentoEconomicoMexicano SAB deCV ADR
USD
4,662,373 36,599,628 1.02SANTANDER/SADR
USD
9.23332,027,313Total - Mexico
1,070,868 106,080,602 2.95Heineken NVEURNetherlands
2,344,667 135,159,753 3.76Unilever NVEUR6.71241,240,355Total - Netherlands
1,297,939 41,208,066 1.15Bank Pekao SAPLNPoland
1.1541,208,066Total - Poland
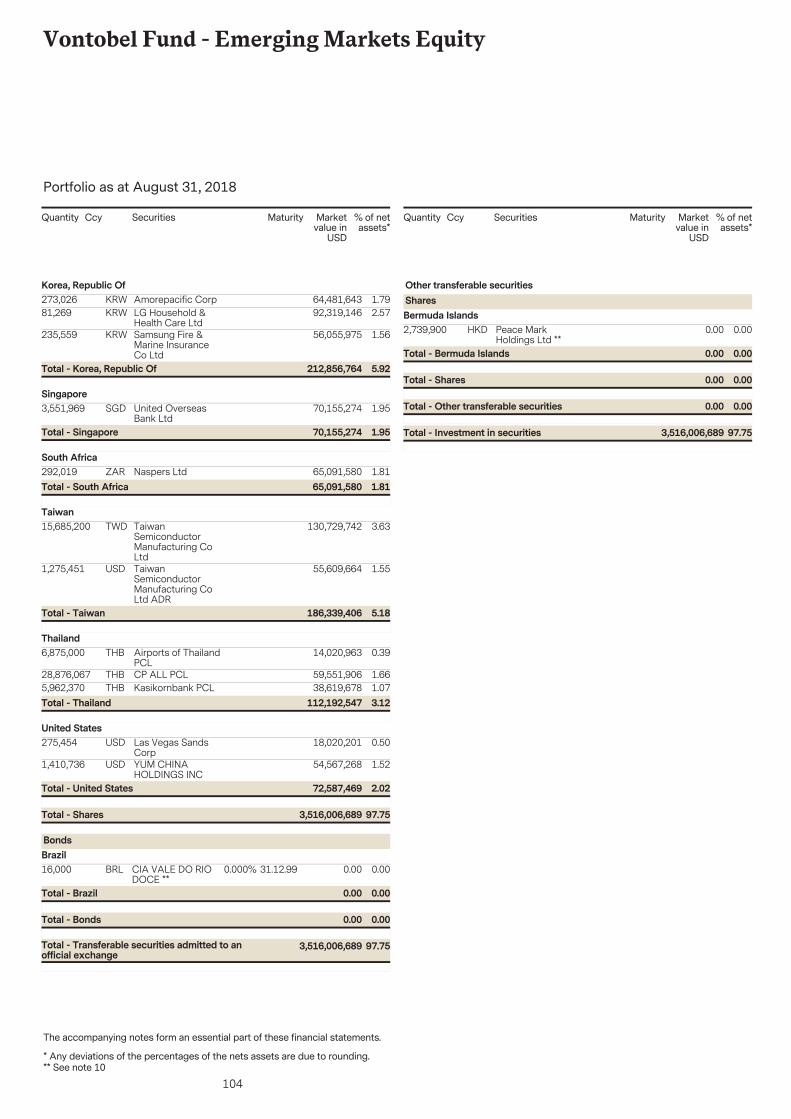
104
Vontobel Fund - Emerging Markets Equity
The accompanying notes form an essential part of these financial statements.
Portfolio as at August 31, 2018
* Any deviations of the percentages of the nets assets are due to rounding.** See note 10
Securities Marketvalue in
USD
% of netassets*
Quantity Ccy Maturity
273,026 64,481,643 1.79Amorepacific CorpKRWKorea, Republic Of
81,269 92,319,146 2.57LG Household &Health Care Ltd
KRW
235,559 56,055,975 1.56Samsung Fire &Marine InsuranceCo Ltd
KRW
5.92212,856,764Total - Korea, Republic Of
3,551,969 70,155,274 1.95United OverseasBank Ltd
SGDSingapore
1.9570,155,274Total - Singapore
292,019 65,091,580 1.81Naspers LtdZARSouth Africa
1.8165,091,580Total - South Africa
15,685,200 130,729,742 3.63TaiwanSemiconductorManufacturing CoLtd
TWDTaiwan
1,275,451 55,609,664 1.55TaiwanSemiconductorManufacturing CoLtd ADR
USD
5.18186,339,406Total - Taiwan
6,875,000 14,020,963 0.39Airports of ThailandPCL
THBThailand
28,876,067 59,551,906 1.66CP ALL PCLTHB5,962,370 38,619,678 1.07Kasikornbank PCLTHB
3.12112,192,547Total - Thailand
275,454 18,020,201 0.50Las Vegas SandsCorp
USDUnited States
1,410,736 54,567,268 1.52YUM CHINAHOLDINGS INC
USD
97.753,516,006,689Total - Shares
2.0272,587,469Total - United States
16,000 0.00 0.0031.12.99CIA VALE DO RIODOCE **
BRL 0.000%
BondsBrazil
97.753,516,006,689Total - Transferable securities admitted to anofficial exchange
0.000.00Total - Bonds
0.000.00Total - Brazil
Securities Marketvalue in
USD
% of netassets*
Quantity Ccy Maturity
2,739,900 0.00 0.00Peace MarkHoldings Ltd **
HKD
Other transferable securitiesSharesBermuda Islands
0.000.00Total - Other transferable securities
0.000.00Total - Shares
0.000.00Total - Bermuda Islands
97.753,516,006,689Total - Investment in securities
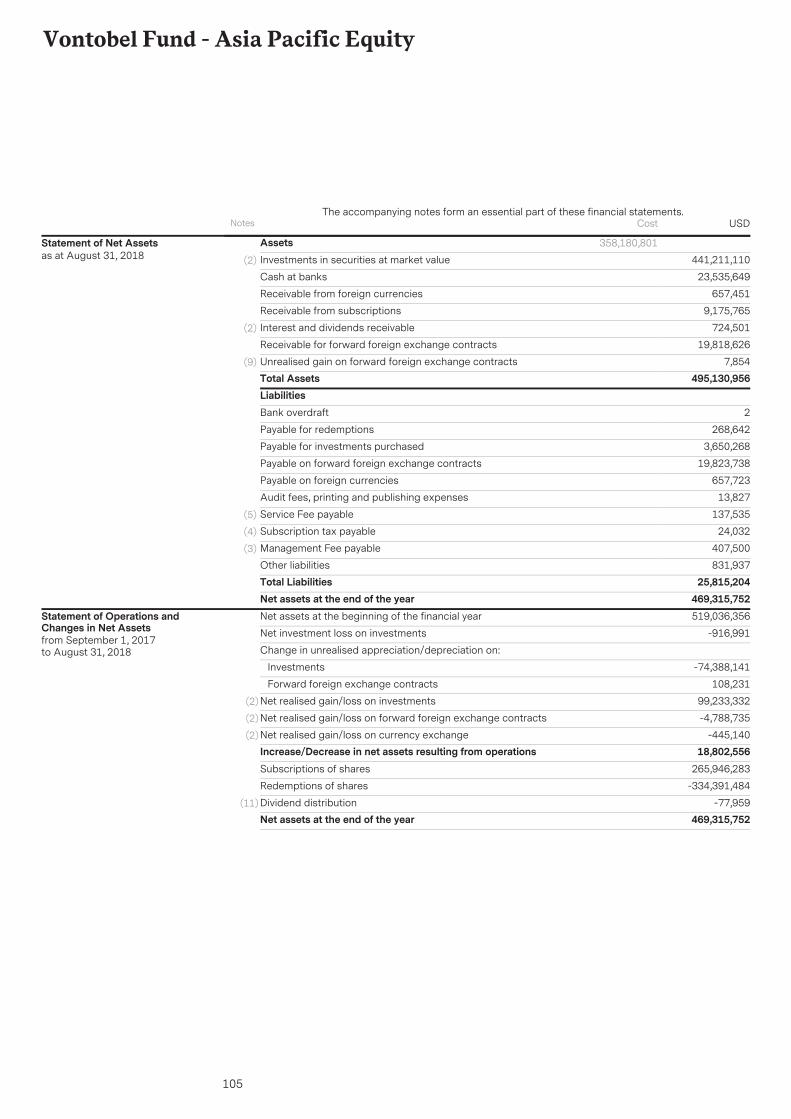
105
Vontobel Fund - Asia Pacific Equity
AssetsInvestments in securities at market value 441,211,110(2)
23,535,649Cash at banks
657,451Receivable from foreign currencies
9,175,765Receivable from subscriptions
724,501Interest and dividends receivable(2)
19,818,626Receivable for forward foreign exchange contracts
7,854Unrealised gain on forward foreign exchange contracts(9)
Total Assets 495,130,956
358,180,801Statement of Net Assetsas at August 31, 2018
LiabilitiesBank overdraft 2
Payable for redemptions 268,642
Payable for investments purchased 3,650,268
Payable on forward foreign exchange contracts 19,823,738
Payable on foreign currencies 657,723
Audit fees, printing and publishing expenses 13,827
Service Fee payable 137,535(5)
Subscription tax payable 24,032(4)
Management Fee payable 407,500(3)
Other liabilities 831,937Total Liabilities 25,815,204Net assets at the end of the year 469,315,752Net assets at the beginning of the financial year 519,036,356
Net investment loss on investments -916,991
Change in unrealised appreciation/depreciation on:
Investments -74,388,141
Forward foreign exchange contracts 108,231
Net realised gain/loss on investments 99,233,332(2)
Net realised gain/loss on forward foreign exchange contracts -4,788,735(2)
Net realised gain/loss on currency exchange -445,140(2)
Increase/Decrease in net assets resulting from operations 18,802,556Subscriptions of shares 265,946,283
Redemptions of shares -334,391,484
Dividend distribution -77,959(11)
Net assets at the end of the year 469,315,752
Statement of Operations andChanges in Net Assetsfrom September 1, 2017to August 31, 2018
Notes USDThe accompanying notes form an essential part of these financial statements.
Cost
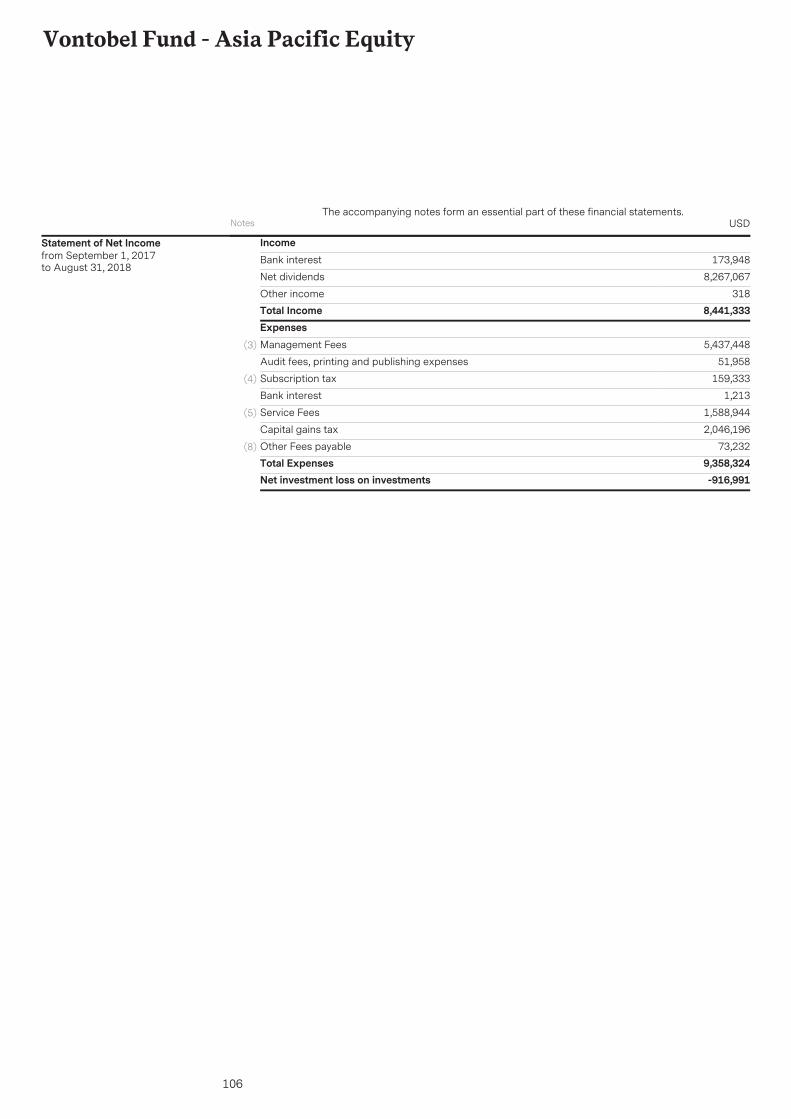
106
Vontobel Fund - Asia Pacific Equity
IncomeBank interest 173,948
Net dividends 8,267,067
Other income 318Total Income 8,441,333ExpensesManagement Fees 5,437,448(3)
Audit fees, printing and publishing expenses 51,958
Subscription tax 159,333(4)
Bank interest 1,213
Service Fees 1,588,944(5)
Capital gains tax 2,046,196
Other Fees payable 73,232(8)
Total Expenses 9,358,324Net investment loss on investments -916,991
Statement of Net Incomefrom September 1, 2017to August 31, 2018
Notes USDThe accompanying notes form an essential part of these financial statements.
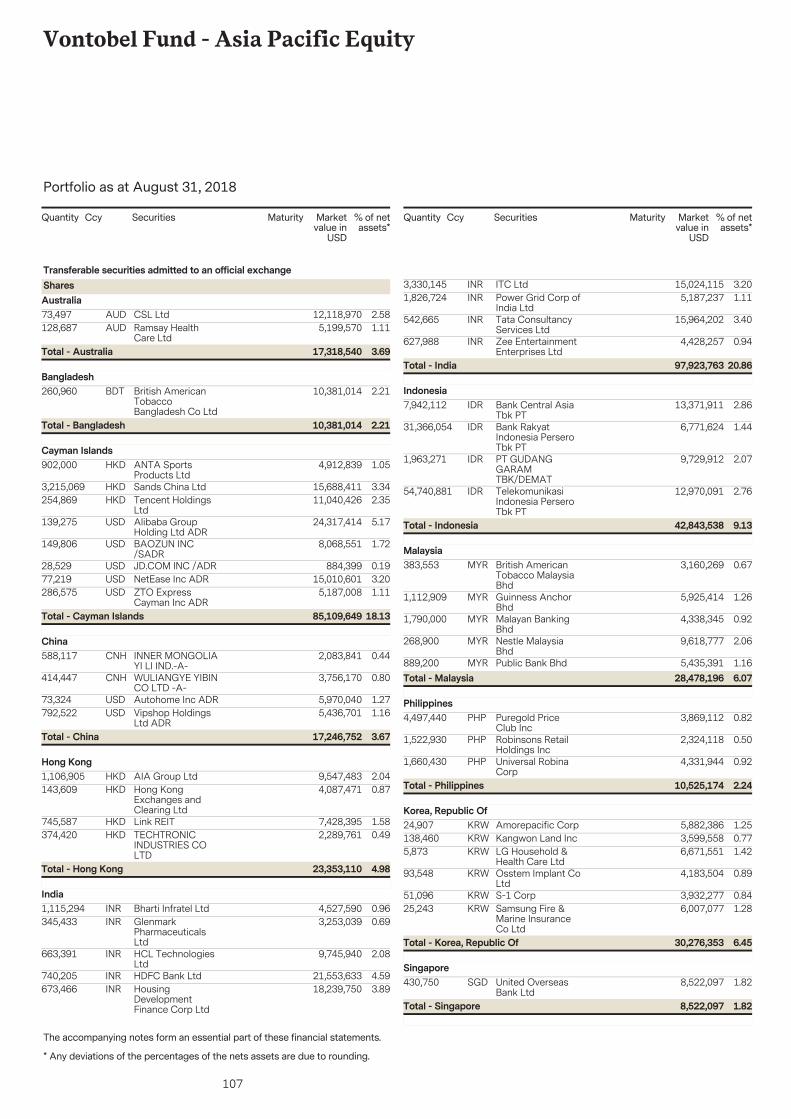
107
Vontobel Fund - Asia Pacific Equity
The accompanying notes form an essential part of these financial statements.
Portfolio as at August 31, 2018
* Any deviations of the percentages of the nets assets are due to rounding.** See note 10
Securities Marketvalue in
USD
% of netassets*
Quantity Ccy Maturity
73,497 12,118,970 2.58CSL LtdAUD
Transferable securities admitted to an official exchangeSharesAustralia
128,687 5,199,570 1.11Ramsay HealthCare Ltd
AUD
3.6917,318,540Total - Australia
260,960 10,381,014 2.21British AmericanTobaccoBangladesh Co Ltd
BDTBangladesh
2.2110,381,014Total - Bangladesh
902,000 4,912,839 1.05ANTA SportsProducts Ltd
HKDCayman Islands
3,215,069 15,688,411 3.34Sands China LtdHKD254,869 11,040,426 2.35Tencent Holdings
LtdHKD
139,275 24,317,414 5.17Alibaba GroupHolding Ltd ADR
USD
149,806 8,068,551 1.72BAOZUN INC/SADR
USD
28,529 884,399 0.19JD.COM INC /ADRUSD77,219 15,010,601 3.20NetEase Inc ADRUSD286,575 5,187,008 1.11ZTO Express
Cayman Inc ADRUSD
18.1385,109,649Total - Cayman Islands
588,117 2,083,841 0.44INNER MONGOLIAYI LI IND.-A-
CNHChina
414,447 3,756,170 0.80WULIANGYE YIBINCO LTD -A-
CNH
73,324 5,970,040 1.27Autohome Inc ADRUSD792,522 5,436,701 1.16Vipshop Holdings
Ltd ADRUSD
3.6717,246,752Total - China
1,106,905 9,547,483 2.04AIA Group LtdHKDHong Kong
143,609 4,087,471 0.87Hong KongExchanges andClearing Ltd
HKD
745,587 7,428,395 1.58Link REITHKD374,420 2,289,761 0.49TECHTRONIC
INDUSTRIES COLTD
HKD
4.9823,353,110Total - Hong Kong
1,115,294 4,527,590 0.96Bharti Infratel LtdINRIndia
345,433 3,253,039 0.69GlenmarkPharmaceuticalsLtd
INR
663,391 9,745,940 2.08HCL TechnologiesLtd
INR
740,205 21,553,633 4.59HDFC Bank LtdINR673,466 18,239,750 3.89Housing
DevelopmentFinance Corp Ltd
INR
Securities Marketvalue in
USD
% of netassets*
Quantity Ccy Maturity
3,330,145 15,024,115 3.20ITC LtdINR1,826,724 5,187,237 1.11Power Grid Corp of
India LtdINR
542,665 15,964,202 3.40Tata ConsultancyServices Ltd
INR
627,988 4,428,257 0.94Zee EntertainmentEnterprises Ltd
INR
20.8697,923,763Total - India
7,942,112 13,371,911 2.86Bank Central AsiaTbk PT
IDRIndonesia
31,366,054 6,771,624 1.44Bank RakyatIndonesia PerseroTbk PT
IDR
1,963,271 9,729,912 2.07PT GUDANGGARAMTBK/DEMAT
IDR
54,740,881 12,970,091 2.76TelekomunikasiIndonesia PerseroTbk PT
IDR
9.1342,843,538Total - Indonesia
383,553 3,160,269 0.67British AmericanTobacco MalaysiaBhd
MYRMalaysia
1,112,909 5,925,414 1.26Guinness AnchorBhd
MYR
1,790,000 4,338,345 0.92Malayan BankingBhd
MYR
268,900 9,618,777 2.06Nestle MalaysiaBhd
MYR
889,200 5,435,391 1.16Public Bank BhdMYR6.0728,478,196Total - Malaysia
4,497,440 3,869,112 0.82Puregold PriceClub Inc
PHPPhilippines
1,522,930 2,324,118 0.50Robinsons RetailHoldings Inc
PHP
1,660,430 4,331,944 0.92Universal RobinaCorp
PHP
2.2410,525,174Total - Philippines
24,907 5,882,386 1.25Amorepacific CorpKRWKorea, Republic Of
138,460 3,599,558 0.77Kangwon Land IncKRW5,873 6,671,551 1.42LG Household &
Health Care LtdKRW
93,548 4,183,504 0.89Osstem Implant CoLtd
KRW
51,096 3,932,277 0.84S-1 CorpKRW25,243 6,007,077 1.28Samsung Fire &
Marine InsuranceCo Ltd
KRW
6.4530,276,353Total - Korea, Republic Of
430,750 8,522,097 1.82United OverseasBank Ltd
SGDSingapore
1.828,522,097Total - Singapore
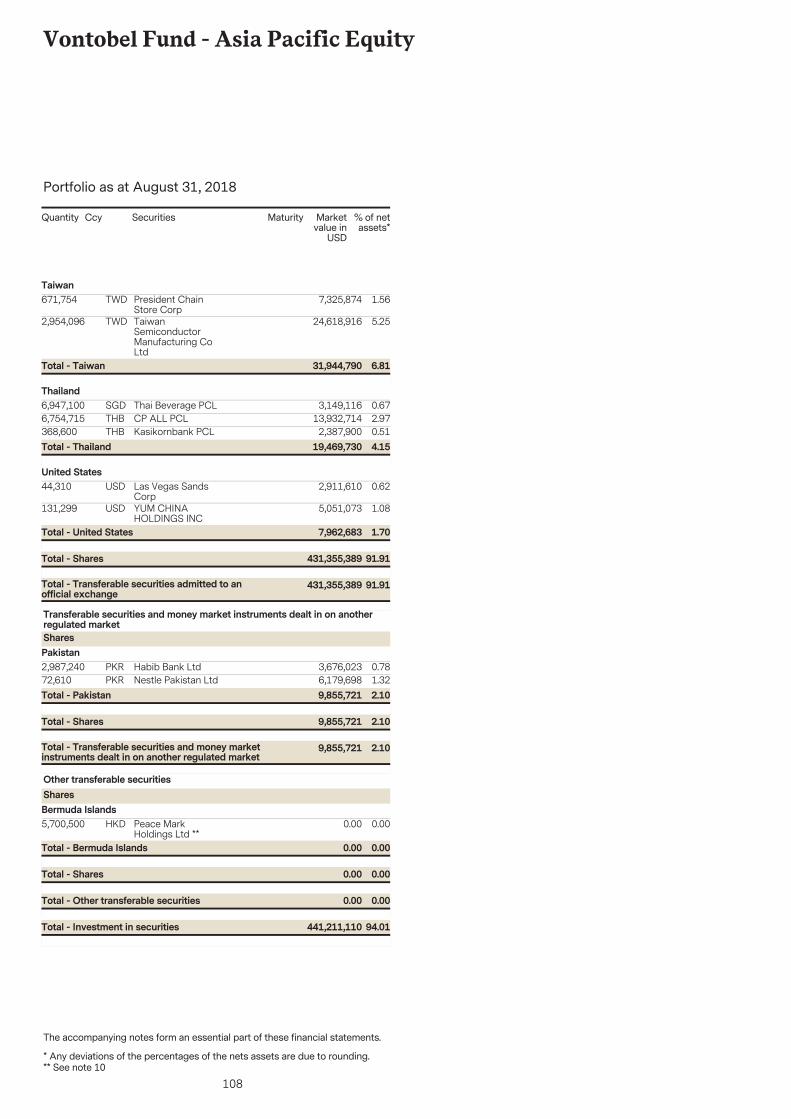
108
Vontobel Fund - Asia Pacific Equity
The accompanying notes form an essential part of these financial statements.
Portfolio as at August 31, 2018
* Any deviations of the percentages of the nets assets are due to rounding.** See note 10
Securities Marketvalue in
USD
% of netassets*
Quantity Ccy Maturity
671,754 7,325,874 1.56President ChainStore Corp
TWDTaiwan
2,954,096 24,618,916 5.25TaiwanSemiconductorManufacturing CoLtd
TWD
6.8131,944,790Total - Taiwan
6,947,100 3,149,116 0.67Thai Beverage PCLSGDThailand
6,754,715 13,932,714 2.97CP ALL PCLTHB368,600 2,387,900 0.51Kasikornbank PCLTHB
4.1519,469,730Total - Thailand
44,310 2,911,610 0.62Las Vegas SandsCorp
USDUnited States
131,299 5,051,073 1.08YUM CHINAHOLDINGS INC
USD
91.91431,355,389Total - Transferable securities admitted to anofficial exchange
91.91431,355,389Total - Shares
1.707,962,683Total - United States
2,987,240 3,676,023 0.78Habib Bank LtdPKR
Transferable securities and money market instruments dealt in on anotherregulated marketSharesPakistan
72,610 6,179,698 1.32Nestle Pakistan LtdPKR
2.109,855,721Total - Transferable securities and money marketinstruments dealt in on another regulated market
2.109,855,721Total - Shares
2.109,855,721Total - Pakistan
5,700,500 0.00 0.00Peace MarkHoldings Ltd **
HKD
Other transferable securitiesSharesBermuda Islands
0.000.00Total - Other transferable securities
0.000.00Total - Shares
0.000.00Total - Bermuda Islands
94.01441,211,110Total - Investment in securities
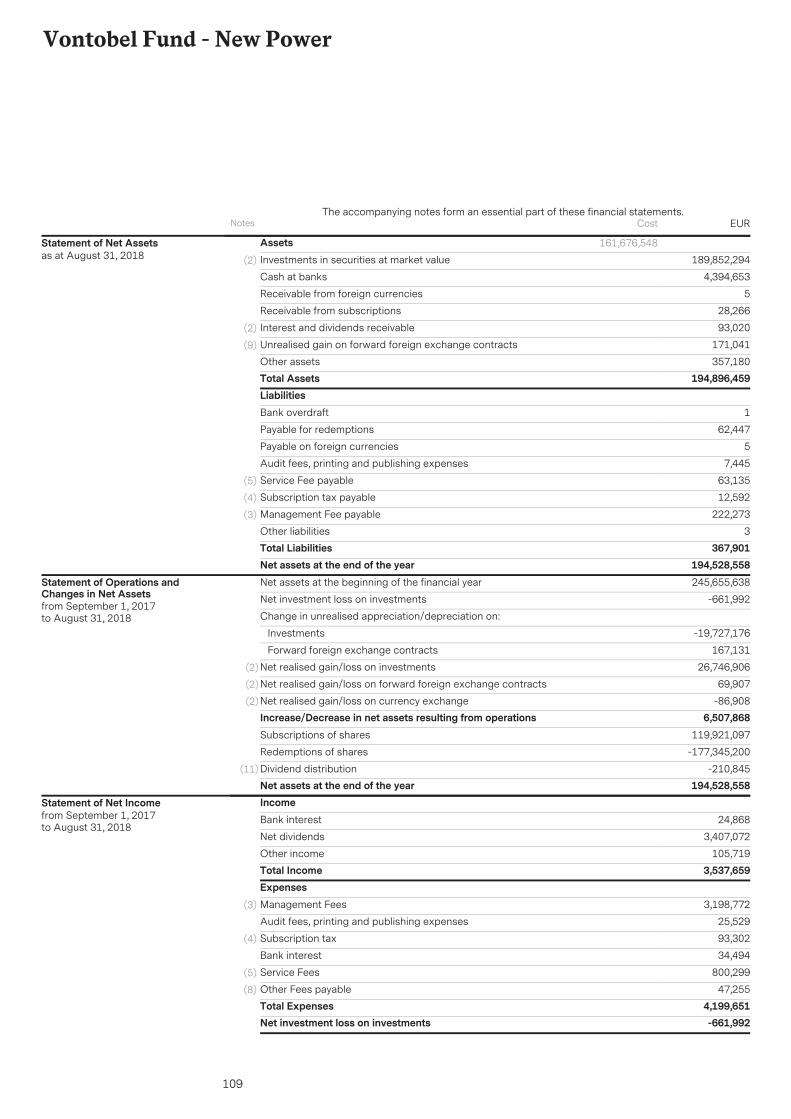
109
Vontobel Fund - New Power
AssetsInvestments in securities at market value 189,852,294(2)
4,394,653Cash at banks
5Receivable from foreign currencies
28,266Receivable from subscriptions
93,020Interest and dividends receivable(2)
171,041Unrealised gain on forward foreign exchange contracts(9)
357,180Other assetsTotal Assets 194,896,459
161,676,548Statement of Net Assetsas at August 31, 2018
LiabilitiesBank overdraft 1
Payable for redemptions 62,447
Payable on foreign currencies 5
Audit fees, printing and publishing expenses 7,445
Service Fee payable 63,135(5)
Subscription tax payable 12,592(4)
Management Fee payable 222,273(3)
Other liabilities 3Total Liabilities 367,901Net assets at the end of the year 194,528,558Net assets at the beginning of the financial year 245,655,638
Net investment loss on investments -661,992
Change in unrealised appreciation/depreciation on:
Investments -19,727,176
Forward foreign exchange contracts 167,131
Net realised gain/loss on investments 26,746,906(2)
Net realised gain/loss on forward foreign exchange contracts 69,907(2)
Net realised gain/loss on currency exchange -86,908(2)
Increase/Decrease in net assets resulting from operations 6,507,868Subscriptions of shares 119,921,097
Redemptions of shares -177,345,200
Dividend distribution -210,845(11)
Net assets at the end of the year 194,528,558
Statement of Operations andChanges in Net Assetsfrom September 1, 2017to August 31, 2018
IncomeBank interest 24,868
Net dividends 3,407,072
Other income 105,719Total Income 3,537,659ExpensesManagement Fees 3,198,772(3)
Audit fees, printing and publishing expenses 25,529
Subscription tax 93,302(4)
Bank interest 34,494
Service Fees 800,299(5)
Other Fees payable 47,255(8)
Total Expenses 4,199,651Net investment loss on investments -661,992
Statement of Net Incomefrom September 1, 2017to August 31, 2018
Notes EURThe accompanying notes form an essential part of these financial statements.
Cost
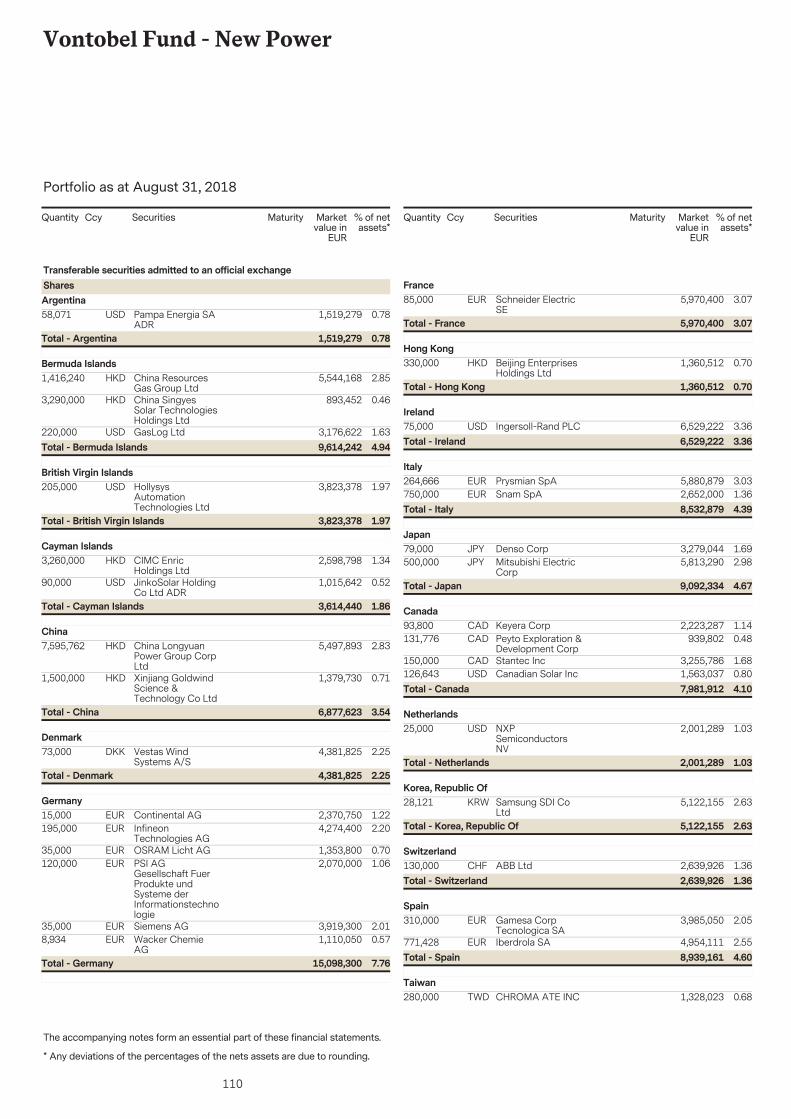
110
Vontobel Fund - New Power
The accompanying notes form an essential part of these financial statements.
Portfolio as at August 31, 2018
* Any deviations of the percentages of the nets assets are due to rounding.
Securities Marketvalue in
EUR
% of netassets*
Quantity Ccy Maturity
58,071 1,519,279 0.78Pampa Energia SAADR
USD
Transferable securities admitted to an official exchangeSharesArgentina
0.781,519,279Total - Argentina
1,416,240 5,544,168 2.85China ResourcesGas Group Ltd
HKDBermuda Islands
3,290,000 893,452 0.46China SingyesSolar TechnologiesHoldings Ltd
HKD
220,000 3,176,622 1.63GasLog LtdUSD4.949,614,242Total - Bermuda Islands
205,000 3,823,378 1.97HollysysAutomationTechnologies Ltd
USDBritish Virgin Islands
1.973,823,378Total - British Virgin Islands
3,260,000 2,598,798 1.34CIMC EnricHoldings Ltd
HKDCayman Islands
90,000 1,015,642 0.52JinkoSolar HoldingCo Ltd ADR
USD
1.863,614,440Total - Cayman Islands
7,595,762 5,497,893 2.83China LongyuanPower Group CorpLtd
HKDChina
1,500,000 1,379,730 0.71Xinjiang GoldwindScience &Technology Co Ltd
HKD
3.546,877,623Total - China
73,000 4,381,825 2.25Vestas WindSystems A/S
DKKDenmark
2.254,381,825Total - Denmark
15,000 2,370,750 1.22Continental AGEURGermany
195,000 4,274,400 2.20InfineonTechnologies AG
EUR
35,000 1,353,800 0.70OSRAM Licht AGEUR120,000 2,070,000 1.06PSI AG
Gesellschaft FuerProdukte undSysteme derInformationstechnologie
EUR
35,000 3,919,300 2.01Siemens AGEUR8,934 1,110,050 0.57Wacker Chemie
AGEUR
7.7615,098,300Total - Germany
Securities Marketvalue in
EUR
% of netassets*
Quantity Ccy Maturity
85,000 5,970,400 3.07Schneider ElectricSE
EURFrance
3.075,970,400Total - France
330,000 1,360,512 0.70Beijing EnterprisesHoldings Ltd
HKDHong Kong
0.701,360,512Total - Hong Kong
75,000 6,529,222 3.36Ingersoll-Rand PLCUSDIreland
3.366,529,222Total - Ireland
264,666 5,880,879 3.03Prysmian SpAEURItaly
750,000 2,652,000 1.36Snam SpAEUR4.398,532,879Total - Italy
79,000 3,279,044 1.69Denso CorpJPYJapan
500,000 5,813,290 2.98Mitsubishi ElectricCorp
JPY
4.679,092,334Total - Japan
93,800 2,223,287 1.14Keyera CorpCADCanada
131,776 939,802 0.48Peyto Exploration &Development Corp
CAD
150,000 3,255,786 1.68Stantec IncCAD126,643 1,563,037 0.80Canadian Solar IncUSD
4.107,981,912Total - Canada
25,000 2,001,289 1.03NXPSemiconductorsNV
USDNetherlands
1.032,001,289Total - Netherlands
28,121 5,122,155 2.63Samsung SDI CoLtd
KRWKorea, Republic Of
2.635,122,155Total - Korea, Republic Of
130,000 2,639,926 1.36ABB LtdCHFSwitzerland
1.362,639,926Total - Switzerland
310,000 3,985,050 2.05Gamesa CorpTecnologica SA
EURSpain
771,428 4,954,111 2.55Iberdrola SAEUR4.608,939,161Total - Spain
280,000 1,328,023 0.68CHROMA ATE INCTWDTaiwan
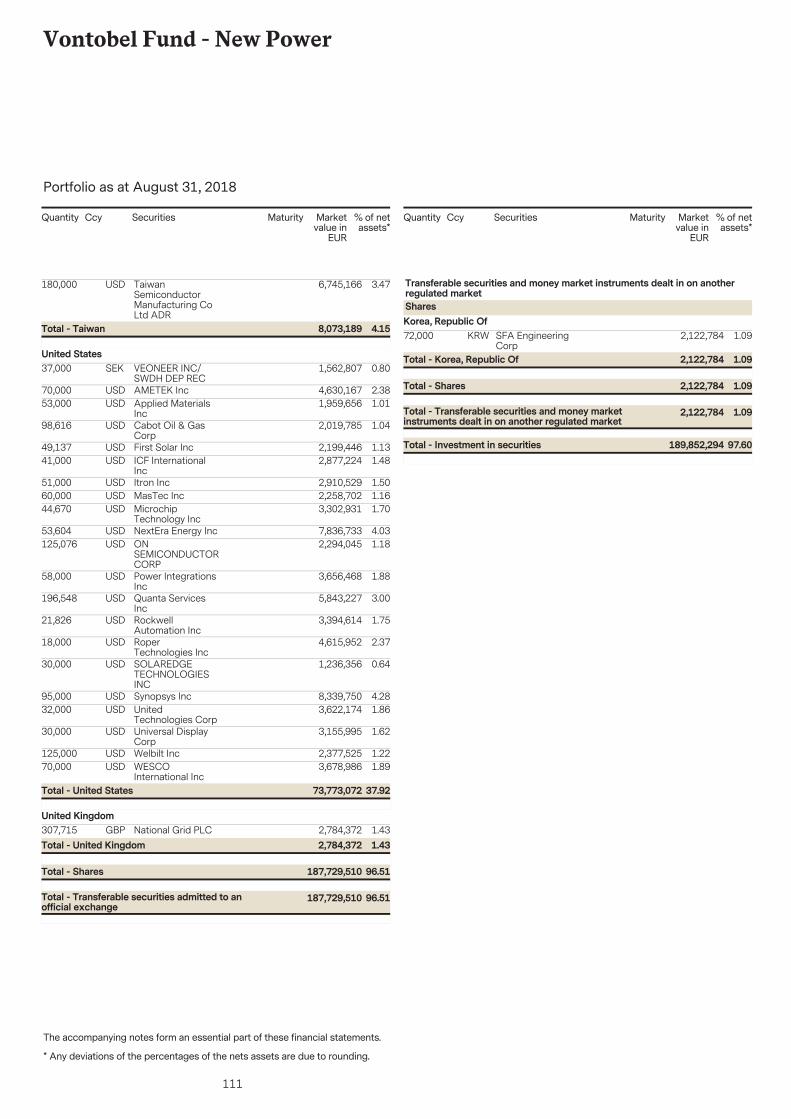
111
Vontobel Fund - New Power
The accompanying notes form an essential part of these financial statements.
Portfolio as at August 31, 2018
* Any deviations of the percentages of the nets assets are due to rounding.
Securities Marketvalue in
EUR
% of netassets*
Quantity Ccy Maturity
180,000 6,745,166 3.47TaiwanSemiconductorManufacturing CoLtd ADR
USD
4.158,073,189Total - Taiwan
37,000 1,562,807 0.80VEONEER INC/SWDH DEP REC
SEKUnited States
70,000 4,630,167 2.38AMETEK IncUSD53,000 1,959,656 1.01Applied Materials
IncUSD
98,616 2,019,785 1.04Cabot Oil & GasCorp
USD
49,137 2,199,446 1.13First Solar IncUSD41,000 2,877,224 1.48ICF International
IncUSD
51,000 2,910,529 1.50Itron IncUSD60,000 2,258,702 1.16MasTec IncUSD44,670 3,302,931 1.70Microchip
Technology IncUSD
53,604 7,836,733 4.03NextEra Energy IncUSD125,076 2,294,045 1.18ON
SEMICONDUCTORCORP
USD
58,000 3,656,468 1.88Power IntegrationsInc
USD
196,548 5,843,227 3.00Quanta ServicesInc
USD
21,826 3,394,614 1.75RockwellAutomation Inc
USD
18,000 4,615,952 2.37RoperTechnologies Inc
USD
30,000 1,236,356 0.64SOLAREDGETECHNOLOGIESINC
USD
95,000 8,339,750 4.28Synopsys IncUSD32,000 3,622,174 1.86United
Technologies CorpUSD
30,000 3,155,995 1.62Universal DisplayCorp
USD
125,000 2,377,525 1.22Welbilt IncUSD70,000 3,678,986 1.89WESCO
International IncUSD
37.9273,773,072Total - United States
307,715 2,784,372 1.43National Grid PLCGBPUnited Kingdom
96.51187,729,510Total - Transferable securities admitted to anofficial exchange
96.51187,729,510Total - Shares
1.432,784,372Total - United Kingdom
Securities Marketvalue in
EUR
% of netassets*
Quantity Ccy Maturity
72,000 2,122,784 1.09SFA EngineeringCorp
KRW
Transferable securities and money market instruments dealt in on anotherregulated marketSharesKorea, Republic Of
1.092,122,784Total - Transferable securities and money marketinstruments dealt in on another regulated market
1.092,122,784Total - Shares
1.092,122,784Total - Korea, Republic Of
97.60189,852,294Total - Investment in securities
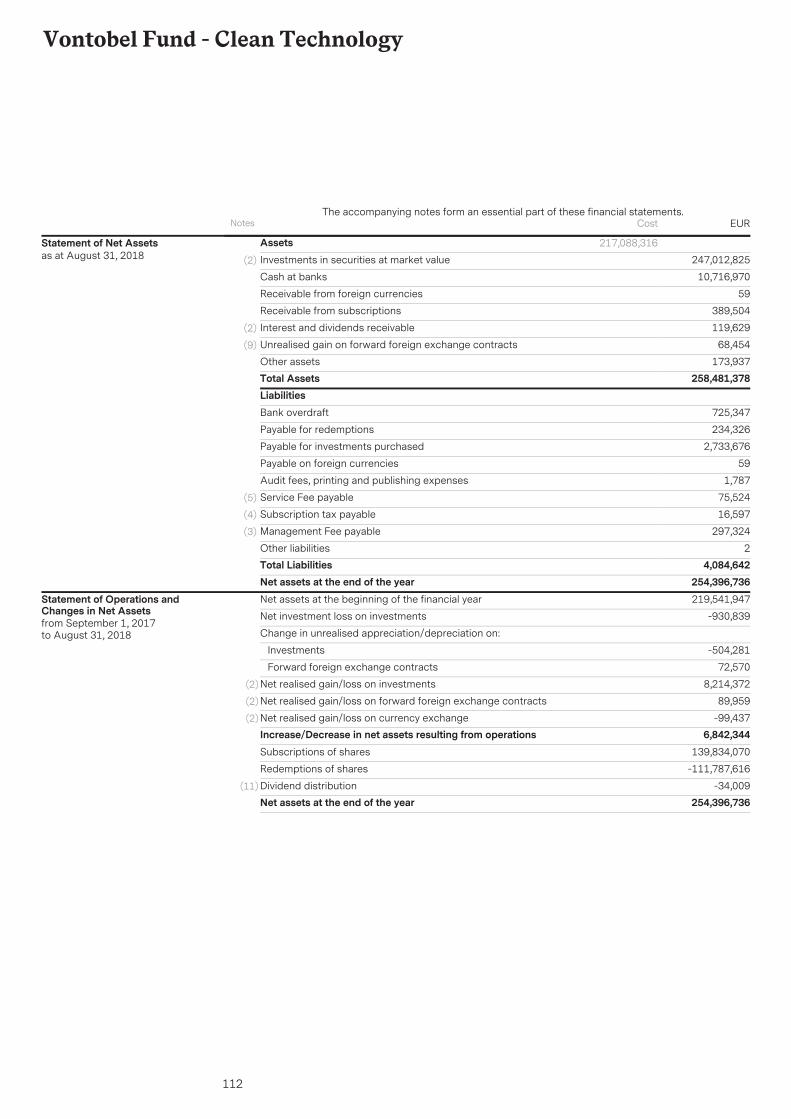
112
Vontobel Fund - Clean Technology
AssetsInvestments in securities at market value 247,012,825(2)
10,716,970Cash at banks
59Receivable from foreign currencies
389,504Receivable from subscriptions
119,629Interest and dividends receivable(2)
68,454Unrealised gain on forward foreign exchange contracts(9)
173,937Other assetsTotal Assets 258,481,378
217,088,316Statement of Net Assetsas at August 31, 2018
LiabilitiesBank overdraft 725,347
Payable for redemptions 234,326
Payable for investments purchased 2,733,676
Payable on foreign currencies 59
Audit fees, printing and publishing expenses 1,787
Service Fee payable 75,524(5)
Subscription tax payable 16,597(4)
Management Fee payable 297,324(3)
Other liabilities 2Total Liabilities 4,084,642Net assets at the end of the year 254,396,736Net assets at the beginning of the financial year 219,541,947
Net investment loss on investments -930,839
Change in unrealised appreciation/depreciation on:
Investments -504,281
Forward foreign exchange contracts 72,570
Net realised gain/loss on investments 8,214,372(2)
Net realised gain/loss on forward foreign exchange contracts 89,959(2)
Net realised gain/loss on currency exchange -99,437(2)
Increase/Decrease in net assets resulting from operations 6,842,344Subscriptions of shares 139,834,070
Redemptions of shares -111,787,616
Dividend distribution -34,009(11)
Net assets at the end of the year 254,396,736
Statement of Operations andChanges in Net Assetsfrom September 1, 2017to August 31, 2018
Notes EURThe accompanying notes form an essential part of these financial statements.
Cost
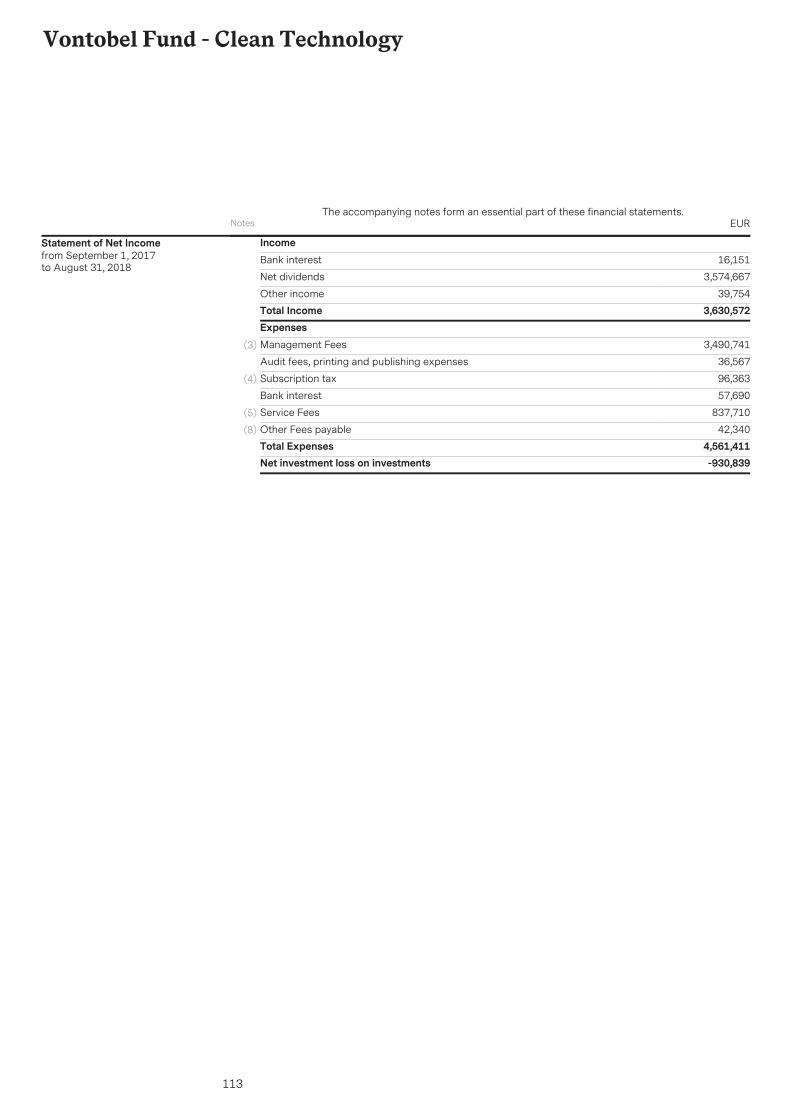
113
Vontobel Fund - Clean Technology
IncomeBank interest 16,151
Net dividends 3,574,667
Other income 39,754Total Income 3,630,572ExpensesManagement Fees 3,490,741(3)
Audit fees, printing and publishing expenses 36,567
Subscription tax 96,363(4)
Bank interest 57,690
Service Fees 837,710(5)
Other Fees payable 42,340(8)
Total Expenses 4,561,411Net investment loss on investments -930,839
Statement of Net Incomefrom September 1, 2017to August 31, 2018
Notes EURThe accompanying notes form an essential part of these financial statements.
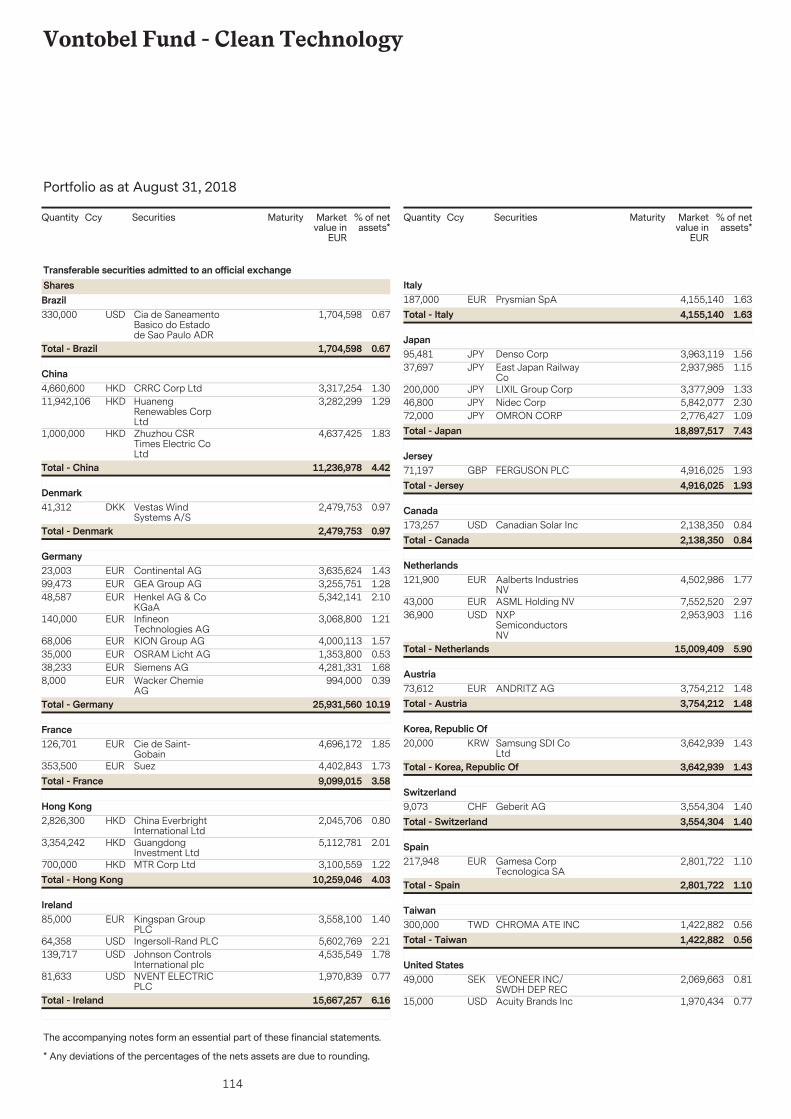
114
Vontobel Fund - Clean Technology
The accompanying notes form an essential part of these financial statements.
Portfolio as at August 31, 2018
* Any deviations of the percentages of the nets assets are due to rounding.
Securities Marketvalue in
EUR
% of netassets*
Quantity Ccy Maturity
330,000 1,704,598 0.67Cia de SaneamentoBasico do Estadode Sao Paulo ADR
USD
Transferable securities admitted to an official exchangeSharesBrazil
0.671,704,598Total - Brazil
4,660,600 3,317,254 1.30CRRC Corp LtdHKDChina
11,942,106 3,282,299 1.29HuanengRenewables CorpLtd
HKD
1,000,000 4,637,425 1.83Zhuzhou CSRTimes Electric CoLtd
HKD
4.4211,236,978Total - China
41,312 2,479,753 0.97Vestas WindSystems A/S
DKKDenmark
0.972,479,753Total - Denmark
23,003 3,635,624 1.43Continental AGEURGermany
99,473 3,255,751 1.28GEA Group AGEUR48,587 5,342,141 2.10Henkel AG & Co
KGaAEUR
140,000 3,068,800 1.21InfineonTechnologies AG
EUR
68,006 4,000,113 1.57KION Group AGEUR35,000 1,353,800 0.53OSRAM Licht AGEUR38,233 4,281,331 1.68Siemens AGEUR8,000 994,000 0.39Wacker Chemie
AGEUR
10.1925,931,560Total - Germany
126,701 4,696,172 1.85Cie de Saint-Gobain
EURFrance
353,500 4,402,843 1.73SuezEUR3.589,099,015Total - France
2,826,300 2,045,706 0.80China EverbrightInternational Ltd
HKDHong Kong
3,354,242 5,112,781 2.01GuangdongInvestment Ltd
HKD
700,000 3,100,559 1.22MTR Corp LtdHKD4.0310,259,046Total - Hong Kong
85,000 3,558,100 1.40Kingspan GroupPLC
EURIreland
64,358 5,602,769 2.21Ingersoll-Rand PLCUSD139,717 4,535,549 1.78Johnson Controls
International plcUSD
81,633 1,970,839 0.77NVENT ELECTRICPLC
USD
6.1615,667,257Total - Ireland
Securities Marketvalue in
EUR
% of netassets*
Quantity Ccy Maturity
187,000 4,155,140 1.63Prysmian SpAEURItaly
1.634,155,140Total - Italy
95,481 3,963,119 1.56Denso CorpJPYJapan
37,697 2,937,985 1.15East Japan RailwayCo
JPY
200,000 3,377,909 1.33LIXIL Group CorpJPY46,800 5,842,077 2.30Nidec CorpJPY72,000 2,776,427 1.09OMRON CORPJPY
7.4318,897,517Total - Japan
71,197 4,916,025 1.93FERGUSON PLCGBPJersey
1.934,916,025Total - Jersey
173,257 2,138,350 0.84Canadian Solar IncUSDCanada
0.842,138,350Total - Canada
121,900 4,502,986 1.77Aalberts IndustriesNV
EURNetherlands
43,000 7,552,520 2.97ASML Holding NVEUR36,900 2,953,903 1.16NXP
SemiconductorsNV
USD
5.9015,009,409Total - Netherlands
73,612 3,754,212 1.48ANDRITZ AGEURAustria
1.483,754,212Total - Austria
20,000 3,642,939 1.43Samsung SDI CoLtd
KRWKorea, Republic Of
1.433,642,939Total - Korea, Republic Of
9,073 3,554,304 1.40Geberit AGCHFSwitzerland
1.403,554,304Total - Switzerland
217,948 2,801,722 1.10Gamesa CorpTecnologica SA
EURSpain
1.102,801,722Total - Spain
300,000 1,422,882 0.56CHROMA ATE INCTWDTaiwan
0.561,422,882Total - Taiwan
49,000 2,069,663 0.81VEONEER INC/SWDH DEP REC
SEKUnited States
15,000 1,970,434 0.77Acuity Brands IncUSD
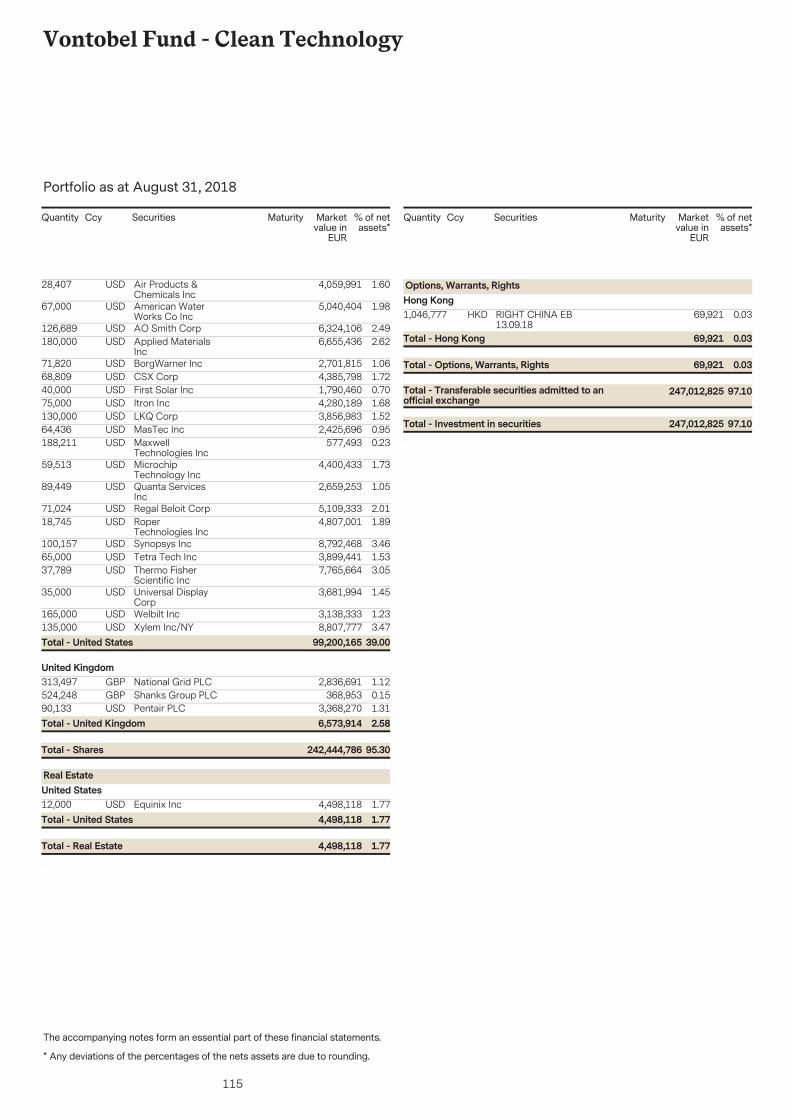
115
Vontobel Fund - Clean Technology
The accompanying notes form an essential part of these financial statements.
Portfolio as at August 31, 2018
* Any deviations of the percentages of the nets assets are due to rounding.
Securities Marketvalue in
EUR
% of netassets*
Quantity Ccy Maturity
28,407 4,059,991 1.60Air Products &Chemicals Inc
USD
67,000 5,040,404 1.98American WaterWorks Co Inc
USD
126,689 6,324,106 2.49AO Smith CorpUSD180,000 6,655,436 2.62Applied Materials
IncUSD
71,820 2,701,815 1.06BorgWarner IncUSD68,809 4,385,798 1.72CSX CorpUSD40,000 1,790,460 0.70First Solar IncUSD75,000 4,280,189 1.68Itron IncUSD130,000 3,856,983 1.52LKQ CorpUSD64,436 2,425,696 0.95MasTec IncUSD188,211 577,493 0.23Maxwell
Technologies IncUSD
59,513 4,400,433 1.73MicrochipTechnology Inc
USD
89,449 2,659,253 1.05Quanta ServicesInc
USD
71,024 5,109,333 2.01Regal Beloit CorpUSD18,745 4,807,001 1.89Roper
Technologies IncUSD
100,157 8,792,468 3.46Synopsys IncUSD65,000 3,899,441 1.53Tetra Tech IncUSD37,789 7,765,664 3.05Thermo Fisher
Scientific IncUSD
35,000 3,681,994 1.45Universal DisplayCorp
USD
165,000 3,138,333 1.23Welbilt IncUSD135,000 8,807,777 3.47Xylem Inc/NYUSD
39.0099,200,165Total - United States
313,497 2,836,691 1.12National Grid PLCGBPUnited Kingdom
524,248 368,953 0.15Shanks Group PLCGBP90,133 3,368,270 1.31Pentair PLCUSD
95.30242,444,786Total - Shares
2.586,573,914Total - United Kingdom
12,000 4,498,118 1.77Equinix IncUSD
Real EstateUnited States
1.774,498,118Total - Real Estate
1.774,498,118Total - United States
Securities Marketvalue in
EUR
% of netassets*
Quantity Ccy Maturity
1,046,777 69,921 0.03RIGHT CHINA EB13.09.18
HKD
Options, Warrants, RightsHong Kong
97.10247,012,825Total - Transferable securities admitted to anofficial exchange
0.0369,921Total - Options, Warrants, Rights
0.0369,921Total - Hong Kong
97.10247,012,825Total - Investment in securities
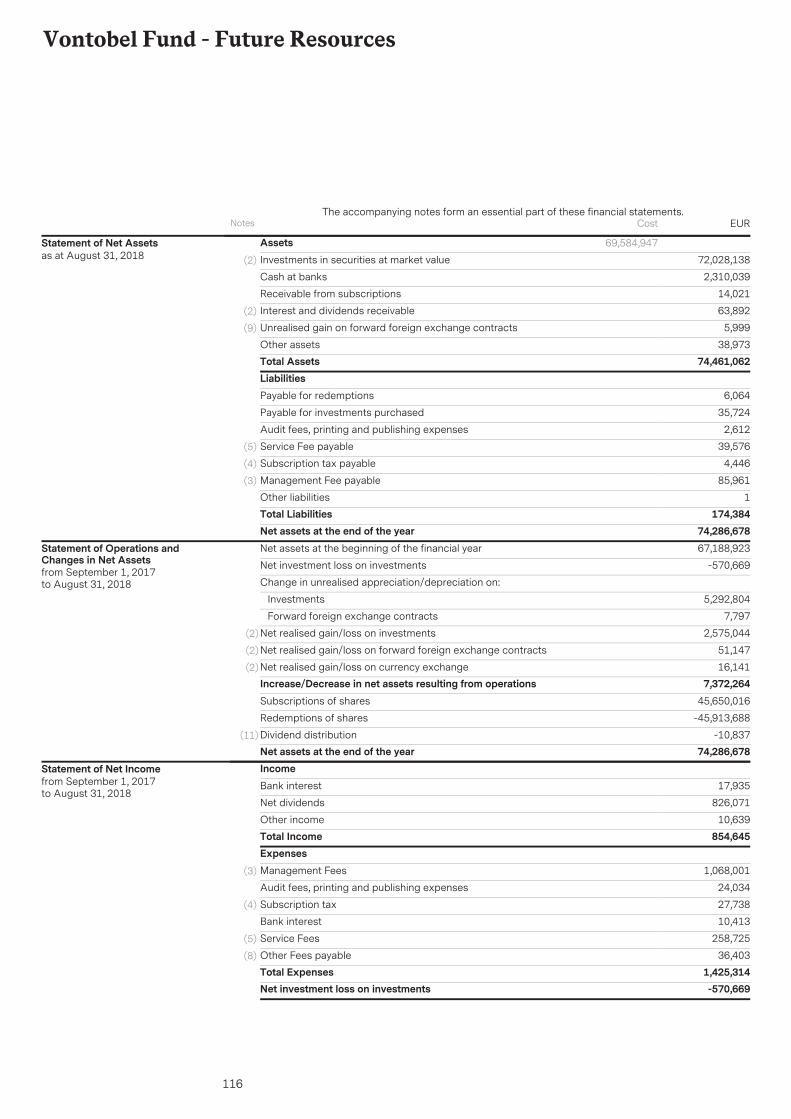
116
Vontobel Fund - Future Resources
AssetsInvestments in securities at market value 72,028,138(2)
2,310,039Cash at banks
14,021Receivable from subscriptions
63,892Interest and dividends receivable(2)
5,999Unrealised gain on forward foreign exchange contracts(9)
38,973Other assetsTotal Assets 74,461,062
69,584,947Statement of Net Assetsas at August 31, 2018
LiabilitiesPayable for redemptions 6,064
Payable for investments purchased 35,724
Audit fees, printing and publishing expenses 2,612
Service Fee payable 39,576(5)
Subscription tax payable 4,446(4)
Management Fee payable 85,961(3)
Other liabilities 1Total Liabilities 174,384Net assets at the end of the year 74,286,678Net assets at the beginning of the financial year 67,188,923
Net investment loss on investments -570,669
Change in unrealised appreciation/depreciation on:
Investments 5,292,804
Forward foreign exchange contracts 7,797
Net realised gain/loss on investments 2,575,044(2)
Net realised gain/loss on forward foreign exchange contracts 51,147(2)
Net realised gain/loss on currency exchange 16,141(2)
Increase/Decrease in net assets resulting from operations 7,372,264Subscriptions of shares 45,650,016
Redemptions of shares -45,913,688
Dividend distribution -10,837(11)
Net assets at the end of the year 74,286,678
Statement of Operations andChanges in Net Assetsfrom September 1, 2017to August 31, 2018
IncomeBank interest 17,935
Net dividends 826,071
Other income 10,639Total Income 854,645ExpensesManagement Fees 1,068,001(3)
Audit fees, printing and publishing expenses 24,034
Subscription tax 27,738(4)
Bank interest 10,413
Service Fees 258,725(5)
Other Fees payable 36,403(8)
Total Expenses 1,425,314Net investment loss on investments -570,669
Statement of Net Incomefrom September 1, 2017to August 31, 2018
Notes EURThe accompanying notes form an essential part of these financial statements.
Cost
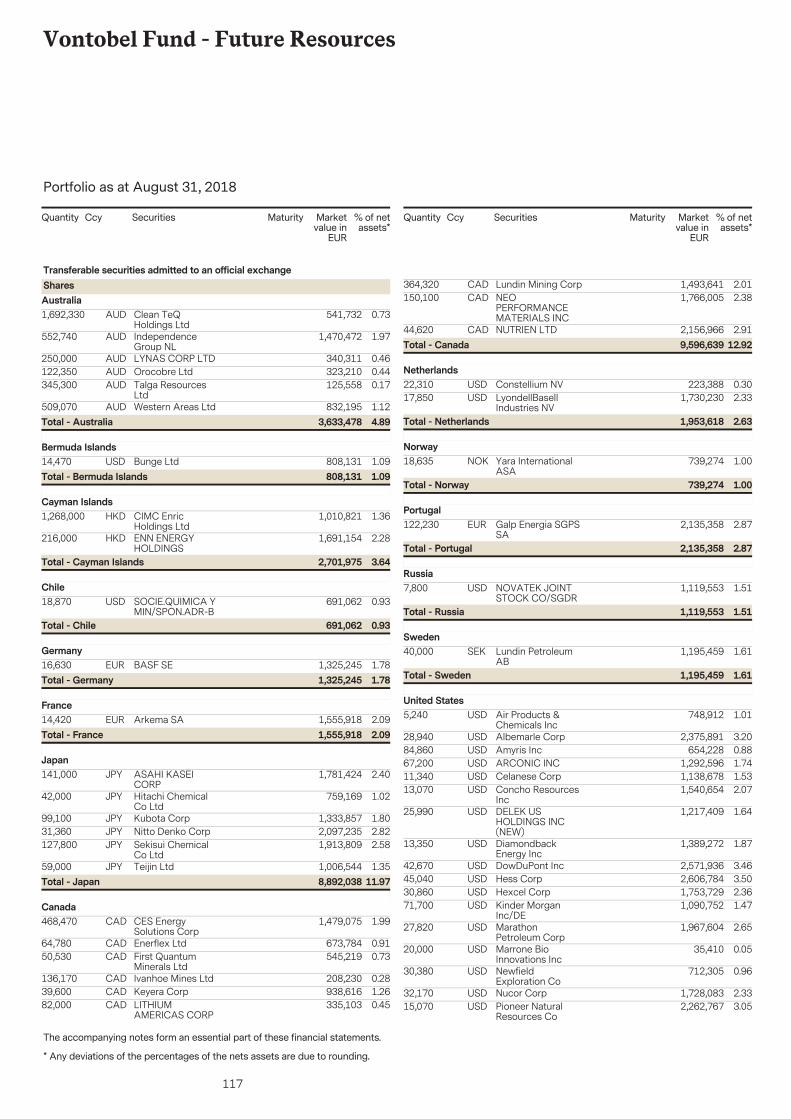
117
Vontobel Fund - Future Resources
The accompanying notes form an essential part of these financial statements.
Portfolio as at August 31, 2018
* Any deviations of the percentages of the nets assets are due to rounding.
Securities Marketvalue in
EUR
% of netassets*
Quantity Ccy Maturity
1,692,330 541,732 0.73Clean TeQHoldings Ltd
AUD
Transferable securities admitted to an official exchangeSharesAustralia
552,740 1,470,472 1.97IndependenceGroup NL
AUD
250,000 340,311 0.46LYNAS CORP LTDAUD122,350 323,210 0.44Orocobre LtdAUD345,300 125,558 0.17Talga Resources
LtdAUD
509,070 832,195 1.12Western Areas LtdAUD4.893,633,478Total - Australia
14,470 808,131 1.09Bunge LtdUSDBermuda Islands
1.09808,131Total - Bermuda Islands
1,268,000 1,010,821 1.36CIMC EnricHoldings Ltd
HKDCayman Islands
216,000 1,691,154 2.28ENN ENERGYHOLDINGS
HKD
3.642,701,975Total - Cayman Islands
18,870 691,062 0.93SOCIE.QUIMICA YMIN/SPON.ADR-B
USDChile
0.93691,062Total - Chile
16,630 1,325,245 1.78BASF SEEURGermany
1.781,325,245Total - Germany
14,420 1,555,918 2.09Arkema SAEURFrance
2.091,555,918Total - France
141,000 1,781,424 2.40ASAHI KASEICORP
JPYJapan
42,000 759,169 1.02Hitachi ChemicalCo Ltd
JPY
99,100 1,333,857 1.80Kubota CorpJPY31,360 2,097,235 2.82Nitto Denko CorpJPY127,800 1,913,809 2.58Sekisui Chemical
Co LtdJPY
59,000 1,006,544 1.35Teijin LtdJPY11.978,892,038Total - Japan
468,470 1,479,075 1.99CES EnergySolutions Corp
CADCanada
64,780 673,784 0.91Enerflex LtdCAD50,530 545,219 0.73First Quantum
Minerals LtdCAD
136,170 208,230 0.28Ivanhoe Mines LtdCAD39,600 938,616 1.26Keyera CorpCAD82,000 335,103 0.45LITHIUM
AMERICAS CORPCAD
Securities Marketvalue in
EUR
% of netassets*
Quantity Ccy Maturity
364,320 1,493,641 2.01Lundin Mining CorpCAD150,100 1,766,005 2.38NEO
PERFORMANCEMATERIALS INC
CAD
44,620 2,156,966 2.91NUTRIEN LTDCAD12.929,596,639Total - Canada
22,310 223,388 0.30Constellium NVUSDNetherlands
17,850 1,730,230 2.33LyondellBasellIndustries NV
USD
2.631,953,618Total - Netherlands
18,635 739,274 1.00Yara InternationalASA
NOKNorway
1.00739,274Total - Norway
122,230 2,135,358 2.87Galp Energia SGPSSA
EURPortugal
2.872,135,358Total - Portugal
7,800 1,119,553 1.51NOVATEK JOINTSTOCK CO/SGDR
USDRussia
1.511,119,553Total - Russia
40,000 1,195,459 1.61Lundin PetroleumAB
SEKSweden
1.611,195,459Total - Sweden
5,240 748,912 1.01Air Products &Chemicals Inc
USDUnited States
28,940 2,375,891 3.20Albemarle CorpUSD84,860 654,228 0.88Amyris IncUSD67,200 1,292,596 1.74ARCONIC INCUSD11,340 1,138,678 1.53Celanese CorpUSD13,070 1,540,654 2.07Concho Resources
IncUSD
25,990 1,217,409 1.64DELEK USHOLDINGS INC(NEW)
USD
13,350 1,389,272 1.87DiamondbackEnergy Inc
USD
42,670 2,571,936 3.46DowDuPont IncUSD45,040 2,606,784 3.50Hess CorpUSD30,860 1,753,729 2.36Hexcel CorpUSD71,700 1,090,752 1.47Kinder Morgan
Inc/DEUSD
27,820 1,967,604 2.65MarathonPetroleum Corp
USD
20,000 35,410 0.05Marrone BioInnovations Inc
USD
30,380 712,305 0.96NewfieldExploration Co
USD
32,170 1,728,083 2.33Nucor CorpUSD15,070 2,262,767 3.05Pioneer Natural
Resources CoUSD
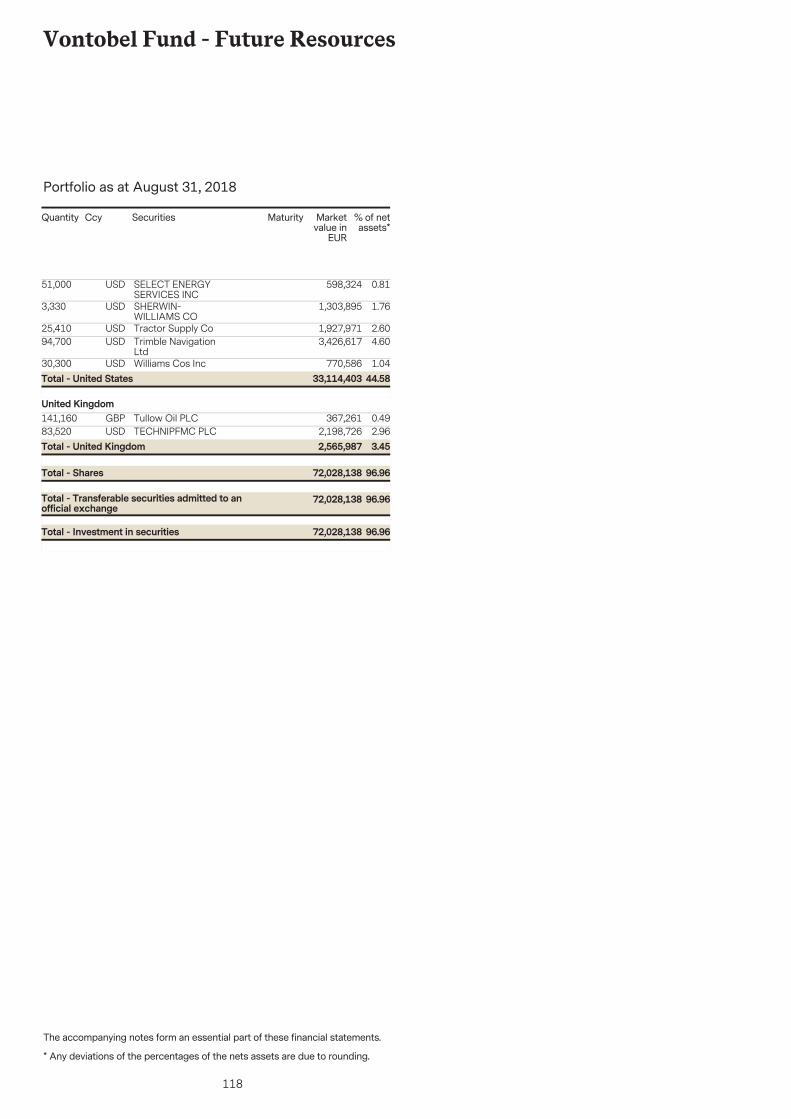
118
Vontobel Fund - Future Resources
The accompanying notes form an essential part of these financial statements.
Portfolio as at August 31, 2018
* Any deviations of the percentages of the nets assets are due to rounding.
Securities Marketvalue in
EUR
% of netassets*
Quantity Ccy Maturity
51,000 598,324 0.81SELECT ENERGYSERVICES INC
USD
3,330 1,303,895 1.76SHERWIN-WILLIAMS CO
USD
25,410 1,927,971 2.60Tractor Supply CoUSD94,700 3,426,617 4.60Trimble Navigation
LtdUSD
30,300 770,586 1.04Williams Cos IncUSD44.5833,114,403Total - United States
141,160 367,261 0.49Tullow Oil PLCGBPUnited Kingdom
83,520 2,198,726 2.96TECHNIPFMC PLCUSD
96.9672,028,138Total - Transferable securities admitted to anofficial exchange
96.9672,028,138Total - Shares
3.452,565,987Total - United Kingdom
96.9672,028,138Total - Investment in securities
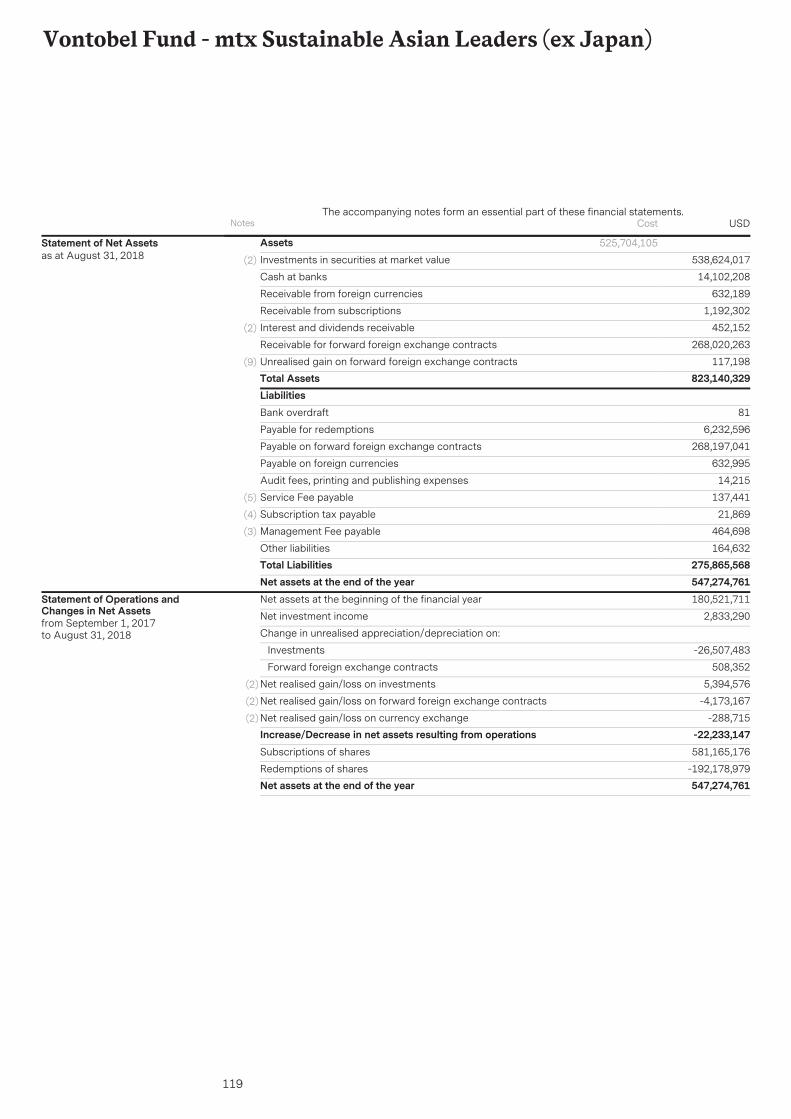
119
Vontobel Fund - mtx Sustainable Asian Leaders (ex Japan)
AssetsInvestments in securities at market value 538,624,017(2)
14,102,208Cash at banks
632,189Receivable from foreign currencies
1,192,302Receivable from subscriptions
452,152Interest and dividends receivable(2)
268,020,263Receivable for forward foreign exchange contracts
117,198Unrealised gain on forward foreign exchange contracts(9)
Total Assets 823,140,329
525,704,105Statement of Net Assetsas at August 31, 2018
LiabilitiesBank overdraft 81
Payable for redemptions 6,232,596
Payable on forward foreign exchange contracts 268,197,041
Payable on foreign currencies 632,995
Audit fees, printing and publishing expenses 14,215
Service Fee payable 137,441(5)
Subscription tax payable 21,869(4)
Management Fee payable 464,698(3)
Other liabilities 164,632Total Liabilities 275,865,568Net assets at the end of the year 547,274,761Net assets at the beginning of the financial year 180,521,711
Net investment income 2,833,290
Change in unrealised appreciation/depreciation on:
Investments -26,507,483
Forward foreign exchange contracts 508,352
Net realised gain/loss on investments 5,394,576(2)
Net realised gain/loss on forward foreign exchange contracts -4,173,167(2)
Net realised gain/loss on currency exchange -288,715(2)
Increase/Decrease in net assets resulting from operations -22,233,147Subscriptions of shares 581,165,176
Redemptions of shares -192,178,979Net assets at the end of the year 547,274,761
Statement of Operations andChanges in Net Assetsfrom September 1, 2017to August 31, 2018
Notes USDThe accompanying notes form an essential part of these financial statements.
Cost
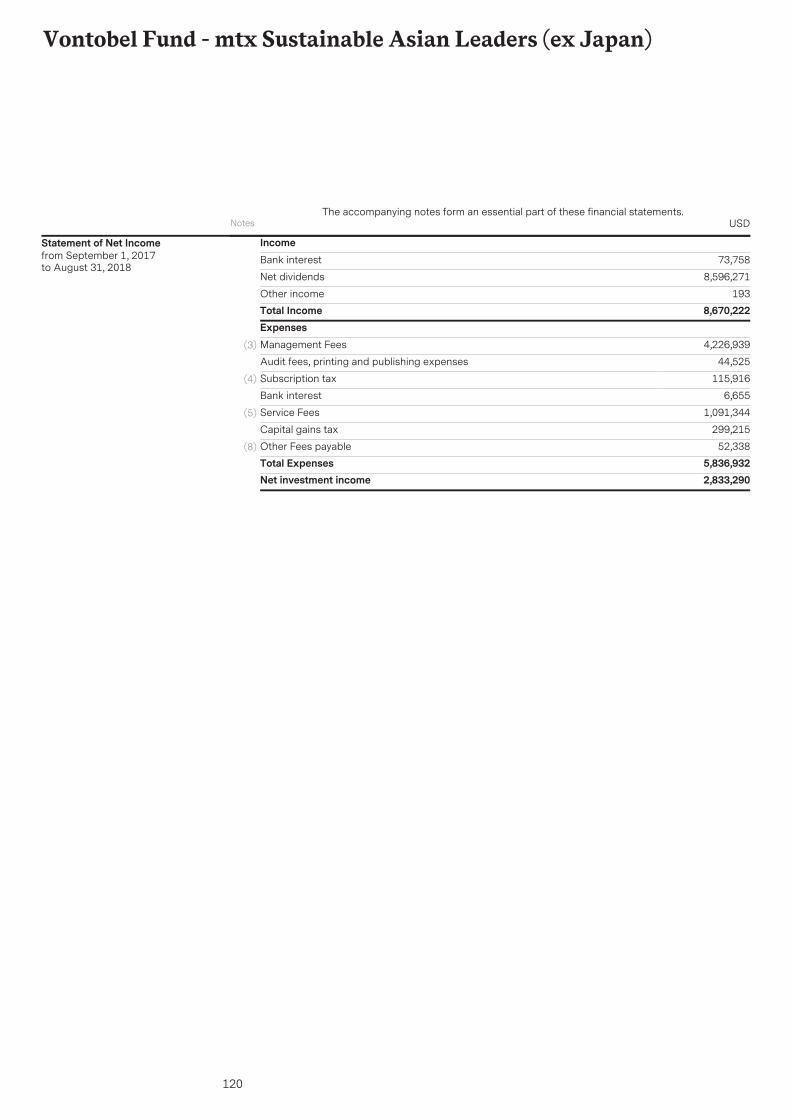
120
Vontobel Fund - mtx Sustainable Asian Leaders (ex Japan)
IncomeBank interest 73,758
Net dividends 8,596,271
Other income 193Total Income 8,670,222ExpensesManagement Fees 4,226,939(3)
Audit fees, printing and publishing expenses 44,525
Subscription tax 115,916(4)
Bank interest 6,655
Service Fees 1,091,344(5)
Capital gains tax 299,215
Other Fees payable 52,338(8)
Total Expenses 5,836,932Net investment income 2,833,290
Statement of Net Incomefrom September 1, 2017to August 31, 2018
Notes USDThe accompanying notes form an essential part of these financial statements.
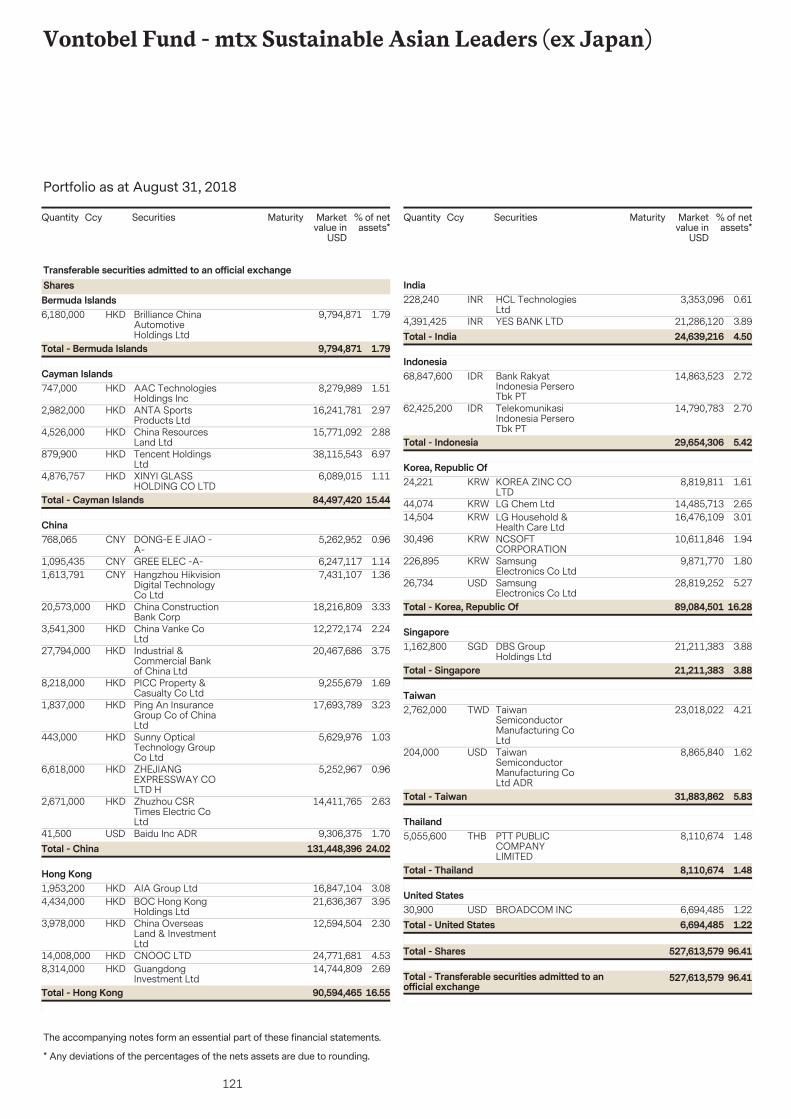
121
Vontobel Fund - mtx Sustainable Asian Leaders (ex Japan)
The accompanying notes form an essential part of these financial statements.
Portfolio as at August 31, 2018
* Any deviations of the percentages of the nets assets are due to rounding.
Securities Marketvalue in
USD
% of netassets*
Quantity Ccy Maturity
6,180,000 9,794,871 1.79Brilliance ChinaAutomotiveHoldings Ltd
HKD
Transferable securities admitted to an official exchangeSharesBermuda Islands
1.799,794,871Total - Bermuda Islands
747,000 8,279,989 1.51AAC TechnologiesHoldings Inc
HKDCayman Islands
2,982,000 16,241,781 2.97ANTA SportsProducts Ltd
HKD
4,526,000 15,771,092 2.88China ResourcesLand Ltd
HKD
879,900 38,115,543 6.97Tencent HoldingsLtd
HKD
4,876,757 6,089,015 1.11XINYI GLASSHOLDING CO LTD
HKD
15.4484,497,420Total - Cayman Islands
768,065 5,262,952 0.96DONG-E E JIAO -A-
CNYChina
1,095,435 6,247,117 1.14GREE ELEC -A-CNY1,613,791 7,431,107 1.36Hangzhou Hikvision
Digital TechnologyCo Ltd
CNY
20,573,000 18,216,809 3.33China ConstructionBank Corp
HKD
3,541,300 12,272,174 2.24China Vanke CoLtd
HKD
27,794,000 20,467,686 3.75Industrial &Commercial Bankof China Ltd
HKD
8,218,000 9,255,679 1.69PICC Property &Casualty Co Ltd
HKD
1,837,000 17,693,789 3.23Ping An InsuranceGroup Co of ChinaLtd
HKD
443,000 5,629,976 1.03Sunny OpticalTechnology GroupCo Ltd
HKD
6,618,000 5,252,967 0.96ZHEJIANGEXPRESSWAY COLTD H
HKD
2,671,000 14,411,765 2.63Zhuzhou CSRTimes Electric CoLtd
HKD
41,500 9,306,375 1.70Baidu Inc ADRUSD24.02131,448,396Total - China
1,953,200 16,847,104 3.08AIA Group LtdHKDHong Kong
4,434,000 21,636,367 3.95BOC Hong KongHoldings Ltd
HKD
3,978,000 12,594,504 2.30China OverseasLand & InvestmentLtd
HKD
14,008,000 24,771,681 4.53CNOOC LTDHKD8,314,000 14,744,809 2.69Guangdong
Investment LtdHKD
16.5590,594,465Total - Hong Kong
Securities Marketvalue in
USD
% of netassets*
Quantity Ccy Maturity
228,240 3,353,096 0.61HCL TechnologiesLtd
INRIndia
4,391,425 21,286,120 3.89YES BANK LTDINR4.5024,639,216Total - India
68,847,600 14,863,523 2.72Bank RakyatIndonesia PerseroTbk PT
IDRIndonesia
62,425,200 14,790,783 2.70TelekomunikasiIndonesia PerseroTbk PT
IDR
5.4229,654,306Total - Indonesia
24,221 8,819,811 1.61KOREA ZINC COLTD
KRWKorea, Republic Of
44,074 14,485,713 2.65LG Chem LtdKRW14,504 16,476,109 3.01LG Household &
Health Care LtdKRW
30,496 10,611,846 1.94NCSOFTCORPORATION
KRW
226,895 9,871,770 1.80SamsungElectronics Co Ltd
KRW
26,734 28,819,252 5.27SamsungElectronics Co Ltd
USD
16.2889,084,501Total - Korea, Republic Of
1,162,800 21,211,383 3.88DBS GroupHoldings Ltd
SGDSingapore
3.8821,211,383Total - Singapore
2,762,000 23,018,022 4.21TaiwanSemiconductorManufacturing CoLtd
TWDTaiwan
204,000 8,865,840 1.62TaiwanSemiconductorManufacturing CoLtd ADR
USD
5.8331,883,862Total - Taiwan
5,055,600 8,110,674 1.48PTT PUBLICCOMPANYLIMITED
THBThailand
1.488,110,674Total - Thailand
30,900 6,694,485 1.22BROADCOM INCUSDUnited States
96.41527,613,579Total - Transferable securities admitted to anofficial exchange
96.41527,613,579Total - Shares
1.226,694,485Total - United States
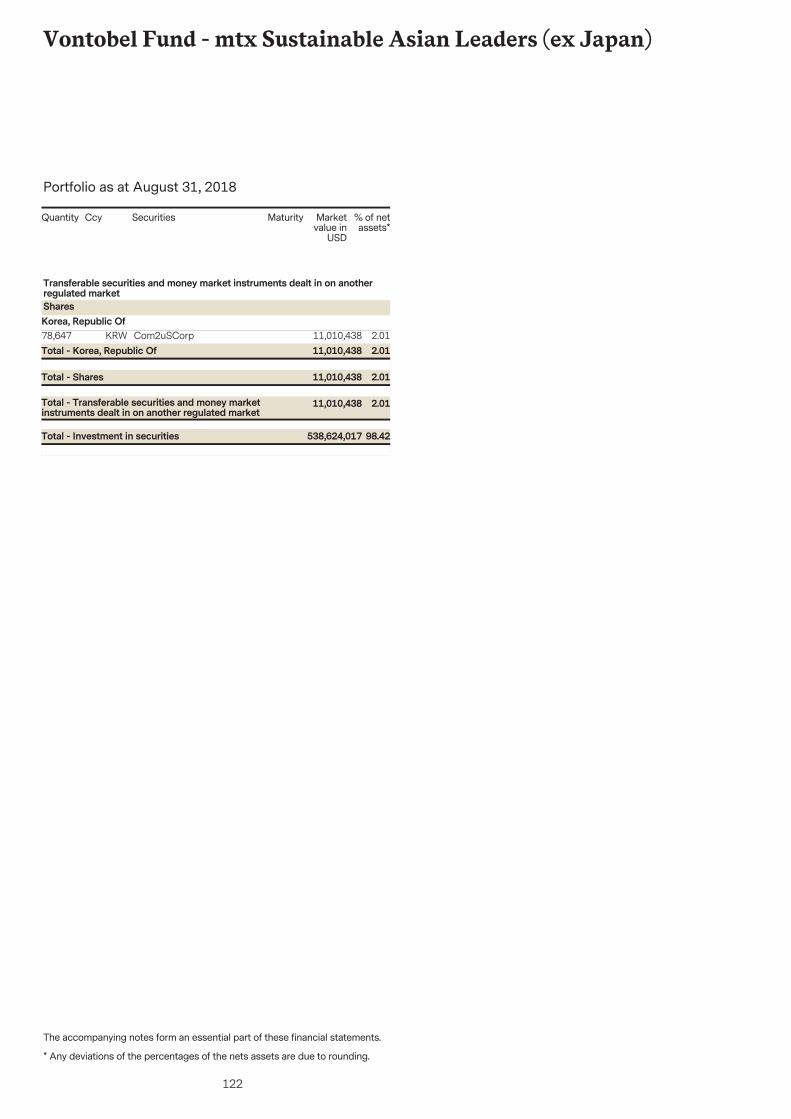
122
Vontobel Fund - mtx Sustainable Asian Leaders (ex Japan)
The accompanying notes form an essential part of these financial statements.
Portfolio as at August 31, 2018
* Any deviations of the percentages of the nets assets are due to rounding.
Securities Marketvalue in
USD
% of netassets*
Quantity Ccy Maturity
78,647 11,010,438 2.01Com2uSCorpKRW
Transferable securities and money market instruments dealt in on anotherregulated marketSharesKorea, Republic Of
2.0111,010,438Total - Transferable securities and money marketinstruments dealt in on another regulated market
2.0111,010,438Total - Shares
2.0111,010,438Total - Korea, Republic Of
98.42538,624,017Total - Investment in securities
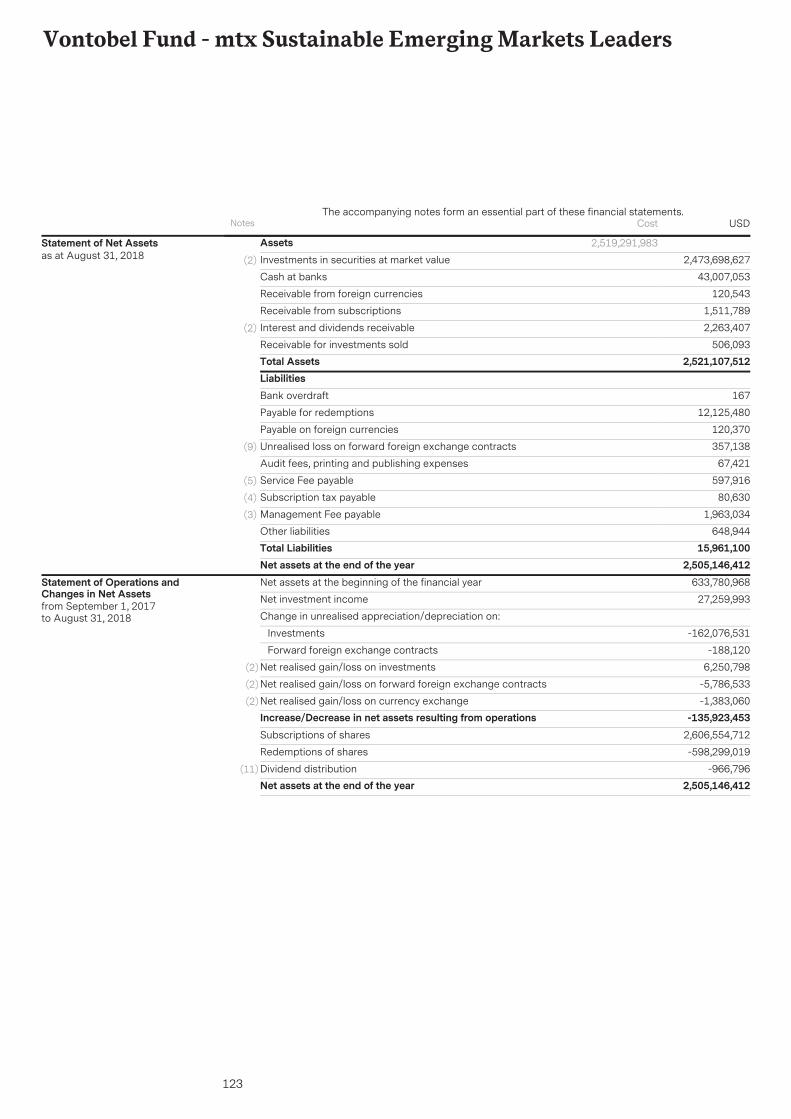
123
Vontobel Fund - mtx Sustainable Emerging Markets Leaders
AssetsInvestments in securities at market value 2,473,698,627(2)
43,007,053Cash at banks
120,543Receivable from foreign currencies
1,511,789Receivable from subscriptions
2,263,407Interest and dividends receivable(2)
506,093Receivable for investments soldTotal Assets 2,521,107,512
2,519,291,983Statement of Net Assetsas at August 31, 2018
LiabilitiesBank overdraft 167
Payable for redemptions 12,125,480
Payable on foreign currencies 120,370
Unrealised loss on forward foreign exchange contracts 357,138(9)
Audit fees, printing and publishing expenses 67,421
Service Fee payable 597,916(5)
Subscription tax payable 80,630(4)
Management Fee payable 1,963,034(3)
Other liabilities 648,944Total Liabilities 15,961,100Net assets at the end of the year 2,505,146,412Net assets at the beginning of the financial year 633,780,968
Net investment income 27,259,993
Change in unrealised appreciation/depreciation on:
Investments -162,076,531
Forward foreign exchange contracts -188,120
Net realised gain/loss on investments 6,250,798(2)
Net realised gain/loss on forward foreign exchange contracts -5,786,533(2)
Net realised gain/loss on currency exchange -1,383,060(2)
Increase/Decrease in net assets resulting from operations -135,923,453Subscriptions of shares 2,606,554,712
Redemptions of shares -598,299,019
Dividend distribution -966,796(11)
Net assets at the end of the year 2,505,146,412
Statement of Operations andChanges in Net Assetsfrom September 1, 2017to August 31, 2018
Notes USDThe accompanying notes form an essential part of these financial statements.
Cost
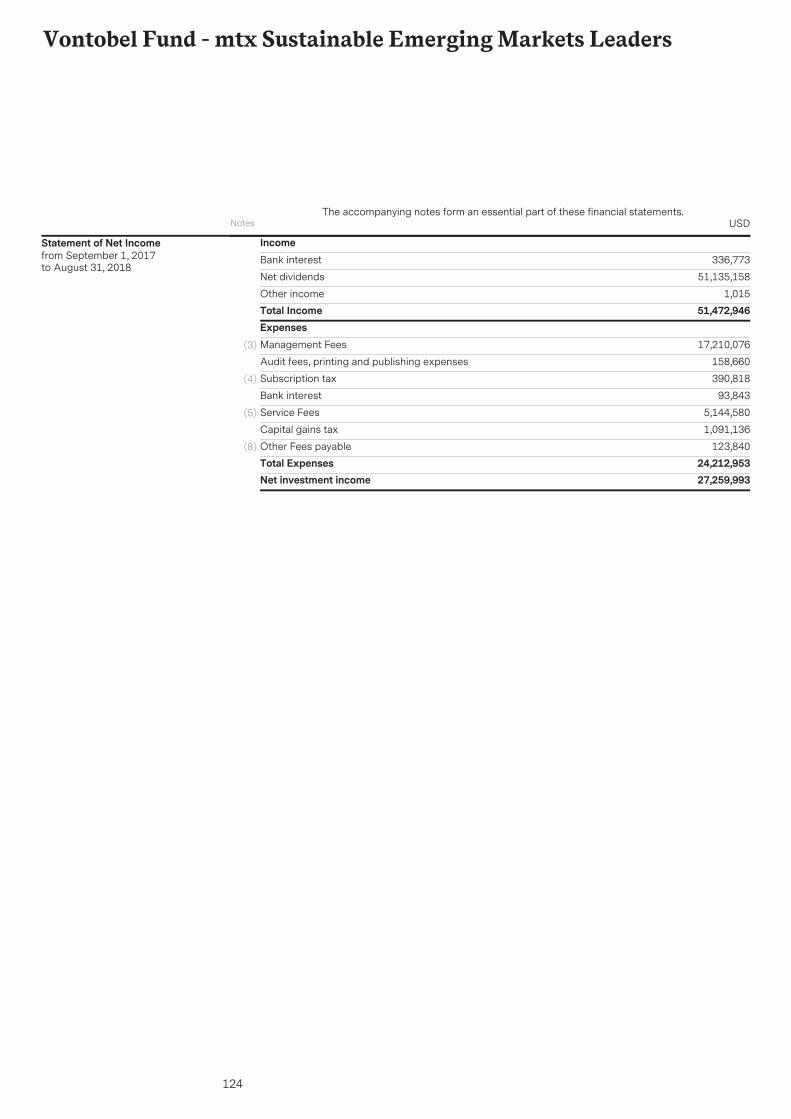
124
Vontobel Fund - mtx Sustainable Emerging Markets Leaders
IncomeBank interest 336,773
Net dividends 51,135,158
Other income 1,015Total Income 51,472,946ExpensesManagement Fees 17,210,076(3)
Audit fees, printing and publishing expenses 158,660
Subscription tax 390,818(4)
Bank interest 93,843
Service Fees 5,144,580(5)
Capital gains tax 1,091,136
Other Fees payable 123,840(8)
Total Expenses 24,212,953Net investment income 27,259,993
Statement of Net Incomefrom September 1, 2017to August 31, 2018
Notes USDThe accompanying notes form an essential part of these financial statements.
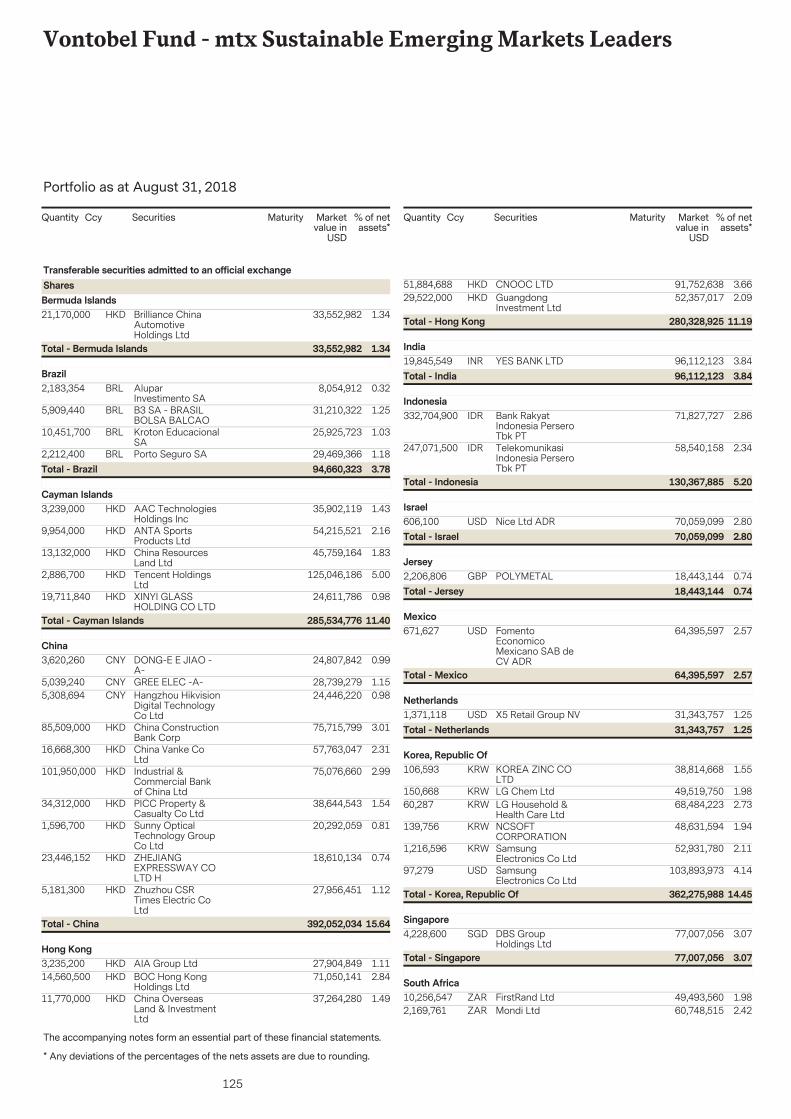
125
Vontobel Fund - mtx Sustainable Emerging Markets Leaders
The accompanying notes form an essential part of these financial statements.
Portfolio as at August 31, 2018
* Any deviations of the percentages of the nets assets are due to rounding.** See note 10
Securities Marketvalue in
USD
% of netassets*
Quantity Ccy Maturity
21,170,000 33,552,982 1.34Brilliance ChinaAutomotiveHoldings Ltd
HKD
Transferable securities admitted to an official exchangeSharesBermuda Islands
1.3433,552,982Total - Bermuda Islands
2,183,354 8,054,912 0.32AluparInvestimento SA
BRLBrazil
5,909,440 31,210,322 1.25B3 SA - BRASILBOLSA BALCAO
BRL
10,451,700 25,925,723 1.03Kroton EducacionalSA
BRL
2,212,400 29,469,366 1.18Porto Seguro SABRL3.7894,660,323Total - Brazil
3,239,000 35,902,119 1.43AAC TechnologiesHoldings Inc
HKDCayman Islands
9,954,000 54,215,521 2.16ANTA SportsProducts Ltd
HKD
13,132,000 45,759,164 1.83China ResourcesLand Ltd
HKD
2,886,700 125,046,186 5.00Tencent HoldingsLtd
HKD
19,711,840 24,611,786 0.98XINYI GLASSHOLDING CO LTD
HKD
11.40285,534,776Total - Cayman Islands
3,620,260 24,807,842 0.99DONG-E E JIAO -A-
CNYChina
5,039,240 28,739,279 1.15GREE ELEC -A-CNY5,308,694 24,446,220 0.98Hangzhou Hikvision
Digital TechnologyCo Ltd
CNY
85,509,000 75,715,799 3.01China ConstructionBank Corp
HKD
16,668,300 57,763,047 2.31China Vanke CoLtd
HKD
101,950,000 75,076,660 2.99Industrial &Commercial Bankof China Ltd
HKD
34,312,000 38,644,543 1.54PICC Property &Casualty Co Ltd
HKD
1,596,700 20,292,059 0.81Sunny OpticalTechnology GroupCo Ltd
HKD
23,446,152 18,610,134 0.74ZHEJIANGEXPRESSWAY COLTD H
HKD
5,181,300 27,956,451 1.12Zhuzhou CSRTimes Electric CoLtd
HKD
15.64392,052,034Total - China
3,235,200 27,904,849 1.11AIA Group LtdHKDHong Kong
14,560,500 71,050,141 2.84BOC Hong KongHoldings Ltd
HKD
11,770,000 37,264,280 1.49China OverseasLand & InvestmentLtd
HKD
Securities Marketvalue in
USD
% of netassets*
Quantity Ccy Maturity
51,884,688 91,752,638 3.66CNOOC LTDHKD29,522,000 52,357,017 2.09Guangdong
Investment LtdHKD
11.19280,328,925Total - Hong Kong
19,845,549 96,112,123 3.84YES BANK LTDINRIndia
3.8496,112,123Total - India
332,704,900 71,827,727 2.86Bank RakyatIndonesia PerseroTbk PT
IDRIndonesia
247,071,500 58,540,158 2.34TelekomunikasiIndonesia PerseroTbk PT
IDR
5.20130,367,885Total - Indonesia
606,100 70,059,099 2.80Nice Ltd ADRUSDIsrael
2.8070,059,099Total - Israel
2,206,806 18,443,144 0.74POLYMETALGBPJersey
0.7418,443,144Total - Jersey
671,627 64,395,597 2.57FomentoEconomicoMexicano SAB deCV ADR
USDMexico
2.5764,395,597Total - Mexico
1,371,118 31,343,757 1.25X5 Retail Group NVUSDNetherlands
1.2531,343,757Total - Netherlands
106,593 38,814,668 1.55KOREA ZINC COLTD
KRWKorea, Republic Of
150,668 49,519,750 1.98LG Chem LtdKRW60,287 68,484,223 2.73LG Household &
Health Care LtdKRW
139,756 48,631,594 1.94NCSOFTCORPORATION
KRW
1,216,596 52,931,780 2.11SamsungElectronics Co Ltd
KRW
97,279 103,893,973 4.14SamsungElectronics Co Ltd
USD
14.45362,275,988Total - Korea, Republic Of
4,228,600 77,007,056 3.07DBS GroupHoldings Ltd
SGDSingapore
3.0777,007,056Total - Singapore
10,256,547 49,493,560 1.98FirstRand LtdZARSouth Africa
2,169,761 60,748,515 2.42Mondi LtdZAR
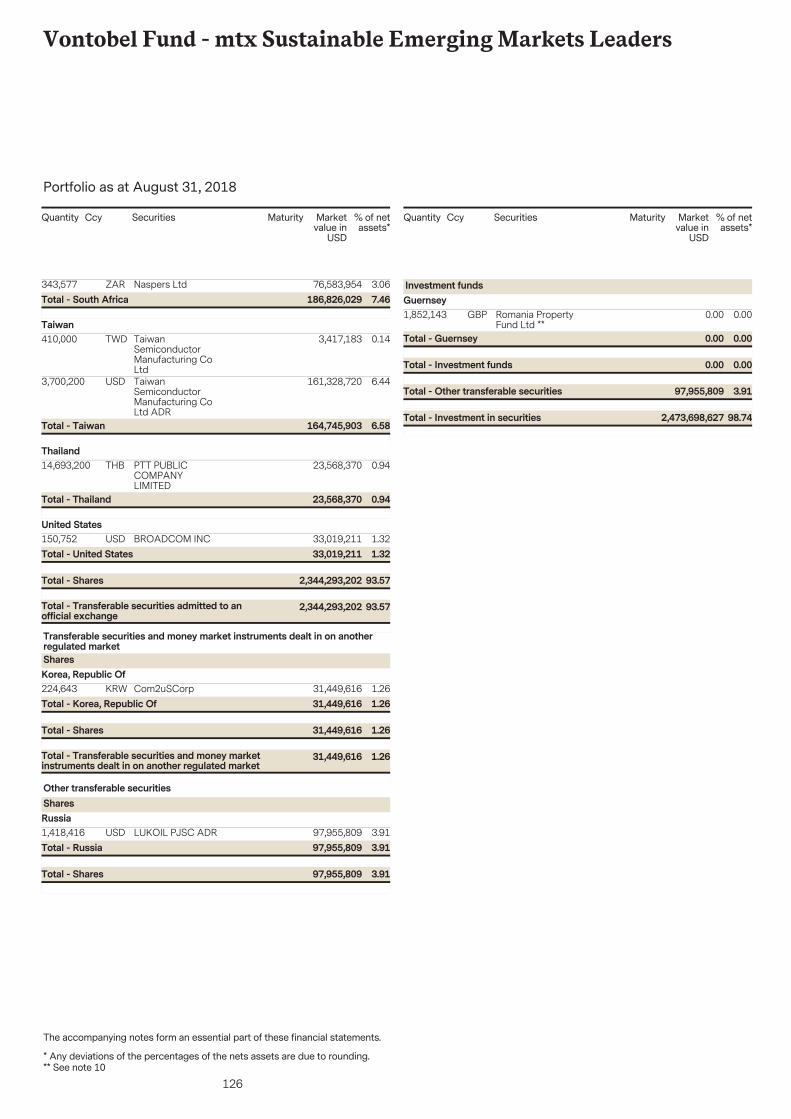
126
Vontobel Fund - mtx Sustainable Emerging Markets Leaders
The accompanying notes form an essential part of these financial statements.
Portfolio as at August 31, 2018
* Any deviations of the percentages of the nets assets are due to rounding.** See note 10
Securities Marketvalue in
USD
% of netassets*
Quantity Ccy Maturity
343,577 76,583,954 3.06Naspers LtdZAR7.46186,826,029Total - South Africa
410,000 3,417,183 0.14TaiwanSemiconductorManufacturing CoLtd
TWDTaiwan
3,700,200 161,328,720 6.44TaiwanSemiconductorManufacturing CoLtd ADR
USD
6.58164,745,903Total - Taiwan
14,693,200 23,568,370 0.94PTT PUBLICCOMPANYLIMITED
THBThailand
0.9423,568,370Total - Thailand
150,752 33,019,211 1.32BROADCOM INCUSDUnited States
93.572,344,293,202Total - Transferable securities admitted to anofficial exchange
93.572,344,293,202Total - Shares
1.3233,019,211Total - United States
224,643 31,449,616 1.26Com2uSCorpKRW
Transferable securities and money market instruments dealt in on anotherregulated marketSharesKorea, Republic Of
1.2631,449,616Total - Transferable securities and money marketinstruments dealt in on another regulated market
1.2631,449,616Total - Shares
1.2631,449,616Total - Korea, Republic Of
1,418,416 97,955,809 3.91LUKOIL PJSC ADRUSD
Other transferable securitiesSharesRussia
3.9197,955,809Total - Shares
3.9197,955,809Total - Russia
Securities Marketvalue in
USD
% of netassets*
Quantity Ccy Maturity
1,852,143 0.00 0.00Romania PropertyFund Ltd **
GBP
Investment fundsGuernsey
3.9197,955,809Total - Other transferable securities
0.000.00Total - Investment funds
0.000.00Total - Guernsey
98.742,473,698,627Total - Investment in securities
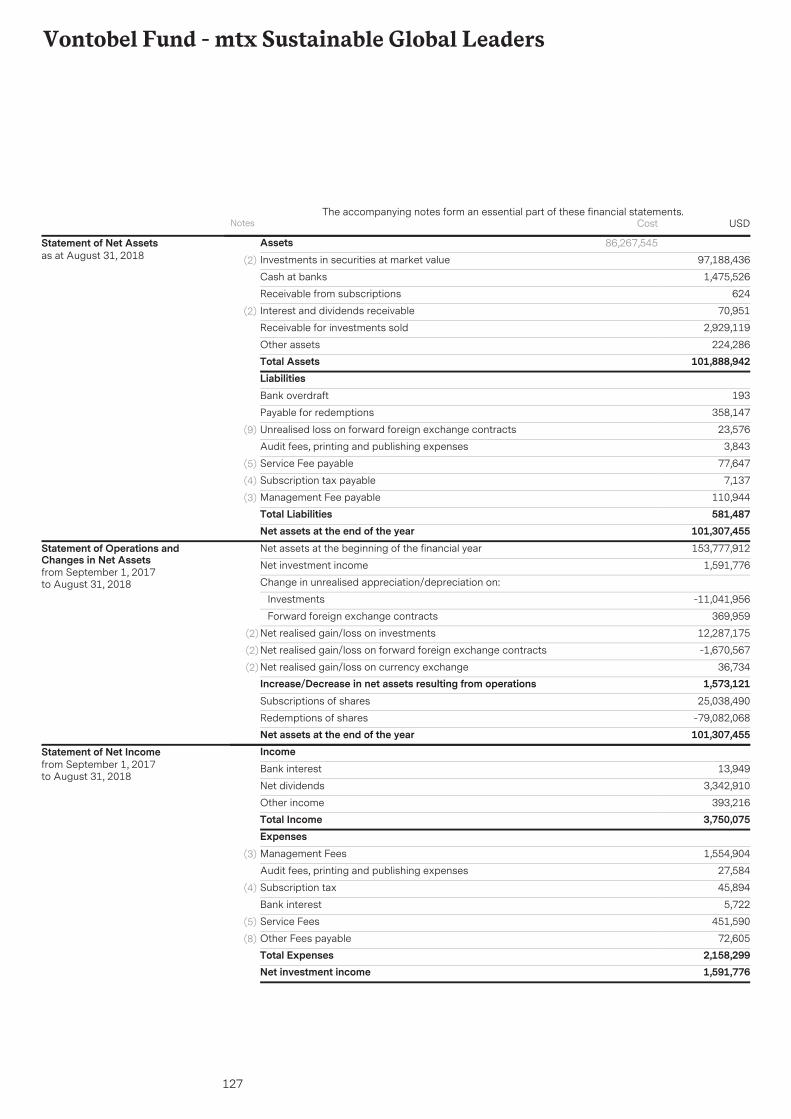
127
Vontobel Fund - mtx Sustainable Global Leaders
AssetsInvestments in securities at market value 97,188,436(2)
1,475,526Cash at banks
624Receivable from subscriptions
70,951Interest and dividends receivable(2)
2,929,119Receivable for investments sold
224,286Other assetsTotal Assets 101,888,942
86,267,545Statement of Net Assetsas at August 31, 2018
LiabilitiesBank overdraft 193
Payable for redemptions 358,147
Unrealised loss on forward foreign exchange contracts 23,576(9)
Audit fees, printing and publishing expenses 3,843
Service Fee payable 77,647(5)
Subscription tax payable 7,137(4)
Management Fee payable 110,944(3)
Total Liabilities 581,487Net assets at the end of the year 101,307,455Net assets at the beginning of the financial year 153,777,912
Net investment income 1,591,776
Change in unrealised appreciation/depreciation on:
Investments -11,041,956
Forward foreign exchange contracts 369,959
Net realised gain/loss on investments 12,287,175(2)
Net realised gain/loss on forward foreign exchange contracts -1,670,567(2)
Net realised gain/loss on currency exchange 36,734(2)
Increase/Decrease in net assets resulting from operations 1,573,121Subscriptions of shares 25,038,490
Redemptions of shares -79,082,068Net assets at the end of the year 101,307,455
Statement of Operations andChanges in Net Assetsfrom September 1, 2017to August 31, 2018
IncomeBank interest 13,949
Net dividends 3,342,910
Other income 393,216Total Income 3,750,075ExpensesManagement Fees 1,554,904(3)
Audit fees, printing and publishing expenses 27,584
Subscription tax 45,894(4)
Bank interest 5,722
Service Fees 451,590(5)
Other Fees payable 72,605(8)
Total Expenses 2,158,299Net investment income 1,591,776
Statement of Net Incomefrom September 1, 2017to August 31, 2018
Notes USDThe accompanying notes form an essential part of these financial statements.
Cost
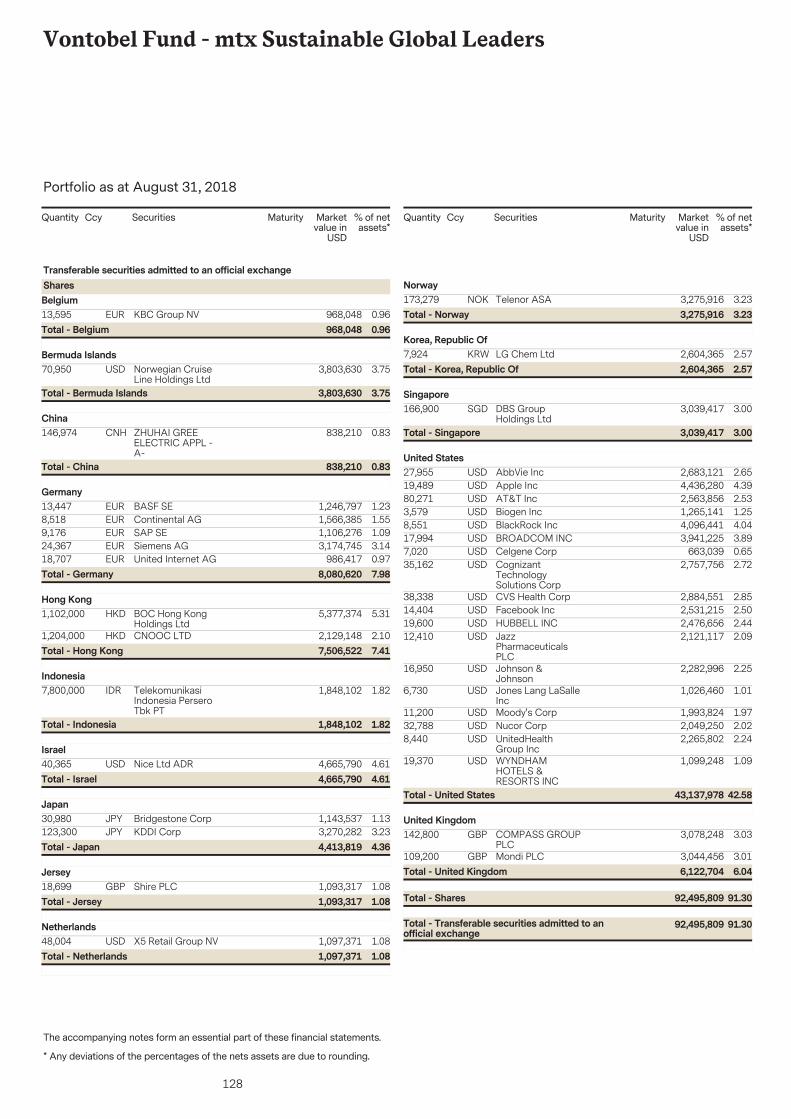
128
Vontobel Fund - mtx Sustainable Global Leaders
The accompanying notes form an essential part of these financial statements.
Portfolio as at August 31, 2018
* Any deviations of the percentages of the nets assets are due to rounding.
Securities Marketvalue in
USD
% of netassets*
Quantity Ccy Maturity
13,595 968,048 0.96KBC Group NVEUR
Transferable securities admitted to an official exchangeSharesBelgium
0.96968,048Total - Belgium
70,950 3,803,630 3.75Norwegian CruiseLine Holdings Ltd
USDBermuda Islands
3.753,803,630Total - Bermuda Islands
146,974 838,210 0.83ZHUHAI GREEELECTRIC APPL -A-
CNHChina
0.83838,210Total - China
13,447 1,246,797 1.23BASF SEEURGermany
8,518 1,566,385 1.55Continental AGEUR9,176 1,106,276 1.09SAP SEEUR24,367 3,174,745 3.14Siemens AGEUR18,707 986,417 0.97United Internet AGEUR
7.988,080,620Total - Germany
1,102,000 5,377,374 5.31BOC Hong KongHoldings Ltd
HKDHong Kong
1,204,000 2,129,148 2.10CNOOC LTDHKD7.417,506,522Total - Hong Kong
7,800,000 1,848,102 1.82TelekomunikasiIndonesia PerseroTbk PT
IDRIndonesia
1.821,848,102Total - Indonesia
40,365 4,665,790 4.61Nice Ltd ADRUSDIsrael
4.614,665,790Total - Israel
30,980 1,143,537 1.13Bridgestone CorpJPYJapan
123,300 3,270,282 3.23KDDI CorpJPY4.364,413,819Total - Japan
18,699 1,093,317 1.08Shire PLCGBPJersey
1.081,093,317Total - Jersey
48,004 1,097,371 1.08X5 Retail Group NVUSDNetherlands
1.081,097,371Total - Netherlands
Securities Marketvalue in
USD
% of netassets*
Quantity Ccy Maturity
173,279 3,275,916 3.23Telenor ASANOKNorway
3.233,275,916Total - Norway
7,924 2,604,365 2.57LG Chem LtdKRWKorea, Republic Of
2.572,604,365Total - Korea, Republic Of
166,900 3,039,417 3.00DBS GroupHoldings Ltd
SGDSingapore
3.003,039,417Total - Singapore
27,955 2,683,121 2.65AbbVie IncUSDUnited States
19,489 4,436,280 4.39Apple IncUSD80,271 2,563,856 2.53AT&T IncUSD3,579 1,265,141 1.25Biogen IncUSD8,551 4,096,441 4.04BlackRock IncUSD17,994 3,941,225 3.89BROADCOM INCUSD7,020 663,039 0.65Celgene CorpUSD35,162 2,757,756 2.72Cognizant
TechnologySolutions Corp
USD
38,338 2,884,551 2.85CVS Health CorpUSD14,404 2,531,215 2.50Facebook IncUSD19,600 2,476,656 2.44HUBBELL INCUSD12,410 2,121,117 2.09Jazz
PharmaceuticalsPLC
USD
16,950 2,282,996 2.25Johnson &Johnson
USD
6,730 1,026,460 1.01Jones Lang LaSalleInc
USD
11,200 1,993,824 1.97Moody's CorpUSD32,788 2,049,250 2.02Nucor CorpUSD8,440 2,265,802 2.24UnitedHealth
Group IncUSD
19,370 1,099,248 1.09WYNDHAMHOTELS &RESORTS INC
USD
42.5843,137,978Total - United States
142,800 3,078,248 3.03COMPASS GROUPPLC
GBPUnited Kingdom
109,200 3,044,456 3.01Mondi PLCGBP
91.3092,495,809Total - Transferable securities admitted to anofficial exchange
91.3092,495,809Total - Shares
6.046,122,704Total - United Kingdom
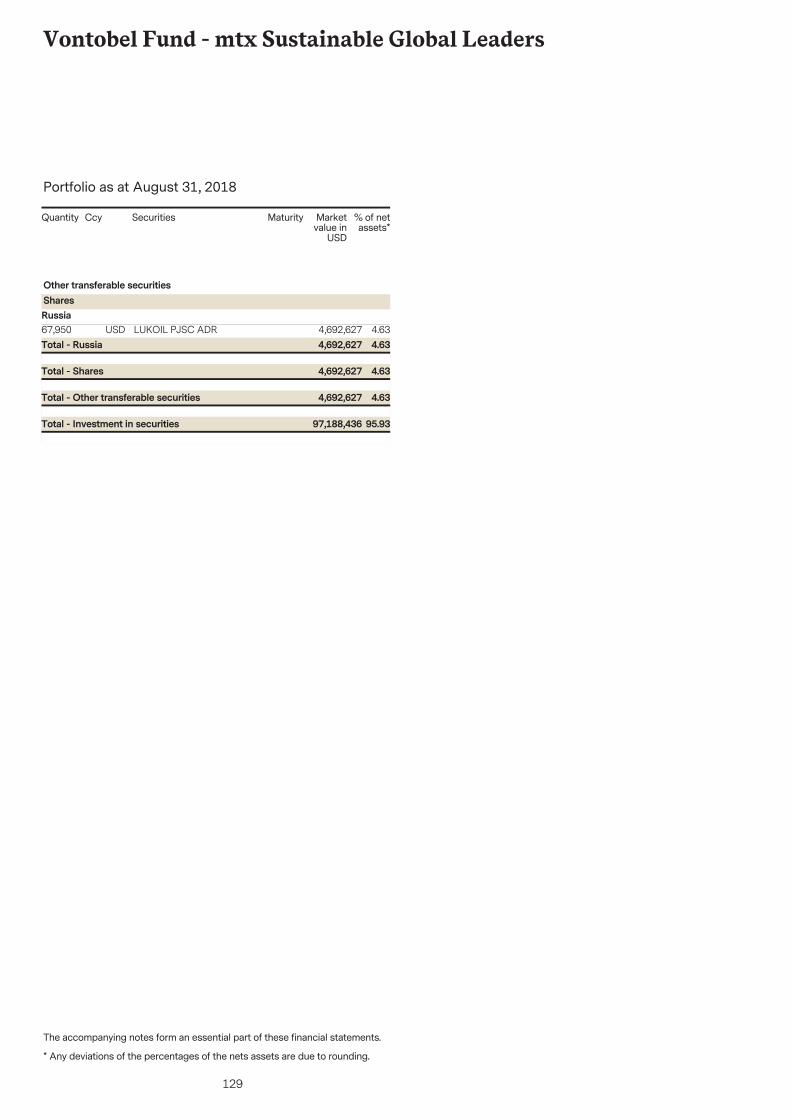
129
Vontobel Fund - mtx Sustainable Global Leaders
The accompanying notes form an essential part of these financial statements.
Portfolio as at August 31, 2018
* Any deviations of the percentages of the nets assets are due to rounding.
Securities Marketvalue in
USD
% of netassets*
Quantity Ccy Maturity
67,950 4,692,627 4.63LUKOIL PJSC ADRUSD
Other transferable securitiesSharesRussia
4.634,692,627Total - Other transferable securities
4.634,692,627Total - Shares
4.634,692,627Total - Russia
95.9397,188,436Total - Investment in securities
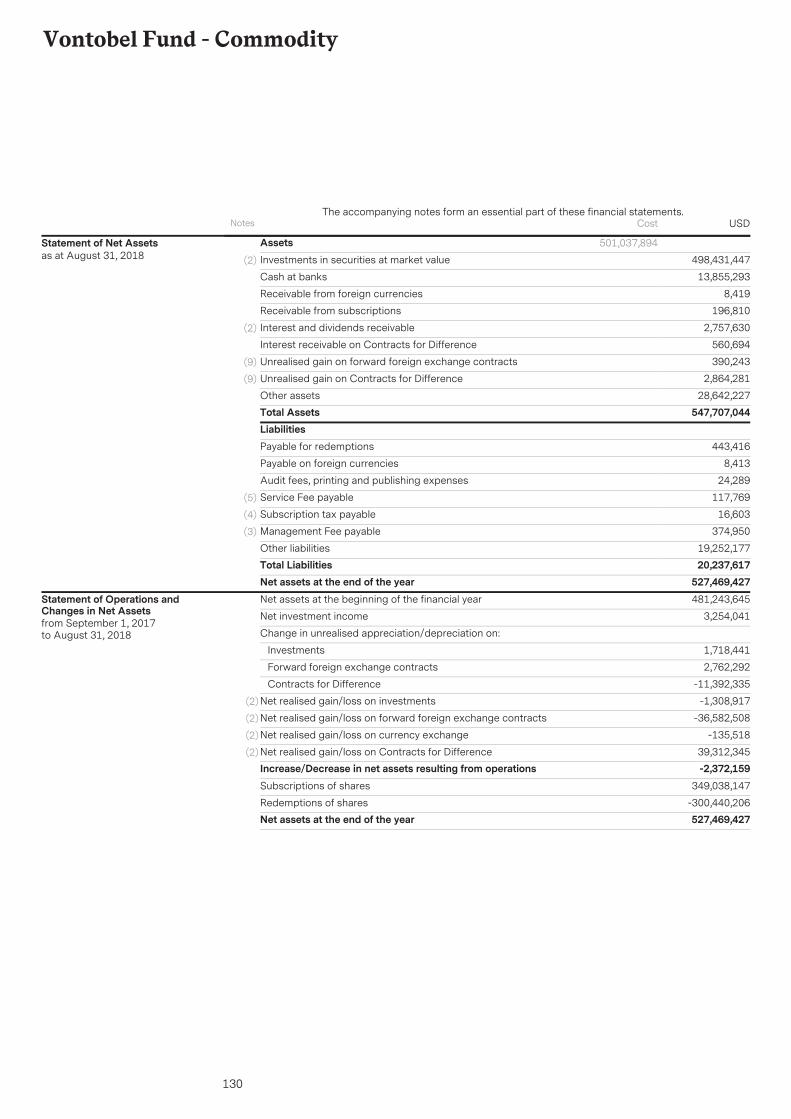
130
Vontobel Fund - Commodity
AssetsInvestments in securities at market value 498,431,447(2)
13,855,293Cash at banks
8,419Receivable from foreign currencies
196,810Receivable from subscriptions
2,757,630Interest and dividends receivable(2)
560,694Interest receivable on Contracts for Difference
390,243Unrealised gain on forward foreign exchange contracts(9)
2,864,281Unrealised gain on Contracts for Difference(9)
28,642,227Other assetsTotal Assets 547,707,044
501,037,894Statement of Net Assetsas at August 31, 2018
LiabilitiesPayable for redemptions 443,416
Payable on foreign currencies 8,413
Audit fees, printing and publishing expenses 24,289
Service Fee payable 117,769(5)
Subscription tax payable 16,603(4)
Management Fee payable 374,950(3)
Other liabilities 19,252,177Total Liabilities 20,237,617Net assets at the end of the year 527,469,427Net assets at the beginning of the financial year 481,243,645
Net investment income 3,254,041
Change in unrealised appreciation/depreciation on:
Investments 1,718,441
Forward foreign exchange contracts 2,762,292
Contracts for Difference -11,392,335
Net realised gain/loss on investments -1,308,917(2)
Net realised gain/loss on forward foreign exchange contracts -36,582,508(2)
Net realised gain/loss on currency exchange -135,518(2)
Net realised gain/loss on Contracts for Difference 39,312,345(2)
Increase/Decrease in net assets resulting from operations -2,372,159Subscriptions of shares 349,038,147
Redemptions of shares -300,440,206Net assets at the end of the year 527,469,427
Statement of Operations andChanges in Net Assetsfrom September 1, 2017to August 31, 2018
Notes USDThe accompanying notes form an essential part of these financial statements.
Cost
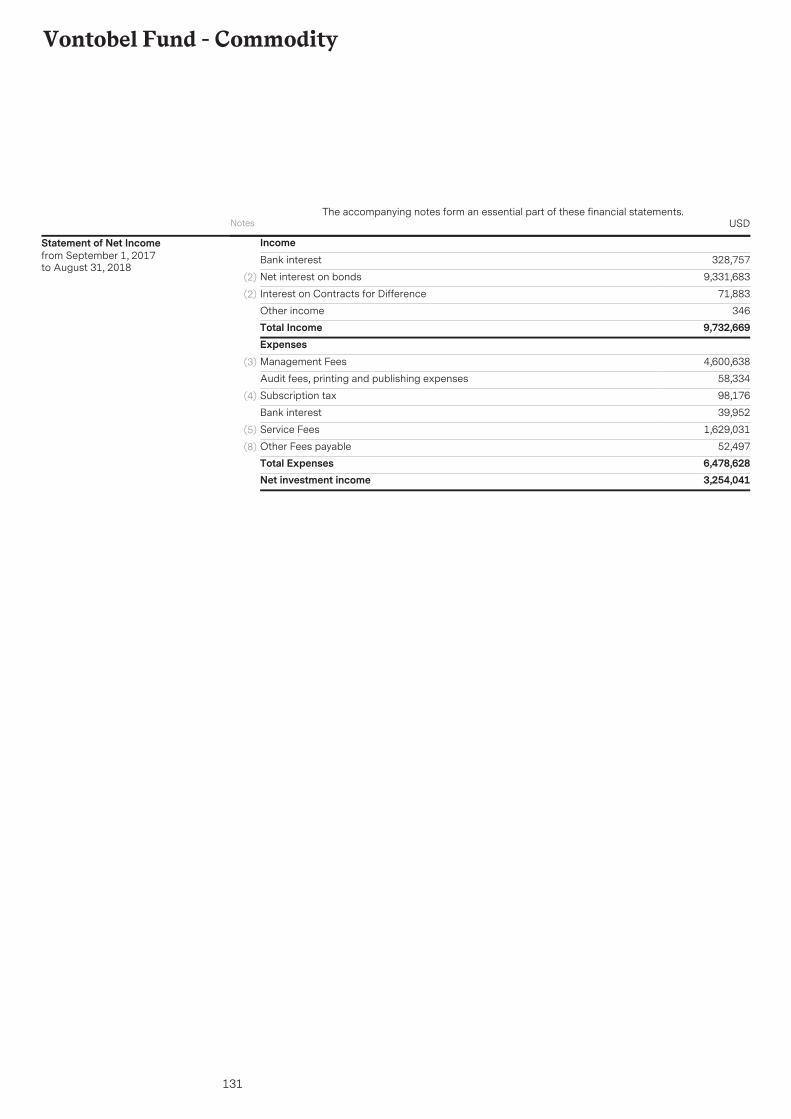
131
Vontobel Fund - Commodity
IncomeBank interest 328,757
Net interest on bonds 9,331,683(2)
Interest on Contracts for Difference 71,883(2)
Other income 346Total Income 9,732,669ExpensesManagement Fees 4,600,638(3)
Audit fees, printing and publishing expenses 58,334
Subscription tax 98,176(4)
Bank interest 39,952
Service Fees 1,629,031(5)
Other Fees payable 52,497(8)
Total Expenses 6,478,628Net investment income 3,254,041
Statement of Net Incomefrom September 1, 2017to August 31, 2018
Notes USDThe accompanying notes form an essential part of these financial statements.
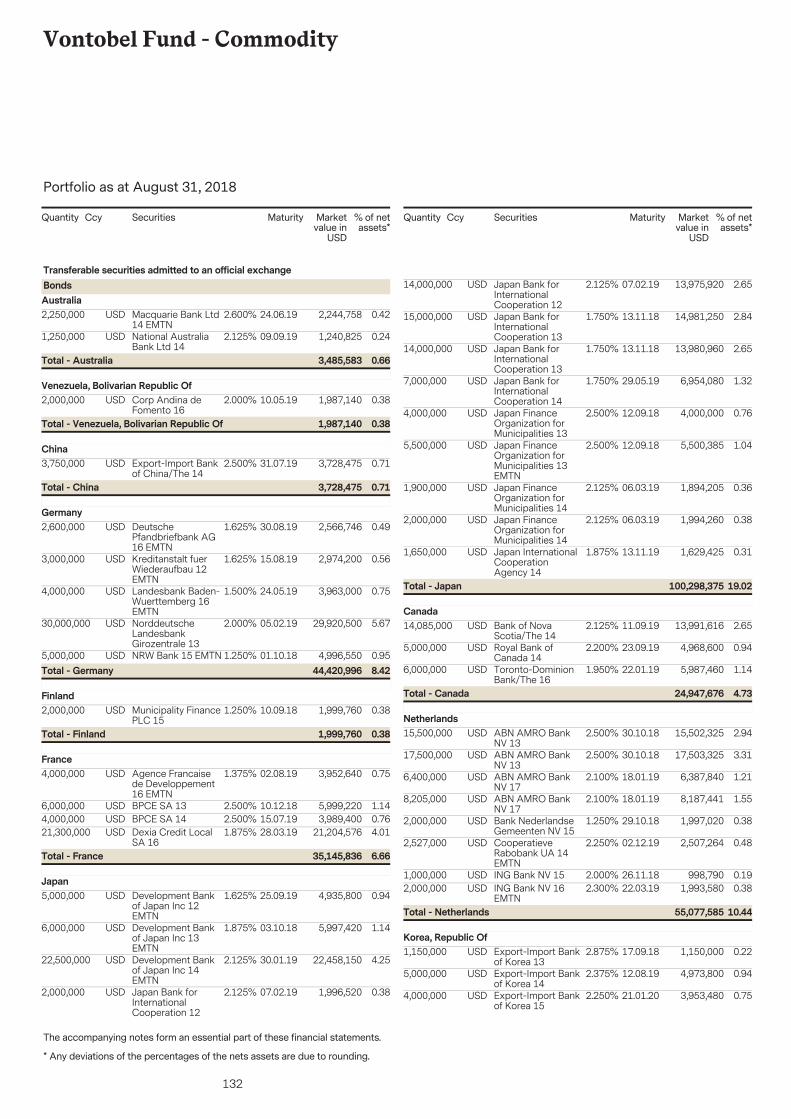
132
Vontobel Fund - Commodity
The accompanying notes form an essential part of these financial statements.
Portfolio as at August 31, 2018
* Any deviations of the percentages of the nets assets are due to rounding.
Securities Marketvalue in
USD
% of netassets*
Quantity Ccy Maturity
2,250,000 2,244,758 0.4224.06.19Macquarie Bank Ltd14 EMTN
USD 2.600%
Transferable securities admitted to an official exchangeBondsAustralia
1,250,000 1,240,825 0.2409.09.19National AustraliaBank Ltd 14
USD 2.125%
0.663,485,583Total - Australia
2,000,000 1,987,140 0.3810.05.19Corp Andina deFomento 16
USD 2.000%Venezuela, Bolivarian Republic Of
0.381,987,140Total - Venezuela, Bolivarian Republic Of
3,750,000 3,728,475 0.7131.07.19Export-Import Bankof China/The 14
USD 2.500%China
0.713,728,475Total - China
2,600,000 2,566,746 0.4930.08.19DeutschePfandbriefbank AG16 EMTN
USD 1.625%Germany
3,000,000 2,974,200 0.5615.08.19Kreditanstalt fuerWiederaufbau 12EMTN
USD 1.625%
4,000,000 3,963,000 0.7524.05.19Landesbank Baden-Wuerttemberg 16EMTN
USD 1.500%
30,000,000 29,920,500 5.6705.02.19NorddeutscheLandesbankGirozentrale 13
USD 2.000%
5,000,000 4,996,550 0.9501.10.18NRW Bank 15 EMTNUSD 1.250%8.4244,420,996Total - Germany
2,000,000 1,999,760 0.3810.09.18Municipality FinancePLC 15
USD 1.250%Finland
0.381,999,760Total - Finland
4,000,000 3,952,640 0.7502.08.19Agence Francaisede Developpement16 EMTN
USD 1.375%France
6,000,000 5,999,220 1.1410.12.18BPCE SA 13USD 2.500%4,000,000 3,989,400 0.7615.07.19BPCE SA 14USD 2.500%21,300,000 21,204,576 4.0128.03.19Dexia Credit Local
SA 16USD 1.875%
6.6635,145,836Total - France
5,000,000 4,935,800 0.9425.09.19Development Bankof Japan Inc 12EMTN
USD 1.625%Japan
6,000,000 5,997,420 1.1403.10.18Development Bankof Japan Inc 13EMTN
USD 1.875%
22,500,000 22,458,150 4.2530.01.19Development Bankof Japan Inc 14EMTN
USD 2.125%
2,000,000 1,996,520 0.3807.02.19Japan Bank forInternationalCooperation 12
USD 2.125%
Securities Marketvalue in
USD
% of netassets*
Quantity Ccy Maturity
14,000,000 13,975,920 2.6507.02.19Japan Bank forInternationalCooperation 12
USD 2.125%
15,000,000 14,981,250 2.8413.11.18Japan Bank forInternationalCooperation 13
USD 1.750%
14,000,000 13,980,960 2.6513.11.18Japan Bank forInternationalCooperation 13
USD 1.750%
7,000,000 6,954,080 1.3229.05.19Japan Bank forInternationalCooperation 14
USD 1.750%
4,000,000 4,000,000 0.7612.09.18Japan FinanceOrganization forMunicipalities 13
USD 2.500%
5,500,000 5,500,385 1.0412.09.18Japan FinanceOrganization forMunicipalities 13EMTN
USD 2.500%
1,900,000 1,894,205 0.3606.03.19Japan FinanceOrganization forMunicipalities 14
USD 2.125%
2,000,000 1,994,260 0.3806.03.19Japan FinanceOrganization forMunicipalities 14
USD 2.125%
1,650,000 1,629,425 0.3113.11.19Japan InternationalCooperationAgency 14
USD 1.875%
19.02100,298,375Total - Japan
14,085,000 13,991,616 2.6511.09.19Bank of NovaScotia/The 14
USD 2.125%Canada
5,000,000 4,968,600 0.9423.09.19Royal Bank ofCanada 14
USD 2.200%
6,000,000 5,987,460 1.1422.01.19Toronto-DominionBank/The 16
USD 1.950%
4.7324,947,676Total - Canada
15,500,000 15,502,325 2.9430.10.18ABN AMRO BankNV 13
USD 2.500%Netherlands
17,500,000 17,503,325 3.3130.10.18ABN AMRO BankNV 13
USD 2.500%
6,400,000 6,387,840 1.2118.01.19ABN AMRO BankNV 17
USD 2.100%
8,205,000 8,187,441 1.5518.01.19ABN AMRO BankNV 17
USD 2.100%
2,000,000 1,997,020 0.3829.10.18Bank NederlandseGemeenten NV 15
USD 1.250%
2,527,000 2,507,264 0.4802.12.19CooperatieveRabobank UA 14EMTN
USD 2.250%
1,000,000 998,790 0.1926.11.18ING Bank NV 15USD 2.000%2,000,000 1,993,580 0.3822.03.19ING Bank NV 16
EMTNUSD 2.300%
10.4455,077,585Total - Netherlands
1,150,000 1,150,000 0.2217.09.18Export-Import Bankof Korea 13
USD 2.875%Korea, Republic Of
5,000,000 4,973,800 0.9412.08.19Export-Import Bankof Korea 14
USD 2.375%
4,000,000 3,953,480 0.7521.01.20Export-Import Bankof Korea 15
USD 2.250%
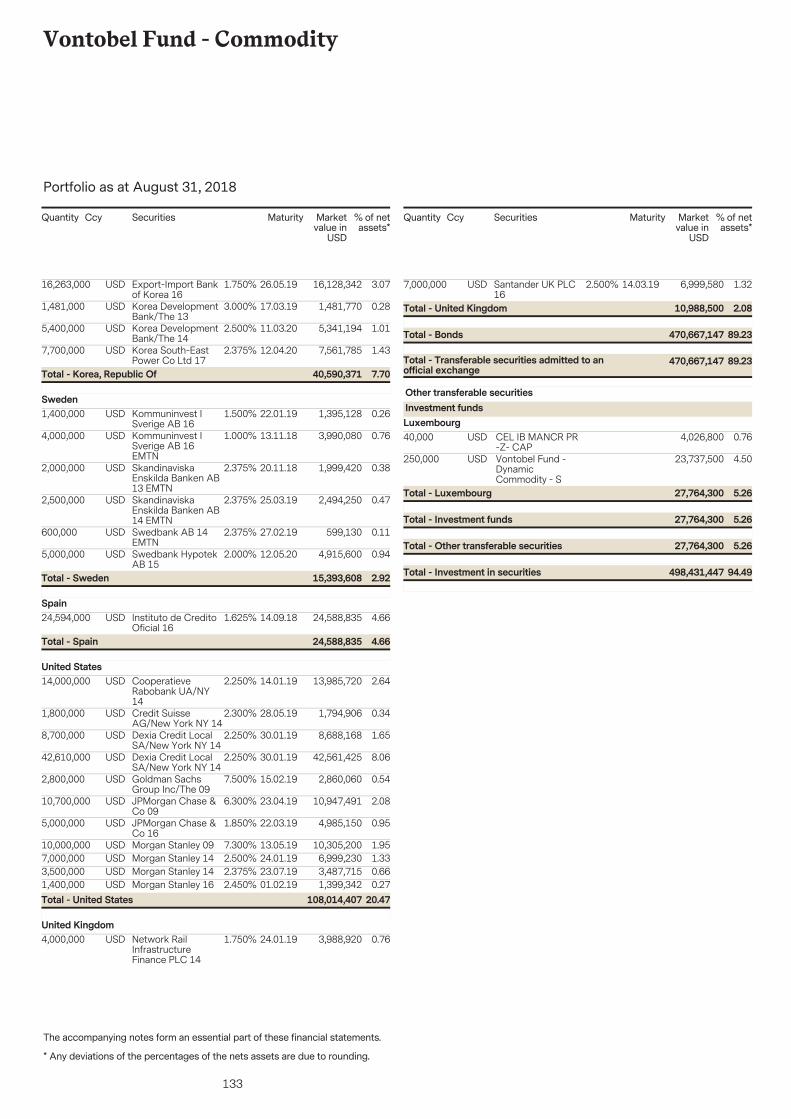
133
Vontobel Fund - Commodity
The accompanying notes form an essential part of these financial statements.
Portfolio as at August 31, 2018
* Any deviations of the percentages of the nets assets are due to rounding.
Securities Marketvalue in
USD
% of netassets*
Quantity Ccy Maturity
16,263,000 16,128,342 3.0726.05.19Export-Import Bankof Korea 16
USD 1.750%
1,481,000 1,481,770 0.2817.03.19Korea DevelopmentBank/The 13
USD 3.000%
5,400,000 5,341,194 1.0111.03.20Korea DevelopmentBank/The 14
USD 2.500%
7,700,000 7,561,785 1.4312.04.20Korea South-EastPower Co Ltd 17
USD 2.375%
7.7040,590,371Total - Korea, Republic Of
1,400,000 1,395,128 0.2622.01.19Kommuninvest ISverige AB 16
USD 1.500%Sweden
4,000,000 3,990,080 0.7613.11.18Kommuninvest ISverige AB 16EMTN
USD 1.000%
2,000,000 1,999,420 0.3820.11.18SkandinaviskaEnskilda Banken AB13 EMTN
USD 2.375%
2,500,000 2,494,250 0.4725.03.19SkandinaviskaEnskilda Banken AB14 EMTN
USD 2.375%
600,000 599,130 0.1127.02.19Swedbank AB 14EMTN
USD 2.375%
5,000,000 4,915,600 0.9412.05.20Swedbank HypotekAB 15
USD 2.000%
2.9215,393,608Total - Sweden
24,594,000 24,588,835 4.6614.09.18Instituto de CreditoOficial 16
USD 1.625%Spain
4.6624,588,835Total - Spain
14,000,000 13,985,720 2.6414.01.19CooperatieveRabobank UA/NY14
USD 2.250%United States
1,800,000 1,794,906 0.3428.05.19Credit SuisseAG/New York NY 14
USD 2.300%
8,700,000 8,688,168 1.6530.01.19Dexia Credit LocalSA/New York NY 14
USD 2.250%
42,610,000 42,561,425 8.0630.01.19Dexia Credit LocalSA/New York NY 14
USD 2.250%
2,800,000 2,860,060 0.5415.02.19Goldman SachsGroup Inc/The 09
USD 7.500%
10,700,000 10,947,491 2.0823.04.19JPMorgan Chase &Co 09
USD 6.300%
5,000,000 4,985,150 0.9522.03.19JPMorgan Chase &Co 16
USD 1.850%
10,000,000 10,305,200 1.9513.05.19Morgan Stanley 09USD 7.300%7,000,000 6,999,230 1.3324.01.19Morgan Stanley 14USD 2.500%3,500,000 3,487,715 0.6623.07.19Morgan Stanley 14USD 2.375%1,400,000 1,399,342 0.2701.02.19Morgan Stanley 16USD 2.450%
20.47108,014,407Total - United States
4,000,000 3,988,920 0.7624.01.19Network RailInfrastructureFinance PLC 14
USD 1.750%United Kingdom
Securities Marketvalue in
USD
% of netassets*
Quantity Ccy Maturity
7,000,000 6,999,580 1.3214.03.19Santander UK PLC16
USD 2.500%
89.23470,667,147Total - Transferable securities admitted to anofficial exchange
89.23470,667,147Total - Bonds
2.0810,988,500Total - United Kingdom
40,000 4,026,800 0.76CEL IB MANCR PR-Z- CAP
USD
Other transferable securitiesInvestment fundsLuxembourg
250,000 23,737,500 4.50Vontobel Fund -DynamicCommodity - S
USD
5.2627,764,300Total - Other transferable securities
5.2627,764,300Total - Investment funds
5.2627,764,300Total - Luxembourg
94.49498,431,447Total - Investment in securities
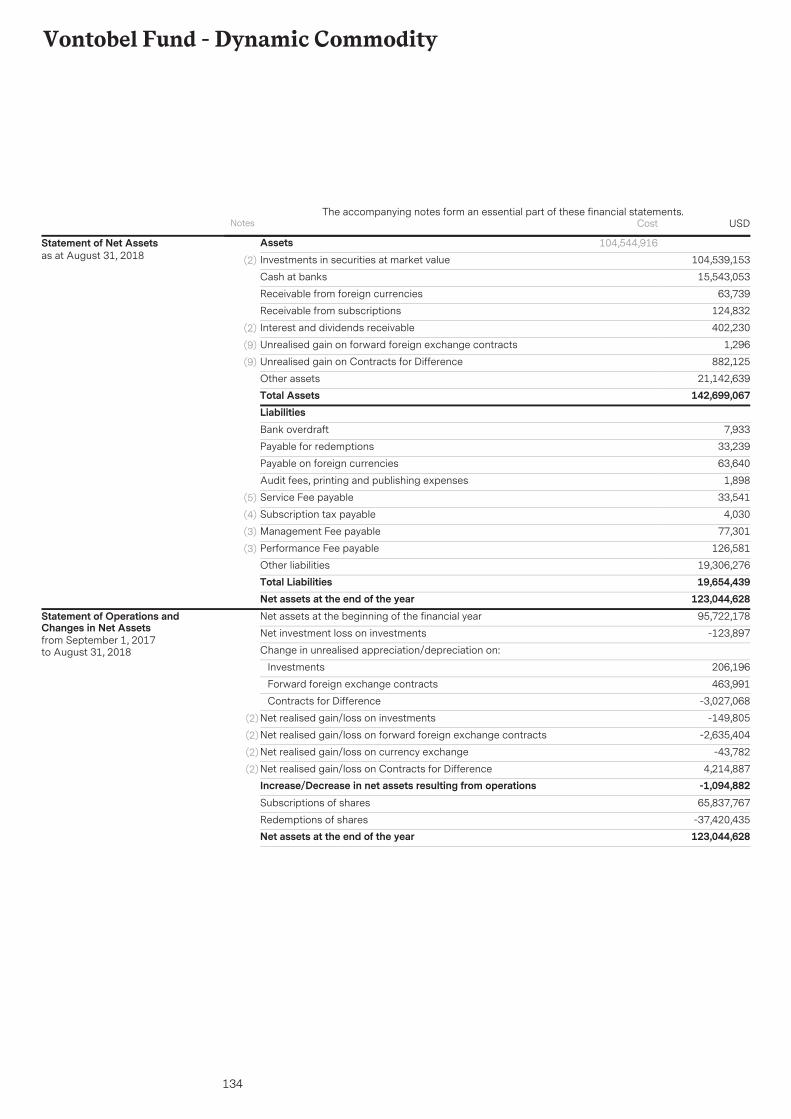
134
Vontobel Fund - Dynamic Commodity
AssetsInvestments in securities at market value 104,539,153(2)
15,543,053Cash at banks
63,739Receivable from foreign currencies
124,832Receivable from subscriptions
402,230Interest and dividends receivable(2)
1,296Unrealised gain on forward foreign exchange contracts(9)
882,125Unrealised gain on Contracts for Difference(9)
21,142,639Other assetsTotal Assets 142,699,067
104,544,916Statement of Net Assetsas at August 31, 2018
LiabilitiesBank overdraft 7,933
Payable for redemptions 33,239
Payable on foreign currencies 63,640
Audit fees, printing and publishing expenses 1,898
Service Fee payable 33,541(5)
Subscription tax payable 4,030(4)
Management Fee payable 77,301(3)
Performance Fee payable 126,581(3)
Other liabilities 19,306,276Total Liabilities 19,654,439Net assets at the end of the year 123,044,628Net assets at the beginning of the financial year 95,722,178
Net investment loss on investments -123,897
Change in unrealised appreciation/depreciation on:
Investments 206,196
Forward foreign exchange contracts 463,991
Contracts for Difference -3,027,068
Net realised gain/loss on investments -149,805(2)
Net realised gain/loss on forward foreign exchange contracts -2,635,404(2)
Net realised gain/loss on currency exchange -43,782(2)
Net realised gain/loss on Contracts for Difference 4,214,887(2)
Increase/Decrease in net assets resulting from operations -1,094,882Subscriptions of shares 65,837,767
Redemptions of shares -37,420,435Net assets at the end of the year 123,044,628
Statement of Operations andChanges in Net Assetsfrom September 1, 2017to August 31, 2018
Notes USDThe accompanying notes form an essential part of these financial statements.
Cost
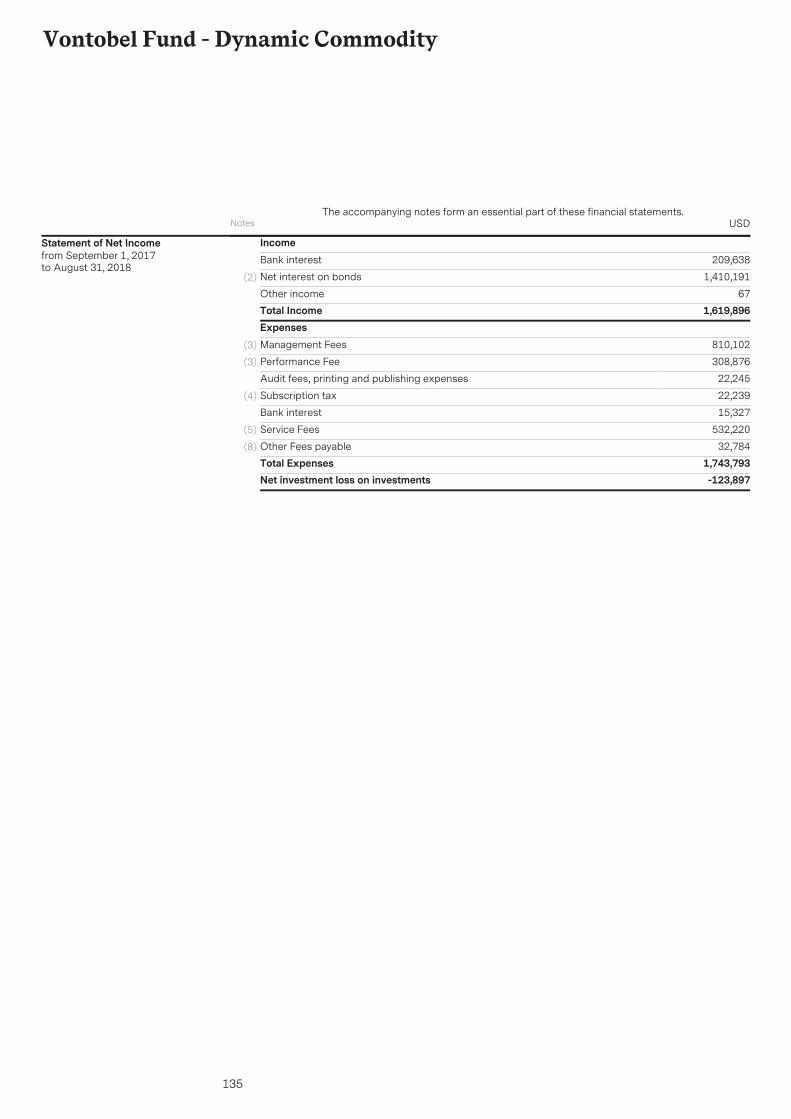
135
Vontobel Fund - Dynamic Commodity
IncomeBank interest 209,638
Net interest on bonds 1,410,191(2)
Other income 67Total Income 1,619,896ExpensesManagement Fees 810,102(3)
Performance Fee 308,876(3)
Audit fees, printing and publishing expenses 22,245
Subscription tax 22,239(4)
Bank interest 15,327
Service Fees 532,220(5)
Other Fees payable 32,784(8)
Total Expenses 1,743,793Net investment loss on investments -123,897
Statement of Net Incomefrom September 1, 2017to August 31, 2018
Notes USDThe accompanying notes form an essential part of these financial statements.
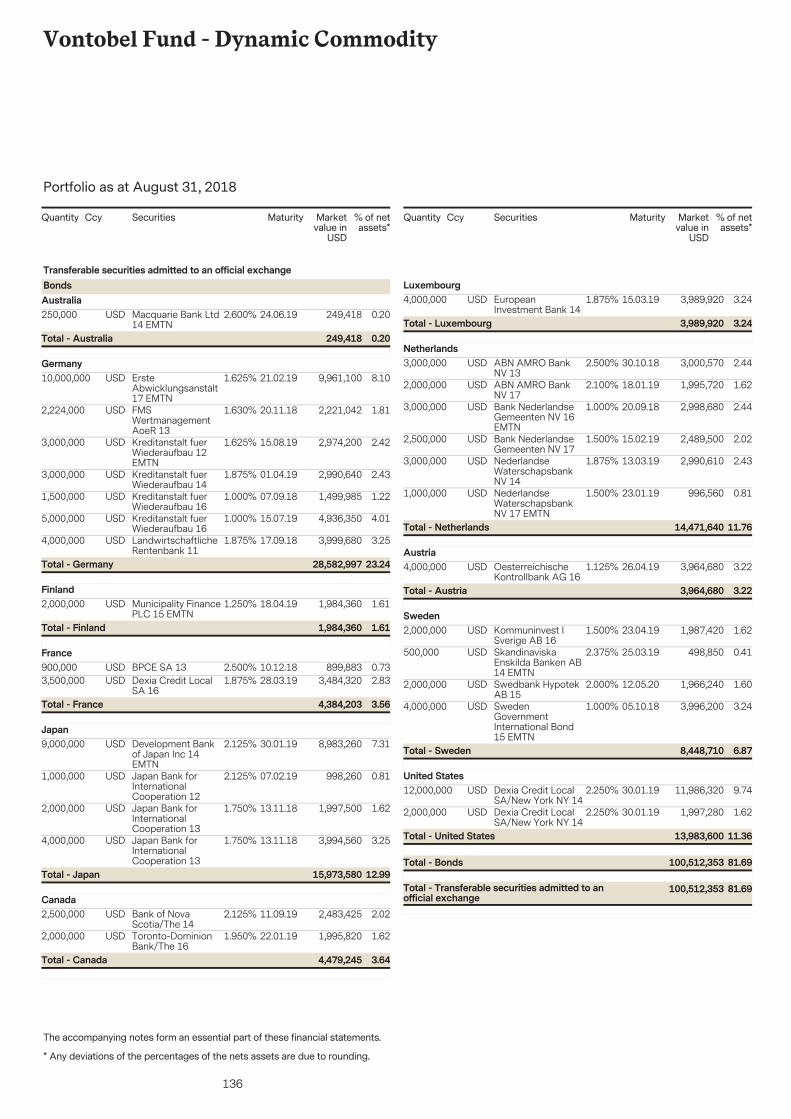
136
Vontobel Fund - Dynamic Commodity
The accompanying notes form an essential part of these financial statements.
Portfolio as at August 31, 2018
* Any deviations of the percentages of the nets assets are due to rounding.
Securities Marketvalue in
USD
% of netassets*
Quantity Ccy Maturity
250,000 249,418 0.2024.06.19Macquarie Bank Ltd14 EMTN
USD 2.600%
Transferable securities admitted to an official exchangeBondsAustralia
0.20249,418Total - Australia
10,000,000 9,961,100 8.1021.02.19ErsteAbwicklungsanstalt17 EMTN
USD 1.625%Germany
2,224,000 2,221,042 1.8120.11.18FMSWertmanagementAoeR 13
USD 1.630%
3,000,000 2,974,200 2.4215.08.19Kreditanstalt fuerWiederaufbau 12EMTN
USD 1.625%
3,000,000 2,990,640 2.4301.04.19Kreditanstalt fuerWiederaufbau 14
USD 1.875%
1,500,000 1,499,985 1.2207.09.18Kreditanstalt fuerWiederaufbau 16
USD 1.000%
5,000,000 4,936,350 4.0115.07.19Kreditanstalt fuerWiederaufbau 16
USD 1.000%
4,000,000 3,999,680 3.2517.09.18LandwirtschaftlicheRentenbank 11
USD 1.875%
23.2428,582,997Total - Germany
2,000,000 1,984,360 1.6118.04.19Municipality FinancePLC 15 EMTN
USD 1.250%Finland
1.611,984,360Total - Finland
900,000 899,883 0.7310.12.18BPCE SA 13USD 2.500%France
3,500,000 3,484,320 2.8328.03.19Dexia Credit LocalSA 16
USD 1.875%
3.564,384,203Total - France
9,000,000 8,983,260 7.3130.01.19Development Bankof Japan Inc 14EMTN
USD 2.125%Japan
1,000,000 998,260 0.8107.02.19Japan Bank forInternationalCooperation 12
USD 2.125%
2,000,000 1,997,500 1.6213.11.18Japan Bank forInternationalCooperation 13
USD 1.750%
4,000,000 3,994,560 3.2513.11.18Japan Bank forInternationalCooperation 13
USD 1.750%
12.9915,973,580Total - Japan
2,500,000 2,483,425 2.0211.09.19Bank of NovaScotia/The 14
USD 2.125%Canada
2,000,000 1,995,820 1.6222.01.19Toronto-DominionBank/The 16
USD 1.950%
3.644,479,245Total - Canada
Securities Marketvalue in
USD
% of netassets*
Quantity Ccy Maturity
4,000,000 3,989,920 3.2415.03.19EuropeanInvestment Bank 14
USD 1.875%Luxembourg
3.243,989,920Total - Luxembourg
3,000,000 3,000,570 2.4430.10.18ABN AMRO BankNV 13
USD 2.500%Netherlands
2,000,000 1,995,720 1.6218.01.19ABN AMRO BankNV 17
USD 2.100%
3,000,000 2,998,680 2.4420.09.18Bank NederlandseGemeenten NV 16EMTN
USD 1.000%
2,500,000 2,489,500 2.0215.02.19Bank NederlandseGemeenten NV 17
USD 1.500%
3,000,000 2,990,610 2.4313.03.19NederlandseWaterschapsbankNV 14
USD 1.875%
1,000,000 996,560 0.8123.01.19NederlandseWaterschapsbankNV 17 EMTN
USD 1.500%
11.7614,471,640Total - Netherlands
4,000,000 3,964,680 3.2226.04.19OesterreichischeKontrollbank AG 16
USD 1.125%Austria
3.223,964,680Total - Austria
2,000,000 1,987,420 1.6223.04.19Kommuninvest ISverige AB 16
USD 1.500%Sweden
500,000 498,850 0.4125.03.19SkandinaviskaEnskilda Banken AB14 EMTN
USD 2.375%
2,000,000 1,966,240 1.6012.05.20Swedbank HypotekAB 15
USD 2.000%
4,000,000 3,996,200 3.2405.10.18SwedenGovernmentInternational Bond15 EMTN
USD 1.000%
6.878,448,710Total - Sweden
12,000,000 11,986,320 9.7430.01.19Dexia Credit LocalSA/New York NY 14
USD 2.250%United States
2,000,000 1,997,280 1.6230.01.19Dexia Credit LocalSA/New York NY 14
USD 2.250%
81.69100,512,353Total - Transferable securities admitted to anofficial exchange
81.69100,512,353Total - Bonds
11.3613,983,600Total - United States
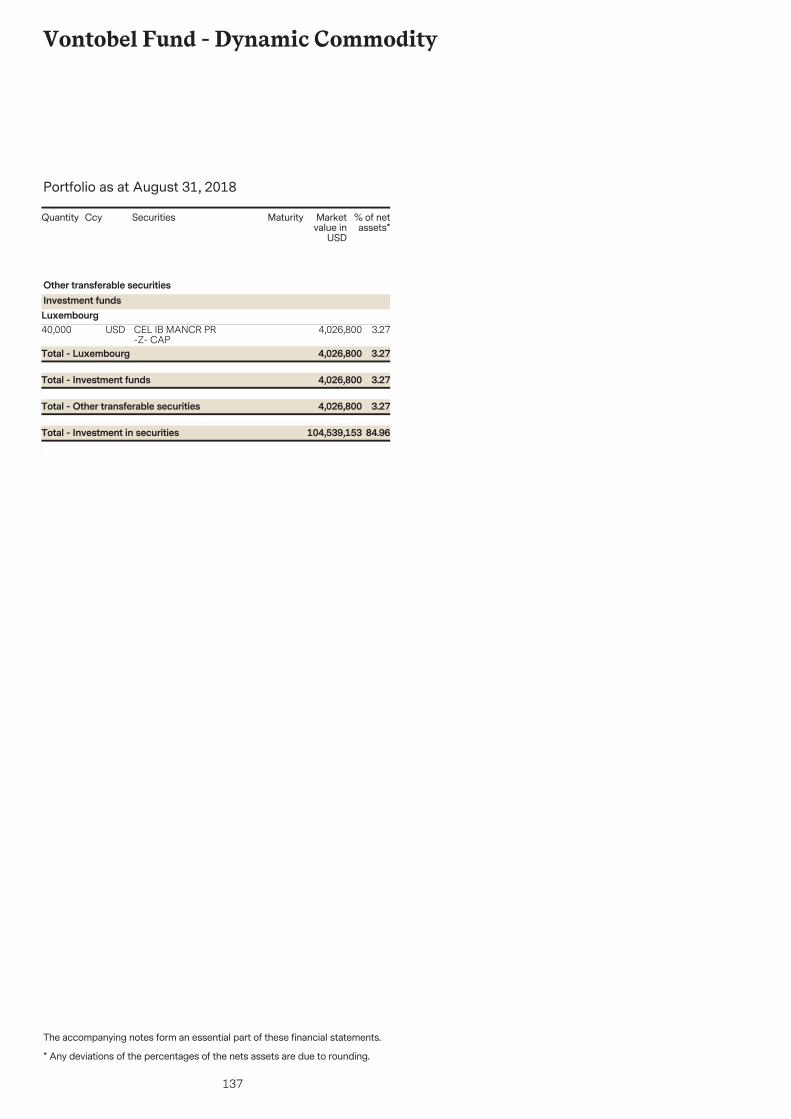
137
Vontobel Fund - Dynamic Commodity
The accompanying notes form an essential part of these financial statements.
Portfolio as at August 31, 2018
* Any deviations of the percentages of the nets assets are due to rounding.
Securities Marketvalue in
USD
% of netassets*
Quantity Ccy Maturity
40,000 4,026,800 3.27CEL IB MANCR PR-Z- CAP
USD
Other transferable securitiesInvestment fundsLuxembourg
3.274,026,800Total - Other transferable securities
3.274,026,800Total - Investment funds
3.274,026,800Total - Luxembourg
84.96104,539,153Total - Investment in securities
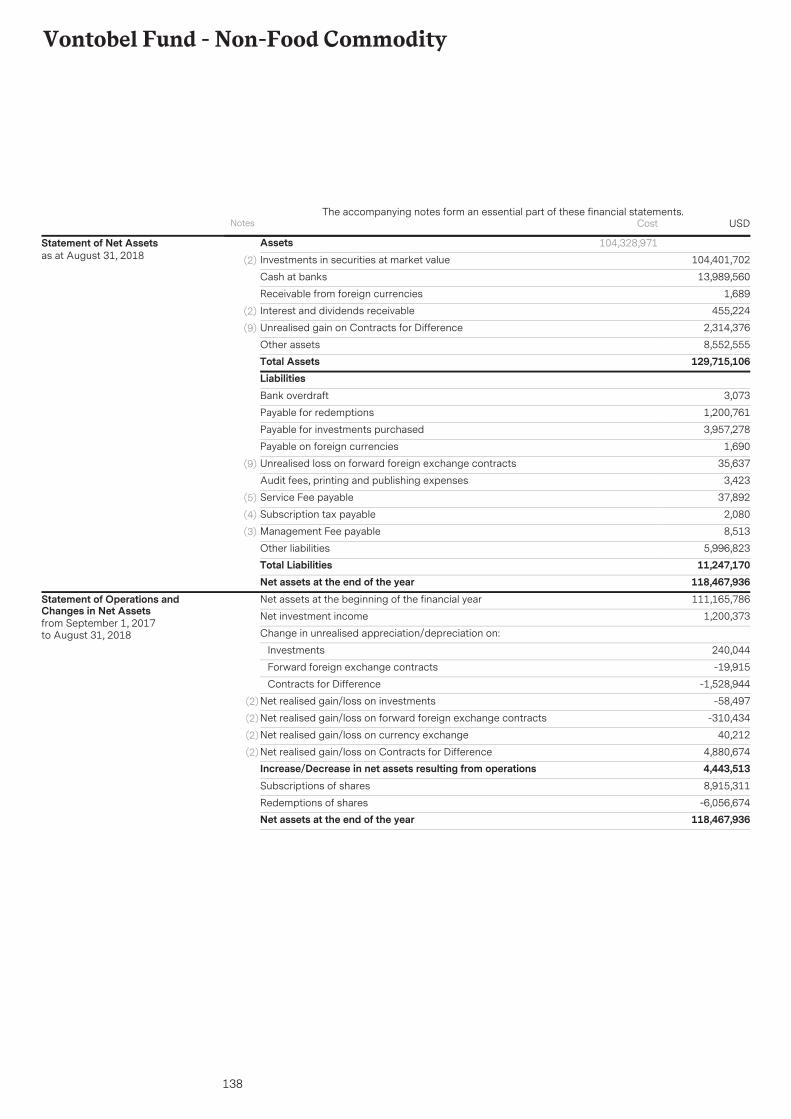
138
Vontobel Fund - Non-Food Commodity
AssetsInvestments in securities at market value 104,401,702(2)
13,989,560Cash at banks
1,689Receivable from foreign currencies
455,224Interest and dividends receivable(2)
2,314,376Unrealised gain on Contracts for Difference(9)
8,552,555Other assetsTotal Assets 129,715,106
104,328,971Statement of Net Assetsas at August 31, 2018
LiabilitiesBank overdraft 3,073
Payable for redemptions 1,200,761
Payable for investments purchased 3,957,278
Payable on foreign currencies 1,690
Unrealised loss on forward foreign exchange contracts 35,637(9)
Audit fees, printing and publishing expenses 3,423
Service Fee payable 37,892(5)
Subscription tax payable 2,080(4)
Management Fee payable 8,513(3)
Other liabilities 5,996,823Total Liabilities 11,247,170Net assets at the end of the year 118,467,936Net assets at the beginning of the financial year 111,165,786
Net investment income 1,200,373
Change in unrealised appreciation/depreciation on:
Investments 240,044
Forward foreign exchange contracts -19,915
Contracts for Difference -1,528,944
Net realised gain/loss on investments -58,497(2)
Net realised gain/loss on forward foreign exchange contracts -310,434(2)
Net realised gain/loss on currency exchange 40,212(2)
Net realised gain/loss on Contracts for Difference 4,880,674(2)
Increase/Decrease in net assets resulting from operations 4,443,513Subscriptions of shares 8,915,311
Redemptions of shares -6,056,674Net assets at the end of the year 118,467,936
Statement of Operations andChanges in Net Assetsfrom September 1, 2017to August 31, 2018
Notes USDThe accompanying notes form an essential part of these financial statements.
Cost
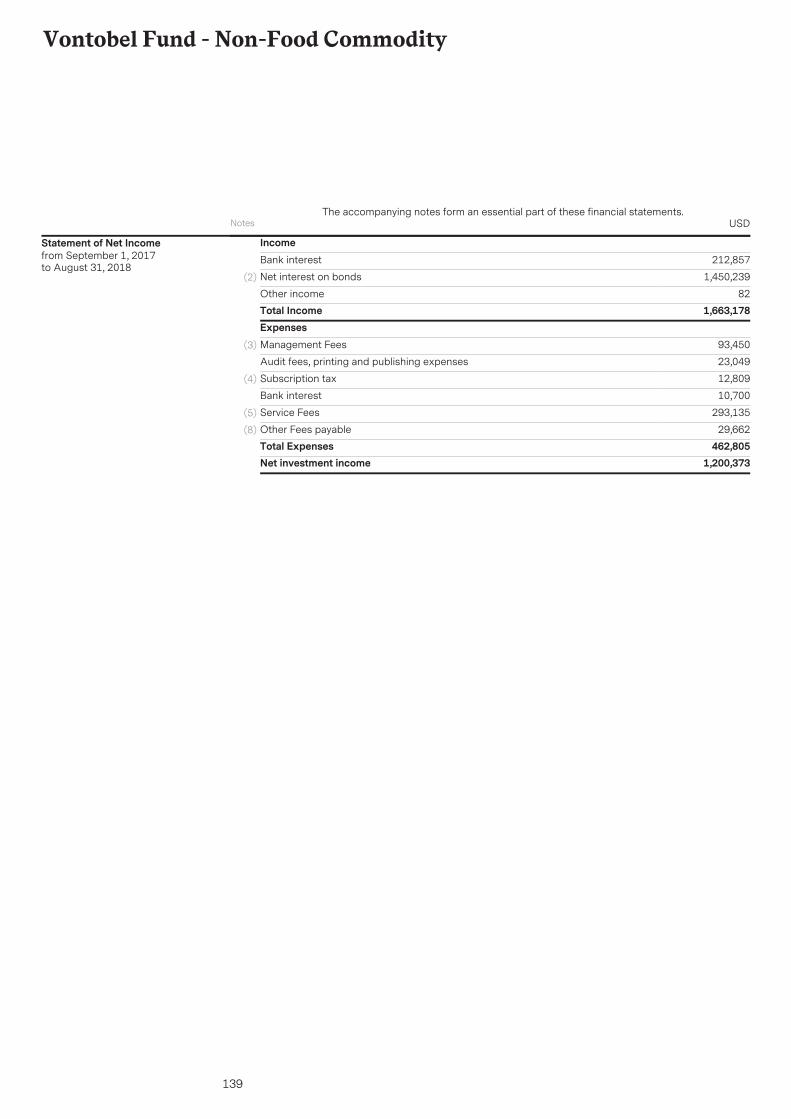
139
Vontobel Fund - Non-Food Commodity
IncomeBank interest 212,857
Net interest on bonds 1,450,239(2)
Other income 82Total Income 1,663,178ExpensesManagement Fees 93,450(3)
Audit fees, printing and publishing expenses 23,049
Subscription tax 12,809(4)
Bank interest 10,700
Service Fees 293,135(5)
Other Fees payable 29,662(8)
Total Expenses 462,805Net investment income 1,200,373
Statement of Net Incomefrom September 1, 2017to August 31, 2018
Notes USDThe accompanying notes form an essential part of these financial statements.
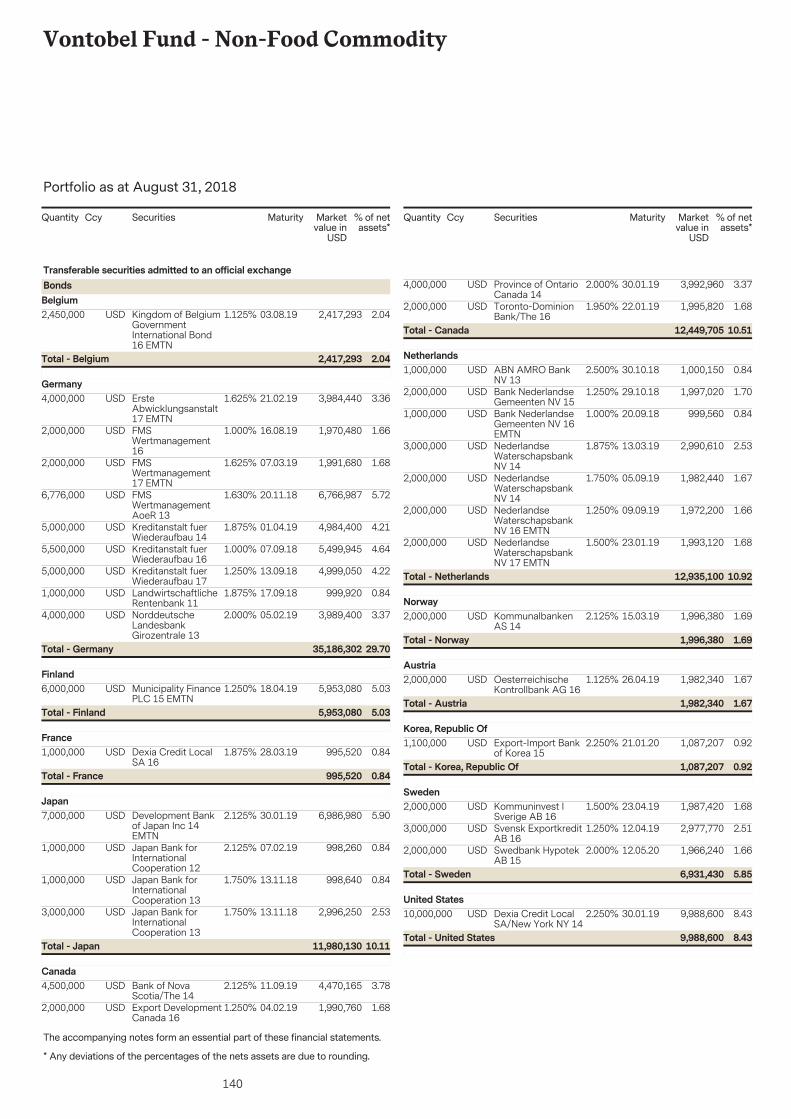
140
Vontobel Fund - Non-Food Commodity
The accompanying notes form an essential part of these financial statements.
Portfolio as at August 31, 2018
* Any deviations of the percentages of the nets assets are due to rounding.
Securities Marketvalue in
USD
% of netassets*
Quantity Ccy Maturity
2,450,000 2,417,293 2.0403.08.19Kingdom of BelgiumGovernmentInternational Bond16 EMTN
USD 1.125%
Transferable securities admitted to an official exchangeBondsBelgium
2.042,417,293Total - Belgium
4,000,000 3,984,440 3.3621.02.19ErsteAbwicklungsanstalt17 EMTN
USD 1.625%Germany
2,000,000 1,970,480 1.6616.08.19FMSWertmanagement16
USD 1.000%
2,000,000 1,991,680 1.6807.03.19FMSWertmanagement17 EMTN
USD 1.625%
6,776,000 6,766,987 5.7220.11.18FMSWertmanagementAoeR 13
USD 1.630%
5,000,000 4,984,400 4.2101.04.19Kreditanstalt fuerWiederaufbau 14
USD 1.875%
5,500,000 5,499,945 4.6407.09.18Kreditanstalt fuerWiederaufbau 16
USD 1.000%
5,000,000 4,999,050 4.2213.09.18Kreditanstalt fuerWiederaufbau 17
USD 1.250%
1,000,000 999,920 0.8417.09.18LandwirtschaftlicheRentenbank 11
USD 1.875%
4,000,000 3,989,400 3.3705.02.19NorddeutscheLandesbankGirozentrale 13
USD 2.000%
29.7035,186,302Total - Germany
6,000,000 5,953,080 5.0318.04.19Municipality FinancePLC 15 EMTN
USD 1.250%Finland
5.035,953,080Total - Finland
1,000,000 995,520 0.8428.03.19Dexia Credit LocalSA 16
USD 1.875%France
0.84995,520Total - France
7,000,000 6,986,980 5.9030.01.19Development Bankof Japan Inc 14EMTN
USD 2.125%Japan
1,000,000 998,260 0.8407.02.19Japan Bank forInternationalCooperation 12
USD 2.125%
1,000,000 998,640 0.8413.11.18Japan Bank forInternationalCooperation 13
USD 1.750%
3,000,000 2,996,250 2.5313.11.18Japan Bank forInternationalCooperation 13
USD 1.750%
10.1111,980,130Total - Japan
4,500,000 4,470,165 3.7811.09.19Bank of NovaScotia/The 14
USD 2.125%Canada
2,000,000 1,990,760 1.6804.02.19Export DevelopmentCanada 16
USD 1.250%
Securities Marketvalue in
USD
% of netassets*
Quantity Ccy Maturity
4,000,000 3,992,960 3.3730.01.19Province of OntarioCanada 14
USD 2.000%
2,000,000 1,995,820 1.6822.01.19Toronto-DominionBank/The 16
USD 1.950%
10.5112,449,705Total - Canada
1,000,000 1,000,150 0.8430.10.18ABN AMRO BankNV 13
USD 2.500%Netherlands
2,000,000 1,997,020 1.7029.10.18Bank NederlandseGemeenten NV 15
USD 1.250%
1,000,000 999,560 0.8420.09.18Bank NederlandseGemeenten NV 16EMTN
USD 1.000%
3,000,000 2,990,610 2.5313.03.19NederlandseWaterschapsbankNV 14
USD 1.875%
2,000,000 1,982,440 1.6705.09.19NederlandseWaterschapsbankNV 14
USD 1.750%
2,000,000 1,972,200 1.6609.09.19NederlandseWaterschapsbankNV 16 EMTN
USD 1.250%
2,000,000 1,993,120 1.6823.01.19NederlandseWaterschapsbankNV 17 EMTN
USD 1.500%
10.9212,935,100Total - Netherlands
2,000,000 1,996,380 1.6915.03.19KommunalbankenAS 14
USD 2.125%Norway
1.691,996,380Total - Norway
2,000,000 1,982,340 1.6726.04.19OesterreichischeKontrollbank AG 16
USD 1.125%Austria
1.671,982,340Total - Austria
1,100,000 1,087,207 0.9221.01.20Export-Import Bankof Korea 15
USD 2.250%Korea, Republic Of
0.921,087,207Total - Korea, Republic Of
2,000,000 1,987,420 1.6823.04.19Kommuninvest ISverige AB 16
USD 1.500%Sweden
3,000,000 2,977,770 2.5112.04.19Svensk ExportkreditAB 16
USD 1.250%
2,000,000 1,966,240 1.6612.05.20Swedbank HypotekAB 15
USD 2.000%
5.856,931,430Total - Sweden
10,000,000 9,988,600 8.4330.01.19Dexia Credit LocalSA/New York NY 14
USD 2.250%United States
8.439,988,600Total - United States
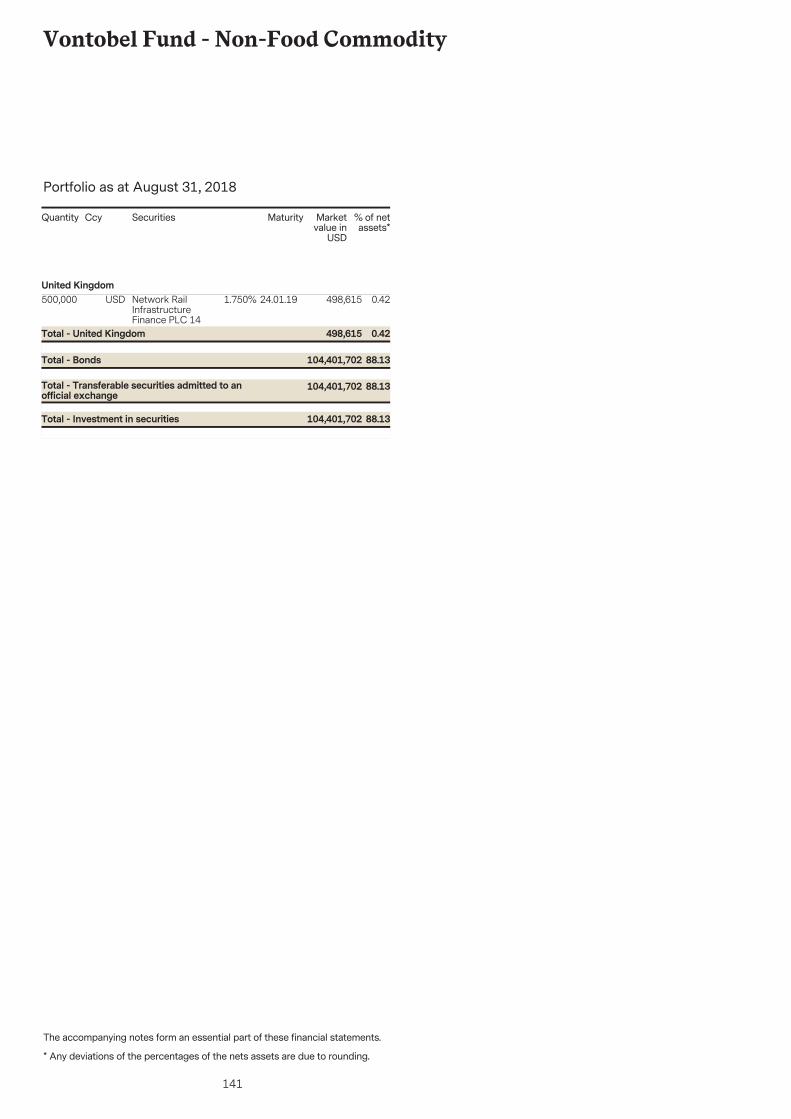
141
Vontobel Fund - Non-Food Commodity
The accompanying notes form an essential part of these financial statements.
Portfolio as at August 31, 2018
* Any deviations of the percentages of the nets assets are due to rounding.
Securities Marketvalue in
USD
% of netassets*
Quantity Ccy Maturity
500,000 498,615 0.4224.01.19Network RailInfrastructureFinance PLC 14
USD 1.750%United Kingdom
88.13104,401,702Total - Transferable securities admitted to anofficial exchange
88.13104,401,702Total - Bonds
0.42498,615Total - United Kingdom
88.13104,401,702Total - Investment in securities
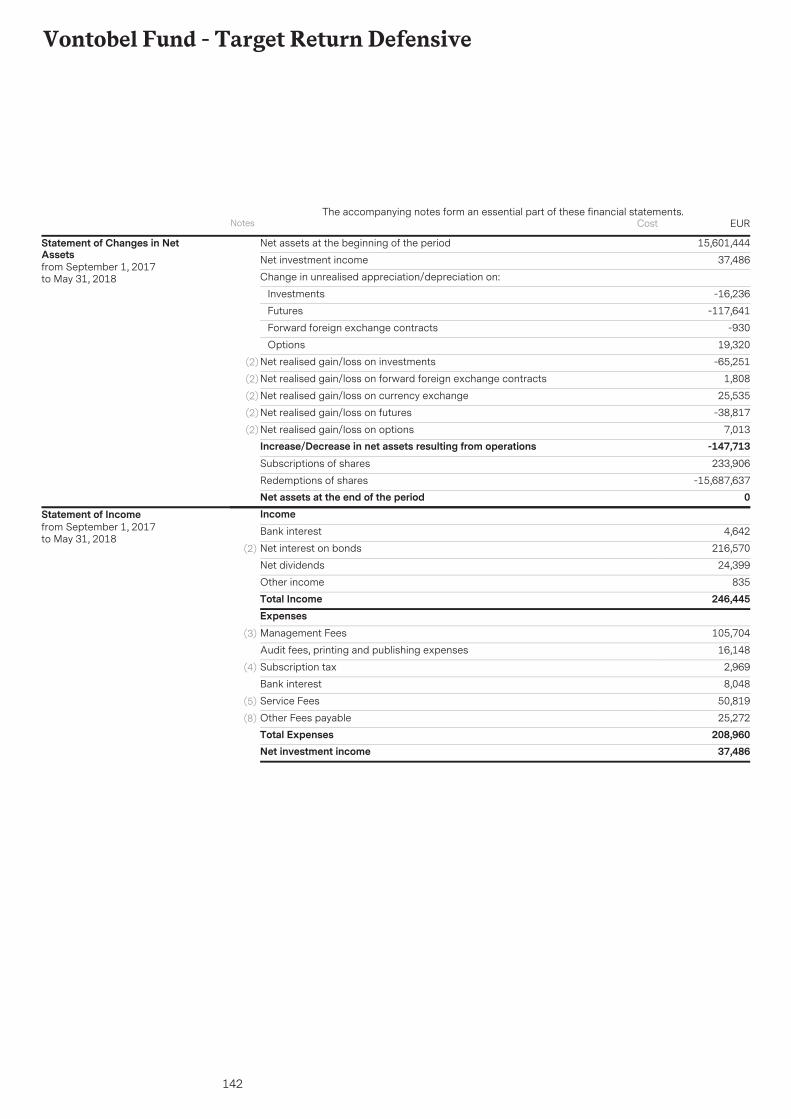
142
Vontobel Fund - Target Return Defensive
Net assets at the beginning of the period 15,601,444
37,486Net investment income
Change in unrealised appreciation/depreciation on:
Investments -16,236
Futures -117,641
Forward foreign exchange contracts -930
Options 19,320
(2) -65,251Net realised gain/loss on investments
(2) 1,808Net realised gain/loss on forward foreign exchange contracts
(2) 25,535Net realised gain/loss on currency exchange
(2) -38,817Net realised gain/loss on futures
(2) 7,013Net realised gain/loss on options-147,713Increase/Decrease in net assets resulting from operations233,906Subscriptions of shares
-15,687,637Redemptions of sharesNet assets at the end of the period 0
Statement of Changes in NetAssetsfrom September 1, 2017to May 31, 2018
IncomeBank interest 4,642
Net interest on bonds 216,570(2)
Net dividends 24,399
Other income 835Total Income 246,445ExpensesManagement Fees 105,704(3)
Audit fees, printing and publishing expenses 16,148
Subscription tax 2,969(4)
Bank interest 8,048
Service Fees 50,819(5)
Other Fees payable 25,272(8)
Total Expenses 208,960Net investment income 37,486
Statement of Incomefrom September 1, 2017to May 31, 2018
Notes EURThe accompanying notes form an essential part of these financial statements.
Cost
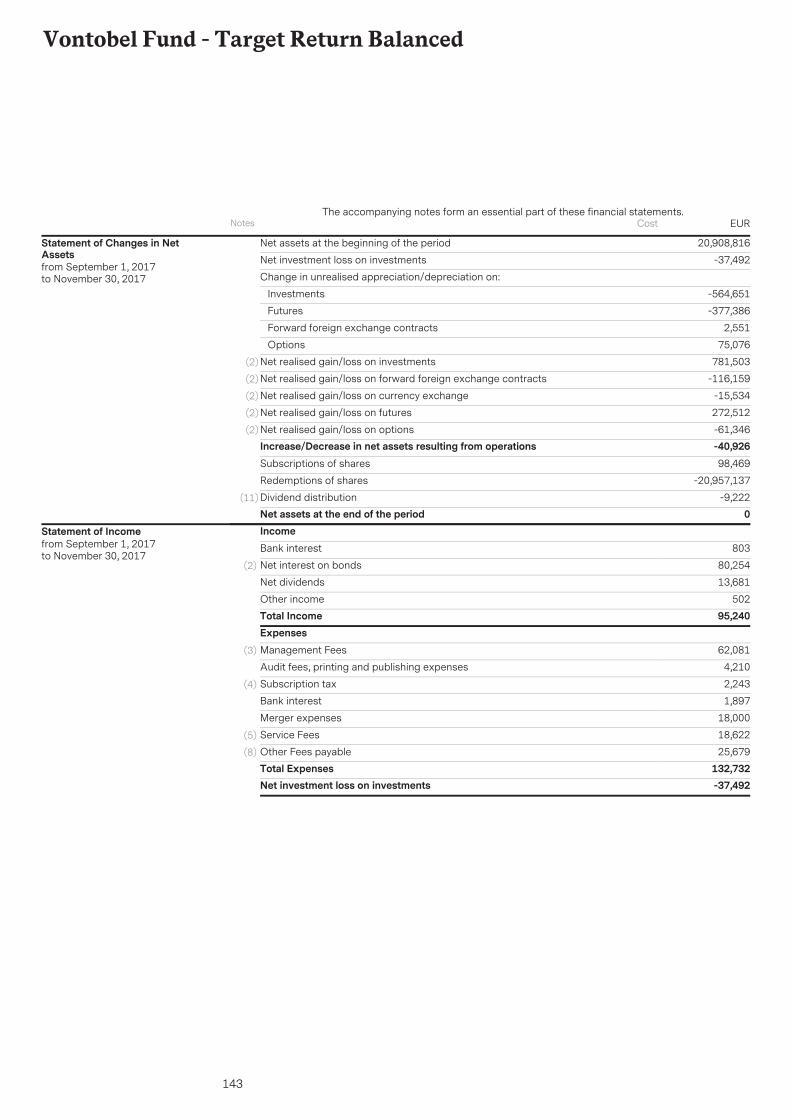
143
Vontobel Fund - Target Return Balanced
Net assets at the beginning of the period 20,908,816
-37,492Net investment loss on investments
Change in unrealised appreciation/depreciation on:
Investments -564,651
Futures -377,386
Forward foreign exchange contracts 2,551
Options 75,076
(2) 781,503Net realised gain/loss on investments
(2) -116,159Net realised gain/loss on forward foreign exchange contracts
(2) -15,534Net realised gain/loss on currency exchange
(2) 272,512Net realised gain/loss on futures
(2) -61,346Net realised gain/loss on options-40,926Increase/Decrease in net assets resulting from operations98,469Subscriptions of shares
-20,957,137Redemptions of shares
(11) -9,222Dividend distributionNet assets at the end of the period 0
Statement of Changes in NetAssetsfrom September 1, 2017to November 30, 2017
IncomeBank interest 803
Net interest on bonds 80,254(2)
Net dividends 13,681
Other income 502Total Income 95,240ExpensesManagement Fees 62,081(3)
Audit fees, printing and publishing expenses 4,210
Subscription tax 2,243(4)
Bank interest 1,897
Merger expenses 18,000
Service Fees 18,622(5)
Other Fees payable 25,679(8)
Total Expenses 132,732Net investment loss on investments -37,492
Statement of Incomefrom September 1, 2017to November 30, 2017
Notes EURThe accompanying notes form an essential part of these financial statements.
Cost
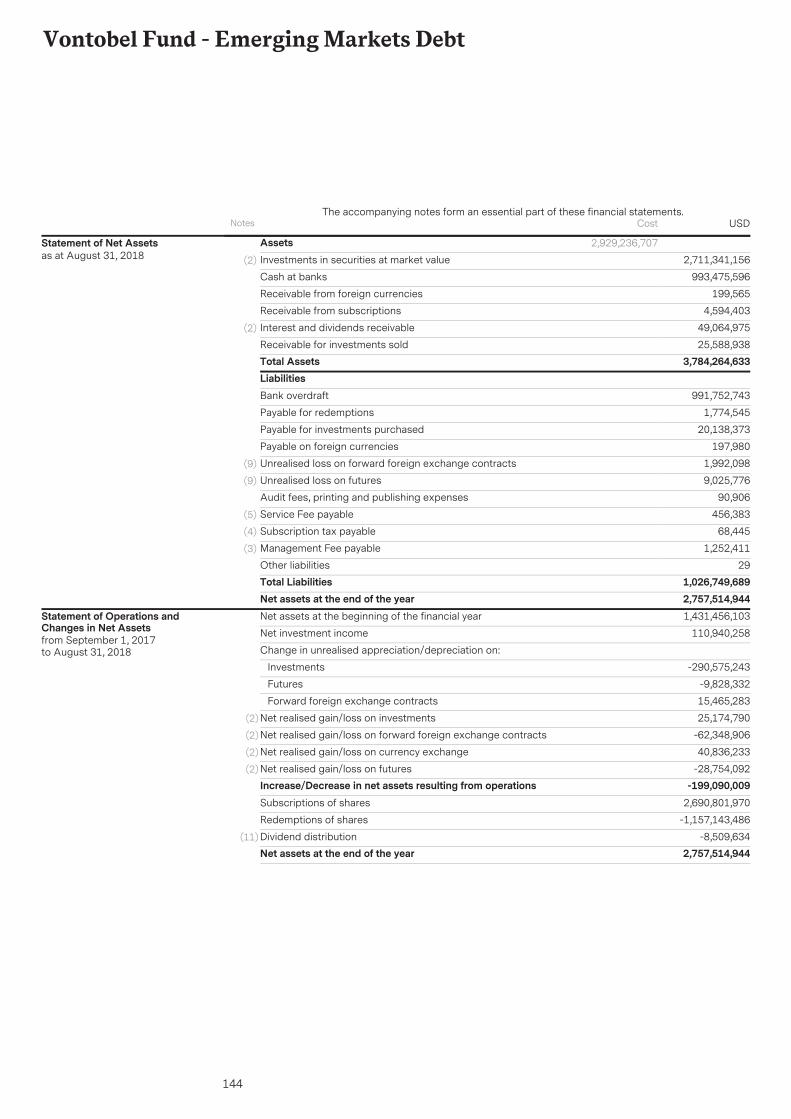
144
Vontobel Fund - Emerging Markets Debt
AssetsInvestments in securities at market value 2,711,341,156(2)
993,475,596Cash at banks
199,565Receivable from foreign currencies
4,594,403Receivable from subscriptions
49,064,975Interest and dividends receivable(2)
25,588,938Receivable for investments soldTotal Assets 3,784,264,633
2,929,236,707Statement of Net Assetsas at August 31, 2018
LiabilitiesBank overdraft 991,752,743
Payable for redemptions 1,774,545
Payable for investments purchased 20,138,373
Payable on foreign currencies 197,980
Unrealised loss on forward foreign exchange contracts 1,992,098(9)
Unrealised loss on futures 9,025,776(9)
Audit fees, printing and publishing expenses 90,906
Service Fee payable 456,383(5)
Subscription tax payable 68,445(4)
Management Fee payable 1,252,411(3)
Other liabilities 29Total Liabilities 1,026,749,689Net assets at the end of the year 2,757,514,944Net assets at the beginning of the financial year 1,431,456,103
Net investment income 110,940,258
Change in unrealised appreciation/depreciation on:
Investments -290,575,243
Futures -9,828,332
Forward foreign exchange contracts 15,465,283
Net realised gain/loss on investments 25,174,790(2)
Net realised gain/loss on forward foreign exchange contracts -62,348,906(2)
Net realised gain/loss on currency exchange 40,836,233(2)
Net realised gain/loss on futures -28,754,092(2)
Increase/Decrease in net assets resulting from operations -199,090,009Subscriptions of shares 2,690,801,970
Redemptions of shares -1,157,143,486
Dividend distribution -8,509,634(11)
Net assets at the end of the year 2,757,514,944
Statement of Operations andChanges in Net Assetsfrom September 1, 2017to August 31, 2018
Notes USDThe accompanying notes form an essential part of these financial statements.
Cost
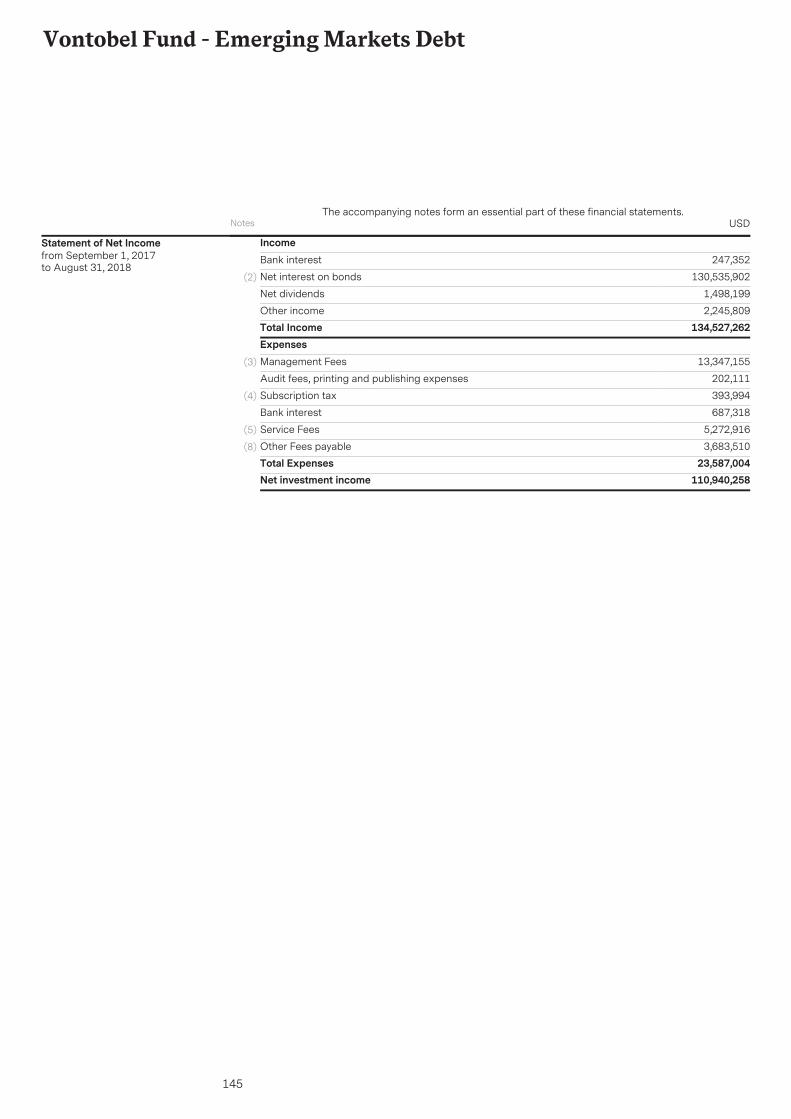
145
Vontobel Fund - Emerging Markets Debt
IncomeBank interest 247,352
Net interest on bonds 130,535,902(2)
Net dividends 1,498,199
Other income 2,245,809Total Income 134,527,262ExpensesManagement Fees 13,347,155(3)
Audit fees, printing and publishing expenses 202,111
Subscription tax 393,994(4)
Bank interest 687,318
Service Fees 5,272,916(5)
Other Fees payable 3,683,510(8)
Total Expenses 23,587,004Net investment income 110,940,258
Statement of Net Incomefrom September 1, 2017to August 31, 2018
Notes USDThe accompanying notes form an essential part of these financial statements.
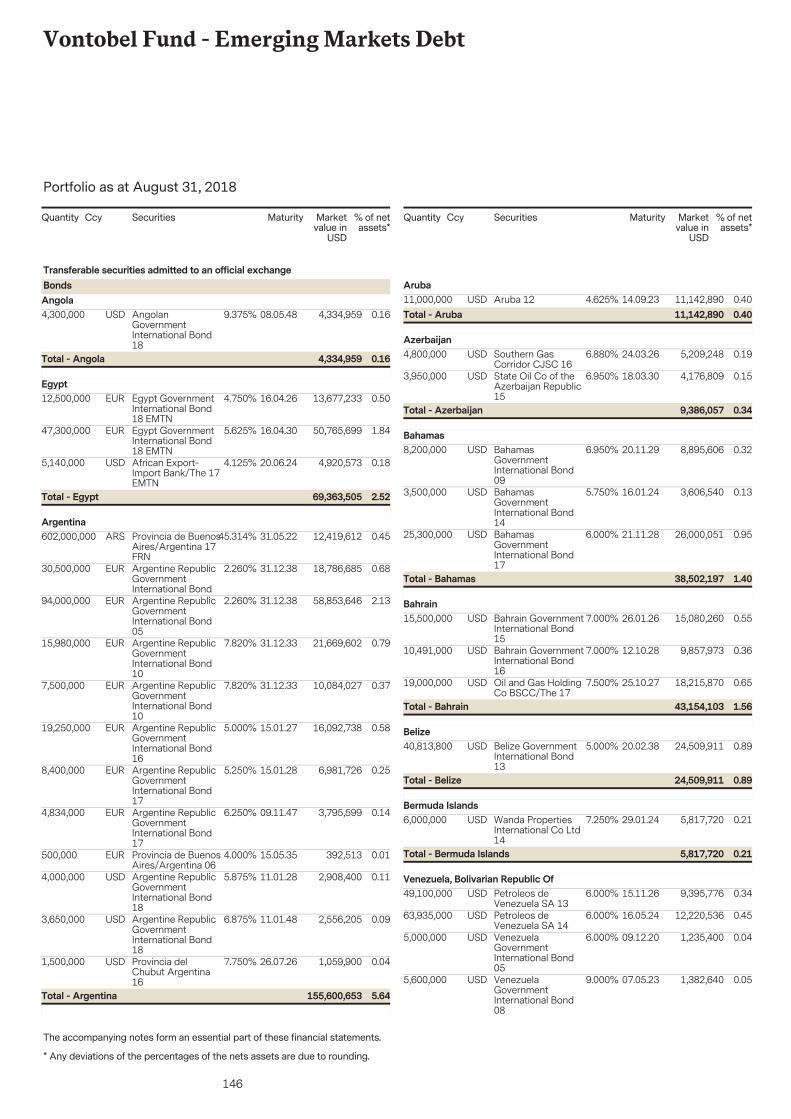
146
Vontobel Fund - Emerging Markets Debt
The accompanying notes form an essential part of these financial statements.
Portfolio as at August 31, 2018
* Any deviations of the percentages of the nets assets are due to rounding.
Securities Marketvalue in
USD
% of netassets*
Quantity Ccy Maturity
4,300,000 4,334,959 0.1608.05.48AngolanGovernmentInternational Bond18
USD 9.375%
Transferable securities admitted to an official exchangeBondsAngola
0.164,334,959Total - Angola
12,500,000 13,677,233 0.5016.04.26Egypt GovernmentInternational Bond18 EMTN
EUR 4.750%Egypt
47,300,000 50,765,699 1.8416.04.30Egypt GovernmentInternational Bond18 EMTN
EUR 5.625%
5,140,000 4,920,573 0.1820.06.24African Export-Import Bank/The 17EMTN
USD 4.125%
2.5269,363,505Total - Egypt
602,000,000 12,419,612 0.4531.05.22Provincia de BuenosAires/Argentina 17FRN
ARS 45.314%Argentina
30,500,000 18,786,685 0.6831.12.38Argentine RepublicGovernmentInternational Bond
EUR 2.260%
94,000,000 58,853,646 2.1331.12.38Argentine RepublicGovernmentInternational Bond05
EUR 2.260%
15,980,000 21,669,602 0.7931.12.33Argentine RepublicGovernmentInternational Bond10
EUR 7.820%
7,500,000 10,084,027 0.3731.12.33Argentine RepublicGovernmentInternational Bond10
EUR 7.820%
19,250,000 16,092,738 0.5815.01.27Argentine RepublicGovernmentInternational Bond16
EUR 5.000%
8,400,000 6,981,726 0.2515.01.28Argentine RepublicGovernmentInternational Bond17
EUR 5.250%
4,834,000 3,795,599 0.1409.11.47Argentine RepublicGovernmentInternational Bond17
EUR 6.250%
500,000 392,513 0.0115.05.35Provincia de BuenosAires/Argentina 06
EUR 4.000%
4,000,000 2,908,400 0.1111.01.28Argentine RepublicGovernmentInternational Bond18
USD 5.875%
3,650,000 2,556,205 0.0911.01.48Argentine RepublicGovernmentInternational Bond18
USD 6.875%
1,500,000 1,059,900 0.0426.07.26Provincia delChubut Argentina16
USD 7.750%
5.64155,600,653Total - Argentina
Securities Marketvalue in
USD
% of netassets*
Quantity Ccy Maturity
11,000,000 11,142,890 0.4014.09.23Aruba 12USD 4.625%Aruba
0.4011,142,890Total - Aruba
4,800,000 5,209,248 0.1924.03.26Southern GasCorridor CJSC 16
USD 6.880%Azerbaijan
3,950,000 4,176,809 0.1518.03.30State Oil Co of theAzerbaijan Republic15
USD 6.950%
0.349,386,057Total - Azerbaijan
8,200,000 8,895,606 0.3220.11.29BahamasGovernmentInternational Bond09
USD 6.950%Bahamas
3,500,000 3,606,540 0.1316.01.24BahamasGovernmentInternational Bond14
USD 5.750%
25,300,000 26,000,051 0.9521.11.28BahamasGovernmentInternational Bond17
USD 6.000%
1.4038,502,197Total - Bahamas
15,500,000 15,080,260 0.5526.01.26Bahrain GovernmentInternational Bond15
USD 7.000%Bahrain
10,491,000 9,857,973 0.3612.10.28Bahrain GovernmentInternational Bond16
USD 7.000%
19,000,000 18,215,870 0.6525.10.27Oil and Gas HoldingCo BSCC/The 17
USD 7.500%
1.5643,154,103Total - Bahrain
40,813,800 24,509,911 0.8920.02.38Belize GovernmentInternational Bond13
USD 5.000%Belize
0.8924,509,911Total - Belize
6,000,000 5,817,720 0.2129.01.24Wanda PropertiesInternational Co Ltd14
USD 7.250%Bermuda Islands
0.215,817,720Total - Bermuda Islands
49,100,000 9,395,776 0.3415.11.26Petroleos deVenezuela SA 13
USD 6.000%Venezuela, Bolivarian Republic Of
63,935,000 12,220,536 0.4516.05.24Petroleos deVenezuela SA 14
USD 6.000%
5,000,000 1,235,400 0.0409.12.20VenezuelaGovernmentInternational Bond05
USD 6.000%
5,600,000 1,382,640 0.0507.05.23VenezuelaGovernmentInternational Bond08
USD 9.000%
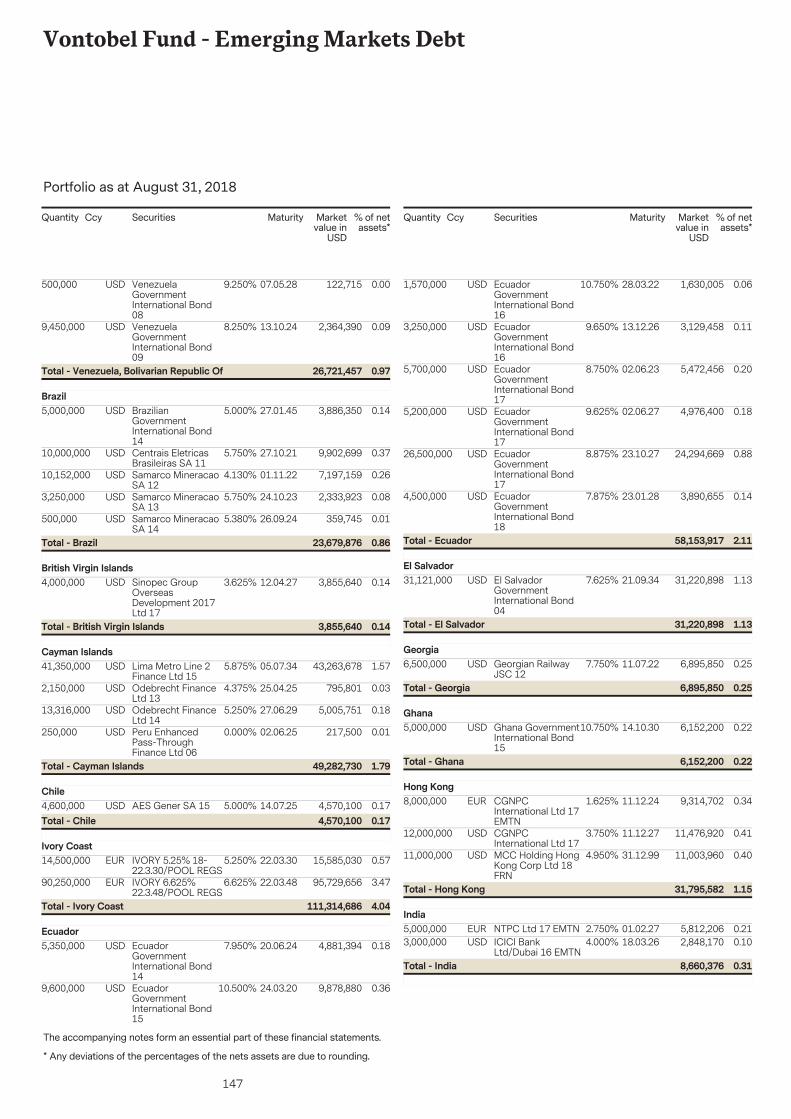
147
Vontobel Fund - Emerging Markets Debt
The accompanying notes form an essential part of these financial statements.
Portfolio as at August 31, 2018
* Any deviations of the percentages of the nets assets are due to rounding.
Securities Marketvalue in
USD
% of netassets*
Quantity Ccy Maturity
500,000 122,715 0.0007.05.28VenezuelaGovernmentInternational Bond08
USD 9.250%
9,450,000 2,364,390 0.0913.10.24VenezuelaGovernmentInternational Bond09
USD 8.250%
0.9726,721,457Total - Venezuela, Bolivarian Republic Of
5,000,000 3,886,350 0.1427.01.45BrazilianGovernmentInternational Bond14
USD 5.000%Brazil
10,000,000 9,902,699 0.3727.10.21Centrais EletricasBrasileiras SA 11
USD 5.750%
10,152,000 7,197,159 0.2601.11.22Samarco MineracaoSA 12
USD 4.130%
3,250,000 2,333,923 0.0824.10.23Samarco MineracaoSA 13
USD 5.750%
500,000 359,745 0.0126.09.24Samarco MineracaoSA 14
USD 5.380%
0.8623,679,876Total - Brazil
4,000,000 3,855,640 0.1412.04.27Sinopec GroupOverseasDevelopment 2017Ltd 17
USD 3.625%British Virgin Islands
0.143,855,640Total - British Virgin Islands
41,350,000 43,263,678 1.5705.07.34Lima Metro Line 2Finance Ltd 15
USD 5.875%Cayman Islands
2,150,000 795,801 0.0325.04.25Odebrecht FinanceLtd 13
USD 4.375%
13,316,000 5,005,751 0.1827.06.29Odebrecht FinanceLtd 14
USD 5.250%
250,000 217,500 0.0102.06.25Peru EnhancedPass-ThroughFinance Ltd 06
USD 0.000%
1.7949,282,730Total - Cayman Islands
4,600,000 4,570,100 0.1714.07.25AES Gener SA 15USD 5.000%Chile
0.174,570,100Total - Chile
14,500,000 15,585,030 0.5722.03.30IVORY 5.25% 18-22.3.30/POOL REGS
EUR 5.250%Ivory Coast
90,250,000 95,729,656 3.4722.03.48IVORY 6.625%22.3.48/POOL REGS
EUR 6.625%
4.04111,314,686Total - Ivory Coast
5,350,000 4,881,394 0.1820.06.24EcuadorGovernmentInternational Bond14
USD 7.950%Ecuador
9,600,000 9,878,880 0.3624.03.20EcuadorGovernmentInternational Bond15
USD 10.500%
Securities Marketvalue in
USD
% of netassets*
Quantity Ccy Maturity
1,570,000 1,630,005 0.0628.03.22EcuadorGovernmentInternational Bond16
USD 10.750%
3,250,000 3,129,458 0.1113.12.26EcuadorGovernmentInternational Bond16
USD 9.650%
5,700,000 5,472,456 0.2002.06.23EcuadorGovernmentInternational Bond17
USD 8.750%
5,200,000 4,976,400 0.1802.06.27EcuadorGovernmentInternational Bond17
USD 9.625%
26,500,000 24,294,669 0.8823.10.27EcuadorGovernmentInternational Bond17
USD 8.875%
4,500,000 3,890,655 0.1423.01.28EcuadorGovernmentInternational Bond18
USD 7.875%
2.1158,153,917Total - Ecuador
31,121,000 31,220,898 1.1321.09.34El SalvadorGovernmentInternational Bond04
USD 7.625%El Salvador
1.1331,220,898Total - El Salvador
6,500,000 6,895,850 0.2511.07.22Georgian RailwayJSC 12
USD 7.750%Georgia
0.256,895,850Total - Georgia
5,000,000 6,152,200 0.2214.10.30Ghana GovernmentInternational Bond15
USD 10.750%Ghana
0.226,152,200Total - Ghana
8,000,000 9,314,702 0.3411.12.24CGNPCInternational Ltd 17EMTN
EUR 1.625%Hong Kong
12,000,000 11,476,920 0.4111.12.27CGNPCInternational Ltd 17
USD 3.750%
11,000,000 11,003,960 0.4031.12.99MCC Holding HongKong Corp Ltd 18FRN
USD 4.950%
1.1531,795,582Total - Hong Kong
5,000,000 5,812,206 0.2101.02.27NTPC Ltd 17 EMTNEUR 2.750%India
3,000,000 2,848,170 0.1018.03.26ICICI BankLtd/Dubai 16 EMTN
USD 4.000%
0.318,660,376Total - India
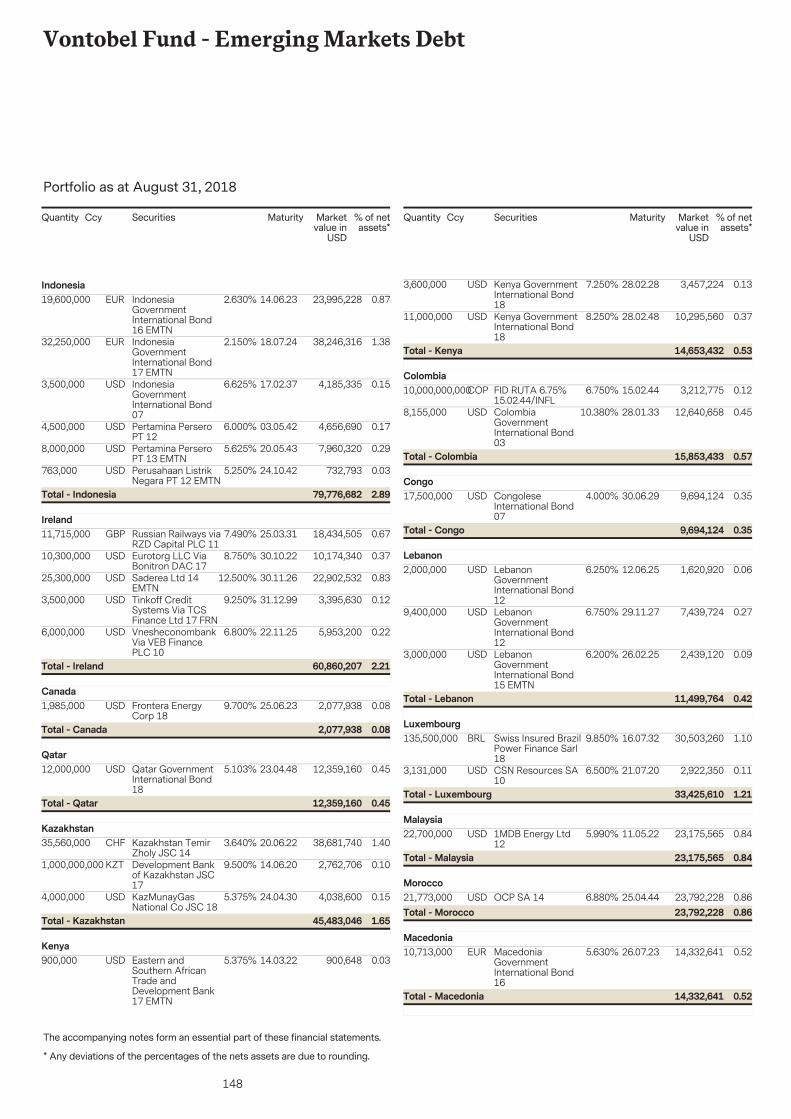
148
Vontobel Fund - Emerging Markets Debt
The accompanying notes form an essential part of these financial statements.
Portfolio as at August 31, 2018
* Any deviations of the percentages of the nets assets are due to rounding.
Securities Marketvalue in
USD
% of netassets*
Quantity Ccy Maturity
19,600,000 23,995,228 0.8714.06.23IndonesiaGovernmentInternational Bond16 EMTN
EUR 2.630%Indonesia
32,250,000 38,246,316 1.3818.07.24IndonesiaGovernmentInternational Bond17 EMTN
EUR 2.150%
3,500,000 4,185,335 0.1517.02.37IndonesiaGovernmentInternational Bond07
USD 6.625%
4,500,000 4,656,690 0.1703.05.42Pertamina PerseroPT 12
USD 6.000%
8,000,000 7,960,320 0.2920.05.43Pertamina PerseroPT 13 EMTN
USD 5.625%
763,000 732,793 0.0324.10.42Perusahaan ListrikNegara PT 12 EMTN
USD 5.250%
2.8979,776,682Total - Indonesia
11,715,000 18,434,505 0.6725.03.31Russian Railways viaRZD Capital PLC 11
GBP 7.490%Ireland
10,300,000 10,174,340 0.3730.10.22Eurotorg LLC ViaBonitron DAC 17
USD 8.750%
25,300,000 22,902,532 0.8330.11.26Saderea Ltd 14EMTN
USD 12.500%
3,500,000 3,395,630 0.1231.12.99Tinkoff CreditSystems Via TCSFinance Ltd 17 FRN
USD 9.250%
6,000,000 5,953,200 0.2222.11.25VnesheconombankVia VEB FinancePLC 10
USD 6.800%
2.2160,860,207Total - Ireland
1,985,000 2,077,938 0.0825.06.23Frontera EnergyCorp 18
USD 9.700%Canada
0.082,077,938Total - Canada
12,000,000 12,359,160 0.4523.04.48Qatar GovernmentInternational Bond18
USD 5.103%Qatar
0.4512,359,160Total - Qatar
35,560,000 38,681,740 1.4020.06.22Kazakhstan TemirZholy JSC 14
CHF 3.640%Kazakhstan
1,000,000,000 2,762,706 0.1014.06.20Development Bankof Kazakhstan JSC17
KZT 9.500%
4,000,000 4,038,600 0.1524.04.30KazMunayGasNational Co JSC 18
USD 5.375%
1.6545,483,046Total - Kazakhstan
900,000 900,648 0.0314.03.22Eastern andSouthern AfricanTrade andDevelopment Bank17 EMTN
USD 5.375%Kenya
Securities Marketvalue in
USD
% of netassets*
Quantity Ccy Maturity
3,600,000 3,457,224 0.1328.02.28Kenya GovernmentInternational Bond18
USD 7.250%
11,000,000 10,295,560 0.3728.02.48Kenya GovernmentInternational Bond18
USD 8.250%
0.5314,653,432Total - Kenya
10,000,000,000 3,212,775 0.1215.02.44FID RUTA 6.75%15.02.44/INFL
COP 6.750%Colombia
8,155,000 12,640,658 0.4528.01.33ColombiaGovernmentInternational Bond03
USD 10.380%
0.5715,853,433Total - Colombia
17,500,000 9,694,124 0.3530.06.29CongoleseInternational Bond07
USD 4.000%Congo
0.359,694,124Total - Congo
2,000,000 1,620,920 0.0612.06.25LebanonGovernmentInternational Bond12
USD 6.250%Lebanon
9,400,000 7,439,724 0.2729.11.27LebanonGovernmentInternational Bond12
USD 6.750%
3,000,000 2,439,120 0.0926.02.25LebanonGovernmentInternational Bond15 EMTN
USD 6.200%
0.4211,499,764Total - Lebanon
135,500,000 30,503,260 1.1016.07.32Swiss Insured BrazilPower Finance Sarl18
BRL 9.850%Luxembourg
3,131,000 2,922,350 0.1121.07.20CSN Resources SA10
USD 6.500%
1.2133,425,610Total - Luxembourg
22,700,000 23,175,565 0.8411.05.221MDB Energy Ltd12
USD 5.990%Malaysia
0.8423,175,565Total - Malaysia
21,773,000 23,792,228 0.8625.04.44OCP SA 14USD 6.880%Morocco
0.8623,792,228Total - Morocco
10,713,000 14,332,641 0.5226.07.23MacedoniaGovernmentInternational Bond16
EUR 5.630%Macedonia
0.5214,332,641Total - Macedonia
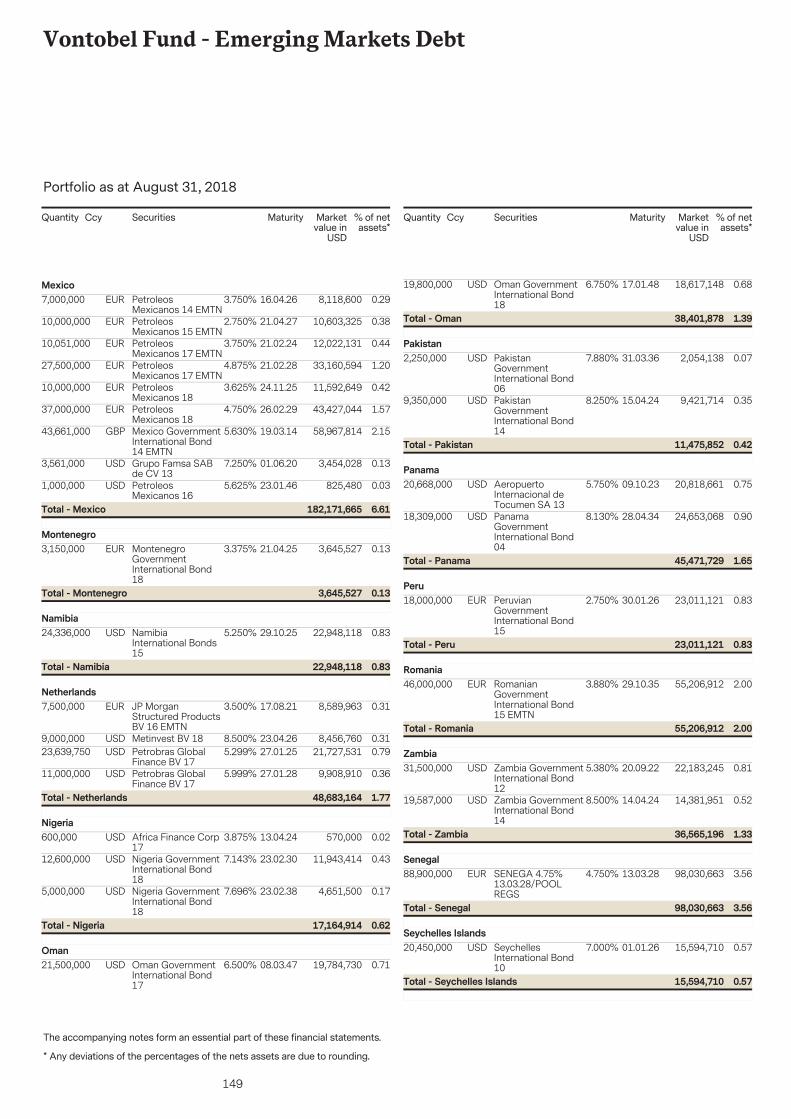
149
Vontobel Fund - Emerging Markets Debt
The accompanying notes form an essential part of these financial statements.
Portfolio as at August 31, 2018
* Any deviations of the percentages of the nets assets are due to rounding.
Securities Marketvalue in
USD
% of netassets*
Quantity Ccy Maturity
7,000,000 8,118,600 0.2916.04.26PetroleosMexicanos 14 EMTN
EUR 3.750%Mexico
10,000,000 10,603,325 0.3821.04.27PetroleosMexicanos 15 EMTN
EUR 2.750%
10,051,000 12,022,131 0.4421.02.24PetroleosMexicanos 17 EMTN
EUR 3.750%
27,500,000 33,160,594 1.2021.02.28PetroleosMexicanos 17 EMTN
EUR 4.875%
10,000,000 11,592,649 0.4224.11.25PetroleosMexicanos 18
EUR 3.625%
37,000,000 43,427,044 1.5726.02.29PetroleosMexicanos 18
EUR 4.750%
43,661,000 58,967,814 2.1519.03.14Mexico GovernmentInternational Bond14 EMTN
GBP 5.630%
3,561,000 3,454,028 0.1301.06.20Grupo Famsa SABde CV 13
USD 7.250%
1,000,000 825,480 0.0323.01.46PetroleosMexicanos 16
USD 5.625%
6.61182,171,665Total - Mexico
3,150,000 3,645,527 0.1321.04.25MontenegroGovernmentInternational Bond18
EUR 3.375%Montenegro
0.133,645,527Total - Montenegro
24,336,000 22,948,118 0.8329.10.25NamibiaInternational Bonds15
USD 5.250%Namibia
0.8322,948,118Total - Namibia
7,500,000 8,589,963 0.3117.08.21JP MorganStructured ProductsBV 16 EMTN
EUR 3.500%Netherlands
9,000,000 8,456,760 0.3123.04.26Metinvest BV 18USD 8.500%23,639,750 21,727,531 0.7927.01.25Petrobras Global
Finance BV 17USD 5.299%
11,000,000 9,908,910 0.3627.01.28Petrobras GlobalFinance BV 17
USD 5.999%
1.7748,683,164Total - Netherlands
600,000 570,000 0.0213.04.24Africa Finance Corp17
USD 3.875%Nigeria
12,600,000 11,943,414 0.4323.02.30Nigeria GovernmentInternational Bond18
USD 7.143%
5,000,000 4,651,500 0.1723.02.38Nigeria GovernmentInternational Bond18
USD 7.696%
0.6217,164,914Total - Nigeria
21,500,000 19,784,730 0.7108.03.47Oman GovernmentInternational Bond17
USD 6.500%Oman
Securities Marketvalue in
USD
% of netassets*
Quantity Ccy Maturity
19,800,000 18,617,148 0.6817.01.48Oman GovernmentInternational Bond18
USD 6.750%
1.3938,401,878Total - Oman
2,250,000 2,054,138 0.0731.03.36PakistanGovernmentInternational Bond06
USD 7.880%Pakistan
9,350,000 9,421,714 0.3515.04.24PakistanGovernmentInternational Bond14
USD 8.250%
0.4211,475,852Total - Pakistan
20,668,000 20,818,661 0.7509.10.23AeropuertoInternacional deTocumen SA 13
USD 5.750%Panama
18,309,000 24,653,068 0.9028.04.34PanamaGovernmentInternational Bond04
USD 8.130%
1.6545,471,729Total - Panama
18,000,000 23,011,121 0.8330.01.26PeruvianGovernmentInternational Bond15
EUR 2.750%Peru
0.8323,011,121Total - Peru
46,000,000 55,206,912 2.0029.10.35RomanianGovernmentInternational Bond15 EMTN
EUR 3.880%Romania
2.0055,206,912Total - Romania
31,500,000 22,183,245 0.8120.09.22Zambia GovernmentInternational Bond12
USD 5.380%Zambia
19,587,000 14,381,951 0.5214.04.24Zambia GovernmentInternational Bond14
USD 8.500%
1.3336,565,196Total - Zambia
88,900,000 98,030,663 3.5613.03.28SENEGA 4.75%13.03.28/POOLREGS
EUR 4.750%Senegal
3.5698,030,663Total - Senegal
20,450,000 15,594,710 0.5701.01.26SeychellesInternational Bond10
USD 7.000%Seychelles Islands
0.5715,594,710Total - Seychelles Islands
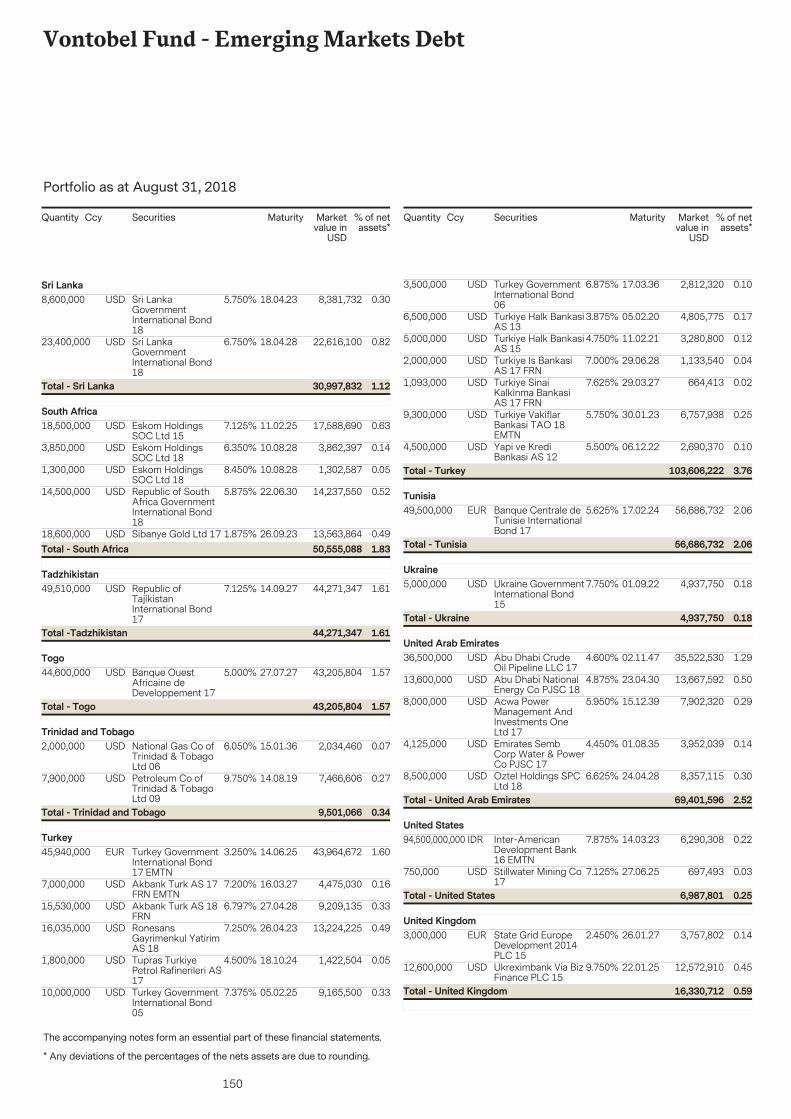
150
Vontobel Fund - Emerging Markets Debt
The accompanying notes form an essential part of these financial statements.
Portfolio as at August 31, 2018
* Any deviations of the percentages of the nets assets are due to rounding.
Securities Marketvalue in
USD
% of netassets*
Quantity Ccy Maturity
8,600,000 8,381,732 0.3018.04.23Sri LankaGovernmentInternational Bond18
USD 5.750%Sri Lanka
23,400,000 22,616,100 0.8218.04.28Sri LankaGovernmentInternational Bond18
USD 6.750%
1.1230,997,832Total - Sri Lanka
18,500,000 17,588,690 0.6311.02.25Eskom HoldingsSOC Ltd 15
USD 7.125%South Africa
3,850,000 3,862,397 0.1410.08.28Eskom HoldingsSOC Ltd 18
USD 6.350%
1,300,000 1,302,587 0.0510.08.28Eskom HoldingsSOC Ltd 18
USD 8.450%
14,500,000 14,237,550 0.5222.06.30Republic of SouthAfrica GovernmentInternational Bond18
USD 5.875%
18,600,000 13,563,864 0.4926.09.23Sibanye Gold Ltd 17USD 1.875%1.8350,555,088Total - South Africa
49,510,000 44,271,347 1.6114.09.27Republic ofTajikistanInternational Bond17
USD 7.125%Tadzhikistan
1.6144,271,347Total -Tadzhikistan
44,600,000 43,205,804 1.5727.07.27Banque OuestAfricaine deDeveloppement 17
USD 5.000%Togo
1.5743,205,804Total - Togo
2,000,000 2,034,460 0.0715.01.36National Gas Co ofTrinidad & TobagoLtd 06
USD 6.050%Trinidad and Tobago
7,900,000 7,466,606 0.2714.08.19Petroleum Co ofTrinidad & TobagoLtd 09
USD 9.750%
0.349,501,066Total - Trinidad and Tobago
45,940,000 43,964,672 1.6014.06.25Turkey GovernmentInternational Bond17 EMTN
EUR 3.250%Turkey
7,000,000 4,475,030 0.1616.03.27Akbank Turk AS 17FRN EMTN
USD 7.200%
15,530,000 9,209,135 0.3327.04.28Akbank Turk AS 18FRN
USD 6.797%
16,035,000 13,224,225 0.4926.04.23RonesansGayrimenkul YatirimAS 18
USD 7.250%
1,800,000 1,422,504 0.0518.10.24Tupras TurkiyePetrol Rafinerileri AS17
USD 4.500%
10,000,000 9,165,500 0.3305.02.25Turkey GovernmentInternational Bond05
USD 7.375%
Securities Marketvalue in
USD
% of netassets*
Quantity Ccy Maturity
3,500,000 2,812,320 0.1017.03.36Turkey GovernmentInternational Bond06
USD 6.875%
6,500,000 4,805,775 0.1705.02.20Turkiye Halk BankasiAS 13
USD 3.875%
5,000,000 3,280,800 0.1211.02.21Turkiye Halk BankasiAS 15
USD 4.750%
2,000,000 1,133,540 0.0429.06.28Turkiye Is BankasiAS 17 FRN
USD 7.000%
1,093,000 664,413 0.0229.03.27Turkiye SinaiKalkinma BankasiAS 17 FRN
USD 7.625%
9,300,000 6,757,938 0.2530.01.23Turkiye VakiflarBankasi TAO 18EMTN
USD 5.750%
4,500,000 2,690,370 0.1006.12.22Yapi ve KrediBankasi AS 12
USD 5.500%
3.76103,606,222Total - Turkey
49,500,000 56,686,732 2.0617.02.24Banque Centrale deTunisie InternationalBond 17
EUR 5.625%Tunisia
2.0656,686,732Total - Tunisia
5,000,000 4,937,750 0.1801.09.22Ukraine GovernmentInternational Bond15
USD 7.750%Ukraine
0.184,937,750Total - Ukraine
36,500,000 35,522,530 1.2902.11.47Abu Dhabi CrudeOil Pipeline LLC 17
USD 4.600%United Arab Emirates
13,600,000 13,667,592 0.5023.04.30Abu Dhabi NationalEnergy Co PJSC 18
USD 4.875%
8,000,000 7,902,320 0.2915.12.39Acwa PowerManagement AndInvestments OneLtd 17
USD 5.950%
4,125,000 3,952,039 0.1401.08.35Emirates SembCorp Water & PowerCo PJSC 17
USD 4.450%
8,500,000 8,357,115 0.3024.04.28Oztel Holdings SPCLtd 18
USD 6.625%
2.5269,401,596Total - United Arab Emirates
94,500,000,000 6,290,308 0.2214.03.23Inter-AmericanDevelopment Bank16 EMTN
IDR 7.875%United States
750,000 697,493 0.0327.06.25Stillwater Mining Co17
USD 7.125%
0.256,987,801Total - United States
3,000,000 3,757,802 0.1426.01.27State Grid EuropeDevelopment 2014PLC 15
EUR 2.450%United Kingdom
12,600,000 12,572,910 0.4522.01.25Ukreximbank Via BizFinance PLC 15
USD 9.750%
0.5916,330,712Total - United Kingdom
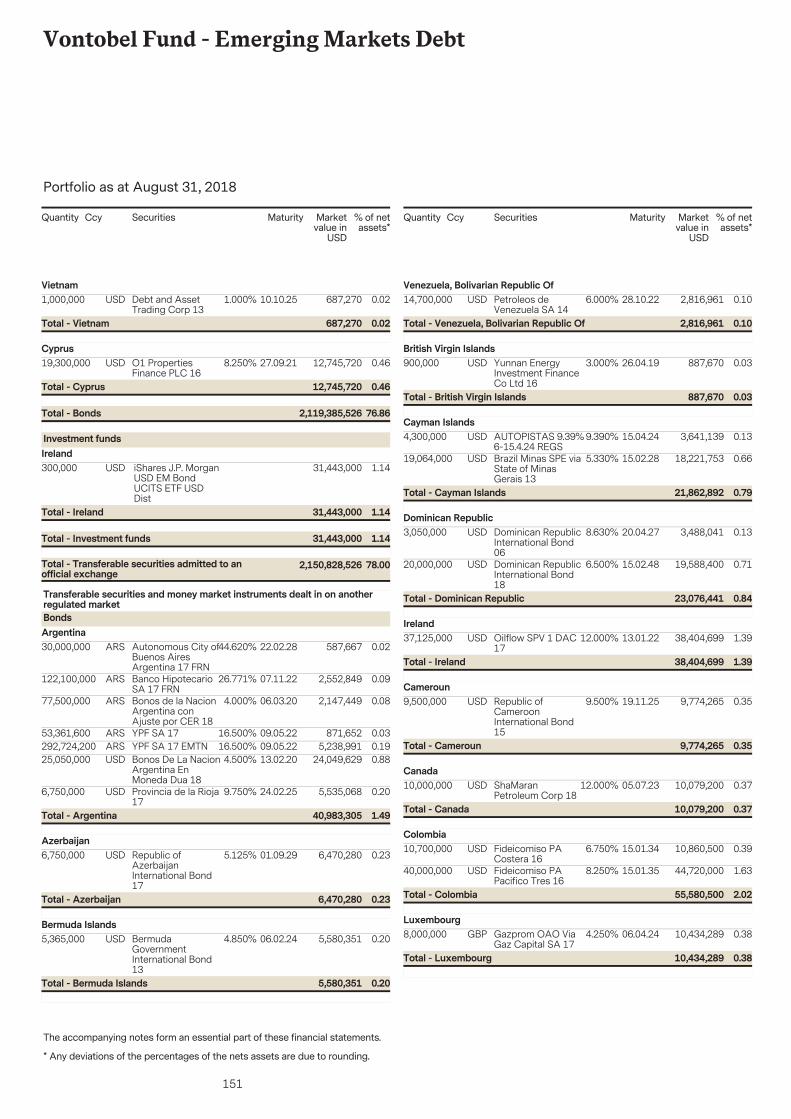
151
Vontobel Fund - Emerging Markets Debt
The accompanying notes form an essential part of these financial statements.
Portfolio as at August 31, 2018
* Any deviations of the percentages of the nets assets are due to rounding.
Securities Marketvalue in
USD
% of netassets*
Quantity Ccy Maturity
1,000,000 687,270 0.0210.10.25Debt and AssetTrading Corp 13
USD 1.000%Vietnam
0.02687,270Total - Vietnam
19,300,000 12,745,720 0.4627.09.21O1 PropertiesFinance PLC 16
USD 8.250%Cyprus
76.862,119,385,526Total - Bonds
0.4612,745,720Total - Cyprus
300,000 31,443,000 1.14iShares J.P. MorganUSD EM BondUCITS ETF USDDist
USD
Investment fundsIreland
78.002,150,828,526Total - Transferable securities admitted to anofficial exchange
1.1431,443,000Total - Investment funds
1.1431,443,000Total - Ireland
30,000,000 587,667 0.0222.02.28Autonomous City ofBuenos AiresArgentina 17 FRN
ARS 44.620%
Transferable securities and money market instruments dealt in on anotherregulated marketBondsArgentina
122,100,000 2,552,849 0.0907.11.22Banco HipotecarioSA 17 FRN
ARS 26.771%
77,500,000 2,147,449 0.0806.03.20Bonos de la NacionArgentina conAjuste por CER 18
ARS 4.000%
53,361,600 871,652 0.0309.05.22YPF SA 17ARS 16.500%292,724,200 5,238,991 0.1909.05.22YPF SA 17 EMTNARS 16.500%25,050,000 24,049,629 0.8813.02.20Bonos De La Nacion
Argentina EnMoneda Dua 18
USD 4.500%
6,750,000 5,535,068 0.2024.02.25Provincia de la Rioja17
USD 9.750%
1.4940,983,305Total - Argentina
6,750,000 6,470,280 0.2301.09.29Republic ofAzerbaijanInternational Bond17
USD 5.125%Azerbaijan
0.236,470,280Total - Azerbaijan
5,365,000 5,580,351 0.2006.02.24BermudaGovernmentInternational Bond13
USD 4.850%Bermuda Islands
0.205,580,351Total - Bermuda Islands
Securities Marketvalue in
USD
% of netassets*
Quantity Ccy Maturity
14,700,000 2,816,961 0.1028.10.22Petroleos deVenezuela SA 14
USD 6.000%Venezuela, Bolivarian Republic Of
0.102,816,961Total - Venezuela, Bolivarian Republic Of
900,000 887,670 0.0326.04.19Yunnan EnergyInvestment FinanceCo Ltd 16
USD 3.000%British Virgin Islands
0.03887,670Total - British Virgin Islands
4,300,000 3,641,139 0.1315.04.24AUTOPISTAS 9.39%6-15.4.24 REGS
USD 9.390%Cayman Islands
19,064,000 18,221,753 0.6615.02.28Brazil Minas SPE viaState of MinasGerais 13
USD 5.330%
0.7921,862,892Total - Cayman Islands
3,050,000 3,488,041 0.1320.04.27Dominican RepublicInternational Bond06
USD 8.630%Dominican Republic
20,000,000 19,588,400 0.7115.02.48Dominican RepublicInternational Bond18
USD 6.500%
0.8423,076,441Total - Dominican Republic
37,125,000 38,404,699 1.3913.01.22Oilflow SPV 1 DAC17
USD 12.000%Ireland
1.3938,404,699Total - Ireland
9,500,000 9,774,265 0.3519.11.25Republic ofCameroonInternational Bond15
USD 9.500%Cameroun
0.359,774,265Total - Cameroun
10,000,000 10,079,200 0.3705.07.23ShaMaranPetroleum Corp 18
USD 12.000%Canada
0.3710,079,200Total - Canada
10,700,000 10,860,500 0.3915.01.34Fideicomiso PACostera 16
USD 6.750%Colombia
40,000,000 44,720,000 1.6315.01.35Fideicomiso PAPacifico Tres 16
USD 8.250%
2.0255,580,500Total - Colombia
8,000,000 10,434,289 0.3806.04.24Gazprom OAO ViaGaz Capital SA 17
GBP 4.250%Luxembourg
0.3810,434,289Total - Luxembourg
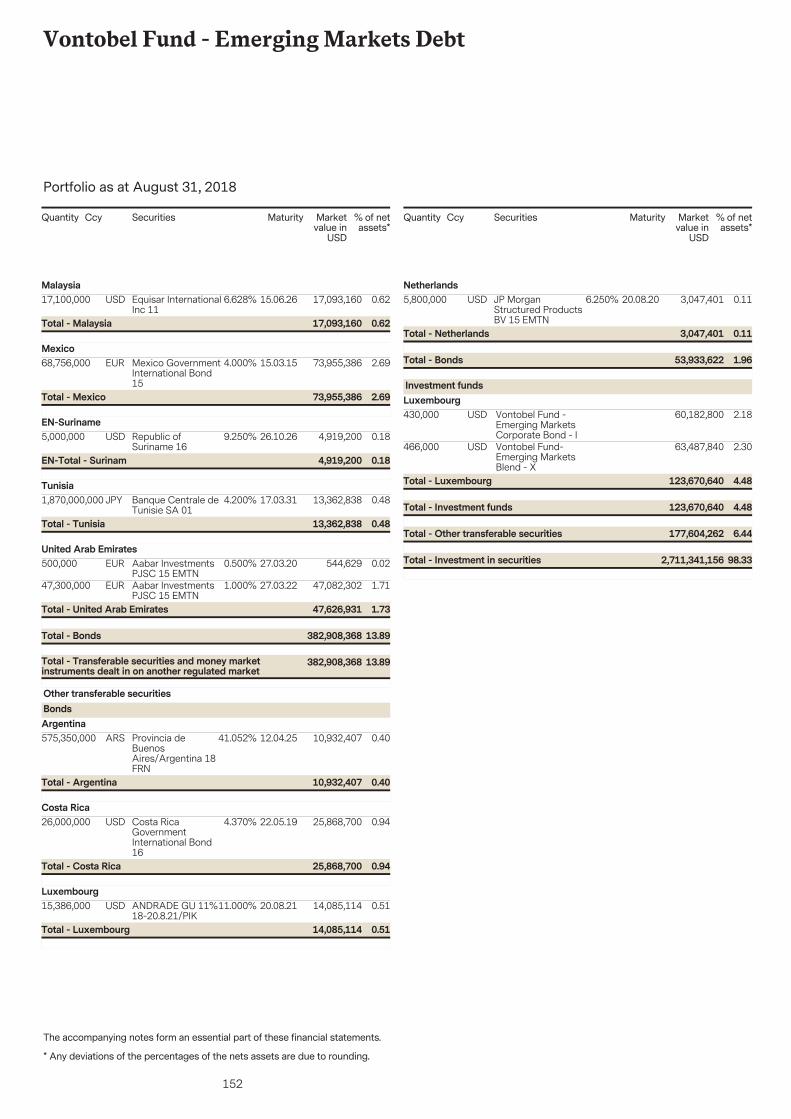
152
Vontobel Fund - Emerging Markets Debt
The accompanying notes form an essential part of these financial statements.
Portfolio as at August 31, 2018
* Any deviations of the percentages of the nets assets are due to rounding.
Securities Marketvalue in
USD
% of netassets*
Quantity Ccy Maturity
17,100,000 17,093,160 0.6215.06.26Equisar InternationalInc 11
USD 6.628%Malaysia
0.6217,093,160Total - Malaysia
68,756,000 73,955,386 2.6915.03.15Mexico GovernmentInternational Bond15
EUR 4.000%Mexico
2.6973,955,386Total - Mexico
5,000,000 4,919,200 0.1826.10.26Republic ofSuriname 16
USD 9.250%EN-Suriname
0.184,919,200EN-Total - Surinam
1,870,000,000 13,362,838 0.4817.03.31Banque Centrale deTunisie SA 01
JPY 4.200%Tunisia
0.4813,362,838Total - Tunisia
500,000 544,629 0.0227.03.20Aabar InvestmentsPJSC 15 EMTN
EUR 0.500%United Arab Emirates
47,300,000 47,082,302 1.7127.03.22Aabar InvestmentsPJSC 15 EMTN
EUR 1.000%
13.89382,908,368Total - Transferable securities and money marketinstruments dealt in on another regulated market
13.89382,908,368Total - Bonds
1.7347,626,931Total - United Arab Emirates
575,350,000 10,932,407 0.4012.04.25Provincia deBuenosAires/Argentina 18FRN
ARS 41.052%
Other transferable securitiesBondsArgentina
0.4010,932,407Total - Argentina
26,000,000 25,868,700 0.9422.05.19Costa RicaGovernmentInternational Bond16
USD 4.370%Costa Rica
0.9425,868,700Total - Costa Rica
15,386,000 14,085,114 0.5120.08.21ANDRADE GU 11%18-20.8.21/PIK
USD 11.000%Luxembourg
0.5114,085,114Total - Luxembourg
Securities Marketvalue in
USD
% of netassets*
Quantity Ccy Maturity
5,800,000 3,047,401 0.1120.08.20JP MorganStructured ProductsBV 15 EMTN
USD 6.250%Netherlands
1.9653,933,622Total - Bonds
0.113,047,401Total - Netherlands
430,000 60,182,800 2.18Vontobel Fund -Emerging MarketsCorporate Bond - I
USD
Investment fundsLuxembourg
466,000 63,487,840 2.30Vontobel Fund-Emerging MarketsBlend - X
USD
6.44177,604,262Total - Other transferable securities
4.48123,670,640Total - Investment funds
4.48123,670,640Total - Luxembourg
98.332,711,341,156Total - Investment in securities
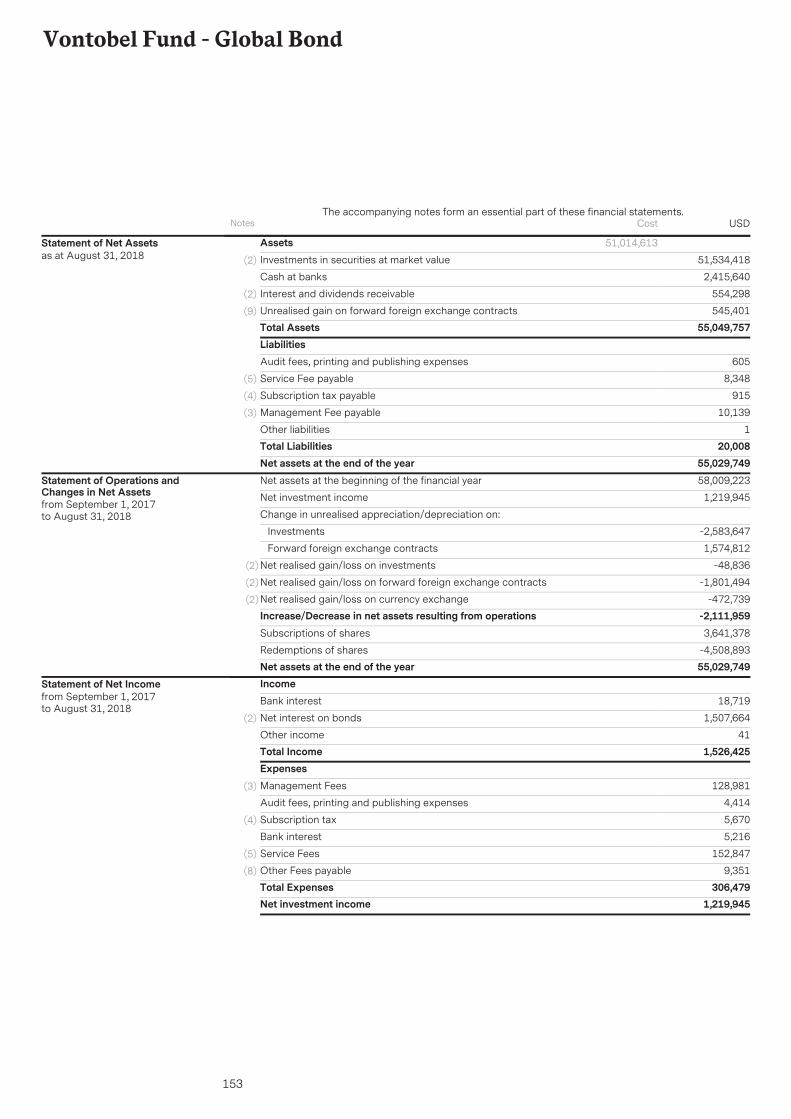
153
Vontobel Fund - Global Bond
AssetsInvestments in securities at market value 51,534,418(2)
2,415,640Cash at banks
554,298Interest and dividends receivable(2)
545,401Unrealised gain on forward foreign exchange contracts(9)
Total Assets 55,049,757
51,014,613Statement of Net Assetsas at August 31, 2018
LiabilitiesAudit fees, printing and publishing expenses 605
Service Fee payable 8,348(5)
Subscription tax payable 915(4)
Management Fee payable 10,139(3)
Other liabilities 1Total Liabilities 20,008Net assets at the end of the year 55,029,749Net assets at the beginning of the financial year 58,009,223
Net investment income 1,219,945
Change in unrealised appreciation/depreciation on:
Investments -2,583,647
Forward foreign exchange contracts 1,574,812
Net realised gain/loss on investments -48,836(2)
Net realised gain/loss on forward foreign exchange contracts -1,801,494(2)
Net realised gain/loss on currency exchange -472,739(2)
Increase/Decrease in net assets resulting from operations -2,111,959Subscriptions of shares 3,641,378
Redemptions of shares -4,508,893Net assets at the end of the year 55,029,749
Statement of Operations andChanges in Net Assetsfrom September 1, 2017to August 31, 2018
IncomeBank interest 18,719
Net interest on bonds 1,507,664(2)
Other income 41Total Income 1,526,425ExpensesManagement Fees 128,981(3)
Audit fees, printing and publishing expenses 4,414
Subscription tax 5,670(4)
Bank interest 5,216
Service Fees 152,847(5)
Other Fees payable 9,351(8)
Total Expenses 306,479Net investment income 1,219,945
Statement of Net Incomefrom September 1, 2017to August 31, 2018
Notes USDThe accompanying notes form an essential part of these financial statements.
Cost
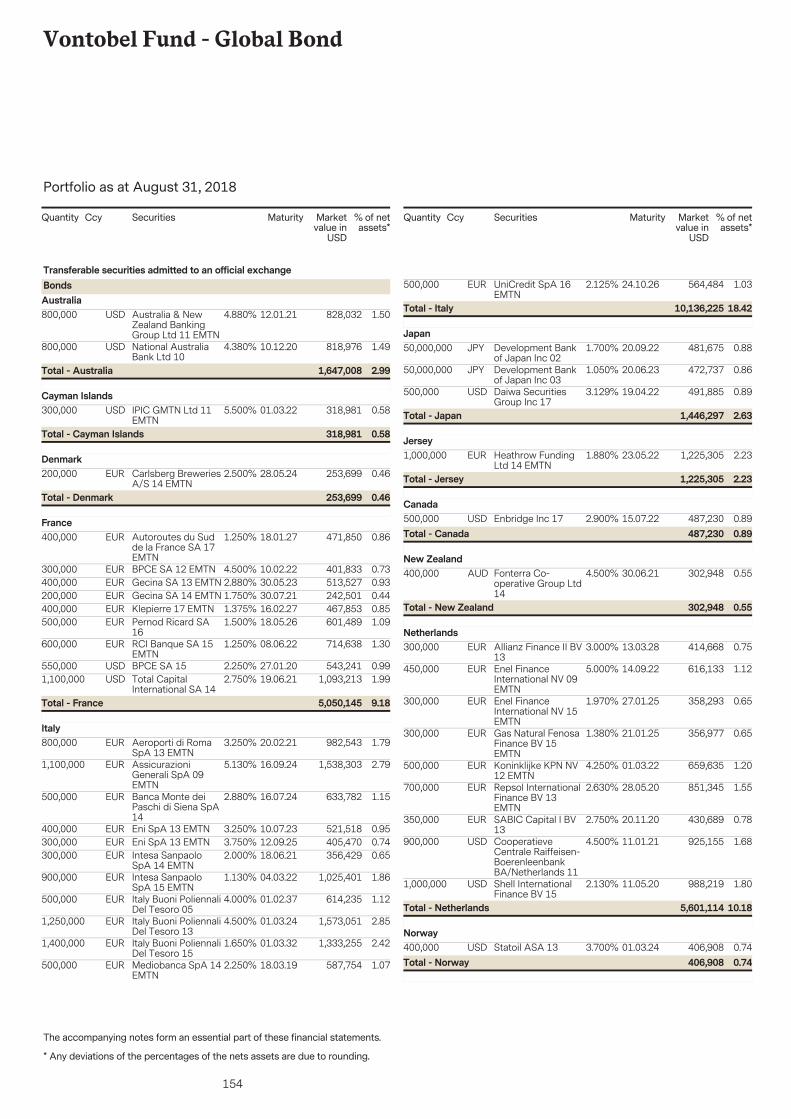
154
Vontobel Fund - Global Bond
The accompanying notes form an essential part of these financial statements.
Portfolio as at August 31, 2018
* Any deviations of the percentages of the nets assets are due to rounding.
Securities Marketvalue in
USD
% of netassets*
Quantity Ccy Maturity
800,000 828,032 1.5012.01.21Australia & NewZealand BankingGroup Ltd 11 EMTN
USD 4.880%
Transferable securities admitted to an official exchangeBondsAustralia
800,000 818,976 1.4910.12.20National AustraliaBank Ltd 10
USD 4.380%
2.991,647,008Total - Australia
300,000 318,981 0.5801.03.22IPIC GMTN Ltd 11EMTN
USD 5.500%Cayman Islands
0.58318,981Total - Cayman Islands
200,000 253,699 0.4628.05.24Carlsberg BreweriesA/S 14 EMTN
EUR 2.500%Denmark
0.46253,699Total - Denmark
400,000 471,850 0.8618.01.27Autoroutes du Sudde la France SA 17EMTN
EUR 1.250%France
300,000 401,833 0.7310.02.22BPCE SA 12 EMTNEUR 4.500%400,000 513,527 0.9330.05.23Gecina SA 13 EMTNEUR 2.880%200,000 242,501 0.4430.07.21Gecina SA 14 EMTNEUR 1.750%400,000 467,853 0.8516.02.27Klepierre 17 EMTNEUR 1.375%500,000 601,489 1.0918.05.26Pernod Ricard SA
16EUR 1.500%
600,000 714,638 1.3008.06.22RCI Banque SA 15EMTN
EUR 1.250%
550,000 543,241 0.9927.01.20BPCE SA 15USD 2.250%1,100,000 1,093,213 1.9919.06.21Total Capital
International SA 14USD 2.750%
9.185,050,145Total - France
800,000 982,543 1.7920.02.21Aeroporti di RomaSpA 13 EMTN
EUR 3.250%Italy
1,100,000 1,538,303 2.7916.09.24AssicurazioniGenerali SpA 09EMTN
EUR 5.130%
500,000 633,782 1.1516.07.24Banca Monte deiPaschi di Siena SpA14
EUR 2.880%
400,000 521,518 0.9510.07.23Eni SpA 13 EMTNEUR 3.250%300,000 405,470 0.7412.09.25Eni SpA 13 EMTNEUR 3.750%300,000 356,429 0.6518.06.21Intesa Sanpaolo
SpA 14 EMTNEUR 2.000%
900,000 1,025,401 1.8604.03.22Intesa SanpaoloSpA 15 EMTN
EUR 1.130%
500,000 614,235 1.1201.02.37Italy Buoni PoliennaliDel Tesoro 05
EUR 4.000%
1,250,000 1,573,051 2.8501.03.24Italy Buoni PoliennaliDel Tesoro 13
EUR 4.500%
1,400,000 1,333,255 2.4201.03.32Italy Buoni PoliennaliDel Tesoro 15
EUR 1.650%
500,000 587,754 1.0718.03.19Mediobanca SpA 14EMTN
EUR 2.250%
Securities Marketvalue in
USD
% of netassets*
Quantity Ccy Maturity
500,000 564,484 1.0324.10.26UniCredit SpA 16EMTN
EUR 2.125%
18.4210,136,225Total - Italy
50,000,000 481,675 0.8820.09.22Development Bankof Japan Inc 02
JPY 1.700%Japan
50,000,000 472,737 0.8620.06.23Development Bankof Japan Inc 03
JPY 1.050%
500,000 491,885 0.8919.04.22Daiwa SecuritiesGroup Inc 17
USD 3.129%
2.631,446,297Total - Japan
1,000,000 1,225,305 2.2323.05.22Heathrow FundingLtd 14 EMTN
EUR 1.880%Jersey
2.231,225,305Total - Jersey
500,000 487,230 0.8915.07.22Enbridge Inc 17USD 2.900%Canada
0.89487,230Total - Canada
400,000 302,948 0.5530.06.21Fonterra Co-operative Group Ltd14
AUD 4.500%New Zealand
0.55302,948Total - New Zealand
300,000 414,668 0.7513.03.28Allianz Finance II BV13
EUR 3.000%Netherlands
450,000 616,133 1.1214.09.22Enel FinanceInternational NV 09EMTN
EUR 5.000%
300,000 358,293 0.6527.01.25Enel FinanceInternational NV 15EMTN
EUR 1.970%
300,000 356,977 0.6521.01.25Gas Natural FenosaFinance BV 15EMTN
EUR 1.380%
500,000 659,635 1.2001.03.22Koninklijke KPN NV12 EMTN
EUR 4.250%
700,000 851,345 1.5528.05.20Repsol InternationalFinance BV 13EMTN
EUR 2.630%
350,000 430,689 0.7820.11.20SABIC Capital I BV13
EUR 2.750%
900,000 925,155 1.6811.01.21CooperatieveCentrale Raiffeisen-BoerenleenbankBA/Netherlands 11
USD 4.500%
1,000,000 988,219 1.8011.05.20Shell InternationalFinance BV 15
USD 2.130%
10.185,601,114Total - Netherlands
400,000 406,908 0.7401.03.24Statoil ASA 13USD 3.700%Norway
0.74406,908Total - Norway
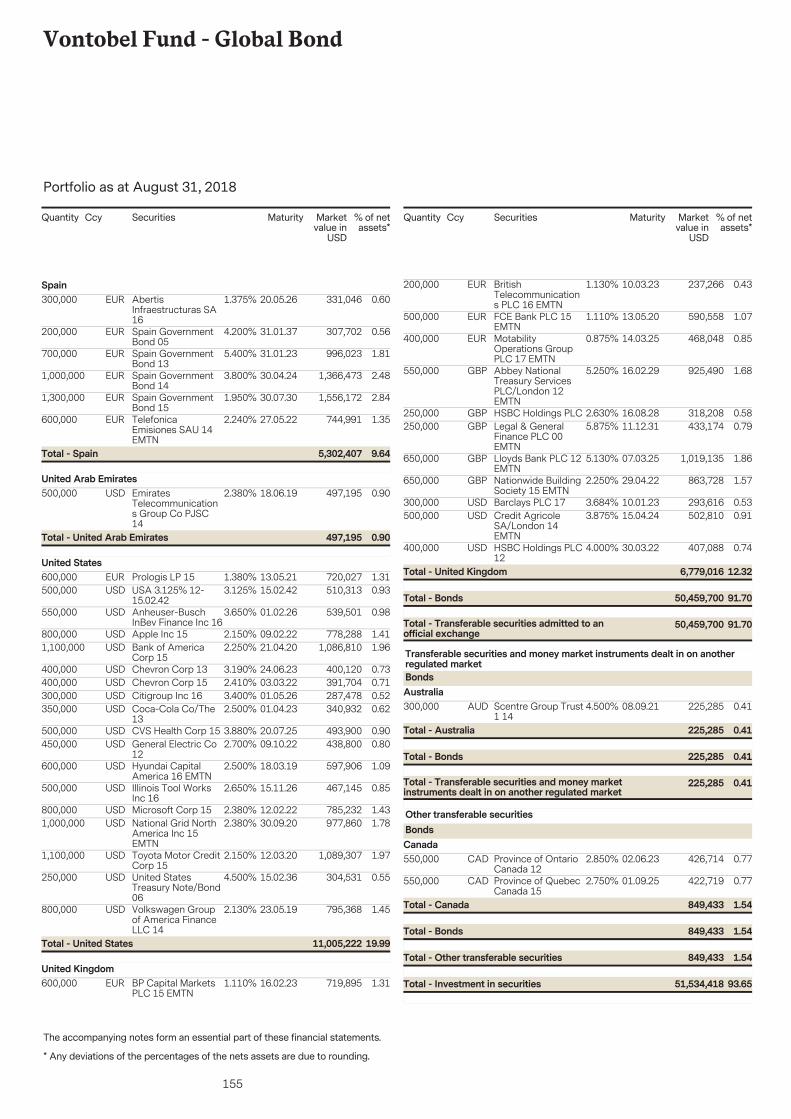
155
Vontobel Fund - Global Bond
The accompanying notes form an essential part of these financial statements.
Portfolio as at August 31, 2018
* Any deviations of the percentages of the nets assets are due to rounding.
Securities Marketvalue in
USD
% of netassets*
Quantity Ccy Maturity
300,000 331,046 0.6020.05.26AbertisInfraestructuras SA16
EUR 1.375%Spain
200,000 307,702 0.5631.01.37Spain GovernmentBond 05
EUR 4.200%
700,000 996,023 1.8131.01.23Spain GovernmentBond 13
EUR 5.400%
1,000,000 1,366,473 2.4830.04.24Spain GovernmentBond 14
EUR 3.800%
1,300,000 1,556,172 2.8430.07.30Spain GovernmentBond 15
EUR 1.950%
600,000 744,991 1.3527.05.22TelefonicaEmisiones SAU 14EMTN
EUR 2.240%
9.645,302,407Total - Spain
500,000 497,195 0.9018.06.19EmiratesTelecommunications Group Co PJSC14
USD 2.380%United Arab Emirates
0.90497,195Total - United Arab Emirates
600,000 720,027 1.3113.05.21Prologis LP 15EUR 1.380%United States
500,000 510,313 0.9315.02.42USA 3.125% 12-15.02.42
USD 3.125%
550,000 539,501 0.9801.02.26Anheuser-BuschInBev Finance Inc 16
USD 3.650%
800,000 778,288 1.4109.02.22Apple Inc 15USD 2.150%1,100,000 1,086,810 1.9621.04.20Bank of America
Corp 15USD 2.250%
400,000 400,120 0.7324.06.23Chevron Corp 13USD 3.190%400,000 391,704 0.7103.03.22Chevron Corp 15USD 2.410%300,000 287,478 0.5201.05.26Citigroup Inc 16USD 3.400%350,000 340,932 0.6201.04.23Coca-Cola Co/The
13USD 2.500%
500,000 493,900 0.9020.07.25CVS Health Corp 15USD 3.880%450,000 438,800 0.8009.10.22General Electric Co
12USD 2.700%
600,000 597,906 1.0918.03.19Hyundai CapitalAmerica 16 EMTN
USD 2.500%
500,000 467,145 0.8515.11.26Illinois Tool WorksInc 16
USD 2.650%
800,000 785,232 1.4312.02.22Microsoft Corp 15USD 2.380%1,000,000 977,860 1.7830.09.20National Grid North
America Inc 15EMTN
USD 2.380%
1,100,000 1,089,307 1.9712.03.20Toyota Motor CreditCorp 15
USD 2.150%
250,000 304,531 0.5515.02.36United StatesTreasury Note/Bond06
USD 4.500%
800,000 795,368 1.4523.05.19Volkswagen Groupof America FinanceLLC 14
USD 2.130%
19.9911,005,222Total - United States
600,000 719,895 1.3116.02.23BP Capital MarketsPLC 15 EMTN
EUR 1.110%United Kingdom
Securities Marketvalue in
USD
% of netassets*
Quantity Ccy Maturity
200,000 237,266 0.4310.03.23BritishTelecommunications PLC 16 EMTN
EUR 1.130%
500,000 590,558 1.0713.05.20FCE Bank PLC 15EMTN
EUR 1.110%
400,000 468,048 0.8514.03.25MotabilityOperations GroupPLC 17 EMTN
EUR 0.875%
550,000 925,490 1.6816.02.29Abbey NationalTreasury ServicesPLC/London 12EMTN
GBP 5.250%
250,000 318,208 0.5816.08.28HSBC Holdings PLCGBP 2.630%250,000 433,174 0.7911.12.31Legal & General
Finance PLC 00EMTN
GBP 5.875%
650,000 1,019,135 1.8607.03.25Lloyds Bank PLC 12EMTN
GBP 5.130%
650,000 863,728 1.5729.04.22Nationwide BuildingSociety 15 EMTN
GBP 2.250%
300,000 293,616 0.5310.01.23Barclays PLC 17USD 3.684%500,000 502,810 0.9115.04.24Credit Agricole
SA/London 14EMTN
USD 3.875%
400,000 407,088 0.7430.03.22HSBC Holdings PLC12
USD 4.000%
91.7050,459,700Total - Transferable securities admitted to anofficial exchange
91.7050,459,700Total - Bonds
12.326,779,016Total - United Kingdom
300,000 225,285 0.4108.09.21Scentre Group Trust1 14
AUD 4.500%
Transferable securities and money market instruments dealt in on anotherregulated marketBondsAustralia
0.41225,285Total - Transferable securities and money marketinstruments dealt in on another regulated market
0.41225,285Total - Bonds
0.41225,285Total - Australia
550,000 426,714 0.7702.06.23Province of OntarioCanada 12
CAD 2.850%
Other transferable securitiesBondsCanada
550,000 422,719 0.7701.09.25Province of QuebecCanada 15
CAD 2.750%
1.54849,433Total - Other transferable securities
1.54849,433Total - Bonds
1.54849,433Total - Canada
93.6551,534,418Total - Investment in securities
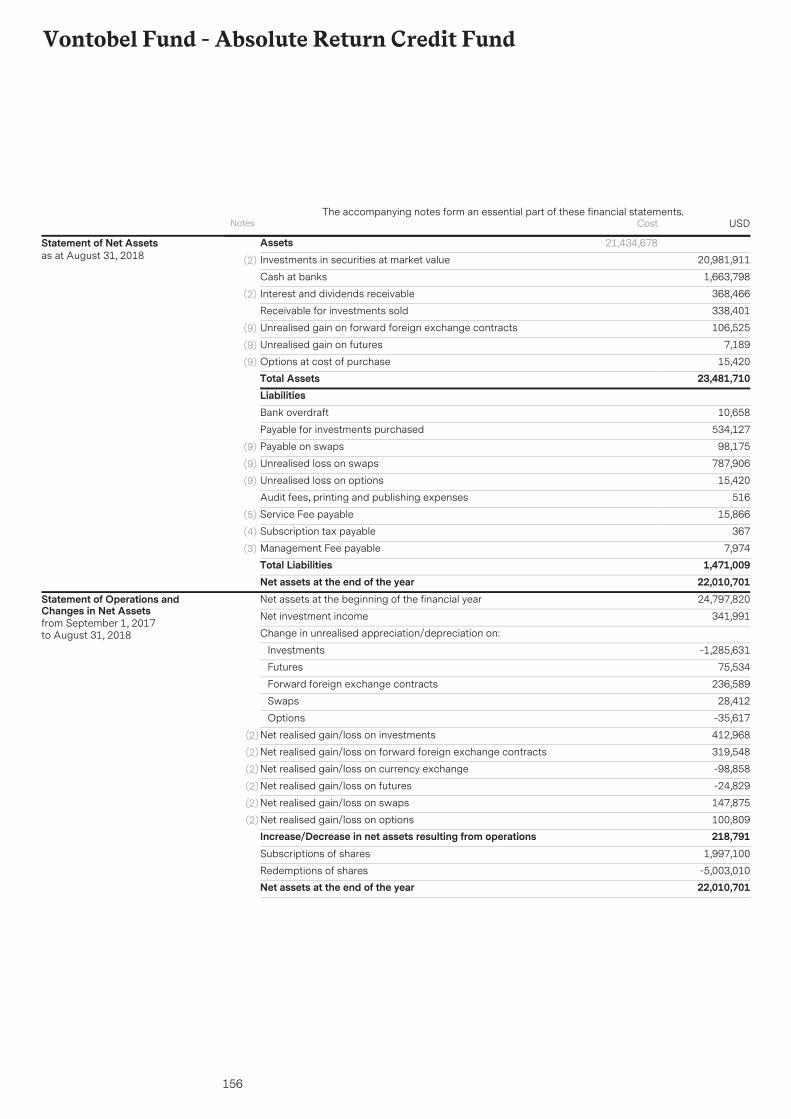
156
Vontobel Fund - Absolute Return Credit Fund
AssetsInvestments in securities at market value 20,981,911(2)
1,663,798Cash at banks
368,466Interest and dividends receivable(2)
338,401Receivable for investments sold
106,525Unrealised gain on forward foreign exchange contracts(9)
7,189Unrealised gain on futures(9)
15,420Options at cost of purchase(9)
Total Assets 23,481,710
21,434,678Statement of Net Assetsas at August 31, 2018
LiabilitiesBank overdraft 10,658
Payable for investments purchased 534,127
Payable on swaps 98,175(9)
Unrealised loss on swaps 787,906(9)
Unrealised loss on options 15,420(9)
Audit fees, printing and publishing expenses 516
Service Fee payable 15,866(5)
Subscription tax payable 367(4)
Management Fee payable 7,974(3)
Total Liabilities 1,471,009Net assets at the end of the year 22,010,701Net assets at the beginning of the financial year 24,797,820
Net investment income 341,991
Change in unrealised appreciation/depreciation on:
Investments -1,285,631
Futures 75,534
Forward foreign exchange contracts 236,589
Swaps 28,412
Options -35,617
Net realised gain/loss on investments 412,968(2)
Net realised gain/loss on forward foreign exchange contracts 319,548(2)
Net realised gain/loss on currency exchange -98,858(2)
Net realised gain/loss on futures -24,829(2)
Net realised gain/loss on swaps 147,875(2)
Net realised gain/loss on options 100,809(2)
Increase/Decrease in net assets resulting from operations 218,791Subscriptions of shares 1,997,100
Redemptions of shares -5,003,010Net assets at the end of the year 22,010,701
Statement of Operations andChanges in Net Assetsfrom September 1, 2017to August 31, 2018
Notes USDThe accompanying notes form an essential part of these financial statements.
Cost
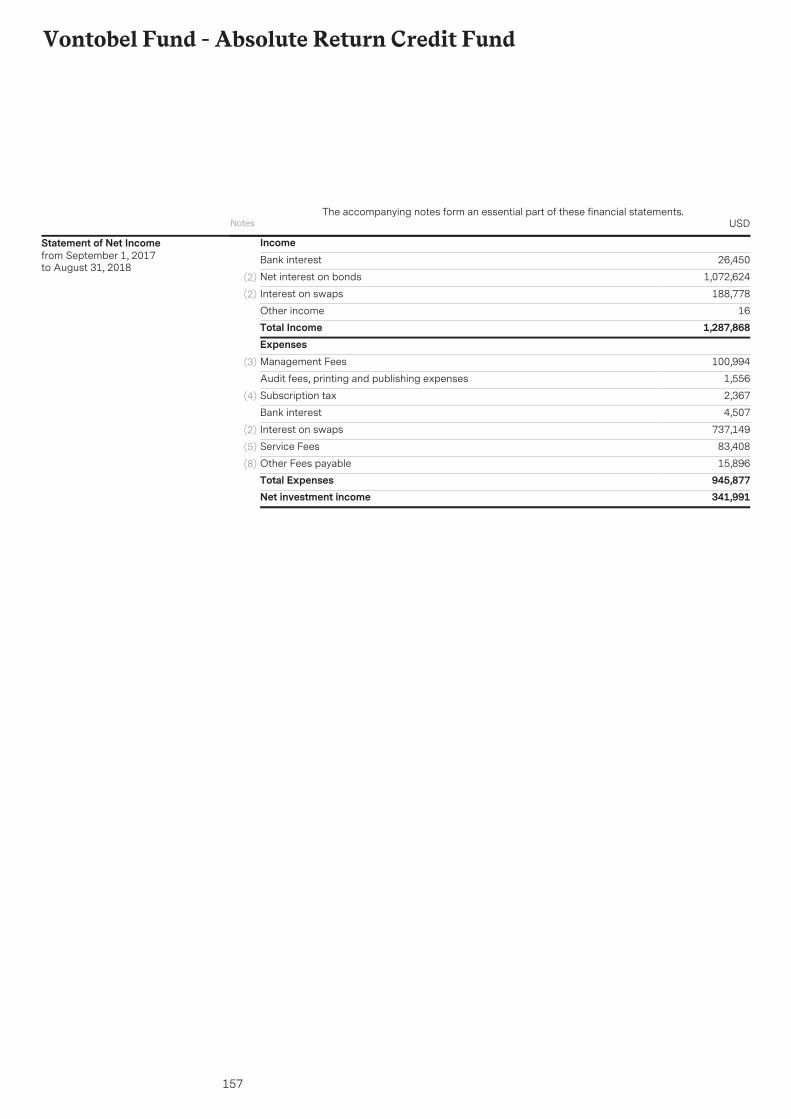
157
Vontobel Fund - Absolute Return Credit Fund
IncomeBank interest 26,450
Net interest on bonds 1,072,624(2)
Interest on swaps 188,778(2)
Other income 16Total Income 1,287,868ExpensesManagement Fees 100,994(3)
Audit fees, printing and publishing expenses 1,556
Subscription tax 2,367(4)
Bank interest 4,507
Interest on swaps 737,149(2)
Service Fees 83,408(5)
Other Fees payable 15,896(8)
Total Expenses 945,877Net investment income 341,991
Statement of Net Incomefrom September 1, 2017to August 31, 2018
Notes USDThe accompanying notes form an essential part of these financial statements.
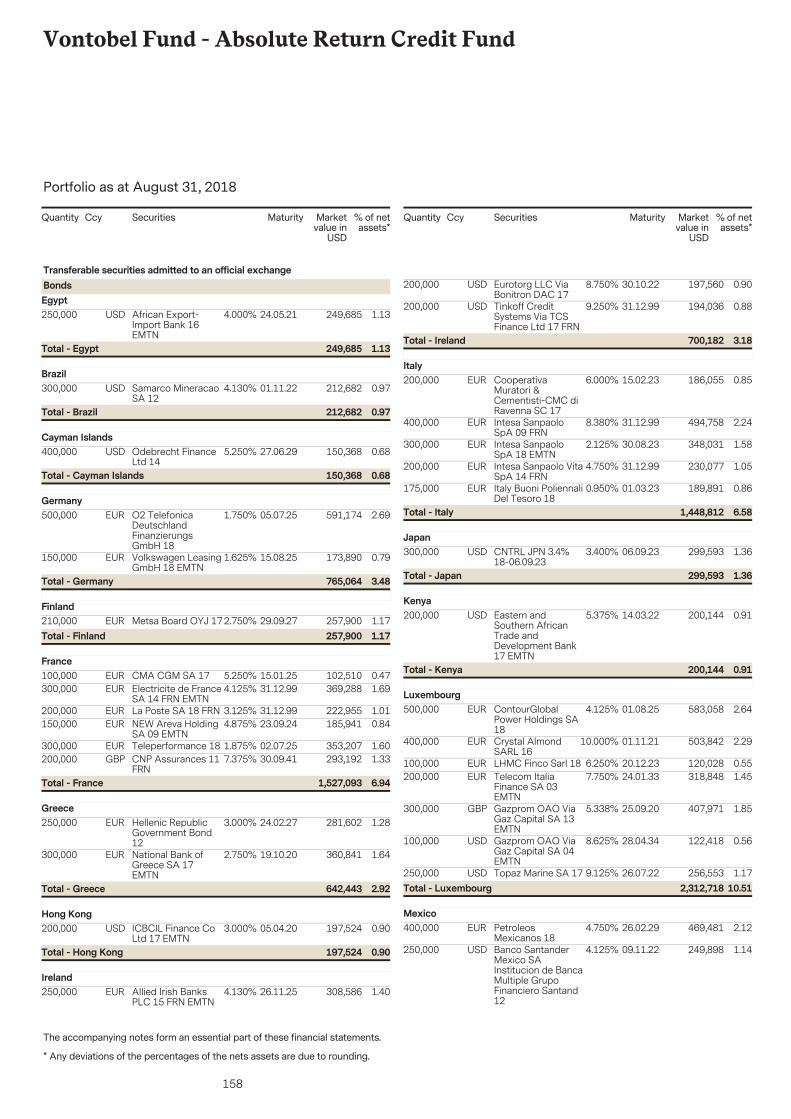
158
Vontobel Fund - Absolute Return Credit Fund
The accompanying notes form an essential part of these financial statements.
Portfolio as at August 31, 2018
* Any deviations of the percentages of the nets assets are due to rounding.
Securities Marketvalue in
USD
% of netassets*
Quantity Ccy Maturity
250,000 249,685 1.1324.05.21African Export-Import Bank 16EMTN
USD 4.000%
Transferable securities admitted to an official exchangeBondsEgypt
1.13249,685Total - Egypt
300,000 212,682 0.9701.11.22Samarco MineracaoSA 12
USD 4.130%Brazil
0.97212,682Total - Brazil
400,000 150,368 0.6827.06.29Odebrecht FinanceLtd 14
USD 5.250%Cayman Islands
0.68150,368Total - Cayman Islands
500,000 591,174 2.6905.07.25O2 TelefonicaDeutschlandFinanzierungsGmbH 18
EUR 1.750%Germany
150,000 173,890 0.7915.08.25Volkswagen LeasingGmbH 18 EMTN
EUR 1.625%
3.48765,064Total - Germany
210,000 257,900 1.1729.09.27Metsa Board OYJ 17EUR 2.750%Finland
1.17257,900Total - Finland
100,000 102,510 0.4715.01.25CMA CGM SA 17EUR 5.250%France
300,000 369,288 1.6931.12.99Electricite de FranceSA 14 FRN EMTN
EUR 4.125%
200,000 222,955 1.0131.12.99La Poste SA 18 FRNEUR 3.125%150,000 185,941 0.8423.09.24NEW Areva Holding
SA 09 EMTNEUR 4.875%
300,000 353,207 1.6002.07.25Teleperformance 18EUR 1.875%200,000 293,192 1.3330.09.41CNP Assurances 11
FRNGBP 7.375%
6.941,527,093Total - France
250,000 281,602 1.2824.02.27Hellenic RepublicGovernment Bond12
EUR 3.000%Greece
300,000 360,841 1.6419.10.20National Bank ofGreece SA 17EMTN
EUR 2.750%
2.92642,443Total - Greece
200,000 197,524 0.9005.04.20ICBCIL Finance CoLtd 17 EMTN
USD 3.000%Hong Kong
0.90197,524Total - Hong Kong
250,000 308,586 1.4026.11.25Allied Irish BanksPLC 15 FRN EMTN
EUR 4.130%Ireland
Securities Marketvalue in
USD
% of netassets*
Quantity Ccy Maturity
200,000 197,560 0.9030.10.22Eurotorg LLC ViaBonitron DAC 17
USD 8.750%
200,000 194,036 0.8831.12.99Tinkoff CreditSystems Via TCSFinance Ltd 17 FRN
USD 9.250%
3.18700,182Total - Ireland
200,000 186,055 0.8515.02.23CooperativaMuratori &Cementisti-CMC diRavenna SC 17
EUR 6.000%Italy
400,000 494,758 2.2431.12.99Intesa SanpaoloSpA 09 FRN
EUR 8.380%
300,000 348,031 1.5830.08.23Intesa SanpaoloSpA 18 EMTN
EUR 2.125%
200,000 230,077 1.0531.12.99Intesa Sanpaolo VitaSpA 14 FRN
EUR 4.750%
175,000 189,891 0.8601.03.23Italy Buoni PoliennaliDel Tesoro 18
EUR 0.950%
6.581,448,812Total - Italy
300,000 299,593 1.3606.09.23CNTRL JPN 3.4%18-06.09.23
USD 3.400%Japan
1.36299,593Total - Japan
200,000 200,144 0.9114.03.22Eastern andSouthern AfricanTrade andDevelopment Bank17 EMTN
USD 5.375%Kenya
0.91200,144Total - Kenya
500,000 583,058 2.6401.08.25ContourGlobalPower Holdings SA18
EUR 4.125%Luxembourg
400,000 503,842 2.2901.11.21Crystal AlmondSARL 16
EUR 10.000%
100,000 120,028 0.5520.12.23LHMC Finco Sarl 18EUR 6.250%200,000 318,848 1.4524.01.33Telecom Italia
Finance SA 03EMTN
EUR 7.750%
300,000 407,971 1.8525.09.20Gazprom OAO ViaGaz Capital SA 13EMTN
GBP 5.338%
100,000 122,418 0.5628.04.34Gazprom OAO ViaGaz Capital SA 04EMTN
USD 8.625%
250,000 256,553 1.1726.07.22Topaz Marine SA 17USD 9.125%10.512,312,718Total - Luxembourg
400,000 469,481 2.1226.02.29PetroleosMexicanos 18
EUR 4.750%Mexico
250,000 249,898 1.1409.11.22Banco SantanderMexico SAInstitucion de BancaMultiple GrupoFinanciero Santand12
USD 4.125%
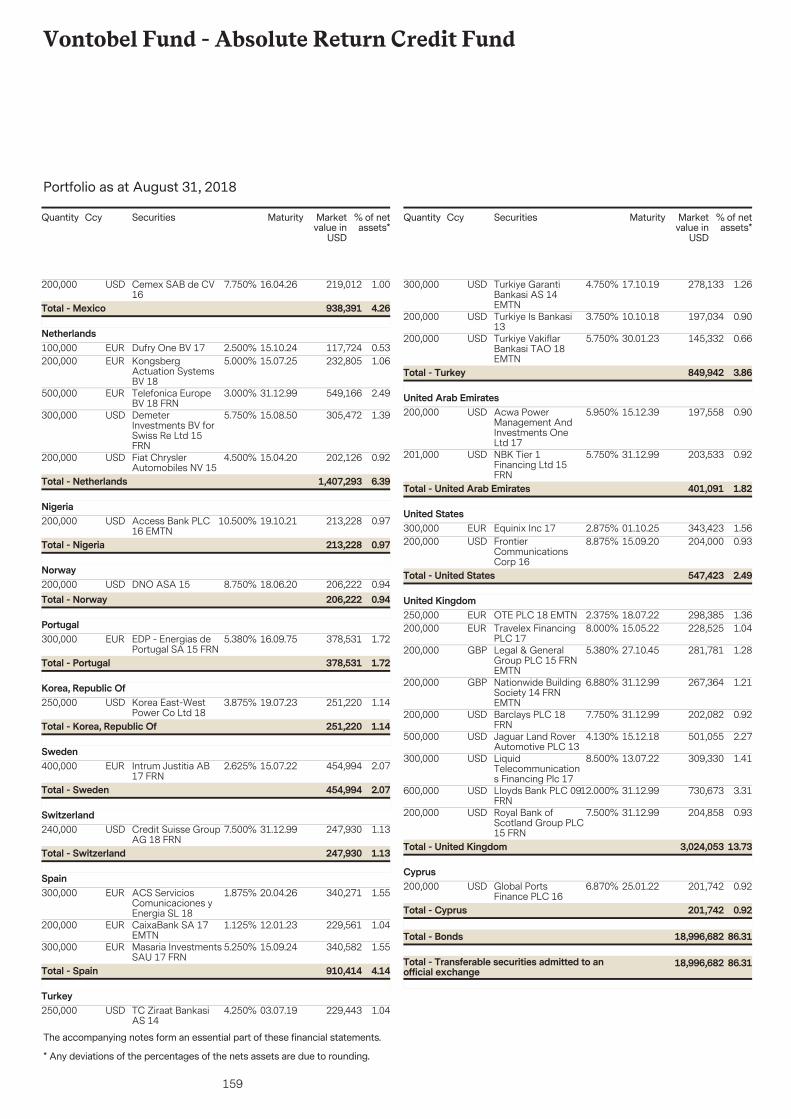
159
Vontobel Fund - Absolute Return Credit Fund
The accompanying notes form an essential part of these financial statements.
Portfolio as at August 31, 2018
* Any deviations of the percentages of the nets assets are due to rounding.
Securities Marketvalue in
USD
% of netassets*
Quantity Ccy Maturity
200,000 219,012 1.0016.04.26Cemex SAB de CV16
USD 7.750%
4.26938,391Total - Mexico
100,000 117,724 0.5315.10.24Dufry One BV 17EUR 2.500%Netherlands
200,000 232,805 1.0615.07.25KongsbergActuation SystemsBV 18
EUR 5.000%
500,000 549,166 2.4931.12.99Telefonica EuropeBV 18 FRN
EUR 3.000%
300,000 305,472 1.3915.08.50DemeterInvestments BV forSwiss Re Ltd 15FRN
USD 5.750%
200,000 202,126 0.9215.04.20Fiat ChryslerAutomobiles NV 15
USD 4.500%
6.391,407,293Total - Netherlands
200,000 213,228 0.9719.10.21Access Bank PLC16 EMTN
USD 10.500%Nigeria
0.97213,228Total - Nigeria
200,000 206,222 0.9418.06.20DNO ASA 15USD 8.750%Norway
0.94206,222Total - Norway
300,000 378,531 1.7216.09.75EDP - Energias dePortugal SA 15 FRN
EUR 5.380%Portugal
1.72378,531Total - Portugal
250,000 251,220 1.1419.07.23Korea East-WestPower Co Ltd 18
USD 3.875%Korea, Republic Of
1.14251,220Total - Korea, Republic Of
400,000 454,994 2.0715.07.22Intrum Justitia AB17 FRN
EUR 2.625%Sweden
2.07454,994Total - Sweden
240,000 247,930 1.1331.12.99Credit Suisse GroupAG 18 FRN
USD 7.500%Switzerland
1.13247,930Total - Switzerland
300,000 340,271 1.5520.04.26ACS ServiciosComunicaciones yEnergia SL 18
EUR 1.875%Spain
200,000 229,561 1.0412.01.23CaixaBank SA 17EMTN
EUR 1.125%
300,000 340,582 1.5515.09.24Masaria InvestmentsSAU 17 FRN
EUR 5.250%
4.14910,414Total - Spain
250,000 229,443 1.0403.07.19TC Ziraat BankasiAS 14
USD 4.250%Turkey
Securities Marketvalue in
USD
% of netassets*
Quantity Ccy Maturity
300,000 278,133 1.2617.10.19Turkiye GarantiBankasi AS 14EMTN
USD 4.750%
200,000 197,034 0.9010.10.18Turkiye Is Bankasi13
USD 3.750%
200,000 145,332 0.6630.01.23Turkiye VakiflarBankasi TAO 18EMTN
USD 5.750%
3.86849,942Total - Turkey
200,000 197,558 0.9015.12.39Acwa PowerManagement AndInvestments OneLtd 17
USD 5.950%United Arab Emirates
201,000 203,533 0.9231.12.99NBK Tier 1Financing Ltd 15FRN
USD 5.750%
1.82401,091Total - United Arab Emirates
300,000 343,423 1.5601.10.25Equinix Inc 17EUR 2.875%United States
200,000 204,000 0.9315.09.20FrontierCommunicationsCorp 16
USD 8.875%
2.49547,423Total - United States
250,000 298,385 1.3618.07.22OTE PLC 18 EMTNEUR 2.375%United Kingdom
200,000 228,525 1.0415.05.22Travelex FinancingPLC 17
EUR 8.000%
200,000 281,781 1.2827.10.45Legal & GeneralGroup PLC 15 FRNEMTN
GBP 5.380%
200,000 267,364 1.2131.12.99Nationwide BuildingSociety 14 FRNEMTN
GBP 6.880%
200,000 202,082 0.9231.12.99Barclays PLC 18FRN
USD 7.750%
500,000 501,055 2.2715.12.18Jaguar Land RoverAutomotive PLC 13
USD 4.130%
300,000 309,330 1.4113.07.22LiquidTelecommunications Financing Plc 17
USD 8.500%
600,000 730,673 3.3131.12.99Lloyds Bank PLC 09FRN
USD 12.000%
200,000 204,858 0.9331.12.99Royal Bank ofScotland Group PLC15 FRN
USD 7.500%
13.733,024,053Total - United Kingdom
200,000 201,742 0.9225.01.22Global PortsFinance PLC 16
USD 6.870%Cyprus
86.3118,996,682Total - Transferable securities admitted to anofficial exchange
86.3118,996,682Total - Bonds
0.92201,742Total - Cyprus
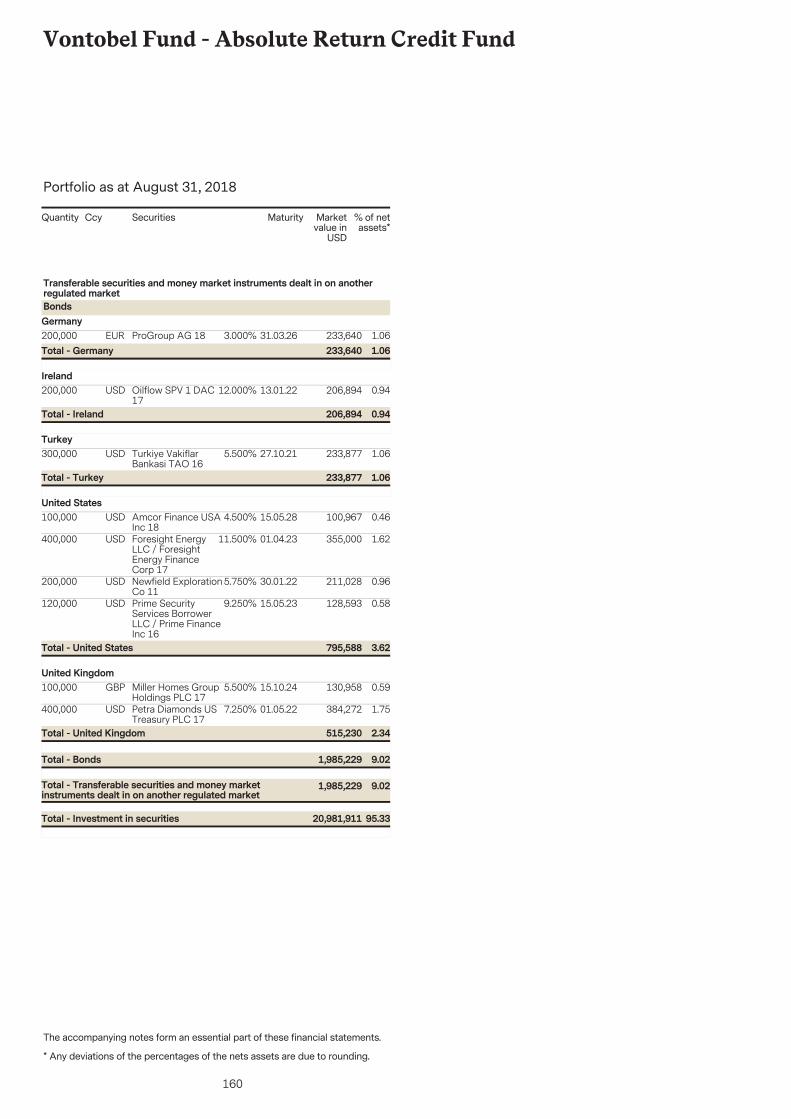
160
Vontobel Fund - Absolute Return Credit Fund
The accompanying notes form an essential part of these financial statements.
Portfolio as at August 31, 2018
* Any deviations of the percentages of the nets assets are due to rounding.
Securities Marketvalue in
USD
% of netassets*
Quantity Ccy Maturity
200,000 233,640 1.0631.03.26ProGroup AG 18EUR 3.000%
Transferable securities and money market instruments dealt in on anotherregulated marketBondsGermany
1.06233,640Total - Germany
200,000 206,894 0.9413.01.22Oilflow SPV 1 DAC17
USD 12.000%Ireland
0.94206,894Total - Ireland
300,000 233,877 1.0627.10.21Turkiye VakiflarBankasi TAO 16
USD 5.500%Turkey
1.06233,877Total - Turkey
100,000 100,967 0.4615.05.28Amcor Finance USAInc 18
USD 4.500%United States
400,000 355,000 1.6201.04.23Foresight EnergyLLC / ForesightEnergy FinanceCorp 17
USD 11.500%
200,000 211,028 0.9630.01.22Newfield ExplorationCo 11
USD 5.750%
120,000 128,593 0.5815.05.23Prime SecurityServices BorrowerLLC / Prime FinanceInc 16
USD 9.250%
3.62795,588Total - United States
100,000 130,958 0.5915.10.24Miller Homes GroupHoldings PLC 17
GBP 5.500%United Kingdom
400,000 384,272 1.7501.05.22Petra Diamonds USTreasury PLC 17
USD 7.250%
9.021,985,229Total - Transferable securities and money marketinstruments dealt in on another regulated market
9.021,985,229Total - Bonds
2.34515,230Total - United Kingdom
95.3320,981,911Total - Investment in securities
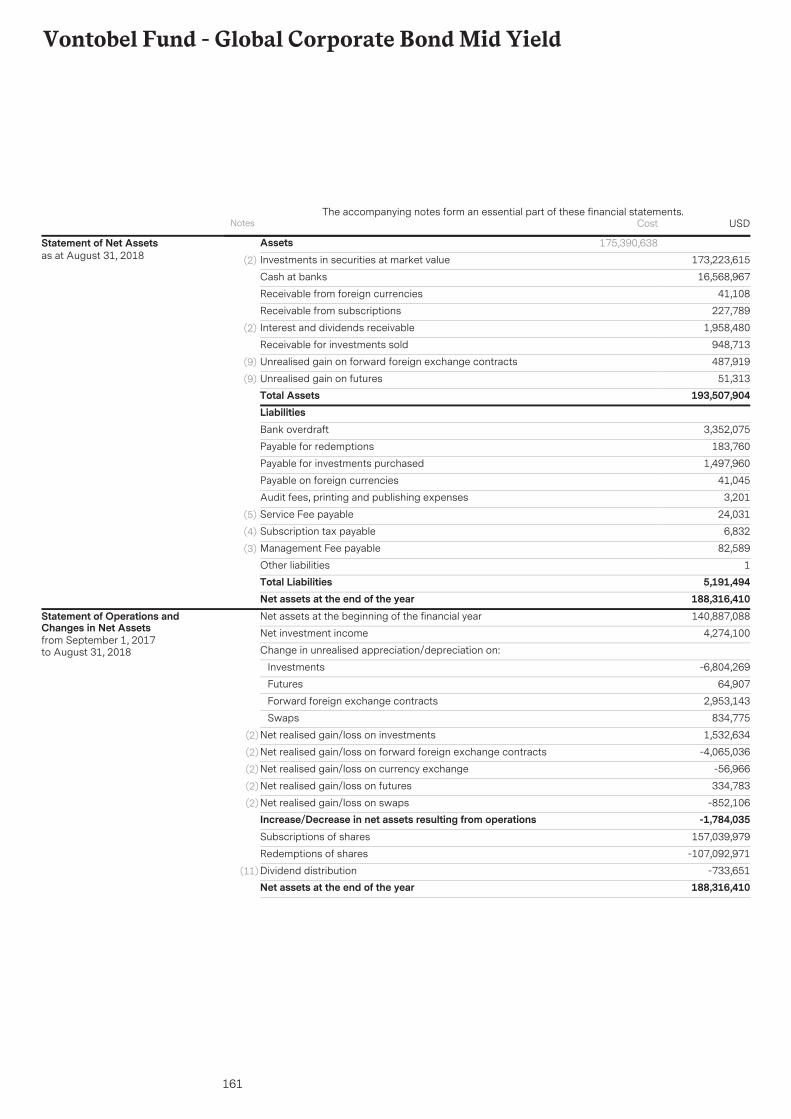
161
Vontobel Fund - Global Corporate Bond Mid Yield
AssetsInvestments in securities at market value 173,223,615(2)
16,568,967Cash at banks
41,108Receivable from foreign currencies
227,789Receivable from subscriptions
1,958,480Interest and dividends receivable(2)
948,713Receivable for investments sold
487,919Unrealised gain on forward foreign exchange contracts(9)
51,313Unrealised gain on futures(9)
Total Assets 193,507,904
175,390,638Statement of Net Assetsas at August 31, 2018
LiabilitiesBank overdraft 3,352,075
Payable for redemptions 183,760
Payable for investments purchased 1,497,960
Payable on foreign currencies 41,045
Audit fees, printing and publishing expenses 3,201
Service Fee payable 24,031(5)
Subscription tax payable 6,832(4)
Management Fee payable 82,589(3)
Other liabilities 1Total Liabilities 5,191,494Net assets at the end of the year 188,316,410Net assets at the beginning of the financial year 140,887,088
Net investment income 4,274,100
Change in unrealised appreciation/depreciation on:
Investments -6,804,269
Futures 64,907
Forward foreign exchange contracts 2,953,143
Swaps 834,775
Net realised gain/loss on investments 1,532,634(2)
Net realised gain/loss on forward foreign exchange contracts -4,065,036(2)
Net realised gain/loss on currency exchange -56,966(2)
Net realised gain/loss on futures 334,783(2)
Net realised gain/loss on swaps -852,106(2)
Increase/Decrease in net assets resulting from operations -1,784,035Subscriptions of shares 157,039,979
Redemptions of shares -107,092,971
Dividend distribution -733,651(11)
Net assets at the end of the year 188,316,410
Statement of Operations andChanges in Net Assetsfrom September 1, 2017to August 31, 2018
Notes USDThe accompanying notes form an essential part of these financial statements.
Cost
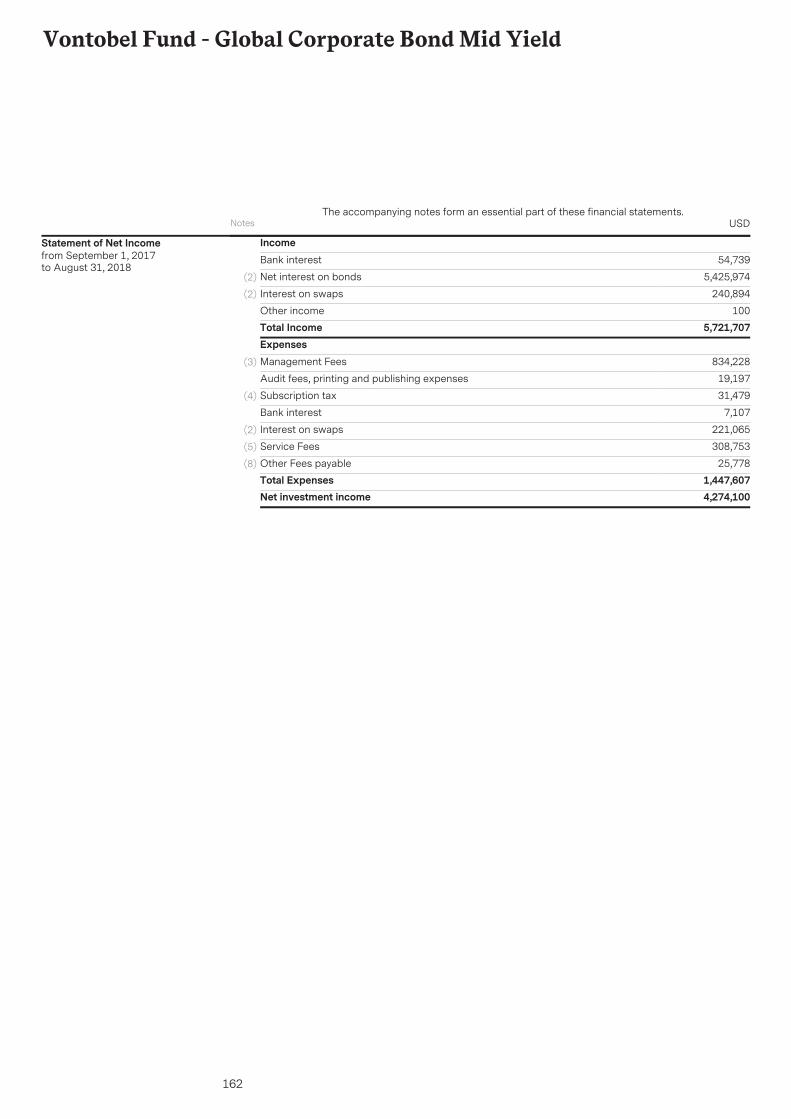
162
Vontobel Fund - Global Corporate Bond Mid Yield
IncomeBank interest 54,739
Net interest on bonds 5,425,974(2)
Interest on swaps 240,894(2)
Other income 100Total Income 5,721,707ExpensesManagement Fees 834,228(3)
Audit fees, printing and publishing expenses 19,197
Subscription tax 31,479(4)
Bank interest 7,107
Interest on swaps 221,065(2)
Service Fees 308,753(5)
Other Fees payable 25,778(8)
Total Expenses 1,447,607Net investment income 4,274,100
Statement of Net Incomefrom September 1, 2017to August 31, 2018
Notes USDThe accompanying notes form an essential part of these financial statements.
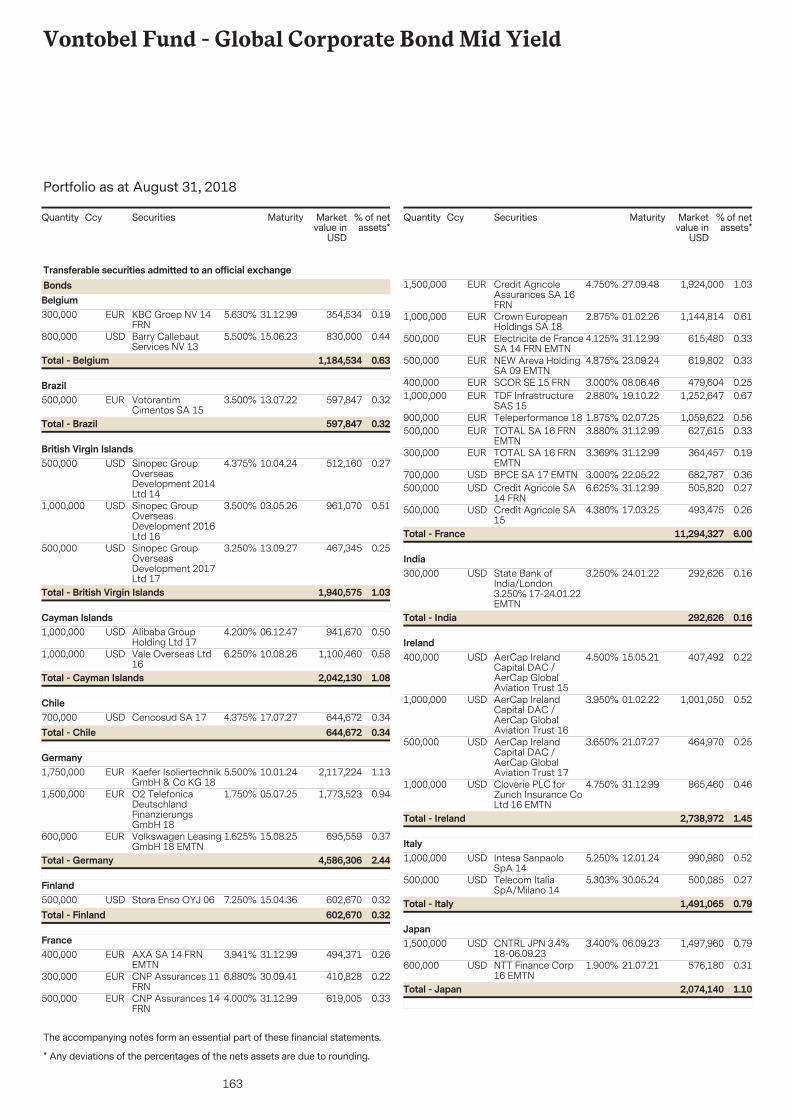
163
Vontobel Fund - Global Corporate Bond Mid Yield
The accompanying notes form an essential part of these financial statements.
Portfolio as at August 31, 2018
* Any deviations of the percentages of the nets assets are due to rounding.
Securities Marketvalue in
USD
% of netassets*
Quantity Ccy Maturity
300,000 354,534 0.1931.12.99KBC Groep NV 14FRN
EUR 5.630%
Transferable securities admitted to an official exchangeBondsBelgium
800,000 830,000 0.4415.06.23Barry CallebautServices NV 13
USD 5.500%
0.631,184,534Total - Belgium
500,000 597,847 0.3213.07.22VotorantimCimentos SA 15
EUR 3.500%Brazil
0.32597,847Total - Brazil
500,000 512,160 0.2710.04.24Sinopec GroupOverseasDevelopment 2014Ltd 14
USD 4.375%British Virgin Islands
1,000,000 961,070 0.5103.05.26Sinopec GroupOverseasDevelopment 2016Ltd 16
USD 3.500%
500,000 467,345 0.2513.09.27Sinopec GroupOverseasDevelopment 2017Ltd 17
USD 3.250%
1.031,940,575Total - British Virgin Islands
1,000,000 941,670 0.5006.12.47Alibaba GroupHolding Ltd 17
USD 4.200%Cayman Islands
1,000,000 1,100,460 0.5810.08.26Vale Overseas Ltd16
USD 6.250%
1.082,042,130Total - Cayman Islands
700,000 644,672 0.3417.07.27Cencosud SA 17USD 4.375%Chile
0.34644,672Total - Chile
1,750,000 2,117,224 1.1310.01.24Kaefer IsoliertechnikGmbH & Co KG 18
EUR 5.500%Germany
1,500,000 1,773,523 0.9405.07.25O2 TelefonicaDeutschlandFinanzierungsGmbH 18
EUR 1.750%
600,000 695,559 0.3715.08.25Volkswagen LeasingGmbH 18 EMTN
EUR 1.625%
2.444,586,306Total - Germany
500,000 602,670 0.3215.04.36Stora Enso OYJ 06USD 7.250%Finland
0.32602,670Total - Finland
400,000 494,371 0.2631.12.99AXA SA 14 FRNEMTN
EUR 3.941%France
300,000 410,828 0.2230.09.41CNP Assurances 11FRN
EUR 6.880%
500,000 619,005 0.3331.12.99CNP Assurances 14FRN
EUR 4.000%
Securities Marketvalue in
USD
% of netassets*
Quantity Ccy Maturity
1,500,000 1,924,000 1.0327.09.48Credit AgricoleAssurances SA 16FRN
EUR 4.750%
1,000,000 1,144,814 0.6101.02.26Crown EuropeanHoldings SA 18
EUR 2.875%
500,000 615,480 0.3331.12.99Electricite de FranceSA 14 FRN EMTN
EUR 4.125%
500,000 619,802 0.3323.09.24NEW Areva HoldingSA 09 EMTN
EUR 4.875%
400,000 479,604 0.2508.06.46SCOR SE 15 FRNEUR 3.000%1,000,000 1,252,647 0.6719.10.22TDF Infrastructure
SAS 15EUR 2.880%
900,000 1,059,622 0.5602.07.25Teleperformance 18EUR 1.875%500,000 627,615 0.3331.12.99TOTAL SA 16 FRN
EMTNEUR 3.880%
300,000 364,457 0.1931.12.99TOTAL SA 16 FRNEMTN
EUR 3.369%
700,000 682,787 0.3622.05.22BPCE SA 17 EMTNUSD 3.000%500,000 505,820 0.2731.12.99Credit Agricole SA
14 FRNUSD 6.625%
500,000 493,475 0.2617.03.25Credit Agricole SA15
USD 4.380%
6.0011,294,327Total - France
300,000 292,626 0.1624.01.22State Bank ofIndia/London3.250% 17-24.01.22EMTN
USD 3.250%India
0.16292,626Total - India
400,000 407,492 0.2215.05.21AerCap IrelandCapital DAC /AerCap GlobalAviation Trust 15
USD 4.500%Ireland
1,000,000 1,001,050 0.5201.02.22AerCap IrelandCapital DAC /AerCap GlobalAviation Trust 16
USD 3.950%
500,000 464,970 0.2521.07.27AerCap IrelandCapital DAC /AerCap GlobalAviation Trust 17
USD 3.650%
1,000,000 865,460 0.4631.12.99Cloverie PLC forZurich Insurance CoLtd 16 EMTN
USD 4.750%
1.452,738,972Total - Ireland
1,000,000 990,980 0.5212.01.24Intesa SanpaoloSpA 14
USD 5.250%Italy
500,000 500,085 0.2730.05.24Telecom ItaliaSpA/Milano 14
USD 5.303%
0.791,491,065Total - Italy
1,500,000 1,497,960 0.7906.09.23CNTRL JPN 3.4%18-06.09.23
USD 3.400%Japan
600,000 576,180 0.3121.07.21NTT Finance Corp16 EMTN
USD 1.900%
1.102,074,140Total - Japan
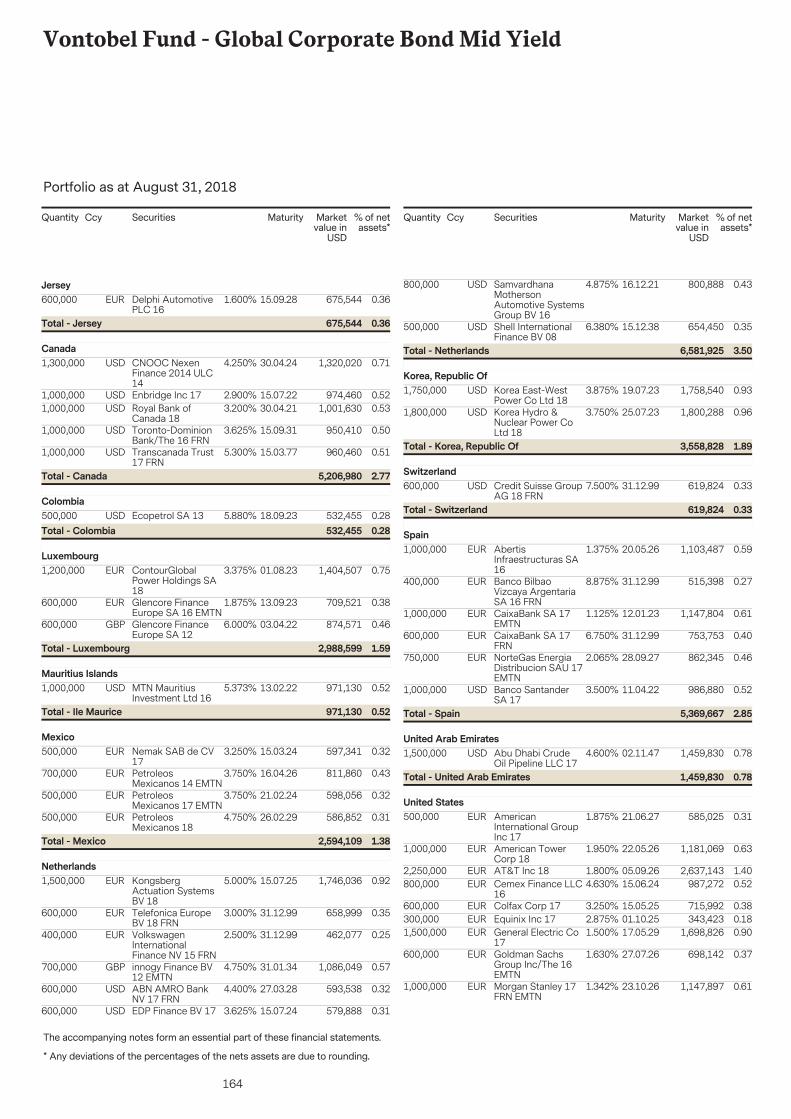
164
Vontobel Fund - Global Corporate Bond Mid Yield
The accompanying notes form an essential part of these financial statements.
Portfolio as at August 31, 2018
* Any deviations of the percentages of the nets assets are due to rounding.
Securities Marketvalue in
USD
% of netassets*
Quantity Ccy Maturity
600,000 675,544 0.3615.09.28Delphi AutomotivePLC 16
EUR 1.600%Jersey
0.36675,544Total - Jersey
1,300,000 1,320,020 0.7130.04.24CNOOC NexenFinance 2014 ULC14
USD 4.250%Canada
1,000,000 974,460 0.5215.07.22Enbridge Inc 17USD 2.900%1,000,000 1,001,630 0.5330.04.21Royal Bank of
Canada 18USD 3.200%
1,000,000 950,410 0.5015.09.31Toronto-DominionBank/The 16 FRN
USD 3.625%
1,000,000 960,460 0.5115.03.77Transcanada Trust17 FRN
USD 5.300%
2.775,206,980Total - Canada
500,000 532,455 0.2818.09.23Ecopetrol SA 13USD 5.880%Colombia
0.28532,455Total - Colombia
1,200,000 1,404,507 0.7501.08.23ContourGlobalPower Holdings SA18
EUR 3.375%Luxembourg
600,000 709,521 0.3813.09.23Glencore FinanceEurope SA 16 EMTN
EUR 1.875%
600,000 874,571 0.4603.04.22Glencore FinanceEurope SA 12
GBP 6.000%
1.592,988,599Total - Luxembourg
1,000,000 971,130 0.5213.02.22MTN MauritiusInvestment Ltd 16
USD 5.373%Mauritius Islands
0.52971,130Total - Ile Maurice
500,000 597,341 0.3215.03.24Nemak SAB de CV17
EUR 3.250%Mexico
700,000 811,860 0.4316.04.26PetroleosMexicanos 14 EMTN
EUR 3.750%
500,000 598,056 0.3221.02.24PetroleosMexicanos 17 EMTN
EUR 3.750%
500,000 586,852 0.3126.02.29PetroleosMexicanos 18
EUR 4.750%
1.382,594,109Total - Mexico
1,500,000 1,746,036 0.9215.07.25KongsbergActuation SystemsBV 18
EUR 5.000%Netherlands
600,000 658,999 0.3531.12.99Telefonica EuropeBV 18 FRN
EUR 3.000%
400,000 462,077 0.2531.12.99VolkswagenInternationalFinance NV 15 FRN
EUR 2.500%
700,000 1,086,049 0.5731.01.34innogy Finance BV12 EMTN
GBP 4.750%
600,000 593,538 0.3227.03.28ABN AMRO BankNV 17 FRN
USD 4.400%
600,000 579,888 0.3115.07.24EDP Finance BV 17USD 3.625%
Securities Marketvalue in
USD
% of netassets*
Quantity Ccy Maturity
800,000 800,888 0.4316.12.21SamvardhanaMothersonAutomotive SystemsGroup BV 16
USD 4.875%
500,000 654,450 0.3515.12.38Shell InternationalFinance BV 08
USD 6.380%
3.506,581,925Total - Netherlands
1,750,000 1,758,540 0.9319.07.23Korea East-WestPower Co Ltd 18
USD 3.875%Korea, Republic Of
1,800,000 1,800,288 0.9625.07.23Korea Hydro &Nuclear Power CoLtd 18
USD 3.750%
1.893,558,828Total - Korea, Republic Of
600,000 619,824 0.3331.12.99Credit Suisse GroupAG 18 FRN
USD 7.500%Switzerland
0.33619,824Total - Switzerland
1,000,000 1,103,487 0.5920.05.26AbertisInfraestructuras SA16
EUR 1.375%Spain
400,000 515,398 0.2731.12.99Banco BilbaoVizcaya ArgentariaSA 16 FRN
EUR 8.875%
1,000,000 1,147,804 0.6112.01.23CaixaBank SA 17EMTN
EUR 1.125%
600,000 753,753 0.4031.12.99CaixaBank SA 17FRN
EUR 6.750%
750,000 862,345 0.4628.09.27NorteGas EnergiaDistribucion SAU 17EMTN
EUR 2.065%
1,000,000 986,880 0.5211.04.22Banco SantanderSA 17
USD 3.500%
2.855,369,667Total - Spain
1,500,000 1,459,830 0.7802.11.47Abu Dhabi CrudeOil Pipeline LLC 17
USD 4.600%United Arab Emirates
0.781,459,830Total - United Arab Emirates
500,000 585,025 0.3121.06.27AmericanInternational GroupInc 17
EUR 1.875%United States
1,000,000 1,181,069 0.6322.05.26American TowerCorp 18
EUR 1.950%
2,250,000 2,637,143 1.4005.09.26AT&T Inc 18EUR 1.800%800,000 987,272 0.5215.06.24Cemex Finance LLC
16EUR 4.630%
600,000 715,992 0.3815.05.25Colfax Corp 17EUR 3.250%300,000 343,423 0.1801.10.25Equinix Inc 17EUR 2.875%1,500,000 1,698,826 0.9017.05.29General Electric Co
17EUR 1.500%
600,000 698,142 0.3727.07.26Goldman SachsGroup Inc/The 16EMTN
EUR 1.630%
1,000,000 1,147,897 0.6123.10.26Morgan Stanley 17FRN EMTN
EUR 1.342%
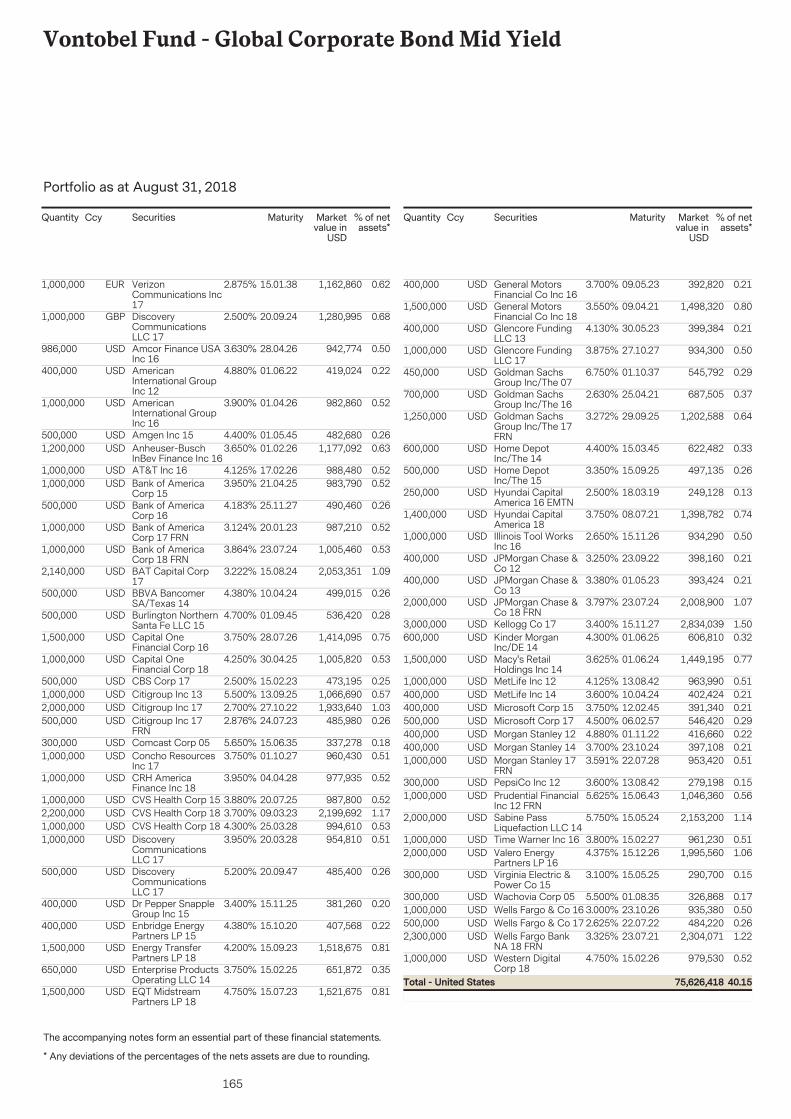
165
Vontobel Fund - Global Corporate Bond Mid Yield
The accompanying notes form an essential part of these financial statements.
Portfolio as at August 31, 2018
* Any deviations of the percentages of the nets assets are due to rounding.
Securities Marketvalue in
USD
% of netassets*
Quantity Ccy Maturity
1,000,000 1,162,860 0.6215.01.38VerizonCommunications Inc17
EUR 2.875%
1,000,000 1,280,995 0.6820.09.24DiscoveryCommunicationsLLC 17
GBP 2.500%
986,000 942,774 0.5028.04.26Amcor Finance USAInc 16
USD 3.630%
400,000 419,024 0.2201.06.22AmericanInternational GroupInc 12
USD 4.880%
1,000,000 982,860 0.5201.04.26AmericanInternational GroupInc 16
USD 3.900%
500,000 482,680 0.2601.05.45Amgen Inc 15USD 4.400%1,200,000 1,177,092 0.6301.02.26Anheuser-Busch
InBev Finance Inc 16USD 3.650%
1,000,000 988,480 0.5217.02.26AT&T Inc 16USD 4.125%1,000,000 983,790 0.5221.04.25Bank of America
Corp 15USD 3.950%
500,000 490,460 0.2625.11.27Bank of AmericaCorp 16
USD 4.183%
1,000,000 987,210 0.5220.01.23Bank of AmericaCorp 17 FRN
USD 3.124%
1,000,000 1,005,460 0.5323.07.24Bank of AmericaCorp 18 FRN
USD 3.864%
2,140,000 2,053,351 1.0915.08.24BAT Capital Corp17
USD 3.222%
500,000 499,015 0.2610.04.24BBVA BancomerSA/Texas 14
USD 4.380%
500,000 536,420 0.2801.09.45Burlington NorthernSanta Fe LLC 15
USD 4.700%
1,500,000 1,414,095 0.7528.07.26Capital OneFinancial Corp 16
USD 3.750%
1,000,000 1,005,820 0.5330.04.25Capital OneFinancial Corp 18
USD 4.250%
500,000 473,195 0.2515.02.23CBS Corp 17USD 2.500%1,000,000 1,066,690 0.5713.09.25Citigroup Inc 13USD 5.500%2,000,000 1,933,640 1.0327.10.22Citigroup Inc 17USD 2.700%500,000 485,980 0.2624.07.23Citigroup Inc 17
FRNUSD 2.876%
300,000 337,278 0.1815.06.35Comcast Corp 05USD 5.650%1,000,000 960,430 0.5101.10.27Concho Resources
Inc 17USD 3.750%
1,000,000 977,935 0.5204.04.28CRH AmericaFinance Inc 18
USD 3.950%
1,000,000 987,800 0.5220.07.25CVS Health Corp 15USD 3.880%2,200,000 2,199,692 1.1709.03.23CVS Health Corp 18USD 3.700%1,000,000 994,610 0.5325.03.28CVS Health Corp 18USD 4.300%1,000,000 954,810 0.5120.03.28Discovery
CommunicationsLLC 17
USD 3.950%
500,000 485,400 0.2620.09.47DiscoveryCommunicationsLLC 17
USD 5.200%
400,000 381,260 0.2015.11.25Dr Pepper SnappleGroup Inc 15
USD 3.400%
400,000 407,568 0.2215.10.20Enbridge EnergyPartners LP 15
USD 4.380%
1,500,000 1,518,675 0.8115.09.23Energy TransferPartners LP 18
USD 4.200%
650,000 651,872 0.3515.02.25Enterprise ProductsOperating LLC 14
USD 3.750%
1,500,000 1,521,675 0.8115.07.23EQT MidstreamPartners LP 18
USD 4.750%
Securities Marketvalue in
USD
% of netassets*
Quantity Ccy Maturity
400,000 392,820 0.2109.05.23General MotorsFinancial Co Inc 16
USD 3.700%
1,500,000 1,498,320 0.8009.04.21General MotorsFinancial Co Inc 18
USD 3.550%
400,000 399,384 0.2130.05.23Glencore FundingLLC 13
USD 4.130%
1,000,000 934,300 0.5027.10.27Glencore FundingLLC 17
USD 3.875%
450,000 545,792 0.2901.10.37Goldman SachsGroup Inc/The 07
USD 6.750%
700,000 687,505 0.3725.04.21Goldman SachsGroup Inc/The 16
USD 2.630%
1,250,000 1,202,588 0.6429.09.25Goldman SachsGroup Inc/The 17FRN
USD 3.272%
600,000 622,482 0.3315.03.45Home DepotInc/The 14
USD 4.400%
500,000 497,135 0.2615.09.25Home DepotInc/The 15
USD 3.350%
250,000 249,128 0.1318.03.19Hyundai CapitalAmerica 16 EMTN
USD 2.500%
1,400,000 1,398,782 0.7408.07.21Hyundai CapitalAmerica 18
USD 3.750%
1,000,000 934,290 0.5015.11.26Illinois Tool WorksInc 16
USD 2.650%
400,000 398,160 0.2123.09.22JPMorgan Chase &Co 12
USD 3.250%
400,000 393,424 0.2101.05.23JPMorgan Chase &Co 13
USD 3.380%
2,000,000 2,008,900 1.0723.07.24JPMorgan Chase &Co 18 FRN
USD 3.797%
3,000,000 2,834,039 1.5015.11.27Kellogg Co 17USD 3.400%600,000 606,810 0.3201.06.25Kinder Morgan
Inc/DE 14USD 4.300%
1,500,000 1,449,195 0.7701.06.24Macy's RetailHoldings Inc 14
USD 3.625%
1,000,000 963,990 0.5113.08.42MetLife Inc 12USD 4.125%400,000 402,424 0.2110.04.24MetLife Inc 14USD 3.600%400,000 391,340 0.2112.02.45Microsoft Corp 15USD 3.750%500,000 546,420 0.2906.02.57Microsoft Corp 17USD 4.500%400,000 416,660 0.2201.11.22Morgan Stanley 12USD 4.880%400,000 397,108 0.2123.10.24Morgan Stanley 14USD 3.700%1,000,000 953,420 0.5122.07.28Morgan Stanley 17
FRNUSD 3.591%
300,000 279,198 0.1513.08.42PepsiCo Inc 12USD 3.600%1,000,000 1,046,360 0.5615.06.43Prudential Financial
Inc 12 FRNUSD 5.625%
2,000,000 2,153,200 1.1415.05.24Sabine PassLiquefaction LLC 14
USD 5.750%
1,000,000 961,230 0.5115.02.27Time Warner Inc 16USD 3.800%2,000,000 1,995,560 1.0615.12.26Valero Energy
Partners LP 16USD 4.375%
300,000 290,700 0.1515.05.25Virginia Electric &Power Co 15
USD 3.100%
300,000 326,868 0.1701.08.35Wachovia Corp 05USD 5.500%1,000,000 935,380 0.5023.10.26Wells Fargo & Co 16USD 3.000%500,000 484,220 0.2622.07.22Wells Fargo & Co 17USD 2.625%2,300,000 2,304,071 1.2223.07.21Wells Fargo Bank
NA 18 FRNUSD 3.325%
1,000,000 979,530 0.5215.02.26Western DigitalCorp 18
USD 4.750%
40.1575,626,418Total - United States
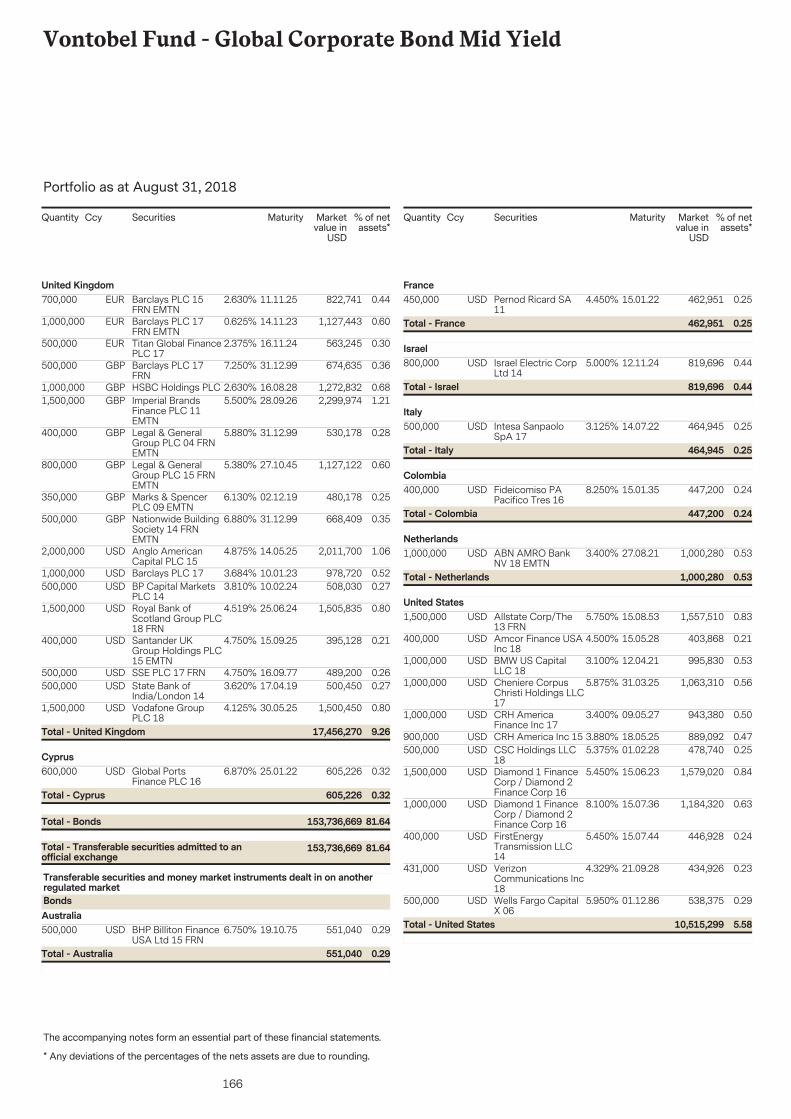
166
Vontobel Fund - Global Corporate Bond Mid Yield
The accompanying notes form an essential part of these financial statements.
Portfolio as at August 31, 2018
* Any deviations of the percentages of the nets assets are due to rounding.
Securities Marketvalue in
USD
% of netassets*
Quantity Ccy Maturity
700,000 822,741 0.4411.11.25Barclays PLC 15FRN EMTN
EUR 2.630%United Kingdom
1,000,000 1,127,443 0.6014.11.23Barclays PLC 17FRN EMTN
EUR 0.625%
500,000 563,245 0.3016.11.24Titan Global FinancePLC 17
EUR 2.375%
500,000 674,635 0.3631.12.99Barclays PLC 17FRN
GBP 7.250%
1,000,000 1,272,832 0.6816.08.28HSBC Holdings PLCGBP 2.630%1,500,000 2,299,974 1.2128.09.26Imperial Brands
Finance PLC 11EMTN
GBP 5.500%
400,000 530,178 0.2831.12.99Legal & GeneralGroup PLC 04 FRNEMTN
GBP 5.880%
800,000 1,127,122 0.6027.10.45Legal & GeneralGroup PLC 15 FRNEMTN
GBP 5.380%
350,000 480,178 0.2502.12.19Marks & SpencerPLC 09 EMTN
GBP 6.130%
500,000 668,409 0.3531.12.99Nationwide BuildingSociety 14 FRNEMTN
GBP 6.880%
2,000,000 2,011,700 1.0614.05.25Anglo AmericanCapital PLC 15
USD 4.875%
1,000,000 978,720 0.5210.01.23Barclays PLC 17USD 3.684%500,000 508,030 0.2710.02.24BP Capital Markets
PLC 14USD 3.810%
1,500,000 1,505,835 0.8025.06.24Royal Bank ofScotland Group PLC18 FRN
USD 4.519%
400,000 395,128 0.2115.09.25Santander UKGroup Holdings PLC15 EMTN
USD 4.750%
500,000 489,200 0.2616.09.77SSE PLC 17 FRNUSD 4.750%500,000 500,450 0.2717.04.19State Bank of
India/London 14USD 3.620%
1,500,000 1,500,450 0.8030.05.25Vodafone GroupPLC 18
USD 4.125%
9.2617,456,270Total - United Kingdom
600,000 605,226 0.3225.01.22Global PortsFinance PLC 16
USD 6.870%Cyprus
81.64153,736,669Total - Transferable securities admitted to anofficial exchange
81.64153,736,669Total - Bonds
0.32605,226Total - Cyprus
500,000 551,040 0.2919.10.75BHP Billiton FinanceUSA Ltd 15 FRN
USD 6.750%
Transferable securities and money market instruments dealt in on anotherregulated marketBondsAustralia
0.29551,040Total - Australia
Securities Marketvalue in
USD
% of netassets*
Quantity Ccy Maturity
450,000 462,951 0.2515.01.22Pernod Ricard SA11
USD 4.450%France
0.25462,951Total - France
800,000 819,696 0.4412.11.24Israel Electric CorpLtd 14
USD 5.000%Israel
0.44819,696Total - Israel
500,000 464,945 0.2514.07.22Intesa SanpaoloSpA 17
USD 3.125%Italy
0.25464,945Total - Italy
400,000 447,200 0.2415.01.35Fideicomiso PAPacifico Tres 16
USD 8.250%Colombia
0.24447,200Total - Colombia
1,000,000 1,000,280 0.5327.08.21ABN AMRO BankNV 18 EMTN
USD 3.400%Netherlands
0.531,000,280Total - Netherlands
1,500,000 1,557,510 0.8315.08.53Allstate Corp/The13 FRN
USD 5.750%United States
400,000 403,868 0.2115.05.28Amcor Finance USAInc 18
USD 4.500%
1,000,000 995,830 0.5312.04.21BMW US CapitalLLC 18
USD 3.100%
1,000,000 1,063,310 0.5631.03.25Cheniere CorpusChristi Holdings LLC17
USD 5.875%
1,000,000 943,380 0.5009.05.27CRH AmericaFinance Inc 17
USD 3.400%
900,000 889,092 0.4718.05.25CRH America Inc 15USD 3.880%500,000 478,740 0.2501.02.28CSC Holdings LLC
18USD 5.375%
1,500,000 1,579,020 0.8415.06.23Diamond 1 FinanceCorp / Diamond 2Finance Corp 16
USD 5.450%
1,000,000 1,184,320 0.6315.07.36Diamond 1 FinanceCorp / Diamond 2Finance Corp 16
USD 8.100%
400,000 446,928 0.2415.07.44FirstEnergyTransmission LLC14
USD 5.450%
431,000 434,926 0.2321.09.28VerizonCommunications Inc18
USD 4.329%
500,000 538,375 0.2901.12.86Wells Fargo CapitalX 06
USD 5.950%
5.5810,515,299Total - United States
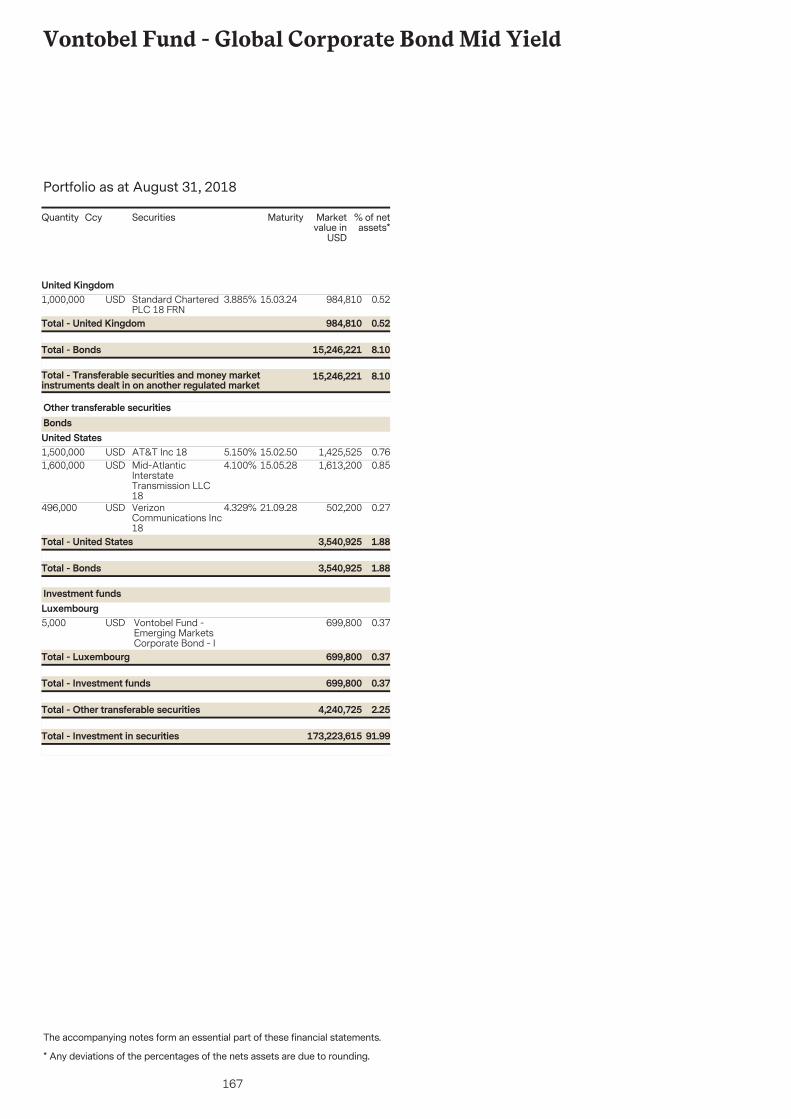
167
Vontobel Fund - Global Corporate Bond Mid Yield
The accompanying notes form an essential part of these financial statements.
Portfolio as at August 31, 2018
* Any deviations of the percentages of the nets assets are due to rounding.
Securities Marketvalue in
USD
% of netassets*
Quantity Ccy Maturity
1,000,000 984,810 0.5215.03.24Standard CharteredPLC 18 FRN
USD 3.885%United Kingdom
8.1015,246,221Total - Transferable securities and money marketinstruments dealt in on another regulated market
8.1015,246,221Total - Bonds
0.52984,810Total - United Kingdom
1,500,000 1,425,525 0.7615.02.50AT&T Inc 18USD 5.150%
Other transferable securitiesBondsUnited States
1,600,000 1,613,200 0.8515.05.28Mid-AtlanticInterstateTransmission LLC18
USD 4.100%
496,000 502,200 0.2721.09.28VerizonCommunications Inc18
USD 4.329%
1.883,540,925Total - Bonds
1.883,540,925Total - United States
5,000 699,800 0.37Vontobel Fund -Emerging MarketsCorporate Bond - I
USD
Investment fundsLuxembourg
2.254,240,725Total - Other transferable securities
0.37699,800Total - Investment funds
0.37699,800Total - Luxembourg
91.99173,223,615Total - Investment in securities
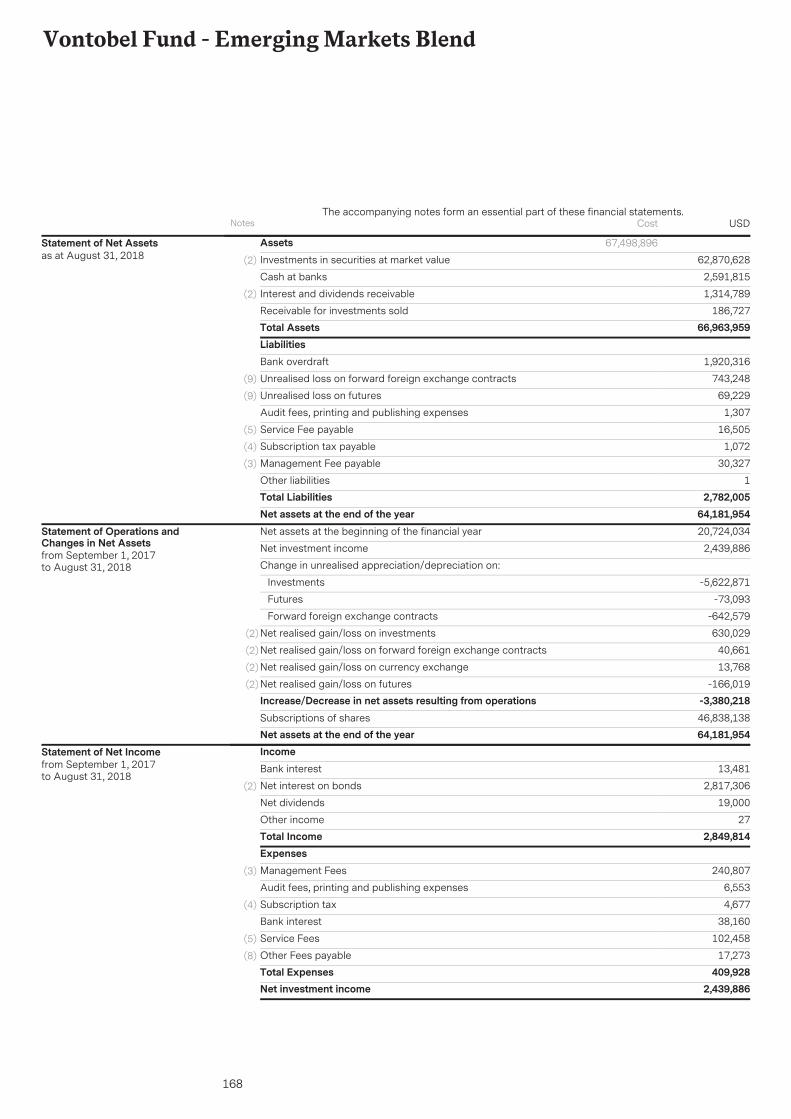
168
Vontobel Fund - Emerging Markets Blend
AssetsInvestments in securities at market value 62,870,628(2)
2,591,815Cash at banks
1,314,789Interest and dividends receivable(2)
186,727Receivable for investments soldTotal Assets 66,963,959
67,498,896Statement of Net Assetsas at August 31, 2018
LiabilitiesBank overdraft 1,920,316
Unrealised loss on forward foreign exchange contracts 743,248(9)
Unrealised loss on futures 69,229(9)
Audit fees, printing and publishing expenses 1,307
Service Fee payable 16,505(5)
Subscription tax payable 1,072(4)
Management Fee payable 30,327(3)
Other liabilities 1Total Liabilities 2,782,005Net assets at the end of the year 64,181,954Net assets at the beginning of the financial year 20,724,034
Net investment income 2,439,886
Change in unrealised appreciation/depreciation on:
Investments -5,622,871
Futures -73,093
Forward foreign exchange contracts -642,579
Net realised gain/loss on investments 630,029(2)
Net realised gain/loss on forward foreign exchange contracts 40,661(2)
Net realised gain/loss on currency exchange 13,768(2)
Net realised gain/loss on futures -166,019(2)
Increase/Decrease in net assets resulting from operations -3,380,218Subscriptions of shares 46,838,138Net assets at the end of the year 64,181,954
Statement of Operations andChanges in Net Assetsfrom September 1, 2017to August 31, 2018
IncomeBank interest 13,481
Net interest on bonds 2,817,306(2)
Net dividends 19,000
Other income 27Total Income 2,849,814ExpensesManagement Fees 240,807(3)
Audit fees, printing and publishing expenses 6,553
Subscription tax 4,677(4)
Bank interest 38,160
Service Fees 102,458(5)
Other Fees payable 17,273(8)
Total Expenses 409,928Net investment income 2,439,886
Statement of Net Incomefrom September 1, 2017to August 31, 2018
Notes USDThe accompanying notes form an essential part of these financial statements.
Cost
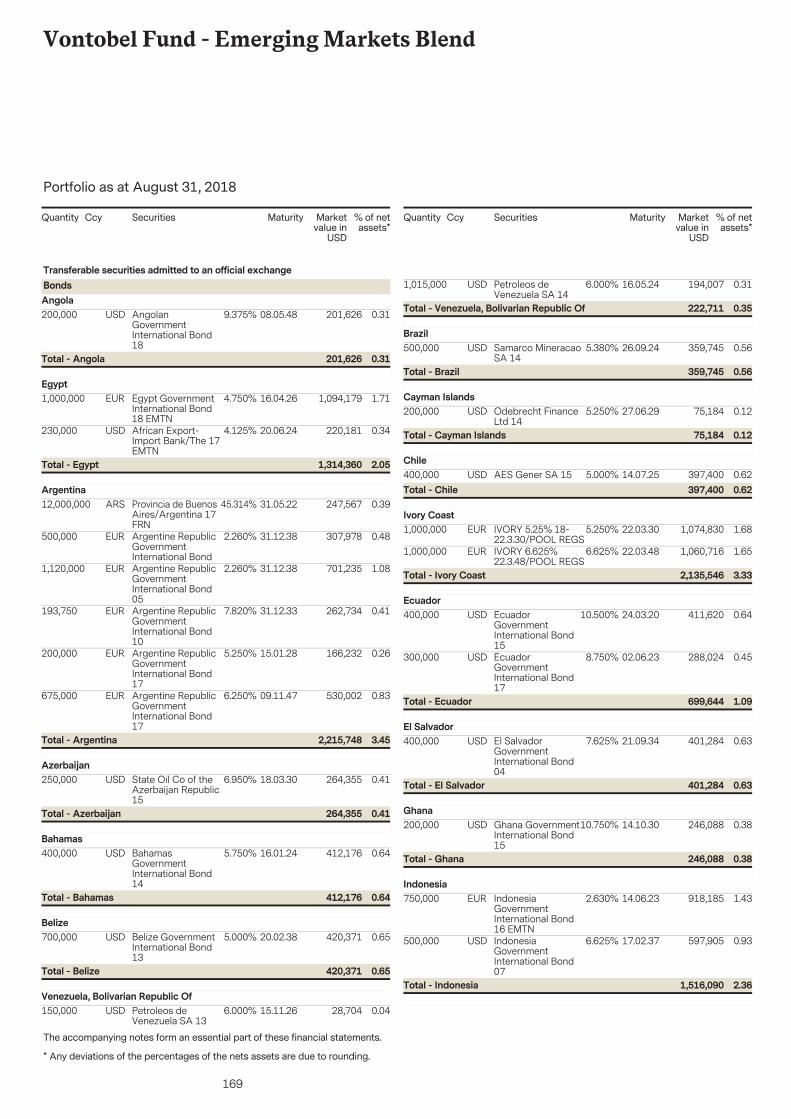
169
Vontobel Fund - Emerging Markets Blend
The accompanying notes form an essential part of these financial statements.
Portfolio as at August 31, 2018
* Any deviations of the percentages of the nets assets are due to rounding.
Securities Marketvalue in
USD
% of netassets*
Quantity Ccy Maturity
200,000 201,626 0.3108.05.48AngolanGovernmentInternational Bond18
USD 9.375%
Transferable securities admitted to an official exchangeBondsAngola
0.31201,626Total - Angola
1,000,000 1,094,179 1.7116.04.26Egypt GovernmentInternational Bond18 EMTN
EUR 4.750%Egypt
230,000 220,181 0.3420.06.24African Export-Import Bank/The 17EMTN
USD 4.125%
2.051,314,360Total - Egypt
12,000,000 247,567 0.3931.05.22Provincia de BuenosAires/Argentina 17FRN
ARS 45.314%Argentina
500,000 307,978 0.4831.12.38Argentine RepublicGovernmentInternational Bond
EUR 2.260%
1,120,000 701,235 1.0831.12.38Argentine RepublicGovernmentInternational Bond05
EUR 2.260%
193,750 262,734 0.4131.12.33Argentine RepublicGovernmentInternational Bond10
EUR 7.820%
200,000 166,232 0.2615.01.28Argentine RepublicGovernmentInternational Bond17
EUR 5.250%
675,000 530,002 0.8309.11.47Argentine RepublicGovernmentInternational Bond17
EUR 6.250%
3.452,215,748Total - Argentina
250,000 264,355 0.4118.03.30State Oil Co of theAzerbaijan Republic15
USD 6.950%Azerbaijan
0.41264,355Total - Azerbaijan
400,000 412,176 0.6416.01.24BahamasGovernmentInternational Bond14
USD 5.750%Bahamas
0.64412,176Total - Bahamas
700,000 420,371 0.6520.02.38Belize GovernmentInternational Bond13
USD 5.000%Belize
0.65420,371Total - Belize
150,000 28,704 0.0415.11.26Petroleos deVenezuela SA 13
USD 6.000%Venezuela, Bolivarian Republic Of
Securities Marketvalue in
USD
% of netassets*
Quantity Ccy Maturity
1,015,000 194,007 0.3116.05.24Petroleos deVenezuela SA 14
USD 6.000%
0.35222,711Total - Venezuela, Bolivarian Republic Of
500,000 359,745 0.5626.09.24Samarco MineracaoSA 14
USD 5.380%Brazil
0.56359,745Total - Brazil
200,000 75,184 0.1227.06.29Odebrecht FinanceLtd 14
USD 5.250%Cayman Islands
0.1275,184Total - Cayman Islands
400,000 397,400 0.6214.07.25AES Gener SA 15USD 5.000%Chile
0.62397,400Total - Chile
1,000,000 1,074,830 1.6822.03.30IVORY 5.25% 18-22.3.30/POOL REGS
EUR 5.250%Ivory Coast
1,000,000 1,060,716 1.6522.03.48IVORY 6.625%22.3.48/POOL REGS
EUR 6.625%
3.332,135,546Total - Ivory Coast
400,000 411,620 0.6424.03.20EcuadorGovernmentInternational Bond15
USD 10.500%Ecuador
300,000 288,024 0.4502.06.23EcuadorGovernmentInternational Bond17
USD 8.750%
1.09699,644Total - Ecuador
400,000 401,284 0.6321.09.34El SalvadorGovernmentInternational Bond04
USD 7.625%El Salvador
0.63401,284Total - El Salvador
200,000 246,088 0.3814.10.30Ghana GovernmentInternational Bond15
USD 10.750%Ghana
0.38246,088Total - Ghana
750,000 918,185 1.4314.06.23IndonesiaGovernmentInternational Bond16 EMTN
EUR 2.630%Indonesia
500,000 597,905 0.9317.02.37IndonesiaGovernmentInternational Bond07
USD 6.625%
2.361,516,090Total - Indonesia
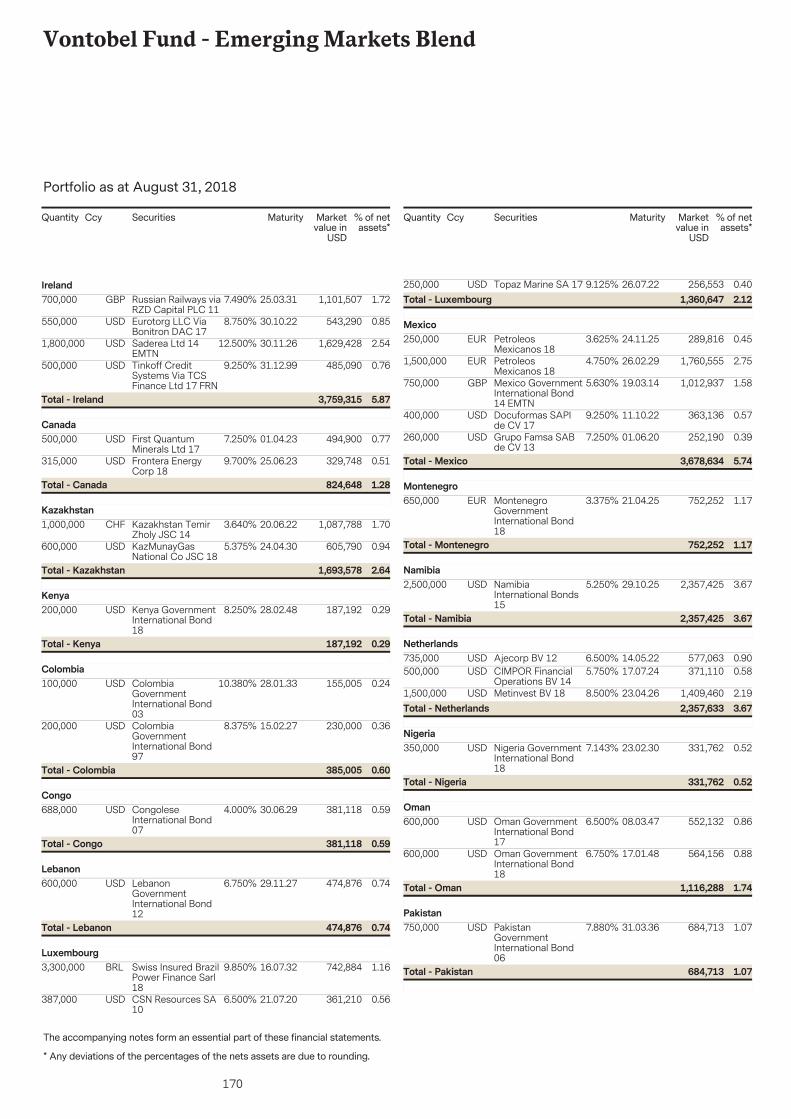
170
Vontobel Fund - Emerging Markets Blend
The accompanying notes form an essential part of these financial statements.
Portfolio as at August 31, 2018
* Any deviations of the percentages of the nets assets are due to rounding.
Securities Marketvalue in
USD
% of netassets*
Quantity Ccy Maturity
700,000 1,101,507 1.7225.03.31Russian Railways viaRZD Capital PLC 11
GBP 7.490%Ireland
550,000 543,290 0.8530.10.22Eurotorg LLC ViaBonitron DAC 17
USD 8.750%
1,800,000 1,629,428 2.5430.11.26Saderea Ltd 14EMTN
USD 12.500%
500,000 485,090 0.7631.12.99Tinkoff CreditSystems Via TCSFinance Ltd 17 FRN
USD 9.250%
5.873,759,315Total - Ireland
500,000 494,900 0.7701.04.23First QuantumMinerals Ltd 17
USD 7.250%Canada
315,000 329,748 0.5125.06.23Frontera EnergyCorp 18
USD 9.700%
1.28824,648Total - Canada
1,000,000 1,087,788 1.7020.06.22Kazakhstan TemirZholy JSC 14
CHF 3.640%Kazakhstan
600,000 605,790 0.9424.04.30KazMunayGasNational Co JSC 18
USD 5.375%
2.641,693,578Total - Kazakhstan
200,000 187,192 0.2928.02.48Kenya GovernmentInternational Bond18
USD 8.250%Kenya
0.29187,192Total - Kenya
100,000 155,005 0.2428.01.33ColombiaGovernmentInternational Bond03
USD 10.380%Colombia
200,000 230,000 0.3615.02.27ColombiaGovernmentInternational Bond97
USD 8.375%
0.60385,005Total - Colombia
688,000 381,118 0.5930.06.29CongoleseInternational Bond07
USD 4.000%Congo
0.59381,118Total - Congo
600,000 474,876 0.7429.11.27LebanonGovernmentInternational Bond12
USD 6.750%Lebanon
0.74474,876Total - Lebanon
3,300,000 742,884 1.1616.07.32Swiss Insured BrazilPower Finance Sarl18
BRL 9.850%Luxembourg
387,000 361,210 0.5621.07.20CSN Resources SA10
USD 6.500%
Securities Marketvalue in
USD
% of netassets*
Quantity Ccy Maturity
250,000 256,553 0.4026.07.22Topaz Marine SA 17USD 9.125%2.121,360,647Total - Luxembourg
250,000 289,816 0.4524.11.25PetroleosMexicanos 18
EUR 3.625%Mexico
1,500,000 1,760,555 2.7526.02.29PetroleosMexicanos 18
EUR 4.750%
750,000 1,012,937 1.5819.03.14Mexico GovernmentInternational Bond14 EMTN
GBP 5.630%
400,000 363,136 0.5711.10.22Docuformas SAPIde CV 17
USD 9.250%
260,000 252,190 0.3901.06.20Grupo Famsa SABde CV 13
USD 7.250%
5.743,678,634Total - Mexico
650,000 752,252 1.1721.04.25MontenegroGovernmentInternational Bond18
EUR 3.375%Montenegro
1.17752,252Total - Montenegro
2,500,000 2,357,425 3.6729.10.25NamibiaInternational Bonds15
USD 5.250%Namibia
3.672,357,425Total - Namibia
735,000 577,063 0.9014.05.22Ajecorp BV 12USD 6.500%Netherlands
500,000 371,110 0.5817.07.24CIMPOR FinancialOperations BV 14
USD 5.750%
1,500,000 1,409,460 2.1923.04.26Metinvest BV 18USD 8.500%3.672,357,633Total - Netherlands
350,000 331,762 0.5223.02.30Nigeria GovernmentInternational Bond18
USD 7.143%Nigeria
0.52331,762Total - Nigeria
600,000 552,132 0.8608.03.47Oman GovernmentInternational Bond17
USD 6.500%Oman
600,000 564,156 0.8817.01.48Oman GovernmentInternational Bond18
USD 6.750%
1.741,116,288Total - Oman
750,000 684,713 1.0731.03.36PakistanGovernmentInternational Bond06
USD 7.880%Pakistan
1.07684,713Total - Pakistan
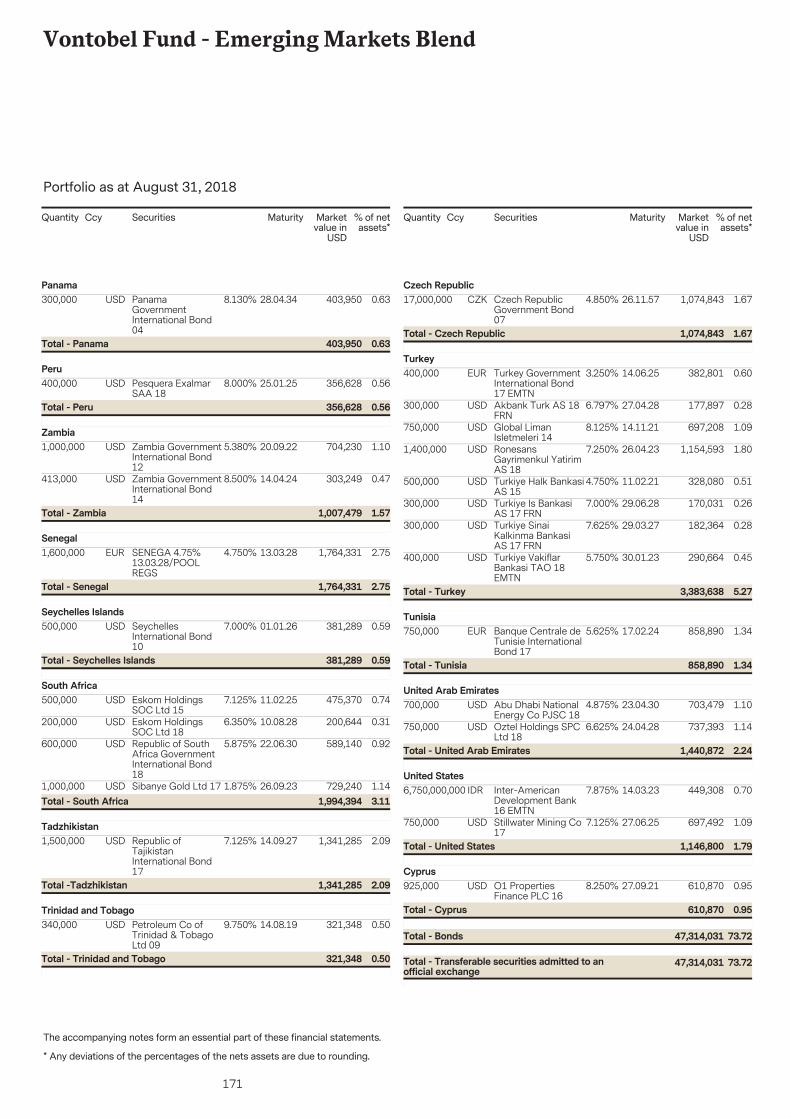
171
Vontobel Fund - Emerging Markets Blend
The accompanying notes form an essential part of these financial statements.
Portfolio as at August 31, 2018
* Any deviations of the percentages of the nets assets are due to rounding.
Securities Marketvalue in
USD
% of netassets*
Quantity Ccy Maturity
300,000 403,950 0.6328.04.34PanamaGovernmentInternational Bond04
USD 8.130%Panama
0.63403,950Total - Panama
400,000 356,628 0.5625.01.25Pesquera ExalmarSAA 18
USD 8.000%Peru
0.56356,628Total - Peru
1,000,000 704,230 1.1020.09.22Zambia GovernmentInternational Bond12
USD 5.380%Zambia
413,000 303,249 0.4714.04.24Zambia GovernmentInternational Bond14
USD 8.500%
1.571,007,479Total - Zambia
1,600,000 1,764,331 2.7513.03.28SENEGA 4.75%13.03.28/POOLREGS
EUR 4.750%Senegal
2.751,764,331Total - Senegal
500,000 381,289 0.5901.01.26SeychellesInternational Bond10
USD 7.000%Seychelles Islands
0.59381,289Total - Seychelles Islands
500,000 475,370 0.7411.02.25Eskom HoldingsSOC Ltd 15
USD 7.125%South Africa
200,000 200,644 0.3110.08.28Eskom HoldingsSOC Ltd 18
USD 6.350%
600,000 589,140 0.9222.06.30Republic of SouthAfrica GovernmentInternational Bond18
USD 5.875%
1,000,000 729,240 1.1426.09.23Sibanye Gold Ltd 17USD 1.875%3.111,994,394Total - South Africa
1,500,000 1,341,285 2.0914.09.27Republic ofTajikistanInternational Bond17
USD 7.125%Tadzhikistan
2.091,341,285Total -Tadzhikistan
340,000 321,348 0.5014.08.19Petroleum Co ofTrinidad & TobagoLtd 09
USD 9.750%Trinidad and Tobago
0.50321,348Total - Trinidad and Tobago
Securities Marketvalue in
USD
% of netassets*
Quantity Ccy Maturity
17,000,000 1,074,843 1.6726.11.57Czech RepublicGovernment Bond07
CZK 4.850%Czech Republic
1.671,074,843Total - Czech Republic
400,000 382,801 0.6014.06.25Turkey GovernmentInternational Bond17 EMTN
EUR 3.250%Turkey
300,000 177,897 0.2827.04.28Akbank Turk AS 18FRN
USD 6.797%
750,000 697,208 1.0914.11.21Global LimanIsletmeleri 14
USD 8.125%
1,400,000 1,154,593 1.8026.04.23RonesansGayrimenkul YatirimAS 18
USD 7.250%
500,000 328,080 0.5111.02.21Turkiye Halk BankasiAS 15
USD 4.750%
300,000 170,031 0.2629.06.28Turkiye Is BankasiAS 17 FRN
USD 7.000%
300,000 182,364 0.2829.03.27Turkiye SinaiKalkinma BankasiAS 17 FRN
USD 7.625%
400,000 290,664 0.4530.01.23Turkiye VakiflarBankasi TAO 18EMTN
USD 5.750%
5.273,383,638Total - Turkey
750,000 858,890 1.3417.02.24Banque Centrale deTunisie InternationalBond 17
EUR 5.625%Tunisia
1.34858,890Total - Tunisia
700,000 703,479 1.1023.04.30Abu Dhabi NationalEnergy Co PJSC 18
USD 4.875%United Arab Emirates
750,000 737,393 1.1424.04.28Oztel Holdings SPCLtd 18
USD 6.625%
2.241,440,872Total - United Arab Emirates
6,750,000,000 449,308 0.7014.03.23Inter-AmericanDevelopment Bank16 EMTN
IDR 7.875%United States
750,000 697,492 1.0927.06.25Stillwater Mining Co17
USD 7.125%
1.791,146,800Total - United States
925,000 610,870 0.9527.09.21O1 PropertiesFinance PLC 16
USD 8.250%Cyprus
73.7247,314,031Total - Transferable securities admitted to anofficial exchange
73.7247,314,031Total - Bonds
0.95610,870Total - Cyprus
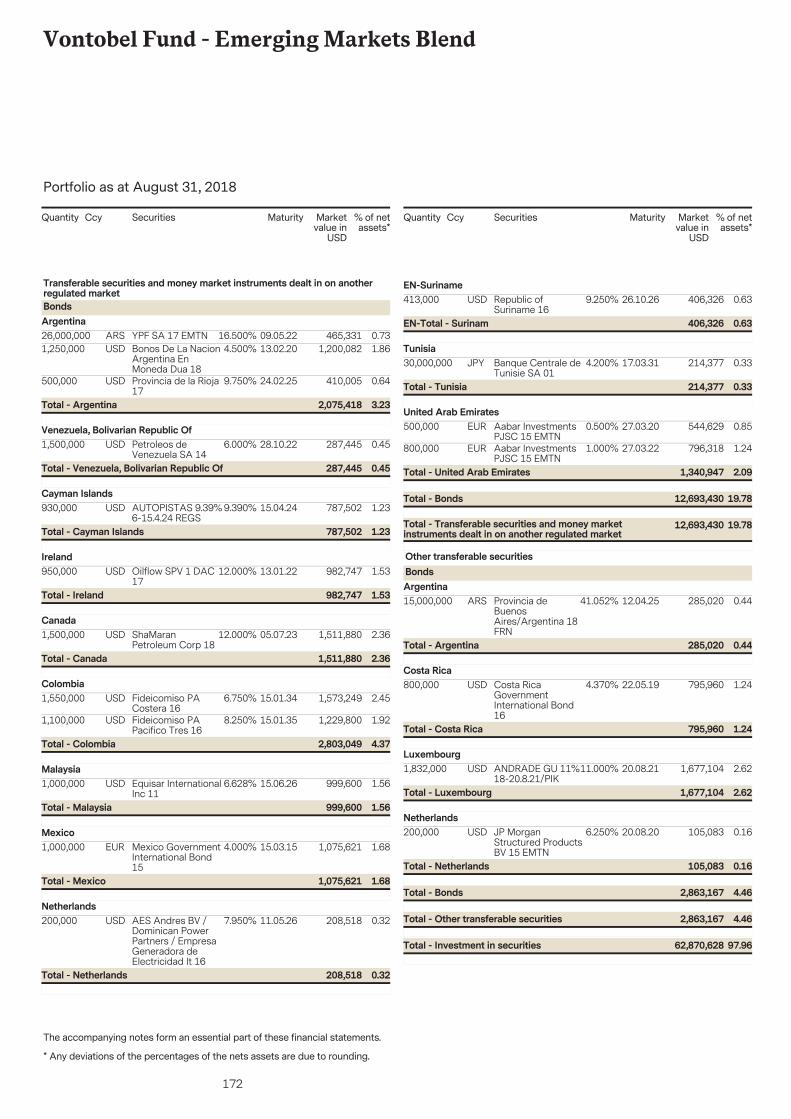
172
Vontobel Fund - Emerging Markets Blend
The accompanying notes form an essential part of these financial statements.
Portfolio as at August 31, 2018
* Any deviations of the percentages of the nets assets are due to rounding.
Securities Marketvalue in
USD
% of netassets*
Quantity Ccy Maturity
26,000,000 465,331 0.7309.05.22YPF SA 17 EMTNARS 16.500%
Transferable securities and money market instruments dealt in on anotherregulated marketBondsArgentina
1,250,000 1,200,082 1.8613.02.20Bonos De La NacionArgentina EnMoneda Dua 18
USD 4.500%
500,000 410,005 0.6424.02.25Provincia de la Rioja17
USD 9.750%
3.232,075,418Total - Argentina
1,500,000 287,445 0.4528.10.22Petroleos deVenezuela SA 14
USD 6.000%Venezuela, Bolivarian Republic Of
0.45287,445Total - Venezuela, Bolivarian Republic Of
930,000 787,502 1.2315.04.24AUTOPISTAS 9.39%6-15.4.24 REGS
USD 9.390%Cayman Islands
1.23787,502Total - Cayman Islands
950,000 982,747 1.5313.01.22Oilflow SPV 1 DAC17
USD 12.000%Ireland
1.53982,747Total - Ireland
1,500,000 1,511,880 2.3605.07.23ShaMaranPetroleum Corp 18
USD 12.000%Canada
2.361,511,880Total - Canada
1,550,000 1,573,249 2.4515.01.34Fideicomiso PACostera 16
USD 6.750%Colombia
1,100,000 1,229,800 1.9215.01.35Fideicomiso PAPacifico Tres 16
USD 8.250%
4.372,803,049Total - Colombia
1,000,000 999,600 1.5615.06.26Equisar InternationalInc 11
USD 6.628%Malaysia
1.56999,600Total - Malaysia
1,000,000 1,075,621 1.6815.03.15Mexico GovernmentInternational Bond15
EUR 4.000%Mexico
1.681,075,621Total - Mexico
200,000 208,518 0.3211.05.26AES Andres BV /Dominican PowerPartners / EmpresaGeneradora deElectricidad It 16
USD 7.950%Netherlands
0.32208,518Total - Netherlands
Securities Marketvalue in
USD
% of netassets*
Quantity Ccy Maturity
413,000 406,326 0.6326.10.26Republic ofSuriname 16
USD 9.250%EN-Suriname
0.63406,326EN-Total - Surinam
30,000,000 214,377 0.3317.03.31Banque Centrale deTunisie SA 01
JPY 4.200%Tunisia
0.33214,377Total - Tunisia
500,000 544,629 0.8527.03.20Aabar InvestmentsPJSC 15 EMTN
EUR 0.500%United Arab Emirates
800,000 796,318 1.2427.03.22Aabar InvestmentsPJSC 15 EMTN
EUR 1.000%
19.7812,693,430Total - Transferable securities and money marketinstruments dealt in on another regulated market
19.7812,693,430Total - Bonds
2.091,340,947Total - United Arab Emirates
15,000,000 285,020 0.4412.04.25Provincia deBuenosAires/Argentina 18FRN
ARS 41.052%
Other transferable securitiesBondsArgentina
0.44285,020Total - Argentina
800,000 795,960 1.2422.05.19Costa RicaGovernmentInternational Bond16
USD 4.370%Costa Rica
1.24795,960Total - Costa Rica
1,832,000 1,677,104 2.6220.08.21ANDRADE GU 11%18-20.8.21/PIK
USD 11.000%Luxembourg
2.621,677,104Total - Luxembourg
200,000 105,083 0.1620.08.20JP MorganStructured ProductsBV 15 EMTN
USD 6.250%Netherlands
4.462,863,167Total - Other transferable securities
4.462,863,167Total - Bonds
0.16105,083Total - Netherlands
97.9662,870,628Total - Investment in securities
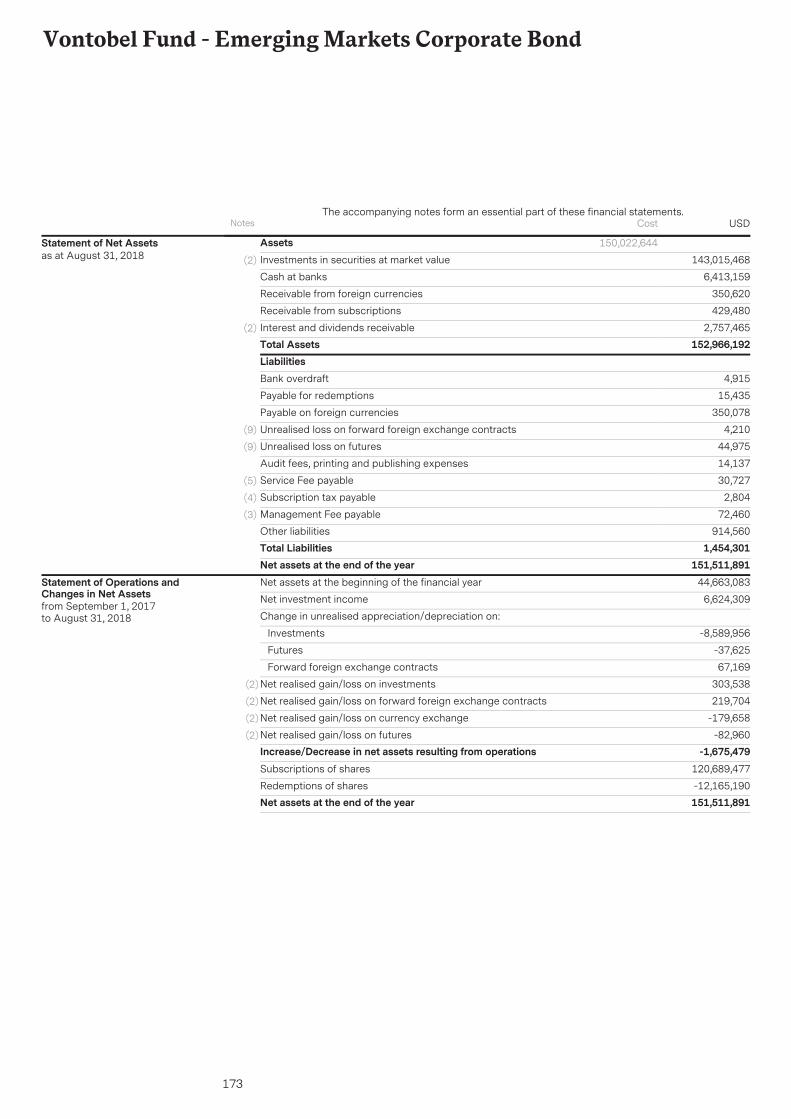
173
Vontobel Fund - Emerging Markets Corporate Bond
AssetsInvestments in securities at market value 143,015,468(2)
6,413,159Cash at banks
350,620Receivable from foreign currencies
429,480Receivable from subscriptions
2,757,465Interest and dividends receivable(2)
Total Assets 152,966,192
150,022,644Statement of Net Assetsas at August 31, 2018
LiabilitiesBank overdraft 4,915
Payable for redemptions 15,435
Payable on foreign currencies 350,078
Unrealised loss on forward foreign exchange contracts 4,210(9)
Unrealised loss on futures 44,975(9)
Audit fees, printing and publishing expenses 14,137
Service Fee payable 30,727(5)
Subscription tax payable 2,804(4)
Management Fee payable 72,460(3)
Other liabilities 914,560Total Liabilities 1,454,301Net assets at the end of the year 151,511,891Net assets at the beginning of the financial year 44,663,083
Net investment income 6,624,309
Change in unrealised appreciation/depreciation on:
Investments -8,589,956
Futures -37,625
Forward foreign exchange contracts 67,169
Net realised gain/loss on investments 303,538(2)
Net realised gain/loss on forward foreign exchange contracts 219,704(2)
Net realised gain/loss on currency exchange -179,658(2)
Net realised gain/loss on futures -82,960(2)
Increase/Decrease in net assets resulting from operations -1,675,479Subscriptions of shares 120,689,477
Redemptions of shares -12,165,190Net assets at the end of the year 151,511,891
Statement of Operations andChanges in Net Assetsfrom September 1, 2017to August 31, 2018
Notes USDThe accompanying notes form an essential part of these financial statements.
Cost
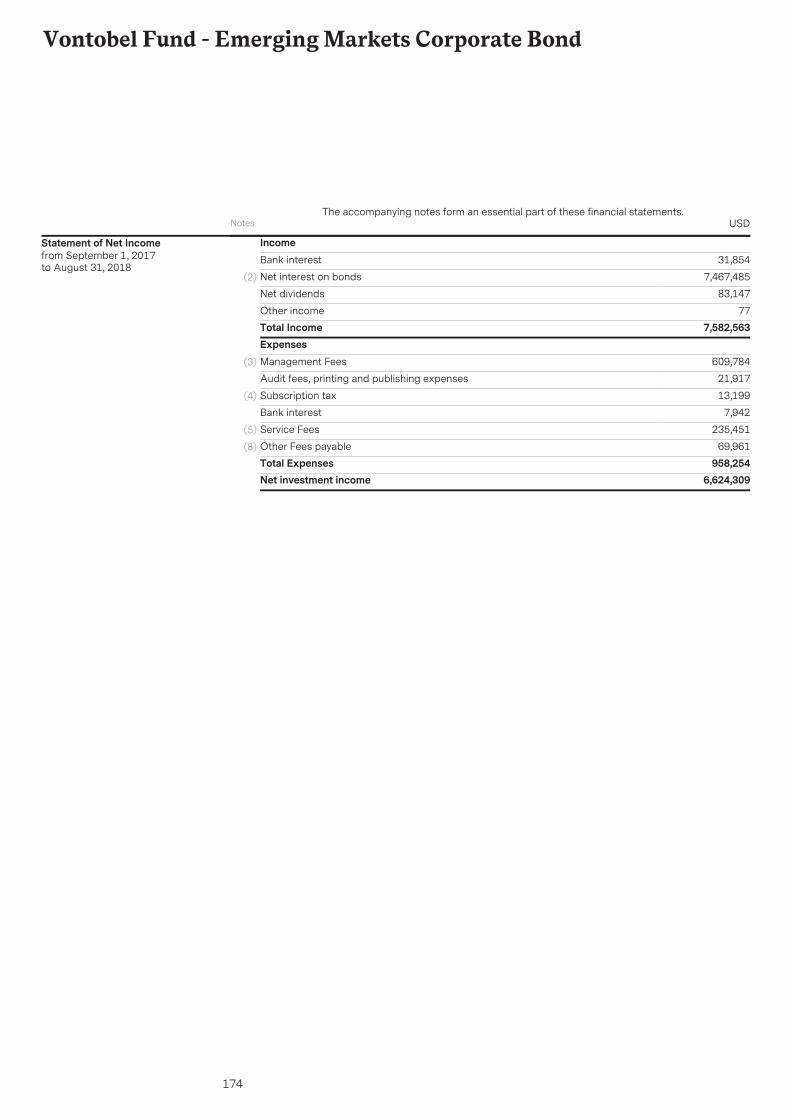
174
Vontobel Fund - Emerging Markets Corporate Bond
IncomeBank interest 31,854
Net interest on bonds 7,467,485(2)
Net dividends 83,147
Other income 77Total Income 7,582,563ExpensesManagement Fees 609,784(3)
Audit fees, printing and publishing expenses 21,917
Subscription tax 13,199(4)
Bank interest 7,942
Service Fees 235,451(5)
Other Fees payable 69,961(8)
Total Expenses 958,254Net investment income 6,624,309
Statement of Net Incomefrom September 1, 2017to August 31, 2018
Notes USDThe accompanying notes form an essential part of these financial statements.
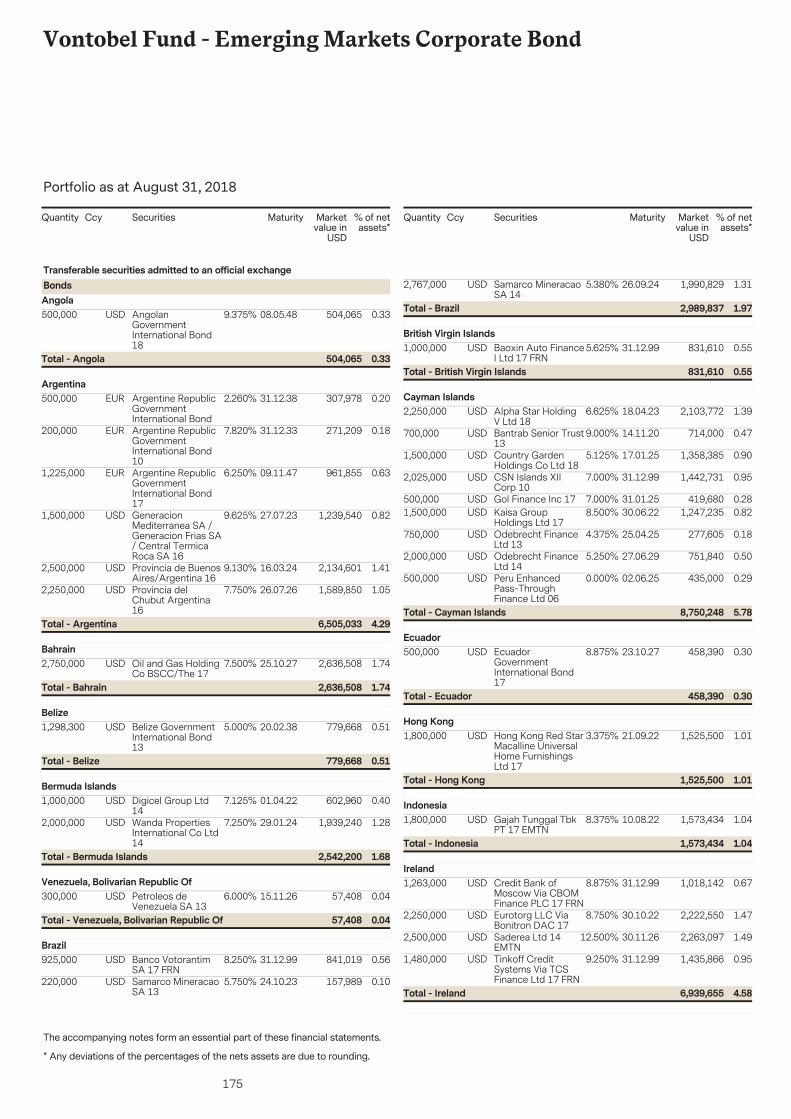
175
Vontobel Fund - Emerging Markets Corporate Bond
The accompanying notes form an essential part of these financial statements.
Portfolio as at August 31, 2018
* Any deviations of the percentages of the nets assets are due to rounding.
Securities Marketvalue in
USD
% of netassets*
Quantity Ccy Maturity
500,000 504,065 0.3308.05.48AngolanGovernmentInternational Bond18
USD 9.375%
Transferable securities admitted to an official exchangeBondsAngola
0.33504,065Total - Angola
500,000 307,978 0.2031.12.38Argentine RepublicGovernmentInternational Bond
EUR 2.260%Argentina
200,000 271,209 0.1831.12.33Argentine RepublicGovernmentInternational Bond10
EUR 7.820%
1,225,000 961,855 0.6309.11.47Argentine RepublicGovernmentInternational Bond17
EUR 6.250%
1,500,000 1,239,540 0.8227.07.23GeneracionMediterranea SA /Generacion Frias SA/ Central TermicaRoca SA 16
USD 9.625%
2,500,000 2,134,601 1.4116.03.24Provincia de BuenosAires/Argentina 16
USD 9.130%
2,250,000 1,589,850 1.0526.07.26Provincia delChubut Argentina16
USD 7.750%
4.296,505,033Total - Argentina
2,750,000 2,636,508 1.7425.10.27Oil and Gas HoldingCo BSCC/The 17
USD 7.500%Bahrain
1.742,636,508Total - Bahrain
1,298,300 779,668 0.5120.02.38Belize GovernmentInternational Bond13
USD 5.000%Belize
0.51779,668Total - Belize
1,000,000 602,960 0.4001.04.22Digicel Group Ltd14
USD 7.125%Bermuda Islands
2,000,000 1,939,240 1.2829.01.24Wanda PropertiesInternational Co Ltd14
USD 7.250%
1.682,542,200Total - Bermuda Islands
300,000 57,408 0.0415.11.26Petroleos deVenezuela SA 13
USD 6.000%Venezuela, Bolivarian Republic Of
0.0457,408Total - Venezuela, Bolivarian Republic Of
925,000 841,019 0.5631.12.99Banco VotorantimSA 17 FRN
USD 8.250%Brazil
220,000 157,989 0.1024.10.23Samarco MineracaoSA 13
USD 5.750%
Securities Marketvalue in
USD
% of netassets*
Quantity Ccy Maturity
2,767,000 1,990,829 1.3126.09.24Samarco MineracaoSA 14
USD 5.380%
1.972,989,837Total - Brazil
1,000,000 831,610 0.5531.12.99Baoxin Auto FinanceI Ltd 17 FRN
USD 5.625%British Virgin Islands
0.55831,610Total - British Virgin Islands
2,250,000 2,103,772 1.3918.04.23Alpha Star HoldingV Ltd 18
USD 6.625%Cayman Islands
700,000 714,000 0.4714.11.20Bantrab Senior Trust13
USD 9.000%
1,500,000 1,358,385 0.9017.01.25Country GardenHoldings Co Ltd 18
USD 5.125%
2,025,000 1,442,731 0.9531.12.99CSN Islands XIICorp 10
USD 7.000%
500,000 419,680 0.2831.01.25Gol Finance Inc 17USD 7.000%1,500,000 1,247,235 0.8230.06.22Kaisa Group
Holdings Ltd 17USD 8.500%
750,000 277,605 0.1825.04.25Odebrecht FinanceLtd 13
USD 4.375%
2,000,000 751,840 0.5027.06.29Odebrecht FinanceLtd 14
USD 5.250%
500,000 435,000 0.2902.06.25Peru EnhancedPass-ThroughFinance Ltd 06
USD 0.000%
5.788,750,248Total - Cayman Islands
500,000 458,390 0.3023.10.27EcuadorGovernmentInternational Bond17
USD 8.875%Ecuador
0.30458,390Total - Ecuador
1,800,000 1,525,500 1.0121.09.22Hong Kong Red StarMacalline UniversalHome FurnishingsLtd 17
USD 3.375%Hong Kong
1.011,525,500Total - Hong Kong
1,800,000 1,573,434 1.0410.08.22Gajah Tunggal TbkPT 17 EMTN
USD 8.375%Indonesia
1.041,573,434Total - Indonesia
1,263,000 1,018,142 0.6731.12.99Credit Bank ofMoscow Via CBOMFinance PLC 17 FRN
USD 8.875%Ireland
2,250,000 2,222,550 1.4730.10.22Eurotorg LLC ViaBonitron DAC 17
USD 8.750%
2,500,000 2,263,097 1.4930.11.26Saderea Ltd 14EMTN
USD 12.500%
1,480,000 1,435,866 0.9531.12.99Tinkoff CreditSystems Via TCSFinance Ltd 17 FRN
USD 9.250%
4.586,939,655Total - Ireland
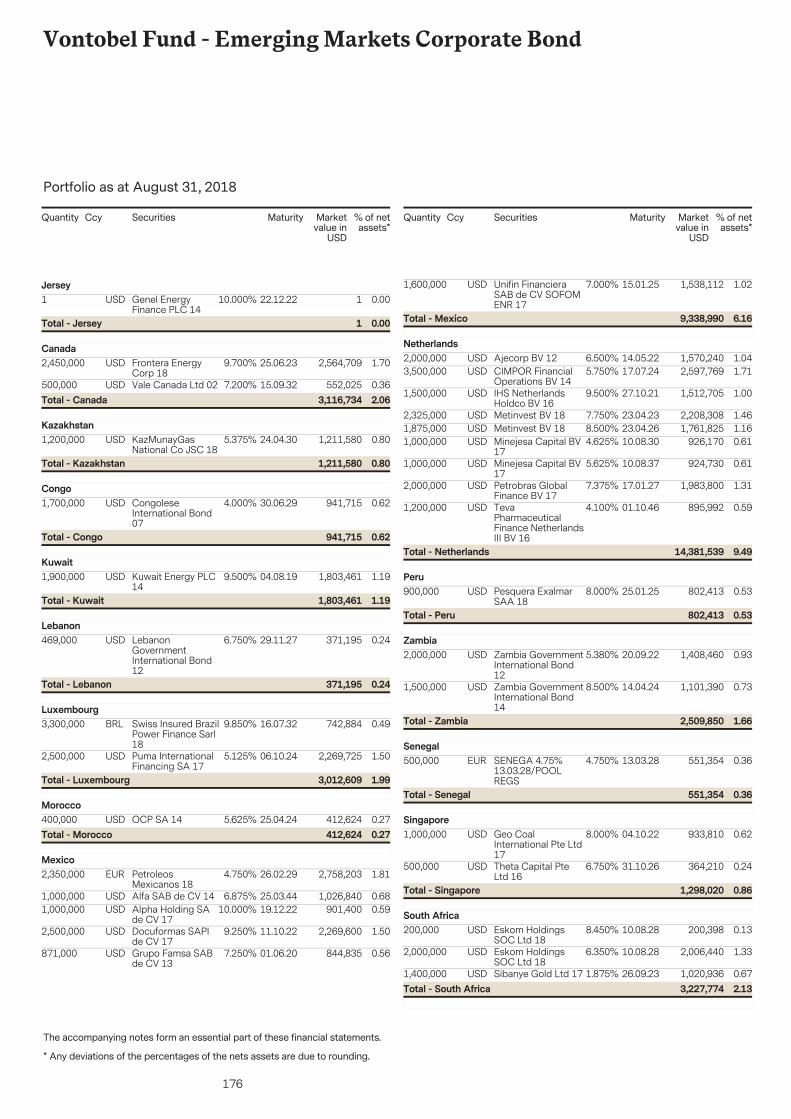
176
Vontobel Fund - Emerging Markets Corporate Bond
The accompanying notes form an essential part of these financial statements.
Portfolio as at August 31, 2018
* Any deviations of the percentages of the nets assets are due to rounding.
Securities Marketvalue in
USD
% of netassets*
Quantity Ccy Maturity
1 1 0.0022.12.22Genel EnergyFinance PLC 14
USD 10.000%Jersey
0.001Total - Jersey
2,450,000 2,564,709 1.7025.06.23Frontera EnergyCorp 18
USD 9.700%Canada
500,000 552,025 0.3615.09.32Vale Canada Ltd 02USD 7.200%2.063,116,734Total - Canada
1,200,000 1,211,580 0.8024.04.30KazMunayGasNational Co JSC 18
USD 5.375%Kazakhstan
0.801,211,580Total - Kazakhstan
1,700,000 941,715 0.6230.06.29CongoleseInternational Bond07
USD 4.000%Congo
0.62941,715Total - Congo
1,900,000 1,803,461 1.1904.08.19Kuwait Energy PLC14
USD 9.500%Kuwait
1.191,803,461Total - Kuwait
469,000 371,195 0.2429.11.27LebanonGovernmentInternational Bond12
USD 6.750%Lebanon
0.24371,195Total - Lebanon
3,300,000 742,884 0.4916.07.32Swiss Insured BrazilPower Finance Sarl18
BRL 9.850%Luxembourg
2,500,000 2,269,725 1.5006.10.24Puma InternationalFinancing SA 17
USD 5.125%
1.993,012,609Total - Luxembourg
400,000 412,624 0.2725.04.24OCP SA 14USD 5.625%Morocco
0.27412,624Total - Morocco
2,350,000 2,758,203 1.8126.02.29PetroleosMexicanos 18
EUR 4.750%Mexico
1,000,000 1,026,840 0.6825.03.44Alfa SAB de CV 14USD 6.875%1,000,000 901,400 0.5919.12.22Alpha Holding SA
de CV 17USD 10.000%
2,500,000 2,269,600 1.5011.10.22Docuformas SAPIde CV 17
USD 9.250%
871,000 844,835 0.5601.06.20Grupo Famsa SABde CV 13
USD 7.250%
Securities Marketvalue in
USD
% of netassets*
Quantity Ccy Maturity
1,600,000 1,538,112 1.0215.01.25Unifin FinancieraSAB de CV SOFOMENR 17
USD 7.000%
6.169,338,990Total - Mexico
2,000,000 1,570,240 1.0414.05.22Ajecorp BV 12USD 6.500%Netherlands
3,500,000 2,597,769 1.7117.07.24CIMPOR FinancialOperations BV 14
USD 5.750%
1,500,000 1,512,705 1.0027.10.21IHS NetherlandsHoldco BV 16
USD 9.500%
2,325,000 2,208,308 1.4623.04.23Metinvest BV 18USD 7.750%1,875,000 1,761,825 1.1623.04.26Metinvest BV 18USD 8.500%1,000,000 926,170 0.6110.08.30Minejesa Capital BV
17USD 4.625%
1,000,000 924,730 0.6110.08.37Minejesa Capital BV17
USD 5.625%
2,000,000 1,983,800 1.3117.01.27Petrobras GlobalFinance BV 17
USD 7.375%
1,200,000 895,992 0.5901.10.46TevaPharmaceuticalFinance NetherlandsIII BV 16
USD 4.100%
9.4914,381,539Total - Netherlands
900,000 802,413 0.5325.01.25Pesquera ExalmarSAA 18
USD 8.000%Peru
0.53802,413Total - Peru
2,000,000 1,408,460 0.9320.09.22Zambia GovernmentInternational Bond12
USD 5.380%Zambia
1,500,000 1,101,390 0.7314.04.24Zambia GovernmentInternational Bond14
USD 8.500%
1.662,509,850Total - Zambia
500,000 551,354 0.3613.03.28SENEGA 4.75%13.03.28/POOLREGS
EUR 4.750%Senegal
0.36551,354Total - Senegal
1,000,000 933,810 0.6204.10.22Geo CoalInternational Pte Ltd17
USD 8.000%Singapore
500,000 364,210 0.2431.10.26Theta Capital PteLtd 16
USD 6.750%
0.861,298,020Total - Singapore
200,000 200,398 0.1310.08.28Eskom HoldingsSOC Ltd 18
USD 8.450%South Africa
2,000,000 2,006,440 1.3310.08.28Eskom HoldingsSOC Ltd 18
USD 6.350%
1,400,000 1,020,936 0.6726.09.23Sibanye Gold Ltd 17USD 1.875%2.133,227,774Total - South Africa
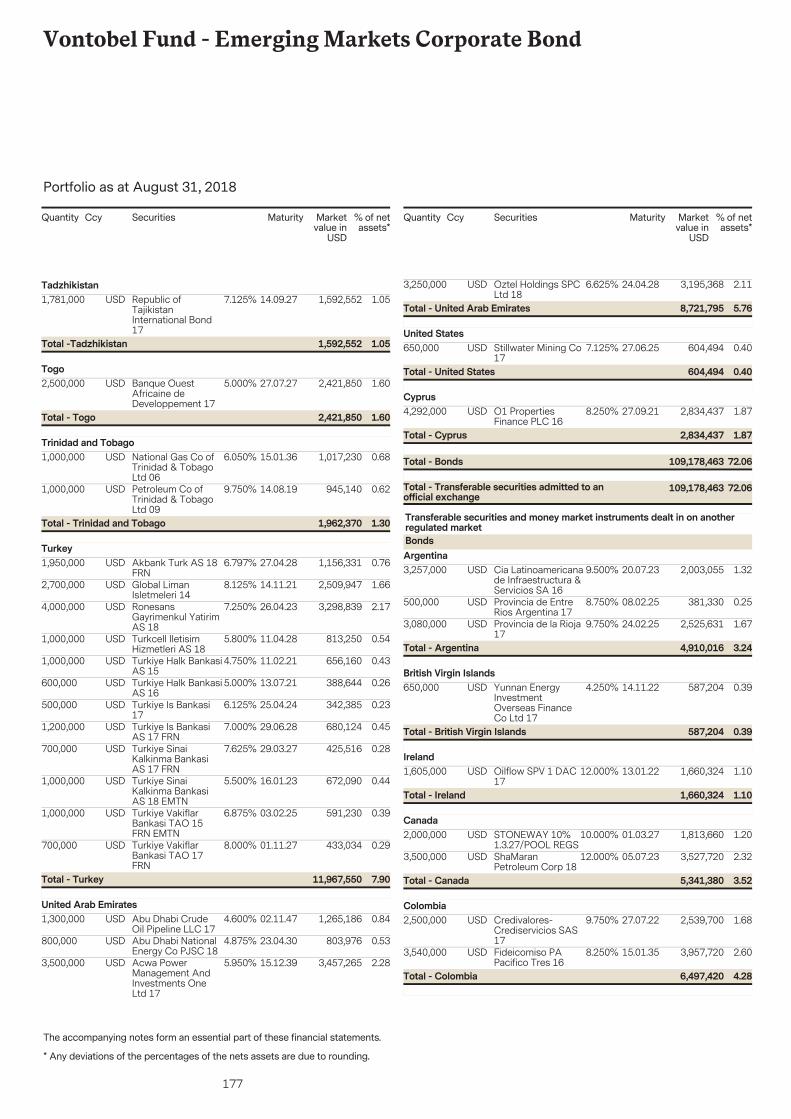
177
Vontobel Fund - Emerging Markets Corporate Bond
The accompanying notes form an essential part of these financial statements.
Portfolio as at August 31, 2018
* Any deviations of the percentages of the nets assets are due to rounding.
Securities Marketvalue in
USD
% of netassets*
Quantity Ccy Maturity
1,781,000 1,592,552 1.0514.09.27Republic ofTajikistanInternational Bond17
USD 7.125%Tadzhikistan
1.051,592,552Total -Tadzhikistan
2,500,000 2,421,850 1.6027.07.27Banque OuestAfricaine deDeveloppement 17
USD 5.000%Togo
1.602,421,850Total - Togo
1,000,000 1,017,230 0.6815.01.36National Gas Co ofTrinidad & TobagoLtd 06
USD 6.050%Trinidad and Tobago
1,000,000 945,140 0.6214.08.19Petroleum Co ofTrinidad & TobagoLtd 09
USD 9.750%
1.301,962,370Total - Trinidad and Tobago
1,950,000 1,156,331 0.7627.04.28Akbank Turk AS 18FRN
USD 6.797%Turkey
2,700,000 2,509,947 1.6614.11.21Global LimanIsletmeleri 14
USD 8.125%
4,000,000 3,298,839 2.1726.04.23RonesansGayrimenkul YatirimAS 18
USD 7.250%
1,000,000 813,250 0.5411.04.28Turkcell IletisimHizmetleri AS 18
USD 5.800%
1,000,000 656,160 0.4311.02.21Turkiye Halk BankasiAS 15
USD 4.750%
600,000 388,644 0.2613.07.21Turkiye Halk BankasiAS 16
USD 5.000%
500,000 342,385 0.2325.04.24Turkiye Is Bankasi17
USD 6.125%
1,200,000 680,124 0.4529.06.28Turkiye Is BankasiAS 17 FRN
USD 7.000%
700,000 425,516 0.2829.03.27Turkiye SinaiKalkinma BankasiAS 17 FRN
USD 7.625%
1,000,000 672,090 0.4416.01.23Turkiye SinaiKalkinma BankasiAS 18 EMTN
USD 5.500%
1,000,000 591,230 0.3903.02.25Turkiye VakiflarBankasi TAO 15FRN EMTN
USD 6.875%
700,000 433,034 0.2901.11.27Turkiye VakiflarBankasi TAO 17FRN
USD 8.000%
7.9011,967,550Total - Turkey
1,300,000 1,265,186 0.8402.11.47Abu Dhabi CrudeOil Pipeline LLC 17
USD 4.600%United Arab Emirates
800,000 803,976 0.5323.04.30Abu Dhabi NationalEnergy Co PJSC 18
USD 4.875%
3,500,000 3,457,265 2.2815.12.39Acwa PowerManagement AndInvestments OneLtd 17
USD 5.950%
Securities Marketvalue in
USD
% of netassets*
Quantity Ccy Maturity
3,250,000 3,195,368 2.1124.04.28Oztel Holdings SPCLtd 18
USD 6.625%
5.768,721,795Total - United Arab Emirates
650,000 604,494 0.4027.06.25Stillwater Mining Co17
USD 7.125%United States
0.40604,494Total - United States
4,292,000 2,834,437 1.8727.09.21O1 PropertiesFinance PLC 16
USD 8.250%Cyprus
72.06109,178,463Total - Transferable securities admitted to anofficial exchange
72.06109,178,463Total - Bonds
1.872,834,437Total - Cyprus
3,257,000 2,003,055 1.3220.07.23Cia Latinoamericanade Infraestructura &Servicios SA 16
USD 9.500%
Transferable securities and money market instruments dealt in on anotherregulated marketBondsArgentina
500,000 381,330 0.2508.02.25Provincia de EntreRios Argentina 17
USD 8.750%
3,080,000 2,525,631 1.6724.02.25Provincia de la Rioja17
USD 9.750%
3.244,910,016Total - Argentina
650,000 587,204 0.3914.11.22Yunnan EnergyInvestmentOverseas FinanceCo Ltd 17
USD 4.250%British Virgin Islands
0.39587,204Total - British Virgin Islands
1,605,000 1,660,324 1.1013.01.22Oilflow SPV 1 DAC17
USD 12.000%Ireland
1.101,660,324Total - Ireland
2,000,000 1,813,660 1.2001.03.27STONEWAY 10%1.3.27/POOL REGS
USD 10.000%Canada
3,500,000 3,527,720 2.3205.07.23ShaMaranPetroleum Corp 18
USD 12.000%
3.525,341,380Total - Canada
2,500,000 2,539,700 1.6827.07.22Credivalores-Crediservicios SAS17
USD 9.750%Colombia
3,540,000 3,957,720 2.6015.01.35Fideicomiso PAPacifico Tres 16
USD 8.250%
4.286,497,420Total - Colombia
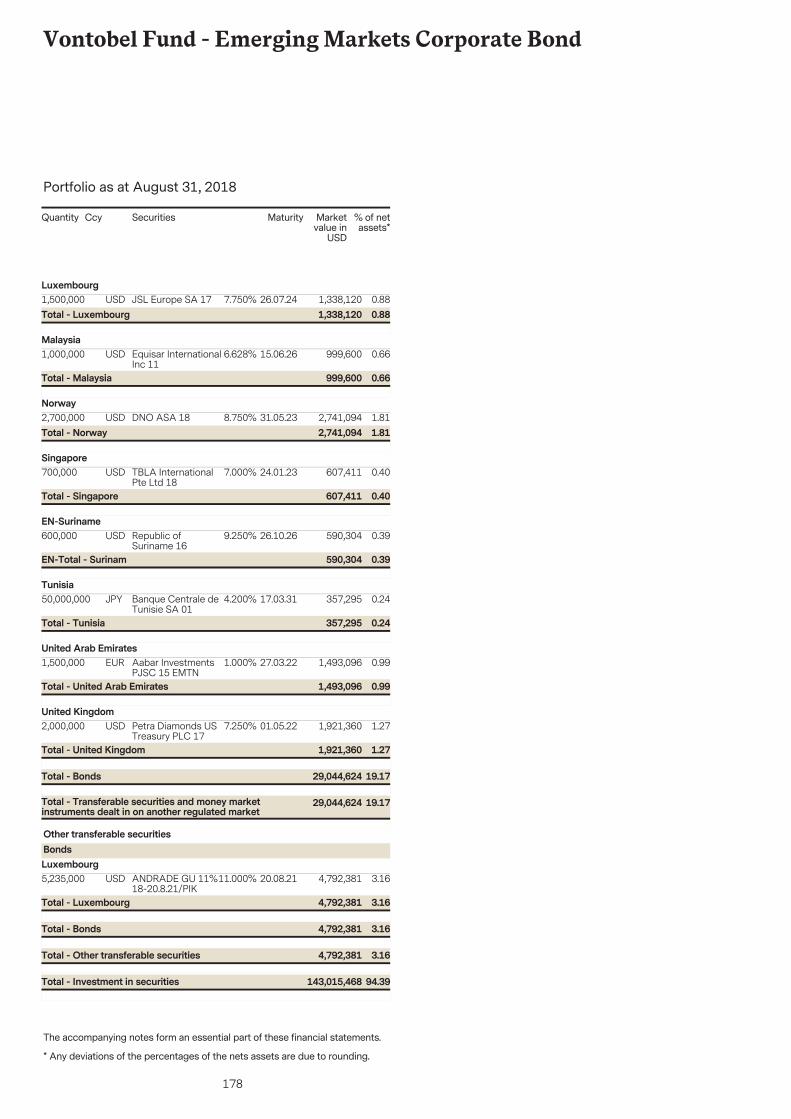
178
Vontobel Fund - Emerging Markets Corporate Bond
The accompanying notes form an essential part of these financial statements.
Portfolio as at August 31, 2018
* Any deviations of the percentages of the nets assets are due to rounding.
Securities Marketvalue in
USD
% of netassets*
Quantity Ccy Maturity
1,500,000 1,338,120 0.8826.07.24JSL Europe SA 17USD 7.750%Luxembourg
0.881,338,120Total - Luxembourg
1,000,000 999,600 0.6615.06.26Equisar InternationalInc 11
USD 6.628%Malaysia
0.66999,600Total - Malaysia
2,700,000 2,741,094 1.8131.05.23DNO ASA 18USD 8.750%Norway
1.812,741,094Total - Norway
700,000 607,411 0.4024.01.23TBLA InternationalPte Ltd 18
USD 7.000%Singapore
0.40607,411Total - Singapore
600,000 590,304 0.3926.10.26Republic ofSuriname 16
USD 9.250%EN-Suriname
0.39590,304EN-Total - Surinam
50,000,000 357,295 0.2417.03.31Banque Centrale deTunisie SA 01
JPY 4.200%Tunisia
0.24357,295Total - Tunisia
1,500,000 1,493,096 0.9927.03.22Aabar InvestmentsPJSC 15 EMTN
EUR 1.000%United Arab Emirates
0.991,493,096Total - United Arab Emirates
2,000,000 1,921,360 1.2701.05.22Petra Diamonds USTreasury PLC 17
USD 7.250%United Kingdom
19.1729,044,624Total - Transferable securities and money marketinstruments dealt in on another regulated market
19.1729,044,624Total - Bonds
1.271,921,360Total - United Kingdom
5,235,000 4,792,381 3.1620.08.21ANDRADE GU 11%18-20.8.21/PIK
USD 11.000%
Other transferable securitiesBondsLuxembourg
3.164,792,381Total - Other transferable securities
3.164,792,381Total - Bonds
3.164,792,381Total - Luxembourg
94.39143,015,468Total - Investment in securities
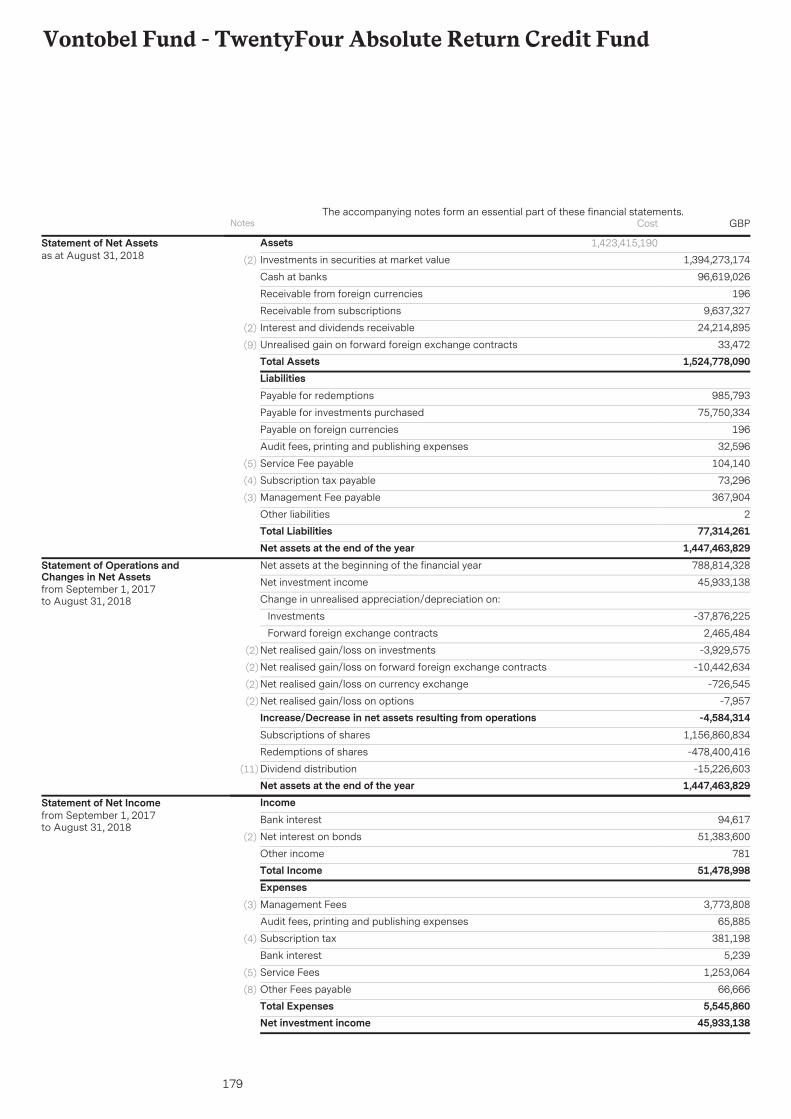
179
Vontobel Fund - TwentyFour Absolute Return Credit Fund
AssetsInvestments in securities at market value 1,394,273,174(2)
96,619,026Cash at banks
196Receivable from foreign currencies
9,637,327Receivable from subscriptions
24,214,895Interest and dividends receivable(2)
33,472Unrealised gain on forward foreign exchange contracts(9)
Total Assets 1,524,778,090
1,423,415,190Statement of Net Assetsas at August 31, 2018
LiabilitiesPayable for redemptions 985,793
Payable for investments purchased 75,750,334
Payable on foreign currencies 196
Audit fees, printing and publishing expenses 32,596
Service Fee payable 104,140(5)
Subscription tax payable 73,296(4)
Management Fee payable 367,904(3)
Other liabilities 2Total Liabilities 77,314,261Net assets at the end of the year 1,447,463,829Net assets at the beginning of the financial year 788,814,328
Net investment income 45,933,138
Change in unrealised appreciation/depreciation on:
Investments -37,876,225
Forward foreign exchange contracts 2,465,484
Net realised gain/loss on investments -3,929,575(2)
Net realised gain/loss on forward foreign exchange contracts -10,442,634(2)
Net realised gain/loss on currency exchange -726,545(2)
Net realised gain/loss on options -7,957(2)
Increase/Decrease in net assets resulting from operations -4,584,314Subscriptions of shares 1,156,860,834
Redemptions of shares -478,400,416
Dividend distribution -15,226,603(11)
Net assets at the end of the year 1,447,463,829
Statement of Operations andChanges in Net Assetsfrom September 1, 2017to August 31, 2018
IncomeBank interest 94,617
Net interest on bonds 51,383,600(2)
Other income 781Total Income 51,478,998ExpensesManagement Fees 3,773,808(3)
Audit fees, printing and publishing expenses 65,885
Subscription tax 381,198(4)
Bank interest 5,239
Service Fees 1,253,064(5)
Other Fees payable 66,666(8)
Total Expenses 5,545,860Net investment income 45,933,138
Statement of Net Incomefrom September 1, 2017to August 31, 2018
Notes GBPThe accompanying notes form an essential part of these financial statements.
Cost
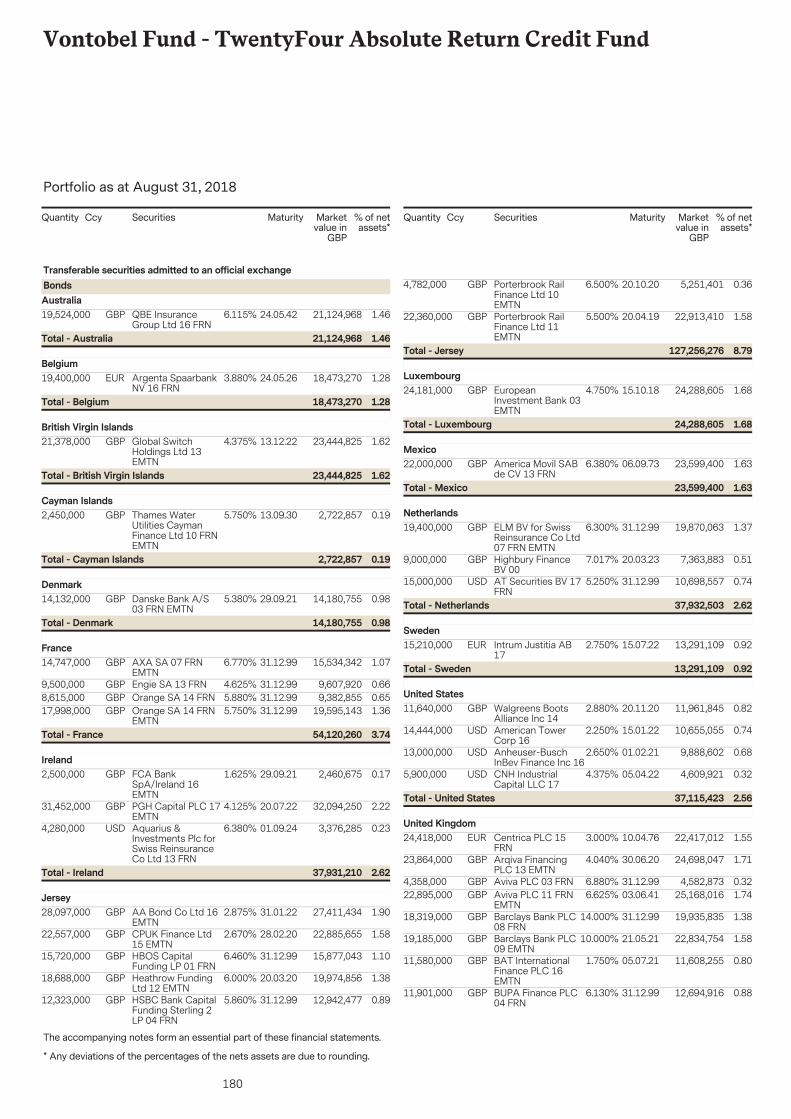
180
Vontobel Fund - TwentyFour Absolute Return Credit Fund
The accompanying notes form an essential part of these financial statements.
Portfolio as at August 31, 2018
* Any deviations of the percentages of the nets assets are due to rounding.
Securities Marketvalue in
GBP
% of netassets*
Quantity Ccy Maturity
19,524,000 21,124,968 1.4624.05.42QBE InsuranceGroup Ltd 16 FRN
GBP 6.115%
Transferable securities admitted to an official exchangeBondsAustralia
1.4621,124,968Total - Australia
19,400,000 18,473,270 1.2824.05.26Argenta SpaarbankNV 16 FRN
EUR 3.880%Belgium
1.2818,473,270Total - Belgium
21,378,000 23,444,825 1.6213.12.22Global SwitchHoldings Ltd 13EMTN
GBP 4.375%British Virgin Islands
1.6223,444,825Total - British Virgin Islands
2,450,000 2,722,857 0.1913.09.30Thames WaterUtilities CaymanFinance Ltd 10 FRNEMTN
GBP 5.750%Cayman Islands
0.192,722,857Total - Cayman Islands
14,132,000 14,180,755 0.9829.09.21Danske Bank A/S03 FRN EMTN
GBP 5.380%Denmark
0.9814,180,755Total - Denmark
14,747,000 15,534,342 1.0731.12.99AXA SA 07 FRNEMTN
GBP 6.770%France
9,500,000 9,607,920 0.6631.12.99Engie SA 13 FRNGBP 4.625%8,615,000 9,382,855 0.6531.12.99Orange SA 14 FRNGBP 5.880%17,998,000 19,595,143 1.3631.12.99Orange SA 14 FRN
EMTNGBP 5.750%
3.7454,120,260Total - France
2,500,000 2,460,675 0.1729.09.21FCA BankSpA/Ireland 16EMTN
GBP 1.625%Ireland
31,452,000 32,094,250 2.2220.07.22PGH Capital PLC 17EMTN
GBP 4.125%
4,280,000 3,376,285 0.2301.09.24Aquarius &Investments Plc forSwiss ReinsuranceCo Ltd 13 FRN
USD 6.380%
2.6237,931,210Total - Ireland
28,097,000 27,411,434 1.9031.01.22AA Bond Co Ltd 16EMTN
GBP 2.875%Jersey
22,557,000 22,885,655 1.5828.02.20CPUK Finance Ltd15 EMTN
GBP 2.670%
15,720,000 15,877,043 1.1031.12.99HBOS CapitalFunding LP 01 FRN
GBP 6.460%
18,688,000 19,974,856 1.3820.03.20Heathrow FundingLtd 12 EMTN
GBP 6.000%
12,323,000 12,942,477 0.8931.12.99HSBC Bank CapitalFunding Sterling 2LP 04 FRN
GBP 5.860%
Securities Marketvalue in
GBP
% of netassets*
Quantity Ccy Maturity
4,782,000 5,251,401 0.3620.10.20Porterbrook RailFinance Ltd 10EMTN
GBP 6.500%
22,360,000 22,913,410 1.5820.04.19Porterbrook RailFinance Ltd 11EMTN
GBP 5.500%
8.79127,256,276Total - Jersey
24,181,000 24,288,605 1.6815.10.18EuropeanInvestment Bank 03EMTN
GBP 4.750%Luxembourg
1.6824,288,605Total - Luxembourg
22,000,000 23,599,400 1.6306.09.73America Movil SABde CV 13 FRN
GBP 6.380%Mexico
1.6323,599,400Total - Mexico
19,400,000 19,870,063 1.3731.12.99ELM BV for SwissReinsurance Co Ltd07 FRN EMTN
GBP 6.300%Netherlands
9,000,000 7,363,883 0.5120.03.23Highbury FinanceBV 00
GBP 7.017%
15,000,000 10,698,557 0.7431.12.99AT Securities BV 17FRN
USD 5.250%
2.6237,932,503Total - Netherlands
15,210,000 13,291,109 0.9215.07.22Intrum Justitia AB17
EUR 2.750%Sweden
0.9213,291,109Total - Sweden
11,640,000 11,961,845 0.8220.11.20Walgreens BootsAlliance Inc 14
GBP 2.880%United States
14,444,000 10,655,055 0.7415.01.22American TowerCorp 16
USD 2.250%
13,000,000 9,888,602 0.6801.02.21Anheuser-BuschInBev Finance Inc 16
USD 2.650%
5,900,000 4,609,921 0.3205.04.22CNH IndustrialCapital LLC 17
USD 4.375%
2.5637,115,423Total - United States
24,418,000 22,417,012 1.5510.04.76Centrica PLC 15FRN
EUR 3.000%United Kingdom
23,864,000 24,698,047 1.7130.06.20Arqiva FinancingPLC 13 EMTN
GBP 4.040%
4,358,000 4,582,873 0.3231.12.99Aviva PLC 03 FRNGBP 6.880%22,895,000 25,168,016 1.7403.06.41Aviva PLC 11 FRN
EMTNGBP 6.625%
18,319,000 19,935,835 1.3831.12.99Barclays Bank PLC08 FRN
GBP 14.000%
19,185,000 22,834,754 1.5821.05.21Barclays Bank PLC09 EMTN
GBP 10.000%
11,580,000 11,608,255 0.8005.07.21BAT InternationalFinance PLC 16EMTN
GBP 1.750%
11,901,000 12,694,916 0.8831.12.99BUPA Finance PLC04 FRN
GBP 6.130%
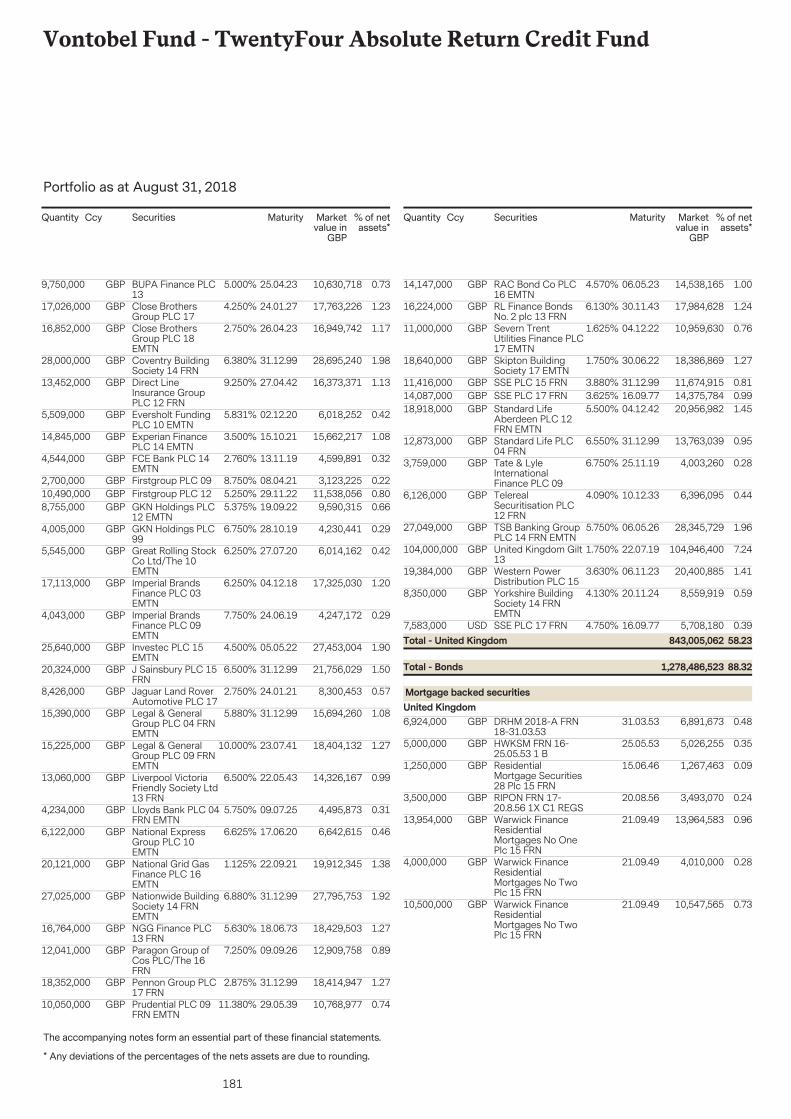
181
Vontobel Fund - TwentyFour Absolute Return Credit Fund
The accompanying notes form an essential part of these financial statements.
Portfolio as at August 31, 2018
* Any deviations of the percentages of the nets assets are due to rounding.
Securities Marketvalue in
GBP
% of netassets*
Quantity Ccy Maturity
9,750,000 10,630,718 0.7325.04.23BUPA Finance PLC13
GBP 5.000%
17,026,000 17,763,226 1.2324.01.27Close BrothersGroup PLC 17
GBP 4.250%
16,852,000 16,949,742 1.1726.04.23Close BrothersGroup PLC 18EMTN
GBP 2.750%
28,000,000 28,695,240 1.9831.12.99Coventry BuildingSociety 14 FRN
GBP 6.380%
13,452,000 16,373,371 1.1327.04.42Direct LineInsurance GroupPLC 12 FRN
GBP 9.250%
5,509,000 6,018,252 0.4202.12.20Eversholt FundingPLC 10 EMTN
GBP 5.831%
14,845,000 15,662,217 1.0815.10.21Experian FinancePLC 14 EMTN
GBP 3.500%
4,544,000 4,599,891 0.3213.11.19FCE Bank PLC 14EMTN
GBP 2.760%
2,700,000 3,123,225 0.2208.04.21Firstgroup PLC 09GBP 8.750%10,490,000 11,538,056 0.8029.11.22Firstgroup PLC 12GBP 5.250%8,755,000 9,590,315 0.6619.09.22GKN Holdings PLC
12 EMTNGBP 5.375%
4,005,000 4,230,441 0.2928.10.19GKN Holdings PLC99
GBP 6.750%
5,545,000 6,014,162 0.4227.07.20Great Rolling StockCo Ltd/The 10EMTN
GBP 6.250%
17,113,000 17,325,030 1.2004.12.18Imperial BrandsFinance PLC 03EMTN
GBP 6.250%
4,043,000 4,247,172 0.2924.06.19Imperial BrandsFinance PLC 09EMTN
GBP 7.750%
25,640,000 27,453,004 1.9005.05.22Investec PLC 15EMTN
GBP 4.500%
20,324,000 21,756,029 1.5031.12.99J Sainsbury PLC 15FRN
GBP 6.500%
8,426,000 8,300,453 0.5724.01.21Jaguar Land RoverAutomotive PLC 17
GBP 2.750%
15,390,000 15,694,260 1.0831.12.99Legal & GeneralGroup PLC 04 FRNEMTN
GBP 5.880%
15,225,000 18,404,132 1.2723.07.41Legal & GeneralGroup PLC 09 FRNEMTN
GBP 10.000%
13,060,000 14,326,167 0.9922.05.43Liverpool VictoriaFriendly Society Ltd13 FRN
GBP 6.500%
4,234,000 4,495,873 0.3109.07.25Lloyds Bank PLC 04FRN EMTN
GBP 5.750%
6,122,000 6,642,615 0.4617.06.20National ExpressGroup PLC 10EMTN
GBP 6.625%
20,121,000 19,912,345 1.3822.09.21National Grid GasFinance PLC 16EMTN
GBP 1.125%
27,025,000 27,795,753 1.9231.12.99Nationwide BuildingSociety 14 FRNEMTN
GBP 6.880%
16,764,000 18,429,503 1.2718.06.73NGG Finance PLC13 FRN
GBP 5.630%
12,041,000 12,909,758 0.8909.09.26Paragon Group ofCos PLC/The 16FRN
GBP 7.250%
18,352,000 18,414,947 1.2731.12.99Pennon Group PLC17 FRN
GBP 2.875%
10,050,000 10,768,977 0.7429.05.39Prudential PLC 09FRN EMTN
GBP 11.380%
Securities Marketvalue in
GBP
% of netassets*
Quantity Ccy Maturity
14,147,000 14,538,165 1.0006.05.23RAC Bond Co PLC16 EMTN
GBP 4.570%
16,224,000 17,984,628 1.2430.11.43RL Finance BondsNo. 2 plc 13 FRN
GBP 6.130%
11,000,000 10,959,630 0.7604.12.22Severn TrentUtilities Finance PLC17 EMTN
GBP 1.625%
18,640,000 18,386,869 1.2730.06.22Skipton BuildingSociety 17 EMTN
GBP 1.750%
11,416,000 11,674,915 0.8131.12.99SSE PLC 15 FRNGBP 3.880%14,087,000 14,375,784 0.9916.09.77SSE PLC 17 FRNGBP 3.625%18,918,000 20,956,982 1.4504.12.42Standard Life
Aberdeen PLC 12FRN EMTN
GBP 5.500%
12,873,000 13,763,039 0.9531.12.99Standard Life PLC04 FRN
GBP 6.550%
3,759,000 4,003,260 0.2825.11.19Tate & LyleInternationalFinance PLC 09
GBP 6.750%
6,126,000 6,396,095 0.4410.12.33TelerealSecuritisation PLC12 FRN
GBP 4.090%
27,049,000 28,345,729 1.9606.05.26TSB Banking GroupPLC 14 FRN EMTN
GBP 5.750%
104,000,000 104,946,400 7.2422.07.19United Kingdom Gilt13
GBP 1.750%
19,384,000 20,400,885 1.4106.11.23Western PowerDistribution PLC 15
GBP 3.630%
8,350,000 8,559,919 0.5920.11.24Yorkshire BuildingSociety 14 FRNEMTN
GBP 4.130%
7,583,000 5,708,180 0.3916.09.77SSE PLC 17 FRNUSD 4.750%
88.321,278,486,523Total - Bonds
58.23843,005,062Total - United Kingdom
6,924,000 6,891,673 0.4831.03.53DRHM 2018-A FRN18-31.03.53
GBP
Mortgage backed securitiesUnited Kingdom
5,000,000 5,026,255 0.3525.05.53HWKSM FRN 16-25.05.53 1 B
GBP
1,250,000 1,267,463 0.0915.06.46ResidentialMortgage Securities28 Plc 15 FRN
GBP
3,500,000 3,493,070 0.2420.08.56RIPON FRN 17-20.8.56 1X C1 REGS
GBP
13,954,000 13,964,583 0.9621.09.49Warwick FinanceResidentialMortgages No OnePlc 15 FRN
GBP
4,000,000 4,010,000 0.2821.09.49Warwick FinanceResidentialMortgages No TwoPlc 15 FRN
GBP
10,500,000 10,547,565 0.7321.09.49Warwick FinanceResidentialMortgages No TwoPlc 15 FRN
GBP
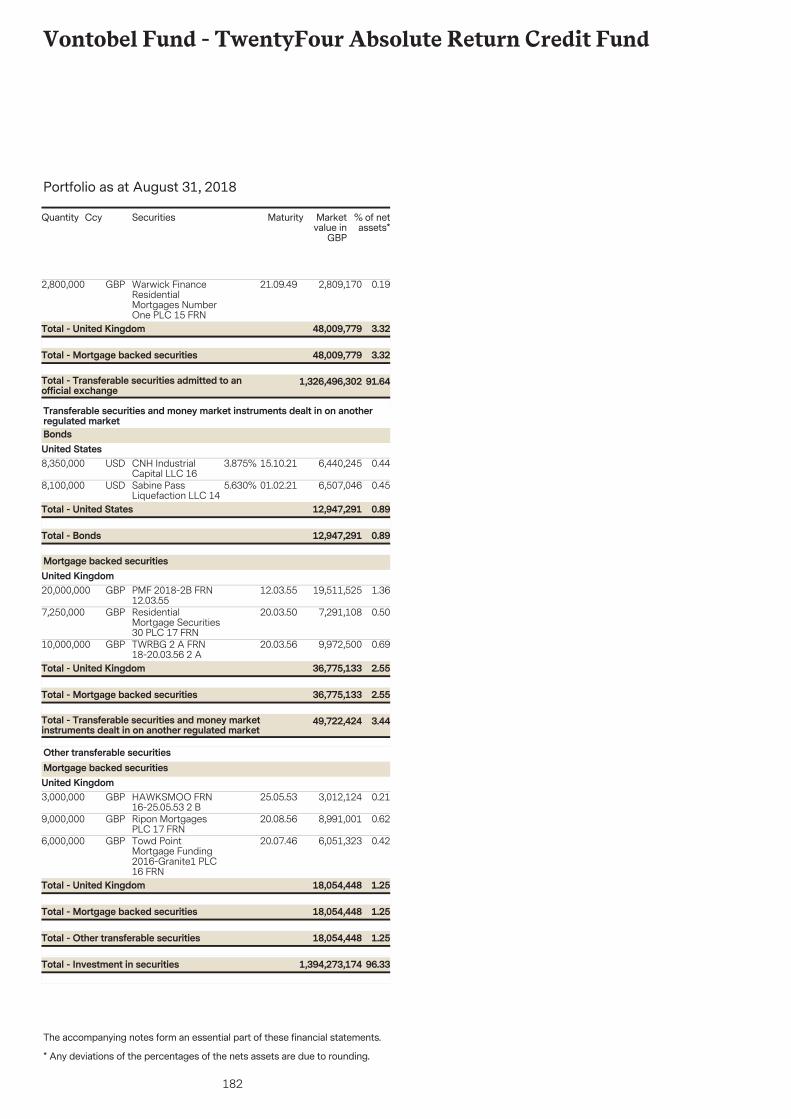
182
Vontobel Fund - TwentyFour Absolute Return Credit Fund
The accompanying notes form an essential part of these financial statements.
Portfolio as at August 31, 2018
* Any deviations of the percentages of the nets assets are due to rounding.
Securities Marketvalue in
GBP
% of netassets*
Quantity Ccy Maturity
2,800,000 2,809,170 0.1921.09.49Warwick FinanceResidentialMortgages NumberOne PLC 15 FRN
GBP
91.641,326,496,302Total - Transferable securities admitted to anofficial exchange
3.3248,009,779Total - Mortgage backed securities
3.3248,009,779Total - United Kingdom
8,350,000 6,440,245 0.4415.10.21CNH IndustrialCapital LLC 16
USD 3.875%
Transferable securities and money market instruments dealt in on anotherregulated marketBondsUnited States
8,100,000 6,507,046 0.4501.02.21Sabine PassLiquefaction LLC 14
USD 5.630%
0.8912,947,291Total - Bonds
0.8912,947,291Total - United States
20,000,000 19,511,525 1.3612.03.55PMF 2018-2B FRN12.03.55
GBP
Mortgage backed securitiesUnited Kingdom
7,250,000 7,291,108 0.5020.03.50ResidentialMortgage Securities30 PLC 17 FRN
GBP
10,000,000 9,972,500 0.6920.03.56TWRBG 2 A FRN18-20.03.56 2 A
GBP
3.4449,722,424Total - Transferable securities and money marketinstruments dealt in on another regulated market
2.5536,775,133Total - Mortgage backed securities
2.5536,775,133Total - United Kingdom
3,000,000 3,012,124 0.2125.05.53HAWKSMOO FRN16-25.05.53 2 B
GBP
Other transferable securitiesMortgage backed securitiesUnited Kingdom
9,000,000 8,991,001 0.6220.08.56Ripon MortgagesPLC 17 FRN
GBP
6,000,000 6,051,323 0.4220.07.46Towd PointMortgage Funding2016-Granite1 PLC16 FRN
GBP
1.2518,054,448Total - Other transferable securities
1.2518,054,448Total - Mortgage backed securities
1.2518,054,448Total - United Kingdom
96.331,394,273,174Total - Investment in securities
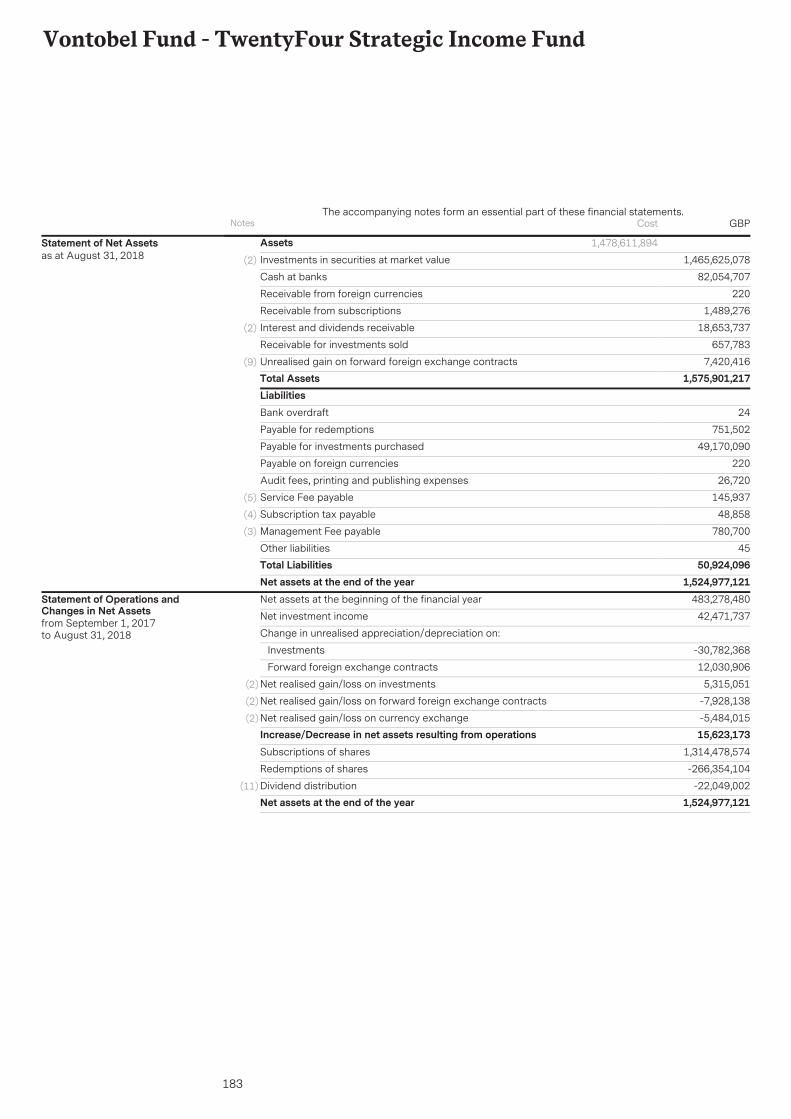
183
Vontobel Fund - TwentyFour Strategic Income Fund
AssetsInvestments in securities at market value 1,465,625,078(2)
82,054,707Cash at banks
220Receivable from foreign currencies
1,489,276Receivable from subscriptions
18,653,737Interest and dividends receivable(2)
657,783Receivable for investments sold
7,420,416Unrealised gain on forward foreign exchange contracts(9)
Total Assets 1,575,901,217
1,478,611,894Statement of Net Assetsas at August 31, 2018
LiabilitiesBank overdraft 24
Payable for redemptions 751,502
Payable for investments purchased 49,170,090
Payable on foreign currencies 220
Audit fees, printing and publishing expenses 26,720
Service Fee payable 145,937(5)
Subscription tax payable 48,858(4)
Management Fee payable 780,700(3)
Other liabilities 45Total Liabilities 50,924,096Net assets at the end of the year 1,524,977,121Net assets at the beginning of the financial year 483,278,480
Net investment income 42,471,737
Change in unrealised appreciation/depreciation on:
Investments -30,782,368
Forward foreign exchange contracts 12,030,906
Net realised gain/loss on investments 5,315,051(2)
Net realised gain/loss on forward foreign exchange contracts -7,928,138(2)
Net realised gain/loss on currency exchange -5,484,015(2)
Increase/Decrease in net assets resulting from operations 15,623,173Subscriptions of shares 1,314,478,574
Redemptions of shares -266,354,104
Dividend distribution -22,049,002(11)
Net assets at the end of the year 1,524,977,121
Statement of Operations andChanges in Net Assetsfrom September 1, 2017to August 31, 2018
Notes GBPThe accompanying notes form an essential part of these financial statements.
Cost

184
Vontobel Fund - TwentyFour Strategic Income Fund
IncomeBank interest 111,318
Net interest on bonds 50,399,629(2)
Net dividends 396,706
Other income 532Total Income 50,908,185ExpensesManagement Fees 5,897,913(3)
Audit fees, printing and publishing expenses 90,339
Subscription tax 196,290(4)
Bank interest 53,530
Service Fees 1,221,796(5)
Other Fees payable 976,580(8)
Total Expenses 8,436,448Net investment income 42,471,737
Statement of Net Incomefrom September 1, 2017to August 31, 2018
Notes GBPThe accompanying notes form an essential part of these financial statements.
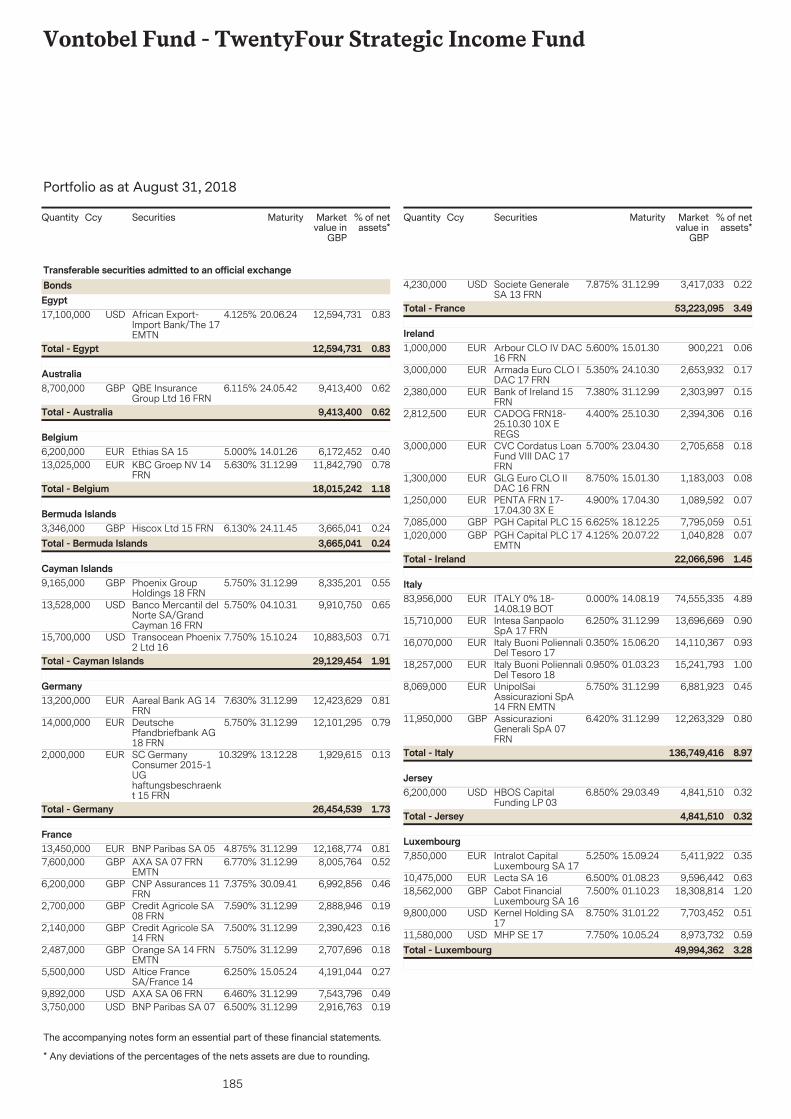
185
Vontobel Fund - TwentyFour Strategic Income Fund
The accompanying notes form an essential part of these financial statements.
Portfolio as at August 31, 2018
* Any deviations of the percentages of the nets assets are due to rounding.
Securities Marketvalue in
GBP
% of netassets*
Quantity Ccy Maturity
17,100,000 12,594,731 0.8320.06.24African Export-Import Bank/The 17EMTN
USD 4.125%
Transferable securities admitted to an official exchangeBondsEgypt
0.8312,594,731Total - Egypt
8,700,000 9,413,400 0.6224.05.42QBE InsuranceGroup Ltd 16 FRN
GBP 6.115%Australia
0.629,413,400Total - Australia
6,200,000 6,172,452 0.4014.01.26Ethias SA 15EUR 5.000%Belgium
13,025,000 11,842,790 0.7831.12.99KBC Groep NV 14FRN
EUR 5.630%
1.1818,015,242Total - Belgium
3,346,000 3,665,041 0.2424.11.45Hiscox Ltd 15 FRNGBP 6.130%Bermuda Islands
0.243,665,041Total - Bermuda Islands
9,165,000 8,335,201 0.5531.12.99Phoenix GroupHoldings 18 FRN
GBP 5.750%Cayman Islands
13,528,000 9,910,750 0.6504.10.31Banco Mercantil delNorte SA/GrandCayman 16 FRN
USD 5.750%
15,700,000 10,883,503 0.7115.10.24Transocean Phoenix2 Ltd 16
USD 7.750%
1.9129,129,454Total - Cayman Islands
13,200,000 12,423,629 0.8131.12.99Aareal Bank AG 14FRN
EUR 7.630%Germany
14,000,000 12,101,295 0.7931.12.99DeutschePfandbriefbank AG18 FRN
EUR 5.750%
2,000,000 1,929,615 0.1313.12.28SC GermanyConsumer 2015-1UGhaftungsbeschraenkt 15 FRN
EUR 10.329%
1.7326,454,539Total - Germany
13,450,000 12,168,774 0.8131.12.99BNP Paribas SA 05EUR 4.875%France
7,600,000 8,005,764 0.5231.12.99AXA SA 07 FRNEMTN
GBP 6.770%
6,200,000 6,992,856 0.4630.09.41CNP Assurances 11FRN
GBP 7.375%
2,700,000 2,888,946 0.1931.12.99Credit Agricole SA08 FRN
GBP 7.590%
2,140,000 2,390,423 0.1631.12.99Credit Agricole SA14 FRN
GBP 7.500%
2,487,000 2,707,696 0.1831.12.99Orange SA 14 FRNEMTN
GBP 5.750%
5,500,000 4,191,044 0.2715.05.24Altice FranceSA/France 14
USD 6.250%
9,892,000 7,543,796 0.4931.12.99AXA SA 06 FRNUSD 6.460%3,750,000 2,916,763 0.1931.12.99BNP Paribas SA 07USD 6.500%
Securities Marketvalue in
GBP
% of netassets*
Quantity Ccy Maturity
4,230,000 3,417,033 0.2231.12.99Societe GeneraleSA 13 FRN
USD 7.875%
3.4953,223,095Total - France
1,000,000 900,221 0.0615.01.30Arbour CLO IV DAC16 FRN
EUR 5.600%Ireland
3,000,000 2,653,932 0.1724.10.30Armada Euro CLO IDAC 17 FRN
EUR 5.350%
2,380,000 2,303,997 0.1531.12.99Bank of Ireland 15FRN
EUR 7.380%
2,812,500 2,394,306 0.1625.10.30CADOG FRN18-25.10.30 10X EREGS
EUR 4.400%
3,000,000 2,705,658 0.1823.04.30CVC Cordatus LoanFund VIII DAC 17FRN
EUR 5.700%
1,300,000 1,183,003 0.0815.01.30GLG Euro CLO IIDAC 16 FRN
EUR 8.750%
1,250,000 1,089,592 0.0717.04.30PENTA FRN 17-17.04.30 3X E
EUR 4.900%
7,085,000 7,795,059 0.5118.12.25PGH Capital PLC 15GBP 6.625%1,020,000 1,040,828 0.0720.07.22PGH Capital PLC 17
EMTNGBP 4.125%
1.4522,066,596Total - Ireland
83,956,000 74,555,335 4.8914.08.19ITALY 0% 18-14.08.19 BOT
EUR 0.000%Italy
15,710,000 13,696,669 0.9031.12.99Intesa SanpaoloSpA 17 FRN
EUR 6.250%
16,070,000 14,110,367 0.9315.06.20Italy Buoni PoliennaliDel Tesoro 17
EUR 0.350%
18,257,000 15,241,793 1.0001.03.23Italy Buoni PoliennaliDel Tesoro 18
EUR 0.950%
8,069,000 6,881,923 0.4531.12.99UnipolSaiAssicurazioni SpA14 FRN EMTN
EUR 5.750%
11,950,000 12,263,329 0.8031.12.99AssicurazioniGenerali SpA 07FRN
GBP 6.420%
8.97136,749,416Total - Italy
6,200,000 4,841,510 0.3229.03.49HBOS CapitalFunding LP 03
USD 6.850%Jersey
0.324,841,510Total - Jersey
7,850,000 5,411,922 0.3515.09.24Intralot CapitalLuxembourg SA 17
EUR 5.250%Luxembourg
10,475,000 9,596,442 0.6301.08.23Lecta SA 16EUR 6.500%18,562,000 18,308,814 1.2001.10.23Cabot Financial
Luxembourg SA 16GBP 7.500%
9,800,000 7,703,452 0.5131.01.22Kernel Holding SA17
USD 8.750%
11,580,000 8,973,732 0.5910.05.24MHP SE 17USD 7.750%3.2849,994,362Total - Luxembourg
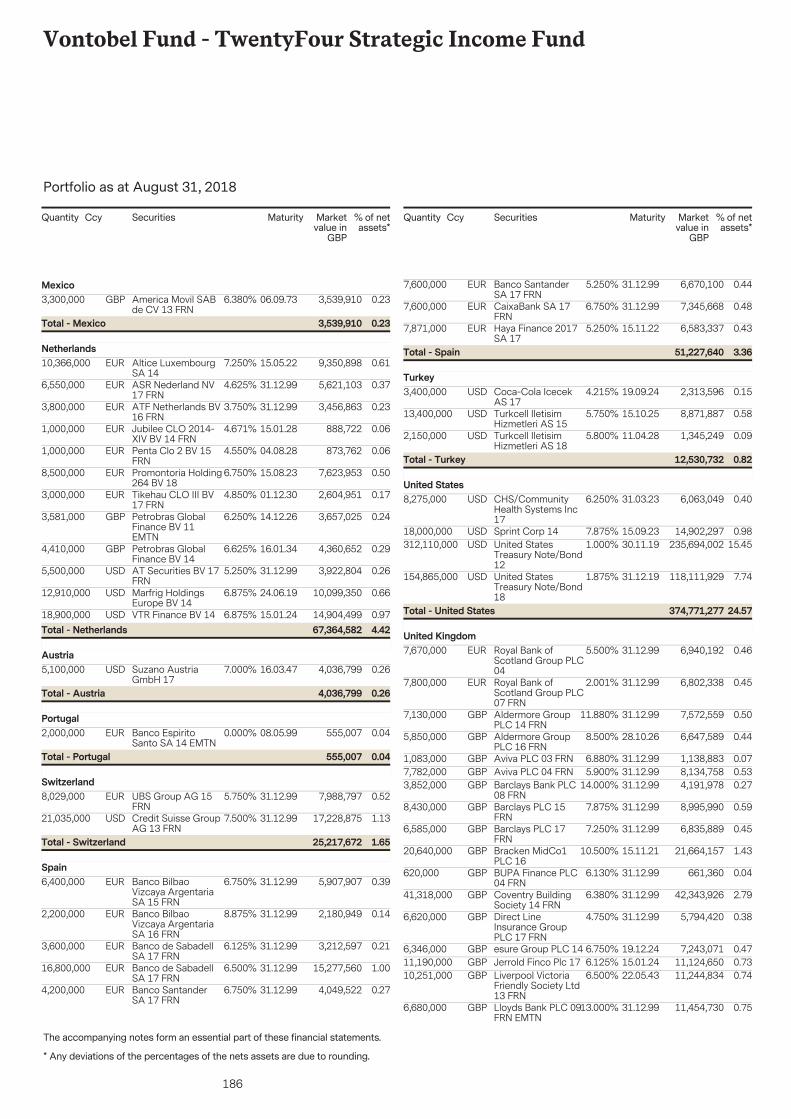
186
Vontobel Fund - TwentyFour Strategic Income Fund
The accompanying notes form an essential part of these financial statements.
Portfolio as at August 31, 2018
* Any deviations of the percentages of the nets assets are due to rounding.
Securities Marketvalue in
GBP
% of netassets*
Quantity Ccy Maturity
3,300,000 3,539,910 0.2306.09.73America Movil SABde CV 13 FRN
GBP 6.380%Mexico
0.233,539,910Total - Mexico
10,366,000 9,350,898 0.6115.05.22Altice LuxembourgSA 14
EUR 7.250%Netherlands
6,550,000 5,621,103 0.3731.12.99ASR Nederland NV17 FRN
EUR 4.625%
3,800,000 3,456,863 0.2331.12.99ATF Netherlands BV16 FRN
EUR 3.750%
1,000,000 888,722 0.0615.01.28Jubilee CLO 2014-XIV BV 14 FRN
EUR 4.671%
1,000,000 873,762 0.0604.08.28Penta Clo 2 BV 15FRN
EUR 4.550%
8,500,000 7,623,953 0.5015.08.23Promontoria Holding264 BV 18
EUR 6.750%
3,000,000 2,604,951 0.1701.12.30Tikehau CLO III BV17 FRN
EUR 4.850%
3,581,000 3,657,025 0.2414.12.26Petrobras GlobalFinance BV 11EMTN
GBP 6.250%
4,410,000 4,360,652 0.2916.01.34Petrobras GlobalFinance BV 14
GBP 6.625%
5,500,000 3,922,804 0.2631.12.99AT Securities BV 17FRN
USD 5.250%
12,910,000 10,099,350 0.6624.06.19Marfrig HoldingsEurope BV 14
USD 6.875%
18,900,000 14,904,499 0.9715.01.24VTR Finance BV 14USD 6.875%4.4267,364,582Total - Netherlands
5,100,000 4,036,799 0.2616.03.47Suzano AustriaGmbH 17
USD 7.000%Austria
0.264,036,799Total - Austria
2,000,000 555,007 0.0408.05.99Banco EspiritoSanto SA 14 EMTN
EUR 0.000%Portugal
0.04555,007Total - Portugal
8,029,000 7,988,797 0.5231.12.99UBS Group AG 15FRN
EUR 5.750%Switzerland
21,035,000 17,228,875 1.1331.12.99Credit Suisse GroupAG 13 FRN
USD 7.500%
1.6525,217,672Total - Switzerland
6,400,000 5,907,907 0.3931.12.99Banco BilbaoVizcaya ArgentariaSA 15 FRN
EUR 6.750%Spain
2,200,000 2,180,949 0.1431.12.99Banco BilbaoVizcaya ArgentariaSA 16 FRN
EUR 8.875%
3,600,000 3,212,597 0.2131.12.99Banco de SabadellSA 17 FRN
EUR 6.125%
16,800,000 15,277,560 1.0031.12.99Banco de SabadellSA 17 FRN
EUR 6.500%
4,200,000 4,049,522 0.2731.12.99Banco SantanderSA 17 FRN
EUR 6.750%
Securities Marketvalue in
GBP
% of netassets*
Quantity Ccy Maturity
7,600,000 6,670,100 0.4431.12.99Banco SantanderSA 17 FRN
EUR 5.250%
7,600,000 7,345,668 0.4831.12.99CaixaBank SA 17FRN
EUR 6.750%
7,871,000 6,583,337 0.4315.11.22Haya Finance 2017SA 17
EUR 5.250%
3.3651,227,640Total - Spain
3,400,000 2,313,596 0.1519.09.24Coca-Cola IcecekAS 17
USD 4.215%Turkey
13,400,000 8,871,887 0.5815.10.25Turkcell IletisimHizmetleri AS 15
USD 5.750%
2,150,000 1,345,249 0.0911.04.28Turkcell IletisimHizmetleri AS 18
USD 5.800%
0.8212,530,732Total - Turkey
8,275,000 6,063,049 0.4031.03.23CHS/CommunityHealth Systems Inc17
USD 6.250%United States
18,000,000 14,902,297 0.9815.09.23Sprint Corp 14USD 7.875%312,110,000 235,694,002 15.4530.11.19United States
Treasury Note/Bond12
USD 1.000%
154,865,000 118,111,929 7.7431.12.19United StatesTreasury Note/Bond18
USD 1.875%
24.57374,771,277Total - United States
7,670,000 6,940,192 0.4631.12.99Royal Bank ofScotland Group PLC04
EUR 5.500%United Kingdom
7,800,000 6,802,338 0.4531.12.99Royal Bank ofScotland Group PLC07 FRN
EUR 2.001%
7,130,000 7,572,559 0.5031.12.99Aldermore GroupPLC 14 FRN
GBP 11.880%
5,850,000 6,647,589 0.4428.10.26Aldermore GroupPLC 16 FRN
GBP 8.500%
1,083,000 1,138,883 0.0731.12.99Aviva PLC 03 FRNGBP 6.880%7,782,000 8,134,758 0.5331.12.99Aviva PLC 04 FRNGBP 5.900%3,852,000 4,191,978 0.2731.12.99Barclays Bank PLC
08 FRNGBP 14.000%
8,430,000 8,995,990 0.5931.12.99Barclays PLC 15FRN
GBP 7.875%
6,585,000 6,835,889 0.4531.12.99Barclays PLC 17FRN
GBP 7.250%
20,640,000 21,664,157 1.4315.11.21Bracken MidCo1PLC 16
GBP 10.500%
620,000 661,360 0.0431.12.99BUPA Finance PLC04 FRN
GBP 6.130%
41,318,000 42,343,926 2.7931.12.99Coventry BuildingSociety 14 FRN
GBP 6.380%
6,620,000 5,794,420 0.3831.12.99Direct LineInsurance GroupPLC 17 FRN
GBP 4.750%
6,346,000 7,243,071 0.4719.12.24esure Group PLC 14GBP 6.750%11,190,000 11,124,650 0.7315.01.24Jerrold Finco Plc 17GBP 6.125%10,251,000 11,244,834 0.7422.05.43Liverpool Victoria
Friendly Society Ltd13 FRN
GBP 6.500%
6,680,000 11,454,730 0.7531.12.99Lloyds Bank PLC 09FRN EMTN
GBP 13.000%
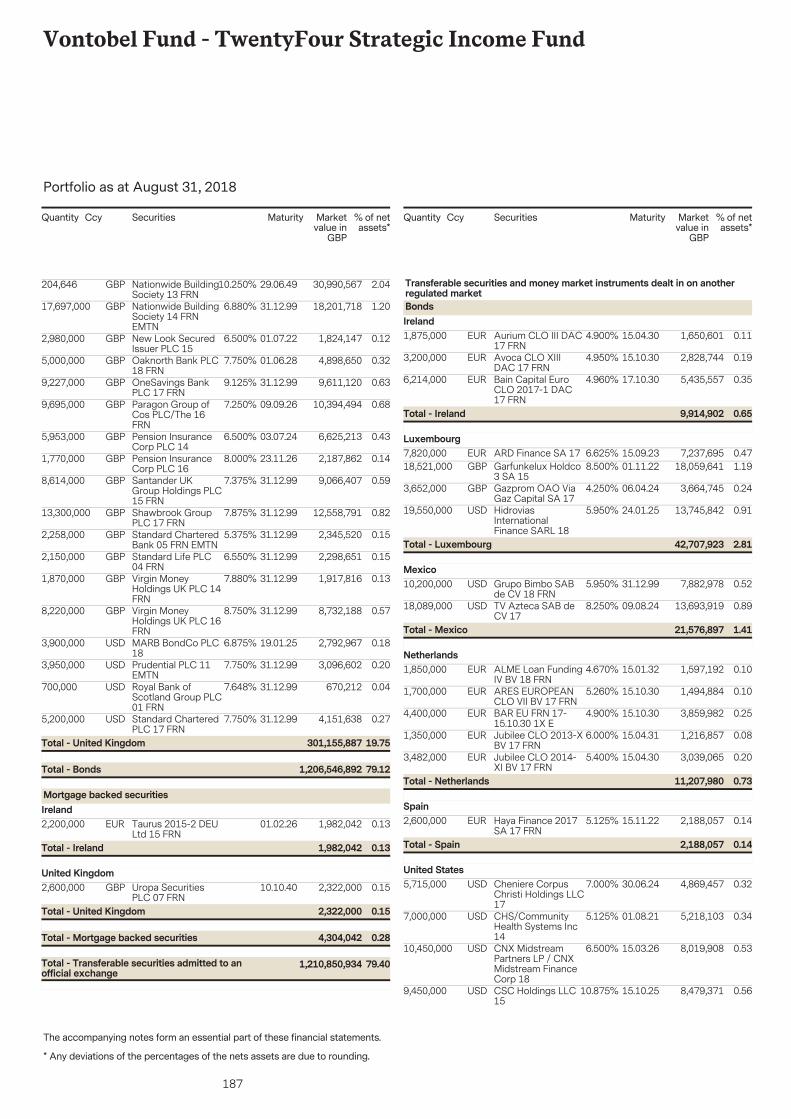
187
Vontobel Fund - TwentyFour Strategic Income Fund
The accompanying notes form an essential part of these financial statements.
Portfolio as at August 31, 2018
* Any deviations of the percentages of the nets assets are due to rounding.
Securities Marketvalue in
GBP
% of netassets*
Quantity Ccy Maturity
204,646 30,990,567 2.0429.06.49Nationwide BuildingSociety 13 FRN
GBP 10.250%
17,697,000 18,201,718 1.2031.12.99Nationwide BuildingSociety 14 FRNEMTN
GBP 6.880%
2,980,000 1,824,147 0.1201.07.22New Look SecuredIssuer PLC 15
GBP 6.500%
5,000,000 4,898,650 0.3201.06.28Oaknorth Bank PLC18 FRN
GBP 7.750%
9,227,000 9,611,120 0.6331.12.99OneSavings BankPLC 17 FRN
GBP 9.125%
9,695,000 10,394,494 0.6809.09.26Paragon Group ofCos PLC/The 16FRN
GBP 7.250%
5,953,000 6,625,213 0.4303.07.24Pension InsuranceCorp PLC 14
GBP 6.500%
1,770,000 2,187,862 0.1423.11.26Pension InsuranceCorp PLC 16
GBP 8.000%
8,614,000 9,066,407 0.5931.12.99Santander UKGroup Holdings PLC15 FRN
GBP 7.375%
13,300,000 12,558,791 0.8231.12.99Shawbrook GroupPLC 17 FRN
GBP 7.875%
2,258,000 2,345,520 0.1531.12.99Standard CharteredBank 05 FRN EMTN
GBP 5.375%
2,150,000 2,298,651 0.1531.12.99Standard Life PLC04 FRN
GBP 6.550%
1,870,000 1,917,816 0.1331.12.99Virgin MoneyHoldings UK PLC 14FRN
GBP 7.880%
8,220,000 8,732,188 0.5731.12.99Virgin MoneyHoldings UK PLC 16FRN
GBP 8.750%
3,900,000 2,792,967 0.1819.01.25MARB BondCo PLC18
USD 6.875%
3,950,000 3,096,602 0.2031.12.99Prudential PLC 11EMTN
USD 7.750%
700,000 670,212 0.0431.12.99Royal Bank ofScotland Group PLC01 FRN
USD 7.648%
5,200,000 4,151,638 0.2731.12.99Standard CharteredPLC 17 FRN
USD 7.750%
79.121,206,546,892Total - Bonds
19.75301,155,887Total - United Kingdom
2,200,000 1,982,042 0.1301.02.26Taurus 2015-2 DEULtd 15 FRN
EUR
Mortgage backed securitiesIreland
0.131,982,042Total - Ireland
2,600,000 2,322,000 0.1510.10.40Uropa SecuritiesPLC 07 FRN
GBPUnited Kingdom
79.401,210,850,934Total - Transferable securities admitted to anofficial exchange
0.284,304,042Total - Mortgage backed securities
0.152,322,000Total - United Kingdom
Securities Marketvalue in
GBP
% of netassets*
Quantity Ccy Maturity
1,875,000 1,650,601 0.1115.04.30Aurium CLO III DAC17 FRN
EUR 4.900%
Transferable securities and money market instruments dealt in on anotherregulated marketBondsIreland
3,200,000 2,828,744 0.1915.10.30Avoca CLO XIIIDAC 17 FRN
EUR 4.950%
6,214,000 5,435,557 0.3517.10.30Bain Capital EuroCLO 2017-1 DAC17 FRN
EUR 4.960%
0.659,914,902Total - Ireland
7,820,000 7,237,695 0.4715.09.23ARD Finance SA 17EUR 6.625%Luxembourg
18,521,000 18,059,641 1.1901.11.22Garfunkelux Holdco3 SA 15
GBP 8.500%
3,652,000 3,664,745 0.2406.04.24Gazprom OAO ViaGaz Capital SA 17
GBP 4.250%
19,550,000 13,745,842 0.9124.01.25HidroviasInternationalFinance SARL 18
USD 5.950%
2.8142,707,923Total - Luxembourg
10,200,000 7,882,978 0.5231.12.99Grupo Bimbo SABde CV 18 FRN
USD 5.950%Mexico
18,089,000 13,693,919 0.8909.08.24TV Azteca SAB deCV 17
USD 8.250%
1.4121,576,897Total - Mexico
1,850,000 1,597,192 0.1015.01.32ALME Loan FundingIV BV 18 FRN
EUR 4.670%Netherlands
1,700,000 1,494,884 0.1015.10.30ARES EUROPEANCLO VII BV 17 FRN
EUR 5.260%
4,400,000 3,859,982 0.2515.10.30BAR EU FRN 17-15.10.30 1X E
EUR 4.900%
1,350,000 1,216,857 0.0815.04.31Jubilee CLO 2013-XBV 17 FRN
EUR 6.000%
3,482,000 3,039,065 0.2015.04.30Jubilee CLO 2014-XI BV 17 FRN
EUR 5.400%
0.7311,207,980Total - Netherlands
2,600,000 2,188,057 0.1415.11.22Haya Finance 2017SA 17 FRN
EUR 5.125%Spain
0.142,188,057Total - Spain
5,715,000 4,869,457 0.3230.06.24Cheniere CorpusChristi Holdings LLC17
USD 7.000%United States
7,000,000 5,218,103 0.3401.08.21CHS/CommunityHealth Systems Inc14
USD 5.125%
10,450,000 8,019,908 0.5315.03.26CNX MidstreamPartners LP / CNXMidstream FinanceCorp 18
USD 6.500%
9,450,000 8,479,371 0.5615.10.25CSC Holdings LLC15
USD 10.875%
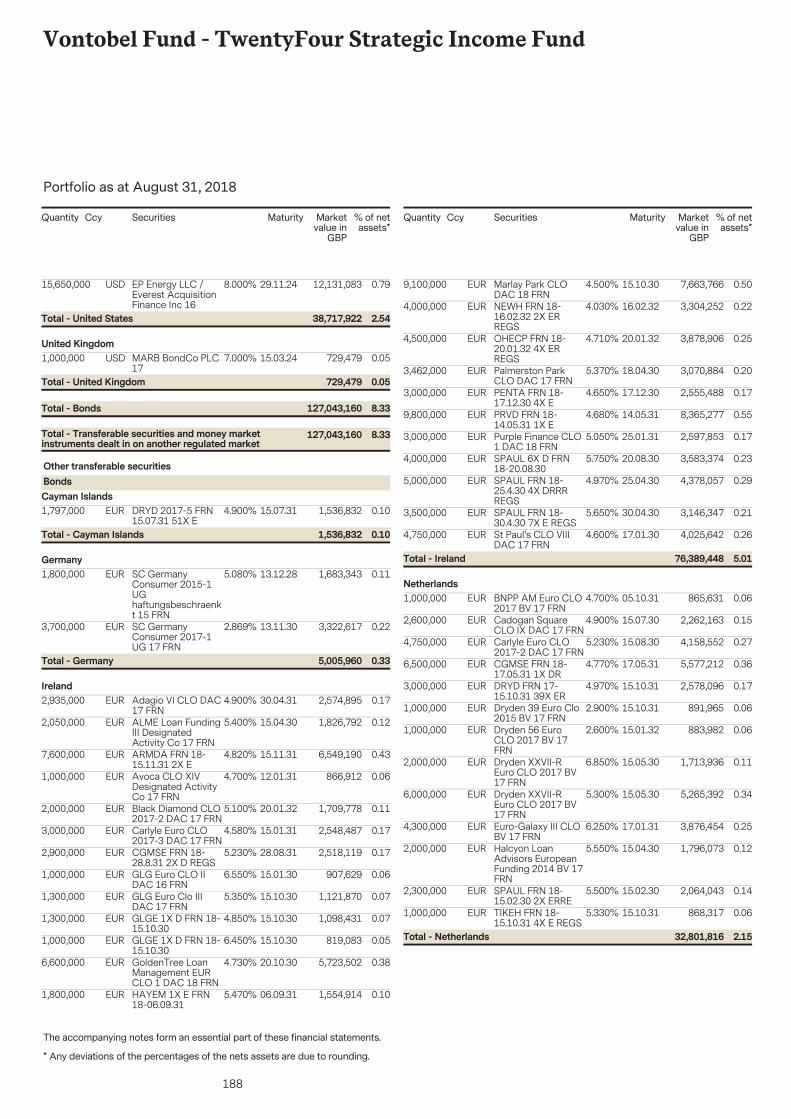
188
Vontobel Fund - TwentyFour Strategic Income Fund
The accompanying notes form an essential part of these financial statements.
Portfolio as at August 31, 2018
* Any deviations of the percentages of the nets assets are due to rounding.
Securities Marketvalue in
GBP
% of netassets*
Quantity Ccy Maturity
15,650,000 12,131,083 0.7929.11.24EP Energy LLC /Everest AcquisitionFinance Inc 16
USD 8.000%
2.5438,717,922Total - United States
1,000,000 729,479 0.0515.03.24MARB BondCo PLC17
USD 7.000%United Kingdom
8.33127,043,160Total - Transferable securities and money marketinstruments dealt in on another regulated market
8.33127,043,160Total - Bonds
0.05729,479Total - United Kingdom
1,797,000 1,536,832 0.1015.07.31DRYD 2017-5 FRN15.07.31 51X E
EUR 4.900%
Other transferable securitiesBondsCayman Islands
0.101,536,832Total - Cayman Islands
1,800,000 1,683,343 0.1113.12.28SC GermanyConsumer 2015-1UGhaftungsbeschraenkt 15 FRN
EUR 5.080%Germany
3,700,000 3,322,617 0.2213.11.30SC GermanyConsumer 2017-1UG 17 FRN
EUR 2.869%
0.335,005,960Total - Germany
2,935,000 2,574,895 0.1730.04.31Adagio VI CLO DAC17 FRN
EUR 4.900%Ireland
2,050,000 1,826,792 0.1215.04.30ALME Loan FundingIII DesignatedActivity Co 17 FRN
EUR 5.400%
7,600,000 6,549,190 0.4315.11.31ARMDA FRN 18-15.11.31 2X E
EUR 4.820%
1,000,000 866,912 0.0612.01.31Avoca CLO XIVDesignated ActivityCo 17 FRN
EUR 4.700%
2,000,000 1,709,778 0.1120.01.32Black Diamond CLO2017-2 DAC 17 FRN
EUR 5.100%
3,000,000 2,548,487 0.1715.01.31Carlyle Euro CLO2017-3 DAC 17 FRN
EUR 4.580%
2,900,000 2,518,119 0.1728.08.31CGMSE FRN 18-28.8.31 2X D REGS
EUR 5.230%
1,000,000 907,629 0.0615.01.30GLG Euro CLO IIDAC 16 FRN
EUR 6.550%
1,300,000 1,121,870 0.0715.10.30GLG Euro Clo IIIDAC 17 FRN
EUR 5.350%
1,300,000 1,098,431 0.0715.10.30GLGE 1X D FRN 18-15.10.30
EUR 4.850%
1,000,000 819,083 0.0515.10.30GLGE 1X D FRN 18-15.10.30
EUR 6.450%
6,600,000 5,723,502 0.3820.10.30GoldenTree LoanManagement EURCLO 1 DAC 18 FRN
EUR 4.730%
1,800,000 1,554,914 0.1006.09.31HAYEM 1X E FRN18-06.09.31
EUR 5.470%
Securities Marketvalue in
GBP
% of netassets*
Quantity Ccy Maturity
9,100,000 7,663,766 0.5015.10.30Marlay Park CLODAC 18 FRN
EUR 4.500%
4,000,000 3,304,252 0.2216.02.32NEWH FRN 18-16.02.32 2X ERREGS
EUR 4.030%
4,500,000 3,878,906 0.2520.01.32OHECP FRN 18-20.01.32 4X ERREGS
EUR 4.710%
3,462,000 3,070,884 0.2018.04.30Palmerston ParkCLO DAC 17 FRN
EUR 5.370%
3,000,000 2,555,488 0.1717.12.30PENTA FRN 18-17.12.30 4X E
EUR 4.650%
9,800,000 8,365,277 0.5514.05.31PRVD FRN 18-14.05.31 1X E
EUR 4.680%
3,000,000 2,597,853 0.1725.01.31Purple Finance CLO1 DAC 18 FRN
EUR 5.050%
4,000,000 3,583,374 0.2320.08.30SPAUL 6X D FRN18-20.08.30
EUR 5.750%
5,000,000 4,378,057 0.2925.04.30SPAUL FRN 18-25.4.30 4X DRRRREGS
EUR 4.970%
3,500,000 3,146,347 0.2130.04.30SPAUL FRN 18-30.4.30 7X E REGS
EUR 5.650%
4,750,000 4,025,642 0.2617.01.30St Paul's CLO VIIIDAC 17 FRN
EUR 4.600%
5.0176,389,448Total - Ireland
1,000,000 865,631 0.0605.10.31BNPP AM Euro CLO2017 BV 17 FRN
EUR 4.700%Netherlands
2,600,000 2,262,163 0.1515.07.30Cadogan SquareCLO IX DAC 17 FRN
EUR 4.900%
4,750,000 4,158,552 0.2715.08.30Carlyle Euro CLO2017-2 DAC 17 FRN
EUR 5.230%
6,500,000 5,577,212 0.3617.05.31CGMSE FRN 18-17.05.31 1X DR
EUR 4.770%
3,000,000 2,578,096 0.1715.10.31DRYD FRN 17-15.10.31 39X ER
EUR 4.970%
1,000,000 891,965 0.0615.10.31Dryden 39 Euro Clo2015 BV 17 FRN
EUR 2.900%
1,000,000 883,982 0.0615.01.32Dryden 56 EuroCLO 2017 BV 17FRN
EUR 2.600%
2,000,000 1,713,936 0.1115.05.30Dryden XXVII-REuro CLO 2017 BV17 FRN
EUR 6.850%
6,000,000 5,265,392 0.3415.05.30Dryden XXVII-REuro CLO 2017 BV17 FRN
EUR 5.300%
4,300,000 3,876,454 0.2517.01.31Euro-Galaxy III CLOBV 17 FRN
EUR 6.250%
2,000,000 1,796,073 0.1215.04.30Halcyon LoanAdvisors EuropeanFunding 2014 BV 17FRN
EUR 5.550%
2,300,000 2,064,043 0.1415.02.30SPAUL FRN 18-15.02.30 2X ERRE
EUR 5.500%
1,000,000 868,317 0.0615.10.31TIKEH FRN 18-15.10.31 4X E REGS
EUR 5.330%
2.1532,801,816Total - Netherlands
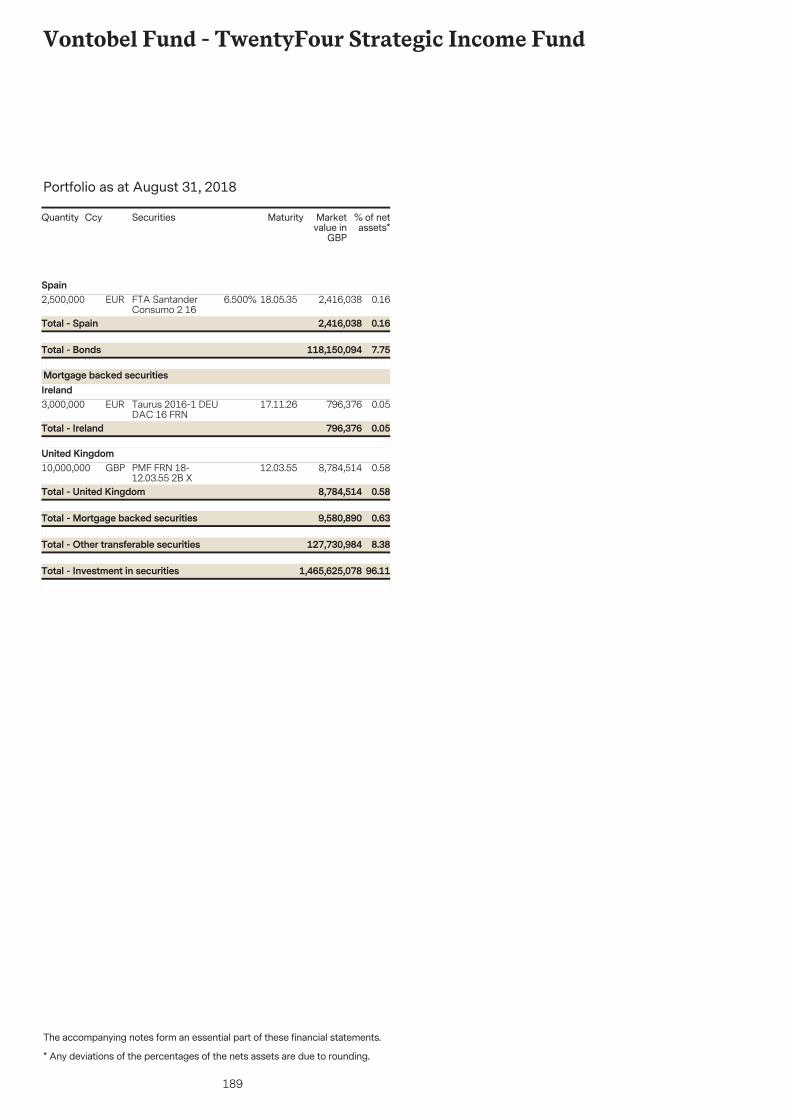
189
Vontobel Fund - TwentyFour Strategic Income Fund
The accompanying notes form an essential part of these financial statements.
Portfolio as at August 31, 2018
* Any deviations of the percentages of the nets assets are due to rounding.
Securities Marketvalue in
GBP
% of netassets*
Quantity Ccy Maturity
2,500,000 2,416,038 0.1618.05.35FTA SantanderConsumo 2 16
EUR 6.500%Spain
7.75118,150,094Total - Bonds
0.162,416,038Total - Spain
3,000,000 796,376 0.0517.11.26Taurus 2016-1 DEUDAC 16 FRN
EUR
Mortgage backed securitiesIreland
0.05796,376Total - Ireland
10,000,000 8,784,514 0.5812.03.55PMF FRN 18-12.03.55 2B X
GBPUnited Kingdom
8.38127,730,984Total - Other transferable securities
0.639,580,890Total - Mortgage backed securities
0.588,784,514Total - United Kingdom
96.111,465,625,078Total - Investment in securities
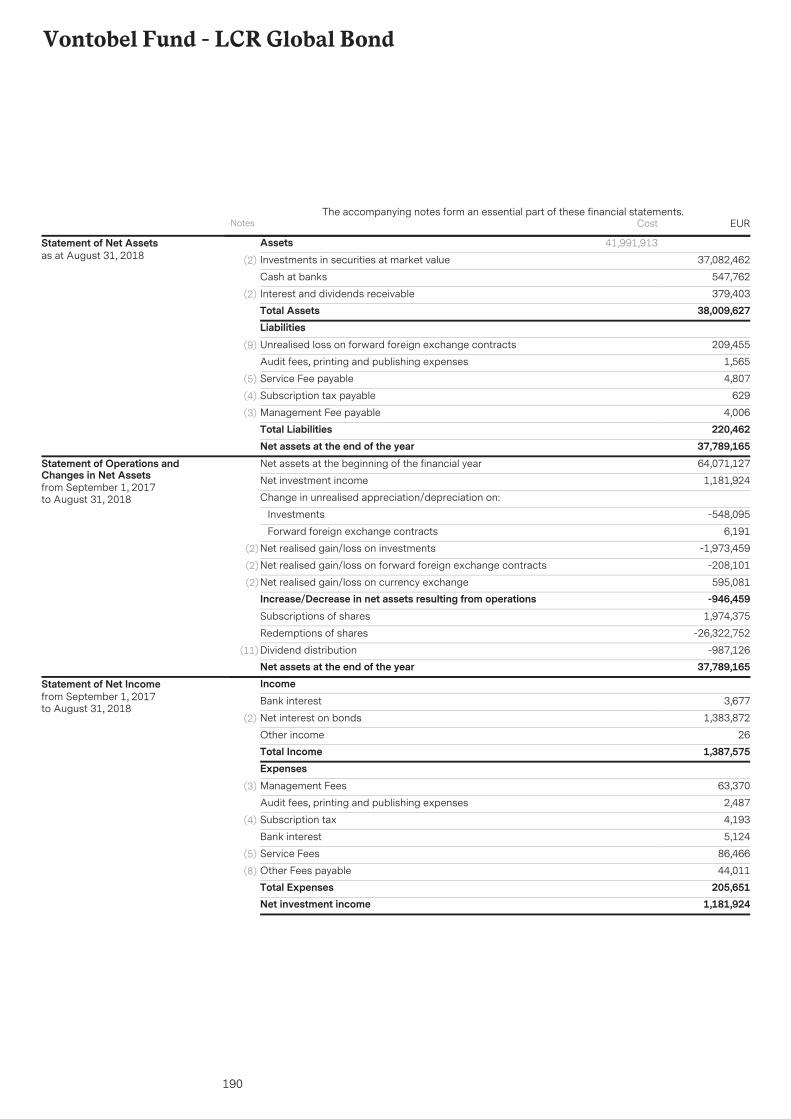
190
Vontobel Fund - LCR Global Bond
AssetsInvestments in securities at market value 37,082,462(2)
547,762Cash at banks
379,403Interest and dividends receivable(2)
Total Assets 38,009,627
41,991,913Statement of Net Assetsas at August 31, 2018
LiabilitiesUnrealised loss on forward foreign exchange contracts 209,455(9)
Audit fees, printing and publishing expenses 1,565
Service Fee payable 4,807(5)
Subscription tax payable 629(4)
Management Fee payable 4,006(3)
Total Liabilities 220,462Net assets at the end of the year 37,789,165Net assets at the beginning of the financial year 64,071,127
Net investment income 1,181,924
Change in unrealised appreciation/depreciation on:
Investments -548,095
Forward foreign exchange contracts 6,191
Net realised gain/loss on investments -1,973,459(2)
Net realised gain/loss on forward foreign exchange contracts -208,101(2)
Net realised gain/loss on currency exchange 595,081(2)
Increase/Decrease in net assets resulting from operations -946,459Subscriptions of shares 1,974,375
Redemptions of shares -26,322,752
Dividend distribution -987,126(11)
Net assets at the end of the year 37,789,165
Statement of Operations andChanges in Net Assetsfrom September 1, 2017to August 31, 2018
IncomeBank interest 3,677
Net interest on bonds 1,383,872(2)
Other income 26Total Income 1,387,575ExpensesManagement Fees 63,370(3)
Audit fees, printing and publishing expenses 2,487
Subscription tax 4,193(4)
Bank interest 5,124
Service Fees 86,466(5)
Other Fees payable 44,011(8)
Total Expenses 205,651Net investment income 1,181,924
Statement of Net Incomefrom September 1, 2017to August 31, 2018
Notes EURThe accompanying notes form an essential part of these financial statements.
Cost
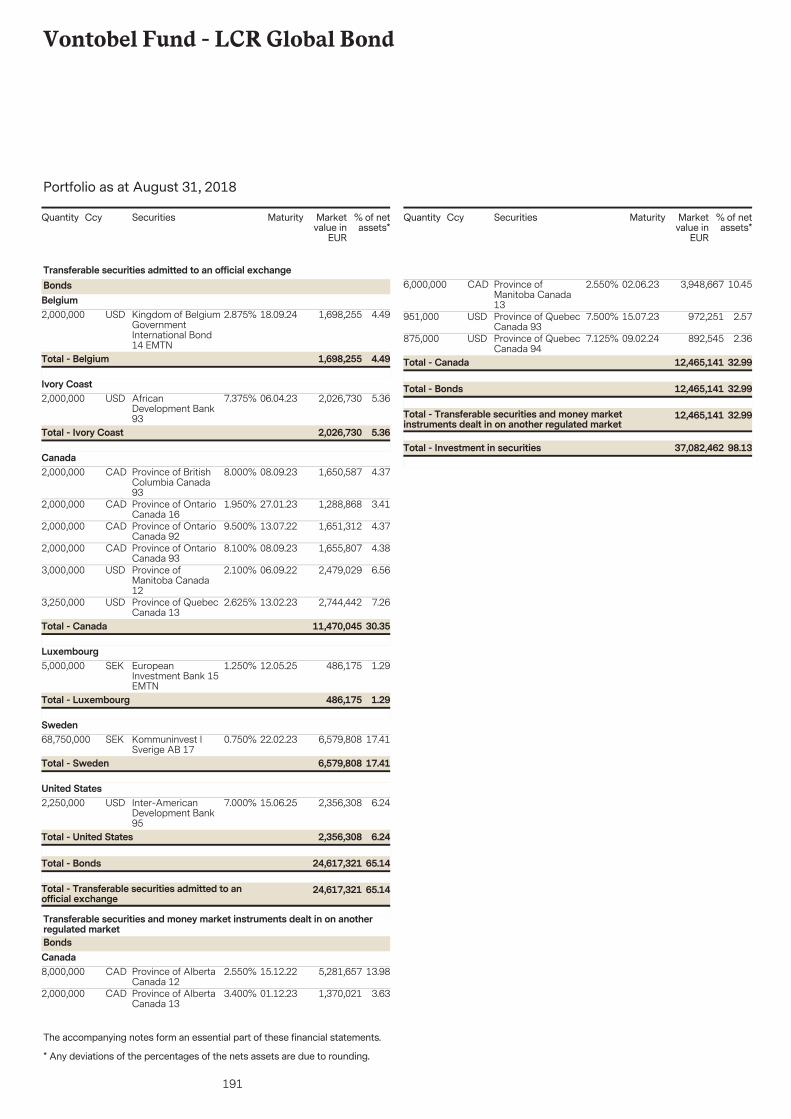
191
Vontobel Fund - LCR Global Bond
The accompanying notes form an essential part of these financial statements.
Portfolio as at August 31, 2018
* Any deviations of the percentages of the nets assets are due to rounding.
Securities Marketvalue in
EUR
% of netassets*
Quantity Ccy Maturity
2,000,000 1,698,255 4.4918.09.24Kingdom of BelgiumGovernmentInternational Bond14 EMTN
USD 2.875%
Transferable securities admitted to an official exchangeBondsBelgium
4.491,698,255Total - Belgium
2,000,000 2,026,730 5.3606.04.23AfricanDevelopment Bank93
USD 7.375%Ivory Coast
5.362,026,730Total - Ivory Coast
2,000,000 1,650,587 4.3708.09.23Province of BritishColumbia Canada93
CAD 8.000%Canada
2,000,000 1,288,868 3.4127.01.23Province of OntarioCanada 16
CAD 1.950%
2,000,000 1,651,312 4.3713.07.22Province of OntarioCanada 92
CAD 9.500%
2,000,000 1,655,807 4.3808.09.23Province of OntarioCanada 93
CAD 8.100%
3,000,000 2,479,029 6.5606.09.22Province ofManitoba Canada12
USD 2.100%
3,250,000 2,744,442 7.2613.02.23Province of QuebecCanada 13
USD 2.625%
30.3511,470,045Total - Canada
5,000,000 486,175 1.2912.05.25EuropeanInvestment Bank 15EMTN
SEK 1.250%Luxembourg
1.29486,175Total - Luxembourg
68,750,000 6,579,808 17.4122.02.23Kommuninvest ISverige AB 17
SEK 0.750%Sweden
17.416,579,808Total - Sweden
2,250,000 2,356,308 6.2415.06.25Inter-AmericanDevelopment Bank95
USD 7.000%United States
65.1424,617,321Total - Transferable securities admitted to anofficial exchange
65.1424,617,321Total - Bonds
6.242,356,308Total - United States
8,000,000 5,281,657 13.9815.12.22Province of AlbertaCanada 12
CAD 2.550%
Transferable securities and money market instruments dealt in on anotherregulated marketBondsCanada
2,000,000 1,370,021 3.6301.12.23Province of AlbertaCanada 13
CAD 3.400%
Securities Marketvalue in
EUR
% of netassets*
Quantity Ccy Maturity
6,000,000 3,948,667 10.4502.06.23Province ofManitoba Canada13
CAD 2.550%
951,000 972,251 2.5715.07.23Province of QuebecCanada 93
USD 7.500%
875,000 892,545 2.3609.02.24Province of QuebecCanada 94
USD 7.125%
32.9912,465,141Total - Transferable securities and money marketinstruments dealt in on another regulated market
32.9912,465,141Total - Bonds
32.9912,465,141Total - Canada
98.1337,082,462Total - Investment in securities
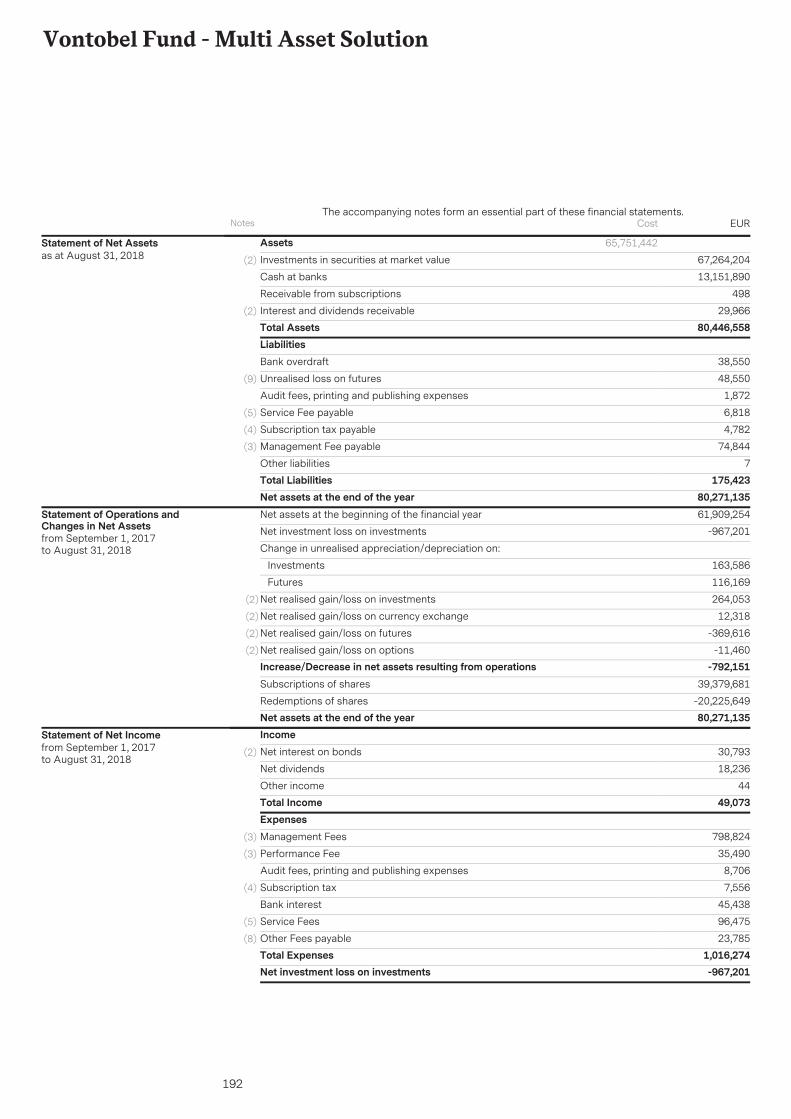
192
Vontobel Fund - Multi Asset Solution
AssetsInvestments in securities at market value 67,264,204(2)
13,151,890Cash at banks
498Receivable from subscriptions
29,966Interest and dividends receivable(2)
Total Assets 80,446,558
65,751,442Statement of Net Assetsas at August 31, 2018
LiabilitiesBank overdraft 38,550
Unrealised loss on futures 48,550(9)
Audit fees, printing and publishing expenses 1,872
Service Fee payable 6,818(5)
Subscription tax payable 4,782(4)
Management Fee payable 74,844(3)
Other liabilities 7Total Liabilities 175,423Net assets at the end of the year 80,271,135Net assets at the beginning of the financial year 61,909,254
Net investment loss on investments -967,201
Change in unrealised appreciation/depreciation on:
Investments 163,586
Futures 116,169
Net realised gain/loss on investments 264,053(2)
Net realised gain/loss on currency exchange 12,318(2)
Net realised gain/loss on futures -369,616(2)
Net realised gain/loss on options -11,460(2)
Increase/Decrease in net assets resulting from operations -792,151Subscriptions of shares 39,379,681
Redemptions of shares -20,225,649Net assets at the end of the year 80,271,135
Statement of Operations andChanges in Net Assetsfrom September 1, 2017to August 31, 2018
IncomeNet interest on bonds 30,793(2)
Net dividends 18,236
Other income 44Total Income 49,073ExpensesManagement Fees 798,824(3)
Performance Fee 35,490(3)
Audit fees, printing and publishing expenses 8,706
Subscription tax 7,556(4)
Bank interest 45,438
Service Fees 96,475(5)
Other Fees payable 23,785(8)
Total Expenses 1,016,274Net investment loss on investments -967,201
Statement of Net Incomefrom September 1, 2017to August 31, 2018
Notes EURThe accompanying notes form an essential part of these financial statements.
Cost
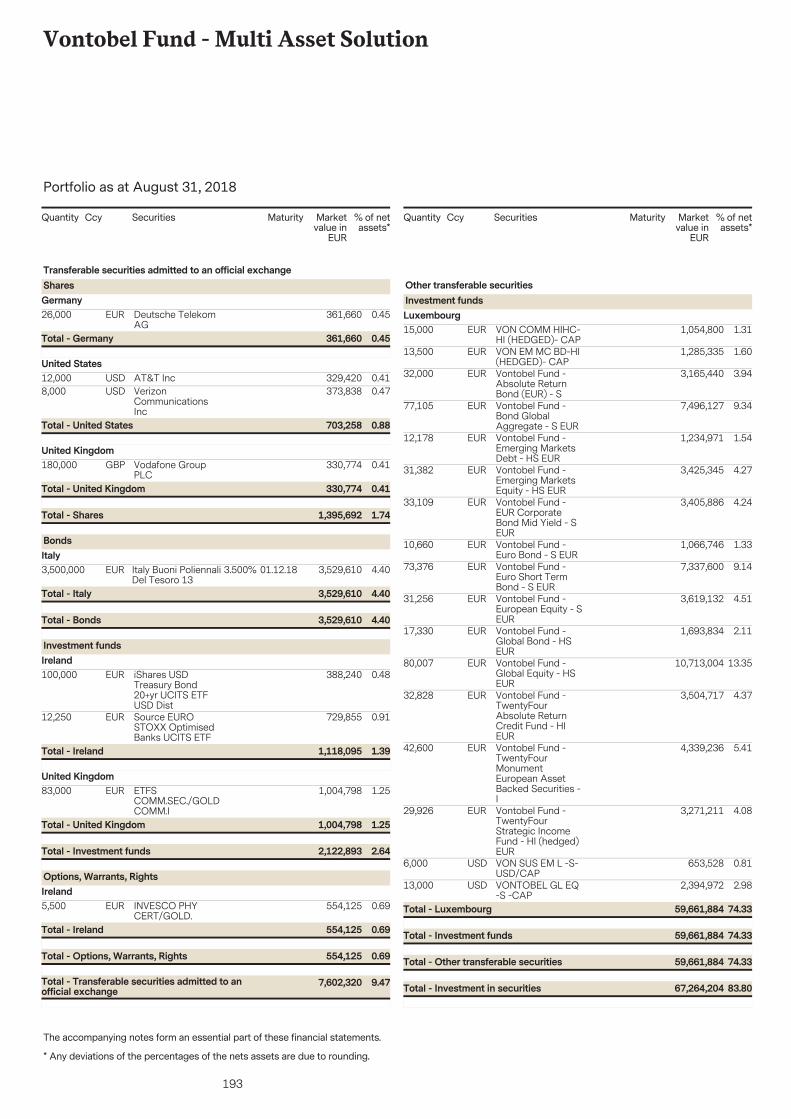
193
Vontobel Fund - Multi Asset Solution
The accompanying notes form an essential part of these financial statements.
Portfolio as at August 31, 2018
* Any deviations of the percentages of the nets assets are due to rounding.
Securities Marketvalue in
EUR
% of netassets*
Quantity Ccy Maturity
26,000 361,660 0.45Deutsche TelekomAG
EUR
Transferable securities admitted to an official exchangeSharesGermany
0.45361,660Total - Germany
12,000 329,420 0.41AT&T IncUSDUnited States
8,000 373,838 0.47VerizonCommunicationsInc
USD
0.88703,258Total - United States
180,000 330,774 0.41Vodafone GroupPLC
GBPUnited Kingdom
1.741,395,692Total - Shares
0.41330,774Total - United Kingdom
3,500,000 3,529,610 4.4001.12.18Italy Buoni PoliennaliDel Tesoro 13
EUR 3.500%
BondsItaly
4.403,529,610Total - Bonds
4.403,529,610Total - Italy
100,000 388,240 0.48iShares USDTreasury Bond20+yr UCITS ETFUSD Dist
EUR
Investment fundsIreland
12,250 729,855 0.91Source EUROSTOXX OptimisedBanks UCITS ETF
EUR
1.391,118,095Total - Ireland
83,000 1,004,798 1.25ETFSCOMM.SEC./GOLDCOMM.I
EURUnited Kingdom
2.642,122,893Total - Investment funds
1.251,004,798Total - United Kingdom
5,500 554,125 0.69INVESCO PHYCERT/GOLD.
EUR
Options, Warrants, RightsIreland
9.477,602,320Total - Transferable securities admitted to anofficial exchange
0.69554,125Total - Options, Warrants, Rights
0.69554,125Total - Ireland
Securities Marketvalue in
EUR
% of netassets*
Quantity Ccy Maturity
15,000 1,054,800 1.31VON COMM HIHC-HI (HEDGED)- CAP
EUR
Other transferable securitiesInvestment fundsLuxembourg
13,500 1,285,335 1.60VON EM MC BD-HI(HEDGED)- CAP
EUR
32,000 3,165,440 3.94Vontobel Fund -Absolute ReturnBond (EUR) - S
EUR
77,105 7,496,127 9.34Vontobel Fund -Bond GlobalAggregate - S EUR
EUR
12,178 1,234,971 1.54Vontobel Fund -Emerging MarketsDebt - HS EUR
EUR
31,382 3,425,345 4.27Vontobel Fund -Emerging MarketsEquity - HS EUR
EUR
33,109 3,405,886 4.24Vontobel Fund -EUR CorporateBond Mid Yield - SEUR
EUR
10,660 1,066,746 1.33Vontobel Fund -Euro Bond - S EUR
EUR
73,376 7,337,600 9.14Vontobel Fund -Euro Short TermBond - S EUR
EUR
31,256 3,619,132 4.51Vontobel Fund -European Equity - SEUR
EUR
17,330 1,693,834 2.11Vontobel Fund -Global Bond - HSEUR
EUR
80,007 10,713,004 13.35Vontobel Fund -Global Equity - HSEUR
EUR
32,828 3,504,717 4.37Vontobel Fund -TwentyFourAbsolute ReturnCredit Fund - HIEUR
EUR
42,600 4,339,236 5.41Vontobel Fund -TwentyFourMonumentEuropean AssetBacked Securities -I
EUR
29,926 3,271,211 4.08Vontobel Fund -TwentyFourStrategic IncomeFund - HI (hedged)EUR
EUR
6,000 653,528 0.81VON SUS EM L -S-USD/CAP
USD
13,000 2,394,972 2.98VONTOBEL GL EQ-S -CAP
USD
74.3359,661,884Total - Other transferable securities
74.3359,661,884Total - Investment funds
74.3359,661,884Total - Luxembourg
83.8067,264,204Total - Investment in securities
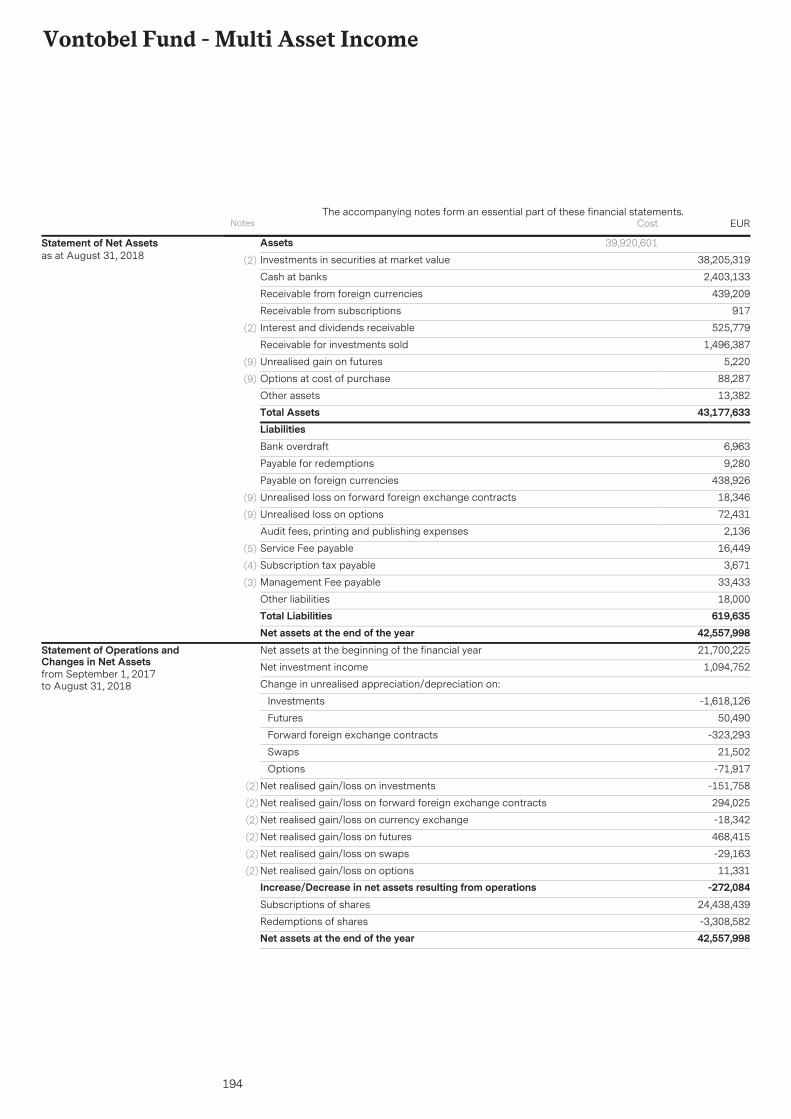
194
Vontobel Fund - Multi Asset Income
AssetsInvestments in securities at market value 38,205,319(2)
2,403,133Cash at banks
439,209Receivable from foreign currencies
917Receivable from subscriptions
525,779Interest and dividends receivable(2)
1,496,387Receivable for investments sold
5,220Unrealised gain on futures(9)
88,287Options at cost of purchase(9)
13,382Other assetsTotal Assets 43,177,633
39,920,601Statement of Net Assetsas at August 31, 2018
LiabilitiesBank overdraft 6,963
Payable for redemptions 9,280
Payable on foreign currencies 438,926
Unrealised loss on forward foreign exchange contracts 18,346(9)
Unrealised loss on options 72,431(9)
Audit fees, printing and publishing expenses 2,136
Service Fee payable 16,449(5)
Subscription tax payable 3,671(4)
Management Fee payable 33,433(3)
Other liabilities 18,000Total Liabilities 619,635Net assets at the end of the year 42,557,998Net assets at the beginning of the financial year 21,700,225
Net investment income 1,094,752
Change in unrealised appreciation/depreciation on:
Investments -1,618,126
Futures 50,490
Forward foreign exchange contracts -323,293
Swaps 21,502
Options -71,917
Net realised gain/loss on investments -151,758(2)
Net realised gain/loss on forward foreign exchange contracts 294,025(2)
Net realised gain/loss on currency exchange -18,342(2)
Net realised gain/loss on futures 468,415(2)
Net realised gain/loss on swaps -29,163(2)
Net realised gain/loss on options 11,331(2)
Increase/Decrease in net assets resulting from operations -272,084Subscriptions of shares 24,438,439
Redemptions of shares -3,308,582Net assets at the end of the year 42,557,998
Statement of Operations andChanges in Net Assetsfrom September 1, 2017to August 31, 2018
Notes EURThe accompanying notes form an essential part of these financial statements.
Cost
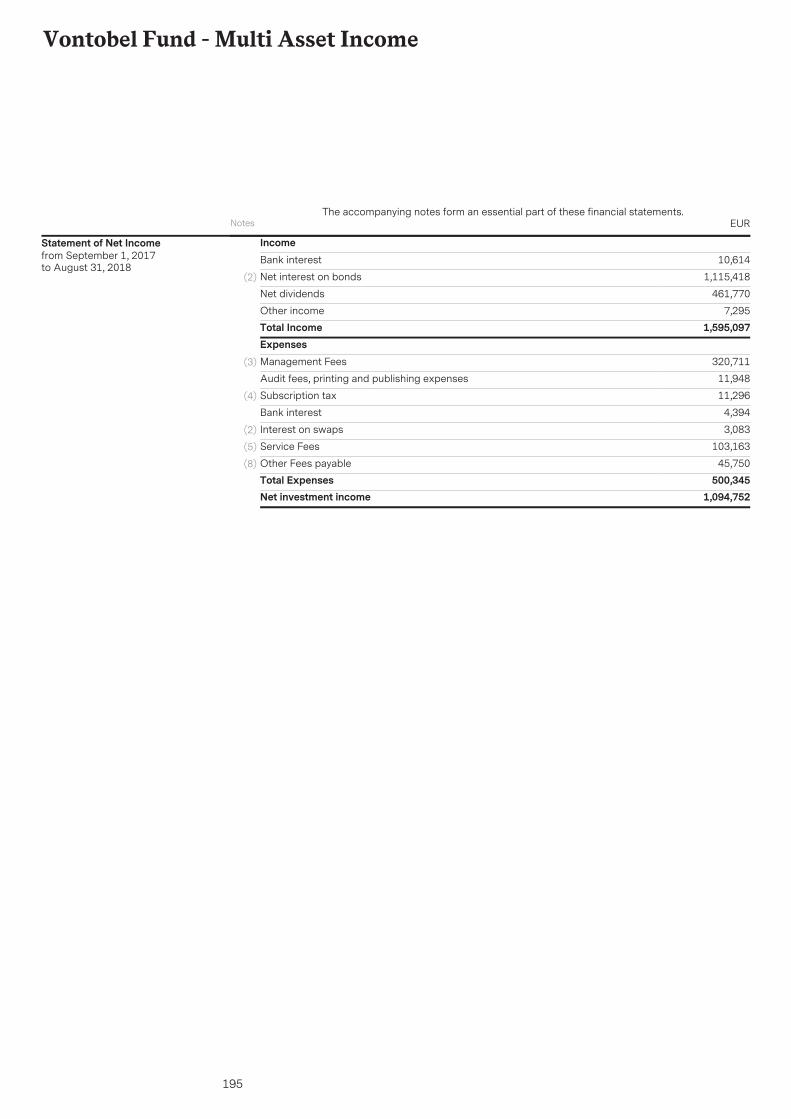
195
Vontobel Fund - Multi Asset Income
IncomeBank interest 10,614
Net interest on bonds 1,115,418(2)
Net dividends 461,770
Other income 7,295Total Income 1,595,097ExpensesManagement Fees 320,711(3)
Audit fees, printing and publishing expenses 11,948
Subscription tax 11,296(4)
Bank interest 4,394
Interest on swaps 3,083(2)
Service Fees 103,163(5)
Other Fees payable 45,750(8)
Total Expenses 500,345Net investment income 1,094,752
Statement of Net Incomefrom September 1, 2017to August 31, 2018
Notes EURThe accompanying notes form an essential part of these financial statements.
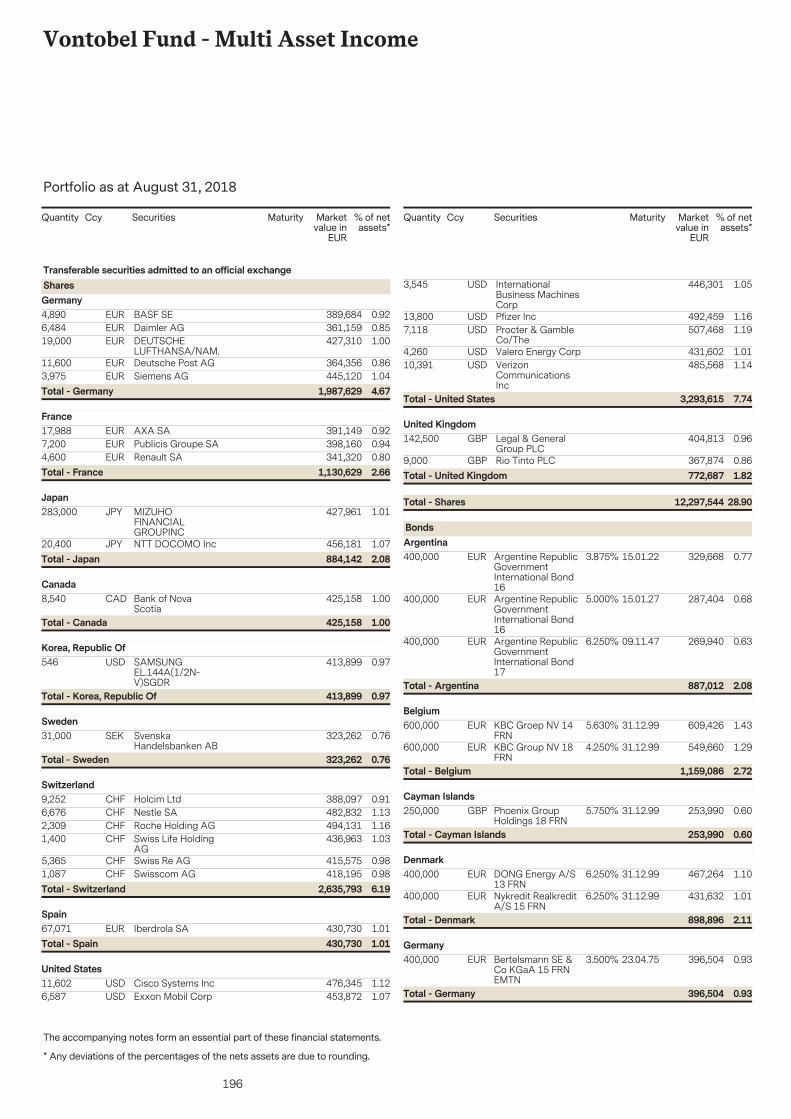
196
Vontobel Fund - Multi Asset Income
The accompanying notes form an essential part of these financial statements.
Portfolio as at August 31, 2018
* Any deviations of the percentages of the nets assets are due to rounding.
Securities Marketvalue in
EUR
% of netassets*
Quantity Ccy Maturity
4,890 389,684 0.92BASF SEEUR
Transferable securities admitted to an official exchangeSharesGermany
6,484 361,159 0.85Daimler AGEUR19,000 427,310 1.00DEUTSCHE
LUFTHANSA/NAM.EUR
11,600 364,356 0.86Deutsche Post AGEUR3,975 445,120 1.04Siemens AGEUR
4.671,987,629Total - Germany
17,988 391,149 0.92AXA SAEURFrance
7,200 398,160 0.94Publicis Groupe SAEUR4,600 341,320 0.80Renault SAEUR
2.661,130,629Total - France
283,000 427,961 1.01MIZUHOFINANCIALGROUPINC
JPYJapan
20,400 456,181 1.07NTT DOCOMO IncJPY2.08884,142Total - Japan
8,540 425,158 1.00Bank of NovaScotia
CADCanada
1.00425,158Total - Canada
546 413,899 0.97SAMSUNGEL.144A(1/2N-V)SGDR
USDKorea, Republic Of
0.97413,899Total - Korea, Republic Of
31,000 323,262 0.76SvenskaHandelsbanken AB
SEKSweden
0.76323,262Total - Sweden
9,252 388,097 0.91Holcim LtdCHFSwitzerland
6,676 482,832 1.13Nestle SACHF2,309 494,131 1.16Roche Holding AGCHF1,400 436,963 1.03Swiss Life Holding
AGCHF
5,365 415,575 0.98Swiss Re AGCHF1,087 418,195 0.98Swisscom AGCHF
6.192,635,793Total - Switzerland
67,071 430,730 1.01Iberdrola SAEURSpain
1.01430,730Total - Spain
11,602 476,345 1.12Cisco Systems IncUSDUnited States
6,587 453,872 1.07Exxon Mobil CorpUSD
Securities Marketvalue in
EUR
% of netassets*
Quantity Ccy Maturity
3,545 446,301 1.05InternationalBusiness MachinesCorp
USD
13,800 492,459 1.16Pfizer IncUSD7,118 507,468 1.19Procter & Gamble
Co/TheUSD
4,260 431,602 1.01Valero Energy CorpUSD10,391 485,568 1.14Verizon
CommunicationsInc
USD
7.743,293,615Total - United States
142,500 404,813 0.96Legal & GeneralGroup PLC
GBPUnited Kingdom
9,000 367,874 0.86Rio Tinto PLCGBP
28.9012,297,544Total - Shares
1.82772,687Total - United Kingdom
400,000 329,668 0.7715.01.22Argentine RepublicGovernmentInternational Bond16
EUR 3.875%
BondsArgentina
400,000 287,404 0.6815.01.27Argentine RepublicGovernmentInternational Bond16
EUR 5.000%
400,000 269,940 0.6309.11.47Argentine RepublicGovernmentInternational Bond17
EUR 6.250%
2.08887,012Total - Argentina
600,000 609,426 1.4331.12.99KBC Groep NV 14FRN
EUR 5.630%Belgium
600,000 549,660 1.2931.12.99KBC Group NV 18FRN
EUR 4.250%
2.721,159,086Total - Belgium
250,000 253,990 0.6031.12.99Phoenix GroupHoldings 18 FRN
GBP 5.750%Cayman Islands
0.60253,990Total - Cayman Islands
400,000 467,264 1.1031.12.99DONG Energy A/S13 FRN
EUR 6.250%Denmark
400,000 431,632 1.0131.12.99Nykredit RealkreditA/S 15 FRN
EUR 6.250%
2.11898,896Total - Denmark
400,000 396,504 0.9323.04.75Bertelsmann SE &Co KGaA 15 FRNEMTN
EUR 3.500%Germany
0.93396,504Total - Germany
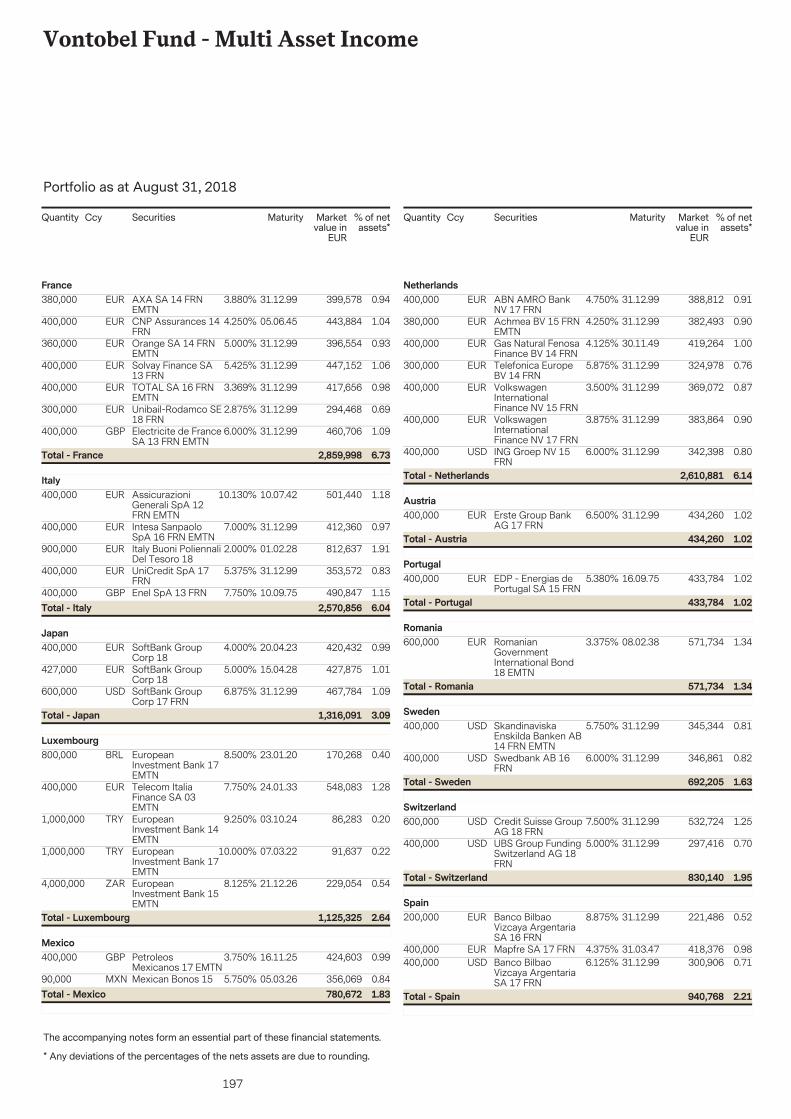
197
Vontobel Fund - Multi Asset Income
The accompanying notes form an essential part of these financial statements.
Portfolio as at August 31, 2018
* Any deviations of the percentages of the nets assets are due to rounding.
Securities Marketvalue in
EUR
% of netassets*
Quantity Ccy Maturity
380,000 399,578 0.9431.12.99AXA SA 14 FRNEMTN
EUR 3.880%France
400,000 443,884 1.0405.06.45CNP Assurances 14FRN
EUR 4.250%
360,000 396,554 0.9331.12.99Orange SA 14 FRNEMTN
EUR 5.000%
400,000 447,152 1.0631.12.99Solvay Finance SA13 FRN
EUR 5.425%
400,000 417,656 0.9831.12.99TOTAL SA 16 FRNEMTN
EUR 3.369%
300,000 294,468 0.6931.12.99Unibail-Rodamco SE18 FRN
EUR 2.875%
400,000 460,706 1.0931.12.99Electricite de FranceSA 13 FRN EMTN
GBP 6.000%
6.732,859,998Total - France
400,000 501,440 1.1810.07.42AssicurazioniGenerali SpA 12FRN EMTN
EUR 10.130%Italy
400,000 412,360 0.9731.12.99Intesa SanpaoloSpA 16 FRN EMTN
EUR 7.000%
900,000 812,637 1.9101.02.28Italy Buoni PoliennaliDel Tesoro 18
EUR 2.000%
400,000 353,572 0.8331.12.99UniCredit SpA 17FRN
EUR 5.375%
400,000 490,847 1.1510.09.75Enel SpA 13 FRNGBP 7.750%6.042,570,856Total - Italy
400,000 420,432 0.9920.04.23SoftBank GroupCorp 18
EUR 4.000%Japan
427,000 427,875 1.0115.04.28SoftBank GroupCorp 18
EUR 5.000%
600,000 467,784 1.0931.12.99SoftBank GroupCorp 17 FRN
USD 6.875%
3.091,316,091Total - Japan
800,000 170,268 0.4023.01.20EuropeanInvestment Bank 17EMTN
BRL 8.500%Luxembourg
400,000 548,083 1.2824.01.33Telecom ItaliaFinance SA 03EMTN
EUR 7.750%
1,000,000 86,283 0.2003.10.24EuropeanInvestment Bank 14EMTN
TRY 9.250%
1,000,000 91,637 0.2207.03.22EuropeanInvestment Bank 17EMTN
TRY 10.000%
4,000,000 229,054 0.5421.12.26EuropeanInvestment Bank 15EMTN
ZAR 8.125%
2.641,125,325Total - Luxembourg
400,000 424,603 0.9916.11.25PetroleosMexicanos 17 EMTN
GBP 3.750%Mexico
90,000 356,069 0.8405.03.26Mexican Bonos 15MXN 5.750%1.83780,672Total - Mexico
Securities Marketvalue in
EUR
% of netassets*
Quantity Ccy Maturity
400,000 388,812 0.9131.12.99ABN AMRO BankNV 17 FRN
EUR 4.750%Netherlands
380,000 382,493 0.9031.12.99Achmea BV 15 FRNEMTN
EUR 4.250%
400,000 419,264 1.0030.11.49Gas Natural FenosaFinance BV 14 FRN
EUR 4.125%
300,000 324,978 0.7631.12.99Telefonica EuropeBV 14 FRN
EUR 5.875%
400,000 369,072 0.8731.12.99VolkswagenInternationalFinance NV 15 FRN
EUR 3.500%
400,000 383,864 0.9031.12.99VolkswagenInternationalFinance NV 17 FRN
EUR 3.875%
400,000 342,398 0.8031.12.99ING Groep NV 15FRN
USD 6.000%
6.142,610,881Total - Netherlands
400,000 434,260 1.0231.12.99Erste Group BankAG 17 FRN
EUR 6.500%Austria
1.02434,260Total - Austria
400,000 433,784 1.0216.09.75EDP - Energias dePortugal SA 15 FRN
EUR 5.380%Portugal
1.02433,784Total - Portugal
600,000 571,734 1.3408.02.38RomanianGovernmentInternational Bond18 EMTN
EUR 3.375%Romania
1.34571,734Total - Romania
400,000 345,344 0.8131.12.99SkandinaviskaEnskilda Banken AB14 FRN EMTN
USD 5.750%Sweden
400,000 346,861 0.8231.12.99Swedbank AB 16FRN
USD 6.000%
1.63692,205Total - Sweden
600,000 532,724 1.2531.12.99Credit Suisse GroupAG 18 FRN
USD 7.500%Switzerland
400,000 297,416 0.7031.12.99UBS Group FundingSwitzerland AG 18FRN
USD 5.000%
1.95830,140Total - Switzerland
200,000 221,486 0.5231.12.99Banco BilbaoVizcaya ArgentariaSA 16 FRN
EUR 8.875%Spain
400,000 418,376 0.9831.03.47Mapfre SA 17 FRNEUR 4.375%400,000 300,906 0.7131.12.99Banco Bilbao
Vizcaya ArgentariaSA 17 FRN
USD 6.125%
2.21940,768Total - Spain
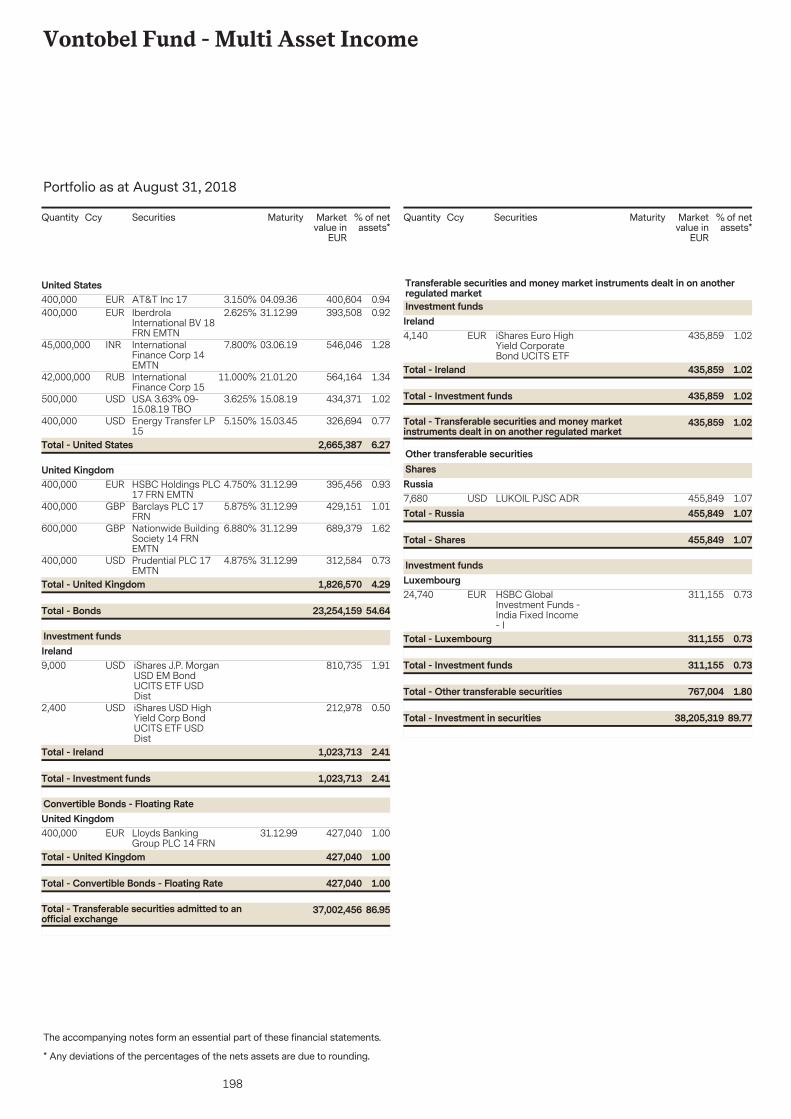
198
Vontobel Fund - Multi Asset Income
The accompanying notes form an essential part of these financial statements.
Portfolio as at August 31, 2018
* Any deviations of the percentages of the nets assets are due to rounding.
Securities Marketvalue in
EUR
% of netassets*
Quantity Ccy Maturity
400,000 400,604 0.9404.09.36AT&T Inc 17EUR 3.150%United States
400,000 393,508 0.9231.12.99IberdrolaInternational BV 18FRN EMTN
EUR 2.625%
45,000,000 546,046 1.2803.06.19InternationalFinance Corp 14EMTN
INR 7.800%
42,000,000 564,164 1.3421.01.20InternationalFinance Corp 15
RUB 11.000%
500,000 434,371 1.0215.08.19USA 3.63% 09-15.08.19 TBO
USD 3.625%
400,000 326,694 0.7715.03.45Energy Transfer LP15
USD 5.150%
6.272,665,387Total - United States
400,000 395,456 0.9331.12.99HSBC Holdings PLC17 FRN EMTN
EUR 4.750%United Kingdom
400,000 429,151 1.0131.12.99Barclays PLC 17FRN
GBP 5.875%
600,000 689,379 1.6231.12.99Nationwide BuildingSociety 14 FRNEMTN
GBP 6.880%
400,000 312,584 0.7331.12.99Prudential PLC 17EMTN
USD 4.875%
54.6423,254,159Total - Bonds
4.291,826,570Total - United Kingdom
9,000 810,735 1.91iShares J.P. MorganUSD EM BondUCITS ETF USDDist
USD
Investment fundsIreland
2,400 212,978 0.50iShares USD HighYield Corp BondUCITS ETF USDDist
USD
2.411,023,713Total - Investment funds
2.411,023,713Total - Ireland
400,000 427,040 1.0031.12.99Lloyds BankingGroup PLC 14 FRN
EUR
Convertible Bonds - Floating RateUnited Kingdom
86.9537,002,456Total - Transferable securities admitted to anofficial exchange
1.00427,040Total - Convertible Bonds - Floating Rate
1.00427,040Total - United Kingdom
Securities Marketvalue in
EUR
% of netassets*
Quantity Ccy Maturity
4,140 435,859 1.02iShares Euro HighYield CorporateBond UCITS ETF
EUR
Transferable securities and money market instruments dealt in on anotherregulated marketInvestment fundsIreland
1.02435,859Total - Transferable securities and money marketinstruments dealt in on another regulated market
1.02435,859Total - Investment funds
1.02435,859Total - Ireland
7,680 455,849 1.07LUKOIL PJSC ADRUSD
Other transferable securitiesSharesRussia
1.07455,849Total - Shares
1.07455,849Total - Russia
24,740 311,155 0.73HSBC GlobalInvestment Funds -India Fixed Income- I
EUR
Investment fundsLuxembourg
1.80767,004Total - Other transferable securities
0.73311,155Total - Investment funds
0.73311,155Total - Luxembourg
89.7738,205,319Total - Investment in securities
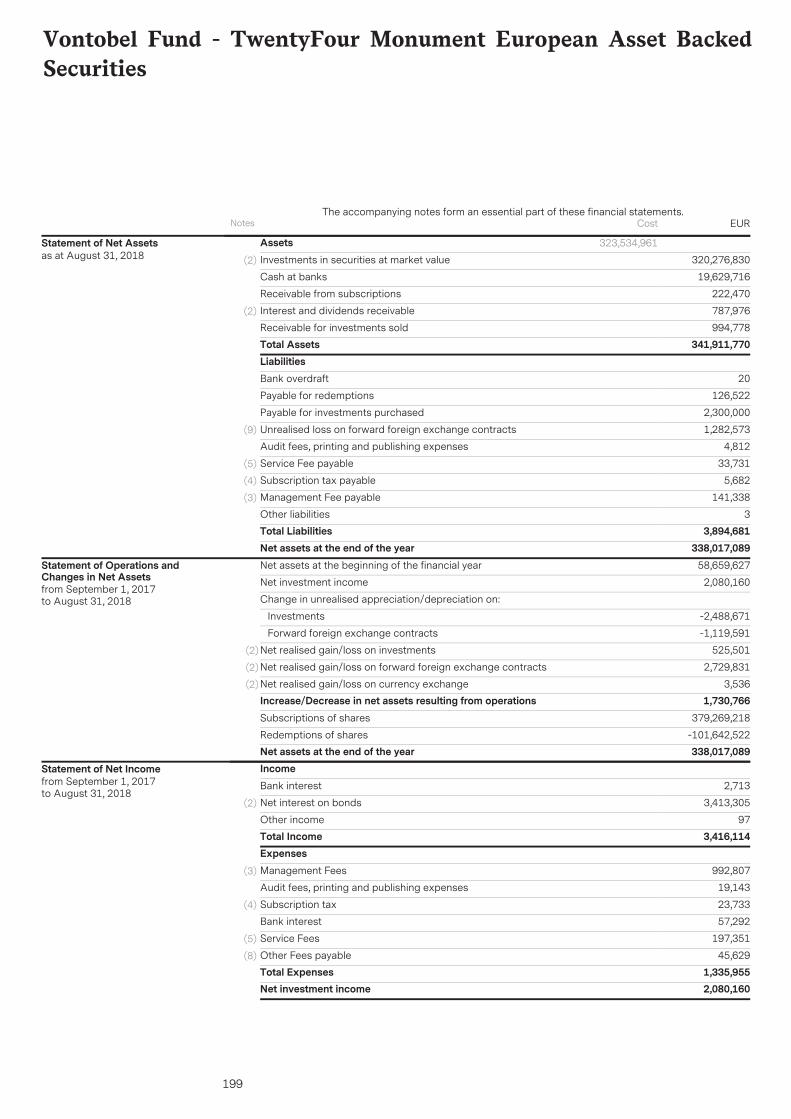
199
Vontobel Fund - TwentyFour Monument European Asset BackedSecurities
AssetsInvestments in securities at market value 320,276,830(2)
19,629,716Cash at banks
222,470Receivable from subscriptions
787,976Interest and dividends receivable(2)
994,778Receivable for investments soldTotal Assets 341,911,770
323,534,961Statement of Net Assetsas at August 31, 2018
LiabilitiesBank overdraft 20
Payable for redemptions 126,522
Payable for investments purchased 2,300,000
Unrealised loss on forward foreign exchange contracts 1,282,573(9)
Audit fees, printing and publishing expenses 4,812
Service Fee payable 33,731(5)
Subscription tax payable 5,682(4)
Management Fee payable 141,338(3)
Other liabilities 3Total Liabilities 3,894,681Net assets at the end of the year 338,017,089Net assets at the beginning of the financial year 58,659,627
Net investment income 2,080,160
Change in unrealised appreciation/depreciation on:
Investments -2,488,671
Forward foreign exchange contracts -1,119,591
Net realised gain/loss on investments 525,501(2)
Net realised gain/loss on forward foreign exchange contracts 2,729,831(2)
Net realised gain/loss on currency exchange 3,536(2)
Increase/Decrease in net assets resulting from operations 1,730,766Subscriptions of shares 379,269,218
Redemptions of shares -101,642,522Net assets at the end of the year 338,017,089
Statement of Operations andChanges in Net Assetsfrom September 1, 2017to August 31, 2018
IncomeBank interest 2,713
Net interest on bonds 3,413,305(2)
Other income 97Total Income 3,416,114ExpensesManagement Fees 992,807(3)
Audit fees, printing and publishing expenses 19,143
Subscription tax 23,733(4)
Bank interest 57,292
Service Fees 197,351(5)
Other Fees payable 45,629(8)
Total Expenses 1,335,955Net investment income 2,080,160
Statement of Net Incomefrom September 1, 2017to August 31, 2018
Notes EURThe accompanying notes form an essential part of these financial statements.
Cost
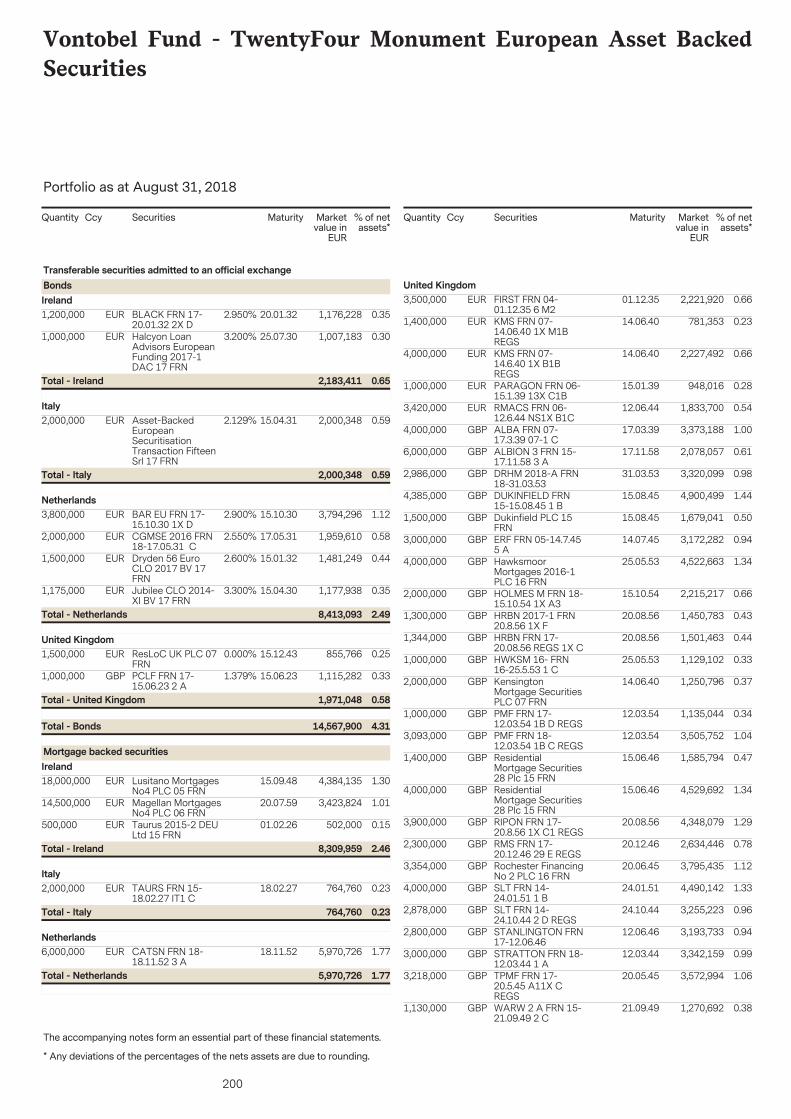
200
Vontobel Fund - TwentyFour Monument European Asset BackedSecurities
The accompanying notes form an essential part of these financial statements.
Portfolio as at August 31, 2018
* Any deviations of the percentages of the nets assets are due to rounding.
Securities Marketvalue in
EUR
% of netassets*
Quantity Ccy Maturity
1,200,000 1,176,228 0.3520.01.32BLACK FRN 17-20.01.32 2X D
EUR 2.950%
Transferable securities admitted to an official exchangeBondsIreland
1,000,000 1,007,183 0.3025.07.30Halcyon LoanAdvisors EuropeanFunding 2017-1DAC 17 FRN
EUR 3.200%
0.652,183,411Total - Ireland
2,000,000 2,000,348 0.5915.04.31Asset-BackedEuropeanSecuritisationTransaction FifteenSrl 17 FRN
EUR 2.129%Italy
0.592,000,348Total - Italy
3,800,000 3,794,296 1.1215.10.30BAR EU FRN 17-15.10.30 1X D
EUR 2.900%Netherlands
2,000,000 1,959,610 0.5817.05.31CGMSE 2016 FRN18-17.05.31 C
EUR 2.550%
1,500,000 1,481,249 0.4415.01.32Dryden 56 EuroCLO 2017 BV 17FRN
EUR 2.600%
1,175,000 1,177,938 0.3515.04.30Jubilee CLO 2014-XI BV 17 FRN
EUR 3.300%
2.498,413,093Total - Netherlands
1,500,000 855,766 0.2515.12.43ResLoC UK PLC 07FRN
EUR 0.000%United Kingdom
1,000,000 1,115,282 0.3315.06.23PCLF FRN 17-15.06.23 2 A
GBP 1.379%
4.3114,567,900Total - Bonds
0.581,971,048Total - United Kingdom
18,000,000 4,384,135 1.3015.09.48Lusitano MortgagesNo4 PLC 05 FRN
EUR
Mortgage backed securitiesIreland
14,500,000 3,423,824 1.0120.07.59Magellan MortgagesNo4 PLC 06 FRN
EUR
500,000 502,000 0.1501.02.26Taurus 2015-2 DEULtd 15 FRN
EUR
2.468,309,959Total - Ireland
2,000,000 764,760 0.2318.02.27TAURS FRN 15-18.02.27 IT1 C
EURItaly
0.23764,760Total - Italy
6,000,000 5,970,726 1.7718.11.52CATSN FRN 18-18.11.52 3 A
EURNetherlands
1.775,970,726Total - Netherlands
Securities Marketvalue in
EUR
% of netassets*
Quantity Ccy Maturity
3,500,000 2,221,920 0.6601.12.35FIRST FRN 04-01.12.35 6 M2
EURUnited Kingdom
1,400,000 781,353 0.2314.06.40KMS FRN 07-14.06.40 1X M1BREGS
EUR
4,000,000 2,227,492 0.6614.06.40KMS FRN 07-14.6.40 1X B1BREGS
EUR
1,000,000 948,016 0.2815.01.39PARAGON FRN 06-15.1.39 13X C1B
EUR
3,420,000 1,833,700 0.5412.06.44RMACS FRN 06-12.6.44 NS1X B1C
EUR
4,000,000 3,373,188 1.0017.03.39ALBA FRN 07-17.3.39 07-1 C
GBP
6,000,000 2,078,057 0.6117.11.58ALBION 3 FRN 15-17.11.58 3 A
GBP
2,986,000 3,320,099 0.9831.03.53DRHM 2018-A FRN18-31.03.53
GBP
4,385,000 4,900,499 1.4415.08.45DUKINFIELD FRN15-15.08.45 1 B
GBP
1,500,000 1,679,041 0.5015.08.45Dukinfield PLC 15FRN
GBP
3,000,000 3,172,282 0.9414.07.45ERF FRN 05-14.7.455 A
GBP
4,000,000 4,522,663 1.3425.05.53HawksmoorMortgages 2016-1PLC 16 FRN
GBP
2,000,000 2,215,217 0.6615.10.54HOLMES M FRN 18-15.10.54 1X A3
GBP
1,300,000 1,450,783 0.4320.08.56HRBN 2017-1 FRN20.8.56 1X F
GBP
1,344,000 1,501,463 0.4420.08.56HRBN FRN 17-20.08.56 REGS 1X C
GBP
1,000,000 1,129,102 0.3325.05.53HWKSM 16- FRN16-25.5.53 1 C
GBP
2,000,000 1,250,796 0.3714.06.40KensingtonMortgage SecuritiesPLC 07 FRN
GBP
1,000,000 1,135,044 0.3412.03.54PMF FRN 17-12.03.54 1B D REGS
GBP
3,093,000 3,505,752 1.0412.03.54PMF FRN 18-12.03.54 1B C REGS
GBP
1,400,000 1,585,794 0.4715.06.46ResidentialMortgage Securities28 Plc 15 FRN
GBP
4,000,000 4,529,692 1.3415.06.46ResidentialMortgage Securities28 Plc 15 FRN
GBP
3,900,000 4,348,079 1.2920.08.56RIPON FRN 17-20.8.56 1X C1 REGS
GBP
2,300,000 2,634,446 0.7820.12.46RMS FRN 17-20.12.46 29 E REGS
GBP
3,354,000 3,795,435 1.1220.06.45Rochester FinancingNo 2 PLC 16 FRN
GBP
4,000,000 4,490,142 1.3324.01.51SLT FRN 14-24.01.51 1 B
GBP
2,878,000 3,255,223 0.9624.10.44SLT FRN 14-24.10.44 2 D REGS
GBP
2,800,000 3,193,733 0.9412.06.46STANLINGTON FRN17-12.06.46
GBP
3,000,000 3,342,159 0.9912.03.44STRATTON FRN 18-12.03.44 1 A
GBP
3,218,000 3,572,994 1.0620.05.45TPMF FRN 17-20.5.45 A11X CREGS
GBP
1,130,000 1,270,692 0.3821.09.49WARW 2 A FRN 15-21.09.49 2 C
GBP
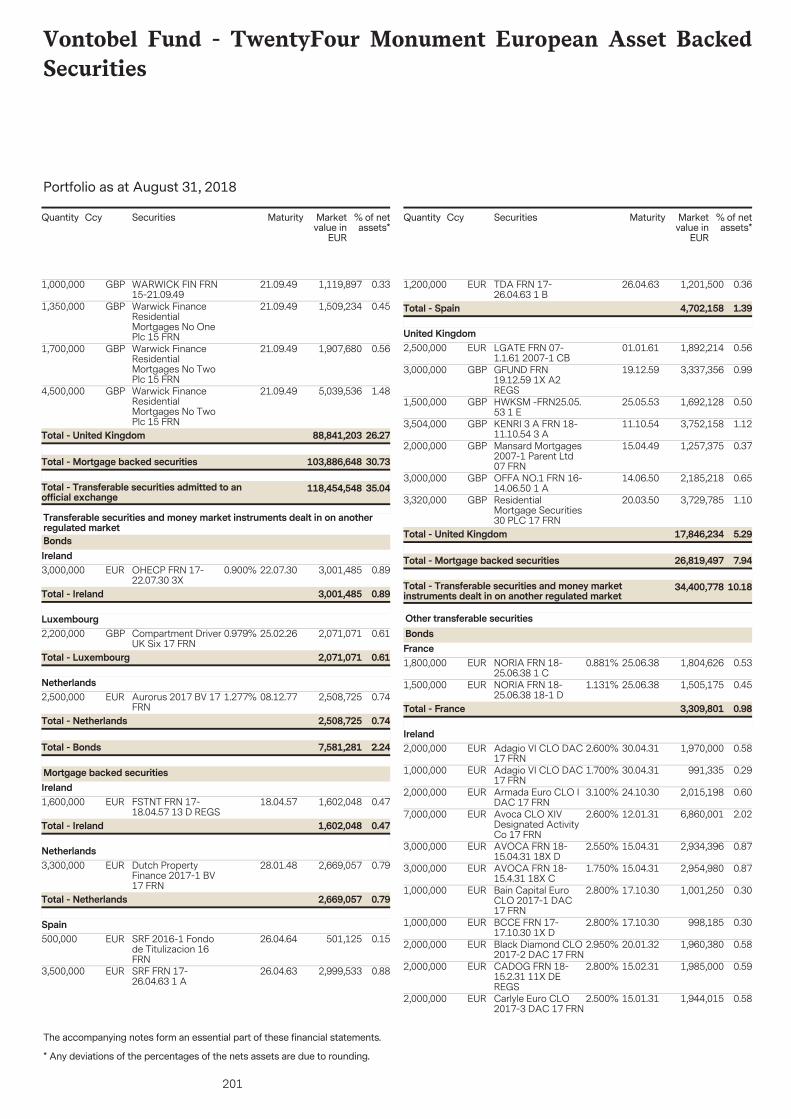
201
Vontobel Fund - TwentyFour Monument European Asset BackedSecurities
The accompanying notes form an essential part of these financial statements.
Portfolio as at August 31, 2018
* Any deviations of the percentages of the nets assets are due to rounding.
Securities Marketvalue in
EUR
% of netassets*
Quantity Ccy Maturity
1,000,000 1,119,897 0.3321.09.49WARWICK FIN FRN15-21.09.49
GBP
1,350,000 1,509,234 0.4521.09.49Warwick FinanceResidentialMortgages No OnePlc 15 FRN
GBP
1,700,000 1,907,680 0.5621.09.49Warwick FinanceResidentialMortgages No TwoPlc 15 FRN
GBP
4,500,000 5,039,536 1.4821.09.49Warwick FinanceResidentialMortgages No TwoPlc 15 FRN
GBP
35.04118,454,548Total - Transferable securities admitted to anofficial exchange
30.73103,886,648Total - Mortgage backed securities
26.2788,841,203Total - United Kingdom
3,000,000 3,001,485 0.8922.07.30OHECP FRN 17-22.07.30 3X
EUR 0.900%
Transferable securities and money market instruments dealt in on anotherregulated marketBondsIreland
0.893,001,485Total - Ireland
2,200,000 2,071,071 0.6125.02.26Compartment DriverUK Six 17 FRN
GBP 0.979%Luxembourg
0.612,071,071Total - Luxembourg
2,500,000 2,508,725 0.7408.12.77Aurorus 2017 BV 17FRN
EUR 1.277%Netherlands
2.247,581,281Total - Bonds
0.742,508,725Total - Netherlands
1,600,000 1,602,048 0.4718.04.57FSTNT FRN 17-18.04.57 13 D REGS
EUR
Mortgage backed securitiesIreland
0.471,602,048Total - Ireland
3,300,000 2,669,057 0.7928.01.48Dutch PropertyFinance 2017-1 BV17 FRN
EURNetherlands
0.792,669,057Total - Netherlands
500,000 501,125 0.1526.04.64SRF 2016-1 Fondode Titulizacion 16FRN
EURSpain
3,500,000 2,999,533 0.8826.04.63SRF FRN 17-26.04.63 1 A
EUR
Securities Marketvalue in
EUR
% of netassets*
Quantity Ccy Maturity
1,200,000 1,201,500 0.3626.04.63TDA FRN 17-26.04.63 1 B
EUR
1.394,702,158Total - Spain
2,500,000 1,892,214 0.5601.01.61LGATE FRN 07-1.1.61 2007-1 CB
EURUnited Kingdom
3,000,000 3,337,356 0.9919.12.59GFUND FRN19.12.59 1X A2REGS
GBP
1,500,000 1,692,128 0.5025.05.53HWKSM -FRN25.05.53 1 E
GBP
3,504,000 3,752,158 1.1211.10.54KENRI 3 A FRN 18-11.10.54 3 A
GBP
2,000,000 1,257,375 0.3715.04.49Mansard Mortgages2007-1 Parent Ltd07 FRN
GBP
3,000,000 2,185,218 0.6514.06.50OFFA NO.1 FRN 16-14.06.50 1 A
GBP
3,320,000 3,729,785 1.1020.03.50ResidentialMortgage Securities30 PLC 17 FRN
GBP
10.1834,400,778Total - Transferable securities and money marketinstruments dealt in on another regulated market
7.9426,819,497Total - Mortgage backed securities
5.2917,846,234Total - United Kingdom
1,800,000 1,804,626 0.5325.06.38NORIA FRN 18-25.06.38 1 C
EUR 0.881%
Other transferable securitiesBondsFrance
1,500,000 1,505,175 0.4525.06.38NORIA FRN 18-25.06.38 18-1 D
EUR 1.131%
0.983,309,801Total - France
2,000,000 1,970,000 0.5830.04.31Adagio VI CLO DAC17 FRN
EUR 2.600%Ireland
1,000,000 991,335 0.2930.04.31Adagio VI CLO DAC17 FRN
EUR 1.700%
2,000,000 2,015,198 0.6024.10.30Armada Euro CLO IDAC 17 FRN
EUR 3.100%
7,000,000 6,860,001 2.0212.01.31Avoca CLO XIVDesignated ActivityCo 17 FRN
EUR 2.600%
3,000,000 2,934,396 0.8715.04.31AVOCA FRN 18-15.04.31 18X D
EUR 2.550%
3,000,000 2,954,980 0.8715.04.31AVOCA FRN 18-15.4.31 18X C
EUR 1.750%
1,000,000 1,001,250 0.3017.10.30Bain Capital EuroCLO 2017-1 DAC17 FRN
EUR 2.800%
1,000,000 998,185 0.3017.10.30BCCE FRN 17-17.10.30 1X D
EUR 2.800%
2,000,000 1,960,380 0.5820.01.32Black Diamond CLO2017-2 DAC 17 FRN
EUR 2.950%
2,000,000 1,985,000 0.5915.02.31CADOG FRN 18-15.2.31 11X DEREGS
EUR 2.800%
2,000,000 1,944,015 0.5815.01.31Carlyle Euro CLO2017-3 DAC 17 FRN
EUR 2.500%
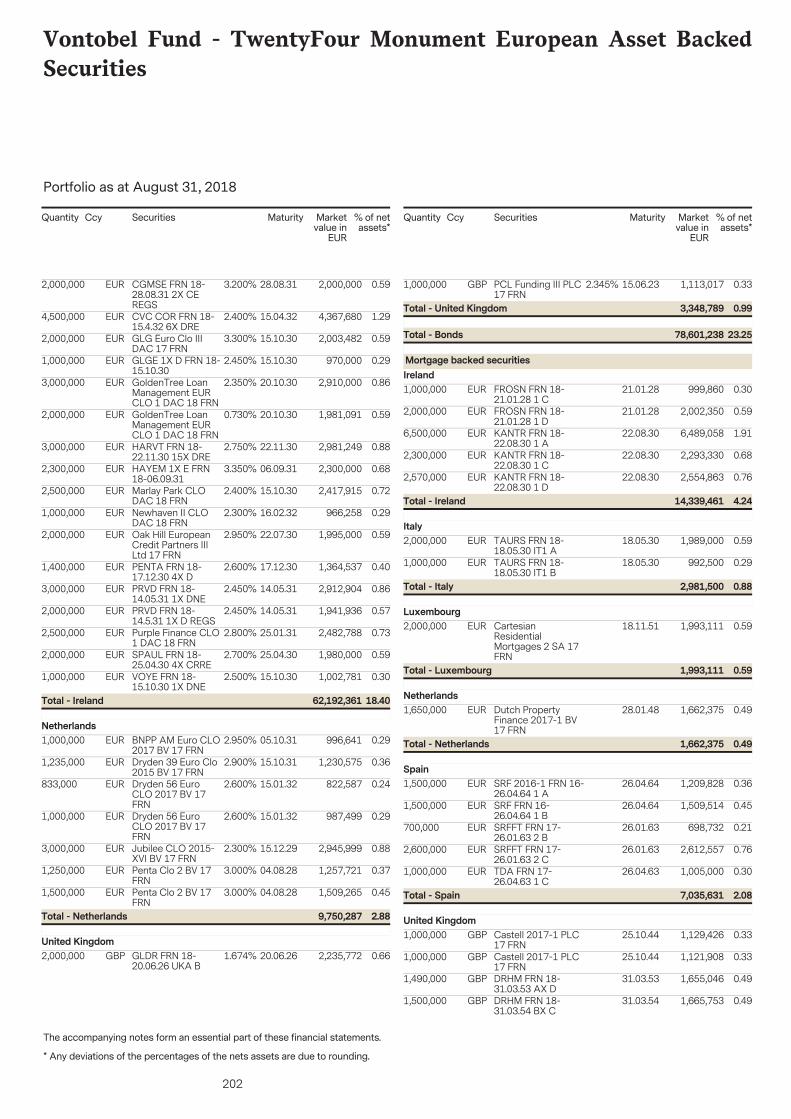
202
Vontobel Fund - TwentyFour Monument European Asset BackedSecurities
The accompanying notes form an essential part of these financial statements.
Portfolio as at August 31, 2018
* Any deviations of the percentages of the nets assets are due to rounding.
Securities Marketvalue in
EUR
% of netassets*
Quantity Ccy Maturity
2,000,000 2,000,000 0.5928.08.31CGMSE FRN 18-28.08.31 2X CEREGS
EUR 3.200%
4,500,000 4,367,680 1.2915.04.32CVC COR FRN 18-15.4.32 6X DRE
EUR 2.400%
2,000,000 2,003,482 0.5915.10.30GLG Euro Clo IIIDAC 17 FRN
EUR 3.300%
1,000,000 970,000 0.2915.10.30GLGE 1X D FRN 18-15.10.30
EUR 2.450%
3,000,000 2,910,000 0.8620.10.30GoldenTree LoanManagement EURCLO 1 DAC 18 FRN
EUR 2.350%
2,000,000 1,981,091 0.5920.10.30GoldenTree LoanManagement EURCLO 1 DAC 18 FRN
EUR 0.730%
3,000,000 2,981,249 0.8822.11.30HARVT FRN 18-22.11.30 15X DRE
EUR 2.750%
2,300,000 2,300,000 0.6806.09.31HAYEM 1X E FRN18-06.09.31
EUR 3.350%
2,500,000 2,417,915 0.7215.10.30Marlay Park CLODAC 18 FRN
EUR 2.400%
1,000,000 966,258 0.2916.02.32Newhaven II CLODAC 18 FRN
EUR 2.300%
2,000,000 1,995,000 0.5922.07.30Oak Hill EuropeanCredit Partners IIILtd 17 FRN
EUR 2.950%
1,400,000 1,364,537 0.4017.12.30PENTA FRN 18-17.12.30 4X D
EUR 2.600%
3,000,000 2,912,904 0.8614.05.31PRVD FRN 18-14.05.31 1X DNE
EUR 2.450%
2,000,000 1,941,936 0.5714.05.31PRVD FRN 18-14.5.31 1X D REGS
EUR 2.450%
2,500,000 2,482,788 0.7325.01.31Purple Finance CLO1 DAC 18 FRN
EUR 2.800%
2,000,000 1,980,000 0.5925.04.30SPAUL FRN 18-25.04.30 4X CRRE
EUR 2.700%
1,000,000 1,002,781 0.3015.10.30VOYE FRN 18-15.10.30 1X DNE
EUR 2.500%
18.4062,192,361Total - Ireland
1,000,000 996,641 0.2905.10.31BNPP AM Euro CLO2017 BV 17 FRN
EUR 2.950%Netherlands
1,235,000 1,230,575 0.3615.10.31Dryden 39 Euro Clo2015 BV 17 FRN
EUR 2.900%
833,000 822,587 0.2415.01.32Dryden 56 EuroCLO 2017 BV 17FRN
EUR 2.600%
1,000,000 987,499 0.2915.01.32Dryden 56 EuroCLO 2017 BV 17FRN
EUR 2.600%
3,000,000 2,945,999 0.8815.12.29Jubilee CLO 2015-XVI BV 17 FRN
EUR 2.300%
1,250,000 1,257,721 0.3704.08.28Penta Clo 2 BV 17FRN
EUR 3.000%
1,500,000 1,509,265 0.4504.08.28Penta Clo 2 BV 17FRN
EUR 3.000%
2.889,750,287Total - Netherlands
2,000,000 2,235,772 0.6620.06.26GLDR FRN 18-20.06.26 UKA B
GBP 1.674%United Kingdom
Securities Marketvalue in
EUR
% of netassets*
Quantity Ccy Maturity
1,000,000 1,113,017 0.3315.06.23PCL Funding III PLC17 FRN
GBP 2.345%
23.2578,601,238Total - Bonds
0.993,348,789Total - United Kingdom
1,000,000 999,860 0.3021.01.28FROSN FRN 18-21.01.28 1 C
EUR
Mortgage backed securitiesIreland
2,000,000 2,002,350 0.5921.01.28FROSN FRN 18-21.01.28 1 D
EUR
6,500,000 6,489,058 1.9122.08.30KANTR FRN 18-22.08.30 1 A
EUR
2,300,000 2,293,330 0.6822.08.30KANTR FRN 18-22.08.30 1 C
EUR
2,570,000 2,554,863 0.7622.08.30KANTR FRN 18-22.08.30 1 D
EUR
4.2414,339,461Total - Ireland
2,000,000 1,989,000 0.5918.05.30TAURS FRN 18-18.05.30 IT1 A
EURItaly
1,000,000 992,500 0.2918.05.30TAURS FRN 18-18.05.30 IT1 B
EUR
0.882,981,500Total - Italy
2,000,000 1,993,111 0.5918.11.51CartesianResidentialMortgages 2 SA 17FRN
EURLuxembourg
0.591,993,111Total - Luxembourg
1,650,000 1,662,375 0.4928.01.48Dutch PropertyFinance 2017-1 BV17 FRN
EURNetherlands
0.491,662,375Total - Netherlands
1,500,000 1,209,828 0.3626.04.64SRF 2016-1 FRN 16-26.04.64 1 A
EURSpain
1,500,000 1,509,514 0.4526.04.64SRF FRN 16-26.04.64 1 B
EUR
700,000 698,732 0.2126.01.63SRFFT FRN 17-26.01.63 2 B
EUR
2,600,000 2,612,557 0.7626.01.63SRFFT FRN 17-26.01.63 2 C
EUR
1,000,000 1,005,000 0.3026.04.63TDA FRN 17-26.04.63 1 C
EUR
2.087,035,631Total - Spain
1,000,000 1,129,426 0.3325.10.44Castell 2017-1 PLC17 FRN
GBPUnited Kingdom
1,000,000 1,121,908 0.3325.10.44Castell 2017-1 PLC17 FRN
GBP
1,490,000 1,655,046 0.4931.03.53DRHM FRN 18-31.03.53 AX D
GBP
1,500,000 1,665,753 0.4931.03.54DRHM FRN 18-31.03.54 BX C
GBP
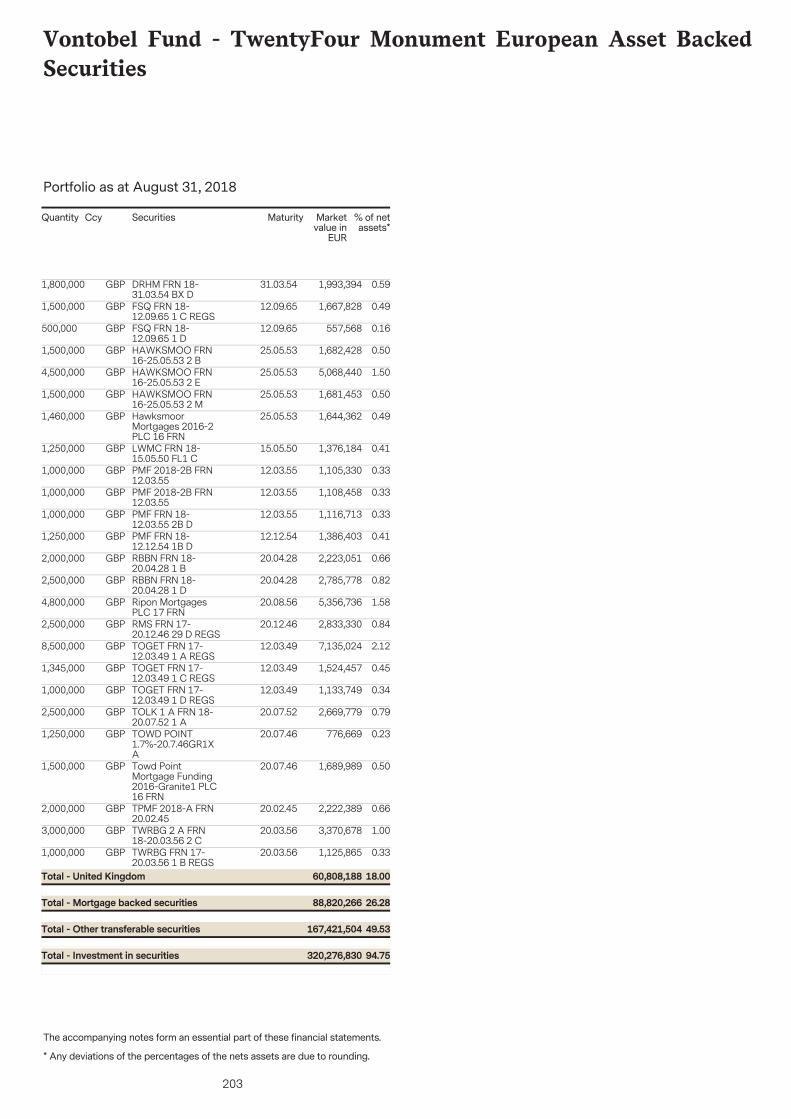
203
Vontobel Fund - TwentyFour Monument European Asset BackedSecurities
The accompanying notes form an essential part of these financial statements.
Portfolio as at August 31, 2018
* Any deviations of the percentages of the nets assets are due to rounding.
Securities Marketvalue in
EUR
% of netassets*
Quantity Ccy Maturity
1,800,000 1,993,394 0.5931.03.54DRHM FRN 18-31.03.54 BX D
GBP
1,500,000 1,667,828 0.4912.09.65FSQ FRN 18-12.09.65 1 C REGS
GBP
500,000 557,568 0.1612.09.65FSQ FRN 18-12.09.65 1 D
GBP
1,500,000 1,682,428 0.5025.05.53HAWKSMOO FRN16-25.05.53 2 B
GBP
4,500,000 5,068,440 1.5025.05.53HAWKSMOO FRN16-25.05.53 2 E
GBP
1,500,000 1,681,453 0.5025.05.53HAWKSMOO FRN16-25.05.53 2 M
GBP
1,460,000 1,644,362 0.4925.05.53HawksmoorMortgages 2016-2PLC 16 FRN
GBP
1,250,000 1,376,184 0.4115.05.50LWMC FRN 18-15.05.50 FL1 C
GBP
1,000,000 1,105,330 0.3312.03.55PMF 2018-2B FRN12.03.55
GBP
1,000,000 1,108,458 0.3312.03.55PMF 2018-2B FRN12.03.55
GBP
1,000,000 1,116,713 0.3312.03.55PMF FRN 18-12.03.55 2B D
GBP
1,250,000 1,386,403 0.4112.12.54PMF FRN 18-12.12.54 1B D
GBP
2,000,000 2,223,051 0.6620.04.28RBBN FRN 18-20.04.28 1 B
GBP
2,500,000 2,785,778 0.8220.04.28RBBN FRN 18-20.04.28 1 D
GBP
4,800,000 5,356,736 1.5820.08.56Ripon MortgagesPLC 17 FRN
GBP
2,500,000 2,833,330 0.8420.12.46RMS FRN 17-20.12.46 29 D REGS
GBP
8,500,000 7,135,024 2.1212.03.49TOGET FRN 17-12.03.49 1 A REGS
GBP
1,345,000 1,524,457 0.4512.03.49TOGET FRN 17-12.03.49 1 C REGS
GBP
1,000,000 1,133,749 0.3412.03.49TOGET FRN 17-12.03.49 1 D REGS
GBP
2,500,000 2,669,779 0.7920.07.52TOLK 1 A FRN 18-20.07.52 1 A
GBP
1,250,000 776,669 0.2320.07.46TOWD POINT1.7%-20.7.46GR1XA
GBP
1,500,000 1,689,989 0.5020.07.46Towd PointMortgage Funding2016-Granite1 PLC16 FRN
GBP
2,000,000 2,222,389 0.6620.02.45TPMF 2018-A FRN20.02.45
GBP
3,000,000 3,370,678 1.0020.03.56TWRBG 2 A FRN18-20.03.56 2 C
GBP
1,000,000 1,125,865 0.3320.03.56TWRBG FRN 17-20.03.56 1 B REGS
GBP
49.53167,421,504Total - Other transferable securities
26.2888,820,266Total - Mortgage backed securities
18.0060,808,188Total - United Kingdom
94.75320,276,830Total - Investment in securities
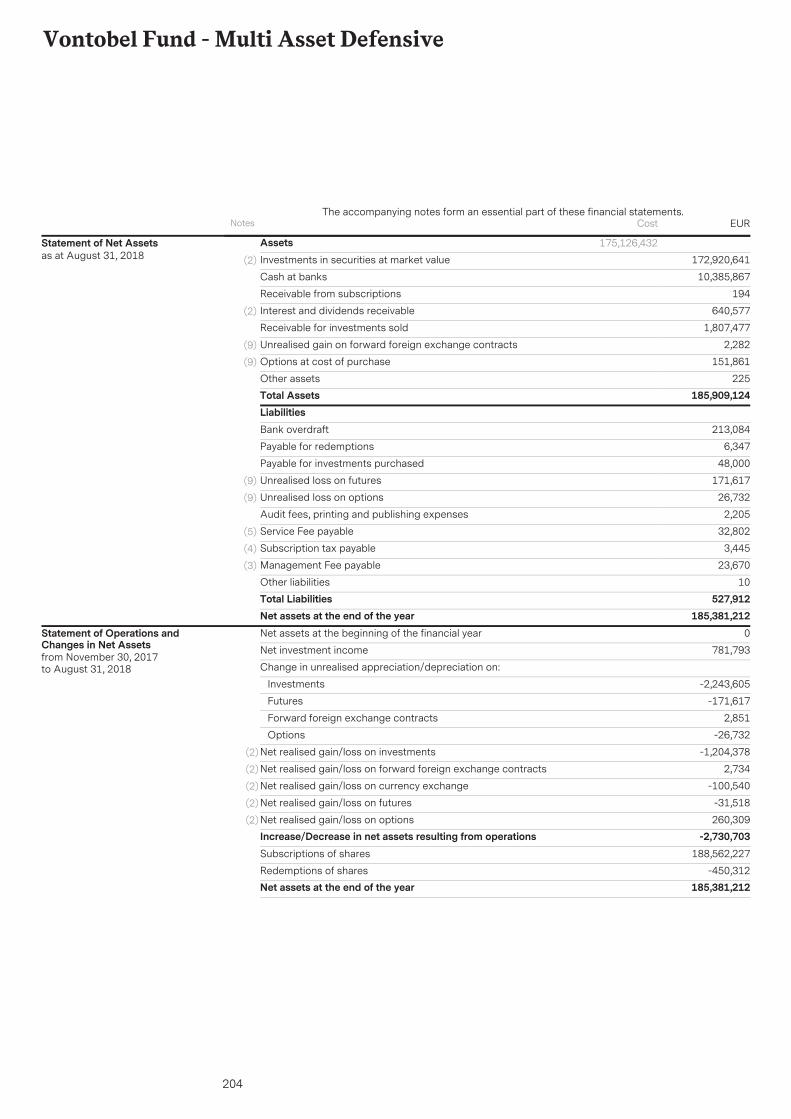
204
Vontobel Fund - Multi Asset Defensive
AssetsInvestments in securities at market value 172,920,641(2)
10,385,867Cash at banks
194Receivable from subscriptions
640,577Interest and dividends receivable(2)
1,807,477Receivable for investments sold
2,282Unrealised gain on forward foreign exchange contracts(9)
151,861Options at cost of purchase(9)
225Other assetsTotal Assets 185,909,124
175,126,432Statement of Net Assetsas at August 31, 2018
LiabilitiesBank overdraft 213,084
Payable for redemptions 6,347
Payable for investments purchased 48,000
Unrealised loss on futures 171,617(9)
Unrealised loss on options 26,732(9)
Audit fees, printing and publishing expenses 2,205
Service Fee payable 32,802(5)
Subscription tax payable 3,445(4)
Management Fee payable 23,670(3)
Other liabilities 10Total Liabilities 527,912Net assets at the end of the year 185,381,212Net assets at the beginning of the financial year 0
Net investment income 781,793
Change in unrealised appreciation/depreciation on:
Investments -2,243,605
Futures -171,617
Forward foreign exchange contracts 2,851
Options -26,732
Net realised gain/loss on investments -1,204,378(2)
Net realised gain/loss on forward foreign exchange contracts 2,734(2)
Net realised gain/loss on currency exchange -100,540(2)
Net realised gain/loss on futures -31,518(2)
Net realised gain/loss on options 260,309(2)
Increase/Decrease in net assets resulting from operations -2,730,703Subscriptions of shares 188,562,227
Redemptions of shares -450,312Net assets at the end of the year 185,381,212
Statement of Operations andChanges in Net Assetsfrom November 30, 2017to August 31, 2018
Notes EURThe accompanying notes form an essential part of these financial statements.
Cost
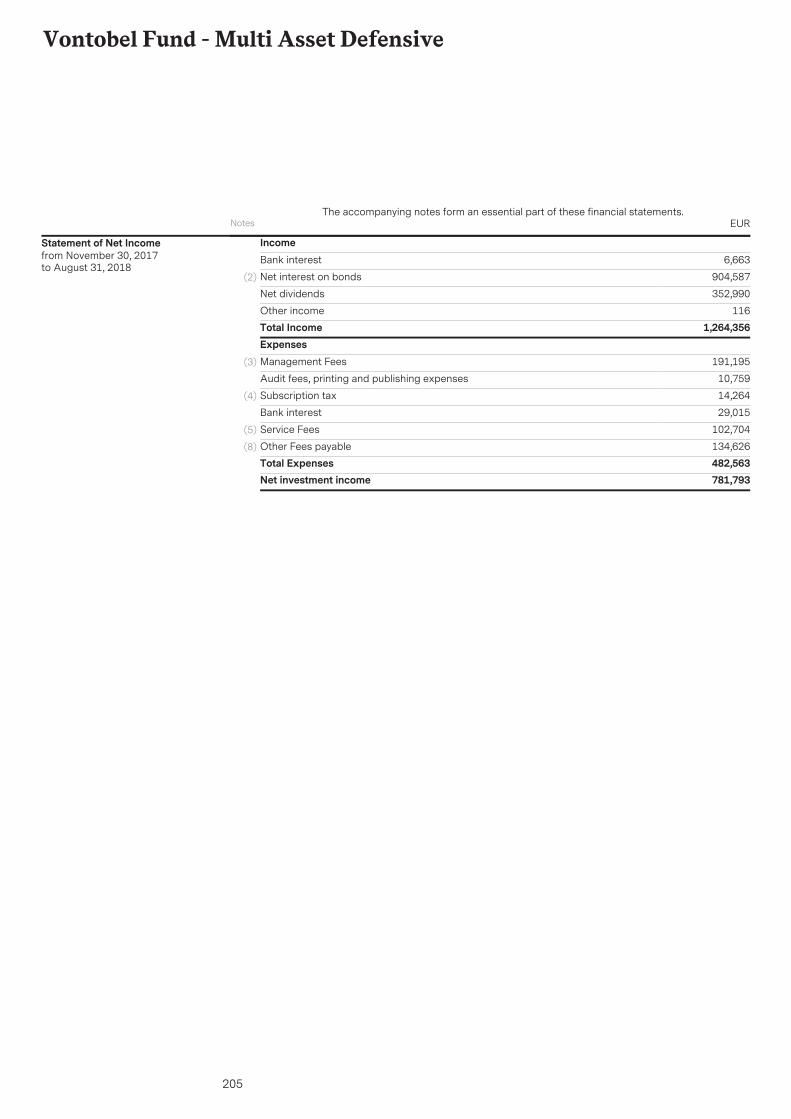
205
Vontobel Fund - Multi Asset Defensive
IncomeBank interest 6,663
Net interest on bonds 904,587(2)
Net dividends 352,990
Other income 116Total Income 1,264,356ExpensesManagement Fees 191,195(3)
Audit fees, printing and publishing expenses 10,759
Subscription tax 14,264(4)
Bank interest 29,015
Service Fees 102,704(5)
Other Fees payable 134,626(8)
Total Expenses 482,563Net investment income 781,793
Statement of Net Incomefrom November 30, 2017to August 31, 2018
Notes EURThe accompanying notes form an essential part of these financial statements.
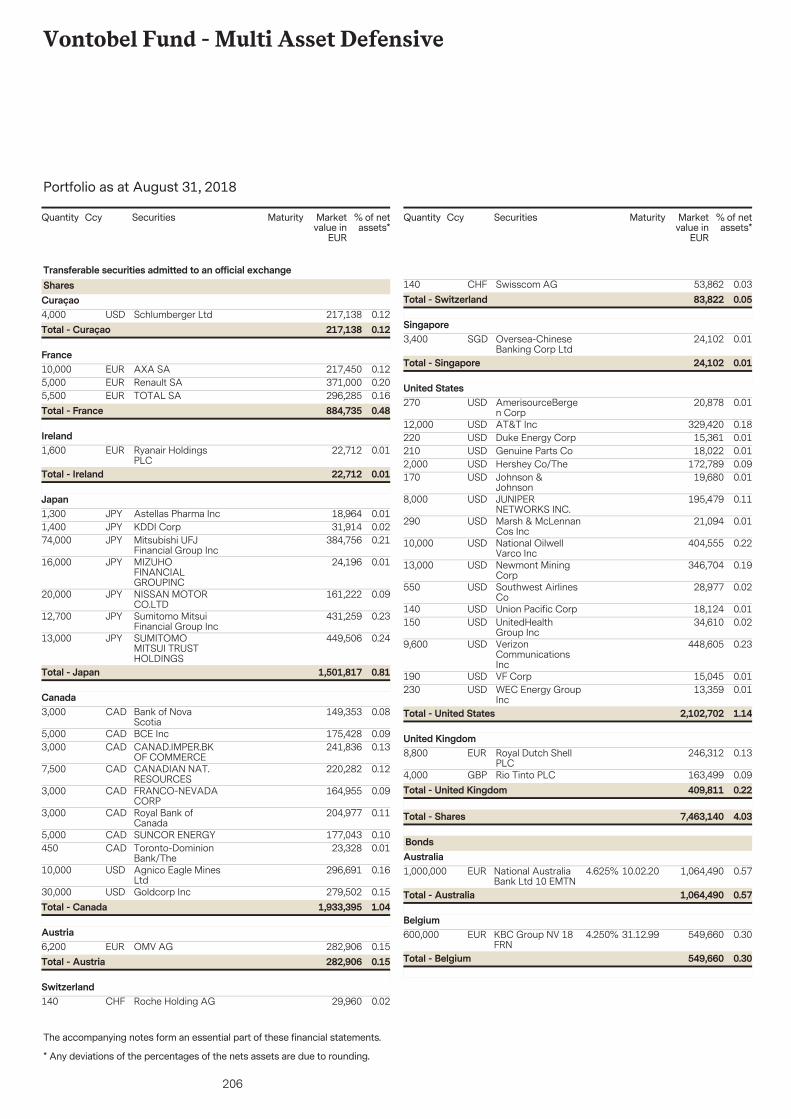
206
Vontobel Fund - Multi Asset Defensive
The accompanying notes form an essential part of these financial statements.
Portfolio as at August 31, 2018
* Any deviations of the percentages of the nets assets are due to rounding.
Securities Marketvalue in
EUR
% of netassets*
Quantity Ccy Maturity
4,000 217,138 0.12Schlumberger LtdUSD
Transferable securities admitted to an official exchangeSharesCuraçao
0.12217,138Total - Curaçao
10,000 217,450 0.12AXA SAEURFrance
5,000 371,000 0.20Renault SAEUR5,500 296,285 0.16TOTAL SAEUR
0.48884,735Total - France
1,600 22,712 0.01Ryanair HoldingsPLC
EURIreland
0.0122,712Total - Ireland
1,300 18,964 0.01Astellas Pharma IncJPYJapan
1,400 31,914 0.02KDDI CorpJPY74,000 384,756 0.21Mitsubishi UFJ
Financial Group IncJPY
16,000 24,196 0.01MIZUHOFINANCIALGROUPINC
JPY
20,000 161,222 0.09NISSAN MOTORCO.LTD
JPY
12,700 431,259 0.23Sumitomo MitsuiFinancial Group Inc
JPY
13,000 449,506 0.24SUMITOMOMITSUI TRUSTHOLDINGS
JPY
0.811,501,817Total - Japan
3,000 149,353 0.08Bank of NovaScotia
CADCanada
5,000 175,428 0.09BCE IncCAD3,000 241,836 0.13CANAD.IMPER.BK
OF COMMERCECAD
7,500 220,282 0.12CANADIAN NAT.RESOURCES
CAD
3,000 164,955 0.09FRANCO-NEVADACORP
CAD
3,000 204,977 0.11Royal Bank ofCanada
CAD
5,000 177,043 0.10SUNCOR ENERGYCAD450 23,328 0.01Toronto-Dominion
Bank/TheCAD
10,000 296,691 0.16Agnico Eagle MinesLtd
USD
30,000 279,502 0.15Goldcorp IncUSD1.041,933,395Total - Canada
6,200 282,906 0.15OMV AGEURAustria
0.15282,906Total - Austria
140 29,960 0.02Roche Holding AGCHFSwitzerland
Securities Marketvalue in
EUR
% of netassets*
Quantity Ccy Maturity
140 53,862 0.03Swisscom AGCHF0.0583,822Total - Switzerland
3,400 24,102 0.01Oversea-ChineseBanking Corp Ltd
SGDSingapore
0.0124,102Total - Singapore
270 20,878 0.01AmerisourceBergen Corp
USDUnited States
12,000 329,420 0.18AT&T IncUSD220 15,361 0.01Duke Energy CorpUSD210 18,022 0.01Genuine Parts CoUSD2,000 172,789 0.09Hershey Co/TheUSD170 19,680 0.01Johnson &
JohnsonUSD
8,000 195,479 0.11JUNIPERNETWORKS INC.
USD
290 21,094 0.01Marsh & McLennanCos Inc
USD
10,000 404,555 0.22National OilwellVarco Inc
USD
13,000 346,704 0.19Newmont MiningCorp
USD
550 28,977 0.02Southwest AirlinesCo
USD
140 18,124 0.01Union Pacific CorpUSD150 34,610 0.02UnitedHealth
Group IncUSD
9,600 448,605 0.23VerizonCommunicationsInc
USD
190 15,045 0.01VF CorpUSD230 13,359 0.01WEC Energy Group
IncUSD
1.142,102,702Total - United States
8,800 246,312 0.13Royal Dutch ShellPLC
EURUnited Kingdom
4,000 163,499 0.09Rio Tinto PLCGBP
4.037,463,140Total - Shares
0.22409,811Total - United Kingdom
1,000,000 1,064,490 0.5710.02.20National AustraliaBank Ltd 10 EMTN
EUR 4.625%
BondsAustralia
0.571,064,490Total - Australia
600,000 549,660 0.3031.12.99KBC Group NV 18FRN
EUR 4.250%Belgium
0.30549,660Total - Belgium
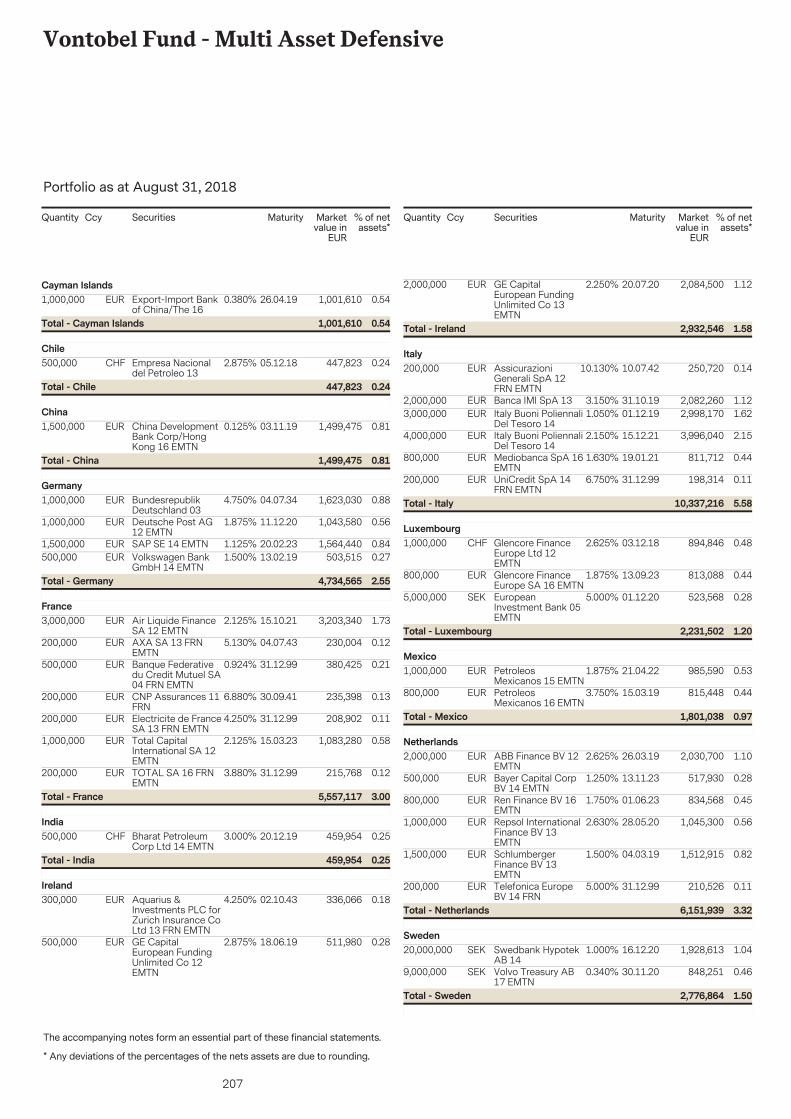
207
Vontobel Fund - Multi Asset Defensive
The accompanying notes form an essential part of these financial statements.
Portfolio as at August 31, 2018
* Any deviations of the percentages of the nets assets are due to rounding.
Securities Marketvalue in
EUR
% of netassets*
Quantity Ccy Maturity
1,000,000 1,001,610 0.5426.04.19Export-Import Bankof China/The 16
EUR 0.380%Cayman Islands
0.541,001,610Total - Cayman Islands
500,000 447,823 0.2405.12.18Empresa Nacionaldel Petroleo 13
CHF 2.875%Chile
0.24447,823Total - Chile
1,500,000 1,499,475 0.8103.11.19China DevelopmentBank Corp/HongKong 16 EMTN
EUR 0.125%China
0.811,499,475Total - China
1,000,000 1,623,030 0.8804.07.34BundesrepublikDeutschland 03
EUR 4.750%Germany
1,000,000 1,043,580 0.5611.12.20Deutsche Post AG12 EMTN
EUR 1.875%
1,500,000 1,564,440 0.8420.02.23SAP SE 14 EMTNEUR 1.125%500,000 503,515 0.2713.02.19Volkswagen Bank
GmbH 14 EMTNEUR 1.500%
2.554,734,565Total - Germany
3,000,000 3,203,340 1.7315.10.21Air Liquide FinanceSA 12 EMTN
EUR 2.125%France
200,000 230,004 0.1204.07.43AXA SA 13 FRNEMTN
EUR 5.130%
500,000 380,425 0.2131.12.99Banque Federativedu Credit Mutuel SA04 FRN EMTN
EUR 0.924%
200,000 235,398 0.1330.09.41CNP Assurances 11FRN
EUR 6.880%
200,000 208,902 0.1131.12.99Electricite de FranceSA 13 FRN EMTN
EUR 4.250%
1,000,000 1,083,280 0.5815.03.23Total CapitalInternational SA 12EMTN
EUR 2.125%
200,000 215,768 0.1231.12.99TOTAL SA 16 FRNEMTN
EUR 3.880%
3.005,557,117Total - France
500,000 459,954 0.2520.12.19Bharat PetroleumCorp Ltd 14 EMTN
CHF 3.000%India
0.25459,954Total - India
300,000 336,066 0.1802.10.43Aquarius &Investments PLC forZurich Insurance CoLtd 13 FRN EMTN
EUR 4.250%Ireland
500,000 511,980 0.2818.06.19GE CapitalEuropean FundingUnlimited Co 12EMTN
EUR 2.875%
Securities Marketvalue in
EUR
% of netassets*
Quantity Ccy Maturity
2,000,000 2,084,500 1.1220.07.20GE CapitalEuropean FundingUnlimited Co 13EMTN
EUR 2.250%
1.582,932,546Total - Ireland
200,000 250,720 0.1410.07.42AssicurazioniGenerali SpA 12FRN EMTN
EUR 10.130%Italy
2,000,000 2,082,260 1.1231.10.19Banca IMI SpA 13EUR 3.150%3,000,000 2,998,170 1.6201.12.19Italy Buoni Poliennali
Del Tesoro 14EUR 1.050%
4,000,000 3,996,040 2.1515.12.21Italy Buoni PoliennaliDel Tesoro 14
EUR 2.150%
800,000 811,712 0.4419.01.21Mediobanca SpA 16EMTN
EUR 1.630%
200,000 198,314 0.1131.12.99UniCredit SpA 14FRN EMTN
EUR 6.750%
5.5810,337,216Total - Italy
1,000,000 894,846 0.4803.12.18Glencore FinanceEurope Ltd 12EMTN
CHF 2.625%Luxembourg
800,000 813,088 0.4413.09.23Glencore FinanceEurope SA 16 EMTN
EUR 1.875%
5,000,000 523,568 0.2801.12.20EuropeanInvestment Bank 05EMTN
SEK 5.000%
1.202,231,502Total - Luxembourg
1,000,000 985,590 0.5321.04.22PetroleosMexicanos 15 EMTN
EUR 1.875%Mexico
800,000 815,448 0.4415.03.19PetroleosMexicanos 16 EMTN
EUR 3.750%
0.971,801,038Total - Mexico
2,000,000 2,030,700 1.1026.03.19ABB Finance BV 12EMTN
EUR 2.625%Netherlands
500,000 517,930 0.2813.11.23Bayer Capital CorpBV 14 EMTN
EUR 1.250%
800,000 834,568 0.4501.06.23Ren Finance BV 16EMTN
EUR 1.750%
1,000,000 1,045,300 0.5628.05.20Repsol InternationalFinance BV 13EMTN
EUR 2.630%
1,500,000 1,512,915 0.8204.03.19SchlumbergerFinance BV 13EMTN
EUR 1.500%
200,000 210,526 0.1131.12.99Telefonica EuropeBV 14 FRN
EUR 5.000%
3.326,151,939Total - Netherlands
20,000,000 1,928,613 1.0416.12.20Swedbank HypotekAB 14
SEK 1.000%Sweden
9,000,000 848,251 0.4630.11.20Volvo Treasury AB17 EMTN
SEK 0.340%
1.502,776,864Total - Sweden
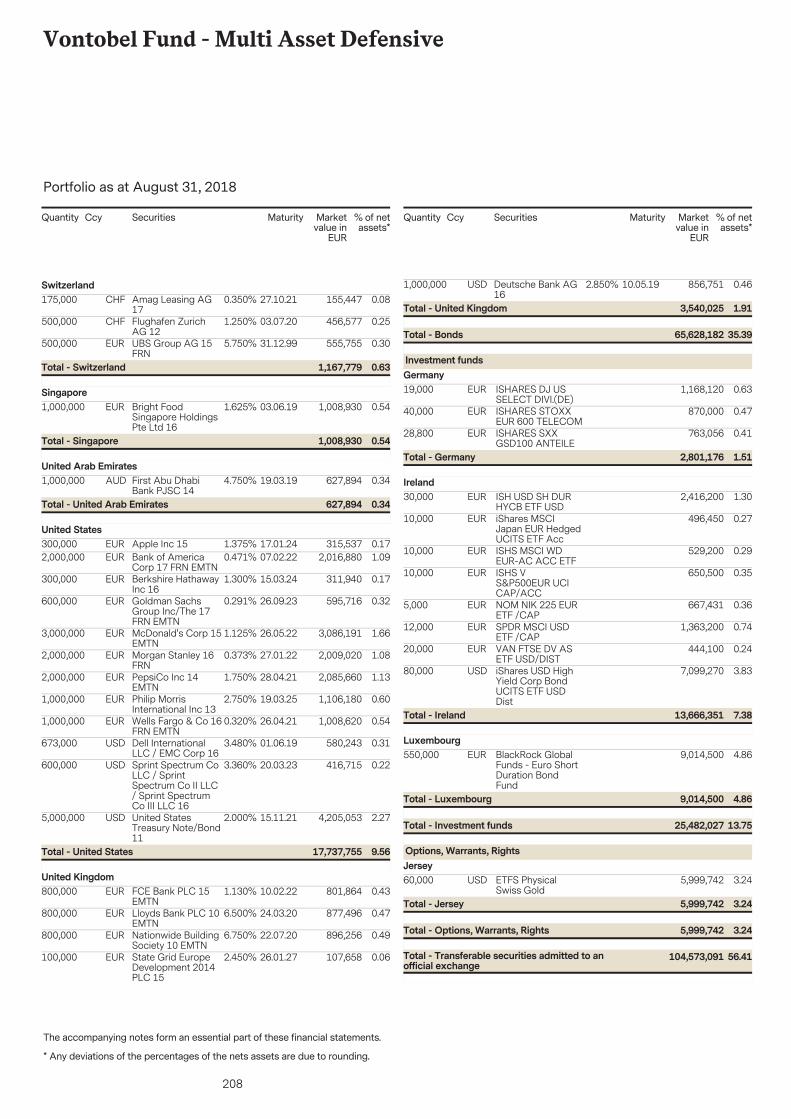
208
Vontobel Fund - Multi Asset Defensive
The accompanying notes form an essential part of these financial statements.
Portfolio as at August 31, 2018
* Any deviations of the percentages of the nets assets are due to rounding.
Securities Marketvalue in
EUR
% of netassets*
Quantity Ccy Maturity
175,000 155,447 0.0827.10.21Amag Leasing AG17
CHF 0.350%Switzerland
500,000 456,577 0.2503.07.20Flughafen ZurichAG 12
CHF 1.250%
500,000 555,755 0.3031.12.99UBS Group AG 15FRN
EUR 5.750%
0.631,167,779Total - Switzerland
1,000,000 1,008,930 0.5403.06.19Bright FoodSingapore HoldingsPte Ltd 16
EUR 1.625%Singapore
0.541,008,930Total - Singapore
1,000,000 627,894 0.3419.03.19First Abu DhabiBank PJSC 14
AUD 4.750%United Arab Emirates
0.34627,894Total - United Arab Emirates
300,000 315,537 0.1717.01.24Apple Inc 15EUR 1.375%United States
2,000,000 2,016,880 1.0907.02.22Bank of AmericaCorp 17 FRN EMTN
EUR 0.471%
300,000 311,940 0.1715.03.24Berkshire HathawayInc 16
EUR 1.300%
600,000 595,716 0.3226.09.23Goldman SachsGroup Inc/The 17FRN EMTN
EUR 0.291%
3,000,000 3,086,191 1.6626.05.22McDonald's Corp 15EMTN
EUR 1.125%
2,000,000 2,009,020 1.0827.01.22Morgan Stanley 16FRN
EUR 0.373%
2,000,000 2,085,660 1.1328.04.21PepsiCo Inc 14EMTN
EUR 1.750%
1,000,000 1,106,180 0.6019.03.25Philip MorrisInternational Inc 13
EUR 2.750%
1,000,000 1,008,620 0.5426.04.21Wells Fargo & Co 16FRN EMTN
EUR 0.320%
673,000 580,243 0.3101.06.19Dell InternationalLLC / EMC Corp 16
USD 3.480%
600,000 416,715 0.2220.03.23Sprint Spectrum CoLLC / SprintSpectrum Co II LLC/ Sprint SpectrumCo III LLC 16
USD 3.360%
5,000,000 4,205,053 2.2715.11.21United StatesTreasury Note/Bond11
USD 2.000%
9.5617,737,755Total - United States
800,000 801,864 0.4310.02.22FCE Bank PLC 15EMTN
EUR 1.130%United Kingdom
800,000 877,496 0.4724.03.20Lloyds Bank PLC 10EMTN
EUR 6.500%
800,000 896,256 0.4922.07.20Nationwide BuildingSociety 10 EMTN
EUR 6.750%
100,000 107,658 0.0626.01.27State Grid EuropeDevelopment 2014PLC 15
EUR 2.450%
Securities Marketvalue in
EUR
% of netassets*
Quantity Ccy Maturity
1,000,000 856,751 0.4610.05.19Deutsche Bank AG16
USD 2.850%
35.3965,628,182Total - Bonds
1.913,540,025Total - United Kingdom
19,000 1,168,120 0.63ISHARES DJ USSELECT DIVI.(DE)
EUR
Investment fundsGermany
40,000 870,000 0.47ISHARES STOXXEUR 600 TELECOM
EUR
28,800 763,056 0.41ISHARES SXXGSD100 ANTEILE
EUR
1.512,801,176Total - Germany
30,000 2,416,200 1.30ISH USD SH DURHYCB ETF USD
EURIreland
10,000 496,450 0.27iShares MSCIJapan EUR HedgedUCITS ETF Acc
EUR
10,000 529,200 0.29ISHS MSCI WDEUR-AC ACC ETF
EUR
10,000 650,500 0.35ISHS VS&P500EUR UCICAP/ACC
EUR
5,000 667,431 0.36NOM NIK 225 EURETF /CAP
EUR
12,000 1,363,200 0.74SPDR MSCI USDETF /CAP
EUR
20,000 444,100 0.24VAN FTSE DV ASETF USD/DIST
EUR
80,000 7,099,270 3.83iShares USD HighYield Corp BondUCITS ETF USDDist
USD
7.3813,666,351Total - Ireland
550,000 9,014,500 4.86BlackRock GlobalFunds - Euro ShortDuration BondFund
EURLuxembourg
13.7525,482,027Total - Investment funds
4.869,014,500Total - Luxembourg
60,000 5,999,742 3.24ETFS PhysicalSwiss Gold
USD
Options, Warrants, RightsJersey
56.41104,573,091Total - Transferable securities admitted to anofficial exchange
3.245,999,742Total - Options, Warrants, Rights
3.245,999,742Total - Jersey
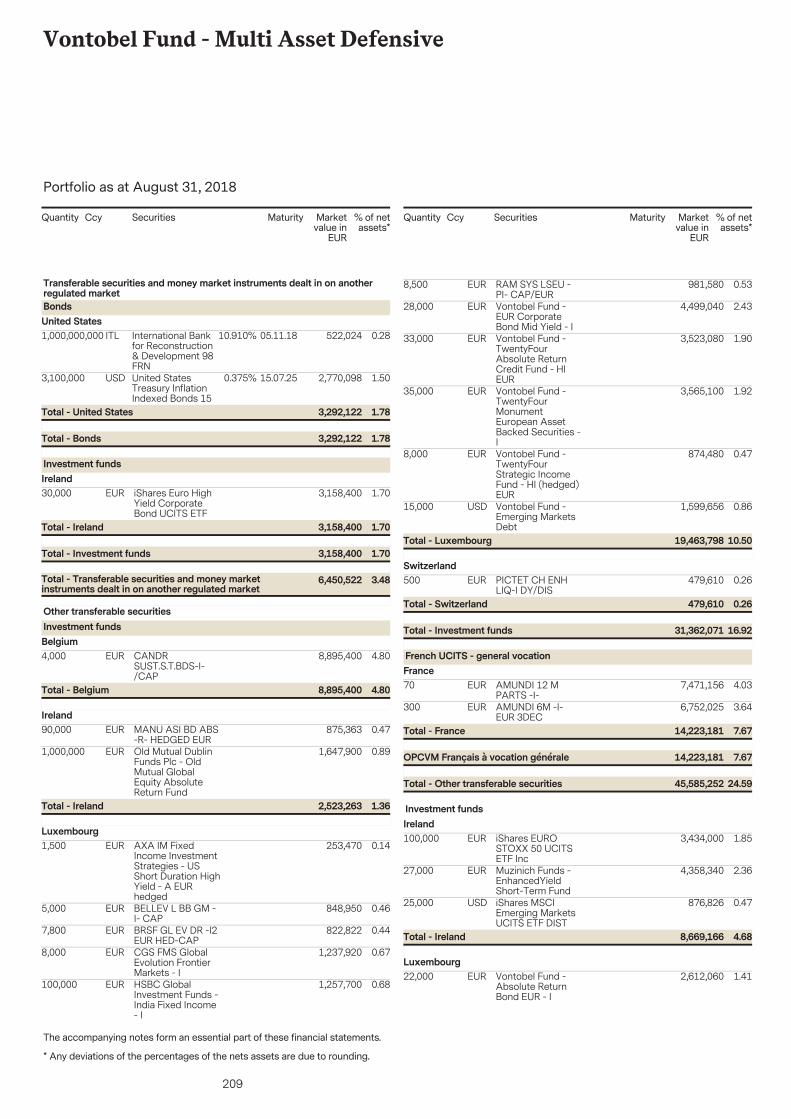
209
Vontobel Fund - Multi Asset Defensive
The accompanying notes form an essential part of these financial statements.
Portfolio as at August 31, 2018
* Any deviations of the percentages of the nets assets are due to rounding.
Securities Marketvalue in
EUR
% of netassets*
Quantity Ccy Maturity
1,000,000,000 522,024 0.2805.11.18International Bankfor Reconstruction& Development 98FRN
ITL 10.910%
Transferable securities and money market instruments dealt in on anotherregulated marketBondsUnited States
3,100,000 2,770,098 1.5015.07.25United StatesTreasury InflationIndexed Bonds 15
USD 0.375%
1.783,292,122Total - Bonds
1.783,292,122Total - United States
30,000 3,158,400 1.70iShares Euro HighYield CorporateBond UCITS ETF
EUR
Investment fundsIreland
3.486,450,522Total - Transferable securities and money marketinstruments dealt in on another regulated market
1.703,158,400Total - Investment funds
1.703,158,400Total - Ireland
4,000 8,895,400 4.80CANDRSUST.S.T.BDS-I-/CAP
EUR
Other transferable securitiesInvestment fundsBelgium
4.808,895,400Total - Belgium
90,000 875,363 0.47MANU ASI BD ABS-R- HEDGED EUR
EURIreland
1,000,000 1,647,900 0.89Old Mutual DublinFunds Plc - OldMutual GlobalEquity AbsoluteReturn Fund
EUR
1.362,523,263Total - Ireland
1,500 253,470 0.14AXA IM FixedIncome InvestmentStrategies - USShort Duration HighYield - A EURhedged
EURLuxembourg
5,000 848,950 0.46BELLEV L BB GM -I- CAP
EUR
7,800 822,822 0.44BRSF GL EV DR -I2EUR HED-CAP
EUR
8,000 1,237,920 0.67CGS FMS GlobalEvolution FrontierMarkets - I
EUR
100,000 1,257,700 0.68HSBC GlobalInvestment Funds -India Fixed Income- I
EUR
Securities Marketvalue in
EUR
% of netassets*
Quantity Ccy Maturity
8,500 981,580 0.53RAM SYS LSEU -PI- CAP/EUR
EUR
28,000 4,499,040 2.43Vontobel Fund -EUR CorporateBond Mid Yield - I
EUR
33,000 3,523,080 1.90Vontobel Fund -TwentyFourAbsolute ReturnCredit Fund - HIEUR
EUR
35,000 3,565,100 1.92Vontobel Fund -TwentyFourMonumentEuropean AssetBacked Securities -I
EUR
8,000 874,480 0.47Vontobel Fund -TwentyFourStrategic IncomeFund - HI (hedged)EUR
EUR
15,000 1,599,656 0.86Vontobel Fund -Emerging MarketsDebt
USD
10.5019,463,798Total - Luxembourg
500 479,610 0.26PICTET CH ENHLIQ-I DY/DIS
EURSwitzerland
16.9231,362,071Total - Investment funds
0.26479,610Total - Switzerland
70 7,471,156 4.03AMUNDI 12 MPARTS -I-
EUR
French UCITS - general vocationFrance
300 6,752,025 3.64AMUNDI 6M -I-EUR 3DEC
EUR
24.5945,585,252Total - Other transferable securities
7.6714,223,181OPCVM Français à vocation générale
7.6714,223,181Total - France
100,000 3,434,000 1.85iShares EUROSTOXX 50 UCITSETF Inc
EUR
Investment fundsIreland
27,000 4,358,340 2.36Muzinich Funds -EnhancedYieldShort-Term Fund
EUR
25,000 876,826 0.47iShares MSCIEmerging MarketsUCITS ETF DIST
USD
4.688,669,166Total - Ireland
22,000 2,612,060 1.41Vontobel Fund -Absolute ReturnBond EUR - I
EURLuxembourg
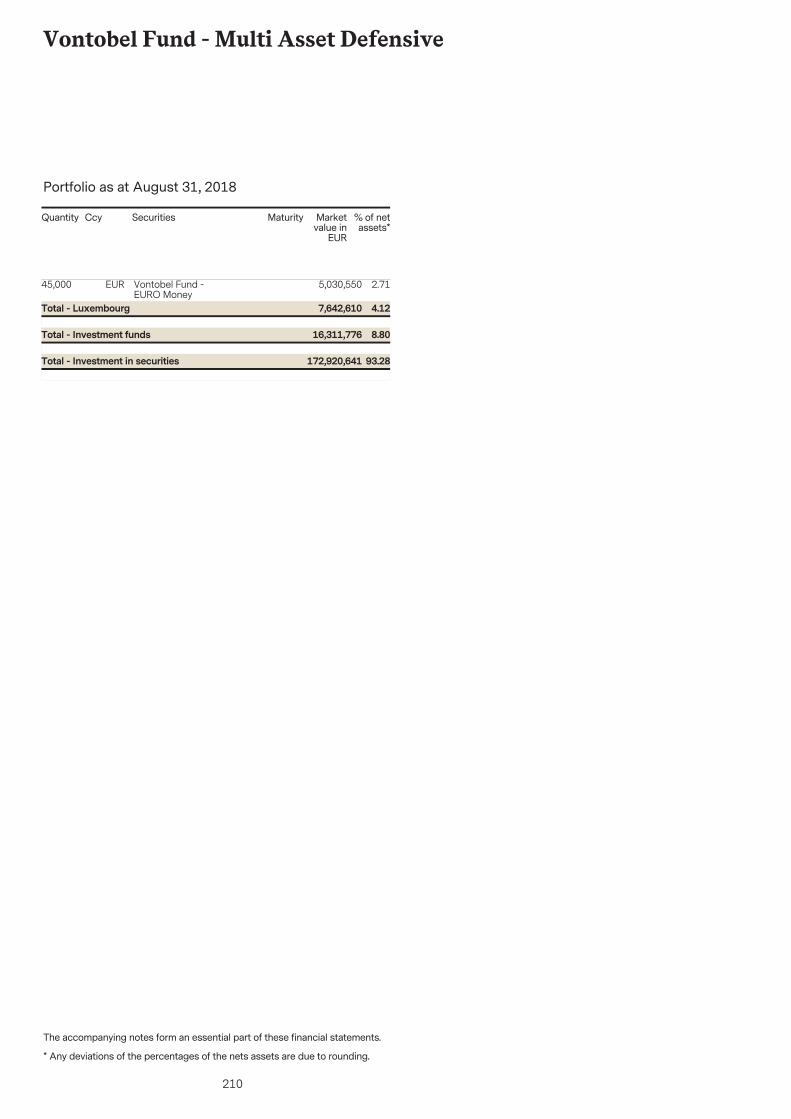
210
Vontobel Fund - Multi Asset Defensive
The accompanying notes form an essential part of these financial statements.
Portfolio as at August 31, 2018
* Any deviations of the percentages of the nets assets are due to rounding.
Securities Marketvalue in
EUR
% of netassets*
Quantity Ccy Maturity
45,000 5,030,550 2.71Vontobel Fund -EURO Money
EUR
8.8016,311,776Total - Investment funds
4.127,642,610Total - Luxembourg
93.28172,920,641Total - Investment in securities
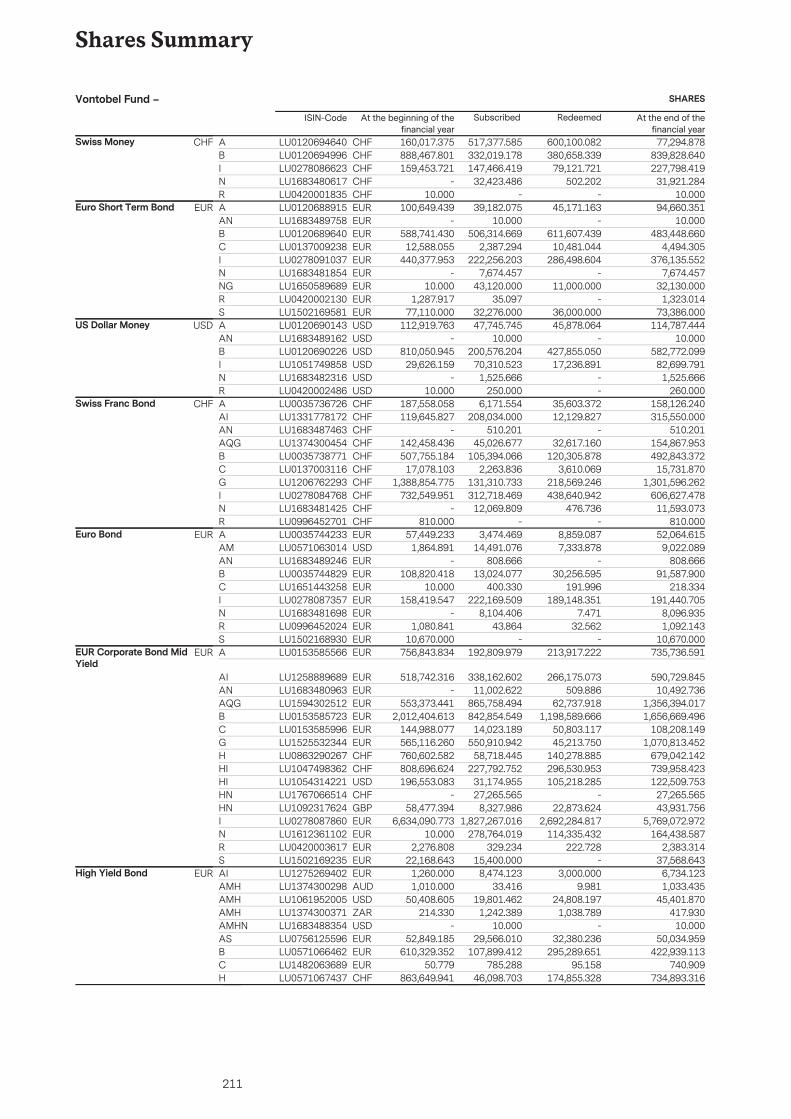
211
Shares Summary
Swiss Money CHF 517,377.585 600,100.082 77,294.878160,017.375A CHFLU0120694640332,019.178 380,658.339 839,828.640888,467.801B CHFLU0120694996147,466.419 79,121.721 227,798.419159,453.721I CHFLU0278086623
32,423.486 502.202 31,921.284-N CHFLU1683480617- - 10.00010.000R CHFLU0420001835
Euro Short Term Bond EUR 39,182.075 45,171.163 94,660.351100,649.439A EURLU012068891510.000 - 10.000-AN EURLU1683489758
506,314.669 611,607.439 483,448.660588,741.430B EURLU01206896402,387.294 10,481.044 4,494.30512,588.055C EURLU0137009238
222,256.203 286,498.604 376,135.552440,377.953I EURLU02780910377,674.457 - 7,674.457-N EURLU1683481854
43,120.000 11,000.000 32,130.00010.000NG EURLU165058968935.097 - 1,323.0141,287.917R EURLU0420002130
32,276.000 36,000.000 73,386.00077,110.000S EURLU1502169581US Dollar Money USD 47,745.745 45,878.064 114,787.444112,919.763A USDLU0120690143
10.000 - 10.000-AN USDLU1683489162200,576.204 427,855.050 582,772.099810,050.945B USDLU0120690226
70,310.523 17,236.891 82,699.79129,626.159I USDLU10517498581,525.666 - 1,525.666-N USDLU1683482316
250.000 - 260.00010.000R USDLU0420002486Swiss Franc Bond CHF 6,171.554 35,603.372 158,126.240187,558.058A CHFLU0035736726
208,034.000 12,129.827 315,550.000119,645.827AI CHFLU1331778172510.201 - 510.201-AN CHFLU1683487463
45,026.677 32,617.160 154,867.953142,458.436AQG CHFLU1374300454105,394.066 120,305.878 492,843.372507,755.184B CHFLU0035738771
2,263.836 3,610.069 15,731.87017,078.103C CHFLU0137003116131,310.733 218,569.246 1,301,596.2621,388,854.775G CHFLU1206762293312,718.469 438,640.942 606,627.478732,549.951I CHFLU0278084768
12,069.809 476.736 11,593.073-N CHFLU1683481425- - 810.000810.000R CHFLU0996452701
Euro Bond EUR 3,474.469 8,859.087 52,064.61557,449.233A EURLU003574423314,491.076 7,333.878 9,022.0891,864.891AM USDLU0571063014
808.666 - 808.666-AN EURLU168348924613,024.077 30,256.595 91,587.900108,820.418B EURLU0035744829
400.330 191.996 218.33410.000C EURLU1651443258222,169.509 189,148.351 191,440.705158,419.547I EURLU0278087357
8,104.406 7.471 8,096.935-N EURLU168348169843.864 32.562 1,092.1431,080.841R EURLU0996452024
- - 10,670.00010,670.000S EURLU1502168930EUR Corporate Bond MidYield
EUR 192,809.979 213,917.222 735,736.591756,843.834A EURLU0153585566
338,162.602 266,175.073 590,729.845518,742.316AI EURLU125888968911,002.622 509.886 10,492.736-AN EURLU1683480963
865,758.494 62,737.918 1,356,394.017553,373.441AQG EURLU1594302512842,854.549 1,198,589.666 1,656,669.4962,012,404.613B EURLU0153585723
14,023.189 50,803.117 108,208.149144,988.077C EURLU0153585996550,910.942 45,213.750 1,070,813.452565,116.260G EURLU1525532344
58,718.445 140,278.885 679,042.142760,602.582H CHFLU0863290267227,792.752 296,530.953 739,958.423808,696.624HI CHFLU1047498362
31,174.955 105,218.285 122,509.753196,553.083HI USDLU105431422127,265.565 - 27,265.565-HN CHFLU1767066514
8,327.986 22,873.624 43,931.75658,477.394HN GBPLU10923176241,827,267.016 2,692,284.817 5,769,072.9726,634,090.773I EURLU0278087860
278,764.019 114,335.432 164,438.58710.000N EURLU1612361102329.234 222.728 2,383.3142,276.808R EURLU0420003617
15,400.000 - 37,568.64322,168.643S EURLU1502169235High Yield Bond EUR 8,474.123 3,000.000 6,734.1231,260.000AI EURLU1275269402
33.416 9.981 1,033.4351,010.000AMH AUDLU137430029819,801.462 24,808.197 45,401.87050,408.605AMH USDLU1061952005
1,242.389 1,038.789 417.930214.330AMH ZARLU137430037110.000 - 10.000-AMHN USDLU1683488354
29,566.010 32,380.236 50,034.95952,849.185AS EURLU0756125596107,899.412 295,289.651 422,939.113610,329.352B EURLU0571066462
785.288 95.158 740.90950.779C EURLU148206368946,098.703 174,855.328 734,893.316863,649.941H CHFLU0571067437
At the beginning of thefinancial year
Subscribed Redeemed At the end of thefinancial year
SHARESVontobel Fund –ISIN-Code
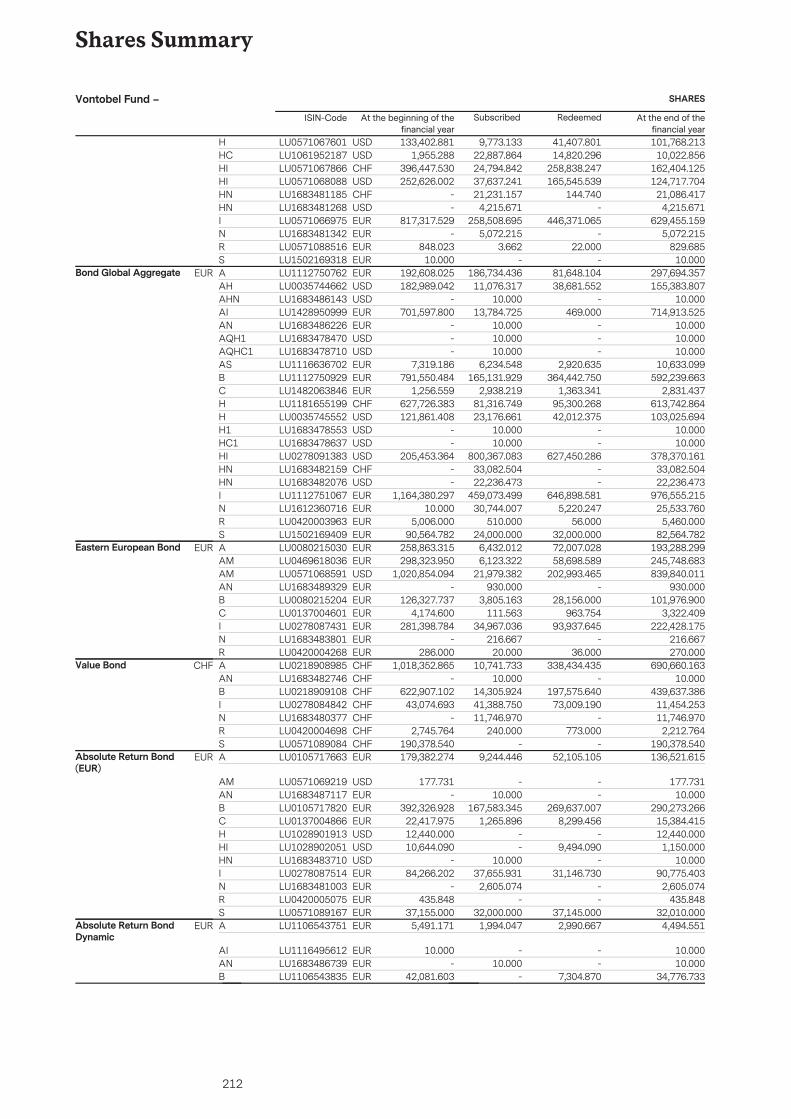
212
Shares Summary
9,773.133 41,407.801 101,768.213133,402.881H USDLU057106760122,887.864 14,820.296 10,022.8561,955.288HC USDLU106195218724,794.842 258,838.247 162,404.125396,447.530HI CHFLU057106786637,637.241 165,545.539 124,717.704252,626.002HI USDLU057106808821,231.157 144.740 21,086.417-HN CHFLU1683481185
4,215.671 - 4,215.671-HN USDLU1683481268258,508.695 446,371.065 629,455.159817,317.529I EURLU0571066975
5,072.215 - 5,072.215-N EURLU16834813423.662 22.000 829.685848.023R EURLU0571088516
- - 10.00010.000S EURLU1502169318Bond Global Aggregate EUR 186,734.436 81,648.104 297,694.357192,608.025A EURLU1112750762
11,076.317 38,681.552 155,383.807182,989.042AH USDLU003574466210.000 - 10.000-AHN USDLU1683486143
13,784.725 469.000 714,913.525701,597.800AI EURLU142895099910.000 - 10.000-AN EURLU168348622610.000 - 10.000-AQH1 USDLU168347847010.000 - 10.000-AQHC1 USDLU1683478710
6,234.548 2,920.635 10,633.0997,319.186AS EURLU1116636702165,131.929 364,442.750 592,239.663791,550.484B EURLU1112750929
2,938.219 1,363.341 2,831.4371,256.559C EURLU148206384681,316.749 95,300.268 613,742.864627,726.383H CHFLU118165519923,176.661 42,012.375 103,025.694121,861.408H USDLU0035745552
10.000 - 10.000-H1 USDLU168347855310.000 - 10.000-HC1 USDLU1683478637
800,367.083 627,450.286 378,370.161205,453.364HI USDLU027809138333,082.504 - 33,082.504-HN CHFLU168348215922,236.473 - 22,236.473-HN USDLU1683482076
459,073.499 646,898.581 976,555.2151,164,380.297I EURLU111275106730,744.007 5,220.247 25,533.76010.000N EURLU1612360716
510.000 56.000 5,460.0005,006.000R EURLU042000396324,000.000 32,000.000 82,564.78290,564.782S EURLU1502169409
Eastern European Bond EUR 6,432.012 72,007.028 193,288.299258,863.315A EURLU00802150306,123.322 58,698.589 245,748.683298,323.950AM EURLU0469618036
21,979.382 202,993.465 839,840.0111,020,854.094AM USDLU0571068591930.000 - 930.000-AN EURLU1683489329
3,805.163 28,156.000 101,976.900126,327.737B EURLU0080215204111.563 963.754 3,322.4094,174.600C EURLU0137004601
34,967.036 93,937.645 222,428.175281,398.784I EURLU0278087431216.667 - 216.667-N EURLU1683483801
20.000 36.000 270.000286.000R EURLU0420004268Value Bond CHF 10,741.733 338,434.435 690,660.1631,018,352.865A CHFLU0218908985
10.000 - 10.000-AN CHFLU168348274614,305.924 197,575.640 439,637.386622,907.102B CHFLU021890910841,388.750 73,009.190 11,454.25343,074.693I CHFLU027808484211,746.970 - 11,746.970-N CHFLU1683480377
240.000 773.000 2,212.7642,745.764R CHFLU0420004698- - 190,378.540190,378.540S CHFLU0571089084
Absolute Return Bond(EUR)
EUR 9,244.446 52,105.105 136,521.615179,382.274A EURLU0105717663
- - 177.731177.731AM USDLU057106921910.000 - 10.000-AN EURLU1683487117
167,583.345 269,637.007 290,273.266392,326.928B EURLU01057178201,265.896 8,299.456 15,384.41522,417.975C EURLU0137004866
- - 12,440.00012,440.000H USDLU1028901913- 9,494.090 1,150.00010,644.090HI USDLU1028902051
10.000 - 10.000-HN USDLU168348371037,655.931 31,146.730 90,775.40384,266.202I EURLU0278087514
2,605.074 - 2,605.074-N EURLU1683481003- - 435.848435.848R EURLU0420005075
32,000.000 37,145.000 32,010.00037,155.000S EURLU0571089167Absolute Return BondDynamic
EUR 1,994.047 2,990.667 4,494.5515,491.171A EURLU1106543751
- - 10.00010.000AI EURLU111649561210.000 - 10.000-AN EURLU1683486739
- 7,304.870 34,776.73342,081.603B EURLU1106543835
At the beginning of thefinancial year
Subscribed Redeemed At the end of thefinancial year
SHARESVontobel Fund –ISIN-Code
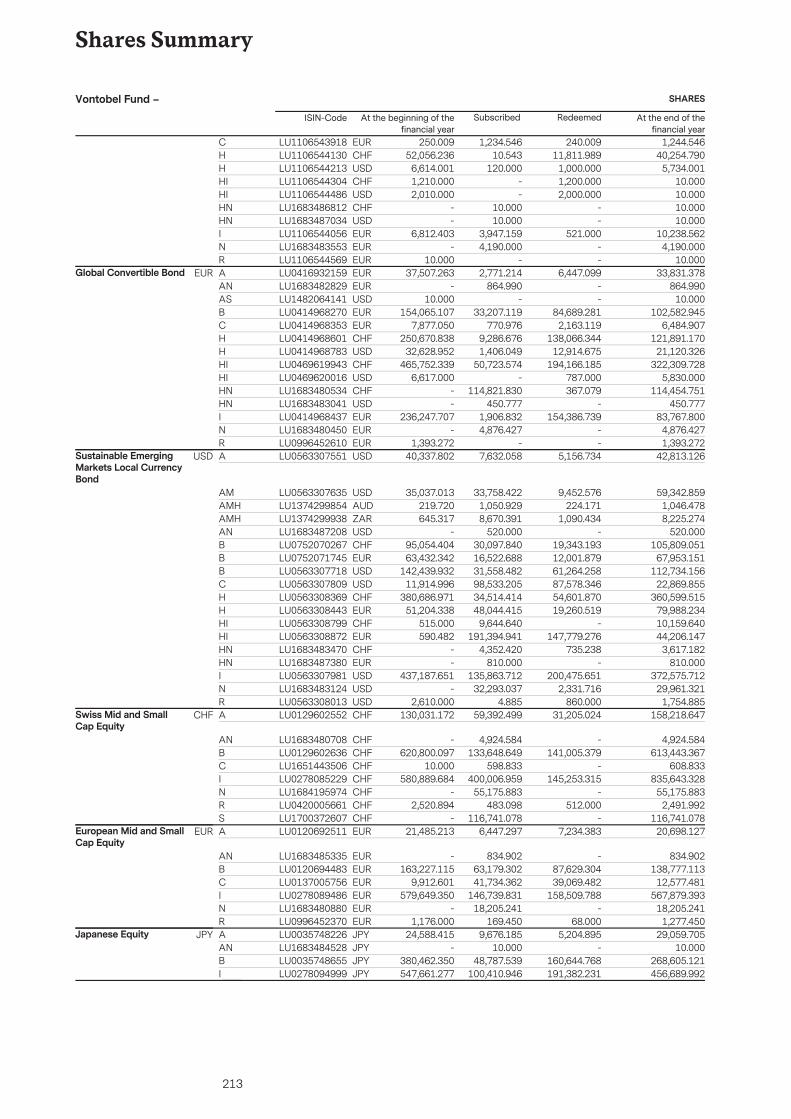
213
Shares Summary
1,234.546 240.009 1,244.546250.009C EURLU110654391810.543 11,811.989 40,254.79052,056.236H CHFLU1106544130
120.000 1,000.000 5,734.0016,614.001H USDLU1106544213- 1,200.000 10.0001,210.000HI CHFLU1106544304- 2,000.000 10.0002,010.000HI USDLU1106544486
10.000 - 10.000-HN CHFLU168348681210.000 - 10.000-HN USDLU1683487034
3,947.159 521.000 10,238.5626,812.403I EURLU11065440564,190.000 - 4,190.000-N EURLU1683483553
- - 10.00010.000R EURLU1106544569Global Convertible Bond EUR 2,771.214 6,447.099 33,831.37837,507.263A EURLU0416932159
864.990 - 864.990-AN EURLU1683482829- - 10.00010.000AS USDLU1482064141
33,207.119 84,689.281 102,582.945154,065.107B EURLU0414968270770.976 2,163.119 6,484.9077,877.050C EURLU0414968353
9,286.676 138,066.344 121,891.170250,670.838H CHFLU04149686011,406.049 12,914.675 21,120.32632,628.952H USDLU0414968783
50,723.574 194,166.185 322,309.728465,752.339HI CHFLU0469619943- 787.000 5,830.0006,617.000HI USDLU0469620016
114,821.830 367.079 114,454.751-HN CHFLU1683480534450.777 - 450.777-HN USDLU1683483041
1,906.832 154,386.739 83,767.800236,247.707I EURLU04149684374,876.427 - 4,876.427-N EURLU1683480450
- - 1,393.2721,393.272R EURLU0996452610Sustainable EmergingMarkets Local CurrencyBond
USD 7,632.058 5,156.734 42,813.12640,337.802A USDLU0563307551
33,758.422 9,452.576 59,342.85935,037.013AM USDLU05633076351,050.929 224.171 1,046.478219.720AMH AUDLU13742998548,670.391 1,090.434 8,225.274645.317AMH ZARLU1374299938
520.000 - 520.000-AN USDLU168348720830,097.840 19,343.193 105,809.05195,054.404B CHFLU075207026716,522.688 12,001.879 67,953.15163,432.342B EURLU075207174531,558.482 61,264.258 112,734.156142,439.932B USDLU056330771898,533.205 87,578.346 22,869.85511,914.996C USDLU056330780934,514.414 54,601.870 360,599.515380,686.971H CHFLU056330836948,044.415 19,260.519 79,988.23451,204.338H EURLU0563308443
9,644.640 - 10,159.640515.000HI CHFLU0563308799191,394.941 147,779.276 44,206.147590.482HI EURLU0563308872
4,352.420 735.238 3,617.182-HN CHFLU1683483470810.000 - 810.000-HN EURLU1683487380
135,863.712 200,475.651 372,575.712437,187.651I USDLU056330798132,293.037 2,331.716 29,961.321-N USDLU1683483124
4.885 860.000 1,754.8852,610.000R USDLU0563308013Swiss Mid and SmallCap Equity
CHF 59,392.499 31,205.024 158,218.647130,031.172A CHFLU0129602552
4,924.584 - 4,924.584-AN CHFLU1683480708133,648.649 141,005.379 613,443.367620,800.097B CHFLU0129602636
598.833 - 608.83310.000C CHFLU1651443506400,006.959 145,253.315 835,643.328580,889.684I CHFLU0278085229
55,175.883 - 55,175.883-N CHFLU1684195974483.098 512.000 2,491.9922,520.894R CHFLU0420005661
116,741.078 - 116,741.078-S CHFLU1700372607European Mid and SmallCap Equity
EUR 6,447.297 7,234.383 20,698.12721,485.213A EURLU0120692511
834.902 - 834.902-AN EURLU168348533563,179.302 87,629.304 138,777.113163,227.115B EURLU012069448341,734.362 39,069.482 12,577.4819,912.601C EURLU0137005756
146,739.831 158,509.788 567,879.393579,649.350I EURLU027808948618,205.241 - 18,205.241-N EURLU1683480880
169.450 68.000 1,277.4501,176.000R EURLU0996452370Japanese Equity JPY 9,676.185 5,204.895 29,059.70524,588.415A JPYLU0035748226
10.000 - 10.000-AN JPYLU168348452848,787.539 160,644.768 268,605.121380,462.350B JPYLU0035748655
100,410.946 191,382.231 456,689.992547,661.277I JPYLU0278094999
At the beginning of thefinancial year
Subscribed Redeemed At the end of thefinancial year
SHARESVontobel Fund –ISIN-Code
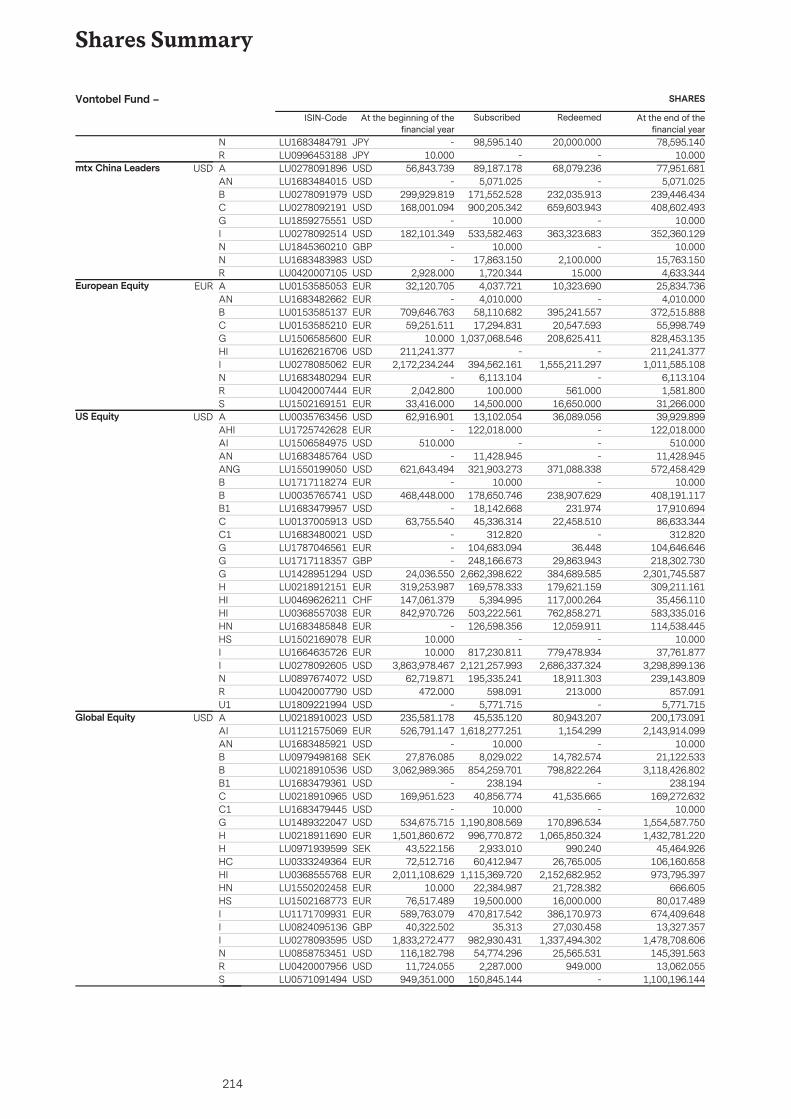
214
Shares Summary
98,595.140 20,000.000 78,595.140-N JPYLU1683484791- - 10.00010.000R JPYLU0996453188
mtx China Leaders USD 89,187.178 68,079.236 77,951.68156,843.739A USDLU02780918965,071.025 - 5,071.025-AN USDLU1683484015
171,552.528 232,035.913 239,446.434299,929.819B USDLU0278091979900,205.342 659,603.943 408,602.493168,001.094C USDLU0278092191
10.000 - 10.000-G USDLU1859275551533,582.463 363,323.683 352,360.129182,101.349I USDLU0278092514
10.000 - 10.000-N GBPLU184536021017,863.150 2,100.000 15,763.150-N USDLU1683483983
1,720.344 15.000 4,633.3442,928.000R USDLU0420007105European Equity EUR 4,037.721 10,323.690 25,834.73632,120.705A EURLU0153585053
4,010.000 - 4,010.000-AN EURLU168348266258,110.682 395,241.557 372,515.888709,646.763B EURLU015358513717,294.831 20,547.593 55,998.74959,251.511C EURLU0153585210
1,037,068.546 208,625.411 828,453.13510.000G EURLU1506585600- - 211,241.377211,241.377HI USDLU1626216706
394,562.161 1,555,211.297 1,011,585.1082,172,234.244I EURLU02780850626,113.104 - 6,113.104-N EURLU1683480294
100.000 561.000 1,581.8002,042.800R EURLU042000744414,500.000 16,650.000 31,266.00033,416.000S EURLU1502169151
US Equity USD 13,102.054 36,089.056 39,929.89962,916.901A USDLU0035763456122,018.000 - 122,018.000-AHI EURLU1725742628
- - 510.000510.000AI USDLU150658497511,428.945 - 11,428.945-AN USDLU1683485764
321,903.273 371,088.338 572,458.429621,643.494ANG USDLU155019905010.000 - 10.000-B EURLU1717118274
178,650.746 238,907.629 408,191.117468,448.000B USDLU003576574118,142.668 231.974 17,910.694-B1 USDLU168347995745,336.314 22,458.510 86,633.34463,755.540C USDLU0137005913
312.820 - 312.820-C1 USDLU1683480021104,683.094 36.448 104,646.646-G EURLU1787046561248,166.673 29,863.943 218,302.730-G GBPLU1717118357
2,662,398.622 384,689.585 2,301,745.58724,036.550G USDLU1428951294169,578.333 179,621.159 309,211.161319,253.987H EURLU0218912151
5,394.995 117,000.264 35,456.110147,061.379HI CHFLU0469626211503,222.561 762,858.271 583,335.016842,970.726HI EURLU0368557038126,598.356 12,059.911 114,538.445-HN EURLU1683485848
- - 10.00010.000HS EURLU1502169078817,230.811 779,478.934 37,761.87710.000I EURLU1664635726
2,121,257.993 2,686,337.324 3,298,899.1363,863,978.467I USDLU0278092605195,335.241 18,911.303 239,143.80962,719.871N USDLU0897674072
598.091 213.000 857.091472.000R USDLU04200077905,771.715 - 5,771.715-U1 USDLU1809221994
Global Equity USD 45,535.120 80,943.207 200,173.091235,581.178A USDLU02189100231,618,277.251 1,154.299 2,143,914.099526,791.147AI EURLU1121575069
10.000 - 10.000-AN USDLU16834859218,029.022 14,782.574 21,122.53327,876.085B SEKLU0979498168
854,259.701 798,822.264 3,118,426.8023,062,989.365B USDLU0218910536238.194 - 238.194-B1 USDLU1683479361
40,856.774 41,535.665 169,272.632169,951.523C USDLU021891096510.000 - 10.000-C1 USDLU1683479445
1,190,808.569 170,896.534 1,554,587.750534,675.715G USDLU1489322047996,770.872 1,065,850.324 1,432,781.2201,501,860.672H EURLU0218911690
2,933.010 990.240 45,464.92643,522.156H SEKLU097193959960,412.947 26,765.005 106,160.65872,512.716HC EURLU0333249364
1,115,369.720 2,152,682.952 973,795.3972,011,108.629HI EURLU036855576822,384.987 21,728.382 666.60510.000HN EURLU155020245819,500.000 16,000.000 80,017.48976,517.489HS EURLU1502168773
470,817.542 386,170.973 674,409.648589,763.079I EURLU117170993135.313 27,030.458 13,327.35740,322.502I GBPLU0824095136
982,930.431 1,337,494.302 1,478,708.6061,833,272.477I USDLU027809359554,774.296 25,565.531 145,391.563116,182.798N USDLU0858753451
2,287.000 949.000 13,062.05511,724.055R USDLU0420007956150,845.144 - 1,100,196.144949,351.000S USDLU0571091494
At the beginning of thefinancial year
Subscribed Redeemed At the end of thefinancial year
SHARESVontobel Fund –ISIN-Code
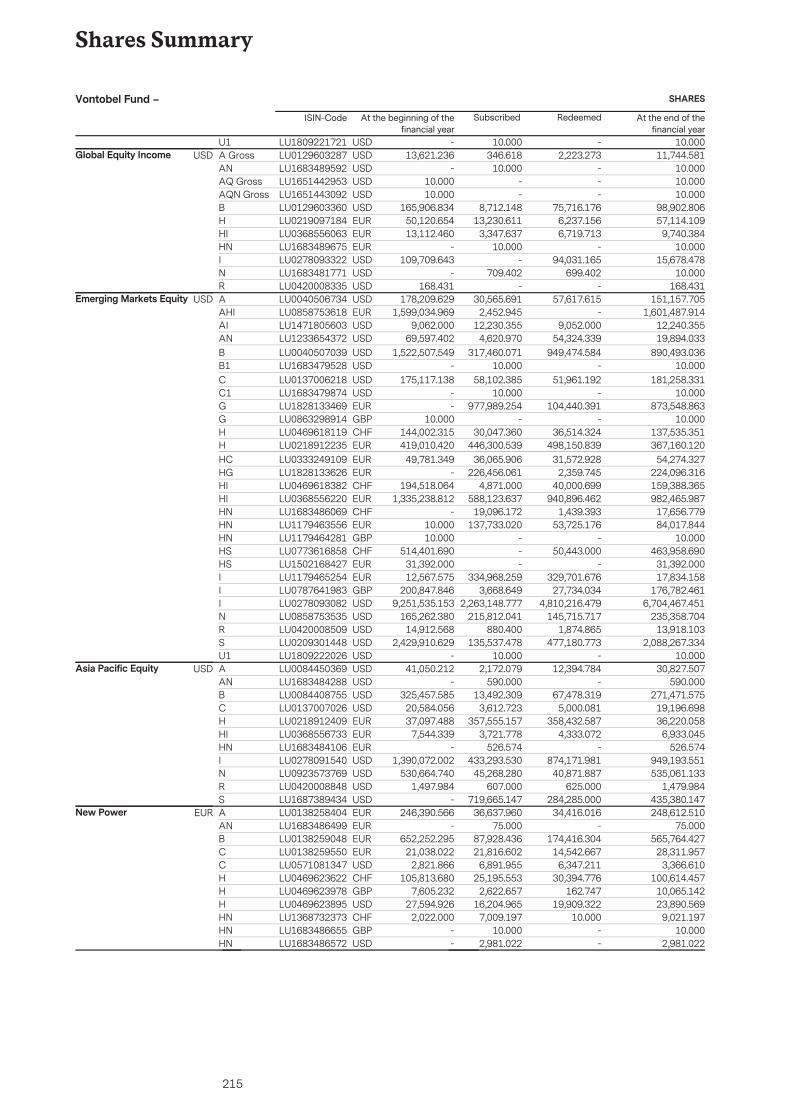
215
Shares Summary
10.000 - 10.000-U1 USDLU1809221721Global Equity Income USD 346.618 2,223.273 11,744.58113,621.236A Gross USDLU0129603287
10.000 - 10.000-AN USDLU1683489592- - 10.00010.000AQ Gross USDLU1651442953- - 10.00010.000AQN Gross USDLU1651443092
8,712.148 75,716.176 98,902.806165,906.834B USDLU012960336013,230.611 6,237.156 57,114.10950,120.654H EURLU0219097184
3,347.637 6,719.713 9,740.38413,112.460HI EURLU036855606310.000 - 10.000-HN EURLU1683489675
- 94,031.165 15,678.478109,709.643I USDLU0278093322709.402 699.402 10.000-N USDLU1683481771
- - 168.431168.431R USDLU0420008335Emerging Markets Equity USD 30,565.691 57,617.615 151,157.705178,209.629A USDLU0040506734
2,452.945 - 1,601,487.9141,599,034.969AHI EURLU085875361812,230.355 9,052.000 12,240.3559,062.000AI USDLU1471805603
4,620.970 54,324.339 19,894.03369,597.402AN USDLU1233654372317,460.071 949,474.584 890,493.0361,522,507.549B USDLU0040507039
10.000 - 10.000-B1 USDLU168347952858,102.385 51,961.192 181,258.331175,117.138C USDLU0137006218
10.000 - 10.000-C1 USDLU1683479874977,989.254 104,440.391 873,548.863-G EURLU1828133469
- - 10.00010.000G GBPLU086329891430,047.360 36,514.324 137,535.351144,002.315H CHFLU0469618119
446,300.539 498,150.839 367,160.120419,010.420H EURLU021891223536,065.906 31,572.928 54,274.32749,781.349HC EURLU0333249109
226,456.061 2,359.745 224,096.316-HG EURLU18281336264,871.000 40,000.699 159,388.365194,518.064HI CHFLU0469618382
588,123.637 940,896.462 982,465.9871,335,238.812HI EURLU036855622019,096.172 1,439.393 17,656.779-HN CHFLU1683486069
137,733.020 53,725.176 84,017.84410.000HN EURLU1179463556- - 10.00010.000HN GBPLU1179464281- 50,443.000 463,958.690514,401.690HS CHFLU0773616858- - 31,392.00031,392.000HS EURLU1502168427
334,968.259 329,701.676 17,834.15812,567.575I EURLU11794652543,668.649 27,734.034 176,782.461200,847.846I GBPLU0787641983
2,263,148.777 4,810,216.479 6,704,467.4519,251,535.153I USDLU0278093082215,812.041 145,715.717 235,358.704165,262.380N USDLU0858753535
880.400 1,874.865 13,918.10314,912.568R USDLU0420008509135,537.478 477,180.773 2,088,267.3342,429,910.629S USDLU0209301448
10.000 - 10.000-U1 USDLU1809222026Asia Pacific Equity USD 2,172.079 12,394.784 30,827.50741,050.212A USDLU0084450369
590.000 - 590.000-AN USDLU168348428813,492.309 67,478.319 271,471.575325,457.585B USDLU0084408755
3,612.723 5,000.081 19,196.69820,584.056C USDLU0137007026357,555.157 358,432.587 36,220.05837,097.488H EURLU0218912409
3,721.778 4,333.072 6,933.0457,544.339HI EURLU0368556733526.574 - 526.574-HN EURLU1683484106
433,293.530 874,171.981 949,193.5511,390,072.002I USDLU027809154045,268.280 40,871.887 535,061.133530,664.740N USDLU0923573769
607.000 625.000 1,479.9841,497.984R USDLU0420008848719,665.147 284,285.000 435,380.147-S USDLU1687389434
New Power EUR 36,637.960 34,416.016 248,612.510246,390.566A EURLU013825840475.000 - 75.000-AN EURLU1683486499
87,928.436 174,416.304 565,764.427652,252.295B EURLU013825904821,816.602 14,542.667 28,311.95721,038.022C EURLU0138259550
6,891.955 6,347.211 3,366.6102,821.866C USDLU057108134725,195.553 30,394.776 100,614.457105,813.680H CHFLU0469623622
2,622.657 162.747 10,065.1427,605.232H GBPLU046962397816,204.965 19,909.322 23,890.56927,594.926H USDLU0469623895
7,009.197 10.000 9,021.1972,022.000HN CHFLU136873237310.000 - 10.000-HN GBPLU1683486655
2,981.022 - 2,981.022-HN USDLU1683486572
At the beginning of thefinancial year
Subscribed Redeemed At the end of thefinancial year
SHARESVontobel Fund –ISIN-Code
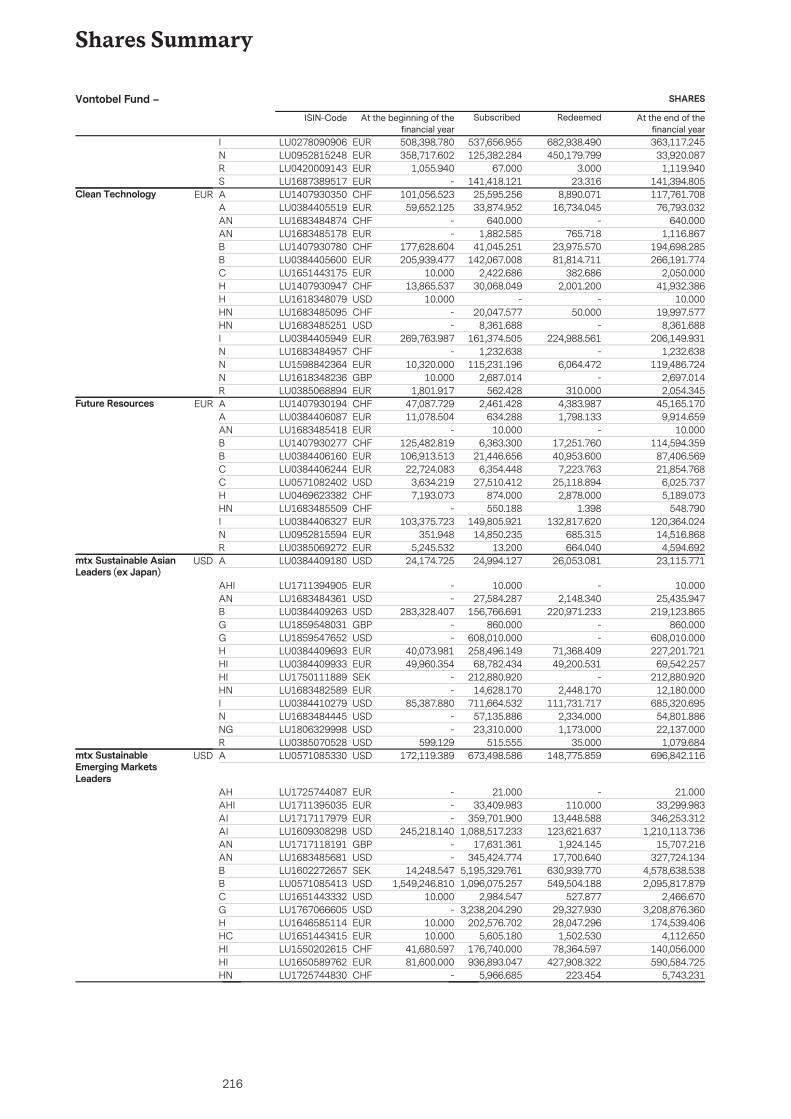
216
Shares Summary
537,656.955 682,938.490 363,117.245508,398.780I EURLU0278090906125,382.284 450,179.799 33,920.087358,717.602N EURLU0952815248
67.000 3.000 1,119.9401,055.940R EURLU0420009143141,418.121 23.316 141,394.805-S EURLU1687389517
Clean Technology EUR 25,595.256 8,890.071 117,761.708101,056.523A CHFLU140793035033,874.952 16,734.045 76,793.03259,652.125A EURLU0384405519
640.000 - 640.000-AN CHFLU16834848741,882.585 765.718 1,116.867-AN EURLU1683485178
41,045.251 23,975.570 194,698.285177,628.604B CHFLU1407930780142,067.008 81,814.711 266,191.774205,939.477B EURLU0384405600
2,422.686 382.686 2,050.00010.000C EURLU165144317530,068.049 2,001.200 41,932.38613,865.537H CHFLU1407930947
- - 10.00010.000H USDLU161834807920,047.577 50.000 19,997.577-HN CHFLU1683485095
8,361.688 - 8,361.688-HN USDLU1683485251161,374.505 224,988.561 206,149.931269,763.987I EURLU0384405949
1,232.638 - 1,232.638-N CHFLU1683484957115,231.196 6,064.472 119,486.72410,320.000N EURLU1598842364
2,687.014 - 2,697.01410.000N GBPLU1618348236562.428 310.000 2,054.3451,801.917R EURLU0385068894
Future Resources EUR 2,461.428 4,383.987 45,165.17047,087.729A CHFLU1407930194634.288 1,798.133 9,914.65911,078.504A EURLU0384406087
10.000 - 10.000-AN EURLU16834854186,363.300 17,251.760 114,594.359125,482.819B CHFLU1407930277
21,446.656 40,953.600 87,406.569106,913.513B EURLU03844061606,354.448 7,223.763 21,854.76822,724.083C EURLU0384406244
27,510.412 25,118.894 6,025.7373,634.219C USDLU0571082402874.000 2,878.000 5,189.0737,193.073H CHFLU0469623382550.188 1.398 548.790-HN CHFLU1683485509
149,805.921 132,817.620 120,364.024103,375.723I EURLU038440632714,850.235 685.315 14,516.868351.948N EURLU0952815594
13.200 664.040 4,594.6925,245.532R EURLU0385069272mtx Sustainable AsianLeaders (ex Japan)
USD 24,994.127 26,053.081 23,115.77124,174.725A USDLU0384409180
10.000 - 10.000-AHI EURLU171139490527,584.287 2,148.340 25,435.947-AN USDLU1683484361
156,766.691 220,971.233 219,123.865283,328.407B USDLU0384409263860.000 - 860.000-G GBPLU1859548031
608,010.000 - 608,010.000-G USDLU1859547652258,496.149 71,368.409 227,201.72140,073.981H EURLU0384409693
68,782.434 49,200.531 69,542.25749,960.354HI EURLU0384409933212,880.920 - 212,880.920-HI SEKLU1750111889
14,628.170 2,448.170 12,180.000-HN EURLU1683482589711,664.532 111,731.717 685,320.69585,387.880I USDLU0384410279
57,135.886 2,334.000 54,801.886-N USDLU168348444523,310.000 1,173.000 22,137.000-NG USDLU1806329998
515.555 35.000 1,079.684599.129R USDLU0385070528mtx SustainableEmerging MarketsLeaders
USD 673,498.586 148,775.859 696,842.116172,119.389A USDLU0571085330
21.000 - 21.000-AH EURLU172574408733,409.983 110.000 33,299.983-AHI EURLU1711395035
359,701.900 13,448.588 346,253.312-AI EURLU17171179791,088,517.233 123,621.637 1,210,113.736245,218.140AI USDLU1609308298
17,631.361 1,924.145 15,707.216-AN GBPLU1717118191345,424.774 17,700.640 327,724.134-AN USDLU1683485681
5,195,329.761 630,939.770 4,578,638.53814,248.547B SEKLU16022726571,096,075.257 549,504.188 2,095,817.8791,549,246.810B USDLU0571085413
2,984.547 527.877 2,466.67010.000C USDLU16514433323,238,204.290 29,327.930 3,208,876.360-G USDLU1767066605
202,576.702 28,047.296 174,539.40610.000H EURLU16465851145,605.180 1,502.530 4,112.65010.000HC EURLU1651443415
176,740.000 78,364.597 140,056.00041,680.597HI CHFLU1550202615936,893.047 427,908.322 590,584.72581,600.000HI EURLU1650589762
5,966.685 223.454 5,743.231-HN CHFLU1725744830
At the beginning of thefinancial year
Subscribed Redeemed At the end of thefinancial year
SHARESVontobel Fund –ISIN-Code
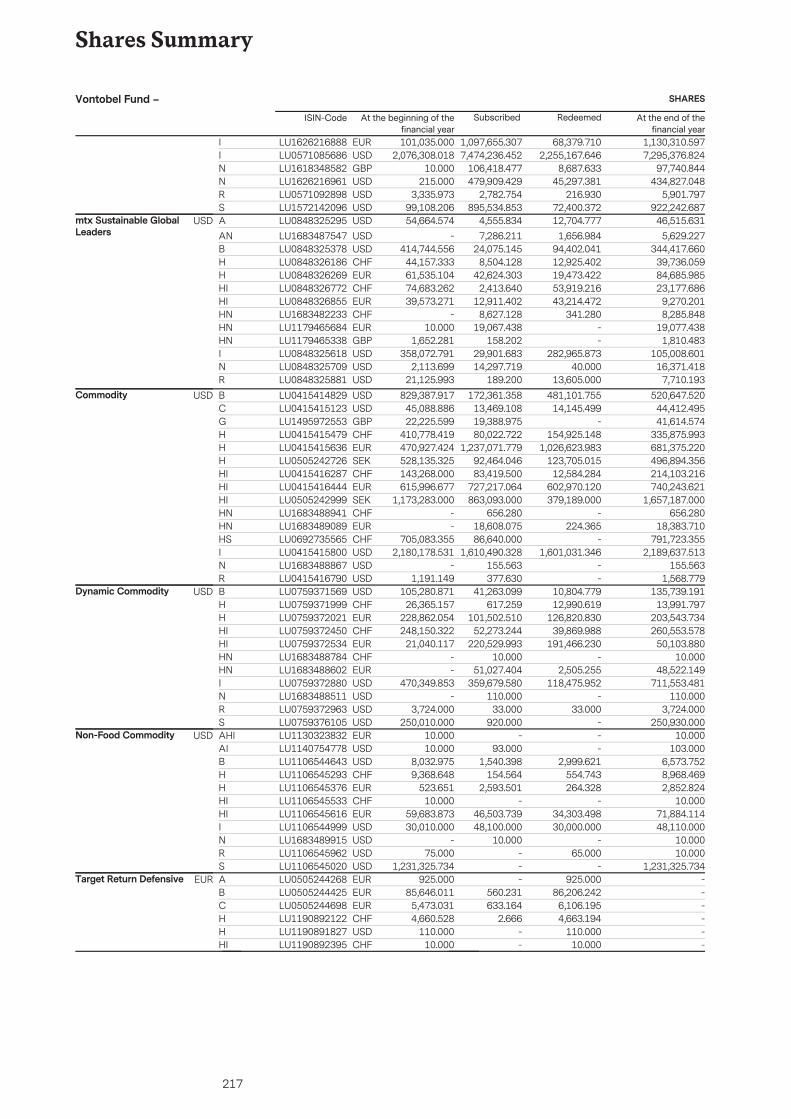
217
Shares Summary
1,097,655.307 68,379.710 1,130,310.597101,035.000I EURLU16262168887,474,236.452 2,255,167.646 7,295,376.8242,076,308.018I USDLU0571085686
106,418.477 8,687.633 97,740.84410.000N GBPLU1618348582479,909.429 45,297.381 434,827.048215.000N USDLU1626216961
2,782.754 216.930 5,901.7973,335.973R USDLU0571092898895,534.853 72,400.372 922,242.68799,108.206S USDLU1572142096
mtx Sustainable GlobalLeaders
USD 4,555.834 12,704.777 46,515.63154,664.574A USDLU08483252957,286.211 1,656.984 5,629.227-AN USDLU1683487547
24,075.145 94,402.041 344,417.660414,744.556B USDLU08483253788,504.128 12,925.402 39,736.05944,157.333H CHFLU0848326186
42,624.303 19,473.422 84,685.98561,535.104H EURLU08483262692,413.640 53,919.216 23,177.68674,683.262HI CHFLU0848326772
12,911.402 43,214.472 9,270.20139,573.271HI EURLU08483268558,627.128 341.280 8,285.848-HN CHFLU1683482233
19,067.438 - 19,077.43810.000HN EURLU1179465684158.202 - 1,810.4831,652.281HN GBPLU1179465338
29,901.683 282,965.873 105,008.601358,072.791I USDLU084832561814,297.719 40.000 16,371.4182,113.699N USDLU0848325709
189.200 13,605.000 7,710.19321,125.993R USDLU0848325881Commodity USD 172,361.358 481,101.755 520,647.520829,387.917B USDLU0415414829
13,469.108 14,145.499 44,412.49545,088.886C USDLU041541512319,388.975 - 41,614.57422,225.599G GBPLU149597255380,022.722 154,925.148 335,875.993410,778.419H CHFLU0415415479
1,237,071.779 1,026,623.983 681,375.220470,927.424H EURLU041541563692,464.046 123,705.015 496,894.356528,135.325H SEKLU050524272683,419.500 12,584.284 214,103.216143,268.000HI CHFLU0415416287
727,217.064 602,970.120 740,243.621615,996.677HI EURLU0415416444863,093.000 379,189.000 1,657,187.0001,173,283.000HI SEKLU0505242999
656.280 - 656.280-HN CHFLU168348894118,608.075 224.365 18,383.710-HN EURLU168348908986,640.000 - 791,723.355705,083.355HS CHFLU0692735565
1,610,490.328 1,601,031.346 2,189,637.5132,180,178.531I USDLU0415415800155.563 - 155.563-N USDLU1683488867377.630 - 1,568.7791,191.149R USDLU0415416790
Dynamic Commodity USD 41,263.099 10,804.779 135,739.191105,280.871B USDLU0759371569617.259 12,990.619 13,991.79726,365.157H CHFLU0759371999
101,502.510 126,820.830 203,543.734228,862.054H EURLU075937202152,273.244 39,869.988 260,553.578248,150.322HI CHFLU0759372450
220,529.993 191,466.230 50,103.88021,040.117HI EURLU075937253410.000 - 10.000-HN CHFLU1683488784
51,027.404 2,505.255 48,522.149-HN EURLU1683488602359,679.580 118,475.952 711,553.481470,349.853I USDLU0759372880
110.000 - 110.000-N USDLU168348851133.000 33.000 3,724.0003,724.000R USDLU0759372963
920.000 - 250,930.000250,010.000S USDLU0759376105Non-Food Commodity USD - - 10.00010.000AHI EURLU1130323832
93.000 - 103.00010.000AI USDLU11407547781,540.398 2,999.621 6,573.7528,032.975B USDLU1106544643
154.564 554.743 8,968.4699,368.648H CHFLU11065452932,593.501 264.328 2,852.824523.651H EURLU1106545376
- - 10.00010.000HI CHFLU110654553346,503.739 34,303.498 71,884.11459,683.873HI EURLU110654561648,100.000 30,000.000 48,110.00030,010.000I USDLU1106544999
10.000 - 10.000-N USDLU1683489915- 65.000 10.00075.000R USDLU1106545962- - 1,231,325.7341,231,325.734S USDLU1106545020
Target Return Defensive EUR - 925.000 -925.000A EURLU0505244268560.231 86,206.242 -85,646.011B EURLU0505244425633.164 6,106.195 -5,473.031C EURLU0505244698
2.666 4,663.194 -4,660.528H CHFLU1190892122- 110.000 -110.000H USDLU1190891827- 10.000 -10.000HI CHFLU1190892395
At the beginning of thefinancial year
Subscribed Redeemed At the end of thefinancial year
SHARESVontobel Fund –ISIN-Code
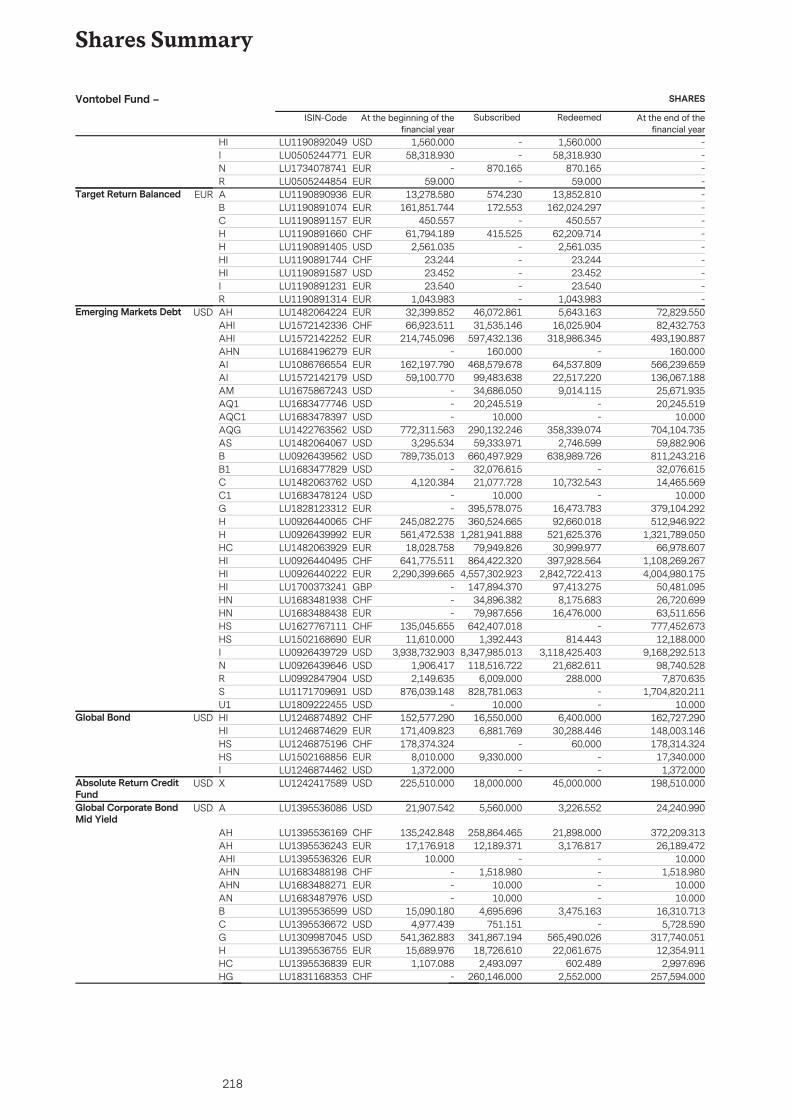
218
Shares Summary
- 1,560.000 -1,560.000HI USDLU1190892049- 58,318.930 -58,318.930I EURLU0505244771
870.165 870.165 --N EURLU1734078741- 59.000 -59.000R EURLU0505244854
Target Return Balanced EUR 574.230 13,852.810 -13,278.580A EURLU1190890936172.553 162,024.297 -161,851.744B EURLU1190891074
- 450.557 -450.557C EURLU1190891157415.525 62,209.714 -61,794.189H CHFLU1190891660
- 2,561.035 -2,561.035H USDLU1190891405- 23.244 -23.244HI CHFLU1190891744- 23.452 -23.452HI USDLU1190891587- 23.540 -23.540I EURLU1190891231- 1,043.983 -1,043.983R EURLU1190891314
Emerging Markets Debt USD 46,072.861 5,643.163 72,829.55032,399.852AH EURLU148206422431,535.146 16,025.904 82,432.75366,923.511AHI CHFLU1572142336
597,432.136 318,986.345 493,190.887214,745.096AHI EURLU1572142252160.000 - 160.000-AHN EURLU1684196279
468,579.678 64,537.809 566,239.659162,197.790AI EURLU108676655499,483.638 22,517.220 136,067.18859,100.770AI USDLU157214217934,686.050 9,014.115 25,671.935-AM USDLU167586724320,245.519 - 20,245.519-AQ1 USDLU1683477746
10.000 - 10.000-AQC1 USDLU1683478397290,132.246 358,339.074 704,104.735772,311.563AQG USDLU1422763562
59,333.971 2,746.599 59,882.9063,295.534AS USDLU1482064067660,497.929 638,989.726 811,243.216789,735.013B USDLU0926439562
32,076.615 - 32,076.615-B1 USDLU168347782921,077.728 10,732.543 14,465.5694,120.384C USDLU1482063762
10.000 - 10.000-C1 USDLU1683478124395,578.075 16,473.783 379,104.292-G EURLU1828123312360,524.665 92,660.018 512,946.922245,082.275H CHFLU0926440065
1,281,941.888 521,625.376 1,321,789.050561,472.538H EURLU092643999279,949.826 30,999.977 66,978.60718,028.758HC EURLU1482063929
864,422.320 397,928.564 1,108,269.267641,775.511HI CHFLU09264404954,557,302.923 2,842,722.413 4,004,980.1752,290,399.665HI EURLU0926440222
147,894.370 97,413.275 50,481.095-HI GBPLU170037324134,896.382 8,175.683 26,720.699-HN CHFLU168348193879,987.656 16,476.000 63,511.656-HN EURLU1683488438
642,407.018 - 777,452.673135,045.655HS CHFLU16277671111,392.443 814.443 12,188.00011,610.000HS EURLU1502168690
8,347,985.013 3,118,425.403 9,168,292.5133,938,732.903I USDLU0926439729118,516.722 21,682.611 98,740.5281,906.417N USDLU0926439646
6,009.000 288.000 7,870.6352,149.635R USDLU0992847904828,781.063 - 1,704,820.211876,039.148S USDLU1171709691
10.000 - 10.000-U1 USDLU1809222455Global Bond USD 16,550.000 6,400.000 162,727.290152,577.290HI CHFLU1246874892
6,881.769 30,288.446 148,003.146171,409.823HI EURLU1246874629- 60.000 178,314.324178,374.324HS CHFLU1246875196
9,330.000 - 17,340.0008,010.000HS EURLU1502168856- - 1,372.0001,372.000I USDLU1246874462
Absolute Return CreditFund
USD 18,000.000 45,000.000 198,510.000225,510.000X USDLU1242417589
Global Corporate BondMid Yield
USD 5,560.000 3,226.552 24,240.99021,907.542A USDLU1395536086
258,864.465 21,898.000 372,209.313135,242.848AH CHFLU139553616912,189.371 3,176.817 26,189.47217,176.918AH EURLU1395536243
- - 10.00010.000AHI EURLU13955363261,518.980 - 1,518.980-AHN CHFLU1683488198
10.000 - 10.000-AHN EURLU168348827110.000 - 10.000-AN USDLU1683487976
4,695.696 3,475.163 16,310.71315,090.180B USDLU1395536599751.151 - 5,728.5904,977.439C USDLU1395536672
341,867.194 565,490.026 317,740.051541,362.883G USDLU130998704518,726.610 22,061.675 12,354.91115,689.976H EURLU1395536755
2,493.097 602.489 2,997.6961,107.088HC EURLU1395536839260,146.000 2,552.000 257,594.000-HG CHFLU1831168353
At the beginning of thefinancial year
Subscribed Redeemed At the end of thefinancial year
SHARESVontobel Fund –ISIN-Code
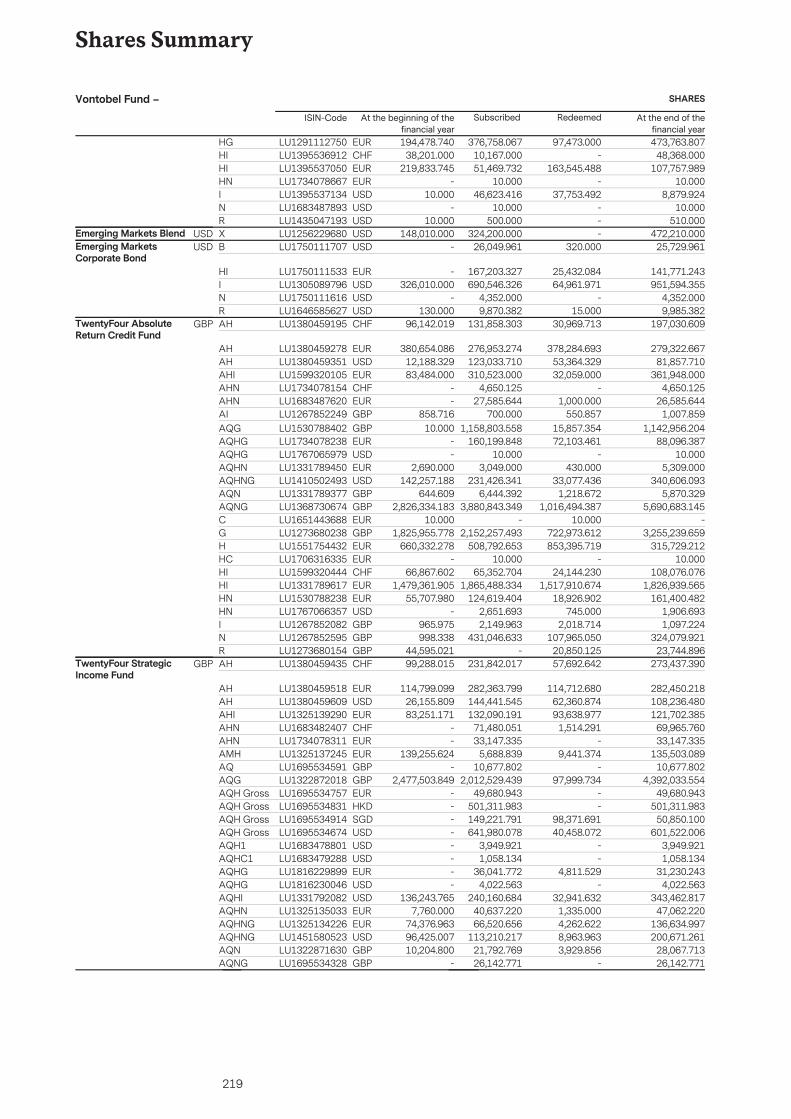
219
Shares Summary
376,758.067 97,473.000 473,763.807194,478.740HG EURLU129111275010,167.000 - 48,368.00038,201.000HI CHFLU139553691251,469.732 163,545.488 107,757.989219,833.745HI EURLU1395537050
10.000 - 10.000-HN EURLU173407866746,623.416 37,753.492 8,879.92410.000I USDLU1395537134
10.000 - 10.000-N USDLU1683487893500.000 - 510.00010.000R USDLU1435047193
Emerging Markets Blend USD 324,200.000 - 472,210.000148,010.000X USDLU1256229680Emerging MarketsCorporate Bond
USD 26,049.961 320.000 25,729.961-B USDLU1750111707
167,203.327 25,432.084 141,771.243-HI EURLU1750111533690,546.326 64,961.971 951,594.355326,010.000I USDLU1305089796
4,352.000 - 4,352.000-N USDLU17501116169,870.382 15.000 9,985.382130.000R USDLU1646585627
TwentyFour AbsoluteReturn Credit Fund
GBP 131,858.303 30,969.713 197,030.60996,142.019AH CHFLU1380459195
276,953.274 378,284.693 279,322.667380,654.086AH EURLU1380459278123,033.710 53,364.329 81,857.71012,188.329AH USDLU1380459351310,523.000 32,059.000 361,948.00083,484.000AHI EURLU1599320105
4,650.125 - 4,650.125-AHN CHFLU173407815427,585.644 1,000.000 26,585.644-AHN EURLU1683487620
700.000 550.857 1,007.859858.716AI GBPLU12678522491,158,803.558 15,857.354 1,142,956.20410.000AQG GBPLU1530788402
160,199.848 72,103.461 88,096.387-AQHG EURLU173407823810.000 - 10.000-AQHG USDLU1767065979
3,049.000 430.000 5,309.0002,690.000AQHN EURLU1331789450231,426.341 33,077.436 340,606.093142,257.188AQHNG USDLU1410502493
6,444.392 1,218.672 5,870.329644.609AQN GBPLU13317893773,880,843.349 1,016,494.387 5,690,683.1452,826,334.183AQNG GBPLU1368730674
- 10.000 -10.000C EURLU16514436882,152,257.493 722,973.612 3,255,239.6591,825,955.778G GBPLU1273680238
508,792.653 853,395.719 315,729.212660,332.278H EURLU155175443210.000 - 10.000-HC EURLU1706316335
65,352.704 24,144.230 108,076.07666,867.602HI CHFLU15993204441,865,488.334 1,517,910.674 1,826,939.5651,479,361.905HI EURLU1331789617
124,619.404 18,926.902 161,400.48255,707.980HN EURLU15307882382,651.693 745.000 1,906.693-HN USDLU17670663572,149.963 2,018.714 1,097.224965.975I GBPLU1267852082
431,046.633 107,965.050 324,079.921998.338N GBPLU1267852595- 20,850.125 23,744.89644,595.021R GBPLU1273680154
TwentyFour StrategicIncome Fund
GBP 231,842.017 57,692.642 273,437.39099,288.015AH CHFLU1380459435
282,363.799 114,712.680 282,450.218114,799.099AH EURLU1380459518144,441.545 62,360.874 108,236.48026,155.809AH USDLU1380459609132,090.191 93,638.977 121,702.38583,251.171AHI EURLU1325139290
71,480.051 1,514.291 69,965.760-AHN CHFLU168348240733,147.335 - 33,147.335-AHN EURLU1734078311
5,688.839 9,441.374 135,503.089139,255.624AMH EURLU132513724510,677.802 - 10,677.802-AQ GBPLU1695534591
2,012,529.439 97,999.734 4,392,033.5542,477,503.849AQG GBPLU132287201849,680.943 - 49,680.943-AQH Gross EURLU1695534757
501,311.983 - 501,311.983-AQH Gross HKDLU1695534831149,221.791 98,371.691 50,850.100-AQH Gross SGDLU1695534914641,980.078 40,458.072 601,522.006-AQH Gross USDLU1695534674
3,949.921 - 3,949.921-AQH1 USDLU16834788011,058.134 - 1,058.134-AQHC1 USDLU1683479288
36,041.772 4,811.529 31,230.243-AQHG EURLU18162298994,022.563 - 4,022.563-AQHG USDLU1816230046
240,160.684 32,941.632 343,462.817136,243.765AQHI USDLU133179208240,637.220 1,335.000 47,062.2207,760.000AQHN EURLU132513503366,520.656 4,262.622 136,634.99774,376.963AQHNG EURLU1325134226
113,210.217 8,963.963 200,671.26196,425.007AQHNG USDLU145158052321,792.769 3,929.856 28,067.71310,204.800AQN GBPLU132287163026,142.771 - 26,142.771-AQNG GBPLU1695534328
At the beginning of thefinancial year
Subscribed Redeemed At the end of thefinancial year
SHARESVontobel Fund –ISIN-Code
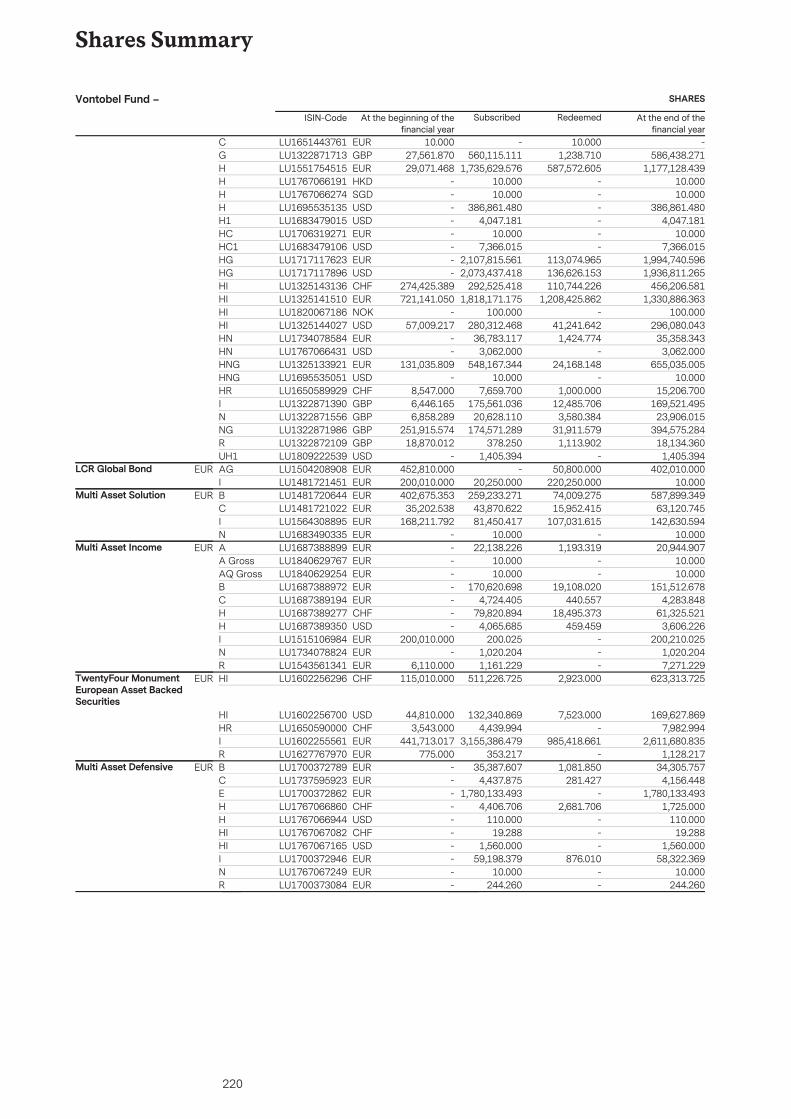
220
Shares Summary
- 10.000 -10.000C EURLU1651443761560,115.111 1,238.710 586,438.27127,561.870G GBPLU1322871713
1,735,629.576 587,572.605 1,177,128.43929,071.468H EURLU155175451510.000 - 10.000-H HKDLU176706619110.000 - 10.000-H SGDLU1767066274
386,861.480 - 386,861.480-H USDLU16955351354,047.181 - 4,047.181-H1 USDLU1683479015
10.000 - 10.000-HC EURLU17063192717,366.015 - 7,366.015-HC1 USDLU1683479106
2,107,815.561 113,074.965 1,994,740.596-HG EURLU17171176232,073,437.418 136,626.153 1,936,811.265-HG USDLU1717117896
292,525.418 110,744.226 456,206.581274,425.389HI CHFLU13251431361,818,171.175 1,208,425.862 1,330,886.363721,141.050HI EURLU1325141510
100.000 - 100.000-HI NOKLU1820067186280,312.468 41,241.642 296,080.04357,009.217HI USDLU1325144027
36,783.117 1,424.774 35,358.343-HN EURLU17340785843,062.000 - 3,062.000-HN USDLU1767066431
548,167.344 24,168.148 655,035.005131,035.809HNG EURLU132513392110.000 - 10.000-HNG USDLU1695535051
7,659.700 1,000.000 15,206.7008,547.000HR CHFLU1650589929175,561.036 12,485.706 169,521.4956,446.165I GBPLU1322871390
20,628.110 3,580.384 23,906.0156,858.289N GBPLU1322871556174,571.289 31,911.579 394,575.284251,915.574NG GBPLU1322871986
378.250 1,113.902 18,134.36018,870.012R GBPLU13228721091,405.394 - 1,405.394-UH1 USDLU1809222539
LCR Global Bond EUR - 50,800.000 402,010.000452,810.000AG EURLU150420890820,250.000 220,250.000 10.000200,010.000I EURLU1481721451
Multi Asset Solution EUR 259,233.271 74,009.275 587,899.349402,675.353B EURLU148172064443,870.622 15,952.415 63,120.74535,202.538C EURLU148172102281,450.417 107,031.615 142,630.594168,211.792I EURLU1564308895
10.000 - 10.000-N EURLU1683490335Multi Asset Income EUR 22,138.226 1,193.319 20,944.907-A EURLU1687388899
10.000 - 10.000-A Gross EURLU184062976710.000 - 10.000-AQ Gross EURLU1840629254
170,620.698 19,108.020 151,512.678-B EURLU16873889724,724.405 440.557 4,283.848-C EURLU1687389194
79,820.894 18,495.373 61,325.521-H CHFLU16873892774,065.685 459.459 3,606.226-H USDLU1687389350
200.025 - 200,210.025200,010.000I EURLU15151069841,020.204 - 1,020.204-N EURLU17340788241,161.229 - 7,271.2296,110.000R EURLU1543561341
TwentyFour MonumentEuropean Asset BackedSecurities
EUR 511,226.725 2,923.000 623,313.725115,010.000HI CHFLU1602256296
132,340.869 7,523.000 169,627.86944,810.000HI USDLU16022567004,439.994 - 7,982.9943,543.000HR CHFLU1650590000
3,155,386.479 985,418.661 2,611,680.835441,713.017I EURLU1602255561353.217 - 1,128.217775.000R EURLU1627767970
Multi Asset Defensive EUR 35,387.607 1,081.850 34,305.757-B EURLU17003727894,437.875 281.427 4,156.448-C EURLU1737595923
1,780,133.493 - 1,780,133.493-E EURLU17003728624,406.706 2,681.706 1,725.000-H CHFLU1767066860
110.000 - 110.000-H USDLU176706694419.288 - 19.288-HI CHFLU1767067082
1,560.000 - 1,560.000-HI USDLU176706716559,198.379 876.010 58,322.369-I EURLU1700372946
10.000 - 10.000-N EURLU1767067249244.260 - 244.260-R EURLU1700373084
At the beginning of thefinancial year
Subscribed Redeemed At the end of thefinancial year
SHARESVontobel Fund –ISIN-Code
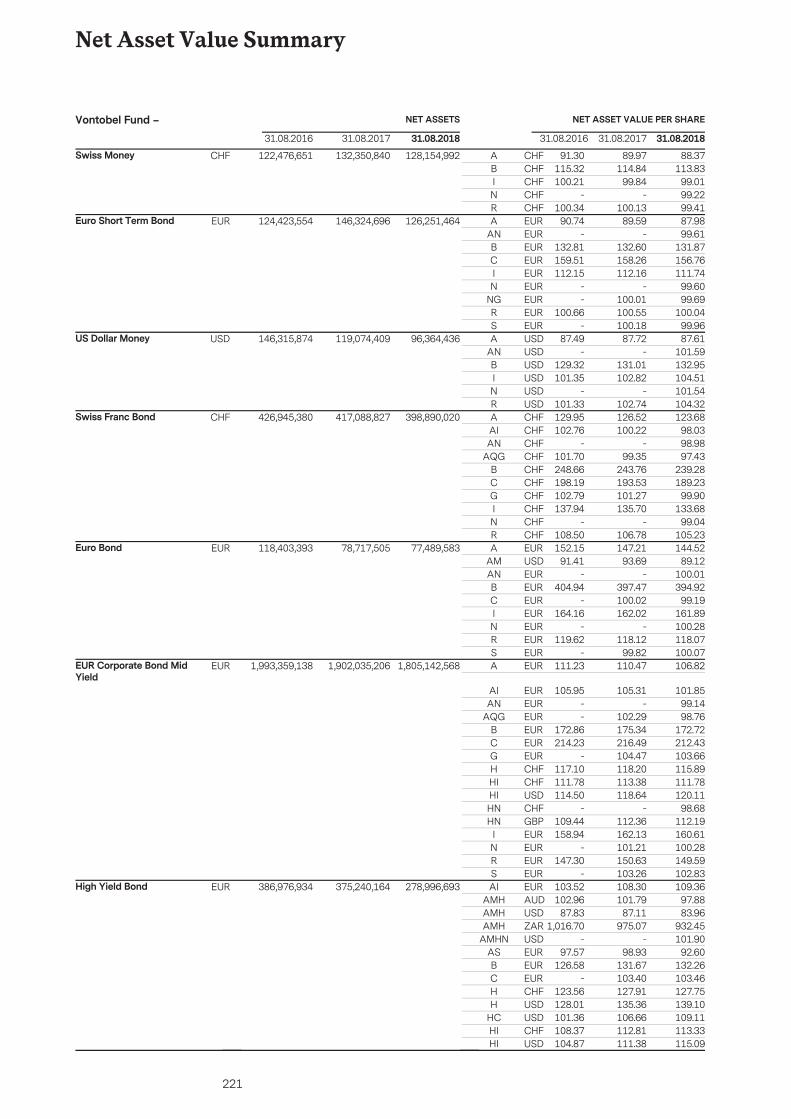
221
Net Asset Value Summary
Swiss Money CHF 122,476,651 132,350,840 128,154,992 91.30 89.97 88.37A CHF115.32 114.84 113.83B CHF100.21 99.84 99.01I CHF
- - 99.22N CHF100.34 100.13 99.41R CHF
Euro Short Term Bond EUR 124,423,554 146,324,696 126,251,464 90.74 89.59 87.98A EUR- - 99.61AN EUR
132.81 132.60 131.87B EUR159.51 158.26 156.76C EUR112.15 112.16 111.74I EUR
- - 99.60N EUR- 100.01 99.69NG EUR
100.66 100.55 100.04R EUR- 100.18 99.96S EUR
US Dollar Money USD 146,315,874 119,074,409 96,364,436 87.49 87.72 87.61A USD- - 101.59AN USD
129.32 131.01 132.95B USD101.35 102.82 104.51I USD
- - 101.54N USD101.33 102.74 104.32R USD
Swiss Franc Bond CHF 426,945,380 417,088,827 398,890,020 129.95 126.52 123.68A CHF102.76 100.22 98.03AI CHF
- - 98.98AN CHF101.70 99.35 97.43AQG CHF248.66 243.76 239.28B CHF198.19 193.53 189.23C CHF102.79 101.27 99.90G CHF137.94 135.70 133.68I CHF
- - 99.04N CHF108.50 106.78 105.23R CHF
Euro Bond EUR 118,403,393 78,717,505 77,489,583 152.15 147.21 144.52A EUR91.41 93.69 89.12AM USD
- - 100.01AN EUR404.94 397.47 394.92B EUR
- 100.02 99.19C EUR164.16 162.02 161.89I EUR
- - 100.28N EUR119.62 118.12 118.07R EUR
- 99.82 100.07S EUREUR Corporate Bond MidYield
EUR 1,993,359,138 1,902,035,206 1,805,142,568 111.23 110.47 106.82A EUR
105.95 105.31 101.85AI EUR- - 99.14AN EUR- 102.29 98.76AQG EUR
172.86 175.34 172.72B EUR214.23 216.49 212.43C EUR
- 104.47 103.66G EUR117.10 118.20 115.89H CHF111.78 113.38 111.78HI CHF114.50 118.64 120.11HI USD
- - 98.68HN CHF109.44 112.36 112.19HN GBP158.94 162.13 160.61I EUR
- 101.21 100.28N EUR147.30 150.63 149.59R EUR
- 103.26 102.83S EURHigh Yield Bond EUR 386,976,934 375,240,164 278,996,693 103.52 108.30 109.36AI EUR
102.96 101.79 97.88AMH AUD87.83 87.11 83.96AMH USD
1,016.70 975.07 932.45AMH ZAR- - 101.90AMHN USD
97.57 98.93 92.60AS EUR126.58 131.67 132.26B EUR
- 103.40 103.46C EUR123.56 127.91 127.75H CHF128.01 135.36 139.10H USD101.36 106.66 109.11HC USD108.37 112.81 113.33HI CHF104.87 111.38 115.09HI USD
31.08.2016 31.08.2017 31.08.2018 31.08.2016 31.08.2017 31.08.2018
NET ASSETS NET ASSET VALUE PER SHAREVontobel Fund –
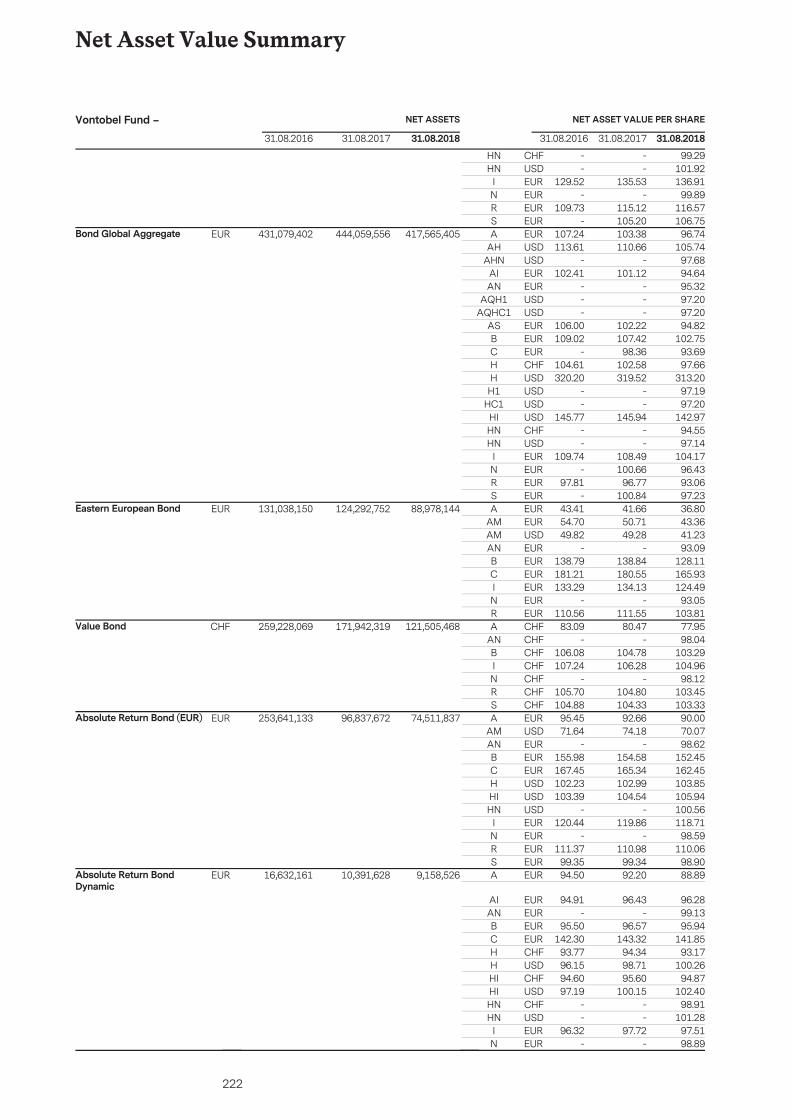
222
Net Asset Value Summary
- - 99.29HN CHF- - 101.92HN USD
129.52 135.53 136.91I EUR- - 99.89N EUR
109.73 115.12 116.57R EUR- 105.20 106.75S EUR
Bond Global Aggregate EUR 431,079,402 444,059,556 417,565,405 107.24 103.38 96.74A EUR113.61 110.66 105.74AH USD
- - 97.68AHN USD102.41 101.12 94.64AI EUR
- - 95.32AN EUR- - 97.20AQH1 USD- - 97.20AQHC1 USD
106.00 102.22 94.82AS EUR109.02 107.42 102.75B EUR
- 98.36 93.69C EUR104.61 102.58 97.66H CHF320.20 319.52 313.20H USD
- - 97.19H1 USD- - 97.20HC1 USD
145.77 145.94 142.97HI USD- - 94.55HN CHF- - 97.14HN USD
109.74 108.49 104.17I EUR- 100.66 96.43N EUR
97.81 96.77 93.06R EUR- 100.84 97.23S EUR
Eastern European Bond EUR 131,038,150 124,292,752 88,978,144 43.41 41.66 36.80A EUR54.70 50.71 43.36AM EUR49.82 49.28 41.23AM USD
- - 93.09AN EUR138.79 138.84 128.11B EUR181.21 180.55 165.93C EUR133.29 134.13 124.49I EUR
- - 93.05N EUR110.56 111.55 103.81R EUR
Value Bond CHF 259,228,069 171,942,319 121,505,468 83.09 80.47 77.95A CHF- - 98.04AN CHF
106.08 104.78 103.29B CHF107.24 106.28 104.96I CHF
- - 98.12N CHF105.70 104.80 103.45R CHF104.88 104.33 103.33S CHF
Absolute Return Bond (EUR) EUR 253,641,133 96,837,672 74,511,837 95.45 92.66 90.00A EUR71.64 74.18 70.07AM USD
- - 98.62AN EUR155.98 154.58 152.45B EUR167.45 165.34 162.45C EUR102.23 102.99 103.85H USD103.39 104.54 105.94HI USD
- - 100.56HN USD120.44 119.86 118.71I EUR
- - 98.59N EUR111.37 110.98 110.06R EUR
99.35 99.34 98.90S EURAbsolute Return BondDynamic
EUR 16,632,161 10,391,628 9,158,526 94.50 92.20 88.89A EUR
94.91 96.43 96.28AI EUR- - 99.13AN EUR
95.50 96.57 95.94B EUR142.30 143.32 141.85C EUR
93.77 94.34 93.17H CHF96.15 98.71 100.26H USD94.60 95.60 94.87HI CHF97.19 100.15 102.40HI USD
- - 98.91HN CHF- - 101.28HN USD
96.32 97.72 97.51I EUR- - 98.89N EUR
31.08.2016 31.08.2017 31.08.2018 31.08.2016 31.08.2017 31.08.2018
NET ASSETS NET ASSET VALUE PER SHAREVontobel Fund –
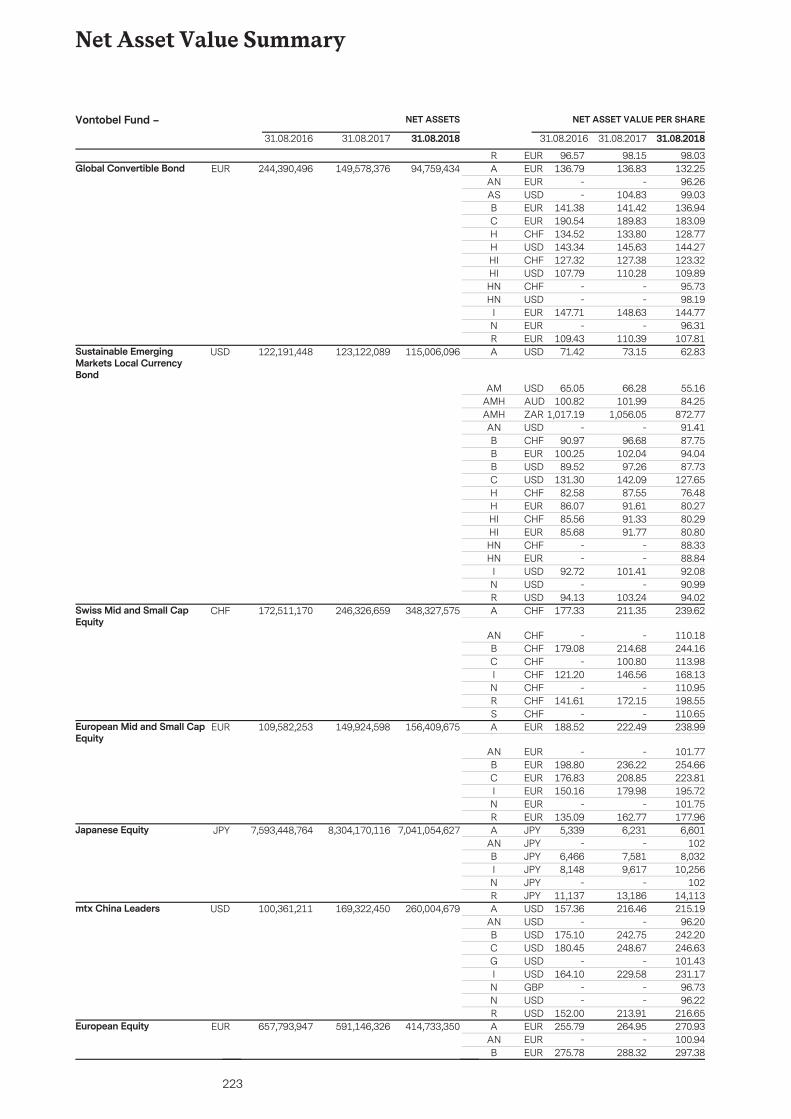
223
Net Asset Value Summary
96.57 98.15 98.03R EURGlobal Convertible Bond EUR 244,390,496 149,578,376 94,759,434 136.79 136.83 132.25A EUR
- - 96.26AN EUR- 104.83 99.03AS USD
141.38 141.42 136.94B EUR190.54 189.83 183.09C EUR134.52 133.80 128.77H CHF143.34 145.63 144.27H USD127.32 127.38 123.32HI CHF107.79 110.28 109.89HI USD
- - 95.73HN CHF- - 98.19HN USD
147.71 148.63 144.77I EUR- - 96.31N EUR
109.43 110.39 107.81R EURSustainable EmergingMarkets Local CurrencyBond
USD 122,191,448 123,122,089 115,006,096 71.42 73.15 62.83A USD
65.05 66.28 55.16AM USD100.82 101.99 84.25AMH AUD
1,017.19 1,056.05 872.77AMH ZAR- - 91.41AN USD
90.97 96.68 87.75B CHF100.25 102.04 94.04B EUR
89.52 97.26 87.73B USD131.30 142.09 127.65C USD
82.58 87.55 76.48H CHF86.07 91.61 80.27H EUR85.56 91.33 80.29HI CHF85.68 91.77 80.80HI EUR
- - 88.33HN CHF- - 88.84HN EUR
92.72 101.41 92.08I USD- - 90.99N USD
94.13 103.24 94.02R USDSwiss Mid and Small CapEquity
CHF 172,511,170 246,326,659 348,327,575 177.33 211.35 239.62A CHF
- - 110.18AN CHF179.08 214.68 244.16B CHF
- 100.80 113.98C CHF121.20 146.56 168.13I CHF
- - 110.95N CHF141.61 172.15 198.55R CHF
- - 110.65S CHFEuropean Mid and Small CapEquity
EUR 109,582,253 149,924,598 156,409,675 188.52 222.49 238.99A EUR
- - 101.77AN EUR198.80 236.22 254.66B EUR176.83 208.85 223.81C EUR150.16 179.98 195.72I EUR
- - 101.75N EUR135.09 162.77 177.96R EUR
Japanese Equity JPY 7,593,448,764 8,304,170,116 7,041,054,627 5,339 6,231 6,601A JPY- - 102AN JPY
6,466 7,581 8,032B JPY8,148 9,617 10,256I JPY
- - 102N JPY11,137 13,186 14,113R JPY
mtx China Leaders USD 100,361,211 169,322,450 260,004,679 157.36 216.46 215.19A USD- - 96.20AN USD
175.10 242.75 242.20B USD180.45 248.67 246.63C USD
- - 101.43G USD164.10 229.58 231.17I USD
- - 96.73N GBP- - 96.22N USD
152.00 213.91 216.65R USDEuropean Equity EUR 657,793,947 591,146,326 414,733,350 255.79 264.95 270.93A EUR
- - 100.94AN EUR275.78 288.32 297.38B EUR
31.08.2016 31.08.2017 31.08.2018 31.08.2016 31.08.2017 31.08.2018
NET ASSETS NET ASSET VALUE PER SHAREVontobel Fund –
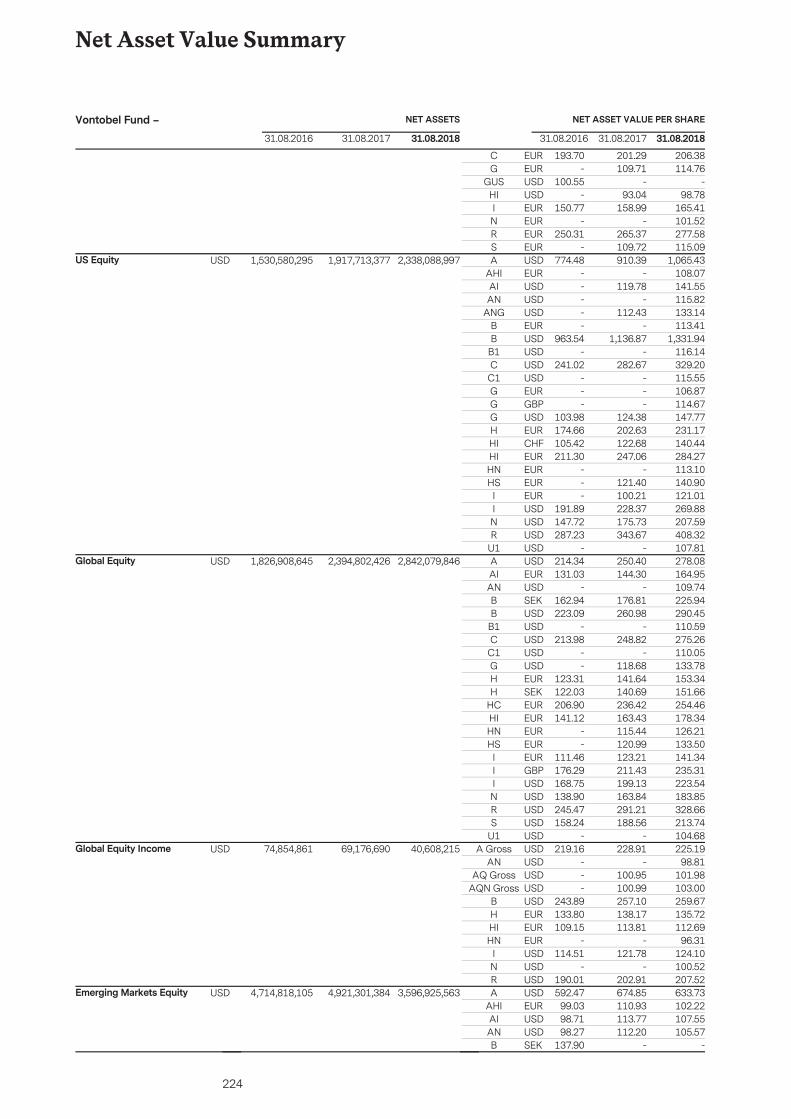
224
Net Asset Value Summary
193.70 201.29 206.38C EUR- 109.71 114.76G EUR
100.55 - -GUS USD- 93.04 98.78HI USD
150.77 158.99 165.41I EUR- - 101.52N EUR
250.31 265.37 277.58R EUR- 109.72 115.09S EUR
US Equity USD 1,530,580,295 1,917,713,377 2,338,088,997 774.48 910.39 1,065.43A USD- - 108.07AHI EUR- 119.78 141.55AI USD- - 115.82AN USD- 112.43 133.14ANG USD- - 113.41B EUR
963.54 1,136.87 1,331.94B USD- - 116.14B1 USD
241.02 282.67 329.20C USD- - 115.55C1 USD- - 106.87G EUR- - 114.67G GBP
103.98 124.38 147.77G USD174.66 202.63 231.17H EUR105.42 122.68 140.44HI CHF211.30 247.06 284.27HI EUR
- - 113.10HN EUR- 121.40 140.90HS EUR- 100.21 121.01I EUR
191.89 228.37 269.88I USD147.72 175.73 207.59N USD287.23 343.67 408.32R USD
- - 107.81U1 USDGlobal Equity USD 1,826,908,645 2,394,802,426 2,842,079,846 214.34 250.40 278.08A USD
131.03 144.30 164.95AI EUR- - 109.74AN USD
162.94 176.81 225.94B SEK223.09 260.98 290.45B USD
- - 110.59B1 USD213.98 248.82 275.26C USD
- - 110.05C1 USD- 118.68 133.78G USD
123.31 141.64 153.34H EUR122.03 140.69 151.66H SEK206.90 236.42 254.46HC EUR141.12 163.43 178.34HI EUR
- 115.44 126.21HN EUR- 120.99 133.50HS EUR
111.46 123.21 141.34I EUR176.29 211.43 235.31I GBP168.75 199.13 223.54I USD138.90 163.84 183.85N USD245.47 291.21 328.66R USD158.24 188.56 213.74S USD
- - 104.68U1 USDGlobal Equity Income USD 74,854,861 69,176,690 40,608,215 219.16 228.91 225.19A Gross USD
- - 98.81AN USD- 100.95 101.98AQ Gross USD- 100.99 103.00AQN Gross USD
243.89 257.10 259.67B USD133.80 138.17 135.72H EUR109.15 113.81 112.69HI EUR
- - 96.31HN EUR114.51 121.78 124.10I USD
- - 100.52N USD190.01 202.91 207.52R USD
Emerging Markets Equity USD 4,714,818,105 4,921,301,384 3,596,925,563 592.47 674.85 633.73A USD99.03 110.93 102.22AHI EUR98.71 113.77 107.55AI USD98.27 112.20 105.57AN USD
137.90 - -B SEK
31.08.2016 31.08.2017 31.08.2018 31.08.2016 31.08.2017 31.08.2018
NET ASSETS NET ASSET VALUE PER SHAREVontobel Fund –
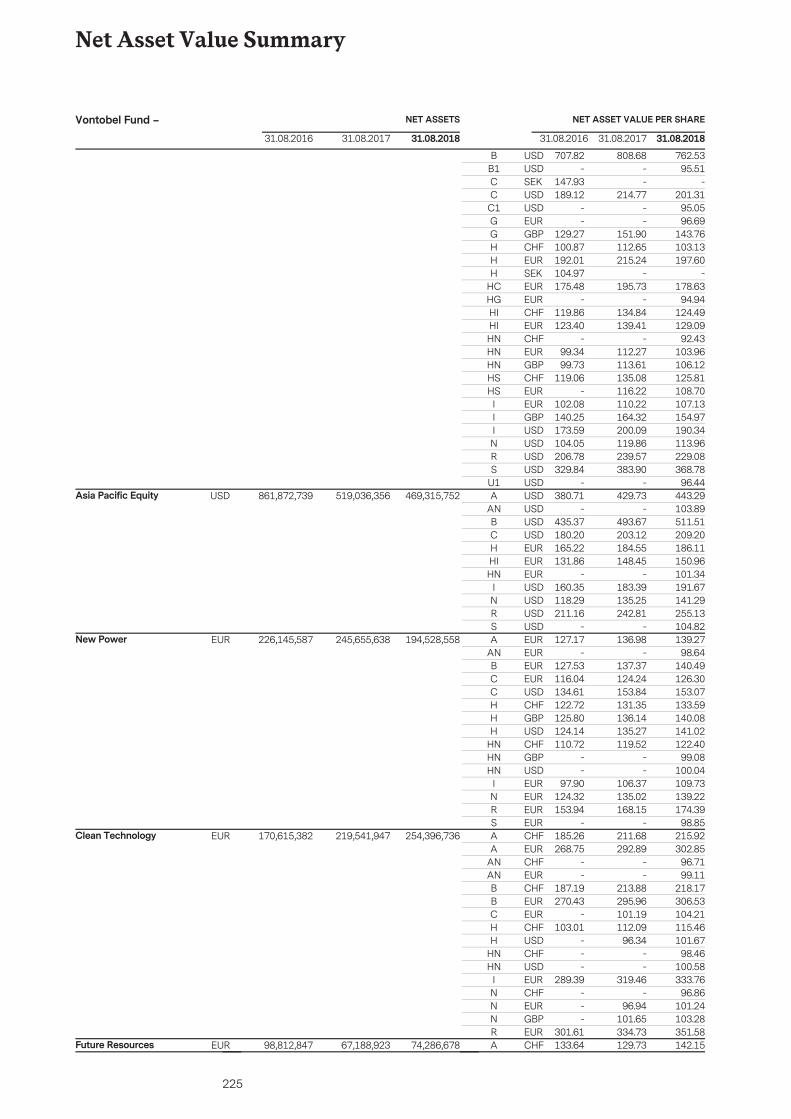
225
Net Asset Value Summary
707.82 808.68 762.53B USD- - 95.51B1 USD
147.93 - -C SEK189.12 214.77 201.31C USD
- - 95.05C1 USD- - 96.69G EUR
129.27 151.90 143.76G GBP100.87 112.65 103.13H CHF192.01 215.24 197.60H EUR104.97 - -H SEK175.48 195.73 178.63HC EUR
- - 94.94HG EUR119.86 134.84 124.49HI CHF123.40 139.41 129.09HI EUR
- - 92.43HN CHF99.34 112.27 103.96HN EUR99.73 113.61 106.12HN GBP
119.06 135.08 125.81HS CHF- 116.22 108.70HS EUR
102.08 110.22 107.13I EUR140.25 164.32 154.97I GBP173.59 200.09 190.34I USD104.05 119.86 113.96N USD206.78 239.57 229.08R USD329.84 383.90 368.78S USD
- - 96.44U1 USDAsia Pacific Equity USD 861,872,739 519,036,356 469,315,752 380.71 429.73 443.29A USD
- - 103.89AN USD435.37 493.67 511.51B USD180.20 203.12 209.20C USD165.22 184.55 186.11H EUR131.86 148.45 150.96HI EUR
- - 101.34HN EUR160.35 183.39 191.67I USD118.29 135.25 141.29N USD211.16 242.81 255.13R USD
- - 104.82S USDNew Power EUR 226,145,587 245,655,638 194,528,558 127.17 136.98 139.27A EUR
- - 98.64AN EUR127.53 137.37 140.49B EUR116.04 124.24 126.30C EUR134.61 153.84 153.07C USD122.72 131.35 133.59H CHF125.80 136.14 140.08H GBP124.14 135.27 141.02H USD110.72 119.52 122.40HN CHF
- - 99.08HN GBP- - 100.04HN USD
97.90 106.37 109.73I EUR124.32 135.02 139.22N EUR153.94 168.15 174.39R EUR
- - 98.85S EURClean Technology EUR 170,615,382 219,541,947 254,396,736 185.26 211.68 215.92A CHF
268.75 292.89 302.85A EUR- - 96.71AN CHF- - 99.11AN EUR
187.19 213.88 218.17B CHF270.43 295.96 306.53B EUR
- 101.19 104.21C EUR103.01 112.09 115.46H CHF
- 96.34 101.67H USD- - 98.46HN CHF- - 100.58HN USD
289.39 319.46 333.76I EUR- - 96.86N CHF- 96.94 101.24N EUR- 101.65 103.28N GBP
301.61 334.73 351.58R EURFuture Resources EUR 98,812,847 67,188,923 74,286,678 133.64 129.73 142.15A CHF
31.08.2016 31.08.2017 31.08.2018 31.08.2016 31.08.2017 31.08.2018
NET ASSETS NET ASSET VALUE PER SHAREVontobel Fund –
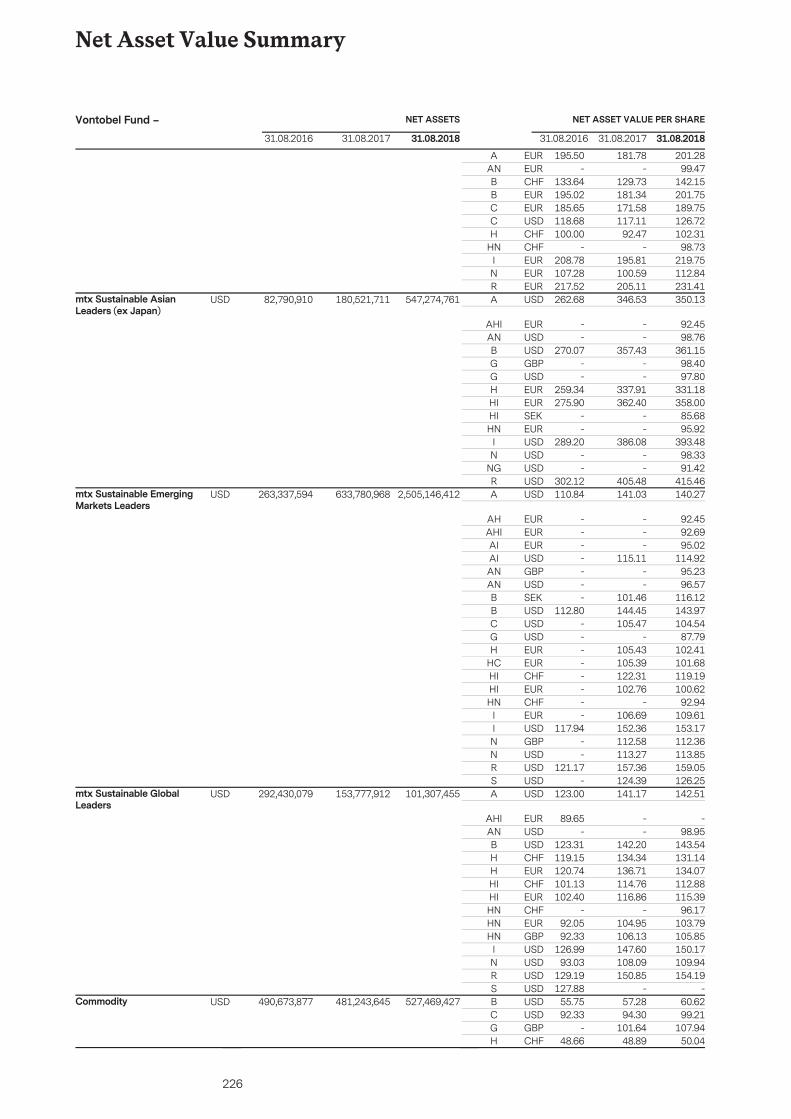
226
Net Asset Value Summary
195.50 181.78 201.28A EUR- - 99.47AN EUR
133.64 129.73 142.15B CHF195.02 181.34 201.75B EUR185.65 171.58 189.75C EUR118.68 117.11 126.72C USD100.00 92.47 102.31H CHF
- - 98.73HN CHF208.78 195.81 219.75I EUR107.28 100.59 112.84N EUR217.52 205.11 231.41R EUR
mtx Sustainable AsianLeaders (ex Japan)
USD 82,790,910 180,521,711 547,274,761 262.68 346.53 350.13A USD
- - 92.45AHI EUR- - 98.76AN USD
270.07 357.43 361.15B USD- - 98.40G GBP- - 97.80G USD
259.34 337.91 331.18H EUR275.90 362.40 358.00HI EUR
- - 85.68HI SEK- - 95.92HN EUR
289.20 386.08 393.48I USD- - 98.33N USD- - 91.42NG USD
302.12 405.48 415.46R USDmtx Sustainable EmergingMarkets Leaders
USD 263,337,594 633,780,968 2,505,146,412 110.84 141.03 140.27A USD
- - 92.45AH EUR- - 92.69AHI EUR- - 95.02AI EUR- 115.11 114.92AI USD- - 95.23AN GBP- - 96.57AN USD- 101.46 116.12B SEK
112.80 144.45 143.97B USD- 105.47 104.54C USD- - 87.79G USD- 105.43 102.41H EUR- 105.39 101.68HC EUR- 122.31 119.19HI CHF- 102.76 100.62HI EUR- - 92.94HN CHF- 106.69 109.61I EUR
117.94 152.36 153.17I USD- 112.58 112.36N GBP- 113.27 113.85N USD
121.17 157.36 159.05R USD- 124.39 126.25S USD
mtx Sustainable GlobalLeaders
USD 292,430,079 153,777,912 101,307,455 123.00 141.17 142.51A USD
89.65 - -AHI EUR- - 98.95AN USD
123.31 142.20 143.54B USD119.15 134.34 131.14H CHF120.74 136.71 134.07H EUR101.13 114.76 112.88HI CHF102.40 116.86 115.39HI EUR
- - 96.17HN CHF92.05 104.95 103.79HN EUR92.33 106.13 105.85HN GBP
126.99 147.60 150.17I USD93.03 108.09 109.94N USD
129.19 150.85 154.19R USD127.88 - -S USD
Commodity USD 490,673,877 481,243,645 527,469,427 55.75 57.28 60.62B USD92.33 94.30 99.21C USD
- 101.64 107.94G GBP48.66 48.89 50.04H CHF
31.08.2016 31.08.2017 31.08.2018 31.08.2016 31.08.2017 31.08.2018
NET ASSETS NET ASSET VALUE PER SHAREVontobel Fund –
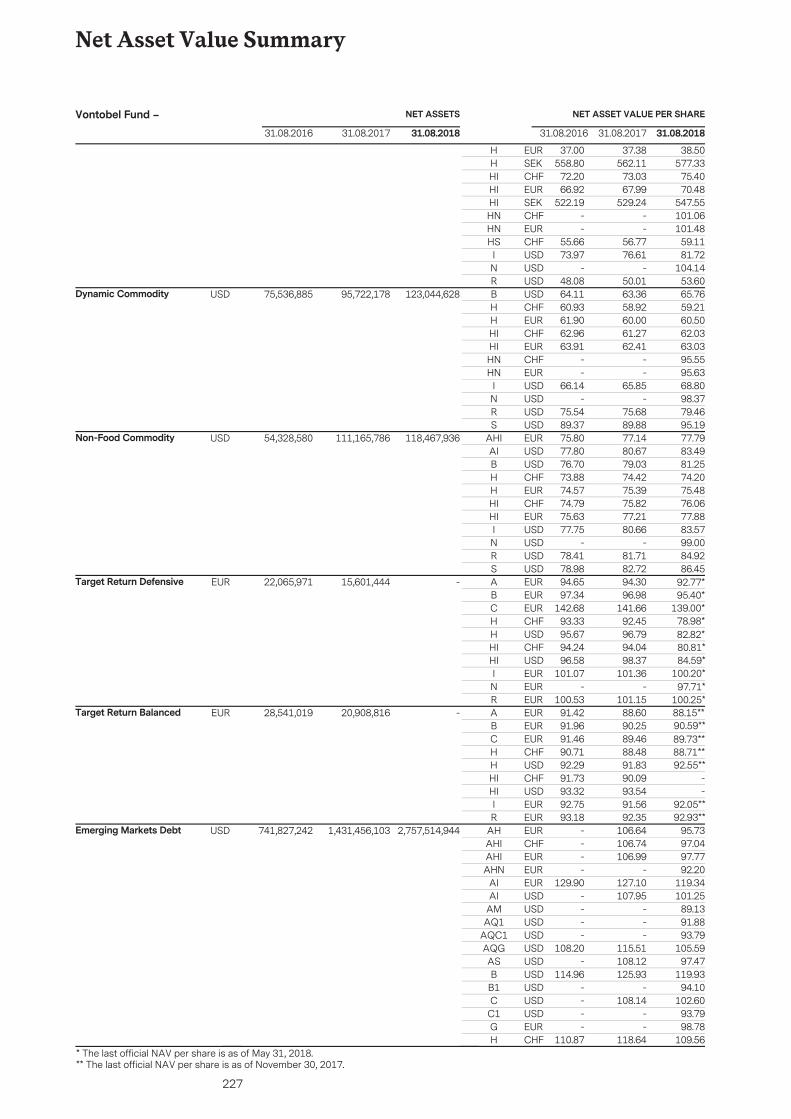
227
Net Asset Value Summary
37.00 37.38 38.50H EUR558.80 562.11 577.33H SEK
72.20 73.03 75.40HI CHF66.92 67.99 70.48HI EUR
522.19 529.24 547.55HI SEK- - 101.06HN CHF- - 101.48HN EUR
55.66 56.77 59.11HS CHF73.97 76.61 81.72I USD
- - 104.14N USD48.08 50.01 53.60R USD
Dynamic Commodity USD 75,536,885 95,722,178 123,044,628 64.11 63.36 65.76B USD60.93 58.92 59.21H CHF61.90 60.00 60.50H EUR62.96 61.27 62.03HI CHF63.91 62.41 63.03HI EUR
- - 95.55HN CHF- - 95.63HN EUR
66.14 65.85 68.80I USD- - 98.37N USD
75.54 75.68 79.46R USD89.37 89.88 95.19S USD
Non-Food Commodity USD 54,328,580 111,165,786 118,467,936 75.80 77.14 77.79AHI EUR77.80 80.67 83.49AI USD76.70 79.03 81.25B USD73.88 74.42 74.20H CHF74.57 75.39 75.48H EUR74.79 75.82 76.06HI CHF75.63 77.21 77.88HI EUR77.75 80.66 83.57I USD
- - 99.00N USD78.41 81.71 84.92R USD78.98 82.72 86.45S USD
Target Return Defensive EUR 22,065,971 15,601,444 - 94.65 94.30 92.77*A EUR97.34 96.98 95.40*B EUR
142.68 141.66 139.00*C EUR93.33 92.45 78.98*H CHF95.67 96.79 82.82*H USD94.24 94.04 80.81*HI CHF96.58 98.37 84.59*HI USD
101.07 101.36 100.20*I EUR- - 97.71*N EUR
100.53 101.15 100.25*R EURTarget Return Balanced EUR 28,541,019 20,908,816 - 91.42 88.60 88.15**A EUR
91.96 90.25 90.59**B EUR91.46 89.46 89.73**C EUR90.71 88.48 88.71**H CHF92.29 91.83 92.55**H USD91.73 90.09 -HI CHF93.32 93.54 -HI USD92.75 91.56 92.05**I EUR93.18 92.35 92.93**R EUR
Emerging Markets Debt USD 741,827,242 1,431,456,103 2,757,514,944 - 106.64 95.73AH EUR- 106.74 97.04AHI CHF- 106.99 97.77AHI EUR- - 92.20AHN EUR
129.90 127.10 119.34AI EUR- 107.95 101.25AI USD- - 89.13AM USD- - 91.88AQ1 USD- - 93.79AQC1 USD
108.20 115.51 105.59AQG USD- 108.12 97.47AS USD
114.96 125.93 119.93B USD- - 94.10B1 USD- 108.14 102.60C USD- - 93.79C1 USD- - 98.78G EUR
110.87 118.64 109.56H CHF
31.08.2016 31.08.2017 31.08.2018 31.08.2016 31.08.2017 31.08.2018
NET ASSETS NET ASSET VALUE PER SHAREVontobel Fund –
* The last official NAV per share is as of May 31, 2018.** The last official NAV per share is as of November 30, 2017.
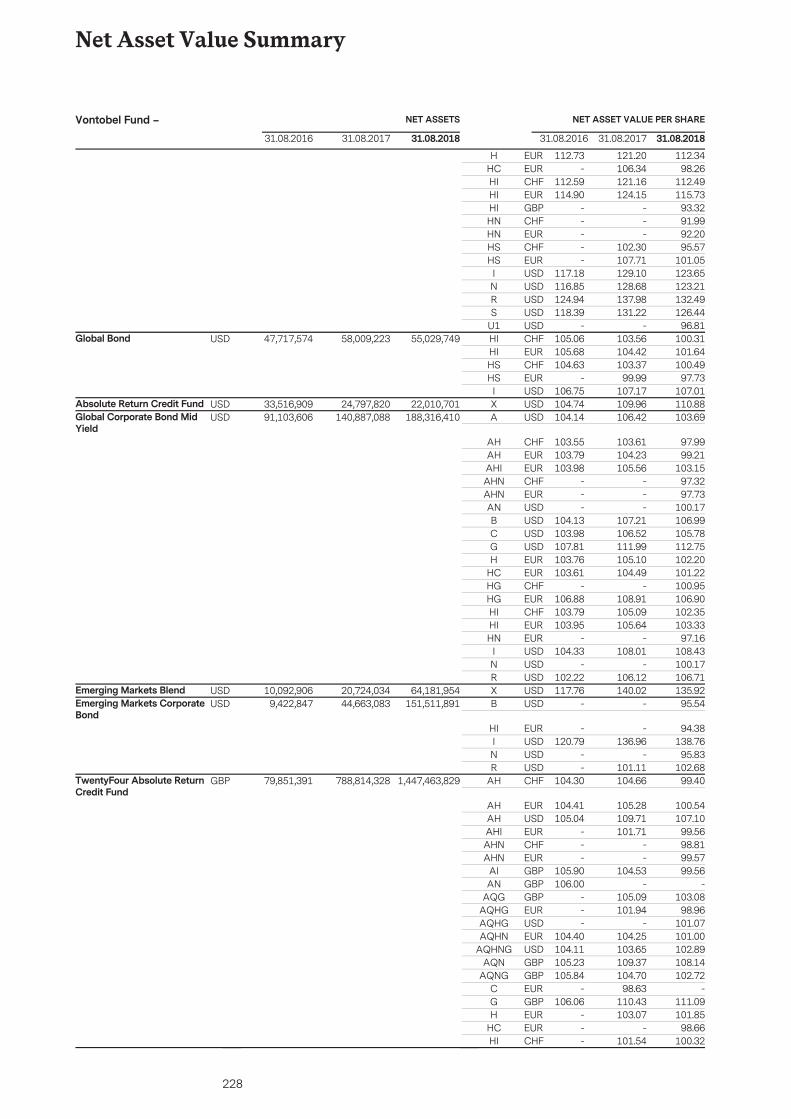
228
Net Asset Value Summary
112.73 121.20 112.34H EUR- 106.34 98.26HC EUR
112.59 121.16 112.49HI CHF114.90 124.15 115.73HI EUR
- - 93.32HI GBP- - 91.99HN CHF- - 92.20HN EUR- 102.30 95.57HS CHF- 107.71 101.05HS EUR
117.18 129.10 123.65I USD116.85 128.68 123.21N USD124.94 137.98 132.49R USD118.39 131.22 126.44S USD
- - 96.81U1 USDGlobal Bond USD 47,717,574 58,009,223 55,029,749 105.06 103.56 100.31HI CHF
105.68 104.42 101.64HI EUR104.63 103.37 100.49HS CHF
- 99.99 97.73HS EUR106.75 107.17 107.01I USD
Absolute Return Credit Fund USD 33,516,909 24,797,820 22,010,701 104.74 109.96 110.88X USDGlobal Corporate Bond MidYield
USD 91,103,606 140,887,088 188,316,410 104.14 106.42 103.69A USD
103.55 103.61 97.99AH CHF103.79 104.23 99.21AH EUR103.98 105.56 103.15AHI EUR
- - 97.32AHN CHF- - 97.73AHN EUR- - 100.17AN USD
104.13 107.21 106.99B USD103.98 106.52 105.78C USD107.81 111.99 112.75G USD103.76 105.10 102.20H EUR103.61 104.49 101.22HC EUR
- - 100.95HG CHF106.88 108.91 106.90HG EUR103.79 105.09 102.35HI CHF103.95 105.64 103.33HI EUR
- - 97.16HN EUR104.33 108.01 108.43I USD
- - 100.17N USD102.22 106.12 106.71R USD
Emerging Markets Blend USD 10,092,906 20,724,034 64,181,954 117.76 140.02 135.92X USDEmerging Markets CorporateBond
USD 9,422,847 44,663,083 151,511,891 - - 95.54B USD
- - 94.38HI EUR120.79 136.96 138.76I USD
- - 95.83N USD- 101.11 102.68R USD
TwentyFour Absolute ReturnCredit Fund
GBP 79,851,391 788,814,328 1,447,463,829 104.30 104.66 99.40AH CHF
104.41 105.28 100.54AH EUR105.04 109.71 107.10AH USD
- 101.71 99.56AHI EUR- - 98.81AHN CHF- - 99.57AHN EUR
105.90 104.53 99.56AI GBP106.00 - -AN GBP
- 105.09 103.08AQG GBP- 101.94 98.96AQHG EUR- - 101.07AQHG USD
104.40 104.25 101.00AQHN EUR104.11 103.65 102.89AQHNG USD105.23 109.37 108.14AQN GBP105.84 104.70 102.72AQNG GBP
- 98.63 -C EUR106.06 110.43 111.09G GBP
- 103.07 101.85H EUR- - 98.66HC EUR- 101.54 100.32HI CHF
31.08.2016 31.08.2017 31.08.2018 31.08.2016 31.08.2017 31.08.2018
NET ASSETS NET ASSET VALUE PER SHAREVontobel Fund –
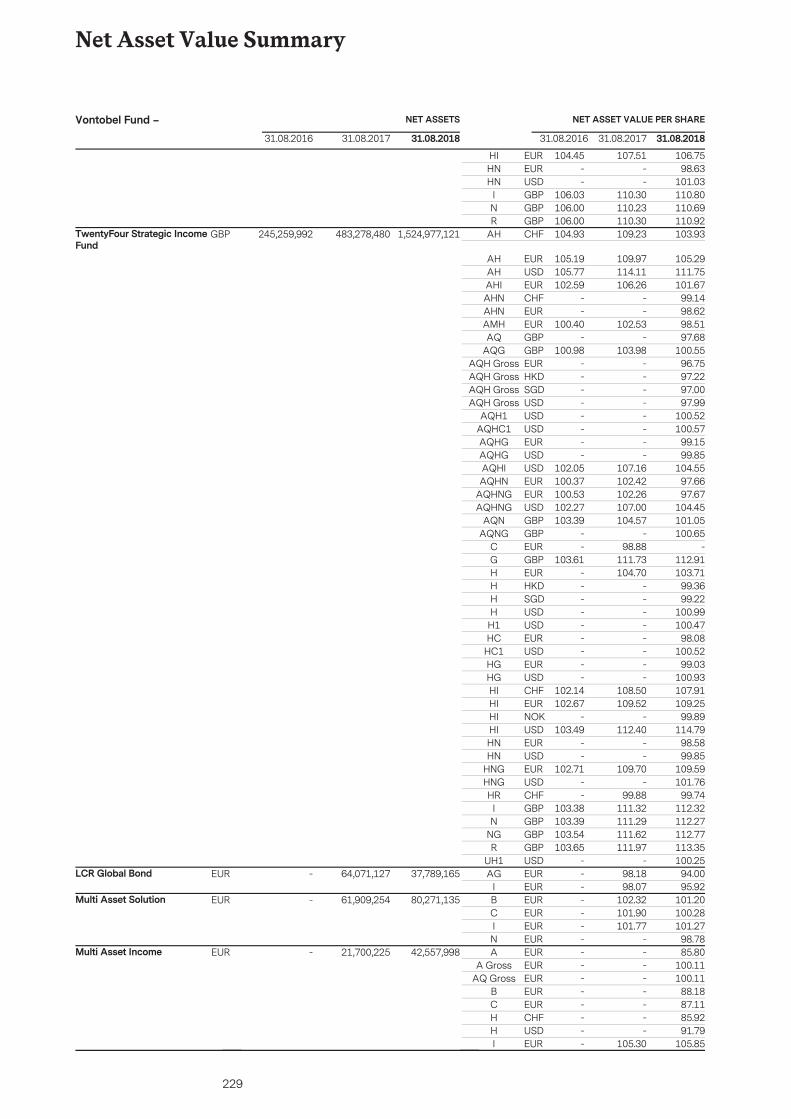
229
Net Asset Value Summary
104.45 107.51 106.75HI EUR- - 98.63HN EUR- - 101.03HN USD
106.03 110.30 110.80I GBP106.00 110.23 110.69N GBP106.00 110.30 110.92R GBP
TwentyFour Strategic IncomeFund
GBP 245,259,992 483,278,480 1,524,977,121 104.93 109.23 103.93AH CHF
105.19 109.97 105.29AH EUR105.77 114.11 111.75AH USD102.59 106.26 101.67AHI EUR
- - 99.14AHN CHF- - 98.62AHN EUR
100.40 102.53 98.51AMH EUR- - 97.68AQ GBP
100.98 103.98 100.55AQG GBP- - 96.75AQH Gross EUR- - 97.22AQH Gross HKD- - 97.00AQH Gross SGD- - 97.99AQH Gross USD- - 100.52AQH1 USD- - 100.57AQHC1 USD- - 99.15AQHG EUR- - 99.85AQHG USD
102.05 107.16 104.55AQHI USD100.37 102.42 97.66AQHN EUR100.53 102.26 97.67AQHNG EUR102.27 107.00 104.45AQHNG USD103.39 104.57 101.05AQN GBP
- - 100.65AQNG GBP- 98.88 -C EUR
103.61 111.73 112.91G GBP- 104.70 103.71H EUR- - 99.36H HKD- - 99.22H SGD- - 100.99H USD- - 100.47H1 USD- - 98.08HC EUR- - 100.52HC1 USD- - 99.03HG EUR- - 100.93HG USD
102.14 108.50 107.91HI CHF102.67 109.52 109.25HI EUR
- - 99.89HI NOK103.49 112.40 114.79HI USD
- - 98.58HN EUR- - 99.85HN USD
102.71 109.70 109.59HNG EUR- - 101.76HNG USD- 99.88 99.74HR CHF
103.38 111.32 112.32I GBP103.39 111.29 112.27N GBP103.54 111.62 112.77NG GBP103.65 111.97 113.35R GBP
- - 100.25UH1 USDLCR Global Bond EUR - 64,071,127 37,789,165 - 98.18 94.00AG EUR
- 98.07 95.92I EURMulti Asset Solution EUR - 61,909,254 80,271,135 - 102.32 101.20B EUR
- 101.90 100.28C EUR- 101.77 101.27I EUR- - 98.78N EUR
Multi Asset Income EUR - 21,700,225 42,557,998 - - 85.80A EUR- - 100.11A Gross EUR- - 100.11AQ Gross EUR- - 88.18B EUR- - 87.11C EUR- - 85.92H CHF- - 91.79H USD- 105.30 105.85I EUR
31.08.2016 31.08.2017 31.08.2018 31.08.2016 31.08.2017 31.08.2018
NET ASSETS NET ASSET VALUE PER SHAREVontobel Fund –
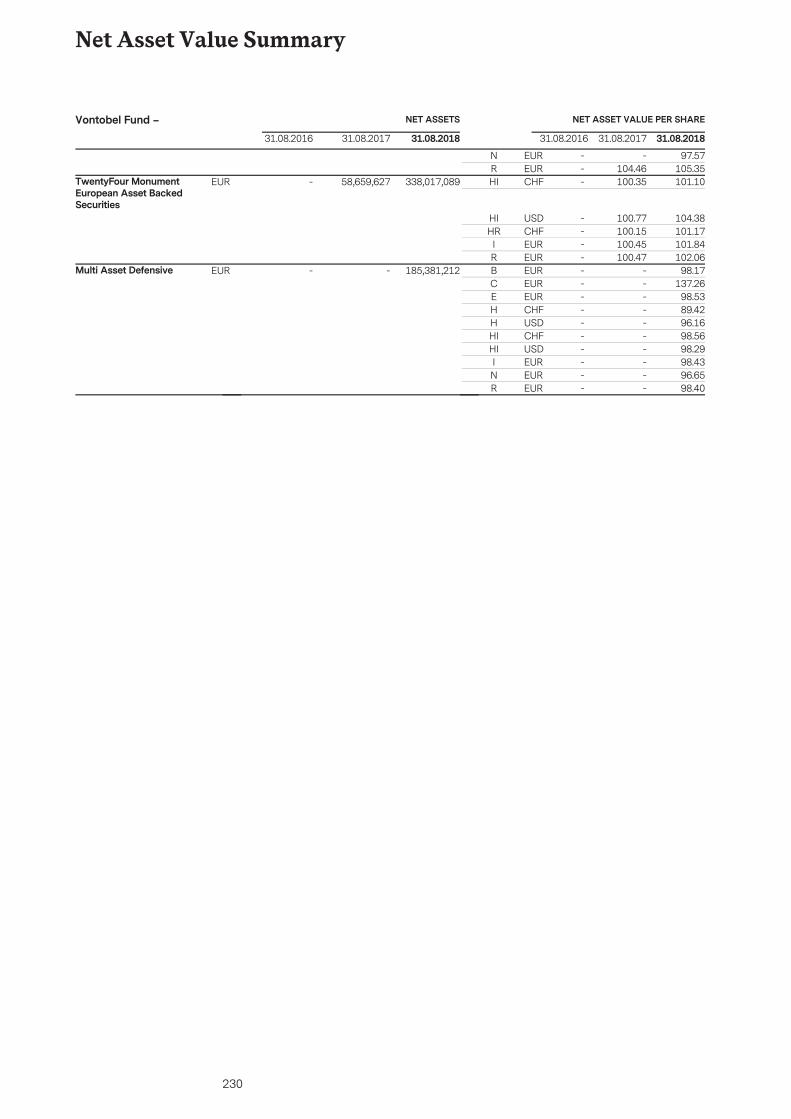
230
Net Asset Value Summary
- - 97.57N EUR- 104.46 105.35R EUR
TwentyFour MonumentEuropean Asset BackedSecurities
EUR - 58,659,627 338,017,089 - 100.35 101.10HI CHF
- 100.77 104.38HI USD- 100.15 101.17HR CHF- 100.45 101.84I EUR- 100.47 102.06R EUR
Multi Asset Defensive EUR - - 185,381,212 - - 98.17B EUR- - 137.26C EUR- - 98.53E EUR- - 89.42H CHF- - 96.16H USD- - 98.56HI CHF- - 98.29HI USD- - 98.43I EUR- - 96.65N EUR- - 98.40R EUR
31.08.2016 31.08.2017 31.08.2018 31.08.2016 31.08.2017 31.08.2018
NET ASSETS NET ASSET VALUE PER SHAREVontobel Fund –
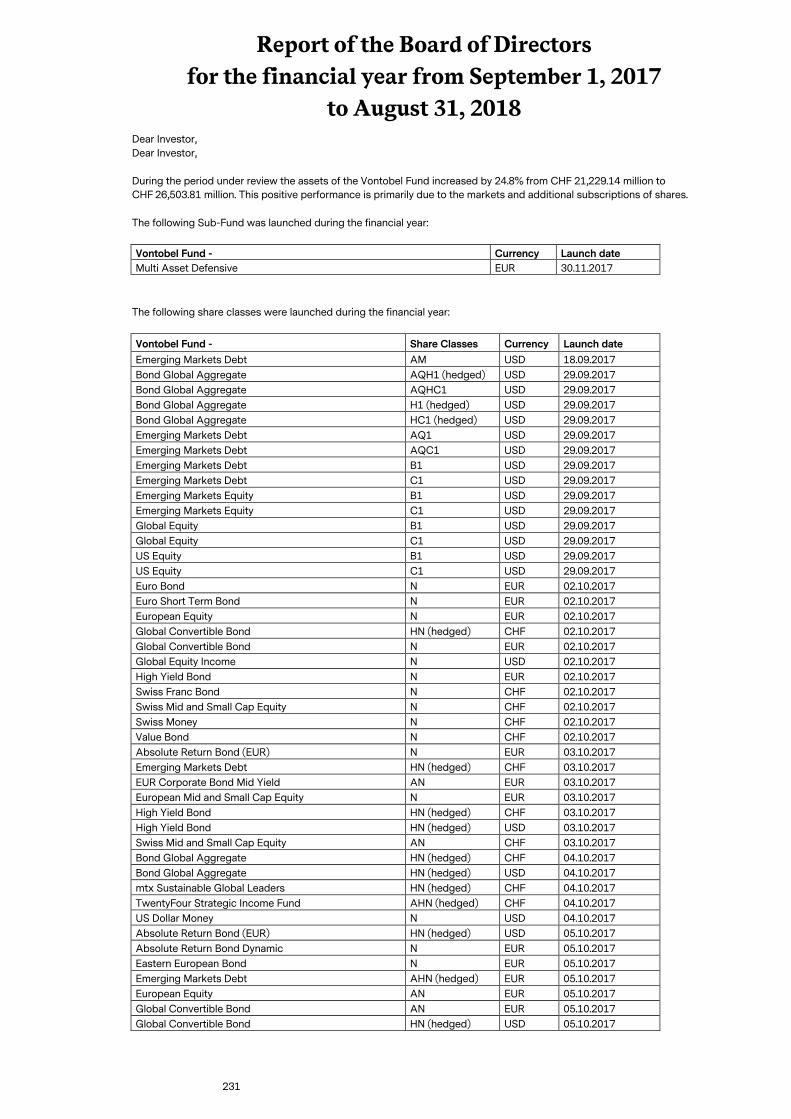
Report of the Board of Directors
for the financial year from September 1, 2017
to August 31, 2018
231
Dear Investor,
Dear Investor,
During the period under review the assets of the Vontobel Fund increased by 24.8% from CHF 21,229.14 million to
CHF 26,503.81 million. This positive performance is primarily due to the markets and additional subscriptions of shares.
The following Sub-Fund was launched during the financial year:
Vontobel Fund - Currency Launch date
Multi Asset Defensive EUR 30.11.2017
The following share classes were launched during the financial year:
Vontobel Fund - Share Classes Currency Launch date
Emerging Markets Debt AM USD 18.09.2017
Bond Global Aggregate AQH1 (hedged) USD 29.09.2017
Bond Global Aggregate AQHC1 USD 29.09.2017
Bond Global Aggregate H1 (hedged) USD 29.09.2017
Bond Global Aggregate HC1 (hedged) USD 29.09.2017
Emerging Markets Debt AQ1 USD 29.09.2017
Emerging Markets Debt AQC1 USD 29.09.2017
Emerging Markets Debt B1 USD 29.09.2017
Emerging Markets Debt C1 USD 29.09.2017
Emerging Markets Equity B1 USD 29.09.2017
Emerging Markets Equity C1 USD 29.09.2017
Global Equity B1 USD 29.09.2017
Global Equity C1 USD 29.09.2017
US Equity B1 USD 29.09.2017
US Equity C1 USD 29.09.2017
Euro Bond N EUR 02.10.2017
Euro Short Term Bond N EUR 02.10.2017
European Equity N EUR 02.10.2017
Global Convertible Bond HN (hedged) CHF 02.10.2017
Global Convertible Bond N EUR 02.10.2017
Global Equity Income N USD 02.10.2017
High Yield Bond N EUR 02.10.2017
Swiss Franc Bond N CHF 02.10.2017
Swiss Mid and Small Cap Equity N CHF 02.10.2017
Swiss Money N CHF 02.10.2017
Value Bond N CHF 02.10.2017
Absolute Return Bond (EUR) N EUR 03.10.2017
Emerging Markets Debt HN (hedged) CHF 03.10.2017
EUR Corporate Bond Mid Yield AN EUR 03.10.2017
European Mid and Small Cap Equity N EUR 03.10.2017
High Yield Bond HN (hedged) CHF 03.10.2017
High Yield Bond HN (hedged) USD 03.10.2017
Swiss Mid and Small Cap Equity AN CHF 03.10.2017
Bond Global Aggregate HN (hedged) CHF 04.10.2017
Bond Global Aggregate HN (hedged) USD 04.10.2017
mtx Sustainable Global Leaders HN (hedged) CHF 04.10.2017
TwentyFour Strategic Income Fund AHN (hedged) CHF 04.10.2017
US Dollar Money N USD 04.10.2017
Absolute Return Bond (EUR) HN (hedged) USD 05.10.2017
Absolute Return Bond Dynamic N EUR 05.10.2017
Eastern European Bond N EUR 05.10.2017
Emerging Markets Debt AHN (hedged) EUR 05.10.2017
European Equity AN EUR 05.10.2017
Global Convertible Bond AN EUR 05.10.2017
Global Convertible Bond HN (hedged) USD 05.10.2017
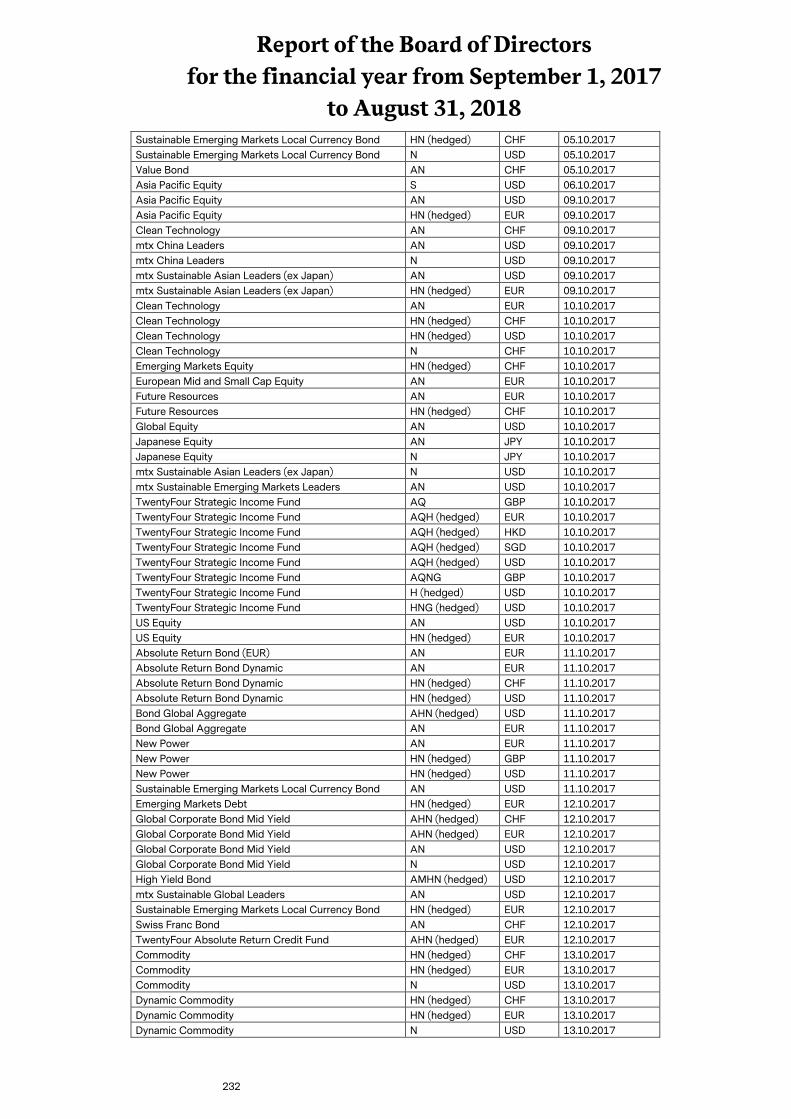
Report of the Board of Directors
for the financial year from September 1, 2017
to August 31, 2018
232
Sustainable Emerging Markets Local Currency Bond HN (hedged) CHF 05.10.2017
Sustainable Emerging Markets Local Currency Bond N USD 05.10.2017
Value Bond AN CHF 05.10.2017
Asia Pacific Equity S USD 06.10.2017
Asia Pacific Equity AN USD 09.10.2017
Asia Pacific Equity HN (hedged) EUR 09.10.2017
Clean Technology AN CHF 09.10.2017
mtx China Leaders AN USD 09.10.2017
mtx China Leaders N USD 09.10.2017
mtx Sustainable Asian Leaders (ex Japan) AN USD 09.10.2017
mtx Sustainable Asian Leaders (ex Japan) HN (hedged) EUR 09.10.2017
Clean Technology AN EUR 10.10.2017
Clean Technology HN (hedged) CHF 10.10.2017
Clean Technology HN (hedged) USD 10.10.2017
Clean Technology N CHF 10.10.2017
Emerging Markets Equity HN (hedged) CHF 10.10.2017
European Mid and Small Cap Equity AN EUR 10.10.2017
Future Resources AN EUR 10.10.2017
Future Resources HN (hedged) CHF 10.10.2017
Global Equity AN USD 10.10.2017
Japanese Equity AN JPY 10.10.2017
Japanese Equity N JPY 10.10.2017
mtx Sustainable Asian Leaders (ex Japan) N USD 10.10.2017
mtx Sustainable Emerging Markets Leaders AN USD 10.10.2017
TwentyFour Strategic Income Fund AQ GBP 10.10.2017
TwentyFour Strategic Income Fund AQH (hedged) EUR 10.10.2017
TwentyFour Strategic Income Fund AQH (hedged) HKD 10.10.2017
TwentyFour Strategic Income Fund AQH (hedged) SGD 10.10.2017
TwentyFour Strategic Income Fund AQH (hedged) USD 10.10.2017
TwentyFour Strategic Income Fund AQNG GBP 10.10.2017
TwentyFour Strategic Income Fund H (hedged) USD 10.10.2017
TwentyFour Strategic Income Fund HNG (hedged) USD 10.10.2017
US Equity AN USD 10.10.2017
US Equity HN (hedged) EUR 10.10.2017
Absolute Return Bond (EUR) AN EUR 11.10.2017
Absolute Return Bond Dynamic AN EUR 11.10.2017
Absolute Return Bond Dynamic HN (hedged) CHF 11.10.2017
Absolute Return Bond Dynamic HN (hedged) USD 11.10.2017
Bond Global Aggregate AHN (hedged) USD 11.10.2017
Bond Global Aggregate AN EUR 11.10.2017
New Power AN EUR 11.10.2017
New Power HN (hedged) GBP 11.10.2017
New Power HN (hedged) USD 11.10.2017
Sustainable Emerging Markets Local Currency Bond AN USD 11.10.2017
Emerging Markets Debt HN (hedged) EUR 12.10.2017
Global Corporate Bond Mid Yield AHN (hedged) CHF 12.10.2017
Global Corporate Bond Mid Yield AHN (hedged) EUR 12.10.2017
Global Corporate Bond Mid Yield AN USD 12.10.2017
Global Corporate Bond Mid Yield N USD 12.10.2017
High Yield Bond AMHN (hedged) USD 12.10.2017
mtx Sustainable Global Leaders AN USD 12.10.2017
Sustainable Emerging Markets Local Currency Bond HN (hedged) EUR 12.10.2017
Swiss Franc Bond AN CHF 12.10.2017
TwentyFour Absolute Return Credit Fund AHN (hedged) EUR 12.10.2017
Commodity HN (hedged) CHF 13.10.2017
Commodity HN (hedged) EUR 13.10.2017
Commodity N USD 13.10.2017
Dynamic Commodity HN (hedged) CHF 13.10.2017
Dynamic Commodity HN (hedged) EUR 13.10.2017
Dynamic Commodity N USD 13.10.2017
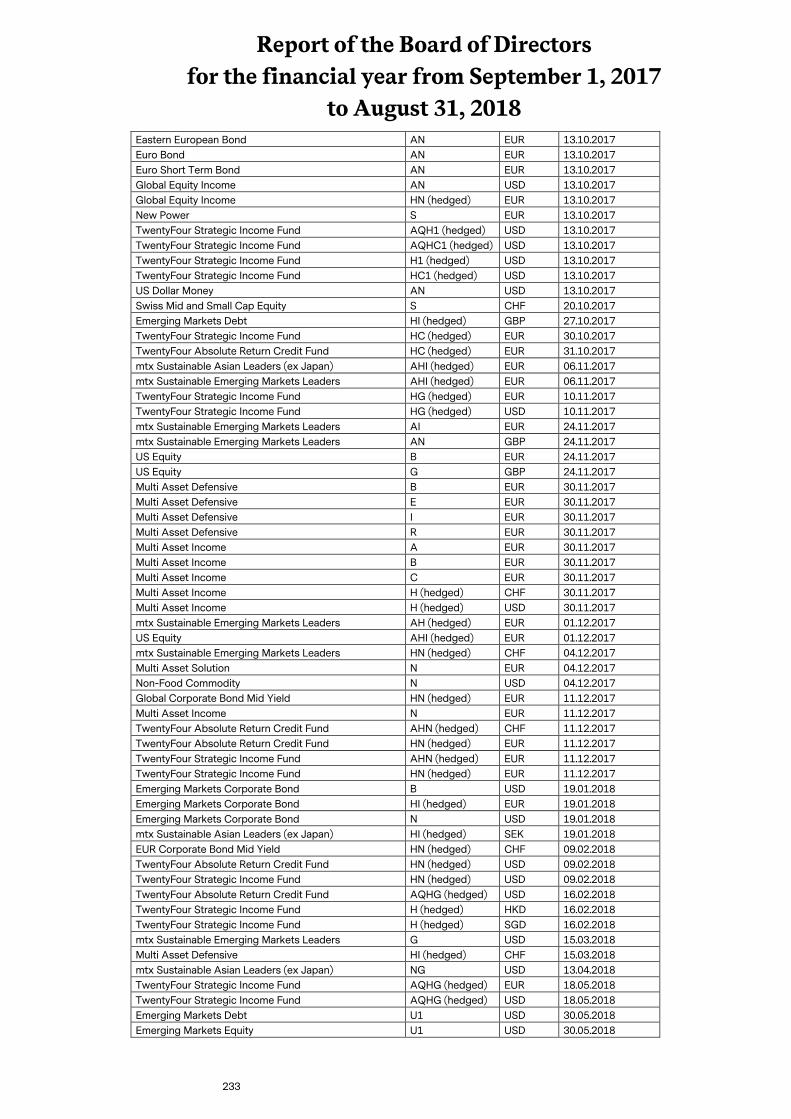
Report of the Board of Directors
for the financial year from September 1, 2017
to August 31, 2018
233
Eastern European Bond AN EUR 13.10.2017
Euro Bond AN EUR 13.10.2017
Euro Short Term Bond AN EUR 13.10.2017
Global Equity Income AN USD 13.10.2017
Global Equity Income HN (hedged) EUR 13.10.2017
New Power S EUR 13.10.2017
TwentyFour Strategic Income Fund AQH1 (hedged) USD 13.10.2017
TwentyFour Strategic Income Fund AQHC1 (hedged) USD 13.10.2017
TwentyFour Strategic Income Fund H1 (hedged) USD 13.10.2017
TwentyFour Strategic Income Fund HC1 (hedged) USD 13.10.2017
US Dollar Money AN USD 13.10.2017
Swiss Mid and Small Cap Equity S CHF 20.10.2017
Emerging Markets Debt HI (hedged) GBP 27.10.2017
TwentyFour Strategic Income Fund HC (hedged) EUR 30.10.2017
TwentyFour Absolute Return Credit Fund HC (hedged) EUR 31.10.2017
mtx Sustainable Asian Leaders (ex Japan) AHI (hedged) EUR 06.11.2017
mtx Sustainable Emerging Markets Leaders AHI (hedged) EUR 06.11.2017
TwentyFour Strategic Income Fund HG (hedged) EUR 10.11.2017
TwentyFour Strategic Income Fund HG (hedged) USD 10.11.2017
mtx Sustainable Emerging Markets Leaders AI EUR 24.11.2017
mtx Sustainable Emerging Markets Leaders AN GBP 24.11.2017
US Equity B EUR 24.11.2017
US Equity G GBP 24.11.2017
Multi Asset Defensive B EUR 30.11.2017
Multi Asset Defensive E EUR 30.11.2017
Multi Asset Defensive I EUR 30.11.2017
Multi Asset Defensive R EUR 30.11.2017
Multi Asset Income A EUR 30.11.2017
Multi Asset Income B EUR 30.11.2017
Multi Asset Income C EUR 30.11.2017
Multi Asset Income H (hedged) CHF 30.11.2017
Multi Asset Income H (hedged) USD 30.11.2017
mtx Sustainable Emerging Markets Leaders AH (hedged) EUR 01.12.2017
US Equity AHI (hedged) EUR 01.12.2017
mtx Sustainable Emerging Markets Leaders HN (hedged) CHF 04.12.2017
Multi Asset Solution N EUR 04.12.2017
Non-Food Commodity N USD 04.12.2017
Global Corporate Bond Mid Yield HN (hedged) EUR 11.12.2017
Multi Asset Income N EUR 11.12.2017
TwentyFour Absolute Return Credit Fund AHN (hedged) CHF 11.12.2017
TwentyFour Absolute Return Credit Fund HN (hedged) EUR 11.12.2017
TwentyFour Strategic Income Fund AHN (hedged) EUR 11.12.2017
TwentyFour Strategic Income Fund HN (hedged) EUR 11.12.2017
Emerging Markets Corporate Bond B USD 19.01.2018
Emerging Markets Corporate Bond HI (hedged) EUR 19.01.2018
Emerging Markets Corporate Bond N USD 19.01.2018
mtx Sustainable Asian Leaders (ex Japan) HI (hedged) SEK 19.01.2018
EUR Corporate Bond Mid Yield HN (hedged) CHF 09.02.2018
TwentyFour Absolute Return Credit Fund HN (hedged) USD 09.02.2018
TwentyFour Strategic Income Fund HN (hedged) USD 09.02.2018
TwentyFour Absolute Return Credit Fund AQHG (hedged) USD 16.02.2018
TwentyFour Strategic Income Fund H (hedged) HKD 16.02.2018
TwentyFour Strategic Income Fund H (hedged) SGD 16.02.2018
mtx Sustainable Emerging Markets Leaders G USD 15.03.2018
Multi Asset Defensive HI (hedged) CHF 15.03.2018
mtx Sustainable Asian Leaders (ex Japan) NG USD 13.04.2018
TwentyFour Strategic Income Fund AQHG (hedged) EUR 18.05.2018
TwentyFour Strategic Income Fund AQHG (hedged) USD 18.05.2018
Emerging Markets Debt U1 USD 30.05.2018
Emerging Markets Equity U1 USD 30.05.2018
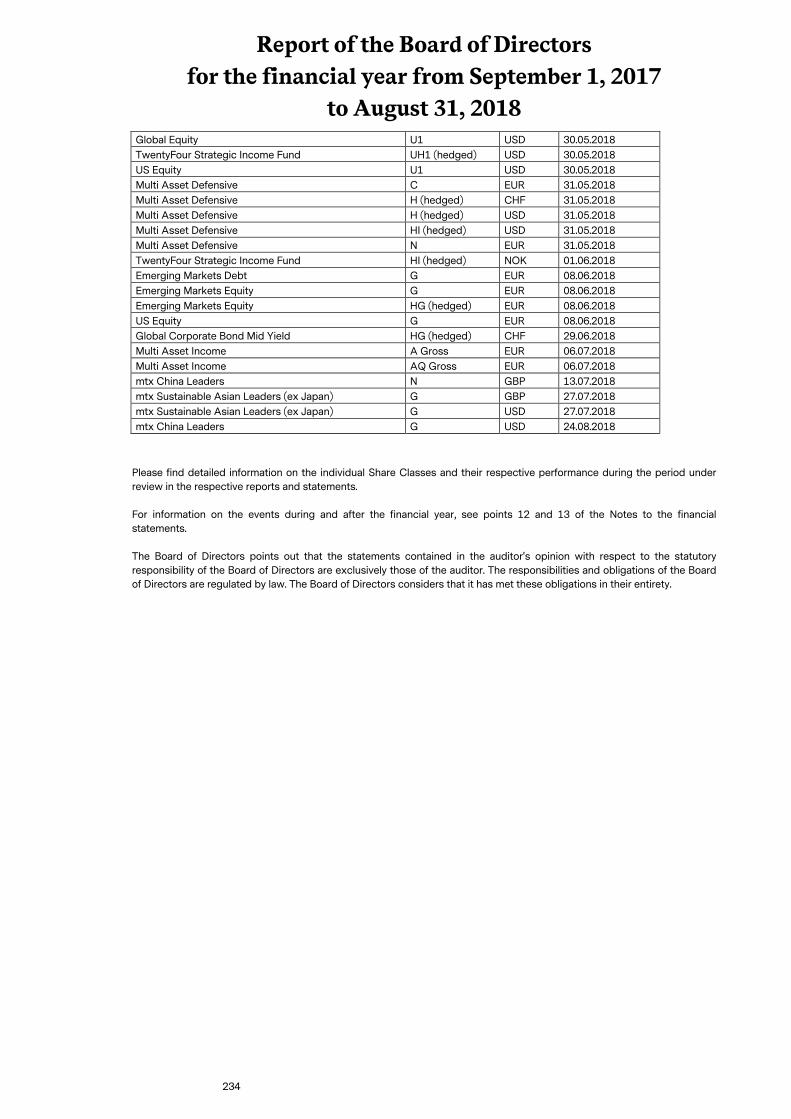
Report of the Board of Directors
for the financial year from September 1, 2017
to August 31, 2018
234
Global Equity U1 USD 30.05.2018
TwentyFour Strategic Income Fund UH1 (hedged) USD 30.05.2018
US Equity U1 USD 30.05.2018
Multi Asset Defensive C EUR 31.05.2018
Multi Asset Defensive H (hedged) CHF 31.05.2018
Multi Asset Defensive H (hedged) USD 31.05.2018
Multi Asset Defensive HI (hedged) USD 31.05.2018
Multi Asset Defensive N EUR 31.05.2018
TwentyFour Strategic Income Fund HI (hedged) NOK 01.06.2018
Emerging Markets Debt G EUR 08.06.2018
Emerging Markets Equity G EUR 08.06.2018
Emerging Markets Equity HG (hedged) EUR 08.06.2018
US Equity G EUR 08.06.2018
Global Corporate Bond Mid Yield HG (hedged) CHF 29.06.2018
Multi Asset Income A Gross EUR 06.07.2018
Multi Asset Income AQ Gross EUR 06.07.2018
mtx China Leaders N GBP 13.07.2018
mtx Sustainable Asian Leaders (ex Japan) G GBP 27.07.2018
mtx Sustainable Asian Leaders (ex Japan) G USD 27.07.2018
mtx China Leaders G USD 24.08.2018
Please find detailed information on the individual Share Classes and their respective performance during the period under
review in the respective reports and statements.
For information on the events during and after the financial year, see points 12 and 13 of the Notes to the financial
statements.
The Board of Directors points out that the statements contained in the auditor's opinion with respect to the statutory
responsibility of the Board of Directors are exclusively those of the auditor. The responsibilities and obligations of the Board
of Directors are regulated by law. The Board of Directors considers that it has met these obligations in their entirety.
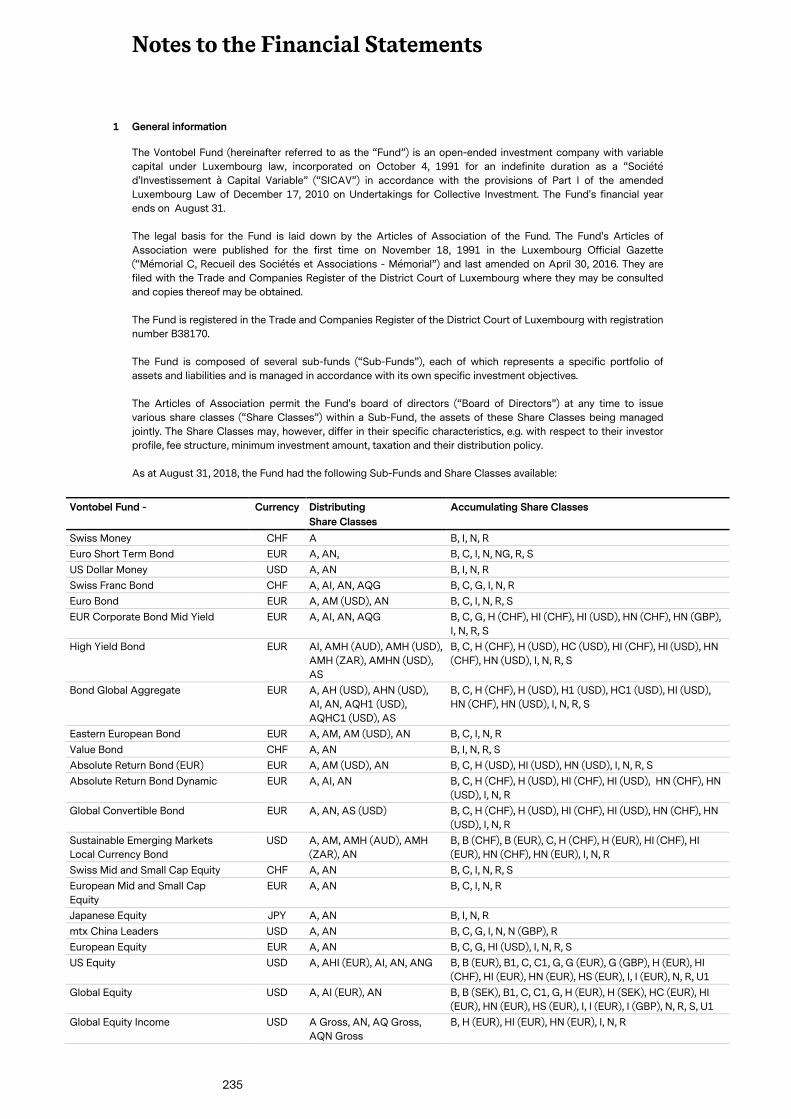
Notes to the Financial Statements
235
1 General information
The Vontobel Fund (hereinafter referred to as the “Fund”) is an open-ended investment company with variable
capital under Luxembourg law, incorporated on October 4, 1991 for an indefinite duration as a “Société
d'Investissement à Capital Variable” (“SICAV”) in accordance with the provisions of Part I of the amended
Luxembourg Law of December 17, 2010 on Undertakings for Collective Investment. The Fund's financial year
ends on August 31.
The legal basis for the Fund is laid down by the Articles of Association of the Fund. The Fund's Articles of
Association were published for the first time on November 18, 1991 in the Luxembourg Official Gazette
(“Mémorial C, Recueil des Sociétés et Associations - Mémorial”) and last amended on April 30, 2016. They are
filed with the Trade and Companies Register of the District Court of Luxembourg where they may be consulted
and copies thereof may be obtained.
The Fund is registered in the Trade and Companies Register of the District Court of Luxembourg with registration
number B38170.
The Fund is composed of several sub-funds (“Sub-Funds”), each of which represents a specific portfolio of
assets and liabilities and is managed in accordance with its own specific investment objectives.
The Articles of Association permit the Fund's board of directors (“Board of Directors”) at any time to issue
various share classes (“Share Classes”) within a Sub-Fund, the assets of these Share Classes being managed
jointly. The Share Classes may, however, differ in their specific characteristics, e.g. with respect to their investor
profile, fee structure, minimum investment amount, taxation and their distribution policy.
As at August 31, 2018, the Fund had the following Sub-Funds and Share Classes available:
Vontobel Fund - Currency Distributing
Share Classes
Accumulating Share Classes
Swiss Money CHF A B, I, N, R
Euro Short Term Bond EUR A, AN, B, C, I, N, NG, R, S
US Dollar Money USD A, AN B, I, N, R
Swiss Franc Bond CHF A, AI, AN, AQG B, C, G, I, N, R
Euro Bond EUR A, AM (USD), AN B, C, I, N, R, S
EUR Corporate Bond Mid Yield EUR A, AI, AN, AQG B, C, G, H (CHF), HI (CHF), HI (USD), HN (CHF), HN (GBP),
I, N, R, S
High Yield Bond EUR AI, AMH (AUD), AMH (USD),
AMH (ZAR), AMHN (USD),
AS
B, C, H (CHF), H (USD), HC (USD), HI (CHF), HI (USD), HN
(CHF), HN (USD), I, N, R, S
Bond Global Aggregate EUR A, AH (USD), AHN (USD),
AI, AN, AQH1 (USD),
AQHC1 (USD), AS
B, C, H (CHF), H (USD), H1 (USD), HC1 (USD), HI (USD),
HN (CHF), HN (USD), I, N, R, S
Eastern European Bond EUR A, AM, AM (USD), AN B, C, I, N, R
Value Bond CHF A, AN B, I, N, R, S
Absolute Return Bond (EUR) EUR A, AM (USD), AN B, C, H (USD), HI (USD), HN (USD), I, N, R, S
Absolute Return Bond Dynamic EUR A, AI, AN B, C, H (CHF), H (USD), HI (CHF), HI (USD), HN (CHF), HN
(USD), I, N, R
Global Convertible Bond EUR A, AN, AS (USD) B, C, H (CHF), H (USD), HI (CHF), HI (USD), HN (CHF), HN
(USD), I, N, R
Sustainable Emerging Markets
Local Currency Bond
USD A, AM, AMH (AUD), AMH
(ZAR), AN
B, B (CHF), B (EUR), C, H (CHF), H (EUR), HI (CHF), HI
(EUR), HN (CHF), HN (EUR), I, N, R
Swiss Mid and Small Cap Equity CHF A, AN B, C, I, N, R, S
European Mid and Small Cap
Equity
EUR A, AN B, C, I, N, R
Japanese Equity JPY A, AN B, I, N, R
mtx China Leaders USD A, AN B, C, G, I, N, N (GBP), R
European Equity EUR A, AN B, C, G, HI (USD), I, N, R, S
US Equity USD A, AHI (EUR), AI, AN, ANG B, B (EUR), B1, C, C1, G, G (EUR), G (GBP), H (EUR), HI
(CHF), HI (EUR), HN (EUR), HS (EUR), I, I (EUR), N, R, U1
Global Equity USD A, AI (EUR), AN B, B (SEK), B1, C, C1, G, H (EUR), H (SEK), HC (EUR), HI
(EUR), HN (EUR), HS (EUR), I, I (EUR), I (GBP), N, R, S, U1
Global Equity Income USD A Gross, AN, AQ Gross,
AQN Gross
B, H (EUR), HI (EUR), HN (EUR), I, N, R
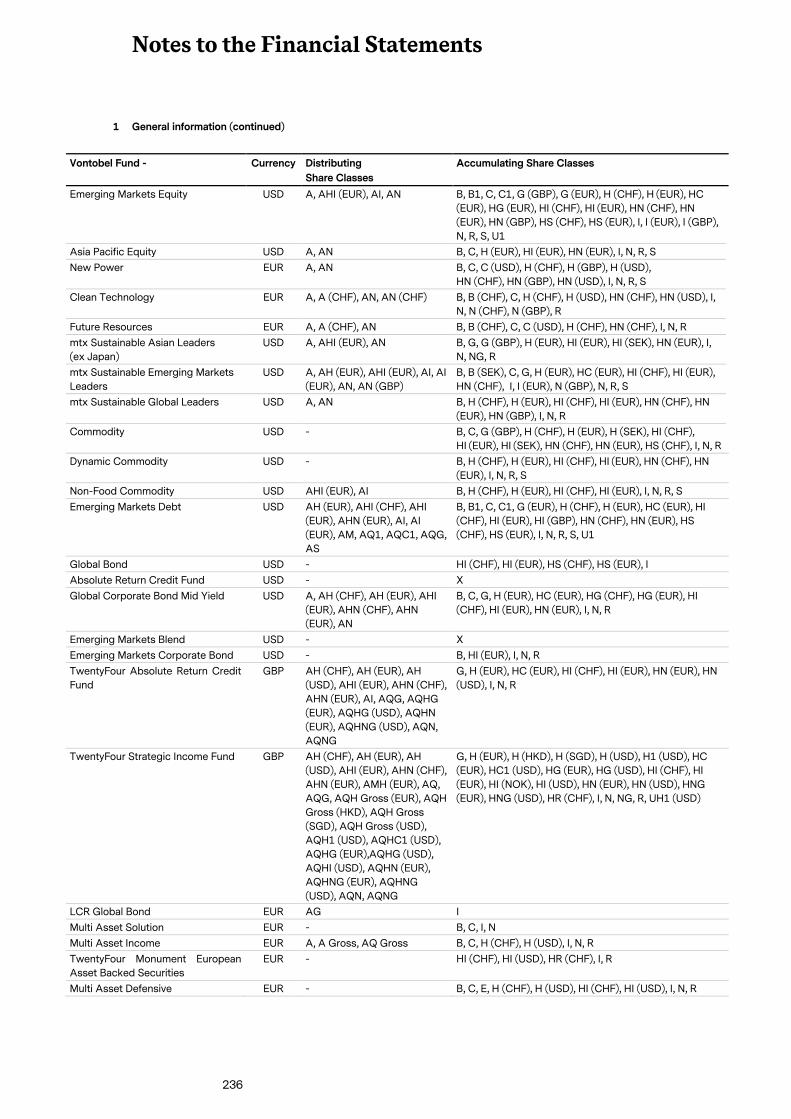
Notes to the Financial Statements
236
1 General information (continued)
Vontobel Fund - Currency Distributing
Share Classes
Accumulating Share Classes
Emerging Markets Equity USD A, AHI (EUR), AI, AN B, B1, C, C1, G (GBP), G (EUR), H (CHF), H (EUR), HC
(EUR), HG (EUR), HI (CHF), HI (EUR), HN (CHF), HN
(EUR), HN (GBP), HS (CHF), HS (EUR), I, I (EUR), I (GBP),
N, R, S, U1
Asia Pacific Equity USD A, AN B, C, H (EUR), HI (EUR), HN (EUR), I, N, R, S
New Power EUR A, AN B, C, C (USD), H (CHF), H (GBP), H (USD),
HN (CHF), HN (GBP), HN (USD), I, N, R, S
Clean Technology EUR A, A (CHF), AN, AN (CHF) B, B (CHF), C, H (CHF), H (USD), HN (CHF), HN (USD), I,
N, N (CHF), N (GBP), R
Future Resources EUR A, A (CHF), AN B, B (CHF), C, C (USD), H (CHF), HN (CHF), I, N, R
mtx Sustainable Asian Leaders
(ex Japan)
USD A, AHI (EUR), AN B, G, G (GBP), H (EUR), HI (EUR), HI (SEK), HN (EUR), I,
N, NG, R
mtx Sustainable Emerging Markets
Leaders
USD A, AH (EUR), AHI (EUR), AI, AI
(EUR), AN, AN (GBP)
B, B (SEK), C, G, H (EUR), HC (EUR), HI (CHF), HI (EUR),
HN (CHF), I, I (EUR), N (GBP), N, R, S
mtx Sustainable Global Leaders USD A, AN B, H (CHF), H (EUR), HI (CHF), HI (EUR), HN (CHF), HN
(EUR), HN (GBP), I, N, R
Commodity USD - B, C, G (GBP), H (CHF), H (EUR), H (SEK), HI (CHF),
HI (EUR), HI (SEK), HN (CHF), HN (EUR), HS (CHF), I, N, R
Dynamic Commodity USD - B, H (CHF), H (EUR), HI (CHF), HI (EUR), HN (CHF), HN
(EUR), I, N, R, S
Non-Food Commodity USD AHI (EUR), AI B, H (CHF), H (EUR), HI (CHF), HI (EUR), I, N, R, S
Emerging Markets Debt USD AH (EUR), AHI (CHF), AHI
(EUR), AHN (EUR), AI, AI
(EUR), AM, AQ1, AQC1, AQG,
AS
B, B1, C, C1, G (EUR), H (CHF), H (EUR), HC (EUR), HI
(CHF), HI (EUR), HI (GBP), HN (CHF), HN (EUR), HS
(CHF), HS (EUR), I, N, R, S, U1
Global Bond USD - HI (CHF), HI (EUR), HS (CHF), HS (EUR), I
Absolute Return Credit Fund USD - X
Global Corporate Bond Mid Yield USD A, AH (CHF), AH (EUR), AHI
(EUR), AHN (CHF), AHN
(EUR), AN
B, C, G, H (EUR), HC (EUR), HG (CHF), HG (EUR), HI
(CHF), HI (EUR), HN (EUR), I, N, R
Emerging Markets Blend USD - X
Emerging Markets Corporate Bond USD - B, HI (EUR), I, N, R
TwentyFour Absolute Return Credit
Fund
GBP AH (CHF), AH (EUR), AH
(USD), AHI (EUR), AHN (CHF),
AHN (EUR), AI, AQG, AQHG
(EUR), AQHG (USD), AQHN
(EUR), AQHNG (USD), AQN,
AQNG
G, H (EUR), HC (EUR), HI (CHF), HI (EUR), HN (EUR), HN
(USD), I, N, R
TwentyFour Strategic Income Fund GBP AH (CHF), AH (EUR), AH
(USD), AHI (EUR), AHN (CHF),
AHN (EUR), AMH (EUR), AQ,
AQG, AQH Gross (EUR), AQH
Gross (HKD), AQH Gross
(SGD), AQH Gross (USD),
AQH1 (USD), AQHC1 (USD),
AQHG (EUR),AQHG (USD),
AQHI (USD), AQHN (EUR),
AQHNG (EUR), AQHNG
(USD), AQN, AQNG
G, H (EUR), H (HKD), H (SGD), H (USD), H1 (USD), HC
(EUR), HC1 (USD), HG (EUR), HG (USD), HI (CHF), HI
(EUR), HI (NOK), HI (USD), HN (EUR), HN (USD), HNG
(EUR), HNG (USD), HR (CHF), I, N, NG, R, UH1 (USD)
LCR Global Bond EUR AG I
Multi Asset Solution EUR - B, C, I, N
Multi Asset Income EUR A, A Gross, AQ Gross B, C, H (CHF), H (USD), I, N, R
TwentyFour Monument European
Asset Backed Securities
EUR - HI (CHF), HI (USD), HR (CHF), I, R
Multi Asset Defensive EUR - B, C, E, H (CHF), H (USD), HI (CHF), HI (USD), I, N, R
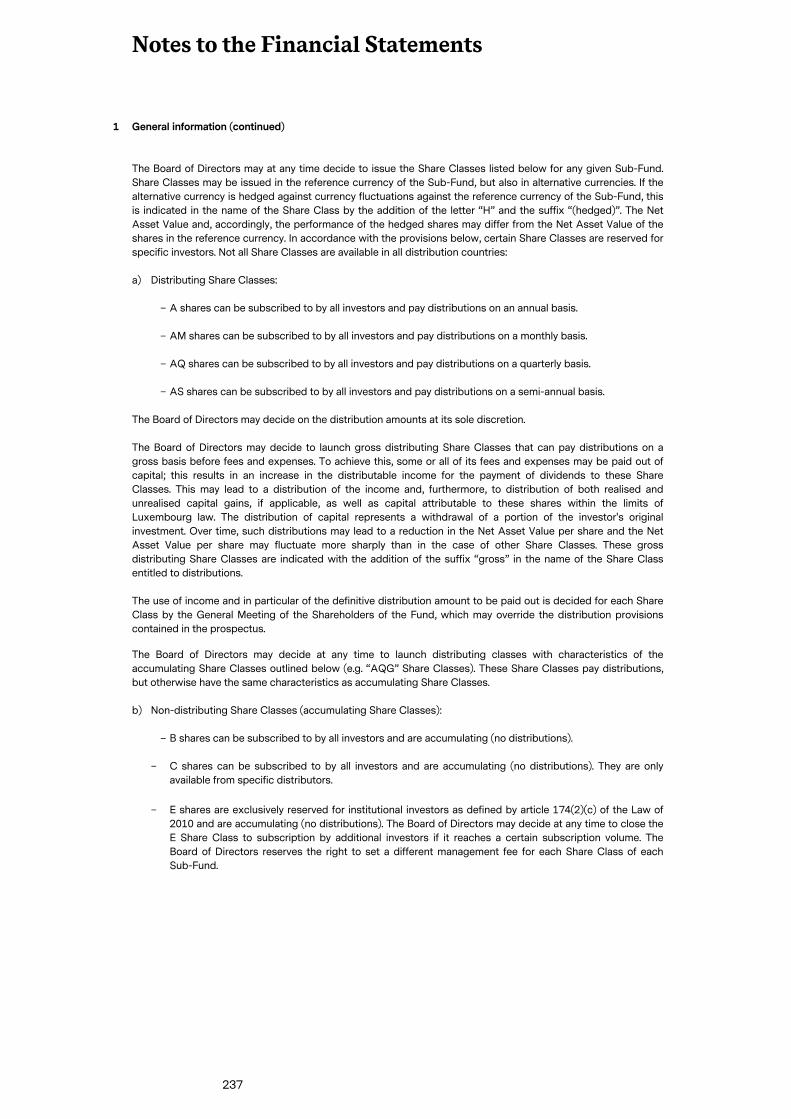
Notes to the Financial Statements
237
1 General information (continued)
The Board of Directors may at any time decide to issue the Share Classes listed below for any given Sub-Fund.
Share Classes may be issued in the reference currency of the Sub-Fund, but also in alternative currencies. If the
alternative currency is hedged against currency fluctuations against the reference currency of the Sub-Fund, this
is indicated in the name of the Share Class by the addition of the letter “H” and the suffix “(hedged)”. The Net
Asset Value and, accordingly, the performance of the hedged shares may differ from the Net Asset Value of the
shares in the reference currency. In accordance with the provisions below, certain Share Classes are reserved for
specific investors. Not all Share Classes are available in all distribution countries:
a) Distributing Share Classes:
− A shares can be subscribed to by all investors and pay distributions on an annual basis.
− AM shares can be subscribed to by all investors and pay distributions on a monthly basis.
− AQ shares can be subscribed to by all investors and pay distributions on a quarterly basis.
− AS shares can be subscribed to by all investors and pay distributions on a semi-annual basis.
The Board of Directors may decide on the distribution amounts at its sole discretion.
The Board of Directors may decide to launch gross distributing Share Classes that can pay distributions on a
gross basis before fees and expenses. To achieve this, some or all of its fees and expenses may be paid out of
capital; this results in an increase in the distributable income for the payment of dividends to these Share
Classes. This may lead to a distribution of the income and, furthermore, to distribution of both realised and
unrealised capital gains, if applicable, as well as capital attributable to these shares within the limits of
Luxembourg law. The distribution of capital represents a withdrawal of a portion of the investor's original
investment. Over time, such distributions may lead to a reduction in the Net Asset Value per share and the Net
Asset Value per share may fluctuate more sharply than in the case of other Share Classes. These gross
distributing Share Classes are indicated with the addition of the suffix “gross” in the name of the Share Class
entitled to distributions.
The use of income and in particular of the definitive distribution amount to be paid out is decided for each Share
Class by the General Meeting of the Shareholders of the Fund, which may override the distribution provisions
contained in the prospectus.
The Board of Directors may decide at any time to launch distributing classes with characteristics of the
accumulating Share Classes outlined below (e.g. “AQG” Share Classes). These Share Classes pay distributions,
but otherwise have the same characteristics as accumulating Share Classes.
b) Non-distributing Share Classes (accumulating Share Classes):
− B shares can be subscribed to by all investors and are accumulating (no distributions).
− C shares can be subscribed to by all investors and are accumulating (no distributions). They are only
available from specific distributors.
− E shares are exclusively reserved for institutional investors as defined by article 174(2)(c) of the Law of
2010 and are accumulating (no distributions). The Board of Directors may decide at any time to close the
E Share Class to subscription by additional investors if it reaches a certain subscription volume. The
Board of Directors reserves the right to set a different management fee for each Share Class of each
Sub-Fund.
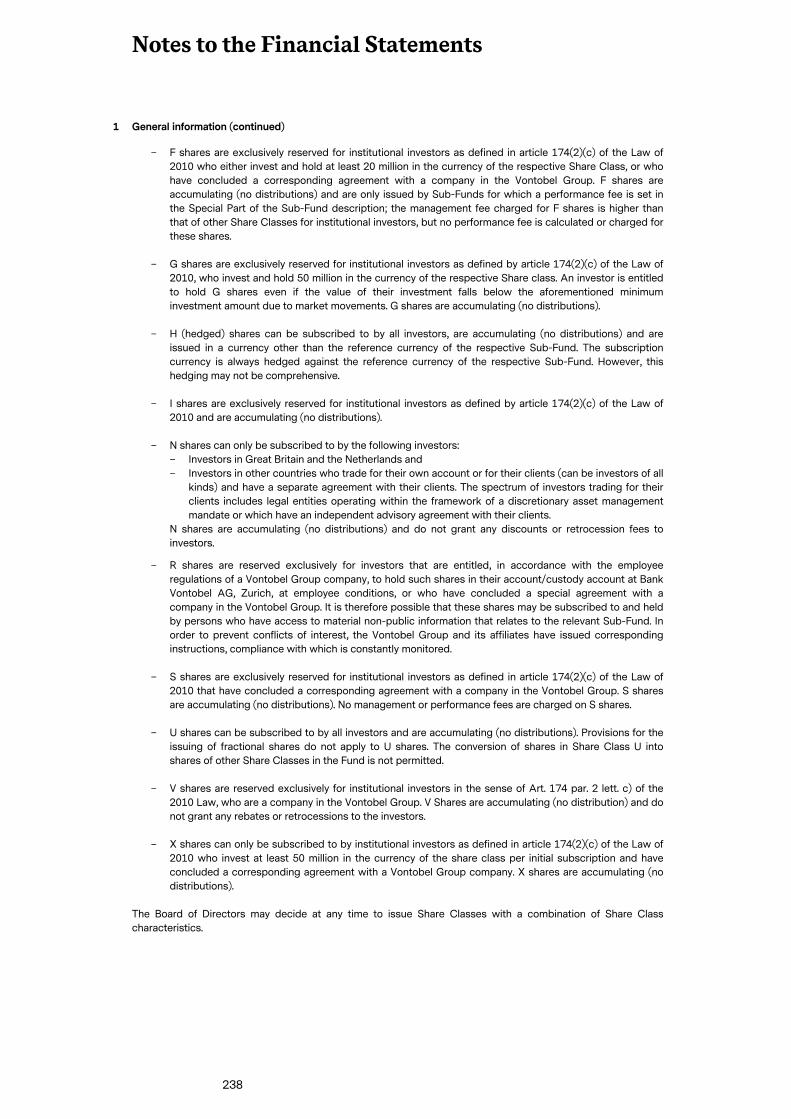
Notes to the Financial Statements
238
1 General information (continued)
− F shares are exclusively reserved for institutional investors as defined in article 174(2)(c) of the Law of
2010 who either invest and hold at least 20 million in the currency of the respective Share Class, or who
have concluded a corresponding agreement with a company in the Vontobel Group. F shares are
accumulating (no distributions) and are only issued by Sub-Funds for which a performance fee is set in
the Special Part of the Sub-Fund description; the management fee charged for F shares is higher than
that of other Share Classes for institutional investors, but no performance fee is calculated or charged for
these shares.
− G shares are exclusively reserved for institutional investors as defined by article 174(2)(c) of the Law of
2010, who invest and hold 50 million in the currency of the respective Share class. An investor is entitled
to hold G shares even if the value of their investment falls below the aforementioned minimum
investment amount due to market movements. G shares are accumulating (no distributions).
− H (hedged) shares can be subscribed to by all investors, are accumulating (no distributions) and are
issued in a currency other than the reference currency of the respective Sub-Fund. The subscription
currency is always hedged against the reference currency of the respective Sub-Fund. However, this
hedging may not be comprehensive.
− I shares are exclusively reserved for institutional investors as defined by article 174(2)(c) of the Law of
2010 and are accumulating (no distributions).
− N shares can only be subscribed to by the following investors:
− Investors in Great Britain and the Netherlands and
− Investors in other countries who trade for their own account or for their clients (can be investors of all
kinds) and have a separate agreement with their clients. The spectrum of investors trading for their
clients includes legal entities operating within the framework of a discretionary asset management
mandate or which have an independent advisory agreement with their clients.
N shares are accumulating (no distributions) and do not grant any discounts or retrocession fees to
investors.
− R shares are reserved exclusively for investors that are entitled, in accordance with the employee
regulations of a Vontobel Group company, to hold such shares in their account/custody account at Bank
Vontobel AG, Zurich, at employee conditions, or who have concluded a special agreement with a
company in the Vontobel Group. It is therefore possible that these shares may be subscribed to and held
by persons who have access to material non-public information that relates to the relevant Sub-Fund. In
order to prevent conflicts of interest, the Vontobel Group and its affiliates have issued corresponding
instructions, compliance with which is constantly monitored.
− S shares are exclusively reserved for institutional investors as defined in article 174(2)(c) of the Law of
2010 that have concluded a corresponding agreement with a company in the Vontobel Group. S shares
are accumulating (no distributions). No management or performance fees are charged on S shares.
− U shares can be subscribed to by all investors and are accumulating (no distributions). Provisions for the
issuing of fractional shares do not apply to U shares. The conversion of shares in Share Class U into
shares of other Share Classes in the Fund is not permitted.
− V shares are reserved exclusively for institutional investors in the sense of Art. 174 par. 2 lett. c) of the
2010 Law, who are a company in the Vontobel Group. V Shares are accumulating (no distribution) and do
not grant any rebates or retrocessions to the investors.
− X shares can only be subscribed to by institutional investors as defined in article 174(2)(c) of the Law of
2010 who invest at least 50 million in the currency of the share class per initial subscription and have
concluded a corresponding agreement with a Vontobel Group company. X shares are accumulating (no
distributions).
The Board of Directors may decide at any time to issue Share Classes with a combination of Share Class
characteristics.
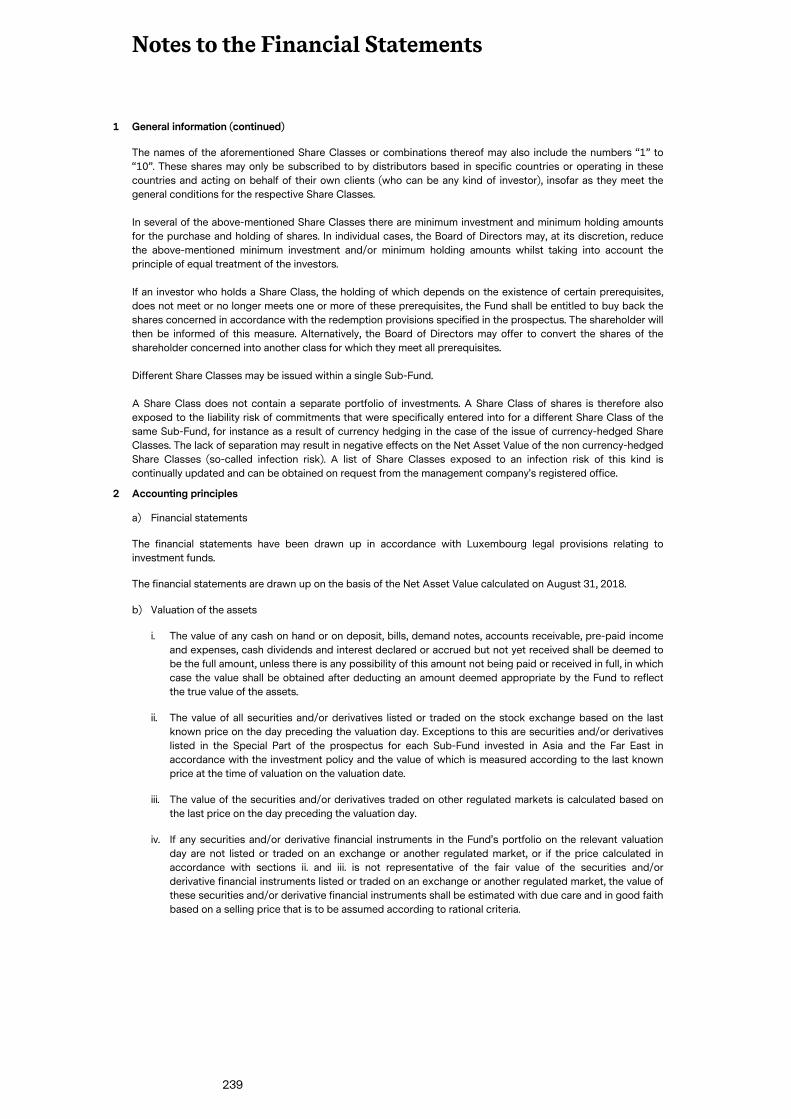
Notes to the Financial Statements
239
1 General information (continued)
The names of the aforementioned Share Classes or combinations thereof may also include the numbers “1” to
“10”. These shares may only be subscribed to by distributors based in specific countries or operating in these
countries and acting on behalf of their own clients (who can be any kind of investor), insofar as they meet the
general conditions for the respective Share Classes.
In several of the above-mentioned Share Classes there are minimum investment and minimum holding amounts
for the purchase and holding of shares. In individual cases, the Board of Directors may, at its discretion, reduce
the above-mentioned minimum investment and/or minimum holding amounts whilst taking into account the
principle of equal treatment of the investors.
If an investor who holds a Share Class, the holding of which depends on the existence of certain prerequisites,
does not meet or no longer meets one or more of these prerequisites, the Fund shall be entitled to buy back the
shares concerned in accordance with the redemption provisions specified in the prospectus. The shareholder will
then be informed of this measure. Alternatively, the Board of Directors may offer to convert the shares of the
shareholder concerned into another class for which they meet all prerequisites.
Different Share Classes may be issued within a single Sub-Fund.
A Share Class does not contain a separate portfolio of investments. A Share Class of shares is therefore also
exposed to the liability risk of commitments that were specifically entered into for a different Share Class of the
same Sub-Fund, for instance as a result of currency hedging in the case of the issue of currency-hedged Share
Classes. The lack of separation may result in negative effects on the Net Asset Value of the non currency-hedged
Share Classes (so-called infection risk). A list of Share Classes exposed to an infection risk of this kind is
continually updated and can be obtained on request from the management company's registered office.
2 Accounting principles
a) Financial statements
The financial statements have been drawn up in accordance with Luxembourg legal provisions relating to
investment funds.
The financial statements are drawn up on the basis of the Net Asset Value calculated on August 31, 2018.
b) Valuation of the assets
i. The value of any cash on hand or on deposit, bills, demand notes, accounts receivable, pre-paid income
and expenses, cash dividends and interest declared or accrued but not yet received shall be deemed to
be the full amount, unless there is any possibility of this amount not being paid or received in full, in which
case the value shall be obtained after deducting an amount deemed appropriate by the Fund to reflect
the true value of the assets.
ii. The value of all securities and/or derivatives listed or traded on the stock exchange based on the last
known price on the day preceding the valuation day. Exceptions to this are securities and/or derivatives
listed in the Special Part of the prospectus for each Sub-Fund invested in Asia and the Far East in
accordance with the investment policy and the value of which is measured according to the last known
price at the time of valuation on the valuation date.
iii. The value of the securities and/or derivatives traded on other regulated markets is calculated based on
the last price on the day preceding the valuation day.
iv. If any securities and/or derivative financial instruments in the Fund's portfolio on the relevant valuation
day are not listed or traded on an exchange or another regulated market, or if the price calculated in
accordance with sections ii. and iii. is not representative of the fair value of the securities and/or
derivative financial instruments listed or traded on an exchange or another regulated market, the value of
these securities and/or derivative financial instruments shall be estimated with due care and in good faith
based on a selling price that is to be assumed according to rational criteria.
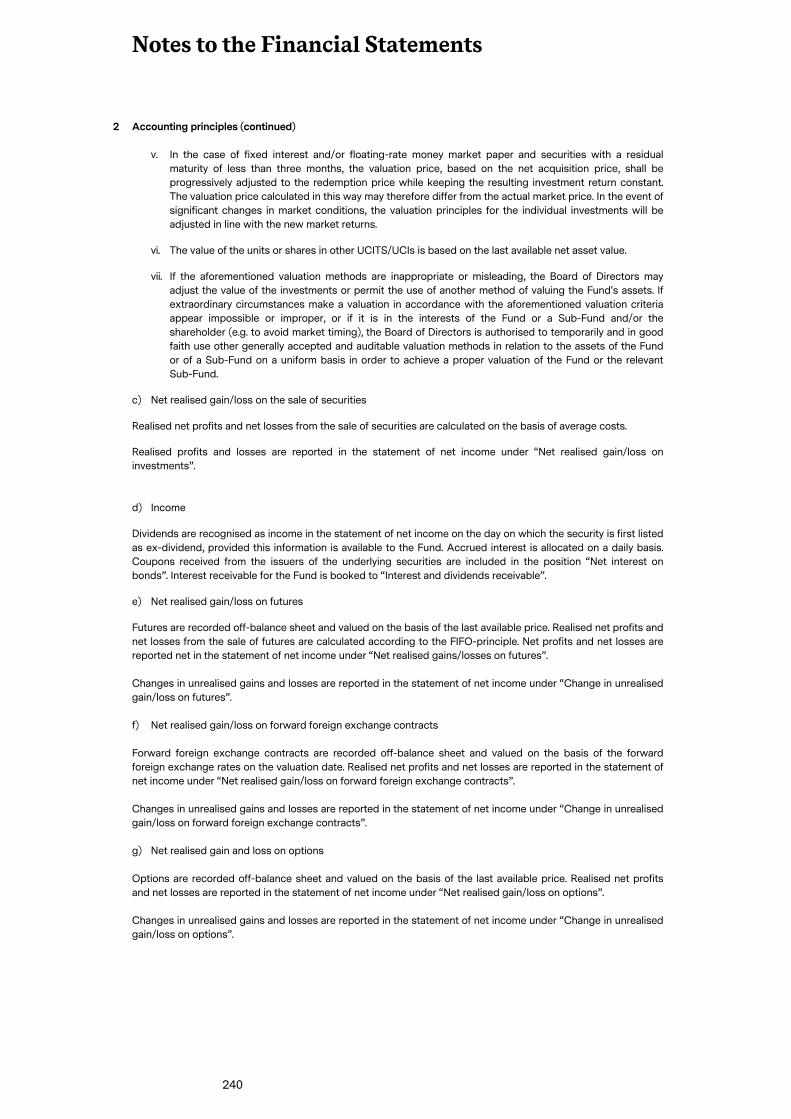
Notes to the Financial Statements
240
2 Accounting principles (continued)
v. In the case of fixed interest and/or floating-rate money market paper and securities with a residual
maturity of less than three months, the valuation price, based on the net acquisition price, shall be
progressively adjusted to the redemption price while keeping the resulting investment return constant.
The valuation price calculated in this way may therefore differ from the actual market price. In the event of
significant changes in market conditions, the valuation principles for the individual investments will be
adjusted in line with the new market returns.
vi. The value of the units or shares in other UCITS/UCIs is based on the last available net asset value.
vii. If the aforementioned valuation methods are inappropriate or misleading, the Board of Directors may
adjust the value of the investments or permit the use of another method of valuing the Fund's assets. If
extraordinary circumstances make a valuation in accordance with the aforementioned valuation criteria
appear impossible or improper, or if it is in the interests of the Fund or a Sub-Fund and/or the
shareholder (e.g. to avoid market timing), the Board of Directors is authorised to temporarily and in good
faith use other generally accepted and auditable valuation methods in relation to the assets of the Fund
or of a Sub-Fund on a uniform basis in order to achieve a proper valuation of the Fund or the relevant
Sub-Fund.
c) Net realised gain/loss on the sale of securities
Realised net profits and net losses from the sale of securities are calculated on the basis of average costs.
Realised profits and losses are reported in the statement of net income under “Net realised gain/loss on
investments”.
d) Income
Dividends are recognised as income in the statement of net income on the day on which the security is first listed
as ex-dividend, provided this information is available to the Fund. Accrued interest is allocated on a daily basis.
Coupons received from the issuers of the underlying securities are included in the position “Net interest on
bonds”. Interest receivable for the Fund is booked to “Interest and dividends receivable”.
e) Net realised gain/loss on futures
Futures are recorded off-balance sheet and valued on the basis of the last available price. Realised net profits and
net losses from the sale of futures are calculated according to the FIFO-principle. Net profits and net losses are
reported net in the statement of net income under “Net realised gains/losses on futures”.
Changes in unrealised gains and losses are reported in the statement of net income under “Change in unrealised
gain/loss on futures”.
f) Net realised gain/loss on forward foreign exchange contracts
Forward foreign exchange contracts are recorded off-balance sheet and valued on the basis of the forward
foreign exchange rates on the valuation date. Realised net profits and net losses are reported in the statement of
net income under “Net realised gain/loss on forward foreign exchange contracts”.
Changes in unrealised gains and losses are reported in the statement of net income under “Change in unrealised
gain/loss on forward foreign exchange contracts”.
g) Net realised gain and loss on options
Options are recorded off-balance sheet and valued on the basis of the last available price. Realised net profits
and net losses are reported in the statement of net income under “Net realised gain/loss on options”.
Changes in unrealised gains and losses are reported in the statement of net income under “Change in unrealised
gain/loss on options”.
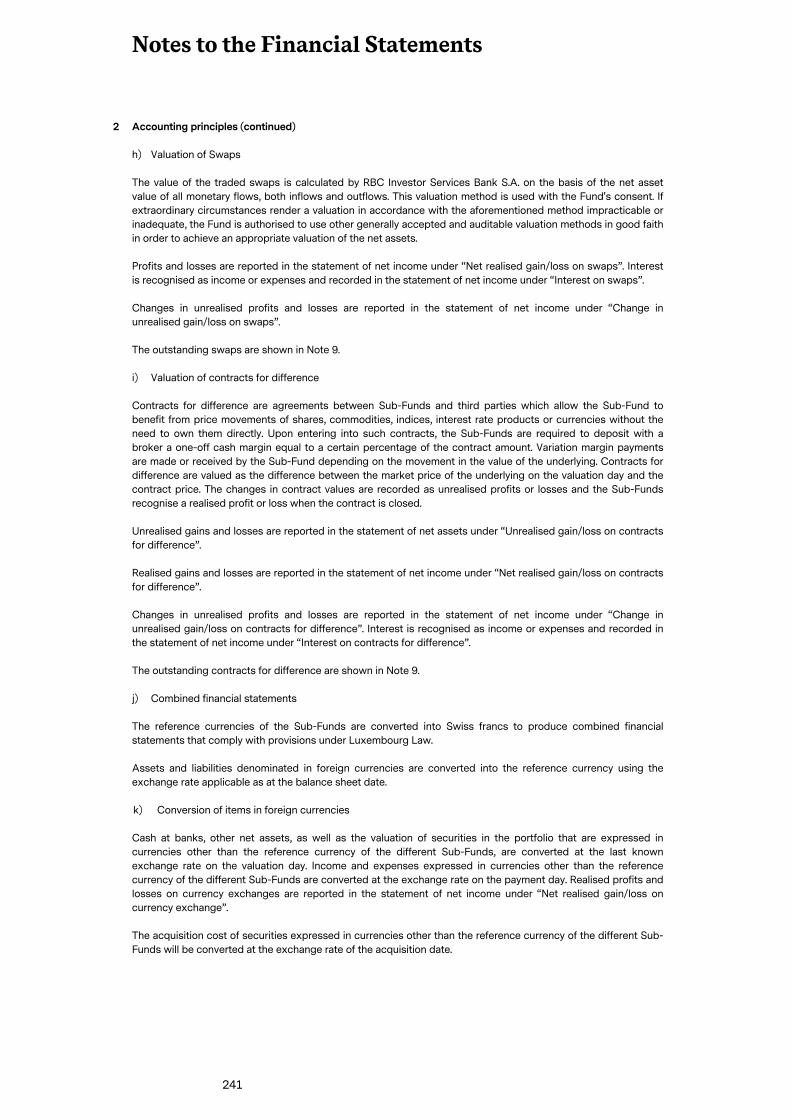
Notes to the Financial Statements
241
2 Accounting principles (continued)
h) Valuation of Swaps
The value of the traded swaps is calculated by RBC Investor Services Bank S.A. on the basis of the net asset
value of all monetary flows, both inflows and outflows. This valuation method is used with the Fund's consent. If
extraordinary circumstances render a valuation in accordance with the aforementioned method impracticable or
inadequate, the Fund is authorised to use other generally accepted and auditable valuation methods in good faith
in order to achieve an appropriate valuation of the net assets.
Profits and losses are reported in the statement of net income under “Net realised gain/loss on swaps”. Interest
is recognised as income or expenses and recorded in the statement of net income under “Interest on swaps”.
Changes in unrealised profits and losses are reported in the statement of net income under “Change in
unrealised gain/loss on swaps”.
The outstanding swaps are shown in Note 9.
i) Valuation of contracts for difference
Contracts for difference are agreements between Sub-Funds and third parties which allow the Sub-Fund to
benefit from price movements of shares, commodities, indices, interest rate products or currencies without the
need to own them directly. Upon entering into such contracts, the Sub-Funds are required to deposit with a
broker a one-off cash margin equal to a certain percentage of the contract amount. Variation margin payments
are made or received by the Sub-Fund depending on the movement in the value of the underlying. Contracts for
difference are valued as the difference between the market price of the underlying on the valuation day and the
contract price. The changes in contract values are recorded as unrealised profits or losses and the Sub-Funds
recognise a realised profit or loss when the contract is closed.
Unrealised gains and losses are reported in the statement of net assets under “Unrealised gain/loss on contracts
for difference”.
Realised gains and losses are reported in the statement of net income under “Net realised gain/loss on contracts
for difference”.
Changes in unrealised profits and losses are reported in the statement of net income under “Change in
unrealised gain/loss on contracts for difference”. Interest is recognised as income or expenses and recorded in
the statement of net income under “Interest on contracts for difference”.
The outstanding contracts for difference are shown in Note 9.
j) Combined financial statements
The reference currencies of the Sub-Funds are converted into Swiss francs to produce combined financial
statements that comply with provisions under Luxembourg Law.
Assets and liabilities denominated in foreign currencies are converted into the reference currency using the
exchange rate applicable as at the balance sheet date.
k) Conversion of items in foreign currencies
Cash at banks, other net assets, as well as the valuation of securities in the portfolio that are expressed in
currencies other than the reference currency of the different Sub-Funds, are converted at the last known
exchange rate on the valuation day. Income and expenses expressed in currencies other than the reference
currency of the different Sub-Funds are converted at the exchange rate on the payment day. Realised profits and
losses on currency exchanges are reported in the statement of net income under “Net realised gain/loss on
currency exchange”.
The acquisition cost of securities expressed in currencies other than the reference currency of the different Sub-
Funds will be converted at the exchange rate of the acquisition date.
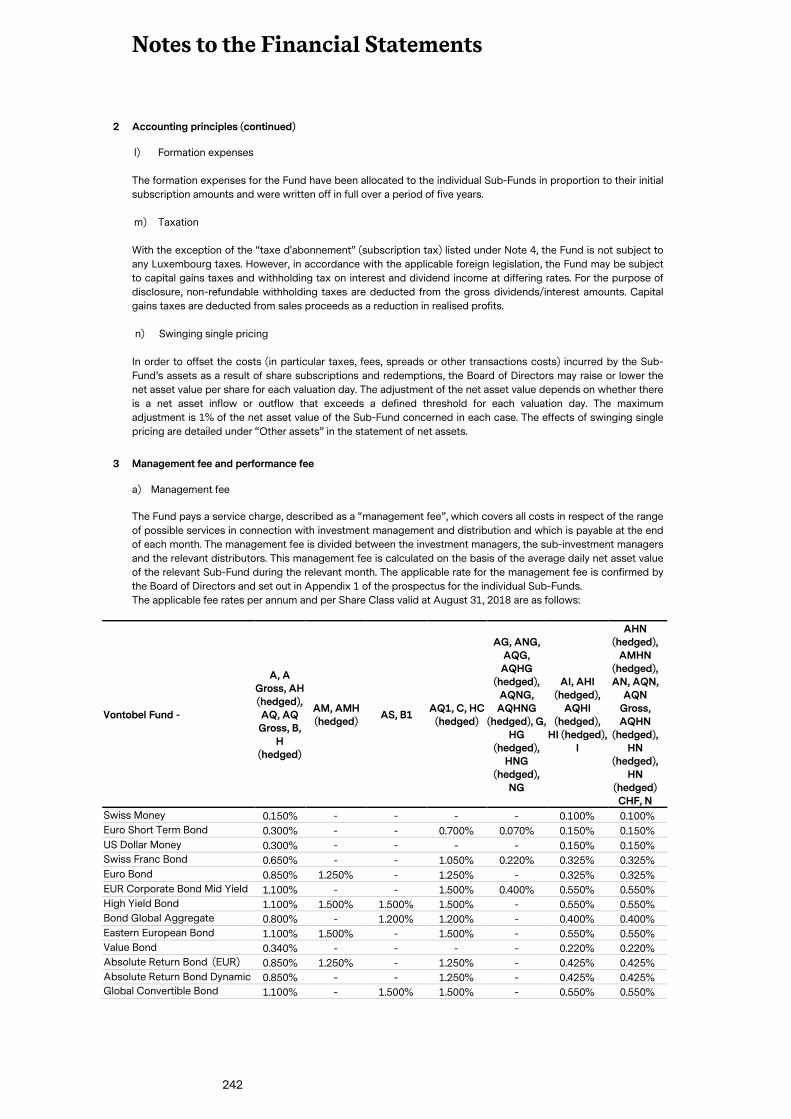
Notes to the Financial Statements
242
2 Accounting principles (continued)
l) Formation expenses
The formation expenses for the Fund have been allocated to the individual Sub-Funds in proportion to their initial
subscription amounts and were written off in full over a period of five years.
m) Taxation
With the exception of the “taxe d'abonnement” (subscription tax) listed under Note 4, the Fund is not subject to
any Luxembourg taxes. However, in accordance with the applicable foreign legislation, the Fund may be subject
to capital gains taxes and withholding tax on interest and dividend income at differing rates. For the purpose of
disclosure, non-refundable withholding taxes are deducted from the gross dividends/interest amounts. Capital
gains taxes are deducted from sales proceeds as a reduction in realised profits.
n) Swinging single pricing
In order to offset the costs (in particular taxes, fees, spreads or other transactions costs) incurred by the Sub-
Fund’s assets as a result of share subscriptions and redemptions, the Board of Directors may raise or lower the
net asset value per share for each valuation day. The adjustment of the net asset value depends on whether there
is a net asset inflow or outflow that exceeds a defined threshold for each valuation day. The maximum
adjustment is 1% of the net asset value of the Sub-Fund concerned in each case. The effects of swinging single
pricing are detailed under “Other assets” in the statement of net assets.
3 Management fee and performance fee
a) Management fee
The Fund pays a service charge, described as a “management fee”, which covers all costs in respect of the range
of possible services in connection with investment management and distribution and which is payable at the end
of each month. The management fee is divided between the investment managers, the sub-investment managers
and the relevant distributors. This management fee is calculated on the basis of the average daily net asset value
of the relevant Sub-Fund during the relevant month. The applicable rate for the management fee is confirmed by
the Board of Directors and set out in Appendix 1 of the prospectus for the individual Sub-Funds.
The applicable fee rates per annum and per Share Class valid at August 31, 2018 are as follows:
Vontobel Fund -
A, A Gross, AH (hedged), AQ, AQ Gross, B,
H (hedged)
AM, AMH (hedged)
AS, B1 AQ1, C, HC
(hedged)
AG, ANG, AQG, AQHG
(hedged), AQNG, AQHNG
(hedged), G, HG
(hedged), HNG
(hedged), NG
AI, AHI (hedged),
AQHI (hedged),
HI (hedged), I
AHN (hedged),
AMHN (hedged), AN, AQN,
AQN Gross, AQHN
(hedged), HN
(hedged), HN
(hedged) CHF, N
Swiss Money 0.150% - - - - 0.100% 0.100%
Euro Short Term Bond 0.300% - - 0.700% 0.070% 0.150% 0.150%
US Dollar Money 0.300% - - - - 0.150% 0.150%
Swiss Franc Bond 0.650% - - 1.050% 0.220% 0.325% 0.325%
Euro Bond 0.850% 1.250% - 1.250% - 0.325% 0.325%
EUR Corporate Bond Mid Yield 1.100% - - 1.500% 0.400% 0.550% 0.550% High Yield Bond 1.100% 1.500% 1.500% 1.500% - 0.550% 0.550% Bond Global Aggregate 0.800% - 1.200% 1.200% - 0.400% 0.400%
Eastern European Bond 1.100% 1.500% - 1.500% - 0.550% 0.550%
Value Bond 0.340% - - - - 0.220% 0.220%
Absolute Return Bond (EUR) 0.850% 1.250% - 1.250% - 0.425% 0.425%
Absolute Return Bond Dynamic 0.850% - - 1.250% - 0.425% 0.425% Global Convertible Bond 1.100% - 1.500% 1.500% - 0.550% 0.550%
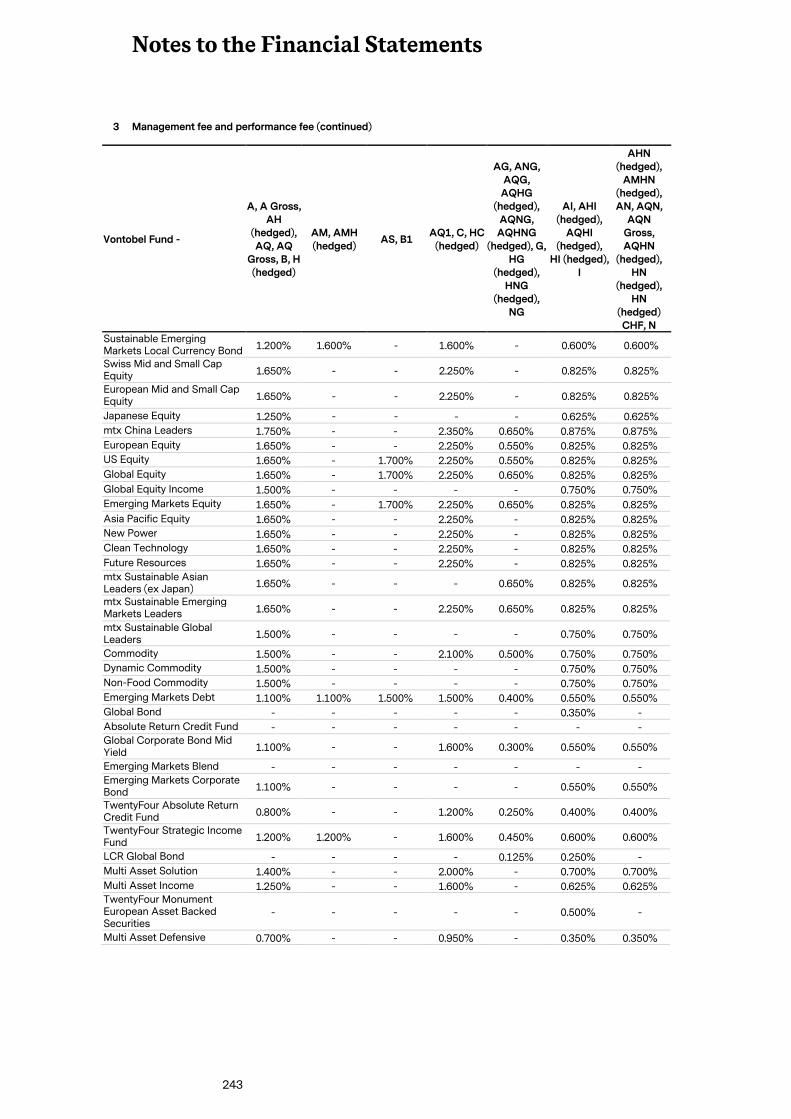
Notes to the Financial Statements
243
3 Management fee and performance fee (continued)
Vontobel Fund -
A, A Gross, AH
(hedged), AQ, AQ
Gross, B, H (hedged)
AM, AMH (hedged)
AS, B1 AQ1, C, HC
(hedged)
AG, ANG, AQG, AQHG
(hedged), AQNG, AQHNG
(hedged), G, HG
(hedged), HNG
(hedged), NG
AI, AHI (hedged),
AQHI (hedged),
HI (hedged), I
AHN (hedged),
AMHN (hedged), AN, AQN,
AQN Gross, AQHN
(hedged), HN
(hedged), HN
(hedged) CHF, N
Sustainable Emerging Markets Local Currency Bond 1.200% 1.600% - 1.600% - 0.600% 0.600%
Swiss Mid and Small Cap Equity 1.650% - - 2.250% - 0.825% 0.825%
European Mid and Small Cap Equity 1.650% - - 2.250% - 0.825% 0.825%
Japanese Equity 1.250% - - - - 0.625% 0.625%
mtx China Leaders 1.750% - - 2.350% 0.650% 0.875% 0.875%
European Equity 1.650% - - 2.250% 0.550% 0.825% 0.825% US Equity 1.650% - 1.700% 2.250% 0.550% 0.825% 0.825%
Global Equity 1.650% - 1.700% 2.250% 0.650% 0.825% 0.825%
Global Equity Income 1.500% - - - - 0.750% 0.750%
Emerging Markets Equity 1.650% - 1.700% 2.250% 0.650% 0.825% 0.825%
Asia Pacific Equity 1.650% - - 2.250% - 0.825% 0.825%
New Power 1.650% - - 2.250% - 0.825% 0.825% Clean Technology 1.650% - - 2.250% - 0.825% 0.825%
Future Resources 1.650% - - 2.250% - 0.825% 0.825% mtx Sustainable Asian Leaders (ex Japan) 1.650% - - - 0.650% 0.825% 0.825%
mtx Sustainable Emerging Markets Leaders 1.650% - - 2.250% 0.650% 0.825% 0.825%
mtx Sustainable Global Leaders 1.500% - - - - 0.750% 0.750%
Commodity 1.500% - - 2.100% 0.500% 0.750% 0.750%
Dynamic Commodity 1.500% - - - - 0.750% 0.750%
Non-Food Commodity 1.500% - - - - 0.750% 0.750%
Emerging Markets Debt 1.100% 1.100% 1.500% 1.500% 0.400% 0.550% 0.550%
Global Bond - - - - - 0.350% -
Absolute Return Credit Fund - - - - - - - Global Corporate Bond Mid Yield 1.100% - - 1.600% 0.300% 0.550% 0.550%
Emerging Markets Blend - - - - - - - Emerging Markets Corporate Bond 1.100% - - - - 0.550% 0.550%
TwentyFour Absolute Return Credit Fund 0.800% - - 1.200% 0.250% 0.400% 0.400%
TwentyFour Strategic Income Fund 1.200% 1.200% - 1.600% 0.450% 0.600% 0.600%
LCR Global Bond - - - - 0.125% 0.250% -
Multi Asset Solution 1.400% - - 2.000% - 0.700% 0.700%
Multi Asset Income 1.250% - - 1.600% - 0.625% 0.625% TwentyFour Monument European Asset Backed Securities
- - - - - 0.500% -
Multi Asset Defensive 0.700% - - 0.950% - 0.350% 0.350%
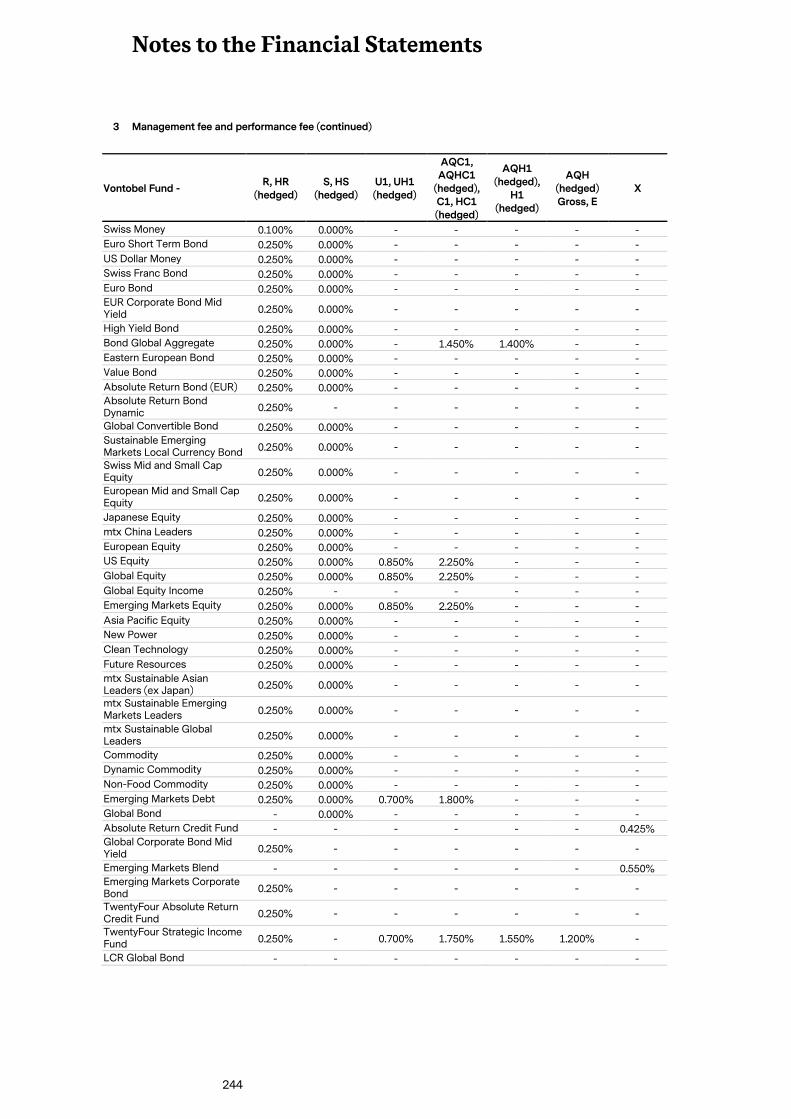
Notes to the Financial Statements
244
3 Management fee and performance fee (continued)
Vontobel Fund - R, HR
(hedged) S, HS
(hedged) U1, UH1 (hedged)
AQC1, AQHC1
(hedged), C1, HC1 (hedged)
AQH1 (hedged),
H1 (hedged)
AQH (hedged) Gross, E
X
Swiss Money 0.100% 0.000% - - - - -
Euro Short Term Bond 0.250% 0.000% - - - - -
US Dollar Money 0.250% 0.000% - - - - -
Swiss Franc Bond 0.250% 0.000% - - - - -
Euro Bond 0.250% 0.000% - - - - - EUR Corporate Bond Mid Yield 0.250% 0.000% - - - - -
High Yield Bond 0.250% 0.000% - - - - - Bond Global Aggregate 0.250% 0.000% - 1.450% 1.400% - -
Eastern European Bond 0.250% 0.000% - - - - -
Value Bond 0.250% 0.000% - - - - -
Absolute Return Bond (EUR) 0.250% 0.000% - - - - - Absolute Return Bond Dynamic 0.250% - - - - - -
Global Convertible Bond 0.250% 0.000% - - - - - Sustainable Emerging Markets Local Currency Bond 0.250% 0.000% - - - - -
Swiss Mid and Small Cap Equity 0.250% 0.000% - - - - -
European Mid and Small Cap Equity 0.250% 0.000% - - - - -
Japanese Equity 0.250% 0.000% - - - - -
mtx China Leaders 0.250% 0.000% - - - - -
European Equity 0.250% 0.000% - - - - - US Equity 0.250% 0.000% 0.850% 2.250% - - -
Global Equity 0.250% 0.000% 0.850% 2.250% - - -
Global Equity Income 0.250% - - - - - -
Emerging Markets Equity 0.250% 0.000% 0.850% 2.250% - - -
Asia Pacific Equity 0.250% 0.000% - - - - -
New Power 0.250% 0.000% - - - - - Clean Technology 0.250% 0.000% - - - - -
Future Resources 0.250% 0.000% - - - - - mtx Sustainable Asian Leaders (ex Japan) 0.250% 0.000% - - - - -
mtx Sustainable Emerging Markets Leaders 0.250% 0.000% - - - - -
mtx Sustainable Global Leaders 0.250% 0.000% - - - - -
Commodity 0.250% 0.000% - - - - -
Dynamic Commodity 0.250% 0.000% - - - - -
Non-Food Commodity 0.250% 0.000% - - - - -
Emerging Markets Debt 0.250% 0.000% 0.700% 1.800% - - -
Global Bond - 0.000% - - - - -
Absolute Return Credit Fund - - - - - - 0.425% Global Corporate Bond Mid Yield 0.250% - - - - - -
Emerging Markets Blend - - - - - - 0.550% Emerging Markets Corporate Bond 0.250% - - - - - -
TwentyFour Absolute Return Credit Fund 0.250% - - - - - -
TwentyFour Strategic Income Fund 0.250% - 0.700% 1.750% 1.550% 1.200% -
LCR Global Bond - - - - - - -
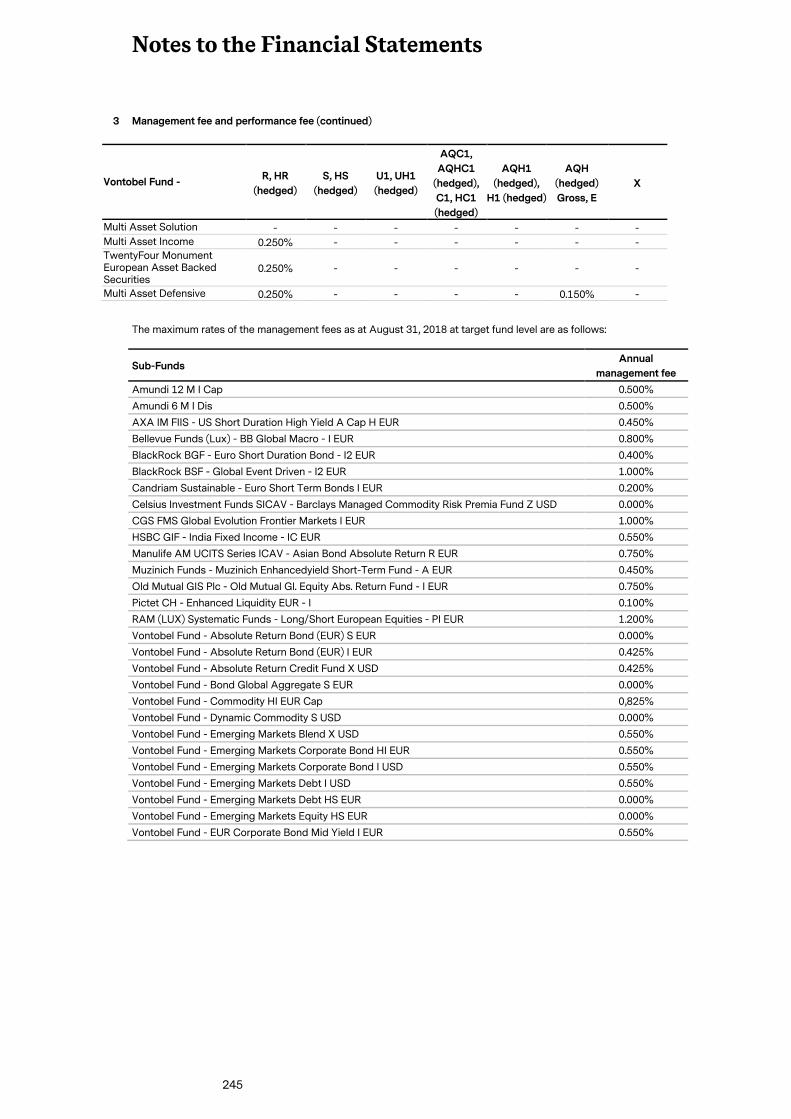
Notes to the Financial Statements
245
3 Management fee and performance fee (continued)
Vontobel Fund - R, HR
(hedged)
S, HS
(hedged)
U1, UH1
(hedged)
AQC1,
AQHC1
(hedged),
C1, HC1
(hedged)
AQH1
(hedged),
H1 (hedged)
AQH
(hedged)
Gross, E
X
Multi Asset Solution - - - - - - -
Multi Asset Income 0.250% - - - - - - TwentyFour Monument European Asset Backed Securities
0.250% - - - - - -
Multi Asset Defensive 0.250% - - - - 0.150% -
The maximum rates of the management fees as at August 31, 2018 at target fund level are as follows:
Sub-Funds Annual
management fee
Amundi 12 M I Cap 0.500%
Amundi 6 M I Dis 0.500%
AXA IM FIIS - US Short Duration High Yield A Cap H EUR 0.450%
Bellevue Funds (Lux) - BB Global Macro - I EUR 0.800%
BlackRock BGF - Euro Short Duration Bond - I2 EUR 0.400%
BlackRock BSF - Global Event Driven - I2 EUR 1.000%
Candriam Sustainable - Euro Short Term Bonds I EUR 0.200%
Celsius Investment Funds SICAV - Barclays Managed Commodity Risk Premia Fund Z USD 0.000%
CGS FMS Global Evolution Frontier Markets I EUR 1.000%
HSBC GIF - India Fixed Income - IC EUR 0.550%
Manulife AM UCITS Series ICAV - Asian Bond Absolute Return R EUR 0.750%
Muzinich Funds - Muzinich Enhancedyield Short-Term Fund - A EUR 0.450%
Old Mutual GIS Plc - Old Mutual Gl. Equity Abs. Return Fund - I EUR 0.750%
Pictet CH - Enhanced Liquidity EUR - I 0.100%
RAM (LUX) Systematic Funds - Long/Short European Equities - PI EUR 1.200%
Vontobel Fund - Absolute Return Bond (EUR) S EUR 0.000%
Vontobel Fund - Absolute Return Bond (EUR) I EUR 0.425%
Vontobel Fund - Absolute Return Credit Fund X USD 0.425%
Vontobel Fund - Bond Global Aggregate S EUR 0.000%
Vontobel Fund - Commodity HI EUR Cap 0,825%
Vontobel Fund - Dynamic Commodity S USD 0.000%
Vontobel Fund - Emerging Markets Blend X USD 0.550%
Vontobel Fund - Emerging Markets Corporate Bond HI EUR 0.550%
Vontobel Fund - Emerging Markets Corporate Bond I USD 0.550%
Vontobel Fund - Emerging Markets Debt I USD 0.550%
Vontobel Fund - Emerging Markets Debt HS EUR 0.000%
Vontobel Fund - Emerging Markets Equity HS EUR 0.000%
Vontobel Fund - EUR Corporate Bond Mid Yield I EUR 0.550%
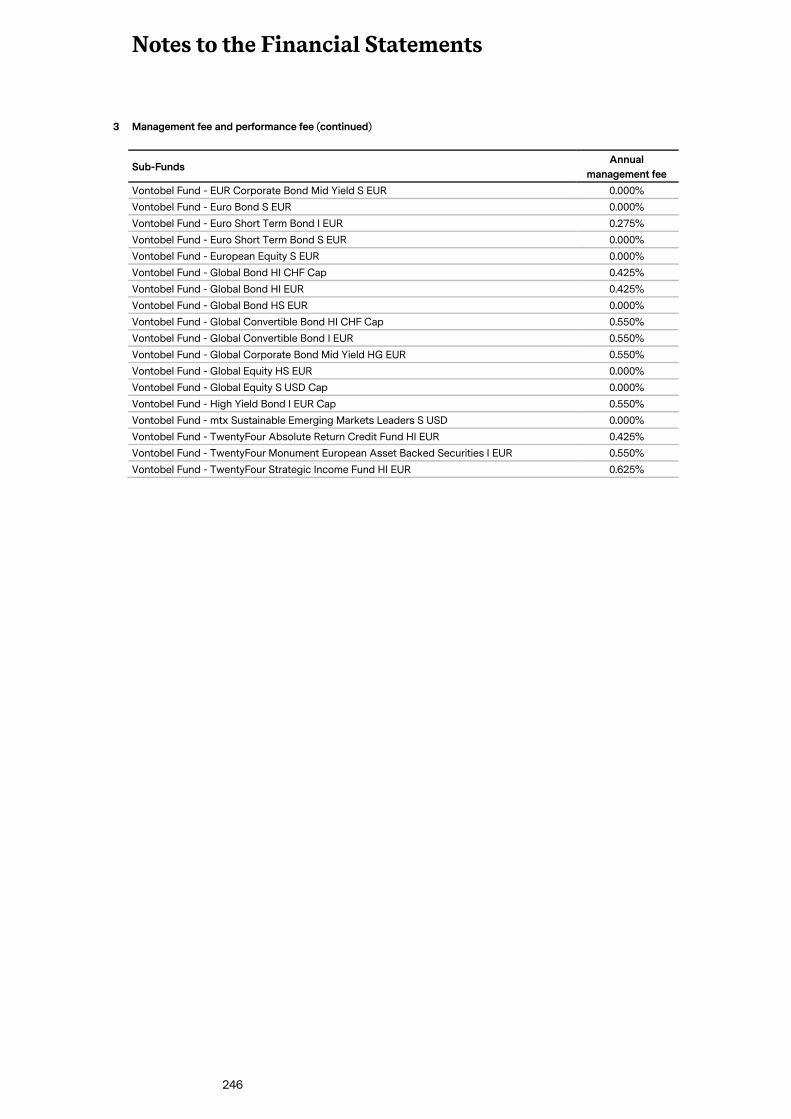
Notes to the Financial Statements
246
3 Management fee and performance fee (continued)
Sub-Funds Annual
management fee
Vontobel Fund - EUR Corporate Bond Mid Yield S EUR 0.000%
Vontobel Fund - Euro Bond S EUR 0.000%
Vontobel Fund - Euro Short Term Bond I EUR 0.275%
Vontobel Fund - Euro Short Term Bond S EUR 0.000%
Vontobel Fund - European Equity S EUR 0.000%
Vontobel Fund - Global Bond HI CHF Cap 0.425%
Vontobel Fund - Global Bond HI EUR 0.425%
Vontobel Fund - Global Bond HS EUR 0.000%
Vontobel Fund - Global Convertible Bond HI CHF Cap 0.550%
Vontobel Fund - Global Convertible Bond I EUR 0.550%
Vontobel Fund - Global Corporate Bond Mid Yield HG EUR 0.550%
Vontobel Fund - Global Equity HS EUR 0.000%
Vontobel Fund - Global Equity S USD Cap 0.000%
Vontobel Fund - High Yield Bond I EUR Cap 0.550%
Vontobel Fund - mtx Sustainable Emerging Markets Leaders S USD 0.000%
Vontobel Fund - TwentyFour Absolute Return Credit Fund HI EUR 0.425%
Vontobel Fund - TwentyFour Monument European Asset Backed Securities I EUR 0.550%
Vontobel Fund - TwentyFour Strategic Income Fund HI EUR 0.625%
Notes to the Financial Statements
247
3 Management fee and performance fee (continued)
b) Performance fee
The performance fee is calculated on each valuation day of the relevant Sub-Fund or corresponding Share Class
in accordance with a period defined for the relevant Sub-Fund (“performance fee period”) and recognised for
accounting purposes as an accrual. Any performance fee owed at the end of the relevant performance fee period
is paid out to the portfolio manager.
Neither equalisation nor multi-series accounting methods are used to calculate the performance fee. This may
mean that under certain circumstances, an investor is unable to participate in a positive performance depending
on the timing of its subscription of shares, although it will nevertheless be charged a performance fee on the
basis of a positive overall performance by the Sub-Fund during the performance fee period.
In the event of a redemption of shares during a performance fee period, the portion of the performance fee that
was accrued during the relevant performance fee period up to the valuation cut-off date for the redemption of the
shares shall also be paid out, regardless of whether a performance fee is due or not at the end of the relevant
performance fee period.
The performance fee is calculated either through cumulative application of the “high-watermark principle”
(“HWM principle”) and “hurdle-rate principle” or alternatively in accordance with one of the aforementioned
principles. The calculation method to be applied for each Sub-Fund is set out in the Special Part of the
prospectus.
According to the prospectus, a performance fee can apply to the following Sub-Funds for the financial period in
question:
Vontobel Fund - High Yield Bond
Vontobel Fund - Bond Global Aggregate
Vontobel Fund - Value Bond
Vontobel Fund - Absolute Return Bond (EUR)
Vontobel Fund - Absolute Return Bond Dynamic
Vontobel Fund - Dynamic Commodity
Vontobel Fund - Emerging Markets Debt
Vontobel Fund - Absolute Return Credit Fund
Vontobel Fund - Emerging Markets Corporate Bond
Vontobel Fund - Multi Asset Solution
4 Subscription tax
In accordance with the 2010 Law, as amended, the Fund is currently exempt from income and capital gains taxes
in Luxembourg. However, under this Law the Fund is subject to a subscription tax (“taxe d'abonnement”). For all
Share Classes in all Sub-Funds reserved for the institutional investors, the tax amounts to 0.01%, and for all other
Share Classes of all Sub-Funds to 0.05% of the net assets of the Share Classes concerned. However, the tax rate
for Sub-Funds invested exclusively in money market instruments amounts to 0.01%. The tax is payable quarterly
and is based on the net assets of the Fund at the end of the relevant quarter.
5 Service fee
The Fund pays a “service fee” which covers the costs of central administration, supervision, custodian services
and support services for the Fund. This service fee is calculated on the basis of the average of the Fund's daily
net asset value during the month in question and amounts to a maximum of 0.08745% per month. It is charged to
the Fund at the end of the month.
Notes to the Financial Statements
248
6 Fees applicable to subscriptions and redemptions of target funds
In accordance with the 2010 Law, as amended, no fees were charged for the subscription or redemption of
shares of target funds that are managed by the same management company or by another company that is
affiliated to the management company.
Some Sub-Funds of the Vontobel Fund invest in other Sub-Funds of the Vontobel Fund. As at August 31, 2018,
the value of these investments (known as “cross investments”) amounts to:
Target Funds Market value
in CHF
Vontobel Fund - Absolute Return Bond (EUR) S EUR 3,561,821
Vontobel Fund - Absolute Return Bond (EUR) - I EUR 2,939,146
Vontobel Fund - Absolute Return Credit Fund X USD 21,291,325
Vontobel Fund - Bond Global Aggregate S EUR 8,434,802
Vontobel Fund - Commodity HI Hedged EUR 1,186,884
Vontobel Fund - Dynamic Commodity S USD 22,956,541
Vontobel Fund - Emerging Markets Blend X USD 61,399,104
Vontobel Fund - Emerging Markets Corporate Bond HI EUR 1,446,286
Vontobel Fund - Emerging Markets Corporate Bond I USD 94,342,685
Vontobel Fund - Emerging Markets Debt - I USD 1,799,967
Vontobel Fund - Emerging Markets Debt HS EUR 1,389,616
Vontobel Fund - Emerging Markets Equity HS EUR 3,854,272
Vontobel Fund - EUR Corporate Bond Mid Yield - I EUR 5,062,416
Vontobel Fund - EUR Corporate Bond Mid Yield S EUR 3,832,376
Vontobel Fund - Euro Bond S EUR 1,200,326
Vontobel Fund - Euro Short Term Bond - I EUR 5,660,482
Vontobel Fund - Euro Short Term Bond S EUR 8,256,424
Vontobel Fund - European Equity S EUR 4,072,325
Vontobel Fund - Global Bond HI CHF 2,705,265
Vontobel Fund - Global Bond HI EUR 13,383,631
Vontobel Fund - Global Bond HS EUR 1,905,938
Vontobel Fund - Global Convertible Bond HI CHF 1,670,138
Vontobel Fund - Global Convertible Bond I EUR 8,645,537
Vontobel Fund - Global Corporate Bond Mid Yield HG EUR 20,576,631
Vontobel Fund - Global Equity HS EUR 12,054,500
Vontobel Fund - Global Equity S USD 2,694,873
Vontobel Fund - High Yield Bond I EUR 51,502,254
Vontobel Fund - MTX Sustainable EM Leaders S USD 735,364
Vontobel Fund - TwentyFour Absolute Return Credit Fund HI EUR 7,907,828
Vontobel Fund - TwentyFour Monument European Asset Backed Securities I EUR 8,894,128
Vontobel Fund - TwentyFour Strategic Income Fund HI EUR 4,664,820
7 Exchange rates When converting balance sheet positions denominated in foreign currencies into Swiss francs as at August 31, 2018, the following exchange rates were used:
1 CHF 39.344736 ARS 1 CHF 8.115936 HKD 1 CHF 55.286264 PHP
1 CHF 1.429783 AUD 1 CHF 289.787288 HUF 1 CHF 127.326561 PKR
1 CHF 86.659319 BDT 1 CHF 15230.799823 IDR 1 CHF 3.805654 PLN
1 CHF 1.738239 BGN 1 CHF 3.721849 ILS 1 CHF 4.116269 RON
1 CHF 4.260254 BRL 1 CHF 73.339882 INR 1 CHF 105.093912 RSD
1 CHF 1.348308 CAD 1 CHF 1720.790849 ITL 1 CHF 69.644979 RUB
1 CHF 701.505427 CLP 1 CHF 114.657227 JPY 1 CHF 9.447237 SEK
1 CHF 7.064515 CNH 1 CHF 1151.468820 KRW 1 CHF 1.416658 SGD
1 CHF 7.061958 CNY 1 CHF 375.870229 KZT 1 CHF 33.843452 THB
1 CHF 3162.137615 COP 1 CHF 166.911864 LKR 1 CHF 6.847536 TRY
1 CHF 592.221649 CRC 1 CHF 19.770918 MXN 1 CHF 31.760267 TWD
1 CHF 22.867420 CZK 1 CHF 4.249294 MYR 1 CHF 29.161797 UAH
1 CHF 6.625566 DKK 1 CHF 15.149574 NAD 1 CHF 1.034019 USD
1 CHF 51.173859 DOP 1 CHF 374.237785 NGN 1 CHF 33.160766 UYU
1 CHF 0.888714 EUR 1 CHF 8.647162 NOK 1 CHF 15.149574 ZAR
1 CHF 0.795552 GBP 1 CHF 1.558431 NZD 1 CHF 10.640026 ZMW
1 CHF 5.004642 GHS 1 CHF 3.417431 PEN
Notes to the Financial Statements
249
8 Other expenses
Sub-Funds Description
Amount in
Sub-Fund
currency
Vontobel Fund - Swiss Money General tax advice 11,466
Other expenses 9,160
Clearing brokerage fees 3,855
Legal fees 3,756
Total CHF 28,237
Vontobel Fund - Euro Short Term Bond General tax advice 7,683
Other expenses 13,752
Clearing brokerage fees 5,755
Legal fees 6,612
Total EUR 33,802
Vontobel Fund - US Dollar Money General tax advice 10,635
Other expenses 4,460
Legal fees 3,183
Total USD 18,278
Vontobel Fund - Swiss Franc Bond General tax advice 19,756
Other expenses 13,162
Clearing brokerage fees 87,273
Legal fees 8,494
Total CHF 128,685
Vontobel Fund - Euro Bond General tax advice 6,999
Other expenses 9,052
Clearing brokerage fees 5,741
Legal fees 3,086
Total EUR 24,878
Vontobel Fund - EUR Corporate Bond Mid Yield General tax advice 57,368
Other expenses 33,706
Clearing brokerage fees 7,620
Legal fees 18,722
Total EUR 117,416
Vontobel Fund - High Yield Bond General tax advice 20,770
Other expenses 10,426
Legal fees 3,562
Total EUR 34,758
Vontobel Fund - Bond Global Aggregate General tax advice 27,908
Other expenses 2,991,275
Clearing brokerage fees 827,451
Legal fees 13,926
Total EUR 3,860,560
Vontobel Fund - Eastern European Bond General tax advice 10,572
Other expenses 9,574
Legal fees 5,285
Total EUR 25,431
Vontobel Fund - Value Bond General tax advice 11,213
Other expenses 2,431
Clearing brokerage fees 67,861
Legal fees 5,440
Total CHF 86,945
Notes to the Financial Statements
250
8 Other expenses (continued)
Sub-Funds Description
Amount in
Sub-Fund
currency
Vontobel Fund - Absolute Return Bond (EUR) General tax advice 11,981
Other expenses 9,540
Clearing brokerage fees 44,292
Legal fees 3,283
Total EUR 69,096
Vontobel Fund - Absolute Return Bond
Dynamic
General tax advice 14,012
Other expenses 6,133
Clearing brokerage fees 10,022
Legal fees 1,550
Total EUR 31,717
Vontobel Fund - Global Convertible Bond General tax advice 17,321
Other expenses 8,126
Clearing brokerage fees 20,470
Legal fees 3,414
Total EUR 49,331
Vontobel Fund - Sustainable Emerging
Markets Local Currency Bond
General tax advice 21,259
Other expenses 29,276
Clearing brokerage fees 5,238
Legal fees 4,127
Total USD 59,900
Vontobel Fund - Swiss Mid and Small Cap
Equity
General tax advice 10,906
Other expenses 21,148
Legal fees 3,816
Total CHF 35,870
Vontobel Fund - European Mid and Small Cap
Equity General tax advice 8,686
Other expenses 8,978
Legal fees 2,951
Total EUR 20,615
Vontobel Fund - Japanese Equity General tax advice 852,759
Other expenses 968,531
Legal fees 352,323
Total JPY 2,173,613
Vontobel Fund - mtx China Leaders General tax advice 10,293
Other expenses 22,923
Legal fees 4,063
Total USD 37,279
Vontobel Fund - European Equity General tax advice 22,106
Other expenses 23,944
Legal fees 14,563
Total EUR 60,613
Vontobel Fund - US Equity General tax advice 56,050
Other expenses 44,711
Legal fees 23,734
Total USD 124,495
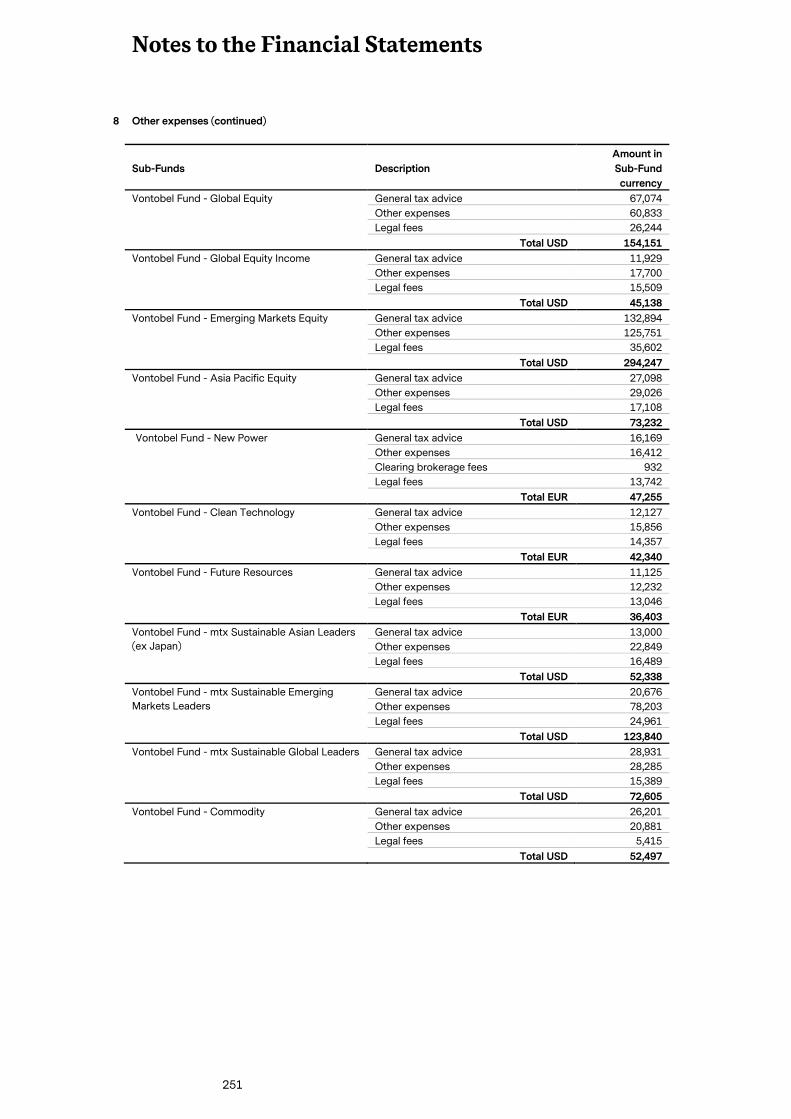
Notes to the Financial Statements
251
8 Other expenses (continued)
Sub-Funds Description
Amount in
Sub-Fund
currency
Vontobel Fund - Global Equity General tax advice 67,074
Other expenses 60,833
Legal fees 26,244
Total USD 154,151
Vontobel Fund - Global Equity Income General tax advice 11,929
Other expenses 17,700
Legal fees 15,509
Total USD 45,138
Vontobel Fund - Emerging Markets Equity General tax advice 132,894
Other expenses 125,751
Legal fees 35,602
Total USD 294,247
Vontobel Fund - Asia Pacific Equity
General tax advice 27,098
Other expenses 29,026
Legal fees 17,108
Total USD 73,232
Vontobel Fund - New Power General tax advice 16,169
Other expenses 16,412
Clearing brokerage fees 932
Legal fees 13,742
Total EUR 47,255
Vontobel Fund - Clean Technology General tax advice 12,127
Other expenses 15,856
Legal fees 14,357
Total EUR 42,340
Vontobel Fund - Future Resources General tax advice 11,125
Other expenses 12,232
Legal fees 13,046
Total EUR 36,403
Vontobel Fund - mtx Sustainable Asian Leaders
(ex Japan)
General tax advice 13,000
Other expenses 22,849
Legal fees 16,489
Total USD 52,338
Vontobel Fund - mtx Sustainable Emerging
Markets Leaders
General tax advice 20,676
Other expenses 78,203
Legal fees 24,961
Total USD 123,840
Vontobel Fund - mtx Sustainable Global Leaders General tax advice 28,931
Other expenses 28,285
Legal fees 15,389
Total USD 72,605
Vontobel Fund - Commodity General tax advice 26,201
Other expenses 20,881
Legal fees 5,415
Total USD 52,497
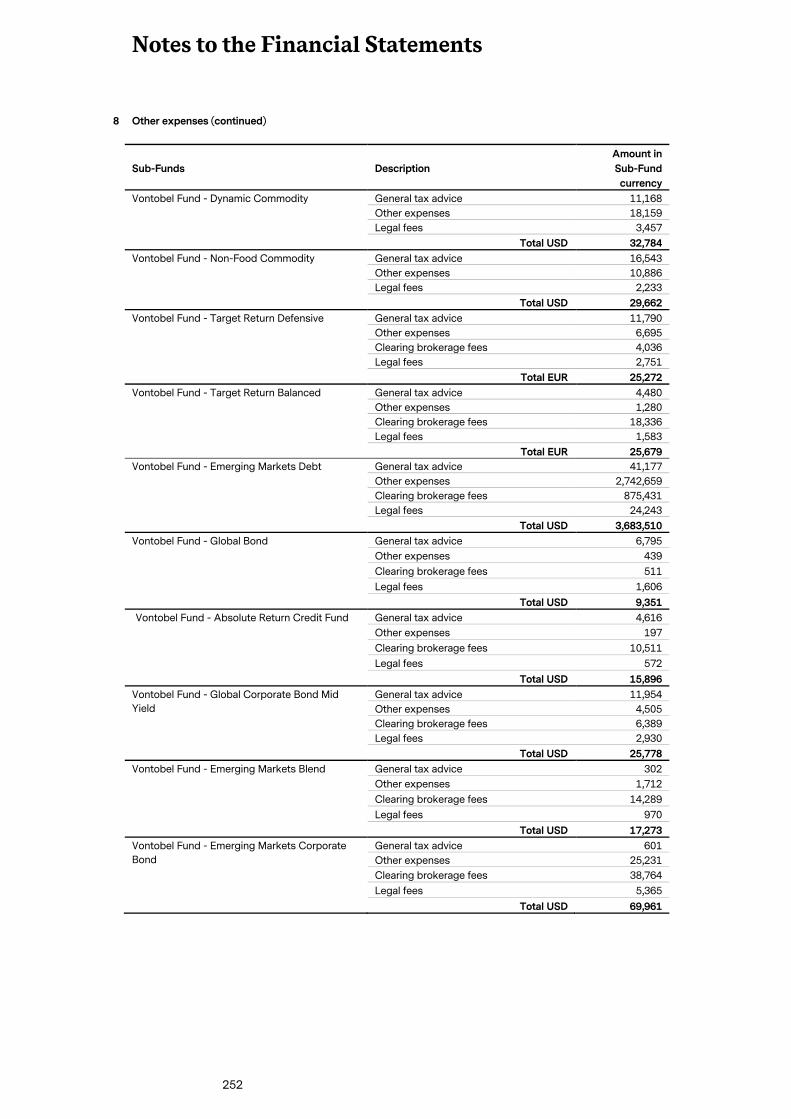
Notes to the Financial Statements
252
8 Other expenses (continued)
Sub-Funds Description
Amount in
Sub-Fund
currency
Vontobel Fund - Dynamic Commodity General tax advice 11,168
Other expenses 18,159
Legal fees 3,457
Total USD 32,784
Vontobel Fund - Non-Food Commodity General tax advice 16,543
Other expenses 10,886
Legal fees 2,233
Total USD 29,662
Vontobel Fund - Target Return Defensive General tax advice 11,790
Other expenses 6,695
Clearing brokerage fees 4,036
Legal fees 2,751
Total EUR 25,272
Vontobel Fund - Target Return Balanced General tax advice 4,480
Other expenses 1,280
Clearing brokerage fees 18,336
Legal fees 1,583
Total EUR 25,679
Vontobel Fund - Emerging Markets Debt General tax advice 41,177
Other expenses 2,742,659
Clearing brokerage fees 875,431
Legal fees 24,243
Total USD 3,683,510
Vontobel Fund - Global Bond General tax advice 6,795
Other expenses 439
Clearing brokerage fees 511
Legal fees 1,606
Total USD 9,351
Vontobel Fund - Absolute Return Credit Fund General tax advice 4,616
Other expenses 197
Clearing brokerage fees 10,511
Legal fees 572
Total USD 15,896
Vontobel Fund - Global Corporate Bond Mid
Yield
General tax advice 11,954
Other expenses 4,505
Clearing brokerage fees 6,389
Legal fees 2,930
Total USD 25,778
Vontobel Fund - Emerging Markets Blend General tax advice 302
Other expenses 1,712
Clearing brokerage fees 14,289
Legal fees 970
Total USD 17,273
Vontobel Fund - Emerging Markets Corporate
Bond
General tax advice 601
Other expenses 25,231
Clearing brokerage fees 38,764
Legal fees 5,365
Total USD 69,961
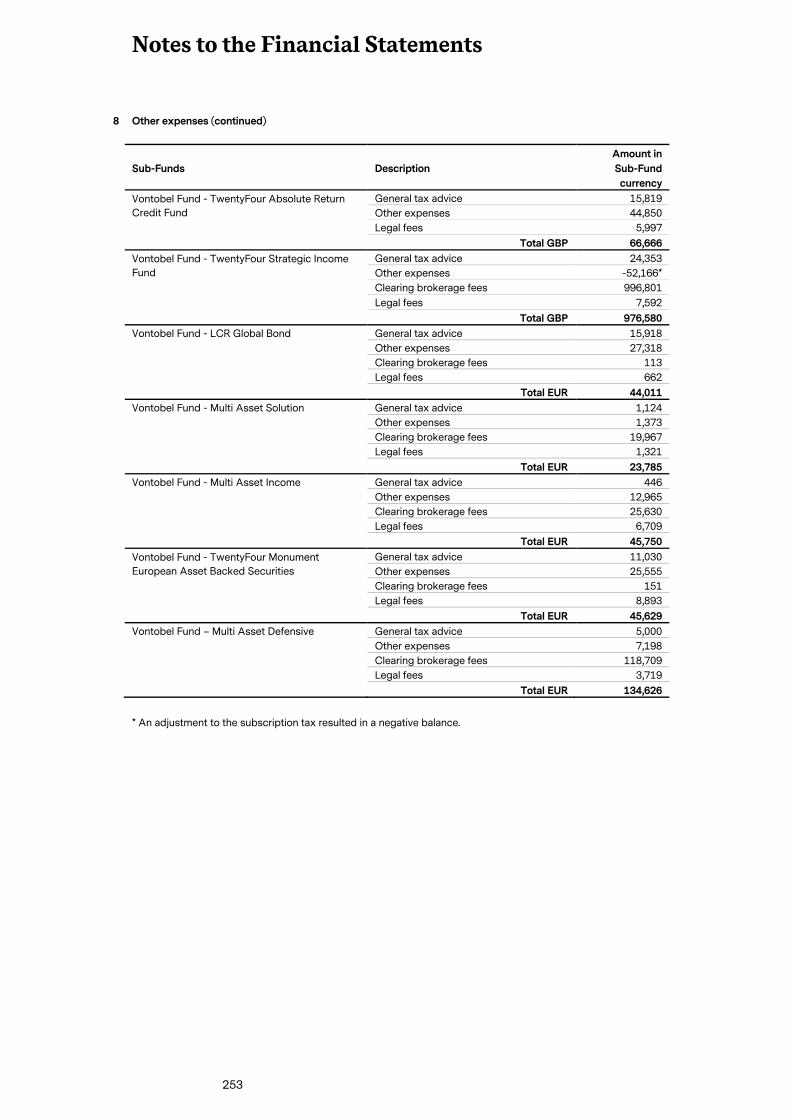
Notes to the Financial Statements
253
8 Other expenses (continued)
Sub-Funds Description
Amount in
Sub-Fund
currency
Vontobel Fund - TwentyFour Absolute Return
Credit Fund
General tax advice 15,819
Other expenses 44,850
Legal fees 5,997
Total GBP 66,666
Vontobel Fund - TwentyFour Strategic Income
Fund
General tax advice 24,353
Other expenses -52,166*
Clearing brokerage fees 996,801
Legal fees 7,592
Total GBP 976,580
Vontobel Fund - LCR Global Bond General tax advice 15,918
Other expenses 27,318
Clearing brokerage fees 113
Legal fees 662
Total EUR 44,011
Vontobel Fund - Multi Asset Solution General tax advice 1,124
Other expenses 1,373
Clearing brokerage fees 19,967
Legal fees 1,321
Total EUR 23,785
Vontobel Fund - Multi Asset Income General tax advice 446
Other expenses 12,965
Clearing brokerage fees 25,630
Legal fees 6,709
Total EUR 45,750
Vontobel Fund - TwentyFour Monument
European Asset Backed Securities
General tax advice 11,030
Other expenses 25,555
Clearing brokerage fees 151
Legal fees 8,893
Total EUR 45,629
Vontobel Fund – Multi Asset Defensive General tax advice 5,000
Other expenses 7,198
Clearing brokerage fees 118,709
Legal fees 3,719
Total EUR 134,626
* An adjustment to the subscription tax resulted in a negative balance.
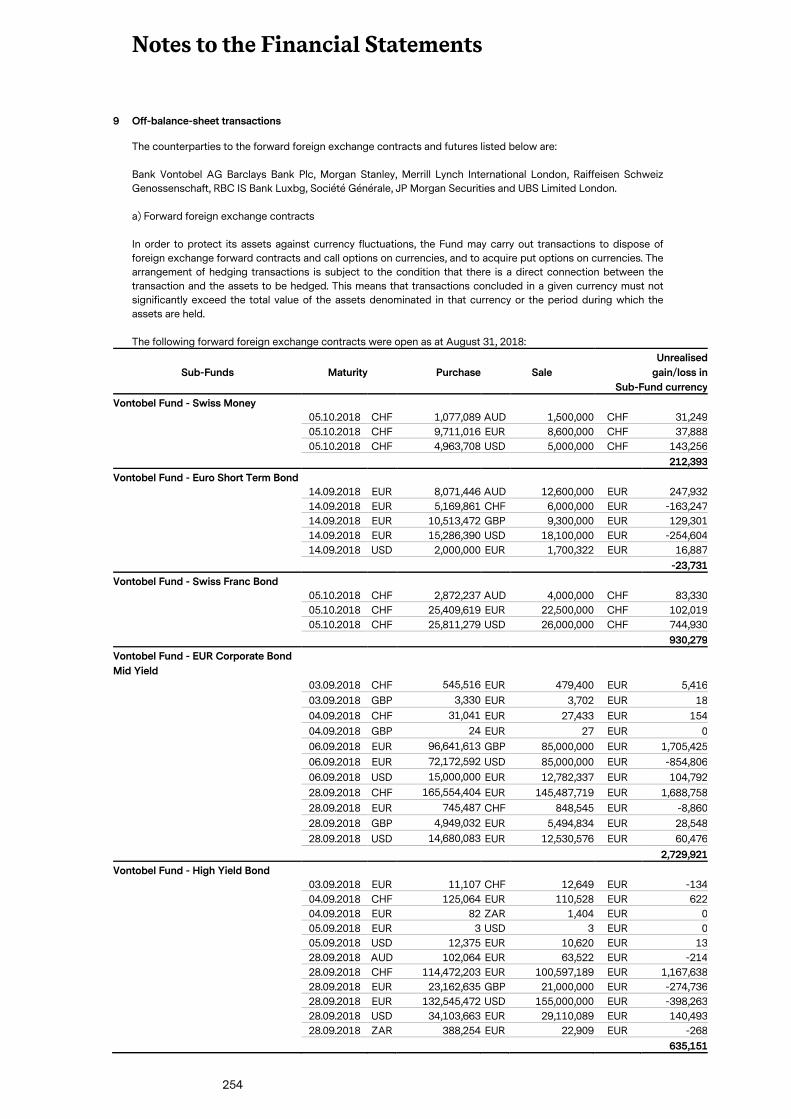
Notes to the Financial Statements
254
9 Off-balance-sheet transactions
The counterparties to the forward foreign exchange contracts and futures listed below are:
Bank Vontobel AG Barclays Bank Plc, Morgan Stanley, Merrill Lynch International London, Raiffeisen Schweiz
Genossenschaft, RBC IS Bank Luxbg, Société Générale, JP Morgan Securities and UBS Limited London.
a) Forward foreign exchange contracts
In order to protect its assets against currency fluctuations, the Fund may carry out transactions to dispose of
foreign exchange forward contracts and call options on currencies, and to acquire put options on currencies. The
arrangement of hedging transactions is subject to the condition that there is a direct connection between the
transaction and the assets to be hedged. This means that transactions concluded in a given currency must not
significantly exceed the total value of the assets denominated in that currency or the period during which the
assets are held.
The following forward foreign exchange contracts were open as at August 31, 2018:
Sub-Funds Maturity Purchase Sale
Unrealised
gain/loss in
Sub-Fund currency
Vontobel Fund - Swiss Money
05.10.2018 CHF 1,077,089 AUD 1,500,000 CHF 31,249
05.10.2018 CHF 9,711,016 EUR 8,600,000 CHF 37,888
05.10.2018 CHF 4,963,708 USD 5,000,000 CHF 143,256
212,393
Vontobel Fund - Euro Short Term Bond
14.09.2018 EUR 8,071,446 AUD 12,600,000 EUR 247,932
14.09.2018 EUR 5,169,861 CHF 6,000,000 EUR -163,247
14.09.2018 EUR 10,513,472 GBP 9,300,000 EUR 129,301
14.09.2018 EUR 15,286,390 USD 18,100,000 EUR -254,604
14.09.2018 USD 2,000,000 EUR 1,700,322 EUR 16,887
-23,731
Vontobel Fund - Swiss Franc Bond
05.10.2018 CHF 2,872,237 AUD 4,000,000 CHF 83,330
05.10.2018 CHF 25,409,619 EUR 22,500,000 CHF 102,019
05.10.2018 CHF 25,811,279 USD 26,000,000 CHF 744,930
930,279
Vontobel Fund - EUR Corporate Bond
Mid Yield
03.09.2018 CHF 545,516 EUR 479,400 EUR 5,416
03.09.2018 GBP 3,330 EUR 3,702 EUR 18
04.09.2018 CHF 31,041 EUR 27,433 EUR 154
04.09.2018 GBP 24 EUR 27 EUR 0
06.09.2018 EUR 96,641,613 GBP 85,000,000 EUR 1,705,425
06.09.2018 EUR 72,172,592 USD 85,000,000 EUR -854,806
06.09.2018 USD 15,000,000 EUR 12,782,337 EUR 104,792
28.09.2018 CHF 165,554,404 EUR 145,487,719 EUR 1,688,758
28.09.2018 EUR 745,487 CHF 848,545 EUR -8,860
28.09.2018 GBP 4,949,032 EUR 5,494,834 EUR 28,548
28.09.2018 USD 14,680,083 EUR 12,530,576 EUR 60,476
2,729,921
Vontobel Fund - High Yield Bond
03.09.2018 EUR 11,107 CHF 12,649 EUR -134
04.09.2018 CHF 125,064 EUR 110,528 EUR 622
04.09.2018 EUR 82 ZAR 1,404 EUR 0
05.09.2018 EUR 3 USD 3 EUR 0
05.09.2018 USD 12,375 EUR 10,620 EUR 13
28.09.2018 AUD 102,064 EUR 63,522 EUR -214
28.09.2018 CHF 114,472,203 EUR 100,597,189 EUR 1,167,638
28.09.2018 EUR 23,162,635 GBP 21,000,000 EUR -274,736
28.09.2018 EUR 132,545,472 USD 155,000,000 EUR -398,263
28.09.2018 USD 34,103,663 EUR 29,110,089 EUR 140,493
28.09.2018 ZAR 388,254 EUR 22,909 EUR -268
635,151
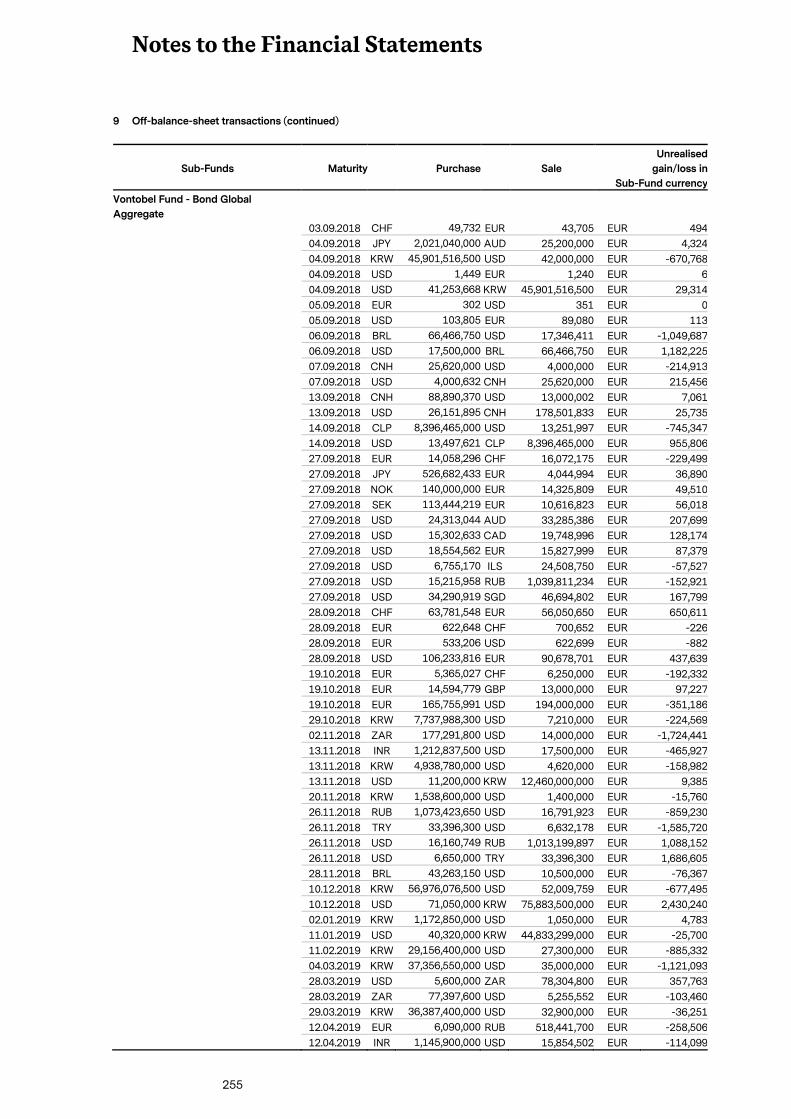
Notes to the Financial Statements
255
9 Off-balance-sheet transactions (continued)
Sub-Funds Maturity Purchase Sale
Unrealised
gain/loss in
Sub-Fund currency
Vontobel Fund - Bond Global
Aggregate
03.09.2018 CHF 49,732 EUR 43,705 EUR 494
04.09.2018 JPY 2,021,040,000 AUD 25,200,000 EUR 4,324
04.09.2018 KRW 45,901,516,500 USD 42,000,000 EUR -670,768
04.09.2018 USD 1,449 EUR 1,240 EUR 6
04.09.2018 USD 41,253,668 KRW 45,901,516,500 EUR 29,314
05.09.2018 EUR 302 USD 351 EUR 0
05.09.2018 USD 103,805 EUR 89,080 EUR 113
06.09.2018 BRL 66,466,750 USD 17,346,411 EUR -1,049,687
06.09.2018 USD 17,500,000 BRL 66,466,750 EUR 1,182,225
07.09.2018 CNH 25,620,000 USD 4,000,000 EUR -214,913
07.09.2018 USD 4,000,632 CNH 25,620,000 EUR 215,456
13.09.2018 CNH 88,890,370 USD 13,000,002 EUR 7,061
13.09.2018 USD 26,151,895 CNH 178,501,833 EUR 25,735
14.09.2018 CLP 8,396,465,000 USD 13,251,997 EUR -745,347
14.09.2018 USD 13,497,621 CLP 8,396,465,000 EUR 955,806
27.09.2018 EUR 14,058,296 CHF 16,072,175 EUR -229,499
27.09.2018 JPY 526,682,433 EUR 4,044,994 EUR 36,890
27.09.2018 NOK 140,000,000 EUR 14,325,809 EUR 49,510
27.09.2018 SEK 113,444,219 EUR 10,616,823 EUR 56,018
27.09.2018 USD 24,313,044 AUD 33,285,386 EUR 207,699
27.09.2018 USD 15,302,633 CAD 19,748,996 EUR 128,174
27.09.2018 USD 18,554,562 EUR 15,827,999 EUR 87,379
27.09.2018 USD 6,755,170 ILS 24,508,750 EUR -57,527
27.09.2018 USD 15,215,958 RUB 1,039,811,234 EUR -152,921
27.09.2018 USD 34,290,919 SGD 46,694,802 EUR 167,799
28.09.2018 CHF 63,781,548 EUR 56,050,650 EUR 650,611
28.09.2018 EUR 622,648 CHF 700,652 EUR -226
28.09.2018 EUR 533,206 USD 622,699 EUR -882
28.09.2018 USD 106,233,816 EUR 90,678,701 EUR 437,639
19.10.2018 EUR 5,365,027 CHF 6,250,000 EUR -192,332
19.10.2018 EUR 14,594,779 GBP 13,000,000 EUR 97,227
19.10.2018 EUR 165,755,991 USD 194,000,000 EUR -351,186
29.10.2018 KRW 7,737,988,300 USD 7,210,000 EUR -224,569
02.11.2018 ZAR 177,291,800 USD 14,000,000 EUR -1,724,441
13.11.2018 INR 1,212,837,500 USD 17,500,000 EUR -465,927
13.11.2018 KRW 4,938,780,000 USD 4,620,000 EUR -158,982
13.11.2018 USD 11,200,000 KRW 12,460,000,000 EUR 9,385
20.11.2018 KRW 1,538,600,000 USD 1,400,000 EUR -15,760
26.11.2018 RUB 1,073,423,650 USD 16,791,923 EUR -859,230
26.11.2018 TRY 33,396,300 USD 6,632,178 EUR -1,585,720
26.11.2018 USD 16,160,749 RUB 1,013,199,897 EUR 1,088,152
26.11.2018 USD 6,650,000 TRY 33,396,300 EUR 1,686,605
28.11.2018 BRL 43,263,150 USD 10,500,000 EUR -76,367
10.12.2018 KRW 56,976,076,500 USD 52,009,759 EUR -677,495
10.12.2018 USD 71,050,000 KRW 75,883,500,000 EUR 2,430,240
02.01.2019 KRW 1,172,850,000 USD 1,050,000 EUR 4,783
11.01.2019 USD 40,320,000 KRW 44,833,299,000 EUR -25,700
11.02.2019 KRW 29,156,400,000 USD 27,300,000 EUR -885,332
04.03.2019 KRW 37,356,550,000 USD 35,000,000 EUR -1,121,093
28.03.2019 USD 5,600,000 ZAR 78,304,800 EUR 357,763
28.03.2019 ZAR 77,397,600 USD 5,255,552 EUR -103,460
29.03.2019 KRW 36,387,400,000 USD 32,900,000 EUR -36,251
12.04.2019 EUR 6,090,000 RUB 518,441,700 EUR -258,506
12.04.2019 INR 1,145,900,000 USD 15,854,502 EUR -114,099
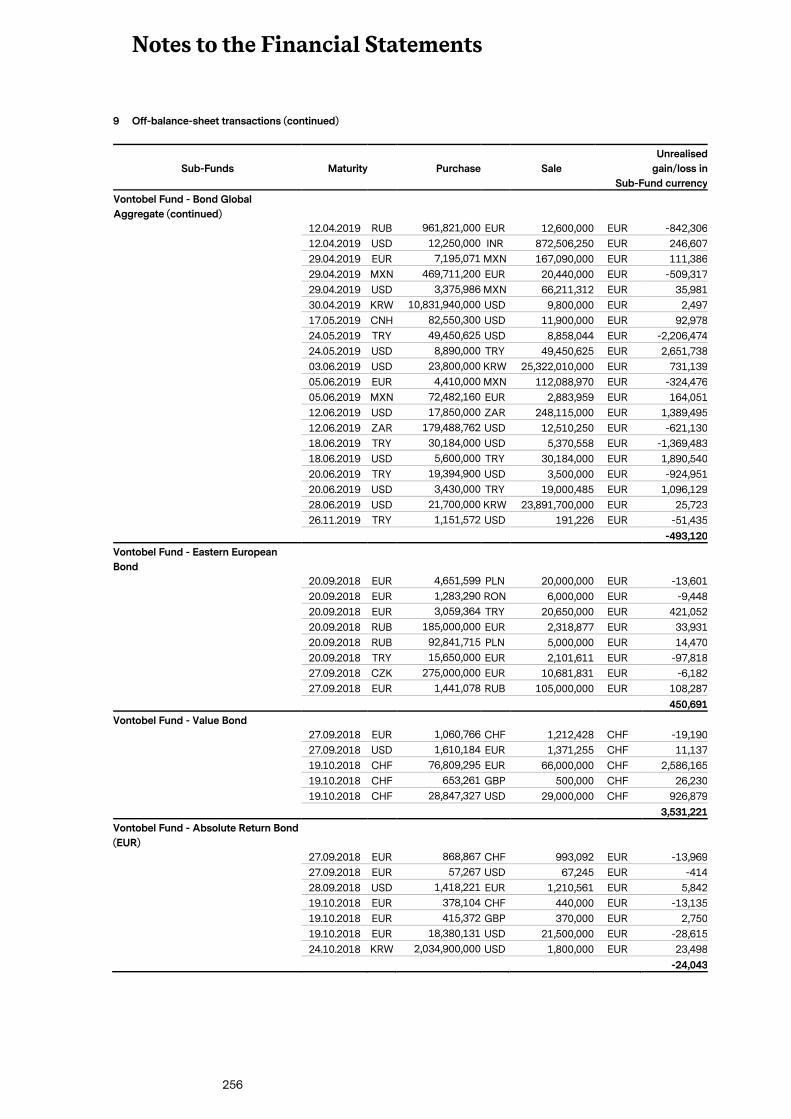
Notes to the Financial Statements
256
9 Off-balance-sheet transactions (continued)
Sub-Funds Maturity Purchase Sale
Unrealised
gain/loss in
Sub-Fund currency
Vontobel Fund - Bond Global
Aggregate (continued)
12.04.2019 RUB 961,821,000 EUR 12,600,000 EUR -842,306
12.04.2019 USD 12,250,000 INR 872,506,250 EUR 246,607
29.04.2019 EUR 7,195,071 MXN 167,090,000 EUR 111,386
29.04.2019 MXN 469,711,200 EUR 20,440,000 EUR -509,317
29.04.2019 USD 3,375,986 MXN 66,211,312 EUR 35,981
30.04.2019 KRW 10,831,940,000 USD 9,800,000 EUR 2,497
17.05.2019 CNH 82,550,300 USD 11,900,000 EUR 92,978
24.05.2019 TRY 49,450,625 USD 8,858,044 EUR -2,206,474
24.05.2019 USD 8,890,000 TRY 49,450,625 EUR 2,651,738
03.06.2019 USD 23,800,000 KRW 25,322,010,000 EUR 731,139
05.06.2019 EUR 4,410,000 MXN 112,088,970 EUR -324,476
05.06.2019 MXN 72,482,160 EUR 2,883,959 EUR 164,051
12.06.2019 USD 17,850,000 ZAR 248,115,000 EUR 1,389,495
12.06.2019 ZAR 179,488,762 USD 12,510,250 EUR -621,130
18.06.2019 TRY 30,184,000 USD 5,370,558 EUR -1,369,483
18.06.2019 USD 5,600,000 TRY 30,184,000 EUR 1,890,540
20.06.2019 TRY 19,394,900 USD 3,500,000 EUR -924,951
20.06.2019 USD 3,430,000 TRY 19,000,485 EUR 1,096,129
28.06.2019 USD 21,700,000 KRW 23,891,700,000 EUR 25,723
26.11.2019 TRY 1,151,572 USD 191,226 EUR -51,435
-493,120
Vontobel Fund - Eastern European
Bond
20.09.2018 EUR 4,651,599 PLN 20,000,000 EUR -13,601
20.09.2018 EUR 1,283,290 RON 6,000,000 EUR -9,448
20.09.2018 EUR 3,059,364 TRY 20,650,000 EUR 421,052
20.09.2018 RUB 185,000,000 EUR 2,318,877 EUR 33,931
20.09.2018 RUB 92,841,715 PLN 5,000,000 EUR 14,470
20.09.2018 TRY 15,650,000 EUR 2,101,611 EUR -97,818
27.09.2018 CZK 275,000,000 EUR 10,681,831 EUR -6,182
27.09.2018 EUR 1,441,078 RUB 105,000,000 EUR 108,287
450,691
Vontobel Fund - Value Bond
27.09.2018 EUR 1,060,766 CHF 1,212,428 CHF -19,190
27.09.2018 USD 1,610,184 EUR 1,371,255 CHF 11,137
19.10.2018 CHF 76,809,295 EUR 66,000,000 CHF 2,586,165
19.10.2018 CHF 653,261 GBP 500,000 CHF 26,230
19.10.2018 CHF 28,847,327 USD 29,000,000 CHF 926,879
3,531,221
Vontobel Fund - Absolute Return Bond
(EUR)
27.09.2018 EUR 868,867 CHF 993,092 EUR -13,969
27.09.2018 EUR 57,267 USD 67,245 EUR -414
28.09.2018 USD 1,418,221 EUR 1,210,561 EUR 5,842
19.10.2018 EUR 378,104 CHF 440,000 EUR -13,135
19.10.2018 EUR 415,372 GBP 370,000 EUR 2,750
19.10.2018 EUR 18,380,131 USD 21,500,000 EUR -28,615
24.10.2018 KRW 2,034,900,000 USD 1,800,000 EUR 23,498
-24,043
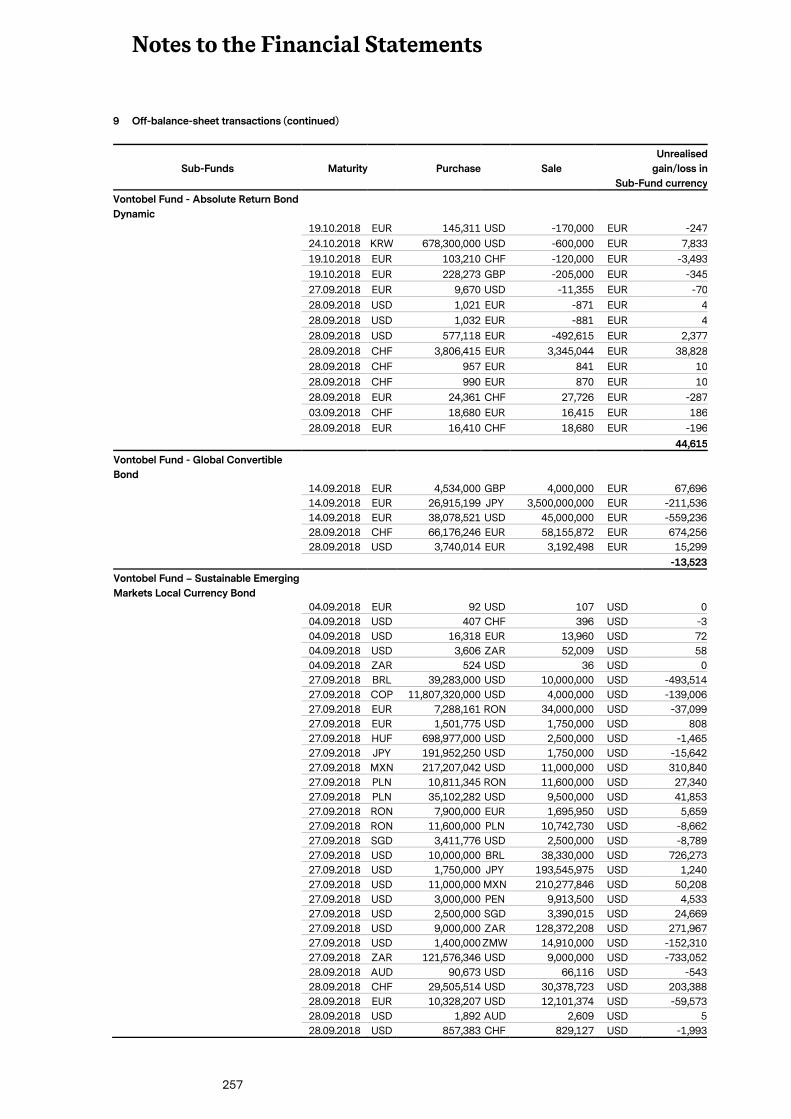
Notes to the Financial Statements
257
9 Off-balance-sheet transactions (continued)
Sub-Funds Maturity Purchase Sale
Unrealised
gain/loss in
Sub-Fund currency
Vontobel Fund - Absolute Return Bond
Dynamic
19.10.2018 EUR 145,311 USD -170,000 EUR -247
24.10.2018 KRW 678,300,000 USD -600,000 EUR 7,833
19.10.2018 EUR 103,210 CHF -120,000 EUR -3,493
19.10.2018 EUR 228,273 GBP -205,000 EUR -345
27.09.2018 EUR 9,670 USD -11,355 EUR -70
28.09.2018 USD 1,021 EUR -871 EUR 4
28.09.2018 USD 1,032 EUR -881 EUR 4
28.09.2018 USD 577,118 EUR -492,615 EUR 2,377
28.09.2018 CHF 3,806,415 EUR 3,345,044 EUR 38,828
28.09.2018 CHF 957 EUR 841 EUR 10
28.09.2018 CHF 990 EUR 870 EUR 10
28.09.2018 EUR 24,361 CHF 27,726 EUR -287
03.09.2018 CHF 18,680 EUR 16,415 EUR 186
28.09.2018 EUR 16,410 CHF 18,680 EUR -196
44,615
Vontobel Fund - Global Convertible
Bond
14.09.2018 EUR 4,534,000 GBP 4,000,000 EUR 67,696
14.09.2018 EUR 26,915,199 JPY 3,500,000,000 EUR -211,536
14.09.2018 EUR 38,078,521 USD 45,000,000 EUR -559,236
28.09.2018 CHF 66,176,246 EUR 58,155,872 EUR 674,256
28.09.2018 USD 3,740,014 EUR 3,192,498 EUR 15,299
-13,523
Vontobel Fund – Sustainable Emerging
Markets Local Currency Bond
04.09.2018 EUR 92 USD 107 USD 0
04.09.2018 USD 407 CHF 396 USD -3
04.09.2018 USD 16,318 EUR 13,960 USD 72
04.09.2018 USD 3,606 ZAR 52,009 USD 58
04.09.2018 ZAR 524 USD 36 USD 0
27.09.2018 BRL 39,283,000 USD 10,000,000 USD -493,514
27.09.2018 COP 11,807,320,000 USD 4,000,000 USD -139,006
27.09.2018 EUR 7,288,161 RON 34,000,000 USD -37,099
27.09.2018 EUR 1,501,775 USD 1,750,000 USD 808
27.09.2018 HUF 698,977,000 USD 2,500,000 USD -1,465
27.09.2018 JPY 191,952,250 USD 1,750,000 USD -15,642
27.09.2018 MXN 217,207,042 USD 11,000,000 USD 310,840
27.09.2018 PLN 10,811,345 RON 11,600,000 USD 27,340
27.09.2018 PLN 35,102,282 USD 9,500,000 USD 41,853
27.09.2018 RON 7,900,000 EUR 1,695,950 USD 5,659
27.09.2018 RON 11,600,000 PLN 10,742,730 USD -8,662
27.09.2018 SGD 3,411,776 USD 2,500,000 USD -8,789
27.09.2018 USD 10,000,000 BRL 38,330,000 USD 726,273
27.09.2018 USD 1,750,000 JPY 193,545,975 USD 1,240
27.09.2018 USD 11,000,000 MXN 210,277,846 USD 50,208
27.09.2018 USD 3,000,000 PEN 9,913,500 USD 4,533
27.09.2018 USD 2,500,000 SGD 3,390,015 USD 24,669
27.09.2018 USD 9,000,000 ZAR 128,372,208 USD 271,967
27.09.2018 USD 1,400,000 ZMW 14,910,000 USD -152,310
27.09.2018 ZAR 121,576,346 USD 9,000,000 USD -733,052
28.09.2018 AUD 90,673 USD 66,116 USD -543
28.09.2018 CHF 29,505,514 USD 30,378,723 USD 203,388
28.09.2018 EUR 10,328,207 USD 12,101,374 USD -59,573
28.09.2018 USD 1,892 AUD 2,609 USD 5
28.09.2018 USD 857,383 CHF 829,127 USD -1,993
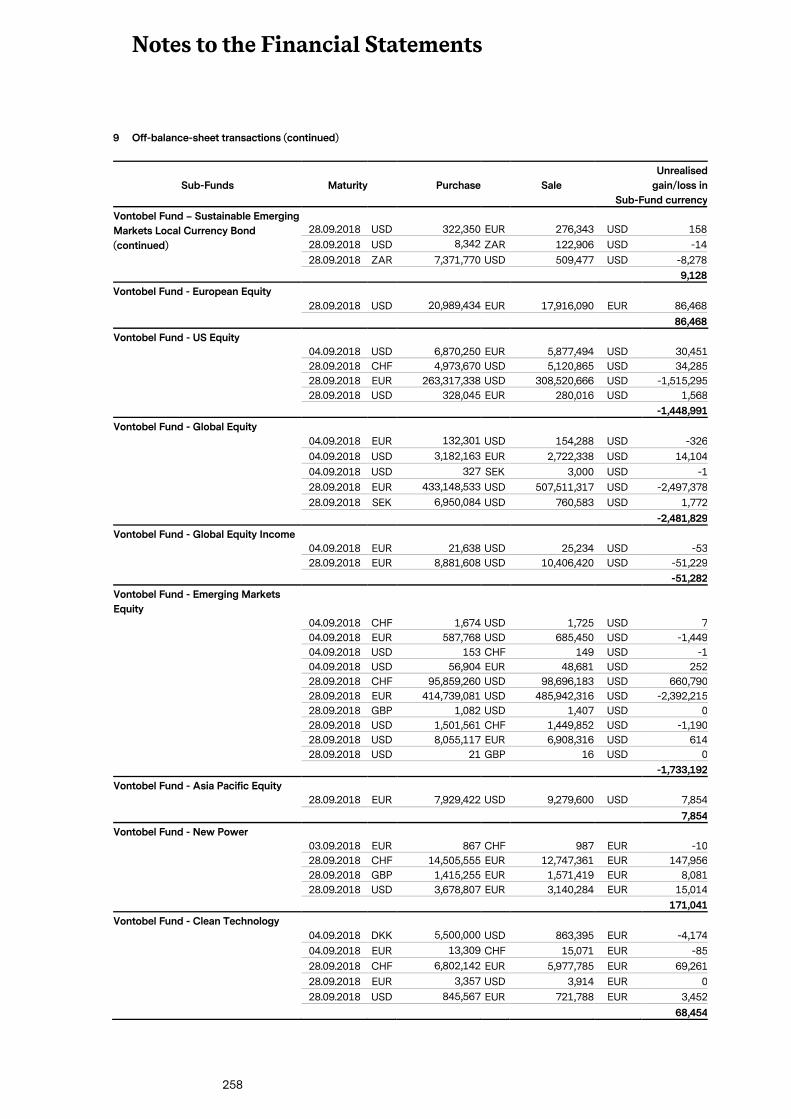
Notes to the Financial Statements
258
9 Off-balance-sheet transactions (continued)
Sub-Funds Maturity Purchase Sale
Unrealised
gain/loss in
Sub-Fund currency
Vontobel Fund – Sustainable Emerging
Markets Local Currency Bond
(continued)
28.09.2018 USD 322,350 EUR 276,343 USD 158
28.09.2018 USD 8,342 ZAR 122,906 USD -14
28.09.2018 ZAR 7,371,770 USD 509,477 USD -8,278
9,128
Vontobel Fund - European Equity
28.09.2018 USD 20,989,434 EUR 17,916,090 EUR 86,468
86,468
Vontobel Fund - US Equity
04.09.2018 USD 6,870,250 EUR 5,877,494 USD 30,451
28.09.2018 CHF 4,973,670 USD 5,120,865 USD 34,285
28.09.2018 EUR 263,317,338 USD 308,520,666 USD -1,515,295
28.09.2018 USD 328,045 EUR 280,016 USD 1,568
-1,448,991
Vontobel Fund - Global Equity
04.09.2018 EUR 132,301 USD 154,288 USD -326
04.09.2018 USD 3,182,163 EUR 2,722,338 USD 14,104
04.09.2018 USD 327 SEK 3,000 USD -1
28.09.2018 EUR 433,148,533 USD 507,511,317 USD -2,497,378
28.09.2018 SEK 6,950,084 USD 760,583 USD 1,772
-2,481,829
Vontobel Fund - Global Equity Income
04.09.2018 EUR 21,638 USD 25,234 USD -53
28.09.2018 EUR 8,881,608 USD 10,406,420 USD -51,229
-51,282
Vontobel Fund - Emerging Markets
Equity
04.09.2018 CHF 1,674 USD 1,725 USD 7
04.09.2018 EUR 587,768 USD 685,450 USD -1,449
04.09.2018 USD 153 CHF 149 USD -1
04.09.2018 USD 56,904 EUR 48,681 USD 252
28.09.2018 CHF 95,859,260 USD 98,696,183 USD 660,790
28.09.2018 EUR 414,739,081 USD 485,942,316 USD -2,392,215
28.09.2018 GBP 1,082 USD 1,407 USD 0
28.09.2018 USD 1,501,561 CHF 1,449,852 USD -1,190
28.09.2018 USD 8,055,117 EUR 6,908,316 USD 614
28.09.2018 USD 21 GBP 16 USD 0
-1,733,192
Vontobel Fund - Asia Pacific Equity
28.09.2018 EUR 7,929,422 USD 9,279,600 USD 7,854
7,854
Vontobel Fund - New Power
03.09.2018 EUR 867 CHF 987 EUR -10
28.09.2018 CHF 14,505,555 EUR 12,747,361 EUR 147,956
28.09.2018 GBP 1,415,255 EUR 1,571,419 EUR 8,081
28.09.2018 USD 3,678,807 EUR 3,140,284 EUR 15,014
171,041
Vontobel Fund - Clean Technology
04.09.2018 DKK 5,500,000 USD 863,395 EUR -4,174
04.09.2018 EUR 13,309 CHF 15,071 EUR -85
28.09.2018 CHF 6,802,142 EUR 5,977,785 EUR 69,261
28.09.2018 EUR 3,357 USD 3,914 EUR 0
28.09.2018 USD 845,567 EUR 721,788 EUR 3,452
68,454
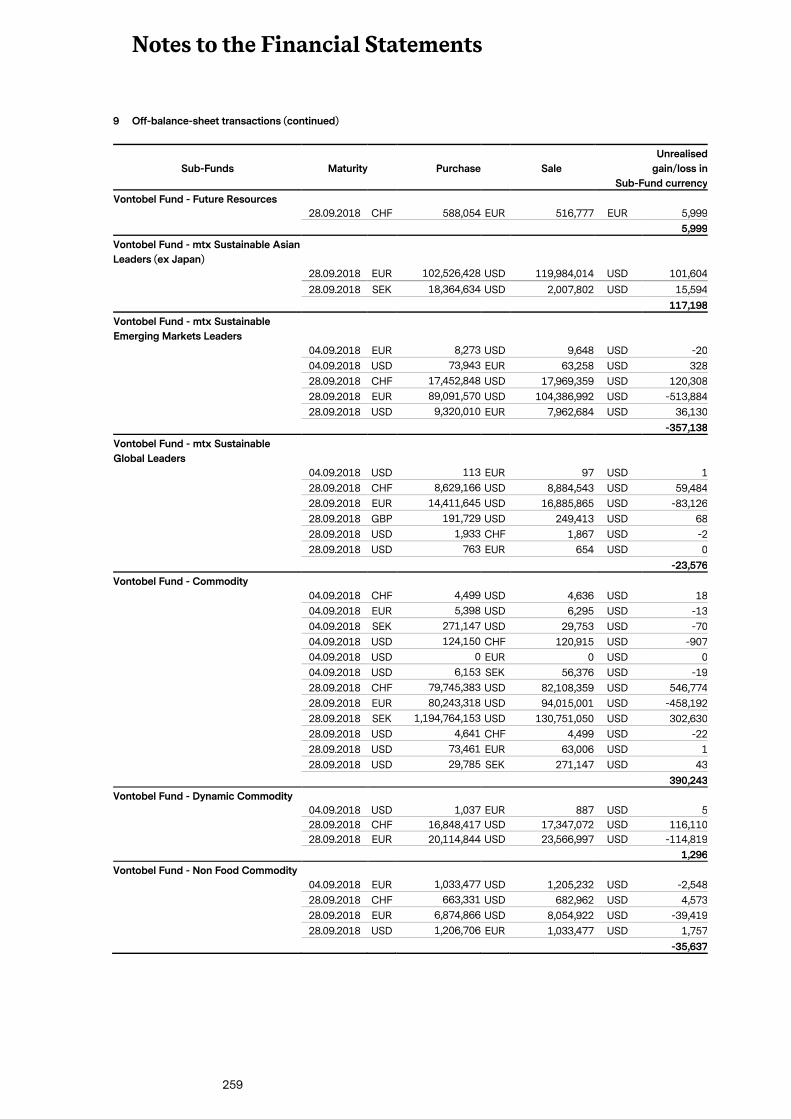
Notes to the Financial Statements
259
9 Off-balance-sheet transactions (continued)
Sub-Funds Maturity Purchase Sale
Unrealised
gain/loss in
Sub-Fund currency
Vontobel Fund - Future Resources
28.09.2018 CHF 588,054 EUR 516,777 EUR 5,999
5,999
Vontobel Fund - mtx Sustainable Asian
Leaders (ex Japan)
28.09.2018 EUR 102,526,428 USD 119,984,014 USD 101,604
28.09.2018 SEK 18,364,634 USD 2,007,802 USD 15,594
117,198
Vontobel Fund - mtx Sustainable
Emerging Markets Leaders
04.09.2018 EUR 8,273 USD 9,648 USD -20
04.09.2018 USD 73,943 EUR 63,258 USD 328
28.09.2018 CHF 17,452,848 USD 17,969,359 USD 120,308
28.09.2018 EUR 89,091,570 USD 104,386,992 USD -513,884
28.09.2018 USD 9,320,010 EUR 7,962,684 USD 36,130
-357,138
Vontobel Fund - mtx Sustainable
Global Leaders
04.09.2018 USD 113 EUR 97 USD 1
28.09.2018 CHF 8,629,166 USD 8,884,543 USD 59,484
28.09.2018 EUR 14,411,645 USD 16,885,865 USD -83,126
28.09.2018 GBP 191,729 USD 249,413 USD 68
28.09.2018 USD 1,933 CHF 1,867 USD -2
28.09.2018 USD 763 EUR 654 USD 0
-23,576
Vontobel Fund - Commodity
04.09.2018 CHF 4,499 USD 4,636 USD 18
04.09.2018 EUR 5,398 USD 6,295 USD -13
04.09.2018 SEK 271,147 USD 29,753 USD -70
04.09.2018 USD 124,150 CHF 120,915 USD -907
04.09.2018 USD 0 EUR 0 USD 0
04.09.2018 USD 6,153 SEK 56,376 USD -19
28.09.2018 CHF 79,745,383 USD 82,108,359 USD 546,774
28.09.2018 EUR 80,243,318 USD 94,015,001 USD -458,192
28.09.2018 SEK 1,194,764,153 USD 130,751,050 USD 302,630
28.09.2018 USD 4,641 CHF 4,499 USD -22
28.09.2018 USD 73,461 EUR 63,006 USD 1
28.09.2018 USD 29,785 SEK 271,147 USD 43
390,243
Vontobel Fund - Dynamic Commodity
04.09.2018 USD 1,037 EUR 887 USD 5
28.09.2018 CHF 16,848,417 USD 17,347,072 USD 116,110
28.09.2018 EUR 20,114,844 USD 23,566,997 USD -114,819
1,296
Vontobel Fund - Non Food Commodity
04.09.2018 EUR 1,033,477 USD 1,205,232 USD -2,548
28.09.2018 CHF 663,331 USD 682,962 USD 4,573
28.09.2018 EUR 6,874,866 USD 8,054,922 USD -39,419
28.09.2018 USD 1,206,706 EUR 1,033,477 USD 1,757
-35,637
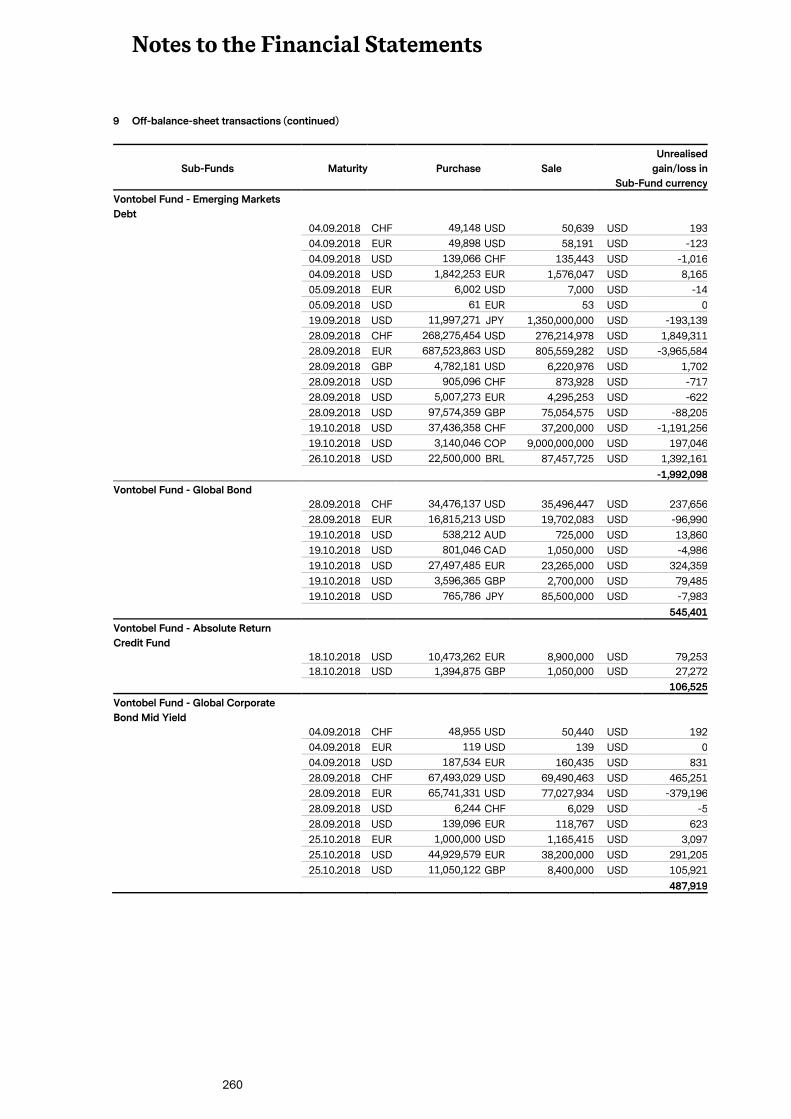
Notes to the Financial Statements
260
9 Off-balance-sheet transactions (continued)
Sub-Funds Maturity Purchase Sale
Unrealised
gain/loss in
Sub-Fund currency
Vontobel Fund - Emerging Markets
Debt
04.09.2018 CHF 49,148 USD 50,639 USD 193
04.09.2018 EUR 49,898 USD 58,191 USD -123
04.09.2018 USD 139,066 CHF 135,443 USD -1,016
04.09.2018 USD 1,842,253 EUR 1,576,047 USD 8,165
05.09.2018 EUR 6,002 USD 7,000 USD -14
05.09.2018 USD 61 EUR 53 USD 0
19.09.2018 USD 11,997,271 JPY 1,350,000,000 USD -193,139
28.09.2018 CHF 268,275,454 USD 276,214,978 USD 1,849,311
28.09.2018 EUR 687,523,863 USD 805,559,282 USD -3,965,584
28.09.2018 GBP 4,782,181 USD 6,220,976 USD 1,702
28.09.2018 USD 905,096 CHF 873,928 USD -717
28.09.2018 USD 5,007,273 EUR 4,295,253 USD -622
28.09.2018 USD 97,574,359 GBP 75,054,575 USD -88,205
19.10.2018 USD 37,436,358 CHF 37,200,000 USD -1,191,256
19.10.2018 USD 3,140,046 COP 9,000,000,000 USD 197,046
26.10.2018 USD 22,500,000 BRL 87,457,725 USD 1,392,161
-1,992,098
Vontobel Fund - Global Bond
28.09.2018 CHF 34,476,137 USD 35,496,447 USD 237,656
28.09.2018 EUR 16,815,213 USD 19,702,083 USD -96,990
19.10.2018 USD 538,212 AUD 725,000 USD 13,860
19.10.2018 USD 801,046 CAD 1,050,000 USD -4,986
19.10.2018 USD 27,497,485 EUR 23,265,000 USD 324,359
19.10.2018 USD 3,596,365 GBP 2,700,000 USD 79,485
19.10.2018 USD 765,786 JPY 85,500,000 USD -7,983
545,401
Vontobel Fund - Absolute Return
Credit Fund
18.10.2018 USD 10,473,262 EUR 8,900,000 USD 79,253
18.10.2018 USD 1,394,875 GBP 1,050,000 USD 27,272
106,525
Vontobel Fund - Global Corporate
Bond Mid Yield
04.09.2018 CHF 48,955 USD 50,440 USD 192
04.09.2018 EUR 119 USD 139 USD 0
04.09.2018 USD 187,534 EUR 160,435 USD 831
28.09.2018 CHF 67,493,029 USD 69,490,463 USD 465,251
28.09.2018 EUR 65,741,331 USD 77,027,934 USD -379,196
28.09.2018 USD 6,244 CHF 6,029 USD -5
28.09.2018 USD 139,096 EUR 118,767 USD 623
25.10.2018 EUR 1,000,000 USD 1,165,415 USD 3,097
25.10.2018 USD 44,929,579 EUR 38,200,000 USD 291,205
25.10.2018 USD 11,050,122 GBP 8,400,000 USD 105,921
487,919
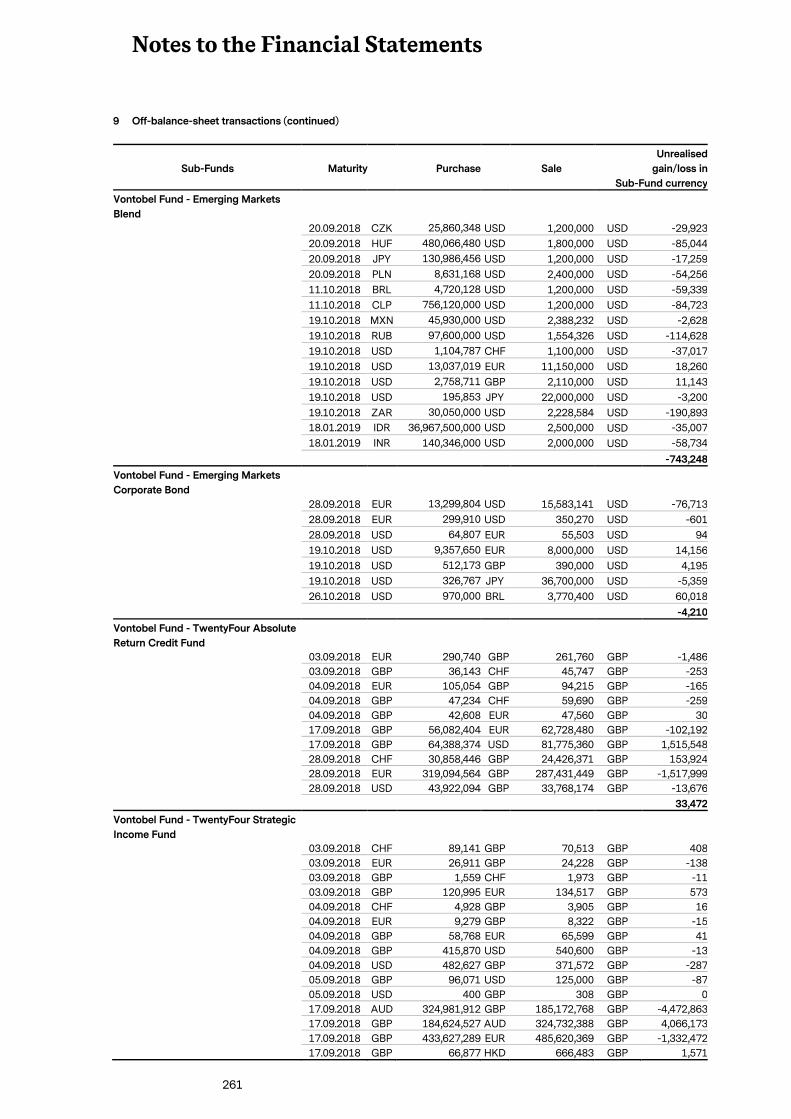
Notes to the Financial Statements
261
9 Off-balance-sheet transactions (continued)
Sub-Funds Maturity Purchase Sale
Unrealised
gain/loss in
Sub-Fund currency
Vontobel Fund - Emerging Markets
Blend
20.09.2018 CZK 25,860,348 USD 1,200,000 USD -29,923
20.09.2018 HUF 480,066,480 USD 1,800,000 USD -85,044
20.09.2018 JPY 130,986,456 USD 1,200,000 USD -17,259
20.09.2018 PLN 8,631,168 USD 2,400,000 USD -54,256
11.10.2018 BRL 4,720,128 USD 1,200,000 USD -59,339
11.10.2018 CLP 756,120,000 USD 1,200,000 USD -84,723
19.10.2018 MXN 45,930,000 USD 2,388,232 USD -2,628
19.10.2018 RUB 97,600,000 USD 1,554,326 USD -114,628
19.10.2018 USD 1,104,787 CHF 1,100,000 USD -37,017
19.10.2018 USD 13,037,019 EUR 11,150,000 USD 18,260
19.10.2018 USD 2,758,711 GBP 2,110,000 USD 11,143
19.10.2018 USD 195,853 JPY 22,000,000 USD -3,200
19.10.2018 ZAR 30,050,000 USD 2,228,584 USD -190,893
18.01.2019 IDR 36,967,500,000 USD 2,500,000 USD -35,007
18.01.2019 INR 140,346,000 USD 2,000,000 USD -58,734
-743,248
Vontobel Fund - Emerging Markets
Corporate Bond
28.09.2018 EUR 13,299,804 USD 15,583,141 USD -76,713
28.09.2018 EUR 299,910 USD 350,270 USD -601
28.09.2018 USD 64,807 EUR 55,503 USD 94
19.10.2018 USD 9,357,650 EUR 8,000,000 USD 14,156
19.10.2018 USD 512,173 GBP 390,000 USD 4,195
19.10.2018 USD 326,767 JPY 36,700,000 USD -5,359
26.10.2018 USD 970,000 BRL 3,770,400 USD 60,018
-4,210
Vontobel Fund - TwentyFour Absolute
Return Credit Fund
03.09.2018 EUR 290,740 GBP 261,760 GBP -1,486
03.09.2018 GBP 36,143 CHF 45,747 GBP -253
04.09.2018 EUR 105,054 GBP 94,215 GBP -165
04.09.2018 GBP 47,234 CHF 59,690 GBP -259
04.09.2018 GBP 42,608 EUR 47,560 GBP 30
17.09.2018 GBP 56,082,404 EUR 62,728,480 GBP -102,192
17.09.2018 GBP 64,388,374 USD 81,775,360 GBP 1,515,548
28.09.2018 CHF 30,858,446 GBP 24,426,371 GBP 153,924
28.09.2018 EUR 319,094,564 GBP 287,431,449 GBP -1,517,999
28.09.2018 USD 43,922,094 GBP 33,768,174 GBP -13,676
33,472
Vontobel Fund - TwentyFour Strategic
Income Fund
03.09.2018 CHF 89,141 GBP 70,513 GBP 408
03.09.2018 EUR 26,911 GBP 24,228 GBP -138
03.09.2018 GBP 1,559 CHF 1,973 GBP -11
03.09.2018 GBP 120,995 EUR 134,517 GBP 573
04.09.2018 CHF 4,928 GBP 3,905 GBP 16
04.09.2018 EUR 9,279 GBP 8,322 GBP -15
04.09.2018 GBP 58,768 EUR 65,599 GBP 41
04.09.2018 GBP 415,870 USD 540,600 GBP -13
04.09.2018 USD 482,627 GBP 371,572 GBP -287
05.09.2018 GBP 96,071 USD 125,000 GBP -87
05.09.2018 USD 400 GBP 308 GBP 0
17.09.2018 AUD 324,981,912 GBP 185,172,768 GBP -4,472,863
17.09.2018 GBP 184,624,527 AUD 324,732,388 GBP 4,066,173
17.09.2018 GBP 433,627,289 EUR 485,620,369 GBP -1,332,472
17.09.2018 GBP 66,877 HKD 666,483 GBP 1,571
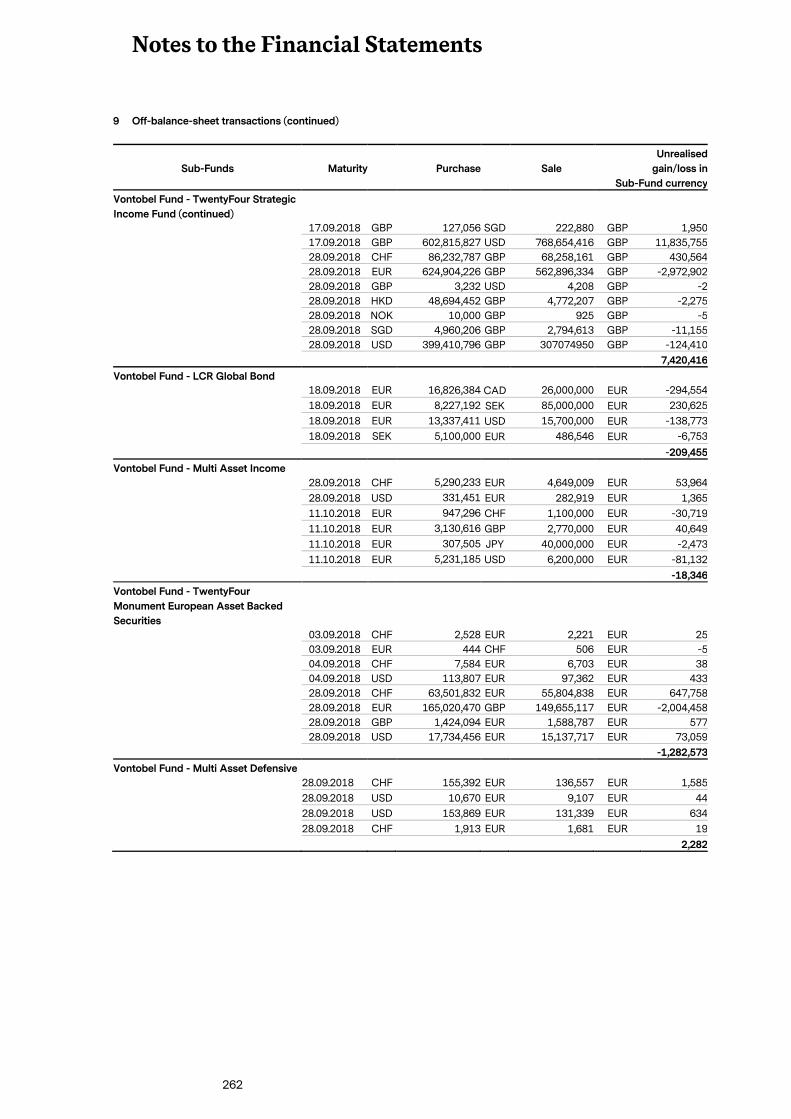
Notes to the Financial Statements
262
9 Off-balance-sheet transactions (continued)
Sub-Funds Maturity Purchase Sale
Unrealised
gain/loss in
Sub-Fund currency
Vontobel Fund - TwentyFour Strategic
Income Fund (continued)
17.09.2018 GBP 127,056 SGD 222,880 GBP 1,950
17.09.2018 GBP 602,815,827 USD 768,654,416 GBP 11,835,755
28.09.2018 CHF 86,232,787 GBP 68,258,161 GBP 430,564
28.09.2018 EUR 624,904,226 GBP 562,896,334 GBP -2,972,902
28.09.2018 GBP 3,232 USD 4,208 GBP -2
28.09.2018 HKD 48,694,452 GBP 4,772,207 GBP -2,275
28.09.2018 NOK 10,000 GBP 925 GBP -5
28.09.2018 SGD 4,960,206 GBP 2,794,613 GBP -11,155
28.09.2018 USD 399,410,796 GBP 307074950 GBP -124,410
7,420,416
Vontobel Fund - LCR Global Bond
18.09.2018 EUR 16,826,384 CAD 26,000,000 EUR -294,554
18.09.2018 EUR 8,227,192 SEK 85,000,000 EUR 230,625
18.09.2018 EUR 13,337,411 USD 15,700,000 EUR -138,773
18.09.2018 SEK 5,100,000 EUR 486,546 EUR -6,753
-209,455
Vontobel Fund - Multi Asset Income
28.09.2018 CHF 5,290,233 EUR 4,649,009 EUR 53,964
28.09.2018 USD 331,451 EUR 282,919 EUR 1,365
11.10.2018 EUR 947,296 CHF 1,100,000 EUR -30,719
11.10.2018 EUR 3,130,616 GBP 2,770,000 EUR 40,649
11.10.2018 EUR 307,505 JPY 40,000,000 EUR -2,473
11.10.2018 EUR 5,231,185 USD 6,200,000 EUR -81,132
-18,346
Vontobel Fund - TwentyFour
Monument European Asset Backed
Securities
03.09.2018 CHF 2,528 EUR 2,221 EUR 25
03.09.2018 EUR 444 CHF 506 EUR -5
04.09.2018 CHF 7,584 EUR 6,703 EUR 38
04.09.2018 USD 113,807 EUR 97,362 EUR 433
28.09.2018 CHF 63,501,832 EUR 55,804,838 EUR 647,758
28.09.2018 EUR 165,020,470 GBP 149,655,117 EUR -2,004,458
28.09.2018 GBP 1,424,094 EUR 1,588,787 EUR 577
28.09.2018 USD 17,734,456 EUR 15,137,717 EUR 73,059
-1,282,573
Vontobel Fund - Multi Asset Defensive
28.09.2018 CHF 155,392 EUR 136,557 EUR 1,585
28.09.2018 USD 10,670 EUR 9,107 EUR 44
28.09.2018 USD 153,869 EUR 131,339 EUR 634
28.09.2018 CHF 1,913 EUR 1,681 EUR 19
2,282
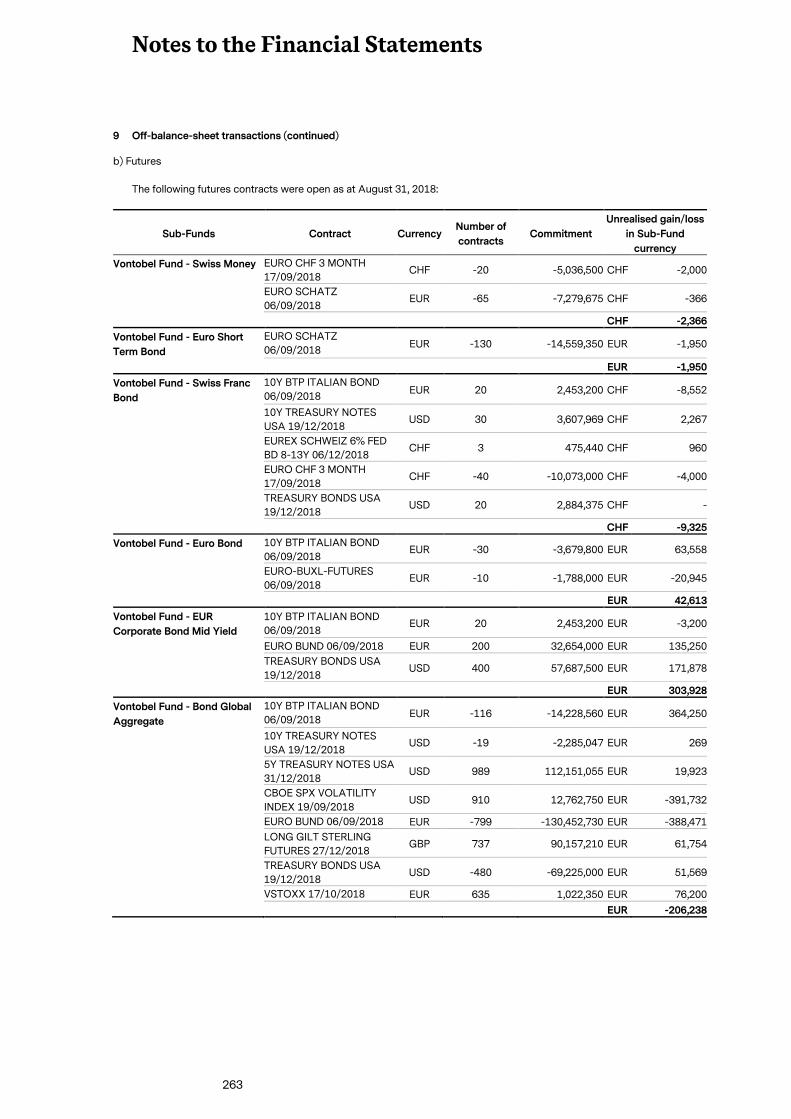
Notes to the Financial Statements
263
9 Off-balance-sheet transactions (continued)
b) Futures
The following futures contracts were open as at August 31, 2018:
Sub-Funds Contract Currency Number of
contracts Commitment
Unrealised gain/loss
in Sub-Fund
currency
Vontobel Fund - Swiss Money EURO CHF 3 MONTH
17/09/2018 CHF -20 -5,036,500 CHF -2,000
EURO SCHATZ
06/09/2018 EUR -65 -7,279,675 CHF -366
CHF -2,366
Vontobel Fund - Euro Short
Term Bond
EURO SCHATZ
06/09/2018 EUR -130 -14,559,350 EUR -1,950
EUR -1,950
Vontobel Fund - Swiss Franc
Bond
10Y BTP ITALIAN BOND
06/09/2018 EUR 20 2,453,200 CHF -8,552
10Y TREASURY NOTES
USA 19/12/2018 USD 30 3,607,969 CHF 2,267
EUREX SCHWEIZ 6% FED
BD 8-13Y 06/12/2018 CHF 3 475,440 CHF 960
EURO CHF 3 MONTH
17/09/2018 CHF -40 -10,073,000 CHF -4,000
TREASURY BONDS USA
19/12/2018 USD 20 2,884,375 CHF -
CHF -9,325
Vontobel Fund - Euro Bond 10Y BTP ITALIAN BOND
06/09/2018 EUR -30 -3,679,800 EUR 63,558
EURO-BUXL-FUTURES
06/09/2018 EUR -10 -1,788,000 EUR -20,945
EUR 42,613
Vontobel Fund - EUR
Corporate Bond Mid Yield
10Y BTP ITALIAN BOND
06/09/2018 EUR 20 2,453,200 EUR -3,200
EURO BUND 06/09/2018 EUR 200 32,654,000 EUR 135,250
TREASURY BONDS USA
19/12/2018 USD 400 57,687,500 EUR 171,878
EUR 303,928
Vontobel Fund - Bond Global
Aggregate
10Y BTP ITALIAN BOND
06/09/2018 EUR -116 -14,228,560 EUR 364,250
10Y TREASURY NOTES
USA 19/12/2018 USD -19 -2,285,047 EUR 269
5Y TREASURY NOTES USA
31/12/2018 USD 989 112,151,055 EUR 19,923
CBOE SPX VOLATILITY
INDEX 19/09/2018 USD 910 12,762,750 EUR -391,732
EURO BUND 06/09/2018 EUR -799 -130,452,730 EUR -388,471
LONG GILT STERLING
FUTURES 27/12/2018 GBP 737 90,157,210 EUR 61,754
TREASURY BONDS USA
19/12/2018 USD -480 -69,225,000 EUR 51,569
VSTOXX 17/10/2018 EUR 635 1,022,350 EUR 76,200
EUR -206,238
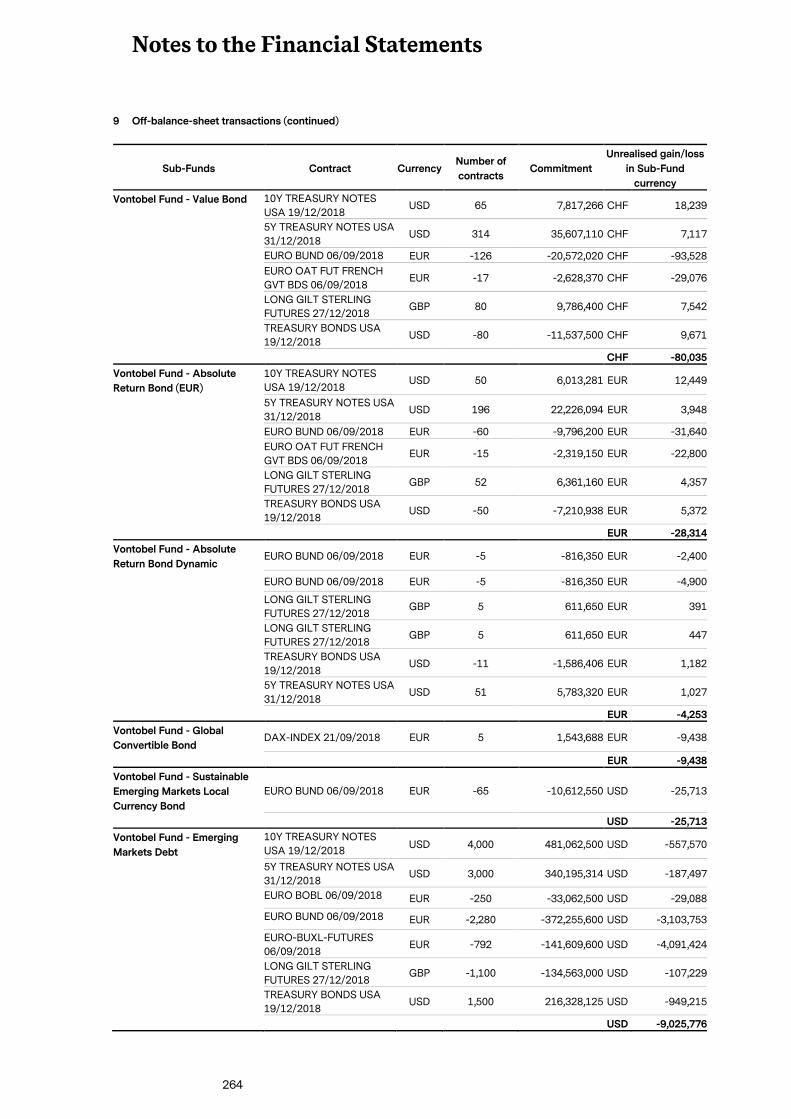
Notes to the Financial Statements
264
9 Off-balance-sheet transactions (continued)
Sub-Funds Contract Currency Number of
contracts Commitment
Unrealised gain/loss
in Sub-Fund
currency
Vontobel Fund - Value Bond 10Y TREASURY NOTES
USA 19/12/2018 USD 65 7,817,266 CHF 18,239
5Y TREASURY NOTES USA
31/12/2018 USD 314 35,607,110 CHF 7,117
EURO BUND 06/09/2018 EUR -126 -20,572,020 CHF -93,528
EURO OAT FUT FRENCH
GVT BDS 06/09/2018 EUR -17 -2,628,370 CHF -29,076
LONG GILT STERLING
FUTURES 27/12/2018 GBP 80 9,786,400 CHF 7,542
TREASURY BONDS USA
19/12/2018 USD -80 -11,537,500 CHF 9,671
CHF -80,035
Vontobel Fund - Absolute
Return Bond (EUR)
10Y TREASURY NOTES
USA 19/12/2018 USD 50 6,013,281 EUR 12,449
5Y TREASURY NOTES USA
31/12/2018 USD 196 22,226,094 EUR 3,948
EURO BUND 06/09/2018 EUR -60 -9,796,200 EUR -31,640
EURO OAT FUT FRENCH
GVT BDS 06/09/2018 EUR -15 -2,319,150 EUR -22,800
LONG GILT STERLING
FUTURES 27/12/2018 GBP 52 6,361,160 EUR 4,357
TREASURY BONDS USA
19/12/2018 USD -50 -7,210,938 EUR 5,372
EUR -28,314
Vontobel Fund - Absolute
Return Bond Dynamic EURO BUND 06/09/2018 EUR -5 -816,350 EUR -2,400
EURO BUND 06/09/2018 EUR -5 -816,350 EUR -4,900
LONG GILT STERLING
FUTURES 27/12/2018 GBP 5 611,650 EUR 391
LONG GILT STERLING
FUTURES 27/12/2018 GBP 5 611,650 EUR 447
TREASURY BONDS USA
19/12/2018 USD -11 -1,586,406 EUR 1,182
5Y TREASURY NOTES USA
31/12/2018 USD 51 5,783,320 EUR 1,027
EUR -4,253
Vontobel Fund - Global
Convertible Bond DAX-INDEX 21/09/2018 EUR 5 1,543,688 EUR -9,438
EUR -9,438
Vontobel Fund - Sustainable
Emerging Markets Local
Currency Bond
EURO BUND 06/09/2018 EUR -65 -10,612,550 USD -25,713
USD -25,713
Vontobel Fund - Emerging
Markets Debt
10Y TREASURY NOTES
USA 19/12/2018 USD 4,000 481,062,500 USD -557,570
5Y TREASURY NOTES USA
31/12/2018 USD 3,000 340,195,314 USD -187,497
EURO BOBL 06/09/2018 EUR -250 -33,062,500 USD -29,088
EURO BUND 06/09/2018 EUR -2,280 -372,255,600 USD -3,103,753
EURO-BUXL-FUTURES
06/09/2018 EUR -792 -141,609,600 USD -4,091,424
LONG GILT STERLING
FUTURES 27/12/2018 GBP -1,100 -134,563,000 USD -107,229
TREASURY BONDS USA
19/12/2018 USD 1,500 216,328,125 USD -949,215
USD -9,025,776
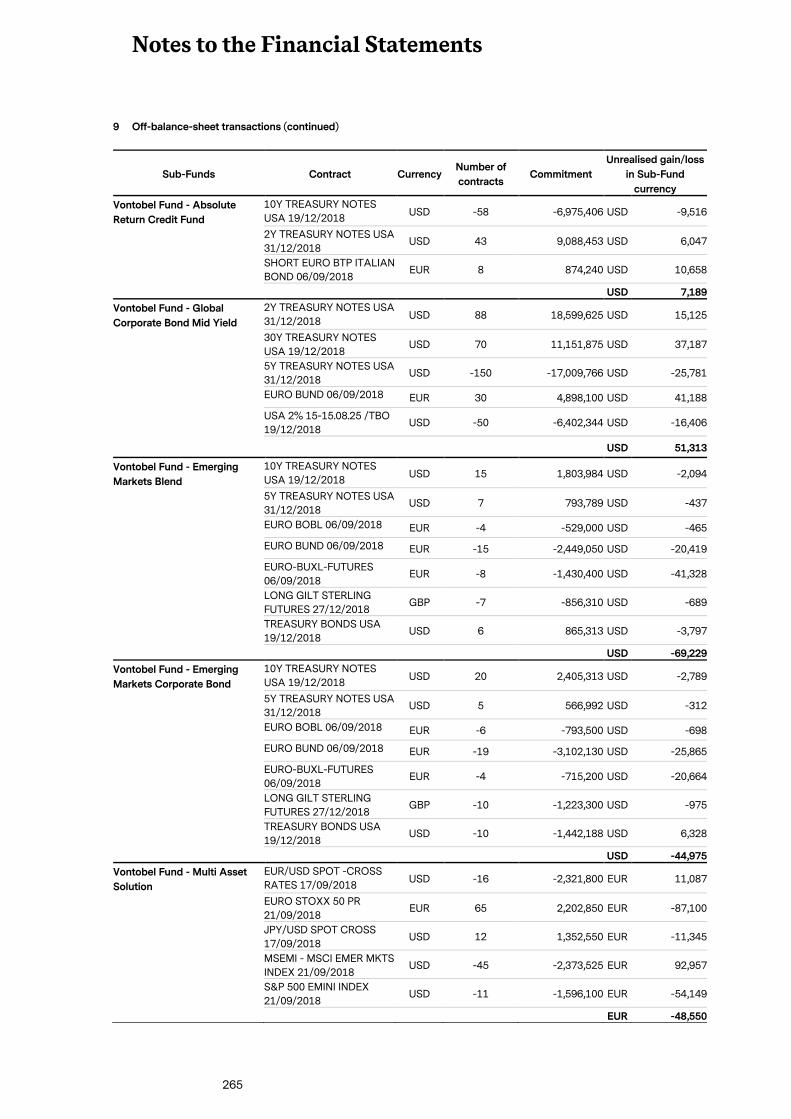
Notes to the Financial Statements
265
9 Off-balance-sheet transactions (continued)
Sub-Funds Contract Currency Number of
contracts Commitment
Unrealised gain/loss
in Sub-Fund
currency
Vontobel Fund - Absolute
Return Credit Fund 10Y TREASURY NOTES
USA 19/12/2018 USD -58 -6,975,406 USD -9,516
2Y TREASURY NOTES USA
31/12/2018 USD 43 9,088,453 USD 6,047
SHORT EURO BTP ITALIAN
BOND 06/09/2018 EUR 8 874,240 USD 10,658
USD 7,189
Vontobel Fund - Global
Corporate Bond Mid Yield 2Y TREASURY NOTES USA
31/12/2018 USD 88 18,599,625 USD 15,125
30Y TREASURY NOTES
USA 19/12/2018 USD 70 11,151,875 USD 37,187
5Y TREASURY NOTES USA
31/12/2018 USD -150 -17,009,766 USD -25,781
EURO BUND 06/09/2018 EUR 30 4,898,100 USD 41,188
USA 2% 15-15.08.25 /TBO
19/12/2018 USD -50 -6,402,344 USD -16,406
USD 51,313
Vontobel Fund - Emerging
Markets Blend
10Y TREASURY NOTES
USA 19/12/2018 USD 15 1,803,984 USD -2,094
5Y TREASURY NOTES USA
31/12/2018 USD 7 793,789 USD -437
EURO BOBL 06/09/2018 EUR -4 -529,000 USD -465
EURO BUND 06/09/2018 EUR -15 -2,449,050 USD -20,419
EURO-BUXL-FUTURES
06/09/2018 EUR -8 -1,430,400 USD -41,328
LONG GILT STERLING
FUTURES 27/12/2018 GBP -7 -856,310 USD -689
TREASURY BONDS USA
19/12/2018 USD 6 865,313 USD -3,797
USD -69,229
Vontobel Fund - Emerging
Markets Corporate Bond 10Y TREASURY NOTES
USA 19/12/2018 USD 20 2,405,313 USD -2,789
5Y TREASURY NOTES USA
31/12/2018 USD 5 566,992 USD -312
EURO BOBL 06/09/2018 EUR -6 -793,500 USD -698
EURO BUND 06/09/2018 EUR -19 -3,102,130 USD -25,865
EURO-BUXL-FUTURES
06/09/2018 EUR -4 -715,200 USD -20,664
LONG GILT STERLING
FUTURES 27/12/2018 GBP -10 -1,223,300 USD -975
TREASURY BONDS USA
19/12/2018 USD -10 -1,442,188 USD 6,328
USD -44,975
Vontobel Fund - Multi Asset
Solution EUR/USD SPOT -CROSS
RATES 17/09/2018 USD -16 -2,321,800 EUR 11,087
EURO STOXX 50 PR
21/09/2018 EUR 65 2,202,850 EUR -87,100
JPY/USD SPOT CROSS
17/09/2018 USD 12 1,352,550 EUR -11,345
MSEMI - MSCI EMER MKTS
INDEX 21/09/2018 USD -45 -2,373,525 EUR 92,957
S&P 500 EMINI INDEX
21/09/2018 USD -11 -1,596,100 EUR -54,149
EUR -48,550
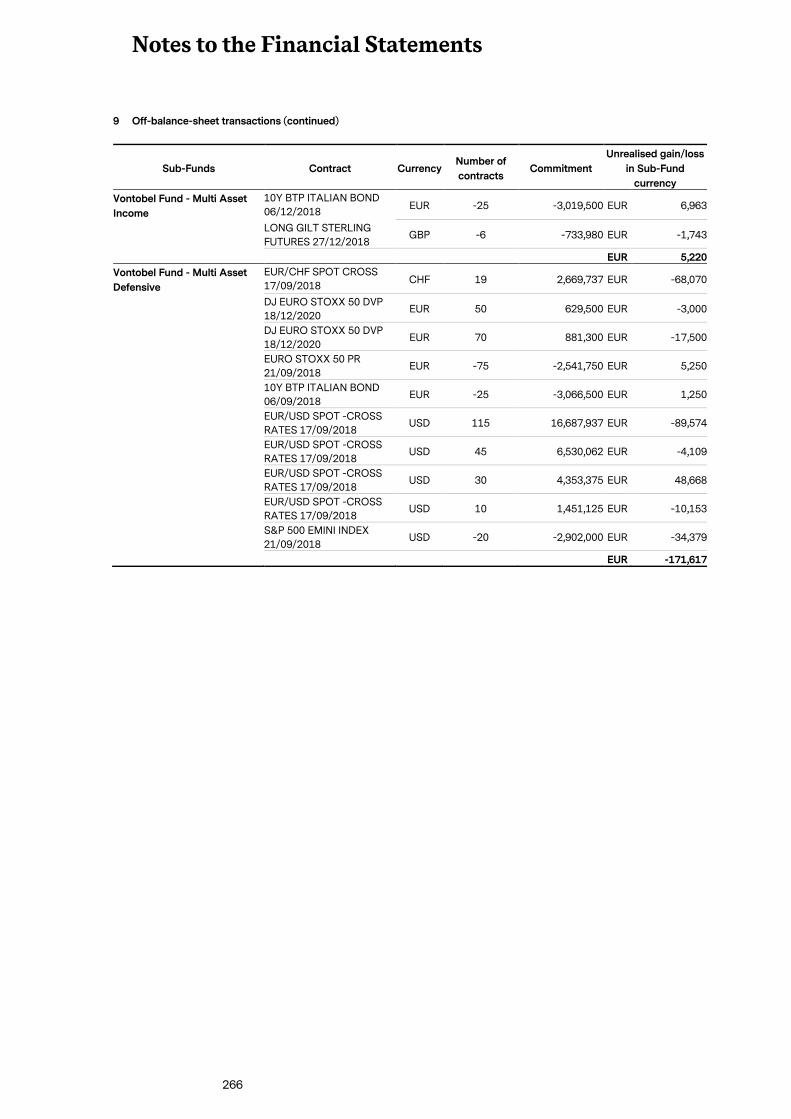
Notes to the Financial Statements
266
9 Off-balance-sheet transactions (continued)
Sub-Funds Contract Currency Number of
contracts Commitment
Unrealised gain/loss
in Sub-Fund
currency
Vontobel Fund - Multi Asset
Income
10Y BTP ITALIAN BOND
06/12/2018 EUR -25 -3,019,500 EUR 6,963
LONG GILT STERLING
FUTURES 27/12/2018 GBP -6 -733,980 EUR -1,743
EUR 5,220
Vontobel Fund - Multi Asset
Defensive
EUR/CHF SPOT CROSS
17/09/2018 CHF 19 2,669,737 EUR -68,070
DJ EURO STOXX 50 DVP
18/12/2020 EUR 50 629,500 EUR -3,000
DJ EURO STOXX 50 DVP
18/12/2020 EUR 70 881,300 EUR -17,500
EURO STOXX 50 PR
21/09/2018 EUR -75 -2,541,750 EUR 5,250
10Y BTP ITALIAN BOND
06/09/2018 EUR -25 -3,066,500 EUR 1,250
EUR/USD SPOT -CROSS
RATES 17/09/2018 USD 115 16,687,937 EUR -89,574
EUR/USD SPOT -CROSS
RATES 17/09/2018 USD 45 6,530,062 EUR -4,109
EUR/USD SPOT -CROSS
RATES 17/09/2018 USD 30 4,353,375 EUR 48,668
EUR/USD SPOT -CROSS
RATES 17/09/2018 USD 10 1,451,125 EUR -10,153
S&P 500 EMINI INDEX
21/09/2018 USD -20 -2,902,000 EUR -34,379
EUR -171,617
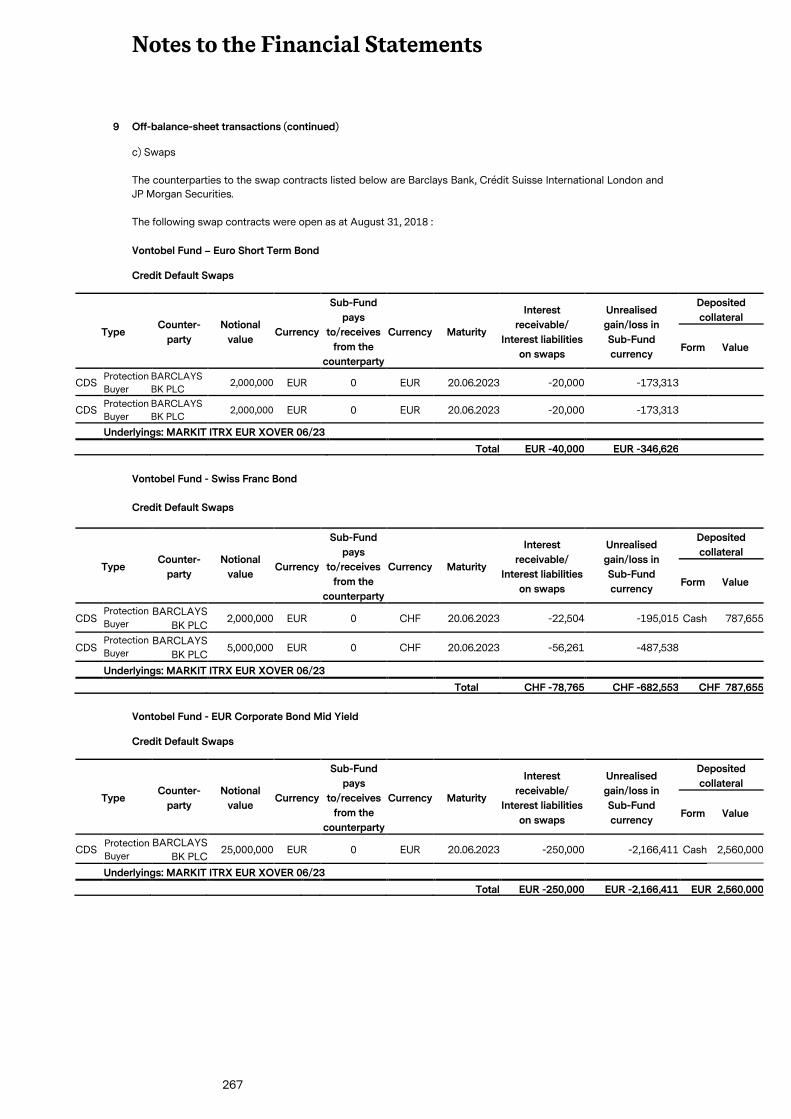
Notes to the Financial Statements
267
9 Off-balance-sheet transactions (continued)
c) Swaps
The counterparties to the swap contracts listed below are Barclays Bank, Crédit Suisse International London and
JP Morgan Securities.
The following swap contracts were open as at August 31, 2018 :
Vontobel Fund – Euro Short Term Bond
Credit Default Swaps
Type Counter-
party
Notional
value Currency
Sub-Fund
pays
to/receives
from the
counterparty
Currency Maturity
Interest
receivable/
Interest liabilities
on swaps
Unrealised
gain/loss in
Sub-Fund
currency
Deposited
collateral
Form Value
CDS Protection
Buyer
BARCLAYS
BK PLC 2,000,000 EUR 0 EUR 20.06.2023 -20,000 -173,313
CDS Protection
Buyer
BARCLAYS
BK PLC 2,000,000 EUR 0 EUR 20.06.2023 -20,000 -173,313
Underlyings: MARKIT ITRX EUR XOVER 06/23
Total EUR -40,000 EUR -346,626
Vontobel Fund - Swiss Franc Bond
Credit Default Swaps
Type Counter-
party
Notional
value Currency
Sub-Fund
pays
to/receives
from the
counterparty
Currency Maturity
Interest
receivable/
Interest liabilities
on swaps
Unrealised
gain/loss in
Sub-Fund
currency
Deposited
collateral
Form Value
CDS Protection
Buyer BARCLAYS
BK PLC2,000,000 EUR 0 CHF 20.06.2023 -22,504 -195,015 Cash 787,655
CDS Protection
Buyer BARCLAYS
BK PLC5,000,000 EUR 0 CHF 20.06.2023 -56,261 -487,538
Underlyings: MARKIT ITRX EUR XOVER 06/23
Total CHF -78,765 CHF -682,553 CHF 787,655
Vontobel Fund - EUR Corporate Bond Mid Yield
Credit Default Swaps
Type Counter-
party
Notional
value Currency
Sub-Fund
pays
to/receives
from the
counterparty
Currency Maturity
Interest
receivable/
Interest liabilities
on swaps
Unrealised
gain/loss in
Sub-Fund
currency
Deposited
collateral
Form Value
CDS Protection
Buyer
BARCLAYS
BK PLC25,000,000 EUR 0 EUR 20.06.2023 -250,000 -2,166,411 Cash 2,560,000
Underlyings: MARKIT ITRX EUR XOVER 06/23
Total EUR -250,000 EUR -2,166,411 EUR 2,560,000
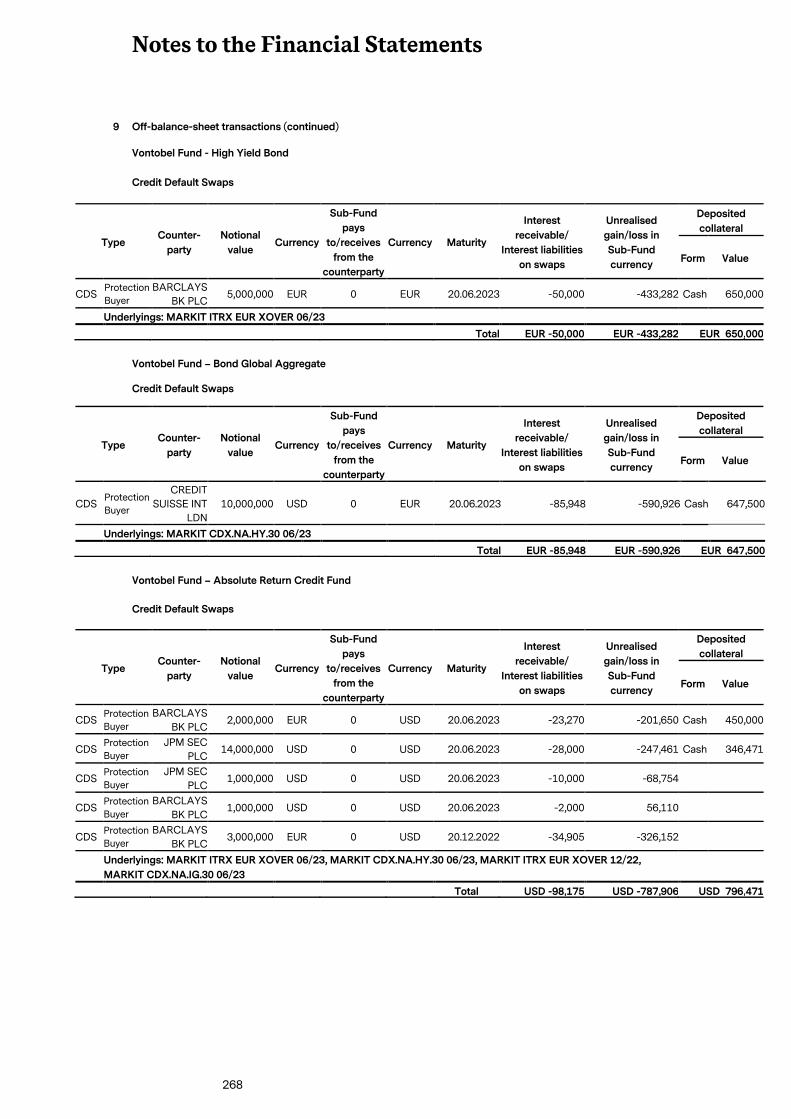
Notes to the Financial Statements
268
9 Off-balance-sheet transactions (continued)
Vontobel Fund - High Yield Bond
Credit Default Swaps
Type Counter-
party
Notional
value Currency
Sub-Fund
pays
to/receives
from the
counterparty
Currency Maturity
Interest
receivable/
Interest liabilities
on swaps
Unrealised
gain/loss in
Sub-Fund
currency
Deposited
collateral
Form Value
CDS Protection
Buyer
BARCLAYS
BK PLC5,000,000 EUR 0 EUR 20.06.2023 -50,000 -433,282 Cash 650,000
Underlyings: MARKIT ITRX EUR XOVER 06/23
Total EUR -50,000 EUR -433,282 EUR 650,000
Vontobel Fund – Bond Global Aggregate
Credit Default Swaps
Type Counter-
party
Notional
value Currency
Sub-Fund
pays
to/receives
from the
counterparty
Currency Maturity
Interest
receivable/
Interest liabilities
on swaps
Unrealised
gain/loss in
Sub-Fund
currency
Deposited
collateral
Form Value
CDS Protection
Buyer
CREDIT
SUISSE INT
LDN
10,000,000 USD 0 EUR 20.06.2023 -85,948 -590,926 Cash 647,500
Underlyings: MARKIT CDX.NA.HY.30 06/23
Total EUR -85,948 EUR -590,926 EUR 647,500
Vontobel Fund – Absolute Return Credit Fund
Credit Default Swaps
Type Counter-
party
Notional
value Currency
Sub-Fund
pays
to/receives
from the
counterparty
Currency Maturity
Interest
receivable/
Interest liabilities
on swaps
Unrealised
gain/loss in
Sub-Fund
currency
Deposited
collateral
Form Value
CDS Protection
Buyer
BARCLAYS
BK PLC2,000,000 EUR 0 USD 20.06.2023 -23,270 -201,650 Cash 450,000
CDS Protection
Buyer
JPM SEC
PLC14,000,000 USD 0 USD 20.06.2023 -28,000 -247,461 Cash 346,471
CDS Protection
Buyer
JPM SEC
PLC1,000,000 USD 0 USD 20.06.2023 -10,000 -68,754
CDS Protection
Buyer
BARCLAYS
BK PLC1,000,000 USD 0 USD 20.06.2023 -2,000 56,110
CDS Protection
Buyer
BARCLAYS
BK PLC3,000,000 EUR 0 USD 20.12.2022 -34,905 -326,152
Underlyings: MARKIT ITRX EUR XOVER 06/23, MARKIT CDX.NA.HY.30 06/23, MARKIT ITRX EUR XOVER 12/22,
MARKIT CDX.NA.IG.30 06/23
Total USD -98,175 USD -787,906 USD 796,471
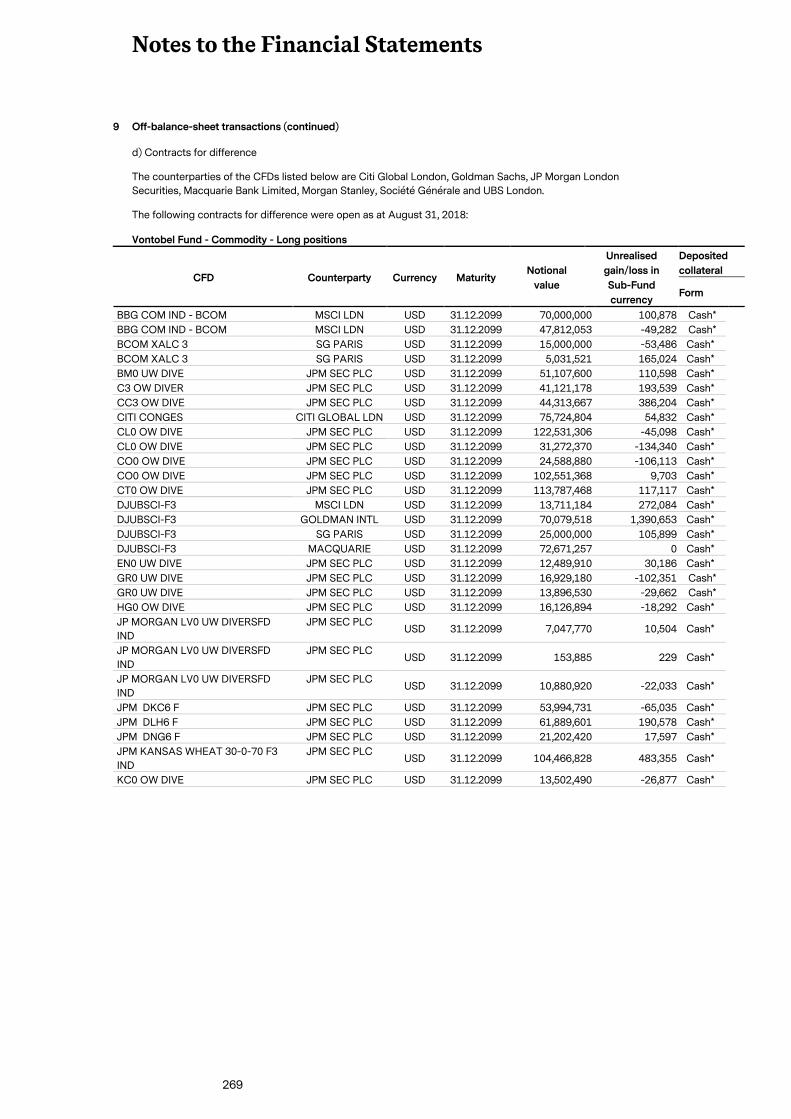
Notes to the Financial Statements
269
9 Off-balance-sheet transactions (continued)
d) Contracts for difference
The counterparties of the CFDs listed below are Citi Global London, Goldman Sachs, JP Morgan London
Securities, Macquarie Bank Limited, Morgan Stanley, Société Générale and UBS London.
The following contracts for difference were open as at August 31, 2018:
Vontobel Fund - Commodity - Long positions
CFD Counterparty Currency Maturity Notional
value
Unrealised
gain/loss in
Sub-Fund
currency
Deposited
collateral
Form
BBG COM IND - BCOM MSCI LDN USD 31.12.2099 70,000,000 100,878 Cash*
BBG COM IND - BCOM MSCI LDN USD 31.12.2099 47,812,053 -49,282 Cash*
BCOM XALC 3 SG PARIS USD 31.12.2099 15,000,000 -53,486 Cash*
BCOM XALC 3 SG PARIS USD 31.12.2099 5,031,521 165,024 Cash*
BM0 UW DIVE JPM SEC PLC USD 31.12.2099 51,107,600 110,598 Cash*
C3 OW DIVER JPM SEC PLC USD 31.12.2099 41,121,178 193,539 Cash*
CC3 OW DIVE JPM SEC PLC USD 31.12.2099 44,313,667 386,204 Cash*
CITI CONGES CITI GLOBAL LDN USD 31.12.2099 75,724,804 54,832 Cash*
CL0 OW DIVE JPM SEC PLC USD 31.12.2099 122,531,306 -45,098 Cash*
CL0 OW DIVE JPM SEC PLC USD 31.12.2099 31,272,370 -134,340 Cash*
CO0 OW DIVE JPM SEC PLC USD 31.12.2099 24,588,880 -106,113 Cash*
CO0 OW DIVE JPM SEC PLC USD 31.12.2099 102,551,368 9,703 Cash*
CT0 OW DIVE JPM SEC PLC USD 31.12.2099 113,787,468 117,117 Cash*
DJUBSCI-F3 MSCI LDN USD 31.12.2099 13,711,184 272,084 Cash*
DJUBSCI-F3 GOLDMAN INTL USD 31.12.2099 70,079,518 1,390,653 Cash*
DJUBSCI-F3 SG PARIS USD 31.12.2099 25,000,000 105,899 Cash*
DJUBSCI-F3 MACQUARIE USD 31.12.2099 72,671,257 0 Cash*
EN0 UW DIVE JPM SEC PLC USD 31.12.2099 12,489,910 30,186 Cash*
GR0 UW DIVE JPM SEC PLC USD 31.12.2099 16,929,180 -102,351 Cash*
GR0 UW DIVE JPM SEC PLC USD 31.12.2099 13,896,530 -29,662 Cash*
HG0 OW DIVE JPM SEC PLC USD 31.12.2099 16,126,894 -18,292 Cash*
JP MORGAN LV0 UW DIVERSFD
IND
JPM SEC PLC USD 31.12.2099 7,047,770 10,504 Cash*
JP MORGAN LV0 UW DIVERSFD
IND
JPM SEC PLC USD 31.12.2099 153,885 229 Cash*
JP MORGAN LV0 UW DIVERSFD
IND
JPM SEC PLC USD 31.12.2099 10,880,920 -22,033 Cash*
JPM DKC6 F JPM SEC PLC USD 31.12.2099 53,994,731 -65,035 Cash*
JPM DLH6 F JPM SEC PLC USD 31.12.2099 61,889,601 190,578 Cash*
JPM DNG6 F JPM SEC PLC USD 31.12.2099 21,202,420 17,597 Cash*
JPM KANSAS WHEAT 30-0-70 F3
IND
JPM SEC PLC USD 31.12.2099 104,466,828 483,355 Cash*
KC0 OW DIVE JPM SEC PLC USD 31.12.2099 13,502,490 -26,877 Cash*
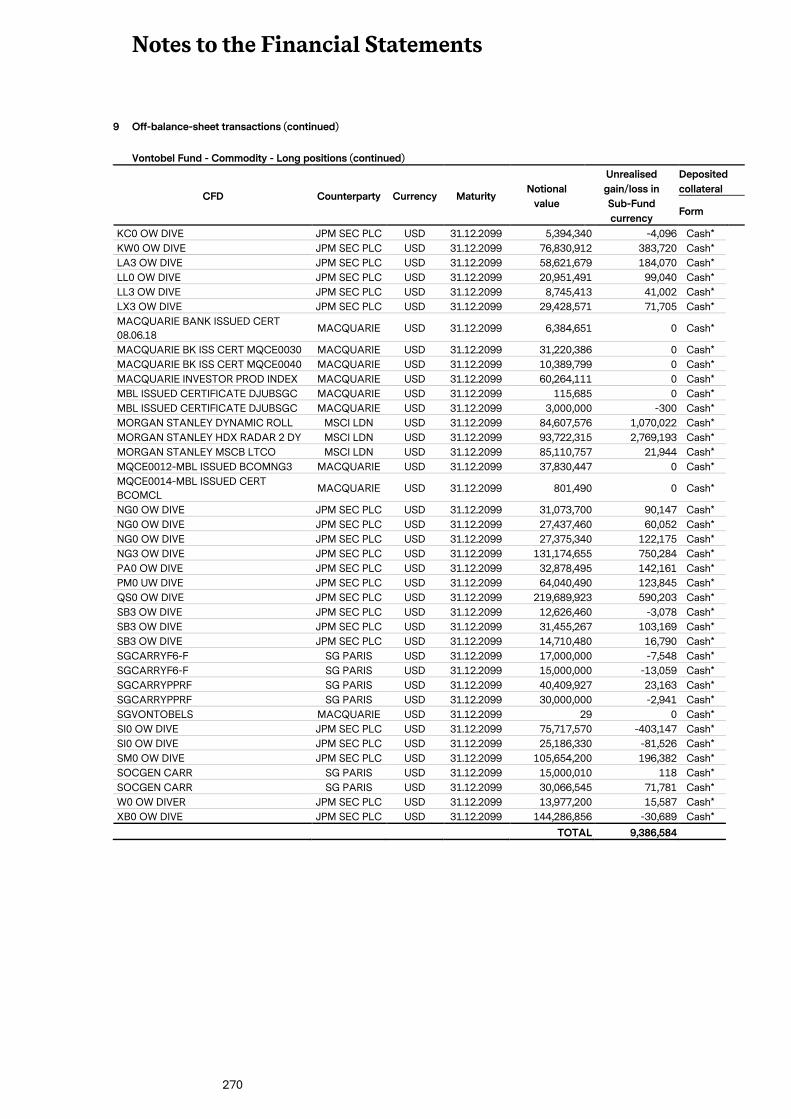
Notes to the Financial Statements
270
9 Off-balance-sheet transactions (continued)
Vontobel Fund - Commodity - Long positions (continued)
CFD Counterparty Currency Maturity Notional
value
Unrealised
gain/loss in
Sub-Fund
currency
Deposited
collateral
Form
KC0 OW DIVE JPM SEC PLC USD 31.12.2099 5,394,340 -4,096 Cash*
KW0 OW DIVE JPM SEC PLC USD 31.12.2099 76,830,912 383,720 Cash*
LA3 OW DIVE JPM SEC PLC USD 31.12.2099 58,621,679 184,070 Cash*
LL0 OW DIVE JPM SEC PLC USD 31.12.2099 20,951,491 99,040 Cash*
LL3 OW DIVE JPM SEC PLC USD 31.12.2099 8,745,413 41,002 Cash*
LX3 OW DIVE JPM SEC PLC USD 31.12.2099 29,428,571 71,705 Cash*
MACQUARIE BANK ISSUED CERT
08.06.18 MACQUARIE USD 31.12.2099 6,384,651 0 Cash*
MACQUARIE BK ISS CERT MQCE0030 MACQUARIE USD 31.12.2099 31,220,386 0 Cash*
MACQUARIE BK ISS CERT MQCE0040 MACQUARIE USD 31.12.2099 10,389,799 0 Cash*
MACQUARIE INVESTOR PROD INDEX MACQUARIE USD 31.12.2099 60,264,111 0 Cash*
MBL ISSUED CERTIFICATE DJUBSGC MACQUARIE USD 31.12.2099 115,685 0 Cash*
MBL ISSUED CERTIFICATE DJUBSGC MACQUARIE USD 31.12.2099 3,000,000 -300 Cash*
MORGAN STANLEY DYNAMIC ROLL MSCI LDN USD 31.12.2099 84,607,576 1,070,022 Cash*
MORGAN STANLEY HDX RADAR 2 DY MSCI LDN USD 31.12.2099 93,722,315 2,769,193 Cash*
MORGAN STANLEY MSCB LTCO MSCI LDN USD 31.12.2099 85,110,757 21,944 Cash*
MQCE0012-MBL ISSUED BCOMNG3 MACQUARIE USD 31.12.2099 37,830,447 0 Cash*
MQCE0014-MBL ISSUED CERT
BCOMCL MACQUARIE USD 31.12.2099 801,490 0 Cash*
NG0 OW DIVE JPM SEC PLC USD 31.12.2099 31,073,700 90,147 Cash*
NG0 OW DIVE JPM SEC PLC USD 31.12.2099 27,437,460 60,052 Cash*
NG0 OW DIVE JPM SEC PLC USD 31.12.2099 27,375,340 122,175 Cash*
NG3 OW DIVE JPM SEC PLC USD 31.12.2099 131,174,655 750,284 Cash*
PA0 OW DIVE JPM SEC PLC USD 31.12.2099 32,878,495 142,161 Cash*
PM0 UW DIVE JPM SEC PLC USD 31.12.2099 64,040,490 123,845 Cash*
QS0 OW DIVE JPM SEC PLC USD 31.12.2099 219,689,923 590,203 Cash*
SB3 OW DIVE JPM SEC PLC USD 31.12.2099 12,626,460 -3,078 Cash*
SB3 OW DIVE JPM SEC PLC USD 31.12.2099 31,455,267 103,169 Cash*
SB3 OW DIVE JPM SEC PLC USD 31.12.2099 14,710,480 16,790 Cash*
SGCARRYF6-F SG PARIS USD 31.12.2099 17,000,000 -7,548 Cash*
SGCARRYF6-F SG PARIS USD 31.12.2099 15,000,000 -13,059 Cash*
SGCARRYPPRF SG PARIS USD 31.12.2099 40,409,927 23,163 Cash*
SGCARRYPPRF SG PARIS USD 31.12.2099 30,000,000 -2,941 Cash*
SGVONTOBELS MACQUARIE USD 31.12.2099 29 0 Cash*
SI0 OW DIVE JPM SEC PLC USD 31.12.2099 75,717,570 -403,147 Cash*
SI0 OW DIVE JPM SEC PLC USD 31.12.2099 25,186,330 -81,526 Cash*
SM0 OW DIVE JPM SEC PLC USD 31.12.2099 105,654,200 196,382 Cash*
SOCGEN CARR SG PARIS USD 31.12.2099 15,000,010 118 Cash*
SOCGEN CARR SG PARIS USD 31.12.2099 30,066,545 71,781 Cash*
W0 OW DIVER JPM SEC PLC USD 31.12.2099 13,977,200 15,587 Cash*
XB0 OW DIVE JPM SEC PLC USD 31.12.2099 144,286,856 -30,689 Cash*
TOTAL 9,386,584
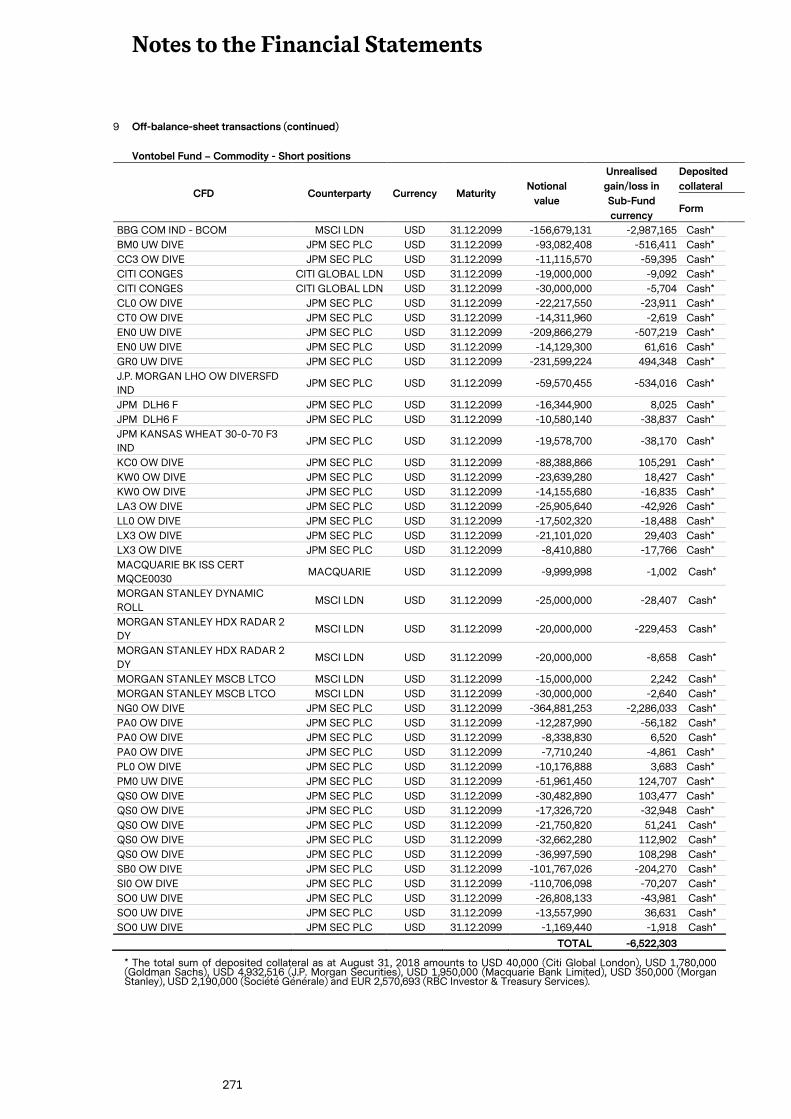
Notes to the Financial Statements
271
9 Off-balance-sheet transactions (continued)
Vontobel Fund – Commodity - Short positions
CFD Counterparty Currency Maturity Notional
value
Unrealised
gain/loss in
Sub-Fund
currency
Deposited
collateral
Form
BBG COM IND - BCOM MSCI LDN USD 31.12.2099 -156,679,131 -2,987,165 Cash*
BM0 UW DIVE JPM SEC PLC USD 31.12.2099 -93,082,408 -516,411 Cash*
CC3 OW DIVE JPM SEC PLC USD 31.12.2099 -11,115,570 -59,395 Cash*
CITI CONGES CITI GLOBAL LDN USD 31.12.2099 -19,000,000 -9,092 Cash*
CITI CONGES CITI GLOBAL LDN USD 31.12.2099 -30,000,000 -5,704 Cash*
CL0 OW DIVE JPM SEC PLC USD 31.12.2099 -22,217,550 -23,911 Cash*
CT0 OW DIVE JPM SEC PLC USD 31.12.2099 -14,311,960 -2,619 Cash*
EN0 UW DIVE JPM SEC PLC USD 31.12.2099 -209,866,279 -507,219 Cash*
EN0 UW DIVE JPM SEC PLC USD 31.12.2099 -14,129,300 61,616 Cash*
GR0 UW DIVE JPM SEC PLC USD 31.12.2099 -231,599,224 494,348 Cash*
J.P. MORGAN LHO OW DIVERSFD
IND JPM SEC PLC USD 31.12.2099 -59,570,455 -534,016 Cash*
JPM DLH6 F JPM SEC PLC USD 31.12.2099 -16,344,900 8,025 Cash*
JPM DLH6 F JPM SEC PLC USD 31.12.2099 -10,580,140 -38,837 Cash*
JPM KANSAS WHEAT 30-0-70 F3
IND JPM SEC PLC USD 31.12.2099 -19,578,700 -38,170 Cash*
KC0 OW DIVE JPM SEC PLC USD 31.12.2099 -88,388,866 105,291 Cash*
KW0 OW DIVE JPM SEC PLC USD 31.12.2099 -23,639,280 18,427 Cash*
KW0 OW DIVE JPM SEC PLC USD 31.12.2099 -14,155,680 -16,835 Cash*
LA3 OW DIVE JPM SEC PLC USD 31.12.2099 -25,905,640 -42,926 Cash*
LL0 OW DIVE JPM SEC PLC USD 31.12.2099 -17,502,320 -18,488 Cash*
LX3 OW DIVE JPM SEC PLC USD 31.12.2099 -21,101,020 29,403 Cash*
LX3 OW DIVE JPM SEC PLC USD 31.12.2099 -8,410,880 -17,766 Cash*
MACQUARIE BK ISS CERT
MQCE0030 MACQUARIE USD 31.12.2099 -9,999,998 -1,002 Cash*
MORGAN STANLEY DYNAMIC
ROLL MSCI LDN USD 31.12.2099 -25,000,000 -28,407 Cash*
MORGAN STANLEY HDX RADAR 2
DY MSCI LDN USD 31.12.2099 -20,000,000 -229,453 Cash*
MORGAN STANLEY HDX RADAR 2
DY MSCI LDN USD 31.12.2099 -20,000,000 -8,658 Cash*
MORGAN STANLEY MSCB LTCO MSCI LDN USD 31.12.2099 -15,000,000 2,242 Cash*
MORGAN STANLEY MSCB LTCO MSCI LDN USD 31.12.2099 -30,000,000 -2,640 Cash*
NG0 OW DIVE JPM SEC PLC USD 31.12.2099 -364,881,253 -2,286,033 Cash*
PA0 OW DIVE JPM SEC PLC USD 31.12.2099 -12,287,990 -56,182 Cash*
PA0 OW DIVE JPM SEC PLC USD 31.12.2099 -8,338,830 6,520 Cash*
PA0 OW DIVE JPM SEC PLC USD 31.12.2099 -7,710,240 -4,861 Cash*
PL0 OW DIVE JPM SEC PLC USD 31.12.2099 -10,176,888 3,683 Cash*
PM0 UW DIVE JPM SEC PLC USD 31.12.2099 -51,961,450 124,707 Cash*
QS0 OW DIVE JPM SEC PLC USD 31.12.2099 -30,482,890 103,477 Cash*
QS0 OW DIVE JPM SEC PLC USD 31.12.2099 -17,326,720 -32,948 Cash*
QS0 OW DIVE JPM SEC PLC USD 31.12.2099 -21,750,820 51,241 Cash*
QS0 OW DIVE JPM SEC PLC USD 31.12.2099 -32,662,280 112,902 Cash*
QS0 OW DIVE JPM SEC PLC USD 31.12.2099 -36,997,590 108,298 Cash*
SB0 OW DIVE JPM SEC PLC USD 31.12.2099 -101,767,026 -204,270 Cash*
SI0 OW DIVE JPM SEC PLC USD 31.12.2099 -110,706,098 -70,207 Cash*
SO0 UW DIVE JPM SEC PLC USD 31.12.2099 -26,808,133 -43,981 Cash*
SO0 UW DIVE JPM SEC PLC USD 31.12.2099 -13,557,990 36,631 Cash*
SO0 UW DIVE JPM SEC PLC USD 31.12.2099 -1,169,440 -1,918 Cash*
TOTAL -6,522,303
* The total sum of deposited collateral as at August 31, 2018 amounts to USD 40,000 (Citi Global London), USD 1,780,000 (Goldman Sachs), USD 4,932,516 (J.P. Morgan Securities), USD 1,950,000 (Macquarie Bank Limited), USD 350,000 (Morgan Stanley), USD 2,190,000 (Société Générale) and EUR 2,570,693 (RBC Investor & Treasury Services).
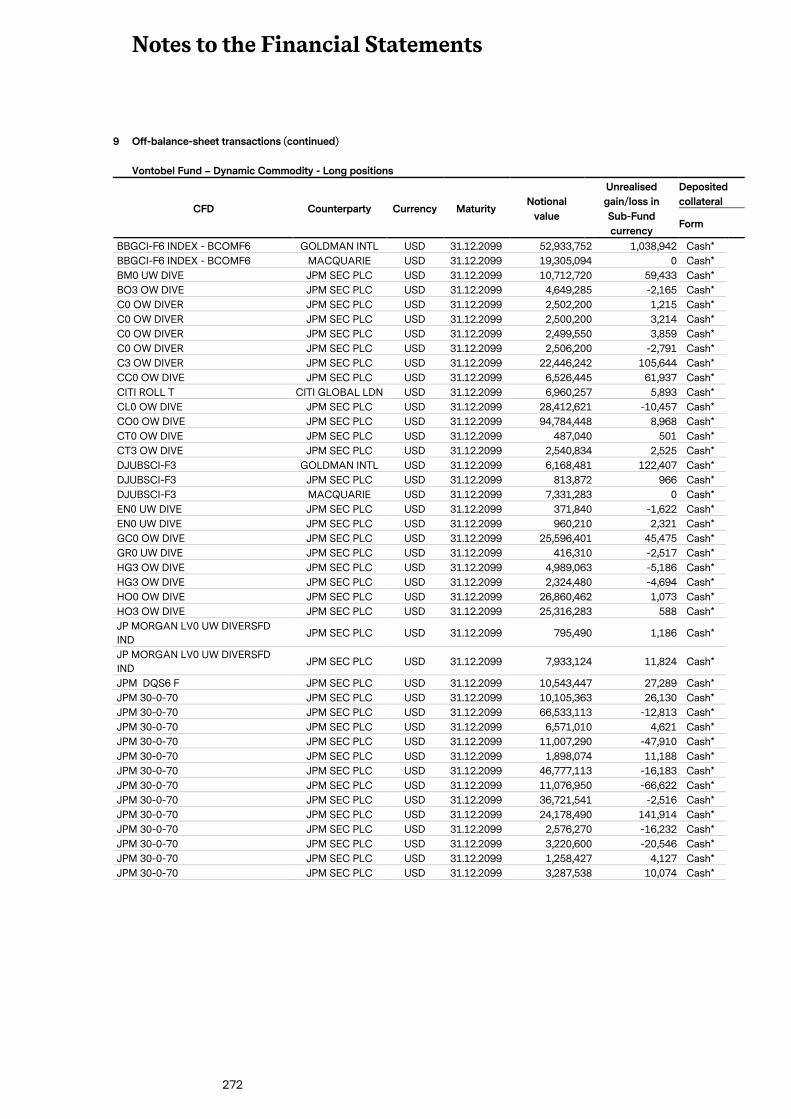
Notes to the Financial Statements
272
9 Off-balance-sheet transactions (continued)
Vontobel Fund – Dynamic Commodity - Long positions
CFD Counterparty Currency Maturity Notional
value
Unrealised
gain/loss in
Sub-Fund
currency
Deposited
collateral
Form
BBGCI-F6 INDEX - BCOMF6 GOLDMAN INTL USD 31.12.2099 52,933,752 1,038,942 Cash*
BBGCI-F6 INDEX - BCOMF6 MACQUARIE USD 31.12.2099 19,305,094 0 Cash*
BM0 UW DIVE JPM SEC PLC USD 31.12.2099 10,712,720 59,433 Cash*
BO3 OW DIVE JPM SEC PLC USD 31.12.2099 4,649,285 -2,165 Cash*
C0 OW DIVER JPM SEC PLC USD 31.12.2099 2,502,200 1,215 Cash*
C0 OW DIVER JPM SEC PLC USD 31.12.2099 2,500,200 3,214 Cash*
C0 OW DIVER JPM SEC PLC USD 31.12.2099 2,499,550 3,859 Cash*
C0 OW DIVER JPM SEC PLC USD 31.12.2099 2,506,200 -2,791 Cash*
C3 OW DIVER JPM SEC PLC USD 31.12.2099 22,446,242 105,644 Cash*
CC0 OW DIVE JPM SEC PLC USD 31.12.2099 6,526,445 61,937 Cash*
CITI ROLL T CITI GLOBAL LDN USD 31.12.2099 6,960,257 5,893 Cash*
CL0 OW DIVE JPM SEC PLC USD 31.12.2099 28,412,621 -10,457 Cash*
CO0 OW DIVE JPM SEC PLC USD 31.12.2099 94,784,448 8,968 Cash*
CT0 OW DIVE JPM SEC PLC USD 31.12.2099 487,040 501 Cash*
CT3 OW DIVE JPM SEC PLC USD 31.12.2099 2,540,834 2,525 Cash*
DJUBSCI-F3 GOLDMAN INTL USD 31.12.2099 6,168,481 122,407 Cash*
DJUBSCI-F3 JPM SEC PLC USD 31.12.2099 813,872 966 Cash*
DJUBSCI-F3 MACQUARIE USD 31.12.2099 7,331,283 0 Cash*
EN0 UW DIVE JPM SEC PLC USD 31.12.2099 371,840 -1,622 Cash*
EN0 UW DIVE JPM SEC PLC USD 31.12.2099 960,210 2,321 Cash*
GC0 OW DIVE JPM SEC PLC USD 31.12.2099 25,596,401 45,475 Cash*
GR0 UW DIVE JPM SEC PLC USD 31.12.2099 416,310 -2,517 Cash*
HG3 OW DIVE JPM SEC PLC USD 31.12.2099 4,989,063 -5,186 Cash*
HG3 OW DIVE JPM SEC PLC USD 31.12.2099 2,324,480 -4,694 Cash*
HO0 OW DIVE JPM SEC PLC USD 31.12.2099 26,860,462 1,073 Cash*
HO3 OW DIVE JPM SEC PLC USD 31.12.2099 25,316,283 588 Cash*
JP MORGAN LV0 UW DIVERSFD
IND JPM SEC PLC USD 31.12.2099 795,490 1,186 Cash*
JP MORGAN LV0 UW DIVERSFD
IND JPM SEC PLC USD 31.12.2099 7,933,124 11,824 Cash*
JPM DQS6 F JPM SEC PLC USD 31.12.2099 10,543,447 27,289 Cash*
JPM 30-0-70 JPM SEC PLC USD 31.12.2099 10,105,363 26,130 Cash*
JPM 30-0-70 JPM SEC PLC USD 31.12.2099 66,533,113 -12,813 Cash*
JPM 30-0-70 JPM SEC PLC USD 31.12.2099 6,571,010 4,621 Cash*
JPM 30-0-70 JPM SEC PLC USD 31.12.2099 11,007,290 -47,910 Cash*
JPM 30-0-70 JPM SEC PLC USD 31.12.2099 1,898,074 11,188 Cash*
JPM 30-0-70 JPM SEC PLC USD 31.12.2099 46,777,113 -16,183 Cash*
JPM 30-0-70 JPM SEC PLC USD 31.12.2099 11,076,950 -66,622 Cash*
JPM 30-0-70 JPM SEC PLC USD 31.12.2099 36,721,541 -2,516 Cash*
JPM 30-0-70 JPM SEC PLC USD 31.12.2099 24,178,490 141,914 Cash*
JPM 30-0-70 JPM SEC PLC USD 31.12.2099 2,576,270 -16,232 Cash*
JPM 30-0-70 JPM SEC PLC USD 31.12.2099 3,220,600 -20,546 Cash*
JPM 30-0-70 JPM SEC PLC USD 31.12.2099 1,258,427 4,127 Cash*
JPM 30-0-70 JPM SEC PLC USD 31.12.2099 3,287,538 10,074 Cash*
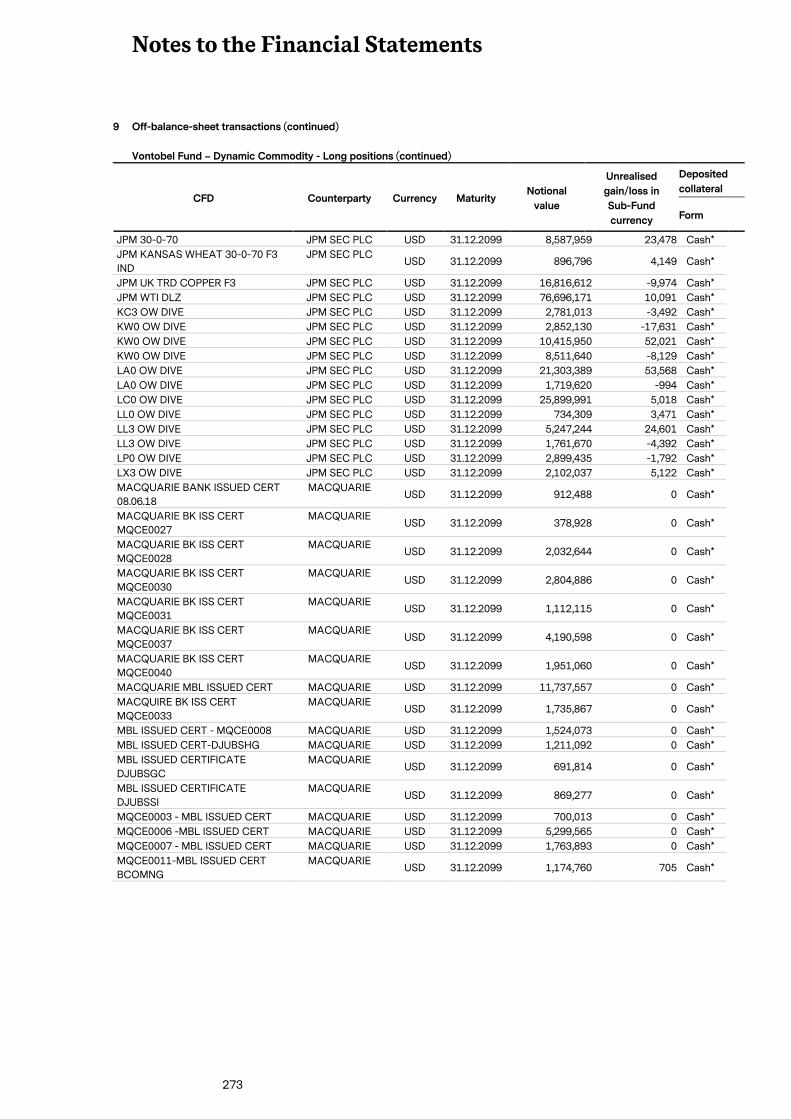
Notes to the Financial Statements
273
9 Off-balance-sheet transactions (continued)
Vontobel Fund – Dynamic Commodity - Long positions (continued)
CFD Counterparty Currency Maturity Notional
value
Unrealised
gain/loss in
Sub-Fund
currency
Deposited
collateral
Form
JPM 30-0-70 JPM SEC PLC USD 31.12.2099 8,587,959 23,478 Cash*
JPM KANSAS WHEAT 30-0-70 F3
IND
JPM SEC PLC USD 31.12.2099 896,796 4,149 Cash*
JPM UK TRD COPPER F3 JPM SEC PLC USD 31.12.2099 16,816,612 -9,974 Cash*
JPM WTI DLZ JPM SEC PLC USD 31.12.2099 76,696,171 10,091 Cash*
KC3 OW DIVE JPM SEC PLC USD 31.12.2099 2,781,013 -3,492 Cash*
KW0 OW DIVE JPM SEC PLC USD 31.12.2099 2,852,130 -17,631 Cash*
KW0 OW DIVE JPM SEC PLC USD 31.12.2099 10,415,950 52,021 Cash*
KW0 OW DIVE JPM SEC PLC USD 31.12.2099 8,511,640 -8,129 Cash*
LA0 OW DIVE JPM SEC PLC USD 31.12.2099 21,303,389 53,568 Cash*
LA0 OW DIVE JPM SEC PLC USD 31.12.2099 1,719,620 -994 Cash*
LC0 OW DIVE JPM SEC PLC USD 31.12.2099 25,899,991 5,018 Cash*
LL0 OW DIVE JPM SEC PLC USD 31.12.2099 734,309 3,471 Cash*
LL3 OW DIVE JPM SEC PLC USD 31.12.2099 5,247,244 24,601 Cash*
LL3 OW DIVE JPM SEC PLC USD 31.12.2099 1,761,670 -4,392 Cash*
LP0 OW DIVE JPM SEC PLC USD 31.12.2099 2,899,435 -1,792 Cash*
LX3 OW DIVE JPM SEC PLC USD 31.12.2099 2,102,037 5,122 Cash*
MACQUARIE BANK ISSUED CERT
08.06.18
MACQUARIE USD 31.12.2099 912,488 0 Cash*
MACQUARIE BK ISS CERT
MQCE0027
MACQUARIE USD 31.12.2099 378,928 0 Cash*
MACQUARIE BK ISS CERT
MQCE0028
MACQUARIE USD 31.12.2099 2,032,644 0 Cash*
MACQUARIE BK ISS CERT
MQCE0030
MACQUARIE USD 31.12.2099 2,804,886 0 Cash*
MACQUARIE BK ISS CERT
MQCE0031
MACQUARIE USD 31.12.2099 1,112,115 0 Cash*
MACQUARIE BK ISS CERT
MQCE0037
MACQUARIE USD 31.12.2099 4,190,598 0 Cash*
MACQUARIE BK ISS CERT
MQCE0040
MACQUARIE USD 31.12.2099 1,951,060 0 Cash*
MACQUARIE MBL ISSUED CERT MACQUARIE USD 31.12.2099 11,737,557 0 Cash*
MACQUIRE BK ISS CERT
MQCE0033
MACQUARIE USD 31.12.2099 1,735,867 0 Cash*
MBL ISSUED CERT - MQCE0008 MACQUARIE USD 31.12.2099 1,524,073 0 Cash*
MBL ISSUED CERT-DJUBSHG MACQUARIE USD 31.12.2099 1,211,092 0 Cash*
MBL ISSUED CERTIFICATE
DJUBSGC
MACQUARIE USD 31.12.2099 691,814 0 Cash*
MBL ISSUED CERTIFICATE
DJUBSSI
MACQUARIE USD 31.12.2099 869,277 0 Cash*
MQCE0003 - MBL ISSUED CERT MACQUARIE USD 31.12.2099 700,013 0 Cash*
MQCE0006 -MBL ISSUED CERT MACQUARIE USD 31.12.2099 5,299,565 0 Cash*
MQCE0007 - MBL ISSUED CERT MACQUARIE USD 31.12.2099 1,763,893 0 Cash*
MQCE0011-MBL ISSUED CERT
BCOMNG
MACQUARIE USD 31.12.2099 1,174,760 705 Cash*
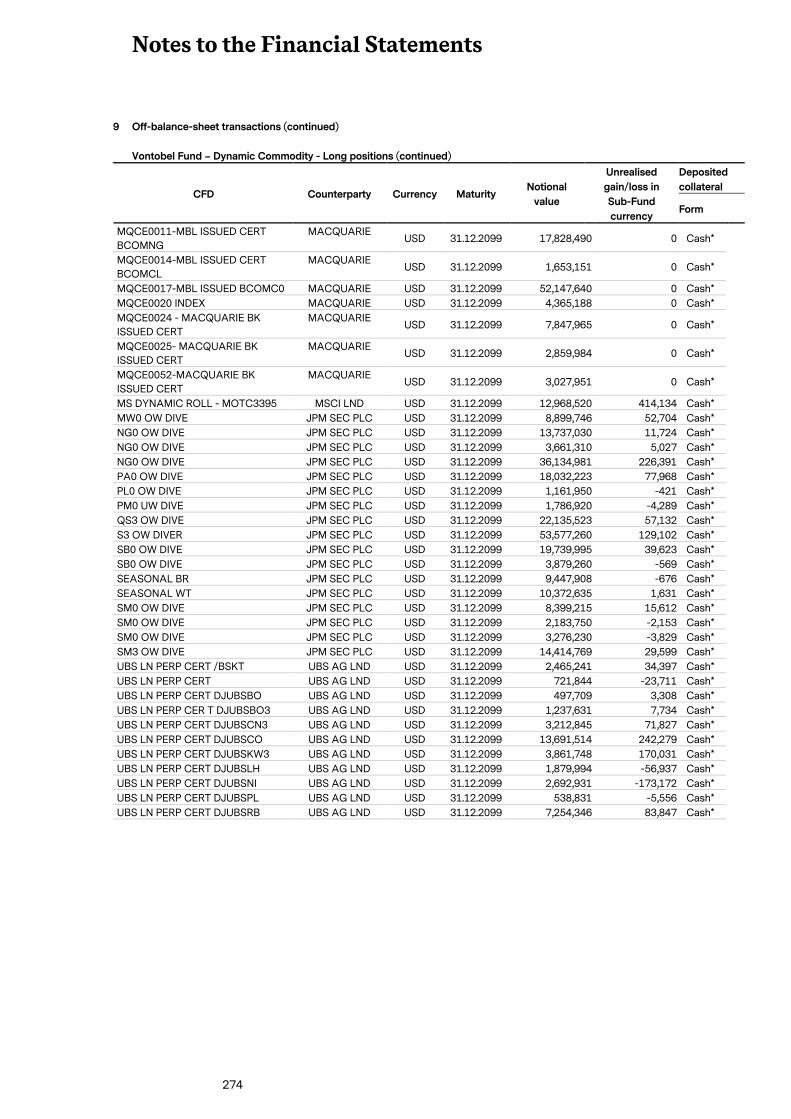
Notes to the Financial Statements
274
9 Off-balance-sheet transactions (continued)
Vontobel Fund – Dynamic Commodity - Long positions (continued)
CFD Counterparty Currency Maturity Notional
value
Unrealised
gain/loss in
Sub-Fund
currency
Deposited
collateral
Form
MQCE0011-MBL ISSUED CERT
BCOMNG
MACQUARIE USD 31.12.2099 17,828,490 0 Cash*
MQCE0014-MBL ISSUED CERT
BCOMCL
MACQUARIE USD 31.12.2099 1,653,151 0 Cash*
MQCE0017-MBL ISSUED BCOMC0 MACQUARIE USD 31.12.2099 52,147,640 0 Cash*
MQCE0020 INDEX MACQUARIE USD 31.12.2099 4,365,188 0 Cash*
MQCE0024 - MACQUARIE BK
ISSUED CERT
MACQUARIE USD 31.12.2099 7,847,965 0 Cash*
MQCE0025- MACQUARIE BK
ISSUED CERT
MACQUARIE USD 31.12.2099 2,859,984 0 Cash*
MQCE0052-MACQUARIE BK
ISSUED CERT
MACQUARIE USD 31.12.2099 3,027,951 0 Cash*
MS DYNAMIC ROLL - MOTC3395 MSCI LND USD 31.12.2099 12,968,520 414,134 Cash*
MW0 OW DIVE JPM SEC PLC USD 31.12.2099 8,899,746 52,704 Cash*
NG0 OW DIVE JPM SEC PLC USD 31.12.2099 13,737,030 11,724 Cash*
NG0 OW DIVE JPM SEC PLC USD 31.12.2099 3,661,310 5,027 Cash*
NG0 OW DIVE JPM SEC PLC USD 31.12.2099 36,134,981 226,391 Cash*
PA0 OW DIVE JPM SEC PLC USD 31.12.2099 18,032,223 77,968 Cash*
PL0 OW DIVE JPM SEC PLC USD 31.12.2099 1,161,950 -421 Cash*
PM0 UW DIVE JPM SEC PLC USD 31.12.2099 1,786,920 -4,289 Cash*
QS3 OW DIVE JPM SEC PLC USD 31.12.2099 22,135,523 57,132 Cash*
S3 OW DIVER JPM SEC PLC USD 31.12.2099 53,577,260 129,102 Cash*
SB0 OW DIVE JPM SEC PLC USD 31.12.2099 19,739,995 39,623 Cash*
SB0 OW DIVE JPM SEC PLC USD 31.12.2099 3,879,260 -569 Cash*
SEASONAL BR JPM SEC PLC USD 31.12.2099 9,447,908 -676 Cash*
SEASONAL WT JPM SEC PLC USD 31.12.2099 10,372,635 1,631 Cash*
SM0 OW DIVE JPM SEC PLC USD 31.12.2099 8,399,215 15,612 Cash*
SM0 OW DIVE JPM SEC PLC USD 31.12.2099 2,183,750 -2,153 Cash*
SM0 OW DIVE JPM SEC PLC USD 31.12.2099 3,276,230 -3,829 Cash*
SM3 OW DIVE JPM SEC PLC USD 31.12.2099 14,414,769 29,599 Cash*
UBS LN PERP CERT /BSKT UBS AG LND USD 31.12.2099 2,465,241 34,397 Cash*
UBS LN PERP CERT UBS AG LND USD 31.12.2099 721,844 -23,711 Cash*
UBS LN PERP CERT DJUBSBO UBS AG LND USD 31.12.2099 497,709 3,308 Cash*
UBS LN PERP CER T DJUBSBO3 UBS AG LND USD 31.12.2099 1,237,631 7,734 Cash*
UBS LN PERP CERT DJUBSCN3 UBS AG LND USD 31.12.2099 3,212,845 71,827 Cash*
UBS LN PERP CERT DJUBSCO UBS AG LND USD 31.12.2099 13,691,514 242,279 Cash*
UBS LN PERP CERT DJUBSKW3 UBS AG LND USD 31.12.2099 3,861,748 170,031 Cash*
UBS LN PERP CERT DJUBSLH UBS AG LND USD 31.12.2099 1,879,994 -56,937 Cash*
UBS LN PERP CERT DJUBSNI UBS AG LND USD 31.12.2099 2,692,931 -173,172 Cash*
UBS LN PERP CERT DJUBSPL UBS AG LND USD 31.12.2099 538,831 -5,556 Cash*
UBS LN PERP CERT DJUBSRB UBS AG LND USD 31.12.2099 7,254,346 83,847 Cash*
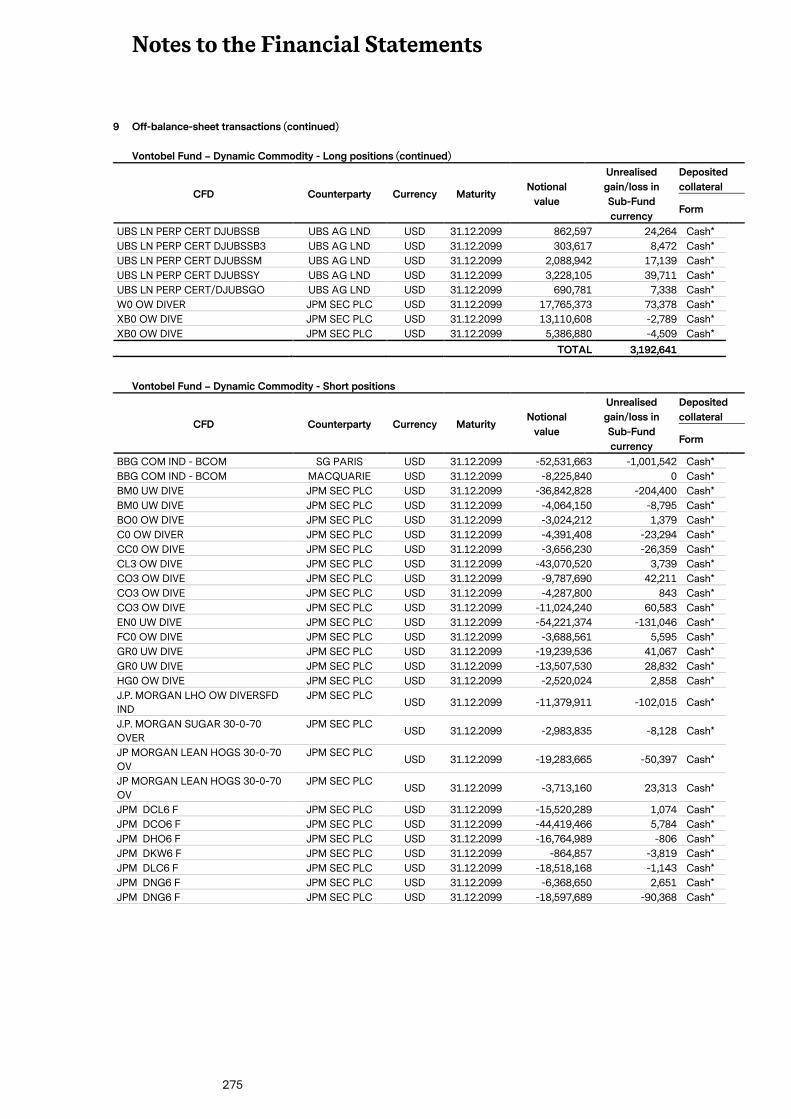
Notes to the Financial Statements
275
9 Off-balance-sheet transactions (continued)
Vontobel Fund – Dynamic Commodity - Long positions (continued)
CFD Counterparty Currency Maturity Notional
value
Unrealised
gain/loss in
Sub-Fund
currency
Deposited
collateral
Form
UBS LN PERP CERT DJUBSSB UBS AG LND USD 31.12.2099 862,597 24,264 Cash*
UBS LN PERP CERT DJUBSSB3 UBS AG LND USD 31.12.2099 303,617 8,472 Cash*
UBS LN PERP CERT DJUBSSM UBS AG LND USD 31.12.2099 2,088,942 17,139 Cash*
UBS LN PERP CERT DJUBSSY UBS AG LND USD 31.12.2099 3,228,105 39,711 Cash*
UBS LN PERP CERT/DJUBSGO UBS AG LND USD 31.12.2099 690,781 7,338 Cash*
W0 OW DIVER JPM SEC PLC USD 31.12.2099 17,765,373 73,378 Cash*
XB0 OW DIVE JPM SEC PLC USD 31.12.2099 13,110,608 -2,789 Cash*
XB0 OW DIVE JPM SEC PLC USD 31.12.2099 5,386,880 -4,509 Cash*
TOTAL 3,192,641
Vontobel Fund – Dynamic Commodity - Short positions
CFD Counterparty Currency Maturity Notional
value
Unrealised
gain/loss in
Sub-Fund
currency
Deposited
collateral
Form
BBG COM IND - BCOM SG PARIS USD 31.12.2099 -52,531,663 -1,001,542 Cash*
BBG COM IND - BCOM MACQUARIE USD 31.12.2099 -8,225,840 0 Cash*
BM0 UW DIVE JPM SEC PLC USD 31.12.2099 -36,842,828 -204,400 Cash*
BM0 UW DIVE JPM SEC PLC USD 31.12.2099 -4,064,150 -8,795 Cash*
BO0 OW DIVE JPM SEC PLC USD 31.12.2099 -3,024,212 1,379 Cash*
C0 OW DIVER JPM SEC PLC USD 31.12.2099 -4,391,408 -23,294 Cash*
CC0 OW DIVE JPM SEC PLC USD 31.12.2099 -3,656,230 -26,359 Cash*
CL3 OW DIVE JPM SEC PLC USD 31.12.2099 -43,070,520 3,739 Cash*
CO3 OW DIVE JPM SEC PLC USD 31.12.2099 -9,787,690 42,211 Cash*
CO3 OW DIVE JPM SEC PLC USD 31.12.2099 -4,287,800 843 Cash*
CO3 OW DIVE JPM SEC PLC USD 31.12.2099 -11,024,240 60,583 Cash*
EN0 UW DIVE JPM SEC PLC USD 31.12.2099 -54,221,374 -131,046 Cash*
FC0 OW DIVE JPM SEC PLC USD 31.12.2099 -3,688,561 5,595 Cash*
GR0 UW DIVE JPM SEC PLC USD 31.12.2099 -19,239,536 41,067 Cash*
GR0 UW DIVE JPM SEC PLC USD 31.12.2099 -13,507,530 28,832 Cash*
HG0 OW DIVE JPM SEC PLC USD 31.12.2099 -2,520,024 2,858 Cash*
J.P. MORGAN LHO OW DIVERSFD
IND
JPM SEC PLC USD 31.12.2099 -11,379,911 -102,015 Cash*
J.P. MORGAN SUGAR 30-0-70
OVER
JPM SEC PLC USD 31.12.2099 -2,983,835 -8,128 Cash*
JP MORGAN LEAN HOGS 30-0-70
OV
JPM SEC PLC USD 31.12.2099 -19,283,665 -50,397 Cash*
JP MORGAN LEAN HOGS 30-0-70
OV
JPM SEC PLC USD 31.12.2099 -3,713,160 23,313 Cash*
JPM DCL6 F JPM SEC PLC USD 31.12.2099 -15,520,289 1,074 Cash*
JPM DCO6 F JPM SEC PLC USD 31.12.2099 -44,419,466 5,784 Cash*
JPM DHO6 F JPM SEC PLC USD 31.12.2099 -16,764,989 -806 Cash*
JPM DKW6 F JPM SEC PLC USD 31.12.2099 -864,857 -3,819 Cash*
JPM DLC6 F JPM SEC PLC USD 31.12.2099 -18,518,168 -1,143 Cash*
JPM DNG6 F JPM SEC PLC USD 31.12.2099 -6,368,650 2,651 Cash*
JPM DNG6 F JPM SEC PLC USD 31.12.2099 -18,597,689 -90,368 Cash*
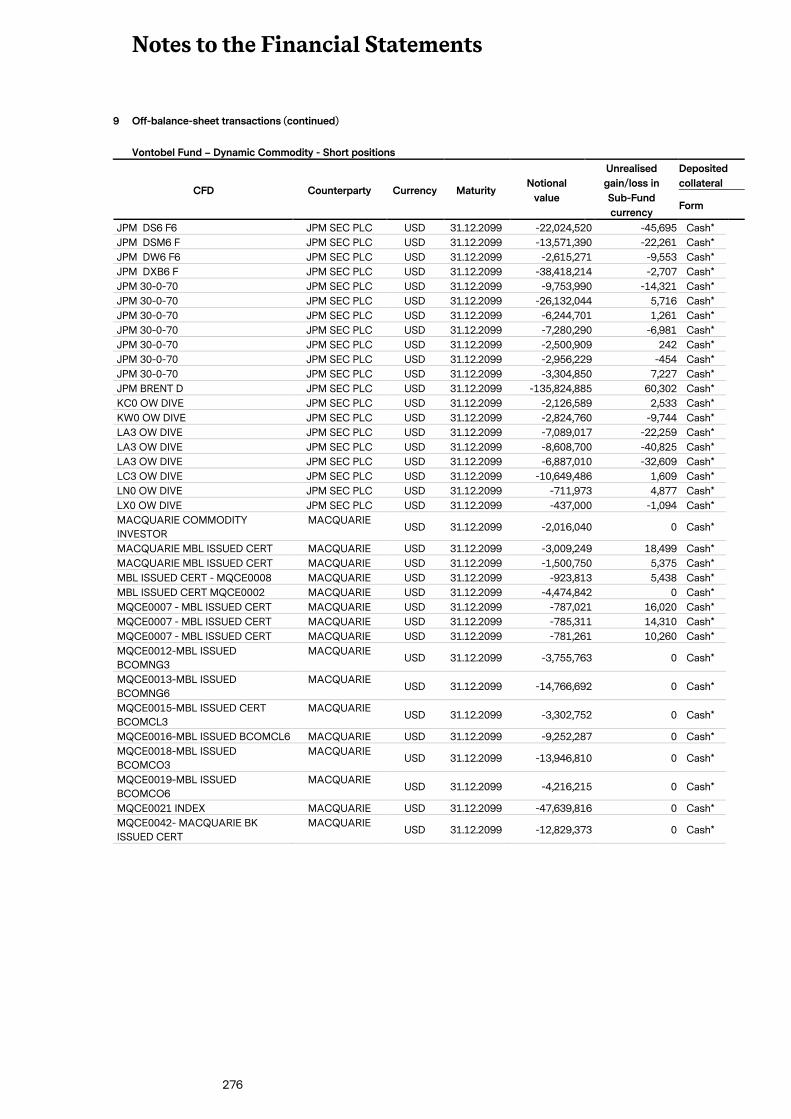
Notes to the Financial Statements
276
9 Off-balance-sheet transactions (continued)
Vontobel Fund – Dynamic Commodity - Short positions
CFD Counterparty Currency Maturity Notional
value
Unrealised
gain/loss in
Sub-Fund
currency
Deposited
collateral
Form
JPM DS6 F6 JPM SEC PLC USD 31.12.2099 -22,024,520 -45,695 Cash*
JPM DSM6 F JPM SEC PLC USD 31.12.2099 -13,571,390 -22,261 Cash*
JPM DW6 F6 JPM SEC PLC USD 31.12.2099 -2,615,271 -9,553 Cash*
JPM DXB6 F JPM SEC PLC USD 31.12.2099 -38,418,214 -2,707 Cash*
JPM 30-0-70 JPM SEC PLC USD 31.12.2099 -9,753,990 -14,321 Cash*
JPM 30-0-70 JPM SEC PLC USD 31.12.2099 -26,132,044 5,716 Cash*
JPM 30-0-70 JPM SEC PLC USD 31.12.2099 -6,244,701 1,261 Cash*
JPM 30-0-70 JPM SEC PLC USD 31.12.2099 -7,280,290 -6,981 Cash*
JPM 30-0-70 JPM SEC PLC USD 31.12.2099 -2,500,909 242 Cash*
JPM 30-0-70 JPM SEC PLC USD 31.12.2099 -2,956,229 -454 Cash*
JPM 30-0-70 JPM SEC PLC USD 31.12.2099 -3,304,850 7,227 Cash*
JPM BRENT D JPM SEC PLC USD 31.12.2099 -135,824,885 60,302 Cash*
KC0 OW DIVE JPM SEC PLC USD 31.12.2099 -2,126,589 2,533 Cash*
KW0 OW DIVE JPM SEC PLC USD 31.12.2099 -2,824,760 -9,744 Cash*
LA3 OW DIVE JPM SEC PLC USD 31.12.2099 -7,089,017 -22,259 Cash*
LA3 OW DIVE JPM SEC PLC USD 31.12.2099 -8,608,700 -40,825 Cash*
LA3 OW DIVE JPM SEC PLC USD 31.12.2099 -6,887,010 -32,609 Cash*
LC3 OW DIVE JPM SEC PLC USD 31.12.2099 -10,649,486 1,609 Cash*
LN0 OW DIVE JPM SEC PLC USD 31.12.2099 -711,973 4,877 Cash*
LX0 OW DIVE JPM SEC PLC USD 31.12.2099 -437,000 -1,094 Cash*
MACQUARIE COMMODITY
INVESTOR
MACQUARIE USD 31.12.2099 -2,016,040 0 Cash*
MACQUARIE MBL ISSUED CERT MACQUARIE USD 31.12.2099 -3,009,249 18,499 Cash*
MACQUARIE MBL ISSUED CERT MACQUARIE USD 31.12.2099 -1,500,750 5,375 Cash*
MBL ISSUED CERT - MQCE0008 MACQUARIE USD 31.12.2099 -923,813 5,438 Cash*
MBL ISSUED CERT MQCE0002 MACQUARIE USD 31.12.2099 -4,474,842 0 Cash*
MQCE0007 - MBL ISSUED CERT MACQUARIE USD 31.12.2099 -787,021 16,020 Cash*
MQCE0007 - MBL ISSUED CERT MACQUARIE USD 31.12.2099 -785,311 14,310 Cash*
MQCE0007 - MBL ISSUED CERT MACQUARIE USD 31.12.2099 -781,261 10,260 Cash*
MQCE0012-MBL ISSUED
BCOMNG3
MACQUARIE USD 31.12.2099 -3,755,763 0 Cash*
MQCE0013-MBL ISSUED
BCOMNG6
MACQUARIE USD 31.12.2099 -14,766,692 0 Cash*
MQCE0015-MBL ISSUED CERT
BCOMCL3
MACQUARIE USD 31.12.2099 -3,302,752 0 Cash*
MQCE0016-MBL ISSUED BCOMCL6 MACQUARIE USD 31.12.2099 -9,252,287 0 Cash*
MQCE0018-MBL ISSUED
BCOMCO3
MACQUARIE USD 31.12.2099 -13,946,810 0 Cash*
MQCE0019-MBL ISSUED
BCOMCO6
MACQUARIE USD 31.12.2099 -4,216,215 0 Cash*
MQCE0021 INDEX MACQUARIE USD 31.12.2099 -47,639,816 0 Cash*
MQCE0042- MACQUARIE BK
ISSUED CERT
MACQUARIE USD 31.12.2099 -12,829,373 0 Cash*
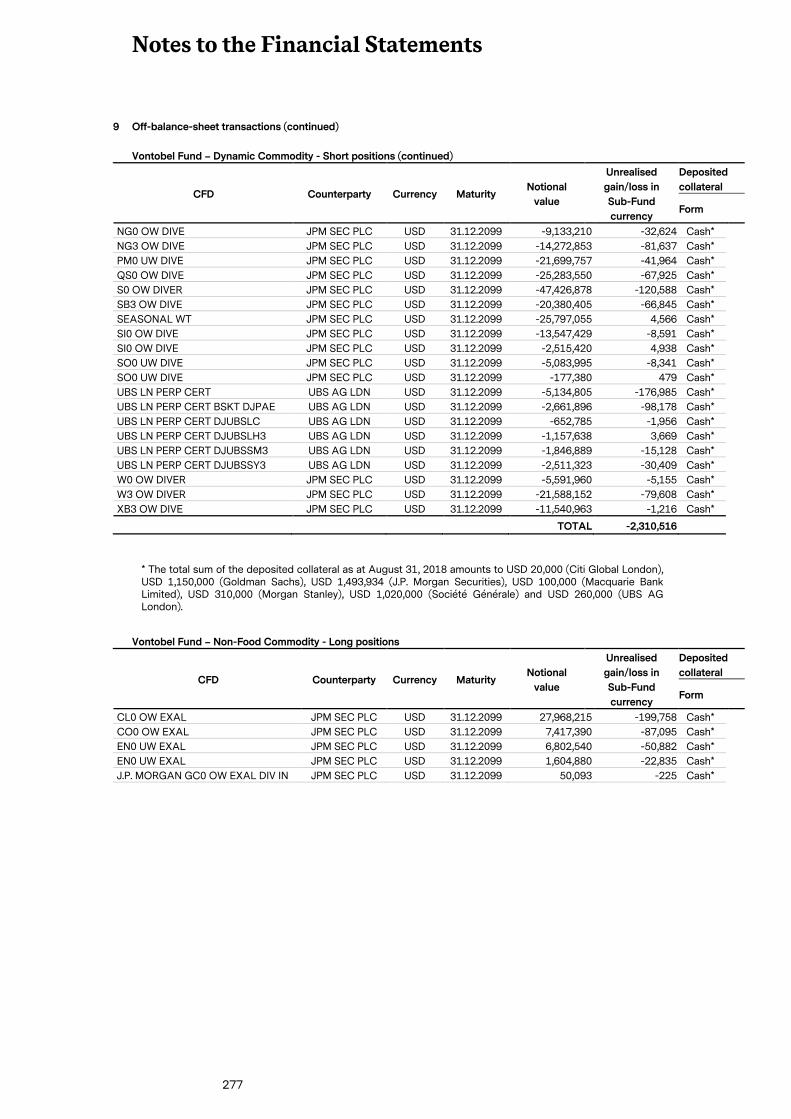
Notes to the Financial Statements
277
9 Off-balance-sheet transactions (continued)
Vontobel Fund – Dynamic Commodity - Short positions (continued)
CFD Counterparty Currency Maturity Notional
value
Unrealised
gain/loss in
Sub-Fund
currency
Deposited
collateral
Form
NG0 OW DIVE JPM SEC PLC USD 31.12.2099 -9,133,210 -32,624 Cash*
NG3 OW DIVE JPM SEC PLC USD 31.12.2099 -14,272,853 -81,637 Cash*
PM0 UW DIVE JPM SEC PLC USD 31.12.2099 -21,699,757 -41,964 Cash*
QS0 OW DIVE JPM SEC PLC USD 31.12.2099 -25,283,550 -67,925 Cash*
S0 OW DIVER JPM SEC PLC USD 31.12.2099 -47,426,878 -120,588 Cash*
SB3 OW DIVE JPM SEC PLC USD 31.12.2099 -20,380,405 -66,845 Cash*
SEASONAL WT JPM SEC PLC USD 31.12.2099 -25,797,055 4,566 Cash*
SI0 OW DIVE JPM SEC PLC USD 31.12.2099 -13,547,429 -8,591 Cash*
SI0 OW DIVE JPM SEC PLC USD 31.12.2099 -2,515,420 4,938 Cash*
SO0 UW DIVE JPM SEC PLC USD 31.12.2099 -5,083,995 -8,341 Cash*
SO0 UW DIVE JPM SEC PLC USD 31.12.2099 -177,380 479 Cash*
UBS LN PERP CERT UBS AG LDN USD 31.12.2099 -5,134,805 -176,985 Cash*
UBS LN PERP CERT BSKT DJPAE UBS AG LDN USD 31.12.2099 -2,661,896 -98,178 Cash*
UBS LN PERP CERT DJUBSLC UBS AG LDN USD 31.12.2099 -652,785 -1,956 Cash*
UBS LN PERP CERT DJUBSLH3 UBS AG LDN USD 31.12.2099 -1,157,638 3,669 Cash*
UBS LN PERP CERT DJUBSSM3 UBS AG LDN USD 31.12.2099 -1,846,889 -15,128 Cash*
UBS LN PERP CERT DJUBSSY3 UBS AG LDN USD 31.12.2099 -2,511,323 -30,409 Cash*
W0 OW DIVER JPM SEC PLC USD 31.12.2099 -5,591,960 -5,155 Cash*
W3 OW DIVER JPM SEC PLC USD 31.12.2099 -21,588,152 -79,608 Cash*
XB3 OW DIVE JPM SEC PLC USD 31.12.2099 -11,540,963 -1,216 Cash*
TOTAL -2,310,516
* The total sum of the deposited collateral as at August 31, 2018 amounts to USD 20,000 (Citi Global London), USD 1,150,000 (Goldman Sachs), USD 1,493,934 (J.P. Morgan Securities), USD 100,000 (Macquarie Bank Limited), USD 310,000 (Morgan Stanley), USD 1,020,000 (Société Générale) and USD 260,000 (UBS AG London).
Vontobel Fund – Non-Food Commodity - Long positions
CFD Counterparty Currency Maturity Notional
value
Unrealised
gain/loss in
Sub-Fund
currency
Deposited
collateral
Form
CL0 OW EXAL JPM SEC PLC USD 31.12.2099 27,968,215 -199,758 Cash*
CO0 OW EXAL JPM SEC PLC USD 31.12.2099 7,417,390 -87,095 Cash*
EN0 UW EXAL JPM SEC PLC USD 31.12.2099 6,802,540 -50,882 Cash*
EN0 UW EXAL JPM SEC PLC USD 31.12.2099 1,604,880 -22,835 Cash*
J.P. MORGAN GC0 OW EXAL DIV IN JPM SEC PLC USD 31.12.2099 50,093 -225 Cash*
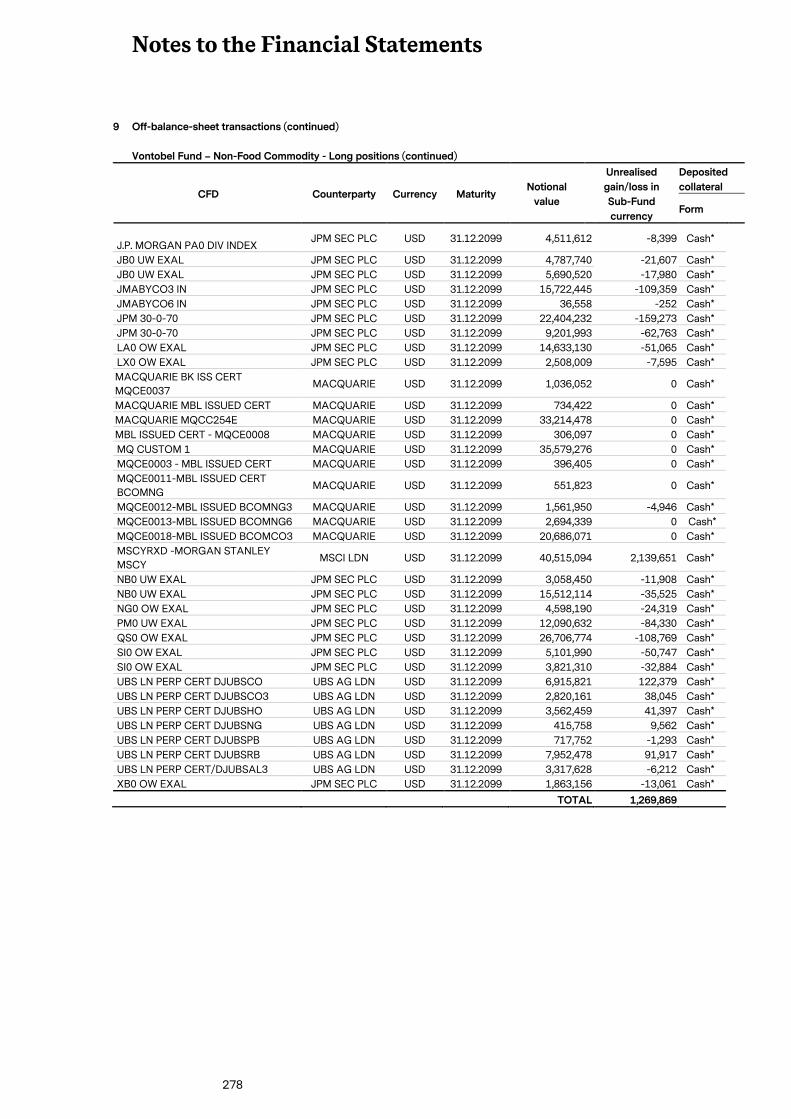
Notes to the Financial Statements
278
9 Off-balance-sheet transactions (continued)
Vontobel Fund – Non-Food Commodity - Long positions (continued)
CFD Counterparty Currency Maturity Notional
value
Unrealised
gain/loss in
Sub-Fund
currency
Deposited
collateral
Form
J.P. MORGAN PA0 DIV INDEX JPM SEC PLC USD 31.12.2099 4,511,612 -8,399 Cash*
JB0 UW EXAL JPM SEC PLC USD 31.12.2099 4,787,740 -21,607 Cash*
JB0 UW EXAL JPM SEC PLC USD 31.12.2099 5,690,520 -17,980 Cash*
JMABYCO3 IN JPM SEC PLC USD 31.12.2099 15,722,445 -109,359 Cash*
JMABYCO6 IN JPM SEC PLC USD 31.12.2099 36,558 -252 Cash*
JPM 30-0-70 JPM SEC PLC USD 31.12.2099 22,404,232 -159,273 Cash*
JPM 30-0-70 JPM SEC PLC USD 31.12.2099 9,201,993 -62,763 Cash*
LA0 OW EXAL JPM SEC PLC USD 31.12.2099 14,633,130 -51,065 Cash*
LX0 OW EXAL JPM SEC PLC USD 31.12.2099 2,508,009 -7,595 Cash*
MACQUARIE BK ISS CERT
MQCE0037 MACQUARIE USD 31.12.2099 1,036,052 0 Cash*
MACQUARIE MBL ISSUED CERT MACQUARIE USD 31.12.2099 734,422 0 Cash*
MACQUARIE MQCC254E MACQUARIE USD 31.12.2099 33,214,478 0 Cash*
MBL ISSUED CERT - MQCE0008 MACQUARIE USD 31.12.2099 306,097 0 Cash*
MQ CUSTOM 1 MACQUARIE USD 31.12.2099 35,579,276 0 Cash*
MQCE0003 - MBL ISSUED CERT MACQUARIE USD 31.12.2099 396,405 0 Cash*
MQCE0011-MBL ISSUED CERT
BCOMNG MACQUARIE USD 31.12.2099 551,823 0 Cash*
MQCE0012-MBL ISSUED BCOMNG3 MACQUARIE USD 31.12.2099 1,561,950 -4,946 Cash*
MQCE0013-MBL ISSUED BCOMNG6 MACQUARIE USD 31.12.2099 2,694,339 0 Cash*
MQCE0018-MBL ISSUED BCOMCO3 MACQUARIE USD 31.12.2099 20,686,071 0 Cash*
MSCYRXD -MORGAN STANLEY
MSCY MSCI LDN USD 31.12.2099 40,515,094 2,139,651 Cash*
NB0 UW EXAL JPM SEC PLC USD 31.12.2099 3,058,450 -11,908 Cash*
NB0 UW EXAL JPM SEC PLC USD 31.12.2099 15,512,114 -35,525 Cash*
NG0 OW EXAL JPM SEC PLC USD 31.12.2099 4,598,190 -24,319 Cash*
PM0 UW EXAL JPM SEC PLC USD 31.12.2099 12,090,632 -84,330 Cash*
QS0 OW EXAL JPM SEC PLC USD 31.12.2099 26,706,774 -108,769 Cash*
SI0 OW EXAL JPM SEC PLC USD 31.12.2099 5,101,990 -50,747 Cash*
SI0 OW EXAL JPM SEC PLC USD 31.12.2099 3,821,310 -32,884 Cash*
UBS LN PERP CERT DJUBSCO UBS AG LDN USD 31.12.2099 6,915,821 122,379 Cash*
UBS LN PERP CERT DJUBSCO3 UBS AG LDN USD 31.12.2099 2,820,161 38,045 Cash*
UBS LN PERP CERT DJUBSHO UBS AG LDN USD 31.12.2099 3,562,459 41,397 Cash*
UBS LN PERP CERT DJUBSNG UBS AG LDN USD 31.12.2099 415,758 9,562 Cash*
UBS LN PERP CERT DJUBSPB UBS AG LDN USD 31.12.2099 717,752 -1,293 Cash*
UBS LN PERP CERT DJUBSRB UBS AG LDN USD 31.12.2099 7,952,478 91,917 Cash*
UBS LN PERP CERT/DJUBSAL3 UBS AG LDN USD 31.12.2099 3,317,628 -6,212 Cash*
XB0 OW EXAL JPM SEC PLC USD 31.12.2099 1,863,156 -13,061 Cash*
TOTAL 1,269,869
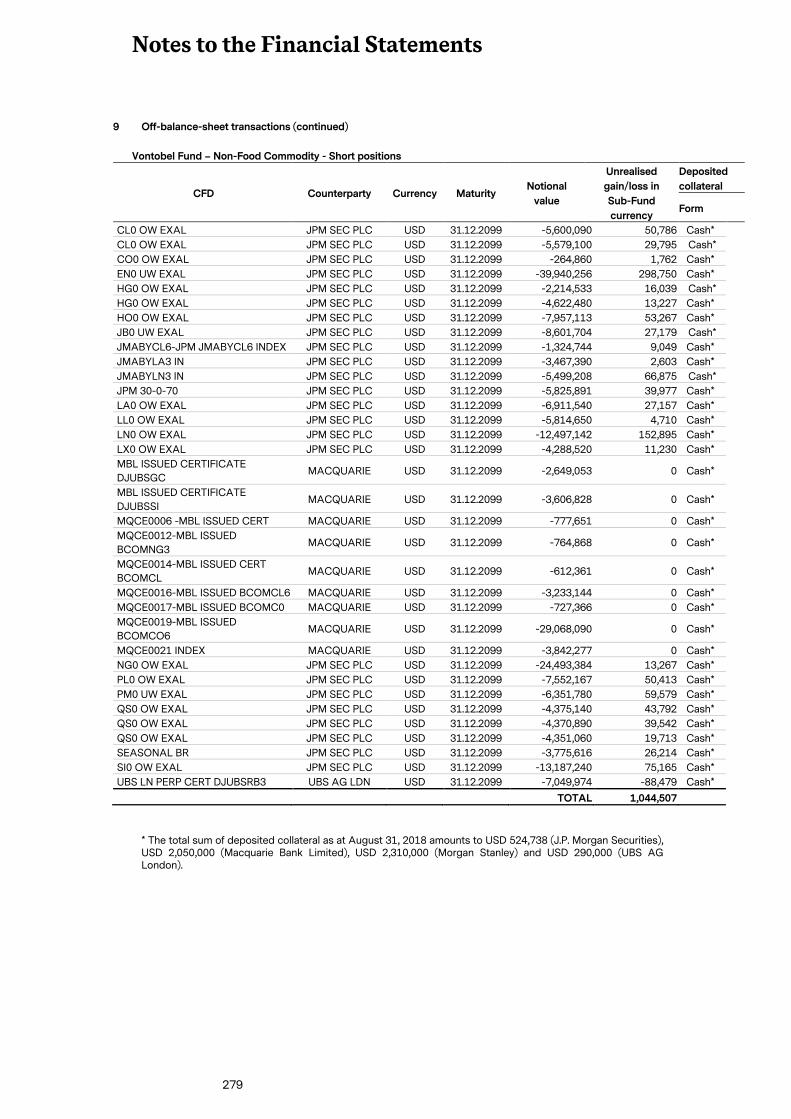
Notes to the Financial Statements
279
9 Off-balance-sheet transactions (continued)
Vontobel Fund – Non-Food Commodity - Short positions
CFD Counterparty Currency Maturity Notional
value
Unrealised
gain/loss in
Sub-Fund
currency
Deposited
collateral
Form
CL0 OW EXAL JPM SEC PLC USD 31.12.2099 -5,600,090 50,786 Cash*
CL0 OW EXAL JPM SEC PLC USD 31.12.2099 -5,579,100 29,795 Cash*
CO0 OW EXAL JPM SEC PLC USD 31.12.2099 -264,860 1,762 Cash*
EN0 UW EXAL JPM SEC PLC USD 31.12.2099 -39,940,256 298,750 Cash*
HG0 OW EXAL JPM SEC PLC USD 31.12.2099 -2,214,533 16,039 Cash*
HG0 OW EXAL JPM SEC PLC USD 31.12.2099 -4,622,480 13,227 Cash*
HO0 OW EXAL JPM SEC PLC USD 31.12.2099 -7,957,113 53,267 Cash*
JB0 UW EXAL JPM SEC PLC USD 31.12.2099 -8,601,704 27,179 Cash*
JMABYCL6-JPM JMABYCL6 INDEX JPM SEC PLC USD 31.12.2099 -1,324,744 9,049 Cash*
JMABYLA3 IN JPM SEC PLC USD 31.12.2099 -3,467,390 2,603 Cash*
JMABYLN3 IN JPM SEC PLC USD 31.12.2099 -5,499,208 66,875 Cash*
JPM 30-0-70 JPM SEC PLC USD 31.12.2099 -5,825,891 39,977 Cash*
LA0 OW EXAL JPM SEC PLC USD 31.12.2099 -6,911,540 27,157 Cash*
LL0 OW EXAL JPM SEC PLC USD 31.12.2099 -5,814,650 4,710 Cash*
LN0 OW EXAL JPM SEC PLC USD 31.12.2099 -12,497,142 152,895 Cash*
LX0 OW EXAL JPM SEC PLC USD 31.12.2099 -4,288,520 11,230 Cash*
MBL ISSUED CERTIFICATE
DJUBSGC MACQUARIE USD 31.12.2099 -2,649,053 0 Cash*
MBL ISSUED CERTIFICATE
DJUBSSI MACQUARIE USD 31.12.2099 -3,606,828 0 Cash*
MQCE0006 -MBL ISSUED CERT MACQUARIE USD 31.12.2099 -777,651 0 Cash*
MQCE0012-MBL ISSUED
BCOMNG3 MACQUARIE USD 31.12.2099 -764,868 0 Cash*
MQCE0014-MBL ISSUED CERT
BCOMCL MACQUARIE USD 31.12.2099 -612,361 0 Cash*
MQCE0016-MBL ISSUED BCOMCL6 MACQUARIE USD 31.12.2099 -3,233,144 0 Cash*
MQCE0017-MBL ISSUED BCOMC0 MACQUARIE USD 31.12.2099 -727,366 0 Cash*
MQCE0019-MBL ISSUED
BCOMCO6 MACQUARIE USD 31.12.2099 -29,068,090 0 Cash*
MQCE0021 INDEX MACQUARIE USD 31.12.2099 -3,842,277 0 Cash*
NG0 OW EXAL JPM SEC PLC USD 31.12.2099 -24,493,384 13,267 Cash*
PL0 OW EXAL JPM SEC PLC USD 31.12.2099 -7,552,167 50,413 Cash*
PM0 UW EXAL JPM SEC PLC USD 31.12.2099 -6,351,780 59,579 Cash*
QS0 OW EXAL JPM SEC PLC USD 31.12.2099 -4,375,140 43,792 Cash*
QS0 OW EXAL JPM SEC PLC USD 31.12.2099 -4,370,890 39,542 Cash*
QS0 OW EXAL JPM SEC PLC USD 31.12.2099 -4,351,060 19,713 Cash*
SEASONAL BR JPM SEC PLC USD 31.12.2099 -3,775,616 26,214 Cash*
SI0 OW EXAL JPM SEC PLC USD 31.12.2099 -13,187,240 75,165 Cash*
UBS LN PERP CERT DJUBSRB3 UBS AG LDN USD 31.12.2099 -7,049,974 -88,479 Cash*
TOTAL 1,044,507
* The total sum of deposited collateral as at August 31, 2018 amounts to USD 524,738 (J.P. Morgan Securities), USD 2,050,000 (Macquarie Bank Limited), USD 2,310,000 (Morgan Stanley) and USD 290,000 (UBS AG London).
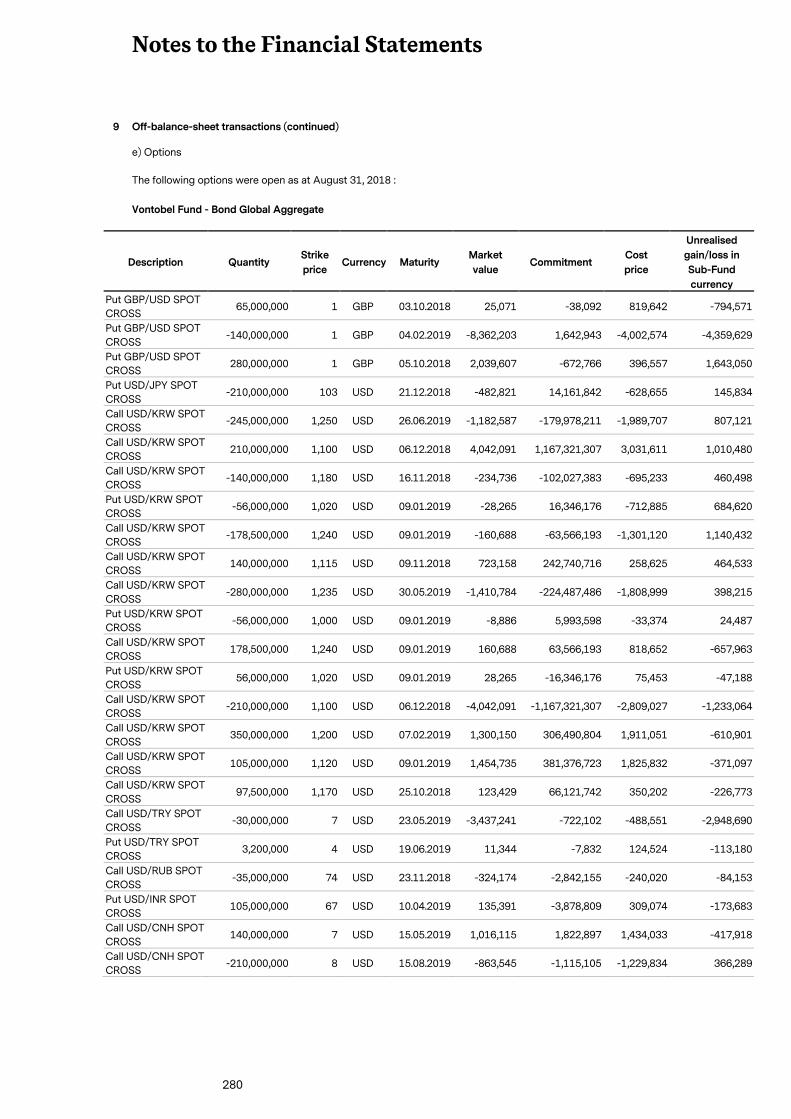
Notes to the Financial Statements
280
9 Off-balance-sheet transactions (continued)
e) Options
The following options were open as at August 31, 2018 :
Vontobel Fund - Bond Global Aggregate
Description Quantity Strike
price Currency Maturity
Market
value Commitment
Cost
price
Unrealised
gain/loss in
Sub-Fund
currency
Put GBP/USD SPOT
CROSS 65,000,000 1 GBP 03.10.2018 25,071 -38,092 819,642 -794,571
Put GBP/USD SPOT
CROSS -140,000,000 1 GBP 04.02.2019 -8,362,203 1,642,943 -4,002,574 -4,359,629
Put GBP/USD SPOT
CROSS 280,000,000 1 GBP 05.10.2018 2,039,607 -672,766 396,557 1,643,050
Put USD/JPY SPOT
CROSS -210,000,000 103 USD 21.12.2018 -482,821 14,161,842 -628,655 145,834
Call USD/KRW SPOT
CROSS -245,000,000 1,250 USD 26.06.2019 -1,182,587 -179,978,211 -1,989,707 807,121
Call USD/KRW SPOT
CROSS 210,000,000 1,100 USD 06.12.2018 4,042,091 1,167,321,307 3,031,611 1,010,480
Call USD/KRW SPOT
CROSS -140,000,000 1,180 USD 16.11.2018 -234,736 -102,027,383 -695,233 460,498
Put USD/KRW SPOT
CROSS -56,000,000 1,020 USD 09.01.2019 -28,265 16,346,176 -712,885 684,620
Call USD/KRW SPOT
CROSS -178,500,000 1,240 USD 09.01.2019 -160,688 -63,566,193 -1,301,120 1,140,432
Call USD/KRW SPOT
CROSS 140,000,000 1,115 USD 09.11.2018 723,158 242,740,716 258,625 464,533
Call USD/KRW SPOT
CROSS -280,000,000 1,235 USD 30.05.2019 -1,410,784 -224,487,486 -1,808,999 398,215
Put USD/KRW SPOT
CROSS -56,000,000 1,000 USD 09.01.2019 -8,886 5,993,598 -33,374 24,487
Call USD/KRW SPOT
CROSS 178,500,000 1,240 USD 09.01.2019 160,688 63,566,193 818,652 -657,963
Put USD/KRW SPOT
CROSS 56,000,000 1,020 USD 09.01.2019 28,265 -16,346,176 75,453 -47,188
Call USD/KRW SPOT
CROSS -210,000,000 1,100 USD 06.12.2018 -4,042,091 -1,167,321,307 -2,809,027 -1,233,064
Call USD/KRW SPOT
CROSS 350,000,000 1,200 USD 07.02.2019 1,300,150 306,490,804 1,911,051 -610,901
Call USD/KRW SPOT
CROSS 105,000,000 1,120 USD 09.01.2019 1,454,735 381,376,723 1,825,832 -371,097
Call USD/KRW SPOT
CROSS 97,500,000 1,170 USD 25.10.2018 123,429 66,121,742 350,202 -226,773
Call USD/TRY SPOT
CROSS -30,000,000 7 USD 23.05.2019 -3,437,241 -722,102 -488,551 -2,948,690
Put USD/TRY SPOT
CROSS 3,200,000 4 USD 19.06.2019 11,344 -7,832 124,524 -113,180
Call USD/RUB SPOT
CROSS -35,000,000 74 USD 23.11.2018 -324,174 -2,842,155 -240,020 -84,153
Put USD/INR SPOT
CROSS 105,000,000 67 USD 10.04.2019 135,391 -3,878,809 309,074 -173,683
Call USD/CNH SPOT
CROSS 140,000,000 7 USD 15.05.2019 1,016,115 1,822,897 1,434,033 -417,918
Call USD/CNH SPOT
CROSS -210,000,000 8 USD 15.08.2019 -863,545 -1,115,105 -1,229,834 366,289
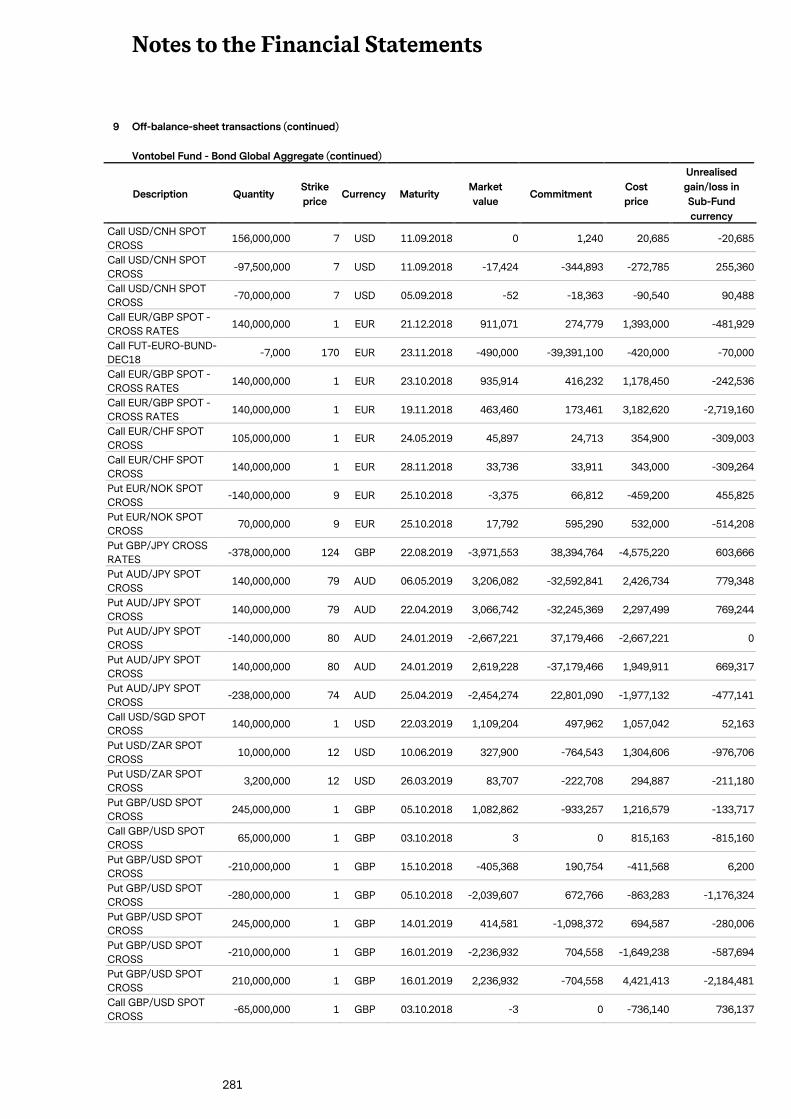
Notes to the Financial Statements
281
9 Off-balance-sheet transactions (continued)
Vontobel Fund - Bond Global Aggregate (continued)
Description Quantity Strike
price Currency Maturity
Market
value Commitment
Cost
price
Unrealised
gain/loss in
Sub-Fund
currency
Call USD/CNH SPOT
CROSS 156,000,000 7 USD 11.09.2018 0 1,240 20,685 -20,685
Call USD/CNH SPOT
CROSS -97,500,000 7 USD 11.09.2018 -17,424 -344,893 -272,785 255,360
Call USD/CNH SPOT
CROSS -70,000,000 7 USD 05.09.2018 -52 -18,363 -90,540 90,488
Call EUR/GBP SPOT -
CROSS RATES 140,000,000 1 EUR 21.12.2018 911,071 274,779 1,393,000 -481,929
Call FUT-EURO-BUND-
DEC18 -7,000 170 EUR 23.11.2018 -490,000 -39,391,100 -420,000 -70,000
Call EUR/GBP SPOT -
CROSS RATES 140,000,000 1 EUR 23.10.2018 935,914 416,232 1,178,450 -242,536
Call EUR/GBP SPOT -
CROSS RATES 140,000,000 1 EUR 19.11.2018 463,460 173,461 3,182,620 -2,719,160
Call EUR/CHF SPOT
CROSS 105,000,000 1 EUR 24.05.2019 45,897 24,713 354,900 -309,003
Call EUR/CHF SPOT
CROSS 140,000,000 1 EUR 28.11.2018 33,736 33,911 343,000 -309,264
Put EUR/NOK SPOT
CROSS -140,000,000 9 EUR 25.10.2018 -3,375 66,812 -459,200 455,825
Put EUR/NOK SPOT
CROSS 70,000,000 9 EUR 25.10.2018 17,792 595,290 532,000 -514,208
Put GBP/JPY CROSS
RATES -378,000,000 124 GBP 22.08.2019 -3,971,553 38,394,764 -4,575,220 603,666
Put AUD/JPY SPOT
CROSS 140,000,000 79 AUD 06.05.2019 3,206,082 -32,592,841 2,426,734 779,348
Put AUD/JPY SPOT
CROSS 140,000,000 79 AUD 22.04.2019 3,066,742 -32,245,369 2,297,499 769,244
Put AUD/JPY SPOT
CROSS -140,000,000 80 AUD 24.01.2019 -2,667,221 37,179,466 -2,667,221 0
Put AUD/JPY SPOT
CROSS 140,000,000 80 AUD 24.01.2019 2,619,228 -37,179,466 1,949,911 669,317
Put AUD/JPY SPOT
CROSS -238,000,000 74 AUD 25.04.2019 -2,454,274 22,801,090 -1,977,132 -477,141
Call USD/SGD SPOT
CROSS 140,000,000 1 USD 22.03.2019 1,109,204 497,962 1,057,042 52,163
Put USD/ZAR SPOT
CROSS 10,000,000 12 USD 10.06.2019 327,900 -764,543 1,304,606 -976,706
Put USD/ZAR SPOT
CROSS 3,200,000 12 USD 26.03.2019 83,707 -222,708 294,887 -211,180
Put GBP/USD SPOT
CROSS 245,000,000 1 GBP 05.10.2018 1,082,862 -933,257 1,216,579 -133,717
Call GBP/USD SPOT
CROSS 65,000,000 1 GBP 03.10.2018 3 0 815,163 -815,160
Put GBP/USD SPOT
CROSS -210,000,000 1 GBP 15.10.2018 -405,368 190,754 -411,568 6,200
Put GBP/USD SPOT
CROSS -280,000,000 1 GBP 05.10.2018 -2,039,607 672,766 -863,283 -1,176,324
Put GBP/USD SPOT
CROSS 245,000,000 1 GBP 14.01.2019 414,581 -1,098,372 694,587 -280,006
Put GBP/USD SPOT
CROSS -210,000,000 1 GBP 16.01.2019 -2,236,932 704,558 -1,649,238 -587,694
Put GBP/USD SPOT
CROSS 210,000,000 1 GBP 16.01.2019 2,236,932 -704,558 4,421,413 -2,184,481
Call GBP/USD SPOT
CROSS -65,000,000 1 GBP 03.10.2018 -3 0 -736,140 736,137
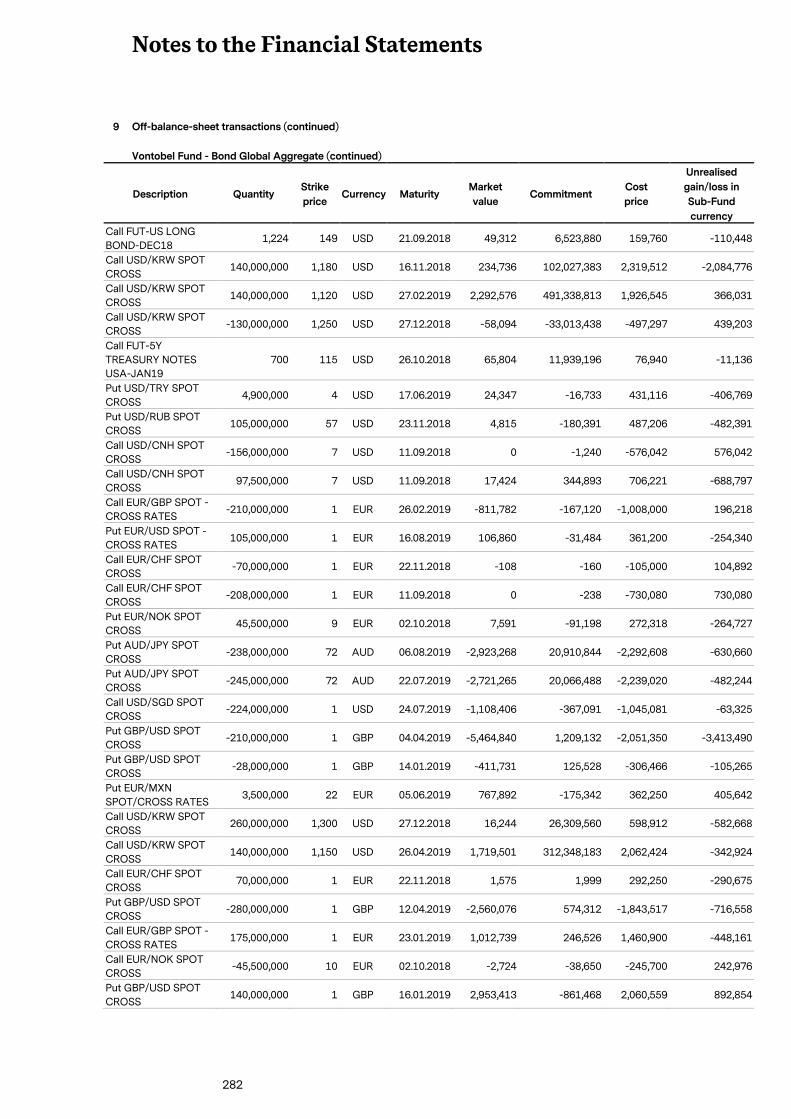
Notes to the Financial Statements
282
9 Off-balance-sheet transactions (continued)
Vontobel Fund - Bond Global Aggregate (continued)
Description Quantity Strike
price Currency Maturity
Market
value Commitment
Cost
price
Unrealised
gain/loss in
Sub-Fund
currency
Call FUT-US LONG
BOND-DEC18 1,224 149 USD 21.09.2018 49,312 6,523,880 159,760 -110,448
Call USD/KRW SPOT
CROSS 140,000,000 1,180 USD 16.11.2018 234,736 102,027,383 2,319,512 -2,084,776
Call USD/KRW SPOT
CROSS 140,000,000 1,120 USD 27.02.2019 2,292,576 491,338,813 1,926,545 366,031
Call USD/KRW SPOT
CROSS -130,000,000 1,250 USD 27.12.2018 -58,094 -33,013,438 -497,297 439,203
Call FUT-5Y
TREASURY NOTES
USA-JAN19
700 115 USD 26.10.2018 65,804 11,939,196 76,940 -11,136
Put USD/TRY SPOT
CROSS 4,900,000 4 USD 17.06.2019 24,347 -16,733 431,116 -406,769
Put USD/RUB SPOT
CROSS 105,000,000 57 USD 23.11.2018 4,815 -180,391 487,206 -482,391
Call USD/CNH SPOT
CROSS -156,000,000 7 USD 11.09.2018 0 -1,240 -576,042 576,042
Call USD/CNH SPOT
CROSS 97,500,000 7 USD 11.09.2018 17,424 344,893 706,221 -688,797
Call EUR/GBP SPOT -
CROSS RATES -210,000,000 1 EUR 26.02.2019 -811,782 -167,120 -1,008,000 196,218
Put EUR/USD SPOT -
CROSS RATES 105,000,000 1 EUR 16.08.2019 106,860 -31,484 361,200 -254,340
Call EUR/CHF SPOT
CROSS -70,000,000 1 EUR 22.11.2018 -108 -160 -105,000 104,892
Call EUR/CHF SPOT
CROSS -208,000,000 1 EUR 11.09.2018 0 -238 -730,080 730,080
Put EUR/NOK SPOT
CROSS 45,500,000 9 EUR 02.10.2018 7,591 -91,198 272,318 -264,727
Put AUD/JPY SPOT
CROSS -238,000,000 72 AUD 06.08.2019 -2,923,268 20,910,844 -2,292,608 -630,660
Put AUD/JPY SPOT
CROSS -245,000,000 72 AUD 22.07.2019 -2,721,265 20,066,488 -2,239,020 -482,244
Call USD/SGD SPOT
CROSS -224,000,000 1 USD 24.07.2019 -1,108,406 -367,091 -1,045,081 -63,325
Put GBP/USD SPOT
CROSS -210,000,000 1 GBP 04.04.2019 -5,464,840 1,209,132 -2,051,350 -3,413,490
Put GBP/USD SPOT
CROSS -28,000,000 1 GBP 14.01.2019 -411,731 125,528 -306,466 -105,265
Put EUR/MXN
SPOT/CROSS RATES 3,500,000 22 EUR 05.06.2019 767,892 -175,342 362,250 405,642
Call USD/KRW SPOT
CROSS 260,000,000 1,300 USD 27.12.2018 16,244 26,309,560 598,912 -582,668
Call USD/KRW SPOT
CROSS 140,000,000 1,150 USD 26.04.2019 1,719,501 312,348,183 2,062,424 -342,924
Call EUR/CHF SPOT
CROSS 70,000,000 1 EUR 22.11.2018 1,575 1,999 292,250 -290,675
Put GBP/USD SPOT
CROSS -280,000,000 1 GBP 12.04.2019 -2,560,076 574,312 -1,843,517 -716,558
Call EUR/GBP SPOT -
CROSS RATES 175,000,000 1 EUR 23.01.2019 1,012,739 246,526 1,460,900 -448,161
Call EUR/NOK SPOT
CROSS -45,500,000 10 EUR 02.10.2018 -2,724 -38,650 -245,700 242,976
Put GBP/USD SPOT
CROSS 140,000,000 1 GBP 16.01.2019 2,953,413 -861,468 2,060,559 892,854
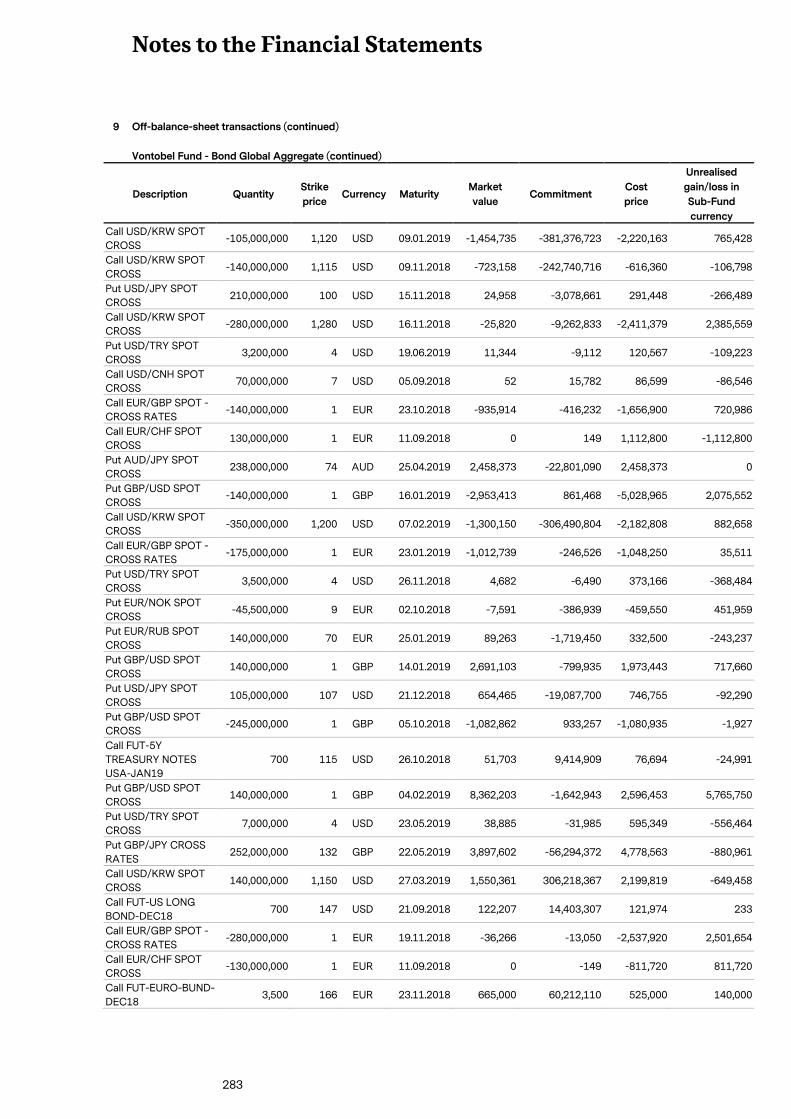
Notes to the Financial Statements
283
9 Off-balance-sheet transactions (continued)
Vontobel Fund - Bond Global Aggregate (continued)
Description Quantity Strike
price Currency Maturity
Market
value Commitment
Cost
price
Unrealised
gain/loss in
Sub-Fund
currency
Call USD/KRW SPOT
CROSS -105,000,000 1,120 USD 09.01.2019 -1,454,735 -381,376,723 -2,220,163 765,428
Call USD/KRW SPOT
CROSS -140,000,000 1,115 USD 09.11.2018 -723,158 -242,740,716 -616,360 -106,798
Put USD/JPY SPOT
CROSS 210,000,000 100 USD 15.11.2018 24,958 -3,078,661 291,448 -266,489
Call USD/KRW SPOT
CROSS -280,000,000 1,280 USD 16.11.2018 -25,820 -9,262,833 -2,411,379 2,385,559
Put USD/TRY SPOT
CROSS 3,200,000 4 USD 19.06.2019 11,344 -9,112 120,567 -109,223
Call USD/CNH SPOT
CROSS 70,000,000 7 USD 05.09.2018 52 15,782 86,599 -86,546
Call EUR/GBP SPOT -
CROSS RATES -140,000,000 1 EUR 23.10.2018 -935,914 -416,232 -1,656,900 720,986
Call EUR/CHF SPOT
CROSS 130,000,000 1 EUR 11.09.2018 0 149 1,112,800 -1,112,800
Put AUD/JPY SPOT
CROSS 238,000,000 74 AUD 25.04.2019 2,458,373 -22,801,090 2,458,373 0
Put GBP/USD SPOT
CROSS -140,000,000 1 GBP 16.01.2019 -2,953,413 861,468 -5,028,965 2,075,552
Call USD/KRW SPOT
CROSS -350,000,000 1,200 USD 07.02.2019 -1,300,150 -306,490,804 -2,182,808 882,658
Call EUR/GBP SPOT -
CROSS RATES -175,000,000 1 EUR 23.01.2019 -1,012,739 -246,526 -1,048,250 35,511
Put USD/TRY SPOT
CROSS 3,500,000 4 USD 26.11.2018 4,682 -6,490 373,166 -368,484
Put EUR/NOK SPOT
CROSS -45,500,000 9 EUR 02.10.2018 -7,591 -386,939 -459,550 451,959
Put EUR/RUB SPOT
CROSS 140,000,000 70 EUR 25.01.2019 89,263 -1,719,450 332,500 -243,237
Put GBP/USD SPOT
CROSS 140,000,000 1 GBP 14.01.2019 2,691,103 -799,935 1,973,443 717,660
Put USD/JPY SPOT
CROSS 105,000,000 107 USD 21.12.2018 654,465 -19,087,700 746,755 -92,290
Put GBP/USD SPOT
CROSS -245,000,000 1 GBP 05.10.2018 -1,082,862 933,257 -1,080,935 -1,927
Call FUT-5Y
TREASURY NOTES
USA-JAN19
700 115 USD 26.10.2018 51,703 9,414,909 76,694 -24,991
Put GBP/USD SPOT
CROSS 140,000,000 1 GBP 04.02.2019 8,362,203 -1,642,943 2,596,453 5,765,750
Put USD/TRY SPOT
CROSS 7,000,000 4 USD 23.05.2019 38,885 -31,985 595,349 -556,464
Put GBP/JPY CROSS
RATES 252,000,000 132 GBP 22.05.2019 3,897,602 -56,294,372 4,778,563 -880,961
Call USD/KRW SPOT
CROSS 140,000,000 1,150 USD 27.03.2019 1,550,361 306,218,367 2,199,819 -649,458
Call FUT-US LONG
BOND-DEC18 700 147 USD 21.09.2018 122,207 14,403,307 121,974 233
Call EUR/GBP SPOT -
CROSS RATES -280,000,000 1 EUR 19.11.2018 -36,266 -13,050 -2,537,920 2,501,654
Call EUR/CHF SPOT
CROSS -130,000,000 1 EUR 11.09.2018 0 -149 -811,720 811,720
Call FUT-EURO-BUND-
DEC18 3,500 166 EUR 23.11.2018 665,000 60,212,110 525,000 140,000
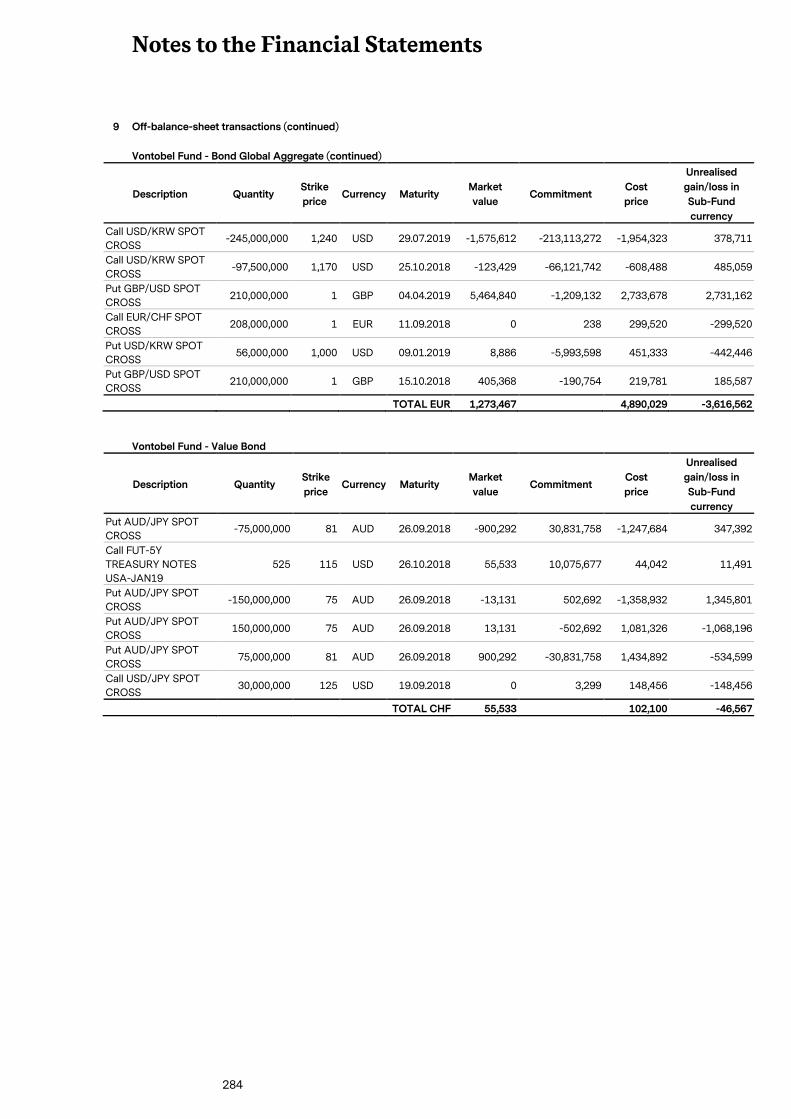
Notes to the Financial Statements
284
9 Off-balance-sheet transactions (continued)
Vontobel Fund - Bond Global Aggregate (continued)
Description Quantity Strike
price Currency Maturity
Market
value Commitment
Cost
price
Unrealised
gain/loss in
Sub-Fund
currency
Call USD/KRW SPOT
CROSS -245,000,000 1,240 USD 29.07.2019 -1,575,612 -213,113,272 -1,954,323 378,711
Call USD/KRW SPOT
CROSS -97,500,000 1,170 USD 25.10.2018 -123,429 -66,121,742 -608,488 485,059
Put GBP/USD SPOT
CROSS 210,000,000 1 GBP 04.04.2019 5,464,840 -1,209,132 2,733,678 2,731,162
Call EUR/CHF SPOT
CROSS 208,000,000 1 EUR 11.09.2018 0 238 299,520 -299,520
Put USD/KRW SPOT
CROSS 56,000,000 1,000 USD 09.01.2019 8,886 -5,993,598 451,333 -442,446
Put GBP/USD SPOT
CROSS 210,000,000 1 GBP 15.10.2018 405,368 -190,754 219,781 185,587
TOTAL EUR 1,273,467 4,890,029 -3,616,562
Vontobel Fund - Value Bond
Description Quantity Strike
price Currency Maturity
Market
value Commitment
Cost
price
Unrealised
gain/loss in
Sub-Fund
currency
Put AUD/JPY SPOT
CROSS -75,000,000 81 AUD 26.09.2018 -900,292 30,831,758 -1,247,684 347,392
Call FUT-5Y
TREASURY NOTES
USA-JAN19
525 115 USD 26.10.2018 55,533 10,075,677 44,042 11,491
Put AUD/JPY SPOT
CROSS -150,000,000 75 AUD 26.09.2018 -13,131 502,692 -1,358,932 1,345,801
Put AUD/JPY SPOT
CROSS 150,000,000 75 AUD 26.09.2018 13,131 -502,692 1,081,326 -1,068,196
Put AUD/JPY SPOT
CROSS 75,000,000 81 AUD 26.09.2018 900,292 -30,831,758 1,434,892 -534,599
Call USD/JPY SPOT
CROSS 30,000,000 125 USD 19.09.2018 0 3,299 148,456 -148,456
TOTAL CHF 55,533 102,100 -46,567
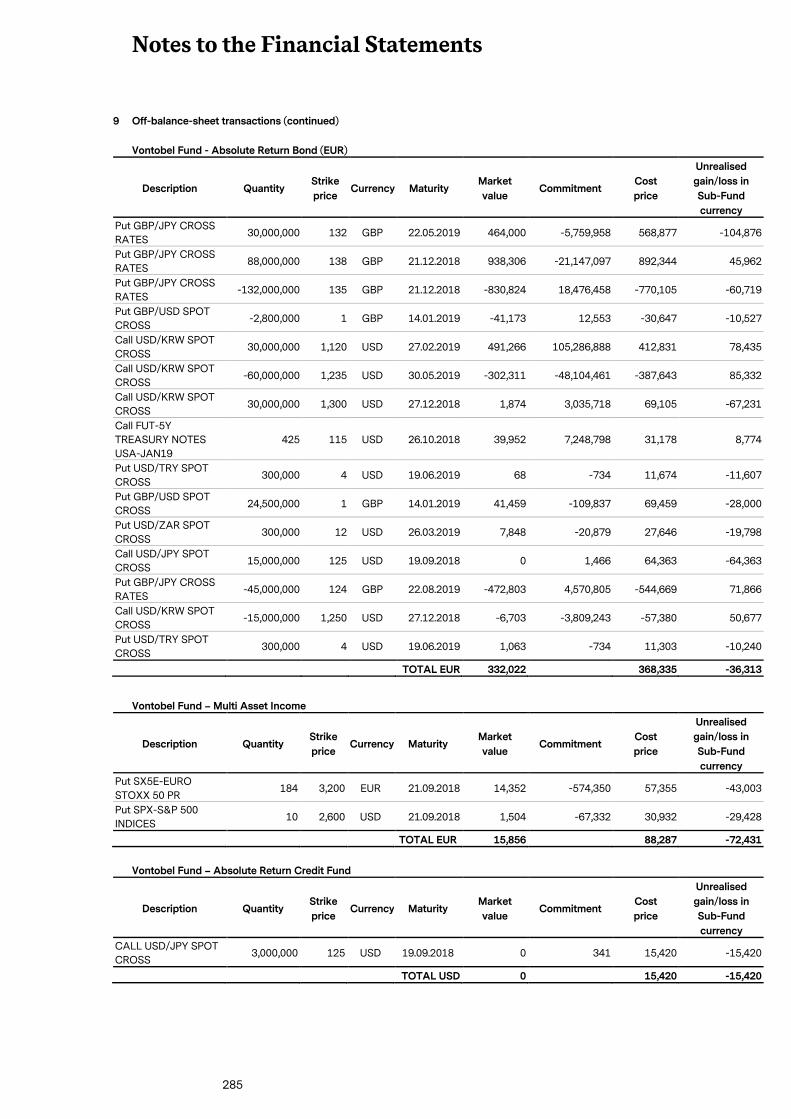
Notes to the Financial Statements
285
9 Off-balance-sheet transactions (continued)
Vontobel Fund - Absolute Return Bond (EUR)
Description Quantity Strike
price Currency Maturity
Market
value Commitment
Cost
price
Unrealised
gain/loss in
Sub-Fund
currency
Put GBP/JPY CROSS
RATES 30,000,000 132 GBP 22.05.2019 464,000 -5,759,958 568,877 -104,876
Put GBP/JPY CROSS
RATES 88,000,000 138 GBP 21.12.2018 938,306 -21,147,097 892,344 45,962
Put GBP/JPY CROSS
RATES -132,000,000 135 GBP 21.12.2018 -830,824 18,476,458 -770,105 -60,719
Put GBP/USD SPOT
CROSS -2,800,000 1 GBP 14.01.2019 -41,173 12,553 -30,647 -10,527
Call USD/KRW SPOT
CROSS 30,000,000 1,120 USD 27.02.2019 491,266 105,286,888 412,831 78,435
Call USD/KRW SPOT
CROSS -60,000,000 1,235 USD 30.05.2019 -302,311 -48,104,461 -387,643 85,332
Call USD/KRW SPOT
CROSS 30,000,000 1,300 USD 27.12.2018 1,874 3,035,718 69,105 -67,231
Call FUT-5Y
TREASURY NOTES
USA-JAN19
425 115 USD 26.10.2018 39,952 7,248,798 31,178 8,774
Put USD/TRY SPOT
CROSS 300,000 4 USD 19.06.2019 68 -734 11,674 -11,607
Put GBP/USD SPOT
CROSS 24,500,000 1 GBP 14.01.2019 41,459 -109,837 69,459 -28,000
Put USD/ZAR SPOT
CROSS 300,000 12 USD 26.03.2019 7,848 -20,879 27,646 -19,798
Call USD/JPY SPOT
CROSS 15,000,000 125 USD 19.09.2018 0 1,466 64,363 -64,363
Put GBP/JPY CROSS
RATES -45,000,000 124 GBP 22.08.2019 -472,803 4,570,805 -544,669 71,866
Call USD/KRW SPOT
CROSS -15,000,000 1,250 USD 27.12.2018 -6,703 -3,809,243 -57,380 50,677
Put USD/TRY SPOT
CROSS 300,000 4 USD 19.06.2019 1,063 -734 11,303 -10,240
TOTAL EUR 332,022 368,335 -36,313
Vontobel Fund – Multi Asset Income
Description Quantity Strike
price Currency Maturity
Market
value Commitment
Cost
price
Unrealised
gain/loss in
Sub-Fund
currency
Put SX5E-EURO
STOXX 50 PR 184 3,200 EUR 21.09.2018 14,352 -574,350 57,355 -43,003
Put SPX-S&P 500
INDICES 10 2,600 USD 21.09.2018 1,504 -67,332 30,932 -29,428
TOTAL EUR 15,856 88,287 -72,431
Vontobel Fund – Absolute Return Credit Fund
Description Quantity Strike
price Currency Maturity
Market
value Commitment
Cost
price
Unrealised
gain/loss in
Sub-Fund
currency
CALL USD/JPY SPOT
CROSS 3,000,000 125 USD 19.09.2018 0 341 15,420 -15,420
TOTAL USD 0 15,420 -15,420
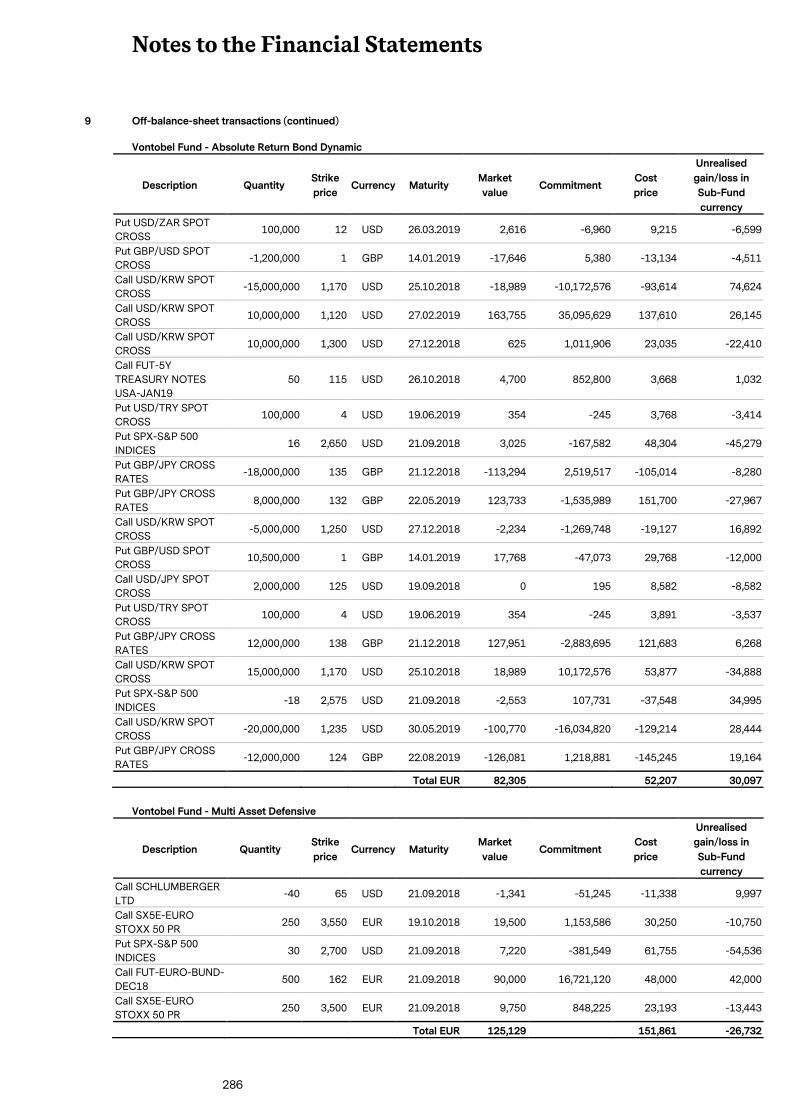
Notes to the Financial Statements
286
9 Off-balance-sheet transactions (continued)
Vontobel Fund - Absolute Return Bond Dynamic
Description Quantity Strike
price Currency Maturity
Market
value Commitment
Cost
price
Unrealised
gain/loss in
Sub-Fund
currency
Put USD/ZAR SPOT
CROSS 100,000 12 USD 26.03.2019 2,616 -6,960 9,215 -6,599
Put GBP/USD SPOT
CROSS -1,200,000 1 GBP 14.01.2019 -17,646 5,380 -13,134 -4,511
Call USD/KRW SPOT
CROSS -15,000,000 1,170 USD 25.10.2018 -18,989 -10,172,576 -93,614 74,624
Call USD/KRW SPOT
CROSS 10,000,000 1,120 USD 27.02.2019 163,755 35,095,629 137,610 26,145
Call USD/KRW SPOT
CROSS 10,000,000 1,300 USD 27.12.2018 625 1,011,906 23,035 -22,410
Call FUT-5Y
TREASURY NOTES
USA-JAN19
50 115 USD 26.10.2018 4,700 852,800 3,668 1,032
Put USD/TRY SPOT
CROSS 100,000 4 USD 19.06.2019 354 -245 3,768 -3,414
Put SPX-S&P 500
INDICES 16 2,650 USD 21.09.2018 3,025 -167,582 48,304 -45,279
Put GBP/JPY CROSS
RATES -18,000,000 135 GBP 21.12.2018 -113,294 2,519,517 -105,014 -8,280
Put GBP/JPY CROSS
RATES 8,000,000 132 GBP 22.05.2019 123,733 -1,535,989 151,700 -27,967
Call USD/KRW SPOT
CROSS -5,000,000 1,250 USD 27.12.2018 -2,234 -1,269,748 -19,127 16,892
Put GBP/USD SPOT
CROSS 10,500,000 1 GBP 14.01.2019 17,768 -47,073 29,768 -12,000
Call USD/JPY SPOT
CROSS 2,000,000 125 USD 19.09.2018 0 195 8,582 -8,582
Put USD/TRY SPOT
CROSS 100,000 4 USD 19.06.2019 354 -245 3,891 -3,537
Put GBP/JPY CROSS
RATES 12,000,000 138 GBP 21.12.2018 127,951 -2,883,695 121,683 6,268
Call USD/KRW SPOT
CROSS 15,000,000 1,170 USD 25.10.2018 18,989 10,172,576 53,877 -34,888
Put SPX-S&P 500
INDICES -18 2,575 USD 21.09.2018 -2,553 107,731 -37,548 34,995
Call USD/KRW SPOT
CROSS -20,000,000 1,235 USD 30.05.2019 -100,770 -16,034,820 -129,214 28,444
Put GBP/JPY CROSS
RATES -12,000,000 124 GBP 22.08.2019 -126,081 1,218,881 -145,245 19,164
Total EUR 82,305 52,207 30,097
Vontobel Fund - Multi Asset Defensive
Description Quantity Strike
price Currency Maturity
Market
value Commitment
Cost
price
Unrealised
gain/loss in
Sub-Fund
currency
Call SCHLUMBERGER
LTD -40 65 USD 21.09.2018 -1,341 -51,245 -11,338 9,997
Call SX5E-EURO
STOXX 50 PR 250 3,550 EUR 19.10.2018 19,500 1,153,586 30,250 -10,750
Put SPX-S&P 500
INDICES 30 2,700 USD 21.09.2018 7,220 -381,549 61,755 -54,536
Call FUT-EURO-BUND-
DEC18 500 162 EUR 21.09.2018 90,000 16,721,120 48,000 42,000
Call SX5E-EURO
STOXX 50 PR 250 3,500 EUR 21.09.2018 9,750 848,225 23,193 -13,443
Total EUR 125,129 151,861 -26,732
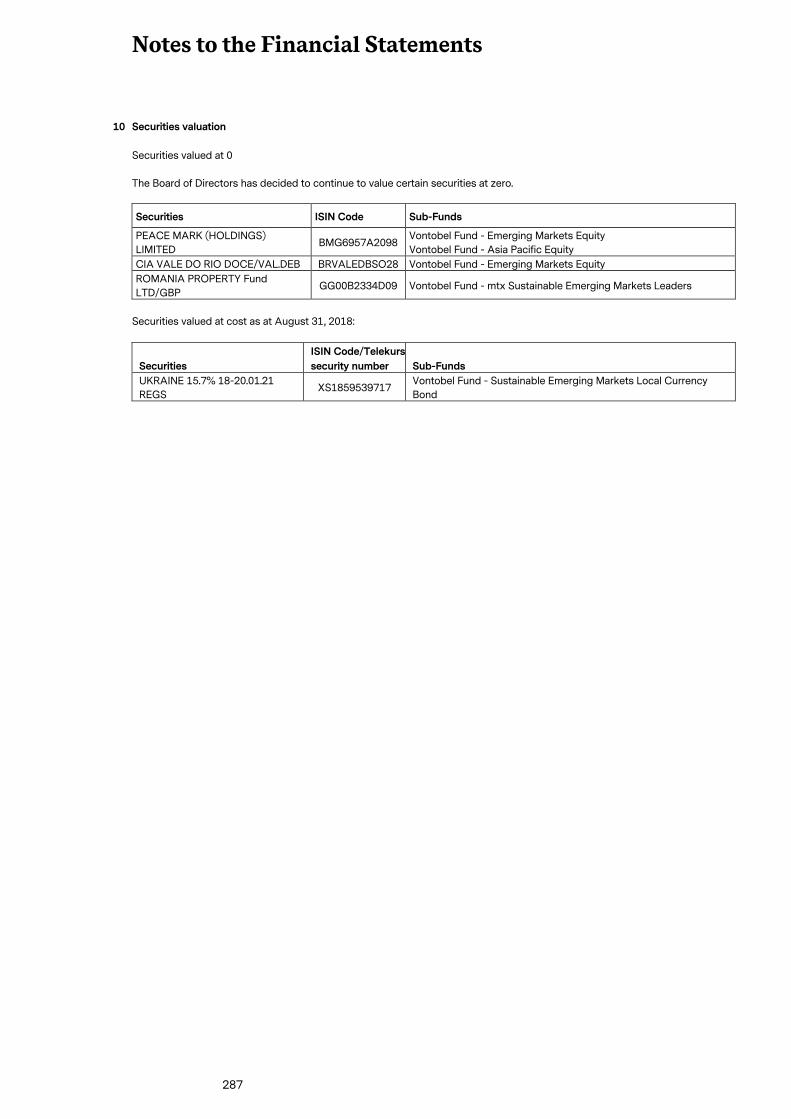
Notes to the Financial Statements
287
10 Securities valuation
Securities valued at 0
The Board of Directors has decided to continue to value certain securities at zero.
Securities ISIN Code Sub-Funds
PEACE MARK (HOLDINGS)
LIMITED BMG6957A2098
Vontobel Fund - Emerging Markets Equity
Vontobel Fund - Asia Pacific Equity
CIA VALE DO RIO DOCE/VAL.DEB BRVALEDBSO28 Vontobel Fund - Emerging Markets Equity
ROMANIA PROPERTY Fund
LTD/GBP GG00B2334D09 Vontobel Fund - mtx Sustainable Emerging Markets Leaders
Securities valued at cost as at August 31, 2018:
Securities
ISIN Code/Telekurs
security number Sub-Funds
UKRAINE 15.7% 18-20.01.21
REGS XS1859539717
Vontobel Fund - Sustainable Emerging Markets Local Currency
Bond
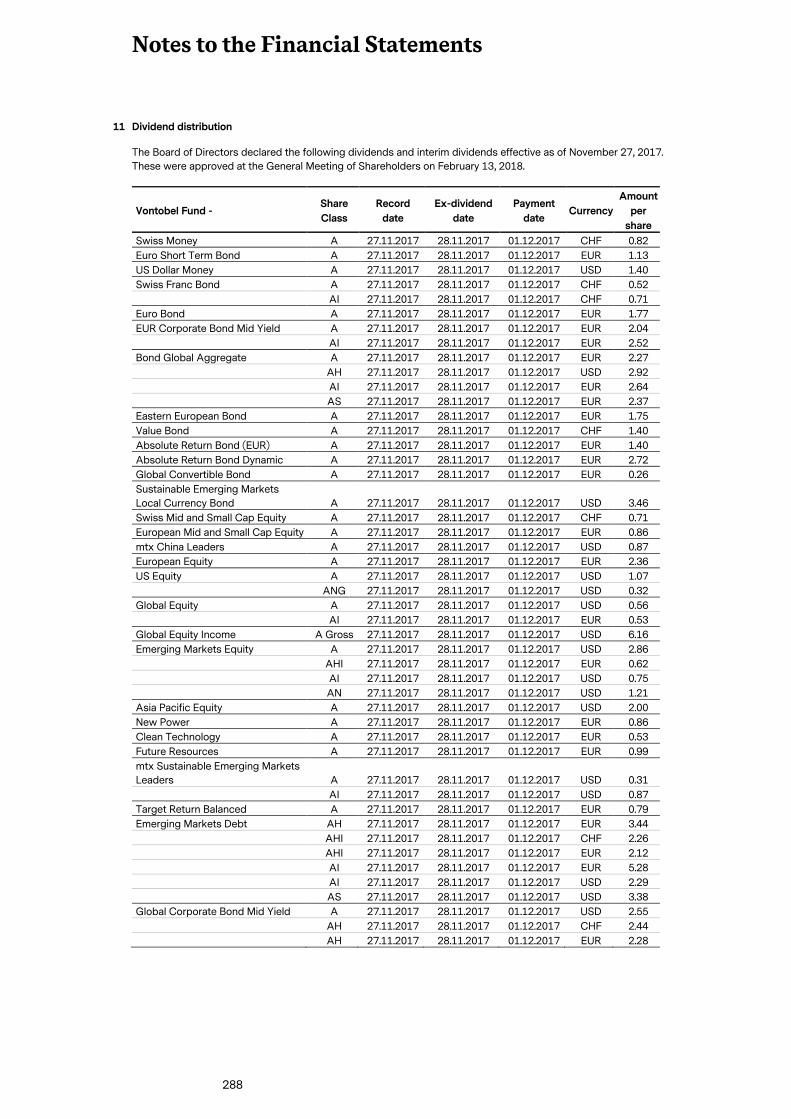
Notes to the Financial Statements
288
11 Dividend distribution
The Board of Directors declared the following dividends and interim dividends effective as of November 27, 2017.
These were approved at the General Meeting of Shareholders on February 13, 2018.
Vontobel Fund - Share
Class
Record
date
Ex-dividend
date
Payment
date Currency
Amount
per
share
Swiss Money A 27.11.2017 28.11.2017 01.12.2017 CHF 0.82
Euro Short Term Bond A 27.11.2017 28.11.2017 01.12.2017 EUR 1.13
US Dollar Money A 27.11.2017 28.11.2017 01.12.2017 USD 1.40
Swiss Franc Bond A 27.11.2017 28.11.2017 01.12.2017 CHF 0.52
AI 27.11.2017 28.11.2017 01.12.2017 CHF 0.71
Euro Bond A 27.11.2017 28.11.2017 01.12.2017 EUR 1.77
EUR Corporate Bond Mid Yield A 27.11.2017 28.11.2017 01.12.2017 EUR 2.04
AI 27.11.2017 28.11.2017 01.12.2017 EUR 2.52
Bond Global Aggregate A 27.11.2017 28.11.2017 01.12.2017 EUR 2.27
AH 27.11.2017 28.11.2017 01.12.2017 USD 2.92
AI 27.11.2017 28.11.2017 01.12.2017 EUR 2.64
AS 27.11.2017 28.11.2017 01.12.2017 EUR 2.37
Eastern European Bond A 27.11.2017 28.11.2017 01.12.2017 EUR 1.75
Value Bond A 27.11.2017 28.11.2017 01.12.2017 CHF 1.40
Absolute Return Bond (EUR) A 27.11.2017 28.11.2017 01.12.2017 EUR 1.40
Absolute Return Bond Dynamic A 27.11.2017 28.11.2017 01.12.2017 EUR 2.72
Global Convertible Bond A 27.11.2017 28.11.2017 01.12.2017 EUR 0.26
Sustainable Emerging Markets
Local Currency Bond A 27.11.2017 28.11.2017 01.12.2017 USD 3.46
Swiss Mid and Small Cap Equity A 27.11.2017 28.11.2017 01.12.2017 CHF 0.71
European Mid and Small Cap Equity A 27.11.2017 28.11.2017 01.12.2017 EUR 0.86
mtx China Leaders A 27.11.2017 28.11.2017 01.12.2017 USD 0.87
European Equity A 27.11.2017 28.11.2017 01.12.2017 EUR 2.36
US Equity A 27.11.2017 28.11.2017 01.12.2017 USD 1.07
ANG 27.11.2017 28.11.2017 01.12.2017 USD 0.32
Global Equity A 27.11.2017 28.11.2017 01.12.2017 USD 0.56
AI 27.11.2017 28.11.2017 01.12.2017 EUR 0.53
Global Equity Income A Gross 27.11.2017 28.11.2017 01.12.2017 USD 6.16
Emerging Markets Equity A 27.11.2017 28.11.2017 01.12.2017 USD 2.86
AHI 27.11.2017 28.11.2017 01.12.2017 EUR 0.62
AI 27.11.2017 28.11.2017 01.12.2017 USD 0.75
AN 27.11.2017 28.11.2017 01.12.2017 USD 1.21
Asia Pacific Equity A 27.11.2017 28.11.2017 01.12.2017 USD 2.00
New Power A 27.11.2017 28.11.2017 01.12.2017 EUR 0.86
Clean Technology A 27.11.2017 28.11.2017 01.12.2017 EUR 0.53
Future Resources A 27.11.2017 28.11.2017 01.12.2017 EUR 0.99
mtx Sustainable Emerging Markets
Leaders A 27.11.2017 28.11.2017 01.12.2017 USD 0.31
AI 27.11.2017 28.11.2017 01.12.2017 USD 0.87
Target Return Balanced A 27.11.2017 28.11.2017 01.12.2017 EUR 0.79
Emerging Markets Debt AH 27.11.2017 28.11.2017 01.12.2017 EUR 3.44
AHI 27.11.2017 28.11.2017 01.12.2017 CHF 2.26
AHI 27.11.2017 28.11.2017 01.12.2017 EUR 2.12
AI 27.11.2017 28.11.2017 01.12.2017 EUR 5.28
AI 27.11.2017 28.11.2017 01.12.2017 USD 2.29
AS 27.11.2017 28.11.2017 01.12.2017 USD 3.38
Global Corporate Bond Mid Yield A 27.11.2017 28.11.2017 01.12.2017 USD 2.55
AH 27.11.2017 28.11.2017 01.12.2017 CHF 2.44
AH 27.11.2017 28.11.2017 01.12.2017 EUR 2.28
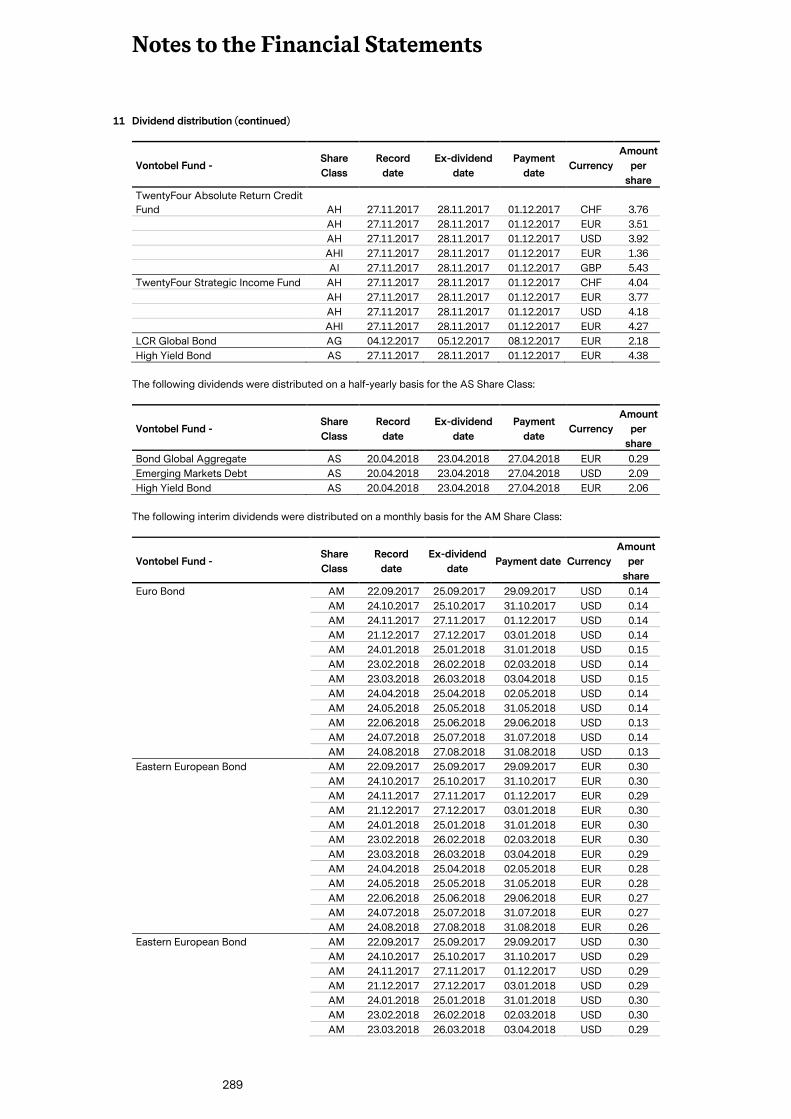
Notes to the Financial Statements
289
11 Dividend distribution (continued)
Vontobel Fund - Share
Class
Record
date
Ex-dividend
date
Payment
date Currency
Amount
per
share
TwentyFour Absolute Return Credit
Fund AH 27.11.2017 28.11.2017 01.12.2017 CHF 3.76
AH 27.11.2017 28.11.2017 01.12.2017 EUR 3.51
AH 27.11.2017 28.11.2017 01.12.2017 USD 3.92
AHI 27.11.2017 28.11.2017 01.12.2017 EUR 1.36
AI 27.11.2017 28.11.2017 01.12.2017 GBP 5.43
TwentyFour Strategic Income Fund AH 27.11.2017 28.11.2017 01.12.2017 CHF 4.04
AH 27.11.2017 28.11.2017 01.12.2017 EUR 3.77
AH 27.11.2017 28.11.2017 01.12.2017 USD 4.18
AHI 27.11.2017 28.11.2017 01.12.2017 EUR 4.27
LCR Global Bond AG 04.12.2017 05.12.2017 08.12.2017 EUR 2.18
High Yield Bond AS 27.11.2017 28.11.2017 01.12.2017 EUR 4.38
The following dividends were distributed on a half-yearly basis for the AS Share Class:
Vontobel Fund - Share
Class
Record
date
Ex-dividend
date
Payment
date Currency
Amount
per
share
Bond Global Aggregate AS 20.04.2018 23.04.2018 27.04.2018 EUR 0.29
Emerging Markets Debt AS 20.04.2018 23.04.2018 27.04.2018 USD 2.09
High Yield Bond AS 20.04.2018 23.04.2018 27.04.2018 EUR 2.06
The following interim dividends were distributed on a monthly basis for the AM Share Class:
Vontobel Fund - Share
Class
Record
date
Ex-dividend
date Payment date Currency
Amount
per
share
Euro Bond AM 22.09.2017 25.09.2017 29.09.2017 USD 0.14
AM 24.10.2017 25.10.2017 31.10.2017 USD 0.14
AM 24.11.2017 27.11.2017 01.12.2017 USD 0.14
AM 21.12.2017 27.12.2017 03.01.2018 USD 0.14
AM 24.01.2018 25.01.2018 31.01.2018 USD 0.15
AM 23.02.2018 26.02.2018 02.03.2018 USD 0.14
AM 23.03.2018 26.03.2018 03.04.2018 USD 0.15
AM 24.04.2018 25.04.2018 02.05.2018 USD 0.14
AM 24.05.2018 25.05.2018 31.05.2018 USD 0.14
AM 22.06.2018 25.06.2018 29.06.2018 USD 0.13
AM 24.07.2018 25.07.2018 31.07.2018 USD 0.14
AM 24.08.2018 27.08.2018 31.08.2018 USD 0.13
Eastern European Bond AM 22.09.2017 25.09.2017 29.09.2017 EUR 0.30
AM 24.10.2017 25.10.2017 31.10.2017 EUR 0.30
AM 24.11.2017 27.11.2017 01.12.2017 EUR 0.29
AM 21.12.2017 27.12.2017 03.01.2018 EUR 0.30
AM 24.01.2018 25.01.2018 31.01.2018 EUR 0.30
AM 23.02.2018 26.02.2018 02.03.2018 EUR 0.30
AM 23.03.2018 26.03.2018 03.04.2018 EUR 0.29
AM 24.04.2018 25.04.2018 02.05.2018 EUR 0.28
AM 24.05.2018 25.05.2018 31.05.2018 EUR 0.28
AM 22.06.2018 25.06.2018 29.06.2018 EUR 0.27
AM 24.07.2018 25.07.2018 31.07.2018 EUR 0.27
AM 24.08.2018 27.08.2018 31.08.2018 EUR 0.26
Eastern European Bond AM 22.09.2017 25.09.2017 29.09.2017 USD 0.30
AM 24.10.2017 25.10.2017 31.10.2017 USD 0.29
AM 24.11.2017 27.11.2017 01.12.2017 USD 0.29
AM 21.12.2017 27.12.2017 03.01.2018 USD 0.29
AM 24.01.2018 25.01.2018 31.01.2018 USD 0.30
AM 23.02.2018 26.02.2018 02.03.2018 USD 0.30
AM 23.03.2018 26.03.2018 03.04.2018 USD 0.29
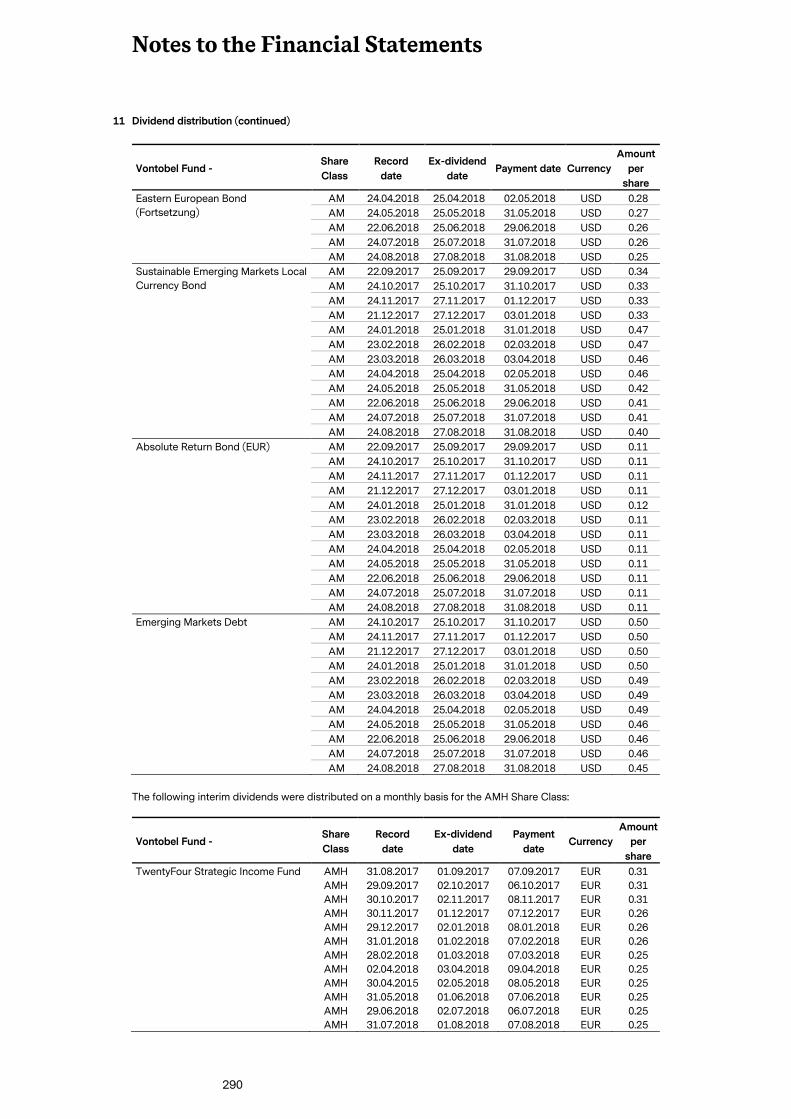
Notes to the Financial Statements
290
11 Dividend distribution (continued)
Vontobel Fund - Share
Class
Record
date
Ex-dividend
date Payment date Currency
Amount
per
share
Eastern European Bond
(Fortsetzung)
AM 24.04.2018 25.04.2018 02.05.2018 USD 0.28
AM 24.05.2018 25.05.2018 31.05.2018 USD 0.27
AM 22.06.2018 25.06.2018 29.06.2018 USD 0.26
AM 24.07.2018 25.07.2018 31.07.2018 USD 0.26
AM 24.08.2018 27.08.2018 31.08.2018 USD 0.25
Sustainable Emerging Markets Local
Currency Bond
AM 22.09.2017 25.09.2017 29.09.2017 USD 0.34
AM 24.10.2017 25.10.2017 31.10.2017 USD 0.33
AM 24.11.2017 27.11.2017 01.12.2017 USD 0.33
AM 21.12.2017 27.12.2017 03.01.2018 USD 0.33
AM 24.01.2018 25.01.2018 31.01.2018 USD 0.47
AM 23.02.2018 26.02.2018 02.03.2018 USD 0.47
AM 23.03.2018 26.03.2018 03.04.2018 USD 0.46
AM 24.04.2018 25.04.2018 02.05.2018 USD 0.46
AM 24.05.2018 25.05.2018 31.05.2018 USD 0.42
AM 22.06.2018 25.06.2018 29.06.2018 USD 0.41
AM 24.07.2018 25.07.2018 31.07.2018 USD 0.41
AM 24.08.2018 27.08.2018 31.08.2018 USD 0.40
Absolute Return Bond (EUR) AM 22.09.2017 25.09.2017 29.09.2017 USD 0.11
AM 24.10.2017 25.10.2017 31.10.2017 USD 0.11
AM 24.11.2017 27.11.2017 01.12.2017 USD 0.11
AM 21.12.2017 27.12.2017 03.01.2018 USD 0.11
AM 24.01.2018 25.01.2018 31.01.2018 USD 0.12
AM 23.02.2018 26.02.2018 02.03.2018 USD 0.11
AM 23.03.2018 26.03.2018 03.04.2018 USD 0.11
AM 24.04.2018 25.04.2018 02.05.2018 USD 0.11
AM 24.05.2018 25.05.2018 31.05.2018 USD 0.11
AM 22.06.2018 25.06.2018 29.06.2018 USD 0.11
AM 24.07.2018 25.07.2018 31.07.2018 USD 0.11
AM 24.08.2018 27.08.2018 31.08.2018 USD 0.11
Emerging Markets Debt AM 24.10.2017 25.10.2017 31.10.2017 USD 0.50
AM 24.11.2017 27.11.2017 01.12.2017 USD 0.50
AM 21.12.2017 27.12.2017 03.01.2018 USD 0.50
AM 24.01.2018 25.01.2018 31.01.2018 USD 0.50
AM 23.02.2018 26.02.2018 02.03.2018 USD 0.49
AM 23.03.2018 26.03.2018 03.04.2018 USD 0.49
AM 24.04.2018 25.04.2018 02.05.2018 USD 0.49
AM 24.05.2018 25.05.2018 31.05.2018 USD 0.46
AM 22.06.2018 25.06.2018 29.06.2018 USD 0.46
AM 24.07.2018 25.07.2018 31.07.2018 USD 0.46
AM 24.08.2018 27.08.2018 31.08.2018 USD 0.45
The following interim dividends were distributed on a monthly basis for the AMH Share Class:
Vontobel Fund - Share
Class
Record
date
Ex-dividend
date
Payment
date Currency
Amount
per
share
TwentyFour Strategic Income Fund AMH 31.08.2017 01.09.2017 07.09.2017 EUR 0.31
AMH 29.09.2017 02.10.2017 06.10.2017 EUR 0.31
AMH 30.10.2017 02.11.2017 08.11.2017 EUR 0.31
AMH 30.11.2017 01.12.2017 07.12.2017 EUR 0.26
AMH 29.12.2017 02.01.2018 08.01.2018 EUR 0.26
AMH 31.01.2018 01.02.2018 07.02.2018 EUR 0.26
AMH 28.02.2018 01.03.2018 07.03.2018 EUR 0.25
AMH 02.04.2018 03.04.2018 09.04.2018 EUR 0.25
AMH 30.04.2015 02.05.2018 08.05.2018 EUR 0.25
AMH 31.05.2018 01.06.2018 07.06.2018 EUR 0.25
AMH 29.06.2018 02.07.2018 06.07.2018 EUR 0.25
AMH 31.07.2018 01.08.2018 07.08.2018 EUR 0.25
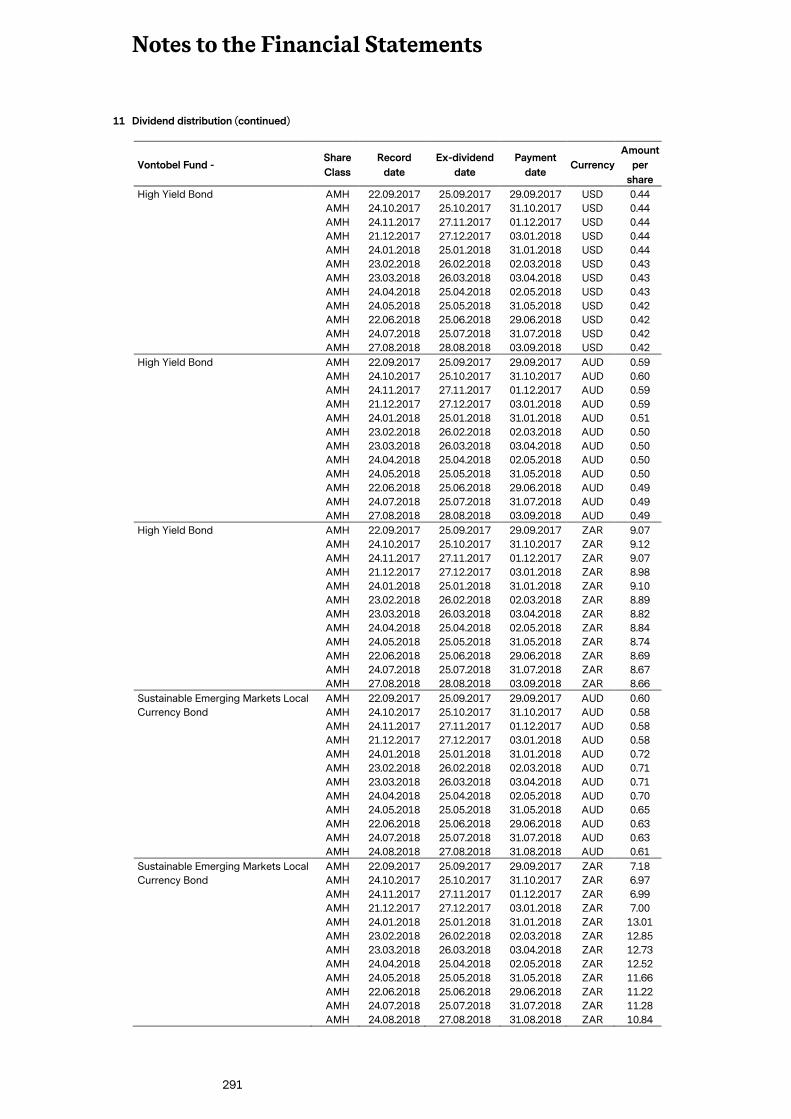
Notes to the Financial Statements
291
11 Dividend distribution (continued)
Vontobel Fund - Share
Class
Record
date
Ex-dividend
date
Payment
date Currency
Amount
per
share
High Yield Bond AMH 22.09.2017 25.09.2017 29.09.2017 USD 0.44
AMH 24.10.2017 25.10.2017 31.10.2017 USD 0.44
AMH 24.11.2017 27.11.2017 01.12.2017 USD 0.44
AMH 21.12.2017 27.12.2017 03.01.2018 USD 0.44
AMH 24.01.2018 25.01.2018 31.01.2018 USD 0.44
AMH 23.02.2018 26.02.2018 02.03.2018 USD 0.43
AMH 23.03.2018 26.03.2018 03.04.2018 USD 0.43
AMH 24.04.2018 25.04.2018 02.05.2018 USD 0.43
AMH 24.05.2018 25.05.2018 31.05.2018 USD 0.42
AMH 22.06.2018 25.06.2018 29.06.2018 USD 0.42
AMH 24.07.2018 25.07.2018 31.07.2018 USD 0.42
AMH 27.08.2018 28.08.2018 03.09.2018 USD 0.42
High Yield Bond AMH 22.09.2017 25.09.2017 29.09.2017 AUD 0.59
AMH 24.10.2017 25.10.2017 31.10.2017 AUD 0.60
AMH 24.11.2017 27.11.2017 01.12.2017 AUD 0.59
AMH 21.12.2017 27.12.2017 03.01.2018 AUD 0.59
AMH 24.01.2018 25.01.2018 31.01.2018 AUD 0.51
AMH 23.02.2018 26.02.2018 02.03.2018 AUD 0.50
AMH 23.03.2018 26.03.2018 03.04.2018 AUD 0.50
AMH 24.04.2018 25.04.2018 02.05.2018 AUD 0.50
AMH 24.05.2018 25.05.2018 31.05.2018 AUD 0.50
AMH 22.06.2018 25.06.2018 29.06.2018 AUD 0.49
AMH 24.07.2018 25.07.2018 31.07.2018 AUD 0.49
AMH 27.08.2018 28.08.2018 03.09.2018 AUD 0.49
High Yield Bond AMH 22.09.2017 25.09.2017 29.09.2017 ZAR 9.07
AMH 24.10.2017 25.10.2017 31.10.2017 ZAR 9.12
AMH 24.11.2017 27.11.2017 01.12.2017 ZAR 9.07
AMH 21.12.2017 27.12.2017 03.01.2018 ZAR 8.98
AMH 24.01.2018 25.01.2018 31.01.2018 ZAR 9.10
AMH 23.02.2018 26.02.2018 02.03.2018 ZAR 8.89
AMH 23.03.2018 26.03.2018 03.04.2018 ZAR 8.82
AMH 24.04.2018 25.04.2018 02.05.2018 ZAR 8.84
AMH 24.05.2018 25.05.2018 31.05.2018 ZAR 8.74
AMH 22.06.2018 25.06.2018 29.06.2018 ZAR 8.69
AMH 24.07.2018 25.07.2018 31.07.2018 ZAR 8.67
AMH 27.08.2018 28.08.2018 03.09.2018 ZAR 8.66
Sustainable Emerging Markets Local
Currency Bond
AMH 22.09.2017 25.09.2017 29.09.2017 AUD 0.60
AMH 24.10.2017 25.10.2017 31.10.2017 AUD 0.58
AMH 24.11.2017 27.11.2017 01.12.2017 AUD 0.58
AMH 21.12.2017 27.12.2017 03.01.2018 AUD 0.58
AMH 24.01.2018 25.01.2018 31.01.2018 AUD 0.72
AMH 23.02.2018 26.02.2018 02.03.2018 AUD 0.71
AMH 23.03.2018 26.03.2018 03.04.2018 AUD 0.71
AMH 24.04.2018 25.04.2018 02.05.2018 AUD 0.70
AMH 24.05.2018 25.05.2018 31.05.2018 AUD 0.65
AMH 22.06.2018 25.06.2018 29.06.2018 AUD 0.63
AMH 24.07.2018 25.07.2018 31.07.2018 AUD 0.63
AMH 24.08.2018 27.08.2018 31.08.2018 AUD 0.61
Sustainable Emerging Markets Local
Currency Bond
AMH 22.09.2017 25.09.2017 29.09.2017 ZAR 7.18
AMH 24.10.2017 25.10.2017 31.10.2017 ZAR 6.97
AMH 24.11.2017 27.11.2017 01.12.2017 ZAR 6.99
AMH 21.12.2017 27.12.2017 03.01.2018 ZAR 7.00
AMH 24.01.2018 25.01.2018 31.01.2018 ZAR 13.01
AMH 23.02.2018 26.02.2018 02.03.2018 ZAR 12.85
AMH 23.03.2018 26.03.2018 03.04.2018 ZAR 12.73
AMH 24.04.2018 25.04.2018 02.05.2018 ZAR 12.52
AMH 24.05.2018 25.05.2018 31.05.2018 ZAR 11.66
AMH 22.06.2018 25.06.2018 29.06.2018 ZAR 11.22
AMH 24.07.2018 25.07.2018 31.07.2018 ZAR 11.28
AMH 24.08.2018 27.08.2018 31.08.2018 ZAR 10.84
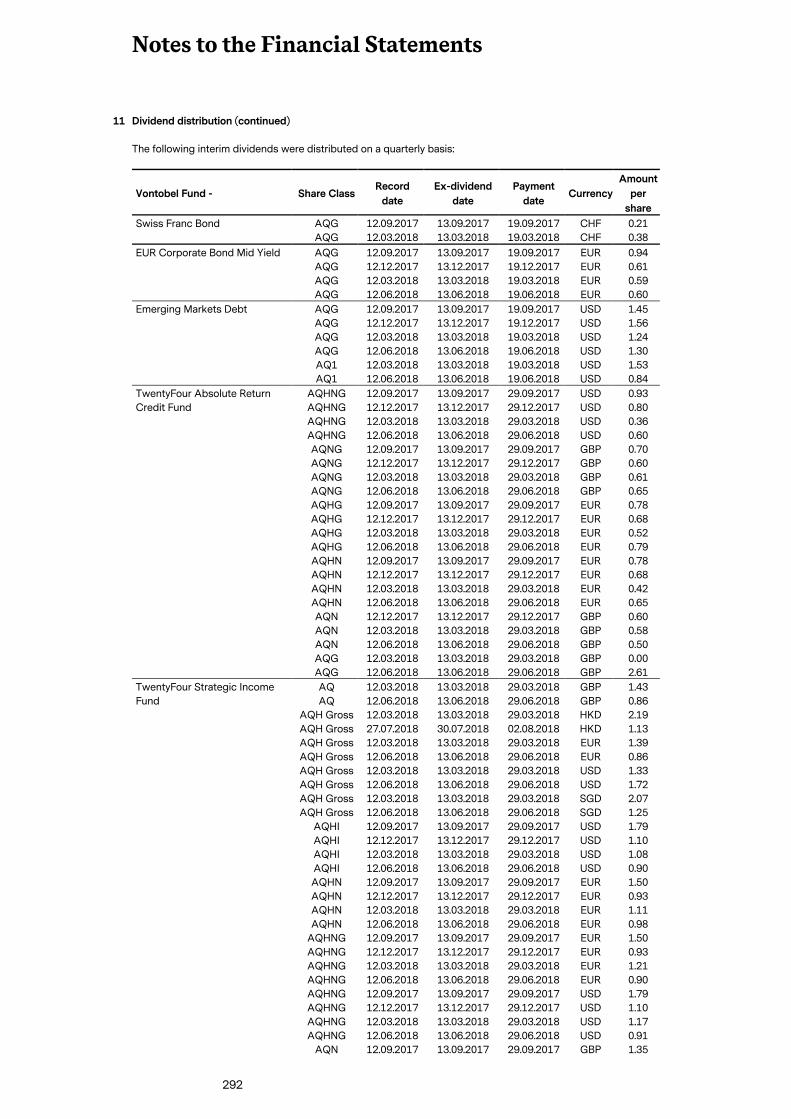
Notes to the Financial Statements
292
11 Dividend distribution (continued)
The following interim dividends were distributed on a quarterly basis:
Vontobel Fund - Share Class Record
date
Ex-dividend
date
Payment
date Currency
Amount
per
share
Swiss Franc Bond AQG 12.09.2017 13.09.2017 19.09.2017 CHF 0.21
AQG 12.03.2018 13.03.2018 19.03.2018 CHF 0.38
EUR Corporate Bond Mid Yield AQG 12.09.2017 13.09.2017 19.09.2017 EUR 0.94
AQG 12.12.2017 13.12.2017 19.12.2017 EUR 0.61
AQG 12.03.2018 13.03.2018 19.03.2018 EUR 0.59
AQG 12.06.2018 13.06.2018 19.06.2018 EUR 0.60
Emerging Markets Debt AQG 12.09.2017 13.09.2017 19.09.2017 USD 1.45
AQG 12.12.2017 13.12.2017 19.12.2017 USD 1.56
AQG 12.03.2018 13.03.2018 19.03.2018 USD 1.24
AQG 12.06.2018 13.06.2018 19.06.2018 USD 1.30
AQ1 12.03.2018 13.03.2018 19.03.2018 USD 1.53
AQ1 12.06.2018 13.06.2018 19.06.2018 USD 0.84
TwentyFour Absolute Return
Credit Fund
AQHNG 12.09.2017 13.09.2017 29.09.2017 USD 0.93
AQHNG 12.12.2017 13.12.2017 29.12.2017 USD 0.80
AQHNG 12.03.2018 13.03.2018 29.03.2018 USD 0.36
AQHNG 12.06.2018 13.06.2018 29.06.2018 USD 0.60
AQNG 12.09.2017 13.09.2017 29.09.2017 GBP 0.70
AQNG 12.12.2017 13.12.2017 29.12.2017 GBP 0.60
AQNG 12.03.2018 13.03.2018 29.03.2018 GBP 0.61
AQNG 12.06.2018 13.06.2018 29.06.2018 GBP 0.65
AQHG 12.09.2017 13.09.2017 29.09.2017 EUR 0.78
AQHG 12.12.2017 13.12.2017 29.12.2017 EUR 0.68
AQHG 12.03.2018 13.03.2018 29.03.2018 EUR 0.52
AQHG 12.06.2018 13.06.2018 29.06.2018 EUR 0.79
AQHN 12.09.2017 13.09.2017 29.09.2017 EUR 0.78
AQHN 12.12.2017 13.12.2017 29.12.2017 EUR 0.68
AQHN 12.03.2018 13.03.2018 29.03.2018 EUR 0.42
AQHN 12.06.2018 13.06.2018 29.06.2018 EUR 0.65
AQN 12.12.2017 13.12.2017 29.12.2017 GBP 0.60
AQN 12.03.2018 13.03.2018 29.03.2018 GBP 0.58
AQN 12.06.2018 13.06.2018 29.06.2018 GBP 0.50
AQG 12.03.2018 13.03.2018 29.03.2018 GBP 0.00
AQG 12.06.2018 13.06.2018 29.06.2018 GBP 2.61
TwentyFour Strategic Income
Fund
AQ 12.03.2018 13.03.2018 29.03.2018 GBP 1.43
AQ 12.06.2018 13.06.2018 29.06.2018 GBP 0.86
AQH Gross 12.03.2018 13.03.2018 29.03.2018 HKD 2.19
AQH Gross 27.07.2018 30.07.2018 02.08.2018 HKD 1.13
AQH Gross 12.03.2018 13.03.2018 29.03.2018 EUR 1.39
AQH Gross 12.06.2018 13.06.2018 29.06.2018 EUR 0.86
AQH Gross 12.03.2018 13.03.2018 29.03.2018 USD 1.33
AQH Gross 12.06.2018 13.06.2018 29.06.2018 USD 1.72
AQH Gross 12.03.2018 13.03.2018 29.03.2018 SGD 2.07
AQH Gross 12.06.2018 13.06.2018 29.06.2018 SGD 1.25
AQHI 12.09.2017 13.09.2017 29.09.2017 USD 1.79
AQHI 12.12.2017 13.12.2017 29.12.2017 USD 1.10
AQHI 12.03.2018 13.03.2018 29.03.2018 USD 1.08
AQHI 12.06.2018 13.06.2018 29.06.2018 USD 0.90
AQHN 12.09.2017 13.09.2017 29.09.2017 EUR 1.50
AQHN 12.12.2017 13.12.2017 29.12.2017 EUR 0.93
AQHN 12.03.2018 13.03.2018 29.03.2018 EUR 1.11
AQHN 12.06.2018 13.06.2018 29.06.2018 EUR 0.98
AQHNG 12.09.2017 13.09.2017 29.09.2017 EUR 1.50
AQHNG 12.12.2017 13.12.2017 29.12.2017 EUR 0.93
AQHNG 12.03.2018 13.03.2018 29.03.2018 EUR 1.21
AQHNG 12.06.2018 13.06.2018 29.06.2018 EUR 0.90
AQHNG 12.09.2017 13.09.2017 29.09.2017 USD 1.79
AQHNG 12.12.2017 13.12.2017 29.12.2017 USD 1.10
AQHNG 12.03.2018 13.03.2018 29.03.2018 USD 1.17
AQHNG 12.06.2018 13.06.2018 29.06.2018 USD 0.91
AQN 12.09.2017 13.09.2017 29.09.2017 GBP 1.35
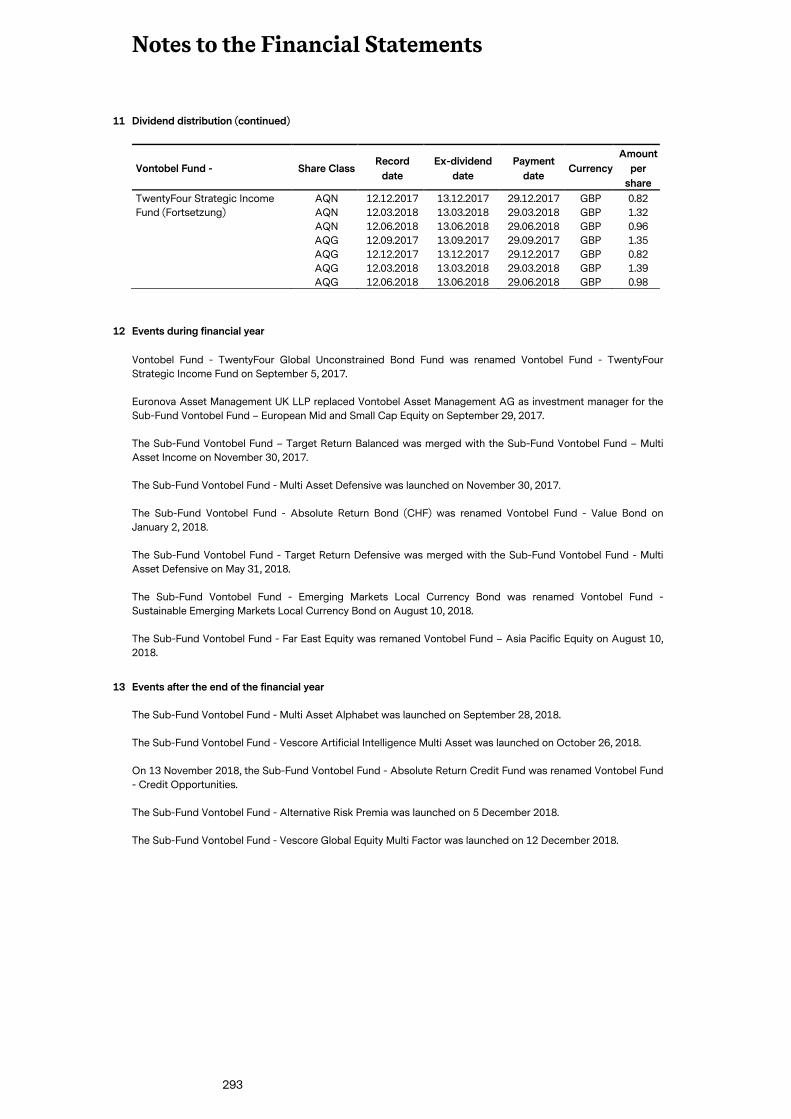
Notes to the Financial Statements
293
11 Dividend distribution (continued)
Vontobel Fund - Share Class Record
date
Ex-dividend
date
Payment
date Currency
Amount
per
share
TwentyFour Strategic Income
Fund (Fortsetzung)
AQN 12.12.2017 13.12.2017 29.12.2017 GBP 0.82
AQN 12.03.2018 13.03.2018 29.03.2018 GBP 1.32
AQN 12.06.2018 13.06.2018 29.06.2018 GBP 0.96
AQG 12.09.2017 13.09.2017 29.09.2017 GBP 1.35
AQG 12.12.2017 13.12.2017 29.12.2017 GBP 0.82
AQG 12.03.2018 13.03.2018 29.03.2018 GBP 1.39
AQG 12.06.2018 13.06.2018 29.06.2018 GBP 0.98
12 Events during financial year
Vontobel Fund - TwentyFour Global Unconstrained Bond Fund was renamed Vontobel Fund - TwentyFour
Strategic Income Fund on September 5, 2017.
Euronova Asset Management UK LLP replaced Vontobel Asset Management AG as investment manager for the
Sub-Fund Vontobel Fund – European Mid and Small Cap Equity on September 29, 2017.
The Sub-Fund Vontobel Fund – Target Return Balanced was merged with the Sub-Fund Vontobel Fund – Multi
Asset Income on November 30, 2017.
The Sub-Fund Vontobel Fund - Multi Asset Defensive was launched on November 30, 2017.
The Sub-Fund Vontobel Fund - Absolute Return Bond (CHF) was renamed Vontobel Fund - Value Bond on
January 2, 2018.
The Sub-Fund Vontobel Fund - Target Return Defensive was merged with the Sub-Fund Vontobel Fund - Multi
Asset Defensive on May 31, 2018.
The Sub-Fund Vontobel Fund - Emerging Markets Local Currency Bond was renamed Vontobel Fund -
Sustainable Emerging Markets Local Currency Bond on August 10, 2018.
The Sub-Fund Vontobel Fund - Far East Equity was remaned Vontobel Fund – Asia Pacific Equity on August 10,
2018.
13 Events after the end of the financial year
The Sub-Fund Vontobel Fund - Multi Asset Alphabet was launched on September 28, 2018.
The Sub-Fund Vontobel Fund - Vescore Artificial Intelligence Multi Asset was launched on October 26, 2018.
On 13 November 2018, the Sub-Fund Vontobel Fund - Absolute Return Credit Fund was renamed Vontobel Fund
- Credit Opportunities.
The Sub-Fund Vontobel Fund - Alternative Risk Premia was launched on 5 December 2018.
The Sub-Fund Vontobel Fund - Vescore Global Equity Multi Factor was launched on 12 December 2018.
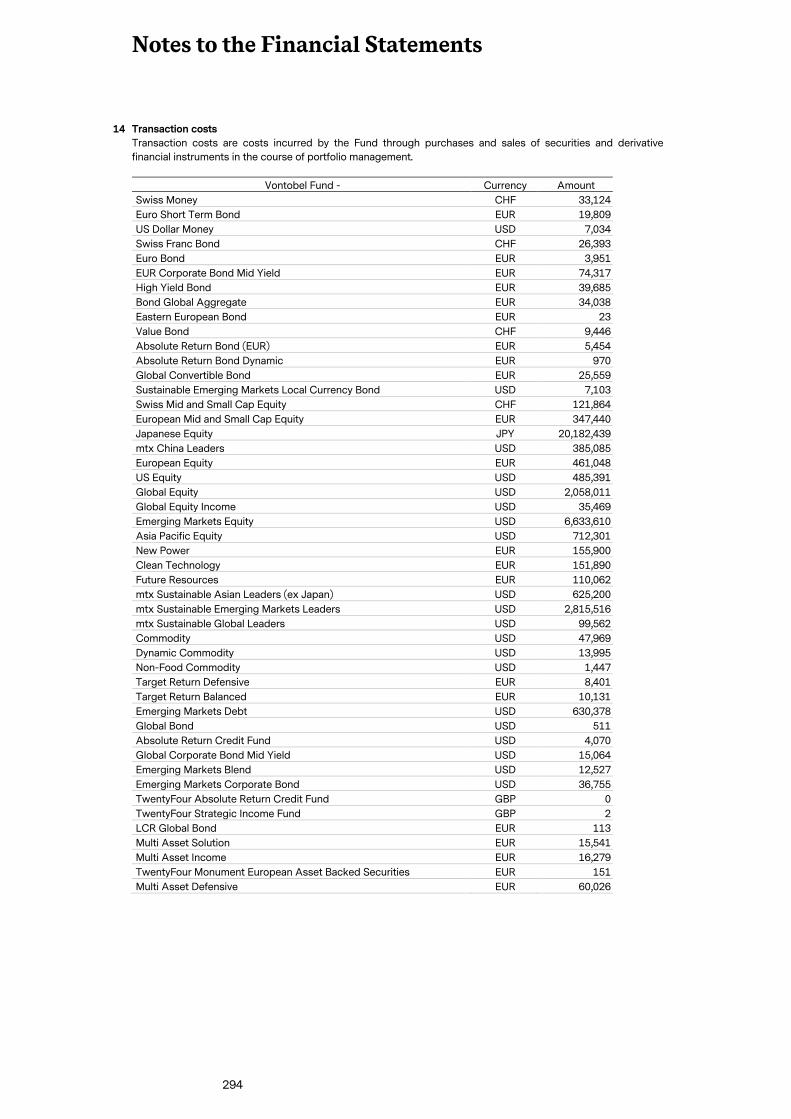
Notes to the Financial Statements
294
14 Transaction costs
Transaction costs are costs incurred by the Fund through purchases and sales of securities and derivative
financial instruments in the course of portfolio management.
Vontobel Fund - Currency Amount
Swiss Money CHF 33,124
Euro Short Term Bond EUR 19,809
US Dollar Money USD 7,034
Swiss Franc Bond CHF 26,393
Euro Bond EUR 3,951
EUR Corporate Bond Mid Yield EUR 74,317
High Yield Bond EUR 39,685
Bond Global Aggregate EUR 34,038
Eastern European Bond EUR 23
Value Bond CHF 9,446
Absolute Return Bond (EUR) EUR 5,454
Absolute Return Bond Dynamic EUR 970
Global Convertible Bond EUR 25,559
Sustainable Emerging Markets Local Currency Bond USD 7,103
Swiss Mid and Small Cap Equity CHF 121,864
European Mid and Small Cap Equity EUR 347,440
Japanese Equity JPY 20,182,439
mtx China Leaders USD 385,085
European Equity EUR 461,048
US Equity USD 485,391
Global Equity USD 2,058,011
Global Equity Income USD 35,469
Emerging Markets Equity USD 6,633,610
Asia Pacific Equity USD 712,301
New Power EUR 155,900
Clean Technology EUR 151,890
Future Resources EUR 110,062
mtx Sustainable Asian Leaders (ex Japan) USD 625,200
mtx Sustainable Emerging Markets Leaders USD 2,815,516
mtx Sustainable Global Leaders USD 99,562
Commodity USD 47,969
Dynamic Commodity USD 13,995
Non-Food Commodity USD 1,447
Target Return Defensive EUR 8,401
Target Return Balanced EUR 10,131
Emerging Markets Debt USD 630,378
Global Bond USD 511
Absolute Return Credit Fund USD 4,070
Global Corporate Bond Mid Yield USD 15,064
Emerging Markets Blend USD 12,527
Emerging Markets Corporate Bond USD 36,755
TwentyFour Absolute Return Credit Fund GBP 0
TwentyFour Strategic Income Fund GBP 2
LCR Global Bond EUR 113
Multi Asset Solution EUR 15,541
Multi Asset Income EUR 16,279
TwentyFour Monument European Asset Backed Securities EUR 151
Multi Asset Defensive EUR 60,026
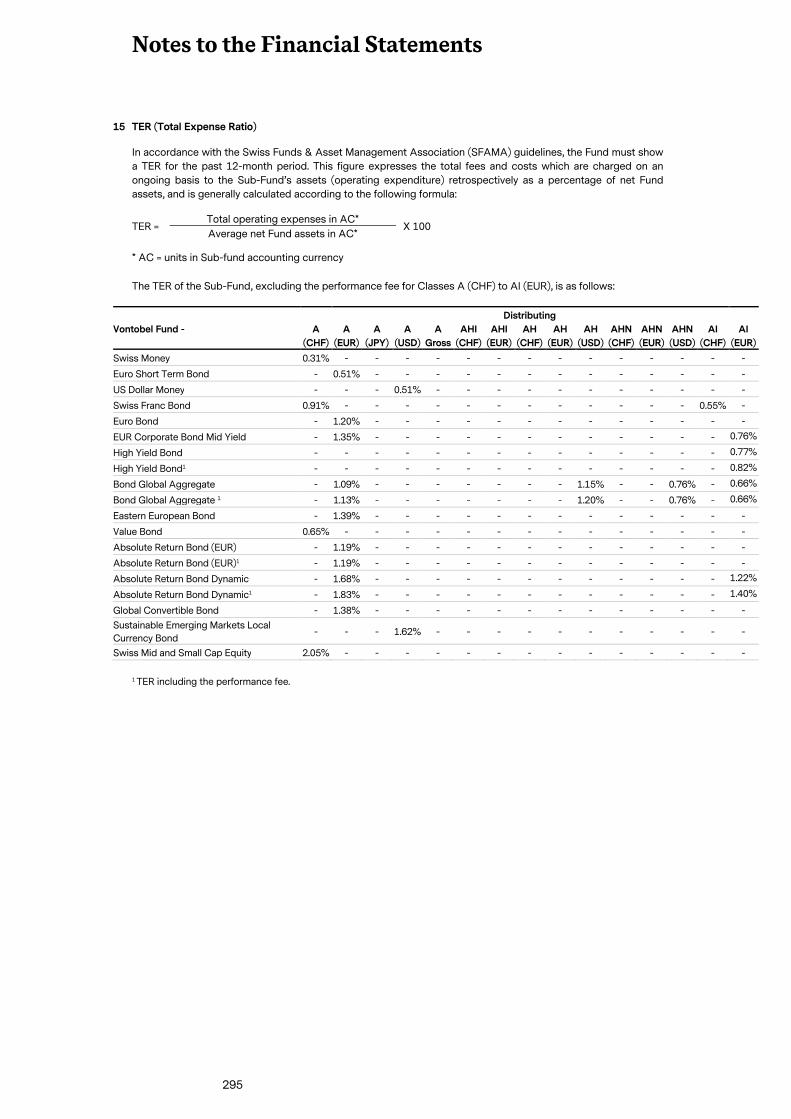
Notes to the Financial Statements
295
15 TER (Total Expense Ratio)
In accordance with the Swiss Funds & Asset Management Association (SFAMA) guidelines, the Fund must show
a TER for the past 12-month period. This figure expresses the total fees and costs which are charged on an
ongoing basis to the Sub-Fund’s assets (operating expenditure) retrospectively as a percentage of net Fund
assets, and is generally calculated according to the following formula:
TER = Total operating expenses in AC*
X 100 Average net Fund assets in AC*
* AC = units in Sub-fund accounting currency
The TER of the Sub-Fund, excluding the performance fee for Classes A (CHF) to AI (EUR), is as follows:
Vontobel Fund -
Distributing
A
(CHF)
A
(EUR)
A
(JPY)
A
(USD)
A
Gross
AHI
(CHF)
AHI
(EUR)
AH
(CHF)
AH
(EUR)
AH
(USD)
AHN
(CHF)
AHN
(EUR)
AHN
(USD)
AI
(CHF)
AI
(EUR)
Swiss Money 0.31% - - - - - - - - - - - - - -
Euro Short Term Bond - 0.51% - - - - - - - - - - - - -
US Dollar Money - - - 0.51% - - - - - - - - - - -
Swiss Franc Bond 0.91% - - - - - - - - - - - - 0.55% -
Euro Bond - 1.20% - - - - - - - - - - - - -
EUR Corporate Bond Mid Yield - 1.35% - - - - - - - - - - - - 0.76%
High Yield Bond - - - - - - - - - - - - - - 0.77%
High Yield Bond1 - - - - - - - - - - - - - - 0.82%
Bond Global Aggregate - 1.09% - - - - - - - 1.15% - - 0.76% - 0.66%
Bond Global Aggregate 1 - 1.13% - - - - - - - 1.20% - - 0.76% - 0.66%
Eastern European Bond - 1.39% - - - - - - - - - - - - -
Value Bond 0.65% - - - - - - - - - - - - - -
Absolute Return Bond (EUR) - 1.19% - - - - - - - - - - - - -
Absolute Return Bond (EUR)1 - 1.19% - - - - - - - - - - - - -
Absolute Return Bond Dynamic - 1.68% - - - - - - - - - - - - 1.22%
Absolute Return Bond Dynamic1 - 1.83% - - - - - - - - - - - - 1.40%
Global Convertible Bond - 1.38% - - - - - - - - - - - - -
Sustainable Emerging Markets Local
Currency Bond - - - 1.62% - - - - - - - - - - -
Swiss Mid and Small Cap Equity 2.05% - - - - - - - - - - - - - -
1 TER including the performance fee.
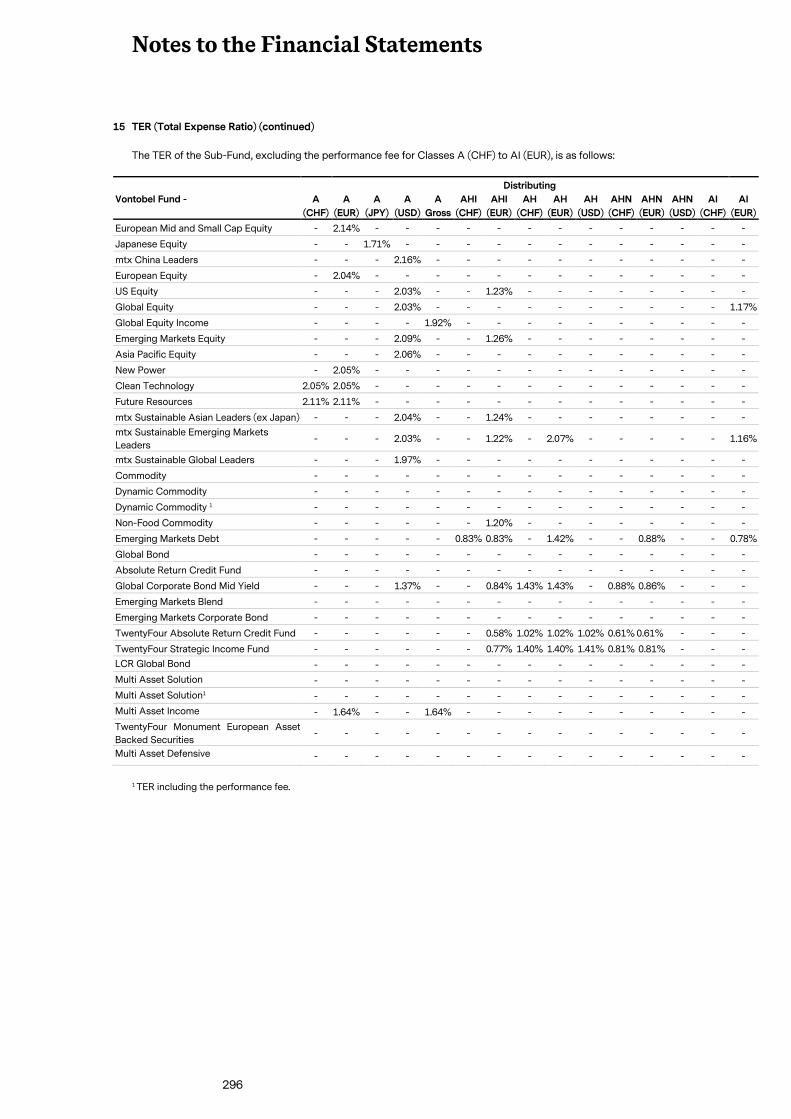
Notes to the Financial Statements
296
15 TER (Total Expense Ratio) (continued)
The TER of the Sub-Fund, excluding the performance fee for Classes A (CHF) to AI (EUR), is as follows:
Vontobel Fund -
Distributing
A
(CHF)
A
(EUR)
A
(JPY)
A
(USD)
A
Gross
AHI
(CHF)
AHI
(EUR)
AH
(CHF)
AH
(EUR)
AH
(USD)
AHN
(CHF)
AHN
(EUR)
AHN
(USD)
AI
(CHF)
AI
(EUR)
European Mid and Small Cap Equity - 2.14% - - - - - - - - - - - - -
Japanese Equity - - 1.71% - - - - - - - - - - - -
mtx China Leaders - - - 2.16% - - - - - - - - - - -
European Equity - 2.04% - - - - - - - - - - - - -
US Equity - - - 2.03% - - 1.23% - - - - - - - -
Global Equity - - - 2.03% - - - - - - - - - - 1.17%
Global Equity Income - - - - 1.92% - - - - - - - - - -
Emerging Markets Equity - - - 2.09% - - 1.26% - - - - - - - -
Asia Pacific Equity - - - 2.06% - - - - - - - - - - -
New Power - 2.05% - - - - - - - - - - - - -
Clean Technology 2.05% 2.05% - - - - - - - - - - - - -
Future Resources 2.11% 2.11% - - - - - - - - - - - - -
mtx Sustainable Asian Leaders (ex Japan) - - - 2.04% - - 1.24% - - - - - - - -
mtx Sustainable Emerging Markets
Leaders - - - 2.03% - - 1.22% - 2.07% - - - - - 1.16%
mtx Sustainable Global Leaders - - - 1.97% - - - - - - - - - - -
Commodity - - - - - - - - - - - - - - -
Dynamic Commodity - - - - - - - - - - - - - - -
Dynamic Commodity 1 - - - - - - - - - - - - - - -
Non-Food Commodity - - - - - - 1.20% - - - - - - - -
Emerging Markets Debt - - - - - 0.83% 0.83% - 1.42% - - 0.88% - - 0.78%
Global Bond - - - - - - - - - - - - - - -
Absolute Return Credit Fund - - - - - - - - - - - - - - -
Global Corporate Bond Mid Yield - - - 1.37% - - 0.84% 1.43% 1.43% - 0.88% 0.86% - - -
Emerging Markets Blend - - - - - - - - - - - - - - -
Emerging Markets Corporate Bond - - - - - - - - - - - - - - -
TwentyFour Absolute Return Credit Fund - - - - - - 0.58% 1.02% 1.02% 1.02% 0.61% 0.61% - - -
TwentyFour Strategic Income Fund - - - - - - 0.77% 1.40% 1.40% 1.41% 0.81% 0.81% - - -
LCR Global Bond - - - - - - - - - - - - - - -
Multi Asset Solution - - - - - - - - - - - - - - -
Multi Asset Solution1 - - - - - - - - - - - - - - -
Multi Asset Income - 1.64% - - 1.64% - - - - - - - - - -
TwentyFour Monument European Asset
Backed Securities - - - - - - - - - - - - - - -
Multi Asset Defensive - - - - - - - - - - - - - - -
1 TER including the performance fee.
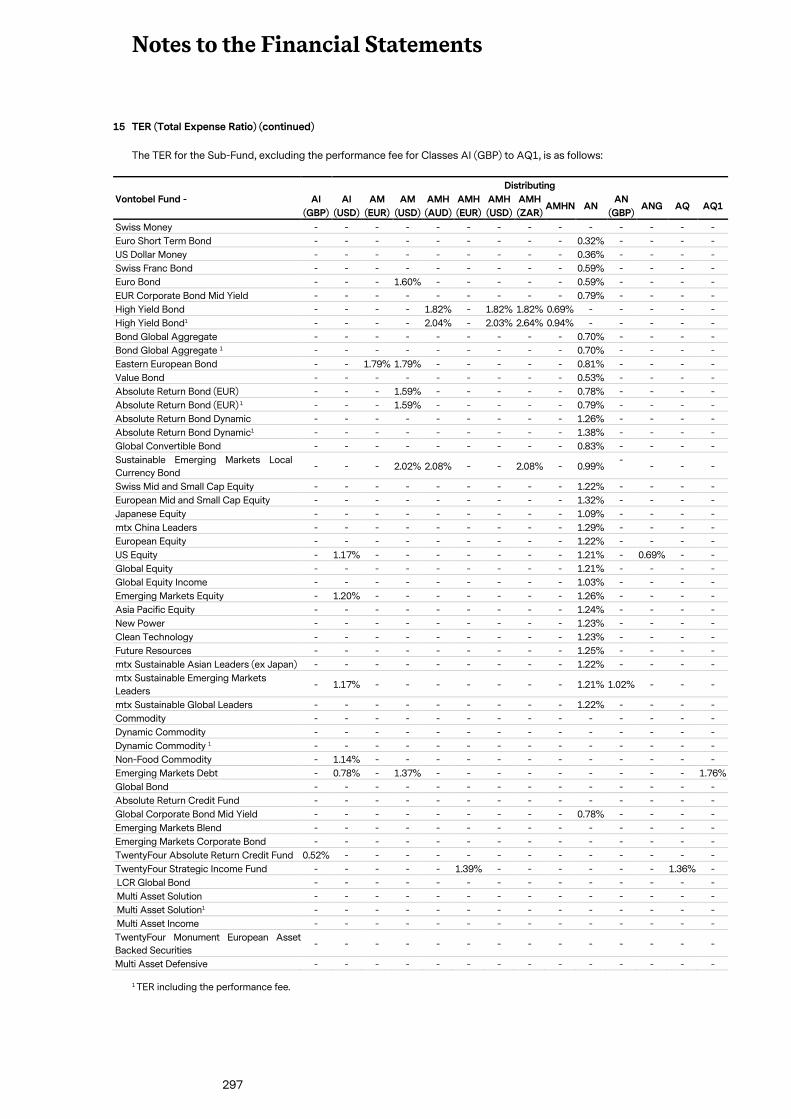
Notes to the Financial Statements
297
15 TER (Total Expense Ratio) (continued)
The TER for the Sub-Fund, excluding the performance fee for Classes AI (GBP) to AQ1, is as follows:
Vontobel Fund -
Distributing
AI
(GBP)
AI
(USD)
AM
(EUR)
AM
(USD)
AMH
(AUD)
AMH
(EUR)
AMH
(USD)
AMH
(ZAR) AMHN AN
AN
(GBP) ANG AQ AQ1
Swiss Money - - - - - - - - - - - - - -
Euro Short Term Bond - - - - - - - - - 0.32% - - - -
US Dollar Money - - - - - - - - - 0.36% - - - -
Swiss Franc Bond - - - - - - - - - 0.59% - - - -
Euro Bond - - - 1.60% - - - - - 0.59% - - - -
EUR Corporate Bond Mid Yield - - - - - - - - - 0.79% - - - -
High Yield Bond - - - - 1.82% - 1.82% 1.82% 0.69% - - - - -
High Yield Bond1 - - - - 2.04% - 2.03% 2.64% 0.94% - - - - -
Bond Global Aggregate - - - - - - - - - 0.70% - - - -
Bond Global Aggregate 1 - - - - - - - - - 0.70% - - - -
Eastern European Bond - - 1.79% 1.79% - - - - - 0.81% - - - -
Value Bond - - - - - - - - - 0.53% - - - -
Absolute Return Bond (EUR) - - - 1.59% - - - - - 0.78% - - - -
Absolute Return Bond (EUR) 1 - - - 1.59% - - - - - 0.79% - - - -
Absolute Return Bond Dynamic - - - - - - - - - 1.26% - - - -
Absolute Return Bond Dynamic1 - - - - - - - - - 1.38% - - - -
Global Convertible Bond - - - - - - - - - 0.83% - - - -
Sustainable Emerging Markets Local
Currency Bond - - - 2.02% 2.08% - - 2.08% - 0.99%
- - - -
Swiss Mid and Small Cap Equity - - - - - - - - - 1.22% - - - -
European Mid and Small Cap Equity - - - - - - - - - 1.32% - - - -
Japanese Equity - - - - - - - - - 1.09% - - - -
mtx China Leaders - - - - - - - - - 1.29% - - - -
European Equity - - - - - - - - - 1.22% - - - -
US Equity - 1.17% - - - - - - - 1.21% - 0.69% - -
Global Equity - - - - - - - - - 1.21% - - - -
Global Equity Income - - - - - - - - - 1.03% - - - -
Emerging Markets Equity - 1.20% - - - - - - - 1.26% - - - -
Asia Pacific Equity - - - - - - - - - 1.24% - - - -
New Power - - - - - - - - - 1.23% - - - -
Clean Technology - - - - - - - - - 1.23% - - - -
Future Resources - - - - - - - - - 1.25% - - - -
mtx Sustainable Asian Leaders (ex Japan) - - - - - - - - - 1.22% - - - -
mtx Sustainable Emerging Markets
Leaders - 1.17% - - - - - - - 1.21% 1.02% - - -
mtx Sustainable Global Leaders - - - - - - - - - 1.22% - - - -
Commodity - - - - - - - - - - - - - -
Dynamic Commodity - - - - - - - - - - - - - -
Dynamic Commodity 1 - - - - - - - - - - - - - -
Non-Food Commodity - 1.14% - - - - - - - - - - - -
Emerging Markets Debt - 0.78% - 1.37% - - - - - - - - - 1.76%
Global Bond - - - - - - - - - - - - - -
Absolute Return Credit Fund - - - - - - - - - - - - - -
Global Corporate Bond Mid Yield - - - - - - - - - 0.78% - - - -
Emerging Markets Blend - - - - - - - - - - - - - -
Emerging Markets Corporate Bond - - - - - - - - - - - - - -
TwentyFour Absolute Return Credit Fund 0.52% - - - - - - - - - - - - -
TwentyFour Strategic Income Fund - - - - - 1.39% - - - - - - 1.36% -
LCR Global Bond - - - - - - - - - - - - - -
Multi Asset Solution - - - - - - - - - - - - - -
Multi Asset Solution1 - - - - - - - - - - - - - -
Multi Asset Income - - - - - - - - - - - - - -
TwentyFour Monument European Asset
Backed Securities - - - - - - - - - - - - - -
Multi Asset Defensive - - - - - - - - - - - - - -
1 TER including the performance fee.
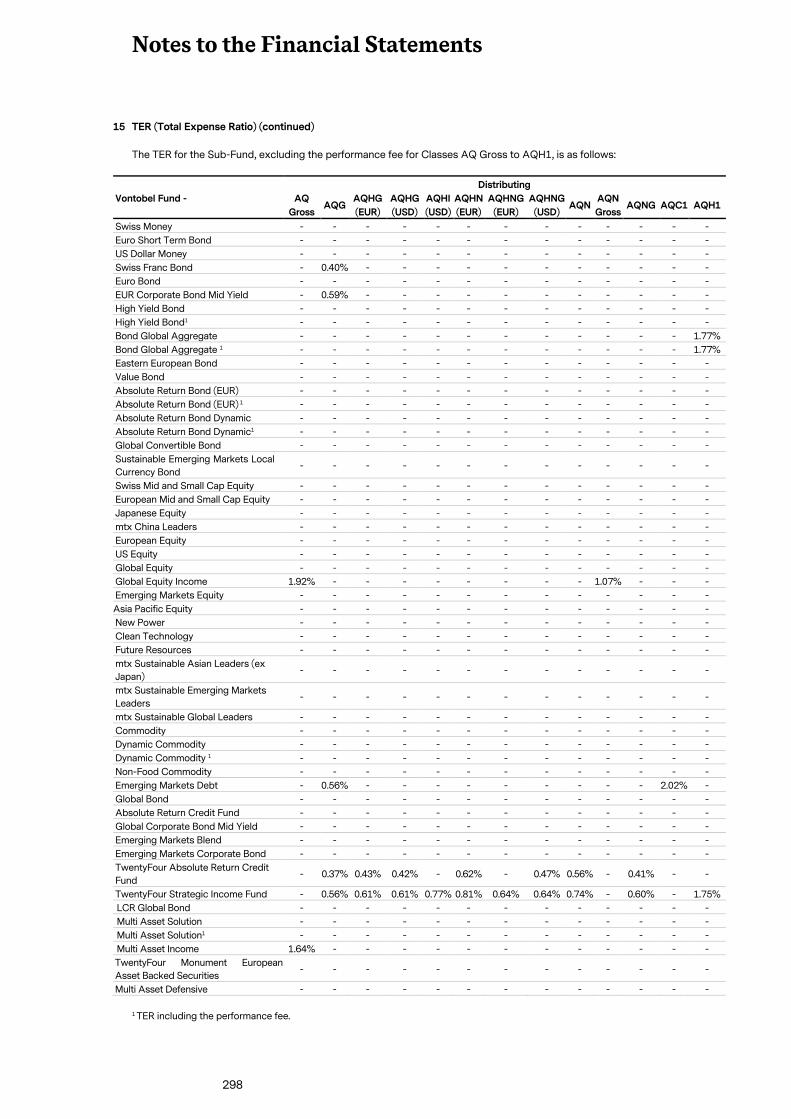
Notes to the Financial Statements
298
15 TER (Total Expense Ratio) (continued)
The TER for the Sub-Fund, excluding the performance fee for Classes AQ Gross to AQH1, is as follows:
Vontobel Fund -
Distributing
AQ
Gross AQG
AQHG
(EUR)
AQHG
(USD)
AQHI
(USD)
AQHN
(EUR)
AQHNG
(EUR)
AQHNG
(USD) AQN
AQN
Gross AQNG AQC1 AQH1
Swiss Money - - - - - - - - - - - - -
Euro Short Term Bond - - - - - - - - - - - - -
US Dollar Money - - - - - - - - - - - - -
Swiss Franc Bond - 0.40% - - - - - - - - - - -
Euro Bond - - - - - - - - - - - - -
EUR Corporate Bond Mid Yield - 0.59% - - - - - - - - - - -
High Yield Bond - - - - - - - - - - - - -
High Yield Bond1 - - - - - - - - - - - - -
Bond Global Aggregate - - - - - - - - - - - - 1.77%
Bond Global Aggregate 1 - - - - - - - - - - - - 1.77%
Eastern European Bond - - - - - - - - - - - - -
Value Bond - - - - - - - - - - - - -
Absolute Return Bond (EUR) - - - - - - - - - - - - -
Absolute Return Bond (EUR) 1 - - - - - - - - - - - - -
Absolute Return Bond Dynamic - - - - - - - - - - - - -
Absolute Return Bond Dynamic1 - - - - - - - - - - - - -
Global Convertible Bond - - - - - - - - - - - - -
Sustainable Emerging Markets Local
Currency Bond - - - - - - - - - - - - -
Swiss Mid and Small Cap Equity - - - - - - - - - - - - -
European Mid and Small Cap Equity - - - - - - - - - - - - -
Japanese Equity - - - - - - - - - - - - -
mtx China Leaders - - - - - - - - - - - - -
European Equity - - - - - - - - - - - - -
US Equity - - - - - - - - - - - - -
Global Equity - - - - - - - - - - - - -
Global Equity Income 1.92% - - - - - - - - 1.07% - - -
Emerging Markets Equity - - - - - - - - - - - - -
Asia Pacific Equity - - - - - - - - - - - - -
New Power - - - - - - - - - - - - -
Clean Technology - - - - - - - - - - - - -
Future Resources - - - - - - - - - - - - -
mtx Sustainable Asian Leaders (ex
Japan) - - - - - - - - - - - - -
mtx Sustainable Emerging Markets
Leaders - - - - - - - - - - - - -
mtx Sustainable Global Leaders - - - - - - - - - - - - -
Commodity - - - - - - - - - - - - -
Dynamic Commodity - - - - - - - - - - - - -
Dynamic Commodity 1 - - - - - - - - - - - - -
Non-Food Commodity - - - - - - - - - - - - -
Emerging Markets Debt - 0.56% - - - - - - - - - 2.02% -
Global Bond - - - - - - - - - - - - -
Absolute Return Credit Fund - - - - - - - - - - - - -
Global Corporate Bond Mid Yield - - - - - - - - - - - - -
Emerging Markets Blend - - - - - - - - - - - - -
Emerging Markets Corporate Bond - - - - - - - - - - - - -
TwentyFour Absolute Return Credit
Fund - 0.37% 0.43% 0.42% - 0.62% - 0.47% 0.56% - 0.41% - -
TwentyFour Strategic Income Fund - 0.56% 0.61% 0.61% 0.77% 0.81% 0.64% 0.64% 0.74% - 0.60% - 1.75%
LCR Global Bond - - - - - - - - - - - - -
Multi Asset Solution - - - - - - - - - - - - -
Multi Asset Solution1 - - - - - - - - - - - - -
Multi Asset Income 1.64% - - - - - - - - - - - -
TwentyFour Monument European
Asset Backed Securities - - - - - - - - - - - - -
Multi Asset Defensive - - - - - - - - - - - - -
1 TER including the performance fee.
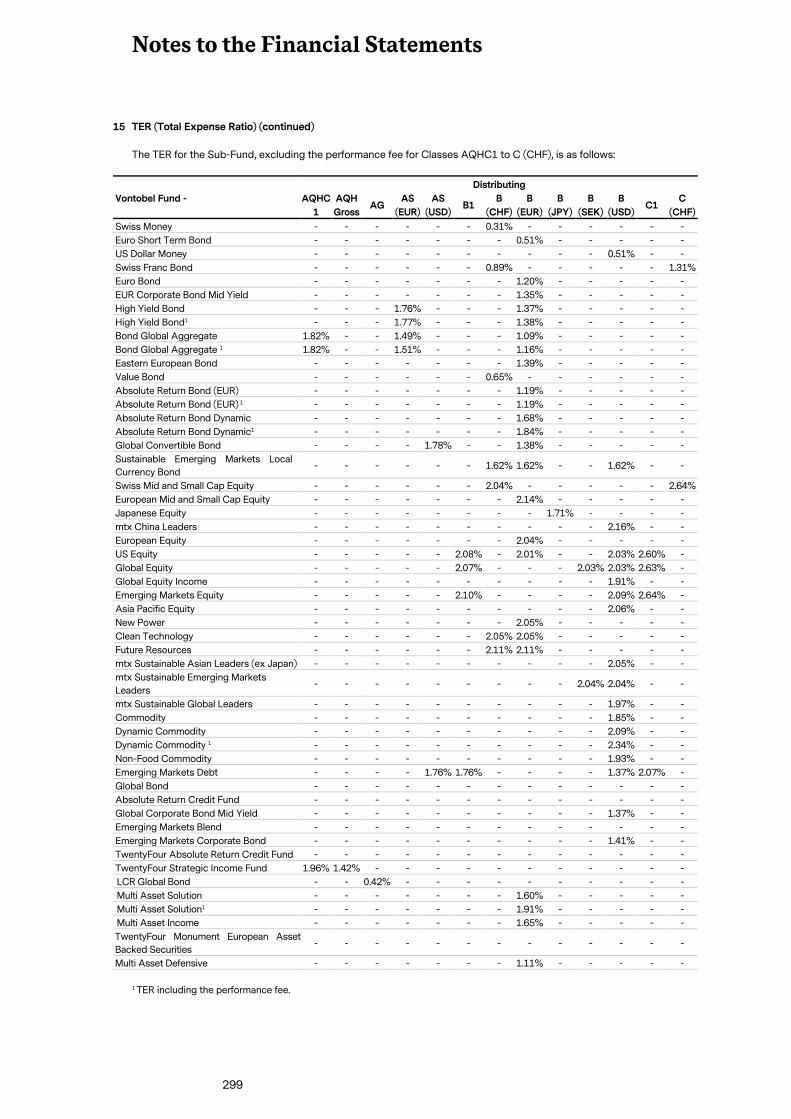
Notes to the Financial Statements
299
15 TER (Total Expense Ratio) (continued)
The TER for the Sub-Fund, excluding the performance fee for Classes AQHC1 to C (CHF), is as follows:
Vontobel Fund -
Distributing
AQHC
1
AQH
Gross AG
AS
(EUR)
AS
(USD) B1
B
(CHF)
B
(EUR)
B
(JPY)
B
(SEK)
B
(USD) C1
C
(CHF)
Swiss Money - - - - - - 0.31% - - - - - - Euro Short Term Bond - - - - - - - 0.51% - - - - - US Dollar Money - - - - - - - - - - 0.51% - - Swiss Franc Bond - - - - - - 0.89% - - - - - 1.31%
Euro Bond - - - - - - - 1.20% - - - - - EUR Corporate Bond Mid Yield - - - - - - - 1.35% - - - - - High Yield Bond - - - 1.76% - - - 1.37% - - - - - High Yield Bond1 - - - 1.77% - - - 1.38% - - - - - Bond Global Aggregate 1.82% - - 1.49% - - - 1.09% - - - - - Bond Global Aggregate 1 1.82% - - 1.51% - - - 1.16% - - - - - Eastern European Bond - - - - - - - 1.39% - - - - - Value Bond - - - - - - 0.65% - - - - - - Absolute Return Bond (EUR) - - - - - - - 1.19% - - - - - Absolute Return Bond (EUR) 1 - - - - - - - 1.19% - - - - - Absolute Return Bond Dynamic - - - - - - - 1.68% - - - - - Absolute Return Bond Dynamic1 - - - - - - - 1.84% - - - - - Global Convertible Bond - - - - 1.78% - - 1.38% - - - - - Sustainable Emerging Markets Local
Currency Bond - - - - - - 1.62% 1.62% - - 1.62% - -
Swiss Mid and Small Cap Equity - - - - - - 2.04% - - - - - 2.64% European Mid and Small Cap Equity - - - - - - - 2.14% - - - - - Japanese Equity - - - - - - - - 1.71% - - - - mtx China Leaders - - - - - - - - - - 2.16% - - European Equity - - - - - - - 2.04% - - - - - US Equity - - - - - 2.08% - 2.01% - - 2.03% 2.60% - Global Equity - - - - - 2.07% - - - 2.03% 2.03% 2.63% - Global Equity Income - - - - - - - - - - 1.91% - - Emerging Markets Equity - - - - - 2.10% - - - - 2.09% 2.64% - Asia Pacific Equity - - - - - - - - - - 2.06% - - New Power - - - - - - - 2.05% - - - - - Clean Technology - - - - - - 2.05% 2.05% - - - - - Future Resources - - - - - - 2.11% 2.11% - - - - - mtx Sustainable Asian Leaders (ex Japan) - - - - - - - - - - 2.05% - - mtx Sustainable Emerging Markets
Leaders - - - - - - - - - 2.04% 2.04% - -
mtx Sustainable Global Leaders - - - - - - - - - - 1.97% - - Commodity - - - - - - - - - - 1.85% - - Dynamic Commodity - - - - - - - - - - 2.09% - - Dynamic Commodity 1 - - - - - - - - - - 2.34% - - Non-Food Commodity - - - - - - - - - - 1.93% - - Emerging Markets Debt - - - - 1.76% 1.76% - - - - 1.37% 2.07% - Global Bond - - - - - - - - - - - - -
Absolute Return Credit Fund - - - - - - - - - - - - -
Global Corporate Bond Mid Yield - - - - - - - - - - 1.37% - -
Emerging Markets Blend - - - - - - - - - - - - -
Emerging Markets Corporate Bond - - - - - - - - - - 1.41% - -
TwentyFour Absolute Return Credit Fund - - - - - - - - - - - - -
TwentyFour Strategic Income Fund 1.96% 1.42% - - - - - - - - - - -
LCR Global Bond - - 0.42% - - - - - - - - - - Multi Asset Solution - - - - - - - 1.60% - - - - - Multi Asset Solution1 - - - - - - - 1.91% - - - - - Multi Asset Income - - - - - - - 1.65% - - - - - TwentyFour Monument European Asset
Backed Securities - - - - - - - - - - - - -
Multi Asset Defensive - - - - - - - 1.11% - - - - -
1 TER including the performance fee.
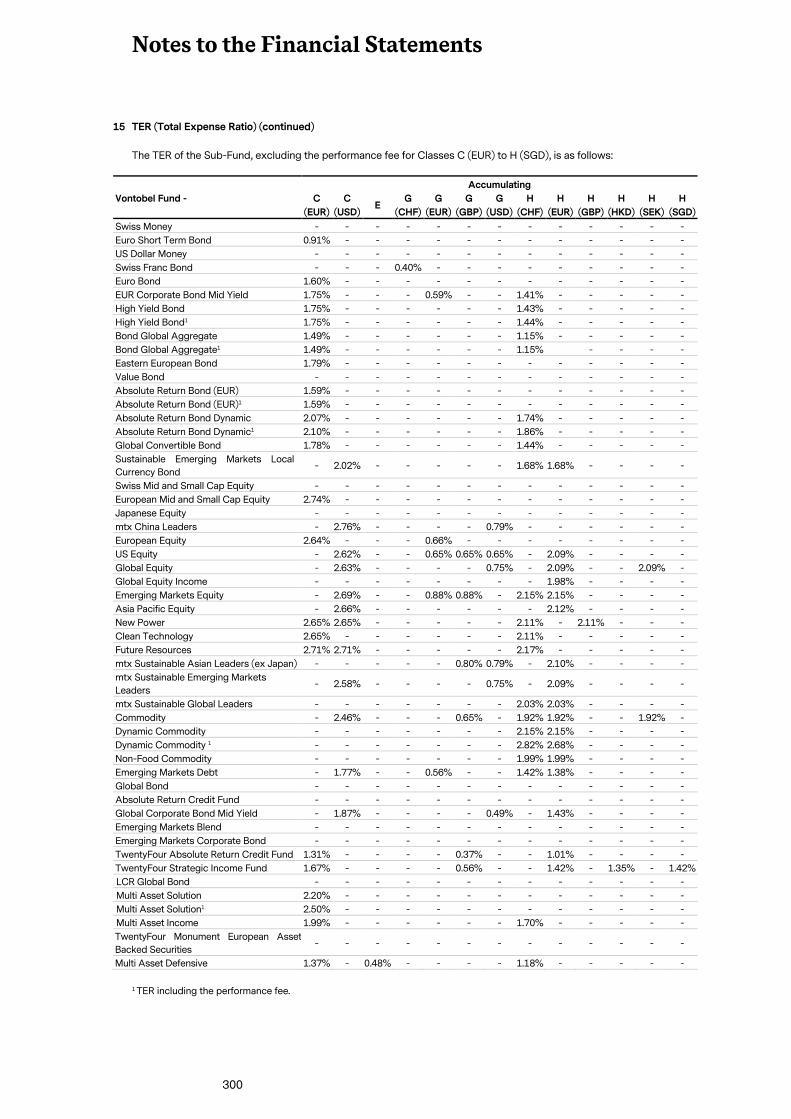
Notes to the Financial Statements
300
15 TER (Total Expense Ratio) (continued)
The TER of the Sub-Fund, excluding the performance fee for Classes C (EUR) to H (SGD), is as follows:
Vontobel Fund -
Accumulating
C
(EUR)
C
(USD) E
G
(CHF)
G
(EUR)
G
(GBP)
G
(USD)
H
(CHF)
H
(EUR)
H
(GBP)
H
(HKD)
H
(SEK)
H
(SGD)
Swiss Money - - - - - - - - - - - - -
Euro Short Term Bond 0.91% - - - - - - - - - - - -
US Dollar Money - - - - - - - - - - - - -
Swiss Franc Bond - - - 0.40% - - - - - - - - -
Euro Bond 1.60% - - - - - - - - - - - -
EUR Corporate Bond Mid Yield 1.75% - - - 0.59% - - 1.41% - - - - -
High Yield Bond 1.75% - - - - - - 1.43% - - - - -
High Yield Bond1 1.75% - - - - - - 1.44% - - - - -
Bond Global Aggregate 1.49% - - - - - - 1.15% - - - - -
Bond Global Aggregate1 1.49% - - - - - - 1.15% - - - -
Eastern European Bond 1.79% - - - - - - - - - - - -
Value Bond - - - - - - - - - - - - -
Absolute Return Bond (EUR) 1.59% - - - - - - - - - - - -
Absolute Return Bond (EUR)1 1.59% - - - - - - - - - - - -
Absolute Return Bond Dynamic 2.07% - - - - - - 1.74% - - - - -
Absolute Return Bond Dynamic1 2.10% - - - - - - 1.86% - - - - -
Global Convertible Bond 1.78% - - - - - - 1.44% - - - - -
Sustainable Emerging Markets Local
Currency Bond - 2.02% - - - - - 1.68% 1.68% - - - -
Swiss Mid and Small Cap Equity - - - - - - - - - - - - -
European Mid and Small Cap Equity 2.74% - - - - - - - - - - - -
Japanese Equity - - - - - - - - - - - - -
mtx China Leaders - 2.76% - - - - 0.79% - - - - - -
European Equity 2.64% - - - 0.66% - - - - - - - -
US Equity - 2.62% - - 0.65% 0.65% 0.65% - 2.09% - - - -
Global Equity - 2.63% - - - - 0.75% - 2.09% - - 2.09% -
Global Equity Income - - - - - - - - 1.98% - - - -
Emerging Markets Equity - 2.69% - - 0.88% 0.88% - 2.15% 2.15% - - - -
Asia Pacific Equity - 2.66% - - - - - - 2.12% - - - -
New Power 2.65% 2.65% - - - - - 2.11% - 2.11% - - -
Clean Technology 2.65% - - - - - - 2.11% - - - - -
Future Resources 2.71% 2.71% - - - - - 2.17% - - - - -
mtx Sustainable Asian Leaders (ex Japan) - - - - - 0.80% 0.79% - 2.10% - - - -
mtx Sustainable Emerging Markets
Leaders - 2.58% - - - - 0.75% - 2.09% - - - -
mtx Sustainable Global Leaders - - - - - - - 2.03% 2.03% - - - -
Commodity - 2.46% - - - 0.65% - 1.92% 1.92% - - 1.92% -
Dynamic Commodity - - - - - - - 2.15% 2.15% - - - -
Dynamic Commodity 1 - - - - - - - 2.82% 2.68% - - - -
Non-Food Commodity - - - - - - - 1.99% 1.99% - - - -
Emerging Markets Debt - 1.77% - - 0.56% - - 1.42% 1.38% - - - -
Global Bond - - - - - - - - - - - - -
Absolute Return Credit Fund - - - - - - - - - - - - -
Global Corporate Bond Mid Yield - 1.87% - - - - 0.49% - 1.43% - - - -
Emerging Markets Blend - - - - - - - - - - - - -
Emerging Markets Corporate Bond - - - - - - - - - - - - -
TwentyFour Absolute Return Credit Fund 1.31% - - - - 0.37% - - 1.01% - - - -
TwentyFour Strategic Income Fund 1.67% - - - - 0.56% - - 1.42% - 1.35% - 1.42%
LCR Global Bond - - - - - - - - - - - - -
Multi Asset Solution 2.20% - - - - - - - - - - - -
Multi Asset Solution1 2.50% - - - - - - - - - - - -
Multi Asset Income 1.99% - - - - - - 1.70% - - - - -
TwentyFour Monument European Asset
Backed Securities - - - - - - - - - - - - -
Multi Asset Defensive 1.37% - 0.48% - - - - 1.18% - - - - -
1 TER including the performance fee.
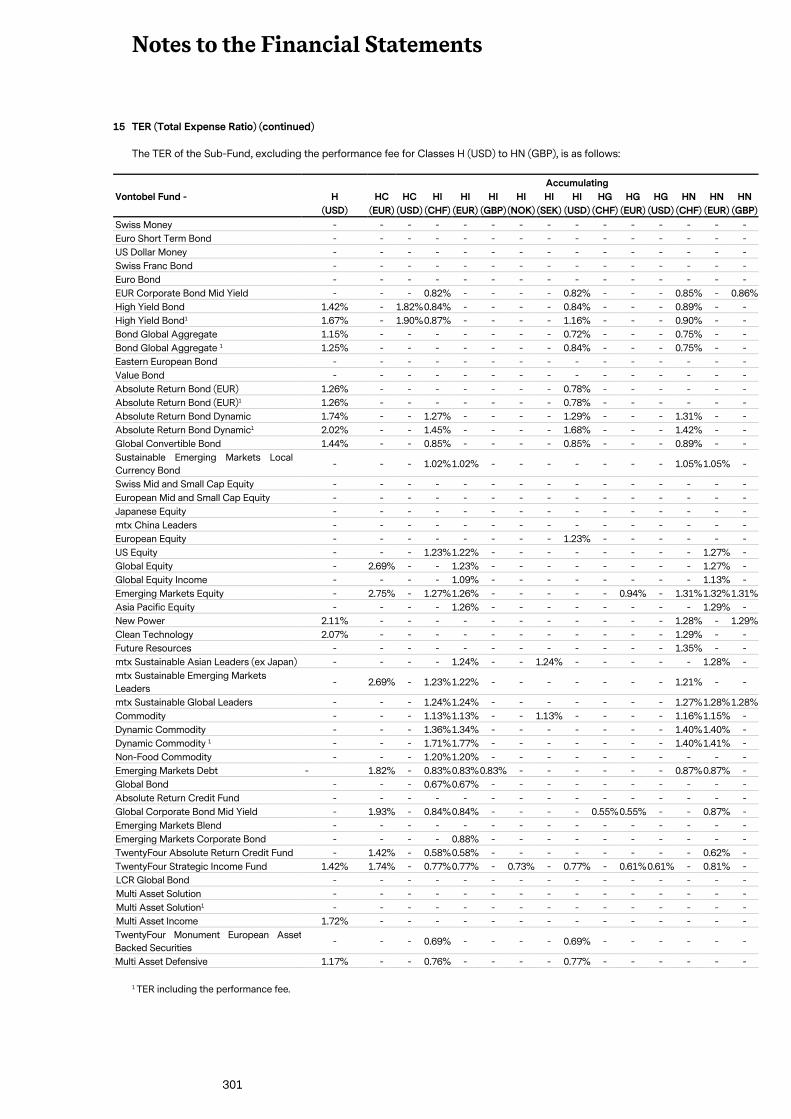
Notes to the Financial Statements
301
15 TER (Total Expense Ratio) (continued)
The TER of the Sub-Fund, excluding the performance fee for Classes H (USD) to HN (GBP), is as follows:
Vontobel Fund -
Accumulating
H
(USD)
HC
(EUR)
HC
(USD)
HI
(CHF)
HI
(EUR)
HI
(GBP)
HI
(NOK)
HI
(SEK)
HI
(USD)
HG
(CHF)
HG
(EUR)
HG
(USD)
HN
(CHF)
HN
(EUR)
HN
(GBP)
Swiss Money - - - - - - - - - - - - - - -
Euro Short Term Bond - - - - - - - - - - - - - - -
US Dollar Money - - - - - - - - - - - - - - -
Swiss Franc Bond - - - - - - - - - - - - - - -
Euro Bond - - - - - - - - - - - - - - -
EUR Corporate Bond Mid Yield - - - 0.82% - - - - 0.82% - - - 0.85% - 0.86%
High Yield Bond 1.42% - 1.82% 0.84% - - - - 0.84% - - - 0.89% - -
High Yield Bond1 1.67% - 1.90% 0.87% - - - - 1.16% - - - 0.90% - -
Bond Global Aggregate 1.15% - - - - - - - 0.72% - - - 0.75% - -
Bond Global Aggregate 1 1.25% - - - - - - - 0.84% - - - 0.75% - -
Eastern European Bond - - - - - - - - - - - - - - -
Value Bond - - - - - - - - - - - - - - -
Absolute Return Bond (EUR) 1.26% - - - - - - - 0.78% - - - - - -
Absolute Return Bond (EUR)1 1.26% - - - - - - - 0.78% - - - - - -
Absolute Return Bond Dynamic 1.74% - - 1.27% - - - - 1.29% - - - 1.31% - -
Absolute Return Bond Dynamic1 2.02% - - 1.45% - - - - 1.68% - - - 1.42% - -
Global Convertible Bond 1.44% - - 0.85% - - - - 0.85% - - - 0.89% - -
Sustainable Emerging Markets Local
Currency Bond - - - 1.02% 1.02% - - - - - - - 1.05% 1.05% -
Swiss Mid and Small Cap Equity - - - - - - - - - - - - - - -
European Mid and Small Cap Equity - - - - - - - - - - - - - - -
Japanese Equity - - - - - - - - - - - - - - -
mtx China Leaders - - - - - - - - - - - - - - -
European Equity - - - - - - - - 1.23% - - - - - -
US Equity - - - 1.23% 1.22% - - - - - - - - 1.27% -
Global Equity - 2.69% - - 1.23% - - - - - - - - 1.27% -
Global Equity Income - - - - 1.09% - - - - - - - - 1.13% -
Emerging Markets Equity - 2.75% - 1.27% 1.26% - - - - - 0.94% - 1.31% 1.32% 1.31%
Asia Pacific Equity - - - - 1.26% - - - - - - - - 1.29% -
New Power 2.11% - - - - - - - - - - - 1.28% - 1.29%
Clean Technology 2.07% - - - - - - - - - - - 1.29% - -
Future Resources - - - - - - - - - - - - 1.35% - -
mtx Sustainable Asian Leaders (ex Japan) - - - - 1.24% - - 1.24% - - - - - 1.28% -
mtx Sustainable Emerging Markets
Leaders - 2.69% - 1.23% 1.22% - - - - - - - 1.21% - -
mtx Sustainable Global Leaders - - - 1.24% 1.24% - - - - - - - 1.27% 1.28% 1.28%
Commodity - - - 1.13% 1.13% - - 1.13% - - - - 1.16% 1.15% -
Dynamic Commodity - - - 1.36% 1.34% - - - - - - - 1.40% 1.40% -
Dynamic Commodity 1 - - - 1.71% 1.77% - - - - - - - 1.40% 1.41% -
Non-Food Commodity - - - 1.20% 1.20% - - - - - - - - - -
Emerging Markets Debt - 1.82% - 0.83% 0.83% 0.83% - - - - - - 0.87% 0.87% -
Global Bond - - - 0.67% 0.67% - - - - - - - - - -
Absolute Return Credit Fund - - - - - - - - - - - - - - -
Global Corporate Bond Mid Yield - 1.93% - 0.84% 0.84% - - - - 0.55% 0.55% - - 0.87% -
Emerging Markets Blend - - - - - - - - - - - - - - -
Emerging Markets Corporate Bond - - - - 0.88% - - - - - - - - - -
TwentyFour Absolute Return Credit Fund - 1.42% - 0.58% 0.58% - - - - - - - - 0.62% -
TwentyFour Strategic Income Fund 1.42% 1.74% - 0.77% 0.77% - 0.73% - 0.77% - 0.61% 0.61% - 0.81% -
LCR Global Bond - - - - - - - - - - - - - - -
Multi Asset Solution - - - - - - - - - - - - - - -
Multi Asset Solution1 - - - - - - - - - - - - - - -
Multi Asset Income 1.72% - - - - - - - - - - - - - -
TwentyFour Monument European Asset
Backed Securities - - - 0.69% - - - - 0.69% - - - - - -
Multi Asset Defensive 1.17% - - 0.76% - - - - 0.77% - - - - - -
1 TER including the performance fee.
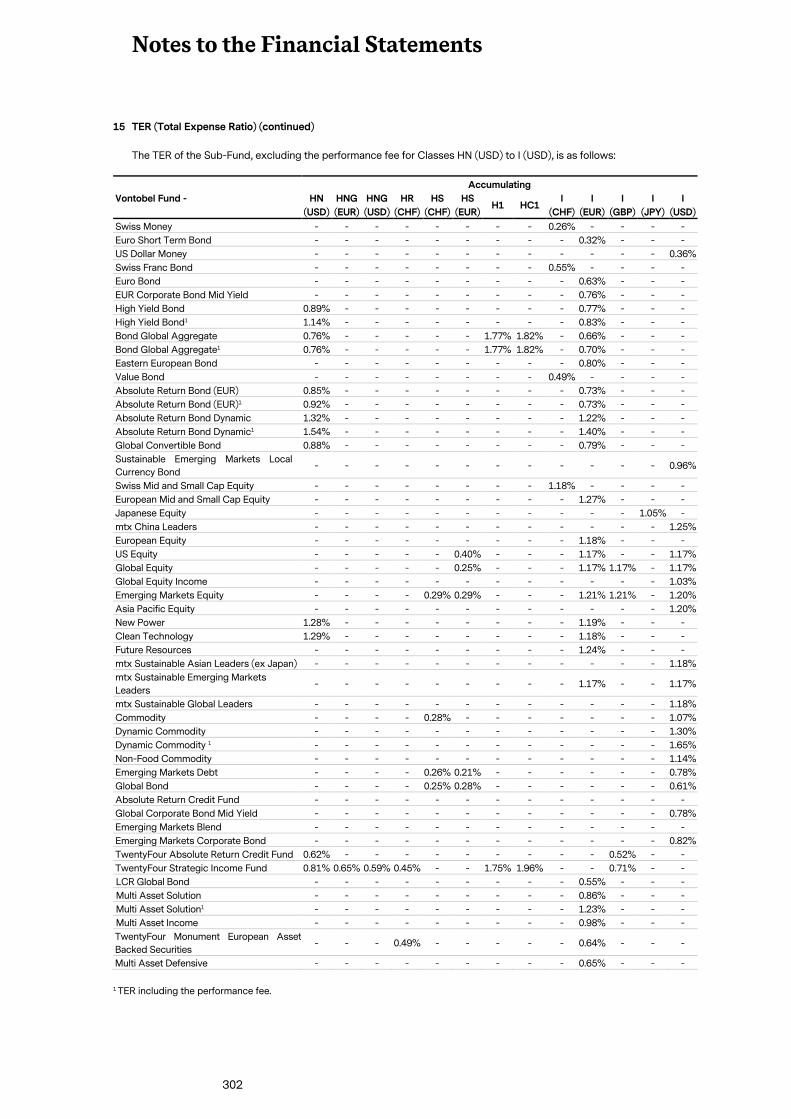
Notes to the Financial Statements
302
15 TER (Total Expense Ratio) (continued)
The TER of the Sub-Fund, excluding the performance fee for Classes HN (USD) to I (USD), is as follows:
Vontobel Fund -
Accumulating
HN
(USD)
HNG
(EUR)
HNG
(USD)
HR
(CHF)
HS
(CHF)
HS
(EUR) H1 HC1
I
(CHF)
I
(EUR)
I
(GBP)
I
(JPY)
I
(USD)
Swiss Money - - - - - - - - 0.26% - - - -
Euro Short Term Bond - - - - - - - - - 0.32% - - -
US Dollar Money - - - - - - - - - - - - 0.36%
Swiss Franc Bond - - - - - - - - 0.55% - - - -
Euro Bond - - - - - - - - - 0.63% - - -
EUR Corporate Bond Mid Yield - - - - - - - - - 0.76% - - -
High Yield Bond 0.89% - - - - - - - - 0.77% - - -
High Yield Bond1 1.14% - - - - - - - - 0.83% - - -
Bond Global Aggregate 0.76% - - - - - 1.77% 1.82% - 0.66% - - -
Bond Global Aggregate1 0.76% - - - - - 1.77% 1.82% - 0.70% - - -
Eastern European Bond - - - - - - - - - 0.80% - - -
Value Bond - - - - - - - - 0.49% - - - -
Absolute Return Bond (EUR) 0.85% - - - - - - - - 0.73% - - -
Absolute Return Bond (EUR)1 0.92% - - - - - - - - 0.73% - - -
Absolute Return Bond Dynamic 1.32% - - - - - - - - 1.22% - - -
Absolute Return Bond Dynamic1 1.54% - - - - - - - - 1.40% - - -
Global Convertible Bond 0.88% - - - - - - - - 0.79% - - -
Sustainable Emerging Markets Local
Currency Bond - - - - - - - - - - - - 0.96%
Swiss Mid and Small Cap Equity - - - - - - - - 1.18% - - - -
European Mid and Small Cap Equity - - - - - - - - - 1.27% - - -
Japanese Equity - - - - - - - - - - - 1.05% -
mtx China Leaders - - - - - - - - - - - - 1.25%
European Equity - - - - - - - - - 1.18% - - -
US Equity - - - - - 0.40% - - - 1.17% - - 1.17%
Global Equity - - - - - 0.25% - - - 1.17% 1.17% - 1.17%
Global Equity Income - - - - - - - - - - - - 1.03%
Emerging Markets Equity - - - - 0.29% 0.29% - - - 1.21% 1.21% - 1.20%
Asia Pacific Equity - - - - - - - - - - - - 1.20%
New Power 1.28% - - - - - - - - 1.19% - - -
Clean Technology 1.29% - - - - - - - - 1.18% - - -
Future Resources - - - - - - - - - 1.24% - - -
mtx Sustainable Asian Leaders (ex Japan) - - - - - - - - - - - - 1.18%
mtx Sustainable Emerging Markets
Leaders - - - - - - - - - 1.17% - - 1.17%
mtx Sustainable Global Leaders - - - - - - - - - - - - 1.18%
Commodity - - - - 0.28% - - - - - - - 1.07%
Dynamic Commodity - - - - - - - - - - - - 1.30%
Dynamic Commodity 1 - - - - - - - - - - - - 1.65%
Non-Food Commodity - - - - - - - - - - - - 1.14%
Emerging Markets Debt - - - - 0.26% 0.21% - - - - - - 0.78%
Global Bond - - - - 0.25% 0.28% - - - - - - 0.61%
Absolute Return Credit Fund - - - - - - - - - - - - -
Global Corporate Bond Mid Yield - - - - - - - - - - - - 0.78%
Emerging Markets Blend - - - - - - - - - - - - -
Emerging Markets Corporate Bond - - - - - - - - - - - - 0.82%
TwentyFour Absolute Return Credit Fund 0.62% - - - - - - - - - 0.52% - -
TwentyFour Strategic Income Fund 0.81% 0.65% 0.59% 0.45% - - 1.75% 1.96% - - 0.71% - -
LCR Global Bond - - - - - - - - - 0.55% - - -
Multi Asset Solution - - - - - - - - - 0.86% - - -
Multi Asset Solution1 - - - - - - - - - 1.23% - - -
Multi Asset Income - - - - - - - - - 0.98% - - -
TwentyFour Monument European Asset
Backed Securities - - - 0.49% - - - - - 0.64% - - -
Multi Asset Defensive - - - - - - - - - 0.65% - - -
1 TER including the performance fee.
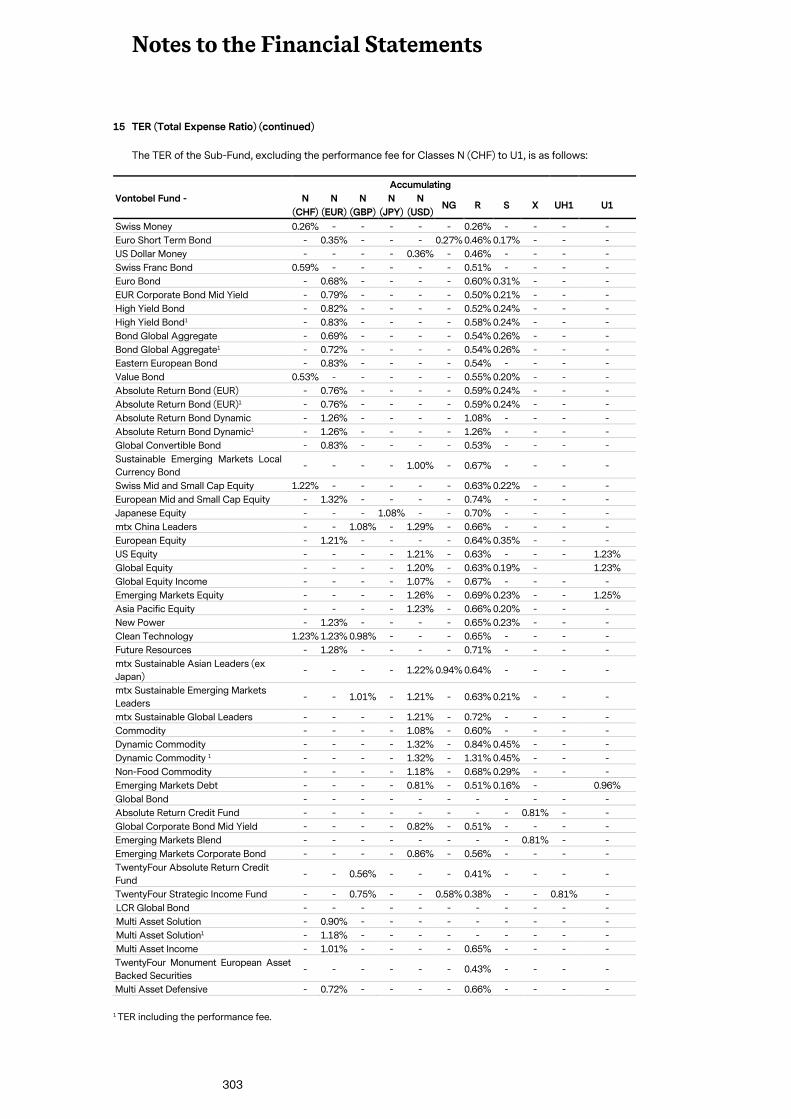
Notes to the Financial Statements
303
15 TER (Total Expense Ratio) (continued)
The TER of the Sub-Fund, excluding the performance fee for Classes N (CHF) to U1, is as follows:
Vontobel Fund -
Accumulating
N
(CHF)
N
(EUR)
N
(GBP)
N
(JPY)
N
(USD) NG R S X UH1 U1
Swiss Money 0.26% - - - - - 0.26% - - - -
Euro Short Term Bond - 0.35% - - - 0.27% 0.46% 0.17% - - -
US Dollar Money - - - - 0.36% - 0.46% - - - -
Swiss Franc Bond 0.59% - - - - - 0.51% - - - -
Euro Bond - 0.68% - - - - 0.60% 0.31% - - -
EUR Corporate Bond Mid Yield - 0.79% - - - - 0.50% 0.21% - - -
High Yield Bond - 0.82% - - - - 0.52% 0.24% - - -
High Yield Bond1 - 0.83% - - - - 0.58% 0.24% - - -
Bond Global Aggregate - 0.69% - - - - 0.54% 0.26% - - -
Bond Global Aggregate1 - 0.72% - - - - 0.54% 0.26% - - -
Eastern European Bond - 0.83% - - - - 0.54% - - - -
Value Bond 0.53% - - - - - 0.55% 0.20% - - -
Absolute Return Bond (EUR) - 0.76% - - - - 0.59% 0.24% - - -
Absolute Return Bond (EUR)1 - 0.76% - - - - 0.59% 0.24% - - -
Absolute Return Bond Dynamic - 1.26% - - - - 1.08% - - - -
Absolute Return Bond Dynamic1 - 1.26% - - - - 1.26% - - - -
Global Convertible Bond - 0.83% - - - - 0.53% - - - -
Sustainable Emerging Markets Local
Currency Bond - - - - 1.00% - 0.67% - - - -
Swiss Mid and Small Cap Equity 1.22% - - - - - 0.63% 0.22% - - -
European Mid and Small Cap Equity - 1.32% - - - - 0.74% - - - -
Japanese Equity - - - 1.08% - - 0.70% - - - -
mtx China Leaders - - 1.08% - 1.29% - 0.66% - - - -
European Equity - 1.21% - - - - 0.64% 0.35% - - -
US Equity - - - - 1.21% - 0.63% - - - 1.23%
Global Equity - - - - 1.20% - 0.63% 0.19% - 1.23%
Global Equity Income - - - - 1.07% - 0.67% - - - -
Emerging Markets Equity - - - - 1.26% - 0.69% 0.23% - - 1.25%
Asia Pacific Equity - - - - 1.23% - 0.66% 0.20% - - -
New Power - 1.23% - - - - 0.65% 0.23% - - -
Clean Technology 1.23% 1.23% 0.98% - - - 0.65% - - - -
Future Resources - 1.28% - - - - 0.71% - - - -
mtx Sustainable Asian Leaders (ex
Japan) - - - - 1.22% 0.94% 0.64% - - - -
mtx Sustainable Emerging Markets
Leaders - - 1.01% - 1.21% - 0.63% 0.21% - - -
mtx Sustainable Global Leaders - - - - 1.21% - 0.72% - - - -
Commodity - - - - 1.08% - 0.60% - - - -
Dynamic Commodity - - - - 1.32% - 0.84% 0.45% - - -
Dynamic Commodity 1 - - - - 1.32% - 1.31% 0.45% - - -
Non-Food Commodity - - - - 1.18% - 0.68% 0.29% - - -
Emerging Markets Debt - - - - 0.81% - 0.51% 0.16% - 0.96%
Global Bond - - - - - - - - - - -
Absolute Return Credit Fund - - - - - - - - 0.81% - -
Global Corporate Bond Mid Yield - - - - 0.82% - 0.51% - - - -
Emerging Markets Blend - - - - - - - - 0.81% - -
Emerging Markets Corporate Bond - - - - 0.86% - 0.56% - - - -
TwentyFour Absolute Return Credit
Fund - - 0.56% - - - 0.41% - - - -
TwentyFour Strategic Income Fund - - 0.75% - - 0.58% 0.38% - - 0.81% -
LCR Global Bond - - - - - - - - - - -
Multi Asset Solution - 0.90% - - - - - - - - -
Multi Asset Solution1 - 1.18% - - - - - - - - -
Multi Asset Income - 1.01% - - - - 0.65% - - - -
TwentyFour Monument European Asset
Backed Securities - - - - - - 0.43% - - - -
Multi Asset Defensive - 0.72% - - - - 0.66% - - - -
1 TER including the performance fee.
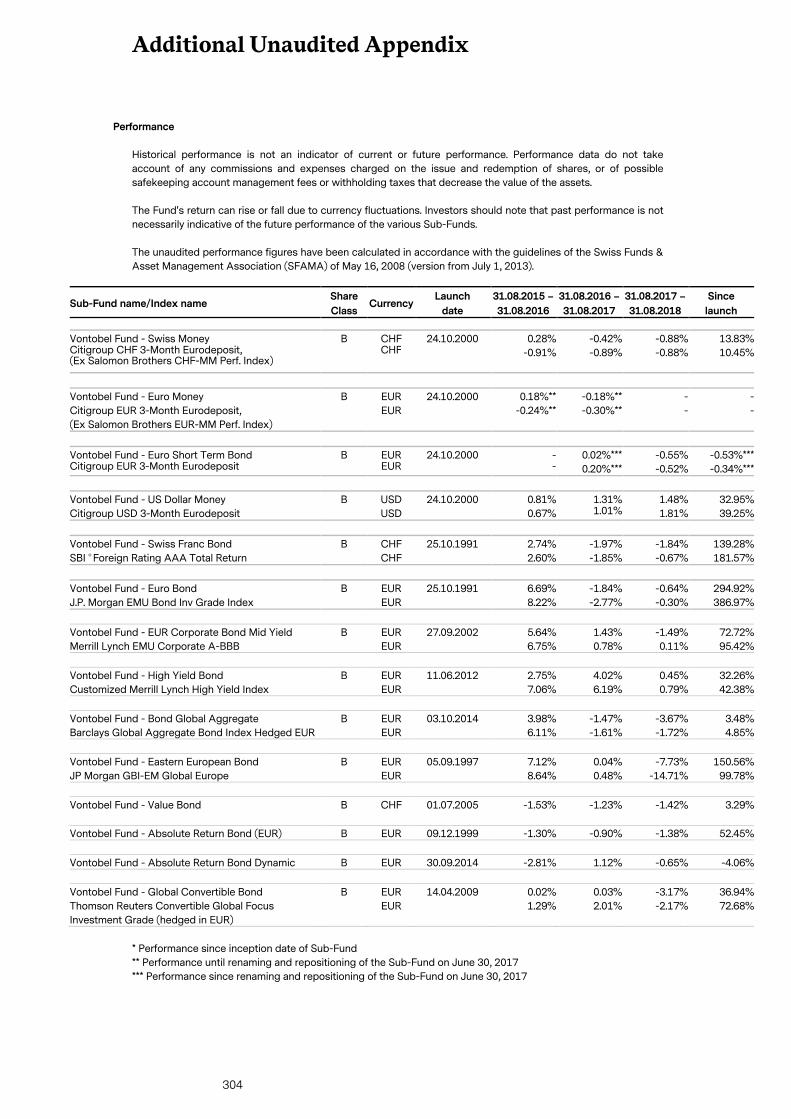
Additional Unaudited Appendix
304
Performance
Historical performance is not an indicator of current or future performance. Performance data do not take
account of any commissions and expenses charged on the issue and redemption of shares, or of possible
safekeeping account management fees or withholding taxes that decrease the value of the assets.
The Fund's return can rise or fall due to currency fluctuations. Investors should note that past performance is not
necessarily indicative of the future performance of the various Sub-Funds.
The unaudited performance figures have been calculated in accordance with the guidelines of the Swiss Funds &
Asset Management Association (SFAMA) of May 16, 2008 (version from July 1, 2013).
Sub-Fund name/Index name Share
Class Currency
Launch
date
31.08.2015 –
31.08.2016
31.08.2016 –
31.08.2017
31.08.2017 –
31.08.2018
Since
launch
Vontobel Fund - Swiss Money B CHF 24.10.2000 0.28% -0.42% -0.88% 13.83% Citigroup CHF 3-Month Eurodeposit, (Ex Salomon Brothers CHF-MM Perf. Index)
CHF -0.91% -0.89% -0.88% 10.45%
Vontobel Fund - Euro Money B EUR 24.10.2000 0.18%** -0.18%** - -
Citigroup EUR 3-Month Eurodeposit,
(Ex Salomon Brothers EUR-MM Perf. Index)
EUR -0.24%** -0.30%** - -
Vontobel Fund - Euro Short Term Bond B EUR 24.10.2000 - 0.02%*** -0.55% -0.53%*** Citigroup EUR 3-Month Eurodeposit EUR - 0.20%*** -0.52% -0.34%***
Vontobel Fund - US Dollar Money B USD 24.10.2000 0.81% 1.31% 1.48% 32.95%
Citigroup USD 3-Month Eurodeposit USD 0.67% 1.01% 1.81% 39.25%
Vontobel Fund - Swiss Franc Bond B CHF 25.10.1991 2.74% -1.97% -1.84% 139.28%
SBI ® Foreign Rating AAA Total Return CHF 2.60% -1.85% -0.67% 181.57%
Vontobel Fund - Euro Bond B EUR 25.10.1991 6.69% -1.84% -0.64% 294.92%
J.P. Morgan EMU Bond Inv Grade Index EUR 8.22% -2.77% -0.30% 386.97%
Vontobel Fund - EUR Corporate Bond Mid Yield B EUR 27.09.2002 5.64% 1.43% -1.49% 72.72%
Merrill Lynch EMU Corporate A-BBB EUR 6.75% 0.78% 0.11% 95.42%
Vontobel Fund - High Yield Bond B EUR 11.06.2012 2.75% 4.02% 0.45% 32.26%
Customized Merrill Lynch High Yield Index EUR 7.06% 6.19% 0.79% 42.38%
Vontobel Fund - Bond Global Aggregate B EUR 03.10.2014 3.98% -1.47% -3.67% 3.48%
Barclays Global Aggregate Bond Index Hedged EUR EUR 6.11% -1.61% -1.72% 4.85%
Vontobel Fund - Eastern European Bond B EUR 05.09.1997 7.12% 0.04% -7.73% 150.56%
JP Morgan GBI-EM Global Europe EUR 8.64% 0.48% -14.71% 99.78%
Vontobel Fund - Value Bond B CHF 01.07.2005 -1.53% -1.23% -1.42% 3.29%
Vontobel Fund - Absolute Return Bond (EUR) B EUR 09.12.1999 -1.30% -0.90% -1.38% 52.45%
Vontobel Fund - Absolute Return Bond Dynamic B EUR 30.09.2014 -2.81% 1.12% -0.65% -4.06%
Vontobel Fund - Global Convertible Bond B EUR 14.04.2009 0.02% 0.03% -3.17% 36.94%
Thomson Reuters Convertible Global Focus
Investment Grade (hedged in EUR)
EUR 1.29% 2.01% -2.17% 72.68%
* Performance since inception date of Sub-Fund
** Performance until renaming and repositioning of the Sub-Fund on June 30, 2017
*** Performance since renaming and repositioning of the Sub-Fund on June 30, 2017
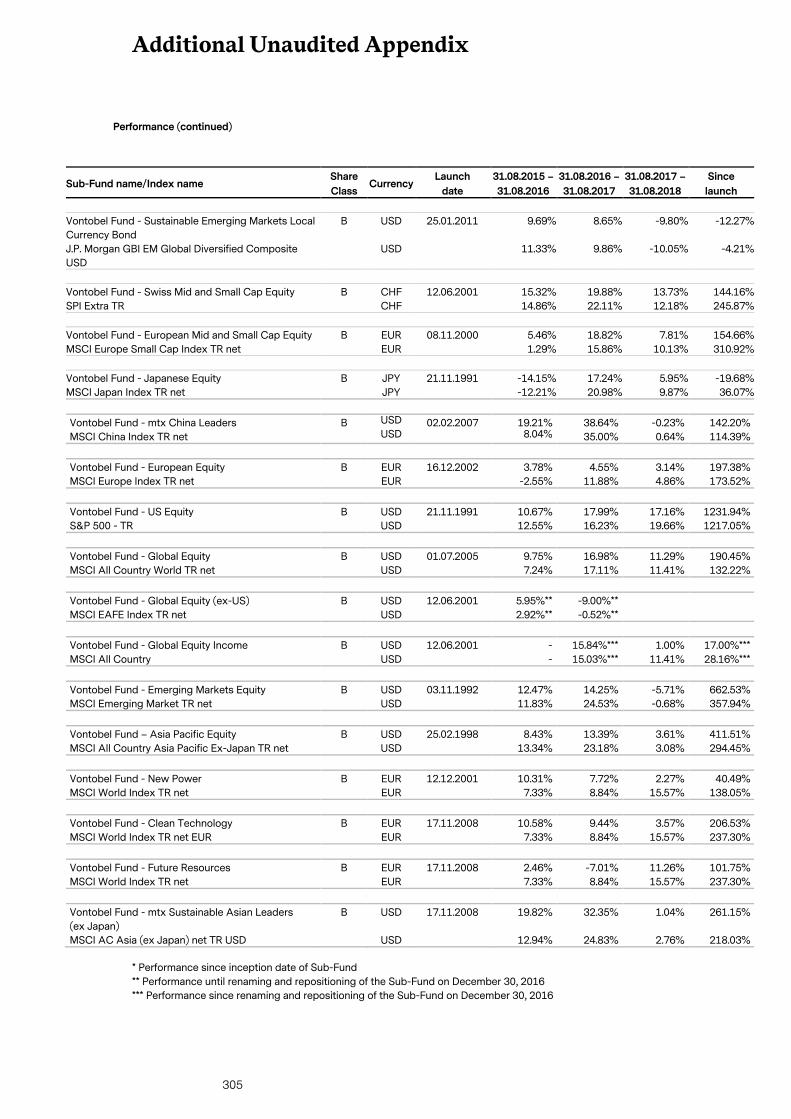
Additional Unaudited Appendix
305
Performance (continued)
Sub-Fund name/Index name Share
Class Currency
Launch
date
31.08.2015 –
31.08.2016
31.08.2016 –
31.08.2017
31.08.2017 –
31.08.2018
Since
launch
Vontobel Fund - Sustainable Emerging Markets Local
Currency Bond
B USD 25.01.2011 9.69% 8.65% -9.80% -12.27%
J.P. Morgan GBI EM Global Diversified Composite
USD
USD 11.33% 9.86% -10.05% -4.21%
Vontobel Fund - Swiss Mid and Small Cap Equity B CHF 12.06.2001 15.32% 19.88% 13.73% 144.16%
SPI Extra TR CHF 14.86% 22.11% 12.18% 245.87%
Vontobel Fund - European Mid and Small Cap Equity B EUR 08.11.2000 5.46% 18.82% 7.81% 154.66%
MSCI Europe Small Cap Index TR net EUR 1.29% 15.86% 10.13% 310.92%
Vontobel Fund - Japanese Equity B JPY 21.11.1991 -14.15% 17.24% 5.95% -19.68%
MSCI Japan Index TR net JPY -12.21% 20.98% 9.87% 36.07%
Vontobel Fund - mtx China Leaders B USD 02.02.2007 19.21% 38.64% -0.23% 142.20%
MSCI China Index TR net USD 8.04% 35.00% 0.64% 114.39%
Vontobel Fund - European Equity B EUR 16.12.2002 3.78% 4.55% 3.14% 197.38%
MSCI Europe Index TR net EUR -2.55% 11.88% 4.86% 173.52%
Vontobel Fund - US Equity B USD 21.11.1991 10.67% 17.99% 17.16% 1231.94%
S&P 500 - TR USD 12.55% 16.23% 19.66% 1217.05%
Vontobel Fund - Global Equity B USD 01.07.2005 9.75% 16.98% 11.29% 190.45%
MSCI All Country World TR net USD 7.24% 17.11% 11.41% 132.22%
Vontobel Fund - Global Equity (ex-US) B USD 12.06.2001 5.95%** -9.00%**
MSCI EAFE Index TR net USD 2.92%** -0.52%**
Vontobel Fund - Global Equity Income B USD 12.06.2001 - 15.84%*** 1.00% 17.00%***
MSCI All Country USD - 15.03%*** 11.41% 28.16%***
Vontobel Fund - Emerging Markets Equity B USD 03.11.1992 12.47% 14.25% -5.71% 662.53%
MSCI Emerging Market TR net USD 11.83% 24.53% -0.68% 357.94%
Vontobel Fund – Asia Pacific Equity B USD 25.02.1998 8.43% 13.39% 3.61% 411.51%
MSCI All Country Asia Pacific Ex-Japan TR net USD 13.34% 23.18% 3.08% 294.45%
Vontobel Fund - New Power B EUR 12.12.2001 10.31% 7.72% 2.27% 40.49%
MSCI World Index TR net EUR 7.33% 8.84% 15.57% 138.05%
Vontobel Fund - Clean Technology B EUR 17.11.2008 10.58% 9.44% 3.57% 206.53%
MSCI World Index TR net EUR EUR 7.33% 8.84% 15.57% 237.30%
Vontobel Fund - Future Resources B EUR 17.11.2008 2.46% -7.01% 11.26% 101.75%
MSCI World Index TR net EUR 7.33% 8.84% 15.57% 237.30%
Vontobel Fund - mtx Sustainable Asian Leaders
(ex Japan)
B USD 17.11.2008 19.82% 32.35% 1.04% 261.15%
MSCI AC Asia (ex Japan) net TR USD USD 12.94% 24.83% 2.76% 218.03%
* Performance since inception date of Sub-Fund
** Performance until renaming and repositioning of the Sub-Fund on December 30, 2016
*** Performance since renaming and repositioning of the Sub-Fund on December 30, 2016
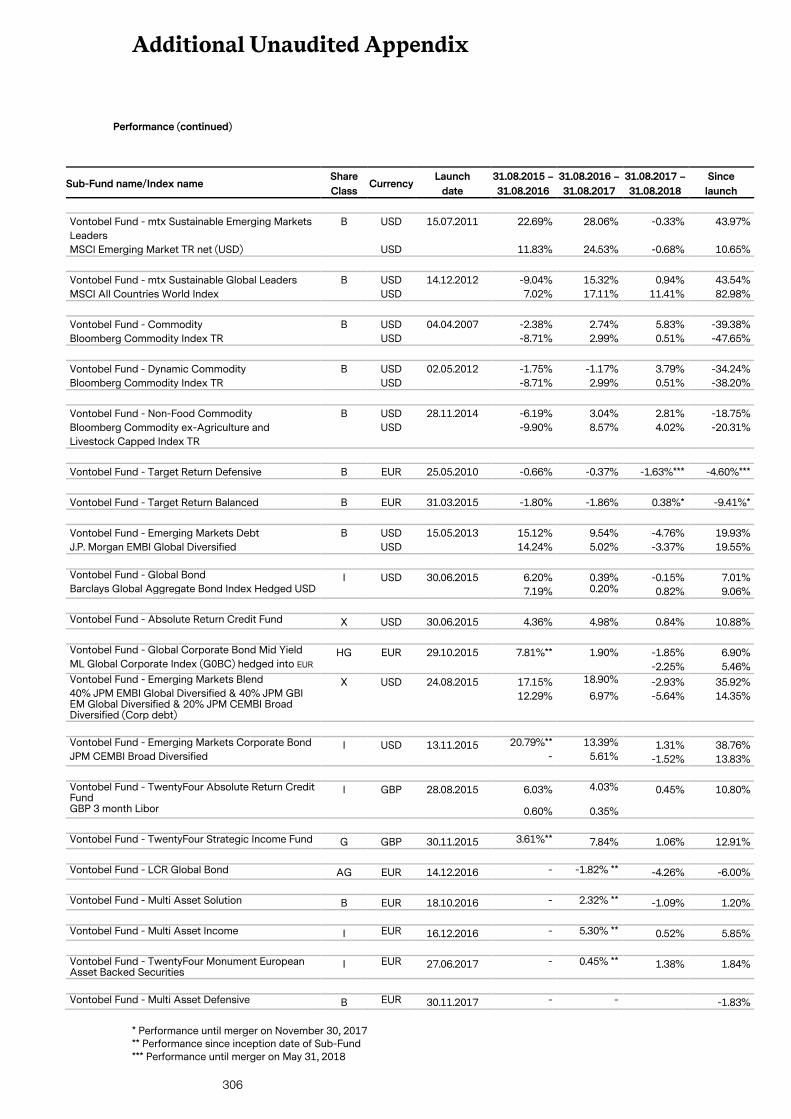
Additional Unaudited Appendix
306
Performance (continued)
Sub-Fund name/Index name Share
Class Currency
Launch
date
31.08.2015 –
31.08.2016
31.08.2016 –
31.08.2017
31.08.2017 –
31.08.2018
Since
launch
Vontobel Fund - mtx Sustainable Emerging Markets
Leaders
B USD 15.07.2011 22.69% 28.06% -0.33% 43.97%
MSCI Emerging Market TR net (USD) USD 11.83% 24.53% -0.68% 10.65%
Vontobel Fund - mtx Sustainable Global Leaders B USD 14.12.2012 -9.04% 15.32% 0.94% 43.54%
MSCI All Countries World Index USD 7.02% 17.11% 11.41% 82.98%
Vontobel Fund - Commodity B USD 04.04.2007 -2.38% 2.74% 5.83% -39.38%
Bloomberg Commodity Index TR USD -8.71% 2.99% 0.51% -47.65%
Vontobel Fund - Dynamic Commodity B USD 02.05.2012 -1.75% -1.17% 3.79% -34.24%
Bloomberg Commodity Index TR USD -8.71% 2.99% 0.51% -38.20%
Vontobel Fund - Non-Food Commodity B USD 28.11.2014 -6.19% 3.04% 2.81% -18.75%
Bloomberg Commodity ex-Agriculture and
Livestock Capped Index TR
USD -9.90% 8.57% 4.02% -20.31%
Vontobel Fund - Target Return Defensive B EUR 25.05.2010 -0.66% -0.37% -1.63%*** -4.60%***
Vontobel Fund - Target Return Balanced B EUR 31.03.2015 -1.80% -1.86% 0.38%* -9.41%*
Vontobel Fund - Emerging Markets Debt B USD 15.05.2013 15.12% 9.54% -4.76% 19.93%
J.P. Morgan EMBI Global Diversified USD 14.24% 5.02% -3.37% 19.55%
Vontobel Fund - Global Bond I USD 30.06.2015 6.20% 0.39% -0.15% 7.01% Barclays Global Aggregate Bond Index Hedged USD 7.19% 0.20% 0.82% 9.06% Vontobel Fund - Absolute Return Credit Fund X USD 30.06.2015 4.36% 4.98% 0.84% 10.88% Vontobel Fund - Global Corporate Bond Mid Yield HG EUR 29.10.2015 7.81%** 1.90% -1.85% 6.90% ML Global Corporate Index (G0BC) hedged into EUR -2.25% 5.46% Vontobel Fund - Emerging Markets Blend X USD 24.08.2015 17.15% 18.90% -2.93% 35.92% 40% JPM EMBI Global Diversified & 40% JPM GBI EM Global Diversified & 20% JPM CEMBI Broad Diversified (Corp debt)
12.29% 6.97% -5.64% 14.35%
Vontobel Fund - Emerging Markets Corporate Bond I USD 13.11.2015 20.79%** 13.39% 1.31% 38.76% JPM CEMBI Broad Diversified - 5.61% -1.52% 13.83% Vontobel Fund - TwentyFour Absolute Return Credit Fund
I GBP 28.08.2015 6.03% 4.03% 0.45% 10.80%
GBP 3 month Libor 0.60% 0.35% Vontobel Fund - TwentyFour Strategic Income Fund G GBP 30.11.2015 3.61%** 7.84% 1.06% 12.91% Vontobel Fund - LCR Global Bond AG EUR 14.12.2016 - -1.82% ** -4.26% -6.00% Vontobel Fund - Multi Asset Solution B EUR 18.10.2016 - 2.32% ** -1.09% 1.20% Vontobel Fund - Multi Asset Income I EUR 16.12.2016 - 5.30% ** 0.52% 5.85% Vontobel Fund - TwentyFour Monument European Asset Backed Securities
I EUR 27.06.2017 - 0.45% ** 1.38% 1.84%
Vontobel Fund - Multi Asset Defensive B EUR 30.11.2017 - - -1.83%
* Performance until merger on November 30, 2017 ** Performance since inception date of Sub-Fund *** Performance until merger on May 31, 2018
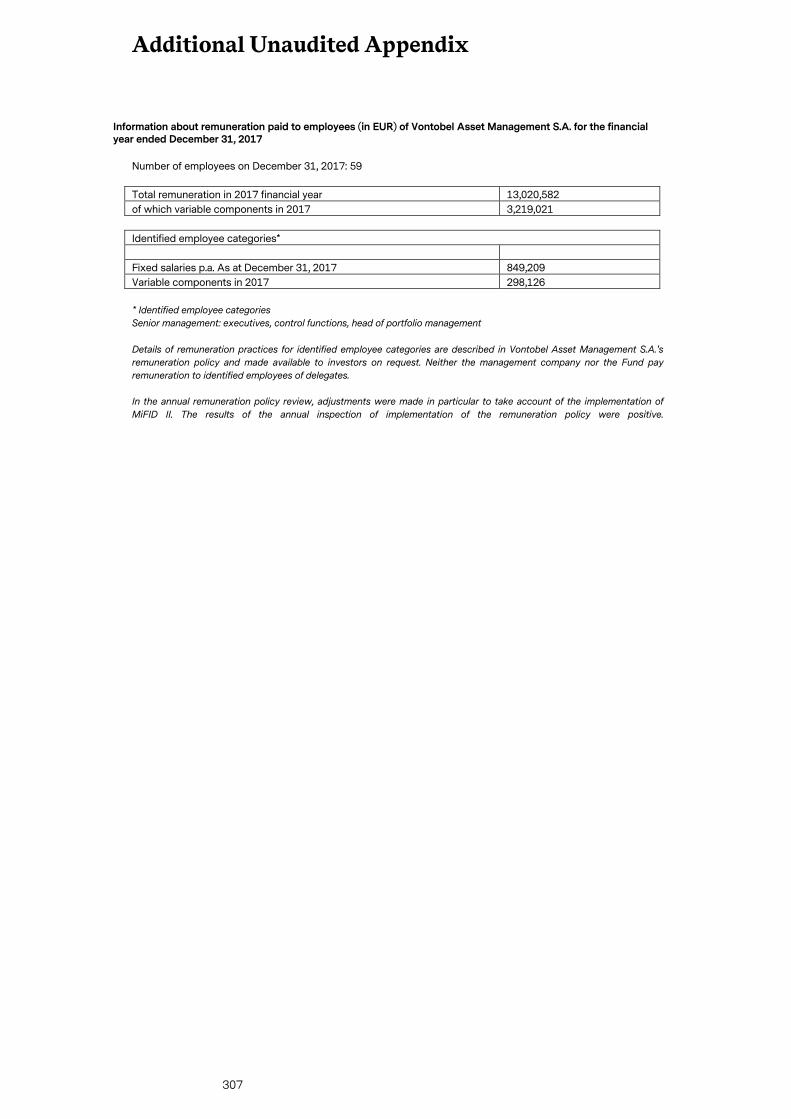
Additional Unaudited Appendix
307
Information about remuneration paid to employees (in EUR) of Vontobel Asset Management S.A. for the financial year ended December 31, 2017
Number of employees on December 31, 2017: 59
Total remuneration in 2017 financial year 13,020,582
of which variable components in 2017 3,219,021
Identified employee categories*
Fixed salaries p.a. As at December 31, 2017 849,209
Variable components in 2017 298,126
* Identified employee categories
Senior management: executives, control functions, head of portfolio management
Details of remuneration practices for identified employee categories are described in Vontobel Asset Management S.A.'s
remuneration policy and made available to investors on request. Neither the management company nor the Fund pay
remuneration to identified employees of delegates.
In the annual remuneration policy review, adjustments were made in particular to take account of the implementation of
MiFID II. The results of the annual inspection of implementation of the remuneration policy were positive.
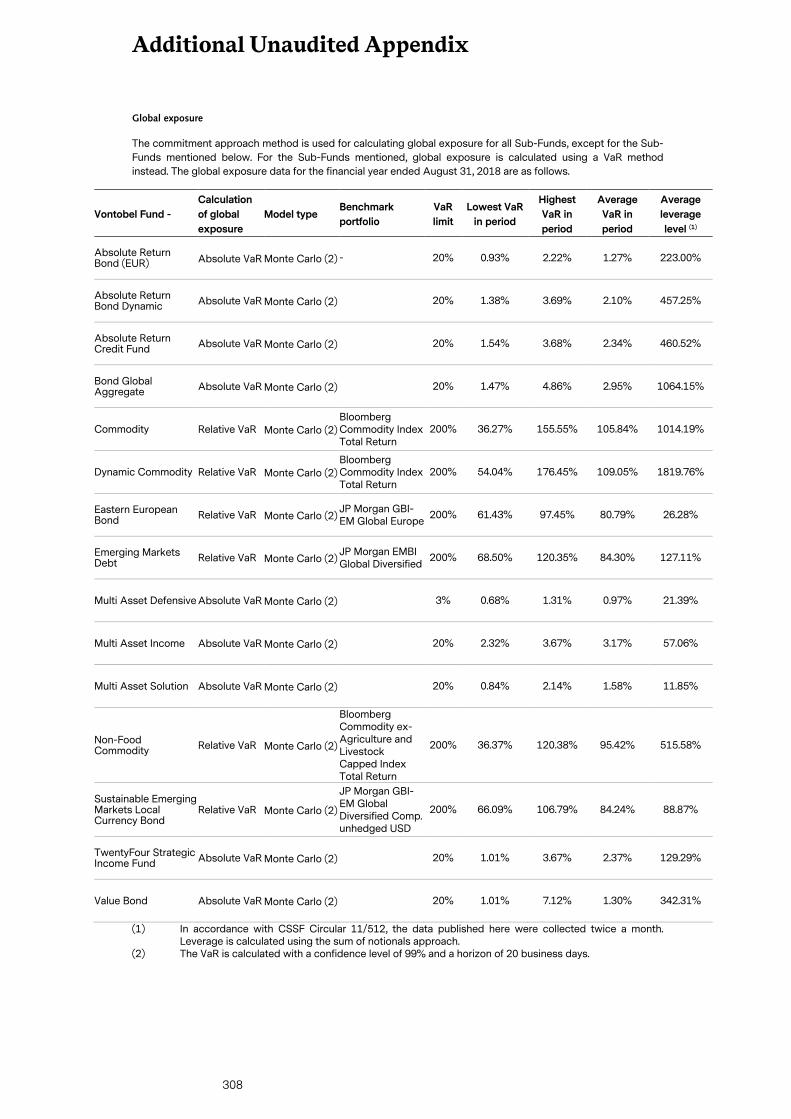
Additional Unaudited Appendix
308
Global exposure
The commitment approach method is used for calculating global exposure for all Sub-Funds, except for the Sub-
Funds mentioned below. For the Sub-Funds mentioned, global exposure is calculated using a VaR method
instead. The global exposure data for the financial year ended August 31, 2018 are as follows.
Vontobel Fund -
Calculation
of global
exposure
Model type Benchmark
portfolio
VaR
limit
Lowest VaR
in period
Highest
VaR in
period
Average
VaR in
period
Average
leverage
level (1)
Absolute Return Bond (EUR) Absolute VaR Monte Carlo (2) - 20% 0.93% 2.22% 1.27% 223.00%
Absolute Return Bond Dynamic Absolute VaR Monte Carlo (2) 20% 1.38% 3.69% 2.10% 457.25%
Absolute Return Credit Fund Absolute VaR Monte Carlo (2) 20% 1.54% 3.68% 2.34% 460.52%
Bond Global Aggregate Absolute VaR Monte Carlo (2) 20% 1.47% 4.86% 2.95% 1064.15%
Commodity Relative VaR Monte Carlo (2) Bloomberg Commodity Index Total Return
200% 36.27% 155.55% 105.84% 1014.19%
Dynamic Commodity Relative VaR Monte Carlo (2) Bloomberg Commodity Index Total Return
200% 54.04% 176.45% 109.05% 1819.76%
Eastern European Bond Relative VaR Monte Carlo (2)
JP Morgan GBI-EM Global Europe
200% 61.43% 97.45% 80.79% 26.28%
Emerging Markets Debt Relative VaR Monte Carlo (2)
JP Morgan EMBI Global Diversified
200% 68.50% 120.35% 84.30% 127.11%
Multi Asset Defensive Absolute VaR Monte Carlo (2) 3% 0.68% 1.31% 0.97% 21.39%
Multi Asset Income Absolute VaR Monte Carlo (2) 20% 2.32% 3.67% 3.17% 57.06%
Multi Asset Solution Absolute VaR Monte Carlo (2) 20% 0.84% 2.14% 1.58% 11.85%
Non-Food Commodity Relative VaR Monte Carlo (2)
Bloomberg Commodity ex-Agriculture and Livestock Capped Index Total Return
200% 36.37% 120.38% 95.42% 515.58%
Sustainable Emerging Markets Local Currency Bond
Relative VaR Monte Carlo (2)
JP Morgan GBI-EM Global Diversified Comp. unhedged USD
200% 66.09% 106.79% 84.24% 88.87%
TwentyFour Strategic Income Fund Absolute VaR Monte Carlo (2) 20% 1.01% 3.67% 2.37% 129.29%
Value Bond Absolute VaR Monte Carlo (2) 20% 1.01% 7.12% 1.30% 342.31%
(1) In accordance with CSSF Circular 11/512, the data published here were collected twice a month. Leverage is calculated using the sum of notionals approach.
(2) The VaR is calculated with a confidence level of 99% and a horizon of 20 business days.
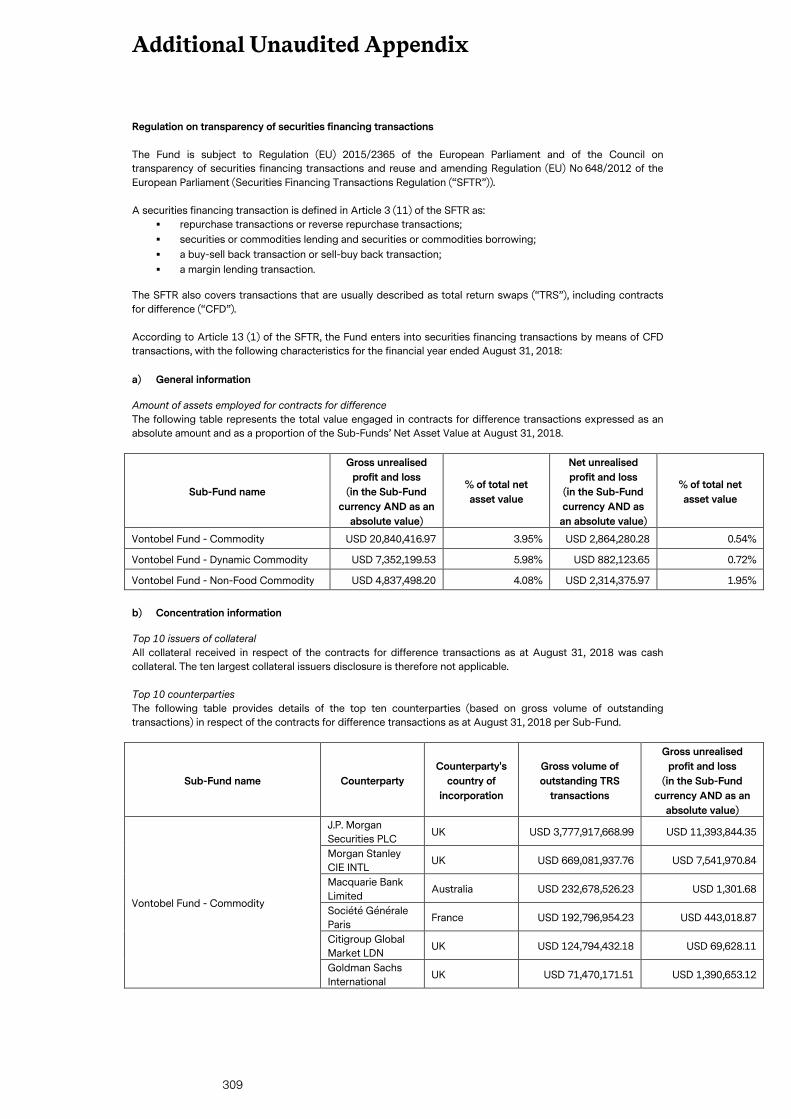
Additional Unaudited Appendix
309
Regulation on transparency of securities financing transactions
The Fund is subject to Regulation (EU) 2015/2365 of the European Parliament and of the Council on
transparency of securities financing transactions and reuse and amending Regulation (EU) No 648/2012 of the
European Parliament (Securities Financing Transactions Regulation (“SFTR”)).
A securities financing transaction is defined in Article 3 (11) of the SFTR as:
� repurchase transactions or reverse repurchase transactions;
� securities or commodities lending and securities or commodities borrowing;
� a buy-sell back transaction or sell-buy back transaction;
� a margin lending transaction.
The SFTR also covers transactions that are usually described as total return swaps (“TRS”), including contracts
for difference (“CFD”).
According to Article 13 (1) of the SFTR, the Fund enters into securities financing transactions by means of CFD
transactions, with the following characteristics for the financial year ended August 31, 2018:
a) General information
Amount of assets employed for contracts for difference
The following table represents the total value engaged in contracts for difference transactions expressed as an
absolute amount and as a proportion of the Sub-Funds’ Net Asset Value at August 31, 2018.
Sub-Fund name
Gross unrealised
profit and loss
(in the Sub-Fund
currency AND as an
absolute value)
% of total net
asset value
Net unrealised
profit and loss
(in the Sub-Fund
currency AND as
an absolute value)
% of total net
asset value
Vontobel Fund - Commodity USD 20,840,416.97 3.95% USD 2,864,280.28 0.54%
Vontobel Fund - Dynamic Commodity USD 7,352,199.53 5.98% USD 882,123.65 0.72%
Vontobel Fund - Non-Food Commodity USD 4,837,498.20 4.08% USD 2,314,375.97 1.95%
b) Concentration information
Top 10 issuers of collateral
All collateral received in respect of the contracts for difference transactions as at August 31, 2018 was cash
collateral. The ten largest collateral issuers disclosure is therefore not applicable.
Top 10 counterparties
The following table provides details of the top ten counterparties (based on gross volume of outstanding
transactions) in respect of the contracts for difference transactions as at August 31, 2018 per Sub-Fund.
Sub-Fund name Counterparty
Counterparty's
country of
incorporation
Gross volume of
outstanding TRS
transactions
Gross unrealised
profit and loss
(in the Sub-Fund
currency AND as an
absolute value)
Vontobel Fund - Commodity
J.P. Morgan
Securities PLC UK USD 3,777,917,668.99 USD 11,393,844.35
Morgan Stanley
CIE INTL UK USD 669,081,937.76 USD 7,541,970.84
Macquarie Bank
Limited Australia USD 232,678,526.23 USD 1,301.68
Société Générale
Paris France USD 192,796,954.23 USD 443,018.87
Citigroup Global
Market LDN UK USD 124,794,432.18 USD 69,628.11
Goldman Sachs
International UK USD 71,470,171.51 USD 1,390,653.12
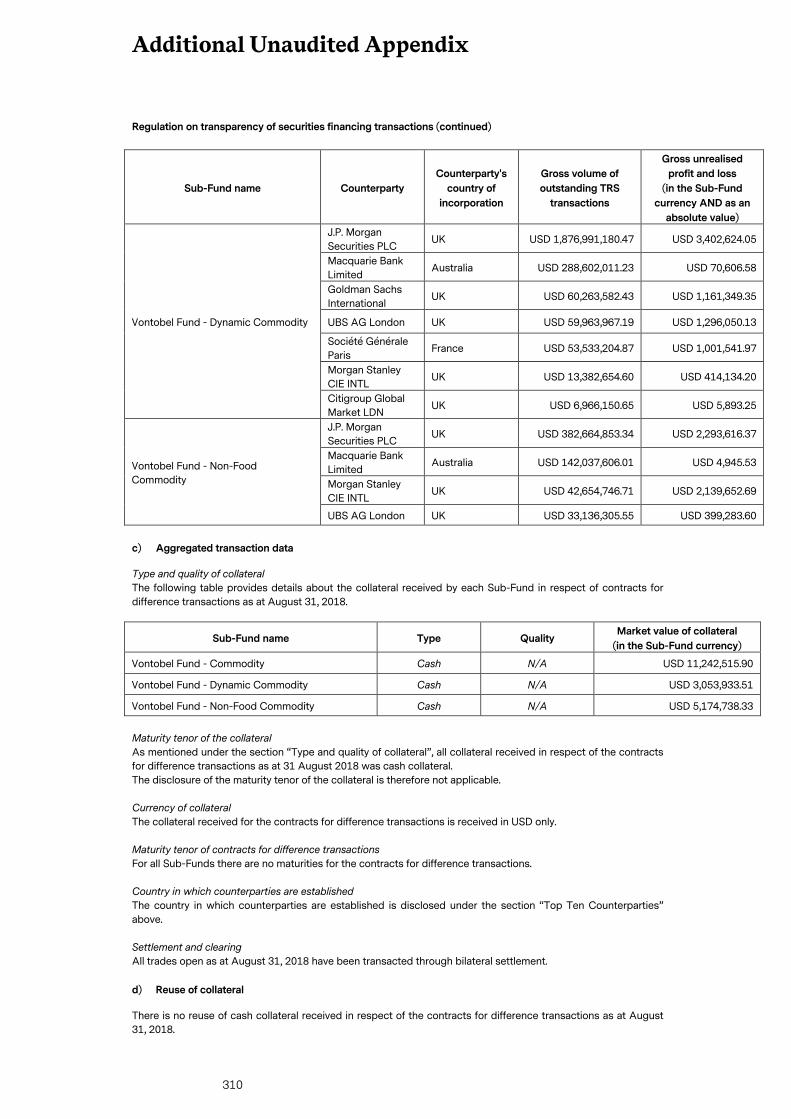
Additional Unaudited Appendix
310
Regulation on transparency of securities financing transactions (continued)
Sub-Fund name Counterparty
Counterparty's
country of
incorporation
Gross volume of
outstanding TRS
transactions
Gross unrealised
profit and loss
(in the Sub-Fund
currency AND as an
absolute value)
Vontobel Fund - Dynamic Commodity
J.P. Morgan
Securities PLC UK USD 1,876,991,180.47 USD 3,402,624.05
Macquarie Bank
Limited Australia USD 288,602,011.23 USD 70,606.58
Goldman Sachs
International UK USD 60,263,582.43 USD 1,161,349.35
UBS AG London UK USD 59,963,967.19 USD 1,296,050.13
Société Générale
Paris France USD 53,533,204.87 USD 1,001,541.97
Morgan Stanley
CIE INTL UK USD 13,382,654.60 USD 414,134.20
Citigroup Global
Market LDN UK USD 6,966,150.65 USD 5,893.25
Vontobel Fund - Non-Food
Commodity
J.P. Morgan
Securities PLC UK USD 382,664,853.34 USD 2,293,616.37
Macquarie Bank
Limited Australia USD 142,037,606.01 USD 4,945.53
Morgan Stanley
CIE INTL UK USD 42,654,746.71 USD 2,139,652.69
UBS AG London UK USD 33,136,305.55 USD 399,283.60
c) Aggregated transaction data
Type and quality of collateral
The following table provides details about the collateral received by each Sub-Fund in respect of contracts for
difference transactions as at August 31, 2018.
Sub-Fund name Type Quality Market value of collateral
(in the Sub-Fund currency)
Vontobel Fund - Commodity Cash N/A USD 11,242,515.90
Vontobel Fund - Dynamic Commodity Cash N/A USD 3,053,933.51
Vontobel Fund - Non-Food Commodity Cash N/A USD 5,174,738.33
Maturity tenor of the collateral
As mentioned under the section “Type and quality of collateral”, all collateral received in respect of the contracts
for difference transactions as at 31 August 2018 was cash collateral.
The disclosure of the maturity tenor of the collateral is therefore not applicable.
Currency of collateral
The collateral received for the contracts for difference transactions is received in USD only.
Maturity tenor of contracts for difference transactions
For all Sub-Funds there are no maturities for the contracts for difference transactions.
Country in which counterparties are established
The country in which counterparties are established is disclosed under the section “Top Ten Counterparties”
above.
Settlement and clearing
All trades open as at August 31, 2018 have been transacted through bilateral settlement.
d) Reuse of collateral
There is no reuse of cash collateral received in respect of the contracts for difference transactions as at August
31, 2018.
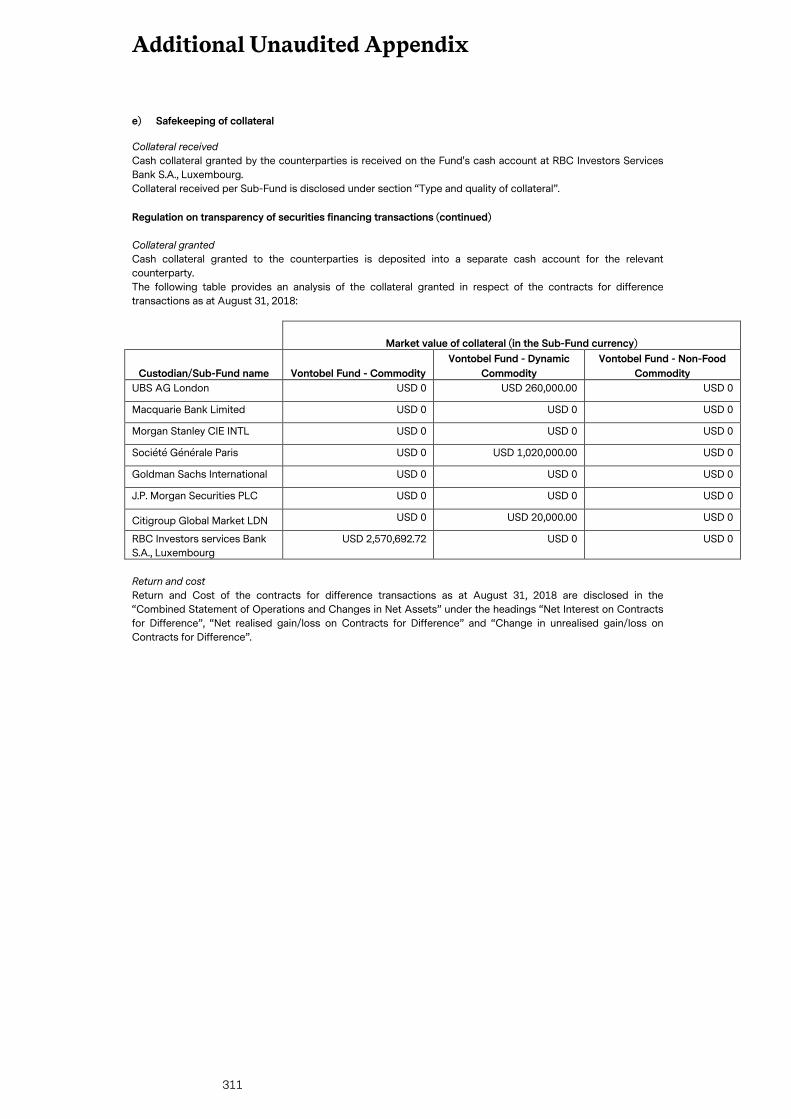
Additional Unaudited Appendix
311
e) Safekeeping of collateral
Collateral received
Cash collateral granted by the counterparties is received on the Fund's cash account at RBC Investors Services
Bank S.A., Luxembourg.
Collateral received per Sub-Fund is disclosed under section “Type and quality of collateral”.
Regulation on transparency of securities financing transactions (continued)
Collateral granted
Cash collateral granted to the counterparties is deposited into a separate cash account for the relevant
counterparty.
The following table provides an analysis of the collateral granted in respect of the contracts for difference
transactions as at August 31, 2018:
Market value of collateral (in the Sub-Fund currency)
Custodian/Sub-Fund name Vontobel Fund - Commodity
Vontobel Fund - Dynamic
Commodity
Vontobel Fund - Non-Food
Commodity
UBS AG London USD 0 USD 260,000.00 USD 0
Macquarie Bank Limited USD 0 USD 0 USD 0
Morgan Stanley CIE INTL USD 0 USD 0 USD 0
Société Générale Paris USD 0 USD 1,020,000.00 USD 0
Goldman Sachs International USD 0 USD 0 USD 0
J.P. Morgan Securities PLC USD 0 USD 0 USD 0
Citigroup Global Market LDN USD 0 USD 20,000.00 USD 0
RBC Investors services Bank
S.A., Luxembourg
USD 2,570,692.72 USD 0 USD 0
Return and cost
Return and Cost of the contracts for difference transactions as at August 31, 2018 are disclosed in the
“Combined Statement of Operations and Changes in Net Assets” under the headings “Net Interest on Contracts
for Difference”, “Net realised gain/loss on Contracts for Difference” and “Change in unrealised gain/loss on
Contracts for Difference”.
Report of the Réviseur d'entreprises agréé
for the financial year from September 1, 2017
to August 31, 2018
312
To Vontobel Fund shareholders
Opinion
We have audited the annual financial statements of Vontobel Fund ("the Fund") and each of its subfunds, which comprise
the Statement of Net Assets as at August 31, 2018, the Statement of Net Income and the Statement of Changes in Net
Assets for the year then ended, including a summary of significant accounting policies.
In our opinion, the financial statements give a true and fair view of the assets and financial position of Vontobel Fund and of
each of its Sub-Funds as at August 31, 2018, and of the results of their operations and changes in their net assets for the
year then ended in accordance with Luxembourg legal and regulatory requirements relating to the preparation of the
financial statements.
Basis for opinion
We conducted our audit in accordance with the Audit Law (Law of July 23, 2016) and International Standards on Auditing
("ISAs") as adopted for Luxembourg by the Commission de Surveillance du Secteur Financier ("CSSF"). Our responsibilities
under that law and those standards are further described in the Responsibilities of the Réviseur d'Entreprises Agréé section
of our report. We are independent of the Fund in accordance with the International Ethics Standards Board for
Accountants’ Code of Ethics for Professional Accountants (IESBA Code) adopted for Luxembourg by the CSSF together
with the professional code of conduct, which we are required to comply with in the course of the audit of the annual
financial statements, and we have fulfilled our other responsibilities in accordance with these ethical requirements.
We believe that the audit evidence we have obtained is sufficient and appropriate to provide a basis for our audit opinion.
Other information
The Fund's Board of Directors is responsible for the other information. The other information comprises the information
included in the annual report, but does not include the annual financial statements and our report thereon as Réviseur
d'Entreprises Agréé.
Our opinion on the annual financial statements does not cover the other information, and we do not express any form of
assurance conclusion thereon.
In connection with our audit of the annual financial statements, our responsibility is to read the other information and, in
doing so, consider whether the other information is materially inconsistent with the annual financial statements or our
knowledge obtained in the audit or otherwise appears to be materially misstated. If, based on the work we have performed,
we conclude that there is a material misstatement of this other information, we are required to report that fact. We have
nothing to report in this regard.
Responsibilities of the Fund's Board of Directors and those responsible for the annual financial statements
The Board of Directors of the Fund is responsible for the preparation and fair presentation of the annual financial
statements in accordance with Luxembourg legal and regulatory requirements relating to the preparation of the financial
statements, and for such internal control as it determines is necessary to enable the preparation of annual financial
statements that are free from material misstatement, whether due to fraud or error.
In preparing the annual financial statements, the Board of Directors of the Fund is responsible for assessing the Fund's
ability to continue as a going concern, disclosing, as applicable, matters related to going concern and using the going
concern basis of accounting, unless the Board of Directors of the Fund either intends to liquidate the Fund or to cease
operations, or has no realistic alternative but to do so.
Responsibilities of the Réviseur d'Entreprises Agréé for the audit of the annual financial statements
Our objectives are to obtain reasonable assurance about whether the annual financial statements as a whole are free from
misstatement, whether due to fraud or error, and to issue a report that includes our opinion, as Réviseur d'Entreprises
Agréé. Reasonable assurance is a high level of assurance, but is not a guarantee that an audit conducted in accordance
with the Law of July 23, 2016 and in accordance with the ISAs adopted for Luxembourg by the CSSF will always detect a
material misstatement when it exists. Misstatements can arise from fraud or error and are considered material if, individually
or in the aggregate, they could reasonably be expected to influence the economic decisions of users taken on the basis of
these annual financial statements.
Report of the Réviseur d'entreprises agréé
for the financial year from September 1, 2017
to August 31, 2018
313
As part of an audit in accordance with the Law of July 23, 2016 and the ISAs adopted for Luxembourg by the CSSF, we
exercise professional judgement and maintain professional scepticism throughout the audit. We also,
- identify and assess the risks of material misstatement of the annual financial statements whether due to fraud or error,
design and perform audit procedures responsive to those risks, and obtain audit evidence that is sufficient and
appropriate to provide a basis for our opinion. The risk of not detecting a material misstatement resulting from fraud is
higher than for one resulting from error, as fraud may involve collusion, forgery, intentional omissions,
misrepresentations, or the override of internal control.
- obtain an understanding of internal control relevant to the audit in order to design audit procedures that are
appropriate in the circumstances, but not for the purpose of expressing an opinion on the effectiveness of the Fund's
internal control.
- evaluate the appropriateness of accounting policies used and the reasonableness of accounting estimates and related
disclosures made by the Board of Directors of the Fund.
- conclude on the appropriateness of the use of the going concern basis of accounting by the Board of Directors of the
Fund and, based on the audit evidence obtained, whether a material uncertainty exists related to events or conditions
that may cast significant doubt on the Fund's ability to continue as a going concern. If we conclude that a material
uncertainty exists, we are required to draw attention in our report as the Réviseur d'Entreprises Agréé to the related
disclosures in the annual financial statements or, if such disclosures are inadequate, to modify our opinion. Our
conclusions are based on the audit evidence obtained up to the date of our report as Réviseur d’Entreprises Agréé.
However, future events or conditions may cause the Fund to cease to continue as a going concern.
- evaluate the overall presentation, structure and content of the annual financial statements, including the disclosures in
the notes, and whether they represent the underlying transactions and events in a manner that achieves fair
presentation.
We communicate with those responsible regarding, among other matters, the planned scope and timing of the audit and
significant audit findings, including any significant deficiencies in internal control that we identify during our audit.
Ernst & Young
Société anonyme
Cabinet de révision agréé
Nadia Faber
Luxembourg, December 21, 2018
Related Documents