Welcome message from author
This document is posted to help you gain knowledge. Please leave a comment to let me know what you think about it! Share it to your friends and learn new things together.
Transcript


Page 1 Albuquerque Bernalillo County Water Utility Authority Voluntary Occurrence Monitoring for PPCPs March 2011
VOLUNTARY OCCURRENCE MONITORING
FOR PHARMACEUTICALS AND PERSONAL CARE PRODUCTS
September 2009 – June 2010
Albuquerque Bernalillo County Water Utility Authority
Executive Summary
In December 2008, the Albuquerque Bernalillo County Water Utility Authority (Water Authority) began adding surface water to the municipal drinking water supply through the San Juan-Chama Drinking Water Project (DWP). Reports by the Associated Press in 2008 highlighted the possible presence of pharmaceuticals and personal care products (PPCPs) in surface water. Although there are no known human health effects from PPCPs at the extremely low concentrations in question, the Water Authority undertook a voluntary testing program for PPCPs to gauge the occurrence of these substances and to establish baseline data should regulations for PPCPs be put in place at some point in the future. Results showed a low occurrence of PPCPs in the water system (pre- and post-treatment) and a much higher occurrence in the wastewater system. Of the more than one hundred substances tested, 81% were never detected in the finished drinking water (Figure a). Of the five hundred analytical tests on the finished drinking water, PPCPs were detected in only 8% of the tests (Figure b). Concentrations of detected PPCPs in the finished drinking water ranged between 0.167 and 4060 nanograms per liter (ng/L) with an average concentration of the detected results of 177 ng/L. Cholesterol was one of the PPCPs detected in the finished drinking water. The highest concentration of Cholesterol was 4060 ng/L. To put that level in perspective, on average, an egg contains 200 milligrams of Cholesterol. Drinking two (2) liters of finished drinking water per day at a concentration of 4060 ng/L Cholesterol, it would take a person more than 67 years to ingest the amount in an egg (200 milligrams).

Page 2 Albuquerque Bernalillo County Water Utility Authority Voluntary Occurrence Monitoring for PPCPs March 2011
Introduction
In December 2008, the Albuquerque Bernalillo County Water Utility Authority (Water Authority) implemented the San Juan-Chama Drinking Water Project (DWP), which began adding purified surface water to the municipal drinking water supply. The purpose of the DWP is to eliminate sole reliance on the overtaxed regional aquifer and transition to a renewable and sustainable surface water supply. The DWP is the most important component of the Water Authority’s Water Resources Management Strategy (Strategy) which also includes water conservation and water reuse. Under the Strategy, the aquifer is to be preserved as a long-term drought reserve and otherwise used only to meet peak demand. In just two (2) years of DWP operation, the U.S. Geological Survey has reported that ground water levels are rising in the Albuquerque Basin. Reports by the Associated Press during 2008 highlighted the possible presence of pharmaceuticals and personal care products (PPCPs) in surface water. The Water Authority undertook a voluntary testing program for PPCPs to gauge the occurrence of these substances at various points in the water and wastewater system and to establish baseline data should regulations for PPCPs be put in place at some point in the future. The results of the first year of occurrence monitoring are provided in this report. At the present time, according to the U.S. Environmental Protection Agency (EPA), scientists have found no evidence of adverse human health effects from PPCPs in the environment. The risks are unknown, largely because the concentrations are so low. There are no known human health effects from such low-
level exposures in drinking water. More investigation is needed (http://www.epa.gov/ppcp/).
There are thousands of PPCPs. The Water Authority’s monitoring program focused on a subset of 113 substances included in two EPA analytical methods. None are regulated under the federal Safe Drinking Water Act (SDWA) or the Clean Water Act (CWA). However, the EPA, which administers enforcement of both the SDWA and the CWA, is reviewing nine (9) of those substances as part of its Contaminant Candidate List 3 (CCL3) efforts (http://water.epa.gov/scitech/drinkingwater/dws/ccl/ccl3.cfm) for possible
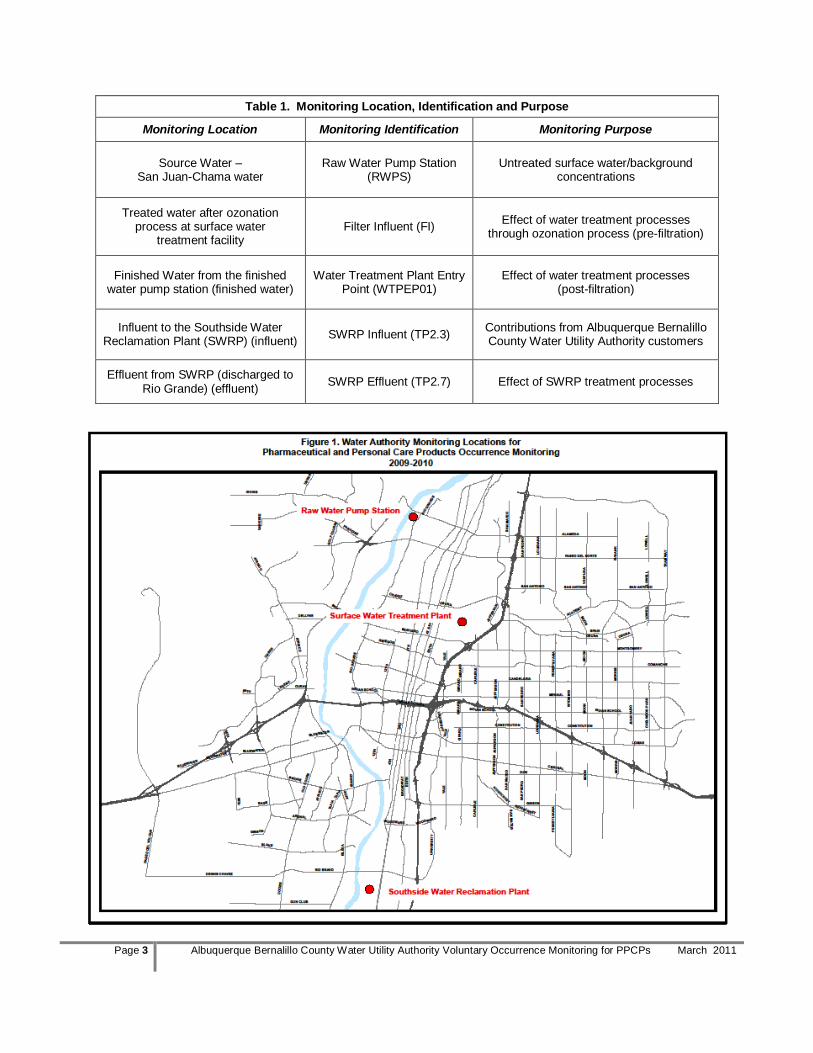
future regulation. The Water Authority voluntarily monitored for PPCPs in both the drinking water and wastewater systems. Specifically, the Water Authority collected 24-hour composite samples from five (5) locations in September 2009, December 2009, March 2010 and June 2010. The monitoring locations and identifications are listed in Table 1 and generally identified in Figure 1 on the following page. Overall, results of the effort showed an extremely low occurrence of PPCPs in source water prior to treatment and an even lower occurrence post-treatment. Predictably, contributions of PPCPs by users of the wastewater collection system resulted in a much higher incidence of PPCPs at the intake to the wastewater treatment plant.
Page 3 Albuquerque Bernalillo County Water Utility Authority Voluntary Occurrence Monitoring for PPCPs March 2011
Table 1. Monitoring Location, Identification and Purpose
Monitoring Location Monitoring Identification Monitoring Purpose
Source Water –
San Juan-Chama water
Raw Water Pump Station (RWPS)
Untreated surface water/background concentrations
Treated water after ozonation process at surface water
treatment facility Filter Influent (FI)
Effect of water treatment processes through ozonation process (pre-filtration)
Finished Water from the finished water pump station (finished water)
Water Treatment Plant Entry Point (WTPEP01)
Effect of water treatment processes (post-filtration)
Influent to the Southside Water Reclamation Plant (SWRP) (influent)
SWRP Influent (TP2.3) Contributions from Albuquerque Bernalillo County Water Utility Authority customers
Effluent from SWRP (discharged to Rio Grande) (effluent)
SWRP Effluent (TP2.7) Effect of SWRP treatment processes

Page 4 Albuquerque Bernalillo County Water Utility Authority Voluntary Occurrence Monitoring for PPCPs March 2011
What are PPCPs and where do they come from?
The EPA defines PPCPs in general as “…any product used by individuals for personal health or cosmetic reasons or used by agribusiness to enhance growth or health of livestock.” They also are comprised of natural and man-made endocrine-disrupting chemicals. PPCPs comprise a diverse collection of thousands of chemical substances including:
Prescription and over-the-counter therapeutic drugs
Veterinary drugs
Fragrances
Lotions
Cosmetics People contribute PPCPs when:
Medication residues are excreted from their bodies as waste and flushed into sewer lines,
Externally applied drugs and personal care products are washed down the shower drain, and
Unused or expired medications are flushed down the toilet. Monitoring Plan and Analytical Methods
In Fiscal Year 2010, the Water Authority conducted a one-year monitoring program for PPCPs to determine the levels that potentially occur in source water and finished water from the new surface water treatment plant, as well as in the influent and effluent from the Southside Water Reclamation Plant (SWRP). Other objectives included estimating treatment removal efficiencies and contributions from the Albuquerque metropolitan area.
Analytical methods for a wide variety of PPCPs at low detection levels are available only for research purposes and by a limited number of laboratories. The Water Authority chose two analytical methods that measure more than 100 PPCPs at very low levels (nanograms per liter (ng/L) or part per trillion (ppt)). For all but a few exceptions, results for organic analyses obtained through commonly available analytical methods are reported typically in the microgram per liter (part per billion (ppb)) level. The analytical methods used for this occurrence monitoring provided results 1000 times more sensitive. The analytical cost for each sample varied between $2000 and $3500 depending on the contract laboratory.
Samples were collected following an approved protocol and sampling techniques using automated composite sampling equipment. A total of 10 liters of sample was collected on a time weighted basis for four (4) of the locations (raw water pump station, after ozone, finished water and SWRP influent). The composite for the fifth location (SWRP effluent) was flow weighted.
A part per trillion is equivalent to:
three seconds out of every 100,000 years
or one drop of water diluted in 20 Olympic sized swimming pools
(13,200,000 Gallons total)

Page 5 Albuquerque Bernalillo County Water Utility Authority Voluntary Occurrence Monitoring for PPCPs March 2011
Sample bottles provided by the contract laboratories were filled with the composited samples, labeled, placed on ice, delivered to the contract laboratory and then shipped to the subcontract laboratory. Samples were analyzed by AXYS Analytical Services (located in British Columbia, Canada) using:
AXYS Method MLA-075. (high performance liquid chromatography combined with tandem mass spectrometry(HPLC/MS/MS))1 and
AXYS Method MLA-068. (isotope dilution and internal standard high resolution gas chromatography combined with high resolution mass spectrometry (HRGC/HRMS))2.
The subcontract laboratory provided results for 113 substances; 86 substances for AXYS Method MLA-075 and 27 substances based on AXYS Method MLA-068. The list of substances is provided in Table 2.
Table 2. Pharmaceuticals and Personal Care Products (PPCPs) Substances
AXYS Method MLA-075 (EPA Method 1694)
AXYS Method MLA-068 (EPA Method 1698)
1,7-Dimethylxanthine (p-Xanthine) Dehydronifedipine Ormetoprim 17a-Dihydroequilin
2-hydroxy-ibuprofen Demeclocycline Oxacillin 17alpha-Estradiol*
4-Ephianhydrotetracycline (EATC) Digoxigenin Oxolinic acid 17alpha-Ethinyl estradiol*
4-Epianhydrochlortetracycline (EACTC) Digoxin Oxycodone 17beta-Estradiol*
4-Epichlorotetracycline (ECTC) Diltiazem Oxytetracycline Androstenedione
4-Epioxytetracycline (EOTC) Diphenhydramine Penicillin G Androsterone
4-Epitetracycline (ETC) Doxycycline Penicillin V B-Estradiol-3-benzoate
Acetaminophen Enalapril Ranitidine beta-Sitosterol
Albuterol (Salbutamol) Enrofloxacin Roxithromycin beta-Stigmastanol
Amphetamine Erythromycin anhydrate Sarafloxacin Campesterol
Anhydrochlortetracycline (ACTC) Flumequine Sulfachloropyridazine Cholestanol
Anhydrotetracycline (ATC) Fluoxetine (Prozac) Sulfadiazine Cholesterol
Atenolol Furosemide Sulfadimethoxine Coprostanol
Atorvastatin Gemfibrozil Sulfamerazine Desmosterol
Azithromycin Glipizide Sulfamethazine Desogestrel
Bisphenol A Glyburide Sulfamethizole Epicoprostanol
Caffeine Hydrochlorothiazide Sulfamethoxazole Equilenin*
Carbadox Hydrocodone Sulfanilamide Equilin*
Carbamazepine Ibuprofen Sulfathiazole Ergosterol
Cefotaxime Isochlortetracycline
(ICTC) Tetracycline (TC) Estriol*
Chlortetracycline Lincomycin Thiabendazole Estrone*
Cimetidine Lomefloxacin Triamterene Mestranol*
Ciprofloxacin Metformin Triclocarbon Norethindrone*
Clarithromycin Miconazole Triclosan Norgestrel
Clinafloxacin Minocycline Trimethoprim Progesterone
Clonidine Naproxen Tylosin Stigmasterol
Cloxacillin Norfloxacin Virginiamycin Testosterone
Codeine Norgestimate Warfarin
Cotinine Ofloxacin
* These substances are included in EPA’s Contaminant Candidate List 3 published October 8, 2009.
1 This is the performance based implementation of EPA Method 1694 Pharmaceuticals and Personal Care Products in Water,
Soil, Sediment, and Biosolids by HPLC/MS/MS, December 2007. http://water.epa.gov/scitech/swguidance/methods/bioindicators/upload/2008_01_03_methods_method_1694.pdf 2 This is the performance based implementation of EPA Method 1698 Steroids and Hormones in Water, Soil, Sediment, and
Biosolids by HRGC/HRMS, December 2007 for Hormones and Steroids. http://water.epa.gov/scitech/swguidance/methods/bioindicators/upload/2008_01_03_methods_method_1698.pdf

Page 6 Albuquerque Bernalillo County Water Utility Authority Voluntary Occurrence Monitoring for PPCPs March 2011
Monitoring and Occurrence Results
This report includes summaries of the analytical results. The laboratory conducted analyses capable of detection at extremely low levels, reporting results in nanograms per liter (ng/L) or parts per trillion (ppt). The analytical methods are typically 1000 times more sensitive than those used for the organic substances regulated by EPA. To determine if substances or interferences are present in the laboratory environment, laboratory blanks are analyzed along with the samples. When the laboratory detected a substance in both the sample and in the associated laboratory blank, the Water Authority “blank corrected”3 the results. If the resulting difference was less than the detection level4 associated with the sample, the result is reported as undetected. Results were blank corrected only for AXYS Method MLA-068 results. No substances were detected in the laboratory blanks for AXYS Method MLA-075, thus blank correction was not necessary. Detection levels vary by substance and also monitoring location due to different interferences in a sample matrix. Summaries of blank corrected results and detection levels for substances detected by method, location and quarter are included in the Appendix to this report. Some PPCPs were detected in all sites. For the raw water pump station, filter influent and finished water, the number of occurrences and concentrations were generally very low (16%, 7% and 8% of the total analyzed, respectively). As expected, the number of detected PPCPs for the wastewater plant was significantly higher, 53% of the total analyzed in SWRP influent and 38% of the total analyzed in SWRP effluent. Table 3 provides a summary of the number of substances detected by location and quarter.
3 Blank correction: subtracting the concentration detected in the laboratory blank from the concentration detected in the sample.
4 Detection Level: the smallest amount of a substance that can be detected to a known level of certainty.
Location DatePharmaceuticals
(86 Substances)
Steroids and
Hormones
(27 Substances)
Total #
Detected
Percent
Detected
Average
Percent
Detected
Sep-09 8 9 17 15%
Dec-09 12 9 21 19%
Mar-10 12 8 20 18%
Jun-10 6 8 14 12%
Sep-09 2 3 5 4%
Dec-09 5 6 11 10%
Mar-10 3 3 6 5%
Jun-10 6 5 11 10%
Sep-09 0 13 13 12%
Dec-09 1 8 9 8%
Mar-10 6 5 11 10%
Jun-10 1 2 3 3%
Sep-09 44 21 65 58%
Dec-09 46 15 61 54%
Mar-10 47 11 58 51%
Jun-10 42 15 57 50%
Sep-09 35 11 46 41%
Dec-09 34 13 47 42%
Mar-10 34 8 42 37%
Jun-10 34 6 40 35%
Raw Water Pump
Station (RWPS)
Table 3. Number of Substances Detected after Blank Correction
Filter Influent (FI)
Finished Water
(WTPEP01)
SWRP Influent
(TP2.3)
SWRP Effluent
(TP2.7)
16%
7%
8%
53%
39%

Page 7 Albuquerque Bernalillo County Water Utility Authority Voluntary Occurrence Monitoring for PPCPs March 2011
The frequency of occurrence for the 113 substances at the five (5) monitoring locations is charted in Figures 2a through 2e. With four (4) quarterly samples, the frequency of occurrence for a substance would range between zero to four (4) times. For example, in the raw water pump station (Figure 2a), the majority of substances (83 out of 113) were not detected in any of the four (4) quarters of monitoring. Of the substances that were detected in the raw water pump station, 10 of them were detected only once, seven (7) were detected twice, four (4) were detected three (3) times and nine (9) were detected four (4) times. Figures 3a and 3b show the fluctuation in concentrations for six (6) selected substances at the five (5) monitoring locations over the monitoring period. Campesterol, Stigmasterol, Sulfamethoxazole and Testosterone are charted in Figure 3a and Beta-sitosterol and Cholesterol in Figure 3b. These are six (6) of the PPCPs with the highest concentrations detected in the finished water over the entire monitoring program. The trends indicate: low levels in the source water (raw water pump station), lower concentrations or no detection at the water treatment plant process locations (filter influent and finished water), significant increases in the SWRP influent and lower concentrations in the SWRP effluent. With the exception of the concentrations of Beta-sitosterol and Stigmasterol in the SWRP effluent in March 2010, the highest concentrations of these PPCPs are found in the SWRP influent, indicative of the contributions from the Albuquerque metropolitan area. The figures show the results in ng/L.

Page 8 Albuquerque Bernalillo County Water Utility Authority Voluntary Occurrence Monitoring for PPCPs March 2011

Page 9 Albuquerque Bernalillo County Water Utility Authority Voluntary Occurrence Monitoring for PPCPs March 2011

Page 10 Albuquerque Bernalillo County Water Utility Authority Voluntary Occurrence Monitoring for PPCPs March 2011
Conclusions
The vast majority of monitored PPCPs were not detected at the raw water pump station (where source water from the river is pumped to the surface water treatment plant) or the finished water following treatment at the surface water treatment plant. Although some PPCPs were detected in the finished water, the levels were very low and often close to the detection level specified for the substance and location. To provide a perspective, for several of the substances detected in the finished water, the Water Authority compared the greatest concentration detected for that substance to a commonly prescribed or recommended dose (Table 4a). A similar comparison was prepared for substances detected in the SWRP effluent (Table 4b). For example, Ibuprofen was detected in the finished water in March 2010 at a concentration of 50.8 ng/L. A common dose for Ibuprofen is 200 milligrams (mg). First, one must convert the concentration detected into mg/L and then divide the dose by that amount to calculate the number of liters it would take to match the dose.
In other words, a person would have to drink approximately 3,940,000 liters (1,041,000 gallons) of finished drinking water to ingest a 200 mg dose of Ibuprofen. This means that if one consumed two-liters of finished water per day, it would take more than 5,000 years to ingest a single dose of Ibuprofen. The concentration of detected PPCPs in the source water at the raw water pump station is very low. In contrast, the concentration of detected PPCPs detected in the SWRP influent is significantly higher, owing to contributions to the wastewater system by the local population. The water and wastewater treatment plant processes are very good at removing the PPCPs. This is consistent with the current understanding of treatment plant performance as discussed in American Water Works Association (AWWA) Research Foundation Report 91188 (Removal of EDCs and Pharmaceuticals in Drinking and Reuse Treatment Processes, AWWA). Next Steps The monitoring that was performed along with the substances that were detected and those undetected are presented in this report. This report is considered to be a living document with data and information provided to Water Authority customers as a means of communicating knowledge of the occurrence of PPCPs in the water and wastewater. The Water Authority will continue this monitoring program in 2011 and will publish the data on an annual basis on the Water Authority website (www.abcwua.org). In addition, the Water Authority will continue to review PPCP health effects research. Future steps will be identified as additional information on both occurrence and health effects become available.
One (1) gram is equivalent to a packet of sugar
One thousandth of a gram is a milligram (10-3
grams)
One thousandth of a milligram is a microgram (10-6
grams)
One thousandth of a microgram is a nanogram (10-9
grams)

Page 11 Albuquerque Bernalillo County Water Utility Authority Voluntary Occurrence Monitoring for PPCPs March 2011
Table 4a. Comparison of Substance Concentration in Finished Water to Commonly Prescribed Dose or Dietary Amount
Substance Classification Level
Detected (ng/L)
Commonly Prescribed
Dose or Dietary Amount
Volume of Water Needed to Consume to Meet Prescribed
Dose or Dietary Amount
Years of Consumption at Two (2) Liters
to Meet Prescribed Dose Liters Gallons
Ibuprofen Analgesic 50.8 200 mg 3,940,000 1,041,000 5,390
Testoterone Sex hormone 23.3 200 mg 8,580,000 2,270,000 11,800
Campesterol Plant sterol 23.9 33.7 mg/Tbsp Vegetable Oil
1,410,000 372,000 1,930
Stigmasterol Plant sterol 114 0.4 mg/Tbsp Vegetable Oil
3,510 927 5
Naproxen Non-steroidal anti-inflammatory drug
210 250 mg 1,190,000 314,000 1,630
2-Hydroxy-Ibuprofen
Metabolite of Ibuprofen
545 200 mg 367,000 97,000 503
Beta-Sitosterol Plant sterol 462 57.8 mg/Tbsp Vegetable Oil
125,000 33,000 171
Cholesterol Sterol 4060 200 mg 49,300 13,000 67
Table 4b. Comparison of Substance Concentration in SWRP Effluent to Commonly Prescribed Dose or Dietary Amount
Substance Classification Level Detected
(ng/L)
Commonly Prescribed Dose or Dietary
Amount
Volume of Effluent Equal to Prescribed
Dose or Dietary Amount
Liters Gallons
Caffeine Stimulant 323 150 mg/cup (1 cup/day)
464,000 123,000
Hydrochlorothiazide Blood pressure
medication 927 25 mg 27,000 7,120
Azithromycin Macrolide antibiotic 1030 250 mg 243,000 64,100
2-Hydroxy-Ibuprofen
Metabolite of Ibuprofen 1190 200 mg 168,000 44,400
Atenolol Blood pressure
medication 1310 25 mg 19,100 5,040
Cholesterol Sterol 3850 200 mg 51,900 13,700
Stigmasterol Plant sterol 4740 0.4 mg/Tbsp Vegetable Oil
84 22
Metformin Anti-diabetic drug 10300 500 mg 48,500 12,800
Beta-Sitosterol Plant sterol 17600 57.8 mg/Tbsp Vegetable Oil
3,280 868

Page 12 Albuquerque Bernalillo County Water Utility Authority Voluntary Occurrence Monitoring for PPCPs March 2011
APPENDIX
Blank Corrected Results for PPCPs Detected at WTP and SWRP Monitoring Locations
(Tables 5a through 5d)

Page 13 Albuquerque Bernalillo County Water Utility Authority Voluntary Occurrence Monitoring for PPCPs March 2011
Substance
Result DL Result DL Result DL Result DL Result DL Result DL Result DL Result DL Result DL Result DL Result DL Result DL Classification
2-hydroxy-ibuprofen U 83.7 U 88.3 U 86.7 U 88.2 U 99.9 363 88.4 224 (N) 81.6 336 104 U 76.7 414 367 545 (N) 250 128 88.2 Anti-inflammatory
Albuterol U 0.32 1.01 0.324 U 0.3 U 0.3 U 0.340 U 0.323 U 0.300 U 0.304 U 0.292 U 0.32 U 0.299 U 0.3 Antiasthmatic
Amphetamine 1.68 1.6 U 1.61 U 4.11 U 1.5 U 1.70 2.14 1.61 U 1.5 1.56 1.52 U 1.46 U 1.6 1.8 1.52 U 1.5 Stimulant
Atenolol 1.71 0.639 4.78 0.645 2.84 0.6 0.731 0.599 U 0.680 1.08 0.645 0.819 0.600 U 0.609 U 0.585 U 0.641 U 0.599 U 0.682 Antihypertensive
Bisphenol A U 2620 U 2760 U 2710 U 551 U 3120 U 2760 U 2550 11400 650 U 2400 U 11500 U 7800 U 547 Used to make plastics
Caffeine U 15.7 U 16.6 U 16.2 U 16.5 19.5 18.7 194 16.6 U 15.3 U 19.5 U 14.4 U 68.8 U 15.6 U 16.4 Stimulant
Carbamazepine 5.85 1.57 8.18 1.66 6.62 1.62 U 1.65 U 1.87 U 1.66 U 1.53 U 1.95 U 1.44 U 6.88 U 1.56 U 1.64 Anticonvulsant
Cimetidine U 0.32 1.08 0.489 1.11 0.6 U 0.599 U 0.340 U 0.323 U 0.600 U 0.609 NQ NQ U 0.326 NQ NQ U 0.682 Anti-acid reflux
Cotinine 5.99 1.6 2.61 1.61 9.98 1.5 3.75 1.5 4.78 1.7 2.84 1.61 5.86 1.50 1.55 1.52 U 1.46 U 1.6 27.2 1.5 U 1.7 Nicotine metabolite
Diltiazem U 0.314 0.833 0.331 0.677 0.325 U 0.331 U 0.375 U 0.332 U 0.306 U 0.390 U 0.288 U 1.38 U 0.312 U 0.328 Antihypertensive
Diphenhydramine U 0.628 U 0.663 U 0.65 U 0.661 U 0.749 U 0.663 U 0.612 1.65 0.781 U 0.684 U 2.75 U 0.624 U 0.657 Antihistamine
Erythromycin anhydrate 0.38 0.314 1.88 0.331 2.08 0.325 0.641 0.331 U 0.375 U 0.332 U 0.306 U 0.390 U 0.288 U 1.38 U 0.312 U 0.328 Macrolide antibiotic
Furosemide 148 74.6 U 67.8 U 43.3 U 45.7 U 49.9 U 57.7 U 61.1 U 64.5 U 67.7 U 183 U 125 NQ NQ Diuretic
Gemfibrozil U 1.57 1.97 1.66 14.5 1.62 U 1.65 U 1.87 U 1.66 U 1.53 U 1.95 U 1.44 U 6.87 13.7 4.68 U 1.64 Antilipemic
Ibuprofen U 15.7 U 16.6 U 16.2 U 16.5 U 18.7 U 16.6 U 15.3 U 19.5 U 14.4 U 68.7 50.8 46.8 U 16.4 Analgesic
Metformin NQ NQ U 32.3 U 30 52 8.64 U 110 U 32.3 U 30.0 33.2 10.1 U 104 U 32 U 29.9 U 11.7 Anti-diabetic drug
Naproxen U 3.14 5.04 3.31 U 3.25 U 3.31 U 3.75 U 3.33 U 3.06 U 3.9 U 2.88 U 13.7 210 9.36 NQ NQ Non-steroidal anti-inflammatory drug
Oxycodone 0.997 0.639 U 0.882 2.68 0.6 U 1.61 U 0.680 U 1.33 U 0.600 U 0.609 U 0.585 U 0.988 U 0.599 U 0.682 Narcotic pain reliever
Ranitidine U 0.709 1.92 0.829 1.44 0.6 U 0.599 U 0.704 U 0.803 U 0.600 U 0.609 U 0.664 U 0.701 U 0.599 U 0.682 Anti-acid reflux
Sulfamethoxazole 14.7 0.937 20.2 0.663 17.3 0.65 4.98 2.01 U 0.749 U 0.663 U 0.612 U 0.781 U 0.575 U 2.75 U 0.624 U 1.86 Sulfonamide antibiotic
Triamterene U 0.32 3.1 0.323 2.85 0.3 1.29 0.38 U 0.340 U 0.323 U 0.300 U 0.304 U 0.292 U 0.32 U 0.299 U 0.341 Diuretic
Trimethoprim U 1.57 U 1.66 2.97 1.62 U 1.65 U 1.87 U 1.66 U 1.53 U 1.95 U 1.44 U 6.88 U 1.56 U 1.64 Pyrimidine antibiotic
Table 5a: Blank Corrected Results for AXYS Method MLA-075 (EPA Method 1694) Detected Substances at WTP Monitoring Locations (ng/L)
Dec-09 Mar-10 Jun-10 Sep-09
RWPS FI WTPEP01
Sep-09 Dec-09 Mar-10 Jun-10 Sep-09 Dec-09 Mar-10 Jun-10
U = Not Detected
NQ = Not Quantifiable
N = Percent Recovery was slightly above nominal method upper control limit
DL = Detection Level
K = Peak detected but did not meet quantification criteria, result reported represents the estimated maximum possible concentration

Page 14 Albuquerque Bernalillo County Water Utility Authority Voluntary Occurrence Monitoring for PPCPs March 2011
Substance
Result DL Result DL Result DL Result DL Result DL Result DL Result DL Result DL Result DL Result DL Result DL Result DL Result DL Result DL Classification
17 alpha-Ethinyl-Estradiol U 1.28 U 1.20 U 0.708 1.52 (K) 0.367 U 0.719 U 0.977 U 0.563 1.49 (K) 0.69 2.27 (K) 0.889 U 2.56 U 1.77 U 1.26 U 2.36 U 1.96 Ovulation inhibitor
17 beta-Estradiol U 0.831 U 0.463 U 0.350 0.692 (K) 0.412 U 0.476 U 0.336 U 0.434 0.767 (K) 0.263 0.827 (K) 0.735 U 1.61 U 1.14 1.31 (K) 0.557 U 1.69 U 1.20 Sex Hormone
Androstenedione U 24.0 U 14.2 9.04 (K) 6.43 U 9.41 U 14.4 U 14.5 U 12.9 U 5.64 U 12.0 U 10.6 U 7.12 U 10.0 U 10.9 U 15.8 Anabolic agent
Androsterone U 0.132 U 0.0934 U 0.447 U 0.129 U 0.154 U 0.115 U 0.265 U 0.089 0.167 (K) 0.0983 U 0.104 U 0.0956 U 0.127 U 0.150 U 0.145 Hormone metabolite
beta-Sitosterol 316 3.30 186 0.904 5280 0.897 172 2.47 97.4 1.77 223 1.46 201 0.807 86 2.12 232 3.54 140 4.39 462 0.736 U 2.60 9.00 3.65 88.0 0.89 Plant sterol
beta-Stigmastanol 27.7 5.95 3.61 0.987 34.7 0.674 4.00 2.21 U 3.92 3.76 1.33 1.09 0.599 U 2.07 22.4 2.63 11.3 (K) 5.16 4.49 0.684 U 2.66 U 4.28 3.35 (K) 0.983 Plant sterol
Campesterol 42.5 6.27 6.30 2.07 61.0 3.44 6.40 3.27 U 3.52 3.62 2.63 U 3.66 U 2.81 23.9 4.94 U 14.2 U 3.72 U 3.58 U 14.2 U 6.48 Plant sterol
Cholestanol 13.5 2.48 3.62 0.717 10.8 1.96 5.71 2.06 U 1.37 U 0.705 U 1.37 U 1.49 79.8 2.04 2.67 1.99 1.14 0.57 U 2.39 U 1.13 U 1.72 Sterol
Cholesterol 206 9.35 U 3.27 U 3.97 29.5 3.97 U 4.02 U 3.54 U 4.34 U 3.24 4060 8.18 U 19.1 U 4.41 U 4.84 81.0 15.5 U 6.87 Sterol
Coprostanol 10.6 (K) 6.31 4.45 1.34 5.13 2.43 U 2.44 U 2.47 2.31 2.06 U 2.45 U 2.06 17.2 5.56 U 17.0 U 2.43 U 3.08 U 11.5 8.60 6.32 Sterol
Desmosterol 40.1 (K) 12.9 7.79 3.83 13.6 6.27 U 10.4 U 4.86 U 4.46 U 5.29 U 7.26 22.8 8.60 U 22.6 U 5.02 U 11.3 U 20.8 U 11.5 Sterol
Desogestrel U 0.872 1.34 0.542 U 0.483 U 0.532 U 0.445 0.806 0.469 U 0.456 U 0.377 U 0.458 U 0.419 U 0.443 U 0.372 U 0.508 0.972 0.669 Ovulation inhibitor
Epicoprostanol U 6.99 U 1.5 U 2.7 U 2.59 U 2.74 U 2.30 U 2.72 U 2.18 U 6.11 U 19.1 U 2.70 U 3.26 U 13.0 8.74 (K) 7.11 Sterol
Equilin U 2.56 U 2.55 U 1.38 U 1.69 U 1.62 U 1.80 U 1.74 U 1.03 4.90 (K) 2.57 U 6.43 U 4.92 U 2.55 U 5.53 U 4.46 Hormone replacement
Ergosterol 53.5 6.63 3.32 1.55 U 3.41 U 3.85 U 3.80 U 1.43 U 4.31 U 4.03 U 4.04 U 7.18 U 2.53 U 5.20 U 6.52 U 3.11 Sterol
Estriol U 2.35 U 2.19 U 1.12 U 1.92 U 1.72 U 2.03 U 0.866 U 1.48 U 0.543 U 1.03 0.425 (K) 0.18 U 1.03 U 1.31 U 1.93 Sex Hormone
Stigmasterol 174 (N) 4.09 28.5 2.00 1150 (N) 1.19 57.0 3.93 31.4 (N) 1.46 44.9 2.01 51.8 (N) 0.971 28.0 3.31 50.9 4.82 U 5.78 114 (N) 1.30 U 3.37 U 5.34 23.6 1.30 Plant sterol
Testosterone U 11.8 U 5.01 U 3.55 U 7.04 6.29 (K) 5.16 U 5.09 U 3.96 8.29 4.66 14.4 5.03 U 5.22 U 3.86 23.3 10.7 U 4.19 U 11.9 Sex Hormone
K = Peak detected but did not meet quantification criteria, result reported represents the estimated maximum possible concentration
N = Percent Recovery was slightly above nominal method upper control limit
NQ = Not Quantifiable
U = Not Detected.
Sep-09 Dec-09 Mar-10 Jun-10
DL = Detection Level
* Analysis for the sample collected in December 2009 at WTPEP01 was repeated in triplicate due to the complex nature of the matrix. The results reported above as WTPEP01 Dup1 and WTPEP01 Dup 2.
W T P E P 01
Dup01*
W T P E P 01
Dup02*
Table 5b: Blank Corrected Results for AXYS Method MLA-068 (EPA Method 1698) Detected Substances at WTP Monitoring Locations (ng/L)
Jun-10
WTPEP01RWPS
Sep-09 Dec-09 Mar-10 Sep-09
FI
Dec-09 Mar-10Jun-10 Dec-09 Dec-09

Page 15 Albuquerque Bernalillo County Water Utility Authority Voluntary Occurrence Monitoring for PPCPs March 2011
Substance
Result DL Result DL Result DL Result DL Result DL Result DL Result DL Result DL Classification
1,7-Dimethylxanthine (p-Xanthine) 26100 942 30900 1590 42000 1870 40500 543 U 169 U 172 832 450 204 122 Antispasmodic, caffeine metabolite
2-Hydroxy-ibuprofen 85600 (N) 947 67200 5730 88600 (N) 244 24800 139 U 89.9 U 91.6 1190 (N) 240 U 162 Anti-inflammatory
4-Epianhydrotetracycline (EATC) 74.1 62.8 250 238 U 70.3 U 25.9 86.4 26.3 130 55.9 U 61.1 U 30.4 Chlorotetracycline degradate
4-Epioxytetracycline (EOTC) U 23.7 U 33.6 U 18.2 U 10.4 U 8.36 U 13.8 U 18.0 U 12.2 Oxytetracycline degradate
4-Epitetracycline [ETC] 24.3 23.7 U 22.6 10.2 7.83 U 13.8 U 7.16 U 7.49 U 18 U 12.2 Tetracycline degradate
Acetaminophen 149000 3400 202000 2090 209000 2650 114000 250 U 67.4 U 68.7 U 180 U 30.4 Antipyretic, Analgesic
Albuterol 20.0 1.18 18.2 2.13 28.2 0.332 11.3 0.585 10.9 0.326 8.64 0.356 18.9 1.19 11.7 0.605 Antiasthmatic
Amphetamine 672 5.88 609 14.5 1650 6.76 812 10.1 33.6 1.63 23.7 2.15 22.7 5.96 23.7 3.03 Stimulant
Atenolol 1590 2.35 1990 11.6 2050 3.09 1960 3.21 752 0.651 688 1.56 1310 2.40 819 2.37 Antihypertensive
Atorvastatin 65.2 34.2 65.0 19.7 17.4 15.0 41.2 2.93 U 9.64 U 6.36 U 59.6 U 3.03 Lowers blood cholesterol
Azithromycin 744 5.92 268 5.64 289 4.29 179 8.74 713 1.69 1030 1.72 181 4.50 353 9.27 Macrolide Antibiotic
Bisphenol A U 29600 U 9410 U 7620 1640 863 U 2810 U 2860 U 7510 U 1010 Used to make plastics
Caffeine 70300 59.2 90300 56.4 105000 210 73100 25.9 U 16.9 18.3 17.2 323 45.0 U 30.4 Stimulant
Carbamazepine 955 5.92 768 5.64 731 1.52 903 2.59 709 1.69 635 1.72 646 4.50 620 3.04 Anticonvulsant
Cimetidine 579 1.18 546 1.07 582 0.880 550 8.91 3.13 0.326 0.533 0.356 U 2.39 U 1.21 Anti-acid reflux
Ciprofloxacin 292 23.7 475 22.6 262 36.1 174 (N) 14.6 103 8.19 89.5 8.50 145 18.0 41.5 (N) 23.3 Quinoline antibiotic
Clarithromycin 140 5.92 25.2 5.64 574 1.52 U 2.59 45.9 1.69 90.6 1.72 324 4.50 36.0 3.04 Macrolide antibiotic
Codeine 282 11.8 237 45.8 265 3.00 250 5.85 U 48.1 U 31.1 69.0 11.9 13.2 6.05 Opiate
Cotinine 2890 5.88 2590 37 3090 1.50 3570 2.93 70.0 1.75 25.3 1.78 28.8 5.96 28.8 5.33 Nicotine metabolite
Dehydronifedipine 5.67 2.45 10.6 2.26 3.37 0.610 6.41 1.6 3.11 0.674 4.40 0.687 5.71 1.80 8.64 1.22 Nifedipine metabolite
DL = Detection Level
Table 5c. Blank Corrected Results for
AXYS Method MLA-075 (EPA Method 1694) Detected Substances at SWRP Monitoring Locations (ng/L)
Jun-10Mar-10Dec-09Sep-09Sep-09 Dec-09 Mar-10 Jun-10
TP2.3 TP2.7
K = Peak detected but did not meet quantification criteria, result reported represents the estimated maximum possible concentration
N = Percent Recovery was slightly above nominal method upper control limit
NQ = Not Quantifiable
U = Not Detected

Page 16 Albuquerque Bernalillo County Water Utility Authority Voluntary Occurrence Monitoring for PPCPs March 2011
Substance
Result DL Result DL Result DL Result DL Result DL Result DL Result DL Result DL Classification
Digoxin U 59.2 U 56.4 U 15.2 36.6 17.1 U 16.9 U 17.2 U 45.0 U 12.2 Cardiac glycoside
Diltiazem 310 1.30 325 3.07 394 0.746 449 1.92 57.4 0.337 34.7 0.344 123 0.901 54.8 0.609 Antihypertensive
Diphenhydramine 267 2.37 1250 4.87 549 0.610 888 1.04 264 0.803 463 0.687 376 1.80 72.4 1.22 Antihistamine
Doxycycline 39.7 23.7 73.8 23.2 27.1 15.0 U 10.4 U 6.74 U 11.1 27.4 20.7 U 12.5 Tetracycline antibiotic
Enalapril 16.5 1.18 18.1 1.47 172 0.300 17.1 0.585 U 0.430 U 0.405 U 1.19 U 0.605 Treats hypertension
Erythromycin anhydrate 311 1.18 363 5.72 298 0.305 252 0.518 239 0.337 270 0.344 226 0.901 191 0.609 Macrolide antibiotic
Fluoxetine 9.52 5.92 38.4 5.64 20.2 2.84 18.4 2.59 26.4 1.69 28.8 1.72 38.6 4.50 29.6 3.04 SSRI Antidepressant
Furosemide 725 166 1070 464 1540 129 1640 87.1 259 134 508 183 838 146 441 125 Diuretic
Gemfibrozil 4060 17.7 4810 9.28 5890 11.8 24.1 8.38 94.2 1.69 27.5 1.72 590 4.50 110 3.04 Antilipemic
Glipizide U 71 25.8 22.6 42.9 18.3 25.5 10.4 11.8 6.74 U 6.87 U 18.0 U 12.2 Glucose control
Glyburide U 35.5 30.0 11.3 29.6 9.15 446 5.18 17.2 3.37 18.9 3.44 9.49 9.01 19.4 6.09 Glucose control
Hydrochlorothiazide 1240 237 904 75.2 756 61.0 80100 34.5 667 22.5 708 22.9 927 60.1 393 40.6 diuretic
Hydrocodone U 66 110 10.6 78.2 2.15 112 2.93 85.2 1.63 76.2 1.78 65.2 5.96 67.8 3.03 Narcotic pain reliever
Ibuprofen 35300 177 23600 84.1 31900 46.4 12400 84 48.7 16.9 38.6 17.2 194 45.0 78.8 30.4 Analgesic
Lincomycin 51.3 27.6 41.2 26.4 57.3 14.6 21.1 9.46 U 7.87 U 8.02 U 21.0 7.21 6.09 Lincosamide antibiotic
Metformin 62300 741 166000 722 NQ NQ 85900 543 9800 646 10300 787 5080 235 3740 34.2 Anti-diabetic drug
Miconazole 27.6 6.35 44.5 5.64 9.11 3.94 U 8.87 1.78 1.69 U 1.72 U 4.50 U 3.04 Antifungal agent
Naproxen 19000 35.5 13600 15 15200 9.15 194 5.18 284 7.51 67.6 3.62 198 10.7 91.1 6.09 Non-steroidal anti-inflammatory drug
Ofloxacin U 59.2 U 56.4 23.1 15.2 6.11 (N) 2.59 U 16.9 U 17.2 U 45.0 4.60 (N) 3.04 Quinoline antibiotic
Oxycodone 204 3.64 174 2.13 222 1.92 296 1.17 147 0.651 104 14.9 157 4.61 160 15.5 Narcotic pain reliever
TP2.3 TP2.7
Sep-09 Dec-09 Mar-10 Jun-10 Sep-09 Dec-09 Mar-10 Jun-10
Table 5c. Blank Corrected Results for
AXYS Method MLA-075 (EPA Method 1694) Detected Substances at SWRP Monitoring Locations (ng/L) (continued)
DL = Detection Level
K = Peak detected but did not meet quantification criteria, result reported represents the estimated maximum possible concentration
N = Percent Recovery was slightly above nominal method upper control limit
NQ = Not Quantifiable
U = Not Detected

Page 17 Albuquerque Bernalillo County Water Utility Authority Voluntary Occurrence Monitoring for PPCPs March 2011
Substance
Result DL Result DL Result DL Result DL Result DL Result DL Result DL Result DL Classification
Penicillin G U 4.73 U 4.51 U 1.22 U 6.17 1.79 1.35 U 1.37 U 3.60 U 6.09 β-lactam antibiotics
Penicillin V 40.8 11.8 U 11.3 68.1 13.5 U 13.9 U 3.37 U 3.44 U 30.0 U 6.09 β-lactam antibiotics
Ranitidine 1620 8.78 2700 7.16 792 5.53 871 5.32 16.0 1.01 4.94 1.08 25.8 2.47 5.68 1.21 Anti-acid reflux
Sulfadiazine 30.0 5.92 43.3 5.64 106 2.61 U 2.59 8.75 1.69 17.2 1.72 10.1 4.50 U 3.04 Sulfonamide antibiotic
Sulfadimethoxine U 1.18 U 1.13 U 7.34 26.4 1.85 U 0.337 U 0.344 U 0.901 U 0.629 Sulfonamide antibiotic
Sulfamerazine 11.1 5.06 U 3.15 U 3.82 U 1.04 U 0.900 U 1.47 U 5.33 U 1.22 Sulfonamide antibiotic
Sulfamethazine U 2.37 10.3 9.29 U 19 U 1.85 U 0.674 3.44 2.69 U 1.8 7.63 2.93 Sulfonamide antibiotic
Sulfamethizole U 4.18 U 4.06 7.11 5.50 U 6.46 U 0.674 U 1.04 U 5.01 U 6.33 Sulfonamide antibiotic
Sulfamethoxazole 2170 5.29 1890 9.55 2050 13.4 2070 5.25 607 1.26 475 0.687 585 7.02 829 3.42 Sulfonamide antibiotic
Sulfanilamide U 59.2 U 56.4 U 15.2 U 25.9 27.7 16.9 30.7 17.2 U 45.0 71.4 30.4 Sulfonamide antibiotic
Tetracycline (TC) 55.6 23.7 46.6 22.6 13.8 6.46 U 13.6 U 6.74 U 7.35 U 18.0 U 12.2 Tetracycline antibiotic
Thiabendazole 14.1 5.92 29.2 5.64 24.5 1.63 19.0 5.52 14.1 1.69 23.0 1.72 21.1 4.50 21.7 3.04 Fungicide and parasiticide
Triamterene 172 1.79 512 7.19 401 0.644 264 1.07 223 0.326 357 0.427 371 1.19 302 0.605 Diuretic
Triclocarbon 741 35.5 1080 11.3 202 9.15 1740 7.67 19.1 3.37 34.6 3.44 28.4 9.01 89.8 6.09 Antimicrobial, disinfectant
Triclosan 2430 710 3910 226 1630 183 6.42 2.76 U 67.4 U 68.7 U 180 U 122 Antimicrobial, disinfectant
Trimethoprim 470 31.1 623 10.3 579 4.31 601 4.27 38.7 5.80 26.2 3.09 364 4.50 109 3.04 Pyrimidine antibiotic
Virginiamycin U 127 1050 441 U 21.1 U 32.1 U 37.2 U 68.4 U 12.1 U 6.09 Macrolide antibiotic
Warfarin U 17.7 U 5.64 4.99 4.57 U 2.59 U 1.69 U 1.72 U 4.50 U 3.04 Anticoagulant
U = Not Detected
NQ = Not Quantifiable
N = Percent Recovery was slightly above nominal method upper control limit
K = Peak detected but did not meet quantification criteria, result reported represents the estimated maximum possible concentration
DL = Detection Level
Table 5c. Blank Corrected Results for
AXYS Method MLA-075 (EPA Method 1694) Detected Substances at SWRP Monitoring Locations (ng/L) (continued)TP2.3 TP2.7
Sep-09 Dec-09 Mar-10 Jun-10 Sep-09 Dec-09 Mar-10 Jun-10

Page 18 Albuquerque Bernalillo County Water Utility Authority Voluntary Occurrence Monitoring for PPCPs March 2011
Substance
Result DL Result DL Result DL Result DL Result DL Result DL Result DL Result DL Classification
17a-Dihydroequilin U 6.76 U 42.9 U 28.1 U 13.7 U 5.23 48.9 17.0 U 8.24 U 5.14 Sterol
17 alpha-Estradiol U 11.0 34.1 24.4 149 60.9 40 15.0 U 1.31 U 2.44 U 2.69 U 1.44 Sex Hormone
17 alpha-Ethinyl-
Estradiol 10.7 (K) 5.68 U 14.9 U 8.74 U 7.28 U 1.31 U 3.94 U 2.11 U 0.776Ovulation inhibitor
17 beta-Estradiol 12.5 (K) 8.93 37.7 (K) 19.2 U 47.9 U 11.7 U 1.15 U 2.09 U 2.12 U 1.04 Sex Hormone
Androstenedione 236 108 U 435 U 593 U 73.7 U 20.6 U 49.2 U 39.6 U 18.3 Hormone metabolite
Androsterone 1450 0.765 1530 14.9 NQ NQ 677 3.67 U 0.325 U 0.589 U 0.436 U 0.336 Hormone metabolite
beta-Sitosterol 9270 23.5 3350 1990 9570 10.5 4950 13.0 861 2.68 169 1.91 17600 67.5 5050 41.9 Plant sterol
beta-Stigmastanol 948 13.8 133 124 1450 15.9 610 50.4 173 7.92 15.1 1.38 260 60.0 U 70.2 Plant sterol
Campesterol 4240 (K) 59.6 836 50.6 2480 11.9 1360 114 198 5.70 18.1 2.19 426 112 U 109 Plant sterol
Cholestanol 2310 18.7 451 49.7 1780 12.7 911 95.7 415 2.49 36.2 0.884 101 (K) 18.5 U 83.7 Sterol
Cholesterol 101000 86.7 18100 1990 36900 43.2 28500 122 3850 10.2 331 4.03 371 124 280 129 Sterol
Coprostanol 63500 51.6 1180 124 28600 20.1 17900 61.4 3820 6.48 236 2.10 178 (K) 73.1 168 (K) 40.2 Sterol
Desmosterol 583 (K) 279 U 353 1450 334 U 591 73.9 (K) 13.2 22.8 6.55 U 355 U 361 Sterol
Desogestrel U 1.56 U 14.9 U 87.3 66.8 (K) 8.58 U 2.81 4.29 2.32 U 2.77 U 4.11 Ovulation inhibitor
Epicoprostanol 3890 48.8 U 124 359 17.0 334 65.1 140 7.19 10.3 2.35 U 84.8 U 42.6 Sterol
Equilenin 15.92 10.6 U 36.3 U NQ U 23.0 U 2.69 U 7.53 U 12.6 U 3.39 Hormone replacement
Ergosterol U 84.6 U 124 183 10.8 U 165 283 10.8 33.1 3.10 U 163 U 186 Sterol
Estriol 737 17.6 359 64.2 NQ NQ 145 10.7 U 2.85 U 7.80 U 2.72 U 2.55 Sex Hormone
Estrone 70.8 (K) 29.1 153 (K) 116 U 159 U 87.3 8.30 (K) 5.08 U 12.3 26.6 7.89 7.15 (K) 3.45 Sex Hormone
Mestranol 18.3 16.6 U 25.9 NQ NQ U 29.8 U 2.63 16.6 14.1 U 8.03 U 3.93 Ovulation inhibitor
Norethindrone 2960 (K) 1020 U 265 NQ NQ 956 (K) 147 U 4.13 U 13.5 U 12.9 48.2 22.2 Ovulation inhibitor
Norgestrel 2065 (K) 204 408 390 U 44.1 U 73.1 U 11.0 U 28.6 U 13.4 U 13.8 Ovulation inhibitor
Progesterone 348 (K) 167 852 (K) 473 U 134 56.3 (K) 52.0 U 12.6 U 38.1 U 16.8 U 7.71 Sex Hormone
Stigmasterol 2170 53.0 974 49.7 2270 (N) 3.87 1150 50.1 306 (N) 5.22 56.6 2.75 4740 101 270 121 Plant sterol
Testosterone 1370 125 1080 224 NQ NQ 2230 233 U 13.0 U 28.9 U 22.0 U 20.5 Sex Hormone
U = Not Detected
NQ = Not Quantifiable
N = Percent Recovery was slightly above nominal method upper control limit
K = Peak detected but did not meet quantification criteria, result reported represents the estimated maximum possible concentration
DL = Detection Level
Table 5d. Blank Corrected Results for
AXYS Method MLA-068 (EPA Method 1698) Detected Analytes at SWRP Monitoring Locations (ng/L)
Mar-10 Jun-10
TP2.3 TP2.7
Sep-09 Dec-09 Mar-10 Jun-10 Sep-09 Dec-09
Related Documents