NSW Environmental Impact Statement Balranald Mineral Sands Project Prepared for Iluka Resources Limited May 2015 5 Volume Appendix H - Surface Water Management Report Appendix I - Balranald Mineral Sands Project Groundwater Assessment Appendix J - Groundwater Dependant Ecosystems Assessment Report

Welcome message from author
This document is posted to help you gain knowledge. Please leave a comment to let me know what you think about it! Share it to your friends and learn new things together.
Transcript

NSW Environmental Impact Statement
Balranald Mineral Sands Project
Prepared for Iluka Resources LimitedMay 2015
5Volume
Appendix H - Surface Water Management ReportAppendix I - Balranald Mineral Sands Project Groundwater AssessmentAppendix J - Groundwater Dependant Ecosystems Assessment Report

www.emgamm.com www.iluka.com
Volume 1Table of contentsPart A Introduction, site and context, regulatory framework and consultationPart B Environmental impact assessmentPart C Commitments and justificationReferencesAcronyms and abbreviations
Volume 2Appendix A Secretary's Environmental Impact Assessment RequirementsAppendix B Study TeamAppendix C Agricultural Impact StatementAppendix D Noise AssessmentAppendix E Air Quality and Greenhouse Gas Assessment
Volume 3Appendix F Biodiversity Assessment
Volume 4Appendix G Aboriginal Cultural Heritage Assessment
Volume 5Appendix H Surface Water Management ReportAppendix I Balranald Mineral Sands Project Groundwater AssessmentAppendix J Groundwater Dependant Ecosystems Assessment Report
Volume 6Appendix K Water AssessmentAppendix L Soil Resource Assessment
Volume 7Appendix M Rehabilitation and Closure StrategyAppendix N Transport AssessmentAppendix O Social Assessment
Volume 8Appendix P Economic AssessmentAppendix Q Geochemistry AssessmentAppendix R Non-Aboriginal Cultural Heritage AssessmentAppendix S Radiation Risk Assessment

Surface Water Management Report
Appendix H

www.emgamm.com www.iluka.com
Balranald Mineral Sands Project
Surface Water Management Report
Iluka Resources Limited
1083-01-C3, 31 March 2015 Iluka Trim Reference: 1639471

wrmwater.com.au 1083-01-C3| 31 March 2015 | Page 2
Report Title Balranald Mineral Sands Project Surface Water Management Report
Client Iluka Resources Limited
Report Number 1083-01-C3
Revision Number Report Date Report Author Reviewer
DRAFT 27 November 2014 RAC GKR
1 6 February 2015 RAC GKR
2 6 March 2015 RAC GKR
3 31 March 2015 RAC GKR
For and on behalf of WRM Water & Environment Pty Ltd Level 9, 135 Wickham Tce, Spring Hill PO Box 10703 Brisbane Adelaide St Qld 4000 Tel 07 3225 0200
Greg Roads Principal Engineer / Director
NOTE: This report has been prepared on the assumption that all information, data and reports provided to
us by our client, on behalf of our client, or by third parties (e.g. government agencies) is complete and
accurate and on the basis that such other assumptions we have identified (whether or not those
assumptions have been identified in this advice) are correct. You must inform us if any of the assumptions
are not complete or accurate. We retain ownership of all copyright in this report. Except where you obtain
our prior written consent, this report may only be used by our client for the purpose for which it has been
provided by us.
wrmwater.com.au 1083-01-C3| 31 March 2015 | Page 3
Contents
1 Introduction __________________________________________________ 10
1.1 Overview _______________________________________________________ 10
1.2 Approval process ________________________________________________ 10
1.3 Secretary’s environmental assessment requirements __________________ 12
1.4 Purpose of this report and regulatory framework _____________________ 12
2 Existing surface water environment _______________________________ 14
2.1 Regional drainage _______________________________________________ 14
2.1.1 Box Creek catchment ______________________________________ 14
2.1.2 Lachlan River and distributaries _____________________________ 14
2.1.3 Murrumbidgee River ________________________________________ 14
2.2 Local drainage and topography ____________________________________ 16
2.3 Rainfall and evaporation _________________________________________ 19
2.4 Streamflows ____________________________________________________ 21
2.4.1 Anecdotal water level and flooding observation ________________ 21
2.4.2 Continuous water level and flow monitoring ___________________ 21
2.5 Water Quality ___________________________________________________ 26
2.5.1 Background water quality data ______________________________ 26
2.5.2 Water quality objectives ____________________________________ 26
3 Project description ____________________________________________ 28
3.1 Project schedule ________________________________________________ 28
3.2 Project area ____________________________________________________ 28
3.2.1 West Balranald and Nepean mines ____________________________ 29
3.2.2 Mining unit plant (MUP) _____________________________________ 29
3.2.3 Injection borefields ________________________________________ 29
3.2.4 Access roads ______________________________________________ 30
3.2.5 Accommodation facility ____________________________________ 30
3.2.6 Water supply pipeline ______________________________________ 30
3.2.7 Gravel extraction __________________________________________ 30
3.3 Contaminant source study and proposed water management strategy ___ 36
3.3.1 Sources of contaminants ____________________________________ 36
3.3.2 Proposed water management strategy ________________________ 36
3.3.3 Raw water supply, potable water supply and sewage treatment and disposal __________________________________________________ 37
3.4 Proposed water management system and infrastructure _______________ 39
3.4.1 Overview _________________________________________________ 39
3.4.2 Year 1 ___________________________________________________ 39
3.4.3 Year 4 ___________________________________________________ 41
3.4.4 Year 8 ___________________________________________________ 43

wrmwater.com.au 1083-01-C3| 31 March 2015 | Page 4
3.4.5 Final landform ____________________________________________ 46
4 Mine water balance ____________________________________________ 49
4.1 Overview _______________________________________________________ 49
4.2 Climate data ____________________________________________________ 50
4.3 Methodology ____________________________________________________ 50
4.3.1 Mine operations ___________________________________________ 50
4.3.2 Final void water and salt balance ____________________________ 51
4.4 Water balance model schematic ___________________________________ 51
4.4.1 Year 1, 4 and 8 ____________________________________________ 51
4.4.2 Final void salt and water balance ____________________________ 52
4.5 Storage capacities _______________________________________________ 53
4.6 Water demands _________________________________________________ 53
4.7 Water sources __________________________________________________ 53
4.7.1 Catchment runoff __________________________________________ 53
4.7.2 Groundwater inflows _______________________________________ 54
4.7.3 Dewatering bores __________________________________________ 54
4.8 Pump capacities and transfer rules _________________________________ 55
4.9 Water balance model results ______________________________________ 56
4.9.1 Year 1 ___________________________________________________ 56
4.9.2 Year 4 ___________________________________________________ 58
4.9.3 Year 8 ___________________________________________________ 60
4.9.4 Final void water and salt balance ____________________________ 61
4.10 Water balance model results summary ______________________________ 62
4.10.1 Year 1, 4 and 8 ____________________________________________ 62
4.10.2 Final void _________________________________________________ 63
4.11 Water balance model sensitivity ___________________________________ 63
5 Box Creek flood assessment ______________________________________ 65
5.1 overview _______________________________________________________ 65
5.2 Available data __________________________________________________ 65
5.2.1 Topographic data __________________________________________ 65
5.2.2 Daily rainfall data _________________________________________ 65
5.3 Estimation of discharges __________________________________________ 65
5.3.1 Overview _________________________________________________ 65
5.3.2 Local catchment rainfall ____________________________________ 65
5.3.3 Merrowie and Middle creeks _________________________________ 66
5.3.4 Adopted design discharge for hydraulic modelling ______________ 67
5.4 Estimation of flood levels and extents ______________________________ 67
5.4.1 TUFLOW model configuration ________________________________ 67
5.4.2 Model results______________________________________________ 68

wrmwater.com.au 1083-01-C3| 31 March 2015 | Page 5
6 Impact assessment _____________________________________________ 73
6.1 Potential impacts _______________________________________________ 73
6.2 Regional water availability impacts ________________________________ 73
6.2.1 Raw and potable water demands _____________________________ 73
6.2.2 Saline and mine affected water demands _____________________ 73
6.3 Surface water quality impacts _____________________________________ 73
6.4 Loss of catchment area and streamflows ____________________________ 74
6.5 Impacts on flooding ______________________________________________ 74
7 Proposed mitigation and management measures _____________________ 75
7.1 Overview _______________________________________________________ 75
7.2 Mine water management system ___________________________________ 75
7.3 Sediment and erosion control plan _________________________________ 76
7.4 Surface water monitoring program _________________________________ 76
8 Summary of findings ___________________________________________ 77
9 References ___________________________________________________ 79

wrmwater.com.au 1083-01-C3| 31 March 2015 | Page 6
List of Figures
Figure 1.1 - Balranald Mineral Sands Project Locality Map ___________________________ 11
Figure 2.1 – Regional drainage setting ____________________________________________ 15
Figure 2.2 – Photograph of Box Creek downstream of Tin Tin Lake ____________________ 16
Figure 2.3 – Local drainage features and topography ________________________________ 17
Figure 2.4 – Photograph looking west across Tin Tin Lake ____________________________ 18
Figure 2.5 – Photograph of Box Creek culverts at Balranald Ivanhoe Road ______________ 18
Figure 2.6 – Distribution of monthly rainfall and pan evaporation at Balranald __________ 20
Figure 2.7 – Lachlan River and distributary stream gauges at Hillston __________________ 23
Figure 2.8 – Lachlan River and distributary discharge hydrographs, 1956 flood event ____ 24
Figure 2.9 – Lachlan River and distributary discharge hydrographs, 1974 flood event ____ 24
Figure 2.10 – Lachlan River and distributary discharge hydrographs, 1990 flood event ___ 25
Figure 2.11 – Lachlan River and distributary discharge hydrographs, 2010/2011 flood event ______________________________________________________________ 25
Figure 3.1 – Project area – West Balranald access road, water supply pipeline and gravel extraction area (Source: EMM) ___________________________________ 31
Figure 3.2 – Project area – West Balranald mine and gravel extraction areas (Source: EMM) ______________________________________________________________ 32
Figure 3.3 – Project area – Injection borefield (Source: EMM) _________________________ 33
Figure 3.4 – Project area – Nepean access road (Source: EMM) ________________________ 34
Figure 3.5 – Project area – Nepean mine (Source: EMM) _____________________________ 35
Figure 3.6 – Balranald Mineral Sands Project conceptual water management system schematic __________________________________________________________ 38
Figure 3.7 – Year 1 Project layout and surface water management infrastructure _______ 40
Figure 3.8 – Year 4 Project layout and surface water management infrastructure _______ 42
Figure 3.9 – Year 8 Project layout and surface water management infrastructure, West Balranald mine _________________________________________________ 44
Figure 3.10 – Year 8 Project layout and surface water management infrastructure, Nepean mine _______________________________________________________ 45
Figure 3.11 – West Balranald post mining landuse (Source: EMM) ______________________ 47
Figure 3.12 – Nepean post mining landuse (Source: EMM) ____________________________ 48
Figure 4.1 – Water balance model schematic, year 1, 4 and 8 of mine life _____________ 52
Figure 4.2 – Water balance model schematic, West Balranald final void _______________ 52
Figure 4.3 – Predicted behaviour of West Balranald final void water storage and electrical conductivity _______________________________________________ 61
Figure 5.1 – TUFLOW model configuration _________________________________________ 70
Figure 5.2 – TUFLOW model roughness mapping ____________________________________ 71
Figure 5.3 – Predicted extent of flooding __________________________________________ 72

wrmwater.com.au 1083-01-C3| 31 March 2015 | Page 7
List of Tables
Table 1.1 – Relevant SEARs for this assessment_____________________________________ 12
Table 2.1 – Balranald (RSL) rainfall station details __________________________________ 19
Table 2.2 – Monthly and annual rainfall statistics, Balranald (RSL) (Station No. 049002), 1879-2014 __________________________________________________ 19
Table 2.3 – Balranald mean monthly and annual pan evaporation _____________________ 20
Table 2.4 – Lachlan River and distributary gauging stations at Hillston _________________ 21
Table 2.5 – Water quality trigger values (ANZECC, 2000) ____________________________ 26
Table 3.1 – Balranald Project – project area and disturbance area ____________________ 28
Table 4.1 – Simulated inflows and outflows to / from mine water management system _____________________________________________________________ 49
Table 4.2 – Water balance model catchment areas and landuse classifications __________ 50
Table 4.3 – Adopted storage capacities for water balance modelling __________________ 53
Table 4.4 – Summary of mine site demands and process water return inflows ___________ 53
Table 4.5 – Adopted rainfall-runoff parameters – AWBM model _______________________ 54
Table 4.6 – Water balance model operational rules _________________________________ 55
Table 4.7 – Year 1 water balance model results – storage volumes and overflows ________ 57
Table 4.8 – Year 1 water balance model results – supply of mine site water demands ____ 58
Table 4.9 – Year 4 water balance model results – storage volumes and overflows ________ 59
Table 4.10 – Year 4 water balance model results – supply of mine site water demands ___________________________________________________________ 59
Table 4.11 – Year 8 water balance model results – storage volumes and overflows _______ 61
Table 4.12 – Summary annual water balance, average, wet and dry rainfall conditions __________________________________________________________ 63
Table 5.1 – Estimated AEP of February 2011 rainfall event in Box Creek catchment ______ 66
Table 5.2 – Predicted peak flood levels in vicinity of West Balranald mine _____________ 68

wrmwater.com.au 1083-01-C3| 31 March 2015 | Page 8
Glossary
AEP Annual exceedance probability (%)
AHD Australian height datum
ARI Average recurrence interval
AWBM Australia water balance model
BoM Bureau of meteorology
DECC Department of environment and climate change
DNR Department of natural resources
D/S Downstream
EC Electrical conductivity
EIS Environmental impact statement
EMM EMGA Mitchell McLennan
EPA Environmental protection agency
EPBC Environment protection and biodiversity conservation
ESCP Erosion and sediment control plan
ha Hectares
HMC Heavy mineral concentrate
ISP Ilmenite separating plant
km Kilometre
m Metre
m2 Square metre
m3 Cubic metres
m3 /s Cubic metres per second
mAHD Metres Australian height datum
ML Megalitre
ML:/day Megalitre per day
Mtpa Million tonnes per annum
MUP Mining unit plant
NSOB Non saline overburden
PAF Potentially acid forming
PMF Probable maximum flood
PMP Probable maximum precipitation
RCBC Reinforced concrete box culvert
ROM Run of mine
SEARS Secretary’s environmental assessment requirements
SOB Saline overburden
SSD State significant development

wrmwater.com.au 1083-01-C3| 31 March 2015 | Page 9
tpa Tonnes per annum
TSF Tailings storage facility
TUFLOW Two dimensional hydraulic modelling software
TSS Total suspended solids
U/S Upstream
WRM WRM Water and Environment Pty Ltd
wrmwater.com.au 1083-01-C3| 31 March 2015 | Page 10
1 Introduction
1.1 OVERVIEW
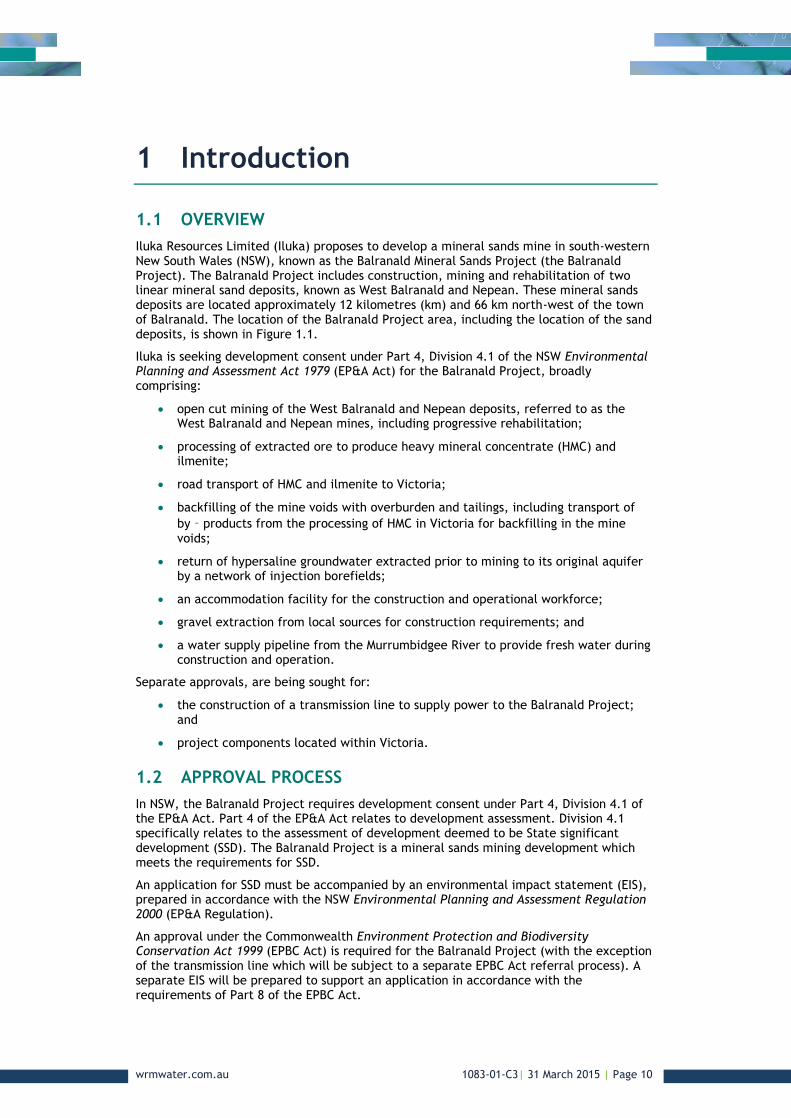
Iluka Resources Limited (Iluka) proposes to develop a mineral sands mine in south-western New South Wales (NSW), known as the Balranald Mineral Sands Project (the Balranald Project). The Balranald Project includes construction, mining and rehabilitation of two linear mineral sand deposits, known as West Balranald and Nepean. These mineral sands deposits are located approximately 12 kilometres (km) and 66 km north-west of the town of Balranald. The location of the Balranald Project area, including the location of the sand deposits, is shown in Figure 1.1.
Iluka is seeking development consent under Part 4, Division 4.1 of the NSW Environmental Planning and Assessment Act 1979 (EP&A Act) for the Balranald Project, broadly comprising:
open cut mining of the West Balranald and Nepean deposits, referred to as the West Balranald and Nepean mines, including progressive rehabilitation;
processing of extracted ore to produce heavy mineral concentrate (HMC) and ilmenite;
road transport of HMC and ilmenite to Victoria;
backfilling of the mine voids with overburden and tailings, including transport of
by‐products from the processing of HMC in Victoria for backfilling in the mine voids;
return of hypersaline groundwater extracted prior to mining to its original aquifer by a network of injection borefields;
an accommodation facility for the construction and operational workforce;
gravel extraction from local sources for construction requirements; and
a water supply pipeline from the Murrumbidgee River to provide fresh water during construction and operation.
Separate approvals, are being sought for:
the construction of a transmission line to supply power to the Balranald Project; and
project components located within Victoria.
1.2 APPROVAL PROCESS
In NSW, the Balranald Project requires development consent under Part 4, Division 4.1 of the EP&A Act. Part 4 of the EP&A Act relates to development assessment. Division 4.1 specifically relates to the assessment of development deemed to be State significant development (SSD). The Balranald Project is a mineral sands mining development which meets the requirements for SSD.
An application for SSD must be accompanied by an environmental impact statement (EIS), prepared in accordance with the NSW Environmental Planning and Assessment Regulation 2000 (EP&A Regulation).
An approval under the Commonwealth Environment Protection and Biodiversity Conservation Act 1999 (EPBC Act) is required for the Balranald Project (with the exception of the transmission line which will be subject to a separate EPBC Act referral process). A separate EIS will be prepared to support an application in accordance with the requirements of Part 8 of the EPBC Act.
wrmwater.com.au 1083-01-C3| 31 March 2015 | Page 11
Figure 1.1 - Balranald Mineral Sands Project Locality Map
Nepean
West
Balranald
wrmwater.com.au 1083-01-C3| 31 March 2015 | Page 12
1.3 SECRETARY’S ENVIRONMENTAL ASSESSMENT
REQUIREMENTS
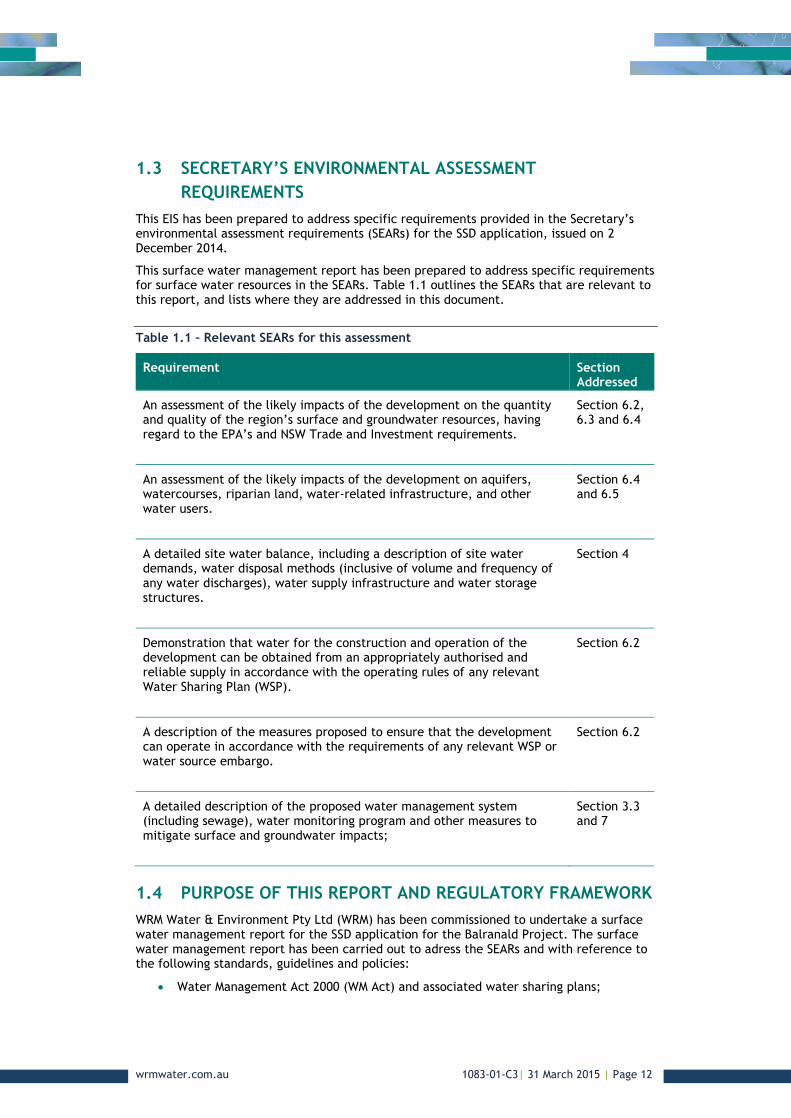
This EIS has been prepared to address specific requirements provided in the Secretary’s environmental assessment requirements (SEARs) for the SSD application, issued on 2 December 2014.
This surface water management report has been prepared to address specific requirements for surface water resources in the SEARs. Table 1.1 outlines the SEARs that are relevant to this report, and lists where they are addressed in this document.
Table 1.1 – Relevant SEARs for this assessment
Requirement Section Addressed
An assessment of the likely impacts of the development on the quantity and quality of the region’s surface and groundwater resources, having regard to the EPA’s and NSW Trade and Investment requirements.
Section 6.2, 6.3 and 6.4
An assessment of the likely impacts of the development on aquifers, watercourses, riparian land, water-related infrastructure, and other water users.
Section 6.4 and 6.5
A detailed site water balance, including a description of site water demands, water disposal methods (inclusive of volume and frequency of any water discharges), water supply infrastructure and water storage structures.
Section 4
Demonstration that water for the construction and operation of the development can be obtained from an appropriately authorised and reliable supply in accordance with the operating rules of any relevant Water Sharing Plan (WSP).
Section 6.2
A description of the measures proposed to ensure that the development can operate in accordance with the requirements of any relevant WSP or water source embargo.
Section 6.2
A detailed description of the proposed water management system (including sewage), water monitoring program and other measures to mitigate surface and groundwater impacts;
Section 3.3 and 7
1.4 PURPOSE OF THIS REPORT AND REGULATORY FRAMEWORK
WRM Water & Environment Pty Ltd (WRM) has been commissioned to undertake a surface water management report for the SSD application for the Balranald Project. The surface water management report has been carried out to adress the SEARs and with reference to the following standards, guidelines and policies:
Water Management Act 2000 (WM Act) and associated water sharing plans;

wrmwater.com.au 1083-01-C3| 31 March 2015 | Page 13
National Water Quality Management Strategy: Australian Guidelines for Fresh and Marine Water Quality (ANZECC/ARMCANZ, 2000);
Water Sharing Plan for the Murrumbidgee Regulated River Water Source (2012);
ANZECC Guidelines and Water Quality Objectives in NSW (DEC, 2006);
Dams Safety Act 1978;
Managing Urban Stormwater Soils and Construction – Volume 2E Mines and Quarries (DECC, 2008); and
Managing Urban Stormwater, Soils and Construction (Landcom, 2004).
The structure of this report is as follows:
Section 2 provides background information on the characteristics of the existing surface water environment.
Section 3 provides a summary of the proposed surface water management strategy and water management infrastructure for the mine.
Section 4 presents the methodology and results of a numerical simulation of the mine site water balance, including an assessment of storage behaviour and potential release volumes. Section 4 also includes an assessment of the likely long term water level and salinity behaviour of the open cut final void.
Section 5 presents the methodology and results of a flood study of Box Creek, which drains a portion of the project area.
Section 6 describes the potential impacts of the Balranald Project on surface water resources and provides an assessment of the likely magnitude of these impacts.
Section 7 documents the proposed mitigation and management measures to minimise the risk of adverse surface water impacts from the Balranald Project.
Section 8 is a summary of the findings of the surface water impact assessment.
Section 9 is a list of references.

wrmwater.com.au 1083-01-C3| 31 March 2015 | Page 14
2 Existing surface water environment
2.1 REGIONAL DRAINAGE
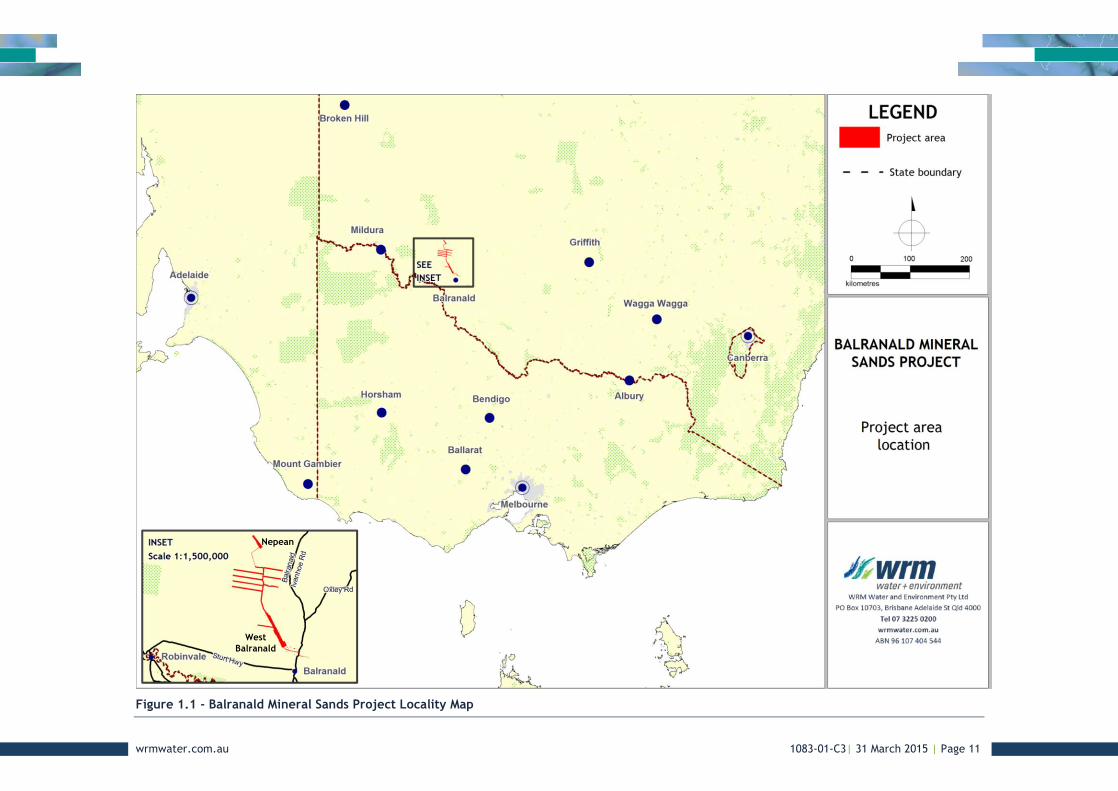
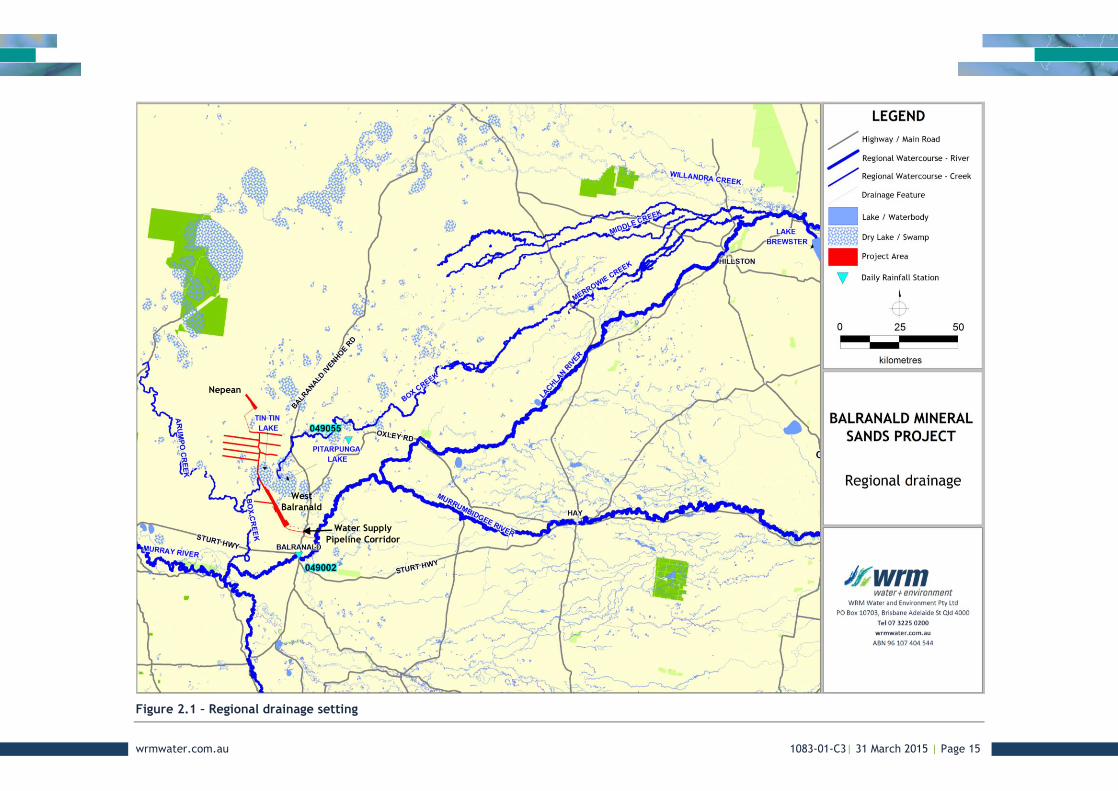
Figure 2.1 shows the regional drainage context of the project area, including relevant watercourses and waterbodies. Key regional drainage catchments and watercourses are discussed below.
2.1.1 Box Creek catchment
The project area is located almost wholly within the catchment of Box Creek. Box Creek is an ephemeral watercourse and a distributary of the Lachlan River, and typically only flows during and immediately following heavy local rainfall and during large flood events in the Lachlan River. In the vicinity of the project area, Box Creek is almost indistinguishable from the surrounding salt bush flats, and has no defined bed or banks.
Upstream of the project area, Box Creek drains south into Pitarpunga Lake and Tin Tin Lake. If flood volumes are sufficient to cause these lakes to fill (they are usually dry), flow will continue along Box Creek downstream of the lakes. Figure 2.2 is a photograph of Box Creek downstream of Tin Tin Lake. Box Creek drains into the Murrumbidgee River some 30km south-west of the project area, after merging with Arumpo Creek.
The Box Creek catchment area upstream of the project area (including Pitarpunga and Tin Tin lakes, but excluding Merrowie and Middle creeks) is approximately 4,900km2, however it should be noted that the vast majority of the catchment drains into dry lakes or depressions, with little or no local runoff actually reporting directly to Box Creek.
2.1.2 Lachlan River and distributaries
The Lachlan River is a tributary of the Murrumbidgee River, and has a catchment of about 54,000 km2 at Hillston, some 180 km north-east of the project area. The Lachlan River – Hillston Floodplain Management Plan Lake Brewster to Whealbah (DNR, 2005) indicates that during large flood events in the Lachlan River, floodwater overflows out of the Lachlan River into a number of distributaries upstream of Hillston, including Middle and Merrowie creeks and Willandra Creek. Floodwater in Middle and Merrowie creeks then flows south-west towards Box Creek filling several dry lakes and swamps. If the flood is large enough, flood water from Middle and Merrowie creeks will drain into Box Creek to the north of the project area.
It is possible that floodwater in Willandra Creek may eventually flow into Arumpo Creek after filling a series of very large dry lakes, however this is unconfirmed.
2.1.3 Murrumbidgee River
The Murrumbidgee River is located to the east and south of the project area and flows in a south-westerly direction, joining the Murray River about 40km south-west of the project area. The Murrumbidgee River is the major drainage feature in the vicinity of the Balranald Project, and has a catchment of about 166,600km2 at Balranald. A small part of the project area (the water supply pipeline corridor) is located on the western floodplain of the Murrumbidgee River.
wrmwater.com.au 1083-01-C3| 31 March 2015 | Page 15
Figure 2.1 – Regional drainage setting
Nepean
West
Balranald
Water Supply
Pipeline Corridor
wrmwater.com.au 1083-01-C3| 31 March 2015 | Page 16
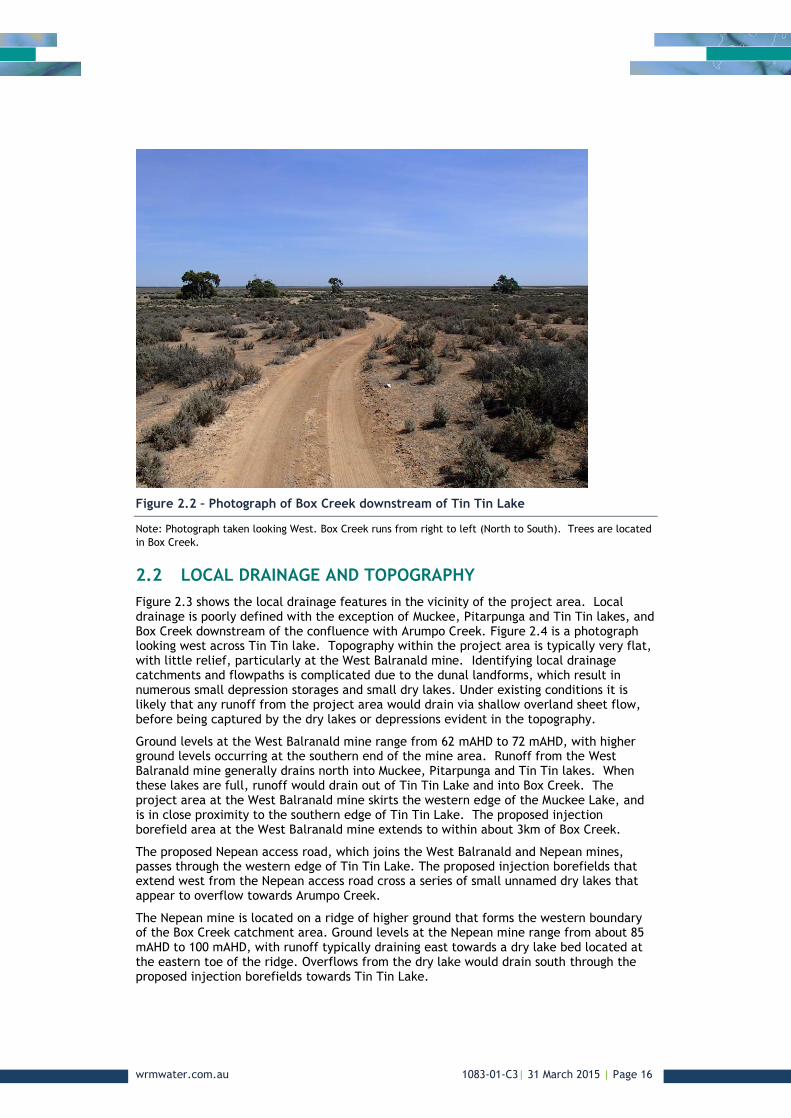
Figure 2.2 – Photograph of Box Creek downstream of Tin Tin Lake
Note: Photograph taken looking West. Box Creek runs from right to left (North to South). Trees are located
in Box Creek.
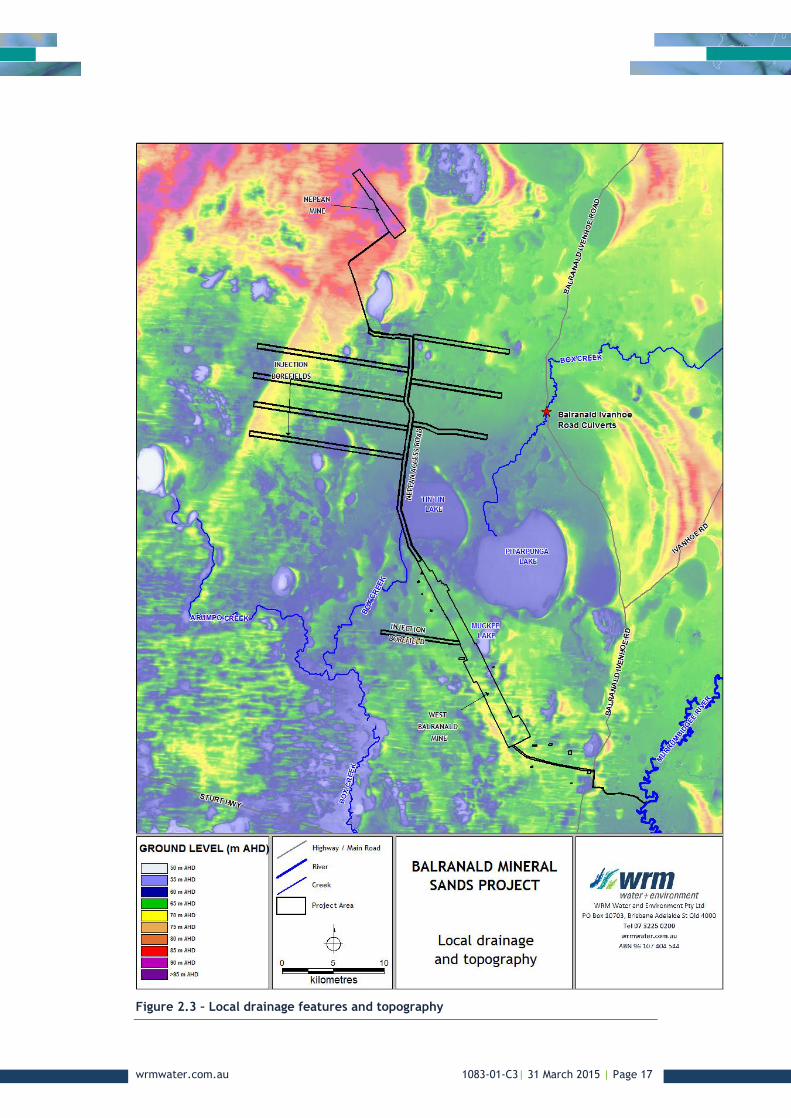
2.2 LOCAL DRAINAGE AND TOPOGRAPHY
Figure 2.3 shows the local drainage features in the vicinity of the project area. Local drainage is poorly defined with the exception of Muckee, Pitarpunga and Tin Tin lakes, and Box Creek downstream of the confluence with Arumpo Creek. Figure 2.4 is a photograph looking west across Tin Tin lake. Topography within the project area is typically very flat, with little relief, particularly at the West Balranald mine. Identifying local drainage catchments and flowpaths is complicated due to the dunal landforms, which result in numerous small depression storages and small dry lakes. Under existing conditions it is likely that any runoff from the project area would drain via shallow overland sheet flow, before being captured by the dry lakes or depressions evident in the topography.
Ground levels at the West Balranald mine range from 62 mAHD to 72 mAHD, with higher ground levels occurring at the southern end of the mine area. Runoff from the West Balranald mine generally drains north into Muckee, Pitarpunga and Tin Tin lakes. When these lakes are full, runoff would drain out of Tin Tin Lake and into Box Creek. The project area at the West Balranald mine skirts the western edge of the Muckee Lake, and is in close proximity to the southern edge of Tin Tin Lake. The proposed injection borefield area at the West Balranald mine extends to within about 3km of Box Creek.
The proposed Nepean access road, which joins the West Balranald and Nepean mines, passes through the western edge of Tin Tin Lake. The proposed injection borefields that extend west from the Nepean access road cross a series of small unnamed dry lakes that appear to overflow towards Arumpo Creek.
The Nepean mine is located on a ridge of higher ground that forms the western boundary of the Box Creek catchment area. Ground levels at the Nepean mine range from about 85 mAHD to 100 mAHD, with runoff typically draining east towards a dry lake bed located at the eastern toe of the ridge. Overflows from the dry lake would drain south through the proposed injection borefields towards Tin Tin Lake.
wrmwater.com.au 1083-01-C3| 31 March 2015 | Page 17
Figure 2.3 – Local drainage features and topography

wrmwater.com.au 1083-01-C3| 31 March 2015 | Page 18
The only drainage infrastructure of note is the Box Creek crossing of the Balranald Ivanhoe Road, which consists of twenty (20) 1.8m high by 1.5m wide reinforced concrete box culverts. Figure 2.5 is a photograph of the Box Creek culverts beneath Balranald Ivanhoe Road.
Figure 2.4 – Photograph looking west across Tin Tin Lake
Figure 2.5 – Photograph of Box Creek culverts at Balranald Ivanhoe Road

wrmwater.com.au 1083-01-C3| 31 March 2015 | Page 19
2.3 RAINFALL AND EVAPORATION
Daily rainfalls have been recorded at Balranald (RSL) (BoM Station No. 049002), about 20 km south-east of the West Balranald mine (refer Figure 2.1), since 1879. Rainfall data recorded at this station would be representative of rainfall in the vicinity of the project area. Table 2.1 shows summary details of the rainfall station. Table 2.2 shows summary rainfall statistics for the Balranald (RSL) station. Mean annual rainfall is 324.3 mm with the highest monthly rainfalls occurring between May and October. The highest annual rainfall at this station (692.3 mm) was recorded in 1973.
Table 2.1 – Balranald (RSL) rainfall station details
Station No.
Station Name
Elevation (m)
Latitude Longitude Distance from Site (km)
Opened Closed
049002 Balranald (RSL)
61 34.64° S 143.56° E 20 1879 -
Table 2.2 – Monthly and annual rainfall statistics, Balranald (RSL) (Station No. 049002), 1879-2014
Statistic Rainfall (mm)
Jan Feb Mar Apr May Jun Jul Aug Sep Oct Nov Dec Annual
Mean 22.3 25.7 22.6 23.4 31.3 29.6 26.4 29.4 29 30.6 27.8 25.9 324.3
Lowest 0 0 0 0 0 0.5 0 0.4 0.5 0 0 0 121.7
5th %ile 0 0 0 0 1.4 4.8 4.1 3.7 5.3 1.9 0 0 154.5
10th %ile 0 0 0.5 1.3 3.8 7.6 7.1 7.9 6.9 3.7 2 1.2 202.7
Median 10.9 13.4 15.1 15.2 25.1 24.4 23 25.9 23.5 22.4 19.6 17.3 314.3
90th %ile 60.8 69.6 60 58 67.7 56.5 50.2 53.3 58.9 71.9 67.8 57.7 465.8
95th %ile 82.6 84.9 76.1 74.9 84.3 66.3 57.9 60.3 67.3 89.3 87.4 71.4 518.5
Highest 137.6 141.5 133.3 125.7 117.4 137.5 82.3 85.2 99 130 125 145.3 692.3
Table 2.3 shows mean monthly evaporation (based on Class A pan evaporation) for Balranald, estimated from the BoM mean monthly and mean annual evaporation gridded datasets. Mean annual evaporation is 1,904mm, which is nearly 6 times average annual rainfall.

wrmwater.com.au 1083-01-C3| 31 March 2015 | Page 20
Table 2.3 – Balranald mean monthly and annual pan evaporation
Month Mean Pan Evaporation (mm)
January 301
February 253
March 200
April 119
May 71
June 44
July 52
August 78
September 110
October 171
November 223
December 282
Total 1,904
Figure 2.6 shows the distribution of average monthly rainfall and evaporation. Evaporation is greater than rainfall in all months, but is much greater than rainfall in the warmer months.
Figure 2.6 – Distribution of monthly rainfall and pan evaporation at Balranald
wrmwater.com.au 1083-01-C3| 31 March 2015 | Page 21
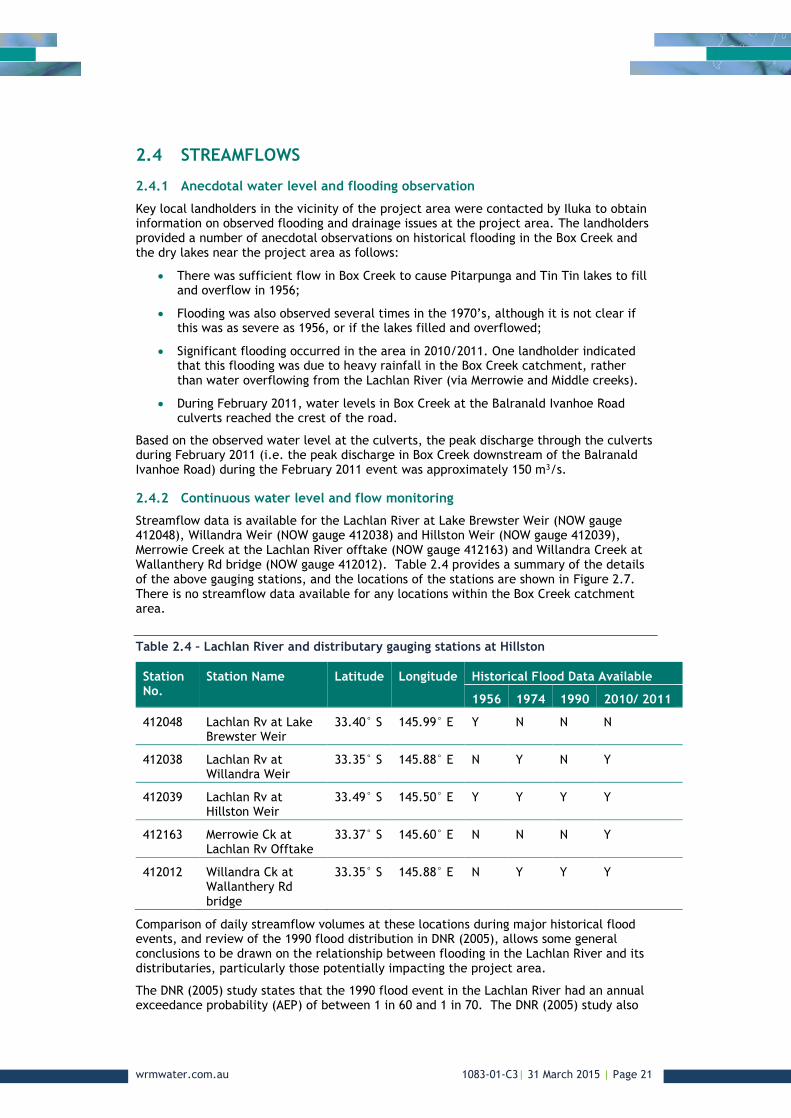
2.4 STREAMFLOWS
2.4.1 Anecdotal water level and flooding observation
Key local landholders in the vicinity of the project area were contacted by Iluka to obtain information on observed flooding and drainage issues at the project area. The landholders provided a number of anecdotal observations on historical flooding in the Box Creek and the dry lakes near the project area as follows:
There was sufficient flow in Box Creek to cause Pitarpunga and Tin Tin lakes to fill and overflow in 1956;
Flooding was also observed several times in the 1970’s, although it is not clear if this was as severe as 1956, or if the lakes filled and overflowed;
Significant flooding occurred in the area in 2010/2011. One landholder indicated that this flooding was due to heavy rainfall in the Box Creek catchment, rather than water overflowing from the Lachlan River (via Merrowie and Middle creeks).
During February 2011, water levels in Box Creek at the Balranald Ivanhoe Road culverts reached the crest of the road.
Based on the observed water level at the culverts, the peak discharge through the culverts during February 2011 (i.e. the peak discharge in Box Creek downstream of the Balranald Ivanhoe Road) during the February 2011 event was approximately 150 m3/s.
2.4.2 Continuous water level and flow monitoring
Streamflow data is available for the Lachlan River at Lake Brewster Weir (NOW gauge 412048), Willandra Weir (NOW gauge 412038) and Hillston Weir (NOW gauge 412039), Merrowie Creek at the Lachlan River offtake (NOW gauge 412163) and Willandra Creek at Wallanthery Rd bridge (NOW gauge 412012). Table 2.4 provides a summary of the details of the above gauging stations, and the locations of the stations are shown in Figure 2.7. There is no streamflow data available for any locations within the Box Creek catchment area.
Table 2.4 – Lachlan River and distributary gauging stations at Hillston
Station No.
Station Name Latitude Longitude Historical Flood Data Available
1956 1974 1990 2010/ 2011
412048 Lachlan Rv at Lake Brewster Weir
33.40° S 145.99° E Y N N N
412038 Lachlan Rv at Willandra Weir
33.35° S 145.88° E N Y N Y
412039 Lachlan Rv at Hillston Weir
33.49° S 145.50° E Y Y Y Y
412163 Merrowie Ck at Lachlan Rv Offtake
33.37° S 145.60° E N N N Y
412012 Willandra Ck at Wallanthery Rd bridge
33.35° S 145.88° E N Y Y Y
Comparison of daily streamflow volumes at these locations during major historical flood events, and review of the 1990 flood distribution in DNR (2005), allows some general conclusions to be drawn on the relationship between flooding in the Lachlan River and its distributaries, particularly those potentially impacting the project area.
The DNR (2005) study states that the 1990 flood event in the Lachlan River had an annual exceedance probability (AEP) of between 1 in 60 and 1 in 70. The DNR (2005) study also

wrmwater.com.au 1083-01-C3| 31 March 2015 | Page 22
gives the following estimated peak discharges (instantaneous) at the following locations for the 1990 Lachlan River flood event:
Lachlan River between Lake Brewster weir and Willandra weir: 51,300 ML/day (594 m3/s);
Willandra Creek at Roto Road: 7,100 ML/day (82 m3/s);
Yangellawah Creek north at Temora Roto Railway: 5,700 ML/day (66 m3/s);
Yangellawah Creek south at Temora Roto Railway: 9,600 ML/day (594 m3/s);
Middle Creek at Temora Roto Railway: 7,600 ML/day (88 m3/s);
Merrowie Creek at Temora Roto Railway: 5,700ML/day (66 m3/s); and
Lachlan River at Hillston Weir: 12,900ML/day (149 m3/s);
The DNR (2005) discharges indicate that about 75% of the peak flow in the Lachlan River at the Lake Brewster weir entered the distributary creeks during the 1990 flood event. It is of note that landholders in the vicinity of the project area do not mention the 1990 flood event, indicating that despite such high flows in Middle and Merrowie creeks (about 154 m3/s at the Temora Roto Railway), there was not a large amount of flow in Box Creek, and certainly not sufficient volume to cause Pitarpunga and Tin Tin lakes to fill and overflow.
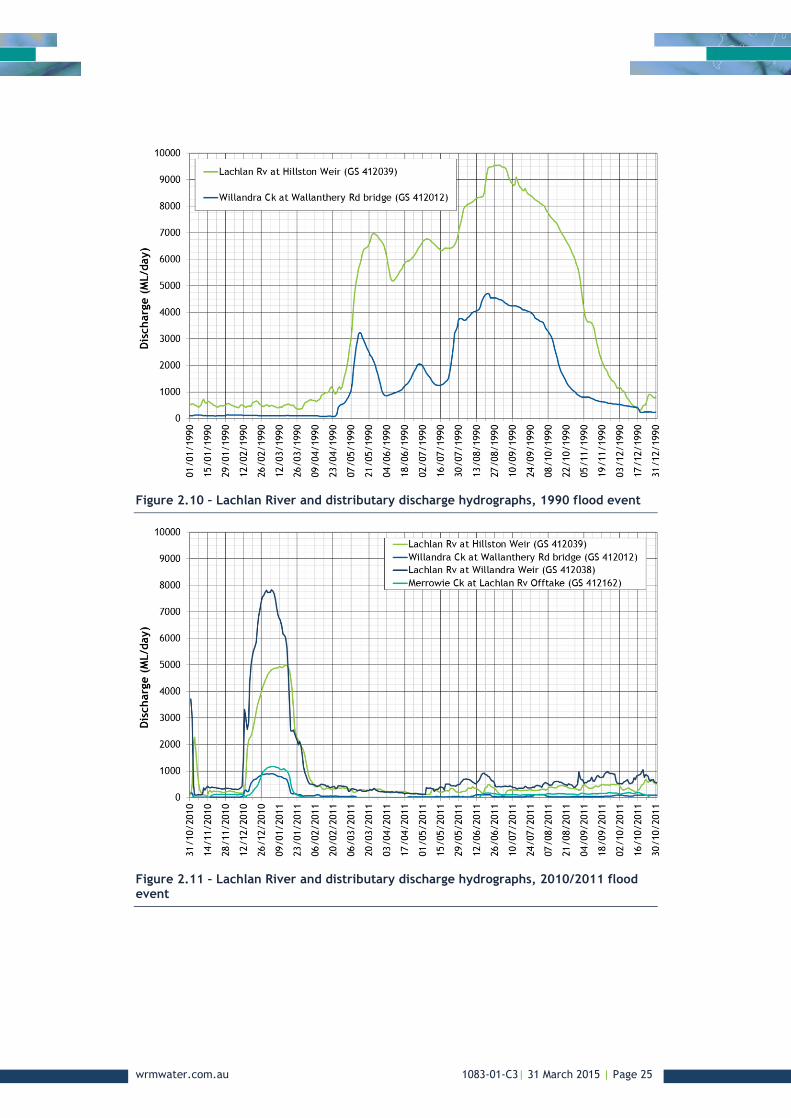
Figure 2.8, Figure 2.9, Figure 2.10 and Figure 2.11 show recorded average daily flowrates at the gauging stations listed in Table 2.4 for the 1956, 1974, 1990 and 2011 flood events (note that there are some discrepancies between the recorded flows and the flows in the DNR (2005) study which have not been investigated). Based on observations made above regarding the 1990 flood event, and the anecdotal evidence provided by the landholders, the following conclusions can be drawn on flood behaviour for the other historical events:
Figure 2.11 indicates that flows in Willandra and Merrowie creeks behave similarly during Lachlan River flood events, with water starting to overflow from the Lachlan River into these creeks when Lachlan River flows exceed about 3,000 ML/day (at either Willandra Weir or Hillston Weir).
Peak flowrates in the Lachlan River for the 1990 and 1956 flood events were of similar magnitudes. However during the 1956 flood event, flows in the Lachlan River exceeded 3,000ML/day for more than 9 months, whilst during the 1990 flood event flows in the Lachlan River exceeded 3,000 ML/day for about 6 months.
According to local landholders the 1956 flood resulted in significant flooding in Box Creek and the lakes in the vicinity of the project area, however the landholders make no mention of flooding in 1990. This suggests that in excess of 6 months of flow exceeding 3,000ML/day in the Lachlan River at Hillston is required to cause significant flooding in the vicinity of the project area.
During the 1974 flood event, flows in the Lachlan River exceeded 3,000 ML/day for about 8 months, and landholders reported extensive flooding during this event, confirming the relationship between the duration of Lachlan River flows and flooding at the site.
Lachlan River at Hillston flowed for only a very short duration during the 2010/2011 flood event, confirming the landholders statement that the 2010/2011 flood event was caused by local catchment rainfall only, rather than floodwater from the Lachlan River. The Annual Exceedance Probability (AEP) of rainfalls during the 2010/2011 flood event is discussed in Section 5.3.2.

wrmwater.com.au 1083-01-C3| 31 March 2015 | Page 23
Figure 2.7 – Lachlan River and distributary stream gauges at Hillston

wrmwater.com.au 1083-01-C3| 31 March 2015 | Page 24
Figure 2.8 – Lachlan River and distributary discharge hydrographs, 1956 flood event
Figure 2.9 – Lachlan River and distributary discharge hydrographs, 1974 flood event
wrmwater.com.au 1083-01-C3| 31 March 2015 | Page 25
Figure 2.10 – Lachlan River and distributary discharge hydrographs, 1990 flood event
Figure 2.11 – Lachlan River and distributary discharge hydrographs, 2010/2011 flood event

wrmwater.com.au 1083-01-C3| 31 March 2015 | Page 26
2.5 WATER QUALITY
2.5.1 Background water quality data
There is no background water quality data available for any watercourses or waterbodies in the Box Creek catchment. Background water quality data is available for the Lachlan, Murrumbidgee and Murray rivers, however this is not relevant to the Balranald Project.
2.5.2 Water quality objectives
The project area is located in the Barwon Darling and Far Western catchment defined in the NSW Water Quality and River Flow Objectives (DEH, 2006). DEH (2006) lists the following water quality objectives for uncontrolled streams (such as Box Creek):
Aquatic ecosystems;
Visual amenity;
Secondary contact recreation;
Primary contact recreation;
Livestock water supply;
Irrigation water supply (in Moonie and Warrego rivers);
Homestead water supply;
Drinking water at point of supply-Disinfection only;
Drinking water at point of supply-Clarification and disinfection;
Drinking water at point of supply-Groundwater; and
Aquatic foods (cooked);
Table 2.5 lists the Australia and New Zealand Environment Conservation Council (ANZECC) water quality guidelines (ANZECC, 2000) trigger values for irrigation, livestock water supply, aquatic ecosystems (lowland streams in south central Australia – low rainfall areas) and recreational contact.
Table 2.5 – Water quality trigger values (ANZECC, 2000)
Parameter Unit Trigger Value
Irrigation Livestock water supply
Aquatic eco-system*d
Recreational contact
pH pH 6.0 - 9.0 - 6.5 - 9.0 6.5 - 8.5
EC (uncompensated) μS/cm 1,000 *a - - -
EC (25ºC) μS/cm - - 100-5000 -
DO (% Saturation) - - 90*a -
Total Dissolved Solids (TDS) mg/L - 2,000*a - 1,000
Turbidity NTU - - 1-50 -
Calcium (Ca) mg/L - 1000 - -
Sodium (Na) mg/L 115*c - 300
Magnesium (Mg) mg/L - 2,000*b - -
Sulphate as SO4 mg/L - 1000 - 400
Chloride as Cl mg/L 175*c - - 400

wrmwater.com.au 1083-01-C3| 31 March 2015 | Page 27
Parameter Unit Trigger Value
Irrigation Livestock water supply
Aquatic eco-system*d
Recreational contact
Arsenic mg/L 0.1*f 0.5 0.013*ae 0.05
Barium mg/L - - 1
Cadmium mg/L 0.01*f 0.01 0.0002*e 0.005
Chromium mg/L 0.1*f 1 0.001*e 0.05
Copper mg/L 0.2*f 0.4*a 0.0014*e 1
Iron mg/L 0.2*f - - 0.3
Lead mg/L 2*f 0.1 0.0034*e 0.05
Manganese mg/L 0.2*f - 1.9*e 0.1
Nickel mg/L 0.2*f 1 0.011*e 0.1
Zinc (Zn) mg/L 2*f 20 0.008*e 5
Mercury mg/L 0.002*f 0.002 0.0006*e 0.001
Ammonia mg/L - - 0.013 -
Total phosphorus (Total P) mg/L 0.05*f - 0.02 -
Total nitrogen (Total N) mg/L 5 - 0.25 -
Nitrate-N mg/L - 400 0.7*e 10
Nitrite-N mg/L 30 1 Notes: - No Trigger Value recommended.
*a Lowest recommended value.
*b Cattle (insufficient information on other livestock)
*c Sensitive crops
*d Upland River
*e 95% of species protected
*f Long term Trigger Value

wrmwater.com.au 1083-01-C3| 31 March 2015 | Page 28
3 Project description
3.1 PROJECT SCHEDULE
The Balranald Project will have a life of approximately 15 years, including construction, mining, backfilling of all overburden material, rehabilitation and decommissioning.
Construction of the Balranald Project will commence at the West Balranald mine, and is expected to take about 2.5 years. Operations will commence at the West Balranald mine in Year 1 of the operational phase, which will overlap with approximately the last six months of the construction. The operational phase would include mining and associated ore extraction, processing and transport activities, and would be approximately nine years in duration. This would include completion of backfilling overburden into the pits at both the West Balranald and Nepean mines. Construction of infrastructure at the Nepean mine will commence in approximately Year 5 of the operational phase, with mining of ore starting in Year 6, and being complete by approximately Year 8.
Rehabilitation and decommissioning is expected to take a further two to five years following Year 9 of the operational phase.
3.2 PROJECT AREA
All development for the Balranald Project that is the subject of the SSD application is within the project area (refer Figure 3.1 to Figure 3.5). The project area is approximately 9,964 ha, and includes the following key project elements, described in subsequent sections:
West Balranald and Nepean mines;
West Balranald access road;
Nepean access road;
injection borefields;
gravel extraction;
water supply pipeline (from the Murrumbidgee River); and
accommodation facility.
Within the project area, the land directly disturbed for the Balranald Project is referred to as the disturbance area. For some project elements in the project area, a larger area has been surveyed than would actually be disturbed. This enables some flexibility to account for changes that may occur during detailed design and operation. The project area and disturbance area for each project element are in Table 3.1.
Table 3.1 – Balranald Project – project area and disturbance area
Project element Project area (ha)
Disturbance area (ha)
West Balranald mine 3,059 3,059
Nepean mine 805 805
West Balranald access road 128 521
Nepean access road 173 1562
Injection borefields 5,721 1,2143

wrmwater.com.au 1083-01-C3| 31 March 2015 | Page 29
Project element Project area (ha)
Disturbance area (ha)
Gravel extraction 42 42
Water supply pipeline 29 114
Accommodation facility 7 7
Total 7,446 4,828
Notes: 1. 60 m wide corridor within project area
2. 40-50 m wide corridor within project area
3. 100 m wide corridors within project area
4. 15 m wide corridor within project area
3.2.1 West Balranald and Nepean mines
The West Balranald and Nepean mines include:
open cut mining areas (ie pit/mine void) that would be developed using conventional dry mining methods to extract the ore;
soil and overburden stockpiles;
ore stockpiles and mining unit plant (MUP) locations;
a processing area (at the West Balranald mine), including a mineral processing plant, tailings storage facility (TSF), maintenance areas and workshops, product stockpiles, truck load-out area, administration offices and amenities;
groundwater management infrastructure, including dewatering, injection and monitoring bores and associated pumps and pipelines;
surface water management infrastructure;
services and utilities infrastructure (eg electricity infrastructure);
haul roads for heavy machinery and service roads for light vehicles; and
other ancillary equipment and infrastructure.
The location of infrastructure at the West Balranald and Nepean mines would vary over the life of the Balranald Project according to the stage of mining.
3.2.2 Mining unit plant (MUP)
The MUP is the first stage of the ore handling process, and is located adjacent to the West Balranald Pit. The MUP will move from south to north, being relocated four times as the West Balranald Pit develops.
The MUP screens oversize material from the ore, and adds water to the remaining ore material to form a slurry that is pumped to the processing plant.
3.2.3 Injection borefields
The Balranald Project requires a network of injection borefields in the project area for the return of hypersaline groundwater to the Loxton Parilla Sands aquifer. Within each borefield, infrastructure is generally located in two 50 m wide corridors (approximately 350 m apart) and typically comprises:
a network of pipelines with a graded windrow on either side;
access roads for vehicle access during construction and operation;
rows of injection wells, with wells spaced at approximately 100 m intervals; and
a series of water storage dams to store water during well development.

wrmwater.com.au 1083-01-C3| 31 March 2015 | Page 30
3.2.4 Access roads
There are two primary access roads within the project area to provide access to the Balranald Project:
West Balranald access road – a private access road to be constructed from the Balranald Ivanhoe Road to the West Balranald mine.
Nepean access road – a route comprising private access roads and existing public roads. A private access road would be constructed from the southern end of the West Balranald mine to the Burke and Wills Road. The middle section of the route would be two public roads, Burke and Wills Road and Arumpo Road. A private access road would be constructed from Arumpo Road to the Nepean mine.
The West Balranald access road would be the primary access point to the project area, and would be used by heavy vehicles transporting HMC and ilmenite. The Nepean access road would primarily be used by heavy vehicles transporting ore mined at the Nepean mine to the processing area at the West Balranald mine.
During the initial construction phase, existing access tracks through the project area from the local road network may also be used temporarily until the West Balranald and Nepean access roads and internal access roads within the project are established.
3.2.5 Accommodation facility
An accommodation facility would be constructed to cater for workers required by the Balranald Project. It would operate throughout the construction and operation phases of the project. The accommodation facility would be located adjacent to the West Balranald Mine near the intersection of the West Balranald access road with the Balranald Ivanhoe Road.
3.2.6 Water supply pipeline
A water supply pipeline would be constructed to supply water from the Murrumbidgee River for operation of the Balranald Project.
3.2.7 Gravel extraction
Gravel would be required during the construction and operational phases of the Balranald Project. Local sources of gravel (borrow pits) have been included in the project area to provide gravel during the construction phase. During the construction phase, gravel would be required for the construction of the West Balranald access road, internal haul roads and service roads, and hardstand areas for infrastructure. Processing operations, such as crushing and screening activities (if required) would also be undertaken at the borrow pits. Gravel for the operational phase would be obtained from external sources.
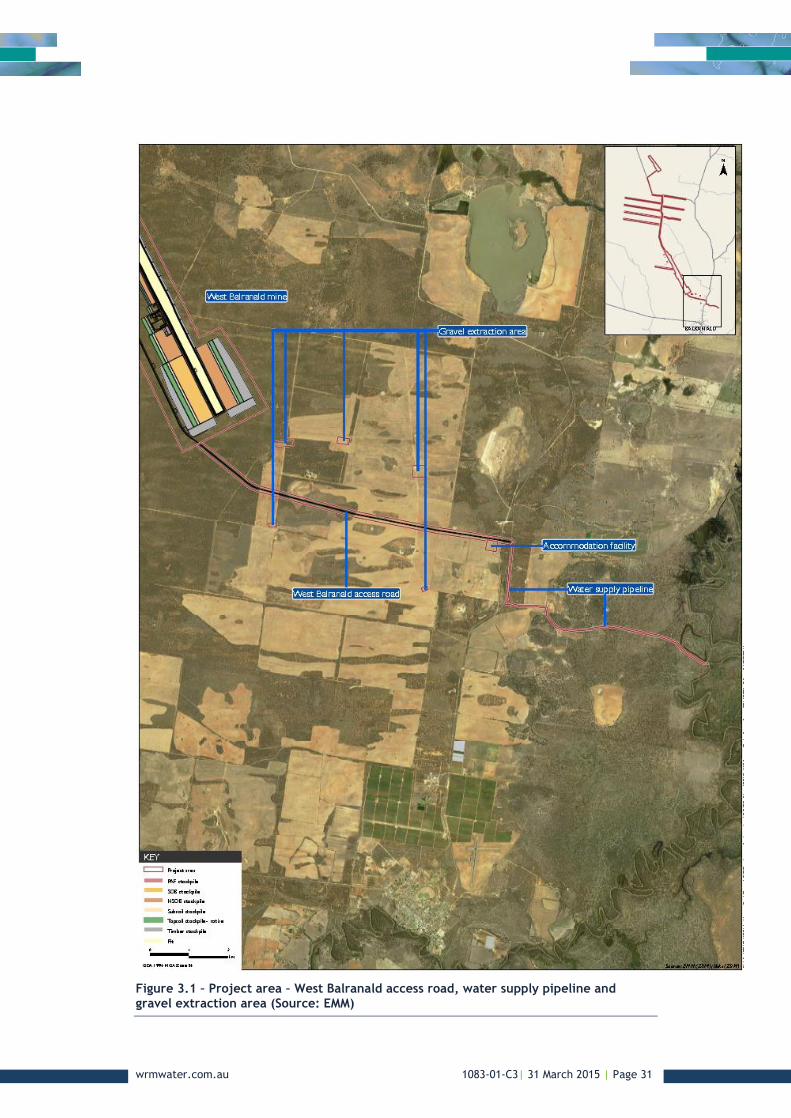
wrmwater.com.au 1083-01-C3| 31 March 2015 | Page 31
Figure 3.1 – Project area – West Balranald access road, water supply pipeline and gravel extraction area (Source: EMM)

wrmwater.com.au 1083-01-C3| 31 March 2015 | Page 32
Figure 3.2 – Project area – West Balranald mine and gravel extraction areas (Source: EMM)

wrmwater.com.au 1083-01-C3| 31 March 2015 | Page 33
Figure 3.3 – Project area – Injection borefield (Source: EMM)

wrmwater.com.au 1083-01-C3| 31 March 2015 | Page 34
Figure 3.4 – Project area – Nepean access road (Source: EMM)

wrmwater.com.au 1083-01-C3| 31 March 2015 | Page 35
Figure 3.5 – Project area – Nepean mine (Source: EMM)
wrmwater.com.au 1083-01-C3| 31 March 2015 | Page 36
3.3 CONTAMINANT SOURCE STUDY AND PROPOSED WATER
MANAGEMENT STRATEGY
3.3.1 Sources of contaminants
Potential sources of contaminants during the life of the Balranald Project in water streams at the project area include:
Hypersaline groundwater: Groundwater in the aquifer surrounding the ore deposit at West Balranald and Nepean is expected to be hypersaline, with electrical conductivity (EC) of between 16,180 µS/cm and 56,660 µS/cm (LWC, 2014).
Mine affected water: Runoff from the following areas may have elevated salinity, low pH, elevated concentrations of heavy metals and elevated concentrations of oil and grease, and is considered as mine affected water:
o Runoff and seepage collecting in the open cut mining area at the West Balranald and Nepean mine;
o Runoff from saline overburden (SOB) and potentially acid forming (PAF) stockpiles at the West Balranald mine. There is no PAF material present in the overburden or ore at the Nepean mine (Earth Systems, 2015); and
o Runoff from the mining unit plant (MUP) area and processing area at West Balranald (including run of mine (ROM) pads, and tailings and mining by-product stockpiles).
Sediment laden water: Runoff collecting in the open cut mining area at the Nepean mine, and runoff from non-saline overburden (NSOB), topsoil and subsoil stockpiles may have elevated levels of suspended solids, but will not have low pH (Earth Systems, 2015).
3.3.2 Proposed water management strategy
The concept water management schematic for the Balranald Project is shown in Figure 3.6. The proposed strategy for the management of water at the mine is based on the separation of water from different sources based on anticipated water quality. Surface water runoff from undisturbed areas will be diverted, wherever possible, around areas disturbed by mining and released from the site, minimising the capture of clean surface runoff.
Hypersaline groundwater will be extracted via the dewatering bores at the West Balranald mine to lower the groundwater table in the open cut pit. Some of the extracted hypersaline groundwater will be used to satisfy mine water demands, however the majority will be treated with ultra-violet (UV) light and reinjected into the Loxton Parilla Sands aquifer via the injection borefields. There will be no surface releases of hypersaline groundwater from the project area.
Seepage, groundwater (from perched aquifers disturbed during mining) and surface runoff inflows to the open cut mining area at the West Balranald mine will be collected in onsite storages and used preferentially to satisfy mine site water demands. Runoff from the mining unit plant (MUP) area and processing area, and the SOB and PAF stockpiles (associated with the start-up mining void) will also be collected in onsite storages and used to satisfy mine site water demands. The mine water management system at West Balranald mine will be operated to prevent releases of mine affected water from the project area.
Runoff and seepage draining into the Nepean open cut pit will be dewatered using in pit pumps and treated to settle sediment and eliminate bacteria (using UV light), prior to injection into the Loxton Parilla Sands aquifer via the injection borefields.
Surface runoff from NSOB stockpiles and the open cut mining area and ROM pad at the Nepean mine may have high concentrations of suspended sediment and will be captured and treated in sediment dams and used for dust suppression, or potentially released from

wrmwater.com.au 1083-01-C3| 31 March 2015 | Page 37
the site via discharges during rainfall events that exceed the 5-day 90th percentile rainfall total, as per the sediment basin design criteria outlined in Managing Urban Stormwater, Soils and Construction, (Landcom, 2004) and Managing Urban Stormwater, Soils and Construction, Volume 2E Mine and Quarries (DECC, 2008).
3.3.3 Raw water supply, potable water supply and sewage treatment and disposal
Raw water for use in dust suppression on sensitive areas (i.e. NSOB stockpiles, rehabilitated areas and haul roads), and to supply filtered water demands will be pumped from the Murrumbidgee River. The raw water demands and licensing requirements for extraction from the Murrumbidgee River are discussed in the Balranald Mineral Sands Project - Water Assessment (EMM 2015).
Potable water will be trucked into the project area and stored in a tank for reticulation and consumption.
Domestic sewage at the project area will be managed in two ways:
For areas with high density of personnel (i.e. process area and accommodation faciltiy), a package waste treatment system will be used, which will require occasional pumping out of sludge; and
For ablutions located in areas with low or infrequent use, untreated waste will be collected in septic tanks which will be emptied by tanker as required.

wrmwater.com.au 1083-01-C3| 31 March 2015 | Page 38
Figure 3.6 – Balranald Mineral Sands Project conceptual water management system schematic
Saline / Mine
Affected Water Dam
Runoff Collection Dam
(Sediment Dam)
Mining Pit
Non-saline Water Dam
Site Water Demand
Pumped Transfer
Seepage
Runoff
Water Source
Non-saline
Water Dam
Filter
Dust
Suppression
Sensitive Areas
ISP Water
Demands
Gland Seal
WaterSite Potable
Water
Demands
Tank – Filled
by truck
Groundwater
Mining Pit Sump
Groundwater
Retention Dam
MUP Dam
Mining Pit
Catchment
Runoff
ROM Pad
Runoff
MUP
Catchment
Runoff
Tailings Pad
Runoff
PAF Stockpile
Runoff (Years
1-3 only
MUP Demands
Dust
Suppression
Non-Sensitive
Areas
Reinjection
Borefield
Murr
um
bid
gee R
iver
Runoff
Collection
Dams
Non-saline
Overburden
Stockpile
Runoff
Topsoil and
Subsoil
Stockpile
Runoff
Settling DamProcess Water
Dam
Processing Area
Runoff Dam
Modcod Tailings
Dam
Product
Stockpile
Runoff
Plant Area
Runoff
WCP
WHIMS
PCP
TailingsDecant
(TailingsMoisture)
West
Balranald
Mining Area
MUP Area
Groundwater
Management Processing Plant Area
Raw Water
Use
Potable Water
Surface Water
Catchment
Watercourse Rainfall / Evaporation
on Dam Surface
Domestic /
Washdown
(Tailings Moisture via Tailings Pad)
SOB Stockpile
Runoff (Years
1-3 only)
Nepean Mine
ROM Pad
Runoff
Sediment
Control
Mining Pit SumpMining Pit
Catchment
Runoff
Nepean
Mining Area
Filtered Water Tanks
Spillway / Gravity
Discharge
Wet
Weather
Offsite
Release
wrmwater.com.au 1083-01-C3| 31 March 2015 | Page 39
3.4 PROPOSED WATER MANAGEMENT SYSTEM AND
INFRASTRUCTURE
3.4.1 Overview
The proposed mine water management system and infrastructure has been conceptually designed and assessed for four stages of mine life:
Years 1, 4 and 8 of mine life; and
Final landform (post mine closure).
These stages are sufficient to describe all of the main infrastructure for the project area. The water management system and infrastructure for each stage is discussed below.
3.4.2 Year 1
Figure 3.7 shows the proposed layout of mine infrastructure, stockpiles, open cut mining area and key surface water management infrastructure at the West Balranald mine during Year 1 of mine life. There will be no development at the Nepean mine in Year 1 of mine life, however the injection borefields (refer Figure 3.3) will be in operation. The following is of note with regards to water management infrastructure in Year 1 of mine life:
Six mine affected water dams will be constructed in Year 1 of mine life:
o Year 1 MUP dam, which will capture runoff from the MUP area, PAF and SOB stockpiles, and also receive pumped dewatering flows from the open cut mining area. If necessary the MUP dam can also receive pumped transfers from the process water dam. The Year 1 MUP dam will be sized and operated to prevent any uncontrolled spills over the life of the mine.
o Processing area runoff dam, which will capture runoff from the processing area. The processing area runoff dam will be sized and operated to prevent any uncontrolled spills over the life of the Balranald Project.
o Settling dam, a turkey nest storage (i.e. no contributing catchment area except the dam surface area), which receives pumped transfers from the processing area runoff dam, Year 1 MUP dam, TSF decant returns and dewatering bores. The settling dam is used to settle out solids from water before use in the processing plant. The settling dam overflows via gravity into the adjacent process water dam.
o Process water dam, a turkey nest storage, which supplies water to the processing plant (excluding the Ilmenite separating plant (ISP), which requires raw water). The process water dam can also be used to transfer water to the MUP dam if required.
o TSF, which receives modified co-disposal (ModCod) slurry consisting of sand and thickener underflow mixture (or slimes). The TSF will contain all direct rainfall and resulting runoff that occurs within the TSF area. Water is decanted from the TSF and returned to the settling dam for reuse in the processing plant. Dewatered ModCod material is extracted from the TSF (after approximately 6 months) and returned to the open cut pit.
o Groundwater retention dam 1, a turkey nest storage, which receives hypersaline groundwater extracted by the dewatering bores, which is treated with UV light prior to being reinjected into the Loxton Parilla Sands aquifer.

wrmwater.com.au 1083-01-C3| 31 March 2015 | Page 40
Figure 3.7 – Year 1 Project layout and surface water management infrastructure

wrmwater.com.au 1083-01-C3| 31 March 2015 | Page 41
A series of runoff collection drains and dams will be constructed to capture runoff from the NSOB, topsoil and subsoil stockpiles. The collection dams will function as sediment basins and will be designed as part of the Erosion and Sediment Control Plan (ESCP) for the Project, which will be developed as part of detailed design.
A non-saline water dam will be constructed to hold imported raw water from the freshwater supply pipeline from the Murrumbidgee River.
3.4.3 Year 4
Figure 3.8 shows the proposed layout of mine infrastructure, stockpiles, open cut mining area and key surface water management infrastructure at the West Balranald mine during Year 4 of mine life. There will be no development at the Nepean mine in Year 4 of mine life. The following is of note with regards to water management infrastructure in Year 4 of mine life:
The MUP will have moved north along the West Balranald mine in Year 4, and will be located at MUP location 4. The PAF and SOB stockpiles located at the Year 1 MUP location will have been completely removed and backfilled into the open cut pit by Year 4. The Year 1 MUP dam will remain in place until the PAF and SOB stockpiles have been removed.
The ROM pads and tailings and mine by-product stockpiles at MUP locations 1, 2 and 3 will be completely removed by Year 4 of mine life.
A Year 4 MUP dam will be constructed at MUP location 4 to capture runoff from the MUP area. Note that a new MUP dam will be constructed at each MUP location. The MUP area catchment at MUP locations 2, 3 and 4 will be the same size, and hence the MUP dam required at these locations will be the same. The MUP area catchment at location 2, 3 and 4 will be significantly smaller than location 1 as they do not include the Year 1 PAF and SOB stockpiles.
A new groundwater retention dam will be constructed at the northern end of the West Balranald mine.
New runoff collection drains and dams will be constructed to the north of the processing area to collect runoff from new NSOB, topsoil and subsoil stockpiles.
The processing area runoff dam, settling dam, process water dam and TSF are all unchanged from Year 1 of mine life.

wrmwater.com.au 1083-01-C3| 31 March 2015 | Page 42
Figure 3.8 – Year 4 Project layout and surface water management infrastructure

wrmwater.com.au 1083-01-C3| 31 March 2015 | Page 43
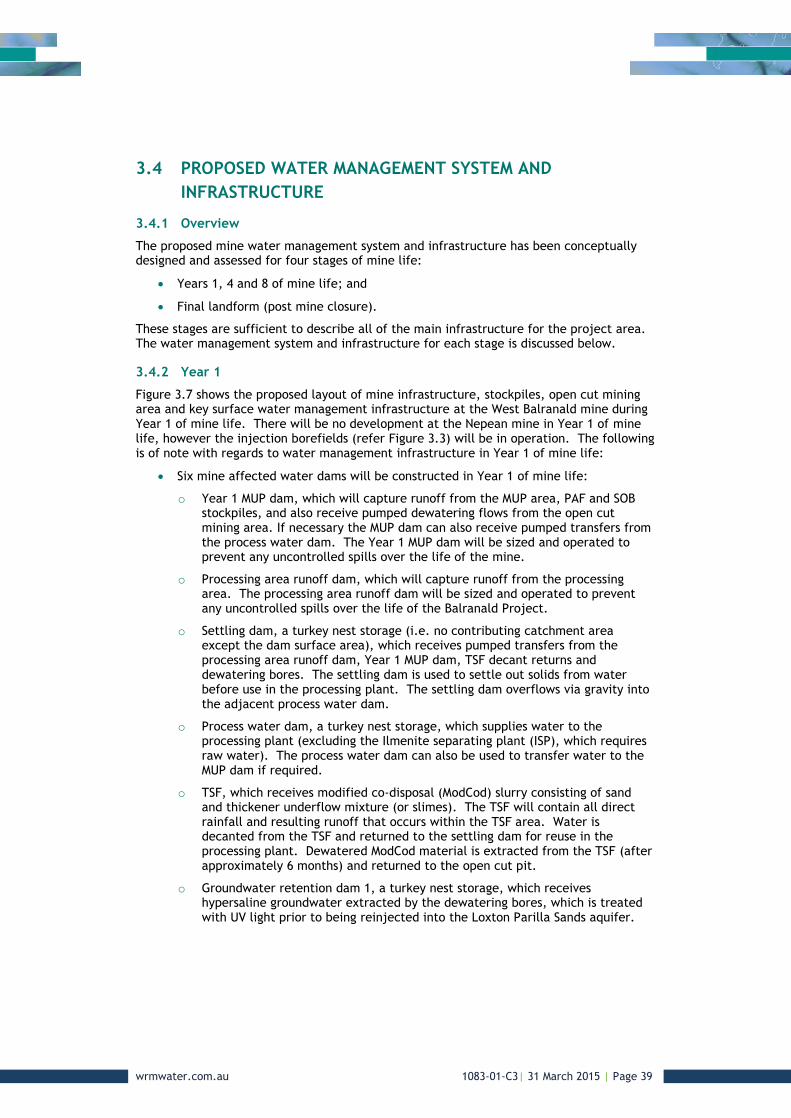
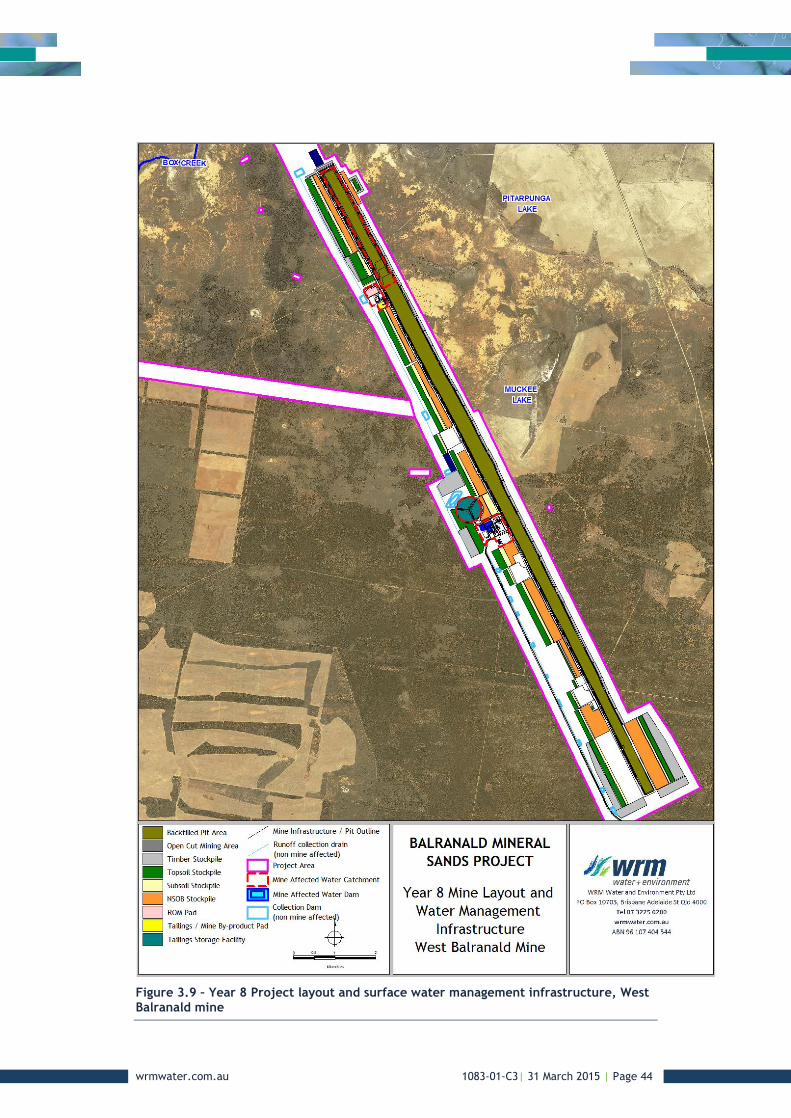
3.4.4 Year 8
Figure 3.9 and Figure 3.10 show the proposed layout of mine infrastructure, stockpiles, open cut mining area and key surface water management infrastructure at the West Balranald and Nepean mines during Year 8 of mine life respectively. The following is of note with regards to water management infrastructure in Year 8 of mine life:
Backfilling of the open cut pit at the West Balarand mine will occur in Year 8, and the West Balranald dewatering borefield will operate to keep the pit floor dry during backfilling.
The West Balranald pit will not be advancing in Year 8, and hence no perched groundwater aquifers will be disturbed and require dewatering from the pit. Any runoff collecting in the pit at West Balranald during the backfilling and rehabilitation works will be dewatered to the MUP dam.
The MUP remains at MUP location 4 in Year 8 of mine life. ROM will be trucked from the Nepean mine to the MUP at the West Balranald mine for processing. The ROM pads and tailings and mine by-product stockpiles at MUP location 3 will be completely removed by Year 8 of mine life.
The Year 4 MUP dam and runoff collection drains at West Balranald will remain.
The processing area runoff dam, settling dam, process water dam and TSF are all unchanged from Year 1 of mine life.
In pit sumps and dewatering pumps will be in place at the Nepean open cut mining area to dewater groundwater seepage and surface water runoff.
Water collecting in the in-pit sumps at Nepean will be treated before being pumped to the injection borefields.
wrmwater.com.au 1083-01-C3| 31 March 2015 | Page 44
Figure 3.9 – Year 8 Project layout and surface water management infrastructure, West Balranald mine
wrmwater.com.au 1083-01-C3| 31 March 2015 | Page 45
Figure 3.10 – Year 8 Project layout and surface water management infrastructure, Nepean mine

wrmwater.com.au 1083-01-C3| 31 March 2015 | Page 46
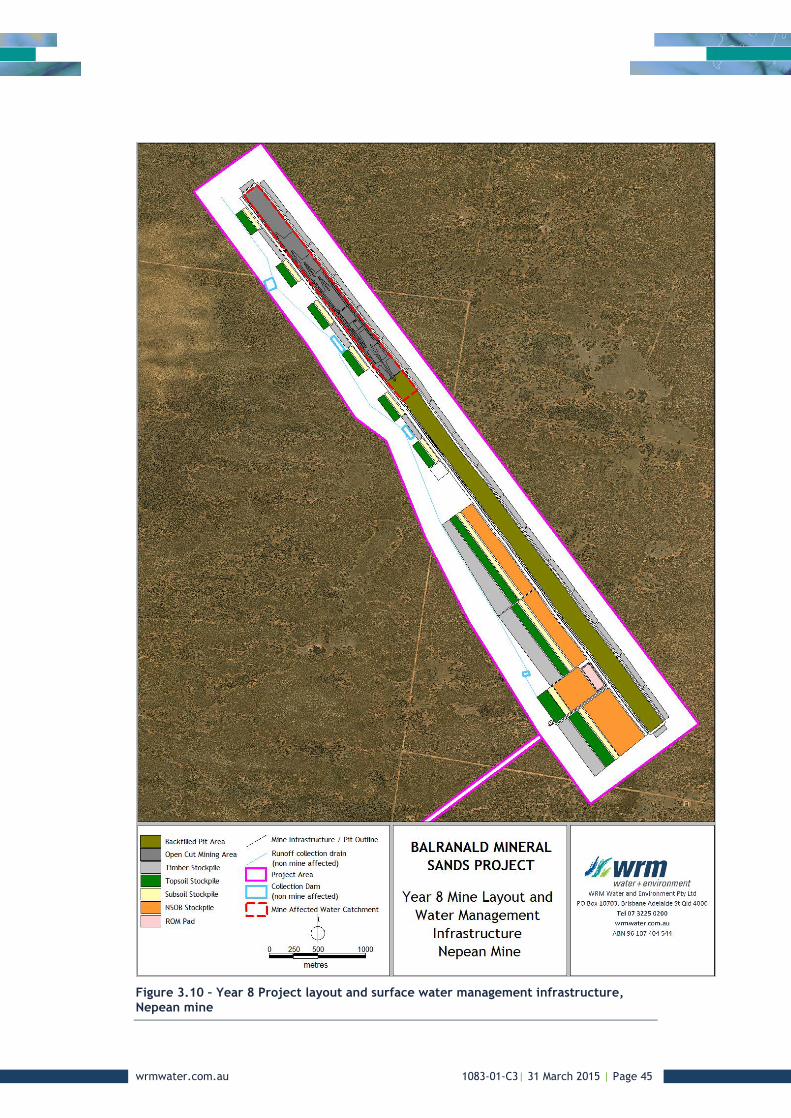
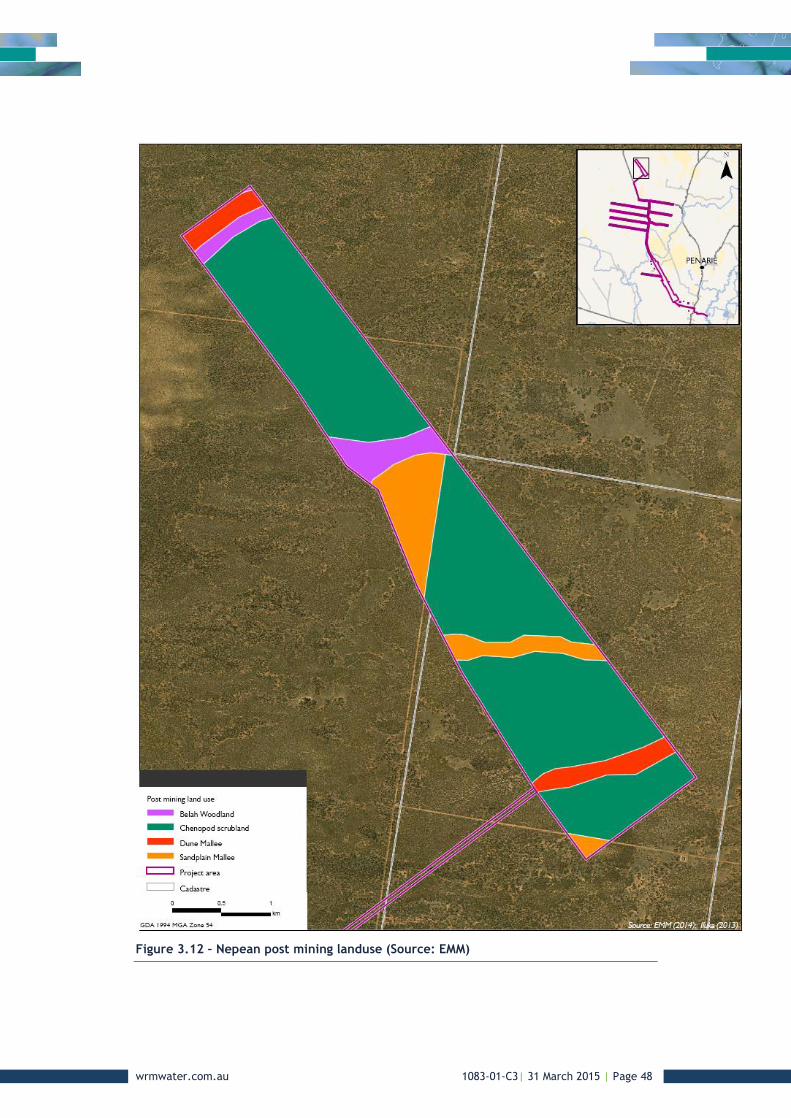
3.4.5 Final landform
Figure 3.11 and Figure 3.12 show the proposed rehabilitated landuses at the West Balranald and Nepean mines. There will be a final void located at West Balranald. The indicative location of the final void is shown in Figure 5.1. The conceptual design of the final void is described below:
The final void at West Balranald will have a contributing catchment area of approximately 52 ha, consisting only of the surface area of the void itself. All surface water runoff from the area surrounding the void will be diverted away from the void, limiting the amount of runoff that is potentially captured by the final void.
The base level of the final void will be approximately 52 mAHD, some 13.5 m below existing surrounding ground levels.
The Balranald Project DFS1 Groundwater Modelling (Jacobs, 2015) provides the following information regarding the interaction of the final void with the groundwater table:
The pre mining measured water level in the Shepparton Formation at the void is approximately 48 mAHD, and the potentiometric surface of the Loxton-Parilla Sands is approximately 48.5 mAHD.
Backfilling will provide a fill cover of at least 3.5 m above the pre-mining potentiometric surface and 4 m above the pre-mining water table elevation. The pre mining potentiometric surfaces are also likely to be conservative (ie higher) compared to the expected water levels post mining due to the sediment pile stratigraphy being replaced with more homogeneous backfill, with potentially larger porosity.
The modelled groundwater level drawdown at the mine void is between 1.2 m lower than the pre-mining water level after 100 years of recovery (ie post mining). Therefore the depth to water at the final West Balranald void will more likely be 4.7 m below ground level 100 years after mining. Recovery to pre-mining water level is expected at approximately 110 years after mining.
Based on the above, no groundwater will enter the final void (i.e. the final void will not be a groundwater sink). The total volume of the final void (below existing ground levels) is approximately 6.5 million cubic metres (capable of storing 6,500 ML of water), and the base of the void has an area of 15.1 ha.
Runoff from the final void catchment at West Balranald will collect in void and either evaporate or infiltrate through the floor of the void into the Loxton Parilla Sands aquifer.
There will be no final void at Nepean, with the open cut mining area backfilled and profiled to match surrounding ground levels.
wrmwater.com.au 1083-01-C3| 31 March 2015 | Page 47
Figure 3.11 – West Balranald post mining landuse (Source: EMM)
wrmwater.com.au 1083-01-C3| 31 March 2015 | Page 48
Figure 3.12 – Nepean post mining landuse (Source: EMM)

wrmwater.com.au 1083-01-C3| 31 March 2015 | Page 49
4 Mine water balance
4.1 OVERVIEW
The Goldsim computer-based simulation model (Goldsim Technology Group, 2014) was used to assess the dynamics of the mine water balance under conditions of varying rainfall and catchment conditions throughout the development of the Balranald Project. The Goldsim model dynamically simulates the operation of the water management system and keeps complete account of all site water volumes on a daily time step.
The model has been configured to simulate the operations of all major components of the water management system during Years 1, 4 and 8 of mine life. The simulated inflows and outflows included in the model are given in Table 4.1.
Table 4.1 – Simulated inflows and outflows to / from mine water management system
Inflows Outflows
Direct rainfall on water surface of storages Evaporation from water surface of storages
Catchment runoff Processing plant water demands
Groundwater inflows to open cut pits MUP water demands
Saline water dust suppression demands
Offsite spills from storages
The water balance model includes the following infrastructure used to manage saline and mine affected water:
West Balranald open cut mining area (Year 1, 4 and 8);
MUP Dam (Year 1, 4 and 8);
Processing area runoff dam (Year 1, 4 and 8);
Settling Dam (Year 1, 4 and 8); and
Process water dam (Year 1, 4 and 8);
Infrastructure that manages raw, filtered, potable or sediment laden water only was not included in the water balance model. The design of the raw and potable water systems are discussed in EMM (2015).
Infrastructure required as part of the groundwater management system (dewatering and injection borefields and groundwater retention dams, is discussed in the Balranald Mineral Sands Project – Water Assessment (EMM, 2015).
The runoff collection drains and dams that will manage sediment laden water will be designed as part of the ESCP and therefore have not been modelled. Although water from the runoff collection dams may be used to supplement raw water for dust suppression for modelling purposes it has been assumed that all raw water is taken from the Murrumbidgee River.
The Nepean open cut mining area is not included in the water balance model as all runoff and seepage that collects in the Nepean pit will be treated and injected into the Loxton Parilla Sands aquifer via the injection borefields, and will not impact on surface water management infrastructure.
wrmwater.com.au 1083-01-C3| 31 March 2015 | Page 50
4.2 CLIMATE DATA
Synthetic historical rainfall and evaporation data for the project area from the SILO Data Drill service (Jeffrey et al. 2001) was adopted to simulate the behaviour of the site water management system. The key advantage of adopting the Data Drill dataset is that it has been adjusted to remove accumulated totals over multiple days and to fill periods of missing data using rainfall from nearby stations. The dataset extends from 1889, and includes open water evaporation and potential evapo-transpiration estimates using Morton’s Method (Morton, 1983).
Morton’s Lake evaporation was used to estimate evaporation loss from storages. Soil moisture evapo-transpiration losses in the AWBM model were estimated using Morton’s actual evapo-transpiration over land. A factor of 0.7 was applied to evaporation from the West Balranald open cut mining area due to the reduced evaporation that occurs from within pits and voids (due to reduced wind and direct sunlight).
4.3 METHODOLOGY
4.3.1 Mine operations
The water management system was modelled for each of the selected years of mine life (Years 1, 4 and 8). For each year of mine life that is modelled, the model is run for a 125 year period using the synthetic climatic dataset (January 1889 –January 2014) assuming catchment areas and infrastructure does not change. This is called a static simulation. This simulation type is useful for providing an indication of the water balance at each year of mine life and allows for a comparison of worst case inflows and outflows between each of the modelled years. The static simulation methodology will assist in demonstrating that the mine water management system is capable of handling both the wettest and driest periods on record at the project area for each of the selected years of mine life.
The model for each year of modelled mine life was modified to reflect changes in catchments. The changes in the physical layout and mine affected water catchments between years 1, 4 and 8 are represented in the mine stage plans given in Figure 3.7 to Figure 3.10. Catchment areas (separated by the different land use types) reporting to the mine site storages are provided in Table 4.2.
Table 4.2 – Water balance model catchment areas and landuse classifications
Year of mine life
Storage Contributing catchment (ha)
Stockpile Pit Hardstand Natural TOTAL
1 West Balranald Pit
MUP Dam
Processing area runoff dam
Settling dam
Process water dam
TOTAL
30.5
79.8
0.0
0.0
0.0
110.3
43.2
0.0
0.0
0.0
0.0
43.2
0.0
2.3
23.5
0.9
1.4
28.1
0.0
9.7
3.0
0.0
0.0
12.7
73.7
91.8
26.5
0.9
1.4
194.3
4
West Balranald Pit
MUP Dam
Processing area runoff dam
Settling dam
Process water dam
TOTAL
72.4
9.4
0.0
0.0
0.0
81.8
46.0
0.0
0.0
0.0
0.0
46.0
0.0
1.8
23.5
0.9
1.4
27.6
0.0
10.0
3.0
0.0
0.0
13.0
118.4
21.2
26.5
0.9
1.4
168.4
wrmwater.com.au 1083-01-C3| 31 March 2015 | Page 51
Year of mine life
Storage Contributing catchment (ha)
Stockpile Pit Hardstand Natural TOTAL
8 West Balranald Pit
MUP Dam
Processing area runoff dam
Settling dam
Process water dam
TOTAL
26.6
9.4
0.0
0.0
0.0
9.4
78.5
0.0
0.0
0.0
0.0
0.0
0.0
1.8
23.5
0.9
1.4
27.6
0.0
10.0
3.0
0.0
0.0
13.0
105.1
21.2
26.5
0.9
1.4
50.0 Note: Dam surface areas are included within the hardstand catchment
4.3.2 Final void water and salt balance
A conceptual water volume and salt balance was undertaken on the final void at West Balranald. The water balance model was run for a 125 year period (January 1889 –January 2014) to investigate the long term behaviour of the final void as described in Section 3.4.5.
The following key assumptions were made with regards to modelling of the final void:
The final void catchment was assumed to have the same rainfall-runoff characteristics as a natural / undisturbed catchment (refer Section 4.7.1);
Runoff generated by the final void catchment will have a uniform electrical conductivity (salinity) of 5000 µS/cm;
Water will infiltrate through the floor of the final void at a rate of 2.5mm/day; and
An evaporation factor of 0.7 was adopted to account for reduced evaporation that occurs in pits and voids.
These assumptions are expected to be conservative, representing the upper limit if what may actually occur at the project site.
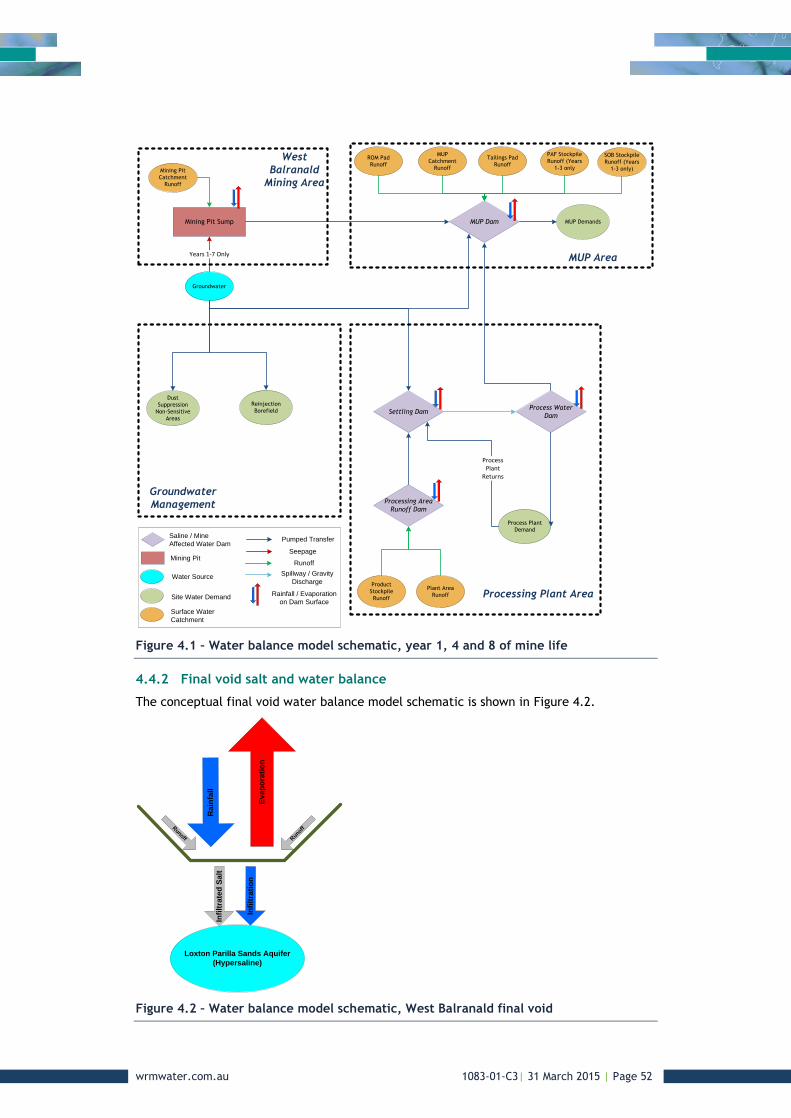
4.4 WATER BALANCE MODEL SCHEMATIC
4.4.1 Year 1, 4 and 8
The conceptual water management schematic shown in Figure 3.6 was simplified to reflect the processes represented in the water balance model. The water balance model schematic is shown in Figure 4.1. Note that no perched groundwater will seep into the West Balranald pit in Year 8, as the mining advance has halted and the West Balranald dewatering borefield will continue to operate to keep the Year 8 pit floor dry.
wrmwater.com.au 1083-01-C3| 31 March 2015 | Page 52
Figure 4.1 – Water balance model schematic, year 1, 4 and 8 of mine life
4.4.2 Final void salt and water balance
The conceptual final void water balance model schematic is shown in Figure 4.2.
Figure 4.2 – Water balance model schematic, West Balranald final void
Saline / Mine
Affected Water Dam
Mining Pit
Site Water Demand
Pumped Transfer
Seepage
Runoff
Water Source
Groundwater
Mining Pit Sump
Years 1-7 Only
MUP Dam
Mining Pit
Catchment
Runoff
ROM Pad
Runoff
MUP
Catchment
Runoff
Tailings Pad
Runoff
PAF Stockpile
Runoff (Years
1-3 only
MUP Demands
Dust
Suppression
Non-Sensitive
Areas
Reinjection
Borefield Settling DamProcess Water
Dam
Processing Area
Runoff Dam
Product
Stockpile
Runoff
Plant Area
Runoff
Process Plant
Demand
West
Balranald
Mining Area
MUP Area
Groundwater
Management
Processing Plant Area
Surface Water
Catchment
Rainfall / Evaporation
on Dam Surface
SOB Stockpile
Runoff (Years
1-3 only)
Spillway / Gravity
Discharge
ProcessPlant
Returns
Ra
infa
ll
Ev
ap
ora
tio
n
Runoff
Infi
ltra
tio
n
Runoff
Loxton Parilla Sands Aquifer
(Hypersaline)
Infi
ltra
ted
Sa
lt
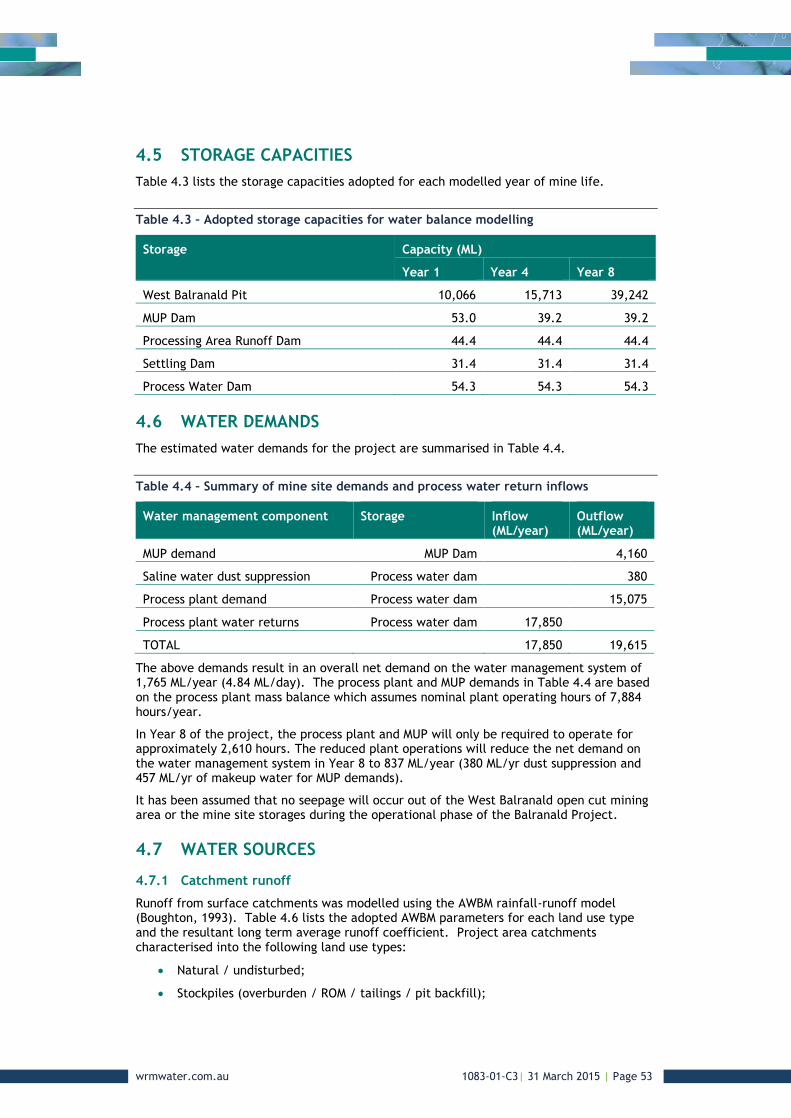
wrmwater.com.au 1083-01-C3| 31 March 2015 | Page 53
4.5 STORAGE CAPACITIES
Table 4.3 lists the storage capacities adopted for each modelled year of mine life.
Table 4.3 – Adopted storage capacities for water balance modelling
Storage Capacity (ML)
Year 1 Year 4 Year 8
West Balranald Pit 110,066 15,713 39,242
MUP Dam 53.0 39.2 39.2
Processing Area Runoff Dam 44.4 44.4 44.4
Settling Dam 31.4 31.4 31.4
Process Water Dam 54.3 54.3 54.3
4.6 WATER DEMANDS
The estimated water demands for the project are summarised in Table 4.4.
Table 4.4 – Summary of mine site demands and process water return inflows
Water management component Storage Inflow (ML/year)
Outflow (ML/year)
MUP demand 1MUP Dam 4,160
Saline water dust suppression Process water dam 380
Process plant demand Process water dam 15,075
Process plant water returns Process water dam 17,850
TOTAL 17,850 19,615
The above demands result in an overall net demand on the water management system of 1,765 ML/year (4.84 ML/day). The process plant and MUP demands in Table 4.4 are based on the process plant mass balance which assumes nominal plant operating hours of 7,884 hours/year.
In Year 8 of the project, the process plant and MUP will only be required to operate for approximately 2,610 hours. The reduced plant operations will reduce the net demand on the water management system in Year 8 to 837 ML/year (380 ML/yr dust suppression and 457 ML/yr of makeup water for MUP demands).
It has been assumed that no seepage will occur out of the West Balranald open cut mining area or the mine site storages during the operational phase of the Balranald Project.
4.7 WATER SOURCES
4.7.1 Catchment runoff
Runoff from surface catchments was modelled using the AWBM rainfall-runoff model (Boughton, 1993). Table 4.6 lists the adopted AWBM parameters for each land use type and the resultant long term average runoff coefficient. Project area catchments characterised into the following land use types:
Natural / undisturbed;
Stockpiles (overburden / ROM / tailings / pit backfill);

wrmwater.com.au 1083-01-C3| 31 March 2015 | Page 54
Roads / hardstand; and
Pit floor and open cut mining area;
AWBM parameters for stockpiles, roads / hardstand and pit and open cut mining areas were adopted based on experience at comparable mining operations. There was no data available from similar Iluka mineral sands mining operations to support further refining of AWBM parameters.
AWBM parameters for natural / undisturbed catchments were developed based on observations made during the site visit, and available information on long term volumetric runoff coefficients for arid zone catchments in Calibration of the AWBM for use on ungauged catchments (Boughton, 2003).
Table 4.5 – Adopted rainfall-runoff parameters – AWBM model
Parameter Natural / undisturbed
Stockpiles Roads / Hardstand
Pit Floor
A1 0.134 0.134 0.134 0.134
A2 0.433 0.433 0.433 0.433
C1 40 10 10 10
C2 100 100 20 20
C3 200 160 50 50
CAVG 135 114 32 32
KBASE 0.898 0.8 0.8 0.8
KSURF 0.00 0.05 0.05 0.05
BFI 0.111 0.8 0.8 0.8
Long term volumetric runoff coefficient
2.3% 5.4% 16.9% 16.9%
4.7.2 Groundwater inflows
Groundwater that reports to the open cut pit at the West Balranald mine will be dewatered to the MUP dam. A constant inflow rate of 50 L/s (1,577 ML/year) has been adopted in the water balance model for Years 1 and 4 of mine life.
Backfilling of the open cut pit at the West Balarand mine will occur in Year 8, and the West Balranald dewatering borefield will operate to keep the pit floor dry during backfilling. The West Balranald pit will not be advancing in Year 8, and hence no perched groundwater aquifers will be encountered. Therefore it is assumed there will be no groundwater seepage into the Year 8 West Balranald pit.
4.7.3 Dewatering bores
Any shortfall in mine site water demands will be made up using hypersaline water from the dewatering borefield at West Balranald. Hypersaline water from the West Balranald dewatering borefield can be transferred directly to either the MUP dam or the process water dam. Note that the dewatering borefield will be used to extract sufficient water to supply the net Year 8 demand outlined in Section 4.6. The predicted dewatering borefield production volumes (Jacobs, 2015) are as follows:
Year 1: 18,524 ML/year;
Year 4: 22,217 ML/year; and
Year 8: 837 ML/year.

wrmwater.com.au 1083-01-C3| 31 March 2015 | Page 55
4.8 PUMP CAPACITIES AND TRANSFER RULES
Table 4.6 lists the adopted operating rules for the water balance model.
Table 4.6 – Water balance model operational rules
Water balance component
Operational rules
Groundwater Continuously drains into West Balranald pit as described in Section 4.7
Water Demands:
MUP demand
Saline water dust suppression
Process plant demand
Process plant return
Demands from the MUP dam at rate listed in Section 4.6.
Demands from the process water dam at rate listed in Section 4.6.
Demands from the process water dam at rate listed in Section 4.6.
Continuously deposited into process water dam at rate listed in Section 4.6.
West Balranald pit
Continuous dewatering at 120 L/s to MUP dam when volume available.
Settling Dam Receives process plant return flows.
Receives pumped transfers from processing area runoff dam.
Discharges to process water dam via gravity overflow.
Pumping of water into settling dam from processing plant runoff dam stops when process water dam volume exceeds 53.0 ML.
Process Water Dam Receives overflows from settling dam via gravity.
Supplies process plant demand.
Supplies saline water dust suppression demand.
Continuously Transfers water to MUP dam at 100 L/s when water is available.
Pumping of water into process plant dam from MUP stops when process plant dam volume exceeds 53.0 ML.
MUP Dam Receives dewatering flows from West Balranald Pit.
Receives transfers of excess water from process water dam.
Pumping into MUP dam from West Balranald pit ceases when dam volume exceeds 40.5 ML (Year 1), or 35.7 ML (Year 4). The West Balranald pit is not dewatered in Year 8.
Transfer of excess water from process water dam into MUP dam is continuous when water is available in process water dam.
Supplies MUP demand.
Transfers water back to process water dam at 100 L/s when volume available, and MUP dam volume exceeds 40.5 ML.

wrmwater.com.au 1083-01-C3| 31 March 2015 | Page 56
Water balance component
Operational rules
Processing area runoff dam
Transfers water to settling dam at 60 L/s when processing area runoff dam volume exceeds 32.5 ML (Year 1 and 4) or 2 ML (Year 8), and the process water dam volume is less than 53 ML.
4.9 WATER BALANCE MODEL RESULTS
The Goldsim model was used to assess the performance of the proposed water management system, including:
mine storage inventory;
hypersaline makeup water requirements from borefield dewatering;
uncontrolled spills from the mine water storages; and
the overall water balance within the project area.
It is important to note that investigation outcomes are dependent on the accuracy of input assumptions. There is inherent uncertainty with respect to some key site characteristics (e.g. catchment yield/rainfall runoff, mining area groundwater inflows) which cannot be accurately determined prior to the commencement of operations. The sensitivity of model parameters is investigated in Section 4.11.
Water balance model results for Years 1, 4 and 8 of mine life and the final void are presented in the following sections.
4.9.1 Year 1
The Year 1 water balance model results are summarised in Table 4.7 and Table 4.8. The following is of note with regards to the behaviour of the West Balranald pit in Year 1:
The maximum volume of water predicted to accumulate in the West Balranald pit over the 125 year continuous water balance model simulation of Year 1 conditions is 210.0 ML, and the median volume of water stored in the pit over the simulation period is 4.3 ML. The 95th percentile pit volume is 4.7 ML (i.e. 95% of the time the volume of water stored in the pit is less than 4.7 ML). A long term average of 1,570 ML/year is predicted to be transferred from the West Balranald pit to the MUP dam over the 125 year simulation period.
The Year 1 water balance simulation predicts that the volume of water in the West Balranald pit would exceed 5 ML for seven consecutive days on 15 occasions over the 125 year simulation period.
The following key points are of note with regards to the predicted behaviour of the Year 1 MUP dam:
The Year 1 MUP dam is predicted to spill in one year of the 125 year simulation period. The predicted total volume of spills over the spill year is 16.8 ML, via two separate spill events that occur within 23 days of each other. Uncontrolled releases of mine affected water predicted by the water balance model are due to an extreme wet weather event within the period of climatic record used for modelling. The historical climatic event which results in uncontrolled releases of mine water has an AEP of less than 1 in 100 (equating to a probability of less than 1% in any given year of mine life). Further, the predicted volume of uncontrolled releases during this extreme historical rainfall event is small and will be diluted with large amounts of clean runoff. It is expected that any uncontrolled releases could be contained within the project area due to the small volume and distance between the dam and project area boundary.

wrmwater.com.au 1083-01-C3| 31 March 2015 | Page 57
A long term average of 59.2 ML/year of water is predicted to be transferred from the Year 1 MUP dam to the process water dam over the 125 year simulation period.
The median Year 1 MUP dam volume over the simulation is 10.8 ML, and the 95th percentile MUP dam volume is 31.4 ML.
The following key points are of note with regards to the predicted behaviour of the processing area runoff dam in Year 1:
The processing area runoff dam is predicted to spill in one year of the 125 year simulation period under Year 1 conditions. The predicted total spill volume is 6.9ML, and occurs from the single extreme historical rainfall event.
The median processing area runoff dam volume over the Year 1 simulation is 14.0 ML, and the 95th percentile dam volume is 29.5 ML. A long term average of 5.1 ML/year of water is predicted to be transferred from the processing area runoff dam to the settling dam over the 125 year simulation period.
The following key points are of note with regards to the predicted behaviour of the process water dam in Year 1:
The maximum volume of water predicted to accumulate in the process water dam under Year 1 conditions is 54.3 ML. The median process water dam volume for the Year 1 simulation is 48.8ML and the 95th percentile dam volume is 49.1 ML. A long term average of 2,372 ML/year of water is predicted to be transferred from the process water dam to the MUP dam over the 125 year simulation period.
The process water dam is not predicted to spill during the Year 1 conditions simulation.
The following key points are of note with regards to the predicted transfer of water within the water management system and supply of mine site demands at West Balranald during Year 1:
The settling dam transfers water continuously into the process water dam at an average rate of 48.9 ML/day over the Year 1 simulation. A long term average of 17,853 ML/year is predicted to be transferred via overflow from the settling dam into the process water dam over the 125 year simulation period.
The Year 1 MUP dam is predicted to supply the MUP demand of 11.4 ML/day on 26.5% of all days over the 125 year simulation period. A long term average of 0.54 ML/day (195.8 ML/year) of hypersaline makeup water would be required from the dewatering borefield to completely satisfy MUP demands.
The process water dam is predicted to supply the full saline water dust suppression and process plant demands for 99.7% of all days over the 125 year simulation period. The long term average volume of hypersaline makeup water required to supply the saline water dust suppression and processing plant demand is about 1.2 ML/year.
Table 4.7 – Year 1 water balance model results – storage volumes and overflows
Storage Maximum volume
(ML)
Median volume
(ML)
95th %ile volume
(ML)
No. Spill years
Total spill
volume (ML)
West Balranald Pit 210.0 4.3 4.7 0 0.0
MUP Dam 53.0 10.8 31.4 1 16.8
Processing Area Runoff Dam 44.4 14.0 29.5 1 6.9
Settling Dam 31.4 31.4 31.4 0 0.0
Process Water Dam 54.3 48.8 49.1 0 0.0
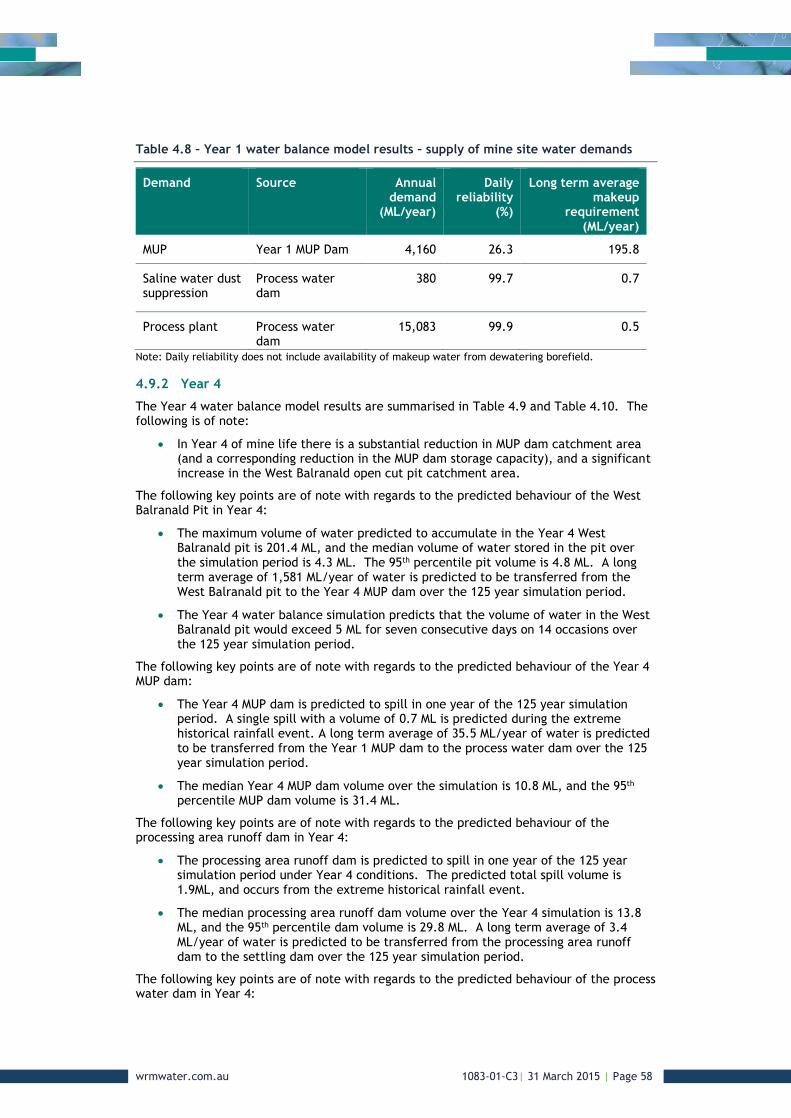
wrmwater.com.au 1083-01-C3| 31 March 2015 | Page 58
Table 4.8 – Year 1 water balance model results – supply of mine site water demands
Demand Source Annual demand
(ML/year)
Daily reliability
(%)
Long term average makeup
requirement (ML/year)
MUP Year 1 MUP Dam 4,160 26.3 195.8
Saline water dust suppression
Process water dam
380 99.7 0.7
Process plant Process water dam
15,083 99.9 0.5
Note: Daily reliability does not include availability of makeup water from dewatering borefield.
4.9.2 Year 4
The Year 4 water balance model results are summarised in Table 4.9 and Table 4.10. The following is of note:
In Year 4 of mine life there is a substantial reduction in MUP dam catchment area (and a corresponding reduction in the MUP dam storage capacity), and a significant increase in the West Balranald open cut pit catchment area.
The following key points are of note with regards to the predicted behaviour of the West Balranald Pit in Year 4:
The maximum volume of water predicted to accumulate in the Year 4 West Balranald pit is 201.4 ML, and the median volume of water stored in the pit over the simulation period is 4.3 ML. The 95th percentile pit volume is 4.8 ML. A long term average of 1,581 ML/year of water is predicted to be transferred from the West Balranald pit to the Year 4 MUP dam over the 125 year simulation period.
The Year 4 water balance simulation predicts that the volume of water in the West Balranald pit would exceed 5 ML for seven consecutive days on 14 occasions over the 125 year simulation period.
The following key points are of note with regards to the predicted behaviour of the Year 4 MUP dam:
The Year 4 MUP dam is predicted to spill in one year of the 125 year simulation period. A single spill with a volume of 0.7 ML is predicted during the extreme historical rainfall event. A long term average of 35.5 ML/year of water is predicted to be transferred from the Year 1 MUP dam to the process water dam over the 125 year simulation period.
The median Year 4 MUP dam volume over the simulation is 10.8 ML, and the 95th percentile MUP dam volume is 31.4 ML.
The following key points are of note with regards to the predicted behaviour of the processing area runoff dam in Year 4:
The processing area runoff dam is predicted to spill in one year of the 125 year simulation period under Year 4 conditions. The predicted total spill volume is 1.9ML, and occurs from the extreme historical rainfall event.
The median processing area runoff dam volume over the Year 4 simulation is 13.8 ML, and the 95th percentile dam volume is 29.8 ML. A long term average of 3.4 ML/year of water is predicted to be transferred from the processing area runoff dam to the settling dam over the 125 year simulation period.
The following key points are of note with regards to the predicted behaviour of the process water dam in Year 4:

wrmwater.com.au 1083-01-C3| 31 March 2015 | Page 59
The maximum volume of water predicted to accumulate in the process water dam under Year 4 conditions is 54.3 ML. The median process water dam volume for the Year 4 simulation is 48.8ML and the 95th percentile dam volume is 49.0 ML. A long term average of 2,373 ML/year of water is predicted to be transferred from the process water dam to the MUP dam over the 125 year simulation period.
The process water dam is not predicted to spill during the Year 4 conditions simulation.
The following key points are of note with regards to the predicted transfer of water within the water management system and supply of mine site demands at West Balranald during Year 4:
The settling dam transfers water continuously into the process water dam at an average rate of48.9 ML/day over the Year 4 simulation. A long term average of 17,852 ML/year is predicted to be transferred via overflow from the settling dam into the process water dam over the 125 year simulation period.
The Year 4 MUP dam is predicted to supply the full MUP demand on 25.3% of all days over the 125 year simulation period. A long term average of 0.55 ML/day (200.8 ML/year) of hypersaline makeup water would be required from the dewatering borefield to completely satisfy MUP demands.
The process water dam is predicted to supply the full saline water dust suppression and process plant demands for 99.7% of all days over the 125 year simulation period. The long term average volume of hypersaline makeup water required to supply the saline water dust suppression and processing plant demand is about 1.2 ML / year.
Table 4.9 – Year 4 water balance model results – storage volumes and overflows
Storage Maximum volume
(ML)
Median volume
(ML)
95th %ile volume
(ML)
No. Spill years
Total spill
volume (ML)
West Balranald Pit 201.4 4.3 4.8 0 0.0
MUP Dam 53.0 10.8 31.4 1 0.7
Processing Area Runoff Dam 44.4 13.8 29.8 1 1.9
Settling Dam 31.4 31.4 31.4 0 0.0
Process Water Dam 54.3 48.8 49.0 0 0.0
Table 4.10 – Year 4 water balance model results – supply of mine site water demands
Demand Source Annual demand
(ML/year)
Daily reliability
(%)
Long term average makeup
requirement (ML/year)
MUP Year 4 MUP Dam 4,160 25.3 200.8
Saline water dust suppression
Process water dam
380 99.7 0.7
Process plant Process water dam
15,083 99.9 0.5
Note: Daily reliability does not include availability of makeup water from dewatering borefield.

wrmwater.com.au 1083-01-C3| 31 March 2015 | Page 60
4.9.3 Year 8
The Year 8 water balance model results are summarised in Table 4.11. The following is of note:
The catchment area and size of the MUP dam remains the same between Year 4 and Year 8.
Without regular dewatering of groundwater from the West Balranald open cut pit, the dewatering borefields will be relied upon to provide almost all of the 837 ML/year net makeup demand for the Year 8 conditions. The makeup water would be pumped into the settling dam, before overflowing into the process water dam for use in the plant or transfer to the MUP dam.
The settling dam will be topped up with water from the extraction borefield to ensure the process water dam has a continuous supply of water during Year 8.
The demand reliability table is not shown, as the vast majority of water supplied from the dewatering borefield in Year 8, as only runoff water will be dewatered from the West Balranald open cut mining area.
The following key points are of note with regards to the predicted behaviour of the West Balranald Pit in Year 8:
The maximum volume of water predicted to accumulate in the Year 8 West Balranald pit is 58.5 ML, and the median volume of water stored in the pit over the simulation period is 0.0 ML. The 95th percentile pit volume is 0.1 ML.
The Year 8 water balance simulation predicts that the volume of water in the West Balranald pit would exceed 5 ML for seven consecutive days on 1 occasion over the 125 year simulation period.
The following key points are of note with regards to the predicted behaviour of the MUP dam in Year 8:
The maximum volume of water predicted to accumulate in the Year 8 MUP dam is 36.6 ML. The median Year 8 MUP dam volume over the simulation is 0.0 ML, and the 95th percentile dam volume is 0.2 ML. The MUP dam is not predicted to spill during the Year 8 simulation.
The following key points are of note with regards to the predicted behaviour of the processing area runoff dam in Year 8:
The maximum volume of water predicted to accumulate in the processing area runoff dam during the Year 8 simulation is 9.0 ML. The median processing area runoff dam volume over the Year 8 simulation is 0.2 ML, and the 95th percentile dam volume is 0.9 ML. The Processing area runoff dam is not predicted to spill during the Year 8 simulation.
The following key points are of note with regards to the predicted behaviour of the process water dam in Year 8:
The maximum volume of water predicted to accumulate in the process water dam under Year 8 conditions is 53.1 ML. The median process water dam volume is 0.0 ML and the 95th dam volume for the Year 8 simulation is 11.8 ML.
The process water dam is not predicted to spill during the Year 8 conditions simulation.

wrmwater.com.au 1083-01-C3| 31 March 2015 | Page 61
Table 4.11 – Year 8 water balance model results – storage volumes and overflows
Storage Maximum volume
(ML)
Median volume
(ML)
95th %ile volume
(ML)
No. Spill years
Total spill
volume (ML)
West Balranald Pit 58.5 0.0 0.1 0 0.0
MUP Dam 36.6 0.0 0.2 0 0.0
Processing Area Runoff Dam 9.0 0.2 0.9 0 0.0
Settling Dam 31.4 31.4 31.4 0 0.0
Process Water Dam 53.1 0.0 11.8 0 0.0
4.9.4 Final void water and salt balance
Figure 4.3 shows the predicted behaviour of predicted water volumes and salinity in the West Balranald final void over a 125 year simulation period. The following is of note:
The maximum volume of water predicted to accumulate in the West Balranald final void is 34 ML. All rainfall and runoff that collects in the final void will evaporate or infiltrate to the groundwater.
Due to daily evaporation exceeding the adopted infiltration rate, some salt will accumulate in the final void. The salt will precipitate out as the water in the final void evaporates, and be resuspended when the void fills with rainfall and runoff.
The predicted maximum EC of water in the final void (when the volume of water in the final void exceeds 1ML) is about 43,000 µS/cm, and the long term average EC of any water in the final void (exceeding 1ML) is about 8,500 µS/cm.
The final void is predicted to behave in a similar hydrologic manner to the nearby dry lakes and surface depressions.
Figure 4.3 – Predicted behaviour of West Balranald final void water storage and electrical conductivity
wrmwater.com.au 1083-01-C3| 31 March 2015 | Page 62
4.10 WATER BALANCE MODEL RESULTS SUMMARY
4.10.1 Year 1, 4 and 8
The water balance model results for Years 1, 4 and 8 of mine life can be summarised as follows:
For Year 1 and 4 site conditions the average annual risk of an uncontrolled release (spill) of mine affected water is less than 1%. No uncontrolled releases of mine affected water are predicted for Year 8 site conditions.
The simulated uncontrolled releases of water from mine affected water storages are associated with the same rainfall event (February 2011), which had 72-hour rainfall intensities some 34% greater than estimated 1 in 100 AEP rainfalls. The statistical significance of the February 2011 event is discussed in Section 5.3.2.
The proposed water management system is adequately configured to prevent long term inundation of the West Balranald pit. The water balance model predicts that the volume of water stored in the West Balranald pit would exceed 5 ML for 14 consecutive days on 15 and 14 occasions for Year 4 and Year 8 site conditions respectively. The maximum pit water volume for Year 4 and 8 is associated with the February 2011 rainfall event.
The water management system maximises the capture and reuse of mine affected water. The predicted long term average volume of required makeup water ranges from 197.0 ML/year (Year 1) to 1,738 ML/year (Year 8). The volumes of required makeup water are significantly less than the volumes of hypersaline water that are predicted to be produced by the dewatering borefield (refer Section 4.7.3).
Table 4.12 presents an annual summary water balance for average (mean annual rainfall), wet (90th percentile annual rainfall) and dry (10th percentile annual rainfall) years for Years 1, 4 and 8 of mine life. The following is of note:
Evaporation from site water storages exceeds catchment runoff and direct rainfall for both average and dry rainfall years;
The mine water management system will provide a significant portion of the net mine site demand in Years 1 and 4, irrespective of climatic conditions, however in Year 8 the mine water management system will supply little or none of the net mine site demand.
Sufficient hypersaline makeup water from the dewatering borefields (refer Section 4.7.3) will be available to satisfy all MUP, process plant and saline water dust suppression demands at all stages of mine life.
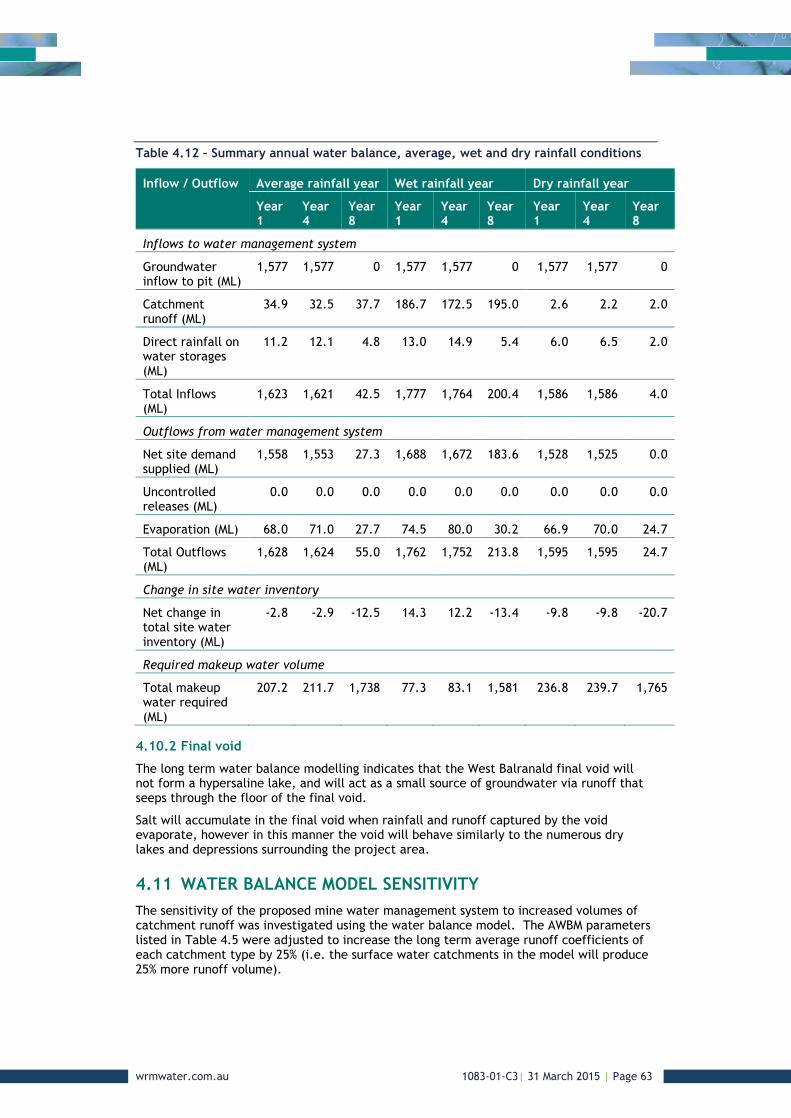
wrmwater.com.au 1083-01-C3| 31 March 2015 | Page 63
Table 4.12 – Summary annual water balance, average, wet and dry rainfall conditions
Inflow / Outflow Average rainfall year Wet rainfall year Dry rainfall year
Year 1
Year 4
Year 8
Year 1
Year 4
Year 8
Year 1
Year 4
Year 8
Inflows to water management system
Groundwater inflow to pit (ML)
1,577 1,577 0 1,577 1,577 0 1,577 1,577 0
Catchment runoff (ML)
34.9 32.5 37.7 186.7 172.5 195.0 2.6 2.2 2.0
Direct rainfall on water storages (ML)
11.2 12.1 4.8 13.0 14.9 5.4 6.0 6.5 2.0
Total Inflows (ML)
1,623 1,621 42.5 1,777 1,764 200.4 1,586 1,586 4.0
Outflows from water management system
Net site demand supplied (ML)
1,558 1,553 27.3 1,688 1,672 183.6 1,528 1,525 0.0
Uncontrolled releases (ML)
0.0 0.0 0.0 0.0 0.0 0.0 0.0 0.0 0.0
Evaporation (ML) 68.0 71.0 27.7 74.5 80.0 30.2 66.9 70.0 24.7
Total Outflows (ML)
1,628 1,624 55.0 1,762 1,752 213.8 1,595 1,595 24.7
Change in site water inventory
Net change in total site water inventory (ML)
-2.8 -2.9 -12.5 14.3 12.2 -13.4 -9.8 -9.8 -20.7
Required makeup water volume
Total makeup water required (ML)
207.2 211.7 1,738 77.3 83.1 1,581 236.8 239.7 1,765
4.10.2 Final void
The long term water balance modelling indicates that the West Balranald final void will not form a hypersaline lake, and will act as a small source of groundwater via runoff that seeps through the floor of the final void.
Salt will accumulate in the final void when rainfall and runoff captured by the void evaporate, however in this manner the void will behave similarly to the numerous dry lakes and depressions surrounding the project area.
4.11 WATER BALANCE MODEL SENSITIVITY
The sensitivity of the proposed mine water management system to increased volumes of catchment runoff was investigated using the water balance model. The AWBM parameters listed in Table 4.5 were adjusted to increase the long term average runoff coefficients of each catchment type by 25% (i.e. the surface water catchments in the model will produce 25% more runoff volume).

wrmwater.com.au 1083-01-C3| 31 March 2015 | Page 64
The Year 1, 4 and 8 water balance models were rerun for the 125 year simulation period using the increased runoff parameters. The following is of note with regards to the sensitivity analysis results:
For the Year 1 scenario, the chance of an uncontrolled release occurring from the mine water management system increases to 1.6% in any year (i.e. only two uncontrolled releases occur over the 125 year simulation period). There a 21 occasions when the West Balranald pit would be inundated by greater than 5 ML of water for longer than seven consecutive days.
For the Year 4 scenario, the chance of an uncontrolled release occurring from the mine water management system is still less than 1% in any year (i.e. only one uncontrolled releases occur over the 125 year simulation period). There a 26 occasions when the West Balranald pit would be inundated by greater than 5 ML of water for longer than seven consecutive days.
There are no predicted uncontrolled release from the mine water management in the Year 8 scenario.
The above results indicate that the mine water management system is suitably robust, and will be capable of adequately managing increased runoff volumes should they occur.

wrmwater.com.au 1083-01-C3| 31 March 2015 | Page 65
5 Box Creek flood assessment
5.1 OVERVIEW
The TUFLOW hydrodynamic model (WBM, 2010) was used to simulate the flow behaviour in Box Creek and its floodplain (including Muckee, Pitarpunga and Tin Tin lakes) in the vicinity of the project area, and investigate the possibility of the West Balranald mine and final void becoming inundated by floodwater.
The Nepean mine is located on a ridgeline and is not in the vicinity of Box Creek or its floodplain, and was excluded from the TUFLOW model as no flood impact assessment is required for this component of the Balranald Project.
TUFLOW represents hydraulic conditions on a fixed grid by solving the full two-dimensional depth averaged momentum and continuity equations for free surface flow. The model automatically calculates breakout points and flow directions.
5.2 AVAILABLE DATA
5.2.1 Topographic data
Iluka provided ASCII grid files of XYZ data at 5m intervals, covering the Balranald Project site and surrounding area. The ASCII grid data was derived from photogrammetry of high resolution aerial imagery, and has vertical accuracy of 0.4m (68th percentile) and horizontal accuracy of <1m.
The ASCII grids were converted to digital elevation model (DEM) for use in TUFLOW modelling.
5.2.2 Daily rainfall data
Daily rainfall data from BoM stations at Balranald (RSL) (station no. 049002) and Oxley (Walmer Downs) (station no. 049055) were obtained for the period July 2010 to June 2011. The locations of these rainfall stations are shown in Figure 2.1.
5.3 ESTIMATION OF DISCHARGES
5.3.1 Overview
It is difficult to estimate design discharges in Box Creek at the project area due to the complicated nature of flooding upstream (See Section 2.4). Flooding in Box Creek can be caused by local catchment rainfall events (such as the 2010 / 2011 flood event), floodwater overflowing from the Lachlan River into Merrowie and Middle Creek and draining into Box Creek (such as occurred in the 1956 and 1974 flood events) or a combination of both.
5.3.2 Local catchment rainfall
As outlined in Section 2.4.1, there was significant flood event in Box Creek in February 2011, which was due to local catchment rainfall alone. The estimated peak discharge in Box Creek downstream of the Balranald Ivanhoe Road during the February 2011 event was approximately 150 m3/s. It is of note that the February 2011 flood did not have sufficient volume to cause Tin Tin and Pitarpunga lakes to fill and overflow back into Box Creek.
Daily rainfall data at Balranald (RSL) (station no. 049002) and Oxley (Walmer Downs) (station no. 049055) for the event were analysed in accordance with the procedures outlined in Australian Rainfall & Runoff, A Guide to Flood Estimation (IEAust, 1998) to determine the possible AEP of the rainfall event. Table 5.1 summarises the results of the rainfall analysis. The following is of note:

wrmwater.com.au 1083-01-C3| 31 March 2015 | Page 66
Rainfall totals and intensities presented in Table 5.1 are restricted rainfalls (i.e. are based on 24-hour totals to 9.00am on any given day). It is possible that unrestricted rainfall totals and intensities were higher than those reported in Table 5.1.
Rainfalls at Balranald (RSL) for storm durations ranging from 24-hours to 72-hours had AEPs of between 1 in 20 and 1 in 50;
Rainfalls at Oxley (Walmer Downs) for storm durations ranging from 24-hours to 72-hours had AEPs exceeding 1 in 100. In particular, the restricted 48-hour and 72-hour rainfall intensities at Oxley (Walmer Downs) during the February 2011 event were approximately a third higher than the 1 in 100 AEP design rainfall intensities for these storm durations.
The catchment of Box Creek upstream of Balranald Ivanhoe Road is located in close proximity to the Oxley (Walmer Downs) rainfall station.
Therefore it can be concluded that a peak discharge in Box Creek downstream of the Balranald Ivanhoe Road (draining into Pitarpunga Lake) of 150 m3/s is associated with a two day rainfall event that exceeded 1 in 100 AEP.
Table 5.1 – Estimated AEP of February 2011 rainfall event in Box Creek catchment
Storm Duration Balranald (RSL) Oxley (Walmer Downs)
Rainfall total (mm)
Average rainfall intensity (mm/hr)
Estimated AEP of rainfall
Rainfall total (mm)
Average rainfall intensity (mm/hr)
Estimated AEP of rainfall
24-hours 81.3 3.4 1 in 20 118.0 4.9 > 1 in 100
48-hours 119.7 2.5 1 in 50 182.0 3.8 > 1 in 100
72-hours 120.9 1.7 1 in 50 197.0 2.7 > 1 in 100
5.3.3 Merrowie and Middle creeks
The DNR (2005) study nominated the 1990 flood event in the Lachlan River as the design event for the assessment of the Hillston Floodplain Management Plan, and assigns it an AEP of between 1 in 60 and 1 in 70. The DNR (2005) study estimates that during the 1990 flood event, the peak discharge in Merrowie Creek was 5,700 ML/day (66 m3/s), and the peak discharge in Middle Creek was 7,600 ML/day (88 m3/s). This gives a total peak discharge of 13,300 ML/day (154 m3/s) that may have flowed into Box Creek from the Lachlan River system. There are a large number of dry lakes and floodplain storages between Hillston and the project area that would mitigate this flow as it drained down the system.
In fact, based on the observations made by landholders it appears that during the 1990 flood event, little water flowed along Box Creek in the vicinity of the project area, indicating that very little of the floodwater in Merrowie and Middle creeks made it to the project area, despite flow occurring in Merrowie and Middle creeks for a long period of time at Hillston (six months). It is not known if the floodwater from Merrowie and Middle Creek reached Pitarpunga and Tin Tin lakes.
Notwithstanding, if it is assumed that all of the lakes and storages in the Merrowie and Middle Creek systems were full and there were no losses downstream of Hillston, peak flood discharges of 13,300 ML/day or 154 m 3/s could reach the project area, and this discharge would possibly continue for weeks or months. Given that the 1990 flood was assigned an AEP of 1 in 60 to 1 in 70, a peak discharge in Box Creek at the project area of 150m3/s is likely to have a significantly lower AEP (i.e. is likely to occur less frequently than a 1 in 70 event).

wrmwater.com.au 1083-01-C3| 31 March 2015 | Page 67
5.3.4 Adopted design discharge for hydraulic modelling
Based on the points outlined in Section 5.3.2 and 5.3.3, a constant discharge of 300 m3/s has been adopted in Box Creek for the purposes of investigating the possibility of the West Balranald pit and final void becoming inundated by floodwater overflowing from Box Creek or the nearby lakes. Such a discharge is considered to represent a flood event of greater than 1 in 100 AEP, although it is not possible to assign an exact AEP to this flow.
The adopted discharge is considered a conservative estimate of a flood event well in excess of 1 in 100 AEP for the following reasons:
The adopted Box Creek discharge for hydraulic modelling in this study is twice the estimated February 2011 peak discharge in Box Creek prior to entering Pitarpunga and Tin Tin lakes;
Rainfalls in the catchment of Box Creek during the February 2011 event had an estimated AEP of greater than 1 in 100. Despite the high peak discharge, the February 2011 flood event did not contain sufficient volume to fill Pitarpunga and Tin Tin lakes. Therefore a local rainfall event significantly larger than the February 2011 rainfall event would be required to cause the lakes to fill and overflow.
The adopted Box Creek discharge for hydraulic modelling in this study is approximately twice the estimated peak discharge in Merrowie and Middle creeks during the 1990 event from the Lachlan River (DNR, 2005).
The 1990 Lachlan River flood had an estimated AEP of between 1 in 60 and 1 in 70 (DNR, 2005).
Little flooding was reported in Box Creek during the 1990 event indicating that very little of the Merrowie and Middle creek floodwater made it to Box Creek downstream of Pitarpunga and Tin Tin lakes.
The adopted discharge would therefore be consistent with the following scenarios:
o A local catchment rainfall event significantly exceeding 1 in 100 AEP design rainfalls, that occurs when Pitarpunga and Tin Tin lakes and all floodplain storages are full; or
o A Lachlan River flood exceeding a 1 in 70 AEP design flood, that occurs when all lakes and floodplain storages in Merrowie, Middle and Box creeks are full, enabling the transmission of all floodwaters from Merrowie and Middle creeks downstream to Box Creek in the vicinity of the project area.
5.4 ESTIMATION OF FLOOD LEVELS AND EXTENTS
5.4.1 TUFLOW model configuration
Figure 5.1 shows the configuration of the TUFLOW model used to assess the potential for flooding of the West Balranald mine and final void. The following is of note:
The TUFLOW model extent is approximately 306 km2, commencing about 11 km upstream and terminating 7 km downstream of the West Balranald mine, and including Box Creek, Muckee, Pitarpunga and Tin Tin lakes. A 20 m grid size (i.e. 20 m x 20 m cells) was adopted for the model.
The TUFLOW model uses Manning’s ‘n’ values to represent hydraulic resistance (notionally channel or floodplain roughness). Manning’s ‘n’ values were initially selected based on typical published values (for example, those of Chow, 1959). The adopted Manning’s n values for the TUFLOW model (shown in Figure 5.2) are:
o Saltbush dunes (densely vegetated): ‘n’ = 0.05;
o Lakes (drowned): ‘n’ = 0.03;
o Box Creek flowpath downstream of Tin Tin Lake (sparsley vegetated): ‘n’ = 0.04;

wrmwater.com.au 1083-01-C3| 31 March 2015 | Page 68
A normal depth boundary was used as the downstream boundary of the TUFLOW model. The model results at the West Balranald mine are not sensitive to the adopted downstream boundary condition.
An initial water level of 61.1mAHD was adopted in the hydraulic model. The adopted initial water level will fill both Tin Tin and Pitarpunga lakes with water prior to the start of the model simulation. This equates to a storage volume of 31,851 ML, which is equivalent to 1.25 days of constant 300 m3/s inflows.
A constant inflow of 300 m3/s was adopted in the model, and applied where Box Creek enters Pitarpunga Lake. The inflow is constant over the 600 hour (25 day) simulation period, allowing the model to approach steady state (i.e. the inflow to Pitarpunga Lake matches the outflow from the hydraulic model).
The adopted initial water level and constant inflow will ensure that flood levels and extents estimated by the model are conservative.
5.4.2 Model results
Figure 5.3 shows the flood extent predicted by the hydraulic model, and Table 5.2 lists predicted peak water levels at the key locations shown on Figure 5.3. The following is of note:
Peak flood levels in the vicinity of the West Balranald mine range from 62.09 mAHD to 62.04 mAHD;
The indicative location of the West Balranald final void is not predicted to be inundated by flooding from Box Creek;
The West Balranald and Nepean mine infrastructure is located outside of the predicted Box Creek and Tin Tin Lake flood extent;
Parts of the Nepean access road and injection borefields are located within the flood extent of Box Creek and Tin Tin Lake. The Nepean access road will be constructed at existing ground levels, and will therefore not have any impact on predicted flood levels, velocities or flow distributions. It is possible that should a major flood event occur, the Nepean access road may be inundated and non-trafficable for an extended period of time.
The injection borefields alongside the Nepean access road will not impact on flood levels, velocities or flow distributions, as the injection well heads are small and will present little obstruction to flow. The windrows alongside the pipelines are unlikely to impact on peak flood levels, and predicted flood flow velocities are very low (less than 0.1m/s) within the injection borefield areas, limiting the possibility of the injection infrastructure causing erosion damage.
Part of the West Balranald Mining area is potentially inundated by floodwater that backs up into Muckee Lake from Pitarpunga Lake. Inundation in this area could be managed via the construction of a small bund to prevent floodwater from Muckee Lake from entering the project area. The bund would be located within the project disturbance area.
The predicted extent of flooding matches well with the limits of alluvium shown in the aerial photograph in Figure 5.3. The white / grey earth (alluvium) is typically located in low lying areas that would be subject to periodic inundation. The red and orange earth is located in higher ground areas, and would typically be free from inundation during flood events.
Table 5.2 – Predicted peak flood levels in vicinity of West Balranald mine

wrmwater.com.au 1083-01-C3| 31 March 2015 | Page 69
Location Ground level (mAHD)
Predicted peak flood level (mAHD)
Comment
A 55.63 62.09 Muckee Lake adjacent to West Balranald mine
B 57.90 62.08 Pitarpunga Lake
C 61.70 62.06 Pitarpunga Lake adjacent to West Balranald final void
D 59.00 62.05 Tin Tin Lake
E 60.35 62.04 Box Creek floodplain south of West Balranald mine
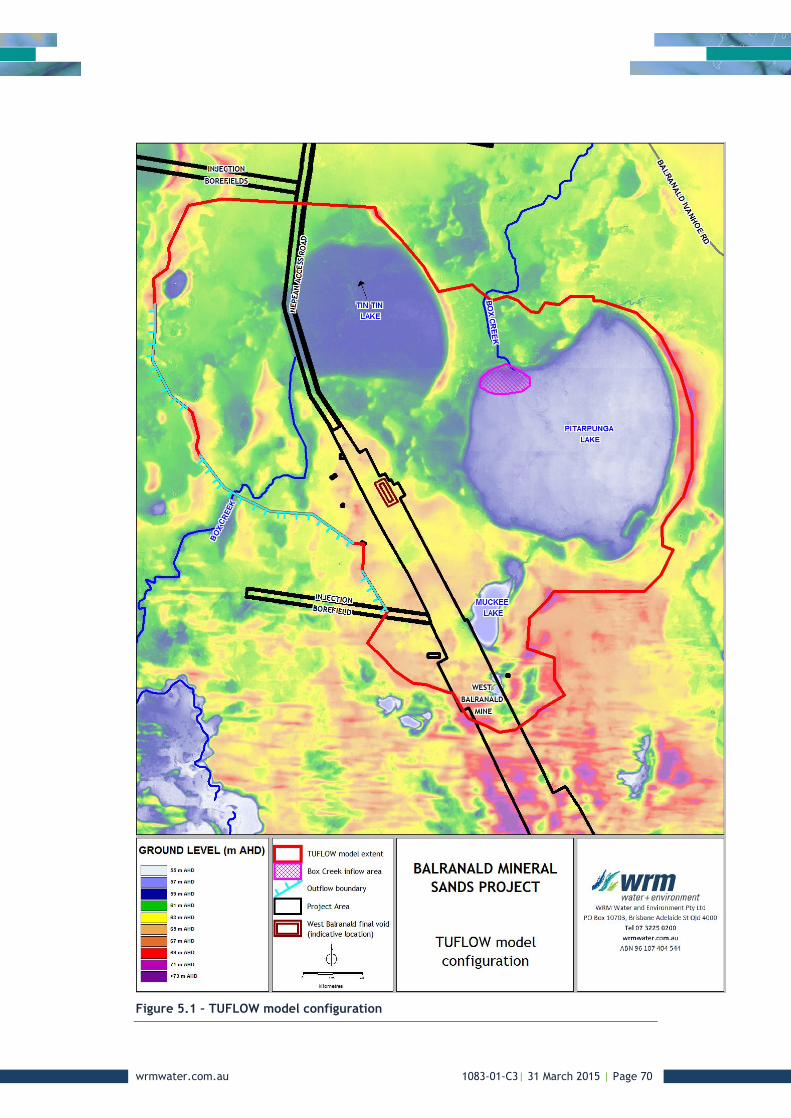
wrmwater.com.au 1083-01-C3| 31 March 2015 | Page 70
Figure 5.1 – TUFLOW model configuration
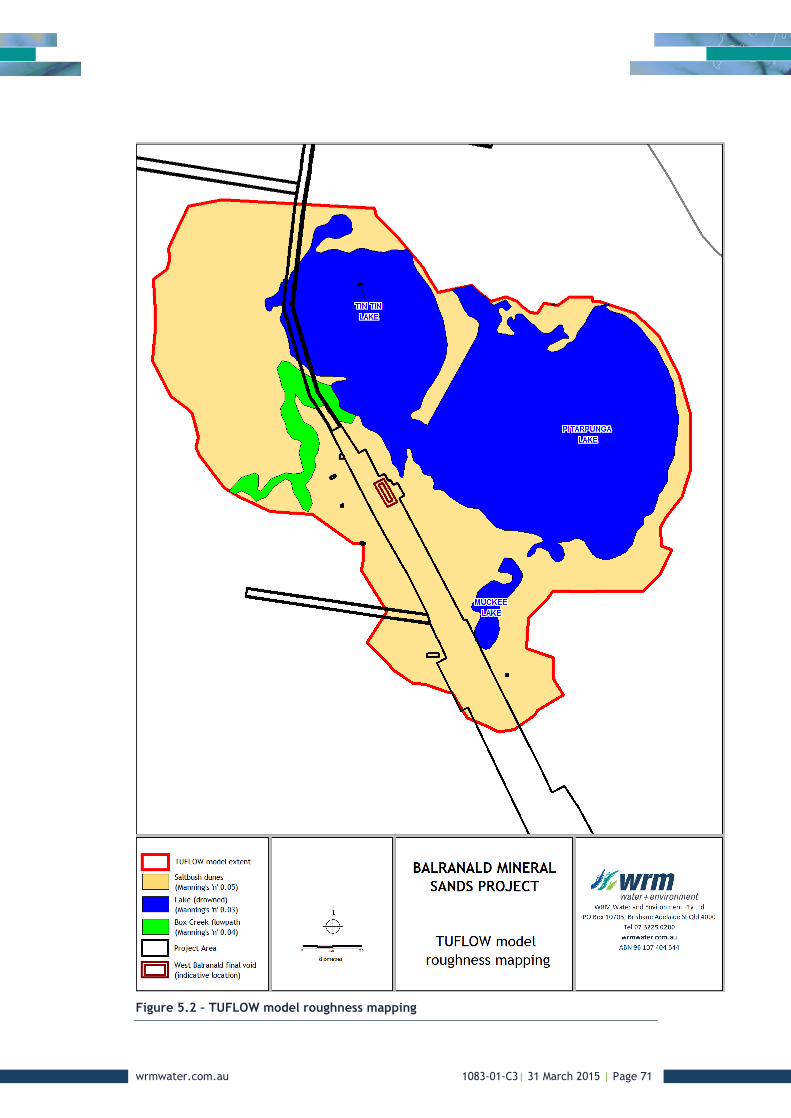
wrmwater.com.au 1083-01-C3| 31 March 2015 | Page 71
Figure 5.2 – TUFLOW model roughness mapping
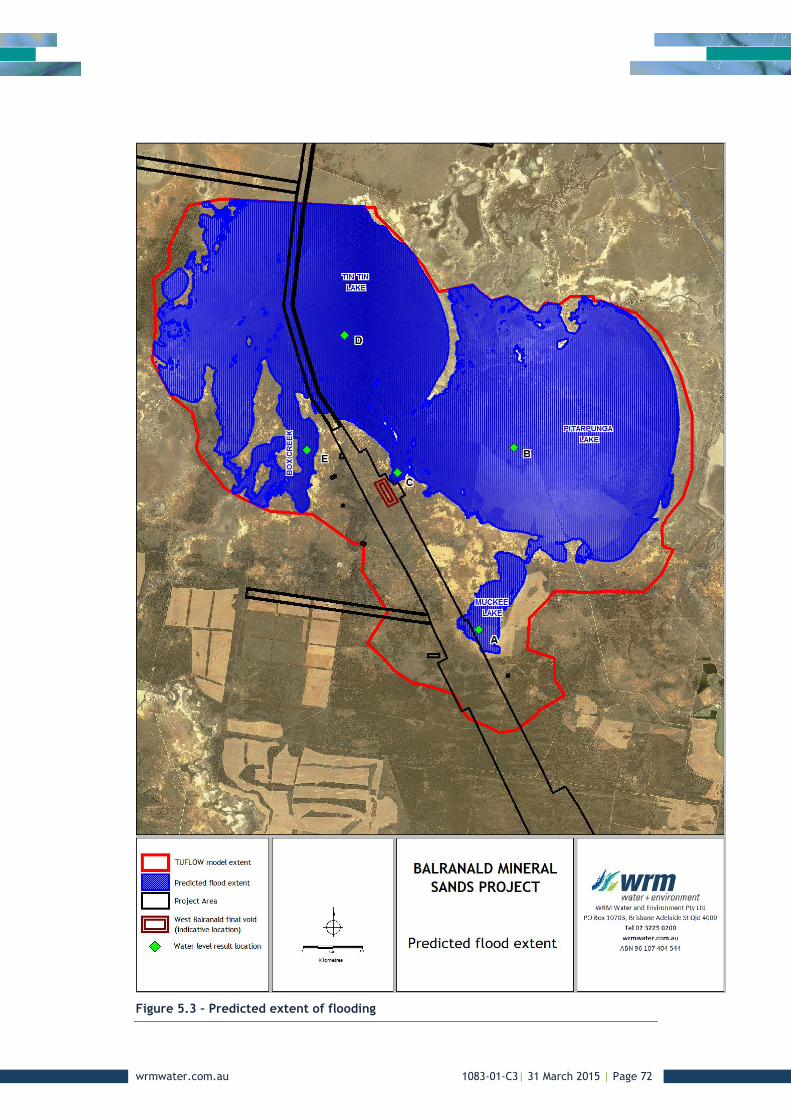
wrmwater.com.au 1083-01-C3| 31 March 2015 | Page 72
Figure 5.3 – Predicted extent of flooding
wrmwater.com.au 1083-01-C3| 31 March 2015 | Page 73
6 Impact assessment
6.1 POTENTIAL IMPACTS
The potential impacts of the Balranald Project on surface water resources include:
Impacts on regional water availability due to the potential need to obtain water from external sources to meet operational water requirements of mining operations;
Adverse impacts on the quality of surface runoff draining from the disturbance area or overflowing from the mine water management system to receiving waters surrounding the project area;
Loss of catchment area draining to Box Creek, Pitarpunga and Tin Tin lake due to capture of runoff within onsite storages and the open cut pit; and
Interference with flood flows along Box Creek, Pitarpunga and Tin Tin lakes and their tributaries.
An assessment of each of these potential impacts of the project is provided in the following sections.
6.2 REGIONAL WATER AVAILABILITY IMPACTS
6.2.1 Raw and potable water demands
The raw water demands and licensing requirements for extraction from the Murrumbidgee River are discussed in the Balranald Mineral Sands Project - Water Assessment (EMM 2015). Sufficient low and high security water access licences will be purchased to allow the Balranald Project to continue to operate at all times.
The required water access licenses will be purchased from within the water license market for the Murrumbidgee Regulated River Water Source, and hence the raw water demands will have no net impact on regional water availability, and will allow the Balranald Project to operate compliantly in accordance with the Water Sharing Plan for the Murrumbidgee Regulated River Water Source (2012) and the Water Management Act (2000).
6.2.2 Saline and mine affected water demands
Water balance modelling (refer Section 4) indicates that the Balranald Project would source the majority of the required water from dewatered groundwater with make-up water supplied via on-site sources (ie rainfall runoff, and groundwater inflow to the pit). Mine affected water will be reused to supply the MUP, processing plant and saline water dust suppression demands. The dewatering borefield production rates are predicted to exceed the net makeup water demands at all stages of mine life.
No external water will be required to supply these demands, and hence these demands will have no impact on regional water availability. The water extracted from the dewatering borefield is hypersaline and has no existing users.
6.3 SURFACE WATER QUALITY IMPACTS
Surface water runoff from undisturbed areas will be diverted, wherever possible, around areas disturbed by mining and released from the site, minimising the capture of clean surface runoff.
Sediment laden water will be managed under an ESCP for the project. The ESCP will include the capture and treatment of sediment laden water in sediment dams. Water captured in the sediment dams will be reused for dust suppression, or potentially released

wrmwater.com.au 1083-01-C3| 31 March 2015 | Page 74
from the site via discharges during rainfall events that exceed the sediment basin design criteria.
Hypersaline groundwater will be extracted via the dewatering bores at the West Balranald mine to lower the groundwater table in the open cut pit, before being reinjected into the Loxton Parilla Sands aquifer via the injection borefields (some hypersaline water may be used as makeup water for mine site demands). There will be no surface releases of hypersaline groundwater from the project area.
Mine affected water will be collected in onsite storages and used preferentially to satisfy mine site water demands. The mine water management system will be operated to prevent releases of mine affected water from the project area. Long term water balance modelling (refer Section 4) indicates that there is a less than 1% chance of a uncontrolled release of mine affected water occurring from the storages at the project area at any stage of mine life.
Runoff and seepage that is dewatered from the Nepean open cut mining area will be treated to settle sediment and eliminate bacteria (using UV light), prior to injection into the Loxton Parilla Sands aquifer via the injection borefields. No mine affected water from the Nepean mine will be released to surface water receiving waters.
The proposed mine site water management strategy and infrastructure will ensure that the Balranald Project has a negligible impact on the quality of surface runoff and receiving waters.
6.4 LOSS OF CATCHMENT AREA AND STREAMFLOWS
The maximum catchment area draining to the mine water management system is 194.3 ha (refer Table 4.2). This represents less than 0.1% of the catchment area draining to Box Creek (4,900 km2). The impact of such a loss of catchment on Box Creek flows will be insignificant, particularly considering the arid nature of the project area. There are no local users of surface water that would be impacted by the Balranald Project.
6.5 IMPACTS ON FLOODING
The West Balranald mine infrastructure is located outside of the predicted Box Creek and Tin Tin Lake flood extent (refer Section 5), and will have no impact on flooding.
The Nepean mine is located on the side of a ridge, and not in the vicinity of any watercourses or drainage paths, and therefore will not have any impact on flooding.
Parts of the Nepean access road and injection borefields are located within the flood extent of Box Creek and Tin Tin Lake. The Nepean access road will be constructed at existing ground levels, and will therefore not have any impact on predicted flood levels, velocities or flow distributions.
The injection borefields will not impact on flood levels, velocities or flow distributions, as the injection well heads are small and will present little obstruction to flow. The windrows that maybe alongside the pipelines are unlikely to impact on peak flood levels, and predicted flood flow velocities are very low (less than 0.1m/s) within the injection borefield areas, limiting the possibility of the injection infrastructure causing erosion damage.
It is possible that should a major flood event occur, the Nepean access road may be inundated and non-trafficable for an extended period of time during flood event. However the likelihood of water filling Tin Tin Lake to inundate the access road is low (See Section 2.4 and Section 5).

wrmwater.com.au 1083-01-C3| 31 March 2015 | Page 75
7 Proposed mitigation and management measures
7.1 OVERVIEW
The impacts of the Balranald Project on surface water resources will be mitigated through the implementation of the following measures:
a mine site water management system to control the flow and storage of water of different qualities across the site;
an ESCP to reduce sediment loads from disturbed area runoff; and
a surface water monitoring program to continually assess environmental impacts and ensure that the site water management system is meeting its objectives of minimal impact on receiving waters.
An overview of each of these management measures is provided in the following sections.
7.2 MINE WATER MANAGEMENT SYSTEM
A key objective of the mine water management system (as described in Section 3.3.2) will be to minimise the risk of uncontrolled releases from mine site storages. To achieve this objective, operation of the mine water management system will be based on the following principles:
Diversion of clean surface water runoff away from areas disturbed by mining activities;
Operation of the mine water management system to minimise uncontrolled releases of mine water from the project area;
Manage potentially sediment-affected runoff by an ESCP which will include the collection of runoff in sediment dams for treatment prior to release or reuse in the mine water management system;
A groundwater dewatering system to extract and reinject hypersaline water from and to the Loxton Parilla sands aquifer.
Transfer of groundwater and seepage inflows to the open cut pits to the mine water system for reuse as a water supply;
Collection of contaminated water from workshop areas for treatment in an oil and grease separator prior to recycling in the mine water management system; and
Recycling water from the mine water system before taking additional water from external sources.
Details of the operation of the mine water management system are provided in Section 4.3.1.
An important component of the mine water management system will be to ensure that contingency measures are in place to accommodate either a surplus or deficit of water on site. Adequate water will be available from the dewatering borefield to supply the saline water mine site demands, without relying on the capture of rainfall and runoff. Mine operations will also be planned to ensure that mining can continue during extended wet periods when water is likely to accumulate in the open cut mining areas.
wrmwater.com.au 1083-01-C3| 31 March 2015 | Page 76
7.3 SEDIMENT AND EROSION CONTROL PLAN
An ESCP will be developed as part of detailed design for the Balranald Project. The design of sediment control measures will be based on the principle of ensuring that runoff from disturbed areas is separated from clean area runoff and collected in sediment dams for treatment. Design of proposed erosion and sediment control measures will be based on the recommended design standards in the following guidelines:
Managing Urban Stormwater, Soils and Construction, (Landcom, 2004); and
Managing Urban Stormwater, Soils and Construction, Volume 2E Mine and Quarries (DECC, 2008).
Locations of proposed major sediment dams (collection dams) to collect and treat runoff from overburden emplacement areas are shown in Figure 3.7, Figure 3.8 and Figure 3.9. Additional minor sediment traps may also be required at other locations across the project area.
Sediment dams will be dewatered as per the Landcom (2004) guidelines to provide free storage capacity of at least the settling zone volume. Where the total suspended solids (TSS) concentration in sediment dams after a runoff event is less than the water quality objectives outlined in Landcom (2004), sediment dams may be dewatered off-site. Where TSS exceeds the water quality objective, water in basins must be either:
flocculated to reduce TSS to less than the water quality objective;
pumped to another water storage with available capacity; or
pumped in to the mine water management system or used for dust suppression.
7.4 SURFACE WATER MONITORING PROGRAM
A surface water monitoring program (including sampling locations, frequencies and monitoring parameters) will be developed in accordance with the approval conditions as part of the Water Management Plan for the project.
Regular inspection of surface drainage infrastructure will also be an important component of the surface water monitoring program. The inspections will include clean and dirty water drains, as well as sediment dams to identify any actual or potential problems with the clean or dirty water drainage system, such as areas of active erosion or sediment deposition with the potential to affect the integrity of the surface water management system.

wrmwater.com.au 1083-01-C3| 31 March 2015 | Page 77
8 Summary of findings
The potential impacts of the Balranald Project on surface water resources include:
impacts on regional water availability due to the potential need to obtain water from external sources to meet operational water requirements of mining operations;
adverse impacts on the quality of surface runoff draining from the disturbance area or overflowing from the mine water management system to the various receiving waters surrounding the project area;
loss of catchment area draining to Box Creek, Pitarpunga and Tin Tin lake due to capture of runoff within onsite storages and the open cut pit; and
interference with flood flows along Box Creek, Pitarpunga and Tin Tin lakes and their tributaries.
The use of external water will be minimised by sourcing all processing water from the mine water management system and saline water extracted from the dewatering borefield. No external water will be required to supply these demands, and hence these demands will have no impact on regional water availability.
Water balance modelling indicates that the Balranald Project would source the majority of the required water from dewatered groundwater with make-up water supplied via on-site sources (ie rainfall runoff, and groundwater inflow to the pit). Mine affected water will be reused to supply the MUP, processing plant and saline water dust suppression demands. The dewatering borefield production rates are predicted to exceed the net makeup water demands at all stages of mine life.
Sufficient low and high security water access licences will be purchased to allow the Balranald Project to continue to operate at all times (EMM, 2015). The required water access licences will be purchased from within the water licence market for the Murrumbidgee Regulated River Water Source, and hence the raw water demands for the Balranald Project will have no net impact on regional water availability, and will allow the project to operate compliantly in accordance with the Water Sharing Plan for the Murrumbidgee Regulated River Water Source (2012) and the Water Management Act (2000).
The mine water management system will be designed and operated to minimise the impacts on downstream water quality. Surface water runoff from undisturbed areas will be diverted, wherever possible, around areas disturbed by mining and released from the site, minimising the capture of clean surface runoff.
Sediment laden water will be managed by an ESCP which will include the capture and treatment of sediment laden water in sediment dams. This water will be used for dust suppression, or potentially released from the site via discharges during rainfall events that exceed the sediment basin design criteria.
Hypersaline groundwater will be extracted via the dewatering bores at the West Balranald mine and in-pit dewatering pumps at the Nepean mine to lower the groundwater table in the open cut pits, before being reinjected into the Loxton Parilla Sands aquifer via the injection borefields (some hypersaline water may be used as makeup water for mine site demands). There will be no surface releases of hypersaline groundwater from the project area.
Mine affected water will be collected in onsite storages and used preferentially to satisfy mine site water demands. The mine water management system will be operated to prevent releases of mine affected water from the project area. Predicted uncontrolled releases of mine affected water are rare (less than a 1% chance of occurring in any year of mine life), and would be small in volume. It is expected that any uncontrolled releases

wrmwater.com.au 1083-01-C3| 31 March 2015 | Page 78
could be contained by the construction of temporary bunds and sumps, preventing the release of mine affected water from the project area.
The proposed mine site water management system and infrastructure will ensure that the Balranald Project has a negligible impact on the quality of surface runoff and receiving waters.
The maximum catchment area draining to the mine water management system is 194.3 ha. This represents less than 0.04% of the catchment area draining to Box Creek (4,900 km2). The impact of such a loss of catchment on Box Creek flows will be insignificant, particularly considering the arid nature of the project area. There are no local users of surface water that would be impacted by the Balranald Project.
The West Balranald and Nepean mine infrastructure is located outside of the predicted Box Creek and Tin Tin Lake flood extent from an event that exceeds the 1 in 100 AEP event and will have no impact on flooding.
Parts of the Nepean access road and injection borefields are located within the flood extent of Box Creek and Tin Tin Lake. The Nepean access road will be constructed at existing levels, and will therefore not have any impact on predicted flood levels, velocities or flow distributions. It is possible that should a major flood event occur, the Nepean access road may be inundated and non-trafficable for an extended period of time.
The injection borefields will not impact on flood levels, velocities or flow distributions, as the injection well heads are small and will present little obstruction to flow. The windrows alongside the pipelines are unlikely to impact on peak flood levels, and predicted flood flow velocities are very low (less than 0.1m/s) within the injection borefield areas, limiting the possibility of the injection infrastructure causing erosion damage.
Based on the assessments completed as part of this study the Balranald Project is not expected to result in any significant impact to surface water resources.
wrmwater.com.au 1083-01-C3| 31 March 2015 | Page 79
9 References
Boughton, 1993 A Hydrograph-Based Model for Estimating the Water Yield of Ungauged Catchments, Hydrology and Water Resources Symposium, Newcastle, June 1993.
Boughton, 2003 Calibrations of the AWBM for use on ungauged catchments, Technical report 03/15, Cooperative research centre for catchment hydrology, December 2003.
Chow, 1959 Open Channel Hydraulics, written by V.T. Chow, McGraw-Hill Book Company, NY, 1959
DECC, 2008 Managing Urban Stormwater: Soils and Construction – Volume 2E Mines and Quarries, NSW Department of Environment and Climate Change, June 2008.
DEH, 2006 NSW Water Quality and River Flow Objectives, NSW Department of Environment and Heritage, 2006
DNR, 2005 Lachlan River – Hillston Floodplain Management Plan Lake Brewster to Whealbah, NSW Department of Natural Resources, October 2005
Earth Systems, 2015
Balranald Mineral Sands Project Geochemistry Assessment. Prepared by Earth Systems Pty Ltd on behalf of Iluka Resources Pty Ltd. 2015
EMM, 2015 Balranald Mineral Sands Project Water Assessment, Report prepared by EMM Pty Ltd on behalf of Iluka Pty Ltd, 2015.
Goldsim Technology Group, 2014
User’s guide Goldsim Probabilistic Simulation Environment, Goldsim Technology Group, May 2014.
IEAust, 1998 Australian Rainfall and Runoff: A Guide to Flood Estimation, Institution of Engineers, Australia
Jacobs, 2015 Balranald Project DFS1 Groundwater Modelling. Prepared by Jacobs on behalf of Iluka Resources Pty Ltd, 2015
Jeffrey SJ, Carter JO, Moodie KM & Beswick AR, 2001
Using Spatial Interpolation to Construct a Comprehensive Archive of Australian Climate Data, Environmental Modelling & Software, Vole 16/4. Pp 309-330, 2001.
Landcom, 2004
Managing Urban Stormwater: Soils and Construction, Volume 1, 4th edition, Department of Energy & Climate Change NSW, Sydney, March 2004.
LWC, 2014 Pre-mining Quarterly Groundwater Monitoring Event (August 2014)
Balranald Mineral Sands Project, Murray Basin, New South Wales, Report prepared by Land & Water Consulting on behalf of Iluka Pty Ltd, October 2014

wrmwater.com.au 1083-01-C3| 31 March 2015 | Page 80
Morton, 1983 Morton, F.I., 1983, ‘Operational estimates of areal evapotranspiration and their significance to the science and practice of hydrology’, Journal of Hydrology, Vol. 66, No. 1-4, pp. 1-76.
WBM, 2010 Tuflow User Manual, GIS Based 2D/1D Hydrodynamic Modelling, Build 2010-10-Ab BMT WBM 2010.
Related Documents