Volume 6B: Environmental and Socio-Economic Assessment (ESA) – Marine Terminal ENBRIDGE NORTHERN GATEWAY PROJECT Sec. 52 Application May 2010

Welcome message from author
This document is posted to help you gain knowledge. Please leave a comment to let me know what you think about it! Share it to your friends and learn new things together.
Transcript

Volume 6B: Environmental and Socio-Economic Assessment (ESA) –
Marine Terminal
ENBRIDGE NORTHERN GATEWAY PROJECT
Sec. 52 Application
May 2010

Preface to Volume 6B
Northern Gateway Pipelines Limited Partnership (Northern Gateway) proposes to construct and operate:
an oil export pipeline
a condensate import pipeline
a tank terminal and marine terminal near Kitimat, British Columbia (referred to as the Kitimat Terminal)
The pipelines will be built in a common right-of-way (RoW) between an initiating pump station near Bruderheim, Alberta and the Kitimat Terminal near Kitimat, British Columbia. The marine terminal will accommodate transfer of oil into, and condensate out of, tankers.
These project components and activities are referred to collectively as the Enbridge Northern Gateway Project (the Project).
Sec. 52 Application Volume 6B: Environmental and Socio-Economic Assessment (ESA) – Marine Terminal Table of Contents
May 2010 Page i
Table of Contents
1 Introduction .................................................................................................................... 1-1 1.1 Purpose of the Environmental and Socio-economic Assessment .................................... 1-1 1.2 Overview of Kitimat Terminal ........................................................................................ 1-1 1.3 Marine Safety and Environmental Protection ................................................................. 1-1 1.4 Overview of Volume 6B: Routine Activities Associated with the Marine
Terminal .......................................................................................................................... 1-2 2 Project Description for the Kitimat Terminal............................................................. 2-1
2.1 Kitimat Terminal ............................................................................................................. 2-1 2.1.1 Marine Terminal ......................................................................................................... 2-7 2.1.2 Assumptions for the ESA ........................................................................................... 2-7
2.2 Kitimat Terminal Construction ....................................................................................... 2-7 2.2.1 Land Areas ................................................................................................................. 2-7 2.2.2 Marine Terminal ......................................................................................................... 2-8 2.2.3 Construction Camp ................................................................................................... 2-10 2.2.4 Assumptions for the ESA ......................................................................................... 2-10
2.3 Kitimat Terminal Operations......................................................................................... 2-11 2.3.1 Marine Terminal ....................................................................................................... 2-12 2.3.2 Assumptions for the ESA ......................................................................................... 2-14
2.4 Decommissioning .......................................................................................................... 2-15 2.5 Environmental Protection and Management Plan ......................................................... 2-15 2.6 References ..................................................................................................................... 2-16
3 Setting for the Marine Environment ............................................................................ 3-1 3.1 Physical Marine Environment ......................................................................................... 3-1
3.1.1 Kitimat Arm Physiography ........................................................................................ 3-1 3.1.2 Prevailing Climate Conditions ................................................................................... 3-2 3.1.3 Estuarine Circulation .................................................................................................. 3-2 3.1.4 Winds ......................................................................................................................... 3-2 3.1.5 Tides ........................................................................................................................... 3-3 3.1.6 Marine Flora and Fauna ............................................................................................. 3-3
3.2 Human Activities ............................................................................................................. 3-4 3.3 References ....................................................................................................................... 3-5
3.3.1 Literature Cited .......................................................................................................... 3-5 3.3.2 Internet Sites............................................................................................................... 3-6
Appendix 3A Project Inclusion List within the REAA in Alberta and British Columbia .............................................................................................. 3A-1
4 Scope of Assessment and Environmental Assessment Methods ................................ 4-1 4.1 Scope of the Assessment for the Project ......................................................................... 4-1
4.1.1 Scope of the Project.................................................................................................... 4-1 4.1.2 Factors to be Considered ............................................................................................ 4-1 4.1.3 Other Factors to be Considered .................................................................................. 4-1

Sec. 52 Application Volume 6B: Environmental and Socio-Economic Assessment (ESA) – Marine Terminal Table of Contents
Page ii May 2010
4.1.4 Scope of the Factors to be Considered ...................................................................... 4-2 4.2 Environmental Assessment Methods .............................................................................. 4-2
4.2.1 Overview of Approach .............................................................................................. 4-2 4.2.2 Scoping ...................................................................................................................... 4-5 4.2.3 Assessment of Environmental Effects ..................................................................... 4-12 4.2.4 Determination of the Significance of Residual Environmental Effects ................... 4-15 4.2.5 Follow-up and Monitoring....................................................................................... 4-16 4.2.6 Accidents, Malfunctions and Unplanned Events ..................................................... 4-17
4.3 Scope of Assessment for the Marine Terminal ............................................................. 4-17 4.3.1 Key Project Issues for the Marine Environment ...................................................... 4-17 4.3.2 Selection of Valued Environmental Components, Key Indicators and
Measurable Parameters for the Marine Environment .............................................. 4-18 4.4 References ..................................................................................................................... 4-21
4.4.1 Literature Cited ........................................................................................................ 4-21 4.4.2 Internet Sites ............................................................................................................ 4-22
Appendix 4A Risk Management Framework .......................................................... 4A-1 5 General Mitigation for the Marine Environment ....................................................... 5-1
5.1 References ....................................................................................................................... 5-3 5.1.1 Literature Cited .......................................................................................................... 5-3
6 Listed Species for the Marine Environment ................................................................ 6-1 6.1 Overview ......................................................................................................................... 6-1 6.2 Species Summary ............................................................................................................ 6-1 6.3 References ....................................................................................................................... 6-5
6.3.1 Literature Cited .......................................................................................................... 6-5 6.3.2 Internet Sites .............................................................................................................. 6-5
7 Sediment and Water Quality ........................................................................................ 7-1 7.1 Setting for Sediment and Water Quality ......................................................................... 7-1 7.2 Scope of Assessment for Sediment and Water Quality ................................................... 7-1
7.2.1 Key Project Issues for Sediment and Water Quality ................................................. 7-1 7.2.2 Selection of Valued Environmental Components and Measurable Parameters
for Sediment and Water Quality ................................................................................ 7-3 7.2.3 Spatial Boundaries for Sediment and Water Quality ................................................. 7-4 7.2.4 Temporal Boundaries for Sediment and Water Quality ............................................ 7-4 7.2.5 Guidelines and Objectives for Sediment and Water Quality ..................................... 7-4 7.2.6 Definition of Environmental Effect Attributes for Sediment and Water
Quality ....................................................................................................................... 7-6 7.2.7 Determination of Significance for Sediment and Water Quality ............................... 7-7
7.3 General Mitigation Measures for Sediment and Water Quality ...................................... 7-7 7.4 Assessment Methods for Sediment and Water Quality ................................................... 7-8
7.4.1 Data Sources and Fieldwork ...................................................................................... 7-8 7.4.2 Analytical Techniques ............................................................................................... 7-8
7.5 Effects on Suspended Sediment Levels ......................................................................... 7-10 7.5.1 Baseline Conditions ................................................................................................. 7-10

Sec. 52 Application Volume 6B: Environmental and Socio-Economic Assessment (ESA) – Marine Terminal Table of Contents
May 2010 Page iii
7.5.2 Effects on Suspended Sediment Levels .................................................................... 7-11 7.5.3 Cumulative Effects Implications .............................................................................. 7-21 7.5.4 Prediction Confidence .............................................................................................. 7-21
7.6 Effects on Sediment and Water Chemistry ................................................................... 7-22 7.6.1 Baseline Conditions ................................................................................................. 7-22 7.6.2 Effects on Sediment and Water Chemistry .............................................................. 7-35 7.6.3 Cumulative Effects Implications .............................................................................. 7-40 7.6.4 Prediction Confidence .............................................................................................. 7-40
7.7 Follow-up and Monitoring for Sediment and Water Quality ........................................ 7-41 7.8 Summary of Effects for Sediment and Water Quality ................................................... 7-41 7.9 References ..................................................................................................................... 7-45
7.9.1 Literature Cited ........................................................................................................ 7-45 7.9.2 Internet Sites............................................................................................................. 7-46
8 Marine Vegetation ......................................................................................................... 8-1 8.1 Setting for Marine Vegetation ......................................................................................... 8-1 8.2 Scope of Assessment for Marine Vegetation .................................................................. 8-1
8.2.1 Key Project Issues for Marine Vegetation.................................................................. 8-1 8.2.2 Selection of Key Indicators and Measurable Parameters for Marine
Vegetation .................................................................................................................. 8-4 8.2.3 Spatial Boundaries for Marine Vegetation ................................................................. 8-5 8.2.4 Temporal Boundaries for Marine Vegetation ............................................................. 8-7 8.2.5 Regulatory Setting or Administrative Boundaries for Marine Vegetation ................. 8-7 8.2.6 Definition of Environmental Effects Attributes for Sediment and Water
Quality ........................................................................................................................ 8-7 8.2.7 Determination of Significance for Marine Vegetation ............................................... 8-8
8.3 General Mitigation Measures for Marine Vegetation ..................................................... 8-8 8.4 Assessment Methods for Marine Vegetation .................................................................. 8-9
8.4.1 Data Sources and Fieldwork ...................................................................................... 8-9 8.4.2 Analytical Techniques ................................................................................................ 8-9
8.5 Ecology and Habitat Requirements for Marine Vegetation ............................................ 8-9 8.5.1 Eelgrass ...................................................................................................................... 8-9 8.5.2 Rockweed ................................................................................................................. 8-10 8.5.3 Marine Riparian Vegetation ..................................................................................... 8-11
8.6 Effects on Marine Vegetation – Habitat Availability .................................................... 8-12 8.6.1 Baseline Conditions ................................................................................................. 8-12 8.6.2 Effects on Marine Vegetation – Habitat Availability ............................................... 8-12 8.6.3 Cumulative Effects Implications .............................................................................. 8-14 8.6.4 Prediction Confidence .............................................................................................. 8-14
8.7 Effects on Marine Vegetation – Habitat Quality ........................................................... 8-18 8.7.1 Baseline Conditions ................................................................................................. 8-18 8.7.2 Effects on Marine Vegetation – Habitat Quality ...................................................... 8-18 8.7.3 Cumulative Effects Implications .............................................................................. 8-25 8.7.4 Prediction Confidence .............................................................................................. 8-25
8.8 Follow-up and Monitoring for Marine Vegetation ........................................................ 8-25

Sec. 52 Application Volume 6B: Environmental and Socio-Economic Assessment (ESA) – Marine Terminal Table of Contents
Page iv May 2010
8.9 Summary of Effects for Marine Vegetation .................................................................. 8-25 8.10 References ..................................................................................................................... 8-28
8.10.1 Literature Cited ........................................................................................................ 8-28 8.10.2 Personal Communication ......................................................................................... 8-29 8.10.3 Internet Site ............................................................................................................. 8-29
9 Marine Invertebrates ..................................................................................................... 9-1 9.1 Setting for Marine Invertebrates ...................................................................................... 9-1 9.2 Scope of Assessment for Marine Invertebrates ............................................................... 9-1
9.2.1 Key Project Issues for Marine Invertebrates.............................................................. 9-1 9.2.2 Selection of Key Indicators and Measurable Parameters for Marine
Invertebrates .............................................................................................................. 9-3 9.2.3 Spatial Boundaries for Marine Invertebrates ............................................................. 9-4 9.2.4 Temporal Boundaries for Marine Invertebrates ......................................................... 9-4 9.2.5 Regulatory Setting or Administrative Boundaries for Marine Invertebrates ............. 9-4 9.2.6 Definition of Environmental Effects Attributes for Marine Invertebrates ................. 9-6 9.2.7 Determination of Significance for Marine Invertebrates ........................................... 9-7
9.3 General Mitigation Measures for Marine Invertebrates .................................................. 9-7 9.4 Assessment Methods for Marine Invertebrates ............................................................... 9-8
9.4.1 Data Sources and Fieldwork ...................................................................................... 9-8 9.4.2 Analytical Techniques ............................................................................................... 9-8
9.5 Ecology and Habitat Requirements for Marine Invertebrates ......................................... 9-8 9.5.1 Bay Mussel ................................................................................................................ 9-8 9.5.2 Dungeness Crab ......................................................................................................... 9-9 9.5.3 Hexactinellid Sponges ............................................................................................. 9-12
9.6 Effects on Marine Invertebrates – Habitat Availability................................................. 9-13 9.6.1 Baseline Conditions ................................................................................................. 9-13 9.6.2 Effects on Marine Invertebrates – Habitat Availability ........................................... 9-14 9.6.3 Cumulative Effects Implications ............................................................................. 9-19 9.6.4 Prediction Confidence ............................................................................................. 9-19
9.7 Effects on Marine Invertebrates – Direct Mortality ...................................................... 9-19 9.7.1 Baseline Conditions ................................................................................................. 9-19 9.7.2 Effects on Marine Invertebrates – Direct Mortality ................................................. 9-20 9.7.3 Cumulative Effects Implications ............................................................................. 9-24 9.7.4 Prediction Confidence ............................................................................................. 9-24
9.8 Effects on Marine Invertebrates – Habitat Quality ........................................................ 9-25 9.8.1 Baseline Conditions ................................................................................................. 9-25 9.8.2 Effects on Marine Invertebrates – Habitat Quality .................................................. 9-25 9.8.3 Cumulative Effects Implications ............................................................................. 9-33 9.8.4 Prediction Confidence ............................................................................................. 9-33
9.9 Follow-up and Monitoring for Marine Invertebrates .................................................... 9-33 9.10 Summary of Effects for Marine Invertebrates ............................................................... 9-33 9.11 References ..................................................................................................................... 9-38
9.11.1 Literature Cited ........................................................................................................ 9-38

Sec. 52 Application Volume 6B: Environmental and Socio-Economic Assessment (ESA) – Marine Terminal Table of Contents
May 2010 Page v
9.11.2 Internet Sites............................................................................................................. 9-41 10 Marine Fish................................................................................................................... 10-1
10.1 Setting for Marine Fish.................................................................................................. 10-1 10.2 Scope of Assessment for Marine Fish ........................................................................... 10-1
10.2.1 Key Project Issues for Marine Fish .......................................................................... 10-1 10.2.2 Selection of Key Indicators and Measurable Parameters for Marine Fish ............... 10-4 10.2.3 Spatial Boundaries for Marine Fish .......................................................................... 10-6 10.2.4 Temporal Boundaries for Marine Fish ..................................................................... 10-6 10.2.5 Regulatory Setting or Administrative Boundaries for Marine Fish .......................... 10-8 10.2.6 Definition of Environmental Effects Attributes for Marine Fish ............................. 10-8 10.2.7 Determination of Significance for Marine Fish ........................................................ 10-9
10.3 General Mitigation Measures for Marine Fish .............................................................. 10-9 10.4 Assessment Methods for Marine Fish ......................................................................... 10-11
10.4.1 Data Sources and Fieldwork .................................................................................. 10-11 10.4.2 Analytical Techniques ............................................................................................ 10-11
10.5 Ecology and Habitat Requirements for Marine Fish ................................................... 10-12 10.5.1 Eulachon ................................................................................................................. 10-12 10.5.2 Pacific Herring ....................................................................................................... 10-13 10.5.3 Rockfish ................................................................................................................. 10-14 10.5.4 Chum Salmon ......................................................................................................... 10-16
10.6 Effects on Marine Fish – Habitat Quality ................................................................... 10-18 10.6.1 Baseline Conditions ............................................................................................... 10-18 10.6.2 Effects on Marine Fish – Habitat Quality ............................................................... 10-18 10.6.3 Cumulative Effects Implications ............................................................................ 10-33 10.6.4 Prediction Confidence ............................................................................................ 10-33
10.7 Effects on Marine Fish – Habitat Availability ............................................................ 10-33 10.7.1 Baseline Conditions ............................................................................................... 10-33 10.7.2 Effects on Marine Fish – Habitat Availability........................................................ 10-34 10.7.3 Cumulative Effects Implications ............................................................................ 10-36 10.7.4 Prediction Confidence ............................................................................................ 10-36
10.8 Effects on Marine Fish from Acoustic Disturbance .................................................... 10-39 10.8.1 Baseline Conditions ............................................................................................... 10-39 10.8.2 Effects on Marine Fish from Acoustic Disturbance ............................................... 10-39 10.8.3 Cumulative Effects Implications ............................................................................ 10-52 10.8.4 Prediction Confidence ............................................................................................ 10-52
10.9 Follow-up and Monitoring for Marine Fish ................................................................ 10-52 10.10 Summary of Effects for Marine Fish ........................................................................... 10-53 10.11 References ................................................................................................................... 10-57
10.11.1 Literature Cited ...................................................................................................... 10-57 10.11.2 Personal Communications ...................................................................................... 10-61 10.11.3 Internet Sites........................................................................................................... 10-62

Sec. 52 Application Volume 6B: Environmental and Socio-Economic Assessment (ESA) – Marine Terminal Table of Contents
Page vi May 2010
11 Marine Mammals ......................................................................................................... 11-1 11.1 Setting ............................................................................................................................ 11-1 11.2 Scope of Assessment for Marine Mammals .................................................................. 11-3
11.2.1 Key Project Issues for Marine Mammals ................................................................ 11-3 11.2.2 Selection of Key Indicators for Marine Mammals .................................................. 11-3 11.2.3 Spatial Boundaries for Marine Mammals ................................................................ 11-4 11.2.4 Temporal Boundaries for Marine Mammals ........................................................... 11-5 11.2.5 Regulatory Setting or Administrative Boundaries for Marine Mammals ................ 11-5 11.2.6 Definition of Environmental Effect Attributes for Marine Mammals ..................... 11-6 11.2.7 Determination of Significance for Marine Mammals .............................................. 11-7
11.3 General Mitigation Measure for Marine Mammals ....................................................... 11-7 11.4 Assessment Methods for Marine Mammals .................................................................. 11-8
11.4.1 Data Sources and Fieldwork .................................................................................... 11-8 11.4.2 Analytical Techniques for Marine Mammals ........................................................ 11-10
11.5 Overview of Project Effects on Marine Mammals ...................................................... 11-10 11.5.1 Effects on Behaviour due to Underwater Noise .................................................... 11-10 11.5.2 Effects on Marine Mammals from Physical Injury due to Blasting....................... 11-17 11.5.3 Effects Not Assessed ............................................................................................. 11-18
11.6 Northern Resident Killer Whale .................................................................................. 11-19 11.6.1 Scope of Assessment for Northern Resident Killer Whale .................................... 11-19 11.6.2 Effects on Behaviour due to Underwater Noise .................................................... 11-27 11.6.3 Effects on Northern Resident Killer Whale from Physical Injury due to
Blasting .................................................................................................................. 11-37 11.7 North Pacific Humpback Whale .................................................................................. 11-41
11.7.1 Scope of Assessment for North Pacific Humpback Whale ................................... 11-41 11.7.2 Effects on Behaviour due to Underwater Noise .................................................... 11-46 11.7.3 Effects on North Pacific Humpback Whale from Physical Injury due to
Blasting .................................................................................................................. 11-55 11.8 Steller Sea Lion ........................................................................................................... 11-59
11.8.1 Scope of Assessment for Steller Sea Lion ............................................................. 11-59 11.8.2 Effects on Behaviour due to In-Air Noise ............................................................. 11-65 11.8.3 Effects on Behaviour due to Underwater Noise .................................................... 11-70 11.8.4 Effects on Steller Sea Lion from Physical Injury due to Blasting ......................... 11-76
11.9 Follow-up and Monitoring for Marine Mammals ....................................................... 11-80 11.10 Summary of Project Environmental Effects on Marine Mammals ............................. 11-81
11.10.1 Northern Resident Killer Whale ............................................................................ 11-81 11.10.2 North Pacific Humpback Whales .......................................................................... 11-85 11.10.3 Summary of Effects on Steller Sea Lion ............................................................... 11-85
11.11 References ................................................................................................................... 11-86 11.11.1 Literature Cited ...................................................................................................... 11-86 11.11.2 Personal Communications ..................................................................................... 11-93 11.11.3 Internet Sites .......................................................................................................... 11-93

Sec. 52 Application Volume 6B: Environmental and Socio-Economic Assessment (ESA) – Marine Terminal Table of Contents
May 2010 Page vii
12 Marine Birds................................................................................................................. 12-1 12.1 Setting for Marine Birds ................................................................................................ 12-1 12.2 Scope of Assessment for Marine Birds ......................................................................... 12-2
12.2.1 Key Project Issues for Marine Birds ........................................................................ 12-2 12.2.2 Selection of Key Indicators and Measurable Parameters for Marine Birds.............. 12-2 12.2.3 Spatial Boundaries for Marine Birds ........................................................................ 12-4 12.2.4 Temporal Boundaries for Marine Birds ................................................................... 12-4 12.2.5 Regulatory Setting or Administrative Boundaries for Marine Birds ........................ 12-4 12.2.6 Definition of Environmental Effect Attributes for Marine Birds ............................. 12-7 12.2.7 Determination of Significance for Marine Birds ...................................................... 12-8
12.3 General Mitigation Measures for Marine Birds ............................................................ 12-8 12.4 Methods for Marine Birds ............................................................................................. 12-9
12.4.1 Data Sources and Field Work ................................................................................... 12-9 12.4.2 Analytical Techniques ............................................................................................ 12-10
12.5 Marbled Murrelet ........................................................................................................ 12-11 12.5.1 Ecology and Habitat Requirements ........................................................................ 12-11 12.5.2 Scope of Assessment for Marbled Murrelet ........................................................... 12-16 12.5.3 Effects on Marbled Murrelet from Changes in Habitat .......................................... 12-18 12.5.4 Effects on Marbled Murrelet from Sensory Disturbance ....................................... 12-34 12.5.5 Effects on Marbled Murrelet from Direct Mortality .............................................. 12-36 12.5.6 Prediction Confidence ............................................................................................ 12-38
12.6 Surf Scoter ................................................................................................................... 12-39 12.6.1 Ecology and Habitat Requirements ........................................................................ 12-39 12.6.2 Scope of Assessment for Surf Scoter ..................................................................... 12-40 12.6.3 Effects on Surf Scoter from Changes in Habitat .................................................... 12-42 12.6.4 Effects on Surf Scoter from Sensory Disturbance .................................................. 12-49 12.6.5 Effects on Surf Scoter from Direct Mortality ......................................................... 12-50 12.6.6 Prediction Confidence ............................................................................................ 12-51
12.7 Bald Eagle ................................................................................................................... 12-51 12.7.1 Ecology and Habitat Requirements ........................................................................ 12-51 12.7.2 Scope of the Assessment for Bald Eagle ................................................................ 12-53 12.7.3 Effects on Bald Eagle from Changes in Habitat ..................................................... 12-53 12.7.4 Effects on Bald Eagle from Sensory Disturbance .................................................. 12-57 12.7.5 Effects on Bald Eagle from Direct Mortality ......................................................... 12-59 12.7.6 Prediction Confidence ............................................................................................ 12-60
12.8 Follow-up and Monitoring for Marine Birds............................................................... 12-60 12.9 Summary of Effects for Marine Birds ......................................................................... 12-65 12.10 References ................................................................................................................... 12-72
12.10.1 Literature Cited ...................................................................................................... 12-72 12.10.2 Internet Sites........................................................................................................... 12-77

Sec. 52 Application Volume 6B: Environmental and Socio-Economic Assessment (ESA) – Marine Terminal Table of Contents
Page viii May 2010
13 Marine Fisheries........................................................................................................... 13-1 13.1 Setting for Marine Fisheries .......................................................................................... 13-1 13.2 Scope of Assessment for Marine Fisheries ................................................................... 13-3
13.2.1 Key Project Issues for Marine Fisheries .................................................................. 13-3 13.2.2 Selection of Valued Environmental Components and Measurable Parameters
for Marine Fisheries ................................................................................................ 13-4 13.2.3 Spatial Boundaries for Marine Fisheries ................................................................. 13-4 13.2.4 Temporal Boundaries for Marine Fisheries ............................................................. 13-4 13.2.5 Regulatory Setting or Administrative Boundaries for Marine Fisheries ................. 13-6 13.2.6 Definition of Environmental Effect Attributes for Marine Fisheries ....................... 13-6 13.2.7 Determination of Significance for Marine Fisheries ............................................... 13-8
13.3 General Mitigation Measures for Marine Fisheries ....................................................... 13-8 13.4 Assessment Methods for Marine Fisheries .................................................................. 13-10
13.4.1 Data Sources and Fieldwork .................................................................................. 13-10 13.5 Baseline Conditions for Marine Fisheries ................................................................... 13-11
13.5.1 Commercial Fisheries ............................................................................................ 13-11 13.5.2 FSC Fishery ........................................................................................................... 13-17 13.5.3 Commercial-Recreational Fishery ......................................................................... 13-18 13.5.4 Recreational Fishery .............................................................................................. 13-19
13.6 Effects on Marine Fisheries from Restriction of Access to Fishing Grounds ............. 13-21 13.6.1 Baseline Conditions ............................................................................................... 13-21 13.6.2 Effects on Marine Fisheries from Restriction of Access to Fishing Grounds ........ 13-22 13.6.3 Cumulative Effects Implications ........................................................................... 13-25 13.6.4 Prediction Confidence ........................................................................................... 13-26
13.7 Follow-up and Monitoring for Marine Fisheries ......................................................... 13-26 13.8 Summary of Environmental Effects on Marine Fisheries ........................................... 13-27 13.9 References ................................................................................................................... 13-32
13.9.1 Literature Cited ...................................................................................................... 13-32 13.9.2 Internet Sites .......................................................................................................... 13-32
14 Ecological Risk Assessment for Routine Activities Associated with the Kitimat Terminal ......................................................................................................... 14-1 14.1 Fundamentals of Risk Assessment ................................................................................ 14-1 14.2 Approach ....................................................................................................................... 14-2
14.2.1 Spatial Boundary ..................................................................................................... 14-2 14.2.2 Cumulative Assessment Cases ................................................................................ 14-4 14.2.3 Potential COPC Emissions from the Marine Terminal into the Marine
Environment ............................................................................................................ 14-4 14.2.4 Exposure Assessment .............................................................................................. 14-7 14.2.5 Hazard Assessment .................................................................................................. 14-9
14.3 Results of the Marine Ecological Risk Assessment ...................................................... 14-9 14.4 Prediction Confidence ................................................................................................. 14-29 14.5 Follow-up and Monitoring .......................................................................................... 14-30
Sec. 52 Application Volume 6B: Environmental and Socio-Economic Assessment (ESA) – Marine Terminal Table of Contents
May 2010 Page ix
14.6 Summary of Ecological Risk Assessment for Routine Activities Associated with the Kitimat Terminal ................................................................................................... 14-31
14.7 References ................................................................................................................... 14-31 15 Effects of the Environment on the Marine Terminal ............................................... 15-1
15.1 Overview ....................................................................................................................... 15-1 15.2 Effects of Slope Failure on the Marine Terminal .......................................................... 15-1
15.2.1 Slope Failure ............................................................................................................ 15-1 15.2.2 Seismicity ................................................................................................................. 15-2 15.2.3 Tsunami .................................................................................................................... 15-5
15.3 References ..................................................................................................................... 15-7 15.3.1 Literature Cited ........................................................................................................ 15-7 15.3.2 Internet Sites............................................................................................................. 15-7
16 Conclusion .................................................................................................................... 16-1 16.1 Mitigation Measures ...................................................................................................... 16-1 16.2 Summary of Environmental Effects .............................................................................. 16-1
17 Acronyms and Abbreviations .................................................................................... 17-1 18 Glossary ........................................................................................................................ 18-1


Sec. 52 Application Volume 6B: Environmental and Socio-Economic Assessment (ESA) – Marine Terminal List of Tables
May 2010 Page xi
List of Tables
Table 2-1 Estimated Barge Traffic for Marine Terminal Construction ......................................... 2-10 Table 2-2 Oil and Condensate Tanker Specifications.................................................................... 2-13 Table 4-1 Complete List of Project Activities and Physical Works Considered in the ESA
(Volume 6A, 6B, 6C and 8B) .......................................................................................... 4-7 Table 4-2 Valued Environmental Components and Key Indicators Selected for the Marine
Environment .................................................................................................................. 4-18 Table 6-1 Federally or Provincially-Listed Marine Species Likely Occurring in the Marine
PEAA .............................................................................................................................. 6-3 Table 7-1 Potential Environmental Effects on Sediment and Water Quality .................................. 7-2 Table 7-2 Characterization of the Residual Effects of Effects on Suspended Sediment
Levels ............................................................................................................................ 7-19 Table 7-3 Sediment Polycyclic Aromatic Hydrocarbon Levels in the PDA and Reference
Areas.............................................................................................................................. 7-25 Table 7-4 Sediment Metal Levels in the PDA and Reference Areas ............................................. 7-28 Table 7-5 Sediment Dioxin and Furan Levels in the PDA ............................................................ 7-31 Table 7-6 Survival and Growth Results for Marine Invertebrates in Sediment Toxicity Tests ..... 7-32 Table 7-7 General Parameters and Metals in Bottom Water, February 2006 ................................ 7-34 Table 7-8 Polycyclic Aromatic Hydrocarbon Levels in Bottom Water, February 2006 ............... 7-35 Table 7-9 Characterization of the Residual Effects of Effects on Sediment and Water
Chemistry ...................................................................................................................... 7-39 Table 7-10 Summary of Residual Environmental Effects on Sediment and Water Quality ............ 7-43 Table 8-1 Potential Environmental Effects on Marine Vegetation .................................................. 8-2 Table 8-2 Characterization of the Residual Effects on Marine Vegetation – Habitat
Availability .................................................................................................................... 8-15 Table 8-3 Characterization of the Residual Effects on Marine Vegetation – Habitat Quality ...... 8-22 Table 8-4 Summary of Residual Environmental Effects on Marine Vegetation ........................... 8-26 Table 9-1 Potential Environmental Effects on Marine Invertebrates .............................................. 9-2 Table 9-2 Characterization of the Residual Effects on Marine Invertebrates – Habitat
Availability .................................................................................................................... 9-16 Table 9-3 Characterization of the Residual Effects on Marine Invertebrates – Direct
Mortality ........................................................................................................................ 9-22 Table 9-4 Characterization of the Residual Effects on Marine Invertebrates – Habitat
Quality ........................................................................................................................... 9-27 Table 9-5 Summary of Residual Environmental Effects on Marine Invertebrates ........................ 9-35 Table 10-1 Potential Environmental Effects on Marine Fish .......................................................... 10-2 Table 10-2 Potential Environmental Effects of Total Suspended Solids on Marine Fish ............. 10-18 Table 10-3 Lethal and ParalethalTotal Suspended Solids Thresholds for Adult and Juvenile
Salmonids .................................................................................................................... 10-28 Table 10-4 Characterization of the Residual Effects on Marine Fish – Habitat Quality ............... 10-30 Table 10-5 Characterization of the Residual Effects on Marine Fish – Habitat Availability ........ 10-37

Sec. 52 Application Volume 6B: Environmental and Socio-Economic Assessment (ESA) – Marine Terminal List of Tables
Page xii May 2010
Table 10-6 Estimated Source Levels of Loud Project Activities ................................................... 10-40 Table 10-7 Characterization of the Residual Effect of Effects on Marine Fish from Acoustic
Disturbance .................................................................................................................. 10-48 Table 10-8 Summary of Residual Environmental Effects on Marine Fish .................................... 10-54 Table 11-1 Marine Mammals Potentially Occurring in the PEAA .................................................. 11-3 Table 11-2 Estimated Source Levels of Project Activities ............................................................ 11-12 Table 11-3 Potential Environmental Effects on Northern Resident Killer Whale ......................... 11-20 Table 11-4 Killer Whale Sound Production .................................................................................. 11-25 Table 11-5 Characterization of the Residual Effects on Behaviour due to Underwater Noise -
Northern Resident Killer Whale .................................................................................. 11-34 Table 11-6 Characterization of the Residual Effects on Northern Resident Killer Whale from
Physical Injury due to Blasting.................................................................................... 11-39 Table 11-7 Potential Environmental Effects on North Pacific Humpback Whale......................... 11-41 Table 11-8 Humpback Whale Sound Production .......................................................................... 11-45 Table 11-9 Characterization of the Residual Effects on Behaviour due to Underwater Noise -
North Pacific Humpback Whale .................................................................................. 11-52 Table 11-10 Characterization of the Residual Effect on North Pacific Humpback Whale from
Physical Injury due to Blasting.................................................................................... 11-57 Table 11-11 Potential Environmental Effects on Steller Sea Lion .................................................. 11-59 Table 11-12 Characterization of the Residual Effect of Effects on Behaviour due to In-Air
Noise - Steller Sea Lion ............................................................................................... 11-67 Table 11-13 Characterization of the Residual Effects on Behaviour due to Underwater Noise -
Steller Sea Lion ........................................................................................................... 11-74 Table 11-14 Characterization of the Residual Effect on Steller Sea Lion from Physical Injury
due to Blasting ............................................................................................................. 11-78 Table 11-15 Summary of Residual Environmental Effects on Marine Mammals ........................... 11-82 Table 12-1 Definitions of Rating Criteria for Assessing Significance of Project Effects ............... 12-7 Table 12-2 Potential Environmental Effects on Marbled Murrelet ............................................... 12-16 Table 12-3 Habitat Suitability for Marbled Murrelet in the Terrestrial PEAA.............................. 12-20 Table 12-4 Characterization of the Residual Effects on Marbled Murrelet ................................... 12-26 Table 12-5 Potential Environmental Effects on Surf Scoter .......................................................... 12-41 Table 12-6 Characterization of the Residual Effects on Surf Scoter ............................................. 12-44 Table 12-7 Potential Environmental Effects on Bald Eagle .......................................................... 12-54 Table 12-8 Characterization of the Residual Effects on Bald Eagle .............................................. 12-61 Table 12-9 Summary of Residual Environmental Effects on Marine Birds .................................. 12-66 Table 13-1 Potential Environmental Effects of the Marine Terminal on Marine Fisheries ............. 13-3 Table 13-2 Salmon Landings in FMA 6 Subareas (1998 to 2008) ................................................ 13-12 Table 13-3 Shrimp Landings by Trap and Trawl in FMA 6 and Subarea 6-1 ............................... 13-15 Table 13-4 Characterization of the Residual Effects on Marine Fisheries from Restriction of
Access to Fishing Grounds .......................................................................................... 13-23 Table 13-5 Summary of Residual Environmental Effects on Marine Fisheries ............................ 13-28

Sec. 52 Application Volume 6B: Environmental and Socio-Economic Assessment (ESA) – Marine Terminal List of Tables
May 2010 Page xiii
Table 14–1 Concentrations of Organic and Trace Element Chemicals of Potential Concern in the Liquid Effluent Discharge ....................................................................................... 14-6
Table 14–2 Base Case Effects Magnitude for Water and Sediment Community-level Selected Representative Species ................................................................................................ 14-10
Table 14–3 Maximum Project Case Effects Magnitude for Water and Sediment Community-level Selected Representative Species ......................................................................... 14-12
Table 14–4 Maximum Application Case Effects Magnitude for Water and Sediment Community-level Selected Representative Species .................................................... 14-15
Table 14–5 Maximum Base Case Hazard Quotients for Avian and Mammalian Selected Representative Species ................................................................................................ 14-17
Table 14–6 Project Case Hazard Quotients for Avian and Mammalian Selected Representative Species ................................................................................................ 14-21
Table 14–7 Application Case Hazard Quotients for Avian and Mammalian Selected Representative Species ................................................................................................ 14-25


Sec. 52 Application Volume 6B: Environmental and Socio-Economic Assessment (ESA) – Marine Terminal List of Figures
May 2010 Page xv
List of Figures
Figure 2-1 Location of the Kitimat Terminal .................................................................................... 2-2 Figure 2-2 Kitimat Terminal Project Development Area.................................................................. 2-3 Figure 2-3 Preliminary Layout of the Kitimat Terminal ................................................................... 2-6 Figure 7-1 PEAA for Sediment and Water Quality .......................................................................... 7-5 Figure 7-2 Sediment and Water Quality Sampling Locations .......................................................... 7-9 Figure 7-3 Modelling Results for Increase in Total Suspended Solids: 80 hours after
Dredging is Completed at 0 to 2 m Depth ..................................................................... 7-13 Figure 7-4 Modelling Results for Increase in Total Suspended Solids: 80 hours after
Dredging is Completed at 10 to 13 m Depth ................................................................. 7-14 Figure 7-5 Modelling Results for Increase in Total Suspended Solids: 80 hours after
Dredging is Completed at 16 to 20 m Depth ................................................................. 7-15 Figure 7-6 Modelling Results for Increase in Total Suspended Solids: 80 hours after
Dredging is Completed at 50 to 70 m Depth ................................................................. 7-16 Figure 7-7 Modelling Results for Increase in Total Suspended Solids: 80 hours after
Dredging is Completed at 140 to 180 m Depth ............................................................. 7-17 Figure 8-1 Marine Vegetation – PDA and PEAA ............................................................................. 8-6 Figure 9-1 PEAA for Marine Invertebrates ...................................................................................... 9-5 Figure 9-2 DFO Fisheries Management Areas 5 and 6 and Subareas............................................. 9-10 Figure 9-3 Dungeness Crab Distribution ........................................................................................ 9-11 Figure 10-1 Marine Fish PEAA ........................................................................................................ 10-7 Figure 10-2 DFO Fisheries Management Areas 5 and 6 and Subareas........................................... 10-17 Figure 10-3 Modelling Results for Increase in Total Suspended Solids: 80 hours after
Dredging is Completed at 0 to 2 m Depth ................................................................... 10-22 Figure 10-4 Modelling Results for Increase in Total Suspended Solids: 80 hours after
Dredging is Completed at 10 to 13 m Depth ............................................................... 10-23 Figure 10-5 Modelling Results for Increase in Total Suspended Solids: 80 hours after
Dredging is Completed at 16 to 20 m Depth ............................................................... 10-24 Figure 10-6 Modelling Results for Increase in Total Suspended Solids: 80 hours after
Dredging is Completed at 50 to 70 m Depth ............................................................... 10-25 Figure 10-7 Modelling Results for Increase in Total Suspended Solids: 80 hours after
Dredging is Completed at 140 to 180 m Depth ........................................................... 10-26 Figure 10-8 Herring – Predicted Sound Levels above Hearing Threshold from Clamshell
Dredging, Kitimat Terminal ........................................................................................ 10-43 Figure 10-9 Salmon – Predicted Sound Levels above Hearing Threshold from Clamshell
Dredging, Kitimat Terminal ........................................................................................ 10-44 Figure 10-10 Herring – Predicted Sound Levels above Hearing Threshold from a Berthed
Tanker on Standby, Kitimat Terminal ......................................................................... 10-45 Figure 10-11 Salmon – Predicted Sound Levels above Hearing Threshold from a Berthed
Tanker on Standby, Kitimat Terminal ......................................................................... 10-46 Figure 11-1 Predicted Sound Levels from Dredging at Kitimat Terminal ..................................... 11-14

Sec. 52 Application Volume 6B: Environmental and Socio-Economic Assessment (ESA) – Marine Terminal List of Figures
Page xvi May 2010
Figure 11-2 Predicted Sound Levels from a Tanker on Standby at Kitimat Terminal.................... 11-15 Figure 11-3 Killer Whale - Predicted Sound Levels above Hearing Threshold from a Berthed
Tanker on Standby, Kitimat Terminal ......................................................................... 11-24 Figure 11-4 Killer Whale - Predicted Sound Levels above Hearing Threshold from Clamshell
Dredging, Kitimat Terminal ........................................................................................ 11-28 Figure 11-5 Humpback Whale - Predicted Sound Levels above Hearing Threshold from a
Berthed Tanker on Standby, Kitimat Terminal ........................................................... 11-44 Figure 11-6 Humpback Whale - Predicted Sound Levels above Hearing Threshold from
Clamshell Dredging, Kitimat Terminal ....................................................................... 11-49 Figure 11-7 Steller Sea Lion - Predicted Sound Levels above Hearing Threshold from a
Berthed Tanker on Standby, Kitimat Terminal ........................................................... 11-62 Figure 11-8 Steller Sea Lion - Predicted Sound Levels above Hearing Threshold from
Clamshell Dredging, Kitimat Terminal ....................................................................... 11-72 Figure 12-1 Marine PEAA for Marine Birds .................................................................................... 12-5 Figure 12-2 Terrestrial PEAA for Marine Birds ............................................................................... 12-6 Figure 12-3 Marbled Murrelet Nesting Suitability at Baseline ....................................................... 12-13 Figure 12-4 Marbled Murrelet Nesting Suitability at Construction ................................................ 12-21 Figure 12-5 Marbled Murrelet Nesting Suitability at Operations ................................................... 12-23 Figure 13-1 DFO Fisheries Management Area 6 and Subareas ........................................................ 13-5 Figure 13-2 Fishing Gear Type in Subarea 6-1, 1998 to 2008 ........................................................ 13-13 Figure 13-3 Fisheries Management Areas 6 Aboriginal Catch, 1999 to 2005 ................................ 13-17 Figure 13-4 Fisheries Management Area 6 Recreational Catch, 1998 to 2007 .............................. 13-21 Figure 14-1 Marine Water Quality Model Compartments ................................................................ 14-3 Figure 14-2 Conceptual Exposure Model for Marine Environment Selected Representative
Species ........................................................................................................................... 14-8 Figure 15-1 Recorded Seismicity in Western Canada ...................................................................... 15-3

Sec. 52 Application Volume 6B: Environmental and Socio-Economic Assessment (ESA) – Marine Terminal Section 1: Introduction
May 2010 Page 1-1
1 Introduction This volume (6B) describes the environmental effects of routine activities of the marine terminal. The environmental effects of the routine activities within the security fence of the Kitimat Terminal (including infrastructure down to the foreshore) and pipelines are described in Volume 6A. Routine activities associated with marine transportation are addressed in Volume 8B.
1.1 Purpose of the Environmental and Socio-economic Assessment The environmental and socio-economic assessment (ESA) has been prepared as part of the filing to meet the requirements of the National Energy Board Act (NEB Act) and the Canadian Environmental Assessment Act (CEA Act).
1.2 Overview of Kitimat Terminal The Kitimat Terminal comprises the tank terminal and the marine terminal. The marine terminal is considered in this volume.
Key components of the marine terminal that are considered in Volume 6B include:
• two marine loading and unloading berths • a utility berth located north of the loading/unloading berths • a 150-m wide safety zone that encompasses a 100-m wide water lot for the marine terminal
Additional details on the Project are provided in Section 2.
1.3 Marine Safety and Environmental Protection As with all Enbridge projects, the Project will be designed with the intention of establishing a model of world-class safety and environmental standards, including requirements related to tankers calling at the Kitimat Terminal.
Examples of these requirements include:
• The Tanker Acceptance Program will ensure that the tankers scheduled to berth at the terminal will meet the highest industry standards.
• All tankers must be equipped and will be required to conform with closed loading and vapour recovery operation systems.
• All tankers will be equipped with an electronic chart display and information system (ECDIS), which integrates position information from the global positioning system (GPS) and other navigational sensors, such as radar and automatic identification systems (AIS).
• Experienced marine pilots with independent pilot carried ECDIS navigation systems will be on board to provide guidance during transits of the coastal waterways.
• Dock monitoring, mooring load monitoring, firefighting, gas detection, security and other safety systems will be installed and monitored during all phases of cargo handling operations.

Sec. 52 Application Volume 6B: Environmental and Socio-Economic Assessment (ESA) – Marine Terminal Section 1: Introduction
Page 1-2 May 2010
The Kitimat Terminal will be equipped with state of the art spill prevention and containment equipment, reducing the risk of spills and the potential for adverse effects. All shore crews handling vessels and hydrocarbon transfers will have extensive training in the safe handling of hydrocarbons and in response preparedness (see Volume 7C for a more detailed discussion of precautions to be taken at the Kitimat Terminal).
1.4 Overview of Volume 6B: Routine Activities Associated with the Marine Terminal
This volume consists of:
• Section 1: An introduction to the environmental and socio-economic assessment, the purpose of the ESA, the scope of the Project and a brief overview of regulatory requirements
• Section 2: A description of the Project with an emphasis on the marine terminal
• Section 3: A brief description of the setting for the marine terminal
• Section 4: A description of the scope of assessment and the methodology employed in completing the ESA
• Section 5: A summary of the project design features, mitigation measures and environmental protection measures that will be employed in association with the construction and operations of the marine terminal
• Section 6: A description of how species at risk are addressed in the ESA
• Sections 7 through 13: An assessment of the project effects and cumulative effects on the selected marine valued environmental components (VECs), specifically:
• sediment and water quality • marine vegetation • marine invertebrates • marine fish • marine mammals • marine birds • marine fisheries
• Section 14: An ecological risk assessment for the marine terminal
• Section 15: Findings on effects of the environment on the marine terminal
• Section 16: Conclusions

Sec. 52 Application Volume 6B: Environmental and Socio-Economic Assessment (ESA) – Marine Terminal Section 2: Project Description for the Kitimat Terminal
May 2010 Page 2-1
2 Project Description for the Kitimat Terminal Details and specifications of the Project are based on the preliminary engineering design. For the environmental assessment, a number of assumptions on project design, construction, operations and decommissioning have been made. These assumptions address project components that cannot be confirmed until the detailed engineering design phase, and are identified below in subsections titled Assumptions for the ESA. Where a range of options or values is possible, the assessment of environmental effects assumes options or values likely to result in the largest adverse effect so that the assessment is conservative.
2.1 Kitimat Terminal The Kitimat Terminal is on the west side of Kitimat Arm (see Figure 2-1 and Figure 2-2) and refers to the tank terminal (the area inside the security fence) and the marine terminal, as well as the undeveloped area outside the security fence that also includes the excess cut disposal area. The total area is 478 ha: 220 ha inside the security fence (the area of infrastructure development that is discussed in detail in Volume 3, Section 9) and 258 ha outside the security fence.
The tank terminal is the area inside the security fence and refers to the tank lot, the interconnect pipes between the tank lot and the marine terminal and a number of additional infrastructure elements (such as the fire water reservoir and the impoundment reservoir). This area extends to the land portion above the highest high water mark, not including marine riparian areas.
The marine terminal refers to the marine infrastructure at or below the water line (dock, foundations loading arms, valves and piping), including everything from the marine riparian area and below the highest high water mark.

REFERENCES: NTDB Topographic Mapsheets provided by the Majesty the Queen in Right of Canada, Department of Natural Resources. All rights reserved.
FIGURE NUMBER:
PREPARED FOR: SCALE:
Location of Kitimat Terminal
E N B R I D G E N O R T H E R N G A T E W A Y P R O J E C T
Reference: Pipeline Route P: November 5, 2008
Z:\C
lient
s\E
nbrid
ge\G
atew
ay\F
igur
es\M
XD
\JW
A-C
AL-
050.
..\JW
A-1
0389
83-0
50-0
05.m
xd
2-1
NAD 83
1:650,000
JWA-1038983-035-001
UTM 9
JP2 DC
Jacques Whitford AXYS Ltd. 20100407
PROJECTION: DATUM:
AUTHOR: APPROVED BY:
DATE:CONTRACTOR:
200
m
200
m
300 m100 m
Kitim
at A
rm
Kitimat
KitamaatVillage
KitimatTerminal
BishCove
EmsleyCove
MinetteBay
Kitimat River
100 m
KP 1160
KP 1172
KP 1171
KP 1170
KP 1169
KP 1168
KP 1167
KP 1166
KP 1165
KP 1164
KP 1163
KP 1162
KP 1161
KP 1159KP 1158
KP 1157
KP 1172.2
PREPARED BY:
Reference: Pipeline Route R
JWA-1038983-050-005
0 1 2 3 4
Kilometres
Kilometre Post
Pipeline Route
Terrestrial Project Development Area
Marine Project Development Area
Security Fence
Powerline
Kitimat Terminal Bypass Road
Bish Forest Service Road
Bathymetry (100 m)

REFERENCES: NTDB Topographic Mapsheets provided by the Majesty the Queen in Right of Canada, Department of Natural Resources. All rights reserved.
FIGURE NUMBER:
PREPARED FOR: SCALE:
Kitimat TerminalProject Development Area
E N B R I D G E N O R T H E R N G A T E W A Y P R O J E C T
Reference: Pipeline Route P: November 5, 2008
Z:\C
lient
s\E
nbrid
ge\G
atew
ay\F
igur
es\M
XD
\JW
A-C
AL-
049-
Loca
tion_
Kiti
mat
_Ter
min
al_D
ougl
as_C
hann
el\J
WA
-103
8983
-049
-005
.mxd
2-2
NAD 83
1:25,000
UTM 9
JP2 DC
Jacques Whitford AXYS Ltd. 20100407
PROJECTION: DATUM:
AUTHOR: APPROVED BY:
DATE:CONTRACTOR:
Kitim
at A
rm
Ki t
ima
t A
rm
Bish Cove
Bish Creek
KP 1172
KP 1171
KP 1170
KP 1172.2
PREPARED BY:
Reference: Pipeline Route R
JWA-1038983-049-005
0.3 0 0.3 0.6
Kilometres
Kilometre Post
Pipeline Route
Terrestrial Project Development Area
Marine Project Development Area
Excess Cut Disposal Area
Security Fence
Powerline
Tank
Kitimat Terminal Bypass Road
Bish Forest Service Road

Sec. 52 Application Volume 6B: Environmental and Socio-Economic Assessment (ESA) – Marine Terminal Section 2: Project Description for the Kitimat Terminal
Page 2-4 May 2010
The area within the security fence includes:
• hydrocarbon tanks
• pump facilities
• other land facilities
• a guard house and security gate at the main entrance
• an internal network of gravel roads between various facilities
• an electric yard, substation and associated facilities
• construction trailers and offices (the ESA assumes a construction camp will be at another location)
• storage, maintenance and control buildings
• gravel surface parking near the construction trailers and offices
• tanks for potable water within several of the buildings
• tanks for grey water and sewage adjacent to several buildings
• an impoundment reservoir
• a firewater reservoir
• an oil-water separator
• a recovered oil tank to hold oily water and pumps to move oily water to the oil-water separator
• a network of transfer pipelines on elevated pipe racks to transport condensate from the berths to the condensate tanks, as well as other transfer pipelines to transport oil from the oil tanks to the berths
• oil and condensate metering and laboratory facilities
• a network of transfer pipelines to transport oil from the export oil pipeline into the oil tanks and to transport condensate from the condensate tanks to the initiating condensate pump
• a condensate initiating pump station to pump condensate into the condensate import pipeline
• a staging area adjacent to the utility berth for temporary storage of construction materials and other equipment
The Kitimat Terminal will also include:
• an excess cut disposal area on land for material cut from the tank terminal (e.g., rock and marine clays)
• a topsoil storage area (for reclamation)
• a construction staging area
The location and specifications for these ancillary areas have not been finalized, and might be outside the security fence (see Figure 2-2).

Sec. 52 Application Volume 6B: Environmental and Socio-Economic Assessment (ESA) – Marine Terminal Section 2: Project Description for the Kitimat Terminal
May 2010 Page 2-5
A 60-m wide area will be cleared around the outside perimeter of all major infrastructure as a firebreak and is included in the 220 ha area estimate within the security fence.
The firewater reservoir will be a water source to fight potential fires. In the event of a fire, additional water could be provided from the impoundment reservoir. Optional provisions in the foreshore area will include allowances for using sea water for fire fighting. The Kitimat Terminal will be equipped with a firewater and foam system to detect and suppress any fires. There will be water cannons with ancillary foam tanks on the berth structure adjacent to, and providing coverage of the berth working platform, the cargo loading arms and ship’s manifold.
Surface water runoff from the developed areas of the tank terminal will be directed to, and stored in, the impoundment reservoir. Water from the impoundment reservoir may be sent to the firewater reservoir.
Before being released to the marine environment, excess water from the impoundment reservoir will be tested to confirm that the concentration of oil is less than 15 parts per million. Water will be released through a perforated pipe located away from the boomed zone of the berths. If the water is found to have oil in excess of 15 parts per million (ppm), it will be directed through the oil-water separator prior to its release.
There is a need for an excess cut disposal area (primarily rock and marine clays) and a bypass road to Bish Creek. A suitable bypass road alignment has been preliminarily identified. The bypass road will provide access for the public to travel beyond the Kitimat Terminal and rejoins Bish forest service road west and south of the PDA (see Figure 2-2). This will allow the public unobstructed access to Bish Cove and surrounding areas throughout the construction phase and during operations of the terminal.
The Kitimat Terminal main access road will be an upgrade of Bish forest service road from the end of the existing pavement to the security fence. (This road is also referred to in the ESA and TDRs as the Kitimat Terminal permanent access road and the Kitimat pump station access road.)
The design of the tank lot is for 14 hydrocarbon tanks. For the current design concept, each tank capacity is 78,800 m3 (496,000 barrels). The hydrocarbon tanks and most of the tank terminal infrastructure will be on a levelled area at approximately 180 m above sea level (asl).
Concrete containment berms will surround each of the four rows of hydrocarbon tanks. Secondary containment berms will separate each tank within the concrete containment berm to allow for localized containment of hydrocarbons. The area inside the berms will be double lined with an impervious membrane liner.
The Kitimat pump station powerline (also called the proposed 287 kV powerline; see Figure 2-3) goes to the electrical yard and substation, where power will then be distributed throughout the Kitimat Terminal, as required.

CONTRACTOR:
PREPARED BY: PREPARED FOR:
FIGURE NUMBER:
SCALE:
PROJECTION: DATUM:
AUTHOR: APPROVED BY:
DATE:
JP2 DC
NAD 83UTM 9
200912112-3Jacques Whitford AXYS Ltd. E N B R I D G E N O R T H E R N G A T E W A Y P R O J E C T
Preliminary Layout of Kitimat Terminal
Kitimat
Arm
KP 1170
KP 1169
KP 1168
KP 1172
KP 1171
KP 1170
KP 1169
KP 1172.2
1:15,000
Kilometre Post
Pipeline Route
Marine Project Development Area
Excess Cut Disposal Area
Security Fence
Powerline
Tank
Kitimat Terminal Bypass Road
Bish Forest Service Road
Z:\C
lient
s\E
nbrid
ge\G
atew
ay\F
igur
es\M
XD
\JW
A-C
AL-
039_
Roc
k_A
rt_S
ites_
At_
Kiti
mat
_Ter
min
al\J
WA
-CA
L-10
3898
3-03
9-00
2.m
xd
VLCC Tanker
Recovered Oil Tank and Pumps
Suezmax TankerUtility Berth
Proposed 287kVPowerline
Tanker Berth
Tanker Berth
Mooring Structures
Berthing Structures
Bish Forest Service Road
Pipe Racks
Potential AddtionalTank
Potential Addtional Tank
ContainmentBerms
Oil-Water Separator
Reservoir Transfer
Pumps
ImpoundmentReservoir
Firewater Reservoir
Condensate Tanks
Oil Tanks
Control Room
Construction Trailers/Offices
Parking
Firewater PumphouseOil/Condensate Tank
Transfer Manifold
Oil/Condensate Booster/Tank Transfer Pumps
Powerlines
Condensate Booster/Transfer & Sump Pumps
Oil and CondensateSending/Receiving Traps
Oil/Condensate Pipelines
Condensate InitiatingMainline Pumps
Marine Topworks (Loading Arms, Gangway, Trestles, Etc.)
Electrical Yard and Substation
Foreshore Facilities
Marine Topworks
Oil Custody Transfer Metering
0 0.1 0.2 0.3 0.4
Kilometres
Reference: Pipeline Route R
JWA-CAL-1038983-039-002
Security Gate
Vapour Recovery Unit
Seawater Firewater Pumps
Seawater Firewater Pumps

Sec. 52 Application Volume 6B: Environmental and Socio-Economic Assessment (ESA) – Marine Terminal Section 2: Project Description for the Kitimat Terminal
May 2010 Page 2-7
2.1.1 Marine Terminal The marine terminal encompasses the marine-based facilities within the Kitimat Terminal and extends from the upper edge of the marine riparian area seaward. It includes a 150-m safety zone seaward of the berth structures (included within the safety zone is a 100-m water lot). The marine terminal will consist of two tanker berths and one utility berth (see Figure 2-3). Both tanker berths will be equipped for loading oil tankers and unloading condensate tankers.
Each tanker berth will consist of:
• a work platform structure supporting loading arms, gangways and connecting trestles • four berthing structures and fendering systems • six mooring structures and mooring hooks units
2.1.2 Assumptions for the ESA For the ESA, it is assumed that:
• clearing and infrastructure along the foreshore will result in the disturbance of up to 1,000 m of marine riparian vegetation
• surface water runoff from the area outside the tank and manifold areas will be controlled so that this water will be released outside the boomed zone of the berthing facilities to the extent practical. The Kitimat Terminal will include waste storage and handling capabilities (solid waste, liquid waste and hazardous waste) for land-based facilities and tankers. The Kitimat Terminal will have facilities to receive, treat and recover oil from the tankers' cargo slops tanks. Engine room slops and bilge water will be transported offsite by a third-party contractor for treatment and disposal.
• the recovered oily water from the berth operations will be treated using an oil-water separator. The oil-water separator will be capable of reducing the concentration of oil to 15 ppm or less.
• the Kitimat Terminal will include potable water infrastructure to support trucked-in water
• there will be three 4,000 hp condensate off-loading booster pumps (including one backup) to pump condensate from the marine terminal up to the condensate tanks, two 850 hp seawater pumps in case of fire (including one backup), and numerous smaller pumps. All pumps will be electrically powered.
2.2 Kitimat Terminal Construction
2.2.1 Land Areas
2.2.1.1 Clearing
Tree clearing will be limited to the immediate area. Some treed areas will remain inside the security fence.
Within the 220-ha area, clearing of 110 ha of forest cover will be required, in addition to approximately 40 ha of existing cutblocks.

Sec. 52 Application Volume 6B: Environmental and Socio-Economic Assessment (ESA) – Marine Terminal Section 2: Project Description for the Kitimat Terminal
Page 2-8 May 2010
Merchantable timber will be salvaged as determined in the Timber Salvage Plan. Vegetation that is not merchantable will be burned or chipped.
2.2.1.2 Soil Salvage
Topsoil and other organic material will be conserved for reclamation. Topsoil and other organic soils will be salvaged selectively and stored to prevent admixing. Salvaged soils will be protected to prevent loss or degradation while stored.
2.2.1.3 Blasting and Grading
Details on the amount and timing of blasting and associated site contouring activities will be finalized as part of the detailed engineering design. Blasting will be scheduled to limit noise disturbances to adjacent industry and residents. Blasting will follow all applicable safety regulations and standards.
Site grading for the tank lot will generate approximately 3 million m3 of excess cut material. Spoil material will be placed in the excess cut disposal area on land outside the security fence.
2.2.1.4 Facility Construction and Testing
Infrastructure will be built to industry standards and will be designed to meet or exceed applicable provincial and federal standards, including appropriate design measures for seismic (earthquake) safety and other natural events (e.g., flooding, tsunamis).
Details on tank hydrostatic testing will be finalized during detailed engineering design. It is assumed that hydrostatic testing will use freshwater.
2.2.2 Marine Terminal Key activities during construction include dredging, blasting, and construction of berths and facilities.
2.2.2.1 Dredging
Dredging will be required for construction of the berth foundations. Dredged material will be disposed of at the excess cut disposal area. Total overburden dredging quantities for the berth structures will be approximately 30,000 m3. This assumes a 1.5 m sediment overburden depth will be removed. Dredging will likely be completed using a derrick barge with a clamshell bucket. Dredging will take approximately eight to nine weeks to complete.
A dredging plan will be developed based on a preliminary berth structure design and configuration. The dredged area and volume may change to suit the final design of the structures but is not anticipated to exceed the volumes noted above.

Sec. 52 Application Volume 6B: Environmental and Socio-Economic Assessment (ESA) – Marine Terminal Section 2: Project Description for the Kitimat Terminal
May 2010 Page 2-9
2.2.2.2 Blasting
Underwater blasting will be required to provide a level surface for foundation pile locations and positioning. Based on preliminary engineering design, total rock blasting (cut) quantities for the berth structures will be approximately 25,000 m3. Based on detailed engineering design, the number of piles may be reduced by using an alternate berth design consisting of some land-based mooring structures.
The majority of blasting will take place in water depths of 10 to 32 m. However, some blasting may take place in shallower water.
Blasting will be scheduled to limit noise disturbances to adjacent industry and residents. High quality, waterproof explosives that do not degrade in the environment will be used. Blasting will follow all applicable safety regulations. Blasted material will be disposed at the excess cut disposal area, to the extent practical.
The Blasting Management Plan assumes a preliminary berth structure design and configuration. The area and volume of blasting may change to suit the final design of the structures but is not anticipated to exceed the volumes cited.
2.2.2.3 Berths and Facilities
Jacket and/or pile supports are proposed for the deepwater tanker berth structures. These include the loading platforms and berthing structures, as well as shallower water or on-land structures such as the mooring structures.
The current design for the utility berth is a floating structure, secured in place with vertical guide piles, and an articulating access ramp to a shore-based abutment.
Based on the preliminary design, approximately 200 piles and five abutments will be required for the foundations of the three berths. The number of piles and other structures could be reduced as a result of detailed engineering design.
2.2.2.4 Construction-Related Vessels
The number of supply vessels, coastal tugs and barges that will be required during construction of the terminal will be determined during detailed engineering design. Routing and scheduling of these vessels will also be determined as part of detailed engineering design. The estimated numbers of construction vessels required to construct the marine terminal are summarized in Table 2-1. (The numbers for the tank terminal will be determined during detailed engineering design.) It is assumed that one coastal tug will be required for each barge transit.
Assessment of the environmental effects of marine transportation related to the Project is considered in Volume 8B.

Sec. 52 Application Volume 6B: Environmental and Socio-Economic Assessment (ESA) – Marine Terminal Section 2: Project Description for the Kitimat Terminal
Page 2-10 May 2010
Table 2-1 Estimated Barge Traffic for Marine Terminal Construction
Construction Year Construction
Quarter
Trips from Vancouver to the Kitimat Terminal
Trips from the Kitimat Terminal to
Vancouver Total Barge Trips Year 1 3 7 0 7 Year 2 1 0 4 4 Year 2 2 9 5 14 Year 2 3 8 6 14 Year 3 1 0 0 0 Year 3 3 4 2 6 Year 4 1 0 0 0 Year 4 3 0 0 0 Year 4 4 0 11 11 Totals: 28 28 56
2.2.3 Construction Camp The construction of the Kitimat Terminal will require a camp capable of supporting 200 to 300 people. It will be either at an existing camp facility in the Kitimat town area or at the Kitimat Terminal. The construction camp will need to operate year-round.
2.2.4 Assumptions for the ESA For the ESA, it is assumed that:
• the tank terminal site will require approximately 400 blasting events over 24 months. Blasting will be scheduled so as to limit noise disturbances to adjacent residents and industry.
• the marine terminal site will require blasting and, dredging over 18 weeks. Blasting will take approximately three weeks and will be scheduled to limit noise disturbance to adjacent residents and industry.
• due to the slope of the underlying sea floor it is estimated that up to 40% (10,000 m3) of the blasted rock will not be recoverable and will, therefore, remain in the marine environment
• tanks will be hydrostatically tested using fresh water. Hydrostatic test water will be extracted from on-site storm water collection ponds. If required, additional water will be obtained from local watercourses to augment the on-site supply. Tank testing will comply with regulatory requirements. Hydrostatic test water will be analyzed before transfer to the impoundment reservoir.
• excess surface water runoff from the impoundment reservoir will be released into the marine environment through a subtidal, perforated pipe that will be located away from the boomed zone of the berths
• each tanker berth will have approximately four berthing structures and six mooring structures. All structures are assumed to be in the intertidal or subtidal environment; however, this number may be reduced through alternative berth designs and use of land-based structures.

Sec. 52 Application Volume 6B: Environmental and Socio-Economic Assessment (ESA) – Marine Terminal Section 2: Project Description for the Kitimat Terminal
May 2010 Page 2-11
• all main berth structure foundations will use rock-socketed piles (though there is potential for some mooring structures to be replaced by land-based structures). Dredging and blasting will be required at each pile location.
• all rock-socketed piles will be installed using drilling techniques. Approximate drilling and installation time for a rock-socketed pile is four days. With two drilling barges and crews working simultaneously six days per week, drilling and installation of piles for the berths is estimated to take 400 days.
• the Kitimat Terminal construction camp will be offsite and the construction workforce will be transported to the site by bus or other group transport. Water use at the construction camp will be approximately 2,050 m3/month. Grey water and sewage will be transported to existing facilities in Kitimat for treatment.
• construction equipment and materials for the terminal will be transported by rail or by truck to Kitimat, or by ship or barge, where practical
• fuel (diesel) consumption during construction of the terminal will total approximately 16 million litres
• the off-loading of condensate from the tankers will be powered from steam driven pumps, using No. 6 Fuel Oil (bunker C) to fire the tankers auxiliary boiler
• during loading of oil, inert gas vapours exhausted from the oil storage tanks on the tanker will be captured by a vapour recovery unit (VRU) located within the marine terminal
2.3 Kitimat Terminal Operations The operations schedule and activities for the Kitimat Terminal are based on the preliminary project concept. Final details on operations will be confirmed later during detailed engineering design.
Operations will involve hydrocarbon tanks and associated pumps and facilities, as well as:
• ongoing equipment monitoring • preventative maintenance • regularly scheduled safety and security inspections • receiving oil from the export pipeline • sending condensate into the import pipeline • tank gauging • communications facilities (including backup) • monitoring treatment, if required, and discharge of impounded water • routine equipment upgrades
Other operational activities and design features include the following:
• Condensate will be transferred from the unloading berths up to the condensate tanks using electric powered pumps.
• Oil will be loaded onto tankers using gravity feed.
• Electric-powered pumps will be used to transfer condensate into the import condensate pipeline.

Sec. 52 Application Volume 6B: Environmental and Socio-Economic Assessment (ESA) – Marine Terminal Section 2: Project Description for the Kitimat Terminal
Page 2-12 May 2010
• Electric-powered pumps will be used to transfer oil from the export oil pipeline into appropriate oil tanks.
• The hydrocarbon tanks will be designed with external floating roofs. Water that collects on floating roofs will be drained to the impoundment reservoir.
• The oil and condensate tanks will have approximately 450 and 165 cycles per year respectively (i.e., a cycle includes a single filling and emptying of a tank or vice versa), based on 80% tank working capacity and average annual throughput.
• As required, excess water from the impoundment reservoir and the firewater reservoir will be released (provided the oil in water concentration is less than 15 ppm) through a subtidal, perforated pipe that will be located away from the boomed zone of the oil berthing facilities.
• The use of personal vehicles between Kitimat and the Kitimat Terminal will be limited.
Within the security fence, there will be a firewater reservoir in case of fire. In the event of a fire, additional water could be provided from the surface water runoff impoundment reservoir. Optional provisions in the foreshore area will include allowances for using seawater for firefighting. There will be water cannons with ancillary foam tanks on the tanker berth structure adjacent to, and providing coverage of, the cargo loading arms and ship’s manifold.
2.3.1 Marine Terminal Marine terminal operations will consist of tanker berthing and unberthing, mooring and unmooring, loading and unloading, VRU to capture displaced vapour during ship loading operations, testing of hydrocarbons before unloading or loading, monitoring and surveys, preventative maintenance, routine equipment upgrades, regularly scheduled safety and security inspections, and ship clearance procedures.
Tanker specifications and estimates of the number of tankers that will use the Kitimat Terminal each year are provided in Table 2-2.
Maximum design loading and unloading rates will be 15,900 m3/h for oil and 11,100 m3/h for condensate, respectively. Current actual loading and unloading rates for specific ship types are listed in Table 2-2.
Condensate will be discharged to the tank terminal from condensate tankers using the tankers centrifugal pumps. Motive power can be either steam or electricity. The primary fuels to drive the steam and electric pumps is No. 6 Fuel Oil (bunker C) and No. 3 Fuel Oil (marine diesel oil), respectively.
Line-handling boats will be berthed at the utility berth and used pre-booming.

Sec. 52 Application Volume 6B: Environmental and Socio-Economic Assessment (ESA) – Marine Terminal Section 2: Project Description for the Kitimat Terminal
May 2010 Page 2-13
Table 2-2 Oil and Condensate Tanker Specifications
Parameter
Tanker Class VLCC
(maximum values)
Suezmax (average values)
Aframax (minimum
values) Annual oil product by ship class (m3) 16,000,000 11,000,000 4,000,000 Annual condensate product by ship class (m3) 0 9,000,000 2,000,000 Total cargo per ship class (m3) 16,000,000 20,000,000 6,000,000 Size (dwt) 320,472
(summer load) 312,500
(winter load)
160,000 (summer load)
155,000 (winter load)
81,408 (summer load)
79,000 (winter load)
Overall length (m) 343.7 274.0 220.8 Beam (m) 70 (max) 48 32.2 Moulded depth (keel to main deck) (m) 30.5 23.1 18.6 Loaded draft (m) 23.1
(summer load) 22.5
(winter load)
17.0 (summer load)
16.6 (winter load)
11.6 (summer load)
11.3 (winter load)
Average cargo capacity (t)* 300,000 150,000 100,000 Average cargo capacity (m3) 330,000 160,000 110,000
Main engine power rating (kW) 30,000 20,000 15,000 Auxiliary engine power rating (kW) 1,500 1,000 750 Number of tankers per year (range) 40 to 60 110 to 130 40 to 60 Number of tankers per year (average) 50 120 50 Average transits per day in Douglas Channel 0.3 0.6 0.3 Total time transit and manoeuvring (rounded h/yr) 1,500 2,900 1,300 Estimated average cargo transfer rate (m3/h) 12,800 8,000 6,400 Total time at berth (rounded h/yr) 1,700 2,900 1,200 Primary ship engine fuel type No. 6 bunker C No. 6 bunker C No. 6 bunker C
NOTES: bbl barrels dwt deadweight tonne h/yr hours per year kW kilowatt m3/h cubic metre per hour t tonne

Sec. 52 Application Volume 6B: Environmental and Socio-Economic Assessment (ESA) – Marine Terminal Section 2: Project Description for the Kitimat Terminal
Page 2-14 May 2010
Each tanker berth will be equipped with a containment boom. The containment boom will be deployed during all oil loading operations. The containment boom will extend from shore, out around the tanker and back to shore. Because condensate dissipates quickly, the containment boom will not be used during condensate off-loading.
All tankers using the Kitimat Terminal will follow requirements for ballast water management and discharge under the Canada Shipping Act, Canadian Ballast Water Control and Management Regulations (BWCMR), and implement an International Maritime Organization (IMO) approved ballast water management plan. Tankers will have segregated ballast on board that has been exchanged not less than 200 nautical miles from shore, as described by the Ballast Water Management Procedures under the BWCMR. Oily ballast water will not be discharged at the Kitimat Terminal. Solid waste and liquid waste will be managed according to the Canadian Shipping Act.
The Kitimat Terminal will have oil-water separator facilities to receive, treat and recover oil from the tankers' cargo slops tanks. The cargo slops can be discharged from the tanker to the terminal’s facility using the same cargo pumps and transfer arms that are used to transfer regular cargo. Although the Kitimat Terminal will not provide on-site facilities to treat or dispose of engine room slops, it will offer a service provided by a third-party contractor, which will use vacuum trucks to receive and transfer the slops to an offsite facility for proper disposal.
2.3.2 Assumptions for the ESA For the ESA, it is assumed that:
• the off-loading of condensate from the tankers will be powered by steam driven pumps, using No. 6 Fuel Oil (bunker C) and using the tankers’ auxiliary boiler
• during loading of oil, inert gas vapours exhausted from the oil tanks on the tanker will be captured by a VRU
• ship-to-shore power supply will not be available
• two ships (either condensate or oil) can be berthed simultaneously (at two berths) at the Kitimat Terminal
• ships will be berthed for 18 to 36 hours to either load or unload. Most vessels will be at the berth for approximately 24 hours.
• tankers will be discharging segregated ballast at the Kitimat Terminal as they load oil. Condensate tankers will be taking on ballast as they unload condensate.
• when not active, escort tugs will berth at the utility berth or at a facility in Kitimat
• up to four tugs (in a combination of escort and harbour tugs will be used to berth or unberth each tanker
• up to seven escort or harbour tugs may operate within the CCAA at one time
• maintenance for escort and harbour tugs will be provided at existing facilities in Kitimat

Sec. 52 Application Volume 6B: Environmental and Socio-Economic Assessment (ESA) – Marine Terminal Section 2: Project Description for the Kitimat Terminal
May 2010 Page 2-15
• escort and harbour tugs will be fuelled at suitable refueling facilities in Kitimat
• harbour tugs are assumed to be similar to those commonly used for such purposes
• harbour tugs will be on standby at the utility berth but may be berthed at a facility in Kitimat if there is no ship at the Kitimat Terminal
• due to the depth of water at the berthing facilities, prop wash from tankers or tugs will not influence the bottom substrate
• all tankers will be equipped with fixed drip trays beneath the manifolds in accordance with the Oil Companies International Marine Forum recommendations (OCIMF 1991). The drip trays will be drained into the cargo tank at the end of each loading or unloading operation and whenever else necessary. All ships receiving cargo will operate under “closed loading” conditions where tank lids and sighting ports will be securely closed and all vapours returned to the VRU at the marine terminal. Prior to cargo transfer, all sea water intakes or overboard discharge lines connected to cargo systems will be securely closed and sealed (if practical), and deck scuppers will be plugged to prevent any oil discharging overboard.
• the loading platform and access trestles will have concrete decks and will be fully curbed. The deck will be sloped to allow all runoff to be collected in a sump and then pumped to the oil-water separator. The loading arms will be equipped with fixed drip trays. Any material collected in the drip trays will be pumped to the recovered oil tank.
2.4 Decommissioning It is assumed that the above ground infrastructure will be removed. Underground pipelines and structures will be abandoned in place according to regulations and standards at the time of decommissioning. Unless government or local authorities decide to retain them, it is assumed that all Kitimat Terminal infrastructures will be removed to the top of the substrate and reclaimed according to the regulations and standards at the time of decommissioning.
2.5 Environmental Protection and Management Plan The Construction Environmental Protection and Management Plan (EPMP; see Volume 7A) describes the environmental management aspects that will be applied to the Project during construction of the pipelines and associated facilities (including the Kitimat Terminal components, RoW development, facilities installation, construction camps, stockpile sites, access roads and utility corridors). The Construction EPMP gives a provisional description of the general and specific methods that will be applied for the Project and Northern Gateway’s commitment to conduct the Project in a manner that protects the environment. Once detailed engineering and route selection have been completed, a final Construction EPMP will be produced for each component of the Project (i.e., the pipelines, tunnels, pump stations and the Kitimat Terminal). The final Construction EPMP will:
• identify federal and provincial environmental regulations pertaining to the Project, along with the associated permits and approvals that will be obtained

Sec. 52 Application Volume 6B: Environmental and Socio-Economic Assessment (ESA) – Marine Terminal Section 2: Project Description for the Kitimat Terminal
Page 2-16 May 2010
• outline environmental protection measures related to project activities to confirm that all construction activities are in compliance with the above-referenced regulations and with any documented, project-specific environmental commitments
• provide instructions for carrying out construction activities to reduce environmental effects
• serve as a reference handbook for environmental inspection staff to assist with understanding the decision-making and provide links to more detailed information
• form part of the contract documents to be used as the primary reference for specific environmental protection instructions
• serve as an educational tool for the orientation and training of project personnel
• provide the foundation for environmental inspection and monitoring during construction to confirm compliance with the Project’s environmental initiatives and the specific regulatory commitments pertaining to the Project
2.6 References Oil Companies International Marine Forum (OCIMF). 1991. Recommendation for Oil Tanker Manifolds
and Associated Equipment. Fourth Edition.

Sec. 52 Application Volume 6B: Environmental and Socio-Economic Assessment (ESA) – Marine Terminal Section 3: Setting for the Marine Environment
May 2010 Page 3-1
3 Setting for the Marine Environment
3.1 Physical Marine Environment Based on the British Columbia Marine Ecological Classification system (LGL Limited Environmental Research Associates 2004), Kitimat Arm is part of the North Coast Fjord Ecosection of the Queen Charlotte Basin (QCB) Ecounit. This ecosection is characterized by a maze of waterways, inlets, and glacial fjords. Its fjords tend to be deep with steep sides, have relatively flat beds with thick sediments, and contain glacial sills. The sediments are of glacial origin, deposited 13,000 to 10,000 years ago.
There are three depositional basins in Douglas Channel and Kitimat Arm: Gil, Maitland and Kitimat. Gil and Maitland basins are separated by a major sill just south of Kitkiata Inlet. Kitimat Basin in northern Kitimat Arm has a 600-m layer of highly stratified postglacial sediments (Bornhold 1983), distributed unevenly throughout the system. Harris (1999) estimated a sediment burial rate of 0.61 cm/year for Kitimat Arm, corresponding to a net deposition rate of 1.9 x 10⁻³ kg/m2/day, 58% of which is generated by resuspension, with the remainder imported from river sediments. Historical aerial photographs for Kitimat Arm prior to industrial development show a large sediment plume from the Kitimat River estuary moving past the PDA and Bish Cove. These photographs illustrate the large amount of natural suspended sediments in the upper reaches of Kitimat Arm. Temperature and salinity profiles collected in Kitimat Arm reveal a well mixed water column in winter, and a stratified water column, with a distinct upper layer 3 to 7 m thick, during the rest of the year (Pickard 1961). Due to increased freshwater discharge and precipitation, Kitimat Arm has a strong salinity gradient (halocline) from late spring into fall. Typically, the upper layer has a salinity of 31
3.1.1 Kitimat Arm Physiography
in summer (see Marine Physical Environment Technical Data Report [TDR], ASL 2010). Surface waters are also warmer during the spring, summer, and fall than during winter.
The coast of mainland British Columbia is subject to coastal mountain, and offshore weather and climate patterns. Water circulation in Kitimat Arm and other parts of the QCB is controlled primarily by three factors: estuarine circulation, winds and tides.
Kitimat Arm measures approximately 3 km across, from 1 km at Minette Bay to 6 km just south of Emsley Cove, and is approximately 20 km long. Throughout much of Kitimat Arm, water depth increases rapidly with distance from shore for the first 0.25 to 1 km, where it reaches a depth of 100 m. The depth then either levels out (in the northern part of the Arm) or continues to drop off over the next few hundred metres. Water depths north of Coste Point do not exceed 300 m.
1 Salinity is measured using the practical salinity scale unless otherwise noted.

Sec. 52 Application Volume 6B: Environmental and Socio-Economic Assessment (ESA) – Marine Terminal Section 3: Setting for the Marine Environment
Page 3-2 May 2010
3.1.2 Prevailing Climate Conditions Environment Canada, through its National Climate Data and Information Archive, provides Canadian climate normals based on meteorological data collected at weather stations throughout Canada. Climate normals calculated for the Kitimat weather station, located on the west side of Kitimat Arm at an elevation of 16.8 m, are based on data collected between 1971 and 2000 (with one missing year in that period).
Kitimat Arm is the landward limit of this system of coastal inlets and temperatures in this area reflect the influences of both a marine and continental climate. Average daily temperatures range from a low of -2.2°C in January (average daily minimum of -4.6°C and maximum of 0.3°C) to a high of 17°C in July and August (average daily minimum of 12°C and maximum of 21.9°C). Extreme temperatures recorded in the Kitimat area over this period were a low of -26°C on December 8, 1995, and a high of 36.7°C on August 18, 1977.
The presence of the Coast Mountains results in high rainfall in this region, as moist Pacific air encounters the coastal mountain range. The Kitimat Arm area receives precipitation an average of 212 days per year. Average annual rainfall in the region is 2395.5 mm, with peak rainfall in October and November. Annual snowfall is 335.2 mm on average, mostly during December and January. The extreme daily rainfall record for Kitimat is 179.4 mm, set on October 31, 1978.
3.1.3 Estuarine Circulation Freshwater input (from river discharge, and snow and glacial melt) is a critical factor controlling fjord water circulation. The lighter surface layer of freshwater flows seaward. This displaced volume is compensated for by a landward flow of seawater at depth (MacDonald 1983). In Kitimat Arm, peak freshwater runoff from melting snow occurs in May and June. Consequently, water circulation is strongest during this time.
Circulation can also be affected by local and offshore weather. Measurements of estuarine surface currents reached speeds of nearly 80 cm/s in Kitimat Arm. In southern Douglas Channel, the average speed of surface seaward-directed currents is 10 to 15 cm/s, and deeper net return flow average is 1 to 3 cm/s below the halocline (see Marine Physical Environment TDR). Average surface currents are expected to be similar for Kitimat Arm. The surface currents in this area are highly variable. Episodic wind forcing is particularly important in the fall and winter under the combined influence of frequent Pacific storms and Arctic outflow.
3.1.4 Winds Along the coast of British Columbia, the predominant winds are influenced by two major offshore pressure systems. During winter months, the Aleutian Low is associated primarily with southeasterly winds. In the summer, the North Pacific High is associated with weaker northwesterly winds. Maximum sustained winds decrease by over 50% from the western coast of Hecate Strait to the inland waters of Kitimat Arm. These changes influence surface currents and deep water upwelling.

Sec. 52 Application Volume 6B: Environmental and Socio-Economic Assessment (ESA) – Marine Terminal Section 3: Setting for the Marine Environment
May 2010 Page 3-3
Seasonal wind directions also vary between inland waters and coastal areas. In the summer, heating over land causes air to rise. In turn, this causes cooler air over the fjord to move toward the Kitimat River valley. During winter, cold Arctic air from the northeast is funnelled down coastal inlets, creating strong outflow conditions. Hence, in Kitimat Arm, southwesterly to southerly winds are most common in the months of April to October, with occasional strong southeasterlies. Northerly winds are dominant from November to March, though stronger, southwesterly winds do occasionally occur. Average wind speeds in the inland waters of Kitimat Arm exhibit little change seasonally (annual daily average2
3.1.5 Tides
of 18.4 km/hr), while the maximum wind speeds are reduced by 10 to 20% between winter and summer. The maximum recorded wind speed near Kitimat is 63.4 km/hr 2 (January 10, 2001).
Tides in the Kitimat Arm area are classified as mixed with mainly semi-diurnal components (i.e., two low tides and two high tides per day). The mean tidal range along the central coast of British Columbia is 3.9 m. At Kitimat, mean tidal range is 4.3 m with a maximum near 6.5 m during spring tide, and a minimum of 3.0 m at neap tide.
Tidal currents are generally predictable and fairly uniform with depth. When the water column is stratified, however, data from Kitimat Arm and Douglas Channel show that internal tidal currents can arise (see Marine Physical Environment TDR). These currents are unpredictable, and can have a considerable influence on surface currents.
3.1.6 Marine Flora and Fauna The marine flora and fauna3
2 Calculated from Kitimat Eurocan wind data (1996 to 2005). 3 Common names for marine biota are used where possible.
in the Kitimat Arm region are typical of those in the highly seasonal, coastal marine ecosystem of the QCB. The QCB area provides valuable habitat for several commercial species, including five species of salmon (Coho chum, pink, sockeye, Chinook), steelhead, many demersal and pelagic fish, and invertebrates such as crab and mussels. A number of ecologically sensitive species such as species of whales, seals, sea lions, and birds also occur within the QCB. For localized areas such as Kitimat Arm, the distribution and habitat use of non-commercial species is not well defined. Information on various biotas in the QCB and Kitimat Arm is summarized below and is based largely on existing data supplemented by the Project field programs.
In the Kitimat Arm area and adjacent waters, spring plankton blooms contribute to high biomass production. Data on primary and secondary production in Kitimat Arm are limited, but existing literature suggests the area is typical for northern British Columbia. Based on shallow plankton tows of Kitimat Arm, copepod species were found to be the dominant zooplankton.
Species diversity of the rocky intertidal community is generally low, with rockweed and the green algae Enteromorpha sp. being the dominant seaweeds. Barnacles, mussels, periwinkles and limpets can be found on rocky substrate. Sea urchins, moon snails, sea anemones, sea stars, and sea cucumber are in shallow subtidal areas.

Sec. 52 Application Volume 6B: Environmental and Socio-Economic Assessment (ESA) – Marine Terminal Section 3: Setting for the Marine Environment
Page 3-4 May 2010
The soft bottom estuaries are dominated by eelgrass, a marine vascular plant that provides important habitat for many juvenile fish such as pink salmon and invertebrates such as Dungeness crab. Sandy areas are inhabited by commercially harvested bivalves such as butter clams and cockles.
Several fish species of Kitimat Arm are important commercially, recreationally and are used for food, social and ceremonial (FSC) purposes. Kitimat Arm has several important salmon rivers such as the Kitimat River, and there is a major pink salmon run in Bish Creek, just south of the terminal location. Fish species commonly harvested include chum, coho, chinook and pink salmon, steelhead, eulachon, and herring. Coves, estuaries, and other nearshore areas offer habitat for juvenile salmon and serve as staging areas for adult salmon prior to their upstream spawning migrations in late-summer and early fall.
Six marine mammals frequent the area including killer whale, humpback whale, Dall’s porpoise, harbour porpoise, harbour seal and Steller sea lion. All but one, harbour seal, are considered of special conservation concern by SARA, COSEWIC or the British Columbia government. The presence of these mammals in Kitimat Arm is more likely during summer and early fall because of the abundance of fish.
Kitimat Arm is also an important waterfowl and seabird area and over 100 species potentially occur in the PEAA at various times throughout the year. While most bird species occur in the area on a seasonal basis, others are year round residents, such as the Marbled Murrelet, a species listed as threatened by SARA and COSEWIC.
3.2 Human Activities In addition to natural processes, human activities in Kitimat Arm have an influence on water, sediment and habitat quality. Sources of contaminants to Kitimat Arm over the years include effluent from a municipal wastewater treatment plant, the Alcan smelter, Methanex Corporation’s methanol plant and the Eurocan pulpmill, as well as storm water runoff from these operations and the municipality. Permitted effluent discharges are related to:
• the District of Kitimat wastewater treatment plant, which discharges effluent approximately 4 km upstream of Kitimat Arm, releasing suspended solids, biochemical oxygen demand (BOD54
• the Alcan aluminum smelter, which discharges effluent and storm water directly into Kitimat Arm and indirectly via Moore and Anderson creeks; discharges contain suspended solids, coke, aluminum, oil, grease, dissolved fluoride, dissolved iron, cyanide and polycyclic aromatic hydrocarbons (PAHs); deposition of air emissions also occurs (Warrington 1987, 1993 (draft) as cited in Norecol Dames and Moore Inc. 1997)
), phosphorus, ammonia, nitrate and fecal coliforms into Kitimat Arm (Norecol Dames and Moore Inc. 1997)
4 The amount of dissolved oxygen consumed in five days by biological processes breaking down organic matter.

Sec. 52 Application Volume 6B: Environmental and Socio-Economic Assessment (ESA) – Marine Terminal Section 3: Setting for the Marine Environment
May 2010 Page 3-5
• the Methanex Corporation methanol plant, which (when in operation) discharge effluent into Kitimat Arm and storm water into Beaver Creek and Kitimat River; effluent contains suspended solids, sodium and methyl formats, chemical oxygen demand (COD), methanol, ammonia, oil and grease (Warrington 1987, 1993 [draft] as cited in Norecol Dames and Moore Inc. 1997)
• the Eurocan Pulp and Paper Company, which (when in operation) discharge effluent from an unbleached kraft mill into the Kitimat River approximately three km upstream of Kitimat Arm, releasing BOD5, color, suspended solids, turbidity, resin acids, tannin and lignin (Ministry of Environment [MoE] 1987, Internet site)
3.3 References
3.3.1 Literature Cited ASL Environmental Sciences Inc. 2010. Marine Physical Environment Technical Data Report. Prepared
for Northern Gateway Pipelines Inc. Calgary, AB.
Bornhold, B.D. 1983. Sedimentation in the Douglas Channel and Kitimat Arm. In R.W. MacDonald (ed.), Proceedings of a workshop on the Kitimat marine environment. Paper presented at the Proceedings of a workshop on the Kitimat marine environment, Institute of Ocean Sciences, Fisheries and Oceans Canada (DFO), Sidney, BC. 88–114.
Harris, G.E. 1999. Assessment of the assimilative capacity of Kitimat Arm, British Columbia: A case study approach of the sustainable management of environmental contaminants. Simon Fraser University, Burnaby, BC.
LGL Limited Environmental Research Associates. 2004. A review of the state of knowledge of marine and shoreline areas in the Queen Charlotte basin. University of Northern British Columbia's Northern Land Use Institute.
MacDonald, R.W. 1983. The distribution and dynamics of suspended particles in Kitimat fjord system. In R.W. MacDonald (ed.). Proceedings of a workshop on the Kitimat marine environment. Paper presented at the Proceedings of a workshop on the Kitimat marine environment, Institute of Ocean Sciences, Fisheries and Oceans Canada (DFO), Sidney, BC. 116–137.
Norecol Dames and Moore Inc. 1997. Eurocan Pulp and Paper Ltd.: First cycle environmental effects monitoring program (Final report). Vancouver, BC.
Pickard, G.L. 1961. Oceanographic features of inlets in the British Columbia mainland coast. Journal of Fisheries Research Board of Canada 18:907–982.
Warrington, P.D. 1987. Skeena-Nass area, lower Kitimat river and Kitimat Arm water quality assessment and objectives: Technical Appendix. Resource Quality Section, Water Management Branch, Ministry of Environment and Parks. Victoria, BC.
Warrington, P.D. 1993 (draft). Lower Kitimat River and Kitimat Arm Water Quality Assessment and Objectives: First update. Water Quality Branch, Water Management Branch, Ministry of Environment, Lands and Parks, Victoria, BC.

Sec. 52 Application Volume 6B: Environmental and Socio-Economic Assessment (ESA) – Marine Terminal Section 3: Setting for the Marine Environment
Page 3-6 May 2010
3.3.2 Internet Sites Ministry of Environment (MoE). 1987. Water quality assessment and objectives for the Lower Kitimat
River and Kitimat Arm: Overview Report. Available at: http://www.env.gov.bc.ca/wat/wq/objectives/kitimat/kitimat.html. Accessed: September 2008.

Sec. 52 Application Volume 6B: Environmental and Socio-Economic Assessment (ESA) – Marine Terminal Appendix 3A: Project Inclusion List
May 2010 Page 3A-1
Appendix 3A Project Inclusion List


Sec. 52 Application Volume 6B: Environmental and Socio-Economic Assessment (ESA) – Marine Terminal Appendix 3A: Project Inclusion List
May 2010 Page 3A-3
The project inclusion list (PIL) includes information on projects that have notified a regulatory body of their intent, that are under regulatory review, approved for construction or are under construction. It also includes projects that are operational. Available information on projects were collected from a variety of sources (internet sources, databases, reports, government agencies, personal communication) within the REAA, reflecting information that was collected to February, 2009.

Sec. 52 Application Volume 6B: Environmental and Socio-Economic Assessment (ESA) – Marine Terminal Appendix 3A: Project Inclusion List
Page 3A-4 May 2010
Table 3A-1 Project Inclusion List – Projects within the REAA in Alberta and British Columbia
Company/Operator
Project Status
Assessment Case Status
Province
Footprint Area within
REAA (ha)
Facility/Project
Industrial Activity
Alberta – Existing and Approved Projects Access Pipeline Inc. – the Access Pipeline
Existing Baseline Alberta 221.61 Redwater Trim Blending Facility
Oil and gas-related plant and facilities
Agrium Inc. Existing Baseline Alberta 809.88 Fort Saskatchewan Fertilizer Plant
Fertilizer plant
Agrium Inc. Existing Baseline Alberta 270.28 Redwater Nitrogen and Phosphates Operations
Fertilizer plant
AGTL Construction Existing Baseline Alberta 3.25 Facility Oil and gas-related plant and facilities
Air Liquide Canada Existing Baseline Alberta 8.92 Scotford Cogeneration Power Plant
Oil and gas-related plant and facilities
Alberta Newsprint Company (West Fraser Timber Company Ltd.)
Existing Baseline Alberta 40.83 Plant Wood and lumber processing
ATCO Midstream Existing Baseline Alberta 129.54 Fort Saskatchewan Sour Gas Plant and Salt Storage Cavern
Oil and gas-related plant and facilities
Aux Sable Canada L.P. Existing Baseline Alberta 97.24 Heartland Off-Gas Project Oil and gas-related plant and facilities
BA Energy Inc. (Value Creation Inc.)
Approved Baseline Alberta 490.36 Heartland Upgrader Oil and gas-related plant and facilities
BA Energy Inc. (Value Creation Inc.)
Approved Baseline Alberta 32.42 Heartland Upgrader Oil and gas-related plant and facilities
Blue Ridge Lumber (West Fraser Timber Company Ltd.)
Existing Baseline Alberta 30.59 Plant Wood and lumber processing
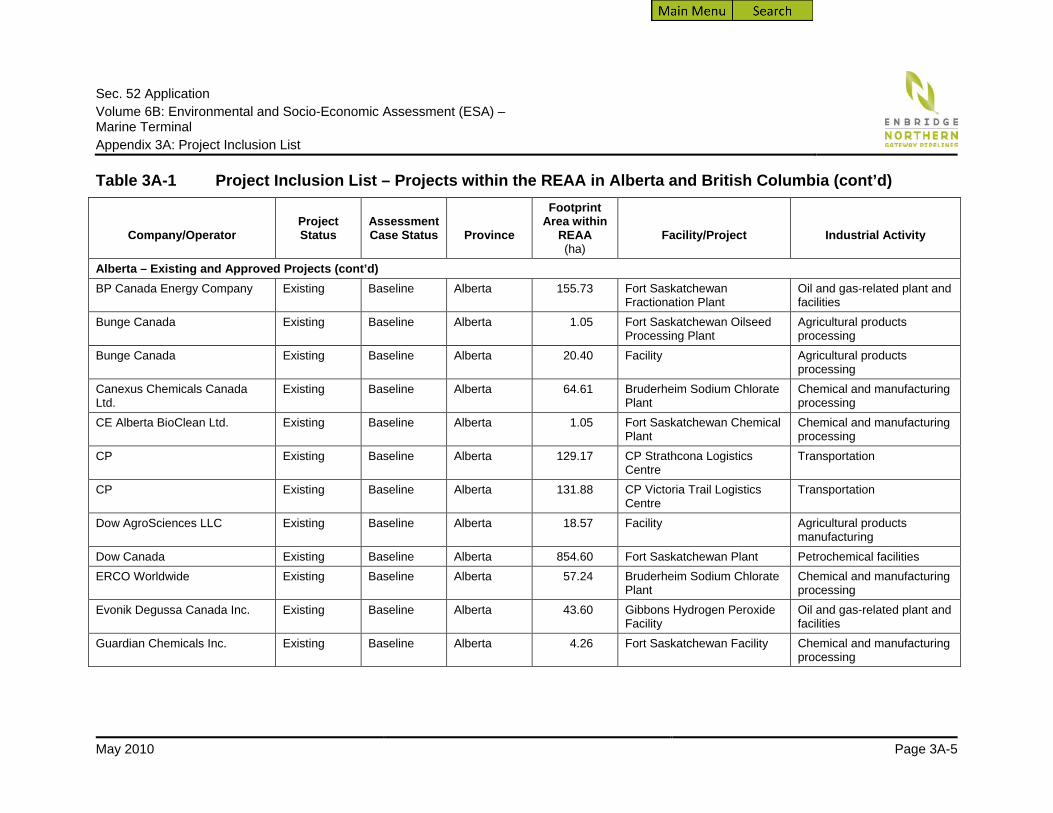
Sec. 52 Application Volume 6B: Environmental and Socio-Economic Assessment (ESA) – Marine Terminal Appendix 3A: Project Inclusion List
May 2010 Page 3A-5
Table 3A-1 Project Inclusion List – Projects within the REAA in Alberta and British Columbia (cont’d)
Company/Operator
Project Status
Assessment Case Status
Province
Footprint Area within
REAA (ha)
Facility/Project
Industrial Activity
Alberta – Existing and Approved Projects (cont’d) BP Canada Energy Company Existing Baseline Alberta 155.73 Fort Saskatchewan
Fractionation Plant Oil and gas-related plant and facilities
Bunge Canada Existing Baseline Alberta 1.05 Fort Saskatchewan Oilseed Processing Plant
Agricultural products processing
Bunge Canada Existing Baseline Alberta 20.40 Facility Agricultural products processing
Canexus Chemicals Canada Ltd.
Existing Baseline Alberta 64.61 Bruderheim Sodium Chlorate Plant
Chemical and manufacturing processing
CE Alberta BioClean Ltd. Existing Baseline Alberta 1.05 Fort Saskatchewan Chemical Plant
Chemical and manufacturing processing
CP Existing Baseline Alberta 129.17 CP Strathcona Logistics Centre
Transportation
CP Existing Baseline Alberta 131.88 CP Victoria Trail Logistics Centre
Transportation
Dow AgroSciences LLC Existing Baseline Alberta 18.57 Facility Agricultural products manufacturing
Dow Canada Existing Baseline Alberta 854.60 Fort Saskatchewan Plant Petrochemical facilities ERCO Worldwide Existing Baseline Alberta 57.24 Bruderheim Sodium Chlorate
Plant Chemical and manufacturing processing
Evonik Degussa Canada Inc. Existing Baseline Alberta 43.60 Gibbons Hydrogen Peroxide Facility
Oil and gas-related plant and facilities
Guardian Chemicals Inc. Existing Baseline Alberta 4.26 Fort Saskatchewan Facility Chemical and manufacturing processing

Sec. 52 Application Volume 6B: Environmental and Socio-Economic Assessment (ESA) – Marine Terminal Appendix 3A: Project Inclusion List
Page 3A-6 May 2010
Table 3A-1 Project Inclusion List – Projects within the REAA in Alberta and British Columbia (cont’d)
Company/Operator
Project Status
Assessment Case Status
Province
Footprint Area within
REAA (ha)
Facility/Project
Industrial Activity
Alberta – Existing and Approved Projects (cont’d) Gulf Chemical and Metallurgical Corporation
Existing Baseline Alberta 97.74 Fort Saskatchewan Plant (Catalyst Recycling Facility)
Oil and gas-related plant and facilities
Hexion Specialty Chemicals Canada
Existing Baseline Alberta 4.15 Sand/Resin Manufacturing Facility
Chemical and manufacturing processing
Keyera (formerly EnerPro Midstream Inc.)
Existing Baseline Alberta 64.86 Fort Saskatchewan Fractionation and Storage Facilities
Oil and gas-related plant and facilities
Marsulex Inc. Existing Baseline Alberta 56.24 Sulphides Plant Chemical and manufacturing processing
Millar Western Forest Products Ltd.
Existing Baseline Alberta 40.84 Plant Wood and lumber processing
Millar Western Forest Products Ltd.(formerly Mostowich Lumber)
Existing Baseline Alberta 15.37 Plant Wood and lumber processing
Mitch Minerals Ltd. Existing Baseline Alberta 0.59 Facility Chemical and manufacturing processing
North West Upgrading Inc. Approved Baseline Alberta 559.89 Heavy Oil Upgrader Oil and gas-related plant and facilities
Praxair Inc. Existing Baseline Alberta 9.68 Industrial Gas facility Chemical and manufacturing processing
Prospec Chemicals Existing Baseline Alberta 2.14 Facility Chemical and manufacturing processing
Provident Energy Trust Existing Baseline Alberta 330.68 Redwater Natural Gas Liquids Processing System
Oil and gas-related plant and facilities

Sec. 52 Application Volume 6B: Environmental and Socio-Economic Assessment (ESA) – Marine Terminal Appendix 3A: Project Inclusion List
May 2010 Page 3A-7
Table 3A-1 Project Inclusion List – Projects within the REAA in Alberta and British Columbia (cont’d)
Company/Operator
Project Status
Assessment Case Status
Province
Footprint Area within
REAA (ha)
Facility/Project
Industrial Activity
Alberta – Existing and Approved Projects (cont’d) R.L. Rurka Sales and Service Inc.
Existing Baseline Alberta 0.46 Facility Transportation
Ranger Board Ltd. (West Fraser Timber Company Ltd.)
Existing Baseline Alberta 20.41 Plant Wood and lumber processing
Reimer Bulk Systems Inc. Existing Baseline Alberta 7.54 Facility Transportation Shell Canada Limited Existing Baseline Alberta 342.42 Scotford Complex - Refinery
and Upgrader and Upgrader Expansion
Oil and gas-related plant and facilities
Shell Chemicals Canada Ltd. Existing Baseline Alberta 167.40 Scotford Styrene Monomer and Monoethylene Glycol (MEG) Plant
Chemical and manufacturing processing
Sherritt International Corporation
Existing Baseline Alberta 63.30 Fort Saskatchewan Fertilizer Plant
Fertilizer
Supreme Instruments and Electrical Services Ltd.
Existing Baseline Alberta 0.48 Facility Oil and gas-related plant and facilities
TBM Transportation Ltd. Existing Baseline Alberta 2.98 Facility Transportation Terry Evans Transport Ltd. Existing Baseline Alberta 1.10 Facility Transportation Triton (Churchill Corporation) Existing Baseline Alberta 64.80 Steel Fabrication Facility Chemical and manufacturing
processing Umicore (formerly UMEX) Existing Baseline Alberta 52.03 Cobalt and Specialty
Materials Production Plant Chemical and manufacturing processing
Ventures West Transport Inc. Existing Baseline Alberta 6.93 Facility Transportation Viterra Inc. (formerly Agricore United)
Existing Baseline Alberta 0.79 Facility Agricultural products manufacturing
Whitecourt Power Ltd Partnership
Existing Baseline Alberta 15.27 Biomass Power Generating Station
Energy
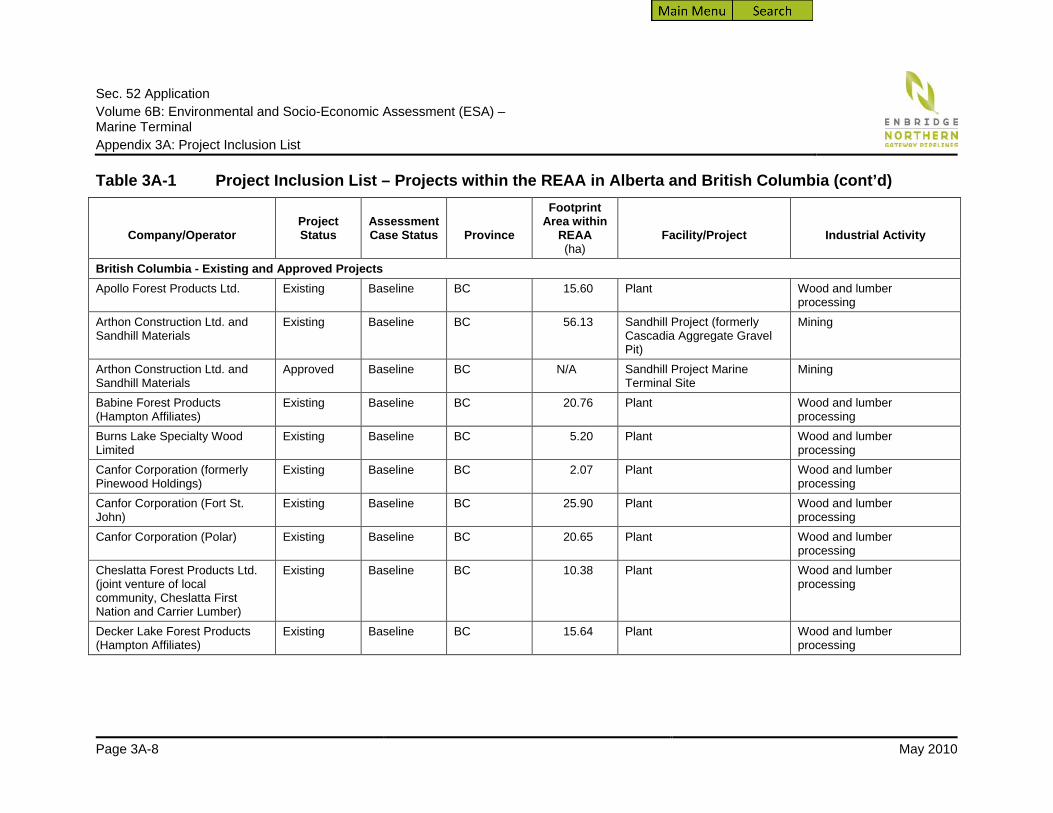
Sec. 52 Application Volume 6B: Environmental and Socio-Economic Assessment (ESA) – Marine Terminal Appendix 3A: Project Inclusion List
Page 3A-8 May 2010
Table 3A-1 Project Inclusion List – Projects within the REAA in Alberta and British Columbia (cont’d)
Company/Operator
Project Status
Assessment Case Status
Province
Footprint Area within
REAA (ha)
Facility/Project
Industrial Activity
British Columbia - Existing and Approved Projects Apollo Forest Products Ltd. Existing Baseline BC 15.60 Plant Wood and lumber
processing Arthon Construction Ltd. and Sandhill Materials
Existing Baseline BC 56.13 Sandhill Project (formerly Cascadia Aggregate Gravel Pit)
Mining
Arthon Construction Ltd. and Sandhill Materials
Approved Baseline BC N/A Sandhill Project Marine Terminal Site
Mining
Babine Forest Products (Hampton Affiliates)
Existing Baseline BC 20.76 Plant Wood and lumber processing
Burns Lake Specialty Wood Limited
Existing Baseline BC 5.20 Plant Wood and lumber processing
Canfor Corporation (formerly Pinewood Holdings)
Existing Baseline BC 2.07 Plant Wood and lumber processing
Canfor Corporation (Fort St. John)
Existing Baseline BC 25.90 Plant Wood and lumber processing
Canfor Corporation (Polar) Existing Baseline BC 20.65 Plant Wood and lumber processing
Cheslatta Forest Products Ltd. (joint venture of local community, Cheslatta First Nation and Carrier Lumber)
Existing Baseline BC 10.38 Plant Wood and lumber processing
Decker Lake Forest Products (Hampton Affiliates)
Existing Baseline BC 15.64 Plant Wood and lumber processing

Sec. 52 Application Volume 6B: Environmental and Socio-Economic Assessment (ESA) – Marine Terminal Appendix 3A: Project Inclusion List
May 2010 Page 3A-9
Table 3A-1 Project Inclusion List – Projects within the REAA in Alberta and British Columbia (cont’d)
Company/Operator
Project Status
Assessment Case Status
Province
Footprint Area within
REAA (ha)
Facility/Project
Industrial Activity
British Columbia - Existing and Approved Projects (cont’d) Eurocan Pulp and Paper Co. (West Fraser Timber Company Ltd.)
Existing Baseline BC 105.99 Plant and Terminal Wood and lumber processing
Eurocan Pulp and Paper Co. (West Fraser Timber Company Ltd.)
Existing Baseline BC 16.05 Plant and Terminal Wood and lumber processing
Eurocan Pulp and Paper Co. (West Fraser Timber Company Ltd.)
Existing Baseline BC 30.16 Plant and Terminal Wood and lumber processing
Kitimat LNG Inc. Approved Baseline BC 18.07 Kitimat LNG Terminal Oil and gas-related plant and facilities
Kitimat LNG Inc. Approved Baseline BC 56.02 15-km LNG Pipeline Oil and gas-related plant and facilities
Kitimat LNG Inc. Approved Baseline BC 4.20 Kitimat LNG Terminal Oil and gas-related plant and facilities
Kitimat LNG Inc. Approved Baseline BC 28.70 Kitimat LNG Terminal Oil and gas-related plant and facilities
Methanex Corporation (formerly Ocelot Ammonia)
Existing Baseline BC 26.65 Plant and Terminal Oil and gas-related plant and facilities
Methanex Corporation (formerly Ocelot Ammonia)
Existing Baseline BC 3.78 Plant and Terminal Oil and gas-related plant and facilities
Methanex Corporation (formerly Ocelot Ammonia)
Existing Baseline BC 5.54 Plant and Terminal Oil and gas-related plant and facilities
Pacific Northern Gas Ltd. (PNG) Existing Baseline BC 211.38 PNG Pipeline Oil and gas-related plant and facilities

Sec. 52 Application Volume 6B: Environmental and Socio-Economic Assessment (ESA) – Marine Terminal Appendix 3A: Project Inclusion List
Page 3A-10 May 2010
Table 3A-1 Project Inclusion List – Projects within the REAA in Alberta and British Columbia (cont’d)
Company/Operator
Project Status
Assessment Case Status
Province
Footprint Area within
REAA (ha)
Facility/Project
Industrial Activity
British Columbia - Existing and Approved Projects (cont’d) Pacific Northern Gas Ltd. (PNG) Existing Baseline BC 297.72 PNG Pipeline Oil and gas-related plant and
facilities Pacific Northern Gas Ltd. (PNG) Existing Baseline BC 2.12 PNG Pipeline, R3
Compressor Station Oil and gas-related plant and facilities
Peace River Coal Inc. Existing Baseline BC 2802.91 Trend Coal Mine Mining Rio Tinto Alcan Primary Metal British Columbia
Existing Baseline BC 142.68 Kitimat Aluminum Smelter and Terminal
Chemical and manufacturing processing
West Fraser Timber Company Ltd. (formerly Stuart Lake Lumber Co. Ltd.)
Existing Baseline BC 15.35 Plant Wood and lumber processing
Alberta - Future Projects AltaLink L.P. Future CEA Alberta 5.44 AltaLink Facility Energy Canadian Pacific Future CEA Alberta 357.60 Rail Expansion Transportation Chevron (formerly Texaco Exploration Ltd.)
Future CEA Alberta 129.44 Facility Oil and gas-related plant and facilities
CN Rail Future CEA Alberta 95.25 CN Oil and Gas Logistics Centre
Oil and gas-related plant and facilities
CN Rail Future CEA Alberta 65.33 Facility Transportation Contura Future CEA Alberta 28.35 Facility Oil and gas-related plant and
facilities Enbridge Inc. Future CEA Alberta 649.00 Stonefell Facilities Oil and gas-related plant and
facilities

Sec. 52 Application Volume 6B: Environmental and Socio-Economic Assessment (ESA) – Marine Terminal Appendix 3A: Project Inclusion List
May 2010 Page 3A-11
Table 3A-1 Project Inclusion List – Projects within the REAA in Alberta and British Columbia (cont’d)
Company/Operator
Project Status
Assessment Case Status
Province
Footprint Area within
REAA (ha)
Facility/Project
Industrial Activity
Alberta - Future Projects (cont’d) Enbridge Inc. Future CEA Alberta 164.00 Stonefell Facilities Oil and gas-related plant and
facilities Gemini Corporation (Kinetic Projects)
Future CEA Alberta 37.27 Fabrication Facility Oil and gas-related plant and facilities
HAZCO Environmental Services Future CEA Alberta 240.76 Bruderheim Sulphur Forming Facility
Chemical and manufacturing processing
Imperial Pipeline Future CEA Alberta 16.42 Facility Oil and gas-related plant and facilities
Keyera Future CEA Alberta 113.15 Fort Saskatchewan Fractionation Facility
Oil and gas-related plant and facilities
Kinder Morgan Canada Inc. Future CEA Alberta 195.72 Heartland Regional Sulphur Forming and Handling Terminal
Oil and gas-related plant and facilities
King Tech Maple Resources Future CEA Alberta 65.09 Catalyst Recycling Facility Oil and gas-related plant and facilities
Petro-Canada Oil Sands Inc. (Fort Hills Energy L. P.)
Future CEA Alberta 2401.16 Sturgeon Upgrader Oil and gas-related plant and facilities
Petro-Gas Marketing Ltd. Future CEA Alberta 34.47 Terminalling Operations Oil and gas-related plant and facilities
Shell Canada Limited Future CEA Alberta 173.17 Scotford Upgrader 2 Oil and gas-related plant and facilities
Shell Canada Limited Future CEA Alberta 3.07 Scotford Upgrader 2 Oil and gas-related plant and facilities

Sec. 52 Application Volume 6B: Environmental and Socio-Economic Assessment (ESA) – Marine Terminal Appendix 3A: Project Inclusion List
Page 3A-12 May 2010
Table 3A-1 Project Inclusion List – Projects within the REAA in Alberta and British Columbia (cont’d)
Company/Operator
Project Status
Assessment Case Status
Province
Footprint Area within
REAA (ha)
Facility/Project
Industrial Activity
Alberta - Future Projects (cont’d) Shell Canada Limited Future CEA Alberta 0.04 Scotford Upgrader 2 Oil and gas-related plant and
facilities Shell Canada Limited Future CEA Alberta 456.41 Scotford Upgrader 2 Oil and gas-related plant and
facilities Shell Canada Limited Future CEA Alberta 521.48 Scotford Upgrader 2 Oil and gas-related plant and
facilities Shell Canada Limited Future CEA Alberta 437.72 Scotford Upgrader 2 Oil and gas-related plant and
facilities StatoilHydro Canada Ltd. (now Statoil ASA)
Future CEA Alberta 61.61 Facility Oil and gas-related plant and facilities
StatoilHydro Canada Ltd. (now Statoil ASA)
Future CEA Alberta 570.01 StatoilHydro Canada Upgrader
Oil and gas-related plant and facilities
Suncor Energy Inc. (Petro-Canada)
Future CEA Alberta 1316.50 Bitumen Processing Facility Oil and gas-related plant and facilities
Suncor Energy Inc. (Petro-Canada)
Future CEA Alberta 32.40 Bitumen Processing Facility Oil and gas-related plant and facilities
Sunwest Canada Energy Limited
Future CEA Alberta 62.76 Facility Energy
Total E and P Canada Ltd. Future CEA Alberta 529.71 Total Upgrader Oil and gas-related plant and facilities
Total E&P Canada Ltd. (formerly Synenco Energy Inc.)
Future CEA Alberta 648.64 Northern Lights Upgrader Project
Oil and gas-related plant and facilities
Total E&P Canada Ltd. (formerly Synenco Energy Inc.)
Future CEA Alberta 1.21 Northern Lights Upgrader Project
Oil and gas-related plant and facilities

Sec. 52 Application Volume 6B: Environmental and Socio-Economic Assessment (ESA) – Marine Terminal Appendix 3A: Project Inclusion List
May 2010 Page 3A-13
Table 3A-1 Project Inclusion List – Projects within the REAA in Alberta and British Columbia (cont’d)
Company/Operator
Project Status
Assessment Case Status
Province
Footprint Area within
REAA (ha)
Facility/Project
Industrial Activity
Alberta - Future Projects (cont’d) Total E&P Canada Ltd. (formerly Synenco Energy Inc.)
Future CEA Alberta 6.85 Northern Lights Upgrader Project
Oil and gas-related plant and facilities
Total E&P Canada Ltd. (formerly Synenco Energy Inc.)
Future CEA Alberta 3.26 Northern Lights Upgrader Project
Oil and gas-related plant and facilities
TransCanada Pipelines Ltd. Future CEA Alberta 130.21 Redwater Cogeneration Plant Oil and gas-related plant and facilities
British Columbia – Future Projects Aeolis Wind Power Corporation Future CEA BC 2706.12 Redwillow Ridge site Wind energy Aeolis Wind Power Corporation Future CEA BC 3903.47 Thunder Mountain site Wind energy Finavera Renewables Inc. Future CEA BC 4277.79 Mount Clifford Wind Energy
Project Wind energy
Naikun Wind Development Inc. Future CEA BC N/A Naikun Offshore Wind Energy Project
Wind energy
North Coast Wind Energy Corp. Future CEA BC N/A Banks Island Wind Energy Project
Wind energy
Pacific Trail Pipelines - Kitimat LNG Inc. (KNLG) and Pacific Northern Gas Ltd. (PNG)
Future CEA BC 16.17 Kitimat-Summit Lake Natural Gas Pipeline Looping (KSL) Project
Oil and gas-related plant and facilities
Pacific Trail Pipelines - Kitimat LNG Inc. (KNLG) and Pacific Northern Gas Ltd. (PNG)
Future CEA BC 387.14 Kitimat-Summit Lake Natural Gas Pipeline Looping (KSL) Project
Oil and gas-related plant and facilities
Pacific Trail Pipelines - Kitimat LNG Inc. (KNLG) and Pacific Northern Gas Ltd. (PNG)
Future CEA BC 14.63 Kitimat-Summit Lake Natural Gas Pipeline Looping (KSL) Project
Oil and gas-related plant and facilities

Sec. 52 Application Volume 6B: Environmental and Socio-Economic Assessment (ESA) – Marine Terminal Appendix 3A: Project Inclusion List
Page 3A-14 May 2010
Table 3A-1 Project Inclusion List – Projects within the REAA in Alberta and British Columbia (cont’d)
Company/Operator
Project Status
Assessment Case Status
Province
Footprint Area within
REAA (ha)
Facility/Project
Industrial Activity
British Columbia – Future Projects (cont’d) Pacific Trail Pipelines - Kitimat LNG Inc. (KNLG) and Pacific Northern Gas Ltd. (PNG)
Future CEA BC 445.15 Kitimat-Summit Lake Natural Gas Pipeline Looping (KSL) Project
Oil and gas-related plant and facilities
Pacific Trail Pipelines - Kitimat LNG Inc. (KNLG) and Pacific Northern Gas Ltd. (PNG)
Future CEA BC 54.08 Kitimat-Summit Lake Natural Gas Pipeline Looping (KSL) Project
Oil and gas-related plant and facilities
Pacific Trail Pipelines - Kitimat LNG Inc. (KNLG) and Pacific Northern Gas Ltd. (PNG)
Future CEA BC 136.71 Kitimat-Summit Lake Natural Gas Pipeline Looping (KSL) Project
Oil and gas-related plant and facilities
Pacific Trail Pipelines - Kitimat LNG Inc. (KNLG) and Pacific Northern Gas Ltd. (PNG)
Future CEA BC 7.84 KSL Pipeline - Methanex Lateral Pipeline
Oil and gas-related plant and facilities
Peace River Coal Inc. Future CEA BC 977.01 Horizon Mine Coal Project Mining Peace River Coal Inc. Future CEA BC 3.13 Horizon Mine Coal Project Mining Peace River Coal Inc. Future CEA BC 5.11 Horizon Mine Coal Project Mining Peace River Coal Inc. Future CEA BC 4.08 Horizon Mine Coal Project Mining Peace River Coal Inc. Future CEA BC 5.88 Horizon Mine Coal Project Mining Peace River Coal Inc. Future CEA BC 6.07 Horizon Mine Coal Project Mining Peace River Coal Inc. Future CEA BC 4.71 Horizon Mine Coal Project Mining Peace River Coal Inc. Future CEA BC 6.37 Horizon Mine Coal Project Mining Peace River Coal Inc. Future CEA BC 1321.34 Roman Coal Mine Mining

Sec. 52 Application Volume 6B: Environmental and Socio-Economic Assessment (ESA) – Marine Terminal Appendix 3A: Project Inclusion List
May 2010 Page 3A-15
Table 3A-1 Project Inclusion List – Projects within the REAA in Alberta and British Columbia (cont’d)
Company/Operator
Project Status
Assessment Case Status
Province
Footprint Area within
REAA (ha)
Facility/Project
Industrial Activity
Alberta and British Columbia – Future Projects SemCAMS Future CEA Alberta and
BC 7.56 Redwillow Pipeline Project
emergency shutdown valve stations
Oil and gas-related plant and facilities
SemCAMS Future CEA Alberta and BC
13.57 Redwillow Pipeline Project right-of-way
Oil and gas-related plant and facilities
SemCAMS Future CEA Alberta and BC
2.25 Redwillow Pipeline Project permanent access
Oil and gas-related plant and facilities
SemCAMS Future CEA Alberta and BC
294.63 Redwillow Pipeline Project right-of-way
Oil and gas-related plant and facilities
SemCAMS Future CEA Alberta and BC
1.78 Redwillow Pipeline Project temporary access
Oil and gas-related plant and facilities
SemCAMS Future CEA Alberta and BC
59.87 Redwillow Pipeline Project temporary workspace
Oil and gas-related plant and facilities
NOTES: CEA – cumulative effects assessment REAA – regional effects assessment area N/A – Not available


Sec. 52 Application Volume 6B: Environmental and Socio-Economic Assessment (ESA) – Marine Terminal Section 4: Scope of Assessment and Environmental Assessment Methods
May 2010 Page 4-1
4 Scope of Assessment and Environmental Assessment Methods
This section describes the scope of the assessment and the methods used in the assessment of the environmental and socio-economic effects of routine construction, operations and decommissioning activities at the marine terminal.
4.1 Scope of the Assessment for the Project The purpose of setting the scope of the assessment is to improve the quality of the ESA by focusing the assessment on the Project and the relevant topics.
The scope of this assessment reflects the matters that are pertinent to the Project, as identified by Northern Gateway through analysis and consultation. This scope is consistent with the Terms of Reference, the Joint Review Panel (JRP) Agreement and the scope of factors guidance document (NEB 2009, Internet site; CEA Agency 2009a, Internet site; CEA Agency 2009b, Internet site).
4.1.1 Scope of the Project The scope of the Project includes all the physical works and activities proposed by the proponent and may include other related physical works and activities. Project details, specific to the ESA are described in Section 2. The scope also includes marine transportation (see Volume 8B for assessment of effects).
4.1.2 Factors to be Considered The ESA for the Project considers factors that are mandatory for all assessments pursuant to the CEA Act and other factors that are specific to the Project and deemed to be relevant to the assessment.
4.1.3 Other Factors to be Considered Other relevant factors are included in the scope of the assessment and are described below. The need for the Project and alternatives to the Project are considered in Volume 1.
4.1.3.1 Socio-economic Factors
The ESA assesses the mandatory factors under the CEA Act (see Section 4.2.2) including direct effects of the Project on the natural or biophysical environment and indirect effects (i.e., those that may arise from the direct effects) on:
• health • socio-economic conditions • physical and cultural heritage • traditional land and resource use • historical, archaeological, paleontological and architecturally important resources
This list reflects the focus of the CEA Act on the natural and biophysical environment.

Sec. 52 Application Volume 6B: Environmental and Socio-Economic Assessment (ESA) – Marine Terminal Section 4: Scope of Assessment and Environmental Assessment Methods
Page 4-2 May 2010
The NEB, however, has a broad mandate to determine the public convenience and necessity of the Project, and therefore must also consider socio-economic matters that it deems to be relevant to the Project subject to assessment. Therefore, the ESA considers direct socio-economic effects of the Project, anticipating that these will be included as a factor to be considered in the assessment.
4.1.3.2 Marine Transportation
This portion of the ESA does not include marine transportation but it is included in the Project Scope as set out in the Joint Review Panel Agreement. Therefore, potential environmental effects of marine transportation are considered in Volume 8B.
4.1.3.3 Factors not Considered
The assessment does not include a consideration of the environmental effects of physical works or activities that are not included in the scope of the Project, unless such environmental effects are likely to interact cumulatively with residual environmental effects of the Project or if they are specified by the federal Minister of the Environment as an additional factor to be considered.
4.1.4 Scope of the Factors to be Considered Once it is determined what factors are to be considered in the assessment, additional specification is usually required regarding the scope of certain factors. Specifying the scope further clarifies what is to be included and, in some cases, excluded from the assessment.
Determining the scope of the factors is most often focused first on specifying which elements of the biophysical and human environments are to be considered and second on setting the temporal and spatial boundaries within which the environmental effects on these elements will be assessed. The elements of the biophysical and human environments considered in the assessment have been determined through a process referred to as scoping (see Section 4.2.2).
4.2 Environmental Assessment Methods
4.2.1 Overview of Approach The methods used in the ESA are based on current accepted best practice for environmental assessment, developed over years of practice by many assessment professionals. The methods have evolved over time to provide the best possible prediction and assessment of potential environmental effects arising from development, within a framework of real-life technical limits. The methods used are designed to meet the applicable regulatory requirements while focusing the assessment on the matters of greatest environmental, social, cultural, economic, and scientific importance. The methodological approach also recognizes the iterative nature of project-level environmental assessment, considering the integration of engineering design and mitigation and monitoring programs in a comprehensive environmental management planning for the life of the Project.

Sec. 52 Application Volume 6B: Environmental and Socio-Economic Assessment (ESA) – Marine Terminal Section 4: Scope of Assessment and Environmental Assessment Methods
May 2010 Page 4-3
The environmental effects assessment method is based on a structured approach that:
• considers the mandatory and discretionary factors that are required under section 16 of the CEA Act
• focuses on issues of greatest concern
• affords consideration of all federal and provincial regulatory requirements for the assessment of environmental effects
• considers issues raised by the regulators, participating Aboriginal groups, and public stakeholders
• integrates project design and programs for mitigation and monitoring into a comprehensive environmental planning
Environment refers broadly to the combined biophysical and human environment and encompasses the definition of environment in the CEA Act, which means the components of the Earth and includes:
a. land, water and air, including all layers of the atmosphere b. all organic and inorganic matter and living organisms c. the interacting natural systems that include components referred to in paragraphs (a) and (b)
The environmental assessment focuses on specific environmental components (called valued environmental components, or VECs) that are of particular value or interest to regulators, participating Aboriginal groups and stakeholders. Environmental components typically are selected for assessment based on regulatory issues and guidelines, consultation with regulators, participating Aboriginal groups and stakeholders, field reconnaissance, and professional judgment of the study team. Where a VEC has various sub-components that may interact in different manners with the Project, the environmental assessment may consider the effects on individual key indicators (KIs), as well as VECs.
Through consultations, Fisheries and Oceans Canada (DFO) has requested that the ESA also apply a risk management approach to project activities that may result in marine habitat-related effects. DFO has asked that this approach follow guidance in the Practitioners Guide to the Risk Management Framework for DFO Habitat Management Staff, Version 1.0 (DFO 2006); see Appendix 4A.
The term “impact” refers to the aspect of the project infrastructure, action or activity that is likely to result in an environmental effect on the environment (i.e., the action or activity that results in an environmental effect). An environmental effect is as defined in CEA Act and broadly refers to a change in the environment in response to an impact; specifically, “environmental effect” means, in respect of a project:
a. any change that the project may cause in the environment, including any change it may cause to a listed wildlife species, its critical habitat or the residences of individuals of that species, as those terms are defined in subsection 2(1) of the Species at Risk Act,
b. any effect of any change referred to in paragraph (a) on
i. health and socio-economic conditions,
ii. physical and cultural heritage,

Sec. 52 Application Volume 6B: Environmental and Socio-Economic Assessment (ESA) – Marine Terminal Section 4: Scope of Assessment and Environmental Assessment Methods
Page 4-4 May 2010
iii. the current use of lands and resources for traditional purposes by Aboriginal persons, or
iv. any structure, site or thing that is of historical, archaeological, paleontological or architectural significance, or
c. any change to the project that may be caused by the environment, whether any such change or effect occurs within or outside Canada
The environmental assessment methods address project-related and cumulative environmental effects. Project-related environmental effects are changes to the biophysical or human environment that are caused by an activity arising solely because of the principal works and activities, as defined by the scope of the project. This includes consideration of the environmental effects of malfunctions or accidents that may occur in connection with a project. Cumulative environmental effects are changes to the biophysical or human environment that are caused by an action of a project, in combination with other past, present and future projects and activities.
Project-related environmental effects and cumulative environmental effects are assessed sequentially. The mechanisms through which a project-specific environmental effect may occur are discussed first, taking into account project design measures and mitigation that help to reduce or avoid environmental effects. The residual environmental effect is then characterized in consideration of planned mitigation. At a minimum, all project environmental effects are characterized using specific criteria (e.g., magnitude, geographic extent, duration) that are defined for each VEC.
A cumulative environmental effects screening is then conducted for that residual environmental effect to determine if there is potential for a cumulative environmental effect, as defined in the CEA Act. Three questions are used to screen cumulative environmental effects (see Section 4.2.3.2). If, based on these three questions, there is potential for cumulative environmental effects, it will be assessed to determine if it has the potential to shift a component of the natural or human environment to an unacceptable state.
The environmental effects assessment approach used in this assessment involves:
• scoping: Scoping of the overall assessment, includes selection of VECs (and, if required, KIs); description of measurable parameters; description of temporal, spatial, administrative and technical boundaries; definition of the parameters that will be used to characterize the project-related environmental effects and cumulative environmental effects; and identification of the standards or thresholds that will be used to determine the significance of environmental effects.
• assessment of project-related environmental effects: Project-related environmental effects are assessed, including descriptions of how an environmental effect will occur, mitigation and environmental protection measures to reduce or eliminate the environmental effect, and evaluation and characterization of the residual environmental effects (i.e., environmental effects remaining after application of mitigation measures) of the Project on the biophysical and human environment for each development phase.
• identification of cumulative environmental effects: Cumulative environmental effects of other projects and activities that overlap with those of the Project are identified. An assessment of potential interactions is completed to determine if an assessment of cumulative effects is required for that specific environmental effect.

Sec. 52 Application Volume 6B: Environmental and Socio-Economic Assessment (ESA) – Marine Terminal Section 4: Scope of Assessment and Environmental Assessment Methods
May 2010 Page 4-5
• evaluation of cumulative environmental effects: The residual cumulative environmental effects of the Project are evaluated in combination with other past and future projects and activities.
• determination of significance: The significance of project-related and cumulative residual environmental effects is determined.
• follow-up and monitoring: Follow-up and monitoring is required to verify environmental effects predictions and assess the effectiveness of mitigation.
4.2.2 Scoping
4.2.2.1 Issues Identification
This phase of the ESA focuses the assessment on the matters of greatest importance (and to assist in determining the factors to be considered and the scope of the factors to be considered in the assessment), and identify issues related to a project. Issues are statements of concern about the possible environmental or socio-economic effects of a project. Issues may be raised by regulators, participating Aboriginal groups, the public, the scientific community, and other stakeholders. Issues related to this Project have been identified from a variety of sources, including:
• the regulatory requirements applicable to the Project
• discussions with technical experts from various provincial and federal government agencies
• input from participating Aboriginal groups, environmental non-governmental organizations (ENGOs), and the public during consultations in relation to the Project
• existing regional information and documentation regarding environmental components found near the Project (e.g., species at risk)
• documentation relating to other projects and activities near the Project
• baseline and assessment studies in the area of the Project
• professional judgment of the assessment authors, based on experience with similar projects elsewhere and other projects and activities near the Project
Key project-related issues are summarized for each discipline in the discipline-specific assessment in the ESA.
Community Advisory Boards (CABs) have been established in order to provide an opportunity for project representatives and representatives from different interests to discuss concerns about the Project, review studies, make recommendations and identify possible legacy measures. The scope for discussions is wide-ranging and include items such as pipeline design, construction and operation, emergency response plans, land use, environmental concerns, employment, training and community benefits to name a few. The process allows for compiling information for the Joint Review Panel (JRP) for consideration at the regulatory hearing. Volume 4 contains further detailed information about the CABs.

Sec. 52 Application Volume 6B: Environmental and Socio-Economic Assessment (ESA) – Marine Terminal Section 4: Scope of Assessment and Environmental Assessment Methods
Page 4-6 May 2010
Existing Documentation and Project-Specific Baseline Studies
Existing documentation relevant to each discipline has been reviewed, including assessments of other projects near the Project and similar projects elsewhere, geographic and technical databases, and scientific literature to identify relevant issues. References are cited at the end of each discipline-specific section. Relevant issues identified during the course of these studies are considered in the assessment. In addition, for the effects assessments discussed in this volume, a number of site-specific studies were completed around the marine terminal in order to characterize the marine environment. These studies are compiled in Technical Data Reports (TDRs) for each discipline. TDRs used in the writing of this volume include:
• Marine Physical Environment TDR (ASL 2010) • Marine Fish and Fish Habitat TDR (Beckett and Munro 2010) • Marine Mammals TDR (Wheeler et al. 2010) • Marine Fisheries TDR (Triton Consultants Ltd. 2010) • Marine Birds TDR (d'Entremont 2010) • Marine Acoustics (2006) TDR (JASCO Research Ltd. 2006) • Marine Ecological Risk Assessment for Kitimat Terminal Operations TDR (Stephenson et al. 2010)
Summaries are provided in Volume 1, Appendix M. Copies of the TDRs will be provided at the time of filing either on a request basis or through the Northern Gateway website.
NEB Filing Manual
The information requirements of the NEB with respect to the ESA of applied-for facilities are documented in Guide A.2 of the NEB’s Filing Manual (NEB 2008). This guide lists biophysical and socio-economic elements to be included in the assessment, reflecting the typical topics of relevance to pipelines and related works and activities. The ESA addresses the guidelines listed in the NEB’s Filing Manual.
Given the NEB’s typical focus on pipelines, the information requirements listed in the Filing Manual are largely focused on the terrestrial environment. Recognizing this, Northern Gateway developed an equivalent list of information requirements pertinent to the marine environment within a confined channel assessment area (CCAA). This list of marine topics was included in the Preliminary Information Package submitted in November 2005 (Appendix C in Gateway Pipeline Inc. 2005). Additional guidance was provided in the Scope of Factors guidance document issued with the Joint Review Panel Agreement (CEA Agency 2009b, Internet site).
Input from Consultation
Consultation undertaken to date with regulators, participating Aboriginal groups, communities, ENGOs, landowners, and the public in relation to the Project is described in Volumes 4, 5A and 5B. Issues raised during these consultations have been documented by Northern Gateway in an issues tracking database. For the assessment, the database was reviewed to identify issues relevant to their discipline.

Sec. 52 Application Volume 6B: Environmental and Socio-Economic Assessment (ESA) – Marine Terminal Section 4: Scope of Assessment and Environmental Assessment Methods
May 2010 Page 4-7
Professional Judgment
The assessment authors have drawn upon their specialist expertise and their experience with assessments of other projects near the Project and of similar projects elsewhere to identify issues of relevance to the Project.
Project Interactions with the Environment
Key project activities and physical works that are likely to result in environmental effects are considered for each VEC. A table of project activities and physical works with corresponding environmental effects is provided near the beginning of each section as a summary of the interactions that are assessed. A full list of project activities and physical works is listed in Table 4-1.
Justification for the project activities and physical works considered for each VEC is provided in the discipline-specific section of the environmental assessment for that VEC.
Table 4-1 Complete List of Project Activities and Physical Works Considered in the ESA (Volume 6A, 6B, 6C and 8B)
All Stages Pipelines Construction Increased access and increased human presence (project workers and non-project
workers) Surface and subsurface disturbance RoW and site preparation (clearing, slash burning/chipping, grading, blasting) Temporary and permanent road development (clearing, slash burning/chipping, grading, drainage control, blasting, structures for vehicle crossings) Powerline development (clearing, slash burning/chipping, grading, temporary structures for vehicle crossings) Infrastructure construction (tanks, pump stations, support buildings, etc.) Construction equipment and traffic Pipeline construction (pipe stringing, setting up pipe, opening ditch, blasting, backfilling, clean-up, instream ditching, welding and lowering-in, temporary dewatering) Watercourse crossings (trenched and trenchless crossings) Hydrostatic testing RoW and site reclamation Camp operations (groundwater withdrawal) Borrow extraction Tunnelling and waste rock disposal, ground water management (temporary dewatering)

Sec. 52 Application Volume 6B: Environmental and Socio-Economic Assessment (ESA) – Marine Terminal Section 4: Scope of Assessment and Environmental Assessment Methods
Page 4-8 May 2010
Table 4-1 Complete List of Project Activities and Physical Works Considered in the ESA (Volume 6A, 6B, 6C and 8B) (cont’d)
All Stages Pipelines Operations (assess at five years into operations)
RoW and infrastructure PDA (cleared surfaces, less permeable surfaces, storm water management systems)
Developed area of roads (cleared surfaces, less permeable surfaces, drainage controls, instream structures for vehicles crossings)
Operational equipment and traffic Operations (pump stations) RoW maintenance (vegetation management, pipe maintenance, surveillance) Permanent road maintenance Borrow extraction Site maintenance
Decommissioning (assess at five years after decommissioning)
Site restoration (infrastructure removal, site rehabilitation, and reclamation) Road removal (recontouring and reclamation, removal of vehicle crossing structures) Decommissioning equipment and traffic (NOT at the five year point) Revegetated (or reclaimed) RoW and infrastructure PDA and developed area of roads
All Stages Kitimat Terminal Construction Onshore infrastructure site preparation (clearing, burning, grading, blasting)
Inwater infrastructure site preparation (dredging, blasting, pile drilling,) Onshore infrastructure construction (tank terminal, inter-connector pipes, support buildings, pumps, etc.) Inwater infrastructure construction (marine terminal, berths, pile installation) Construction support vessels (barges, tugs) Camp operations (waste water disposal) Construction equipment and traffic
Operations Onshore infrastructure PDA (tank terminal, and associated cleared surfaces, less permeable surfaces, storm water management systems) Inwater infrastructure PDA (marine terminal, berths and associated shading, underwater structures) Onshore infrastructure operations (tank terminal, and associated site water run-off, lights, noise, waste water disposal, emissions) Inwater infrastructure operations (marine terminal, berth and associated lights, noise) Inwater infrastructure maintenance (piling inspection) Berthed tankers on standby (and associated combustion emissions, inert gas exchange, prop wash, noise, boom deployment)
Bilge and ballast water management Gas venting at the tanker berths Site maintenance Operations (pump station)

Sec. 52 Application Volume 6B: Environmental and Socio-Economic Assessment (ESA) – Marine Terminal Section 4: Scope of Assessment and Environmental Assessment Methods
May 2010 Page 4-9
Table 4-1 Complete List of Project Activities and Physical Works Considered in the ESA (Volume 6A, 6B, 6C and 8B) (cont’d)
All Stages Kitimat Terminal Decommissioning Onshore site restoration (infrastructure removal, site rehabilitation, and reclamation)
Inwater infrastructure site restoration (infrastructure removal) Decommissioning support vessels (for piling, berth removal)
Vessel Traffic Construction Marine vessel traffic (wake, noise, collisions with sea life) Operations Tanker traffic (wake, noise, collisions with sea life)
Tug traffic (wake, noise, collisions, prop wash) Decommissioning Not Applicable
NOTE: Marine transportation is described in Volume 8B.
4.2.2.2 Selection of Valued Environmental Components and Key Indicators
VECs are defined as broad components of the biophysical and human environments, which, if altered by the Project, would be of concern to regulators, participating Aboriginal groups, resource managers, scientists and the public.
VECs for the biophysical environment typically represent major components or aspects of the physical and biological environment (e.g., marine ecosystems) that might be altered by the Project, and are widely recognized as important for ecological reasons.
Criteria for selecting VECs include the following questions:
• Do they represent a broad environmental, ecological or human environment component that may be affected by the Project?
• Are they vulnerable to the environmental effects of the Project and other activities in the region?
• Have they been identified as important issues or concerns by participating Aboriginal groups or stakeholders, or in other effects assessments in the region?
• Were they identified by responsible authorities or other federal agencies?
KIs are species, species groups, resources, or ecosystem functions that represent components of the broader VECs and are selected using the same criteria as described above for VECs. For example, Northern Resident killer whale represents all toothed whales that may occur in the assessment area. For practical reasons, it is often useful to select KIs where sufficient information is available or obtainable through field studies to assess adequately the potential project-related residual environmental effects and cumulative effects.
For each VEC or KI, one or more measurable parameters are selected for quantitative or qualitative measurement of potential project environmental effects and cumulative environmental effects. Measurable parameters provide means of determining the level or amount of change to a VEC or KI because of an environmental effect. For example, a measure of total suspended solids might be chosen as

Sec. 52 Application Volume 6B: Environmental and Socio-Economic Assessment (ESA) – Marine Terminal Section 4: Scope of Assessment and Environmental Assessment Methods
Page 4-10 May 2010
the measurable parameter for change in habitat quality (the environmental effect) for sediment and water quality (a VEC) or eelgrass (a KI). Other measurable parameters include specific water quality measurements, changes in the seasonal distribution of a species, and the presence of resident birds or marine mammals.
The degree of change in these measurable parameters is used to characterize project-related and cumulative environmental effects, and evaluate the significance of the potential environmental effects. Thresholds or standards are identified for each measurable parameter to assist, where possible, in determining the significance of a predicted environmental effect.
4.2.2.3 Assessment Boundaries
Temporal Boundaries
Temporal boundaries for the assessment of the effects of the marine terminal are based on the timing and duration of project environmental effects in relation to each VEC or KI and are detailed in the assessment section for each VEC. These boundaries encompass those periods and areas during which the VECs and KIs are likely to be affected by project activities. Temporal boundaries for most projects typically include:
• baseline represents the biophysical characteristics of the marine environment, as of 2009 including all existing disturbances and past and present (certain to be built by 2015) projects
• construction phase is the period from initial physical surface disturbance up to commissioning
• operations phase is the period from commissioning until the end of the operating life of the terminal. For operations, environmental effects are assessed with the assumption that enough time had elapsed for shoreline areas disturbed during construction to re-vegetate. The temporal boundary for operations includes those periods and areas during which the VECs and KIs are likely to be affected by project activities.
• decommissioning refers to the duration of the removal of project infrastructure to the surface substrate material
Spatial Boundaries
Spatial boundaries are established for the assessment of potential project-related and cumulative environmental effects for each VEC or KI. The primary consideration used in the establishment of spatial boundaries for assessment areas is the probable geographical extent of the environmental effects on the VEC or KI. In some instances, the boundaries are assessed to reflect the range of movement of a migratory species, or to reflect administrative boundaries (e.g., management areas).
Spatial boundaries vary according to the nature and distribution of the VEC or KI and the type of environmental effect. Therefore, they are defined in each of the discipline-specific sections in the ESA. In general, there are three spatial boundaries as follows:
• Project development area (PDA) – the terrestrial PDA includes the disturbed area of the pipelines and area within the security fence and the marine PDA includes the disturbed area of the marine terminal.

Sec. 52 Application Volume 6B: Environmental and Socio-Economic Assessment (ESA) – Marine Terminal Section 4: Scope of Assessment and Environmental Assessment Methods
May 2010 Page 4-11
• Project effects assessment area (PEAA) is the maximum area where project-specific environmental effects can be predicted or measured with a reasonable degree of accuracy and confidence. Project environmental effects include direct effects such as habitat alteration. For the marine terminal, the PEAA encompasses the PDA plus the area potentially affected by routine operations of the marine terminal. This typically includes all of Kitimat Arm, which is the area where the environmental effects of the marine terminal are most likely for the marine VECs and KIs. For example, the area of sensory disturbance to marine mammals is defined as the area within which they would sense and respond to underwater noise from marine terminal activities, such as dredging during construction. The PEAA, therefore, is VEC-specific and is detailed in the assessment section for each VEC.
• Regional effects assessment area (REAA) is the area within which cumulative environmental effects are likely to occur, depending on social, physical and biological conditions (e.g., seasonal range of wildlife movements), and the type and location of other past, present or reasonably foreseeable projects or activities.
Administrative and Technical Boundaries
As appropriate, administrative and technical boundaries are identified and justified for each VEC and KI.
Administrative boundaries include specific aspects of provincial and federal regulatory requirements, as well as regional planning initiatives that are relevant to the assessment of the project’s environmental effects on the VEC. Administrative boundaries are sometimes selected to establish spatial boundaries.
Technical boundaries include limitations in scientific and social information, data analyses and data interpretation, as well as time limitations.
4.2.2.4 Characterizing Residual Environmental Effects
Where possible, the following characteristics for an environmental effect are described quantitatively to assist in the assessment of the residual environmental effect. Where these residual environmental effects characteristics could not be expressed quantitatively, at minimum, they are described using qualitative terms. Examples are provided in parentheses for each criterion below. If qualitative descriptions are used, definitions for these qualitative terms are provided for each VEC or KI, as appropriate, in the section of the environmental assessment for that VEC or KI.
• Direction: the ultimate long-term trend of the environmental effect (e.g., positive or adverse)
• Magnitude: the amount of change in a measurable parameter or variable relative to the baseline (i.e., negligible, low, moderate, high)
• Geographical Extent: the geographic area within which an environmental effect of a defined magnitude occurs (site-specific, local, regional, provincial, national, international)
• Frequency: the number of times that an environmental effect may occur (i.e., once, sporadic, regular, continuous)

Sec. 52 Application Volume 6B: Environmental and Socio-Economic Assessment (ESA) – Marine Terminal Section 4: Scope of Assessment and Environmental Assessment Methods
Page 4-12 May 2010
• Duration: this is typically defined as the period of time that is required until the VEC or KI returns to its baseline condition or the environmental effect can no longer be measured or otherwise perceived (i.e., short term, medium term, long term, permanent)
• Reversibility: the likelihood that a measurable parameter or KI will recover from an environmental effect (i.e., reversible, irreversible)
4.2.2.5 Standards or Thresholds for Determining the Significance of Environmental Effects
Under the CEA Act and most provincial legislation or guidelines, the environmental assessment must include a determination of the significance of environmental effects. Where possible, threshold criteria or standards are identified for each VEC or KI, beyond which a residual environmental effect would be considered significant. In some cases, standards or thresholds are also defined for specific effects for a VEC or KI.
Standards are recognized government or industry objectives for physical aspects such as air quality, water quality, effluent release, or in-stream flows. Thresholds reflect the limits of an acceptable state for an environmental component based on resource management objectives, community standards, scientific literature, or ecological processes (e.g., desired states for fish or wildlife habitats or populations).
Potential changes in a measurable parameter, KI, or VEC resulting from the Project and/or cumulative environmental effects are evaluated against these standards or thresholds.
4.2.3 Assessment of Environmental Effects
4.2.3.1 Assessment of Project Environmental Effects
Description of Project Environmental Effects
The assessment of each project environmental effect begins with a description of the mechanisms whereby specific project activities and physical works could result in the environmental effect. Where possible, the spatial and temporal extent of these changes (i.e., where and when the environmental effect might occur) is also described. Because the environmental assessment focuses only on residual environmental effects, environmental effects before mitigation are not quantified or characterized. The significance of the environmental effect before mitigation is also not described.
Mitigation of Project Environmental Effects
Mitigation is defined as changes in the temporal or spatial aspects of the Project and/or the means in which the Project will be constructed, operated or decommissioned, over and above the project design aspects. Mitigation can also include specialized measures such as habitat compensation, replacement, or financial compensation.

Sec. 52 Application Volume 6B: Environmental and Socio-Economic Assessment (ESA) – Marine Terminal Section 4: Scope of Assessment and Environmental Assessment Methods
May 2010 Page 4-13
Mitigation measures that help reduce or eliminate an environmental effect are described, with emphasis on how these measures will change the environmental effect. Where possible, the effectiveness of mitigation measures is expressed as the expected change in the measurable parameters for the environmental effect.
Characterization of Residual Project Environmental Effects
Residual environmental effects are described, taking into account how the mitigation will change the environmental effect. Where possible, the magnitude, geographic extent, and duration are quantified. The definition of these attributes may vary from VEC to VEC. In some cases, changes in an environmental effect can be described relative to each project phase.
Environmental effects are characterized quantitatively or qualitatively in terms of the direction, magnitude, geographic extent, frequency, duration and reversibility (see Section 4.2.2.4).
4.2.3.2 Assessment of Cumulative Environmental Effects
Screening for Cumulative Environmental Effects
Cumulative environmental effects are only assessed if all three of the following conditions are met for the environmental effect under consideration:
• The Project will result in a measurable, demonstrable or reasonably-expected residual environmental effect on a component of the biophysical or human environment (i.e., Is there an environmental effect that can be measured or that can reasonably be expected to occur?);
• The project-specific residual environmental effect on that component does, or is likely to, act in a cumulative fashion with the environmental effects of other past or future projects and activities that are likely to occur (i.e., Is there overlap of environmental effects – i.e., a cumulative environmental effect?); and
• There is a reasonable expectation that the Project’s contribution to cumulative environmental effects will affect the viability or sustainability of the resource or value.
Project Inclusion List
The project inclusion list includes all past, present and reasonably foreseeable projects (those that are likely to occur), activities and actions with residual environmental effects that could overlap spatially and temporally with the residual environmental project effect being considered. These projects are listed in Appendix 3A.
Where a cumulative environmental effects assessment is completed for a VEC or KI, only those projects, activities and actions that could result in a similar environmental effect to the environmental effect being considered are included in the cumulative environmental effects assessment. The specific projects, activities and actions considered for each environmental effect are described in the assessment for the VEC or KI.

Sec. 52 Application Volume 6B: Environmental and Socio-Economic Assessment (ESA) – Marine Terminal Section 4: Scope of Assessment and Environmental Assessment Methods
Page 4-14 May 2010
Description of Cumulative Environmental Effects
The assessment of each cumulative environmental effect begins with a description of the environmental effect and the mechanisms whereby the project environmental effects may interact with other projects and activities in the REAA. Where possible, the cumulative environmental effect is quantified as the degree of change in the appropriate measurable parameter(s) and the spatial and temporal extent of these changes (i.e., where and when might the interactions occur between residual environmental effects of the Project and residual environmental effects of other projects and activities). As the assessment focuses only on residual environmental effects, cumulative environmental effects before mitigation are not characterized. The significance of the environmental effect before mitigation is also not described. Cumulative environmental effects are described for the following three cases:
• Base Case: the status of the measurable parameters for the environmental effect prior to the start of the Project, including all appropriate past and present projects and activities. Present projects and activities include all projects or actions that currently exist, as well as projects that have been approved under some form of regulatory permitting. In the latter case, information is gathered (often from regulatory and permitting agencies) and estimates are made. The Base Case is normally presented in the existing conditions of the VEC or KI with explicit reference to the fact that the Base Case reflects the contributions of past and present projects and activities.
• Project Case: the status of the measurable parameters for the environmental effect with the Project in place, over and above the Base Case. This is usually assessed using the peak environmental effect of the Project or the maximum active footprint5
• Future Case: the status of the measurable parameters for the environmental effect because of the Project Case in combination with all reasonably foreseeable projects, activities and actions. Reasonably foreseeable projects are defined as future projects, activities or actions that will occur with certainty, including projects that are in some form of regulatory approval or have made a public announcement to seek regulatory approval (i.e., they are likely to occur).
for the Project.
The comparison of the Project Case with the Future Case allows determination of the Project’s contribution to cumulative effects of all past, present and reasonably-foreseeable projects and activities (i.e., Future Case).
Mitigation of Residual Cumulative Environmental Effects
Mitigation measures that would reduce the project environmental effects are described for cumulative environmental effects, with emphasis on measures that should limit the interaction of environmental effects of the Project with similar environmental effects from other projects. Three types of mitigation measures are considered:
• measures that can be implemented solely by Northern Gateway
5 Maximum active footprint is defined as the maximum disturbed area during the project life minus any benefits derived from reclamation (if applicable).

Sec. 52 Application Volume 6B: Environmental and Socio-Economic Assessment (ESA) – Marine Terminal Section 4: Scope of Assessment and Environmental Assessment Methods
May 2010 Page 4-15
• measures that can be implemented by Northern Gateway in cooperation with other project proponents, government, participating Aboriginal groups and/or public stakeholders
• measures that can be implemented independently by other project proponents, government, participating Aboriginal groups and/or public stakeholders
For the latter two types of measures, the degree to which Northern Gateway can or cannot influence the implementation of these measures is noted.
Mitigation measures that would assist in reducing potential cumulative environmental effects are identified for each environmental effect, including a discussion of how these measures may modify the characteristics of an environmental effect.
Characterization of Residual Cumulative Environmental Effects
Residual cumulative environmental effects are described, taking into account how the mitigation will change the environmental effect. Where possible, cumulative environmental effects are characterized quantitatively or qualitatively in terms of the direction, magnitude, geographic extent, frequency, duration and reversibility (see Section 4.2.2.4).
Two aspects of cumulative environmental effects on a VEC or KI are characterized:
• the overall cumulative environmental effect (i.e., the environmental effect of all past, present and reasonably foreseeable projects and activities in combination with the environmental effect of the Project)
• the contribution of the Project to overall cumulative effects
Cumulative Effects Implications
The potential for the project effect under consideration to interact with other past, present and reasonably foreseeable activities and projects is determined using the three screening questions for cumulative effects described at the beginning of this section.
4.2.4 Determination of the Significance of Residual Environmental Effects
4.2.4.1 Determination of Significance of Project Environmental Effects
A determination of the significance of project environmental effects is made using standards or thresholds that are specific to the VEC, KI and/or the measurable parameters used to assess the environmental effect.
Determinations include a discussion of prediction confidence based on:
• scientific certainty relative to quantifying or estimating the environmental effect, including the quality and/or quantity of data and the understanding of the effect mechanisms
• scientific certainty relative to the effectiveness of the mitigation measures
Sec. 52 Application Volume 6B: Environmental and Socio-Economic Assessment (ESA) – Marine Terminal Section 4: Scope of Assessment and Environmental Assessment Methods
Page 4-16 May 2010
4.2.4.2 Determination of Significance of Residual Cumulative Environmental Effects
A determination of the significance of cumulative environmental effects is made using standards or thresholds that are specific to the VEC, KI and/or the measurable parameters used to assess the environmental effect. Determinations of significance are made for:
• the significance of the overall cumulative environmental effect (i.e., the environmental effect of all past, present and reasonably foreseeable projects and activities in combination with the environmental effect of the Project)
• the significance of the contribution of the Project to overall cumulative effects
As for residual project environmental effects, the determination for residual cumulative environmental effects also includes a discussion of prediction confidence based on:
• scientific certainty relative to quantifying or estimating the environmental effect, including the quality and/or quantity of data and the understanding of the effect mechanisms
• scientific certainty relative to the effectiveness of the mitigation measures
4.2.5 Follow-up and Monitoring After the analysis and evaluation of the residual environmental effects and their contribution to cumulative effects, it may be necessary to conduct a follow-up program or monitoring program.
Follow-up is defined as “a program for verifying the accuracy of the environmental assessment of a project, and determining the effectiveness of any measures taken to mitigate the adverse environmental effects of the project” (CEA Agency 2007). Follow-up programs may be warranted when:
• there is a need to address project-related issues of public concern
• there is a need to test the accuracy of the predictions of the environmental assessment
• there is a need to verify that mitigation measures were effective or successful
• the environmental effects of a project were assessed using new or unproven analytical or modeling techniques or the proposed project involves technology or mitigation measures that are new or unproven
• there is limited experience implementing the type of project being proposed in the environmental setting under consideration
• the scientific knowledge used to predict the environmental effects of the proposed project is limited (CEA Agency 2007)
Follow-up programs can be time- and resource-intensive and are only required where there is an identified need for a program based on the criteria set out above. In some instances, a monitoring program may adequately address any environmental issues so that the environment is protected.

Sec. 52 Application Volume 6B: Environmental and Socio-Economic Assessment (ESA) – Marine Terminal Section 4: Scope of Assessment and Environmental Assessment Methods
May 2010 Page 4-17
Monitoring typically refers to a program designed to:
• confirm the effectiveness of a broad range of approved mitigation techniques
• determine whether increased or different approved mitigation techniques are required to achieve the mitigation or reclamation goals
• identify and address any effects experienced that were not predicted (CEA Agency 2007)
Compliance inspections are designed to confirm implementation of approved design standards and other technical conditions as specified by the NEB Filing Manual, which also indicates the use of monitoring programs and compliance inspections during operation or post-operation assessment (NEB 2008).
Follow-up and monitoring programs are identified for specific disciplines. If a follow-up or monitoring program is identified, the following elements are discussed:
• parameters to be measured
• methods and equipment to be used
• location and timing of surveys
• how the results of the follow-up or monitoring program will be applied, including consideration of an adaptive management approach
4.2.6 Accidents, Malfunctions and Unplanned Events Issues of concern in relation to accidents and malfunctions of the marine terminal are described in Volume 7C.
4.3 Scope of Assessment for the Marine Terminal
4.3.1 Key Project Issues for the Marine Environment Construction and operations of the Kitimat Terminal will have an effect on the marine environment. Consultations with governmental representatives, participating Aboriginal groups and stakeholders, as well as the professional experience of the assessment team, have identified a number of potential issues from activities or events related to the marine terminal, including:
• onshore and inwater site preparation (including clearing, excavating, dredging, blasting, pile drilling and use of support vessels)
• onshore and inwater construction (including pile installation, structure assembly, and use of support vessels)
• operations (including wastewater discharge, presence of structures, and light and noise production from vessels and infrastructure)
These activities or events have the potential to result in:
• habitat disturbance • habitat loss

Sec. 52 Application Volume 6B: Environmental and Socio-Economic Assessment (ESA) – Marine Terminal Section 4: Scope of Assessment and Environmental Assessment Methods
Page 4-18 May 2010
• species displacement • injuries to, or death of marine organisms
4.3.2 Selection of Valued Environmental Components, Key Indicators and Measurable Parameters for the Marine Environment
Based on the marine resources in the area, seven VECs are identified for the marine environment:
• sediment and water quality • marine vegetation • marine invertebrates • marine fish • marine mammals • marine birds • marine fisheries
The justification for the selection of each VEC is provided below and summarized in Table 4-2. For a number of the above VECs, key indicators are assessed to obtain a finer detail for prediction of environmental effects (see Table 4-2).
Table 4-2 Valued Environmental Components and Key Indicators Selected for the Marine Environment
Valued Environmental Component Key Indicator Selection Basis
Sediment and Water Quality • Important habitat for all marine biota
Marine Vegetation Eelgrass (Zostera marina) • Important habitat for marine biota • Sensitive to disturbance • Present with select distribution in the area
Rockweed (Fucus distichus, ssp. edentatus)
• Important habitat for marine biota • Abundant or widely distributed in the area
Marine Riparian Habitat • Important habitat for marine biota
Marine Benthic Invertebrates Bay Mussels (Mytilus edulis) • Abundant or widely distributed in the area • Important food source for marine biota
Dungeness Crab (Cancer magister)
• Commercially and recreationally valuable • Culturally important • Sensitive to disturbance • Important food source for marine biota • Important benthic predator • Abundant or widely distributed in the area
Hexactinellid Sponges • Present in the area • Important habitat for marine biota • Sensitive to disturbance • Species of conservation concern

Sec. 52 Application Volume 6B: Environmental and Socio-Economic Assessment (ESA) – Marine Terminal Section 4: Scope of Assessment and Environmental Assessment Methods
May 2010 Page 4-19
Table 4-2 Valued Environmental Components and Key Indicators Selected for the Marine Environment (cont’d)
Valued Environmental Component Key Indicator Selection Basis
Marine Fish Eulachon (Thaleichthys pacificus)
• Commercially and recreationally valuable • Culturally important • Sensitive to disturbance • Species of conservation concern • Important food source for marine biota • Spawns in the area
Pacific Herring (Clupea harengus pallasi)
• Commercially and recreationally valuable • Culturally important • Sensitive to disturbances • Important food source for marine biota • Resident population in the area
Marine Fish (cont’d) Rockfish (Sebastes sp.) • Commercially and recreationally valuable • Sensitive to disturbance • Species of conservation concern • Stable populations in the area
Chum Salmon (Oncorhynchus keta)
• Commercially and recreationally valuable • Culturally important • Sensitive to disturbance • Important food source for marine biota • Abundant or widely distributed in the area
Marine Mammals Northern Resident Killer Whale (Ornicus orca)
• Commercially and recreationally valuable • Culturally important • Sensitive to disturbance • Species of conservation concern
North Pacific Humpback Whale (Megaptera novaeangliae)
• Commercially and recreationally valuable • Culturally important • Sensitive to disturbance • Species of conservation concern
Steller Sea Lion (Eumetopias jubatus)
• Commercially and recreationally valuable • Culturally important • Sensitive to disturbance • Species of conservation concern
Marine Birds Marbled Murrelet (Brachyramphus marmoratus)
• Sensitive to disturbance • Species of conservation concern
Surf Scoter (Melanitta perspicillata)
• Sensitive to disturbance • Species of conservation concern
Bald Eagle (Haliaeetus leucocephalus)
• Culturally important • Abundant in the area
Marine Fisheries Commercial Fishery Recreational Fishery Commercial Recreational Fishery Food, Social and Ceremonial Fishery
• Commercially and recreationally valuable • Culturally important • Species of Conservation Concern • Sensitive to disturbance • Abundant or widely distributed in the area

Sec. 52 Application Volume 6B: Environmental and Socio-Economic Assessment (ESA) – Marine Terminal Section 4: Scope of Assessment and Environmental Assessment Methods
Page 4-20 May 2010
4.3.2.1 Sediment and Water Quality, Marine Vegetation, Marine Invertebrates, and Marine Fish
Sediment and water quality, marine vegetation, marine benthic invertebrates and marine fish are identified because of their economic, recreational and cultural importance in the area, either directly or indirectly. Some of these aspects of the marine environment may also be particularly sensitive to disturbance.
Marine sediment, water and vegetation provide important fish habitat, which is defined by the Fisheries Act as, “spawning grounds and nursery, rearing, food supply and migration areas on which fish depend directly or indirectly to carry out their life processes”. Marine invertebrates also provide fish habitat (e.g., sponges) and are harvested for food (e.g., Dungeness crabs and mussels). Besides their importance for commercial harvest and food, social and ceremonial (FSC) fisheries, marine fish are an important food source for marine organisms.
4.3.2.2 Marine Mammals
Marine mammals are identified because of their, cultural, aesthetic, economic and biological values to Canadian society. Many of the populations of marine mammals found in British Colombia waters (e.g., killer whales) have declined in the past and are now protected under federal legislation (Species at Risk Act and Fisheries Act - Marine Mammal Regulations). These mammals depend on marine habitats during part or all their life cycle.
Due to habitat requirements for breeding, feeding and migrating, marine mammals are more likely to interact with many types of human activities and are therefore susceptible to additive environmental effect. This broad group includes baleen whales (e.g., humpback whales), toothed whales (e.g., dolphins, porpoises and killer whales), seals, sea lions and sea otters.
4.3.2.3 Marine Birds
Marine birds are identified because of their social, cultural and aesthetic value to society, as well as their contribution to local and global biodiversity. Marine birds are those species that depend on marine habitat for part or all of their life cycle. Many marine bird populations (e.g., alcids) are declining provincially, nationally and internationally due to anthropogenic effects such as mortality due to fish bycatch, as well as natural environmental changes such as climate change. Therefore, they are subject to conservation efforts, which often take the form of legislation or government policy (Wildlife Act, Species at Risk Act and Migratory Bird Convention Act).
British Columbia supports large populations of breeding, migrant, and wintering marine birds. Like marine mammals, they are susceptible to a range of human disturbances because they require a range of habitats during breeding, non-breeding, and staging periods.

Sec. 52 Application Volume 6B: Environmental and Socio-Economic Assessment (ESA) – Marine Terminal Section 4: Scope of Assessment and Environmental Assessment Methods
May 2010 Page 4-21
4.3.2.4 Marine Fisheries
Marine Fisheries are identified because of their cultural, commercial and recreational values, and their sensitivity to disturbance. The contributions of commercial fishing activities and landed volumes to the regional and provincial economies are noteworthy. Commercial fishing activities have been an ongoing and consistent contributor to these economies.
The importance of FSC fisheries was impressed upon the study team during a number of meetings with residents of Kitamaat Village, as well as elsewhere in the CCAA. While some members of Aboriginal groups depend upon the fishery more than others, all the Aboriginal coastal groups traditionally harvest fish and shellfish from the area.
4.4 References
4.4.1 Literature Cited ASL Environmental Sciences Inc. 2010. Marine Physical Environment Technical Data Report. Prepared
for: Northern Gateway Pipelines Inc. Calgary, AB.
Beckett, J. and K. Munro. 2010. Marine Fish and Fish Habitat Technical Data Report. Prepared for Northern Gateway Pipelines Inc. Calgary, AB.
Canadian Environmental Assessment Agency (CEA Agency). 2007. Follow-up Programs under the Canadian Environmental Assessment Act. Operational Policy Statement. Canadian Environmental Assessment Agency.
d'Entremont, M. 2010. Marine Birds Technical Data Report. Prepared for Northern Gateway Pipelines Inc. Calgary, AB.
Fisheries and Oceans Canada (DFO). 2006. Practitioners Guide to the Risk Management Framework for DFO Habitat Management Staff, Version 1.0. Habitat Management Program, Fisheries and Oceans Canada.
Gateway Pipeline Inc. 2005. Preliminary Information Package. Gateway Pipeline Inc. Calgary, AB.
JASCO Research Ltd. 2006. Marine Acoustics (2006) Technical Data Report. Prepared for Northern Gateway Pipelines Inc. Calgary, AB.
National Energy Board (NEB). 2008. Filing Manual. National Energy Board, Calgary, AB.
Stephenson, M., A. St-Amand, P.Mazzocco and J-M. Devink. 2010. Marine Ecological Risk Assessment for Kitimat Terminal Operations Technical Data Report. Prepared for Northern Gateway Pipelines Inc. Calgary, AB.
Triton Consultants Ltd. 2010. Marine Fisheries Technical Data Report. Prepared for: Northern Gateway Pipelines Inc. Calgary, AB.
Wheeler, B., A. Rambeau and K. Zottenberg. 2010. Marine Mammals Technical Data Report. Prepared for Northern Gateway Pipelines Inc. Calgary, AB.
Sec. 52 Application Volume 6B: Environmental and Socio-Economic Assessment (ESA) – Marine Terminal Section 4: Scope of Assessment and Environmental Assessment Methods
Page 4-22 May 2010
4.4.2 Internet Sites National Energy Board. 2009. Northern Gateway Pipeline Project - Joint Review Panel Agreement and
Terms of Reference. Accessed January 14, 2010. Available at: http://www.neb.gc.ca/clf-nsi/rthnb/nwsrls/2009/nrthrngtwjprgrmntbckgrndr-eng.html
Canadian Environmental Assessment Agency (CEA Agency). 2009a. Joint Review Panel Agreement. Accessed on January 14, 2010. Available at: http://www.ceaa-acee.gc.ca/050/document-eng.cfm?document=39960
Canadian Environmental Assessment Agency (CEA Agency). 2009b. Scope of Factors. Accessed on January 14, 2010. Available at: http://www.ceaa-acee.gc.ca/050/document-eng.cfm?document=39985

Sec. 52 Application Volume 6B: Environmental and Socio-Economic Assessment (ESA) – Marine Terminal Appendix 4A: Risk Management Framework
May 2010 Page 4A-1
Appendix 4A Risk Management Framework


Sec. 52 Application Volume 6B: Environmental and Socio-Economic Assessment (ESA) – Marine Terminal Appendix 4A: Risk Management Framework
May 2010 Page 4A-3
4A.1 Introduction
4A.1.1 Objectives Fisheries and Oceans Canada (DFO) reviews development proposals based on the habitat protection provisions in the Fisheries Act, particularly Section 35(1), which prohibits the “harmful alteration, disruption or destruction of fish habitat” (HADD). These reviews follow a risk management approach as outlined in the Practitioners Guide to the Risk Management Framework for DFO Habitat Management Staff, Version 1.0 (DFO 2006, Internet site). Completing a risk management framework (RMF) allows development proposals to be evaluated according to this approach and in accordance with the habitat protection provisions outlined in the Fisheries Act.
The effects of the proposed Enbridge Northern Gateway Project (the Project) on marine fish and their habitat are assessed in the Environmental and Socio-Economic Assessment (ESA) in this volume through the evaluation of valued environmental components (VECs) and key indicators (KIs). This appendix describes a RMF approach for project activities that might result in marine habitat related effects as requested by DFO.
The RMF approach was originally developed for use in the freshwater environment (the freshwater RMF evaluation is contained in Volume 6A, Section 11). There are no known examples of the RMF approach being applied to the marine environment. An RMF is generally developed through an iterative process and this RMF will continue to develop through further consultations with DFO.
The RMF evaluation might result in project relocation or revision, as well as modification of mitigation measures and therefore fulfills the relocate, redesign, and mitigate requirements of the Policy for the Management of Fish Habitat (DFO 1986, Internet site). Residual risks can be managed through additional mitigation (e.g., best practices) or habitat compensation, where appropriate. If additional mitigation or habitat compensation measures are required because of further refinement by DFO, commitments to these measures will be provided as the environmental review and permitting processes proceed.
4A.2 Methods
4A.2.1 Risk Management Framework An initial screening process is used to:
• confirm the presence of fish habitat
• establish whether sufficient information exists to determine if habitat protection provisions of the Fisheries Act apply
• determine whether the project activity is covered under DFO Operational Statements (DFO 2009, Internet site)

Sec. 52 Application Volume 6B: Environmental and Socio-Economic Assessment (ESA) – Marine Terminal Appendix 4A: Risk Management Framework
Page 4A-4 May 2010
Once initial screening is complete, the risk management framework includes three components (DFO 2006, Internet site):
• an effects assessment (modelled using DFO Pathways of Effects) identifies potential effects on habitat and opportunities to apply mitigation measures
• a risk assessment evaluates the sensitivity of fish and fish habitat, and the scale of negative effects associated with site-specific construction activities after applying mitigation
• a risk management strategy is developed if overall risk to fish and fish habitat is medium to high
Details of how the initial screening process and each RMF component are applied to marine habitat are discussed below.
4A.2.2 Initial Screening
Identification of Fish and Fish Habitat
Fish and fish habitat were identified through field studies (2005, 2006, 2008 and 2009) and review of historical data. In the project development area (PDA), the project effects assessment area (PEAA) and the confined channel assessment area (CCAA), habitat can be classified into marine riparian, intertidal, subtidal benthic and subtidal pelagic. The differentiating characteristics of these habitats and their associated flora and fauna are:
• Marine Riparian. The marine riparian area at the terminal site consists of forested areas that are immediately adjacent to the intertidal zone. Dominant tree species include western red cedar and western hemlock.
• Intertidal. The main intertidal habitat types are rock walls and ramps with some shallow platforms, and boulder beaches consisting of rock platforms with both boulder cover (approximately 84%) and cobble cover (approximately 25%).Species diversity in the rocky intertidal community of the study site is generally low. Rockweed and green algae (Ulva sp.) are the dominant seaweeds in the mid and upper intertidal zones; red algal turf and sparse kelp cover comprise the lower intertidal flora. Barnacles, mussels, periwinkles and limpets can be found on rocky substrate.
• Subtidal Benthic. Subtidal substrate at the terminal site is predominantly bedrock with overlying surface sediments, including fines and boulders. Grab results suggest that fine material in this habitat is a combination of gravel, silt and clay; with gravel and silt being dominant. The topography of the subtidal habitat consists of a narrow shelf along the coast that abruptly drops off to deepwater in a series of cliffs and ledges. The predominant macrophytes are small filamentous red algae. Animals include small sessile invertebrates such as bivalves, tunicates (Halocynthia spp., Ascidia spp.) and tubeworms (Serpula spp.). There are also a number of seastars and sea cucumbers, and several species of fish including sole, sculpin, stickleback, cockscomb and dogfish.

Sec. 52 Application Volume 6B: Environmental and Socio-Economic Assessment (ESA) – Marine Terminal Appendix 4A: Risk Management Framework
May 2010 Page 4A-5
• Subtidal Pelagic. Several species of fish and marine mammals are known to frequent the subtidal pelagic area of Kitimat Arm and the study area. Fish species commonly harvested include chum, coho, chinook and pink salmon, and steelhead, eulachon, and Pacific herring. Six marine mammals can be found in the area including killer whale, humpback whale, Dall’s porpoise, harbour porpoise, harbour seal and Steller sea lion. All but one, the harbour seal, are considered of special conservation concern by the Species at Risk Act (SARA), the Committee on the Status of Endangered Wildlife in Canada (COSEWIC) or the British Columbia government. These mammals are more likely to be present in Kitimat Arm during summer and early fall because of the abundance of fish.
Operational Statements
Operational Statements (DFO 2009, Internet site) provide standard mitigation measures to apply to activities that are of low risk to fish habitat. If Operational Statements can be applied, an effects assessment is not required. There are few Operational Statements for the marine environment and those that do exist are not relevant to the marine terminal. Therefore, an effects assessment is carried out for all marine activities.
4A.1.1.1 Component 1 – Effects Assessment
A RMF effects assessment identifies the potential effects of a development proposal on fish habitat. DFO Pathways of Effects (PoE) diagrams (DFO 2006, Internet site) are used to identify various land-based and inwater activities that can cause adverse environmental effects on fish and fish habitat if unmitigated. Residual adverse effects identified through this process are then examined further in the risk assessment component.
The first step to applying the PoE model to the project effects assessment is identifying project activities associated with the marine terminal that have the potential to affect fish habitat. Based on the project description the following eight activities were identified:
• Grading. A level area for the immediate onshore infrastructure and abutments for the berth will be constructed along the shoreline area. Clearing for this area will result in the disturbance of up to 1,000 m of marine riparian shoreline. Where possible, tree cover will be maintained between the main access road and the steep slopes above the berths. Marine riparian and intertidal habitat types will potentially be affected by grading.
• Dredging. Dredging will be required for construction of the berth foundations. Total overburden dredging quantities will be approximately 30,000 m3; assuming a 1.5 m sediment overburden depth is removed. Dredging will take approximately eight to nine weeks to complete. Subtidal benthic and subtidal pelagic habitat types will potentially be affected by dredging.
• Blasting. Based on the preliminary engineering design, total rock blasting (cut) quantities for the berth structures will be approximately 25,000 m3. The explosive discharge portion of the blasting will take approximately three weeks. Due to the slope of the underlying sea floor, up to 40% (10,000 m3) of the blasted rock will not be recoverable and will therefore remain in the marine environment. Subtidal benthic and subtidal pelagic habitat types will potentially be affected by blasting.

Sec. 52 Application Volume 6B: Environmental and Socio-Economic Assessment (ESA) – Marine Terminal Appendix 4A: Risk Management Framework
Page 4A-6 May 2010
• Pile Drilling. Based on the preliminary design and assumptions made for the ESA, approximately 200 piles will be required for the foundations of the three berths. The number of piles and other structures could be reduced because of ongoing engineering design. All main berth structure foundations will use rock-socketed piles. Piles will be installed using drilling techniques. Approximate drilling and installation time for a rock-socketed pile is four days. With two drilling barges and crews working simultaneously six days per week, drilling and installing piles for the ship berths is estimated to take 400 days. Intertidal, subtidal benthic and subtidal pelagic habitat types will potentially be affected by pile drilling.
• Grouting. Pile grouting will take place following drilling and after the pile has been put in place. Intertidal, subtidal, benthic and subtidal pelagic habitat types will potentially be affected by grouting.
• Use of Industrial Equipment. During berth construction, industrial equipment will be used both in water and on land. All equipment will be stored in a staging area adjacent to the utility berth. Intertidal and subtidal benthic and subtidal pelagic habitat types will potentially be affected by the use of industrial equipment.
• Surface Water Runoff. Surface water runoff from the tank and manifold areas of the tank terminal will be directed to, and stored in, the impoundment reservoir before being released to the marine environment or, when required, sent to the firewater reservoir. Water will be tested to confirm that the concentration of oil in water is less than 15 parts per million (ppm), before being released to the marine environment through a subtidal, perforated pipe. If the water is found to have oil in water exceeding 15 ppm, the water will be directed through the oil-water separator prior to its release. Subtidal benthic and subtidal pelagic habitat types will potentially be affected by surface water runoff.
• Marine Vessels. The number of one-way vessel transits (including barges and associated coastal tugs) associated with the Kitimat Terminal will vary for each year and phase. During terminal construction, there will be 7 one-way transits in Year 1, 32 in Year 2, 6 in Year 3 and 11 in Year 4, making a total of 56. During operations, it is estimated that the average number of transits per day will be 0.3 for very large crude carriers (VLCC), 0.6 for Suezmax and 0.3 for Aframax tankers (for a total of 1.2 transits per day, on average). Each vessel will require up to four harbour or escort tugs to berth or unberth. Harbour tugs are assumed to be similar to those commonly used for such purposes. Due to the depth of water at the berthing facilities, prop wash from large vessels or harbour tugs will not influence the bottom substrate.
• Tankers will be discharging segregated ballast at the Kitimat Terminal as they load liquid hydrocarbons and condensate tankers will be taking on ballast as they unload condensate. All vessels using the Kitimat Terminal will be required to follow requirements for ballast water management and discharge under the Canada Shipping Act, and to implement an International Maritime Organization (IMO)-approved Canadian Ballast Water Management Plan. Tankers will have segregated ballast on board that has been exchanged not less than 200 nautical miles from shore, as described by the Ballast Water Management Procedures. Oily ballast water will not be discharged at the Kitimat Terminal. Engine room slops and bilge water will be transported off-site by a third-party contractor for treatment and disposal.

Sec. 52 Application Volume 6B: Environmental and Socio-Economic Assessment (ESA) – Marine Terminal Appendix 4A: Risk Management Framework
May 2010 Page 4A-7
• Intertidal, subtidal benthic and subtidal pelagic habitat types will potentially be affected by marine vessels.
Once the project activities that can potentially affect fish and fish habitat had been identified, PoE flow charts were developed to determine the potential intermediate and ultimate effects of each activity on the quality and quantity of the marine habitats identified during the initial screening. These flow diagrams consider effects resulting from both construction and operationsand, where possible, were based on PoE flow diagrams previously developed by DFO.
Firstly, construction and operation activities were grouped according to their corresponding major development activity (see Attachment 4A.1):
• onshore site clearing and grading for terminal construction and berth abutments • inwater site preparation for berth construction • berth construction • terminal operation
Pathways were not identified for decommissioning, as any effects are considered positive (e.g., the piles and abutments will be removed). Once project activities for each major development activity were identified, a PoE flow chart was developed that identified associated and ultimate effects (Attachment 4A.2).
By combining information on the marine habitats that might be affected by project activities and the activities that might cause effects, potential pathways for interactions (i.e., which habitats might be affected by which activities) were identified (Table 4A-1).
Table 4A-1 Habitat Types Affected by Project-Related Activities
Activity Habitat Affected
Marine Riparian Intertidal Subtidal Benthic Subtidal Pelagic
Pile Drilling X X X
Dredging X X
Blasting X X
Grading X X
Marine Vessels X X X
Industrial Equipment X X X
Surface water runoff X X
Grouting X X X
Mitigation measures (i.e., measures designed to disable any pathway that leads to an effect) are identified in the environmental assessment. Proposed measures are both adapted from known standards and best management practices, and based on professional judgment. Residual adverse effects (i.e., those that cannot be eliminated through relocation, redesign or application of other mitigation measures) are examined further in the risk assessment component below.

Sec. 52 Application Volume 6B: Environmental and Socio-Economic Assessment (ESA) – Marine Terminal Appendix 4A: Risk Management Framework
Page 4A-8 May 2010
4A.2.2.1 Component 2 – Risk Assessment
The risk assessment component of the RMF determines the level of risk that residual effects pose to fish and fish habitat. Risk is assessed by considering the sensitivity of fish and fish habitat to a given effect and the scale of negative effects that are expected to occur because of project activities. The criteria used to develop ratings for fish and fish habitat sensitivity and scale of negative effects are based on those established for the freshwater fisheries RMF completed for Volume 6A (Section 11) and are discussed below.
Sensitivity of Fish and Fish Habitat
A fish and fish habitat sensitivity rating system was developed using the sensitivity attributes species sensitivity, species habitat dependence, rarity and habitat resilience, as outlined in the Practitioners Guide (DFO 2006, Internet site). These descriptors are somewhat subjective, so biophysical data collected during the field programs were used wherever possible. Based on the biophysical data available, sensitivity attributes were defined as follows:
• Species Sensitivity (SS): sensitivity of fish species to changes in environmental conditions
• Species Habitat Dependence (HD): habitat use by fish species
• Rarity (R): security of fish population or prevalence of the habitat type
• Habitat Resilience (HR): ability of an aquatic ecosystem to recover from changes in environment conditions and determined by:
• physical characteristics (dominant substrate type, vegetation, and aspect) • habitat complexity • exposure • current strength
Sensitivity scale ratings from 0 (not sensitive) to 5 (highly sensitive) were assigned to each attribute (Table 4A-2) based on the professional judgement of biologists. An overall sensitivity rating was calculated for each habitat as the sum of the fish and fish habitat sensitivity attribute scores, using the following formula:
Sensitivity of Fish Habitat = SS + HD + R + HR
Where the HR value used is the average rating of its components as listed above. The combined sensitivity rating ranges from 0 (no fish habitat) to 20 (highly sensitive habitat that supports rare species).

Sec. 52 Application Volume 6B: Environmental and Socio-Economic Assessment (ESA) – Marine Terminal Appendix 4A: Risk Management Framework
May 2010 Page 4A-9
Table 4A-2 Biophysical Parameters used to Calculate Habitat Sensitivity Sensitivity of Fish and Fish Habitat
Attribute Attribute Measures Scale Score
SPP Sensitivity
Sensitivity
of species to change or perturbation of conditions (e.g., fish to increased turbidity, m
amm
als
Not-sensitive to disturbance, highly resilient 1
Some temporary negative effects, full recovery expected 3
Permanent negative effect (injury, mortality); species very sensitive to disturbance
5
SPP Habitat
Dependency
Habitat Use Poor reproductive/rearing habitat, low quality shelter/foraging habitat
1
Poor reproductive/rearing habitat, good quality shelter/foraging habitat
3
Good reproductive, rearing and foraging habitat 4
Excellent reproductive, rearing and foraging habitat 5
Rarity
Security of fish population or prevalence of the habitat type
Habitat common / secure species 1
Habitat less common / Threatened species 4
Rare habitat / Endangered species 5
Habitat R
esilience
The ability of an aquatic ecosystem to recover from changes in environment concerns
Dominant substrate type - bedrock 1
Dominant substrate type - boulder (>25.6 cm) 2
Dominant substrate type – cobble (6.4–25.6 cm) 3
Dominant substrate type – gravel (0.2–6.4 cm) 4
Dominant substrate type – sand/mud 5
Vegetation – little to no seaweed or kelp (0%–5%) 1
Vegetation – low lying seaweed, low diversity (e.g., Fucus) 3
Vegetation – low lying kelp, high diversity 4
Vegetation – canopy kelp, eelgrass 5
Aspect – flat (stable) 1
Aspect – gradual slope 3
Aspect – moderate slope 4
Aspect – steep slope (unstable) 5
Low complexity – homogenous substrate, no vertical complexity
1
Moderate complexity – variable substrate types, low vertical complexity
3

Sec. 52 Application Volume 6B: Environmental and Socio-Economic Assessment (ESA) – Marine Terminal Appendix 4A: Risk Management Framework
Page 4A-10 May 2010
Table 4A-2 Biophysical Parameters used to Calculate Habitat Sensitivity (cont’d)
Sensitivity of Fish and Fish Habitat
Attribute Attribute Measures Scale Score
Habitat R
esilience (cont’d)
The ability of an aquatic ecosystem to recover from changes in environment concerns (cont’d)
High complexity – variable substrate types, moderate vertical complexity
5
High exposure – organisms accustomed to disturbance, high flushing
1
Medium exposure 3
Low exposure – organisms not accustomed to disturbance 5
Little to no current – habitat alteration unlikely to affect currents
1
Moderate current 3
Strong current - habitat alteration will likely change current pattern and, therefore, organism (larval) settlement, deposition of sediment etc.
5
Scale of Negative Effects
The scale of negative effects rating system for the Project was developed using the attributes extent, duration and intensity as outlined in DFO (2006, Internet site).
Project-specific data were used to establish the scale of negative effects based on the following parameters:
• extent (i.e., the areas directly and indirectly affected): area affected with respect to the PDA and the PEAA
• duration (i.e., the period for which residual effects persist): duration of inwater work for temporary effects; change to habitat if residual effect is permanent
• intensity (i.e., the expected change from baseline conditions, potentially influenced by timing): habitat effects due to works, considering timing of work windows
Details of the ratings are given in Table 4A.2-3. The overall scale of negative effects rating for each project activity was calculated as the sum of the scale of negative effects attribute scores using the following formula:
Scale of Negative Effects = Extent + Duration Score + Intensity
where the Intensity value used is the average of the Timing and Habitat Impacts ratings. The scale ranges from 1 to 15, with 15 representing the highest degree of residual effect.

Sec. 52 Application Volume 6B: Environmental and Socio-Economic Assessment (ESA) – Marine Terminal Appendix 4A: Risk Management Framework
May 2010 Page 4A-11
Table 4A-3 Attributes Used to Describe Scale of Negative Effects for the Project
Attribute Description Scales Used to Quantify Attributes Scale Score
Extent
The areas directly and indirectly affected
effects are within the PDA 1 effects are beyond the PDA but within the PEAA
3
effects are beyond the PEAA 5
Duration
Period that residual effects persist Inwater activity period is 1 to 6 weeks 1 Inwater activity period is 6 weeks to 6 months
2
Inwater activity period is ≥ 6 months 3 Permanent alteration of habitat (habitat alteration)
4
Permanent loss of habitat (habitat loss) 5
Intensity
Expected change from baseline conditions (timing can influence intensity)
Timing Work occurs within a least risk window 3 Work occurs outside of the least risk window
5
Habitat Impacts
Habitat still suitable; minimal effects 1
Habitat quality significantly reduced 3
Habitat unusable 5
Categorizing Risk
Risk is characterized by plotting the scale of negative effects rating and sensitivity of fish and fish habitat rating for each habitat and activity on DFO’s Risk Assessment Matrix (DFO 2006, Internet site; Figure 4A-1). For each habitat, the activity will fall into one of four risk management categories:
• Low Risk – no harmful alteration, disruption or destruction (HADD) likely with mitigation • Medium Risk – HADD likely that are small scale and/or temporary • High Risk – HADD likely over a broad geographic extend and/or a long period of time • Significant Negative Effect
If risk associated with a project activity could result in a significant negative effect, DFO’s policy requires project relocation or redesign. Once the relocation or redesign is complete, the RMF is evaluated again.

Sec. 52 Application Volume 6B: Environmental and Socio-Economic Assessment (ESA) – Marine Terminal Appendix 4A: Risk Management Framework
Page 4A-12 May 2010
SOURCE: DFO 2006, Internet site
Figure 4A-1 DFO’s Risk Assessment Matrix
4A.2.2.2 Component 3 – Risk Management
The method of risk management used is dependent on the category of risk determined for each activity (Figure 4A.2-1). Risk management recommendations most commonly come in the form of:
• a letter of advice that describes obligations for protecting fish and how to do so
• a Fisheries Act authorization, which also includes conditions for monitoring, habitat compensation and possibly financial security.
Low risk effects on fish and fish habitat are not likely to result in a HADD, assuming appropriate mitigation measures are in place. Under these circumstances, DFO is likely to issues a “No HADD Likely as Proposed” letter that will include a list of mitigations that must be followed.
Medium- and high-risk effects are likely to result in a HADD and a Fisheries Act authorization will be required. Medium- and high-risk effects differ in that medium risk effects are typically small scale and/or temporary in duration and have predictable outcomes. In contrast, high-risk effects typically occur over a long period of time or a broad geographic extent in areas ranked high on the sensitivity of fish and fish habitat scale.

Sec. 52 Application Volume 6B: Environmental and Socio-Economic Assessment (ESA) – Marine Terminal Appendix 4A: Risk Management Framework
May 2010 Page 4A-13
4A.2.2.3 Results and Discussion
The RMF approach was applied to the four marine habitat types identified in the initial screening process, as a function of the eight project activities identified as potentially affecting fish and fish habitat. Effects ratings calculations are given in Attachment 4A.3. Results indicate that the risk of a project-related effect on fish and fish habitat is low (green) for all activities except for some habitats affected by pile drilling, blasting and dredging which have risks of low/moderate to moderate (yellow; Figure 4A-2; Table 4A-4). Also shown in Figure 4A-2 are the numbers of habitats in the study that correspond to a given area of the matrix. Based on these findings, further assessment should focus on determining the effects of these three activities on fish and fish habitat. The vegetation VEC in the ESA also considers the effect of grading, but concludes that the effects will be not significant (habitat is lost permanently but only 0.2% of riparian habitat in the PEAA is affected) and, therefore, is consistent with the RMF study.
SOURCE: DFO 2006, Internet site.
Figure 4A-2 Result of the Marine Environment Risk Management Framework as plotted on DFO’s Risk Determination Matrix

Sec. 52 Application Volume 6B: Environmental and Socio-Economic Assessment (ESA) – Marine Terminal Appendix 4A: Risk Management Framework
Page 4A-14 May 2010
Table 4A-4 Project Activities and Associated Habitat Types Where Moderate Risk to Fish and Fish Habitat Was Identified
The RMF results show that habitat compensation will likely be required as a result of the moderate risks associated with pile drilling. Specifically, risks linked to the loss of intertidal and subtidal benthic habitat. This activity will primarily affect invertebrates and vegetation as indicated in the ESA.
Blasting and dredging activities present low–moderate risk but might also require habitat compensation measures. These activities lie on the low–moderate risk boundary because:
• habitat will be altered rather than lost (i.e., habitat will be usable for recolonization immediately following cessation of activity)
• similar habitat is abundant in the PEAA
• marine invertebrates will recolonize the disturbed area within several years
It is possible that some of the subtidal benthic habitat lost because of blasting will be self-compensated. Approximately 40% of the blasted rock will permanently come to rest in the subtidal benthic habitat leading to the loss of invertebrates and vegetation as indicated in the ESA. However, the rocks will produce complex structures for attachment by various organisms, as well as refuge for fish, and therefore contribute to a net habitat gain.
Dredging and blasting are the only activities identified in the ESA as potentially requiring habitat compensation. Pile drilling is not identified because the key indicators that are assessed under vegetation (rockweed, eelgrass and marine riparian) are not present in the subtidal area where pile drilling will be taking place. However, the subtidal environment is habitat for many invertebrate and fish species; as a result, pile drilling is identified as requiring compensation in the RMF.
The overall outcome of the RMF is consistent with what is reported in the ESA. Specifically, effects caused by pile drilling, dredging and blasting are likely to result in habitat alterations and losses that will be sufficient to require habitat compensation. Although grading results in a loss of fish habitat, the low level of sensitivity associated with this habitat resulted in this effect being of low risk and, therefore, not requiring compensation.
Activity Habitat Affected Risk
Pile Drilling Intertidal Moderate Pile Drilling Subtidal benthic Moderate Dredging Subtidal benthic Low/Moderate Blasting Subtidal benthic Low/Moderate

Sec. 52 Application Volume 6B: Environmental and Socio-Economic Assessment (ESA) – Marine Terminal Appendix 4A: Risk Management Framework
May 2010 Page 4A-15
4A.3 References
4A.3.1 Internet Sites Fisheries and Oceans Canada DFO. 1986. The Department of Fisheries and Oceans Policy for the Management
of Fish Habitat. Available at: http://www.dfo-mpo.gc.ca/oceans-habitat/habitat/policies-politique/operating-operation/fhm-policy/index_e.asp
Fisheries and Oceans Canada DFO. 2006. Practitioners Guide to the Risk Management Framework for DFO Habitat Management Staff. Version 1.0. Available at: http://www.dfo-mpo.gc.ca/oceans-habitat/habitat/policies-politique/operating-operation/risk-risques/index_e.asp
Fisheries and Oceans Canada DFO. 2009. Operational Statements. Available at: www.dfo-mpo.gc.ca/regions/central/habitat/os-eo/provinces-territories-territoires/index-eng.htm


Sec. 52 Application Volume 6B: Environmental and Socio-Economic Assessment (ESA) – Marine Terminal Attachment 4A.1: Potential Pathways of Effects for the Marine Environment
May 2010 Page 4A.1-1
Attachment 4A.1 Potential Pathways of Effects for the Marine Environment


Sec. 52 Application Volume 6B: Environmental and Socio-Economic Assessment (ESA) – Marine Terminal Attachment 4A.1: Potential Pathways of Effects for the Marine Environment
May 2010 Page 4A.1-3
Table 4A.1-1 Potential Pathways of Effects for the Marine Environment for Project Activities at the Marine Terminal
Development Activity Pathway Potential Physical Impact
Ultimate Effects Marine Land-based Onshore site preparation for the marine terminal and berth abutments
• Site clearing and/or grading (On shore)
• Change in shoreline stability
• Increased erosion potential
• Removal of riparian vegetation
• Noise Generation
• Change in food supply • Habitat alteration • Change in sediment
concentrations
• Use of industrial equipment • Resuspension of sediment
• Oil, grease and fuel leaks
• Change in shoreline stability
• Increased erosion potential
• Potential mortality of fish and eggs from equipment
• Physical injury • Change in sediment
concentrations • Change in contaminant
concentrations Inwater site preparation for the berth
• Dredging • Resuspension of sediment
• Change in substrate • Change in marine
macrophytes
• Change in shoreline stability
• Change in food supply • Habitat alteration • Change in sediment
concentrations • Change in nutrient
concentrations • Change in contaminant
concentrations

Sec. 52 Application Volume 6B: Environmental and Socio-Economic Assessment (ESA) – Marine Terminal Attachment 4A.1: Potential Pathways of Effects for the Marine Environment
Page 4A.1-4 May 2010
Table 4A.1-1 Potential Pathways of Effects for the Marine Environment for Project Activities at the Marine Terminal (cont’d)
Development Activity Pathway Potential Physical Impact
Ultimate Effects Marine Land-based Inwater site preparation for the berth (cont’d)
• Blasting (In water) • Change in substrate/hydraulics
• Blast residues • Increased erosion
potential
• Change in nutrient concentrations
• Change in contaminant concentrations
• Change in sediment concentrations
• Habitat alteration
• Use of industrial equipment • Resuspension of sediment
• Oil, grease and fuel leaks
• Change in shoreline stability
• Increased erosion potential
• Potential mortality of fish and eggs from equipment
• Physical injury • Change in sediment
concentrations • Change in contaminant
concentrations Berth construction • Use of industrial equipment • Resuspension of
sediment • Oil, grease and fuel
leaks
• Change in shoreline stability
• Increased erosion potential
• Potential mortality of fish and eggs from equipment
• Physical injury • Change in sediment
concentrations • Change in contaminant
concentrations

Sec. 52 Application Volume 6B: Environmental and Socio-Economic Assessment (ESA) – Marine Terminal Attachment 4A.1: Potential Pathways of Effects for the Marine Environment
May 2010 Page 4A.1-5
Table 4A.1-1 Potential Pathways of Effects for the Marine Environment for Project Activities at the Marine Terminal (cont’d)
Development Activity Pathway Potential Physical Impact
Ultimate Effects Marine Land-based Berth construction (cont’d) • Pile drilling • Change in hydraulics
• Change in substrate composition
• Changes in vegetation • Loss of habitat
• Direct mortality • Habitat alteration • Change in sediment
concentrations • Change in food supply
• Grouting piles • Release of concrete/grouting material into water
• Change in contaminant concentration
• Direct mortality Terminal Operation • Marine vessels • Release/intake of
ballast water • Vessel strike • Resuspension/
entrainment of sediment from propeller wash
• Oil, grease and fuel leaks
• Hull fouling
• Change in contaminant concentration
• Physical injury/direct mortality
• Habitat alteration • Change in sediment
concentration
• Surface water runoff and wastewater management
• Alteration to thermocline/halocline
• Thermal loading • Generation of
sediment-laden runoff
• • Change in salinity • Habitat alteration • Change in temperature • Change in sediment
and nutrient concentrations


Sec. 52 Application Volume 6B: Environmental and Socio-Economic Assessment (ESA) – Marine Terminal Attachment 4A.2: Potential Pathways of Effects Diagrams for the Marine Environment
May 2010 Page 4A.2-1
Attachment 4A.2 Potential Pathways of Effects Diagrams for the Marine Environment


Sec. 52 Application Volume 6B: Environmental and Socio-Economic Assessment (ESA) – Marine Terminal Attachment 4A.2: Potential Pathways of Effects Diagrams for the Marine Environment
May 2010 Page 4A.2-3
Figure 4A.2-1 Potential Pathways of Effects for the Marine Environment – Dredging (Inwater Construction)
Dredge material
deposited in water
DREDGING
Change in marine
macrophytes
Resuspension & entrainment of
sediment
Change in bottom or shoreline
morphology
Material in water
pathway
Change in hydraulics
Change in shoreline stability
Change in substrate
Habitat alteration
Change in contaminant
Change in food supply
Change in sediment
Change in food supply
Change in nutrient
Restricted access to fishing grounds

Sec. 52 Application Volume 6B: Environmental and Socio-Economic Assessment (ESA) – Marine Terminal Attachment 4A.2: Potential Pathways of Effects Diagrams for the Marine Environment
Page 4A.2-4 May 2010
Figure 4A.2-2 Potential Pathways of Effects for the Marine Environment – Blasting (Inwater Construction)
BLASTING (INWATER)
Change in bank or bottom stability Blast residues
Change in contaminant
concentrations
Change in nutrient concentrations
Change in sediment concentrations
Increased erosion potential
Restricted access to fishing grounds
Change in bottom morphology
Change in hydraulics
Change in substrate
Habitat alteration

Sec. 52 Application Volume 6B: Environmental and Socio-Economic Assessment (ESA) – Marine Terminal Attachment 4A.2: Potential Pathways of Effects Diagrams for the Marine Environment
May 2010 Page 4A.2-5
Figure 4A.2-3 Potential Pathways of Effects for the Marine Environment – Use of Industrial Equipment (Land-Based and Inwater Construction)
Physical injury
Potential mortality of fish/eggs from
equipment
USE OF INDUSTRIAL EQUIPMENT
Use of immobile industrial equipment
Use of mobile industrial equipment
(on shore)
Re-suspension and
entrainment of sediment
Change in contaminant concentrations
Change in sediment concentrations
Oil, grease and fuel leaks Shoreline
stability—exposed soils/increased
erosion potential

Sec. 52 Application Volume 6B: Environmental and Socio-Economic Assessment (ESA) – Marine Terminal Attachment 4A.2: Potential Pathways of Effects Diagrams for the Marine Environment
Page 4A.2-6 May 2010
Figure 4A.2-4 Potential Pathways of Effects for the Marine Environment –Grading (Onshore Construction)
GRADING (ON-SHORE)
Bank stability and exposed soils
Change in sediment concentrations
Habitat alteration
Change in slope
Change in drainage patterns
Increased erosion potential
Removal of shoreline vegetation
Change in food supply (to marine
environment)

Sec. 52 Application Volume 6B: Environmental and Socio-Economic Assessment (ESA) – Marine Terminal Attachment 4A.2: Potential Pathways of Effects Diagrams for the Marine Environment
May 2010 Page 4A.2-7
Figure 4A.2-5 Potential Pathways of Effects for the Marine Environment – Pile Drilling (Construction)
PILE DRILLING (PLACEMENT OF STRUCTURES &
EQUIPMENT IN WATER)
Change in sediment
concentrations
Partial constriction of
flow (e.g., piles,
Change in hydraulics
Change in seabed and/or shoreline
morphology
Changes in aquatic vegetation
Direct mortality Change in substrate
composition
Change in food supply
Restricted access to fishing grounds
Loss of habitat
Habitat alteration

Sec. 52 Application Volume 6B: Environmental and Socio-Economic Assessment (ESA) – Marine Terminal Attachment 4A.2: Potential Pathways of Effects Diagrams for the Marine Environment
Page 4A.2-8 May 2010
Figure 4A.2-6 Potential Pathways of Effects for the Marine Environment – Pile Grouting (Construction)
GROUTING (PILES) AND CONCRETE WORK
Release of concrete / grouting material into water
Change in contaminant concentrations
Direct mortality (toxicity of uncured concrete product)

Sec. 52 Application Volume 6B: Environmental and Socio-Economic Assessment (ESA) – Marine Terminal Attachment 4A.2: Potential Pathways of Effects Diagrams for the Marine Environment
May 2010 Page 4A.2-9
Figure 4A.2-7 Potential Pathways of Effects for the Marine Environment – Marine Vessels* * Marine vessels in this case include all vessels used for the Project, including those used during construction, operations, and shipping
MARINE VESSELS
Habitat alteration
Physical injury
Bank stability, resuspension & entrainment of sediments from
propeller wash (from tugs)
Change in contaminant
concentrations
Change in sediment concentrations
Oil, grease and fuel leaks or collision with other vessels
Vessel strikes on marine animals
Direct mortality
Ballast water intake/exchange/
release
Change in contaminant
concentrations
Habitat alteration
Direct mortality
Hull fouling (introduction of non-indigenous species

Sec. 52 Application Volume 6B: Environmental and Socio-Economic Assessment (ESA) – Marine Terminal Attachment 4A.2: Potential Pathways of Effects Diagrams for the Marine Environment
Page 4A.2-10 May 2010
Figure 4A.2-8 Potential Pathways of Effects for the Marine Environment – Surface Water Runoff and Wastewater Management (Operations)
SURFACE WATER RUNOFF AND WASTEWATER MANAGEMENT
Change in temperature
Thermal loading
Alteration of thermocline/halocline
Change in salinity Habitat alteration
Change in migration and/or habitat use
Generation of sediment-laden runoff
Change in nutrient concentrations
Change in sediment concentrations

Sec. 52 Application Volume 6B: Environmental and Socio-Economic Assessment (ESA) – Marine Terminal Attachment 4A.3: Risk Rating
May 2010 Page 4A.3-1
Attachment 4A.3 Risk Rating


Sec. 52 Application Volume 6B: Environmental and Socio-Economic Assessment (ESA) – Marine Terminal Attachment 4A.3: Risk Rating
May 2010 Page 4A.3-3
Table 4A.3-1 Sensitivity and Scale of Negative Effects Ratings for Grading
Dominant Substrate Vegetation Aspect
Habtiat Complexity Exposure Current Timing
Habitat Impacts
habtiat alterationchange in sediment concentrations
3 3
3 3
_ _ 11 low risk3 _ 1 5 5 55.5Riparian 1 1 1 2 _Habitat loss
Tota
l (15
)
4
5
_
NA
NA
1 2
Intensity RiskHabitat types
Attribute MeasuresSensitivity Rating
Tota
l (20
) Scale of Negative Effects
Intertidal 3 3
Spp Sensitivity
Spp. Habitat Dependency
low risk1 2
_ _
Rarity
Habitat Resilience
Extent Duration
3
Subtidal Benthic
3 3 1 1 3none _ _
15
_3 10
63 10
Subtidal Pelagic
3 3 1 _ _none _ _ __ 3 10 _ _3
Table 4A.3-2 Sensitivity and Scale of Negative Effects Ratings for Dredging
Dominant Substrate Vegetation Aspect
Habtiat Complexity Exposure Current Timing
Habitat Impacts
change in food supply
habitat alterationchange in sediment conc.change in nutirent conc.change in contaminant conc.
_
none
1 3
4
5Subtidal Benthic
3 3
1Subtidal Pelagic
3 1 1 _ 3 73 8 3 2 3_ _change in sediment conc.
3
_ _
1 9
_ _
Habitat types
Sensitivity Rating
Tota
l (20
) Scale of Negative EffectsAttribute Measures
Intertidal 3 3 1 3
low risk
low/moderate risk
Risk
NA
Extent Duration
Intensity
3
_
4
Spp Sensitivity
Spp. Habitat Dependency Rarity
Habitat Resilience
32 3
10
3 10
31
Tota
l (15
)
3 3


Sec. 52 Application Volume 6B: Environmental and Socio-Economic Assessment (ESA) – Marine Terminal Attachment 4A.3: Risk Rating
May 2010 Page 4A.3-5
Table 4A.3-3 Sensitivity and Scale of Negative Effects Ratings for Blasting
Dominant Substrate Vegetation Aspect
Habtiat Complexity Exposure Current Timing
Habitat Impacts
change in nutrient conc.change in contaminant conc.change in sediment conc.lethal or sublethal effects on fishhabitat alteration
3
3 3
3 3
Extent
1 3 1
_
low/moderate risk
low risk
_ _
63
Habitat types
Sensitivity Rating
Tota
l (20
) Scale of Negative Effects
Tota
l (15
)
_
Intensity
change in sediment conc.
None 2
1
Spp Sensitivity
Spp. Habitat Dependency Rarity
Habitat Resilience
4
Subtidal Pelagic
3 1
Intertidal 3 3
Subtidal Benthic
33
Attribute Measures
1 5 3 351
1 3
1
10
8_ 3
93 3
_ _
Risk
NA3 10 _
Duration
_
Table 4A.3-4 Sensitivity and Scale of Negative Effects Ratings for Pile Drilling
Dominant Substrate Vegetation Aspect
Habtiat Complexity Exposure Current Timing
Habitat Impacts
habitat alteration
change in sediment conc.
change in food supplyinjury/mortality
3 3
change in sediment conc. low risk
Subtidal Benthic
3 3 1 1
Subtidal Pelagic
_ 33 1 1 _ _ _ 3
To
tal
(20
)
Habitat ResilienceAttribute Measures
3
4 32
3
3
3 3
Habitat types
Spp Sensitivity
Spp. Habitat Dependency Rarity
Sensitivity Rating
noneIntertidal 3 3 1
Risk
10
Scale of Negative Effects
To
tal
(15
)
Extent
Intensity
moderate risk
Duration
1
moderate risk5 5 1010
10 5 3
8
1 3
5
5
81333


Sec. 52 Application Volume 6B: Environmental and Socio-Economic Assessment (ESA) – Marine Terminal Attachment 4A.3: Risk Rating
May 2010 Page 4A.3-7
Table 4A.3-5 Sensitivity and Scale of Negative Effects Ratings for Grouting
Dominant Substrate Vegetation Aspect
Habtiat Complexity Exposure Current Timing
Habitat Impacts
Change in contaminant concentrationDirect mortality
none
Habitat types
Attribute MeasuresSensitivity Rating
3
1Subtidal Benthic
3 3
Scale of Negative Effects
3 1
5
10
3
1 3
33
Tota
l (15
)
RiskSpp
SensitivitySpp. Habitat Dependency Rarity
HabitatResilience
Extent Duration
Intensity
Tota
l (20
)
low risk
Intertidal 3 3 1 2 3 4 3
1
3 3
low risk
6 low risk
3 1 6
3_ _ 8 3
10 13
_ 3
3
1 6Subtidal Pelagic
3 1 1 _Change in contaminant concentration
1
Table 4A.3-6 Sensitivity and Scale of Negative Effects Ratings for Use of Industrial Equipment
Dominant Substrate Vegetation Aspect
Habtiat Complexity Exposure Current Timing
Habitat Impacts
Potential mortality of fish/eggs from equipmentPhysical injuryChange in sediment concentrations
Change in contaminant concentrations
Potential mortality of fish/eggs from equipmentPhysical injury
Change in sediment concentrations
Change in contaminant concentrations
_ 3
3 3
3 3
low riskNone 3_
3
3 low risk
low risk
5
4
Habitat types
Attribute MeasuresSensitivity Rating
Tota
l (20
) Scale of Negative Effects
Tota
l (15
)
RiskSpp
SensitivitySpp. Habitat Dependency Rarity
Habitat Resilience
Extent Duration
Intensity
3 1 1 3
Intertidal 3 3 1 2 3 10
1
1 71 3 5
71 3 510
Subtidal Pelagic
3 1 1 _ _
Subtidal Benthic
3
78 1 3 5 1


Sec. 52 Application Volume 6B: Environmental and Socio-Economic Assessment (ESA) – Marine Terminal Attachment 4A.3: Risk Rating
May 2010 Page 4A.3-9
Table 4A.3-7 Sensitivity and Scale of Negative Effects Ratings for Surface Water Runoff
Dominant Substrate Vegetation Aspect
Habtiat Complexity Exposure Current Timing
Habitat Impacts
Change in salinity Habitat alterationChange in temperature
Change in sediment concentrations
Change in salinity Habitat alterationChange in temperature
Change in sediment concentrations
3 3 3
3
low risk
none low risk
10 1 3
4 _ _ _
_
Habitat types
Attribute MeasuresSensitivity Rating
Tota
l (20
) Scale of Negative Effects
Tota
l (15
)
RiskSpp
SensitivitySpp. Habitat Dependency Rarity
Habitat Resilience
Extent Duration
Intensity
_Intertidal 3 3 1 2 3 33 3 _ low risk
Subtidal Benthic
3 3 1 1 3 5
10
5 1 7
Subtidal Pelagic
3 1 1 _ _ 7_ 8 1 3 5 13
Table 4A.3-8 Sensitivity and Scale of Negative Effects Ratings for Marine Vessels
Dominant Substrate Vegetation Aspect
Habtiat Complexity Exposure Current Timing
Habitat Impacts
Change in contaminant concentration
Physical injury / direct mortalityChange in sediment concentrationHabitat alteration
7
Tota
l (15
)
low risk
3 5 1
1 7
7 low risk
low risk
Duration
IntensityHabitat types
Attribute MeasuresSensitivity Rating
Tota
l (20
) Scale of Negative Effects
3 3 1
Subtidal Pelagic
RiskSpp
SensitivitySpp. Habitat Dependency Rarity
Habitat Resilience
Extent
Change in sediment concentration
33 3
Change in sediment concentration
Intertidal 3 3 1
Subtidal Benthic
510 15 3
2 3 4 10 1
1_ 3_ 8
1 3 33 3
1 3 533 1 1 _ _


Sec. 52 Application Volume 6B: Environmental and Socio-Economic Assessment (ESA) – Marine Terminal Section 5: General Mitigation for the Marine Environment
May 2010 Page 5-1
5 General Mitigation for the Marine Environment Northern Gateway is committed to the Project having no significant adverse environmental effects on the marine environment. It is also committed to complying with all provincial and federal regulations and acts pertaining to marine life and their habitat so that species of special conservation concern are protected.
Based on guidance from the Kalum Land and Resource Management Plan (LRMP), Government of British Columbia (2002), the site for the Kitimat Terminal is within lands that are identified as suitable for development within Kitimat Arm. Benefits of the site selected for the terminal include:
• marine species sensitive habitats, such as estuaries, eelgrass beds and known spawning grounds, will not be directly affected
• marine parks and protected areas, will not be directly affected
The design of the Kitimat Terminal preserves existing water flow and fish movement patterns.
To the extent possible, contractors will follow best management practices, codified practices, and industry standards including the following during construction:
• in consultation with DFO, timing window constraints for activities such as site preparation, dredging and blasting
• location constraints that specify where certain activities can and cannot occur
• methods that specify how construction activities will be conducted. These might include use of silt curtains, onshore water management plans, use of appropriate erosion and runoff controls (e.g., silt fences, sediment settlement ponds), and choice of a dredging system to limit sediment effects (e.g., clamshell bucket on the dredge, closed during ascent through the water column).
Marine Fish Habitat Compensation
Northern Gateway is committed to avoiding loss of marine habitat. As part of the ongoing design of the marine terminal, Northern Gateway has reduced the number of in-water structures, as well as the amount of seabed that would need to be disturbed to accommodate the in-water structures. Where marine habitat loss related to the construction of the Kitimat Terminal cannot be avoided, habitat restoration, enhancement and/or creation will be provided to compensate for any harmful alteration, disruption, or destruction of fish habitat (HADD) of marine fish habitat. Compensation works will follow DFO’s policy of net habitat gain and the hierarchy of preferences established in Practitioners Guide to Habitat Compensation for DFO Habitat Management Staff – Version 1.1 (DFO).
Northern Gateway will develop a marine Habitat Compensation Program, which will be based on prior discussions with DFO, ‘detailed information requirements for compensation measures’ already provided by DFO, and recent marine compensation examples in British Columbia. As a first step, a conceptual marine habitat compensation plan will be prepared, which will form the basis for discussions with DFO and provincial agencies, participating Aboriginal groups and the public. An Interim Compensation Program will then continue to investigate likely HADD and compensation opportunities. A final marine habitat compensation plan will be developed to reflect consultations.

Sec. 52 Application Volume 6B: Environmental and Socio-Economic Assessment (ESA) – Marine Terminal Section 5: General Mitigation for the Marine Environment
Page 5-2 May 2010
The final plan will be developed during detailed engineering and will be implemented prior to and during construction of the Project. The overall objective is to assess potential HADD and identify options to adequately compensate the potential HADD.
Major steps in the Interim Habitat Compensation Program include the following:
• Initial quantification of HADD will take place once a design concept is finalized, estimates of HADD (in square metres), will be determined using overlays of the terminal footprint on existing marine habitats, thus providing an overall scale of expected HADD that can be used in discussions pertaining to compensation options and productive capacity.
• Compensation goals have largely been provided by DFO (e.g., no net loss). Site and habitat specific objectives will be determined in cooperation with DFO and through discussions with participating Aboriginal groups and directly affected stakeholders.
• Compensation opportunities in line with DFO’s hierarchy of compensation options (like-for-like, etc.), that satisfy goals (no net loss of productive capacity), will be identified and described to a moderate level of detail (maps, drawings).
• Preferred options will be selected through discussions with DFO, and will be reviewed with participating Aboriginal organizations and directly affected stakeholders.
• Quantification of HADD will be completed using information from field surveys to determine the amount of marine riparian, intertidal and sub-tidal habitat that will be affected and the associated temporary losses of related productive capacity. Overlays of the detailed design for the marine terminal with marine habitats will be used to quantify the amount and types of HADD. Compensation ratios for various habitat types will be used to set the compensation goal.
• Detailed plans for habitat compensation projects will be developed and will take into consideration the issues raised during the review process. These plans will be submitted for authorizations and permits as necessary.
• Implementation of habitat compensation projects:
• Should on-site or off-site compensation options be identified, they may be implemented prior to construction using a “habitat banking” approach.
• Some of the compensation works may be constructed and/or maintained through partnerships with participating Aboriginal groups and community groups.
• Monitoring of habitat compensation projects. All compensation works will be monitored at regular intervals until they become maintenance free. Monitoring will include parameters such as structural integrity, fish use, and success of riparian plantings.

Sec. 52 Application Volume 6B: Environmental and Socio-Economic Assessment (ESA) – Marine Terminal Section 5: General Mitigation for the Marine Environment
May 2010 Page 5-3
5.1 References
5.1.1 Literature Cited Fisheries and Oceans Canada (DFO). Practitioners Guide to Habitat Compensation for DFO Habitat
Management Staff, Version 1.1. Habitat Management Program, Fisheries and Oceans Canada
Government of British Columbia. 2002. Kalum Land and Resource Management Plan. Ministry of Sustainable Resource Management. Victoria, BC.

Sec. 52 Application Volume 6B: Environmental and Socio-Economic Assessment (ESA) – Marine Terminal Section 6: Listed Species for the Marine Environment
May 2010 Page 6-1
6 Listed Species for the Marine Environment
6.1 Overview This section provides an index to where detailed assessments for listed species (or the KI that represents them) can be found in this volume.
Within the marine PEAA, there are nine species identified as being at risk and protected under provincial or federal legislation. Eight of these are listed on Schedule 1 of the Species at Risk Act (SARA) (see Table 6-1). Bocaccio (a species of rockfish) is presently under review for addition to Schedule 1. Eulachon, while not protected under SARA, is listed on the provincial blue list as a species of concern (Ramsay 2003, Internet site).
The presence of listed species in the marine PEAA is identified based on range and distributions reported in Committee on the Status of Endangered Wildlife in Canada (COSEWIC) status reports, associated literature, recent field surveys in the area and expert knowledge (see Marine Birds TDR, d'Entremont 2010; Marine Fish and Fish Habitat TDR, Beckett and Munro 2010; Marine Mammals TDR, Wheeler et al. 2010). SARA listed species are assessed with the most closely related marine VEC and associated KIs. VECs and KIs are chosen to represent common life history characteristics or similar responses to project effects and mitigation strategies. Table 6-1 lists the nine at risk species, identifies the species’ federal and provincial status, and cites for each species the section in the assessment where potential project effects are assessed.
6.2 Species Summary The bocaccio is a member of the rockfish family. All rockfish share similar life history traits and physiology, with variation in habitat preference and distribution (Love et al. 2002). Due to these biological similarities and because project related effects will be similar for all rockfish within the CCAA, rockfish is chosen as a KI and bocaccio are assessed with other members of the rockfish family in Section 10.
The eulachon is a small pelagic, anadromous fish, listed on the provincial blue list because of its limited range and long term declines. The eulachon is known to spawn in the Kitimat River and has been identified as a KI (see Section 10).
There are three toothed whale species at risk that are likely to occur in the marine PEAA. Harbour porpoise is the smallest of these species and the smallest cetacean in British Columbia. It is on Schedule 1 of the SARA, and is designated as special concern (COSEWIC 2003a). Two ecotypes of killer whale frequent the channels adjacent to the marine terminal: the Northern resident killer whales, which are salmon-hunting specialists, and the northeast Pacific transient killer whales, which specialize in hunting marine mammals. Both killer whale ecotypes are designated as threatened (COSEWIC 2001) and are on Schedule 1 of the SARA due to their low population size and reproductive rate.

Sec. 52 Application Volume 6B: Environmental and Socio-Economic Assessment (ESA) – Marine Terminal Section 6: Listed Species for the Marine Environment
Page 6-2 May 2010
Although they do not share similar diets, project environmental effects from routine activities at the terminal (acoustic disturbance and habitat alteration) are considered similar for all toothed whales in this region and Northern resident killer whales are representative of the three species at risk (see Section 11.6).
Three baleen whales known to frequent the North Coast are designated as species at risk under federal legislation. Of these, it is considered unlikely that either the fin whale (threatened) or the grey whale (special concern) will be present near the marine terminal (Gregr and Trites 2001; Lucas et al. 2007). As such, the humpback whale (threatened; COSEWIC 2003b) is chosen as the representative species for baleen whales (see Section 11.7). It is regularly observed in Douglas Channel and shares similar life history traits with the other federally listed baleen whales.
Steller sea lion is the only at-risk pinniped seen regularly near the marine terminal. Although they may commonly forage in Douglas Channel, its closest permanent haulout is a winter haulout on Ashdown Island. The Steller sea lion is designated as Special Concern (COSEWIC 2003c), and is on Schedule 1 of the SARA (see Section 11.8).
The Marbled Murrelet is a small seabird that nests in old growth forests and forages in coastal waters including those near the marine terminal. It was designated as threatened by COSEWIC in 2000 and is listed on Schedule 1 of the SARA (see Section 12.5).

Sec. 52 Application Volume 6B: Environmental and Socio-Economic Assessment (ESA) – Marine Terminal Section 6: Listed Species for the Marine Environment
May 2010 Page 6-3
Table 6-1 Federally or Provincially-Listed Marine Species Likely Occurring in the Marine PEAA
Common Name G Ranka
Federal British Columbia
ESA Section SARA
Schedule 1b COSEWIC
Statusc S Rankd Provincial
Statuse
Boccacio G4 - T - - Section 10.5 to 10.8 Marine Fish (Rockfish)
Eulachon G5 - - S2S3 B Section 10.5 to 10.8 Marine Fish (Eulachon)
Killer Whale-, Northern Resident Population
G4G5 T S3 B Section 11.6 Killer Whale
Killer Whale- Northeast Pacific Transient Population
G4G5 T S2 R Section 11.6 Killer Whale
Harbour Porpoise G4G5 SC S3 B Section 11.6 Killer Whale
Humpback Whale G3 T S3 B Section 11.7 Humpback Whale
Grey Whale (unlikely) G4 SC S3 B Section 11.7 Humpback Whale
Fin Whale (unlikely) G3G4 T S2N R Section 11.7 Humpback Whale
Steller Sea Lion G3 SC S2S3B, S3N B Section 11.8 Steller Sea Lion
Marbled Murrelet G3G4 T S2B, S4N R Section 12.5 Marbled Murrelet

Sec. 52 Application Volume 6B: Environmental and Socio-Economic Assessment (ESA) – Marine Terminal Section 6: Listed Species for the Marine Environment
Page 6-4 May 2010
Table 6-1 Federally or Provincially-Listed Marine Species Likely Occurring in the Marine PEAA (cont’d)
NOTES: = listed in SARA Schedule 1 a G Rank = global rank 1 = critically imperilled 2 = imperilled 3 = vulnerable to extirpation or extinction 4 = apparently secure 5 = demonstrably widespread, abundant, and secure. b Schedule 1 = Schedule 1 of SARA 2005 c COSEWIC Status E = endangered – facing imminent extirpation or extinction T = threatened – likely to become endangered if limiting factors are not reversed SC = special concern – may become threatened or endangered for a combination of reasons d S Rank = subnational rank. Modifiers used with the rankings are as follows:
B = indicates breeding status for a migratory species N = indicates non-breeding status for a migratory species S1 = Critically imperilled S2 = Imperilled S3 = Special Concern S4 = Apparently Secure S5 = Secure
e Provincial (British Columbia) Status ranks are as follows: R = red list – Extirpated or presumed extirpated (not reported for 20-40 years) species. Species legally designated as threatened or endangered under the
provincial Wildlife Act and all candidates for such designation (the majority of red-listed species). B = blue list – Species not immediately threatened but of concern because of characteristics that make them particularly sensitive to human activities or
natural events. Y = yellow list – All species not on the red or blue lists, but tracked by the CDC; they are not considered to be at risk.

Sec. 52 Application Volume 6B: Environmental and Socio-Economic Assessment (ESA) – Marine Terminal Section 6: Listed Species for the Marine Environment
May 2010 Page 6-5
6.3 References
6.3.1 Literature Cited Beckett, J. 2010. Marine Fish and Fish Habitat Technical Data Report. Prepared for Northern Gateway
Pipelines Inc. Calgary, AB.
Committee on the Status of Endangered Wildlife in Canada (COSEWIC). 2001. COSEWIC assessment and update status report on the killer whale Orcinus orca in Canada. Committee on the Status of Endangered Wildlife in Canada. Ottawa, ON. Canadian Wildlife Service, Environment Canada.
Committee on the Status of Endangered Wildlife in Canada (COSEWIC). 2003a. COSEWIC assessment and update status report on the harbour porpoise Phocoena phocoena (Pacific ocean population) in Canada. Committee on the Status of Endangered Wildlife in Canada. Ottawa, ON. Canadian Wildlife Service, Environment Canada.
Committee on the Status of Endangered Wildlife in Canada (COSEWIC). 2003b. COSEWIC assessment and update status report on the humpback whale Megaptera novaeangliae in Canada. Committee on the Status of Endangered Wildlife in Canada. Ottawa, ON. Canadian Wildlife Service, Environment Canada.
Committee on the Status of Endangered Wildlife in Canada (COSEWIC). 2003c. COSEWIC assessment and update status report on the Steller sea lion Eumetopias jubatus in Canada. Committee on the Status of Endangered Wildlife in Canada. Ottawa, ON.
d'Entremont, M. 2010. Marine Birds Technical Data Report. Prepared for Northern Gateway Pipelines Inc. Calgary, AB.
Gregr, E.J. and A.W. Trites. 2001. Predictions of critical habitat for five whale species in the waters of coastal British Columbia. Canadian Journal of Fisheries and Aquatic Sciences 58(7):1265–1285.
Love, M.S., M. Yoklavich and L. Thorsteinson. 2002. The Rockfishes of the Northeast Pacific. University of California Press. Berkley, CA.
Lucas, B.G., S. Verrin and R. Brown. 2007. Ecosystem overview: Pacific North Coast Integrated Management Area (PNCIMA). Canadian Technical Report of Fisheries and Aquatic Sciences 2667: xii.
Wheeler, B., A. Rambeau and K. Zottenberg. 2010. Marine Mammals Technical Data Report. Prepared for Northern Gateway Pipelines Inc. Calgary, AB.
6.3.2 Internet Sites Ramsay, L. 2003. Conservation Status Report: Thaleichthys pacificus (Eulachon). B.C. Conservation
Data Centre. B.C. Ministry of Environment. Available at: http://a100.gov.bc.ca/pub/eswp/esr.do?id=14828


Sec. 52 Application Volume 6B: Environmental and Socio-Economic Assessment (ESA) – Marine Terminal Section 7: Sediment and Water Quality
May 2010 Page 7-1
7 Sediment and Water Quality Marine sediment and water quality refers to the physical and chemical parameters of marine sediment and seawater, including salinity, temperature, dissolved oxygen, macro- and micro-nutrients and organic carbon, as well as inorganic and organic contaminants. Baseline data indicate some contamination of water, sediments, and benthic organisms from previous industrial activity in the project effects assessment area (PEAA), which encompasses the area from the head of Kitimat Arm to just east of Emsley Cove.
Potential environmental effects include altered suspended sediment levels and altered sediment and water chemistry primarily related to dredging. Only 400 m2 of the assessed area is expected to receive more than 1 cm of sediment deposition from dredging; therefore, sediment disturbance during dredging is not expected to increase the amount of contaminants dissolved in seawater by any measurable amount. Project design and project-specific mitigation measures will include deploying silt curtains to limit dispersion of silt, managing surface water runoff and confirming wastewater discharges, all of which are compliant with the Waste Management Act, Petroleum Storage and Distribution Facilities Storm Water Regulation, and the British Columbia Special Waste Regulation. After mitigation, the assessment concludes that the Project is not expected to cause a long-term decline in sediments and water quality and residual effects are expected to be not significant.
7.1 Setting for Sediment and Water Quality Water quality is important, because water is habitat for a large number of marine species near the Project. Sediment quality is important because sediment provides habitat for benthic aquatic organisms and contains contaminants that have accumulated in depositional areas from historic and current anthropogenic activities. Some of these contaminants enter the food web through bioaccumulation. Sediment and water quality are considered in assessments of changes in habitat quality for a number of marine valued environmental components (VECs).
The construction, operations and decommissioning of the Kitimat Terminal could result in changes in sediment and water quality. Specific issues include:
• suspended sediment levels • sediment and water chemistry
7.2 Scope of Assessment for Sediment and Water Quality
7.2.1 Key Project Issues for Sediment and Water Quality For a summary of the potential effects of the Project on marine sediment and water quality, see Table 7-1. The list of effects and issues was developed based on the scope of factors from the Joint Review Panel, federal and provincial regulatory requirements for assessment of environmental effects, and issues raised by the public, participating Aboriginal groups and public stakeholders.

Sec. 52 Application Volume 6B: Environmental and Socio-Economic Assessment (ESA) – Marine Terminal Section 7: Sediment and Water Quality
Page 7-2 May 2010
Construction and operations activities are included because of potential for disturbance of sediment or release of contaminants in discharges. Land-based construction activities are not assessed further, because the Erosion and Sediment Control Plan, the Water Quality and the Substrate Composition Monitoring Plan and the Storm Water Management Plan, as described in the Construction Environmental Protection and Management Plan (EPMP) (see Volume 7A), will limit entry of sediment and surface water into the marine environment during construction.
Decommissioning activities are not considered because changes to sediment or water are not anticipated during decommissioning. Infrastructure in the water (berthing structures) will be removed to the top of the substrate, so minimal disturbance to sediment is expected. The above-water pipework infrastructure will be removed after purging of any hydrocarbons, so no contaminants will be released into Kitimat Arm.
Table 7-1 Potential Environmental Effects on Sediment and Water Quality This table identifies the potential environmental effects on sediment and water quality that are assessed in this section of the ESA. Each of these environmental effects is discussed in more detail later in this section. Recommendations for mitigation and, if required, follow-up and monitoring are also provided. With the implementation of these mitigation measures where appropriate, the Project is not likely to cause significant adverse environmental effects on sediment and water quality.
Project Activities and Physical Works
Key Environmental Effects on Sediment and Water Quality Relevance to the Assessment
Considered in the ESA Kitimat Terminal
Construction Inwater infrastructure site preparation (dredging, blasting, pile drilling)
• Altered suspended sediment levels
• Altered sediment and water chemistry suspended sediment from dredging, blasting
Contamination from dredging, blasting, equipment leaks
Operations
Onshore infrastructure operations (associated site water runoff, waste water disposal, emissions)
• Altered suspended sediment levels
• Altered sediment and water chemistry suspended sediment from operations
Contamination from operations (e.g., minor spills)
Not Considered in the ESA Construction Inwater infrastructure construction (marine terminal, tanker berths, utility berth, foundation pile installation)
• Altered suspended sediment levels
• Altered sediment and water chemistry suspended sediment from marine terminal construction
Contamination from construction activities (e.g., minor spills) – minor disturbance and potential for minor spills, which are addressed in the Construction EPMP (Volume 7A)
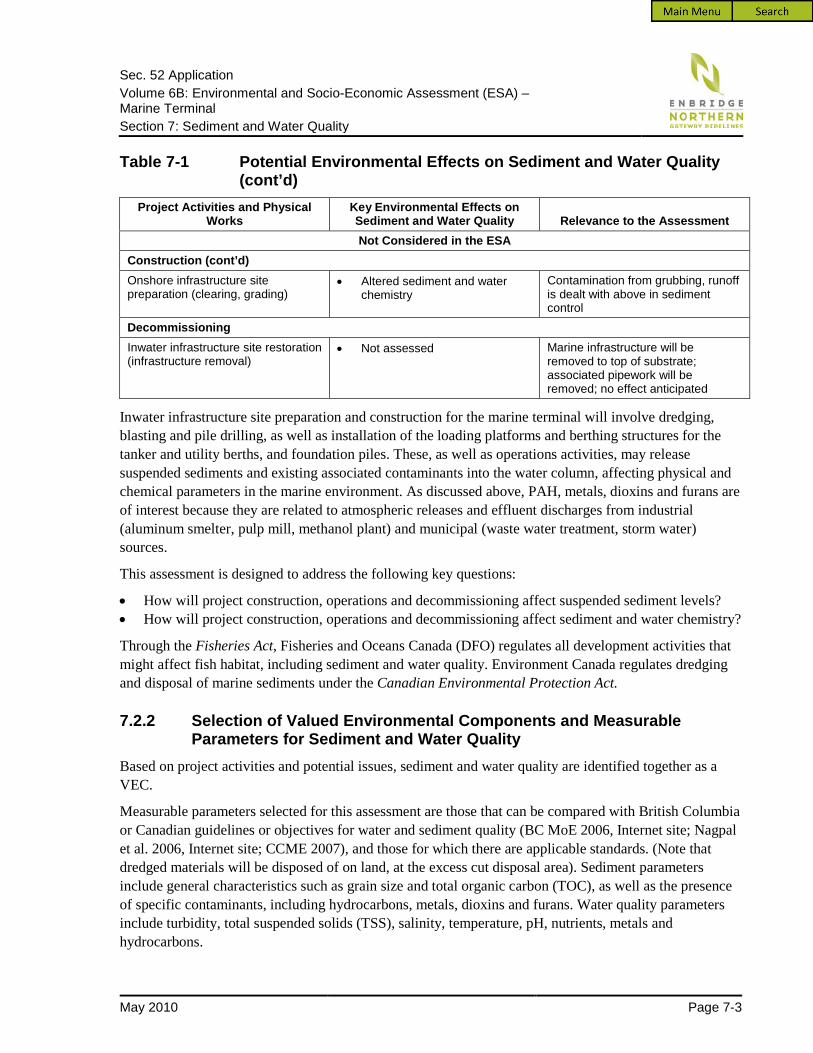
Sec. 52 Application Volume 6B: Environmental and Socio-Economic Assessment (ESA) – Marine Terminal Section 7: Sediment and Water Quality
May 2010 Page 7-3
Table 7-1 Potential Environmental Effects on Sediment and Water Quality (cont’d)
Project Activities and Physical Works
Key Environmental Effects on Sediment and Water Quality Relevance to the Assessment Not Considered in the ESA
Construction (cont’d) Onshore infrastructure site preparation (clearing, grading)
• Altered sediment and water chemistry
Contamination from grubbing, runoff is dealt with above in sediment control
Decommissioning Inwater infrastructure site restoration (infrastructure removal)
• Not assessed Marine infrastructure will be removed to top of substrate; associated pipework will be removed; no effect anticipated
Inwater infrastructure site preparation and construction for the marine terminal will involve dredging, blasting and pile drilling, as well as installation of the loading platforms and berthing structures for the tanker and utility berths, and foundation piles. These, as well as operations activities, may release suspended sediments and existing associated contaminants into the water column, affecting physical and chemical parameters in the marine environment. As discussed above, PAH, metals, dioxins and furans are of interest because they are related to atmospheric releases and effluent discharges from industrial (aluminum smelter, pulp mill, methanol plant) and municipal (waste water treatment, storm water) sources.
This assessment is designed to address the following key questions:
• How will project construction, operations and decommissioning affect suspended sediment levels? • How will project construction, operations and decommissioning affect sediment and water chemistry?
Through the Fisheries Act, Fisheries and Oceans Canada (DFO) regulates all development activities that might affect fish habitat, including sediment and water quality. Environment Canada regulates dredging and disposal of marine sediments under the Canadian Environmental Protection Act.
7.2.2 Selection of Valued Environmental Components and Measurable Parameters for Sediment and Water Quality
Based on project activities and potential issues, sediment and water quality are identified together as a VEC.
Measurable parameters selected for this assessment are those that can be compared with British Columbia or Canadian guidelines or objectives for water and sediment quality (BC MoE 2006, Internet site; Nagpal et al. 2006, Internet site; CCME 2007), and those for which there are applicable standards. (Note that dredged materials will be disposed of on land, at the excess cut disposal area). Sediment parameters include general characteristics such as grain size and total organic carbon (TOC), as well as the presence of specific contaminants, including hydrocarbons, metals, dioxins and furans. Water quality parameters include turbidity, total suspended solids (TSS), salinity, temperature, pH, nutrients, metals and hydrocarbons.

Sec. 52 Application Volume 6B: Environmental and Socio-Economic Assessment (ESA) – Marine Terminal Section 7: Sediment and Water Quality
Page 7-4 May 2010
7.2.3 Spatial Boundaries for Sediment and Water Quality The effects of the Project on sediment and water quality are assessed for the Project development area (PDA), the project effects assessment area (PEAA) and the regional effects assessment area (REAA).
The PDA (see Figure 7-1) includes the cleared and disturbed area of the Kitimat Terminal and the restricted zones around it.
The PEAA (see Figure 7-1) includes all areas where project works and activities have the potential to affect sediment or water quality. The PEAA encompasses the area from the head of Kitimat Arm to just east of Emsley Cove.
The REAA is the area within which cumulative environmental effects (i.e., potential effects of the marine terminal and other projects in the area) are likely to occur, depending on movement and circulation of water and the type and location of other past, present or reasonably foreseeable projects or activities around the terminal.
7.2.4 Temporal Boundaries for Sediment and Water Quality The temporal boundaries for this assessment are the construction and operations phases. As noted earlier, no further changes in sediment and water quality are anticipated during decommissioning.
7.2.5 Guidelines and Objectives for Sediment and Water Quality British Columbia and Canada have established guidelines and objectives for sediment and water quality, including:
• Canadian Council of Ministers of Environment (CCME) Interim Sediment Quality Guidelines (ISQG) (CCME 2007)
• British Columbia Water Quality Guidelines (BC MoE 2006, Internet site; Nagpal et al. 2006, Internet site)

100
m
200 m
100
m
100 m
200 m
100
m
300 m
200
m
100
m
Kitimat
Minette Bay
KitamaatVillage
KitimatTerminal
K i t i
m a
t A
r m
BishCove
EmsleyCove
EmsleyPoint
CostePoint
CosteIsland
ClioBay
GobeilBay
Kitimat River
CreekBish
200 m
100
m
Pipeline Route
Security Fence
Terrestrial PDA
Marine PDA
Marine PEAA
Bathymetric Contour (100 m)
Railway
Road
SS
Jacques Whitford AXYS Ltd.
FIGURE NUMBER:
PROJECTION:
CONTRACTOR: DATE:
AUTHOR: APPROVED BY:PREPARED FOR:PREPARED BY: SCALE:
PEAA for Sediment and Water Quality
ENB R ID GE N OR TH ER N GA TEW A Y PR OJ EC T 7-1
NAD 83DATUM:
1:110,000
UTM 9
CM
0 1 2 3
Kilometres
JWA-1048334-1588
REFERENCES: NTDB Topographic Mapsheets provided by the Majesty the Queen in Right of Canada, Department of Natural Resources. All rights reserved.
20090911
R:\2
009F
isca
l\104
8334
_Nor
ther
nGat
eway
_ES
A_2
009Reference: Pipeline Route R

Sec. 52 Application Volume 6B: Environmental and Socio-Economic Assessment (ESA) – Marine Terminal Section 7: Sediment and Water Quality
Page 7-6 May 2010
7.2.6 Definition of Environmental Effect Attributes for Sediment and Water Quality
Effects on sediment and water quality are characterized using standardized evaluation criteria for assessing environmental effects, as defined below.
Direction
• positive: an improvement in parameter concentrations relative to applicable sediment or water quality guidelines
• adverse: a deterioration in parameter concentrations relative to applicable guidelines
Magnitude
• negligible: no or slight increase in concentration above baseline (within the range of natural variability)
• low: predicted concentrations are below quality guidelines (i.e., Canadian Council of Ministers of Environment [CCME] Interim Sediment Quality Guidelines [ISQG] for sediment, CCME water quality guidelines)
• moderate: predicted concentrations exceed sediment guidelines (e.g., higher than CCME ISQG and lower than CCME Probable Effects Levels [PEL] for sediment, or more than 10% above baseline if currently exceed guideline1
• high: predicted concentrations are higher than CCME PEL for sediment or similar screening criteria (e.g., five times higher than water quality guidelines), resulting in acute effects on sensitive species
) and water quality guidelines, resulting in chronic sublethal effects on sensitive species
Geographic Extent
• site specific: PDA • local: 3 km from the marine PDA, within Kitimat Arm • regional: Most of or the entire PEAA
Duration
• short term: effects lasting for minutes or hours • medium term: effects lasting for one day to one week • long term: effects lasting longer than one week • permanent: effects persisting indefinitely
1 A range up to 10% above baseline levels will be considered within natural variability (e.g., within 95% confidence interval of the mean).
Sec. 52 Application Volume 6B: Environmental and Socio-Economic Assessment (ESA) – Marine Terminal Section 7: Sediment and Water Quality
May 2010 Page 7-7
Frequency
• occasional: occurs once or twice over the life of the Project
• sporadic: occurs at irregular intervals, once or twice a year
• regular: occurs with a degree of periodicity in response to events that can be identified or forecast (e.g., seasonal weather events or specific activities such as loading or unloading)
• continuous: occurs weekly or daily through the life of the Project
Reversibility
• reversible: quickly returning to baseline conditions after the event
• irreversible: not returning to baseline conditions after the event, or returning to baseline conditions only after an extended period of time (e.g., one year or longer)
7.2.7 Determination of Significance for Sediment and Water Quality An environmental effect is considered to be significant if the measured parameter (e.g., total suspended solids [TSS]) occurs at increased concentrations that exceed guidelines for longer than one day. In the case where baseline conditions currently exceed guidelines, a predicted effect is considered to be significant if the increase over baseline is more than 10%.
7.3 General Mitigation Measures for Sediment and Water Quality Northern Gateway Pipelines Limited Partnership (Northern Gateway) will implement mitigation measures based on project-specific procedures to maintain water and sediment quality within applicable guidelines to protect marine life. Project design measures that will help to prevent or reduce project effects on sediment and water quality include:
• strategically situating the Kitimat Terminal to reduce the amount of dredging and potential sediment disturbance during construction
• treating surface water runoff from the tank and manifold areas by directing it to, and storing it in, the impoundment reservoir. Excess surface water runoff from the impoundment reservoir will be released into the marine environment through a subtidal, perforated pipe. Before being released to the marine environment, excess water from the impoundment reservoir will be tested to confirm that the concentration of oil is less than 15 parts per million. Surface water runoff from the area outside the tank and manifold areas will be controlled so that this water will be released outside the boomed zone of the berths to the extent practical.
The following practices will be implemented:
• for wastewater discharges from the Kitimat Terminal, adherence to standards set under the Waste Management Act, Petroleum Storage and Distribution Facilities Storm Water Regulation, and the British Columbia Special Waste Regulation

Sec. 52 Application Volume 6B: Environmental and Socio-Economic Assessment (ESA) – Marine Terminal Section 7: Sediment and Water Quality
Page 7-8 May 2010
• use of appropriate erosion and runoff controls on land during construction and operations to limit release of sediment to near-shore waters around the terminal (includes use of silt fences and sediment settlement ponds if appropriate)
• use of a dredging system to limit sediment effects, as appropriate (clamshell dredge currently proposed)
• use of a silt curtain, where practical, during dredging and blasting, to reduce the dispersion and duration of suspended sediments, and loadings, on existing substrates
• disposal of dredged materials on land
7.4 Assessment Methods for Sediment and Water Quality
7.4.1 Data Sources and Fieldwork Studies of Kitimat Arm have been conducted periodically since the 1960s, including oceanographic surveys and studies related to industrial activities (see Section 7.1). Water quality objectives for the Kitimat River and Kitimat Arm were set by the British Columbia Ministry of Environment (BC MoE 1987, Internet site).
A field program was carried out in February 2006 to augment historic baseline data for the area. Sediment and benthic water samples were collected in and adjacent to the PDA using defined protocols and a quality assurance and quality control program designed to produce high-quality data (i.e., sample handling, cleaning techniques, and suitable hold times for analysis). Methods are discussed in the Marine Fish and Fish Habitat Technical Data Report (TDR) (Beckett and Munro 2010). Samples were analyzed by an accredited analytical laboratory (ALS Environmental, Vancouver, British Columbia). For the sampling locations, see Figure 7-2. The Ecological Risk Assessment used results of the 2006 sampling program and did additional sampling in 2008 at two locations; one north and the other south of the PDA (see Section 14). However, results discussed below do not include data from 2008.
7.4.2 Analytical Techniques Standard dispersion modelling was used to predict the quantity and dispersion patterns of suspended sediment resulting from dredging. Effects of the Project on sediment and water quality were assessed qualitatively by documenting baseline conditions and identifying sources and amounts of contaminants that could be released during project construction and operations. Analytical techniques were determined by criteria defined in the Disposal at Sea Regulations (Environment Canada 2008, Internet site), as well as the laboratory responsible for the chemical analysis. These methods were used because, at the time the field program was developed, disposal at sea of dredged materials was being considered. The methods are also scientifically rigorous, with quality assurance and quality control measures built in and low detection limits, making the data useable for assessing sediment quality in general.

BishCove
EmsleyPoint
KitamaatVillage
KitimatTerminal
Pipeline Route
Security Fence
Terrestrial PDA
Marine PDA
Sediment and Water Sampling Locations
Bathymetric Contour (100 m)
Railway
RoadClio Bay
SS
Jacques Whitford AXYS Ltd.
FIGURE NUMBER:
PROJECTION:
CONTRACTOR: DATE:
AUTHOR: APPROVED BY:PREPARED FOR:PREPARED BY: SCALE:
ENB R ID GE N OR TH ER N GA TEW A Y PR OJ EC T
NAD 83DATUM:
1:60,000
UTM 9
CM
To K
itim
at
K i t i
m a
t A
r m
7-2
Bish Creek
Sediment and Water Quality Sampling Locations
SWQ-06-04
SWQ-06-08SWQ-06-12SWQ-06-03
SWQ-06-11SWQ-06-02
SWQ-06-01SWQ-06-06
SWQ-06-05SWQ-06-07
SWQ-06-10
SWQ-06-09
0 0.5 1 1.5
Kilometres
JWA-1048334-1589
REFERENCES: NTDB Topographic Mapsheets provided by the Majesty the Queen in Right of Canada, Department of Natural Resources. All rights reserved.
20090922
R:\2
009F
isca
l\104
8334
_Nor
ther
nGat
eway
_ES
A_2
009Reference: Pipeline Route R

Sec. 52 Application Volume 6B: Environmental and Socio-Economic Assessment (ESA) – Marine Terminal Section 7: Sediment and Water Quality
Page 7-10 May 2010
Samples were collected for sediment, benthic water and toxicity assessments at eight locations near the marine terminal (SWQ-06-01 through SWQ-06-07, and SWQ-06-12) and two in reference areas (SWQ-06-09 and SWQ-06-10) on the east shore of Kitimat Arm (see Figure 7-2). Samples from two additional locations near the marine terminal (SWQ-06-08 and SWQ-06-11) were analyzed for salinity, pH, ammonia and sulphide only. Sampling depths varied from 30 to 100 m.
Sediment samples were analyzed for total metals, acid volatile sulphide and simultaneously extracted metals (AVS/SEM), benzene, toluene, ethylbenzene and xylene (BTEX), PAH, PCBs, dioxins and furans, pore water ammonia and sulphide. BTEX, dioxins and furans were not analyzed in reference samples.
Benthic water samples (supernatant water in the benthic sediment grabs) were collected to provide additional information about conditions at the sediment-water interface for toxicity testing. Samples were analyzed for metals, nutrients, polycyclic aromatic hydrocarbons, sulphide and ammonia.
Toxicity of sediment to benthic invertebrates was assessed using standard bioassay protocols. A 10-day marine amphipod (Eohaustorius estuarius) survival test and a 20-day polychaete (Neanthes arenaceodentata) survival and growth test were done by Cantest Ltd. (formerly Vizon Scitec, Vancouver, British Columbia). These methods and results are discussed in the Ecological Risk Assessment (see Section 14).
7.5 Effects on Suspended Sediment Levels Dredging during construction will occur at a time agreed upon in consultation with DFO. Dredging has the potential to release a plume of sediment (and contaminants) to the water column. Elevated levels of suspended solids (measured as TSS or turbidity) can have an adverse effect on some marine species.
Standard sediment models and sediment composition data were used to predict TSS levels and plume distribution resulting from dredging (Fissel et al. 2006).
7.5.1 Baseline Conditions The main source of suspended sediment in Kitimat Arm is glacial flour in runoff from rivers in the area. The District of Kitimat sewage treatment plant, Rio Tinto Alcan Primary Metal BC aluminum smelter, Eurocan Pulp and Paper Co. plant, and the Methanex Corporation plant and terminal also contribute to TSS loading in Kitimat Arm (Warrington 1987, 1993, as cited in Norecol Dames & Moore Inc. 1997). Biological production (zooplankton and phytoplankton) and atmospheric fallout also contribute TSS. Coarse particles (greater than 125 microns [µm]) fall out within minutes of reaching the sea. Finer sediment settles from the upper layer for about five days (MacDonald 1983).
TSS levels are highest during peak river runoff (May to July, October) and lowest during winter.
For this assessment, TSS concentrations during winter and early spring are discussed because this is when dredging may occur because it is the least biologically sensitive time of year (e.g., no spawning salmon or juveniles passing through the area). However, the specific work windows will be determined in consultation with DFO.
At nearby Bish Cove, TSS concentrations averaged 18 mg/L during winter, when contributions of TSS from the rivers of Kitimat Arm are at their lowest (Jacques Whitford 2005).

Sec. 52 Application Volume 6B: Environmental and Socio-Economic Assessment (ESA) – Marine Terminal Section 7: Sediment and Water Quality
May 2010 Page 7-11
Surficial sediments are continually in flux and are exchanged with sediments from other nearby areas (Harris 1999). Harris (1999) estimated a sediment burial rate of 0.61 cm/y for Kitimat Arm, with 58% generated by resuspension.
7.5.2 Effects on Suspended Sediment Levels
7.5.2.1 Effect Mechanisms
Construction Shoreline and submarine construction may result in increased TSS in the water column. Approximately 1.5 m of sediment overburden covering the rock slope at the marine terminal will be removed before blasting, which totals approximately 30,000 m3 of dredged material. Both the overburden from dredging, and the waste rock from blasting will be disposed of on land, at the excess cut disposal area, to the extent practical.
Blasting and dredging for placement of four berthing and six mooring structures for each of the tanker berths will occur mainly between the 10- and 32-m contours. Dredging will remove the top 1.5 m of substrate. Blasting will then be used to create a stepped platform or allow pile seating for installation of the berth infrastructure. These combined activities, including preparation time, will occur over approximately 18 weeks. Dredging at the tanker berths, using clamshell buckets that are closed as they rise through the water column, will take approximately eight to nine weeks. Blasting will require approximately three weeks.
No dredging is planned for the utility berth. The current design for this berth is a floating structure, secured in place with vertical guide piles, and with an articulating access ramp to a shore-based abutment.
Silt curtains will be used where appropriate, to control siltation during blasting and dredging. During dredging, it is estimated that approximately 0.5% of the material from each grab will escape from the clamshell near the bottom and another 0.5% will be lost as the bucket is moved to the surface. This will result in increased TSS levels in water.
Operations
Sediment disturbance during berthing of project-related vessels is not assessed. Because of the depth of water at the berth, propeller wash from large vessels or harbour tugs will not influence the bottom substrate.
Water discharges (site runoff) from the Kitimat Terminal will comply with standards established under the Waste Management Act, Petroleum Storage and Distribution Facilities Storm Water Regulation, and the Special Waste Regulation. Because discharged water will comply with the regulations, it is not expected to exceed guideline levels for turbidity or TSS. There are separate guidelines for turbidity and TSS because they are not necessarily directly related to each other (e.g., a sample with an exceedance for turbidity may meet the TSS guideline if the sample consists mainly of fine silt). The turbidity guideline is maximum induced increase of 8 nephelometric turbidity units (NTU) when background turbidity is up to
Sec. 52 Application Volume 6B: Environmental and Socio-Economic Assessment (ESA) – Marine Terminal Section 7: Sediment and Water Quality
Page 7-12 May 2010
80 NTU, The TSS guideline is maximum induced increase of 25 mg/L for ambient TSS levels up to 250 mg/L. These levels are within natural variability observed for Kitimat Arm.
Decommissioning At decommissioning, all above-water infrastructure will be removed and the inwater infrastructure will be removed to the top of the substrate. It is expected that these activities will only result in minor disruptions to marine habitats (i.e., highly site-specific, short term and reversible within hours to days). As a result, changes in sediment and water quality during decommissioning are not considered further.
7.5.2.2 Mitigation and Effects Management
The Project incorporates many design elements and environmental protection measures (see Section 7.3). Those most applicable to suspended sediment levels are summarized here:
• Appropriate erosion and runoff controls will be placed on land during construction and operations to reduce the concentration and duration of TSS and turbidity in nearshore waters around the marine terminal.
• A silt curtain will be used, where practical, during dredging and blasting to reduce the dispersion and duration of suspended sediments, and loadings, on existing substrates.
7.5.2.3 Residual Effects
As noted earlier, baseline levels of TSS in the surface waters during winter were measured at 18 mg/L in nearby Bish Cove (Jacques Whitford 2005). Levels are lower (up to 2.5 mg/L) in the deeper water (Fissel et al. 2006).
The plume of increased TSS was modelled during winter, when dredging is likely to occur. The model was used to predict concentrations 80 hours (3 and 1/3 days) after dredging is completed and seven days after dredging is completed (Fissel et al. 2006). See Figures 7-3 through 7-7 for the 80-hour modelling results for a variety of depths (0 to 2 m, 10 to 13 m, 16 to 20 m, 50 to 70 m and 140 to 180 m). Presented in these figures is the increase in TSS above ambient conditions. The results also apply during the spring, until freshet, when runoff from area streams would introduce additional sediment and influence the water circulation patterns in Kitimat Arm.
The modelled concentrations for TSS during dredging were compared with water quality guidelines for protection of aquatic life (BC MoE 2006, Internet site), which for TSS is an increase of no more than 25 mg/L when ambient levels are less than 250 mg/L (maximum induced TSS). Small increases in TSS are predicted in and away from the PDA. There are no circumstances modelled where the increase in TSS is near or above the guideline (coloured red, above 25 mg/L). Increases of 0.5 mg/L or less would be difficult to detect analytically.

200 m
100
m
100 m
200 m
100
m
300 m
200
m
100
m
Kitimat
Minette Bay
KitamaatVillage
KitimatTerminal
K i t i
m a
t A
r m
BishCove
EmsleyCove
EmsleyPoint
CostePoint
CosteIsland
ClioBay
GobeilBay
Kitimat River
CreekBish
200 m
100
m
SS
Jacques Whitford AXYS Ltd.
FIGURE NUMBER:
PROJECTION:
CONTRACTOR: DATE:
AUTHOR: APPROVED BY:PREPARED FOR:PREPARED BY: SCALE:
Modelling Results for Increase in Total Suspended Solids: 80 hours after Dredging is Completed at 0 to 2 m Depth
ENB R ID GE N OR TH ER N GA T EW A Y P RO J EC T 7-3
NAD 83DATUM:
1:110,000
UTM 9
CM
Inset1:50,000
0 1 2 3
Kilometres
Reference: Pipeline Route R
JWA-1048334-1590
REFERENCES: NTDB Topographic Mapsheets provided by the Majesty the Queen in Right of Canada, Department of Natural Resources. All rights reserved.
Total Suspended Solids(mg/L) Above Baseline
25
10
5
2.5
1
0.5
0.25
0.1
0.05
0
20090911
R:\2
009F
isca
l\104
8334
_Nor
ther
nGat
eway
_ES
A_2
009
KitimatTerminal
Railway
Road
Bathymetric Contour (100 m)
Pipeline Route
Security Fence
Terrestrial PDA
Marine PDA

200 m
100
m
100 m
200 m
100
m
300 m
200
m
100
m
Kitimat
Minette Bay
KitamaatVillage
KitimatTerminal
K i t i
m a
t A
r m
BishCove
EmsleyCove
EmsleyPoint
CostePoint
CosteIsland
ClioBay
GobeilBay
Kitimat River
CreekBish
200 m
SS
Jacques Whitford AXYS Ltd.
FIGURE NUMBER:
PROJECTION:
CONTRACTOR: DATE:
AUTHOR: APPROVED BY:PREPARED FOR:PREPARED BY: SCALE:
ENB R ID GE N OR TH ER N GA T EW A Y P RO J EC T 7-4
NAD 83DATUM:
1:110,000
UTM 9
CMModelling Results for Increase in Total Suspended Solids: 80 hours after Dredging is Completed at 10 to 13 m Depth
Inset1:50,000
0 1 2 3
Kilometres
Reference: Pipeline Route R
JWA-1048334-1591
REFERENCES: NTDB Topographic Mapsheets provided by the Majesty the Queen in Right of Canada, Department of Natural Resources. All rights reserved.
Total Suspended Solids(mg/L) Above Baseline
25
10
5
2.5
1
0.5
0.25
0.1
0.05
0
20090911
R:\2
009F
isca
l\104
8334
_Nor
ther
nGat
eway
_ES
A_2
009
KitimatTerminal
Railway
Road
Bathymetric Contour (100 m)
Pipeline Route
Security Fence
Terrestrial PDA
Marine PDA

200 m
100
m
100 m
200 m
100
m
300 m
200
m
100
m
Kitimat
Minette Bay
KitamaatVillage
KitimatTerminal
K i t i
m a
t A
r m
BishCove
EmsleyCove
EmsleyPoint
CostePoint
CosteIsland
ClioBay
GobeilBay
Kitimat River
CreekBish
200 m
100
m
SS
Jacques Whitford AXYS Ltd.
FIGURE NUMBER:
PROJECTION:
CONTRACTOR: DATE:
AUTHOR: APPROVED BY:PREPARED FOR:PREPARED BY: SCALE:
ENB R ID GE N OR TH ER N GA T EW A Y P RO J EC T 7-5
NAD 83DATUM:
1:110,000
UTM 9
CMModelling Results for Increase in Total Suspended Solids: 80 hours after Dredging is Completed at 16 to 20 m Depth
Inset1:50,000
0 1 2 3
Kilometres
Reference: Pipeline Route R
JWA-1048334-1592
REFERENCES: NTDB Topographic Mapsheets provided by the Majesty the Queen in Right of Canada, Department of Natural Resources. All rights reserved.
Total Suspended Solids(mg/L) Above Baseline
25
10
5
2.5
1
0.5
0.25
0.1
0.05
0
20090911
R:\2
009F
isca
l\104
8334
_Nor
ther
nGat
eway
_ES
A_2
009
KitimatTerminal
Railway
Road
Bathymetric Contour (100 m)
Pipeline Route
Security Fence
Terrestrial PDA
Marine PDA

200 m
100
m
100 m
200 m
100
m
300 m
200
m
100
m
Kitimat
Minette Bay
KitamaatVillage
KitimatTerminal
K i t i
m a
t A
r m
BishCove
EmsleyCove
EmsleyPoint
CostePoint
CosteIsland
ClioBay
GobeilBay
Kitimat River
CreekBish
200 m
100
m
SS
Jacques Whitford AXYS Ltd.
FIGURE NUMBER:
PROJECTION:
CONTRACTOR: DATE:
AUTHOR: APPROVED BY:PREPARED FOR:PREPARED BY: SCALE:
ENB R ID GE N OR TH ER N GA T EW A Y P RO J EC T 7-6
NAD 83DATUM:
1:110,000
UTM 9
CMModelling Results for Increase in Total Suspended Solids: 80 hours after Dredging is Completed at 50 to 70 m Depth
Inset1:50,000
0 1 2 3
Kilometres
Reference: Pipeline Route R
JWA-1048334-1593
REFERENCES: NTDB Topographic Mapsheets provided by the Majesty the Queen in Right of Canada, Department of Natural Resources. All rights reserved.
Total Suspended Solids(mg/L) Above Baseline
25
10
5
2.5
1
0.5
0.25
0.1
0.05
0R
:\200
9Fis
cal\1
0483
34_N
orth
ernG
atew
ay_E
SA
_200
9
20090911
KitimatTerminal
Railway
Road
Bathymetric Contour (100 m)
Pipeline Route
Security Fence
Terrestrial PDA
Marine PDA

200 m
100
m
100 m
200 m
100
m
300 m
200
m
100
m
Kitimat
Minette Bay
KitamaatVillage
KitimatTerminal
K i t i
m a
t A
r m
BishCove
EmsleyCove
EmsleyPoint
CostePoint
CosteIsland
ClioBay
GobeilBay
Kitimat River
CreekBish
200 m
100
m
SS
Jacques Whitford AXYS Ltd.
FIGURE NUMBER:
PROJECTION:
CONTRACTOR: DATE:
AUTHOR: APPROVED BY:PREPARED FOR:PREPARED BY: SCALE:
ENB R ID GE N OR TH ER N GA T EW A Y P RO J EC T 7-7
NAD 83DATUM:
1:110,000
UTM 9
CMModelling Results for Increase in Total Suspended Solids: 80 hours after Dredging is Completed at 140 to 180 m Depth
Inset1:50,000
0 1 2 3
Kilometres
Reference: Pipeline Route R
JWA-1048334-1594
REFERENCES: NTDB Topographic Mapsheets provided by the Majesty the Queen in Right of Canada, Department of Natural Resources. All rights reserved.
Total Suspended Solids(mg/L) Above Baseline
25
10
5
2.5
1
0.5
0.25
0.1
0.05
0
R:\2
009F
isca
l\104
8334
_Nor
ther
nGat
eway
_ES
A_2
009
20090911
KitimatTerminal
Railway
Road
Bathymetric Contour (100 m)
Pipeline Route
Security Fence
Terrestrial PDA
Marine PDA
Sec. 52 Application Volume 6B: Environmental and Socio-Economic Assessment (ESA) – Marine Terminal Section 7: Sediment and Water Quality
Page 7-18 May 2010
TSS is predicted to decrease with distance from the dredging activity, although clay particles may be carried for several kilometres before they settle out. The plume, to the north along the coast, would extend up to 3 km, but at levels difficult to distinguish from background levels. The TSS models predict the following increases above ambient levels (18 mg/L for surface water):
• less than 0.5 mg/L increase at the surface, except adjacent to active dredging, where TSS levels at the surface will be up to 2.7 mg/L higher
• 0.05 to 1.0 mg/L increase at 2 m to 20 m depth (likely not detectable), except within 200 m of active dredging, where TSS levels at these depths will increase by less than 2.5 mg/L, with the plume extending northeast of the dredge area
• less than 0.25 to 2.5 mg/L increase at 50 to 70 m and 140 to 180 m depths, near the dredge site (at and just beyond the PDA), as fine silt and clay particles slowly descend to the bottom
Modelling results seven days after dredging, for 0 to 20 m, were slightly lower and showed an approximate balance between addition of sediment from dredging and losses due to dilution and deposition (results presented in Fissel et al. 2006). Results for deeper water (50 to 70 m) were slightly higher for seven days after dredging compared to concentrations 80 hours after dredging is completed, with a peak value of 3.3 mg/L above baseline, due to settling of silts and clays, which take several days to settle to the bottom at depths of 100 m. These levels are still well below water quality guidelines. Because results for seven days represent an equilibrium condition, they can be assumed to apply for extended periods of dredging.
Effects of TSS on sediment quality can be measured by the amount of deposition on surface substrates. The area expected to receive more than 1 cm of disturbed sediment has been modelled as 400 m2, with a conservative estimate of up to 1,600 m2 (Fissel et al. 2006). The small area in which deposition will occur reduces any adverse effects. The dredged material will have a particle size similar to that of naturally occurring surface substrates in the area, which are predominantly silt and clay, and newly settled material following dredging will be similar in size.
Also, small amounts of material may be suspended near the bottom during drilling of seabed pile supports and blasting. Based on the preliminary engineering design, total rock blasting (cut) quantities for the berth structures will be approximately 25,000 m3 (10,000 m3 for the berth structures and 15,000 m3 for navigational clearance). The use of accepted construction practices (e.g., blasting mats, silt curtains) will limit the level of suspended sediment.
For a summary of the predicted residual effects of changes in TSS levels, see Table 7-2. Changes in TSS and turbidity may occur during dredging, with subsequent resettlement in the PDA, but these will be negligible or low in magnitude. The frequency and duration of disturbance may range from hours to over a week. The geographic extent is local, the magnitude of disturbance is low and the environmental effects are reversible.
Modelling of TSS levels shows a sediment plume may develop to the northeast of the dredge area; however, changes in TSS levels are predicted to be within water quality guidelines and difficult to distinguish from baseline conditions. Therefore, the expected environmental effect is expected to be not significant.

Sec. 52 Application Volume 6B: Environmental and Socio-Economic Assessment (ESA) – Marine Terminal Section 7: Sediment and Water Quality
May 2010 Page 7-19
Table 7-2 Characterization of the Residual Effects of Effects on Suspended Sediment Levels
Activity Direction
Additional Proposed Mitigation/Compensation
Measures1–6
Residual Environmental Effect
Magnitude
Geographic Extent
Duration/
Frequency
Reversibility
Significance
Potential Measurable Contribution to Regional
Cumulative Environmental Effects
Construction Inwater infrastructure site preparation
A • Dredge technology1 • Silt curtains2 • Spill Contingency Plan3 • Spill and leak prevention4
L L M/O R N N
Operations Onshore infrastructure operations and associated site water runoff
A • Discharge away from the marine terminal5
• Discharge to meet TSS guideline6
L L S/R R N N
Mitigation: 1. Dredge technology: Use of a dredging system to limit sediment effects, where practical (see Construction EPMP, Volume 7A,). 2. Silt curtains: Use of silt curtains, where practical, to limit dispersion of silt during dredging and blasting (see Construction EPMP, Volume 7A). 3. Spill Contingency Plan: The Spill Contingency Plan outlines mitigation measures to prevent and limit effects of a spill in the marine terminal area. See the
Construction EPMP (Volume 7A). 4. Spill and leak prevention: The Construction EPMP (Volume 7A) describes the protection plans that will be implemented during construction activities. 5. Discharge away from marine terminal: Positioning site water discharge away from the boomed zone of the marine terminal (see Section 2.3). 6. Discharge to meet TSS guideline (see Section 7.2).
Follow-up and Monitoring: Water Quality and Substrate Composition Monitoring Plan: The Water Quality and Substrate Composition Monitoring Plan includes monitoring of the sediment plume in the marine environment during blasting and dredging.

Sec. 52 Application Volume 6B: Environmental and Socio-Economic Assessment (ESA) – Marine Terminal Section 7: Sediment and Water Quality
Page 7-20 May 2010
Table 7-2 Characterization of the Residual Effect of Altered Suspended Sediment Levels (cont’d) KEY Direction: P Positive: an improvement in parameter
concentrations relative to applicable sediment or water quality guidelines.
A Adverse: A deterioration in parameter. concentrations relative to applicable guidelines
No No effect.
Magnitude: N Negligible: no or slight increase in concentration
above baseline. L Low: predicted concentrations are below quality
guidelines (i.e., CCME ISQG for sediment, CCME water quality guidelines).
M Moderate: predicted concentrations exceed sediment guidelines (e.g., higher than CCME ISQG and lower than CCME PEL for sediment, or more than 10% above baseline if currently exceed guideline) and water quality guidelines, resulting in chronic sublethal effects on sensitive species.
H High: predicted concentrations are higher than CCME PEL for sediment or similar screening criteria (e.g., five times higher than water quality guidelines), resulting in acute effects on sensitive species.
Geographic Extent: S Site specific: the project
development area (PDA). L Local: 3 km from the marine
PDA, within Kitimat Arm. R Regional: most of or the entire
PEAA.
Duration: S Short term: lasting for minutes
or hours. M Medium term: lasting for one
day to one week. L Long term: lasting longer than
one week. P Permanent: persisting
indefinitely.
Frequency: O Occasional: occurs once or
twice over the life of the Project.
S Sporadic: occurs at irregular intervals, once or twice a year.
R Regular: occurs with a degree of periodicity in response to events that can be identified or forecast.
C Continuous: occurs weekly or daily through the life of the Project.
Reversibility: R Reversible: quickly
returning to baseline conditions after the event.
I Irreversible: not returning to baseline, or returning to baseline only after an extended period (e.g., one year or longer).
Significance: S Significant. N Not Significant.
Potential Contribution to Regional Cumulative Effects: Y Yes. N No.

Sec. 52 Application Volume 6B: Environmental and Socio-Economic Assessment (ESA) – Marine Terminal Section 7: Sediment and Water Quality
May 2010 Page 7-21
Because terminal operations will follow applicable regulations for discharge of runoff and waste water, no important changes in TSS levels are expected during routine operations. The effect of terminal operations on water and sediment quality is considered to be not significant.
The potential effects of suspended sediment and sedimentation on sediment and water quality during decommissioning are considered to be not significant.
7.5.3 Cumulative Effects Implications Several existing industrial and commercial activities occur in the Kitimat area, and several are in the planning phase. The potential for cumulative effects on TSS levels considered the small and short-term change in water quality that could arise mainly during construction dredging, which could interact with other projects with similar activities and potential environmental effects.
Although small changes in suspended sediment levels might occur because of the Project, they would be associated mainly with the dredging and blasting activities during the construction phase. While these short-term activities might overlap with similar environmental effects from existing and proposed activities in the region, cumulative changes in suspended sediment levels are expected to be not significant, because there is limited potential for overlap between effects from various projects. Sediment levels from these projects are also likely to be within the range of suspended sediment from natural sources. Operational discharges will comply with all federal and provincial standards. As no substantial changes in suspended sediment levels are expected, cumulative effects of the Project with other activities were not considered further.
7.5.4 Prediction Confidence There is a high level of certainty for the not-significant prediction for project residual effects and project contribution to cumulative effects on ambient TSS levels. The existing levels of suspended sediment and turbidity in the PDA have been quantified. The potential TSS levels have been modelled for magnitude and extent, and the change is predicted to be small and difficult to distinguish from ambient conditions.
The baseline data used for the assessment of suspended sediment on water and sediment quality were grain size analysis of the substrates within the PDA, obtained using standard sediment sample collection methods and analysis of grain size by a certified analytical laboratory. The quality of these data is considered high.
Baseline TSS data for the dredge period were collected on only one date, but can be considered typical of ambient conditions, given the distance of the sampling location (Bish Cove) from the municipality of Kitimat, where most of the TSS sources and major river sources are. The mitigation measures to reduce amounts of sediment released into the water during construction (silt curtain, clamshell dredge) have predictable reliability, resulting in a high degree of confidence in the mitigation strategies. Based on these factors, there is a high degree of confidence in the conclusion that the project effects on sediment and water quality are expected to be not significant.
Sec. 52 Application Volume 6B: Environmental and Socio-Economic Assessment (ESA) – Marine Terminal Section 7: Sediment and Water Quality
Page 7-22 May 2010
7.6 Effects on Sediment and Water Chemistry Construction activities, including dredging and pile installation, have the potential to disturb sediment and release contaminants (already present in the sediments) to the water column in a sediment plume. Dredged material from the construction of the marine terminal will be disposed of on land, at the excess cut disposal area. As discussed, historic and current activities have contributed to the sediment contamination.
7.6.1 Baseline Conditions The following sections summarize the results of the February 2006 field program and relevant published literature. However, they do not include data obtained in the 2008 program conducted for the Ecological Risk Assessment (see Section 14), which included data for two additional stations. To review the analytical dataset for 2006, see the Marine Fish and Fish Habitat TDR.
7.6.1.1 Sediment Quality
General sediment chemistry of Kitimat Arm and Douglas Channel is influenced by fjord and estuarine circulation patterns. Fjords typically have anoxic conditions (low levels or absence of oxygen) in bottom waters, which affect availability (e.g., speciation and solubility) of contaminants, types of benthic organisms and interactions between contaminants and organisms. Some species of benthic organisms burrow into the sediment, disturbing and releasing contaminants. While anoxic conditions are noted rarely in the area, Pickard (1961) reported anoxic conditions in the deeper water at Miette Bay, at the head of Kitimat Arm.
The fine-grained sediments in the deep water of Douglas Channel and Kitimat Arm contain organic matter in amounts generally expected for coastal British Columbia. Organic matter, which is measured as percent total organic carbon (TOC), is derived mainly from detritus settling in the water column. TOC binds readily with silt, clay and some contaminants. Therefore levels are generally higher in fine-grained than coarser substrates. Sediment TOC levels in Kitimat Arm increase with distance from the Kitimat River and range from 1% outside Miette Bay to 1.8% near Emsley Cove and 3% in Douglas Channel (Crete et al. 1983). Sandy substrates are prevalent within the inner harbour and along nearby intertidal areas, whereas finer-grained substrates are found in deeper portions of Kitimat Arm (Bornhold 1983; EVS 1995), including the PDA.
Industrial activities in the Kitimat area have released contaminants through air emissions and effluent discharges since the 1960s. Periodic sediment monitoring programs in the Kitimat area indicate the presence of contaminants such as polycyclic aromatic hydrocarbons (PAH), metals, dioxins and furans.
Sediment PAH levels are considered to represent historic and, to a lesser extent, current air emissions from the Rio Tinto Alcan Primary Metal BC aluminum smelter. A study of PAH in sediment of Kitimat Arm in the early 1980s (Crete et al. 1983) indicated the presence of PAH (mean concentration of 2.55 mg/kg), with decreasing levels up to 70 km south of the area. Levels were higher in sediment from the northwest shore of Kitimat Arm (5.4 to 10 mg/kg) than from the eastern and western shores (2 to 5.4 mg/kg). A more recent study indicated that most of the PAH in Kitimat Arm are associated with particulate materials such as soot, and seem resistant to degradation and desorption (Kickoff et al. 2003).

Sec. 52 Application Volume 6B: Environmental and Socio-Economic Assessment (ESA) – Marine Terminal Section 7: Sediment and Water Quality
May 2010 Page 7-23
The less soluble high molecular weight PAHs were predominant. However, more soluble low molecular weight PAHs were also present and may still be bioavailable (Eickhoff et al. 2003).
Changes in PAH levels over time are thought to be related to reduced emissions and discharges, particularly from the Rio Tinto Alcan Primary Metal BC aluminum smelter, and the resuspension and resettling of PAH within Kitimat Arm (Harris 1999). Given the reduced atmospheric and other loadings in recent years, resuspension from areas farther down Kitimat Arm may be a notable source of PAH and other contaminants to areas near the head of the inlet. Core samples taken in the late 1970s showed decreasing PAH concentrations with sediment depth from up to 2.5 mg/kg in surface sediment to 0.0005 mg/kg in deep (60 to 63 cm) sediment, with a sharp decrease below 15 cm depth (Erickson et al. 1979).
Studies from the 1990s (in the Bish Cove area on the western shore of Kitimat Arm) reported a total PAH concentration of 2.44 mg/kg in a composite of five samples (EVS 1995; Paine et al. 1996). This level was considered relatively low compared with other sites sampled in Kitimat Arm. The Bish Cove sample had relatively high TOC levels (2.25%) compared with other samples from Kitimat Arm (perhaps from pitch and coke particulates), with no toxicity associated with the sample (Paine et al. 1996). A decrease in sediment PAH concentration on the western shore of Kitimat Arm between the 1980s and 1990s was attributed to capping (more recent sedimentation) by clean sediments from the Kitimat River (Paine et al. 1996).
Elevated concentrations of metals (i.e., copper, lead, zinc, fluoride, cadmium and mercury) have been reported in Kitimat Arm, with higher than guideline levels in sediment from the inner harbour (Warrington 1987). Fluoride, aluminum and iron levels are linked to Rio Tinto Alcan Primary Metal BC aluminum smelter discharges (BC MoE 1987, Internet site), whereas metals in fine-grained substrates in deeper portions of Kitimat Arm are linked to other industrial effluents (Warrington 1987, 1993). These areas are not well flushed during tidal exchange so contaminants sink to the bottom in the middle of Kitimat Arm.
Dioxins and furans have also been reported in Kitimat Arm sediments, with concentrations of individual compounds ranging from 475 to 982 picograms per gram (pg/g) in the 1990s (Warrington 1993). The Eurocan Pulp and Paper Co. plant did not use a chlorine bleaching process, but a sawmill formerly attached to Eurocan may have used chlorophenols (Warrington 1993), which could be a source of dioxins and furans.
Sediment Chemistry
Environment Canada reviewed the 2006 sediment sampling plan and list of parameters for adherence to an Ocean Disposal Permit for dredged material. This analytical approach was taken because, at the time, disposal of dredged material in the ocean was being considered for the Project. Although ocean disposal is no longer being planned, the study design is scientifically robust and data are useful for characterization of sediment quality. Eight samples in the PDA and one in each of two reference stations were collected from 30 to 100 m depth. Samples were analyzed for PAH, total metals, AVS/SEM, PCB, dioxins and furans. See Figure 7-2 for the locations where samples were collected.

Sec. 52 Application Volume 6B: Environmental and Socio-Economic Assessment (ESA) – Marine Terminal Section 7: Sediment and Water Quality
Page 7-24 May 2010
Results were compared with the following guidelines for marine sediment:
• federal guidelines for ocean disposal of sediment (Environment Canada 2008, Internet site)
• CCME ISQG and PEL (CCME 2007)
• provincial sediment quality guidelines (Nagpal et al. 2006, Internet site) for protection of marine life (same as CCME ISQG and PEL for many parameters, plus guidelines for total low molecular weight and high molecular weight PAH)
The CCME and provincial sediment quality guidelines were established based on acute and chronic toxicity tests with a wide range of marine organisms. The guidelines were set to be protective of the most sensitive organisms and incorporate a generous safety margin. Concentrations below the ISQG are not expected to be associated with adverse biological effects. Concentrations falling between the ISQG and the PEL are in the range where effects are occasionally observed. Concentrations above PEL values are expected to be associated with adverse biological effects on a variety of organisms. In addition to chemical analysis of sediment samples, laboratory toxicity tests can be run to identify whether sediments that contain contaminants above the guidelines pose a risk to marine organisms.
The analytical data for the PDA confirm the presence of contaminants previously reported for Kitimat Arm, with most of the samples meeting ISQG for the majority of parameters. For example, PAHs in the test samples were present in the lower end of the range reported for Kitimat Arm, with two of eight samples exceeding the ocean disposal guideline by up to 20%. Levels of mercury and cadmium were well below the ocean disposal guidelines; however, levels of copper and chromium exceeded CCME and British Columbia ISQG in most of the reference and PDA samples. Detectable levels of dioxins and furans were reported for all samples from the PDA exceeding the CCME ISQG. However, levels of all these contaminants were well below applicable PEL so are not expected to pose a risk to marine organisms if small amounts are released during dredging.
For PAH data (16 parent compounds plus methylated naphthalene), see Table 7-3. The ocean disposal guideline for total PAH of 2.5 mg/kg was slightly exceeded at stations SWQ-06-02 and SWQ-06-03 and nearly matched at SWQ-06-01 (2.49 mg/kg). There are no federal or provincial guidelines for total PAH. British Columbia guidelines for total low and high molecular weight PAH were not exceeded in any samples. However, levels of several individual PAH compounds (phenanthrene, fluoranthene, pyrene, benzo(a)anthracene, chrysene, benzo(a)pyrene and dibenz(a,h)anthracene) exceeded CCME and British Columbia ISQG (but not PEL) at all stations except SWQ-06-04 and the reference stations SWQ-06-09 and SWQ-06-10. Measurable levels of volatile hydrocarbons such as BTEX and styrene were not reported from any samples.
Cadmium and mercury were well below the screening limits for ocean disposal (0.6 mg/kg cadmium and 0.75 mg/kg mercury) and also the British Columbia and CCME ISQG for all samples (see Table 7-4 for the total metals data). Copper and chromium were the only metals reported to be above the CCME and British Columbia ISQG (but lower than PEL), with elevated levels at both PDA and reference stations. Chromium was just above the ISQG level and copper was two to three times higher than the ISQG level.

Sec. 52 Application Volume 6B: Environmental and Socio-Economic Assessment (ESA) – Marine Terminal Section 7: Sediment and Water Quality
May 2010 Page 7-25
Table 7-3 Sediment Polycyclic Aromatic Hydrocarbon Levels in the PDA and Reference Areas
Parameter
Sediment Quality Guideline (mg/kg)
Range of Concentrations1 (mg/kg)
Number of Exceedances for PDA Value Reference PDA
(8 samples) Reference Area
(2 samples) Total PAH 2.5 Environment Canada Ocean
Disposal <0.05–3.16 0.06–0.21 2 of 8 samples exceed Ocean Disposal
criterion by up to 26% Total High Molecular Weight PAH
9.6 “no adverse effect” (BC) <0.05–2.98 0.06–0.21 All samples below BC No Adverse Effect level 53.0 “minor adverse effect” (BC)
Total Low Molecular Weight PAH
3.7 “no adverse effect” (BC) <0.05–0.18 <0.05 All samples below BC No Adverse Effect level 7.8 “minor adverse effect” (BC)
Naphthalene 0.0346 ISQG (BC and CCME) <0.05 <0.05 Unable to assess against ISQG (detection limit higher than ISQG) All samples below PEL 0.391 PEL (BC and CCME)
2-Methylnapthalene 0.0202 ISQG (BC and CCME) <0.05 <0.05 Unable to assess against ISQG (detection limit higher than ISQG) All samples below PEL 0.201 PEL (BC and CCME)
Acenapthylene 0.0059 ISQG (BC and CCME) <0.05 <0.05 Unable to assess against ISQG (detection limit higher than ISQG) All samples below PEL 0.128 PEL (BC and CCME)
Acenaphthene 0.0067 ISQG (BC and CCME) <0.05 <0.05 Unable to assess against ISQG (detection limit higher than ISQG) All samples below PEL 0.0889 PEL (BC and CCME)
Fluorene 0.0212 ISQG (BC and CCME) <0.05 <0.05 Unable to assess against ISQG (detection limit higher than ISQG) All samples below PEL 0.144 PEL (BC and CCME)

Sec. 52 Application Volume 6B: Environmental and Socio-Economic Assessment (ESA) – Marine Terminal Section 7: Sediment and Water Quality
Page 7-26 May 2010
Table 7-3 Sediment Polycyclic Aromatic Hydrocarbon Levels in the PDA and Reference Areas (cont’d)
Parameter
Sediment Quality Guideline (mg/kg)
Range of Concentrations1 (mg/kg)
Number of Exceedances for PDA Value Reference PDA
(8 samples) Reference Area
(2 samples) Phenanthrene 0.0867 ISQG (BC and CCME) <0.05–0.18 <0.05 7 of 8 samples exceed ISQG by 1.1 to 2 times,
but all are below PEL 0.544 PEL (BC and CCME) Anthracene 0.0469 ISQG (BC and CCME) <0.05 <0.05 All samples below ISQG and PEL
0.245 PEL (BC and CCME) Fluoranthene 0.113 ISQG (BC and CCME) <0.05–0.39 <0.05–0.06 7 of 8 samples exceed ISQG by 2 to 3.5 times,
but all are below PEL 1.494 PEL (BC and CCME) Pyrene 0.153 ISQG (BC and CCME) <0.05–0.40 <0.05–0.06 7 of 8 samples exceed ISQG by 1.6 to 2.6
times, but all are below PEL 1.398 PEL (BC and CCME) Benzo(a)anthracene 0.0748 ISQG (BC and CCME) <0.05–0.27 <0.05 7 of 8 samples exceed ISQG by 1.8 to 3.6
times, but all are below PEL 0.693 PEL (BC and CCME) Chrysene 0.108 ISQG (BC and CCME) <0.05–0.32 <0.05 6 of 8 samples exceed ISQG by 1.5 to 3 times,
but all are below PEL 0.846 PEL (BC and CCME) Benzo(b)fluoranthene2 2.3 “no adverse effect” (BC) <0.05–0.7 0.06–0.09 All samples below BC No Adverse Effect
4.5 “minor adverse effect” (BC) Benzo(k)fluoranthene2 2.3 “no adverse effect” (BC) <0.05 <0.05 All samples below BC No Adverse Effect
4.5 “minor adverse effect” (BC) Benzo(a)pyrene 0.0888 ISQG (BC and CCME) <0.05–0.36 <0.05 7 of 8 samples exceed ISQG by 2 to 4 times,
but all are below PEL 0.763 PEL (BC and CCME)
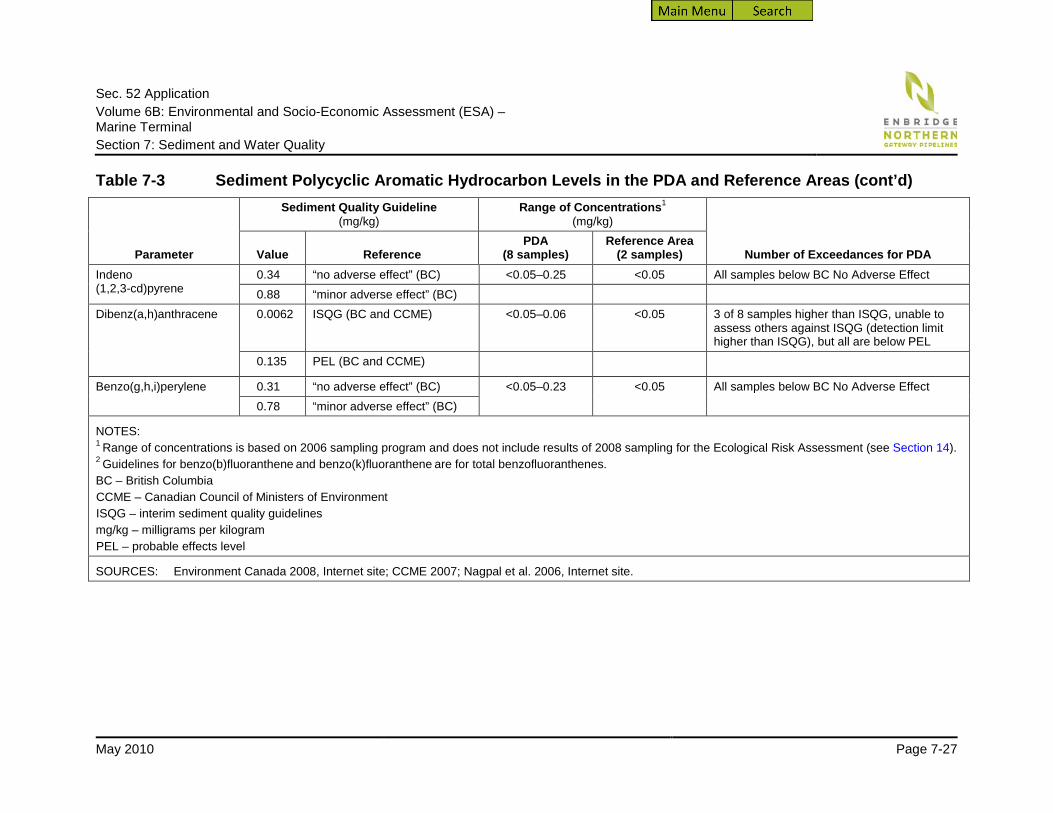
Sec. 52 Application Volume 6B: Environmental and Socio-Economic Assessment (ESA) – Marine Terminal Section 7: Sediment and Water Quality
May 2010 Page 7-27
Table 7-3 Sediment Polycyclic Aromatic Hydrocarbon Levels in the PDA and Reference Areas (cont’d)
Parameter
Sediment Quality Guideline (mg/kg)
Range of Concentrations1 (mg/kg)
Number of Exceedances for PDA Value Reference PDA
(8 samples) Reference Area
(2 samples) Indeno (1,2,3-cd)pyrene
0.34 “no adverse effect” (BC) <0.05–0.25 <0.05 All samples below BC No Adverse Effect 0.88 “minor adverse effect” (BC)
Dibenz(a,h)anthracene 0.0062 ISQG (BC and CCME) <0.05–0.06 <0.05 3 of 8 samples higher than ISQG, unable to assess others against ISQG (detection limit higher than ISQG), but all are below PEL
0.135 PEL (BC and CCME)
Benzo(g,h,i)perylene 0.31 “no adverse effect” (BC) <0.05–0.23 <0.05 All samples below BC No Adverse Effect 0.78 “minor adverse effect” (BC)
NOTES: 1 Range of concentrations is based on 2006 sampling program and does not include results of 2008 sampling for the Ecological Risk Assessment (see Section 14). 2 Guidelines for benzo(b)fluoranthene and benzo(k)fluoranthene are for total benzofluoranthenes. BC – British Columbia CCME – Canadian Council of Ministers of Environment ISQG – interim sediment quality guidelines mg/kg – milligrams per kilogram PEL – probable effects level
SOURCES: Environment Canada 2008, Internet site; CCME 2007; Nagpal et al. 2006, Internet site.

Sec. 52 Application Volume 6B: Environmental and Socio-Economic Assessment (ESA) – Marine Terminal Section 7: Sediment and Water Quality
Page 7-28 May 2010
Table 7-4 Sediment Metal Levels in the PDA and Reference Areas
Parameter
Sediment Quality Guideline (mg/kg)
Range of Concentrations1 (mg/kg)
Number of Exceedances Value Reference PDA
(8 samples) Reference area
(2 samples) Arsenic 7.24 ISQG (BC and CCME) 2–6 3 No exceedances in 8 samples
41.6 PEL (BC and CCME) Cadmium 0.6 Environment Canada Ocean Disposal <0.05–0.09 <0.05 No exceedances in 8 samples
0.7 ISQG (BC and CCME) 4.2 PEL (BC and CCME)
Chromium 52.3 ISQG (BC and CCME) 48.2–55.7 44.3–54.4 4 PDA and 1 reference sample exceed ISQG by 1.01 to 1.06 times, but all are below PEL 160 PEL (BC and CCME)
Copper 18.7 ISQG (BC and CCME) 43.1–51.1 34.3–40.8 All PDA and reference samples exceed ISQG by 1.8 to 2.7 times but all are below PEL 1,086 PEL (BC and CCME)
Mercury 0.75 Environment Canada Ocean Disposal 0.014–0.022 0.011–0.012 No exceedances in 8 samples 0.13 ISQG (BC and CCME)
0.70 PEL (BC and CCME)
Nickel 30 BC low level 21.8–24.0 18.0–24.6 No exceedances in 8 samples 50 BC median level
Lead 30.2 ISQG (BC and CCME) 4–5 2–3 No exceedances in 8 samples 112 PEL (BC and CCME)
Zinc 124 ISQG (BC and CCME) 73.6–84.9 79.1–80.2 No exceedances in 8 samples 271 PEL (BC and CCME)
Total organic carbon No guideline available 0.8–1.8% 0.8–1.6% Not applicable

Sec. 52 Application Volume 6B: Environmental and Socio-Economic Assessment (ESA) – Marine Terminal Section 7: Sediment and Water Quality
May 2010 Page 7-29
Table 7-4 Sediment Metal Levels in the PDA and Reference Areas (cont’d)
Parameter
Sediment Quality Guideline (mg/kg)
Range of Concentrations1
Number of Exceedances Value Reference PDA
(8 samples) Reference area
(2 samples) Acid volatile sulphide No guideline available 0.3–1.8
μmol/g <0.2–0.9 μmol/g Not applicable
Total simultaneously extracted metals
No guideline applicable 0.030–0.355 μmol/g
0.112–0.148 μmol/g
AVS/SEM ratio of 0.04–0.27 (ratio <1 suggests no bioavailable metals)
NOTES: 1 Range of concentrations is based on 2006 sampling program and does not include results of 2008 sampling for the Ecological Risk Assessment (see Section 14).
AVS/SEM – acid volatile sulphide to simultaneously extracted metals ratio BC – British Columbia CCME – Canadian Council of Ministers of Environment ISQG – interim sediment quality guidelines PEL – probable effects level µmol/g – micromole per gram
SOURCES: Environment Canada 2008, Internet site; CCME 2007; Nagpal et al. 2006, Internet site.
Sec. 52 Application Volume 6B: Environmental and Socio-Economic Assessment (ESA) – Marine Terminal Section 7: Sediment and Water Quality
Page 7-30 May 2010
Metal bioavailability can be assessed by measuring amounts of AVS and SEM in sediment, based on theory and observations for contaminated sites that not all metals reported for a sample are available and toxic to aquatic organisms (Di Toro et al. 1992). Silver, copper, cadmium, nickel, lead and zinc form insoluble precipitates in the presence of sulphide. If the molar concentration of the sum of SEM metals is less than the AVS concentration (ratio less than 1), the metals will be almost exclusively bound to sulphide, their bioavailability will be extremely low, and toxicity will be unlikely. AVS levels are lowest in the spring and increase through summer, so bioavailability of metals will decrease throughout the summer. Results show AVS/SEM ratios well below 1.0 for all samples analyzed. As a result, metals in general and more specifically copper (up to three times higher than ISQG in routine metals analysis, see Table 7-4) in sediment are not expected to be bioavailable and to pose a risk of toxicity to benthic organisms. This is consistent with toxicity testing of the sediment samples from Kitimat Arm.
Table 7-5 summarizes data for dioxin and furan in sediment collected from Kitimat Arm in 2006. Norecol Dames & Moore Inc. (1997) discussed several potential sources of dioxins and furans in Kitimat Arm, including the Eurocan Pulp and Paper Co. plant (which did not use a bleaching process), its former sawmill, and the Rio Tinto Alcan Primary Metal BC aluminum smelter. The most toxic of the dioxins, 2,3,7,8–tetrachlorodibenzo-p-dioxin (TCDD), was detectable in all samples, with concentrations ranging from 0.12 to 0.21 pg/g (parts per trillion). The toxic equivalent (TEQ), a standard measure of the combined toxicity of all dioxins and furans measured in a sample, was higher than the ISQG in all samples and ranged from 1.24 to 2.34 using toxic equivalent factors for fish described in CCME (2004) and up to 4.35 using various conventions for calculation (Van den Berg et al. 1998). The TEQ can be reported in various ways, depending on how values reported as less than detection are treated in the calculation, and which toxic equivalent factors are used (e.g., those for mammals, fish or humans). Dioxins and furans do not dissolve in water, so are only bioavailable to organisms that ingest sediment particles.
Total PCB levels were also measured in the sediment samples. Levels were below detection (0.03 µg/g) at all stations except SWQ-06-11, which had a value at the detection limit.
Sediment Toxicity
Toxicity of sediment to common benthic invertebrates was assessed using standard bioassay protocols on five replicate samples from each of the ten sediment stations sampled in 2006 (no additional samples were analyzed for the 2008 program for the Ecological Risk Assessment [see Section 14]). A 10-day marine amphipod (Eohaustorius estuarius) survival test and a 20-day polychaete (Neanthes arenaceodentata) survival and growth test were carried out.

Sec. 52 Application Volume 6B: Environmental and Socio-Economic Assessment (ESA) – Marine Terminal Section 7: Sediment and Water Quality
May 2010 Page 7-31
Table 7-5 Sediment Dioxin and Furan Levels in the PDA
Parameter/ Calculation Method1
Sediment Quality Guideline TEQ2 Range of Concentrations3
(10 samples from PDA) Number of Exceedances Value Reference Octachlorodibenzo-p-dioxin (OCDD)
Not quantifiable Environment Canada Ocean Disposal
37.2–82.4 pg/g All samples have quantifiable amounts of OCDD
TEQ calculated using 1998 WHO TEF values, nondetect=0
0.85 ISQG CCME 2.33–4.35 TEQ All ten samples from PDA exceed ISQG by up to 5 times, but well below PEL 21.5 PEL, CCME
TEQ calculated using 1998 WHO TEF values, nondetect=1/2 DL
0.85 ISQG CCME 2.35–4.26 TEQ All ten samples from PDA exceed ISQG by up to 5 times, but well below PEL 21.5 PEL, CCME
TEQ calculated using CCME (2004) TEF values with nondetect=1/2 DL2
0.85 ISQG CCME 1.24–2.34 TEQ All ten samples from PDA exceed ISQG by up to 3 times, but well below PEL 21.5 PEL, CCME
NOTES: 1 The method recommended by Environment Canada for Oceans Disposal permits is according to the Canadian Council of Ministers of Environment (CCME
2004), which calculates toxic equivalent (TEQ) using toxic equivalency factors (TEFs) for fish and half the detection limit for values less than detection. 2 The toxic equivalent (TEQ) is calculated using toxic equivalency factors (TEFs) for the individual dioxin and furan congeners established for specific receptors
(e.g., human, mammal, fish). Congener values less than detection can be treated either as 0 or 1/2 the detection limit (DL). 3 Range of concentrations is based on 2006 sampling program and does not include results of 2008 sampling for the Ecological Risk Assessment (see
Section 14).
CCME – Canadian Council of Ministers of Environment DL – detection limit ISQG – interim sediment quality guidelines PEL – probable effects level pg/g – pictograms per gram TEF – toxic equivalency factor TEQ – toxic equivalent WHO – World Health Organization SOURCES: Environment Canada 2008, Internet site; Van den Berg et al. 1998.

Sec. 52 Application Volume 6B: Environmental and Socio-Economic Assessment (ESA) – Marine Terminal Section 7: Sediment and Water Quality
Page 7-32 May 2010
The sediment samples were nontoxic as determined by the amphipod survival test, the polychaete survival test and the polychaete growth test (see Table 7-6). Amphipod survival ranged from 80% to 88% in the PDA samples and 90% to 97% in the reference samples, with statistically significantly lower survival (p=0.05) in five of the eight samples from the PDA compared with one of the two reference samples (SWQ-06-09). There were no notable differences in survival (100%) or growth of the polychaete in PDA and reference samples (p =0.05). Levels of metals and other contaminants measured in sediments, some above ISQG, do not appear to be bioavailable to cause toxicity in these common marine organisms, as suggested in AVS/SEM analysis.
Table 7-6 Survival and Growth Results for Marine Invertebrates in Sediment Toxicity Tests
Sediment Sample
Eohaustorius estuarius Neanthes arenaceodentata Survival
(%) Notes
Survival
(%) Mean Growth Rate
(mg/worm/day) Notes
Control (2 samples)
99–100 No comment applicable
100 NA No comment applicable
Reference area (2 samples)
90–97 No comment applicable
100 0.98–1.00 Not substantially different from laboratory control (p=0.05)
PDA (8 samples)
80–88 Passed, although five samples had survival significantly different (p=0.05) from one of the two reference samples
100 0.97–1.04 Not substantially different from either reference area sample (p=0.05)
NOTES: Mean of five replicates per station mg/worm/day – milligrams per worm per day NA – data not available
7.6.1.2 Water Quality
The dissolved oxygen concentration in surface waters of Kitimat Arm and Douglas Channel increases in spring as the increased phytoplankton growth releases oxygen during photosynthesis. By contrast, dissolved oxygen levels in deeper waters can become low in oxygen at any time of year, as the presence of sills permits little exchange with oceanic waters.
Suspended particulate matter (commonly measured as turbidity or total suspended solids [TSS]) also increases in spring, with the increase in phytoplankton growth and river runoff. Particulate matter may be composed of microscopic biota, clay, and silt with attached organic and inorganic nutrients that have been suspended in the water column by currents or waves. The main sources of particulate matter include river runoff, biological production and atmospheric fallout, with some anthropogenic contributions from waste water effluents and substrate disturbances. Suspended particulate matter in near-shore environments is usually highest during spring, but may increase anytime of the year after heavy rain. The deep basins of

Sec. 52 Application Volume 6B: Environmental and Socio-Economic Assessment (ESA) – Marine Terminal Section 7: Sediment and Water Quality
May 2010 Page 7-33
Douglas Channel and Kitimat Arm typically have low levels of suspended matter resulting from resuspension of fine bottom substrates (MacDonald 1983).
Nutrients essential to primary production—including phosphorus, nitrogen (ammonia and nitrate) and silicon—are present in particulate and dissolved forms. Concentrations vary seasonally, depending on runoff, vertical mixing and phytoplankton uptake. The spring phytoplankton bloom results in depleted nutrient levels in near-surface waters and maximum concentrations at about 50 m depth. Strong tidal mixing and river runoff can redistribute nutrients in the water column during summer, fall and winter.
The surface waters of coastal British Columbia are characterized by relatively high levels of silicon derived from rivers and runoff and relatively low levels of phosphorus and nitrogen. Kitimat Arm is expected to have relatively low nutrient levels compared with open coastal areas because of poor mixing between the deep fjord and the more nutrient-rich coastal waters. Eelgrass beds and estuaries in Kitimat Arm are areas of enriched production and nutrient export to adjacent areas. Anthropogenic sources of nutrients can include waste water discharge from municipalities, industries and ships.
Seawater is slightly basic, with a pH of 7.8 to 8.3. The pH is influenced by photosynthesis. The increased uptake of carbon dioxide (CO2) and release of oxygen during photosynthesis leads to increased pH. Localized areas of lower pH can occur where streams discharge more acidic water. Deep waters tend to have lower pH, particularly in areas low in oxygen, owing to flushing or build-up of decomposing organic debris.
Water chemistry in Kitimat Arm has been influenced by decades of air emissions and effluent discharges from industrial activities. The Province of British Columbia’s proposed ambient water quality objectives for the Kitimat River and Kitimat Arm in 1987 (BC MoE 1987, Internet site) are similar to the current generic provincial guidelines, but with a revised fluoride guideline of 1.5 milligrams per litre (mg/L) to protect the ecosystem from observed discharges from the Rio Tinto Alcan aluminum smelter. In the 1980s, fluoride levels up to 15 mg/L were reported for Kitimat harbour, along with elevated levels of aluminum, iron and cyanide. Contaminants from municipal, commercial and industrial discharges of metals, pesticides, polychlorinated biphenyls (PCBs), dioxins, furans, PAH and chlorinated phenols have all been documented in Kitimat Arm. For example, Cretney et al. (1983) and Harris (1999) concluded that PAH, which was detected throughout the inlet, came from a variety of sources (e.g., atmospheric and effluent discharges from the Rio Tinto Alcan aluminum smelter, woodstove exhaust and residential waste), and that contaminants derived from atmospheric deposition are also transported out of the inlet by estuarine circulation.
Information about quality of water at the sediment–water interface was also obtained by sampling overlying water in the sediment grabs. Ten samples collected in February 2006, eight from the PDA and two from the reference area, were analyzed for nutrients, metals and PAH. Results were compared with applicable water quality guidelines for protection of marine life. These include CCME guidelines for arsenic, cadmium, chromium and mercury (CCME 2007) and British Columbia guidelines for copper, lead, mercury, selenium, silver, zinc and PAH compounds (BC MoE 2006, Internet site; Nagpal et al. 2006, Internet site). Similar to sediment quality guidelines, the water quality guidelines are set at a level protective of the most sensitive organisms tested in the laboratory, and incorporate generous (typically ten-fold) safety margins for the most sensitive organisms.

Sec. 52 Application Volume 6B: Environmental and Socio-Economic Assessment (ESA) – Marine Terminal Section 7: Sediment and Water Quality
Page 7-34 May 2010
Table 7-7 summarizes the results of the analyses for general parameters and metals. Only two of the 33 metals tested were present at or above guidelines in one or more samples. Cadmium was slightly above the CCME and British Columbia guideline of 0.00012 mg/L at five of the eight stations. Zinc ranged from 0.0011 to 0.02 mg/L and exceeded the British Columbia guideline (0.01 mg/L) at one station. Other metals were well within guidelines, with little variation between stations. These relatively small exceedances of guidelines indicate baseline sources of metals, which are well within safety margins of the guidelines. Several parameters, including barium, cobalt, iron, manganese and silicon were highest at Station SWQ-06-12 (near the centre of the marine terminal); the reason for this is not known.
Table 7-7 General Parameters and Metals in Bottom Water, February 2006
Parameter
Guideline (mg/L unless noted)
Range of Concentrations1 (mg/L unless noted)
PDA (8 samples)
Reference area (2 samples)
Salinity (ppt) NA 26.2–29.5 27.6–27.7 pH (units) 7.0–8.7 (BC and CCME) 7.12–7.98 7.61–7.77 Ammonia (mg/L as nitrogen)
3.1–12 (BC) 0.023–0.117 0.015–0.0016
Sulphide NA 0.168–0.686 0.274–0.32 Arsenic 0.0125
(BC and CCME) <0.0002–0.0019 0.0008–0.001
Barium 0.5 (BC) 0.0068–0.017 0.0074–0.0076 Boron NA 3.4–3.9 3.6–3.7 Cadmium 0.00012
(BC and CCME) 0.00009–0.00017 0.00011
Cobalt NA 0.000061–0.0021 <0.00005–0.000056 Copper 0.003 (BC) 0.00070–0.00120 0.00079–0.00094 Manganese 0.01 (BC) 0.0070–0.054 0.0020–0.0029 Molybdenum NA 0.0087–0.0095 0.0081–0.0095 Nickel 0.0083 (BC) 0.00070–0.00088 0.00061–0.00069 Zinc 0.01 (BC) 0.0011–0.021 0.0050–0.0058
NOTES: 1 Range of concentrations is based on the 2006 sampling program and does not include results of the 2008
sampling for the Ecological Risk Assessment (see Section 14). NA – data not available
Toxicity testing of the water would be useful in identifying any potential for chronic toxicity to marine life; however, given the small and sporadic exceedances, the likelihood of adverse effects is very low.
The British Columbia water quality guidelines for the PAH chrysene and benzo(a) pyrene were exceeded at several stations, with the highest concentrations occurring at Station SWQ-06-12 (see Table 7-8). Total PAH concentration was highest at Station SWQ-06-12 (11.5 µg/L) and Station SWQ-06-04 (10.6 µg/L). All other stations with detectable PAH concentrations had levels less than half those reported at SWQ-06-12 and SWQ-06-04. The CCME guideline for PAH (only available for naphthalene) was not exceeded in these samples.

Sec. 52 Application Volume 6B: Environmental and Socio-Economic Assessment (ESA) – Marine Terminal Section 7: Sediment and Water Quality
May 2010 Page 7-35
Table 7-8 Polycyclic Aromatic Hydrocarbon Levels in Bottom Water, February 2006
Parameter (µg/L)
Guideline (µg/L)
Range of Concentrations1 (μg/L unless noted)
PDA (8 samples)
Reference area (2 samples)
Total PAH NA <0.05–11.5 1.00–1.32
Naphthalene 1.4 (CCME) 1 (BC)
<0.05–0.11 <0.05
Quinoline NA <0.1– 0.61 2-Methylnapthalene 1 (BC) <0.05–0.21 <0.05 Acenapthylene NA <0.05 <0.05–0.08 Acenaphthene 6 (BC) <0.05–<0.08 <0.05 Fluorene 12 (BC) <0.05–0.12 <0.05 Phenanthrene NA <0.05–0.35 0.11–0.14 Anthracene NA <0.05–0.08 <0.05 Acridine NA <0.1–<0.16 <0.1 Fluoranthene NA <0.07–1.07 0.13–0.47 Pyrene NA <0.07–0.96 0.04–0.09 Benzo(a) anthracene NA <0.07–1.05 0.76 Chrysene 0.1 (BC) <0.05–1.98 0.09–0.10 Benzo(b) fluoranthene NA <0.07–3.94 0.19–0.27 Benzo(k) fluoranthene NA <0.05 <0.05 Benzo(a) pyrene 0.01 (BC) <0.07–0.36 <0.05 Indeno(1,2,3-cd)pyrene NA <0.07–0.48 <0.05 Dibenz(a,h)anthracene NA <0.05–0.08 <0.05 Benzo(g,h,i)perylene NA <0.07–0.25 0.11–0.14 Total PAHs 0.00 <0.05–11.5 1.00–1.32
NOTES: 1 Range of concentrations is based on 2006 sampling program and does not include results of 2008 sampling for the
Ecological Risk Assessment (see Section 14).
NA – data not available
7.6.2 Effects on Sediment and Water Chemistry
7.6.2.1 Effect Mechanisms
Construction Construction of the marine terminal will include dredging and blasting operations. Although dredged materials will be disposed on land, according to standard protocols, sediment released during dredging or in association with blasting might contain contaminants that adversely affect marine biota. Even though most of the contaminants present in sediment are bound to organic compounds and are not soluble in seawater, there is a risk of bioaccumulation when suspended particles are ingested.

Sec. 52 Application Volume 6B: Environmental and Socio-Economic Assessment (ESA) – Marine Terminal Section 7: Sediment and Water Quality
Page 7-36 May 2010
Operations Surface water runoff from the tank and manifold areas will be directed to, and stored in, the impoundment reservoir. Water from the impoundment reservoir may be sent to the firewater reservoir. Before being released to the marine environment, excess water from the impoundment reservoir will be tested to confirm that the concentration of oil is less than 15 parts per million (ppm). Water will be released through a perforated pipe located away from the boomed zone of the berths. If the water is found to have oil in excess of 15 ppm, it will be directed through the oil-water separator prior to its release. Waste water discharges from the Kitimat Terminal will comply with the Waste Management Act, Petroleum Storage and Distribution Facilities Storm Water Regulation, and the British Columbia Special Waste Regulation. Surface water runoff from the area outside the tank and manifold areas will be controlled so that this water will be released outside the boomed zone of the berths, to the extent practical. Any difference in salinity and temperature between the effluent and ambient water will be quickly removed. The effluent is not expected to cause concentrations of hydrocarbons or metals to exceed CCME or British Columbia water quality guidelines in the receiving environment, because it will meet all the regulatory requirements listed above.
Decommissioning At decommissioning, all above-water infrastructure will be removed; inwater infrastructure will be removed to the top of the substrate. It is expected that these activities will result in only minor disruptions to marine habitats and sediment (i.e., highly site-specific, short term and reversible within hours to days). As a result, no substantial changes to sediment or water chemistry in the PDA or beyond are expected.
7.6.2.2 Mitigation and Effects Management
The Project incorporates many design elements and environmental protection measures (see Section 7.3). Those most applicable to sediment and water chemistry are summarized:
• Appropriate erosion and runoff controls will be placed on land during construction and operations to contain and treat sediment, hydrocarbons and contaminants, restricting their discharge into near-shore waters.
• Environmental effects of dredging will be mitigated according to permits or approvals. This may include use of a dredging system to limit sediment effects (e.g., clamshell dredge), limiting the amount of dredging needed to complete the work, and placing silt curtains around the dredge area to limit the silt plume.
• Discharges of excess water from the impoundment reservoir will contain less than 15 ppm of oil. Water will be released through a perforated pipe located away from the boomed zone of the berths, and will comply with the Waste Management Act, Petroleum Storage and Distribution Facilities Storm Water Regulation, and the British Columbia Special Waste Regulation.

Sec. 52 Application Volume 6B: Environmental and Socio-Economic Assessment (ESA) – Marine Terminal Section 7: Sediment and Water Quality
May 2010 Page 7-37
7.6.2.3 Residual Effects
Construction
Simpson (1997) noted that PAH in sediments in Kitimat Arm have accumulated from atmospheric deposition and are strongly adsorbed to particles, so are generally not bioavailable. However, some of the lower weight PAH in sediment were shown to be bioavailable to crabs (Eickhoff et al. 2003), likely because of ingestion of sediment during feeding. Results of the 2006 sampling program support the conclusion of a lack of bioavailability of potential contaminants. The AVS/SEM analysis shows that most of the metals in sediment are bound to sulphide, which decreases availability and potential metal toxicity and the toxicity testing results confirm that the sediments do not show acute or chronic toxicity.
During dredging, it is estimated that approximately 0.5% of the material from each grab will escape from the clamshell near the bottom, and another 0.5% will be lost as the bucket is moved to the surface. Because of the small amount of sediment released (approximately 1% of material) during dredging, there is not expected to be a measurable increase in the amount of contaminants dissolved in seawater. Their bioavailability is low and there is a small spatial extent of suspended sediment. As a result, the risk of exposure to contamination is expected to be localized, if it occurs. The environmental effect will be reversible because the small fraction of the finer suspended particles that remain in the water column will settle in a few days. Sediment disturbances from blasting are expected to be localized and short term.
Acid rock drainage and metal leaching from disturbed bedrock could also affect water quality in the PDA. Metal leaching and acid rock drainage are caused when sulphide minerals are weathered and exposed to air, producing acid compounds that can dissolve in water if they are not neutralized. Many metals are highly soluble under acidic conditions and may become bioavailable. However, the pH of seawater is near neutral or slightly basic, and it will prevent metals, if present, from dissolving, thus reducing bioavailability to fish and invertebrates. Geochemical testing of the shoreline near the marine terminal has shown there is little risk of acid rock drainage and metal leaching from soils or rock disturbed during terminal construction. For these reasons, acid rock drainage is not expected to result in changes in water or sediment quality close to the marine terminal or in the PEAA.
Compounds used for blasting will not generate nitrogen compounds in the blast residue, as ammonium nitrate-based explosives (nitrate fuel oil mixtures) are not being considered for use. The explosives used for underwater blasting work are very high quality waterproof explosives that do not degrade in the environment. The detonation end products are gaseous and generally consist of carbon dioxide, carbon monoxide, water vapour and some minor nitrous oxide fumes, which do not result in nutrient additions or blast residues in water.
Construction equipment will operated in compliance with the plans outlined in the Construction EPMP (see Volume 7A) and are not expected to contribute detectable levels of contamination to water or sediment in the PEAA.

Sec. 52 Application Volume 6B: Environmental and Socio-Economic Assessment (ESA) – Marine Terminal Section 7: Sediment and Water Quality
Page 7-38 May 2010
Operations
On days when the containment reservoir is emptied, salinity and temperature of water near the point of discharge will be affected. Discharge temperature will be near ambient air temperature, as it is primarily rainwater that will be collected, treated and stored. Discharge salinity will be lower than ambient seawater, with the magnitude of the difference varying with the season. For most of the year, the halocline occurs at 3 to 7 m depth, so the discharge water will be released within the lower salinity surface water where it will disperse by rising to near the surface and assimilated by the tide. Ambient surface salinity ranges from 3 to 21 ppt in Kitimat Arm, fluctuating seasonally with rainfall and daily with tidal movement. The greatest difference in salinity between ambient and discharge waters will occur in the winter, when surface waters of Kitimat Arm are more saline and the water column is not stratified.
Summary
For a summary of residual effects of the Project on altered sediment and water chemistry during construction, operations and decommissioning, see Table 7-9. Changes in sediment and water quality in the PDA may occur during dredging, associated with re-suspension of potentially contaminated sediment. Sediment in the PDA meets federal and provincial guidelines, with the exception of PAHs, copper, chromium, dioxins and furans in some samples. However, the concentrations are well below probable effects levels and are similar through the PDA and at reference sites (i.e., are typical of conditions in the general area of the marine terminal).
Sediment toxicity tests with two marine organisms indicated no chronic toxicity and AVS/SEM results indicated no metal bioavailability. Therefore, the release of small amounts of sediment (approximately 1% of dredged materials) containing these contaminants is unlikely to cause increases in water above applicable guidelines, or increase exposure to aquatic organisms. The magnitude of changes to sediment and water chemistry related to dredging would be low to moderate (some guideline exceedances). The sediment would be released and settle into a similar environment. The geographic extent is assumed to be local (used for the TSS modelling for dredging) because suspended solids would be the main transport mechanism and direction for contaminants. The frequency and duration of environmental effects vary, but they are reversible.
Given the construction methods that will be used and mitigation measures that will be implemented, the effect of construction on water and sediment chemistry is considered to be not significant.

Sec. 52 Application Volume 6B: Environmental and Socio-Economic Assessment (ESA) – Marine Terminal Section 7: Sediment and Water Quality
May 2010 Page 7-39
Table 7-9 Characterization of the Residual Effects of Effects on Sediment and Water Chemistry
Activity Direction
Additional Proposed Mitigation/Compensation
Measures1–3
Residual Environmental Effect
Magnitude
Geographic Extent
Duration/
Frequency
Reversibility
Significance
Potential Measurable Contribution to Regional
Cumulative Environmental Effects
Construction Inwater infrastructure site preparation
A • Dredge technology1 M L M/O R N N
Operations Onshore infrastructure operations and associated site water runoff
A • Oil-water separators on water collection system2
• Discharge away from the marine terminal3
N S S/R R N N
Mitigation: 1. Dredge technology: Use of a dredging system to limit sediment effects where practical (see Construction EPMP, Volume 7A). 2. Oil-water separators on water collection system: Excess water from the impoundment reservoir will be tested to confirm that the concentration of oil is less than
15 parts per million. If the water is found to have oil in excess of 15 parts per million, it will be directed through an oil-water separator before release. 3. Discharge away from the marine terminal: Positioning site water discharge away from the boomed zone of the marine terminal.
Follow-up and Monitoring: Water Quality and Substrate Composition Monitoring Plan: The Water Quality and Substrate Composition Monitoring Plan includes monitoring of the sediment
plume in the marine environment during blasting and dredging. Construction EPMP: The Construction EPMP provides details of monitoring and compliance programs.
KEY Refer to Table 7-2.

Sec. 52 Application Volume 6B: Environmental and Socio-Economic Assessment (ESA) – Marine Terminal Section 7: Sediment and Water Quality
Page 7-40 May 2010
Because applicable regulations for discharge of treated waste water and storm water will be followed during operations—and the variation between ambient and effluent temperature and salinity is localized, of short duration and reversible—no important changes in water or sediment chemistry are expected during routine operations. The effect of terminal operations on sediment and water quality is considered to be not significant.
The potential effects on sediment and water quality during decommissioning are considered to be not significant because few inwater disturbances will occur.
7.6.3 Cumulative Effects Implications There are several existing and proposed industrial and commercial activities in the Kitimat area (see Section 7.5.1). The potential for cumulative effects on sediment and water chemistry considered the small and short-term change in water quality that could arise mainly during construction dredging. Although small changes in sediment and water quality might occur because of the Project, they would be associated mainly with the dredging and blasting activities during the construction phase over a span of 18 weeks. While these short-term activities might overlap with similar effects from existing and proposed activities in the region, cumulative changes in sediment and water quality and other properties are expected to be not significant, especially as construction will not release any new contaminants into the marine ecosystem. Operational discharges will comply with all federal and provincial standards. Because no substantial changes in sediment and water quality are expected, cumulative effects of the Project with other activities are not considered further.
7.6.4 Prediction Confidence There is a high level of certainty for the not-significant prediction for project residual effects and project contribution to cumulative effects on sediment and water quality. Potential levels of contamination were quantified for magnitude and extent, and predicted changes to water and sediment quality are within the range of natural variability.
The quality of the baseline data collected is considered good. Sediment and water chemistry samples were collected using standard sample collection methods for a disposal at sea permit for dredged material and a recognized analytical laboratory completed the chemical analyses. The relatively low variability between samples of the chemical concentrations also indicates data quality. The mitigation measures to reduce sediment release during construction (silt curtain, clamshell dredge) have predictable reliability, resulting in a high degree of confidence in the mitigation strategies. Based on these factors, there is a high degree of confidence in the conclusion that the Project will have low effects on sediment and water quality.

Sec. 52 Application Volume 6B: Environmental and Socio-Economic Assessment (ESA) – Marine Terminal Section 7: Sediment and Water Quality
May 2010 Page 7-41
7.7 Follow-up and Monitoring for Sediment and Water Quality Monitoring will be undertaken during construction to verify the predicted effects on sediment and water quality for both contaminants and TSS and determine the effectiveness of the mitigation measures used to limit sediment and contaminant release during dredging. The programs for the two identified environmental effects will be carried out together and include construction monitoring for TSS and turbidity during dredging. If notably elevated TSS levels (higher than water quality guidelines) are observed beyond the PDA during dredging, additional analysis of samples for contaminants such as PAHs will be included. In addition, the quality of discharge water released from the site during operations will be monitored according to parameters identified in any permits issued for the Project. Monitoring will include compliance monitoring to confirm that the mitigation measures were implemented and effective.
7.8 Summary of Effects for Sediment and Water Quality Dredging for the marine terminal will disturb sediment, releasing up to 1% of the dredged volume from the clamshell planned for use. Coarse sediment will settle quickly and most of the sediment will be contained in a silt curtain. Modelling of TSS levels for the dredging activity predicts a sediment plume extending to the northeast; however, the elevation in TSS levels will be low (0.05 to 1 mg/L TSS) in the water column near the dredge site and difficult to distinguish from ambient TSS levels (18 to 20 mg/L during winter).
Contaminants in the sediment, from historic activities, may also be released during dredging. A sampling program consistent with requirements for a disposal at sea permit for dredged materials2
• PAH levels that exceeded the ocean disposal criterion of 2.5 mg/kg by up to 26% in two of eight samples collected from within the PDA
indicated small but measurable amounts of contaminants; however, chronic toxicity tests with two marine organisms indicated no toxicity of the samples. Details of these samples include:
• copper and chromium levels higher than CCME and British Columbia ISQG in most samples from both the PDA and reference areas
• dioxin and furan levels higher than CCME ISQG but well below PEL in most samples from the PDA
Given the low proportion of sediment leaving the immediate dredge area and contaminant levels that are close to guidelines and not causing toxicity, resuspension and settling of sediments in the Kitimat Arm area are not expected to change ambient conditions.
During operations, discharge of water from the impoundment reservoir away from the marine terminal through a subtidal perforated pipe, might release water of different temperature and composition to the marine environment. However, the water will be at ambient air temperature, and will have been treated to remove hydrocarbons to reduce effects of the discharge on seawater.
2 This analytical approach was taken because, at the time, disposal of dredged material in the ocean was being considered for the Project. Although ocean disposal is no longer planned, the study design is scientifically robust and data are useful for characterization of sediment quality.

Sec. 52 Application Volume 6B: Environmental and Socio-Economic Assessment (ESA) – Marine Terminal Section 7: Sediment and Water Quality
Page 7-42 May 2010
Decommissioning will include removal of infrastructure to the top of the substrate, and reclamation according to the regulations and standards at the time of decommissioning; therefore, no effects on sediment or water quality are predicted.
Cumulative effects of the Project are considered not applicable. Although a small but demonstrable effect would occur, it would be associated mainly with the dredging and blasting activities during the construction phase (to be completed over a span of 18 weeks). Because these short-term activities might overlap with similar effects from existing and proposed activities, cumulative changes in sediment and water quality and other properties are expected to be not significant.
Sediment quality of the PEAA is affected primarily by local municipal and industrial sources of effluent in Kitimat. Although dredging related to the Project will resuspend contaminants, it will not release new contaminants. The approved Kitimat LNG Inc. terminal and the Arthon Construction and Sandhill Materials Sandhill Project are expected to be operational before construction begins for the Kitimat Terminal. Therefore, no overlap in dredging times will occur. During operations, all these projects will comply with effluent discharge guidelines, so will add minimally to current contaminant or TSS levels in the PEAA.
Because of the conditions and mitigation measures described above, effects of project construction, operations and decommissioning on sediment and water quality are considered to be not significant. Similarly, cumulative effects are considered to be not significant (see Table 7-10).

Sec. 52 Application Volume 6B: Environmental and Socio-Economic Assessment (ESA) – Marine Terminal Section 7: Sediment and Water Quality
May 2010 Page 7-43
Table 7-10 Summary of Residual Environmental Effects on Sediment and Water Quality
Potential Effect Mitigation
Residual Environmental Effect
Magnitude Geographic
Extent Duration/
Frequency Reversibility Significance Prediction Confidence
Construction
• Altered suspended sediment levels
• Altered sediment and water chemistry
• Dredge technology1 • Silt curtains2 • Spill and leak prevention3
L S/L M or L/O R N H
Operations
• Altered suspended sediment levels
• Altered sediment and water chemistry
• Oil-water separators on water collection system4
• Discharge, away from the marine terminal5
L L S/R R N H
Cumulative Environmental Effects
• Not applicable
Combined Effects Project-specific • Same as for individual
effects L S/L S/S R N H
Cumulative effects • Same as for individual effects
L S/L S/S R N H

Sec. 52 Application Volume 6B: Environmental and Socio-Economic Assessment (ESA) – Marine Terminal Section 7: Sediment and Water Quality
Page 7-44 May 2010
Table 7-10 Summary of Residual Environmental Effects on Sediment and Water Quality (cont’d) Mitigation: 1. Dredge technology: Use of a dredging system to limit sediment effects where practical (see Construction EPMP, Volume 7A). 2. Silt curtains: Use of silt curtains where practical to limit dispersion of silt during dredging and blasting (see Construction EPMP, Volume 7A. 3. Spill and leak prevention: The Construction EPMP (Volume 7A) describes the protection plans that will be implemented during construction activities. 4. Oil-water separator: Excess water from the impoundment reservoir will be tested to confirm that the concentration of oil is less than 15 parts per million. If the
water is found to have oil in excess of 15 parts per million, it will be directed through an oil-water separator prior to its release. 5. Discharge away from the marine terminal: Positioning site water discharge away from the boomed zone of the marine terminal.
Follow-up and Monitoring: Water Quality and Substrate Composition Monitoring Plan: The Water Quality and Substrate Composition Monitoring Plan includes monitoring of the sediment
plume in the marine environment during blasting and dredging. KEY Refer to Table 7-2.

Sec. 52 Application Volume 6B: Environmental and Socio-Economic Assessment (ESA) – Marine Terminal Section 7: Sediment and Water Quality
May 2010 Page 7-45
7.9 References
7.9.1 Literature Cited Beckett, J. and K. Munro. 2010. Marine Fish and Fish Habitat Technical Data Report. Prepared for
Enbridge Northern Gateway Inc. Calgary, AB.
Bornhold, B.D. 1983. Sedimentation in the Douglas Channel and Kitimat Arm. In R. W. MacDonald (ed.). Proceedings of a Workshop on the Kitimat Marine Environment. Paper presented at the Proceedings of a workshop on the Kitimat Marine Environment. Institute of Ocean Sciences, DFO. Sidney, BC. 88–114.
Canadian Council of Ministers of the Environment (CCME). 2004. Canadian Sediment Quality Guidelines for the Protection of Aquatic Life: Dioxins and Furans. Canadian Council of Ministers of the Environment. Winnipeg, MB.
Canadian Council of Ministers of the Environment (CCME). 2007. Canadian Environmental Quality Guidelines. Canadian Council of Ministers of the Environment. Winnipeg, MB. (updated from 1999 Edition).
Cretney, W.J., C.S. Wong, R.W. MacDonald, P.E. Erikson and B.R. Fowler. 1983. Polycyclic Aromatic Hydrocarbons in Surface Sediments and Age-Date Cores from Kitimat Arm, Douglas Channel and Adjoining Waterways. In R. W. MacDonald (ed.). Proceedings of a workshop on the Kitimat marine environment. Paper presented at the Proceedings of a workshop on the Kitimat marine environment, Institute of Ocean Sciences, DFO. Sidney, BC. 162–195.
Di Toro, D.M., J.D. Mahony, D.J. Hansen, K.J. Scott, A.R. Carlson and G.T. Ankley. 1992. Acid Volatile Sulphide Predicts the Acute Toxicity of Cadmium and Nickel in Sediments. Environmental Science & Technology 26: 96–101.
Eickhoff, C.V., S.X. He, F.A.P.C. Gobas and F.C.P. Law. 2003. Determination of Polycyclic Aromatic Hydrocarbons in Dungeness Crabs (Cancer magister) Near an Aluminum Smelter in Kitimat Arm, British Columbia, Canada. Environmental Toxicology and Chemistry 22(1): 50–58.
Erickson, P., B.R. Fowler, D.A. Brown, W. Heath and K. Thompson. 1979. Hydrocarbon Levels in the Marine Environment of Kitimat Arm and Its Seaward Approaches. Seakem Oceanography Ltd. Sidney, BC.
EVS Environmental Consultants (EVS). 1995. Alcan Marine Monitoring Program 1994 Intensive Study. EVS Environmental Consultants. North Vancouver, BC. Report No. 3/045-11.
Fissel, D., J. Jiang and K. Borg. 2006. Spatial Distribution of Suspended Sediment Concentrations and Sediment Deposition from Marine Terminal Dredging Operations. Sidney, BC. Unpublished report prepared for Jacques Whitford Ltd. by ASL Environmental Sciences. Burnaby, BC.
Harris, G.E. 1999. Assessment of the Assimilative Capacity of Kitimat Arm, British Columbia: A case Study Approach of the Sustainable Management of Environmental Contaminants. Ph.D. thesis. Simon Fraser University. Burnaby, BC.

Sec. 52 Application Volume 6B: Environmental and Socio-Economic Assessment (ESA) – Marine Terminal Section 7: Sediment and Water Quality
Page 7-46 May 2010
Jacques Whitford. 2005. Application for Approval. Kitimat Liquid Natural Gas Project, Environmental Assessment Certificate Application. Burnaby, BC.
MacDonald, R.W. 1983. The Distribution and Dynamics of Suspended Particles in Kitimat Fjord System. In R. W. MacDonald (ed.). Proceedings of a workshop on the Kitimat marine environment. Paper presented at the Proceedings of a workshop on the Kitimat marine environment. Institute of Ocean Sciences, DFO. Sidney, B.C. 116–137.
Norecol Dames & Moore Inc. 1997. Eurocan Pulp and Paper Ltd.: First Cycle Environmental Effects Monitoring Program. Final report. Vancouver, BC.
Paine, M.D., P.M. Chapman, P.J. Allard, M.H. Murdoch and D. Minifie. 1996. Limited Bioavailability of Sediment PAH Near an Aluminum Smelter: Contamination Does not Equal Effects. Environmental Toxicology and Chemistry 15(11):2003–2018.
Pickard, G.L. 1961. Oceanographic Features of Inlets in the British Columbia Mainland Coast. Journal of Fisheries Research Board of Canada 18:907–982.
Simpson, C.D. 1997. Some Aspects of the Distribution and Fate of Polycyclic Aromatic Hydrocarbon Contamination in the Kitimat Fjord System. Ph.D. thesis. University of British Columbia, Vancouver, BC.
Van den Berg, M., L. Birnbaum, A.T. Bosveld, B. Brunstrom, P. Cook, M. Feeley, J.P. Giesy, A. Hanberg, R. Hasegawa, S.W. Kennedy, T. Kubiak, J.C. Larsen, F.X. van Leeuwen, A.K. Liem, C. Nolt, R.E. Peterson, L. Poellinger, S. Safe, D. Schrenk, D. Tillitt, M. Tysklind, M. Younes, F. Waern, and T. Zacharewski. (1998). Toxic equivalency factors (TEFs) for PCBs, PCDDs, PCDFs for humans and wildlife. Environmental Health Perspectives 106(12): 775–792.
Warrington, P.D. 1987. Skeena-Nass Area, Lower Kitimat River and Kitimat Arm Water Quality Assessment and Objectives: Technical Appendix. Resource Quality Section, Water Management Branch, Ministry of Environment and Parks. Victoria, B.C.
Warrington, P.D. 1993. Lower Kitimat River and Kitimat Arm Water Quality Assessment and Objectives: First Update (draft). Water Quality Branch, Water Management Branch, Ministry of Environment, Lands and Parks. Victoria, BC.
7.9.2 Internet Sites British Columbia Ministry of Environment (BC MoE). 1987. Water Quality Assessment and Objectives
for the Lower Kitimat River and Kitimat Arm: Overview Report. Accessed: September 2008. Available at: http://www.env.gov.bc.ca/wat/wq/objectives/kitimat/kitimat.html
British Columbia Ministry of Environment (BC MoE). 2006. British Columbia Approved Water Quality Guidelines. Ministry of Environment, Science and Information Branch. Accessed: September 2008. Available at: http://www.env.gov.bc.ca/wat/wq/BCguidelines/approv_wq_guide/approved.html

Sec. 52 Application Volume 6B: Environmental and Socio-Economic Assessment (ESA) – Marine Terminal Section 7: Sediment and Water Quality
May 2010 Page 7-47
Environment Canada. 2008. Minimum Requirements for Dredged Materials Pacific and Yukon Region. Accessed: September 2008. Available at: http://www.pyr.ec.gc.ca/ep/ocean-disposal/english/table1_e.htm
Nagpal, N.K., L.W. Pommen and L.G. Swain. 2006. A Compendium of Working Water Quality Guidelines for British Columbia. Accessed: November 2008. Available at: http://www.env.gov.bc.ca/wat/wq/BCguidelines/working.html


Sec. 52 Application Volume 6B: Environmental and Socio-Economic Assessment (ESA) – Marine Terminal Section 8: Marine Vegetation
May 2010 Page 8-1
8 Marine Vegetation Marine vegetation has ecological importance as food, refuge and rearing habitat for invertebrates and juvenile fish. Eelgrass, rockweed and marine riparian vegetation are key indicators. Potential environmental effects assessed include changes in habitat quality from increased sedimentation or exposure to contaminants from re-suspended sediments and habitat availability because of construction dredging, blasting and clearing of the foreshore. Mitigation will include reducing sedimentation by using sediment settlement ponds, silt fences and silt curtains and managing surface water drainage. After mitigation, the effects of the Project are not expected to cause a long-term decline in abundance, distribution or ecological function of marine vegetation, and residual effects are expected to be not significant. Where adverse effects cannot be avoided or mitigated, a compensation plan will be developed in cooperation with Fisheries and Oceans Canada (DFO), and according to DFO’s policies and mandate, to offset the corresponding loss of habitat productive capacity.
8.1 Setting for Marine Vegetation The algal species diversity of the rocky intertidal community in Kitimat Arm is generally low, with rockweed (Fucus distichus ssp. edentatus) and sea lettuce (Ulva spp.) being the dominant seaweeds. Relatively undisturbed marine riparian vegetation runs continuously along the shoreline between the Town of Kitimat and Bish Cove and most of Kitimat Arm. Marine vegetation provides habitat for numerous intertidal and subtidal invertebrates and nearshore fish.
The soft bottom estuaries in the Kitimat Arm are dominated by eelgrass, a marine vascular plant that provides important habitat for many juvenile fish such as pink salmon and invertebrates such as Dungeness crab. Sandy areas are also inhabited by commercially harvested bivalves such as butter clams and cockles.
Detailed descriptions of the marine-associated life in Kitimat Arm can be found in the Marine Fish and Fish Habitat Technical Data Report (Beckett and Munro 2010).
8.2 Scope of Assessment for Marine Vegetation
8.2.1 Key Project Issues for Marine Vegetation Construction, operations and decommissioning of the marine terminal could affect marine vegetation through:
• changes in habitat quality • changes in habitat availability • direct mortality
The change in foreshore habitat resulting from project activities at the marine terminal will result in direct mortality of marine vegetation.

Sec. 52 Application Volume 6B: Environmental and Socio-Economic Assessment (ESA) – Marine Terminal Section 8: Marine Vegetation
Page 8-2 May 2010
Potential environmental effects were determined based on the scope of factors from the Joint Review Panel, and input from regulators, participating Aboriginal groups, resource managers, scientists and the general public, as well as professional judgement. For a summary of these environmental effects and their likelihood of occurrence during each of the project phases, see Table 8-1.
Table 8-1 Potential Environmental Effects on Marine Vegetation This table identifies the potential environmental effects on marine vegetation that are assessed in this section of the ESA. Each of these environmental effects is discussed in more detail later in this section. Recommendations for mitigation and, if required, follow-up and monitoring are also provided. With the implementation of these mitigation measures where appropriate, the Project is not likely to cause significant adverse environmental effects on marine vegetation due to changes in habitat quality or habitat availability.
Project Activities and Physical Works
Key Environmental Effects on Marine Vegetation Relevance to the Assessment
Considered in the ESA Kitimat Terminal
Construction • Onshore infrastructure site
preparation (clearing, burning, grading, blasting)
• Onshore infrastructure construction (tank terminal, inter-connector pipes, support buildings, pumps, etc.)
• Change in habitat quality • Change in habitat availability
• Changes to fish habitat (marine vegetation communities) may require habitat compensation under regulations in the Fisheries Act
• Direct effects of project activities on riparian vegetation
• Increase in total suspended solids (TSS) and discharge/re-suspension of contaminants may interfere with the ability of eelgrass and rockweed to photosynthesize and may affect marine vegetation establishment and health
• Presence of the infrastructure may affect habitat available for marine riparian vegetation

Sec. 52 Application Volume 6B: Environmental and Socio-Economic Assessment (ESA) – Marine Terminal Section 8: Marine Vegetation
May 2010 Page 8-3
Table 8-1 Potential Environmental Effects on Marine Vegetation (cont’d) Project Activities and
Physical Works Key Environmental Effects on
Marine Vegetation Relevance to the Assessment Considered in the ESA (cont’d)
Kitimat Terminal (cont’d) Construction (cont’d) • Inwater infrastructure site
preparation (dredging, blasting, pile drilling
• Inwater infrastructure construction (marine terminal, berths, pile installation)
• Change in habitat quality • Change in habitat availability
• Changes to fish habitat (marine vegetation communities) may require habitat compensation under regulations in the Fisheries Act
• Direct effects of project activities on rockweed
• Increase in TSS and discharge or re-suspension of contaminants may interfere with the ability of eelgrass and rockweed to photosynthesize and may affect marine vegetation health
• Presence of the infrastructure may affect habitat available for rockweed (e.g., substrate available, light conditions)
Operations • Onshore infrastructure
operations (tank terminal, associated site water runoff, lights, noise, waste water disposal, emissions)
• Onshore infrastructure PDA (tank terminal, less permeable surfaces, storm water management systems)
• Change in habitat quality • Change in habitat availability
• Increase in TSS may interfere with the ability of eelgrass and rockweed to photosynthesize
• Presence of the infrastructure may affect habitat available for vegetation (e.g., substrate available, light conditions)
• Inwater infrastructure operations (marine terminal, berths and associated lights, noise shading and underwater structures)
• Change in habitat quality • Change in habitat availability
• Increase in TSS may interfere with the ability of eelgrass and rockweed to photosynthesize
• Presence of the infrastructure may affect habitat available for rockweed (e.g., substrate available, light conditions)

Sec. 52 Application Volume 6B: Environmental and Socio-Economic Assessment (ESA) – Marine Terminal Section 8: Marine Vegetation
Page 8-4 May 2010
Table 8-1 Potential Environmental Effects on Marine Vegetation (cont’d) Project Activities and
Physical Works Key Environmental Effects on
Marine Vegetation Relevance to the Assessment Not Considered in the ESA
Decommissioning • Onshore site restoration
(infrastructure removal, site rehabilitation and reclamation)
• No effect anticipated As effects would be similar to those described for construction, but of a lower magnitude, geographic scope and duration, they are not assessed.
• Inwater infrastructure site restoration (infrastructure removal)
• No effect anticipated As effects would be similar to those described for construction, but of a lower magnitude, geographic scope and duration, they are not assessed.
All vessels using the Kitimat Terminal will be required to follow requirements for ballast water management and discharge under the Canada Shipping Act, Canadian Ballast Water Control and Management Regulations (BWCMR), and to implement an International Maritime Organization (IMO) approved Ballast Water Management Plan. Oil tankers will have segregated ballast on board that has been exchanged not less than 200 nautical miles from shore, as described by the Ballast Water Management Procedures under the BWCMR. Oily ballast water will not be discharged at the Kitimat Terminal. Solid waste and liquid waste will be managed according to the Canadian Shipping Act.
The Kitimat Terminal will have oil-water separation facilities on the foreshore to receive, treat and recover oil from the vessel’s cargo slops tanks. Although the Kitimat Terminal will not provide on-site facilities to treat or dispose of engine room slops, it will offer a service provided by a third-party contractor, which will use vacuum trucks to receive and transfer the slops to an offsite facility for proper disposal.
Because bilge and ballast water will be managed in accordance with these requirements, adverse effects from the bilge and ballast water at the terminal are not anticipated and will not be discussed further in the assessment of marine vegetation.
8.2.2 Selection of Key Indicators and Measurable Parameters for Marine Vegetation
The following key indicators (KIs) represent important spatial and temporal ecological elements of the marine vegetation valued environmental component (VEC):
• eelgrass (Zostera marina) • rockweed (Fucus distichus ssp. edentatus) • marine riparian vegetation
These KIs are representative of marine vegetation taxa in Kitimat Arm that can be grouped together based on similar life requisites.

Sec. 52 Application Volume 6B: Environmental and Socio-Economic Assessment (ESA) – Marine Terminal Section 8: Marine Vegetation
May 2010 Page 8-5
Eelgrass (Zostera marina) is a KI because it is an ecologically important species in the region and occurs in Kitimat Arm. Eelgrass can form extensive subtidal, perennial beds widely recognized as important nearshore habitat for juvenile (and adult) invertebrates and fish (Chambers et al. 1999). Eelgrass beds provide cover from predation, reduce local water currents (allowing for settlement of organisms) and increase secondary productivity by adding to local habitat complexity and surface area (Vandermeulen 2005). Eelgrass has been deemed a “sensitive habitat” by DFO and is threatened by coastal development worldwide.
Rockweed (Fucus distichus ssp. edentatus) is a KI because of its ecological importance and relative abundance throughout Kitimat Arm. It has the largest macrophyte (seaweed) biomass in the region and provides food and shelter for a number of nearshore organisms. Large-scale alterations to rockweed abundance and distribution would trigger wide-ranging effects on the intertidal and subtidal communities in the region.
Marine riparian vegetation is a KI because of its role as incubation, rearing and migratory habitat for several commercially important fish species, such as salmonids. Unaltered marine riparian habitat runs continuously along shorelines in Kitimat Arm because of relatively limited shoreline development. Marine riparian vegetation (e.g., shrubs, trees, grasses, forbs) grows at the interface between terrestrial and marine environments on land bordering tidewater (Brennan and Culverwell 2004). Although there has been limited research on marine riparian vegetation, evidence suggests it is important for food production, water temperature regulation and wave energy absorption (Levings and Jamieson 2001).
The environmental effects of the project activities on marine vegetation are characterized by first identifying ecological and habitat requirements and then relating these to the project activities. Potential environmental effects from the project activities are described based on relevant research and literature, and professional experience.
The following measurable parameters are identified for each of the three KIs for each of the environmental effects:
• changes in habitat availability were assessed by estimating the differences in existing baseline habitat conditions with future habitat conditions
• changes in habitat quality were assessed using predicted changes in total suspended solids (TSS) in the water column
8.2.3 Spatial Boundaries for Marine Vegetation The assessment areas for marine vegetation are (see Figure 8-1):
• the marine PDA, which encompasses the area disturbed by project activities at the marine terminal
• the PEAA, which includes all areas where routine project activities could cause vegetation mortality, influence vegetation health, or remove suitable habitat for vegetation growth. Changes in habitat quality due to movement of suspended sediment from project activities such as dredging and blasting are anticipated to have the widest potential geographic effect. So, the PEAA has been selected conservatively to encompass a relatively large area from Minette Bay south to a boundary between Emsley Point and Coste Point.

200 m
100
m
100 m
200 m
100
m
300 m
200
m
100
m
Kitimat
Minette Bay
KitamaatVillage
KitimatTerminal
K i t i
m a
t A
r m
BishCove
EmsleyCove
EmsleyPoint
CostePoint
CosteIsland
ClioBay
GobeilBay
Kitimat River
CreekBish
200 m
Pipeline Route
Security Fence
Terrestrial PDA
Marine PDA
Marine PEAA
Bathymetric Contour (100 m)
Railway
Road
NP
Jacques Whitford AXYS Ltd.
FIGURE NUMBER:
PROJECTION:
CONTRACTOR: DATE:
AUTHOR: APPROVED BY:PREPARED FOR:PREPARED BY: SCALE:
Marine Vegetation - PDA and PEAA
ENB R ID GE N OR TH ER N GA TEW A Y PR OJ EC T 8-1
NAD 83DATUM:
1:110,000
UTM 9
CM
Kitimat River
0 1 2 3
Kilometres
JWA-1048334-1587
REFERENCES: NTDB Topographic Mapsheets provided by the Majesty the Queen in Right of Canada, Department of Natural Resources. All rights reserved.
20090911
R:\2
009F
isca
l\104
8334
_Nor
ther
nGat
eway
_ES
A_2
009Reference: Pipeline Route R

Sec. 52 Application Volume 6B: Environmental and Socio-Economic Assessment (ESA) – Marine Terminal Section 8: Marine Vegetation
May 2010 Page 8-7
8.2.4 Temporal Boundaries for Marine Vegetation The temporal boundaries of the effects assessment include the lifespan of the Project, from construction through operations. Environmental effects on marine vegetation are expected to occur primarily during construction (e.g., onshore site preparation, inwater infrastructure site preparation and construction). There will be no additional clearing of marine vegetation or increased sedimentation after construction. Effects on marine vegetation during decommissioning will be similar to those described for construction but will be less substantial due to the geographic scope and duration of activities; as a result, these effects are not considered in detail in the remainder of this assessment.
8.2.5 Regulatory Setting or Administrative Boundaries for Marine Vegetation Fisheries and Oceans Canada regulates all activities that might affect fish habitat under the Fisheries Act.
The Fisheries Act defines fish habitat as “spawning and nursery grounds, rearing, food supply and migration areas on which fish depend directly or indirectly to carry out their life processes.” The Act includes all the life stages of “shellfish, crustaceans, marine animals and any parts of shellfish, crustaceans or marine animals.” Marine vegetation is an important aspect of fish habitat.
DFO’s long-term objective is to achieve an overall net gain of the productive capacity of fish habitats. A “no net loss” principle guides DFO to “balance unavoidable habitat losses with habitat replacement on a project-by-project basis so that further reductions to Canada’s fisheries resources due to habitat loss or damage may be prevented” (DFO 1986).
8.2.6 Definition of Environmental Effects Attributes for Sediment and Water Quality
Effects on marine vegetation are characterized according to expected direction, magnitude, geographic extent, duration, frequency and reversibility.
Direction
• positive: enhances vegetation or vegetation’s function as habitat • adverse: detrimental to vegetation or vegetation’s function as habitat
Magnitude
• negligible: no measurable adverse environmental effects are anticipated
• low: affects a specific group of localized individuals within a population but does not affect other trophic levels or the population itself
• moderate: affects a portion of the local population but does not threaten the integrity of that population or any population dependent upon it
• high: affects the local population to the degree that may threaten the integrity of that population or any population dependent upon it

Sec. 52 Application Volume 6B: Environmental and Socio-Economic Assessment (ESA) – Marine Terminal Section 8: Marine Vegetation
Page 8-8 May 2010
Geographic Extent • site specific: the PDA • local: the PEAA • regional: extends beyond the PEAA
Duration • short term: effects noticeable during construction and decommissioning • medium term: effects noticeable less than two years after construction is complete • long term: effects noticeable more than two years after construction is complete • permanent: effects are permanent
Frequency • occurs once • occurs occasionally • occurs regularly • continuous
Reversibility • reversible • irreversible
8.2.7 Determination of Significance for Marine Vegetation The environmental effects on marine vegetation populations are categorized as significant if they are expected to cause a long-term decline in abundance, distribution, or ecological function of the local population or species, beyond which natural recruitment will not return that population or species, or any population or species dependent upon it, to its former level within several generations.
Environmental effects that affect marine vegetation populations or communities (or their habitat) in the PEAA over a short period (i.e., over the period of one season) in a manner similar to natural variation or have no measurable effect on the integrity of the regional population are considered not significant.
8.3 General Mitigation Measures for Marine Vegetation During construction, operations and decommissioning, the following mitigation measures will be implemented to reduce the adverse environmental effects of activities such as blasting, dredging and pile drilling, and consequently reduce the potential for changes in habitat availability, changes in habitat quality and risks of direct mortality:
• habitat compensation plan – A habitat compensation plan will be prepared for harmful alteration, disruption or destruction of fish habitat (HADD) under Section 35(2) of the Fisheries Act. Marine vegetation provides important habitat for nearshore fish and migratory juvenile salmon. The plan will outline mitigation measures to reduce potential effects of the Project on marine vegetation loss in the PEAA. Under the Fisheries Act, DFO is responsible for the determination of a HADD and the acceptance of a habitat compensation plan.

Sec. 52 Application Volume 6B: Environmental and Socio-Economic Assessment (ESA) – Marine Terminal Section 8: Marine Vegetation
May 2010 Page 8-9
• Construction Environmental Protection and Management Plan (EPMP) – This plan (see Volume 7A) outlines the protection measures developed by Northern Gateway to reduce potential environmental effects associated with routine activities during construction. Sediment management measures incorporated in the Construction EPMP include the use of silt curtains, sediment settlement ponds, and managing surface water drainage, as appropriate. These measures are included in the Erosion and Sediment Control Plan (see Volume 7A, Appendix A.3.5) and the Storm Water Management Plan (see Volume 7A, Appendix A.3.4) that are part of the EPMP. These plans will be implemented to manage surface water drainage during construction to reduce sedimentation in nearshore waters.
8.4 Assessment Methods for Marine Vegetation
8.4.1 Data Sources and Fieldwork Literature, aerial photographs, government data and community mapping initiatives were reviewed to determine the presence, diversity and abundance of marine vegetation in the PDA and PEAA. Field programs included foreshore assessment and underwater video surveys at the marine PDA (see the Marine Fish and Fish Habitat TDR).
8.4.2 Analytical Techniques The Marine Fish and Fish Habitat TDR provides details on field studies, modelling and laboratory work completed for this assessment, including sediment plume modelling and sediment chemistry analysis. Intertidal transect surveys and subtidal video surveys were completed at the marine terminal to confirm the presence of various marine vegetation species in the PDA. The extent of marine riparian vegetation in the PDA was assessed using an overlay of the Kitimat Terminal PDA on a vegetation map of the area.
8.5 Ecology and Habitat Requirements for Marine Vegetation
8.5.1 Eelgrass
8.5.1.1 Status
Eelgrass communities have been generally described as one of the richest and most productive ecosystems in the world (Phillips 1984); productivity rates reported in the Pacific Northwest range from 200 to 806 g C/m2/y (grams of carbon per square metre per year) (Williams and Thom 2001).
Eelgrass comprises part of the foundation of marine food webs, providing a food source for invertebrates as well as migrating juvenile and adult fish. It provides critical habitat for numerous ecologically and commercially important species at various life history stages, including outmigrating juvenile salmon (Oncorhynchus spp.), Pacific herring (Clupea harengus), Dungeness crab (Cancer magister), Great Blue Heron (Ardea herodias) and Black Brant (Branta bernicla) (Phillips 1984; Simenstad 1994; Wilson and Atkinson 1995). The Marine Fish and Fish Habitat TDR provides a detailed explanation of the role of eelgrass has in marine food webs.
Sec. 52 Application Volume 6B: Environmental and Socio-Economic Assessment (ESA) – Marine Terminal Section 8: Marine Vegetation
Page 8-10 May 2010
8.5.1.2 Seasonal Distribution, Population Trends and Habitat Requirements
The seasonal distribution and occurrence of eelgrass in coastal ecosystems is influenced by a combination of biotic and abiotic factors, such as desiccation, temperature, salinity and water motion. Eelgrass prefers soft substrates in either muddy or sandy conditions. In the PEAA, estuarine shorelines with mud flats and marsh habitats compose 15% of total shoreline (see the Marine Fish and Fish Habitat TDR). Shoots are susceptible to scour and wave action and are typically found in more sheltered waters.
The steep and rocky characteristics of the shoreline at the marine terminal hinder eelgrass growth within the PDA. However, intertidal surveys revealed small patches of eelgrass in the PEAA (see the Marine Fish and Fish Habitat TDR). The largest eelgrass bed found during the surveys was in the Bish Creek estuary, to the south of the marine PDA.
The Marine Fish and Fish Habitat TDR provides details on the seasonal distribution, occurrence and specific habitat requirements of eelgrass within the PEAA.
8.5.1.3 Limiting Factors
Although eelgrass, and the marine communities associated with it, is common in coastal waters of British Columbia, global populations are in decline as a result of loss and alteration of estuarine and nearshore habitats (Erftemeijer and Lewis III 2006). Threats include human activities such as dredging and filling, as well as alteration of water chemistry from unhealthy watersheds, docks, other hard structures on the shoreline and toxic releases. Eelgrass may also be detrimentally affected by global climate change (Short and Neckles 1999).
Historical and existing industrial development in Kitimat Arm may restrict the abundance and distribution of eelgrass. Existing projects in Kitimat Arm include the Eurocan Pulp and Paper Co.’s plant and terminal, Rio Tinto Alcan Primary Metal BC aluminum smelter, Kitimat LNG Inc. terminal, Methanex Corporation’s plant and terminal and the Arthon Construction Ltd. and Sandhill Materials Sandhill Project, as well as several smaller developments (see Appendix 3A). It is suspected that coastal development has adversely affected eelgrass presence in these areas, prompting local groups to spearhead eelgrass transplant efforts (Horwood 2006, pers. comm.). Few threats to eelgrass populations exist within the remainder of the PEAA, as this area has not been subjected to large-scale development.
8.5.2 Rockweed
8.5.2.1 Status
Rockweed (Fucus distichus ssp. edentatus) is a common species of intertidal seaweed that dominates mid to high rocky intertidal regions of the Pacific coast of Canada and the United States, ranging from California to Alaska. Like eelgrass, it forms part of the foundation of the marine food web and provides complex structural habitat for numerous invertebrate and fish species.

Sec. 52 Application Volume 6B: Environmental and Socio-Economic Assessment (ESA) – Marine Terminal Section 8: Marine Vegetation
May 2010 Page 8-11
8.5.2.2 Seasonal Distribution, Population Trends and Habitat Requirements
Rockweed is a perennial alga that persists throughout winter. Growth occurs predominantly in the summer when light levels are increased.
Rockweed is most common in wave-sheltered to moderately exposed coasts in the upper intertidal zone (Druehl 2000). Because there is a limited abundance of laminarians (kelp) in the PEAA, rockweed is not limited by competition and is able to extend into the low intertidal zone. The PEAA provides ample habitat for rockweed; rocky shores dominate the intertidal zone, accounting for 39% of the total shoreline of the PEAA (see the Marine Fish and Fish Habitat TDR). Additionally, rockweed commonly colonizes anthropogenic structures.
The Marine Fish and Fish Habitat TDR provides additional information on the role of rockweed within the marine ecosystem, the seasonal distribution and occurrence of rockweed within the PEAA, and specific habitat requirements.
8.5.2.3 Limiting Factors
Rockweed abundance and distribution in British Columbia is stable and no limiting factors have been identified.
8.5.3 Marine Riparian Vegetation
8.5.3.1 Status
Because most riparian research has been done on freshwater systems, the information available on marine riparian vegetation and associated biota is limited. However, evidence suggests that marine riparian vegetation plays a major role in fish health by providing habitat for feeding and spawning. It also likely plays a key role in stabilizing the upper shore by limiting and filtering freshwater runoff into the nearshore marine ecosystem (Levings and Jamieson 2001).
8.5.3.2 Seasonal Distribution, Population Trends and Habitat Requirements
Marine riparian systems are areas on land bordering tidewater and constitute the interface between terrestrial and aquatic ecosystems (Brennan and Culverwell 2004). These systems may include vegetated or non-vegetated areas shoreward of the higher high water, large tide (HHWLT). They are distinguished by gradients in biophysical conditions, ecological processes and biota (National Research Council [NRC] 2002). They include those portions of terrestrial ecosystems that have a considerable influence on exchanges of energy and matter with aquatic ecosystems.
Marine riparian vegetation is considered to be any vegetation within 20 to 30 m of the tidewater. In the PDA, marine riparian vegetation grows on a steep, rocky shoreline well above the high water mark, although it may receive saltwater spray during storms. The marine riparian zone adjacent to the marine terminal is densely populated with western hemlock, western red cedar, Amabilis fir, Sitka spruce and some Douglas fir. Small shrubs occupy the shoreward limits of the zone, and mature forest stands extend inland from the shoreline, except for recently harvested areas (i.e., cutblocks) that support early successional vegetation.

Sec. 52 Application Volume 6B: Environmental and Socio-Economic Assessment (ESA) – Marine Terminal Section 8: Marine Vegetation
Page 8-12 May 2010
8.5.3.3 Limiting Factors
Marine riparian vegetation is often removed or reduced as a consequence of shoreline development.
8.6 Effects on Marine Vegetation – Habitat Availability
8.6.1 Baseline Conditions The shoreline in the marine PDA is predominantly composed of two classes: rock cliff and rock with sand and gravel beach. These two shore types compose 14.5% of the total shoreline types in the PEAA. Approximately 69% of the 70 km of shoreline in the PEAA is suitable rockweed habitat. The shoreline found in the marine PDA does not represent unique habitat and is commonly found throughout the PEAA. Habitat in the marine PDA is currently undisturbed by anthropogenic development.
8.6.2 Effects on Marine Vegetation – Habitat Availability
8.6.2.1 Effect Mechanisms
Construction
During construction, total overburden dredging quantities for the berth structures will be approximately 30,000 m3. Total rock blasting (cut) quantities for the berth structures will be approximately 25,000 m3. Dredging and blasting areas will overlap. Although the exact locations and areal extent where these two activities will occur are not known, most will be in deeper water away from the intertidal zone. Clearing the foreshore for the marine terminal is expected to remove 20,000 to 30,000 m2 of marine riparian habitat (i.e., 1000 m long and 20 to 30 m wide). The total area of intertidal habitat that will be affected is not known at this time but is assumed to be less than 2,400 m2 (total marine terminal disturbed area between the highest high tide mark, out to 5 m water depth, and along the shoreline for the extent of the marine terminal infrastructure).
The installation of berthing structures will create additional hard substrate at suitable depth and light conditions for colonization by some algal species. It is assumed most of this area, with the exception of areas that will be contacted by vessels, will be suitable for colonization.
Major functions of the marine riparian zone include stabilizing the upper shore and limiting freshwater runoff (see Section 8.5.3.1). The shoreline at the PDA is narrow, steep and rocky, with a tree line 20 to 30 m from the water’s edge. Although the steep slope of the coastline at the PDA and removal of marine riparian vegetation from these slopes could result in increased runoff, reduced water quality and increased potential for slope failure, temporary and permanent surface water management measures will be used to limit runoff into the marine environment and changes in water quality.
Shading is another important function of marine riparian and intertidal vegetation along rocky shores. Removal of marine vegetation in the marine PDA will result in changes to foreshore habitat. Loss of shading could increase desiccation of intertidal species and, in turn, alter community structure and distribution.

Sec. 52 Application Volume 6B: Environmental and Socio-Economic Assessment (ESA) – Marine Terminal Section 8: Marine Vegetation
May 2010 Page 8-13
Operations
Changes in habitat as a result of the marine terminal will persist into operations, because of shading and exclusion due to infrastructure placement. Reduced light interferes with seaweed growth in the affected area. There are no eelgrass beds within the PDA, therefore; only intertidal seaweeds such as rockweed will be affected. As mentioned previously, the hard substrates added (e.g., berths, pilings) will be suitable for colonization by some species of marine vegetation.
Approximately 2,400 m2 of marine vegetation habitat will be shaded by the terminal for the life of the Project. Habitat in the shaded area will not be suitable for rockweed as light requirements will not be met.
Decommissioning
The Kitimat Terminal will be removed to the top of the substrate and reclaimed according to the regulations and standards at the time of decommissioning. Removal of inwater infrastructure will result in the mortality of marine vegetation (i.e., rockweed) that has colonized the terminal infrastructure.
8.6.2.2 Mitigation and Effects Management
As noted in Section 8.3, an Erosion and Sediment Control Plan and a Storm Water Management Plan will be used to reduce the effects of slope erosion and associated surface runoff and sedimentation into the marine environment. During construction of the marine terminal disturbance to marine riparian vegetation and intertidal areas will be limited, where practical.
As discussed in Section 8.3, a suite of measures will be used to reduce effects of dredging and blasting on marine vegetation and other marine species. Key measures will include, as appropriate:
• using silt curtains and plume monitoring
• implementing the Erosion and Sediment Control Plan and the Storm Water Management Plan from the Construction EPMP (see Volume 7A)
• implementing a habitat compensation plan
8.6.2.3 Residual Effects
The preparation of the marine terminal site and the installation of associated infrastructure will result in the loss of up to 30,000 m2 of marine riparian vegetation and approximately 2,400 m2 of suitable habitat for marine algal species such as rockweed. Direct mortality of rockweed and marine riparian vegetation will result from removal of this habitat. The magnitude of changes in the availability of eelgrass are considered to be negligible given that only a few isolated patches of eelgrass were located within the PDA and no large concentrations of eelgrass (such as in Bish Cove) will be affected by the Project.
The marine PDA contains approximately 45 km2 of rockweed habitat and 18 km2 of marine riparian vegetation (see the Marine Fish and Fish Habitat TDR). The change in marine riparian habitat at the marine terminal therefore represents approximately 0.2% of the available marine riparian habitat in the PEAA. Clearing of this area will persist for the life of the Project, but the area will be reclaimed and restored at decommissioning. Given the site-specific nature of the habitat loss and the reversible nature of

Sec. 52 Application Volume 6B: Environmental and Socio-Economic Assessment (ESA) – Marine Terminal Section 8: Marine Vegetation
Page 8-14 May 2010
the effect 10 to 15 years following reclamation, the change in habitat availability for marine riparian habitat because of the Project is considered to be not significant.
Shading from the terminal will block light and alter habitat quality for Rockweed. Rockweed is the dominant intertidal vegetation species at the PDA and provides habitat for other intertidal species such as invertebrates and nearshore fish. Approximately 2,400 m2 of intertidal habitat will be affected. Suitable habitat is abundant in the PEAA and habitat forming marine vegetation such as rockweed is not limited in the region. The proportion of altered habitat is less than 1% of what is available in the PEAA and is not expected to affect rockweed populations or the species that use vegetation forming habitat. Therefore, changes in habitat availability for rockweed are expected to be not significant.
The magnitude of changes in the availability of eelgrass are predicted to be negligible relative to the abundance of this community in the PEAA and the effects are considered to be not significant.
For a summary of the residual effects of changes in habitat availability on marine vegetation, see Table 8-2.
8.6.3 Cumulative Effects Implications The Project is expected to result in a long-term loss of approximately 0.2% of the marine riparian habitat in the PEAA. Although a substantial area of marine riparian and estuarine habitat has been disturbed by other industrial, residential and recreational development, similar types of marine riparian habitat remain intact in much of the PEAA, and are common along Douglas Channel and other adjacent marine areas. In addition, the terminal is within an area designated as industrial and forest licence lands by the District of Kitimat (2008). As a result, the cumulative change in the availability of marine riparian habitat, although large, is not expected to alter substantially the long-term sustainability of this community type or the species that rely upon it. The change is also not out of context for a municipal area zoned for industrial use. As a result, cumulative effects of changes in habitat availability for marine riparian habitat in the PEAA are considered to be not significant. The project contribution to the cumulative effect is also considered to be not significant.
Effects of changes in habitat availability for rockweed because of the Project are considered to be not significant. As the magnitude of the project effect is negligible, cumulative effects are not considered further for rockweed. The project contribution to cumulative changes in habitat availability for this species is concluded to be not significant.
8.6.4 Prediction Confidence The degree of confidence in the prediction of not significant for residual effects from changes in marine vegetation habitat is high for rockweed and moderate for marine riparian vegetation. The combination of available scientific literature and field surveys provide a relatively robust composite of baseline conditions, rockweed distribution, extent of disturbance as well as re-colonization potential. Less is known about the current availability and status of marine riparian vegetation in the region but project effects are certain.

Sec. 52 Application Volume 6B: Environmental and Socio-Economic Assessment (ESA) – Marine Terminal Section 8: Marine Vegetation
May 2010 Page 8-15
Table 8-2 Characterization of the Residual Effects on Marine Vegetation – Habitat Availability
Project Activities and Physical Works Direction
Additional Proposed Mitigation and
Compensation Measures1-3
Residual Environmental Effect
Magnitude
Geographic Extent
Duration and Frequency
Reversibility
Significance Potential
Measurable Contribution to
Regional Cumulative
Environmental Effects
Construction Onshore infrastructure site preparation
Adverse • Construction EPMP (see Volume 7A)1
• Limit area of disturbance2
L S S/O I N N
Onshore infrastructure construction Adverse • Construction EPMP (see Volume 7A)1
• Limit area of disturbance2
L S S/O I N N
Inwater infrastructure site preparation
Adverse • Construction EPMP (see Volume 7A)1
• Limit area of disturbance2
L S M/O I N N
Inwater infrastructure construction Adverse • Construction EPMP (see Volume 7A)
• Limit area of disturbance2 • Habitat compensation
plan3
L S M/O I N N

Sec. 52 Application Volume 6B: Environmental and Socio-Economic Assessment (ESA) – Marine Terminal Section 8: Marine Vegetation
Page 8-16 May 2010
Table 8-2 Characterization of the Residual Effects on Marine Vegetation – Habitat Availability (cont’d)
Project Activities and Physical Works Direction
Additional Proposed Mitigation and
Compensation Measures1-3
Residual Environmental Effect
Magnitude
Geographic Extent
Duration and Frequency
Reversibility
Significance Potential
Measurable Contribution to
Regional Cumulative
Environmental Effects
Operations Onshore infrastructure operations
Adverse • Construction EPMP (see Volume 7A)1
L S L/C R N N
Inwater infrastructure operations Adverse • Construction EPMP (see Volume 7A)1
L S L/C R N N
Mitigation: 1 Construction EPMP: The Construction EPMP lists mitigation measures to be implemented in all areas of construction, to limit potential effects
plus compliance and effects monitoring programs. Many of these measures are also applicable to operations. Sediment management measures incorporated in the Construction EPMP include the use of silt curtains, sediment settlement ponds, and managing surface water drainage, as appropriate. These measures are included in the Erosion and Sediment Control Plan (Section A.3.5) and the Storm Water Management Plan (Section A.3.4) that are part of the EPMP. These plans will be implemented to manage surface water drainage during construction to reduce sedimentation in nearshore waters.
2 Limit area of disturbance: Dredging and blasting will be limited to what is absolutely necessary to complete construction. 3 Habitat compensation plan: A habitat compensation plan will be prepared to reduce potential effects of the Project on marine habitat, so that no
net loss of fish habitat occurs.
Follow-up and Monitoring: Water Quality and Substrate Composition Monitoring Plan: The Water Quality and Substrate Composition Monitoring Plan (Volume 7A, Appendix A.3.19) includes monitoring of the sediment plume in the marine environment during dredging and blasting. See Section 8.8.

Sec. 52 Application Volume 6B: Environmental and Socio-Economic Assessment (ESA) – Marine Terminal Section 8: Marine Vegetation
May 2010 Page 8-17
Table 8-2 Characterization of the Residual Effects on Marine Vegetation – Habitat Availability (cont’d) KEY Magnitude: N Negligible: No measurable adverse
environmental effects are anticipated.
L Low: affects a specific group of localized individuals within a population but does not affect other trophic levels or the population itself
M Moderate: affects a portion of the local population but does not threaten the integrity of that population or any population dependent upon it.
H High: Affects the local population to the degree that may threaten the integrity of that population or any population dependent upon it.
Geographic Extent: S Site specific: within the PDA L Local: within the PEAA R Regional: extends beyond the PEAA
Duration: S Short term: Effects are noticeable
during construction and decommissioning.
M Medium term: effects noticeable less than two years after the construction is complete
L Long term: Effects are noticeable more than two years after construction
P Permanent
Frequency: O Occurs once S Occurs occasionally R Occurs regularly C Continuous
Reversibility: R Reversible I Irreversible
Significance: S Significant N Not Significant
Potential Contribution to Regional Cumulative Effects: Y Yes N No

Sec. 52 Application Volume 6B: Environmental and Socio-Economic Assessment (ESA) – Marine Terminal Section 8: Marine Vegetation
Page 8-18 May 2010
8.7 Effects on Marine Vegetation – Habitat Quality
8.7.1 Baseline Conditions There are several natural sediment sources in Kitimat Arm. North coast fjords, such as Douglas Channel, penetrate into inland glacial watersheds and are subject to silt-laden runoff throughout spring and summer. Estuarine flows in Douglas Channel travel at approximately 10 cm/s and may disrupt sediment dispersion. Biological production (plankton and phytoplankton) and atmospheric dust fallout also contribute to suspended particulate concentrations in the water column. In general, background levels of TSS in Douglas Channel may reach levels above 2.5 mg/L in spring and winter. Additional information on sediment loads is provided in Section 7.5.
Currently, there are no anthropogenic activities near the marine PDA that alter water quality; however, a number of industrial developments in Kitimat Arm discharge effluents into the Kitimat estuary. For example, the District of Kitimat sewage treatment plant, Rio Tinto Alcan Primary Metal BC aluminum smelter, the Eurocan Pulp and Paper Co. plant and terminal, the Methanex Corporation plant and terminal, Kitimat LNG Inc. terminal and Arthon Construction Ltd. and Sandhill Materials Sandhill Project, all within the PEAA, have the potential to contribute cumulatively to the loading of suspended solids and contaminants into Kitimat Arm. In addition, past industries have released contaminants that reside within sediments in certain areas of Kitimat Arm (see Section 7).
8.7.2 Effects on Marine Vegetation – Habitat Quality
8.7.2.1 Effect Mechanisms
Changes in water quality resulting from increased sedimentation or exposure to contaminants from re-suspended sediments associated with dredging, blasting and construction activities, as well as surface runoff may affect the growth, survival and recovery potential of marine vegetation such as eelgrass and rockweed. Changes in water quality are not expected to affect the health of marine riparian vegetation because it is above the high tide line; therefore, this effect is discussed for rockweed and eelgrass only.
Construction
Bathymetry within the marine PDA shows a relatively deep site, dropping off to a depth of over 100 m within 50 m of the shoreline. Total dredging quantities for the berthing facilities will equal approximately 30,000 m3. The overburden removed during dredging will be disposed of on land, at the excess cut disposal area, to the extent practical. The major source of suspended sediments released into the water column will likely be from overspill material from the clamshell and barge.
Underwater blasting is required to provide a level surface for pile location and positioning. Total blasting quantities for the berth structures will be approximately 25,000 m3. Most blasting will take place in water depths of 10 to 32 m and some blasting will occur in shallower water.
Given that the dredged area will overlap the area that will be blasted (i.e., some of the areas to be blasted will be dredged first), it is estimated that the total directly disturbed area will be approximately 50,000 m2. It is assumed that most of the 1,000-m frontage of the marine terminal area will be disturbed. Sediment

Sec. 52 Application Volume 6B: Environmental and Socio-Economic Assessment (ESA) – Marine Terminal Section 8: Marine Vegetation
May 2010 Page 8-19
plume effects from dredging and blasting will increase this by approximately 200 m north and south of the PDA, resulting in a combined disturbed area of 70,000 m2.
Operations
During operations, surface runoff from the tank and manifold areas will be directed to, and stored in, the impoundment reservoir. Excess surface water runoff from the impoundment reservoir will be released into the marine environment through a subtidal, perforated pipe, after treatment to reduce the oil-in-water concentration to 15 ppm or less. Surface water runoff from outside the tank and manifold areas will be controlled so that this water will be released outside the boomed zone of the berthing structures, to the extent practical. Because of these surface water control measures and because freshwater inputs are very common and abundant in the north coast fjord system, there will be no effect on rockweed distribution. Because no eelgrass is present near the discharge, it is expected to have no measurable effect on eelgrass health.
Decommissioning
The Kitimat Terminal will be removed to the top of the substrate and reclaimed according to the regulations and standards at the time of decommissioning. Removal of inwater infrastructure will result in the mortality of marine vegetation (i.e., rockweed) that has colonized the terminal infrastructure.
8.7.2.2 Mitigation and Effects Management
As noted in Section 8.3, an Erosion and Sediment Control Plan and a Storm Water Management Plan will be used to reduce effects of slope erosion and associated surface runoff and sedimentation into the marine environment. During construction of the marine terminal, disturbance to marine riparian vegetation and intertidal areas will be limited, where practical.
As discussed in Section 8.3, a suite of measures will be used to reduce effects of dredging and blasting on marine vegetation and other marine species:
• using silt curtains and plume monitoring
• implementing the Erosion and Sediment Control Plan and the Storm Water Management Plan from the Construction EPMP
• implementing a habitat compensation plan
8.7.2.3 Residual Effects
The health of eelgrass and rockweed may be affected by dredging and blasting through:
• an increase in the concentration of TSS, which affects light attenuation and photosynthesis • release of existing contaminants such as metals or hydrocarbons in re-suspended sediment
Sec. 52 Application Volume 6B: Environmental and Socio-Economic Assessment (ESA) – Marine Terminal Section 8: Marine Vegetation
Page 8-20 May 2010
Exposure to Increased Turbidity and Sedimentation
Construction activities, particularly dredging, may increase TSS in the water column that, in turn, may adversely affect marine vegetation.
A comprehensive analysis of the effects of burial and erosion on eelgrasses, conducted by Cabaço et al. (2008), confirms that seagrasses are highly vulnerable to changes in sediment levels. If eelgrass is overwhelmed by rapid sedimentation, it does not survive burial well (Vandermeulen 2005). Mills and Fonseca (2003) demonstrate that Z. marina can only tolerate burial covering less than half of its photosynthetic surfaces; even burial of only 25% can lead to more than 50% mortality after 24 days. Further, a recent study by Cabaço et al. (2008) demonstrated high mortality (70% to 90%) of Z. marina under low burial levels; however, it should be noted that seagrass meadows are often able to recover, depending on the magnitude of burial (Cabaço et al. 2008).
Even if eelgrass is not smothered by sediment, excessive amounts of particulate material settling on leaves can lead to mortality. The mechanism for damage appears to be reduced photosynthesis due to shading of leaves (Tamaki et al. 2002). Any project activity or physical works that may result in high levels of TSS may therefore cause a reduction in eelgrass primary productivity.
The growth and survival of rockweed is also primarily limited by light and nutrients (Creed et al. 1996). Effects of reduced light on Fucus species have included inhibition of photosynthesis and impaired development, potentially leading to decreased recruitment success and change in community structures (Major and Davidson 1998). A study done by Vogt and Schramm (1991) in the western Baltic Sea indicated that a decrease in light levels, because of eutrophication, might have caused the disappearance of Fucus species in the area.
A 3-D coastal circulation model was used to determine increases in TSS concentrations and deposition of sediments around the marine PDA due to dredging activity at the marine terminal. The model suggests that one small eelgrass bed next to the PDA may be exposed to concentrations between 0.05 and 0.25 mg/L. These levels are well below Douglas Channel’s natural TSS levels, which can reach up to 2.5 mg/L in the spring and winter. Sediment deposition greater than 1 cm is predicted to be limited to an area no greater than 400 m2 at the marine terminal. Based on modelling results, sediments from dredging will not reach Bish Cove, which contains the largest known eelgrass bed near the PDA.
Onshore site preparation activities may introduce low levels of fugitive sediments to the marine environment. However, given the proposed environmental protection measures and an Erosion and Sediment Control Plan, the magnitude of effects of sediment loading from terrestrial sources will be negligible. Even if sediments were to be introduced to the nearshore area, effects on both rockweed and eelgrass are predicted to be highly localized (i.e., less than 100 m from the water discharge site). Because the closest eelgrass site is approximately 1 km from the marine terminal, the area affected by sediment from terrestrial sources is not expected to overlap with eelgrass beds in the PEAA.
In summary, construction activities will result in elevated TSS levels within a limited area surrounding the marine PDA. Most of the sediment plume created by construction activities is anticipated to be relatively minor in relation to natural background levels. Overall, the localized area of effect from deposition, coupled with the high potential for reversibility, will limit the effects of TSS on eelgrass and

Sec. 52 Application Volume 6B: Environmental and Socio-Economic Assessment (ESA) – Marine Terminal Section 8: Marine Vegetation
May 2010 Page 8-21
rockweed. As a result, effects of increased turbidity and sedimentation on marine vegetation are predicted to be not significant.
Exposure to Re-suspended Contaminants
Given the industrial history of Kitimat Arm, concentrations of contaminants (e.g., heavy metals, PAHs [polycyclic aromatic hydrocarbons], dioxins) are already elevated in sediments near the PDA. Research in Kitimat Arm also suggests low levels of contaminants outside the harbour (Simpson et al. 1996; Eickhoff et al. 2003).
Evidence shows that roots of eelgrass absorb large amounts of heavy metals (e.g., lead, cadmium, zinc and chromium) over long periods of time (Wright 2002). This may have long-term effects on eelgrass consumers, especially waterfowl and marine invertebrates.
A sediment sampling program was completed in the winter of 2006 to characterize the sediment contamination levels at the marine PDA. Chemical analysis revealed that copper and chromium were above the Canadian Council of Ministers of the Environment (CCME) Interim Sediment Quality Guidelines (ISQG) within the PDA and at reference areas. The ISQG identifies the chemical concentrations recommended to support and maintain aquatic ecosystems associated with bed sediments. However, concentrations of all metals in all samples were less than the probable effects level (PEL), the level above which adverse effects are expected to occur frequently. Chemical concentrations between the ISQG and the PEL represent the range in which effects are observed occasionally.
The 2006 sediment sampling program also detected certain dioxins and furans in samples. The most toxic of the dioxins is 2,3,7,8 tetrachlorodibenzo-p-dioxin (TCDD), which was reported in each sample taken from the PDA at concentrations ranging from 0.12 to 0.21 pg/g (picograms per gram).
Austin (1996) concluded that eelgrass is tolerant of many toxins found in contaminated sediments, citing no differential mortality of eelgrass growing in contaminated sediments compared with eelgrass in control sediments. Rockweed also appears to be tolerant of these types of contaminants, as evidenced by the growth of this species in a variety of industrial locations, including Kitimat Arm.
Based on predicted quantities of re-suspended sediment, the levels and bioavailability of re-suspended contaminants are expected to be low. Although there is the potential for contamination to occur, eelgrass is known to be tolerant of many toxins found in contaminated sediments (Austin 1996). With the implementation of mitigation measures, project effects on habitat quality for marine vegetation are not expected to result in changes in health of eelgrass or rockweed communities in the PEAA. As a result, no major changes in marine vegetation populations from project activities are expected. Therefore, effects of the changes in habitat quality from the Project on marine vegetation are concluded to be not significant.
For a summary of the residual effects of changes in habitat quality on marine vegetation health, see Table 8-3.

Sec. 52 Application Volume 6B: Environmental and Socio-Economic Assessment (ESA) – Marine Terminal Section 8: Marine Vegetation
Page 8-22 May 2010
Table 8-3 Characterization of the Residual Effects on Marine Vegetation – Habitat Quality
Project Activities and Physical Works Direction
Additional Proposed Mitigation and
Compensation Measures1-3
Residual Environmental Effect
Magnitude
Geographic Extent
Duration and Frequency
Reversibility
Significance Potential
Measurable Contribution to
Regional Cumulative
Environmental Effects
Construction Onshore infrastructure site preparation
Adverse • Construction EPMP (see Volume 7A)1
• Limit area of disturbance2
L L S/O R N N
Onshore infrastructure construction Adverse • Construction EPMP (see Volume 7A)
• Limit area of disturbance2
L L S/O R N N
Inwater infrastructure site preparation
Adverse • Construction EPMP (see Volume 7A)
• Limit area of disturbance
L L M/O R N N
Inwater infrastructure construction Adverse • Construction EPMP (see Volume 7A)
• Limit area of disturbance • Habitat compensation
plan3
L L M/O R N N

Sec. 52 Application Volume 6B: Environmental and Socio-Economic Assessment (ESA) – Marine Terminal Section 8: Marine Vegetation
May 2010 Page 8-23
Table 8-3 Characterization of the Residual Effects on Marine Vegetation – Habitat Quality (cont’d)
Project Activities and Physical Works Direction
Additional Proposed Mitigation and
Compensation Measures1-3
Residual Environmental Effect
Magnitude
Geographic Extent
Duration and Frequency
Reversibility
Significance Potential
Measurable Contribution to
Regional Cumulative
Environmental Effects
Operations Onshore infrastructure operations
Adverse • Construction EPMP (see Volume 7A)1
L L L/C R N N
Inwater infrastructure operations Adverse • Construction EPMP (see Volume 7A)1
L L L/C R N N
Mitigation: 1 Construction EPMP: The EPMP lists mitigation measures to be implemented in all areas of construction, to limit potential effects plus compliance
and effects monitoring programs. Many of these measures are also applicable to operations. Sediment management measures incorporated in the Construction EPMP include the use of silt curtains, sediment settlement ponds, and managing surface water drainage, as appropriate. These measures are included in the Erosion and Sediment Control Plan (Section A.3.5) and the Storm Water Management Plan (Section A.3.4) that are part of the EPMP. These plans will be implemented to manage surface water drainage during construction to reduce sedimentation in nearshore waters.
2 Limit the area of disturbance: Dredging and blasting will be limited to what is absolutely necessary to complete construction. 3 Habitat compensation plan: A habitat compensation plan will be prepared to reduce potential effects of the Project on marine habitat, so that no
net loss of fish habitat occurs. Follow-up and Monitoring: Water Quality and Substrate Composition Monitoring Plan: The Water Quality and Substrate Composition Monitoring Plan (Volume 7A, Appendix A.3.19) includes monitoring of the sediment plume in the marine environment during dredging and blasting. See Section 8.8.

Sec. 52 Application Volume 6B: Environmental and Socio-Economic Assessment (ESA) – Marine Terminal Section 8: Marine Vegetation
Page 8-24 May 2010
Table 8-3 Characterization of the Residual Effects on Marine Vegetation – Habitat Quality (cont’d) KEY Magnitude: N Negligible: No measurable adverse
environmental effects are anticipated. L Low: affects a specific group of localized
individuals within a population but does not affect other trophic levels or the population itself
M Moderate: affects a portion of the local population but does not threaten the integrity of that population or any population dependent upon it.
H High: Affects the local population to the degree that may threaten the integrity of that population or any population dependent upon it.
Geographic Extent: S Site specific: within the PDA L Local: within the PEAA R Regional: extends beyond the PEAA
Duration: S Short term: Effects are noticeable
during construction and decommissioning.
M Medium term: effects noticeable less than two years after the construction is complete
L Long term: Effects are noticeable more than two years after construction
P Permanent
Frequency: O Occurs once S Occurs occasionally R Occurs regularly C Continuous
Reversibility: R Reversible I Irreversible
Significance: S Significant N Not Significant
Potential Contribution to Regional Cumulative Effects: Y Yes N No

Sec. 52 Application Volume 6B: Environmental and Socio-Economic Assessment (ESA) – Marine Terminal Section 8: Marine Vegetation
May 2010 Page 8-25
8.7.3 Cumulative Effects Implications Given that no temporal and spatial changes in marine vegetation are expected from changes in habitat quality associated with the Project, the potential for project effects to interact with similar effects from other developments and activities is considered minor. As a result, cumulative effects are not considered further in this assessment.
8.7.4 Prediction Confidence The degree of confidence in the prediction of not significant for residual effects of changes in habitat quality on marine vegetation is high. The combination of available scientific literature, field surveys, sediment analyses and TSS modelling provide a relatively robust composite of baseline conditions and the potential extent of disturbance.
8.8 Follow-up and Monitoring for Marine Vegetation Given the minor effects of the Project on marine vegetation, no specific follow-up or monitoring activities for marine vegetation are proposed. However, potential effects associated with sediment dispersion during dredging and blasting will be monitored as part of the general Environmental Protection and Management Plan (EPMP) for construction of the marine terminal.
8.9 Summary of Effects for Marine Vegetation Based on recent literature, the current understanding of project components and the respective status and life histories of marine vegetation in the PEAA, the combined residual effects of changes in habitat availability, changes in habitat quality and direct mortality are considered to be not significant.
The highest risk of project environmental effects on marine vegetation populations will be during construction. Construction activities are anticipated to take place over a four-year period and mitigation measures will be in place to limit potential environmental effects.
For a summary of the assessment of project-related environmental effects on marine vegetation throughout all the project phases, see Table 8-4.

Sec. 52 Application Volume 6B: Environmental and Socio-Economic Assessment (ESA) – Marine Terminal Section 8: Marine Vegetation
Page 8-26 May 2010
Table 8-4 Summary of Residual Environmental Effects on Marine Vegetation
Potential Effect Mitigation1-3
Residual Environmental Effect
Magnitude Geographic
Extent Duration/
Frequency Reversibility Significance Prediction Confidence
Construction Change in Habitat Quality
• Construction EPMP (see Volume 7A)1 • Limit area of disturbance2 • Habitat compensation plan4
L L M/O R N High
Change in Habitat Availability
• Construction EPMP (see Volume 7A) • Limit area of disturbance2 • Habitat compensation plan3
L S M/O I N High
Operations Change in Habitat Quality
• Construction EPMP (see Volume 7A)1 L L L/C R N High
Change in Habitat Availability
• Construction EPMP (see Volume 7A)1 L S L/C R N High
Cumulative Environmental Effects Change in Habitat Quality
N/A N/A N/A N/A N/A N/A Low
Change in Habitat Availability
N/A N/A N/A N/A N/A N/A Low
Combined Effects Project specific • Construction EPMP (see Volume 7A)1
• Limit area of disturbance2 • Habitat compensation plan3
L L L/C R N Moderate
Cumulative effects N/A N/A N/A N/A N/A N/A Low

Sec. 52 Application Volume 6B: Environmental and Socio-Economic Assessment (ESA) – Marine Terminal Section 8: Marine Vegetation
May 2010 Page 8-27
Table 8-4 Summary of Residual Environmental Effects on Marine Vegetation (cont’d)
Mitigation: 1 Construction EPMP: The EPMP lists mitigation measures to be implemented in all areas of construction, to limit potential effects plus compliance and effects
monitoring programs. Many of these measures are also applicable to operations. Sediment management measures incorporated in the Construction EPMP include the use of silt curtains, sediment settlement ponds, and managing surface water drainage, as appropriate. These measures are included in the Erosion and Sediment Control Plan (Section A.3.5) and the Storm Water Management Plan (Section A.3.4) that are part of the EPMP. These plans will be implemented to manage surface water drainage during construction to reduce sedimentation in nearshore waters.
2 Limit area of disturbance: Dredging and blasting will be limited to what is absolutely necessary to complete construction. 3 Habitat compensation plan: The habitat compensation plan will be prepared to reduce potential effects of the Project on marine habitat, so that no net loss of fish
habitat occurs.
Follow-up and Monitoring: Water Quality and Substrate Composition Monitoring Plan: The Water Quality and Substrate Composition Monitoring Plan (Volume 7A, Appendix A.3.19) includes monitoring of the sediment plume in the marine environment during dredging and blasting. See Section 8.8. KEY Magnitude: N Negligible: No measurable adverse
environmental effects are anticipated. L Low: affects a specific group of localized
individuals within a population but does not affect other trophic levels or the population itself
M Moderate: affects a portion of the local population but does not threaten the integrity of that population or any population dependent upon it.
H High: Affects the local population to the degree that may threaten the integrity of that population or any population dependent upon it.
Geographic Extent: S Site specific: within the PDA L Local: within the PEAA R Regional: extends beyond the PEAA
Duration: S Short term: Effects are noticeable
during construction and decommissioning.
M Medium term: effects noticeable less than two years after the construction is complete
L Long term: Effects are noticeable more than two years after construction
P Permanent
Frequency: O Occurs once S Occurs occasionally R Occurs regularly C Continuous
Reversibility: R Reversible I Irreversible
Significance: S Significant N Not Significant
Prediction Confidence: H High M Moderate L Low

Sec. 52 Application Volume 6B: Environmental and Socio-Economic Assessment (ESA) – Marine Terminal Section 8: Marine Vegetation
Page 8-28 May 2010
8.10 References
8.10.1 Literature Cited Austin, W.C. 1996. Assessment of Intertidal Sensitive Species and Habitats. Water Quality Branch,
Environment Canada. Ottawa, ON.
Beckett, J. and K. Munro 2010. Marine Fish and Fish Habitat Technical Data Report. Prepared for Northern Gateway Pipelines Inc. Calgary, AB.
Brennan, J.S. and H. Culverwell. 2004. Marine Riparian: An Assessment of Riparian Functions in Marine Ecosystems. Unpublished manuscript. Seattle, WA.
Cabaço, S., R. Santos and C.M. Duarte. 2008. The impact of sediment burial and erosion on seagrasses: A review. Estuarine, Coastal and Shelf Science 79(3): 354–366.
Chambers, P.A., R.E. DeWreede, E.A. Irlandi and H. Vandermeulen. 1999. Management issues in aquatic macrophyte ecology: a Canadian perspective. Canadian Journal of Botany 7(4): 471–487.
Creed, J.C., T.A. Norton and J.M. Kain. 1996. Intraspecific competition on Fucus serratus germlings: The interaction of light, nutrients and density. Journal of Experimental Marine Biology and Ecology 212: 211–213.
District of Kitimat. 2008. Official Community Plan 2008. Kitimat, BC.
Druehl, L. 2000. Pacific Seaweeds. Harbour Publishing. Madeira Park, BC.
Eickhoff, C.V., S.X. He, F.A.P.C. Gobas and F.C.P. Law. 2003. Determination of polycylic aromatic hydrocarbons in Dungeness crabs (Cancer magister) near an aluminum smelter in Kitimat Arm, British Columbia, Canada. Environmental Toxicology and Chemistry 22(1): 50–58.
Erftemeijer, P.L.A. and R.R.R. Lewis III. 2006. Environmental impacts of dredging on seagrasses: A review. Marine Pollution Bulletin 52: 1553–1572.
Fisheries and Oceans Canada (DFO). 1986. The Department of Fisheries and Oceans Policy for the Management of Fish Habitat. Communications Directorate, Department of Fisheries and Oceans Fish Habitat Management Branch. Ottawa, ON.
Levings, C. and G. Jamieson. 2001. Marine and Estuarine Riparian Habitats and Their Role in Coastal Ecosystems, Pacific Region. Canadian Science Advisory Secretariat. Fisheries and Oceans Canada. Ottawa, ON.
Major, K.M. and I.R. Davidson. 1998. Influence of temperature and light on growth and photosynthetic physiology of Fucus evanescens (Phaeophyta) embryos. European Journal of Phycology 33: 129–138.
Mills, K.E. and M.S. Fonseca. 2003. Mortality and productivity of eelgrass Zostera marina under conditions of experimental burial with two sediment types. Marine Ecology Progress Series 255: 127–134.

Sec. 52 Application Volume 6B: Environmental and Socio-Economic Assessment (ESA) – Marine Terminal Section 8: Marine Vegetation
May 2010 Page 8-29
National Research Council (NRC). 2002. Riparian Areas: Functions and Strategies for Management. Report of the National Research Council. National Academy Press. Washington, DC.
Phillips, R.C. 1984. The ecology of eelgrass meadows in the Pacific Northwest: a community profile. Report FWS/OBS-84/24. US Fish and Wildlife Service. Seattle, WA.
Short, F.T. and H.A. Neckles. 1999. The effects of global climate change on seagrasses. Aquatic Botany 63: 169–196.
Simenstad, C.A. 1994. Faunal associations and ecological interactions in seagrass communities of the Pacific Northwest coast. In S. Wyllie-Echheverria, A. M. Olsen and M. J. Hershman (eds.), Seagrass Science and Policy in the Pacific Northwest. Proceedings of a Seminar Series. EPA 910/R-94-004. US Environmental Protection Agency. Seattle, WA. 11–18.
Simpson, C.D., A.A. Mosi, W.R. Cullen and K.J. Reimer. 1996. Composition and distribution of polycyclic aromatic hydrocarbon contamination in surface marine sediments from Kitimat Harbour, Canada. The Science of the Total Environment 181: 265–278.
Tamaki, H., M. Tokuoka, W. Nishijima, T. Terawaki and M. Okada. 2002. Deterioration of eelgrass, Zostera marina L., meadows by water pollution in Seto Inland Sea, Japan. Marine Pollution Bulletin 44: 1253–1258.
Vandermeulen, H. 2005. Assessing Marine Habitat Sensitivity: A case study with eelgrass (Zostera marina L.) and kelps (Laminaria, Macrocystis). Canadian Science Advisory Secretariat. DFO. Ottawa, ON.
Vogt, H. and W. Schramm. 1991. Conspicuous decline of Fucus spp. in Kiel Bay (Western Baltic): what are the causes? Marine Ecology Progress Series 69: 189–194.
Williams, G.D. and R.M. Thom. 2001. Marine and Estuarine Shoreline Modification Issues. White Paper Prepared for Washington Department of Fish and Wildlife by Batelle Memorial Institute. Sequim, WA.
Wilson, U.W. and J.B. Atkinson. 1995. Black brant winter and spring-stages use at two Washington coastal areas in relation to eelgrass abundance. The Condor 97: 91–98.
Wright, N. 2002. Eelgrass Conservation for the B.C. Coast: A Discussion Paper. Prepared for BC Coastal Eelgrass Stewardship Project. SeaChange Marine Conservation Society. Brentwood Bay, BC.
8.10.2 Personal Communication Horwood, D. 2006. Kitimat Valley Naturalist Society, Kitimat, BC. Meeting. July 26, 2006
8.10.3 Internet Site Transport Canada. 2000. Guidelines for the Control of Ballast Water Discharge from Ships in Waters
Under Canadian Jurisdiction. Available at: http://www.shipfed.ca/eng/library/other_subjects/ballats_water/BallastWaterCanadianGuidelines.html. Accessed: November 2008.


Sec. 52 Application Volume 6B: Environmental and Socio-Economic Assessment (ESA) – Marine Terminal Section 9: Marine Invertebrates
May 2010 Page 9-1
9 Marine Invertebrates Marine invertebrates have ecological importance as food, substrate, refuge and rearing habitat for other invertebrates and juvenile fish. Some also have commercial value. Bay mussel, Dungeness crab and hexactinellid sponges are the representative invertebrates assessed. Potential environmental effects include changes in habitat availability, direct mortality and changes in habitat quality. The amount of marine invertebrate habitat affected by the Project is small compared to that available. For example, loss of approximately 1,000 m2 of bay mussel habitat represents 3.7% of total habitat in the assessed area, and the area will be suitable for re-colonization after construction. Loss of hexactinellid sponges would be limited to isolated individuals that are common throughout the north and central coasts and do not carry the same ecological vulnerability as the rare reef complexes. Mitigation will include reducing sedimentation, implementing a Blasting Management Plan, and establishing work windows developed in consultation with DFO. Although not anticipated at this time, if high-quality crab habitat (eelgrass beds) will be disturbed by sedimentation from dredging and blasting, a preconstruction trap and release program will be implemented to relocate Dungeness crab away from areas affected. Effects of the Project are not expected to cause a long-term decline in abundance, distribution or ecological importance of marine benthic invertebrates. After mitigation, residual effects are expected to be not significant.
9.1 Setting for Marine Invertebrates The marine invertebrate communities in the Kitimat Arm region are typical of those in the highly seasonal, mid-latitude, coastal marine ecosystem of the Queen Charlotte Basin. The species diversity of the rocky intertidal community in Kitimat Arm is generally low. The dominant fauna found in this zone is composed of barnacles, mussels, periwinkles and limpets. Species that can be found in the shallow subtidal community include sea urchins, moon snails, green sea anemones, sea stars and California sea cucumbers.
The soft bottom estuaries are dominated by eelgrass, a marine vascular plant that provides important habitat for invertebrates such as Dungeness crab. Sandy areas are also inhabited by commercially harvested bivalves such as butter clams and cockles.
9.2 Scope of Assessment for Marine Invertebrates
9.2.1 Key Project Issues for Marine Invertebrates The construction, operations and decommissioning of the marine terminal could affect marine invertebrates that inhabit or use the project effects assessment area (PEAA) through:
• changes in habitat availability • risk of direct mortality • changes in habitat quality
For a summary of the potential environmental effects of the construction, operations and decommissioning activities at the marine terminal on marine invertebrates, see Table 9-1.

Sec. 52 Application Volume 6B: Environmental and Socio-Economic Assessment (ESA) – Marine Terminal Section 9: Marine Invertebrates
Page 9-2 May 2010
Table 9-1 Potential Environmental Effects on Marine Invertebrates This table identifies the potential environmental effects on marine invertebrates that are assessed in this section of the ESA. Each of these environmental effects is discussed in more detail later in this section. Recommendations for mitigation and, if required, follow-up and monitoring are also provided. With the implementation of these mitigation measures where appropriate, the Project is not likely to cause significant adverse environmental effects on marine invertebrates.
Project Activities and Physical Works
Key Environmental Effects on Marine Invertebrates Relevance to the Assessment Considered in the ESA
Kitimat Terminal Construction
• Onshore infrastructure site preparation (clearing, burning, grading, blasting)
• Change in habitat availability • Risk of direct mortality • Change in habitat quality
Potential for: • direct mortality • physiological stress • physical damage • modification of natural
movements • mechanical damage to eggs
and larvae • decreased critical spawning and
rearing habitat • creation of new, artificial habitat
• Inwater infrastructure site preparation (dredging, blasting, pile drilling)
• Change in habitat availability • Risk of direct mortality • Change in habitat quality
• Inwater infrastructure construction (marine terminal, berths, pile installation)
• Change in habitat availability • Risk of direct mortality • Change in habitat quality
Operations
• Inwater infrastructure project development area (PDA) (marine terminal, berths and associated shading, underwater structures)
• Change in habitat availability Potential for: • physiological stress • physical damage • modification of natural
movements • mechanical damage to eggs
and larvae • decreased critical spawning and
rearing habitat • creation of new, artificial habitat
• Berthed tankers (and associated combustion emissions, inert gas exchange, prop wash, noise, boom deployment)
• Change in habitat availability • Risk of direct mortality • Change in habitat quality
Decommissioning
• Onshore site restoration (infrastructure removal, site rehabilitation and reclamation)
• Change in habitat availability • Change in habitat quality
Potential for: • direct mortality • physiological stress • physical damage • modification of natural
movements • mechanical damage to eggs
and larvae • decreased critical spawning and
rearing habitat • creation of new, artificial habitat
• Inwater infrastructure site restoration (infrastructure removal)
• Change in habitat availability • Risk of direct mortality • Change in habitat quality

Sec. 52 Application Volume 6B: Environmental and Socio-Economic Assessment (ESA) – Marine Terminal Section 9: Marine Invertebrates
May 2010 Page 9-3
All vessels using the Kitimat Terminal will be required to follow requirements for ballast water management and discharge under the Canada Shipping Act, Canadian Ballast Water Control and Management Regulations (BWCMR), and to implement an International Maritime Organization (IMO) approved Ballast Water Management Plan. Tankers will have segregated ballast on board that has been exchanged not less than 200 nautical miles from shore, as described by the Ballast Water Management Procedures under the BWCMR. Oily ballast water will not be discharged at the Kitimat Terminal. Solid waste and liquid waste will be managed according to the Canadian Shipping Act.
The Kitimat Terminal will have oil-water separator facilities on the foreshore to receive, treat and recover oil from the vessel’s cargo slops tanks. The cargo slops can be discharged from the vessel to the terminal’s facility using the same cargo pumps and transfer arms that are used to transfer regular cargo. Although the Kitimat Terminal will not provide on-site facilities to treat or dispose of engine room slops, it will offer a service provided by a third-party contractor, which will use vacuum trucks to receive and transfer the slops to an offsite facility for proper disposal.
Because bilge and ballast water will be managed in accordance with these requirements, adverse effects from the bilge and ballast water at the terminal are not anticipated and will not be discussed further in the assessment of marine invertebrates.
9.2.2 Selection of Key Indicators and Measurable Parameters for Marine Invertebrates
Three key indicators (KIs) represent marine invertebrates within the PEAA:
• bay mussel • Dungeness crab • hexactinellid sponges
Bay mussel (Mytilus edulis) are widely considered a marine environment indicator species and used extensively in monitoring programs. They are broadly distributed and abundant within the PEAA. They are also an important food source for numerous marine species, including many birds. The structures created by the dense mussel mats provide protection and substrate for other intertidal organisms including barnacles, bryozoans, crabs and snails.
Effects on bay mussel will be assessed based on changes in the relative abundance of bay mussel in the PEAA.
Dungeness crab is a KI because of its ecological importance and value as a resource in the PEAA. Beyond the PEAA, Dungeness crab is the most important crab species harvested in British Columbia and is exploited by commercial, Aboriginal and recreational fishers coast-wide (Fisheries and Oceans Canada [DFO] 2000a). Dungeness crabs usually recruit in very large numbers and their larvae are a valuable food source for Pacific herring, Pacific sardine, rockfish and salmon and many deposit and suspension feeders. The adults are also important predators in the benthic environment, feeding on clams, other crustaceans and small fish (DFO 2002).
Benthic sponges are sensitive to disturbance and serve as nursery habitat for fishes and invertebrates. Some species such as those present in Hecate Strait are unique to the western Canadian continental shelf

Sec. 52 Application Volume 6B: Environmental and Socio-Economic Assessment (ESA) – Marine Terminal Section 9: Marine Invertebrates
Page 9-4 May 2010
(DFO 2000b) and thus, ecologically important contributors to species diversity. Baseline surveys confirmed that hexactinellid sponges are present in the PEAA.
Measurable parameters identified for each of the three KIs for each of the environmental effects are:
• change in habitat availability is assessed, based on changes in the location and amount of suitable habitat for supporting marine invertebrate settlement and persistence
• risk of direct mortality is assessed using indices of change for both habitat and abundance because marine invertebrate communities are closely associated with habitat availability and are most vulnerable to direct mortality in areas where changes in habitat will result from project activities in the project development area (PDA). Specifically, the measurable parameters used are the location and amount of suitable habitat, seasonal occurrence, distribution, relative abundance and density.
• changes in habitat quality are assessed using predicted changes in total suspended solids in the water column
9.2.3 Spatial Boundaries for Marine Invertebrates The spatial boundaries used for the assessment include the marine PDA and the PEAA (see Figure 9-1). The marine PEAA includes the marine PDA as well as all areas where construction, operations and decommissioning have the potential to affect marine invertebrate populations. It covers a relatively large area, stretching from the head of Kitimat Arm south to Emsley Point and Coste Point (see Figure 9-1).
The marine PEAA conservatively encompasses the geographic extent of disturbance to invertebrates generated by construction and routine operations of the marine terminal. The PEAA is sufficiently large to account for the spatial extent of sediment dispersion and its disturbance to marine invertebrates.
9.2.4 Temporal Boundaries for Marine Invertebrates The temporal boundaries of the effects assessment include the construction, operations and decommissioning phases. Adults and juveniles of all three KIs are expected to be present in the PDA and PEAA throughout the Project.
9.2.5 Regulatory Setting or Administrative Boundaries for Marine Invertebrates
DFO regulates activities that may affect fisheries or fish habitat, as well as activities that may affect fish. Under the Fisheries Act, marine invertebrate are considered fish and, therefore, are legally protected. Section 35 of the Act prohibits harmful alteration, disruption or destruction (HADD) of fish habitat, while Section 36 prohibits deposits of any substances considered deleterious to fish. Environment Canada administers Section 36 of the Fisheries Act, while DFO administers Section 35. Fish habitat is also protected by the DFO Policy for the Management of Fish Habitat (DFO 1986). This policy applies to all activities in or near water that threaten the productive capacity of fish habitats. The guiding principle of this policy is to achieve no net loss of the productive capacity of fish habitat and to achieve a net gain in productive capacity of habitat. DFO also administers commercial fishery quotas and closures.

200 m
100
m
100 m
200 m
100
m
300 m
200
m
100
m
Kitimat
Minette Bay
KitamaatVillage
KitimatTerminal
K i t i
m a
t A
r m
BishCove
EmsleyCove
EmsleyPoint
CostePoint
CosteIsland
ClioBay
GobeilBay
Kitimat River
CreekBish
Pipeline Route
Security Fence
Terrestrial PDA
Marine PDA
Marine PEAA
Bathymetric Contour (100 m)
Railway
Road
NP
Jacques Whitford AXYS Ltd.
FIGURE NUMBER:
PROJECTION:
CONTRACTOR: DATE:
AUTHOR: APPROVED BY:PREPARED FOR:PREPARED BY: SCALE:
PEAA for Marine Invertebrates
ENB R ID GE N OR TH ER N GA TEW A Y PR OJ EC T 9-1
NAD 83DATUM:
1:110,000
UTM 9
CM
0 1 2 3
Kilometres
Reference: Pipeline Route R
JWA-1048334-1542
REFERENCES: NTDB Topographic Mapsheets provided by the Majesty the Queen in Right of Canada, Department of Natural Resources. All rights reserved.
R:\2
009F
isca
l\104
8334
_Nor
ther
nGat
eway
_ES
A_2
009
20090911

Sec. 52 Application Volume 6B: Environmental and Socio-Economic Assessment (ESA) – Marine Terminal Section 9: Marine Invertebrates
Page 9-6 May 2010
The federal Species at Risk Act (SARA) applies only to marine species within the assessment area that are listed under SARA. There are no special status invertebrate species within the PEAA.
9.2.6 Definition of Environmental Effects Attributes for Marine Invertebrates Environmental effects on marine invertebrates are characterized by geographic scope, magnitude, duration, frequency and reversibility. Definitions for each of these criteria are provided below.
Direction
• positive: an improvement in parameter concentrations relative to applicable sediment or water quality guidelines
• adverse: a deterioration in parameter concentrations relative to applicable guidelines
Magnitude
• negligible: no measurable adverse environmental effects are anticipated
• low: affects a specific group of localized individuals within a population but does not affect other trophic levels or the population itself
• moderate: affects a portion of the local population but does not threaten the integrity of that population or any population dependent upon it
• high: affects the local population to the degree which may threaten the integrity of that population or any population dependent upon it
Geographic Extent
• site-specific: within the PDA • local: within the PEAA • regional: extends beyond the PEAA
Duration
• short term: effects noticeable during construction and decommissioning period • medium term: effects noticeable less than two years after construction is complete • long term: effects noticeable more than two years after construction is complete • permanent: effects are permanent
Frequency
• occurs once • occurs at sporadic intervals • occurs regularly and at regular intervals • continuous

Sec. 52 Application Volume 6B: Environmental and Socio-Economic Assessment (ESA) – Marine Terminal Section 9: Marine Invertebrates
May 2010 Page 9-7
Reversibility
• reversible • irreversible
9.2.7 Determination of Significance for Marine Invertebrates The environmental effects on marine invertebrate populations are categorized as significant if they are expected to cause a long-term decline in abundance or distribution of the local population or species, beyond which natural recruitment will not return that population or species, or any population or species dependent upon it, to its former level within several generations.
9.3 General Mitigation Measures for Marine Invertebrates During construction, operations and decommissioning of the marine terminal, mitigation measures will be implemented to reduce the adverse environmental effects of activities such as blasting, dredging and pile drilling on marine invertebrates. Specifically this will involve:
• Construction Environmental Protection and Management Plan (EPMP): Environmental protection measures outlined in Volume 7A, Construction EPMP, will be used to reduce potential environmental effects of routine construction activities. The plan also encompasses compliance and effects monitoring programs. Sediment management measures incorporated in the Construction EPMP include the use of silt curtains, sediment settlement ponds, and managing surface water drainage, as appropriate. These measures are included in the Erosion and Sediment Control Plan (see Volume 7A, Appendix A.3.5) and the Storm Water Management Plan (see Volume 7A, Appendix A.3.4) that are part of the EPMP. These plans will be implemented to manage surface water drainage during construction to reduce sedimentation in nearshore waters.
• Water Quality and Substrate Composition Monitoring Plan: It includes monitoring of the sediment plume in the marine environment during dredging and blasting.
• Blasting Management Plan: A Blasting Management Plan will be developed to confirm that all blasting activities are concurrent with DFO guidelines for the use of explosives in or near Canadian fisheries waters.
• Work windows: Timing of work windows for inwater activities such as dredging and blasting will be determined in consultation with DFO. These windows will consider sensitive periods for marine invertebrates, and timing of commercial and traditional harvesting.
Note that present development plans are not expected to disturb high quality crab habitat (i.e., eelgrass beds). If crab habitats are affected, then crabs will be salvaged by trap and relocated before inwater site preparation activities (dredging, blasting) occur.

Sec. 52 Application Volume 6B: Environmental and Socio-Economic Assessment (ESA) – Marine Terminal Section 9: Marine Invertebrates
Page 9-8 May 2010
9.4 Assessment Methods for Marine Invertebrates
9.4.1 Data Sources and Fieldwork A comprehensive literature review was completed to compile available information on marine invertebrates in the PEAA and adjacent region in relation to population status, population trends, seasonal distribution, habitat requirements, and limiting factors. Government reports, peer reviewed journals, personal communications with professionals, conference proceedings and digital databases were reviewed.
Intertidal field surveys, crab trapping surveys and subtidal video surveys were also completed along the shoreline and subtidal areas of the marine PDA.
Additional information on the data sources and field work is provided in the Marine Fish and Fish Habitat Technical Data Report (TDR) (Beckett and Munro 2010) and the Marine Physical Environment TDR (ASL Environmental Sciences Inc. 2010).
9.4.2 Analytical Techniques The Marine Fish and Fish Habitat TDR includes details on acoustic modelling, sediment plume modelling, sediment chemistry analyses, and benthic invertebrate analyses conducted for the assessment.
9.5 Ecology and Habitat Requirements for Marine Invertebrates
9.5.1 Bay Mussel
Status
There are no known current regulatory or ecological issues for bay mussel. Wild mussels have not been harvested commercially in British Columbia.
Seasonal Distribution, Population Trends and Habitat Requirements
The bay mussel is native to the Pacific Northwest and dominates the hard shoreline of the sheltered coasts of British Columbia (Gosling 1992), including the PEAA. Bay mussels are typically abundant in habitats such as rock shelves, estuaries and boulder beaches; this was confirmed by observations from intertidal surveys in the marine PDA in 2005, 2006, 2008 and 2009. There were no observations of California mussel (Mytilus californianus) in the area, which is to be expected given the low wave exposure in Kitimat Arm (Ackerman and Nishizaki 2004). The vertical distribution of mussels in the intertidal is determined by both abiotic and biotic factors. Temperature is known to adversely affect mussels and act in combination with desiccation to set the upper limits of mussel distribution, while the lower limit for mussels is determined principally by biological factors such as predation and competition (Connell 1972; Paine 1974). Major predators include sea stars, gastropods, crabs, fishes, shorebirds, sea ducks and sea otters.

Sec. 52 Application Volume 6B: Environmental and Socio-Economic Assessment (ESA) – Marine Terminal Section 9: Marine Invertebrates
May 2010 Page 9-9
Salinity conditions usually determine the distribution of mussels in an estuary. However, the bay mussel is exceptional in that it tolerates salinities ranging from both full oceanic (35 parts per thousand [ppt]), to conditions as low as 6 to 7 ppt (Gosling 1992). Surveys completed for the Project confirmed bay mussels were found in both the estuary and full oceanic sites (see the Marine Fish and Fish Habitat TDR).
Limiting Factors
Typical anthropogenic threats to mussels include physical development of shoreline and degradation of water quality. However, mussels are a pioneer species and will establish themselves on most anthropogenic structures such as pilings and shoreline reinforcements.
9.5.2 Dungeness Crab
Status
The outlook for the Dungeness crab fishery in British Columbia is positive because stocks appear to be healthy and management follows a precautionary approach (DFO 2009). The commercial effort in commercial crab License Area B (north coast of British Columbia) has remained consistent over the last decade (DFO 2007a). Dungeness crab landings in Douglas Channel, Fisheries Management Area 6 (DFO 2008, Internet site; see Figure 9-2), from 1999 to 2004 accounted for 0.1% to 0.4% of the total British Columbia landings. Subarea 6-1 is closed to commercial crab fishing (see Figure 9-2).
Seasonal Distribution, Population Trends and Habitat Requirements
Dungeness crabs are distributed from Alaska to California, from the intertidal to a depth of about 180 m (DFO 2002). They live in bays and inlets, around estuaries and on the continental shelf. Although sometimes found on mud and gravel, Dungeness crabs are most abundant on sandy bottoms and in shallow waters around eelgrass (DFO 2002).
Dungeness crab recruitment is affected by variations in oceanic conditions and, as a result, abundance (as reflected by total catches) fluctuates greatly from year to year (DFO 2007b). Dungeness crabs have seasonal migration patterns based on reproductive status. Mating typically occurs outside estuaries and in nearshore habitats during summer, from May to August (DFO 2000a). During winter, crabs tend to migrate to deeper waters, where females bury themselves in soft sediments and remain inactive, from the time of fertilization to release of larvae in spring (DFO 2000a). The larvae remain within the water column for three to four months and become dispersed by ocean currents before eventually settling on suitable substrates (DFO 2000a). Juveniles reside in shallow coastal waters, tidal flats and estuaries, living in beds of eelgrass and other aquatic vegetation (DFO 2000a). Juvenile Dungeness remain in their settlement area for several months.
No Dungeness crabs were captured during a nearshore trapping survey (between 10 and 30 m water depth) in June 2006. The subtidal camera survey, conducted in 2005 and 2006, revealed a low abundance of crabs at the marine terminal (see Figure 9-3), suggesting the PDA is not primary habitat for Dungeness crab in Kitimat Arm.
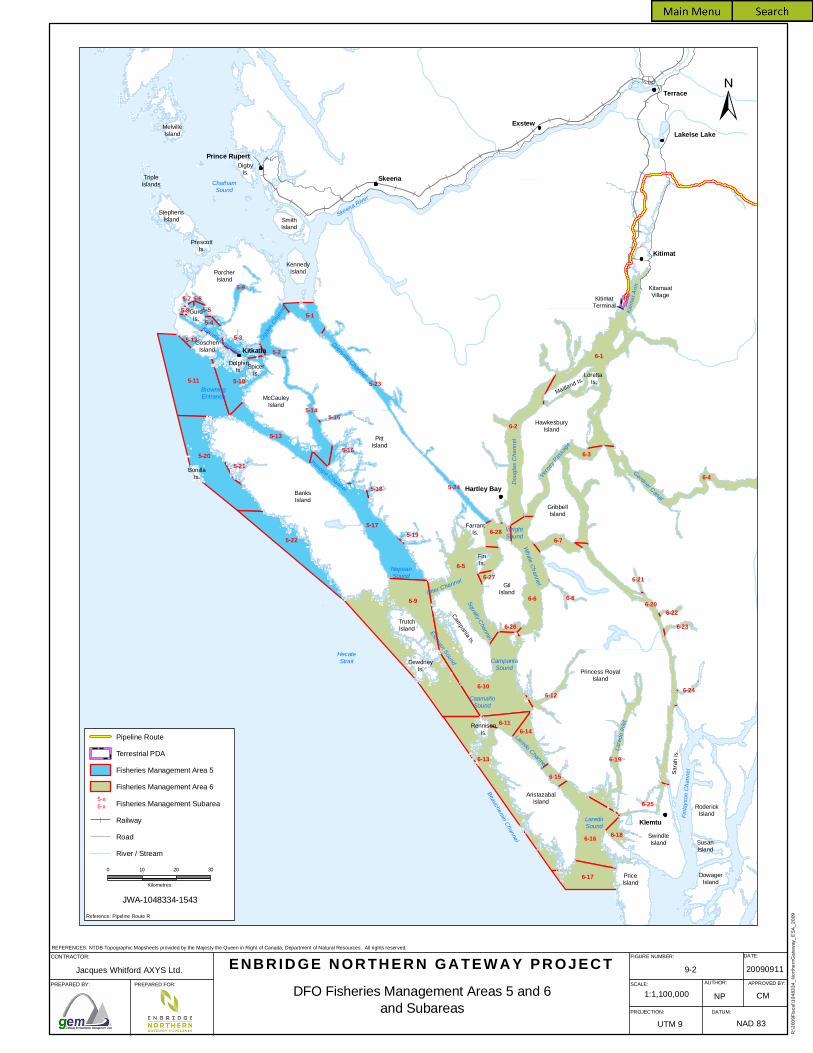
Skeena
Exstew
Terrace
Lakelse Lake
Kitimat
KitamaatVillageKitimat
Terminal
Loretta Is.
HawkesburyIsland
Princess RoyalIsland
Hartley Bay
PittIsland
PorcherIsland
StephensIsland
McCauleyIsland
BanksIsland
TrutchIsland
DewdneyIs.
Campania Is.
GilIsland
FinIs.
AristazabalIsland
PriceIsland
SwindleIsland
RoderickIsland
SusanIsland
DowagerIsland
Sara
h Is
.
GoschenIsland
GurdIs.
DolphinIs. Spicer
Is.
KennedyIsland
SmithIsland
PrescottIs.
MelvilleIsland
DigbyIs.
Prince Rupert
Kitkatla
Klemtu
FarrantIs.
GribbellIsland
Maitland Is.
RennisonIs.
Beauchemin Channel
LaredoSound
Laredo Channel
Estevan Sound
Squally Channel
CampaniaSound
CaamañoSound
NepeanSound
Otter Channel
WrightSound
Whale Channel
Lared
o Inle
t
Finlay
son C
hann
el
Doug
las C
hann
el
Verney
Passage
Kitim
at Ar
m
Principe Channel
ChathamSound
Skeena River
Grenville Channel
BrowningEntrance
Ogden C
hannel
Kitkatla Channel
BonillaIs.
HecateStrait
Gardner Canal
TripleIslands
6-1
6-9
6-4
6-2
6-5
6-3
6-20
6-10
6-13
6-6
6-16
6-19
6-12
6-7
6-17
6-14
6-25
6-28
6-11
6-8
6-18
6-15
6-236-26
6-21
6-22
6-27
6-24
5-17
5-11
5-20
5-22
5-235-10
5-13
5-16
5-2
5-14
5-24
5-9
5-1
5-3
5-4
5-21
5-19
5-15
5-12
5-5
5-18
5-8
5-7 5-6
Pipeline Route
Terrestrial PDA
Fisheries Management Area 5
Fisheries Management Area 6
Fisheries Management Subarea
Railway
Road
River / Stream
NP
Jacques Whitford AXYS Ltd.
FIGURE NUMBER:
PROJECTION:
CONTRACTOR: DATE:
AUTHOR: APPROVED BY:PREPARED FOR:PREPARED BY: SCALE:
DFO Fisheries Management Areas 5 and 6and Subareas
ENB R ID GE N OR TH ER N GA TEW A Y PR OJ EC T
R:\2
009F
isca
l\104
8334
_Nor
ther
nGat
eway
_ES
A_2
009
9-2
NAD 83DATUM:
1:1,100,000
UTM 9
CM
5-x6-x
20090911
0 10 20 30
Kilometres
Reference: Pipeline Route R
JWA-1048334-1543
REFERENCES: NTDB Topographic Mapsheets provided by the Majesty the Queen in Right of Canada, Department of Natural Resources. All rights reserved.

BishCove
EmsleyPoint
NP
Jacques Whitford AXYS Ltd.
FIGURE NUMBER:
PROJECTION:
CONTRACTOR: DATE:
AUTHOR: APPROVED BY:PREPARED FOR:PREPARED BY: SCALE:
Dungeness Crab Distribution
ENB R ID GE N OR TH ER N GA TEW A Y PR OJ EC T
NAD 83DATUM:
1:25,000
UTM 9
CM
To K
itim
at
K i t i
m a
t A
r m
9-3
Bish Creek
Kitimat Terminal
0 0.25 0.5 0.75
Kilometres
Reference: Pipeline Route R
JWA-1048334-1544
REFERENCES: NTDB Topographic Mapsheets provided by the Majesty the Queen in Right of Canada, Department of Natural Resources. All rights reserved.
Pipeline Route
Security Fence
Terrestrial PDA
Marine PDA
Dungeness Crab Distribution
Bathymetric Contour (100 m)
Railway
Road
R:\2
009F
isca
l\104
8334
_Nor
ther
nGat
eway
_ES
A_2
009
20090911

Sec. 52 Application Volume 6B: Environmental and Socio-Economic Assessment (ESA) – Marine Terminal Section 9: Marine Invertebrates
Page 9-12 May 2010
Limiting Factors
Potential threats to Dungeness crab include (Alaska Department of Fish and Game 1985):
• an increase in suspended organic or mineral material • alteration of substrate (e.g., sandy bottoms) • a reduction in protective cover (e.g., seaweed beds) • obstruction of migration routes • shock waves in the aquatic environment • changes in the temperature or chemistry of nearshore waters • climate change (McConnaughey and Armstrong 1995) • invasive species (McDonald et al. 2001) • commercial fishery (DFO 2002)
9.5.3 Hexactinellid Sponges
Status
Hexactinellid or glass sponges are commonly found throughout marine waters of British Columbia and are of interest due to their ability to form large reef complexes. Although there are specific reef formations that are under consideration for protective status (Jamison and Chew 2002), the species itself does not receive any formal provincial or federal protection.
Seasonal Distribution, Population Trends and Habitat Requirements
Glass sponges typically live in deep waters (500 to 3,000 m) worldwide. They are found in waters shallower than 50 m at only four locations, one of which includes the coastal waters of the Pacific northwest.
The major difference between North America’s glass sponge communities and those of all other oceans is the presence of large numbers of reef-building (dictyonine) sponges (Leys et al. 2004). At least seven reefs of hexactinellids have recently been discovered in Hecate Strait and the Strait of Georgia at depths of 165 to 240 m (Conway et al. 2001).
A subtidal video survey of the marine PDA in May 2007 indicated a scattered distribution of hexactinellid sponges throughout the survey area. The sponges were present at both ends of the marine PDA, but absent from the central region and appeared to be associated with the steep, rugged cliffs found within the northern portion just outside (southern end) of the marine PDA.
While these sponges have the potential to form reefs, their abundance during baseline surveys did not indicate the formation of sponge reefs. Sponge reefs consist of frequently interconnected circular mounds and ridges up to 21 m in height (Conway et al. 2001). The sponges within the PEAA were low-density, loose aggregations.

Sec. 52 Application Volume 6B: Environmental and Socio-Economic Assessment (ESA) – Marine Terminal Section 9: Marine Invertebrates
May 2010 Page 9-13
Limiting Factors
Possible factors limiting the distribution of hexactinellids on the British Columbia Coast (Leys et al. 2004) include:
• dissolved oxygen levels • sediment loading • levels of dissolved silica • temperature • light sensitivity • food availability • anthropogenic influences (e.g., bottom trawling; coastal industrial development) • substrate
9.6 Effects on Marine Invertebrates – Habitat Availability
9.6.1 Baseline Conditions The shoreline within the PDA is predominantly composed of two shore types – rock cliff and rock with sand and gravel beaches. These two shore types comprise 14.5% (9,944.8 m) of the total shoreline length (70,072.1 m) within the PEAA. The shoreline within the PEAA is relatively undisturbed and provides ample habitat for marine invertebrate communities. Rocky shores, such as those similar to habitat in the PDA, dominate the intertidal zone, accounting for 39% (27,061 m) of the total shoreline of the PEAA (see the Marine Fish and Fish Habitat TDR). The remainder of habitat types in the PEAA includes estuaries, sand and gravel beaches, and salt marshes, which also provide important habitat for marine invertebrates.
The subtidal habitat within the PDA is representative of the subtidal habitats within the PEAA. It is composed of underlying bedrock, with varying substrate types on top, ranging from cobble to silt and clay. Preliminary analyses of sediment suggest that the deep subtidal zone (greater than 30 m) is dominated by silt and clay habitat types.
Rockweed and sea lettuce (Fucus distichus ssp. edentatus and Ulva sp.) are the dominant macrophytes in the intertidal zone. The dominant fauna found in this zone include barnacles, mussels, periwinkles and limpets. Species that can be found in the benthic community include sea urchins, moon snails, sea stars and the California sea cucumber. Estuaries contain eelgrass, which provides important habitat for juvenile fish, forage fish and a variety of invertebrates such as Dungeness crab. These soft bottom areas also contain commercially harvested bivalves such as butter clams and heart cockles.
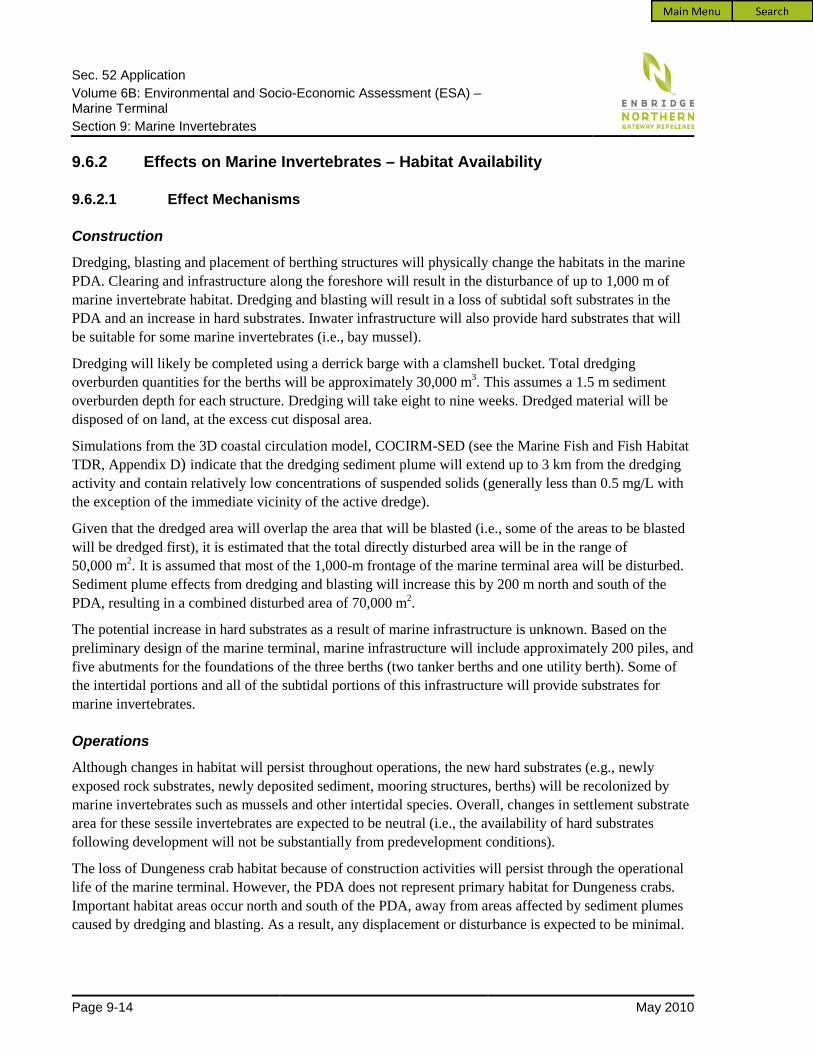
Sec. 52 Application Volume 6B: Environmental and Socio-Economic Assessment (ESA) – Marine Terminal Section 9: Marine Invertebrates
Page 9-14 May 2010
9.6.2 Effects on Marine Invertebrates – Habitat Availability
9.6.2.1 Effect Mechanisms
Construction
Dredging, blasting and placement of berthing structures will physically change the habitats in the marine PDA. Clearing and infrastructure along the foreshore will result in the disturbance of up to 1,000 m of marine invertebrate habitat. Dredging and blasting will result in a loss of subtidal soft substrates in the PDA and an increase in hard substrates. Inwater infrastructure will also provide hard substrates that will be suitable for some marine invertebrates (i.e., bay mussel).
Dredging will likely be completed using a derrick barge with a clamshell bucket. Total dredging overburden quantities for the berths will be approximately 30,000 m3. This assumes a 1.5 m sediment overburden depth for each structure. Dredging will take eight to nine weeks. Dredged material will be disposed of on land, at the excess cut disposal area.
Simulations from the 3D coastal circulation model, COCIRM-SED (see the Marine Fish and Fish Habitat TDR, Appendix D) indicate that the dredging sediment plume will extend up to 3 km from the dredging activity and contain relatively low concentrations of suspended solids (generally less than 0.5 mg/L with the exception of the immediate vicinity of the active dredge).
Given that the dredged area will overlap the area that will be blasted (i.e., some of the areas to be blasted will be dredged first), it is estimated that the total directly disturbed area will be in the range of 50,000 m2. It is assumed that most of the 1,000-m frontage of the marine terminal area will be disturbed. Sediment plume effects from dredging and blasting will increase this by 200 m north and south of the PDA, resulting in a combined disturbed area of 70,000 m2.
The potential increase in hard substrates as a result of marine infrastructure is unknown. Based on the preliminary design of the marine terminal, marine infrastructure will include approximately 200 piles, and five abutments for the foundations of the three berths (two tanker berths and one utility berth). Some of the intertidal portions and all of the subtidal portions of this infrastructure will provide substrates for marine invertebrates.
Operations
Although changes in habitat will persist throughout operations, the new hard substrates (e.g., newly exposed rock substrates, newly deposited sediment, mooring structures, berths) will be recolonized by marine invertebrates such as mussels and other intertidal species. Overall, changes in settlement substrate area for these sessile invertebrates are expected to be neutral (i.e., the availability of hard substrates following development will not be substantially from predevelopment conditions).
The loss of Dungeness crab habitat because of construction activities will persist through the operational life of the marine terminal. However, the PDA does not represent primary habitat for Dungeness crabs. Important habitat areas occur north and south of the PDA, away from areas affected by sediment plumes caused by dredging and blasting. As a result, any displacement or disturbance is expected to be minimal.

Sec. 52 Application Volume 6B: Environmental and Socio-Economic Assessment (ESA) – Marine Terminal Section 9: Marine Invertebrates
May 2010 Page 9-15
Decommissioning
All Kitimat Terminal facilities will be removed to the top of the substrate (i.e., surface substrate or material [rock, sand, mud]) and reclaimed according to the regulations and standards at the time of decommissioning. The removal of inwater infrastructures will result in a loss of artificial substrate for mussel and sponges but will return the site to a more natural condition.
9.6.2.2 Mitigation and Effects Management
As discussed in Section 9.3, a suite of measures will be used, as appropriate, to reduce effects of dredging and blasting on habitat for marine invertebrates and other marine species. Key measures include:
• limiting the area that will need to be dredged or blasted • limiting the number of inwater structures • using silt curtains and plume monitoring • developing a Blasting Management Plan
9.6.2.3 Residual Effects
For a summary of the residual effects of project activities on habitat availability for marine invertebrates, see Table 9-2.
Potential environmental effects of changes in habitat and disturbance on marine invertebrate populations are predicted to be not significant because of the:
• localized area of the marine terminal and indirect effects • ability of marine invertebrates to recolonize the disturbed areas within several years • abundance of nearby similar habitat
As noted for marine fish, habitat change as a result of the Project will be fully mitigated by a fish habitat compensation plan to confirm no net loss of productive capacity. Additional details for each KI are provided below.
Bay Mussel
It is assumed that dredging and blasting and associated sediment dispersion could affect a combined area of 70,000 m2. The disturbance will occur early in the construction phase. Few additional direct disturbances are expected during construction with the exception of the installation of rocket socketed piles.

Sec. 52 Application Volume 6B: Environmental and Socio-Economic Assessment (ESA) – Marine Terminal Section 9: Marine Invertebrates
Page 9-16 May 2010
Table 9-2 Characterization of the Residual Effects on Marine Invertebrates – Habitat Availability
Activity Direction
Additional Proposed Mitigation/ Compensation
Measures 1-4
Residual Environmental Effect
Magnitude
Geographic Extent
Duration/
Frequency
Reversibility
Significance Potential Measurable
Contribution to Regional Cumulative
Environmental Effects Construction Inwater infrastructure site preparation Adverse • Construction EPMP1
• Work windows2 • Crab salvage3 • Blasting Management Plan4
L S P/O I N N
Inwater infrastructure construction Adverse • Construction EPMP1 • Work windows2 • Crab salvage3
L S P/O R N N
Operations
Inwater infrastructure PDA Positive N/A L S L/C R N N
Berthed tankers Adverse • See below L S L/C R N N
Decommissioning Onshore site restoration (infrastructure removal, site rehabilitation and reclamation)
Adverse N/A L S L/O R N N
Inwater infrastructure site restoration (infrastructure removal)
Adverse N/A L S S/O R N N

Sec. 52 Application Volume 6B: Environmental and Socio-Economic Assessment (ESA) – Marine Terminal Section 9: Marine Invertebrates
May 2010 Page 9-17
Table 9-2 Characterization of the Residual Effects on Marine Invertebrates – Habitat Availability (cont’d) Mitigation: 1 Construction EPMP: The Construction EPMP (Volume 7A) outlines the protection measures developed by Northern Gateway for the routine activities during
construction to reduce potential environmental effects. It also encompasses compliance and effects monitoring programs. Sediment management measures incorporated in the Construction EPMP include the use of silt curtains, sediment settlement ponds, and managing surface water drainage, as appropriate. These measures are included in the Erosion and Sediment Control Plan (see Volume 7A, Appendix A.3.5) and the Storm Water Management Plan (see Volume 7A, Appendix A.3.4) that are part of the EPMP. These plans will be implemented to manage surface water drainage during construction to reduce sedimentation in nearshore waters.
2 Work windows: Timing of work windows for inwater activities such as dredging and blasting will be determined in consultation with DFO. These windows will consider sensitive periods for marine invertebrates.
3 Crab salvage: If crab habitats are affected, crabs will be salvaged by trap and relocated before inwater site preparation activities (dredging, blasting) occur. 4 Blasting Management Plan: A Blasting Management Plan will be developed to confirm that all blasting activities are concurrent with DFO guidelines for the use
of explosives in or near Canadian fisheries waters.
Follow-up and Monitoring: Water Quality and Substrate Composition Monitoring Plan: The Water Quality and Substrate Composition Monitoring Plan includes monitoring of the sediment plume in the marine environment during dredging and blasting. See Section 9.9. KEY Magnitude: N Negligible: No measurable adverse
environmental effects are anticipated L Low: affects a specific group of localized
individuals within a population but does not affect other trophic levels or the population itself
M Moderate: affects a portion of the local population but does not threaten the integrity of that population or any population dependent upon it
H High: Affects the local population to the degree that it may threaten the integrity of that population or any population dependent upon it
Geographic Extent: S Site specific: within the PDA L Local: within the PEAA R Regional: extends beyond the PEAA
Duration: S Short term: Effects are noticeable during
construction and decommissioning M Medium term: effects noticeable less than
two years after the construction is complete
L Long term: Effects are noticeable more than two years after construction
P Permanent
Frequency: O Occurs once S Occurs occasionally R Occurs regularly C Continuous
Reversibility: R Reversible I Irreversible
Significance: S Significant N Not Significant
Potential Contribution to Regional Cumulative Effects: Y Yes N No

Sec. 52 Application Volume 6B: Environmental and Socio-Economic Assessment (ESA) – Marine Terminal Section 9: Marine Invertebrates
Page 9-18 May 2010
The total length of marine invertebrate habitat that is expected to be lost or altered due to project activities is 1,000 m. As noted earlier, 14.5% of the total shoreline within the PEAA consists of rock cliff and rock with sand and gravel beaches that are similar to those that occur within the PDA. These and other habitats, such as rock with sandy beaches and rock with gravel beaches, that are suitable for bay mussels, account for 39% of the shoreline length in the PEAA. Assuming that bay mussels occupy all of these similar rocky substrates, direct effects of construction activities will therefore affect approximately 1.4% of the total shoreline and 3.7% of suitable habitat for bay mussel in the PEAA. Because mussels are a common species in the area and are pioneering species that will recolonize disturbed areas very quickly, it is expected that the disturbed suitable substrates will be recolonized within one to two seasons. The berthing and mooring structures will also provide new suitable substrate for mussel settlement.
As a result, effects of changes in habitat and disturbance from the Project on bay mussel are not expected to result in long-term changes in the local abundance or distribution of bay mussels and will be not significant.
Dungeness Crab
The PDA is not considered prime nursery or spawning habitat for Dungeness crab. Suitable areas do occur to the south of the PDA (i.e., Bish Cove) but are not expected to be affected by dredging, blasting or sedimentation. As a result, changes in habitat availability for Dungeness crab are expected to low (i.e., affect a few individuals in a portion of their range). Following the initial dredging and blasting activity, crabs will eventually be able to return to and use the PDA. Effects of changes in habitat and disturbance of the Project on Dungeness crab are therefore predicted to be not significant.
Hexactinellid Sponges
Hexactinellid sponges prefer hard substrates, such as bare rock or rock with only a light sediment cover. (Leys et al. 2004) observed very few sponges on what appeared to be gravel and sediment covered substrates. Sponges seen within the PDA were individual sponges and not of the appropriate formation or density to constitute a sponge reef. Since individual sponges are common throughout the north and central coasts, they do not carry the same ecological vulnerability as the rare reef complexes.
While the exact area of suitable habitat for hexactinellid sponges that will be altered or disturbed in the PDA is not known, the creation of new-exposed rocky substrates and marine infrastructure (e.g., pilings) will provide areas that may be suitable for recolonization by sponges. However, little is known about the reproduction and recruitment of hexactinellid sponges. Experts estimate the timeframe of recovery of reefs is in the order of 100 to 200 years, based on what is known about their slow growth rates (DFO 2000b).
While recovery of sponges within the PDA could take a long time, the area of the effect is small compared to the availability of habitat in the PEAA and the adjacent regional area. No effects on the long-term sustainability of hexactinellid sponges in the region are expected. In addition, as the areas created by blasting and dredging will create surfaces suitable for recolonization, the effect is assumed to be reversible. Effects of changes in habitat and disturbance from the Project on hexactinellid sponges are therefore expected to be not significant. There may even be potential to increase suitable habitat for this KI.

Sec. 52 Application Volume 6B: Environmental and Socio-Economic Assessment (ESA) – Marine Terminal Section 9: Marine Invertebrates
May 2010 Page 9-19
9.6.3 Cumulative Effects Implications Project-specific residual environmental effects on marine invertebrates are expected to be very localized, short-term and reversible. Due to the availability of similar habitat in other areas of the PEAA and the broader region, no effects on the sustainability of marine invertebrate populations are likely.
Although other developments in the PEAA (see Appendix 3A) have resulted in similar disturbances of marine invertebrate habitat, the effects are also highly localized, short-term and reversible. It is therefore unlikely that the effects of these other activities and projects on marine invertebrate habitat would interact cumulatively with the similar project effects to an extent that the long-term sustainability of marine invertebrates would be compromised.
Given that few measurable project effects are expected and there is limited potential for interactions with cumulative effects from past, present and future projects, cumulative effects on marine invertebrate habitat are considered to be not significant and are not considered further in this assessment.
9.6.4 Prediction Confidence The degree of confidence in the prediction of not significant for residual project effects of changes in habitat on the bay mussel is rated as high because the sources of disturbance are understood, potential environmental effects can be identified and mussel population distribution is known.
Confidence in the prediction of not significant for residual effects of changes in habitat on Dungeness crab and hexactinellid sponge populations is rated as moderate. While the sources of disturbance are understood and potential environmental effects identified, uncertainty remains regarding Dungeness crab distribution in the PEAA and the recovery potential of benthic sponges.
The level of certainty for the prediction of not significant for project contribution to cumulative environmental effects in relation to changes in habitat on marine invertebrates is high, given the magnitude of the potential effects on habitat from this and other projects.
9.7 Effects on Marine Invertebrates – Direct Mortality
9.7.1 Baseline Conditions Marine invertebrates are adapted to intertidal and nearshore conditions that include substantial variation in temperature, salinity and turbidity in addition to predation and disturbance from storm events. Marine invertebrates in the marine PDA are currently not subject to major disturbances from anthropogenic sources. In contrast, marine invertebrate communities have been altered by industrial and residential activities in several locations in Kitimat Arm, including development of marine infrastructure, vessel traffic, and industrial and municipal discharges.

Sec. 52 Application Volume 6B: Environmental and Socio-Economic Assessment (ESA) – Marine Terminal Section 9: Marine Invertebrates
Page 9-20 May 2010
9.7.2 Effects on Marine Invertebrates – Direct Mortality
9.7.2.1 Effect Mechanisms
Direct mortality effects of the Project on marine invertebrates are assessed, based on the aerial extent of habitat disturbances and the relative abundance of the KIs.
Construction
Construction activities such as blasting and dredging to install onshore and inwater infrastructure (e.g., berthing and mooring structures) will result in direct mortality of marine invertebrate species within the marine PDA. While construction activities will take place over four years, marine invertebrates in the PDA are at greatest risk of direct mortality during dredging, blasting and associated site preparation.
Dredging can directly smother or affect sessile or slow-moving organisms. The ability of benthic invertebrates to cope with increased sedimentation and potential smothering varies considerably among species and is also influenced by sediment type, sediment depth, duration of burial and temperature (Maurer and Keck 1978). Resettlement of disturbed materials is unlikely to cause direct mortality of marine invertebrates due to smothering, except in the marine PDA. The life stage of a species can affect its sensitivity to increased sedimentation. For example, eggs and larvae are more sensitive to inorganic suspensions than are adults of the same species (Appleby and Scarratt 1989).
The majority of blasting will take place in water depths of 10 to 32 m. However, some blasting might take place in shallower water. Blasting will result in direct mortality of organisms within the area affected by the blasting. Based on preliminary engineering, total rock blasting (cut) quantities for the berth structures will be approximately 25,000 m3.
Blasting may also change adjacent inshore habitat and cause mobile marine invertebrates to temporarily avoid the adjacent waters. The effects of underwater blasting on benthic marine invertebrates are not well understood; however, invertebrates appear to be relatively resilient to damage caused by pressure changes (shock waves) from underwater explosions (Keevin and Hempen 1997). Acoustically induced invertebrate mortality is dependent on the location of the blasting activities (open ocean, sediment or rock), energy of the detonations, and the distance of the organism from the detonation source (Keevin and Hempen 1997).
Previous studies have shown that Dungeness crab suffered no damage from blasting when blast pressure was kept below 100 kilopascals (kPa) at a 10 m radius (Keevin and Hempen 1997; Moriyasu et al. 2004).
Operations
Berthing during operations may result in crushing of small numbers of mussels on the berthing structures. Direct localized mortality of mussels on the marine terminal is not expected to affect mussel populations in the PEAA. Routine operations of the marine terminal should not result in direct mortality of Dungeness crabs or hexactinellid sponges in the marine PDA because these species are geographically separated from the routine operational activities at the marine terminal.

Sec. 52 Application Volume 6B: Environmental and Socio-Economic Assessment (ESA) – Marine Terminal Section 9: Marine Invertebrates
May 2010 Page 9-21
Decommissioning
All facilities in the Kitimat Terminal will be removed to the top of the substrate and reclaimed according to the regulations and standards at the time of decommissioning. Removal of inwater infrastructure will result in the mortality of sessile species (i.e., mussels and sponges) that have colonized this infrastructure.
9.7.2.2 Mitigation and Effects Management
As discussed in Section 9.3, a suite of measures will be used, as appropriate, to reduce effects of dredging and blasting on marine invertebrates and other marine species. Key measures include:
• timing work windows, in consultation with DFO, to avoid sensitive periods, where practical • using silt curtains and plume monitoring • developing a Blasting Management Plan
9.7.2.3 Residual Effects
For a summary of the residual effects of project activities on marine invertebrate mortality, see Table 9-3.
Bay Mussel
Direct mortality of mussels in the PDA will likely be greatest because of dredging and blasting activities. Some additional mortality could occur during placement of berthing and mooring structures on shore. As noted in Section 9.6.2.3, assuming that bay mussels occupy all of these similar rocky substrates in the PEAA, direct effects of construction activities will affect approximately 3.7% of the bay mussel population in the PEAA. Following the initial construction activities, the newly exposed rocky substrates, as well as the berthing and mooring structures will provide suitable substrate for mussel settlement. Recolonization is expected within one to two years.
Given the relative number of mussels that might be killed because of routine activities and the ability of this species to recolonize disturbed areas and artificial structures, there will be no long-term changes in local abundance or distribution of bay mussels resulting from the Project. As a result, effects of direct mortality from the Project on the bay mussel will be not significant.
Dungeness Crab
While dredging and blasting areas in the marine PDA may overlap with some Dungeness crab habitat, it is not likely to be an area of high crab abundance because of the steep slopes. Trapping and subtidal video surveys revealed very low numbers of Dungeness crab in the PDA.
Crabs may also be susceptible to physical damage from blasting and associated shock waves during their moulting period as they have a soft shell and very limited mobility. Work windows will be developed in consultation with DFO and will consider sensitive life history phases, such as egg extrusion and larval release.

Sec. 52 Application Volume 6B: Environmental and Socio-Economic Assessment (ESA) – Marine Terminal Section 9: Marine Invertebrates
Page 9-22 May 2010
Table 9-3 Characterization of the Residual Effects on Marine Invertebrates – Direct Mortality
Activity Direction
Additional Proposed Mitigation/Compensation
Measures 1-4
Residual Environmental Effect
Magnitude
Geographic Extent
Duration/
Frequency
Reversibility
Significance Potential
Measurable Contribution to
Regional Cumulative
Environmental Effects
Construction
• Onshore infrastructure site preparation Adverse • Construction EPMP1 L S S/O I N N
• Inwater infrastructure site preparation Adverse • Construction EPMP1 • Work windows2 • Crab salvage3 • Blasting Management Plan4
L S S/O I N N
• Inwater infrastructure construction Adverse • Construction EPMP1 • Work windows2 • Crab salvage3
L S S/O I N N
Operations
• Berthed tankers Adverse N/A L S L/R I N N
Decommissioning
• Inwater infrastructure site restoration Adverse • Work windows3 L S S/O I N N

Sec. 52 Application Volume 6B: Environmental and Socio-Economic Assessment (ESA) – Marine Terminal Section 9: Marine Invertebrates
May 2010 Page 9-23
Table 9-3 Characterization of the Residual Effects on Marine Invertebrates – Direct Mortality (cont’d) Mitigation: 1 Construction EPMP: The Construction EPMP (Volume 7A) outlines the protection measures developed by Northern Gateway for the routine activities during
construction to reduce potential environmental effects. It also encompasses compliance and effects monitoring programs. Sediment management measures incorporated in the Construction EPMP include the use of silt curtains, sediment settlement ponds, and managing surface water drainage, as appropriate. These measures are included in the Erosion and Sediment Control Plan (see Volume 7A, Appendix A.3.5) and the Storm Water Management Plan (see Volume 7A, Appendix A.3.4) that are part of the EPMP. These plans will be implemented to manage surface water drainage during construction to reduce sedimentation in nearshore waters.
2 Work windows: Timing of work windows for inwater activities such as dredging and blasting will be determined in consultation with DFO. These windows will consider sensitive periods for organisms.
3 Crab salvage: If crab habitats are affected, crabs will be salvaged by trap and relocated before inwater site preparation activities (dredging, blasting) occur. 4 Blasting Management Plan: A Blasting Management Plan will be developed so that all blasting activities are concurrent with DFO guidelines for the use of
explosives in or near Canadian fisheries waters.
Follow-up and Monitoring: Water Quality and Substrate Composition Monitoring Plan: The Water Quality and Substrate Composition Monitoring Plan includes monitoring of the sediment plume in the marine environment during dredging and blasting. See Section 9.9.
KEY Magnitude: N Negligible: No measurable adverse
environmental effects are anticipated L Low: affects a specific group of localized
individuals within a population but does not affect other trophic levels or the population itself
M Moderate: affects a portion of the local population but does not threaten the integrity of that population or any population dependent upon it
H High: Affects the local population to the degree that it may threaten the integrity of that population or any population dependent upon it
Geographic Extent: S Site specific: within the PDA L Local: within the PEAA R Regional: extends beyond the PEAA
Duration: S Short term: Effects are noticeable during
construction and decommissioning M Medium term: effects noticeable less
than two years after the construction is complete
L Long term: Effects are noticeable more than two years after construction
P Permanent
Frequency: O Occurs once S Occurs occasionally R Occurs regularly C Continuous
Reversibility: R Reversible I Irreversible
Significance: S Significant N Not Significant
Potential Contribution to Regional Cumulative Effects: Y Yes N No

Sec. 52 Application Volume 6B: Environmental and Socio-Economic Assessment (ESA) – Marine Terminal Section 9: Marine Invertebrates
Page 9-24 May 2010
Overall, few Dungeness crab are expected to be killed or injured by the construction activities relative to the abundance of the species in the PEAA. Any loss of animals would be replaced through natural recruitment within one to two breeding seasons. Given that effects of direct mortality are highly localized, short-term and reversible, the effect of the Project on Dungeness crabs is concluded to be not significant.
Hexactinellid Sponges
While the presence of hexactinellid sponges is documented in the PDA, the sponges seen on site were not of the appropriate formation or density to constitute a sponge reef. Construction activities may result in mortality of individual sponges, which are common throughout the north and central coasts and do not carry the same ecological vulnerability as the rare reef complexes. Consequently, the effect of direct mortality from the Project on sponges is predicted to be not significant.
In addition to smothering, hexactinellid sponges are susceptible to structural damage, as their skeletal projections are easily fragmented (Jamieson and Chew 2002). If physical injury from construction activities does not cause direct mortality, it could still have detrimental effects on the growth and development of sponge aggregations and reef complexes due to available substrate and reproductive strategy. In addition, glass sponges predominately reproduce asexually and grow off existing colonies (bipartitioning and budding) (Teixidó et al. 2006), making neighbouring skeletons the only available substrate for the attachment of new sponges. Because of this, skeleton fragmentation may inhibit the recruitment of new sponges (Jamieson and Chew 2002).
9.7.3 Cumulative Effects Implications Marine invertebrate mortalities resulting from the Project are not expected to result in a measurable, demonstrable or reasonably expected residual environmental effect on marine invertebrate populations in the PEAA. Due to the limited spatial extent of project activities and the widespread distribution of invertebrate populations within the PEAA, project-specific residual environmental effects are not expected to act in a cumulative fashion with the environmental effects of other past, present or future projects and activities. Overall, the Project is not expected to contribute cumulatively to the viability or sustainability of marine invertebrate populations in the PEAA.
9.7.4 Prediction Confidence The degree of confidence in the prediction of not significant for residual effects of the project activities on bay mussel mortality is rated as high because the sources of disturbance are understood, potential effects can be identified and mussel population distribution is known.
Confidence in the prediction of not significant for residual effects of project activities on Dungeness crab and hexactinellid sponge mortality is rated as moderate. Although the sources of disturbance are understood and potential effects identified, uncertainty remains regarding Dungeness crab distribution in the PEAA and the recovery potential of benthic sponges.

Sec. 52 Application Volume 6B: Environmental and Socio-Economic Assessment (ESA) – Marine Terminal Section 9: Marine Invertebrates
May 2010 Page 9-25
9.8 Effects on Marine Invertebrates – Habitat Quality
9.8.1 Baseline Conditions Habitat quality for marine invertebrates is assessed, based largely on suspended sediment concentration and the quality of sediment.
Sedimentation patterns in the PEAA are largely controlled by natural outflows from the nearest freshwater source, the Kitimat River. Additionally, there are tides and currents actions that create periods of suspended sediments. Levels of total suspended solids (TSS) fluctuate seasonally and in response to climatic variations, but tend to be highest during June and July (see the Marine Physical Environment TDR).
9.8.2 Effects on Marine Invertebrates – Habitat Quality
9.8.2.1 Effect Mechanisms
Construction
Construction activities, such as dredging and blasting to install onshore and inwater infrastructure (e.g., berthing and mooring structures) will result in temporary increases in sediment suspension in the PDA as well as an adjacent area of up to 200 m around the PDA.
Dredging for the berth structures will result in approximately 30,000 m3 of sediments based on an estimated 1.5 m of sediment overburden for each structure (see Section 2.2.2.1). In general, mechanical dredges (e.g., clamshell) increase suspended sediment concentrations more than hydraulic (hopper and cutterhead) methods (Wilbur and Clarke 2001). Herbich and Brahme (1991) broke down the process of sediment re-suspension from mechanical dredging into the following components:
• re-suspension when the bucket hits the sediment bed, closes and is pulled off the bottom
• sediment losses as the bucket is pulled through the water column
• sediment losses when the bucket breaks the water surface
• sediment and water spillage or leakage as the bucket is hoisted and swung from the water to the haul barge
Underwater blasting will be required to provide a level surface for pile location and positioning. As noted earlier, total rock blasting (cut) quantities for the berth structures will be approximately 25,000 m3.
Effects of re-suspended sediment on marine invertebrates can be broken down into two broad categories (Anchor Environmental 2003):
• effects related to the physical properties of the sediment • effects related to chemicals associated with the sediments

Sec. 52 Application Volume 6B: Environmental and Socio-Economic Assessment (ESA) – Marine Terminal Section 9: Marine Invertebrates
Page 9-26 May 2010
Operations
Operation of the marine terminal is not expected to result in increases in sediment loads that would affect marine invertebrates in either the PDA or the PEAA. Due to the depth of water at the berthing facilities, prop wash from large vessels or harbour tugs will not re-suspend sediments from the bottom substrate.
Decommissioning
All Kitimat Terminal facilities will be removed to the top of the substrate and reclaimed according to the regulations and standards at the time of decommissioning. While the activities associated with the removal of the inwater infrastructure will result in some disturbance of marine sediments, the anticipated environmental effects on marine invertebrates due to increased TSS during this phase are predicted to be much less than during construction.
9.8.2.2 Mitigation and Effects Management
Changes in Water Quality As discussed in Section 9.3, a suite of measures will be used to reduce effects of dredging and blasting on marine invertebrates and other marine species. Key measures include:
• timing work windows, in consultation with DFO, to avoid sensitive periods, where practical • using silt curtains and plume monitoring • developing a Blasting Management Plan
9.8.2.3 Residual Effects
For a summary of the residual effects of changes in habitat quality from the Project on marine invertebrates, see Table 9-4.
Overview of Physical and Chemical Effects of Sediment on Marine Invertebrates
Physical Effects
Suspended sediments can elicit a variety of responses from aquatic biota, primarily because many attributes of the physical environment are affected. For example, increased light attenuation caused by turbidity reduces visibility, shortens the depth of the photic zone and can alter the vertical stratification of heat in the water column (Moore 1978). Physical effects are not all necessarily detrimental to aquatic organisms; for example, under laboratory conditions, several aquatic species actively prefer turbid over clear water conditions, presumably using turbid conditions to feed and avoid predators. Alternatively, physical effects from increased concentrations of suspended sediments can result in abrasion and clogging of filtration mechanisms, thereby interfering with ingestion and respiration and, in extreme cases, smothering and burial and, ultimately, mortality (Berry et al. 2003).
The ability of benthic invertebrates to cope with increased levels of suspended sediments within the water column varies among species. Filter feeders are more sensitive than deposit feeders and juveniles are more sensitive than adults (Newell et al. 1998). Suspension feeders are particularly vulnerable to physical abrasion and clogging of filtration and respiratory organs from releases of suspended matter.

Sec. 52 Application Volume 6B: Environmental and Socio-Economic Assessment (ESA) – Marine Terminal Section 9: Marine Invertebrates
May 2010 Page 9-27
Table 9-4 Characterization of the Residual Effects on Marine Invertebrates – Habitat Quality
Activity Direction
Additional Proposed Mitigation/Compensation
Measures1-4
Residual Environmental Effect
Magnitude
Geographic Extent
Duration/
Frequency
Reversibility
Significance Potential Measurable
Contribution to Regional Cumulative
Environmental Effects
Construction Onshore infrastructure site preparation (clearing, burning, grading, blasting)
Adverse • Construction EPMP1 L L S/O R N N
Inwater infrastructure site preparation (dredging, blasting, pile drilling)
Adverse • Construction EPMP1 • Work windows2 • Crab salvage3 • Blasting Management Plan4
L L S/O R N N
Inwater infrastructure construction (marine terminal, berths, pile installation)
Adverse • Construction EPMP1 • Work windows2 • Crab salvage3
L L S/O R N N
Operations Berthed tankers (and associated combustion emissions, inert gas exchange, prop wash, noise, boom deployment)
Adverse • Construction EPMP1
L L L/R R N N

Sec. 52 Application Volume 6B: Environmental and Socio-Economic Assessment (ESA) – Marine Terminal Section 9: Marine Invertebrates
Page 9-28 May 2010
Table 9-4 Characterization of the Residual Effects on Marine Invertebrates – Habitat Quality (cont’d)
Activity Direction
Additional Proposed Mitigation/Compensation
Measures1-4
Residual Environmental Effect
Magnitude
Geographic Extent
Duration/
Frequency
Reversibility
Significance Potential Measurable
Contribution to Regional Cumulative
Environmental Effects
Decommissioning Onshore site restoration (infrastructure removal, site rehabilitation and reclamation)
Adverse • Construction EPMP1 L L S/O R N N
Inwater infrastructure site restoration (infrastructure removal)
Adverse • Construction EPMP1 L L S/O R N N
Mitigation : 1 Construction EPMP: The Construction EPMP (Volume 7A) outlines the protection measures developed by Northern Gateway for the routine activities during
construction to reduce potential environmental effects. It also encompasses compliance and effects monitoring programs. Sediment management measures incorporated in the Construction EPMP include the use of silt curtains, sediment settlement ponds, and managing surface water drainage, as appropriate. These measures are included in the Erosion and Sediment Control Plan (see Volume 7A, Appendix A.3.5) and the Storm Water Management Plan (see Volume 7A, Appendix A.3.4) that are part of the EPMP. These plans will be implemented to manage surface water drainage during construction to reduce sedimentation in nearshore waters.
2 Work windows: Timing of work windows for inwater activities such as dredging and blasting will be determined in consultation with DFO. These windows will consider sensitive periods for marine invertebrates.
3 Crab salvage: If crab habitats are affected, crabs will be salvaged by trap and relocated before inwater site preparation activities (dredging, blasting) occur. 4 Blasting Management Plan: A Blasting Management Plan will be developed to confirm that all blasting activities are concurrent with DFO guidelines for the use
of explosives in or near Canadian fisheries waters.
Follow-up and Monitoring: Water Quality and Substrate Composition Monitoring Plan: The Water Quality and Substrate Composition Monitoring Plan includes monitoring of the sediment plume in the marine environment during dredging and blasting. See Section 9.9.

Sec. 52 Application Volume 6B: Environmental and Socio-Economic Assessment (ESA) – Marine Terminal Section 9: Marine Invertebrates
May 2010 Page 9-29
Table 9-4 Characterization of the Residual Effects on Marine Invertebrates – Habitat Quality (cont’d) KEY Magnitude: N Negligible: No measurable adverse
environmental effects are anticipated L Low: affects a specific group of localized
individuals within a population but does not affect other trophic levels or the population itself
M Moderate: affects a portion of the local population but does not threaten the integrity of that population or any population dependent upon it.
H High: Affects the local population to the degree that it may threaten the integrity of that population or any population dependent upon it
Geographic Extent: S Site specific: within the PDA L Local: within the PEAA R Regional: extends beyond the PEAA
Duration: S Short term: Effects are noticeable during
construction and decommissioning M Medium term: effects noticeable less than
two years after the construction is complete
L Long term: Effects are noticeable more than two years after construction
P Permanent
Frequency: O Occurs once S Occurs occasionally R Occurs regularly C Continuous
Reversibility: R Reversible I Irreversible
Significance: S Significant N Not Significant
Potential Contribution to Regional Cumulative Effects: Y Yes N No

Sec. 52 Application Volume 6B: Environmental and Socio-Economic Assessment (ESA) – Marine Terminal Section 9: Marine Invertebrates
Page 9-30 May 2010
Coastal bivalves (e.g., bay mussel) are resilient to increased TSS concentrations, whether induced by periodic storms or dredging. Newell et al. (1998) demonstrated that bivalves can maintain their feeding activity over a wide range of phytoplankton concentrations and inorganic particulate loads. Alternately, Sushko and Freeman (1991) found that bay mussel shell growth rates decreased with increased TSS concentrations. Bivalves use a number of mechanisms to cope with high concentrations of suspended sediments, such as reducing pumping rates and rejecting material in pseudofaeces (Wilbur and Clarke 2001). Although adult bivalves are silt-tolerant, their presence in naturally silty areas does not necessarily mean they are unaffected by high concentrations of suspended sediment (Wilbur and Clarke 2001). Nonetheless, suspended sediment concentrations required to elicit mortality are extremely high, beyond the upper limits of concentrations reported for most estuarine systems under natural conditions and greater than typical concentrations associated with dredging activities (Wilbur and Clarke 2001).
A 3D coastal circulation model determined TSS and deposition of sediments in the PEAA due to construction activities (see the Marine Fish and Fish Habitat TDR, Appendix D). At the surface (0 to 2 m), TSS is expected to reach levels between 0.05 and 0.5 mg/L, which is below the range of naturally occurring TSS values (greater than 25 mg/L). The deposition thickness, above water depths of 10 m, ranges from 0.01 to 0.05 mm. The model indicates that disturbed sediments will resettle in a narrow band (approximately 400 m wide) along the shore that extends approximately 4 km to the north and south of the dredging site.
Site preparation activities in the terrestrial PDA may also change marine habitat and water quality by introducing additional suspended sediments to the water column. The contribution of terrestrial runoff to sediment loading is expected to be minimal. In the event that sediment is introduced to the nearshore area, environmental effects will be restricted to a highly localized (i.e., less than a few hundred metres) area near the input site.
Chemical Effects
Most chemicals within water are bound to or adsorbed by particulates, and TSS levels are often highly correlated with the total concentration of chemicals (e.g., metals or hydrocarbons) present in re-suspended sediments (Eisler 2000).
Many studies have evaluated the effects of re-suspended contaminated sediments on marine organisms, including bioaccumulation of contaminants. Contaminant uptake rate depends on a number of factors such as species developmental stage, season and contaminant bioavailability (Eggleton and Thomas 2004). Eggleton and Thomas (2004) conducted sediment bioassays, which indicated it was unlikely for sediment re-suspension during dredging to cause acute water column toxicity. The concentrations of heavy metals and polychlorinated biphenyls (PCBs) found in common mussel species (Mytilus edulis) exposed to remobilized sediment-bound contaminants was sufficiently low, suggesting no cause for concern (Miller et al. 2000). Organisms such as mussels, shrimp, amphipod and polychaete species, shiner perch, striped bass and an isopod species also have proved to be tolerant of varying concentrations of contaminated suspended sediments of graded bentonite clay (Peddicord et al. 1975 cited in Hirsch et al. 1978). Lasalle et al. (1991) drew similar conclusions. On the other hand, (Vale et al. 1998) found another species of mussel, Mytilus galloprovincialis, accumulated metals and PCB congeners when tested under

Sec. 52 Application Volume 6B: Environmental and Socio-Economic Assessment (ESA) – Marine Terminal Section 9: Marine Invertebrates
May 2010 Page 9-31
laboratory settings of turbid aerated water. In general, however, the biological uptake of contaminants in suspended sediment is low and short term.
Other studies suggest more adverse effects, depending on the contaminant. When (Pruell et al. 1986) exposed bay mussel to sediments containing polycyclic aromatic hydrocarbons (PAHs) and PCBs, both contaminants were rapidly accumulated and remained for a long time. Similar studies support these findings, for example Roesijadi et al. 1978 and Geyer et al. 1982.
A sediment sampling program during winter 2006 characterized the level of contamination in the sediments in the marine PDA. These contaminants are likely associated with past industrial activity in Kitimat Arm. Copper and chromium concentrations were above the Canadian Council of Ministers of Environment (CCME) interim sediment quality guidelines (ISQG) within the PDA and at two reference areas in Kitimat Arm. Concentrations of all metals in all samples were less than the probable effects level (PEL).
The 2006 sampling program also detected dioxins and furans in the sediment samples. The most toxic of the dioxins is 2,3,7,8–tetrachlorodibenzo-p-dioxin (TCDD), which was reported in each sample taken from the PDA, with concentrations ranging from 0.12 to 0.21 pg/g (picograms per gram). The toxic equivalent (TEQ) values for the PDA samples ranged from 1.86 to 3.57 pg/g (TEQ is a standard measure of the combined toxicity of dioxins and furans in a sample). The TEQ values are calculated according to Environment Canada National Pollutant Release Inventory method and were higher than the ISQG, but well below the PEL. There were also a number of PAHs that were above ISQG levels but below the PEL. The sediment toxicity tests (10-day amphipod survival and 20-day polychaete survival and growth tests) showed no statistically notable differences in survival in contaminated sediments when compared to control sediments. This would suggest that the sediments from the PDA are not acutely or chronically toxic to infaunal invertebrates.
Bay Mussel
The vertical distribution of bay mussels in the PDA is predominantly limited to the intertidal region, and they will not be heavily exposed to suspended sediments as dredging and blasting will occur at approximately 10 to 30 m below chart datum.
Mussels are widely used as a bio-indicator for persistent organic pollutants (Lauenstein et al. 1990) because of their wide distribution, high abundance and propensity to accumulate compounds in their tissue. This species accumulates concentrations of metals two to five orders of magnitude greater than in ambient seawater (Potrykus et al. 2003).
Although mussel health in the PDA could be affected by long-term exposure to contaminated sediments, the exposure will be low because of the small volumes of sediment that will be disturbed and the short duration of exposure (eight to nine weeks). Underwater blasting activities will likely happen over 18 weeks. Overburden will be removed by clamshell dredge before blasting to limit the amounts of re-suspended sediment.
By-products from the detonation of explosives can include ammonia or similar compounds toxic to marine biota (Wright and Hopky 1998). Because the use of explosives is expected to be limited to within a few hundred metres of the marine terminal (i.e., the PDA), and compounds used for blasting will not

Sec. 52 Application Volume 6B: Environmental and Socio-Economic Assessment (ESA) – Marine Terminal Section 9: Marine Invertebrates
Page 9-32 May 2010
generate nitrogen compounds in the blast residue (e.g., ammonium nitrate-based explosives), the effects of contaminants on mussels are unlikely or restricted to a highly localized area surrounding the marine terminal.
Given the wide distribution of bay mussels in the PEAA, the short duration of the dredging and blasting activity (i.e., a combined total of several months over three years) and their ability to tolerate short-term exposure of sediment loads, effects of changes in habitat quality from the Project on bay mussels will be not significant.
Dungeness Crab
Due to the steep slope of the site and the hard bottom substrate, the PDA is most likely not a prime nursery habitat for Dungeness crabs. Sediments from dredging will not reach Bish Cove, which contains the largest eelgrass bed near the PDA.
The closest estuary that may contain Dungeness crabs in sensitive life history stages is more than 3 km from the marine terminal and likely will not be affected by the sediment plume.
Dungeness crabs are good environmental indicators of toxic contaminants because they accumulate contaminants in their tissue. They tend to concentrate contaminants at a higher level than finfish and many other shellfish (e.g., shrimp), because of their relatively sedentary nature and their penchant for sandy substrates (Environment Canada 2005, Internet site). Although Dungeness crabs may ingest re-suspended contaminants near the dredging and blasting areas, sediment toxicity tests suggest that these contaminants will not be present in toxic levels. Further, the affected area is highly localized and expected to be hundreds of metres away from dredging and blasting operations. As a result, effects of changes in habitat quality on Dungeness crab are expected to be not significant.
Hexactinellid Sponges
Hexactinellid sponges are sensitive to sediment loading. According to Leys and Lauzon (1998), glass sponges may be particularly sensitive because intake of particulates causes cessation of the feeding current until the suspended material clears from the water. Consequently, disturbances to the sediments around sponges may affect them within the PDA (Jamieson and Chew 2002). However, given that hexactinellid sponges typically reside in deep water (e.g., depths greater than 20 m), it is anticipated that the population in the PEAA will be exposed to lower levels of sediment from dredging or blasting than marine invertebrates in shallow water (e.g., less than 20 m depth).
Although there are no specific data on the accumulation of contaminants by benthic sponges, as filter feeders they are likely to ingest some contaminated particles. As with bay mussel, the magnitude of exposure to possible contaminated sediments will be low because of the small volumes being disturbed and the short duration of exposure.
Due to the localized temporal and spatial nature of sediment disturbance and resettling during the construction, operations and decommissioning phases of the berths, effects of changes in habitat quality due to sedimentation on hexactinellid sponges are predicted to be short-term and low in magnitude.

Sec. 52 Application Volume 6B: Environmental and Socio-Economic Assessment (ESA) – Marine Terminal Section 9: Marine Invertebrates
May 2010 Page 9-33
After the appropriate mitigation measures are applied, environmental effects are characterized as reversible and not significant.
9.8.3 Cumulative Effects Implications Changes in water quality from the Project are not expected to result in a measurable, demonstrable or reasonably expected residual environmental effect on marine invertebrate populations in the PEAA. Due to the limited spatial extent of potential increased TSS levels and sediment resettling (within the PEAA) from project activities and to the widespread distribution of invertebrate populations in the PEAA, project-specific residual environmental effects on marine invertebrates are not expected to be cumulative with the environmental effects of other past, present or future projects and activities. Overall, the Project is not expected to contribute cumulatively to the viability or sustainability of marine invertebrate populations in the PEAA.
9.8.4 Prediction Confidence The degree of confidence in the prediction of not significant for residual effects of elevated TSS concentrations on bay mussel is rated as high. The prediction confidence is considered high because the sources of disturbance are understood, potential environmental effects can be identified and mussel population distribution is known.
Confidence in the prediction of not significant for residual effects of sedimentation on Dungeness crab and hexactinellid sponge populations is rated as moderate. Although the sources of disturbance are understood and potential environmental effects identified, uncertainty remains regarding Dungeness crab distribution in the PEAA and the recovery potential of benthic sponges.
Similarly, the degree of confidence in the prediction of not significant for project contribution to cumulative environmental effects in relation to sedimentation disturbance on marine invertebrates is moderate. Potential effects of marine construction on invertebrates are generally understood. Potential effects from the Project are not expected to overlap spatially or temporally with activities of other projects.
9.9 Follow-up and Monitoring for Marine Invertebrates No specific follow-up and monitoring program for marine invertebrates are proposed. However, potential effects associated with sediment dispersion during dredging and blasting will be monitored as part of the general Environmental Protection and Management Plan for construction of the marine terminal. Details are provided in the Construction EPMP (Volume 7A).
9.10 Summary of Effects for Marine Invertebrates Based on recent literature, the current understanding of project components and the respective status and life histories of marine invertebrates in the PEAA, the combined residual effects of changes in habitat availability, direct mortality, and changes in habitat quality attributable to the Project are considered to be not significant.

Sec. 52 Application Volume 6B: Environmental and Socio-Economic Assessment (ESA) – Marine Terminal Section 9: Marine Invertebrates
Page 9-34 May 2010
The construction phase presents the highest risk of project effects on marine invertebrate populations, with the greatest risk occurring during the initial site preparation activities (i.e., dredging, blasting and initial installation of marine infrastructure). Mitigation measures will be in place to limit any potential environmental effects.
For a summary of the environmental effects of the Project on marine invertebrate populations throughout all project phases, see Table 9-5.

Sec. 52 Application Volume 6B: Environmental and Socio-Economic Assessment (ESA) – Marine Terminal Section 9: Marine Invertebrates
May 2010 Page 9-35
Table 9-5 Summary of Residual Environmental Effects on Marine Invertebrates
Potential Effect Mitigation1-4
Residual Environmental Effect
Magnitude Geographic
Extent Duration/
Frequency Reversibility Significance Prediction Confidence
Construction Direct mortality • Construction EPMP1
• Work windows2 • Crab salvage3 • Blasting Management Plan4
L S S/O I N Moderate
Change in habitat quality • Construction EPMP1 • Work windows2 • Crab salvage3 • Blasting Management Plan4
L L S/O R N Moderate
Change in habitat availability
• Construction EPMP1 • Work windows2 • Crab salvage3 • Blasting Management Plan4
L S P/O I N Moderate
Operations Direct mortality N/A L S L/R I N Moderate
Change in habitat quality • Construction EPMP1
L L L/R R N Moderate
Change in habitat availability
• Construction EPMP1 L S L/C R N Moderate

Sec. 52 ApplicationVolume 6B: Environmental and Socio-Economic Assessment (ESA) –Marine TerminalSection 9: Marine Invertebrates
Page 9-36 May 2010
Table 9-5 Summary of Residual Environmental Effects on Marine Invertebrates (cont’d)
Potential Effect Mitigation1-4
Residual Environmental Effect
MagnitudeGeographic
ExtentDuration/
Frequency Reversibility SignificancePredictionConfidence
DecommissioningDirect mortality Construction EPMP1
Work windows2L S S/O I N Moderate
Change in habitat quality Construction EPMP1 L L S/O R N Moderate
Change in habitatavailability
N/A L S S/O R N Moderate
Cumulative Environmental EffectsDirect mortality N/A N/A N/A N/A N/A N/A Low
Change in habitat quality N/A N/A N/A N/A N/A N/A Low
Change in habitatavailability
N/A N/A N/A N/A N/A N/A Low
Combined EffectsProject specific All above L L L/C R N Moderate
Cumulative effects N/A N/A N/A N/A N/A N/A Low

Sec. 52 ApplicationVolume 6B: Environmental and Socio-Economic Assessment (ESA) –Marine TerminalSection 9: Marine Invertebrates
May 2010 Page 9-37
Table 9-5 Summary of Residual Environmental Effects on Marine Invertebrates (cont’d)Mitigation :1 Construction EPMP: The Construction EPMP (Volume 7A) outlines the protection measures developed by Northern Gateway for the routine activities during
construction to reduce potential environmental effects. It also encompasses compliance and effects monitoring programs. Sediment management measuresincorporated in the Construction EPMP include the use of silt curtains, sediment settlement ponds, and managing surface water drainage, as appropriate. Thesemeasures are included in the Erosion and Sediment Control Plan (see Volume 7A, Appendix A.3.5) and the Storm Water Management Plan (see Volume 7A,Appendix A.3.4) that are part of the EPMP. These plans will be implemented to manage surface water drainage during construction to reduce sedimentation innearshore waters.
2 Work windows: Timing of work windows for inwater activities such as dredging and blasting will be determined in consultation with DFO. These windows willconsider sensitive periods for marine invertebrates.
3 Crab salvage: If crab habitats are affected, crabs will be salvaged by trap and relocated before inwater site preparation activities (dredging, blasting) occur.4 Blasting Management Plan: A Blasting Management Plan will be developed to confirm that all blasting activities are concurrent with DFO guidelines for the use of
explosives in or near Canadian fisheries waters.Follow-up and Monitoring:Water Quality and Substrate Composition Monitoring Plan: The Water Quality and Substrate Composition Monitoring Plan includes monitoring of the sedimentplume in the marine environment during dredging and blasting.See Section 9.9.KEYMagnitude:N Negligible: No measurable adverse
environmental effects are anticipatedL Low: affects a specific group of localized
individuals within a population but does not affectother trophic levels or the population itself
M Moderate: affects a portion of the local populationbut does not threaten the integrity of thatpopulation or any population dependent upon it
H High: Affects the local population to the degreethat it may threaten the integrity of thatpopulation or any population dependent upon it
Geographic Extent:S Site specific: within the PDAL Local: within the PEAAR Regional: extends beyond the PEAA
Duration:S Short term: Effects are noticeable during
construction and decommissioningM Medium term: effects noticeable less than two
years after the construction is completeL Long term: Effects are noticeable more than
two years after constructionP Permanent
Frequency:O Occurs onceS Occurs
occasionallyR Occurs regularlyC Continuous
Reversibility:R ReversibleI Irreversible
Significance:S SignificantN Not Significant
PredictionConfidence:H HighM ModerateL Low

Sec. 52 Application Volume 6B: Environmental and Socio-Economic Assessment (ESA) – Marine Terminal Section 9: Marine Invertebrates
Page 9-38 May 2010
9.11 References
9.11.1 Literature Cited Ackerman, J.D. and M.T. Nishizaki. 2004. The effect of velocity on the suspension feeding and growth of
the marine mussels Mytilus trossulus and Mytilus californianus: implications for niche separation. Journal of Marine Systems 49: 195–207.
Alaska Department of Fish and Game. 1985. Dungeness Crab, Cancer magister. In Alaska Habitat Management Guide, Southcentral Region, Volume 1: Life Histories and Habitat Requirements of Fish and Wildlife. Alaska Department of Fish and Game, Division of Habitat. Juneau, AK. 379–385.
Anchor Environmental. 2003. Literature Review of Effects of Resuspended Sediments due to Dredging Operations. Prepared for Los Angeles Contaminated Sediments Task Force. Los Angeles, CA.
Appleby, J.A. and D.J. Scarratt. 1989. Physical Effects of Suspended Solids on Marine and Estuarine Fish and Shellfish with Special Reference to Ocean Dumping: A Literature Review. Canadian Technical Report of Fisheries and Aquatic Sciences. Biological Sciences Branch, Department of Fisheries and Oceans. Halifax, NS.
ASL Environmental Sciences Inc. 2010. Marine Physical Environment Technical Data Report. Prepared for Northern Gateway Pipelines Inc. Calgary, AB.
Beckett, J. and K. Munro. 2010. Marine Fish and Fish Habitat Technical Data Report. Prepared for Northern Gateway Pipelines Inc. Calgary, AB.
Berry, W., N. Rubinstein, B. Melzian and B. Hill. 2003. The Biological Effects of Suspended and Bedded Sediment (SABS) in aquatic systems: A review. United States Environmental Protection Agency. Narrangansett, RI.
Connell, J.H. 1972. Community interactions on marine rocky intertidal shores. Annual Review of Ecology and Systematics 3: 169−192.
Conway, K.W., M. Krautter, J.V. Barrie and M. Neuweiler. 2001. Hexactinellid sponge reefs on the Canadian continental shelf: a unique ‘living fossil’. Geoscience Canada 28(2): 71–78.
DFO (Fisheries and Oceans Canada). 1986. The Department of Fisheries and Oceans Policy for the Management of Fish Habitat. Communications Directorate, Fisheries and Oceans Canada, Fish Habitat Management Branch. Ottawa, ON.
DFO. 2000a. Dungeness Crab Coastal Fisheries License Areas B, E, G, H, I & J. DFO Science Stock Status Report (2000). Fisheries and Oceans Canada, Pacific Region. Vancouver, BC.
DFO. 2000b. Hexactinellid Sponge Reefs on the British Columbia Continental Shelf: Geological and Biological Structure. Habitat Status Report 2000/02. Fisheries and Oceans Canada, Pacific Region. Vancouver, BC.
DFO. 2002. Underwater World – Dungeness Crab. Fisheries and Oceans Canada, Pacific Region. Vancouver, BC.

Sec. 52 Application Volume 6B: Environmental and Socio-Economic Assessment (ESA) – Marine Terminal Section 9: Marine Invertebrates
May 2010 Page 9-39
DFO. 2007a. Discussion Paper: Review and Reform of the Dungeness Crab Fishery. Fisheries and Oceans Canada, Pacific Region. Vancouver, BC.
DFO. 2007b. Pacific Region Integrated Fisheries Management Plan Crab by Trap January 1, 2008 to December 31, 2008. Fisheries and Oceans Canada, Pacific Region. Vancouver, BC.
DFO. 2009. Pacific Region Integrated Fisheries Management Plan, Crab by Trap, January 1, 2009 to December 31, 2009. Fisheries and Oceans Canada, Pacific Region. Vancouver, BC.
Eggleton, J. and K.V. Thomas. 2004. A review of factors affecting the release and bioavailability of contaminants during sediment disturbance events. Environment International 30: 973–980.
Eisler, R. 2000. Handbook of Chemical Risk Assessment: Health Hazards to Humans, Plants, and Animals. Vol. 1-3. CRC Press. Boca Raton, FL.
Geyer, H., P. Sheehan, D. Kotzias, D. Freitag and F. Korte. 1982. Prediction of ecotoxicological behaviour of chemicals: relationship between physico-chemical properties and bioaccumulation of organic chemicals in the mussel Mytilus edulis. Chemosphere 11(11): 1121−1134.
Gosling, E.M. 1992. Systematics and geographic distribution of Mytilus. In E.M. Gosling (ed.). The Mussel Mytilus: Ecology, Physiology, Genetics and Culture. Developments in Aquaculture and Fisheries Science. No. 25: 1–17. Elsevier Science Publications. New York, NY.
Herbich, J.B. and S.B. Brahme. 1991. Literature Review and Technical Evaluation of Sediment Resuspension During Dredging. Contract Report HL-91-1. Prepared for U.S. Army Engineer Waterways Experiment Station. Washington, DC.
Hirsch, N.D., L.H. DiSalvo and R. Peddicord. 1978. Effects of Dredging and Disposal on Aquatic Organisms. Naval Biosciences Laboratory, University of California, Naval Supply Center. Oakland, CA.
Jamieson, G.S. and L. Chew. 2002. Hexactinellid Sponge Reefs: Areas of Interest as Marine Protected Areas in the North and Central Coast Areas. Research Document 2002/122. Canadian Science Advisory Secretariat. Fisheries and Oceans Canada. Nanaimo, BC.
Keevin, T.M. and G.L. Hempen. 1997. The Environmental Effects of Underwater Explosions, with Methods to Mitigate Impacts. US Army Corps of Engineers, St. Louis District. St. Louis, MO.
Lasalle, M.W., D.G. Clark, J. Homziak, J.D. Lunz and T.J. Fredette. 1991. A Framework for Assessing the Need for Seasonal Restrictions on Dredging and Disposal Operations. Technical Report D-91-1. US Army Engineer Waterways Experiment Station. Vicksberg, MS.
Lauenstein, G.G., A. Robertson and T.P. O'Conner. 1990. Comparison of trace metal data in mussels and oysters from a Mussel Watch Programme of the 1970s with those from a 1980s programme. Marine Pollution Bulletin 21: 440−447.
Leys, S.P. and N.R.J. Lauzon. 1998. Hexactinellid sponge ecology: growth rates and seasonality in deep water sponges. Journal of Experimental Marine Biology and Ecology 230: 111–129.
Sec. 52 Application Volume 6B: Environmental and Socio-Economic Assessment (ESA) – Marine Terminal Section 9: Marine Invertebrates
Page 9-40 May 2010
Leys, S.P., K. Wilson, C. Holeton, H.M. Reiswig, W.C. Austin and V. Tunnicliffe. 2004. Patterns of glass sponge (Porifera, Hexactinellida) distribution in coastal waters of British Columbia, Canada. Marine Ecology Progress Series 283: 133–149.
Maurer, D. and R.T. Keck. 1978. Vertical Migration of Marine Benthos in Dredge Material Deposits. Department of Defense, Waterways Experiment Station, US Army Corps of Engineers. Vicksburg, MS.
McConnaughey, R.A. and D.A. Armstrong. 1995. Potential effects of global climate change on Dungeness crab (Cancer magister) populations in the northeastern Pacific Ocean. In R.J. Beamish (ed.). Climate Change and Northern Fish Populations. Canadian Special Publication of Fisheries and Aquatic Sciences 121: 291–306.
McDonald, P.S., G.C. Jensen and D.A. Armstrong. 2001. The competitive and predatory impacts of the nonindigenous crab Carcinus maenas (L.) on early benthic phase Dungeness crab Cancer magister. Journal of Experimental Marine Biology and Ecology 258(1): 39–54.
Miller, B.S., D.J. Pirie and C.J. Redshaw. 2000. An Assessment of the Contamination and Toxicity of Marine Sediments in the Holy Loch, Scotland. Marine Pollution Bulletin 40(1): 22–35.
Moore, P.G. 1978. Inorganic particulate suspensions in the sea and their effects on marine animals. Oceanography and Marine Biology, Annual Review 15: 225−363. Cited in Wilber, D.H. and D.G. Clarke. 2001. Biological effects of suspended sediments: a review of suspended sediment impacts on fish and shellfish with relation to dredging activities in estuaries. North American Journal of Fisheries Management 21(4): 855−875.
Moriyasu, M., R. Allain, K. Benhalima and R. Claytor. 2004. Effects of Seismic and Marine Noise on Invertebrates: A Literature Review. Research Document 2004/126. Canadian Science Advisory Secretariat. Fisheries and Oceans Canada, Pacific Region. Nanaimo, BC.
Newell, R.C., L.J. Seiderer and D.R. Hitchcock. 1998. The impact of dredging works in coastal waters: a review of the sensitivity to disturbance and subsequent recovery of biological resources on the sea bed. Oceanography and Marine Biology 36: 127−172.
Paine, R.T. 1974. Intertidal community structure: experimental studies on the relationship between a dominant competitor and its principal predator. Oecologia 15: 93−120.
Potrykus, J., A. Albalat, J. Pempkowiak and C. Porte. 2003. Content and patterns of organic pollutants (PAHs, PCBs and DDT) in blue mussels (Mytilus trossulus) from the southern Baltic Sea. Oceanologia 45(1): 337−355.
Pruell, R.J., J.L. Lake, W.R. Davis and J.G. Quinn. 1986. Uptake and depuration of organic contaminants by blue mussels (Mytilus edulis) exposed to environmentally contaminated sediment. Marine Biology 91(4): 497–507.
Roesijadi, G., J. Anderson and J. Blaylock. 1978. Uptake of hydrocarbons from marine sediments contaminated with Prudhoe Bay crude oil: influence of feeding type of test species and availability of polycyclic aromatic hydrocarbons. Journal of the Fisheries Research Board of Canada 35: 608−614.

Sec. 52 Application Volume 6B: Environmental and Socio-Economic Assessment (ESA) – Marine Terminal Section 9: Marine Invertebrates
May 2010 Page 9-41
Sushko, H. and K.R. Freeman. 1991. The Use of Laser Diffraction in Measuring the Effect of Suspended Sediment on the Shell Growth of Mussels, Mytilus edulis. Canadian Manuscript Report of Fisheries and Aquatic Sciences 2121. Fisheries and Oceans Canada. Halifax, NS.
Teixidó, N., J.M. Gili, M.J. Uriz, J. Gutt and W.E. Arntz. 2006. Observations of asexual reproductive strategies in Antarctic hexactinellid sponges from ROV video records. Deep Sea Research Part II: Topical Studies in Oceanography 53(8–10): 972–984.
Vale, C., A.M. Ferreira, C. Micaelo, M. Caetano, E. Pereira, M.J. Madureira and E. Ramahosa. 1998. Mobility of contaminants in relation to dredging operations in a mesotidal estuary (Tagus Estuary, Portugal). Water Science and Technology 37(67):25–31.
Wilbur, D.H. and D.G. Clarke. 2001. Biological effects of suspended sediments: a review of suspended sediment impacts on fish and shellfish with relation to dredging activities in estuaries. North American Journal of Fisheries Management 21: 855–875.
Wright, D.G. and G.E. Hopky. 1998. Guidelines for the Use of Explosives in or Near Canadian Fisheries Waters. Canadian Technical Report of Fisheries and Aquatic Sciences 2107. Fisheries and Oceans Canada. Ottawa, ON.
9.11.2 Internet Sites DFO (Fisheries and Oceans Canada). 2008. Management Areas – Pacific Region. Fisheries and Oceans
Canada. Available at: http://www.pac.dfo-mpo.gc.ca/fm-gp/maps-cartes/areas-secteurs/index-eng.htm
Environment Canada. 2005. Dioxin/Furan levels: an indicator of toxic contaminants in coastal B.C. Accessed: September 22, 2008. Available at: http://www.ecoinfo.org/env_ind/region/dioxinfuran/dioxin_e.cfm
Transport Canada. 2000. Guidelines for the Control of Ballast Water Discharge from Ships in Waters Under Canadian Jurisdiction. Accessed: November, 2008. Available at: http://www.shipfed.ca/eng/library/other_subjects/ballats_water/BallastWaterCanadianGuidelines.html


Sec. 52 Application Volume 6B: Environmental and Socio-Economic Assessment (ESA) – Marine Terminal Section 10: Marine Fish
May 2010 Page 10-1
10 Marine Fish Marine fish have ecological, social, cultural and commercial value. Several fish species in Kitimat Arm are important commercially, recreationally and as Aboriginal subsistence resources. Eulachon, Pacific herring, rockfish and chum salmon are included in the assessment. Potential effects of the Project on marine fish include changes in habitat quality, changes in habitat availability and acoustic disturbance. Marine fish are not expected to be adversely affected by increased sedimentation, and re-suspension of contaminants contained in sediments is expected to be limited and potential effects are expected to be limited to within a few hundred metres of the dredging activity around the marine terminal. Acoustic disturbance from dredging, blasting and other project construction activities will be short-term and reversible. Some marine fish may temporarily alter swimming patterns or move from an area to avoid noise sources. For example, rockfish are expected to move out of the area during peak periods of construction noise, but return to home ranges after the disturbance is over. Mitigation will include following work windows developed in consultation with DFO for dredging and blasting, implementing a Blasting Management Plan, using bubble curtains where practical to reduce underwater noise propagation, and managing sedimentation. Effects of the Project are not expected to cause a long-term decline in abundance or change in distribution of marine fish. After mitigation, the residual effects of the Project on marine fish are expected to be not significant. Where adverse effects cannot be avoided or mitigated, a compensation plan will be developed in cooperation with DFO to offset the corresponding loss of habitat productive capacity.
10.1 Setting for Marine Fish Kitimat Arm has several important salmon rivers such as the Kitimat River, and there is a major pink salmon run in Bish Creek, just south of the marine terminal location. Species commonly harvested include chum, coho, chinook and pink salmon, steelhead, eulachon, herring, and halibut. Coves, estuaries and other nearshore habitats offer rearing habitats for juvenile fish and serve as staging areas for adult salmon prior to their upstream spawning migrations in late summer and early fall.
Detailed descriptions of the marine-associated life in the Kitimat area are in the Marine Fish and Fish Habitat Technical Data Report (Beckett and Munro 2010).
10.2 Scope of Assessment for Marine Fish
10.2.1 Key Project Issues for Marine Fish Numerous fish species are present in Kitimat Arm. Marine fish contribute to overall ecosystem health, and provide cultural and economic benefits to the Kitimat region.
Potential project-related environmental effects that are assessed for their effects on marine fish include:
• change in habitat quality – associated with water quality alteration due to sedimentation

Sec. 52 Application Volume 6B: Environmental and Socio-Economic Assessment (ESA) – Marine Terminal Section 10: Marine Fish
Page 10-2 May 2010
• change in habitat availability – associated with physical alterations or losses of fish habitat through various construction activities, such as blasting and dredging, and the introduction of inwater infrastructure
• acoustic disturbance – underwater noises and their potential to disturb or displace marine fish from their habitat
Potential environmental effects on marine fish were determined based on the scope of factors from the Joint Review Panel and input from regulators, the public and participating Aboriginal groups, as well as professional judgement. For a summary of project activities and their potential environmental effect on marine fish, see Table 10-1.
Table 10-1 Potential Environmental Effects on Marine Fish This table identifies the potential environmental effects on marine fish that are assessed in this section of the ESA. Each of these environmental effects is discussed in more detail later in this section. Recommendations for mitigation and, if required, follow-up and monitoring are also provided. With the implementation of these mitigation measures where appropriate, the Project is not likely to cause significant adverse environmental effects on marine fish.
Project Activities and Physical Works
Key Environmental Effects on Marine Fish Relevance to the Assessment
Considered in the ESA Kitimat Terminal (tank terminal and marine terminal)
Construction
• Onshore infrastructure site preparation (clearing, burning, grading, blasting)
• Change in habitat quality Potential for: • direct mortality • physiological stress • physical damage • change to natural movements • induced behavioural changes • mechanical damage to eggs and
larvae • decreased critical spawning or
rearing habitat • creation of new, artificial habitat • decreased concentrations of
dissolved oxygen
• Inwater infrastructure site preparation (dredging, blasting, pile drilling)
• Change in habitat quality • Change in habitat availability • Acoustic disturbance
• Inwater infrastructure construction (marine terminal, berths, pile installation)
• Change in habitat quality • Change in habitat availability • Acoustic disturbance
• Berthed construction support vessels (barges, escort and harbour tugs)
• Acoustic disturbance

Sec. 52 Application Volume 6B: Environmental and Socio-Economic Assessment (ESA) – Marine Terminal Section 10: Marine Fish
May 2010 Page 10-3
Table 10-1 Potential Environmental Effects on Marine Fish (cont’d) Project Activities and
Physical Works Key Environmental Effects on
Marine Fish Relevance to the Assessment Operations
• Inwater infrastructure (marine terminal, berths and associated shading, underwater structures)
• Change in habitat availability Potential for: • physiological stress • physical damage • change to natural movements • induced behavioural changes • mechanical damage to eggs and
larvae • decreased critical spawning or
rearing habitat • creation of new habitat
• Berthed tankers (and associated combustion emissions, inert gas exchange, prop wash, noise, boom deployment)
• Change in habitat quality • Acoustic disturbance
Decommissioning
• Onshore site restoration (infrastructure removal, site rehabilitation and reclamation)
• Change in habitat quality Potential for: • direct mortality • physiological stress • physical damage • change to natural movements • induced behavioural changes • mechanical damage to eggs and
larvae • decreased critical spawning or
rearing habitat • creation of new, artificial habitat • decreased concentrations of
dissolved oxygen
• Inwater infrastructure site restoration (infrastructure removal above the substrate)
• Change in habitat quality • Change in habitat availability • Acoustic disturbance
NOTE: Environmental effects associated with project-related tanker movements are assessed in Volume 8B.
All vessels using the Kitimat Terminal will be required to follow requirements for ballast water management and discharge under the Canada Shipping Act, Canadian Ballast Water Control and Management Regulations (BWCMR), and to implement an International Maritime Organization (IMO) approved Ballast Water Management Plan. Oil tankers will have segregated ballast on board that has been exchanged not less than 200 nautical miles from shore, as described by the Ballast Water Management Procedures under the BWCMR. Oily ballast water will not be discharged at the Kitimat Terminal. Solid waste and liquid waste will be managed according to the Canadian Shipping Act.
The Kitimat Terminal will have oil-water separator facilities on the foreshore to receive, treat and recover oil from the vessel’s cargo slops tanks. The cargo slops can be discharged from the vessel to the terminal’s facility using the same cargo pumps and transfer arms that are used to transfer regular cargo. Although the Kitimat Terminal will not provide on-site facilities to treat or dispose of engine room slops, it will offer a service provided by a third-party contractor, which will use vacuum trucks to receive and transfer the slops to an offsite facility for proper disposal.

Sec. 52 Application Volume 6B: Environmental and Socio-Economic Assessment (ESA) – Marine Terminal Section 10: Marine Fish
Page 10-4 May 2010
Because ballast water will be managed in accordance with these requirements, adverse effects from the bilge and ballast water at the terminal are not anticipated and will not be discussed further in the assessment of marine fish.
10.2.2 Selection of Key Indicators and Measurable Parameters for Marine Fish Four key indicators (KIs) were selected for the assessment:
• eulachon • Pacific herring • rockfish • chum salmon
The criteria and rationale for their selection are described below.
10.2.2.1 Eulachon
Eulachon (Thaleichthys pacificus) is chosen as a KI because it is a culturally and ecologically important species in the region. Numerous marine species depend on eulachon as a food source and the species’ annual migration contributes to overall ecosystem health and productivity (Stoffels 2001). Eulachon is culturally important as a staple food source and historically valuable trade item for many Aboriginal groups along the coast, particularly the Haisla Nation, the Nisga’a Nation and the Tsimshian (Cambria Gordon Ltd. 2006).
The eulachon is blue-listed by the British Columbia Conservation Data Centre, which indicates it is a species of special concern and thus requires special attention so that it does not become threatened (Cambria Gordon Ltd. 2006).
10.2.2.2 Pacific Herring
Pacific herring was selected due to its ecological and commercial importance. Ecologically, they play a central role in the marine food web as prey, contributing to the summer diets of salmon, Pacific cod, ling cod and harbour seals. Also, herring eggs are an important part of the diets of invertebrates, and of migrating seabirds and grey whales. Environment Canada considers Pacific herring to be a regional indicator of marine resource sustainability and general ecosystem productivity and health (Environment Canada 1998, Internet site).
Economically, Pacific herring has been one of the most important components of the British Columbia commercial fisheries over the past century (Schweigert 2005). Although the herring fishery collapsed in the late 1960s because of environmental changes and overfishing (DFO [Fisheries and Oceans Canada] 2008a, 2008b), important fisheries now exist for herring roe, spawn on kelp, and for food and bait. The Pacific herring fishery is highly valued internationally (for traditional food, delicacies, fishing bait, and food for zoos and aquariums), provides employment for coastal communities and contributes notably to Canada’s economy (Environment Canada 1998, Internet site).

Sec. 52 Application Volume 6B: Environmental and Socio-Economic Assessment (ESA) – Marine Terminal Section 10: Marine Fish
May 2010 Page 10-5
10.2.2.3 Rockfish
Rockfish (Sebastes or Sebastolobus sp.), of which there are approximately 35 species in British Columbia, is chosen as a KI because it represents the demersal fish community in the PEAA. Assemblages of rockfish species contribute to the biodiversity of an area and have an important ecological role in marine trophic dynamics as both predator and prey.
Rockfish are generally long-lived, late-maturing species. Individuals typically remain within a defined home range for most of their lives. Life history characteristics often make rockfish vulnerable to activities that alter habitat or disturb ecosystem dynamics. Several rockfish populations in British Columbia have recently declined dramatically. For example, bocaccio (Sebastes paucispinis) numbers declined an estimated 95% from 1980 to 2000 according to the Committee on the Status of Endangered Wildlife in Canada (COSEWIC 2002). It is a threatened species under review for addition to Schedule 1 and protection under the Canadian Species at Risk Act (SARA).
10.2.2.4 Chum Salmon
Pacific salmon (Oncorhynchus sp.) have great economic and cultural importance. They are an integral part of the ecosystem providing a source of food and nutrients for a wide variety of flora and fauna. Chum salmon (O. keta) was selected to represent the salmonid group because it has the broadest distribution of all salmon species and a lifecycle that generally represents other salmonids.
Chum salmon is chosen as a KI over the other salmon species for the following reasons:
• Chum fry migrate immediately to marine waters upon emerging from the gravel spawning beds in the spring and rely on estuarine and nearby marine habitats. As a result, they may be more susceptible to effects of the marine terminal than species with fry that remain in rivers to later life stages.
• Chum salmon are targeted by both commercial and subsistence fisheries in the PEAA.
• Chum salmon is favoured by coastal Aboriginal groups for food, social and ceremonial purposes (DFO 1999). However, its pale flesh and low fat content makes it the least commercially desirable of the salmon species in British Columbia.
In addition to providing economic and social value to fishers, salmon is a key food resource for terrestrial vertebrate predators and scavengers, thereby providing a critical link between terrestrial and aquatic systems (Willson and Halupka 1995).
The following measurable parameters are identified for each of the four KIs for each of the environmental effects:
• Changes in habitat availability are assessed based on changes in the location and amount of suitable habitat for supporting the presence and persistence of local fish populations.
• Changes in habitat quality are assessed using predicted changes in total suspended solids in the water column.
• Acoustic disturbance is assessed by determining the increase in underwater acoustics. Specifically, the measurable parameters used were the location and level of noise expected to be associated with project activities.

Sec. 52 Application Volume 6B: Environmental and Socio-Economic Assessment (ESA) – Marine Terminal Section 10: Marine Fish
Page 10-6 May 2010
10.2.3 Spatial Boundaries for Marine Fish The marine project development area (PDA) is defined as the marine areas that will be directly affected by the construction, operations and decommissioning of the marine terminal.
The project effects assessment area (PEAA) has been defined to include the area around and including the PDA where construction, operations and decommissioning have the potential to affect marine fish populations. As effects from acoustic emissions cover the largest area, the PEAA was based on predicted sound propagation from various activities associated with construction (i.e., clamshell dredging) and operations (i.e., a tanker on standby). The PEAA encompasses marine waters and associated coastline, and covers the area stretching from the head of Kitimat Arm south to a boundary between Emsley Point and Coste Point (see Figure 10-1).
A third area is used in the assessment of marine transportation (Volume 8B) and is referred to as the confined channel assessment area (CCAA). In this section, the regional effects assessment area (REAA) is defined by the boundaries of the CCAA and is therefore referred to as the CCAA throughout (see Section 4.2.2.3 for an explanation of the REAA). The CCAA includes all of the PDA and PEAA, as well as the remaining area of Douglas Channel, Caamaño Sound and Principe Channel (see Volume 8B for more details).
10.2.4 Temporal Boundaries for Marine Fish The assessment’s temporal boundaries consist of all project phases including construction, operations and decommissioning. Adults and juveniles of all four KI species are expected to be in the PDA and PEAA during the Project’s life.
The highest density of eulachon will occur in the PEAA during migration and spawning, which typically occurs in the Douglas Channel and Gardner Canal area in February to March (McCarter and Hay 1999; Hay and Beacham 2005).
Pacific herring reside in the PEAA all year. However, they typically spawn in Kitimat Arm and Douglas Channel from March through April, but as late as July (Schweigert and Haist 2007).
Rockfish reside in the PEAA all year. Bocaccio rockfish (Sebastes paucispinis) juveniles tend to settle into littoral and demersal habitats from late spring through the summer. Young-of-the-year live near the surface for a few months and then settle in nearshore areas (Love et al. 2002).
Two chum salmon runs occur in the PEAA, one in summer and the second in fall. The summer chums migrate in June, July and August, and spawn in September and early October. The fall chum migrate in September, October and November and spawn from October to January (DFO 1999). Chum salmon fry migrate into the marine waters of Kitimat Arm and Douglas Channel in late winter and early spring and aggregate in nearshore waters for weeks to months before travelling toward open habitat.

Kitimat
Minette Bay
KitamaatVillage
KitimatTerminal
K i t i
m a
t A
r m
BishCove
EmsleyCove
EmsleyPoint
CostePoint
CosteIsland
ClioBay
GobeilBay
Kitimat River
CreekBish
100
m
200
m
300 m
100
m
200 m
100 m200 m
100
m
200 m
Pipeline Route
Security Fence
Terrestrial PDA
Marine PDA
Marine PEAA
Bathymetric Contour (100 m)
Railway
Road
SS
Jacques Whitford AXYS Ltd.
FIGURE NUMBER:
PROJECTION:
CONTRACTOR: DATE:
AUTHOR: APPROVED BY:PREPARED FOR:PREPARED BY: SCALE:
ENB R ID GE N OR TH ER N GA TEW A Y PR OJ EC T
NAD 83DATUM:
1:110,000
UTM 9
CMMarine Fish PEAA
10-1
0 1 2 3
Kilometres
Reference: Pipeline Route R
JWA-1048334-1515
REFERENCES: NTDB Topographic Mapsheets provided by the Majesty the Queen in Right of Canada, Department of Natural Resources. All rights reserved.
20090911
R:\2
009F
isca
l\104
8334
_Nor
ther
nGat
eway
_ES
A_2
009

Sec. 52 Application Volume 6B: Environmental and Socio-Economic Assessment (ESA) – Marine Terminal Section 10: Marine Fish
Page 10-8 May 2010
10.2.5 Regulatory Setting or Administrative Boundaries for Marine Fish The DFO regulates activities that may affect fish or fish habitat. Under the Fisheries Act, fish and fish habitat are legally protected. Section 35 of the Act prohibits harmful alteration, disruption or destruction (HADD) of fish habitat, while Section 36 prohibits deposits of any substances considered deleterious to fish. Environment Canada administers Section 36 of the Fisheries Act, while DFO administers Section 35. Fish habitat is also protected by the DFO Policy for the Management of Fish Habitat (DFO 1986). This policy applies to all activities in or near water that threaten the productive capacity of fish habitats. The guiding principle of this policy is to achieve no net loss of the productive capacity of fish habitat and to achieve a net gain in productive capacity of habitat. DFO also administers commercial fishery quotas and closures.
The PEAA falls within DFO Fisheries Management Area (FMA) 6, which includes all of Douglas Channel and extends out to the middle of Hecate Strait between the southern tip of Banks Island to the southern tip of Aristazabal Island.
SARA applies only to marine species within the assessment area that are listed under SARA. There are no SARA listed fish species within the PEAA.
10.2.6 Definition of Environmental Effects Attributes for Marine Fish Environmental effects on marine fish were characterized in terms of direction, magnitude, geographic extent, frequency, duration and reversibility, using the following criteria and definitions.
Direction
• the ultimate long-term trend of the environmental effect (i.e., positive or adverse)
Magnitude
• negligible: no measurable adverse environmental effects are anticipated
• low: affects a specific group of localized individuals within a population but does not affect other trophic levels or the population itself
• moderate: affects a portion of the local population but does not threaten the integrity of that population or any population dependent upon it
• high: affects the local population to the degree which may threaten the integrity of that population or any population dependent upon it
Geographic Extent
• site-specific: within the PDA • local: within the PEAA • regional: extends beyond the PEAA (into the CCAA or beyond)

Sec. 52 Application Volume 6B: Environmental and Socio-Economic Assessment (ESA) – Marine Terminal Section 10: Marine Fish
May 2010 Page 10-9
Frequency
• occurs once • occurs sporadically • occurs regularly • continuous
Duration
• short term: effects noticeable during construction and decommissioning period • medium term: effects noticeable less than two years after construction is complete • long term: effects noticeable more than two years after construction is complete • permanent: effects are permanent
Reversibility
• The likelihood that a KI will recover from an environmental effect (i.e., reversible, irreversible).
10.2.7 Determination of Significance for Marine Fish The environmental effects on marine fish populations were categorized as significant if they are expected to cause a long-term decline in abundance or distribution of the local population or species, beyond which natural recruitment will not return that population or species to its former level within one generation for the affected stock (e.g., the generation time is four years for salmon and two to five years for Pacific herring).
10.3 General Mitigation Measures for Marine Fish The full suite of project design, mitigation and environmental protection measures that will be used during the construction of the Kitimat Terminal is described in the Construction Environmental Protection and Management Plan (EPMP) (see Volume 7A). Following project approval, and before the start of construction, a detailed Construction EPMP will be completed for the construction of the Kitimat Terminal.
Northern Gateway Pipelines Limited Partnership (Northern Gateway) has included a number of project design measures and additional mitigation measures, including environmental protection measures, to limit the effects of the Kitimat Terminal on the marine environment. Mitigation and environmental protection measures to limit effects on marine fish are summarized below.

Sec. 52 Application Volume 6B: Environmental and Socio-Economic Assessment (ESA) – Marine Terminal Section 10: Marine Fish
Page 10-10 May 2010
During construction, operations and decommissioning, mitigation measures will be implemented to reduce the adverse environmental effects of activities, such as blasting, dredging and pile drilling, on marine habitat quality, marine habitat availability and underwater noise. Mitigation will involve the following:
• The Construction EPMP (Volume 7A), which outlines the mitigation measures developed by Northern Gateway to reduce the potential environmental effects of routine construction activities. It also encompasses compliance and effects monitoring programs. Water quality and sediment management measures incorporated in the Construction EPMP include the use of silt curtains, sediment settlement ponds, and managing surface water drainage, as appropriate. These measures are included in the Erosion and Sediment Control Plan (see Volume 7A, Appendix A.3.5) and the Storm Water Management Plan (see Volume 7A, Appendix A.3.4) that are part of the EPMP. These plans will be implemented to manage surface water drainage during construction to reduce sedimentation in nearshore waters.
• A Water Quality and Substrate Composition Monitoring Plan. It includes monitoring of the sediment plume in the marine environment during dredging and blasting.
• Work windows for inwater activities such as dredging and blasting. The timing of work windows and associated measures to protect migration, spawning and egg development of anadromous species, such as eulachon and salmon, will be determined in consultation with DFO.
• Use of a dredging system to limit sediment effects and underwater noise, as appropriate (a clamshell dredge is currently proposed).
• Use of a silt curtain, where practical, during dredging and blasting, to reduce the dispersion and duration of suspended sediments.
• Propellers of all construction and decommissioning support vessels will be well maintained and visually inspected regularly for damage (e.g., bent blades, nicks in the blade). Poorly maintained propellers are known to increase underwater noise. Where feasible, construction and decommissioning support vessels will operate at slow speeds to reduce the intensity of noise.
• Northern Gateway is committed to incorporating best commercially available technology so that escort and harbour tugs produce the least underwater noise possible. Examples of this technology may include use of Voith-Schneider (VS) and modified Azimuth Stern Drive (ASD) propulsion systems.
• The development and implementation of the Blasting Management Plan. Efforts will be made during the blasting design to reduce overpressure.
• Bubble curtains will be used, where practical, to limit underwater noise propagation.

Sec. 52 Application Volume 6B: Environmental and Socio-Economic Assessment (ESA) – Marine Terminal Section 10: Marine Fish
May 2010 Page 10-11
10.4 Assessment Methods for Marine Fish
10.4.1 Data Sources and Fieldwork Nearshore fish surveys were conducted in late summer 2005. Surveys involved beach seine nets, gillnets and longlines to determine presence and relative abundance of fish species in nearshore environments of the PEAA. The survey confirmed the presence of 12 species of benthic and pelagic fish. Underwater surveys using self-contained underwater breathing apparatus (SCUBA) and underwater cameras assessed rockfish presence, abundance and locations of aggregations in the PDA (see the Marine Fish and Fish Habitat TDR).
A thorough literature review and data search was also conducted to determine fish species potential in the PEAA.
The presence of eulachon in the PEAA is documented in government and scientific reports (British Columbia Forest Service 1998; McCarter and Hay 1999; Hay and McCarter 2000; DFO 2001, 2005; Stoffels 2001; Beacham et al. 2005).
The presence of Pacific herring in the PEAA was confirmed through DFO landings statistics and literature review (see the Marine Fisheries Technical Data Report [Triton 2010]). Fish were surveyed in 2005 using beach seine nets, gillnets and longlines. However, no Pacific herring were caught in the PEAA during these surveys.
DFO landings statistics and literature review confirm the presence of chum salmon in the PEAA (see the Marine Fish and Fish Habitat TDR).
10.4.2 Analytical Techniques The 3-D coastal circulation model, COCIRM-SED was used to estimate the concentrations of total suspended solids (TSS) and deposition of sediments in Kitimat Arm as a result of construction dredging (see the Marine Fish and Fish Habitat TDR).
To evaluate levels of noise received by marine fish due to routine marine terminal activities during all phases of the Project (e.g., clamshell dredging and tankers at the marine terminal), sound levels above species-specific hearing thresholds were modelled. The resulting levels above hearing threshold (in units of dB re threshold) were plotted on contour maps. The contours on the maps show predicted sound levels above threshold in 5 dB increments from 5 to 105 dB (re threshold). For a discussion of the methodology, source levels and environmental parameters used for computing received sound pressure levels, see Marine Acoustics (2006) Technical Data Report (JASCO 2006). This modelling was completed in 2006 but since then the marine terminal location has changed, resulting in the location of the sound source being displaced from the current location of the berths by 500 m. This discrepancy does not change the results of the assessment.

Sec. 52 Application Volume 6B: Environmental and Socio-Economic Assessment (ESA) – Marine Terminal Section 10: Marine Fish
Page 10-12 May 2010
10.5 Ecology and Habitat Requirements for Marine Fish Baseline information is required to support the assessment of each of the environmental effects of the Project on marine fish. The baseline status of each of the four KIs is presented here. This is followed by the detailed assessment of the effects of the Project on marine fish associated with changes in habitat quality, changes in habitat availability and acoustic disturbance.
10.5.1 Eulachon
10.5.1.1 Status
Eulachon is not a listed species under SARA, but because of coastal declines in eulachon populations, researchers have requested that COSEWIC list the eulachon as a threatened species (Cambria Gordon Ltd. 2006). In British Columbia, the Conservation Data Centre has rated the eulachon as blue listed, which classifies it as a species of concern.
Eulachon have characteristics that make them vulnerable to human or natural disturbance (Vennesland et al. 2002), and the species is of concern because of localized rarity and recent sporadic spawning failures throughout British Columbia (British Columbia Conservation Data Centre 2008, Internet site).
10.5.1.2 Seasonal Distribution, Population Trends and Habitat Requirements
The eulachon is an anadromous fish that was historically abundant in Douglas Channel and provided a source of food for local Aboriginal communities until the mid-1980s, when stocks began declining. Eulachon runs have always been somewhat unpredictable, but recent declines have been more widespread and sustained, indicating a potential overall decline throughout the geographic range (Stoffels 2001).
The eulachon generally reaches maturity at the end of its third year and migrates into the lower reaches of rivers and channels to spawn in early spring (Hay and McCarter 2000). Spawning in streams and rivers around Douglas Channel and Gardner Canal generally occurs at night during February and March, before the spring freshets (British Columbia Forest Service 1998).
Although the eulachon is a pelagic fish that occurs throughout coastal waters for most of its life, freshwater streams and rivers provide important spawning habitat in the early spring of each year. Suitable spawning habitat requirements include:
• spring runoff from large snowpacks or glaciers into rivers (Hay and McCarter 2000; Beacham et al. 2005)
• clean water and sandy or gravel substrate (Stoffels 2001)
Of the 30 to 40 eulachon spawning rivers known in British Columbia, only half support regular spawning events (Hay and McCarter 2000). Spawning locations vary from year to year, but various locations in the Kitimat area are known to be eulachon runs. The Kildala River, the Kitimat River and possibly other small channels off Gardner Canal (e.g., Kemano, Kowesas and Kitlope Rivers) support consistent eulachon spawning (Hay and McCarter 2000). Gilttoyees Inlet and Foch Lagoon are also used occasionally (Hay and McCarter 2000). Adult eulachon have been confirmed in Bish Creek, indicating occasional spawning activity in the area (British Columbia Forest Service 1998).

Sec. 52 Application Volume 6B: Environmental and Socio-Economic Assessment (ESA) – Marine Terminal Section 10: Marine Fish
May 2010 Page 10-13
Adults likely spend most of their at-sea life in Hecate Strait and Queen Charlotte Sound (British Columbia Forest Service 1998; Hay and McCarter 2000).
Estimates of eulachon biomass are based on larval surveys and the offshore eulachon index in Queen Charlotte Sound (McCarter and Hay 1999; DFO 2005). In the 1990s, the population decline of eulachon across most of British Columbia was followed by non-existent runs in Douglas Channel from 1998 to 2000 (Hay and McCarter 2000). The 2006 eulachon run in the Kitimat River was the lowest recorded, and virtually non-existent, with fewer than 1,000 spawners estimated (EcoMetrix Inc. 2006).
In British Columbia, no commercial fishery for eulachon exists outside the Fraser and Columbia Rivers. Harvesting activity in the Kitimat area is limited to local Aboriginal communities. Based on recent estimates, eulachon populations have been fluctuating over the past decade, but because of a lack of long-term data and unpredictable spawning returns, future population trends cannot be adequately assessed.
10.5.1.3 Limiting Factors
Reasons for the eulachon decline are not fully understood and speculative because of a lack of data and research. Possible explanations for these declines include (Hay and McCarter 2000; Stoffels 2001):
• directed fisheries • bycatch in shrimp trawling operations • changes in ocean climate • physical alteration of spawning habitat leading to hydrological changes • debris and associated non-oxygenated water from log handling and booming • chemical contaminants
10.5.2 Pacific Herring
10.5.2.1 Status
For management purposes, herring in British Columbia have been divided into five major migratory stocks, and several minor stocks that spawn outside the five main stock-assessment areas. The Central Coast herring stock is one of the five major migratory stocks. According to Schweigert and Haist (2007), the abundance of Central Coast herring has increased because of the strong recruitment of several year classes, with the most recent one being the 2002 class that recruited in 2005. Although the stock is expected to remain healthy in the foreseeable future, the appearance of strong year-classes is intermittent and recruitment is variable. For example, the 2003 year class was poor, making up only 10% of the run in 2006 (Schweigert and Haist 2007).
10.5.2.2 Seasonal Distribution, Population Trends and Habitat Requirements
The Pacific herring is a schooling pelagic species that inhabits nearshore and continental shelf environments on both sides of the North Pacific. In the eastern Pacific, herring ranges from California to the Beaufort Sea (DFO 2008a). The largest populations of Pacific herring in North America occur in British Columbia and Alaska (Connor et al. 2005).

Sec. 52 Application Volume 6B: Environmental and Socio-Economic Assessment (ESA) – Marine Terminal Section 10: Marine Fish
Page 10-14 May 2010
In general, the Pacific herring in Kitimat Arm are from a small and slow-growing resident population that tends not to emigrate from the area; however, they may undertake a post-spawning migration to the mouth of Kitimat estuary (Triton 1993).
Spawning locations in the CCAA vary from year to year (Hay et al. 2001). Spawning sites include:
• Kitimat Arm • the southwest side of Hawkesbury Island • Hartley Bay, where high concentrations of Pacific herring gather in the spring to spawn
Spawning occurs locally along the foreshore between Kitamaat Village and Minette Bay, in Clio Bay, Kildala Arm and on Coste Island. In the Kitimat fjord complex, spawning beds are on:
• both sides of Douglas Channel • the west side of Ursula Channel • the south side of Coste Island
Adult Pacific herring are also in Kitkatla Inlet, just north of Browning Entrance, and in Kitasu and Weeteean Bay south of Caamaño Sound (see the Marine Fish and Fish Habitat TDR). The average spawning period is four days, and occurs during March through April (Hay et al. 1989). In the PEAA, juvenile Pacific herring are generally reared in the upper end of Kitimat Arm, including Minette Bay.
Herring are deposit spawners, and their sticky eggs coat spawning substrates (Connor et al. 2005). Therefore, spawning habitat requirements for Pacific herring include intertidal and subtidal vegetation, such as filamentous and branching red algae, sea grasses, rockweed, kelp and other brown algae.
10.5.2.3 Limiting Factors
Pacific herring are strongly affected by annual variation in environmental conditions, as well as longer-term trends such as climate change (Zebdu and Collie 1995), which can produce large fluctuations in recruitment and subsequent stock abundance (DFO 2001).
10.5.3 Rockfish
10.5.3.1 Status
There are conservation issues for inshore rockfish throughout all British Columbia coastal areas, particularly in the waters of Georgia, Juan de Fuca and Johnstone Straits (DFO 2002). According to Love et al. (2002), population biomass and size composition have decreased for many rockfish populations.
Rockfish stocks in Douglas Channel are considered fairly stable (Reagan 2006, pers. comm.) except possibly for the bocaccio, whose biomass on the Pacific Coast has fallen to between 1.8% and 2.3% of its 1969 level (Love et al. 2002). The bocaccio is currently under review, to be designated as threatened under Schedule 1 of the Canadian Species at Risk Act (SARA), because of:
• poor recruitment and the effect of harvesting, leading to major declines and low spawning abundance • a lack of biological information specific to the Canadian population

Sec. 52 Application Volume 6B: Environmental and Socio-Economic Assessment (ESA) – Marine Terminal Section 10: Marine Fish
May 2010 Page 10-15
COSEWIC has designated canary rockfish (S. pinniger) as threatened, and the rougheye rockfish (S. aleutianus) as of special concern. Juveniles of these species may use habitat in the PEAA.
10.5.3.2 Seasonal Distribution, Population Trends and Habitat Requirements
The rockfish most likely to occur in the PEAA are species collectively referred to as the inshore rockfish assemblage, which includes:
• copper rockfish (Sebastes caurinus) • quillback rockfish (Carpiodes cyprinus) • china rockfish (Sebastes nebulosus) • tiger rockfish (Sebastes nigrocinctus) • yelloweye rockfish (Sebastes ruberrimu)
The assemblage may also include juvenile bocaccio (Love et al. 2002).
Little is known about the specific habitat requirements of most rockfish. However, they tend to inhabit areas with various amounts of hard, complex substrates (e.g., rock ledges, caves, crevices, boulders, cobble fields, pebbles and shell debris) and other vertical structures (e.g., kelp forests) (Love et al. 2002). Most rockfish settle out of plankton in comparatively shallow water, and move into deeper water as they grow and mature (Love et al. 2002).
Piled structures in the water can provide habitat for a diverse range of rockfish species (Love and York 2005; Love et al. 2007). Pilings provide vertical structure for the colonization of invertebrates and attachment sites for kelp, which supply habitat for rockfish.
Rockfish species appear to have highly variable home ranges, depending on the quality of available habitat. Individuals that live on optimal habitat rarely move far from their home reefs, or at least stay within a restricted geographic area (Love et al. 2002).
As bathymetry and substrate indicate suitable rockfish habitat in the PDA and PEAA, numerous inshore rockfish species are likely present. Subtidal surveys show that yelloweye, quillback and copper rockfish were present in low abundance throughout the PDA with the highest density at the southern end of the marine terminal (see the Marine Fish and Fish Habitat TDR). Recreational catch statistics record bocaccio caught in DFO Fisheries Management Area 6 (see Figure 10-2), but not within sub-area 6-1, which encompasses the PEAA. However, the near shore area of the PEAA likely provides suitable habitat for juvenile bocaccio.
10.5.3.3 Limiting Factors
Bocaccio stocks in Canada have declined 90% in the past decade (Stanley et al. 2004). Reasons for the decline are mostly unknown, but life history traits (e.g., long-lived, late-maturing, sedentary, slow-growing) make this species vulnerable to localized depletion from overharvesting and by catch mortality (Yamanaka and Lacko 2001). Incidental bycatch is a common threat to several rockfish species.

Sec. 52 Application Volume 6B: Environmental and Socio-Economic Assessment (ESA) – Marine Terminal Section 10: Marine Fish
Page 10-16 May 2010
10.5.4 Chum Salmon
10.5.4.1 Status
DFO’s 2007 Salmon Stock Outlook (DFO 2009, Internet site) reported a long-term, widespread decline among small and medium chum salmon stocks in Fisheries Management Areas 5 and 6. Brood-year escapements have been strong (DFO 2009, Internet site). The 2008 to 2009 season returns of chum salmon are expected to be very poor with the exception of returns to the Kitimat Hatchery. The hatchery-enhanced runs into the Kitimat area are forecast to have a surplus of 100,000 to 200,000 chum (DFO 2008c). Returns to the Kitimat hatchery have been variable and forecasts unreliable (DFO 2008c).
10.5.4.2 Seasonal Distribution, Population Trends and Habitat Requirements
Chum salmon has the broadest distribution of all salmon species, ranging from northern California to Alaska, as well as the Yukon and Mackenzie Rivers in the Arctic (DFO 1999). In British Columbia, chum spawn in more than 880 streams and coastal rivers, and are usually the last of the Pacific salmon to enter fresh water, generally spawning in winter (see the Marine Fish and Fish Habitat TDR).
Adults move each year into the PEAA to spawn in the Kitimat River. Spawning grounds for chum are generally restricted to the lower tributaries along the coast, and chum are rarely found more than 160 km inland (Hart 1973).The peak time for returning chum is July to August, and a second wave occurs in September and October (DFO 2008b). In late winter and early spring, the fry hatch and immediately migrate to the marine waters of Kitimat Arm and Douglas Channel, where they tend to aggregate close to shore in discrete schools. A hatchery based on the Kitimat River raises and releases five different salmonid species, including chum. The hatchery releases about six million juvenile chum annually and, to protect wild stocks, fisheries in Douglas Channel are directed to take hatchery stock (DFO 2006, Internet site).
DFO landings statistics show that chum salmon are the most abundant of the salmon species fished in the PEAA. In 2003, about 2.3 million kilograms of chum were landed from FMA 6, which encompasses the PEAA. About 95% of salmon landings in the PEAA from 1999 to 2004 were chum salmon (see the Marine Fish and Fish Habitat TDR).

Skeena
Exstew
Terrace
Lakelse Lake
Kitimat
KitamaatVillageKitimat
Terminal
Loretta Is.
HawkesburyIsland
Princess RoyalIsland
Hartley Bay
PittIsland
PorcherIsland
StephensIsland
McCauleyIsland
BanksIsland
TrutchIsland
DewdneyIs.
Campania Is.
GilIsland
FinIs.
AristazabalIsland
PriceIsland
SwindleIsland
RoderickIsland
SusanIsland
DowagerIsland
Sara
h Is
.
GoschenIsland
GurdIs.
DolphinIs. Spicer
Is.
KennedyIsland
SmithIsland
PrescottIs.
MelvilleIsland
DigbyIs.
Prince Rupert
Kitkatla
Klemtu
FarrantIs.
GribbellIsland
Maitland Is.
RennisonIs.
Beauchemin Channel
LaredoSound
Laredo Channel
Estevan Sound
Squally Channel
CampaniaSound
CaamañoSound
NepeanSound
Otter Channel
WrightSound
Whale Channel
Lared
o Inle
t
Finlay
son C
hann
el
Doug
las C
hann
el
Verney
Passage
Kitim
at Ar
m
Principe Channel
ChathamSound
Skeena River
Grenville Channel
BrowningEntrance
Ogden C
hannel
Kitkatla Channel
BonillaIs.
HecateStrait
Gardner Canal
TripleIslands
6-1
6-9
6-4
6-2
6-5
6-3
6-20
6-10
6-13
6-6
6-16
6-19
6-12
6-7
6-17
6-14
6-25
6-28
6-11
6-8
6-18
6-15
6-236-26
6-21
6-22
6-27
6-24
5-17
5-11
5-20
5-22
5-235-10
5-13
5-16
5-2
5-14
5-24
5-9
5-1
5-3
5-4
5-21
5-19
5-15
5-12
5-5
5-18
5-8
5-7 5-6
Pipeline Route
Terrestrial PDA
Fisheries Management Area 5
Fisheries Management Area 6
Fisheries Management Subarea
Railway
Road
River / Stream
NP
Jacques Whitford AXYS Ltd.
FIGURE NUMBER:
PROJECTION:
CONTRACTOR: DATE:
AUTHOR: APPROVED BY:PREPARED FOR:PREPARED BY: SCALE:
DFO Fisheries Management Areas 5 and 6and Subareas
ENB R ID GE N OR TH ER N GA TEW A Y PR OJ EC T
R:\2
009F
isca
l\104
8334
_Nor
ther
nGat
eway
_ES
A_2
009
10-2
NAD 83DATUM:
1:1,100,000
UTM 9
CM
5-x6-x
20090911
0 10 20 30
Kilometres
Reference: Pipeline Route R
JWA-1048334-1516
REFERENCES: NTDB Topographic Mapsheets provided by the Majesty the Queen in Right of Canada, Department of Natural Resources. All rights reserved.

Sec. 52 Application Volume 6B: Environmental and Socio-Economic Assessment (ESA) – Marine Terminal Section 10: Marine Fish
Page 10-18 May 2010
10.5.4.3 Limiting Factors
Chum fry rely on estuarine and marine habitats as they migrate immediately to marine waters upon emerging from the gravel spawning beds in the spring (DFO 1999).
10.6 Effects on Marine Fish – Habitat Quality
10.6.1 Baseline Conditions ASL Environmental Sciences Ltd. was contracted to use a 3-D coastal circulation and sediment model (COCIRM-SED) to estimate the TSS levels and deposition of sediments in Kitimat Arm that would result from dredging operations at the marine terminal. The modelling results were used to assess any difference from suspended solids and sedimentation baseline conditions.
Sediment influx in the PEAA is largely controlled by natural outflow from the Kitimat River. However, storm events, tides and currents can also create periods of suspended solids. Levels of total suspended solids (TSS) fluctuate seasonally and in response to climatic variations, but are generally highest during June and July (Fissel et al. 2006). Also, commercial and recreational vessels currently operating in the PEAA may increase TSS through sediment disruption. Consequently, marine fish in the PEAA are routinely exposed to moderate background levels of suspended solids, ranging from less than 0.25 mg/L to 2.7 mg/L (Fissel et al. 2006).
10.6.2 Effects on Marine Fish – Habitat Quality
10.6.2.1 Effect Mechanisms
Construction
Various inwater site preparation and construction activities, such as blasting and dredging for the installation of the berthing structures, will result in temporary increases in sediment suspension in the PDA (see Table 10-2). Project construction activities are expected to take place over a four year period.
Table 10-2 Potential Environmental Effects of Total Suspended Solids on Marine Fish
Type of Effect Potential Environmental Effect Behavioural • Avoidance (holding or migration changes)
• Attraction (TSS as cover; reduced predation risk) • Reduced feeding success (reduction in visibility) • Increased feeding success (reduction in ability of prey to sense predators) • Increased coughing or gill flaring
Physical • Endocrine stress (elevated plasma cortisol, glucose and hematocrit levels) • Tissue damage (abrasion and clogging of gills) • Reduced growth • Mortality

Sec. 52 Application Volume 6B: Environmental and Socio-Economic Assessment (ESA) – Marine Terminal Section 10: Marine Fish
May 2010 Page 10-19
Table 10-2 Potential Environmental Effects of Total Suspended Solids on Marine Fish (cont’d)
Type of Effect Potential Environmental Effect Habitat • Increased sedimentation
• Decreased dissolved oxygen concentrations • High biological oxygen demand (BOD) • Decreased residual pool volumes • Degraded spawning and rearing habitat • Smothered incubating embryos and larval fish
SOURCE: Based on CH2M Hill 2000, Internet site.
Operations
Routine operations may affect water quality through:
• runoff from terrestrial activities • alterations of sediment transport because of physical infrastructure in the water
Surface water runoff from the area outside the tank and manifold areas will be controlled so that this water is released outside the boomed zone of the berthing facilities, to the extent practical. Also, freshwater inputs are very common and abundant in the north coast fjord system. Therefore, runoff is not expected to have a measurable effect on TSS in the PEAA.
Inwater infrastructure may result in localized changes to site-specific current circulation and sediment transport regimes. These changes may result in site-specific smothering of habitat from accumulated sediments. However, no major effects on marine fish are expected, because:
• modelling predicts highly localized sedimentation • none of the selected KIs spawn in the PDA • extensive similar habitats exist in the PEAA
Decommissioning
For the ESA, and unless government or local authorities decide to retain the facilities, it is assumed that all Kitimat Terminal facilities will be removed to the top of the substrate (e.g., rock, sand, mud, and the like) and reclaimed according to the regulations and standards at the time of decommissioning. Minor increases of TSS or degradation in water quality are expected during decommissioning of marine infrastructure. Small-scale changes of sediment deposition in the PDA may occur from removing marine infrastructure. Minor sedimentation may result from small amounts of runoff caused by removing onshore facilities. This level of sedimentation will not likely have an environmental effect on adult or larval fish populations.

Sec. 52 Application Volume 6B: Environmental and Socio-Economic Assessment (ESA) – Marine Terminal Section 10: Marine Fish
Page 10-20 May 2010
10.6.2.2 Mitigation and Effects Management
During construction, operations and decommissioning, mitigation measures will be implemented to reduce the adverse environmental effects of activities, such as blasting, dredging and pile drilling, on marine habitat quality. Mitigation will involve the following:
• The Construction EPMP (Volume 7A), which outlines the mitigation measures developed by Northern Gateway to reduce the potential environmental effects of routine construction activities. It also encompasses compliance and effects monitoring programs. Sediment management measures incorporated in the Construction EPMP include the use of silt curtains, sediment settlement ponds, and managing surface water drainage, as appropriate. These measures are included in the Erosion and Sediment Control Plan (see Volume 7A, Appendix A.3.5) and the Storm Water Management Plan (see Volume 7A, Appendix A.3.4) that are part of the EPMP. These plans will be implemented to manage surface water drainage during construction to reduce sedimentation in nearshore waters.
• A Water Quality and Substrate Composition Monitoring Plan has been developed. It includes monitoring of the sediment plume in the marine environment during dredging and blasting.
• Work windows for inwater activities such as dredging and blasting. The timing of work windows and associated measures to protect migration, spawning and egg development of anadromous species, such as eulachon and salmon, will be determined in consultation with DFO.
• Use of a dredging system to limit sediment effects, as appropriate (a clamshell dredge is currently proposed).
• Use of a silt curtain, where practical, during dredging and blasting, to reduce the dispersion and duration of suspended sediments.
10.6.2.3 Residual Effects
The ability to cope with increased levels of TSS varies considerably among fish species (Newcombe and Jensen 1996). Kitimat Arm is routinely subjected to freshwater discharge from the Kitimat River and smaller rivers and streams in Douglas Channel, as well as spring freshets. Sediment modelling predicts that the plume from dredging will extend northward. However, as the expected levels of TSS will be lower than the thresholds known to elicit physiological and behavioural responses in fish, dredging operations are unlikely to affect spawning or migrating marine fish adversely.
Consequently, tolerance to periods of high sediment loads is a trait essential for fish to survive in these naturally fluctuating environments. Therefore, exposure to a localized sediment plume of approximately eight to nine weeks is not expected to hinder the access of marine fish to upper Kitimat Arm and, for anadromous fish such as eulachon and salmon, its associated rivers.
Construction
Suspended solids will resettle on the seabed after disturbance. The rate and location of deposition depends on grain size and water currents. Coarse sediment particles settle within minutes of discharge, whereas finer material (silt and mud) can continue to drift in the water column for up to five days (MacDonald

Sec. 52 Application Volume 6B: Environmental and Socio-Economic Assessment (ESA) – Marine Terminal Section 10: Marine Fish
May 2010 Page 10-21
1983). Naturally occurring TSS values in the surface layer in the PEAA range from 2 to 3 mg/L in calm conditions to 20 mg/L or more during river freshet periods (June to July) levels (Fissel et al. 2006).
Examples, modelled using the 3-D coastal circulation model COCIRM-SED (see the Marine Fish and Fish Habitat TDR), show that after 80 hours the TSS values are predicted to be less than 0.5 mg/L, except for the immediate vicinity of the active dredge location, where levels would rise to 2.7 mg/L (see Figure 10-3). Low concentrations (0.05 to 0.1 mg/L) in surface waters are also predicted to be present in a narrow band, 3 to 4 km long and 200 to 300 m wide, around Emsley Cove.
At intermediate water depths between 10 to 13 m and 16 to 20 m, the dredging sediment plume may extend to the northwest and exceed naturally occurring levels over an area larger than that at the surface. However, the plume is expected to remain within 200 m of the dredging activity (see Figure 10-4 and Figure 10-5). TSS concentrations are expected to be low (0.5 to 1 mg/L) and thus unlikely to be detectable from natural ambient levels. At deeper depths of 50 to 70 m and 140 to 180 m, the TSS values are less than 0.25 mg/L and spatial distribution of the sediment plume is limited (see Figure 10-6 and Figure 10-7).
Given the industrial history of upper Kitimat Arm, concentrations of contaminants such as metals, PAHs and dioxins are in elevated concentrations in sediments near the marine terminal. Although most of these contaminants are likely to be organic compounds insoluble in seawater (and therefore of limited bioavailability), a risk of bioaccumulation exists when suspended particles are ingested. The potential exists for marine fish to be affected by the re-suspension of contaminants from sediments in the area of underwater construction activities. However, these environmental effects are expected to be limited to within a few hundred metres of the marine PDA. Results from the February 2006 sediment sampling program are described in greater detail in Section 7.
On-land construction activities could add to the sediment load in the marine water column, as a result of increased erosion and volume from sediment-laden runoff into the nearshore environment. The onshore Erosion and Sediment Control Plan, that includes use of appropriate erosion and runoff controls, will be used to limit sediment input. Mitigation efforts, along with the steep incline and depth of the nearshore habitat, and regular tidal flushing, will help disperse any sediment input quickly. Therefore, sediment plumes from land are expected to be minimal, restricted to a limited area surrounding the PDA and not expected to have a measurable environmental effect on TSS in the PEAA.
In summary, construction activities will result in elevated TSS levels within a limited area surrounding the PDA. Most of the sediment plume created by construction activities is expected to be minor in relation to natural background levels.

200 m
100
m
100 m
200 m
100
m
300 m
200
m
100
m
Kitimat
Minette Bay
KitamaatVillage
KitimatTerminal
K i t i
m a
t A
r m
BishCove
EmsleyCove
EmsleyPoint
CostePoint
CosteIsland
ClioBay
GobeilBay
Kitimat River
CreekBish
200 m
100
m
SS
Jacques Whitford AXYS Ltd.
FIGURE NUMBER:
PROJECTION:
CONTRACTOR: DATE:
AUTHOR: APPROVED BY:PREPARED FOR:PREPARED BY: SCALE:
Modelling Results for Increase in Total Suspended Solids: 80 hours after Dredging is Completed at 0 to 2 m Depth
ENB R ID GE N OR TH ER N GA TEW A Y PR OJ EC T 10-3
NAD 83DATUM:
1:110,000
UTM 9
CM
Inset1:50,000
0 1 2 3
Kilometres
Reference: Pipeline Route R
JWA-1048334-1517
REFERENCES: NTDB Topographic Mapsheets provided by the Majesty the Queen in Right of Canada, Department of Natural Resources. All rights reserved.
Total Suspended Solids(mg/L) Above Baseline
25
10
5
2.5
1
0.5
0.25
0.1
0.05
0
20090911
R:\2
009F
isca
l\104
8334
_Nor
ther
nGat
eway
_ES
A_2
009
KitimatTerminal
Railway
Road
Bathymetric Contour (100 m)
Pipeline Route
Terrestrial PDA
Marine PDA
Security Fence

200 m
100
m
100 m
200 m
100
m
300 m
200
m
100
m
Kitimat
Minette Bay
KitamaatVillage
KitimatTerminal
K i t i
m a
t A
r m
BishCove
EmsleyCove
EmsleyPoint
CostePoint
CosteIsland
ClioBay
GobeilBay
Kitimat River
CreekBish
200 m
SS
Jacques Whitford AXYS Ltd.
FIGURE NUMBER:
PROJECTION:
CONTRACTOR: DATE:
AUTHOR: APPROVED BY:PREPARED FOR:PREPARED BY: SCALE:
ENB R ID GE N OR TH ER N GA TEW A Y PR OJ EC T 10-4
NAD 83DATUM:
1:110,000
UTM 9
CMModelling Results for Increase in Total Suspended Solids: 80 hours after Dredging is Completed at 10 to 13 m Depth
Inset1:50,000
0 1 2 3
Kilometres
Reference: Pipeline Route R
JWA-1048334-1518
REFERENCES: NTDB Topographic Mapsheets provided by the Majesty the Queen in Right of Canada, Department of Natural Resources. All rights reserved.
Total Suspended Solids(mg/L) Above Baseline
25
10
5
2.5
1
0.5
0.25
0.1
0.05
0
20090911
R:\2
009F
isca
l\104
8334
_Nor
ther
nGat
eway
_ES
A_2
009
KitimatTerminal
Railway
Road
Bathymetric Contour (100 m)
Pipeline Route
Terrestrial PDA
Marine PDA
Security Fence

200 m
100
m
100 m
200 m
100
m
300 m
200
m
100
m
Kitimat
Minette Bay
KitamaatVillage
KitimatTerminal
K i t i
m a
t A
r m
BishCove
EmsleyCove
EmsleyPoint
CostePoint
CosteIsland
ClioBay
GobeilBay
Kitimat River
CreekBish
200 m
100
m
SS
Jacques Whitford AXYS Ltd.
FIGURE NUMBER:
PROJECTION:
CONTRACTOR: DATE:
AUTHOR: APPROVED BY:PREPARED FOR:PREPARED BY: SCALE:
ENB R ID GE N OR TH ER N GA TEW A Y PR OJ EC T 10-5
NAD 83DATUM:
1:110,000
UTM 9
CMModelling Results for Increase in Total Suspended Solids: 80 hours after Dredging is Completed at 16 to 20 m Depth
Inset1:50,000
0 1 2 3
Kilometres
Reference: Pipeline Route R
JWA-1048334-1519
REFERENCES: NTDB Topographic Mapsheets provided by the Majesty the Queen in Right of Canada, Department of Natural Resources. All rights reserved.
Total Suspended Solids(mg/L) Above Baseline
25
10
5
2.5
1
0.5
0.25
0.1
0.05
0
20090911
R:\2
009F
isca
l\104
8334
_Nor
ther
nGat
eway
_ES
A_2
009
KitimatTerminal
Railway
Road
Bathymetric Contour (100 m)
Pipeline Route
Security Fence
Terrestrial PDA
Marine PDA

200 m
100
m
100 m
200 m
100
m
300 m
200
m
100
m
Kitimat
Minette Bay
KitamaatVillage
KitimatTerminal
K i t i
m a
t A
r m
BishCove
EmsleyCove
EmsleyPoint
CostePoint
CosteIsland
ClioBay
GobeilBay
Kitimat River
CreekBish
200 m
100
m
SS
Jacques Whitford AXYS Ltd.
FIGURE NUMBER:
PROJECTION:
CONTRACTOR: DATE:
AUTHOR: APPROVED BY:PREPARED FOR:PREPARED BY: SCALE:
ENB R ID GE N OR TH ER N GA TEW A Y PR OJ EC T 10-6
NAD 83DATUM:
1:110,000
UTM 9
CMModelling Results for Increase in Total Suspended Solids: 80 hours after Dredging is Completed at 50 to 70 m Depth
Inset1:50,000
0 1 2 3
Kilometres
Reference: Pipeline Route R
JWA-1048334-1520
REFERENCES: NTDB Topographic Mapsheets provided by the Majesty the Queen in Right of Canada, Department of Natural Resources. All rights reserved.
Total Suspended Solids(mg/L) Above Baseline
25
10
5
2.5
1
0.5
0.25
0.1
0.05
0R
:\200
9Fis
cal\1
0483
34_N
orth
ernG
atew
ay_E
SA
_200
9
20090911
KitimatTerminal
Railway
Road
Bathymetric Contour (100 m)
Pipeline Route
Security Fence
Terrestrial PDA
Marine PDA

200 m
100
m
100 m
200 m
100
m
300 m
200
m
100
m
Kitimat
Minette Bay
KitamaatVillage
KitimatTerminal
K i t i
m a
t A
r m
BishCove
EmsleyCove
EmsleyPoint
CostePoint
CosteIsland
ClioBay
GobeilBay
Kitimat River
CreekBish
200 m
100
m
SS
Jacques Whitford AXYS Ltd.
FIGURE NUMBER:
PROJECTION:
CONTRACTOR: DATE:
AUTHOR: APPROVED BY:PREPARED FOR:PREPARED BY: SCALE:
ENB R ID GE N OR TH ER N GA TEW A Y PR OJ EC T 10-7
NAD 83DATUM:
1:110,000
UTM 9
CMModelling Results for Increase in Total Suspended Solids: 80 hours after Dredging is Completed at 140 to 180 m Depth
Inset1:50,000
0 1 2 3
Kilometres
Reference: Pipeline Route R
JWA-1048334-1521
REFERENCES: NTDB Topographic Mapsheets provided by the Majesty the Queen in Right of Canada, Department of Natural Resources. All rights reserved.
Total Suspended Solids(mg/L) Above Baseline
25
10
5
2.5
1
0.5
0.25
0.1
0.05
0
R:\2
009F
isca
l\104
8334
_Nor
ther
nGat
eway
_ES
A_2
009
20090911
KitimatTerminal
Railway
Road
Bathymetric Contour (100 m)
Pipeline Route
Security Fence
Terrestrial PDA
Marine PDA

Sec. 52 Application Volume 6B: Environmental and Socio-Economic Assessment (ESA) – Marine Terminal Section 10: Marine Fish
May 2010 Page 10-27
Overview of Effects of TSS on Maine Fish
The following discussion includes an initial discussion of the effects of TSS on marine fish. This is followed by a discussion of the residual effects of the Project on eulachon, Pacific herring, rockfish and chum salmon.
Eggs and larvae are generally more sensitive to TSS than adults of the same species (Appleby and Scarratt 1989). Suspended solids concentrations in the water column affect larvae and adult herring in various ways (Boehlert and Morgan 1985). Suspended solids concentrations of 16 mg/L resulted in herring larvae changing their depth preference and adult herring reducing their feeding rate at concentrations of 20 mg/L (Johnson and Wildish 1982). Mechanical damage to herring larvae was observed at suspended solid concentrations of 1,000 mg/L (Boehlert and Yoklavich 1984).
Indirect effects of water quality on fish through alterations of food webs may also occur. Increased suspended solids in the water column temporarily reduce the depth of the euphotic zone for phytoplankton. This localized change in plankton distribution can disrupt zooplankton distribution and alter the diet selection and normal feeding patterns of fish that feed on them. For example, copepods, an important prey, show negative effects and reduced numbers when there are moderate loadings of suspended solids (Robinson and Cuthbert 1996).
Sub lethal effects in several fish species have been reported after several days of exposure to suspended solids concentrations of about 650 mg/L or greater (Appleby and Scarratt 1989). Suspended solids can cause respiratory and feeding problems for finfish species in the area, or the fish may simply avoid the area of construction activity (Robinson and Cuthbert 1996). Ritchie (1970) found no gross physical effects from disposing of spoil overboard in shallow water in Chesapeake Bay, on 44 species of fish sampled. No changes in catch rates attributable to disposal activities were detected (Appleby and Scarratt 1989). Similarly, Ingle et al. (1952) found no mortality of fish or motile shellfish at a dredging site in Mobile Bay, Alabama. In addition to TSS concentration, the frequency and duration of exposure are also of key importance in considering the environmental effects of TSS on fish (Newcombe and Jensen 1996). Short-term spikes in turbidity may be benign, whereas frequent or long episodes may not (CH2M Hill Consulting Company 2000, Internet site).
Newcombe and Jensen (1996) predicted empirical TSS thresholds for the most sensitive adult and juvenile salmonids based on the results of previous suspended solids studies on fish (see Table 10-3).
Eulachon
Although the movement patterns and habitat use of eulachon in the upper Kitimat Arm are not well known, some exposure to a sediment plume is expected during project construction. If dredging activities are ongoing during February and March when the eulachon run occurs, they could be exposed if they pass through the north side of the upper Kitimat Arm. Exposure to increased suspended solids will be spatially limited to an area within several hundred metres of the dredge or blasting location and will occur over a period of approximately 18 weeks. The explosive discharge portion of the blasting will take approximately three weeks. Construction is not expected to interfere with the access of eulachon to the upper Kitimat Arm and to the potential spawning habitat in the nearby rivers and streams.

Sec. 52 Application Volume 6B: Environmental and Socio-Economic Assessment (ESA) – Marine Terminal Section 10: Marine Fish
Page 10-28 May 2010
Table 10-3 Lethal and Paralethal Total Suspended Solids Thresholds for Adult and Juvenile Salmonids
Exposure Duration
Total Suspended Solids (mg/L)
Lethal and Paralethal TSS Thresholds Sublethal TSS Thresholds
1 hour 22,026 55
1 day 148 N/A
2 weeks 7 1
7 weeks – 11 months 3 1
NOTE: Paralethal and lethal effects include reduced fish growth rate and density, delayed hatching, increased predation, moderate to severe habitat degradation and incremental rates of mortality.
SOURCE: Newcombe and Jensen 1996
Because of the high variation in spawning locations from year to year, homing behaviour is not expected to be specific enough to be altered substantially by a small, localized increase in sedimentation.
Because of the localized spatial nature of sediment disturbance and rapid resettling (i.e., within days of each dredging or blasting event), environmental effects of sedimentation on eulachon are predicted to be low in magnitude and short-term.
With mitigation, the environmental effects of changes in habitat quality from the Project on eulachon are expected to be not significant.
Pacific Herring
Pacific herring spawn in the PEAA from March through April, with spawning peaking around late March. Therefore, spawning herring and herring eggs are potentially at risk from the environmental effects of increased sediment loads in the water, if dredging or blasting overlaps temporally with peak spawning times. Specific spawning areas have been identified on the coastline near Minette Bay and on the southern coast of Kitimat Arm.
The sediment modelling shows that the sediment plume from dredging activity will extend to the north of the marine terminal. As the plume is not expected to reach the head of Kitimat Arm or the southern coastline, it will not overlap with known herring spawning habitat. The expected levels of TSS will be less than naturally occurring levels in all areas, except near the dredging activity (see Figure 10-3 to Figure 10-7). All TSS levels expected because of dredging are less than those known to elicit physiological and behavioural responses in Pacific herring.
Because sediment plumes will not affect herring spawning areas, and potential effects on adult fish will be limited to a localized area around the dredging or blasting activity and will only persist for a short period after each blasting or dredging event, environmental effects of sedimentation on Pacific herring are predicted to be low in magnitude and short-term.

Sec. 52 Application Volume 6B: Environmental and Socio-Economic Assessment (ESA) – Marine Terminal Section 10: Marine Fish
May 2010 Page 10-29
With mitigation, the environmental effects of changes in habitat quality from the Project on Pacific herring are expected to be not significant.
Rockfish
Although exact spawning locations for rockfish have not been identified, juveniles eventually settle in nearshore areas (Love et al. 2002). Habitat for spawning rockfish or juveniles has not been confirmed near the PDA. If such habitat were present within areas that might be affected by increased suspended solids, no measurable effects on rockfish populations would be expected. This affected area is a very small proportion of the habitat available for juvenile rockfish in Kitimat Arm. In addition, suspended solids conditions as a result of dredging and blasting would be similar or lower to those naturally encountered by juvenile rockfish in Kitimat Arm during the spring runoff. Therefore, while behavioural or minor physiological effects may occur, mortality of large numbers of juveniles is unlikely and effects would be reversible.
Resident adult rockfish in the PDA are not expected to be affected by increased sedimentation, given the low magnitude of the event and the annual sedimentation events during spring freshets. The area with sediment deposition over 0.1 cm thick will be confined mainly to the immediate zone of dredging activities. Outside this disturbed area, the deposition will be less than 0.1 cm thick, typically 0.0025 to 0.05 cm thick and is not expected to affect rockfish measurably.
Because sediment plumes are unlikely to affect juvenile or spawning areas for rockfish, and should not affect adult fish, environmental effects of sedimentation on rockfish are predicted to be of negligible magnitude and short-term. With mitigation, the environmental effects of changes in habitat quality from the Project on rockfish are expected to be not significant.
Chum Salmon
Juvenile salmon feed on zooplankton and larval and adult invertebrates. Adult salmon returning to spawn do not feed during their migration. Therefore, the potential environmental effects on food sources from increased suspended solids are limited to juvenile salmon transiting the area en route to the ocean. However, assuming that an increase in suspended solids does affect food availability for juveniles, they are likely to move out of the affected area in search of food. Because the area of increased turbidity around the PDA is limited both spatially and temporally, juvenile salmon are unlikely to be adversely affected by increased sedimentation from project activities. Work windows will be used to avoid sensitive periods for species such as salmon. Therefore, no effects on adult salmon are expected due to temporal and spatial separation of these animals from the activities that are most likely to result in sedimentation.
Because sediment plumes are unlikely to affect juvenile chum salmon, and will not affect adult fish, environmental effects of sedimentation on chum salmon are predicted to be of negligible magnitude and short-term.
With mitigation, the environmental effects of changes in habitat quality from the Project on chum salmon are expected to be not significant.
For the characterization of potential environmental effects of change in water quality on marine fish during all project phases, see Table 10-4.

Sec. 52 Application Volume 6B: Environmental and Socio-Economic Assessment (ESA) – Marine Terminal Section 10: Marine Fish
Page 10-30 May 2010
Table 10-4 Characterization of the Residual Effects on Marine Fish – Habitat Quality
Activity Direction Additional Proposed
Mitigation Measures1-4
Residual Environmental Effect
Magnitude
Geographic Extent
Duration/
Frequency
Reversibility
Significance Potential
Measurable Contribution to
Regional Cumulative
Environmental Effects
Construction
• Onshore infrastructure site preparation
Adverse • Construction EPMP (Volume 7A)1
L S S/O R N No
• Inwater infrastructure site preparation Adverse • Construction EPMP (Volume 7A)1
• Work windows2 • Dredge technology3 • Silt curtains4
L S S/O R N No
• Inwater infrastructure construction Adverse L L S/O R N No
Operations
• Inwater infrastructure PDA (marine terminal, berths and associated shading, underwater structures)
Adverse L S L/C R N No
• Berthed tankers Adverse • Ballast Water Management Plan
L S S/R R N No
• Onshore site restoration Adverse • Construction EPMP (Volume 7A)1
L S S/O R N No
• Inwater infrastructure site restoration Adverse • Construction EPMP (Volume 7A)1
• Work windows2
L L S/O R N No

Sec. 52 Application Volume 6B: Environmental and Socio-Economic Assessment (ESA) – Marine Terminal Section 10: Marine Fish
May 2010 Page 10-31
Table 10-4 Characterization of the Residual Effects on Marine Fish – Habitat Quality (cont’d) Mitigation: 1. Construction Environmental Protection and Management Plan (EPMP): The Construction EPMP (Volume 7A) outlines the protection measures developed by
Northern Gateway to reduce the potential environmental effects of routine construction activities. It also encompasses compliance and effects monitoring programs. Water quality and sediment management measures incorporated in the Construction EPMP include the use of silt curtains, sediment settlement ponds, and managing surface water drainage, as appropriate. These measures are included in the Erosion and Sediment Control Plan (see Volume 7A, Appendix A.3.5) and the Storm Water Management Plan (see Volume 7A, Appendix A.3.4) that are part of the EPMP. These plans will be implemented to manage surface water drainage during construction to reduce sedimentation in nearshore waters.
2. Work windows: Work windows for inwater activities such as dredging and blasting will be determined in consultation with DFO. Mitigation for protecting migration, spawning and egg development of anadromous species, such as eulachon, will be implemented, where appropriate.
3. Dredge technology: Dredging will involve using a system to limit sediment effects, as appropriate. 4. Silt curtains: Silt curtains will be used to reduce TSS.
Follow-up and Monitoring: 1. Water Quality and Substrate Composition Monitoring Plan: The Water Quality and Substrate Composition Monitoring Plan includes monitoring of the sediment
plume in the marine environment during dredging and blasting 2. Species monitoring: Because of uncertainty in scientific data and the cultural importance of eulachon to Coastal Aboriginal groups, a three-year monitoring
program will track potential project effects on eulachon populations. Rockfish will be surveyed at the marine terminal, to confirm that these fish have re-inhabited the affected areas, address habitat predictions and address habitat predictions.

Sec. 52 Application Volume 6B: Environmental and Socio-Economic Assessment (ESA) – Marine Terminal Section 10: Marine Fish
Page 10-32 May 2010
Table 10-4 Characterization of the Residual Effects on Marine Fish – Habitat Quality (cont’d) KEY Direction: P Positive: an enhancement of the
population or species. A Adverse: an effect that has a
negative effect on the population or species.
Magnitude: N Negligible: no measurable
adverse environmental effects expected.
L Low: affects a specific group of localized individuals in a population but does not affect other trophic levels or the population itself.
M Moderate: affects a portion of a population but does not threaten the integrity of that population or any population depending on it.
H High: affects the local population to the degree which may threaten the integrity of that population or any population dependent upon it.
Geographic Extent: S Site-specific: within the PDA L Local: within the PEAA R Regional: extends beyond the
PEAA (into or beyond the CCAA)
Duration: S Short term: environmental effects
noticeable during construction and decommissioning.
M Medium term: environmental effects noticeable less than two years after construction is complete.
L Long term: environmental effects noticeable more than two years after construction is complete.
P Permanent: environmental effects are permanent.
Frequency: O Occurs once. S Occurs sporadically. R Occurs regularly. C Continuous.
Reversibility: R Reversible. I Irreversible.
Significance: S Significant. N Not significant
Potential Contribution to Regional Cumulative Effects: Yes: project-related environmental
effects on marine fish are likely to contribute to regional cumulative changes on marine fish in the CCAA.
No: project-related environmental effects on marine fish are not likely to contribute to regional cumulative changes on marine fish in the CCAA.

Sec. 52 Application Volume 6B: Environmental and Socio-Economic Assessment (ESA) – Marine Terminal Section 10: Marine Fish
May 2010 Page 10-33
10.6.3 Cumulative Effects Implications The environmental effects of changes in habitat quality from the Project on marine fish are expected to be restricted to the immediate area of the PDA and will be limited to the period when dredging and blasting will occur. With mitigation, no significant effects on juvenile or adult fish are expected. While other activities in the PEAA may generate small amounts of sediment over short period, no major dredging or blasting programs are known that would overlap with the activities at the marine terminal. As a result, cumulative effects will be low in magnitude, local, short-term and reversible, and are not considered further in this assessment.
10.6.4 Prediction Confidence The level of certainty for the prediction of not significant for residual environmental effects on marine fish from sedimentation is rated moderate. Although the sources of disturbance are understood and potential environmental effects have been identified, the exact spatial and temporal distribution of each KI species in the PEAA relative to the sediment dispersion from the Project is unknown.
The level of certainty for the prediction of not significant for project contribution to cumulative effects in relation to sedimentation disturbance on marine fish is rated as moderate for the same reasons.
10.7 Effects on Marine Fish – Habitat Availability Construction, operations and decommissioning of the marine terminal will result in both permanent and temporary alteration of marine fish habitat. Although none of the KI species are known to spawn within PDA boundaries, spawning sites have been documented in and around the PEAA. For example, Pacific herring spawning sites have been identified in Douglas Channel and Kitimat Arm. Additionally, both adult eulachon and salmon migrate through Kitimat Arm to reach nearby spawning sites such as Bish Creek and the Kitimat River. The PEAA may also include important rearing and nursery areas for juvenile fish, such as rockfish, which prefer nearshore areas. Maintaining healthy spawning and nursery habitat is critical to the recovery of declining marine fish stocks, as well as the maintenance of currently robust fish stocks.
10.7.1 Baseline Conditions Douglas Channel and Kitimat Arm have large areas of relatively undisturbed marine fish habitat. Numerous species of marine fish, including several commercially and culturally important marine fish populations, use the region for feeding, spawning and rearing. The region encompasses intact ecosystems that maintain linkages between the marine and terrestrial environments and provide the ecological requirements for a large diversity of coastal wildlife populations.

Sec. 52 Application Volume 6B: Environmental and Socio-Economic Assessment (ESA) – Marine Terminal Section 10: Marine Fish
Page 10-34 May 2010
10.7.2 Effects on Marine Fish – Habitat Availability
10.7.2.1 Effect Mechanisms
Construction
Construction activities that will permanently alter marine fish habitat in the PDA include:
• blasting • dredging • creating terraces along the underwater rock face (to support components of the marine infrastructure) • installing physical structures in the water column
Dredging will result in a temporary increase in suspended solids that may alter habitat in a localized area.
Vertical structures can create new habitat, offsetting potential detrimental effects. The structure may act as artificial reefs, providing habitat, food and protection from predation for marine fish. In California, offshore oil and gas platforms provided recruitment habitat for pelagic juvenile rockfish to settle and grow before dispersing to other areas (Love et al. 2006). The Project’s inwater vertical structures that will support the mooring and berthing structures may serve a similar purpose.
However, structures may also be obstructions that alter fish movements. This type of interference has the potential to affect natural migration or spawning behaviour of marine fish.
Underwater blasting is necessary to provide shelves for placing berthing structures and piles. Blasting around the site may remove or disturb a large volume of rockfish habitat. Rockfish prefer complex substrates, exhibit high site fidelity and often stay within a defined home range (sometimes less than 10 m2) for most of their lives (Love et al. 2002). Homing behaviour in rockfish is poorly understood, but most species apparently have at least some ability to return to their home range when they are displaced (Love et al. 2002). Among the inshore rockfish species, copper and quillback have been shown to return home after being translocated, depending on the relief of their original site and the season they were removed (Love et al. 2002).
Operations
No additional changes in habitat availability, apart from those outlined for construction, are expected during routine operations.
Decommissioning
The entire infrastructure at the Kitimat Terminal is expected to be removed to the top of the substrate and reclaimed according to the regulations and standards at the time of decommissioning. Decommissioning activities may temporarily displace fish. Removing inwater infrastructure will represent a loss of habitat for some fish species, but will return the site to a more natural habitat similar to that before construction.

Sec. 52 Application Volume 6B: Environmental and Socio-Economic Assessment (ESA) – Marine Terminal Section 10: Marine Fish
May 2010 Page 10-35
10.7.2.2 Mitigation and Effects Management
During construction, operations and decommissioning, mitigation measures will be implemented to reduce the adverse environmental effects of activities, such as blasting, dredging and pile drilling on marine habitat availability. Mitigation will involve the following:
• The Construction EPMP (Volume 7A), which outlines the mitigation measures developed by Northern Gateway to reduce the potential environmental effects of routine construction activities. It also encompasses compliance and effects monitoring programs. Sediment management measures incorporated in the Construction EPMP include the use of silt curtains, sediment settlement ponds, and managing surface water drainage, as appropriate. These measures are included in the Erosion and Sediment Control Plan (see Volume 7A, Appendix A.3.5) and the Storm Water Management Plan (see Volume 7A, Appendix A.3.4) that are part of the EPMP. These plans will be implemented to manage surface water drainage during construction to reduce sedimentation in nearshore waters.
• A Water Quality and Substrate Composition Monitoring Plan has been developed. It includes monitoring of the sediment plume in the marine environment during dredging and blasting.
• Work windows for inwater activities such as dredging and blasting. The timing of work windows and associated measures to protect migration, spawning and egg development of anadromous species, such as eulachon and salmon, will be determined in consultation with DFO.
• Use of a dredging system to limit sediment effects, as appropriate (a clamshell dredge is currently proposed).
• Use of a silt curtain, where practical, during dredging and blasting, to reduce the dispersion and duration of suspended sediments.
10.7.2.3 Residual Effects
Changes in habitat availability will have permanent and temporary components. Alteration to the seabed and foreshore areas will be permanent, but alterations such as increased sedimentation during construction, will be temporary and revert to pre-project conditions once construction is complete. Following construction, marine fish are also expected to return to and utilize habitat within the PDA.
Although rockfish may be displaced by construction activities, the effect is expected to be temporary.
No major effects on the habitat use and movements of marine fish are expected to result from the construction and operations of the marine terminal because:
• the PDA does not overlap with any spawning habitat for any of the KIs
• construction activities will be short in duration
• similar habitat is abundant within the PEAA
• following construction, marine fish are expected to return to and use the PDA, including newly exposed rock substrates in the marine terminal area
• marine infrastructure may provide additional shelter and habitat for some species of fish

Sec. 52 Application Volume 6B: Environmental and Socio-Economic Assessment (ESA) – Marine Terminal Section 10: Marine Fish
Page 10-36 May 2010
The localized temporal and spatial nature of change in habitat availability during construction, operations and decommissioning phases, coupled with the mitigation measures to be implemented, suggest that potential environmental effects of the Project are of negligible magnitude, short-term and reversible.
Changes in habitat availability from the Project for marine fish are concluded to be not significant (see Table 10-5).
10.7.3 Cumulative Effects Implications Project-specific residual environmental effects on marine fish are expected to be of negligible magnitude, short-term and reversible. Due to the availability of similar habitat in other areas of the PEAA and the broader region, no effects on the sustainability of marine fish populations are likely.
While there are other developments in the PEAA that have resulted or might result in similar alteration or disturbance of marine fish habitat, these effects are expected to also be highly localized, short-term and reversible. It is therefore unlikely that the combined effects of other projects and the Project on marine fish habitat will compromise the long-term sustainability of marine fish.
Given that few measurable project effects are expected and there is limited potential for interactions with cumulative effects form past, present and future projects, cumulative effects on the availability of marine fish habitat were considered to be not significant and are not considered further in this assessment.
10.7.4 Prediction Confidence The level of certainty for the prediction of not significant for residual environmental effects of the Project on habitat availability for marine fish is moderate, because the sources of disturbance are understood and potential environmental effects have been identified. However, the exact spatial and temporal distribution of the KIs in the PEAA relative to the marine terminal infrastructure is unknown.
The level of certainty for the prediction of cumulative environmental effects on habitat availability for marine fish is rated as moderate for the same reasons.
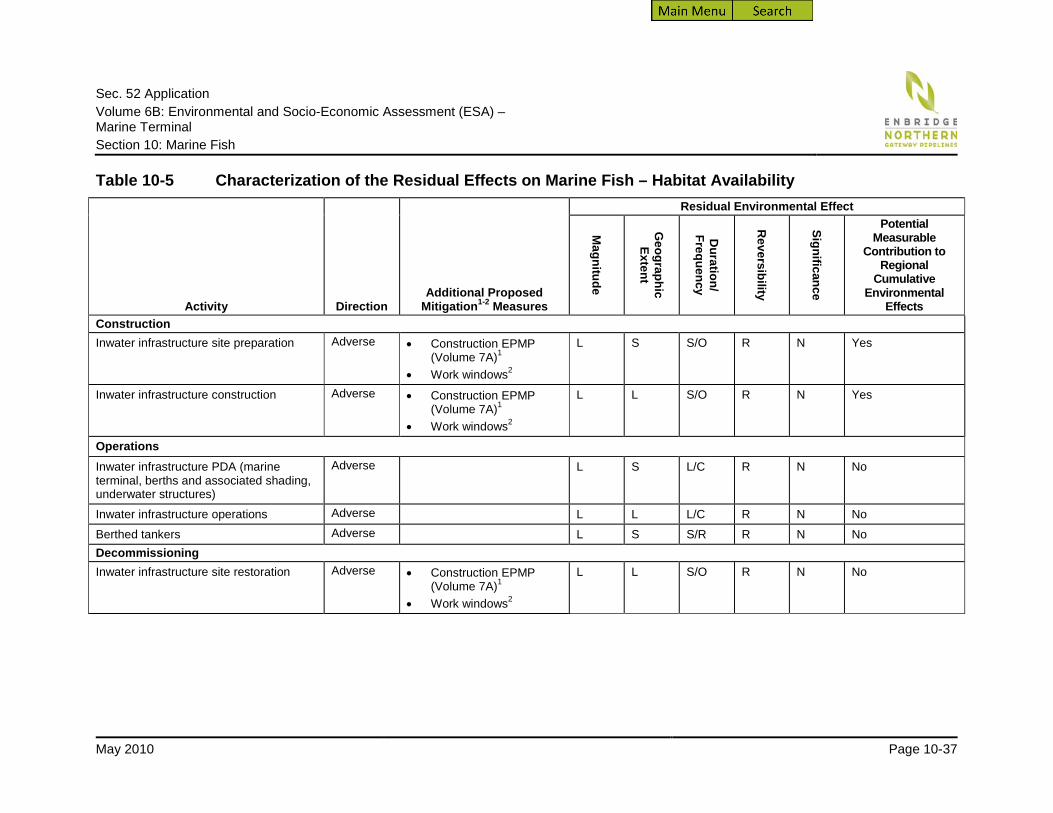
Sec. 52 Application Volume 6B: Environmental and Socio-Economic Assessment (ESA) – Marine Terminal Section 10: Marine Fish
May 2010 Page 10-37
Table 10-5 Characterization of the Residual Effects on Marine Fish – Habitat Availability
Activity Direction Additional Proposed
Mitigation1-2 Measures
Residual Environmental Effect
Magnitude
Geographic Extent
Duration/
Frequency
Reversibility
Significance Potential
Measurable Contribution to
Regional Cumulative
Environmental Effects
Construction Inwater infrastructure site preparation Adverse • Construction EPMP
(Volume 7A)1 • Work windows2
L S S/O R N Yes
Inwater infrastructure construction Adverse • Construction EPMP (Volume 7A)1
• Work windows2
L L S/O R N Yes
Operations Inwater infrastructure PDA (marine terminal, berths and associated shading, underwater structures)
Adverse L S L/C R N No
Inwater infrastructure operations Adverse L L L/C R N No
Berthed tankers Adverse L S S/R R N No Decommissioning Inwater infrastructure site restoration Adverse • Construction EPMP
(Volume 7A)1 • Work windows2
L L S/O R N No

Sec. 52 Application Volume 6B: Environmental and Socio-Economic Assessment (ESA) – Marine Terminal Section 10: Marine Fish
Page 10-38 May 2010
Table 10-5 Characterization of the Residual Effects on Marine Fish – Habitat Availability (cont’d) Mitigation: 1. Construction Environmental Protection and Management Plan (EPMP): The Construction EPMP (Volume 7A) outlines the protection measures developed by
Northern Gateway to reduce the potential environmental effects of routine construction activities. It also encompasses compliance and effects monitoring programs. Water quality and sediment management measures incorporated in the Construction EPMP include the use of silt curtains, sediment settlement ponds, and managing surface water drainage, as appropriate. These measures are included in the Erosion and Sediment Control Plan (see Volume 7A, Appendix A.3.5) and the Storm Water Management Plan (see Volume 7A, Appendix A.3.4) that are part of the EPMP. These plans will be implemented to manage surface water drainage during construction to reduce sedimentation in nearshore waters.
2. Work windows: Work windows for inwater activities such as dredging and blasting will be determined in consultation with DFO. Mitigation for protecting migration, spawning and egg development of anadromous species, such as eulachon, will be implemented, where appropriate.
Follow-up and Monitoring: 1. Water Quality and Substrate Composition Monitoring Plan: The Water Quality and Substrate Composition Monitoring Plan includes monitoring of the
sediment plume in the marine environment during dredging and blasting 2. Species monitoring: Because of uncertainty in scientific data and the cultural importance of eulachon to Coastal Aboriginal groups, a three-year monitoring
program will track potential project environmental effects on eulachon populations. Rockfish will be surveyed at the marine terminal, to confirm these fish have re-inhabited the disturbed areas, address habitat predictions and help with decisions about removing infrastructure.
Key Refer to Table 10-4.

Sec. 52 Application Volume 6B: Environmental and Socio-Economic Assessment (ESA) – Marine Terminal Section 10: Marine Fish
May 2010 Page 10-39
10.8 Effects on Marine Fish from Acoustic Disturbance
10.8.1 Baseline Conditions The PEAA is subject to several sources of anthropogenic noise. Commercial vessels regularly navigate the area. According to the Port of Kitimat, 102 deep-sea vessels, generally ranging from 40,000 to 50,000 deadweight tonnes (dwt), called at the Port of Kitimat in 2007, which is a substantial reduction from the peak volumes in the order of 300 calls per year in 1992 to 1993 (Port of Kitimat Vessel Traffic 1978 to 2007).
In the PEAA, there are two commercial marinas, as well as wharves and marine structures associated with the Alcan, Eurocan and Methanex facilities. Many commercial fishing vessels and recreational vessels also operate in the PEAA; most traffic is during the summer.
In September 2005, a field study of ambient noise at several locations from Emsley Cove to Principe Channel recorded sound levels ranging from 82 dBRMS re 1µPa to 155 dBRMS re 1µPa, with minimum broadband ambient noise levels ranging of 84RMS dB re 1µPa at Emsley Creek Estuary to 95 dBRMS re 1 µPa at Caamaño Sound (see the Marine Acoustics [2006] TDR). Four vessels were recorded as distant low-level events that produced broadband levels less than 100 dB, with spectral energy restricted to above 100 Hz. A fifth vessel caused a 1-minute sound level average to exceed 120 dB re 1 µPa. This event also had maximum spectral content at a very low frequency, near 30 to 40 Hz (see Marine Acoustics [2006] TDR).
10.8.2 Effects on Marine Fish from Acoustic Disturbance
10.8.2.1 Effect Mechanisms
During construction, operations and decommissioning of the marine terminal, underwater acoustic emissions will be produced by various activities: blasting, dredging, pile installation and project-related vessel noise. Source levels associated with these activities were measured during previous construction projects (see Table 10-6 for a summary).
Construction
Project construction is expected to take place over a four year period. During this time, marine fish in the PEAA will be exposed to periods of elevated underwater acoustic emissions resulting from supply vessel engine noise, blasting, pile installation and dredging.

Sec. 52 Application Volume 6B: Environmental and Socio-Economic Assessment (ESA) – Marine Terminal Section 10: Marine Fish
Page 10-40 May 2010
Table 10-6 Estimated Source Levels of Loud Project Activities Project Activity
Details
Source Level (dB re 1 µPa)
Dredging Clamshell dredge 161 at 1 m 1
Drilling Various vessel-based drilling operations
154–191 at 1 m 2
Tug Pushing and pulling; slow 193 at 1 m 4
Tug In transit; full speed 185 at 1 m 4
Operations Small workboat 156.9 at 1 m 5 Tanker On standby 160 at 1 m 6 Blasting Underwater (TNT) 267–278 at 1 m 7*
NOTE: * Peak pressure is reduced substantially, to about 5% of the value for freely suspended charges, when charges are buried in boreholes (Nedwell and Thandavamoorthy 1989).
SOURCES: 1 Miles et al. 1987 2 Richardson and Malme 1995 3 Hastings and Popper 2005 4 JASCO 2008 5 JASCO 2006 6 Hannay 2006, pers. comm. 7 Richardson and Malme 1995
Operations
Noise from berthed vessels and tugs will be the primary source of acoustic disturbance during routine operations of the marine terminal.
During operations, berthed project-related vessels at the marine terminal (during 18- to 36-hour hydrocarbon loading or off-loading periods) will produce low frequency sounds for an average of 20 days a month. Sound levels of tankers on standby are expected to be 160 dB re 1 µPa at 1 m (see Table 10-6).
Decommissioning
The potential environmental effects of decommissioning activities on acoustic disturbance are considered to be similar to those identified for construction. For the ESA, and unless government or local authorities decide to retain the facilities, all the facilities in the Kitimat Terminal are assumed to be removed to the top of the substrate, and reclaimed according to the regulations and standards at the time of decommissioning.

Sec. 52 Application Volume 6B: Environmental and Socio-Economic Assessment (ESA) – Marine Terminal Section 10: Marine Fish
May 2010 Page 10-41
10.8.2.2 Mitigation and Effects Management
To reduce the likelihood and extent of adverse effects of underwater noise on marine fish, Northern Gateway will implement the following best industry practices and mitigation measures, where practical.
The following mitigation strategies will be used to limit underwater noise:
• The timing of work windows for inwater infrastructure site preparation will be determined in consultation with DFO to avoid sensitive seasonal periods, where practical.
• Equipment will be selected and operated to limit underwater noise. Propellers of all construction and decommissioning support vessels will be well maintained and visually inspected regularly for damage (e.g., bent blades, nicks in the blade). Poorly maintained propellers are known to increase underwater noise. Where feasible, construction and decommissioning support vessels will operate at slow speeds to reduce the intensity of noise.
• Northern Gateway is committed to incorporating best commercially available technology so that escort and harbour tugs produce the least underwater noise possible. Examples of this technology may include use of Voith-Schneider (VS) and modified Azimuth Stern Drive (ASD) propulsion systems.
A Blasting Management Plan will be developed and implemented (see Construction EPMP, Volume 7A). All blasting activities will be within the Guidelines for Using Explosives in or Near Canadian Fisheries Waters (Wright and Hopky 1998). Mitigation strategies that will be used before or during blasting, where practical, include:
• The timing of work windows for blasting activities will be determined in consultation with DFO to avoid sensitive seasonal periods, where practical.
• Efforts will be made during the blasting design to reduce overpressure.
• Bubble curtains will be used, where practical, to limit underwater noise propagation.
10.8.2.3 Residual Effects
With mitigation, underwater noise generated by marine terminal construction is not expected to affect marine fish adversely. In the PDA, noise generated by tugs and drilling is expected to dissipate below the reported behavioural response threshold of 160 dB re 1 µPa within about 50 m (see Table 10-6) (McCauley et al. 2000a, 2000b). Because many of the environmental effects reported in the literature appear to be temporary or intermittent, adverse environmental effects are not expected for marine fish at the population level.
Construction
The sound levels for project construction activities are well below the interim guideline threshold of 208 dB re 1 µPa set by Popper et al. (2006). Therefore, onset of physical damage in marine fish is not expected as a direct result of project-related vessel acoustic emissions. Eulachon, Pacific herring and chum salmon are all known to migrate through areas of high vessel traffic (e.g., Fraser and Columbia Rivers), and no major effects on migration on spawning activity have yet been documented in the literature.

Sec. 52 Application Volume 6B: Environmental and Socio-Economic Assessment (ESA) – Marine Terminal Section 10: Marine Fish
Page 10-42 May 2010
Underwater Noise
Underwater sounds from construction activities have most acoustic energy centred at low frequencies (less than 1 kHz; Richardson and Malme 1995). The propagation of these sounds depends on both the source intensity and the geophysical properties of the water and seafloor.
To assess the area in which marine fish are affected by construction sounds, sound levels above thresholds for both hearing specialists (herring) and generalists (Atlantic salmon) were modelled for a clamshell dredge (with a source sound level of 161 dB re 1 µPa at 1 m) operating at the marine terminal construction site (see Figure 10-8 and Figure 10-9).
These model examples indicate that acoustic disturbance in relation to marine fish will be limited. Acoustic disturbance levels were modelled to 60 dB over threshold for hearing specialists near the source. However, this disturbance decreases with distance from the source, to 20 dB at about 3.5 km (Figure 10-8). Received levels of sound for a generalist fish are below 25 dB re 1 µPa and will not extend beyond 0.5 km from the source (Figure 10-9).
Blasting
Data from explosive blast studies show that very fast, high-level acoustic exposures can cause physical damage to, or mortally wound, fish (Hastings and Popper 2005). Studies suggest that, when using explosives, far more damage occurs to fish with swim bladders than to species that do not have such chambers (McCauley 1994). Environmental effects on fish decline rapidly with distance from the explosion as the peak overpressure decreases and the impulse duration increases (Goertner et al. 1994). However, Hastings and Popper (2005) caution that considerable variability exists in the environmental effects of explosive blasts on fish and that the variables include:
• received sound energy • presence or absence of a swim bladder • mass of fish • body shape • the biomechanical properties of the swim bladder wall
Most blasting will occur between 10 m and 32 m deep in the water. However, some blasting may take place in shallower water.
Operations
To assess the area affected by sounds from routine operations, sound levels above thresholds for both hearing specialists (herring) and generalists (Atlantic salmon) were modelled for a tanker (with a source sound level of 160 dB re 1 µPa at 1 m) on standby at the marine terminal (see Figure 10-10 and Figure 10-11). Tankers on standby will be audible to Pacific herring throughout most of the upper part of Kitimat Arm, but will be highest within 0.5 km of the marine terminal (see Figure 10-10). Results for Atlantic salmon (hearing generalists) suggest that noise disturbance will be highest within 0.2 km of the marine terminal (40 dB re threshold) and will be reduced to 20 dB re threshold less than 1 km from the marine terminal (see Figure 10-11).

200 m
100
m
100 m
200 m
100
m
300 m
200
m
100
m
Kitimat
Minette Bay
KitamaatVillage
KitimatTerminal
K i t i
m a
t A
r m
BishCove
EmsleyCove
EmsleyPoint
CostePoint
CosteIsland
ClioBay
GobeilBay
Kitimat River
CreekBish
200 m
100
m
Pipeline Route
Security Fence
Terrestrial PDA
Marine PDA
Sound Level(dB re threshold)
0
5
10
15
20
25
30
35
40
45
50
55
60
Bathymetric Contour (100 m)
Railway
Road
100
m
200
m
NP
Jacques Whitford AXYS Ltd.
FIGURE NUMBER:
PROJECTION:
CONTRACTOR: DATE:
AUTHOR: APPROVED BY:PREPARED FOR:PREPARED BY: SCALE:Herring -Predicted Sound Levels above Hearing Threshold
from Clamshell Dredging, Kitimat Terminal
ENB R ID GE N OR TH ER N GA TEW A Y PR OJ EC T 10-8
NAD 83DATUM:
1:110,000
UTM 9
CM
Inset1:40,000
KitimatTerminal
0 1 2 3
Kilometres
Reference: Pipeline Route R
JWA-1048334-1522
REFERENCES: NTDB Topographic Mapsheets provided by the Majesty the Queen in Right of Canada, Department of Natural Resources. All rights reserved.
R:\2
009F
isca
l\104
8334
_Nor
ther
nGat
eway
_ES
A_2
009
20090911

200 m
100
m
100 m
200 m
100
m
300 m
200
m
100
m
Kitimat
Minette Bay
KitamaatVillage
KitimatTerminal
K i t i
m a
t A
r m
BishCove
EmsleyCove
EmsleyPoint
CostePoint
CosteIsland
ClioBay
GobeilBay
Kitimat River
CreekBish
200 m
Pipeline Route
Security Fence
Terrestrial PDA
Marine PDA
Sound Level(dB re threshold)
0
5
10
15
20
25
Bathymetric Contour (100 m)
Railway
Road
100
m
200
m
NP
Jacques Whitford AXYS Ltd.
FIGURE NUMBER:
PROJECTION:
CONTRACTOR: DATE:
AUTHOR: APPROVED BY:PREPARED FOR:PREPARED BY: SCALE:
ENB R ID GE N OR TH ER N GA TEW A Y PR OJ EC T 10-9
NAD 83DATUM:
1:110,000
UTM 9
CM
Inset1:40,000
KitimatTerminal
Salmon -Predicted Sound Levels above Hearing Threshold
from Clamshell Dredging, Kitimat Terminal
0 1 2 3
Kilometres
Reference: Pipeline Route R
JWA-1048334-1523
REFERENCES: NTDB Topographic Mapsheets provided by the Majesty the Queen in Right of Canada, Department of Natural Resources. All rights reserved.
R:\2
009F
isca
l\104
8334
_Nor
ther
nGat
eway
_ES
A_2
009
20090911

Kitimat
KitamaatVillage
K i t i
m a
t A
r m
BishCove
EmsleyCove
EmsleyPoint
Kitimat
Bish Creek
River
CosteIsland
ClioBay
GobeilBay
Minette Bay
KitimatTerminal
CostePoint
100 m
200
m
300 m
100
m
200
m
200
m
200 m
200 m
100 m
200 m
Pipeline Route
Security Fence
Terrestrial PDA
Marine PDA
Sound Level(dB re threshold)
0
5
10
15
20
25
30
35
40
45
50
55
60
65
70
Bathymetric Contour (100 m)
Railway
Road
100
m
200
m
Inset1:40,000
NP
Jacques Whitford AXYS Ltd.
FIGURE NUMBER:
PROJECTION:
CONTRACTOR: DATE:
AUTHOR: APPROVED BY:PREPARED FOR:PREPARED BY: SCALE:
ENB R ID GE N OR TH ER N GA TEW A Y PR OJ EC T 10-10
NAD 83DATUM:
1:140,000
UTM 9
CM
KitimatTerminal
Herring -Predicted Sound Levels above Hearing Threshold
from a Berthed Tanker on Standby, Kitimat Terminal
0 1 2 3
Kilometres
Reference: Pipeline Route R
JWA-1048334-1524
REFERENCES: NTDB Topographic Mapsheets provided by the Majesty the Queen in Right of Canada, Department of Natural Resources. All rights reserved.
R:\2
009F
isca
l\104
8334
_Nor
ther
nGat
eway
_ES
A_2
009
20100305

100
m
200 m
100
m
100 m
200 m
100
m
300 m
200
m
100
m
Kitimat
Minette Bay
KitamaatVillage
KitimatTerminal
K i t i
m a
t A
r m
BishCove
EmsleyCove
EmsleyPoint
CostePoint
CosteIsland
ClioBay
GobeilBay
Kitimat River
CreekBish
200 m
100
m
Pipeline Route
Security Fence
Terrestrial PDA
Marine PDA
Sound Level(dB re threshold)
0
5
10
15
20
25
30
35
40
Bathymetric Contour (100 m)
Railway
Road
100
m
200
m
NP
Jacques Whitford AXYS Ltd.
FIGURE NUMBER:
PROJECTION:
CONTRACTOR: DATE:
AUTHOR: APPROVED BY:PREPARED FOR:PREPARED BY: SCALE:
ENB R ID GE N OR TH ER N GA TEW A Y PR OJ EC T 10-11
NAD 83DATUM:
1:110,000
UTM 9
CM
Inset1:40,000
Salmon -Predicted Sound Levels above Hearing Threshold
from a Berthed Tanker on Standby, Kitimat Terminal
KitimatTerminal
0 1 2 3
Kilometres
Reference: Pipeline Route R
JWA-1048334-1525
REFERENCES: NTDB Topographic Mapsheets provided by the Majesty the Queen in Right of Canada, Department of Natural Resources. All rights reserved.
R:\2
009F
isca
l\104
8334
_Nor
ther
nGat
eway
_ES
A_2
009
20100305

Sec. 52 Application Volume 6B: Environmental and Socio-Economic Assessment (ESA) – Marine Terminal Section 10: Marine Fish
May 2010 Page 10-47
Overview
In this section, acoustic effects on fish associated with underwater noise and blasting are generally discussed. This is followed with an assessment of how acoustic disturbance may affect each of the four marine fish KIs.
For a characterization of the potential environmental effects of acoustic disturbance on marine fish during all project phases, see Table 10-7.
Although all species of fish have the ability to hear, researchers agree that fish can be divided into two groups: hearing specialists and hearing generalists. Hearing specialists have adaptations (such as the connected swim bladder and inner ear) that enhance their hearing bandwidth and sensitivity (i.e., lower their hearing threshold). Hearing specialists can detect signals up to 3,000 to 4,000 Hz, with thresholds that are 20 dB, or more, lower than the generalists (Hastings and Popper 2005). Pacific herring is used as a representative KI for hearing specialists in the PEAA.
Most fish do not have specializations to enhance hearing and are termed hearing generalists. Eulachon and chum salmon are representative KIs for hearing generalists in the PEAA. This group of fish likely detects sounds up to only 1,000 to 1,500 Hz. For example, Hawkins et al. (2002) reported that salmon are functionally deaf above 380 Hz. The extent of data on salmonid hearing is limited to the Atlantic salmon (Salmo salar) and, despite research supporting existence of similar auditory systems in all salmonids, extrapolation of hearing data must be done with considerable caution (Hastings and Popper 2005).
Whether rockfish are hearing generalists or specialists is unknown, as no reliable hearing data are available. Rockfish have muscles extending from the skull to the swim bladder, which allows them to produce sound (Love et al. 2002). This suggests that they may have specialized hearing abilities. For this assessment, rockfish are treated as hearing specialists to reduce the possibility of underestimating environmental effects resulting from acoustic disturbance.
Fish use sounds in a wide variety of behaviour, including aggression, protection of territory, defence and reproduction. Also, hearing capability is linked to survival because fish must (Hastings and Popper 2005):
• discriminate between sounds of predators and those of prey • determine the direction of a sound emitted by potential predators and prey • determine the nature of one sound source in the presence of others
Therefore, it is crucial that fish are able to detect an important signal, even when there are extraneous background noises. However, adding anthropogenic sounds to the background noise can make the environment so loud that fish are not able to detect important signals because of masking by anthropogenic sound (Hastings and Popper 2005).

Sec. 52 Application Volume 6B: Environmental and Socio-Economic Assessment (ESA) – Marine Terminal Section 10: Marine Fish
Page 10-48 May 2010
Table 10-7 Characterization of the Residual Effect of Effects on Marine Fish from Acoustic Disturbance
Activity Direction Additional Proposed
Mitigation/Compensation Measures1-5
Residual Environmental Effect
Magnitude
Geographic Extent
Duration/
Frequency
Reversibility
Significance Potential
Measurable Contribution to
Regional Cumulative
Environmental Effects
Construction Inwater infrastructure site preparation
Adverse • Construction EPMP (Volume 7A)1 • Work windows2 • Dredge technology3 • Bubble curtains4 • Blasting Management Plan5
L S S/O R N No
Inwater infrastructure construction Adverse L L S/O R N No
Berthed construction support vessels
Adverse • Construction EPMP (Volume 7A)1 L L S/O R N No
Operations Inwater infrastructure operations Adverse L L L/C R N No
Berthed tankers Adverse L S S/R R N No Decommissioning Inwater infrastructure site restoration
Adverse • Work windows2 • Dredge technology3 • Bubble curtains4 • Blasting Management Plan5
L L S/O R N No
Berthed decommissioning support vessels
Adverse L L S/O R N No

Sec. 52 Application Volume 6B: Environmental and Socio-Economic Assessment (ESA) – Marine Terminal Section 10: Marine Fish
May 2010 Page 10-49
Table 10-7 Characterization of the Residual Effect of Effects on Marine Fish from Acoustic Disturbance (cont’d)
Mitigation: 1. Construction Environmental Protection and Management Plan (EPMP): The Construction EPMP (Volume 7A) outlines the protection measures developed by
Northern Gateway to reduce the potential environmental effects of routine construction activities. It also encompasses compliance and effects monitoring programs. For water quality, sediment management measures incorporated in the Construction EPMP include the use of silt curtains, as appropriate, and sediment plume monitoring.
2. Work windows: Work windows for inwater activities such as dredging and blasting will be determined in consultation with DFO. Mitigation for protecting migration, spawning and egg development of anadromous species, such as eulachon, will be implemented, where appropriate.
3. Dredge technology: Dredging will involve using a system to limit underwater noise where technically possible. 4. Bubble curtains: Bubble curtains will be used, where practical, to limit underwater noise propagation. 5. Blasting Management Plan: A Blasting Management Plan will be developed so that all blasting activities are concurrent with DFO Guidelines for Using
Explosives in or Near Canadian Fisheries Waters.
Follow-up and Monitoring: Species monitoring: Because of uncertainty in scientific data and the cultural importance of eulachon to Coastal Aboriginal groups, a three-year monitoring program will track potential project environmental effects on eulachon populations. Rockfish will be surveyed at the marine terminal, to confirm re-inhabitation address habitat predictions and help with decisions about removing infrastructure. Key Refer to Table 10-4.

Sec. 52 Application Volume 6B: Environmental and Socio-Economic Assessment (ESA) – Marine Terminal Section 10: Marine Fish
Page 10-50 May 2010
Evaluating the environmental effects of a particular type of sound on a particular species is difficult, because of the lack of scientific information, in particular field experiments on fish and invertebrates. However, results from limited studies show that potential environmental effects of exposure to continuous sound on marine fish include (LGL Limited and JASCO Research Ltd. 2005):
• temporary threshold shift (temporary hearing loss caused by an upward shift in auditory threshold)
• physical damage to the ear region
• physiological stress responses
• behavioural responses such as startle response, alarm response, avoidance, and perhaps lack of response because of acoustic cues being masked
The lowest sound pressure level (SPL) causing documented damage is 180 dB re 1 µPa for continuous, long-duration tones in a region of good hearing (200 to 500 Hz for many fish species) (MMS 2004). Additionally, McCauley et al. (2000a) suggest avoidance by fish typically occurs at about 160 to 180 dB re 1 μPa.
Few studies have provided information on the environmental effects of noise exposure on fish eggs and larvae. Studies that have examined the effects of sound on fish in a laboratory context show that high levels of ambient sound can be detrimental to eggs and decrease larval growth rates (Banner and Hyatt 1973; Lagardere 1982). In the field, effects appear to be minimal and mortality has not generally been observed. Most marine fish hatch with an undeveloped ear, and auditory structures become fully functional some time later (Fuiman et al. 2004). As fish larvae are at substantial risk of predation while in the pelagic environment, increases in the rate of auditory development may be a selective advantage if sound is an important cue. Higgs (2005) reported some retinal tissue damage in cod larvae exposed at 1 m from an airgun source. However, any observed larval mortality occurred after exposures within 0.5 to 3 m of the airgun source. Saetre and Ona (1996) applied a worst-case scenario mathematical model to investigate the effects of seismic energy on fish eggs and larvae. They concluded that mortality rates caused by exposure to seismic energy are so low compared with natural mortality, that the effect of seismic surveying on recruitment to a fish stock must be regarded as minor.
When comparing estimated source levels of project activities (see Table 10-6) to the interim noise exposure criteria proposed by Popper et al. (2006), it appears to be unlikely that construction activities will induce a temporary threshold shift (TTS) in marine fish. Auditory fatigue and physical damage to the auditory system of marine fish are unlikely to occur (see Table 10-7). For most project activities, acoustic emissions are expected to dissipate to tolerable levels within several hundred metres.
Behavioural responses of marine fish to vessel noise could include avoidance of the immediate area of the marine terminal. Schwarz and Greer (1984) described the behavioural responses of net-penned Pacific herring to various tape-recorded sounds. Although herring did not respond to any of the natural sounds nor to the sonar or echo sounder, avoidance responses were elicited by:
• the sounds of large vessels approaching at constant speed • the sounds of smaller vessels on accelerated approach • some of the electronic sounds

Sec. 52 Application Volume 6B: Environmental and Socio-Economic Assessment (ESA) – Marine Terminal Section 10: Marine Fish
May 2010 Page 10-51
Pacific herring are known to use, and spawn throughout, certain locations in the PEAA, despite the area being exposed to acoustic disturbance from various natural and anthropogenic sources (see JASCO 2006). Modelling results show that acoustic disturbance produced by tankers on standby will be audible to Pacific herring throughout most of the upper part of the Kitimat Arm (see Figure 10-10). Noise levels will be 65 dB above the hearing threshold for Pacific herring close to the vessel. Within about 2 km, this will have reduced to 30 dB above the hearing threshold. Similar effects are expected for the other marine fish KIs.
Given the limited geographic extent of acoustic disturbance from marine terminal operations, substantial effects of auditory disturbances on marine fish populations and migration patterns are not expected during project operations. Effects of acoustic disturbance from marine terminal operations are therefore not considered further for the four KIs.
Eulachon
Eulachon in the PEAA are most sensitive to acoustic disturbance during migration to spawning rivers and subsequent development of the marine larval life stage. Acoustic modelling suggests that low frequency noise produced by tankers on standby and clamshell dredging is received by fish generalists at levels below 40 dB in a limited area near the marine terminal. Mitigation measures centred on the appropriate timing of dredging and blasting activity (developed in consultation with DFO) will reduce the effects of acoustic disturbance on migrating eulachon.
Given the type and level of sound disturbances from construction vessels and activities, and the duration of construction activities, environmental effects of acoustic disturbance on eulachon are predicted to be local, short-term and reversible.
The environmental effects are expected to be not significant because eulachon are known to migrate through areas of high vessel traffic (i.e., Fraser River, Columbia River) where they are subject to similar or higher noise disturbance than that expected from project activities, and no substantial environmental effects on migration or spawning activity have been documented. Eulachon may temporarily alter swimming patterns to avoid noise sources.
Pacific Herring
Pacific herring are known to spawn in Minette Bay, despite the area being exposed to acoustic disturbance from different vessels (e.g., tankers, cargo vessels, work vessels and recreational vessels).
Rockfish
Based on known information on rockfish responses to construction noise and blasting, it is likely that rockfish will move out of the area during the peak periods of acoustic disturbance and construction activity. For example, a 52% decrease in rockfish catch was recorded after a single air-gun emission, suggesting that rockfish had left the affected area (Pearson et al. 1992). However, since rockfish show high habitat fidelity and often stay within one defined home range for most of their lives (Love et al. 2002), it is expected that displaced individuals will return to their home ranges after disturbance (Love et al. 2002). Habitat near the marine infrastructure will likely be recolonized by resident rockfish, and those that do not return will be replaced by juvenile rockfish recruiting into the unused habitat.

Sec. 52 Application Volume 6B: Environmental and Socio-Economic Assessment (ESA) – Marine Terminal Section 10: Marine Fish
Page 10-52 May 2010
Effects of acoustic disturbance from dredging, blasting and other construction activities on rockfish will be local, short-term and reversible. Dredging may span eight to nine weeks, and blasting will occur over an 18 week period. Given the use of work windows, equipment selection, and noise management, acoustic disturbance effects from the Project on rockfish are concluded to be not significant.
Chum Salmon
Given the short duration of dredging and blasting activities, other mitigation measures, and the migration patterns of chum, environmental effects on chum populations are predicted to be local, short-term and reversible.
Effects of acoustic disturbance from the Project on chum salmon are concluded to be not significant because of the work windows for dredging and blasting (developed in consultation with DFO) and the other mitigation measures that will be implemented.
10.8.3 Cumulative Effects Implications Although a number of acoustical disturbances to marine fish will occur during project construction, operations and decommissioning, effects are expected to be local, short-term and reversible. Other existing projects in the PEAA (e.g., Eurocan Pulp and Paper Co. plant and terminal, Methanex Corporation plant and terminal and Rio Tinto Alcan Primary Metal British Columbia aluminum smelter) as well as approved projects such as Kitimat LNG Inc. terminal and Arthon Construction Ltd. and Sandhill Materials Sandhill project, will similarly contribute to peak and background noise in the PEAA (see Appendix 3A). Assuming that the area affected by each of these projects, with regard to acoustic disturbance to marine fish, extends several hundred metres, there is no overlap between the acoustic disturbance from the marine terminal and disturbance from any other project in the PEAA that is likely to result in either auditory fatigue or physical damage to the auditory system of marine fish. Cumulative effects of acoustic disturbance on marine fish were therefore not considered further in this assessment.
10.8.4 Prediction Confidence The confidence in the prediction of not significant for residual environmental effects from acoustic emissions is rated as moderate. Although the sources of disturbance and sound propagation are understood, the available scientific and commercial data on the effects of anthropogenic sound on fish allow only preliminary conclusions. The confidence in the prediction of not significant for cumulative environmental effects of acoustic disturbance is rated moderate for the same reasons.
10.9 Follow-up and Monitoring for Marine Fish Because of the uncertainty in scientific data and the cultural importance of eulachon to coastal Aboriginal groups, a three-year follow-up program will track potential project environmental effects on eulachon populations. This is in addition to the mitigation measures (see Section 10.3).
Similar surveys will be done to confirm that rockfish re-inhabit the site after loud construction activities and during regular vessel noise because of uncertainty in scientific data on rockfish.

Sec. 52 Application Volume 6B: Environmental and Socio-Economic Assessment (ESA) – Marine Terminal Section 10: Marine Fish
May 2010 Page 10-53
A monitoring program also will be developed to confirm that Northern Gateway has implemented all mitigation measures and to confirm that these mitigation measures are working to protect fish and fish habitat from adverse environmental effects. Key aspects of monitoring include:
• confirming that conditions of the Authorization for Works or Undertakings Affecting Fish Habitat are implemented, and verifying their effectiveness, including the Fish Habitat Compensation Agreement
• confirming that sedimentation control devices are installed properly and are limiting sedimentation during project construction
• determining the resultant marine water quality, including sedimentation rates
10.10 Summary of Effects for Marine Fish Based on recent literature, the current understanding of project components and the respective status and life histories of marine fish in the PEAA, the combined residual environmental effects of changes in habitat quality, changes in habitat availability and acoustic disturbance on marine fish populations are considered to be not significant.
The highest risk of project environmental effects on marine fish will be during the construction phase, particularly during the completion of dredging and blasting activities. Construction activities are expected to continue over a four year period, and mitigation measures will be in place to reduce potential adverse environmental effects.
For a summary of the assessment of project-related environmental effects on marine fish during all project phases, see Table 10-8.

Sec. 52 Application Volume 6B: Environmental and Socio-Economic Assessment (ESA) – Marine Terminal Section 10: Marine Fish
Page 10-54 May 2010
Table 10-8 Summary of Residual Environmental Effects on Marine Fish
Potential Effect Mitigation1-5
Residual Environmental Effect
Magnitude
Geographic Extent
Duration/
Frequency
Reversibility
Significance
Prediction C
onfidence
Construction Change in water quality • Construction EPMP
(Volume 7A)1 • Work windows2 • Dredge technology4
L L S/O R N Moderate
Change in habitat availability • Construction EPMP (Volume 7A)1
• Work windows2
L S S/C R N Moderate
Acoustic disturbance • Blasting Management Plan3 • Bubble curtains5
L L S/O R N Moderate
Operations Change in water quality • Ballast Water Management Plan3 L S L/C R N Moderate
Change in habitat availability L S L/C R N Moderate
Acoustic disturbance L L L/C R N Moderate Decommissioning Change in water quality L L S/O R N Moderate
Change in habitat availability • Work windows2 L S S/C R N Moderate

Sec. 52 Application Volume 6B: Environmental and Socio-Economic Assessment (ESA) – Marine Terminal Section 10: Marine Fish
May 2010 Page 10-55
Table 10-8 Summary of Residual Environmental Effects on Marine Fish (cont’d)
Potential Effect Mitigation1-5
Residual Environmental Effect
Magnitude
Geographic Extent
Duration/
Frequency
Reversibility
Significance
Prediction C
onfidence
Decommissioning cont’d
Acoustic disturbance • Bubble curtains6 • Blasting Management Plan3
L L S/O R N Moderate
Cumulative Environmental Effects Change in water quality • Construction EPMP
(Volume 7A)1 • Work windows2 • Dredge technology4 • Bubble curtains5 • Blasting Management Plan3
L L L/C R N Moderate
Change in habitat availability L S L/C R N Moderate
Acoustic disturbance L L L/C R N Moderate
Combined Effects Project-specific cumulative effects
• Construction EPMP (Volume 7A)1
• Work windows2 • Blasting Management Plan3 • Dredge technology4 • Bubble curtains5
L L L/C R N Moderate
Cumulative effects L L L/C R N Moderate

Sec. 52 Application Volume 6B: Environmental and Socio-Economic Assessment (ESA) – Marine Terminal Section 10: Marine Fish
Page 10-56 May 2010
Table 10-8 Summary of Residual Environmental Effects on Marine Fish (cont’d) Mitigation: 1. Construction Environmental Protection and Management Plan (EPMP): The Construction EPMP (Volume 7A) outlines the protection measures developed by
Northern Gateway to reduce potential environmental effects from routine construction activities. It also encompasses compliance and environmental effects monitoring programs. Sediment management measures incorporated in the Construction EPMP include the use of silt curtains, sediment settlement ponds, and managing surface water drainage, as appropriate. These measures are included in the Erosion and Sediment Control Plan (see Volume 7A, Appendix A.3.5) and the Storm Water Management Plan (see Volume 7A, Appendix A.3.4) that are part of the EPMP. These plans will be implemented to manage surface water drainage during construction to reduce sedimentation in nearshore waters.
2. Work windows: Work windows for inwater activities such as dredging and blasting will be determined in consultation with DFO. Mitigation for protecting migration, spawning and egg development of anadromous species such as eulachon will be implemented, where appropriate.
3. Blasting Management Plan: A Blasting Management Plan will be developed so that all blasting activities are concurrent with DFO Guidelines for Using Explosives in or Near Canadian Fisheries Waters.
4. Dredge technology: Dredging will use a system to limit sediment effects and underwater noise as appropriate. 5. Bubble curtains: Bubble curtains will be used, where practical, to limit underwater noise propagation. Follow-up and Monitoring: 1. Water Quality and Substrate Composition Monitoring Plan: The Water Quality and Substrate Composition Monitoring Plan includes monitoring of the sediment
plume in the marine environment during dredging and blasting 2. Species monitoring: Because of uncertainty in scientific data and the cultural importance of eulachon to Coastal Aboriginal groups, a three-year monitoring
program will track potential project environmental effects on eulachon populations. Rockfish will be surveyed at the marine terminal, to confirm that these fish have re-inhabited the affected areas, address habitat predictions and help with decisions about removing infrastructure.
Key Refer to Table 10-4.

Sec. 52 Application Volume 6B: Environmental and Socio-Economic Assessment (ESA) – Marine Terminal Section 10: Marine Fish
May 2010 Page 10-57
10.11 References
10.11.1 Literature Cited Appleby, J.A. and D.J. Scarratt. 1989. Physical Effects of Suspended Solids on Marine and Estuarine Fish and
Shellfish with Special Reference to Ocean Dumping: A Literature Review. Canadian Technical Report of Fisheries and Aquatic Sciences. Biological Sciences Branch, Department of Fisheries and Oceans. Halifax, NS.
Banner, A. and M. Hyatt. 1973. Effects of noise on eggs and larvae of two estuarine fish. Transactions of the American Fisheries Society 1: 134–136.
Beacham, T.D., D.E. Hay and K.D. Le. 2005. Population structure and stock identification of eulachon (Thaleichthys pacificus), an anadromous smelt, in the Pacific Northwest. Marine Biotechnology 7(4): 363–372.
Beckett, J. and K. Munro. 2010. Marine Fish and Fish Habitat Technical Data Report. Prepared for Northern Gateway Pipelines Inc. Calgary, AB.
Boehlert, G. and M. Yoklavich. 1984. Carbon assimilation as a function of ingestion rate in larval Pacific herring, Clupea harengus pallasi Valenciennes. Journal of Experimental Marine Biology and Ecology 79(3): 251–262.
Boehlert, G.W. and J.B. Morgan. 1985. Turbidity enhances feeding abilities of larval Pacific herring, Clupea harengus pallasi. Hydrobiologia 123(2): 161–170.
British Columbia Forest Service. 1998. Eulachon: A significant fish for First Nations communities. Forest Sciences, Prince Rupert Forest Region. Smithers, BC.
Cambria Gordon Ltd. 2006. Eulachon of the Pacific Northwest: A Life History. Prepared for Living Landscapes Program, Royal British Columbia Museum. Victoria, BC.
Committee on the Status of Endangered Wildlife in Canada (COSEWIC). 2002. COSEWIC Assessment and Status Report on the Bocaccio Sebastes paucispinis in Canada. Ottawa, ON.
Connor, M., J. Hunt and C. Werme. 2005. Potential Impacts of Dredging on Pacific Herring in San Francisco Bay. Prepared for the U.S. Army Corps of Engineers and Long-Term Management Strategy Science Assessment and Data Gaps Workgroup Herring Subcommittee. San Francisco, CA.
EcoMetrix Inc. 2006. Summary of 2006 eulachon study results and 2007 study design. Prepared for Eurocan Pulp and Paper Co., Kitimat, BC. Cited in Moody, M.F. 2008. Eulachon Past and Present. BSc thesis. University of British Columbia. Vancouver, BC.
Fisheries and Oceans Canada (DFO). 1999. Inner South Coast Chum Salmon, Pacific Region. Stock Status Report D6-09. Vancouver, BC.
Fisheries and Oceans Canada (DFO). 2001. Fish Stocks of the Pacific Coast. Fisheries and Oceans Canada. ISBN 0-662-30042-4. Ottawa, ON.
Fisheries and Oceans Canada (DFO). 2002. Toward an Inshore Rockfish Conservation Plan: A Structure for Continued Consultation. Consultation Discussion Document. Vancouver, BC.

Sec. 52 Application Volume 6B: Environmental and Socio-Economic Assessment (ESA) – Marine Terminal Section 10: Marine Fish
Page 10-58 May 2010
Fisheries and Oceans Canada (DFO). 2005. Pacific Region Integrated Fisheries Management Plan for Eulachon from April 1, 2005 to March 31, 2006. Fisheries and Oceans Canada, Pacific Region. Vancouver, BC.
Fisheries and Oceans Canada (DFO). 2008a. Stock Assessment on Central Coast Pacific Herring, Pacific Region. Canadian Science Advisory Secretariat. Science Advisory Report 2008/010. Vancouver, BC.
Fisheries and Oceans Canada (DFO). 2008b. Stock Assessment Report on Prince Rupert District Pacific Herring. Canadian Science Advisory Secretariat. Science Advisory Report 2008/011. Vancouver, BC.
Fisheries and Oceans Canada (DFO). 2008c. Pacific Region Integrated Fisheries Management Plan for Salmon in Northern B.C., June 1, 2007– May 31, 2008. Fisheries and Oceans Canada, Pacific Region. Vancouver, BC.
Fissel, D., J. Jiang and K. Borg. 2006. Spatial Distribution of Suspended Sediment Concentrations and Sediment Deposition from Marine Terminal Dredging Operations, Sidney, BC. Unpublished report prepared for Jacques Whitford Ltd. Burnaby, BC by ASL Environmental Sciences.
Fuiman, L.A., D.M. Higgs and K.R. Poling. 2004. Changing structure and function of the ear and lateral line system of fish during development. American Fisheries Society Symposium 40: 177–144.
Goertner, J.F., M.L. Wiley, G.A. Young and W.W. McDonald. 1994. Effects of underwater explosions on fish without swimbladders. Naval Surface Warfare Center. Cited in Hastings, M.C. and A.N. Popper. 2005. Effects of Sound on Fish. Report for the California Department of Transportation. Sacramento, CA.
Hart, J.L. 1973. Pacific Fishes of Canada. Fisheries Research Board of Canada. Bulletin 180.
Hastings, M.C. and A.N. Popper. 2005. Effects of sound on fish. Report for the California Department of Transportation. Contract No. 43A0139. Sacramento, CA.
Hawkins, S.J., P.E. Gibbs, N.D. Pope, G.R. Burt, B.S. Chesman, S. Bray. 2002. Recovery of polluted ecosystems: the case for long term studies. Marine Pollution Bulletin 54: 215–222.
Hay, D. and P.B. McCarter. 2000. Status of the eulachon (Thaleichthys pacificus) in Canada. Research Document 2000/145. Canadian Stock Assessment Secretariat, Government of Canada. Ottawa, ON.
Hay, D.E. and T.D. Beacham. 2005. Stock identification of eulachon (Thaleichthys pacificus), an anadromous smelt in the eastern Pacific. CM2005/K:14. Fisheries and Oceans Canada Pacific Biological Station. Nanaimo, BC.
Hay, D.E., P.B. McCarter and K.S. Daniel. 2001. Tagging of Pacific herring Clupea pallasi from 1936–1992: a review with comments on homing, geographic fidelity, and straying. Canadian Journal of Fisheries and Aquatic Sciences 58: 1356–1370.
Hay, D.E., P.B. McCarter, R. Kronlund and C. Roy. 1989. Spawning areas of British Columbia herring: a review, geographical analysis and classification. Volumes 1–6. Canadian Manuscript Report of Fisheries and Aquatic Sciences. MS 2019. Fisheries and Oceans Canada Pacific Biological Station. Nanaimo, BC.
Higgs, D.M. 2005. Auditory cues as ecological signals for marine fish. Marine Ecology Progress Series 287: 263–307.

Sec. 52 Application Volume 6B: Environmental and Socio-Economic Assessment (ESA) – Marine Terminal Section 10: Marine Fish
May 2010 Page 10-59
Ingle, R.M., A.R. Ceurvels and R. Leinecker. 1952. Chemical and Biological Studies of the Muds of Mobile Bay. Report to the Division of Seafoods. Alabama Department of Conservation. Montgomery, AL.
JASCO Research Ltd. 2006. Marine Acoustics (2006) Technical Data Report. Prepared for Northern Gateway Pipelines Inc. Calgary, AB.
JASCO Research Ltd. 2008. Eider Rock Project: Acoustic Environment – Acoustic Source Levels Expected During Construction and Operation. Prepared for Irving Oil. St. John, NB.
Johnson, D.W. and D.J. Wildish. 1982. Avoidance of dredge spoil by herring (C. harengus harengus). Bulletin of Environmental Contamination and Toxicology 26: 307–314.
Lagardere, J.P. 1982. Effects of noise on growth and reproduction in Crangon crangon in rearing tanks. Marine Biology 71: 177–186.
LGL Limited and JASCO Research Ltd. 2005. Assessment of the Effects of Underwater Noise from the Proposed Neptune LNG Project. Report No. TA4200-3. Prepared for Ecology and Environment, Inc. Arlington, VA.
Love, M.S. and A. York. 2005. A comparison of the fish assemblages associated with an oil/gas pipeline and adjacent seafloor in the Santa Barbara Channel, Southern California Bight. Bulletin of Marine Science 77(1): 101–117.
Love, M.S., D.M. Schroeder, W. Lenarz, A. MacCall, A.S. Bull and L. Thorsteinson. 2006. Potential use of offshore marine structures in rebuilding an overfished rockfish species, bocaccio (Sebastes paucispinis). Fishery Bulletin 104(3): 383–390.
Love, M.S., E. Brothers, D.M. Schroeder and W.H. Lenarz. 2007. Ecological performance of young-of-the-year blue rockfish (Sebastes mystinus) associated with oil platforms and natural reefs in California as measured by daily growth rates. Bulletin of Marine Science 80(1): 147–157.
Love, M.S., M. Yoklavich and L. Thorsteinson. 2002. The Rockfish of the Northeast Pacific. University of California Press. Berkley, CA.
MacDonald, R.W. 1983. The distribution and dynamics of suspended particles in Kitimat Fjord system. In R.W. MacDonald (ed.). Proceedings of a Workshop on the Kitimat Marine Environment. Canadian Technical Report of Hydrography and Ocean Sciences 18: 116–137.
McCarter, P.B. and D.E. Hay. 1999. Distribution of spawning eulachon stocks in the central coast of British Columbia as indicated by larval surveys. Research Document 1999/177. Canadian Stock Assessment Secretariat, Government of Canada. Ottawa, ON.
McCauley, R.D. 1994. Seismic Surveys. In J.M. Swan, J.M. Neff and P.C. Young (eds.). Environmental Implications of Offshore Oil and Gas Development in Australia - the Findings of an Independent Scientific Review. Australian Petroleum Exploration Association. Sydney, NSW, Australia. Cited in EnviroGulf Consulting. 2007. Bell Bay Pulp Mill Project: Appendix 3 of Witness Statement for Mr. David Balloch, Residual Impacts of Wharf Facility Construction and Operations.
Sec. 52 Application Volume 6B: Environmental and Socio-Economic Assessment (ESA) – Marine Terminal Section 10: Marine Fish
Page 10-60 May 2010
McCauley, R.D., J. Fewtrell, A.J. Duncan, C. Jenner, M.N. Jenner and J.D. Penrose. 2000a. Marine seismic surveys: Analysis and propagation of air-gun signals; and effects of air-gun exposure on humpback whales, sea turtles, fish and squid. No. R99-15. Prepared for Australian Petroleum Production and Exploration Association, Centre for Marine Science and Technology, Curtin University. Perth, Australia.
McCauley, R.D., J. Fewtrell, A.J. Duncan, M.N. Jenner, C. Jenner and R.I.T. Prince. 2000b. Marine seismic surveys: A study of environmental implications. Australian Petroleum Production and Exploration Association (APPEA) Journal 40: 692–708.
Miles, P.R., C.I. Malme, G.W. Shepard, W.J. Richardson and J.E. Bird. 1987. Prediction of drilling site-specific interaction of industrial acoustic stimuli and endangered whales, Beaufort Sea. BBN Rep. No. 6509. OCS Study MMS 87-0084. NTIS PB88-158498. Prepared by BBN Labs Inc. and LGL Ltd. King City, ON, for the Alaska Outer Continental Shelf (OCS) Region of the US Minerals Management Service. Anchorage, AK.
Minerals Management Service (MMS). 2004. Geological and Geophysical Exploration of Mineral Resources on the Gulf of Mexico Outer Continental Shelf. Final Programmatic Environmental Assessment. Minerals Management Service, US Department of the Interior. Cited in EnviroGulf Consulting. 2007. Bell Bay Pulp Mill Project: Appendix 3 of Witness Statement for Mr. David Balloch, Residual Impacts of Wharf Facility Construction and Operations.
Nedwell, J.R. and T.S. Thandavamoorthy. 1989. Laboratory measurement of the blast pressure underwater due to the underwater detonation of buried and freely-suspended explosive charges. Institute for Sound and Vibration Research (ISVR), Memorandum 698. University of Southampton, Southampton, UK.
Newcombe, C.P. and J.O. Jensen. 1996. Channel suspended sediments and fisheries: a synthesis for quantitative assessment of risk and impact. North American Journal of Fisheries Management 16(4): 693–727.
Pearson, W.H., J.R. Skalski and C.I. Malme. 1992. Effects of sounds from a geophysical survey device on behaviour of captive rockfish (Sebastes spp.). Canadian Journal of Fisheries and Aquatic Sciences 49(7): 1343–1356.
Popper, A.N., R.R. Fay and W.N.V. Tavolga. 2006. A history of fish bioacoustic studies. Journal of the Acoustical Society of America 120(5 pt. 2): 3055.
Richardson, W.J. and B. Malme. 1995. Zones of noise influence. In W.J. Richardson, C.R. Greene, B. Malme and D.H. Thomson (eds.). Marine Mammals and Noise. Academic Press. San Diego, CA.
Ritchie, D.E. 1970. Adult Fish. Project F Ref. No. 69-48. Chesapeake Biological Laboratory. University of Maryland. Solomons, MD.
Robinson, C.L.K. and I.D. Cuthbert. 1996. The Impacts of Backshore Developments on Nearshore Biota and Their Habitats. No. 2432/WP1192n. Triton Environmental Consultants Ltd. Nanaimo, BC.
Saetre, R. and E. Ona. 1996. Seismic investigations and harmful effects on fish eggs and larvae. An assessment of the possible effects on the level of recruitment. Fisken og Havet 8.
Schwarz, A.L. and G.L. Greer. 1984. Responses of Pacific herring, Clupea harengus pallasi, to some underwater sounds. Canadian Journal of Fisheries and Aquatic Sciences 41(8): 1183–1192.

Sec. 52 Application Volume 6B: Environmental and Socio-Economic Assessment (ESA) – Marine Terminal Section 10: Marine Fish
May 2010 Page 10-61
Schweigert, J. 2005. An Assessment Framework for Pacific Herring (Clupea pallasi) in British Columbia. Canadian Science Advisory Secretariat. Research Document 2005/083. Fisheries and Oceans Canada. Ottawa, ON.
Schweigert, J. and V. Haist. 2007. Stock Assessment for British Columbia Herring in 2006 and Forecasts of the Potential Catch in 2007. Canadian Science Advisory Secretariat. Research Document 2007/002. Fisheries and Oceans Canada. Ottawa, ON.
Stanley, R.D., P. Starr and N. Olsen. 2004. Bocaccio Update. Canadian Science Advisory Secretariat. Research Document 2004/027. Fisheries and Oceans Canada. Ottawa, ON.
Stoffels, D. 2001. Background Report – Eulachon in the North Coast. Government of British Columbia. Victoria, BC.
Triton Consultants Ltd. 2010. Marine Fisheries Technical Data Report. Prepared for Northern Gateway Pipelines Inc. Calgary, AB.
Triton Environmental Consultants Ltd. (Triton). 1993. MTBE Trans-shipment Project Environmental Baseline and Sensitivity – Final Report. Prepared for Alberta Envirofuels Inc. Kitimat, BC.
Vennesland, R., A. Harcombe, S. Cannings and L. Darling. 2002. Species Ranking in British Columbia: About More Than Just Numbers. Ministry of Sustainable Resource Management. Government of British Columbia. Victoria, BC.
Willson, M.F. and K.C. Halupka. 1995. Anadromous fish as keystone species in vertebrate communities. Conservation Biology 9(3): 489–497.
Wright, D.G. and G.E. Hopky. 1998. Guidelines for the Use of Explosives in or Near Canadian Fisheries Waters. Canadian Technical Report of Fisheries and Aquatic Sciences 2107. Fisheries and Oceans Canada. Ottawa, ON.
Yamanaka, K.L. and L.C. Lacko. 2001. Inshore Rockfish (Sebastes ruberrimus, S. maliger, S. caurinus, S. melanops, S. nigrocinctus, and S. nebulosus): Stock assessment for the West Coast of Canada and Recommendations for Management. Canadian Science Advisory Secretariat. Research Document 2001/139. Fisheries and Oceans Canada. Ottawa, ON.
Zebdu, A. and J.S. Collie. 1995. Effect of climate on herring (Clupea pallasi) population dynamics in the Northeast Pacific Ocean. In R.J. Beamish (ed.) Climate Change and Northern Fish Populations. Canadian Special Publication of Fisheries and Aquatic Sciences 121. Government of Canada Publications. Ottawa, ON.
10.11.2 Personal Communications Hannay, D. 2006. Vice-President, JASCO Research Limited. JASCO Research Limited, Sidney, BC. E-mail.
February 21, 2006.
Reagan, M. 2006. Resource Manager, Regional Fisheries. Fisheries and Oceans Canada, Resource Management. Prince Rupert, BC. Telephone conversation. February 13, 2006.

Sec. 52 Application Volume 6B: Environmental and Socio-Economic Assessment (ESA) – Marine Terminal Section 10: Marine Fish
Page 10-62 May 2010
10.11.3 Internet Sites British Columbia Conservation Data Centre. 2008. Species Summary: Thaleichthys pacificus. Available at:
http://a100.gov.bc.ca/pub/eswp/reports.do?index=0. Accessed: September 25, 2008.
CH2M Hill Consulting Company. 2000. Appendix A: Suspended Sediment Effects on Fish: A Literature Review. Available at: http://www.epa.gov/region8/superfund/mt/milltown/pdf/mrsBOappA.pdf. Accessed: June 2009.
District of Kitimat. 2006. Port of Kitimat. Available at: http://www.kitimat.ca/EN/main/business/port-of-kitimat.html. Accessed: January 18, 2006.
Environment Canada. 1998. National Environmental Indicator Species: Sustaining Marine Resources: Pacific Herring Fish Stocks. CP01-176-000 and CP01-179-000. FERC/EIS –0140 (SOE Bulletin No. 98-2). Available at: http://www.ec.gc.ca/soer-ree/English/Indicators/Issues/Herring/default.cfm. Accessed: 1998.
Fisheries and Oceans Canada (DFO). 2006. Kitimat Hatchery – Fish Production. Available at: http://www-heb.pac.dfo-mpo.gc.ca/facilities/kitimat/production_e.htm. Accessed: September 2008.
Fisheries and Oceans Canada (DFO). 2009. 2009 Salmon Stock Outlook. Available at: http://www-ops2.pac.dfo-mpo.gc.ca/xnet/content/salmon/webdocs/SalmonStockOutlook2009.htm. Accessed: March 2009.
Transport Canada. 2000. The Canadian Ballast Water Management Guidelines. Available at: http://www.tc.gc.ca/marinesafety/oep/environment/ballastwater/management.htm. Accessed: November 2008.

Sec. 52 Application Volume 6B: Environmental and Socio-Economic Assessment (ESA) – Marine Terminal Section 11: Marine Mammals
May 2010 Page 11-1
11 Marine Mammals Several marine species frequent the marine waters surrounding the Kitimat Terminal on a year-round or seasonal basis. Marine mammals have conservation status, as well as social, cultural, recreational and commercial value. Northern resident (NR) killer whale, North Pacific humpback whale and Steller sea lion are assessed. Whales are dependent on the acoustical environment for important life functions such as spatial orientation and migration, communication, predator and prey detection and locating conspecifics. Activities associated with the construction, operation and decommissioning of the Kitimat Terminal could affect marine mammals through:
• effects on behaviour due to underwater noise • effects on marine mammals from physical injury due to underwater blasting
Mitigation will include implementing a Blasting Management Plan, developing seasonal work windows, using bubble curtains where practical to reduce underwater noise propagation, implementing a marine mammal monitoring program and conducting detection surveys at the marine terminal (to prevent underwater construction activities taking place when marine mammals are in a predetermined safety radius or danger zone). With mitigation measures, blasting is unlikely to result in injury or direct mortality of marine mammals. Underwater project noise may cause habitat avoidance and behavioural change but is unlikely to adversely affect the viability or sustainability of marine mammal populations. After mitigation, the residual effects on marine mammals are expected to be not significant.
11.1 Setting Marine mammals occur throughout the region around the Kitimat Terminal, from Hecate Strait up to the mouth of Kitimat River. Less is known about the specific distribution and seasonality in Kitimat Arm but generally, seasonal changes in abundance are related to migratory patterns and the distribution of prey. Marine mammals that occur in Kitimat Arm fall into two diverse taxonomic orders:
• Cetacea, which includes:
• odontocete (toothed) whales (resident and transient killer whales, Pacific white-sided dolphins, Dall’s porpoises, harbour porpoises)
• mysticete (baleen) whales (humpback and grey whales)
• Carnivora, which includes:
• pinnipeds (seals and sea lions) • mustelids (river otters and sea otters)
Toothed whales are active hunters and their prey includes small fish, squid and other marine mammals. Common species include killer whales (resident and transient) and Dall’s and harbour porpoises. Northern resident killer whales are expected most frequently during June and July in pursuit of pre-spawning chinook salmon but may also be found in the area to prey on the large runs of chum salmon that arrive in September and October (Ford 2005, pers. comm.).

Sec. 52 Application Volume 6B: Environmental and Socio-Economic Assessment (ESA) – Marine Terminal Section 11: Marine Mammals
Page 11-2 May 2010
Dall’s and harbour porpoises are often reported within Kitimat Arm and are thought to be year-round residents (Wang et al. 1996; COSEWIC 2003a; LGL Limited Environmental Research Associates 2004). Typically, toothed whales are much smaller than baleen whales (with the exception of sperm whales) and have beak-like snouts (Evans and Raga 2001). Toothed whale communication calls are of moderate to high frequencies and many have highly developed echolocation systems operating at high frequencies (20 to 150 kHz).
Baleen whales are generally much larger than toothed whales (i.e., greater than 10 m) and feed through fringed plates (called baleen), which filter plankton and small fish. Available information suggests both humpback and grey whales occasionally frequent Kitimat Arm. Both species are migratory and generally occur along the British Columbia coastline during summer and early fall. However, recent studies suggest there may be resident (year-round) populations of both grey and humpback whales on the central British Columbia coast (Evans and Raga 2001; Hoelzel 2002; Calambokidis et al. 2008; Rambeau 2008). Humpback whales are seen in northern British Columbia waters throughout the year but are more abundant in summer and fall and have been observed in Douglas Channel from June to November. In contrast to toothed whales, evidence suggests that baleen whales are sensitive to low to medium noise frequencies and lack high frequency echolocation systems (Richardson et al. 1995).
Pinnipeds are less morphologically diverse than cetaceans and in many cases are relatively common. At least one of the three harbour seal subspecies can be found on all three of Canada’s coastlines (Baird 2001). On the Pacific coast, the harbour seal subspecies Phoca vitulina richardsi inhabits the inshore waters from central Baja California north to Bristol Bay, Alaska and west to the Aleutian Islands (Olesiuk 1999). Steller sea lions inhabit cool temperate and subarctic coastal waters of the North Pacific Ocean from southern California north to Bering Sea Strait and south along the Asian coastline (COSEWIC 2003b). Pinnipeds include harbour seals and Steller sea lions. Both species may occur year-round in Kitimat Arm. Unlike cetaceans, pinnipeds spend considerable time on land. Haul-outs and rookeries represent important habitat for both harbour seals and Steller sea lions. The closest semi-permanent Steller sea lion haulout to Kitimat Arm winter haulout on Ashdown Island (COSEWIC 2003b). Given that they pursue eulachon and pre-spawning salmon during the spring, summer and early fall, Steller sea lions are likely to be present in Kitimat Arm year-round.
Two mustelids occur in the Pacific Northwest: river otters and sea otters. River otters occur in streams, lakes, ponds, swamps, marshes, estuaries and along the exposed outer coast and are expected to occur throughout Kitimat Arm. Sea otters are not present in Kitimat Arm (Nichol 2006, pers. comm.) nor are they likely to establish in this habitat in the future because this species prefers more open ocean habitats. However, their coastal range is currently expanding in British Columbia, and it is possible that they will come to inhabit coastal areas within or near the CCAA.

Sec. 52 Application Volume 6B: Environmental and Socio-Economic Assessment (ESA) – Marine Terminal Section 11: Marine Mammals
May 2010 Page 11-3
11.2 Scope of Assessment for Marine Mammals
11.2.1 Key Project Issues for Marine Mammals Potential environmental effects on marine mammals during project construction, operations and decommissioning are:
• effects on behaviour due to underwater noise (and in some cases, in-air noise) • effects on marine mammals from physical injury due to underwater blasting
11.2.2 Selection of Key Indicators for Marine Mammals Three KIs are used for the assessment of residual and cumulative project environmental effects on marine mammals:
• northern resident (NR) killer whale • North Pacific (NP) humpback whale • Steller sea lion
These KIs are representative species of the three distinct major groups of marine mammals: toothed whales, baleen whales and pinnipeds.
Species occurrences in the general region of the Kitimat Terminal were determined through review of scientific literature, local knowledge, expert knowledge, field studies and professional experience. Marine mammals that have a low or very low probability of occurring within Kitimat Arm were not considered for selection as a KI (see Table 11-1). Marine mammals that have a medium or high probability of occurring within Kitimat Arm (e.g., harbour porpoise, Dall’s porpoise, harbour seals) but not selected as a KI, are adequately represented by the selected KIs. For example, the biology, physiology and ecology of harbour seals are sufficiently similar to Steller sea lion that an assessment of the latter is representative of the former. River otters, though likely present in Kitimat Arm, are not assessed because there is a low likelihood for interaction with routine terminal operations and construction effects will likely be of negligible magnitude for the regional population. Follow-up studies to be undertaken by Northern Gateway (see Section 11.9) will include collection of abundance and distribution information on this species to confirm the expectation of low likelihood interaction and negligible magnitude.
Due to the differences in biology and physiology among the three marine mammal groups, potential project environmental effects and cumulative effects on each KI are assessed separately.
Table 11-1 Marine Mammals Potentially Occurring in the PEAA
Species Occurrence
in PEAA1 COSEWIC Status SARA Schedule BC Status2 Toothed Whales Killer whale northern resident
Medium Threatened Schedule 1 Blue
Killer whale transient
Medium Threatened Schedule 1 Red
Killer whale offshore Very low Threatened Schedule 1 Blue

Sec. 52 Application Volume 6B: Environmental and Socio-Economic Assessment (ESA) – Marine Terminal Section 11: Marine Mammals
Page 11-4 May 2010
Table 11-1 Marine Mammals Potentially Occurring in the PEAA (cont’d)
Species Occurrence
in PEAA1 COSEWIC Status SARA Schedule BC Status2 Toothed Whales (cont’d) Sperm whale Very low Not at risk Not listed Blue Dall’s porpoise High Not at risk Not listed Yellow Harbour porpoise High Special concern Schedule 1 Blue Pacific white-sided dolphin
Medium Not at risk Not listed Yellow
Baleen Whales North Pacific right whale
Very low Endangered Schedule 2 Red
Grey whale Low Special concern Schedule 1 Blue Blue whale Very low Endangered Schedule 1 Red Fin whale Low Threatened Schedule 1 Red Sei whale Very low Endangered Schedule 1 Red Humpback whale Medium Threatened Schedule 1 Blue Minke whale Low Not at risk Not listed Yellow Pinnipeds Harbour seal High Not at risk Not listed Yellow Steller sea lion High Special concern Schedule 1 Blue Northern fur seal Very low Threatened Not listed Red Elephant seal Very low Not at risk Not listed Yellow Mustelids River otter High Not Assessed Not listed Yellow Sea otter Follow-up studies Special concern Schedule 1 (Special
Concern) Red
NOTES: 1 Occurrence is based on the following scale: high (likely year-round), medium (seasonally or annually), low (rarely)
to very low (not likely present in the PEAA). 2 See Section 11.2.5.3 for status definitions.
11.2.3 Spatial Boundaries for Marine Mammals For this assessment, three geographic areas have been identified: the marine project development area (PDA), the PEAA and the regional effects assessment area (REAA).
The marine PDA encompasses the marine terminal and a 150-m zone seaward of the berth structures (see Section 2, Figure 2-2).
The PEAA for marine mammals includes the largest area where routine project construction, operations and decommissioning activities have the potential to affect marine mammals. Underwater noise is likely to have the largest spatial influence on marine mammals of any activity at the marine terminal. Therefore the PEAA boundaries are based on marine areas where sounds generated by project activities could

Sec. 52 Application Volume 6B: Environmental and Socio-Economic Assessment (ESA) – Marine Terminal Section 11: Marine Mammals
May 2010 Page 11-5
exceed the level of noise above the animals hearing threshold (i.e., the level at which a sound is just detectable by an individual animal at a given frequency).
Underwater sounds are specific to the activities producing them. Similarly, hearing capabilities in marine mammals are species specific. Consequently, the PEAA may differ for each KI and is assessed separately. Broadly, the PEAA for all KIs encompasses the Kitimat Arm region (extending generally from Kitimat Estuary to the north end of Maitland Island).
The REAA for marine mammals relates to their population distribution and consequently can span large areas (e.g., from mid-Vancouver Island to southern Alaska for NR killer whale). The REAA for each KI encompasses the CCAA; the CCAA is the approximate area where marine mammals may encounter vessels in confined areas between the Kitimat Terminal and the open waters of Hecate Strait (see Volume 8B).
11.2.4 Temporal Boundaries for Marine Mammals This effects assessment for marine mammals encompasses all project phases that overlap with marine mammal distributions.
11.2.5 Regulatory Setting or Administrative Boundaries for Marine Mammals
11.2.5.1 Fisheries Act
The federal Fisheries Act, which provides for the protection of fish and fish habitat, considers marine mammals as fish. The Fisheries Act stipulates, “no person may carry out any work or undertaking that results in the harmful alteration, disruption or destruction of fish habitat” unless authorized by the Minister of Fisheries and Oceans. The guiding principle behind fish habitat management by Fisheries and Oceans Canada (DFO) is to achieve no net loss of the productive capacity of fish habitats (DFO 1986). The Marine Mammal Regulations (1993) under the Fisheries Act apply to the management and control of fishing for marine mammals in Canadian waters. For industrial projects, the regulations state, “no person shall disturb a marine mammal except when fishing for marine mammals under the authority of these regulations”.
The Marine Mammal Regulations are under review and a draft of proposed amendments was released in March 2005. These amendments largely address the management of tourism-related activities (DFO 2008).
11.2.5.2 Species at Risk Act
The Species at Risk Act (SARA) is a federal commitment to prevent “at risk” wildlife species from becoming extinct and to secure the necessary actions for their recovery. It provides for the legal protection of wildlife species and the conservation of biological diversity. The Committee on the Status of Endangered Wildlife in Canada (COSEWIC) ranks species according to conservation concern (i.e., Extinct, Extirpated, Endangered, Threatened, Special Concern, Not at Risk or Data Deficient). Schedule 1 of SARA, the official list of wildlife species at risk in Canada, includes species that are extirpated (a wildlife species that no longer exists in Canada, but exists elsewhere in the wild),

Sec. 52 Application Volume 6B: Environmental and Socio-Economic Assessment (ESA) – Marine Terminal Section 11: Marine Mammals
Page 11-6 May 2010
endangered, threatened and of special concern (DFO 2008). Once a species is listed on Schedule 1, protection and recovery measures are developed and implemented. If added to Schedule 1, populations and “critical habitats” of the species are legally protected. The Minister of Fisheries and Oceans is responsible for the management and protection of marine mammals. Under SARA (Government of Canada 2005), it is an offence to:
• kill, harm, harass, capture or take an individual of a listed species that is extirpated, endangered or threatened
• possess, collect, buy, sell or trade an individual of a listed species that is extirpated, endangered or threatened, or its part or derivative
• damage or destroy the residence of one or more individuals of a listed endangered or threatened species or of a listed extirpated species if a recovery strategy has recommended its reintroduction
Projects that require an environmental assessment under an Act of Parliament must take into account the project environmental effects on listed wildlife species and their critical habitats. The assessment must include recommendations for measures to avoid or reduce adverse environmental effects and plans to monitor the effect of the Project. The project plan must respect recovery strategies and action plans.
11.2.5.3 British Columbia Wildlife Act
The British Columbia Conservation Data Centre (BCCDC), which is part of the Environmental Stewardship Division in the British Columbia Ministry of Environment, produces lists of species and ecosystems at risk in British Columbia.
Species are assigned to either a red, blue or yellow list based on their provincial Conservation Status Rank (SRANK), which is assigned by the BCCDC and flags the species or communities that require investigation.
The red list includes any ecological community, indigenous species or subspecies that is extirpated, endangered or threatened in British Columbia. Extirpated elements no longer exist in the wild in British Columbia, but do occur elsewhere. Endangered elements are facing imminent extirpation or extinction. Threatened elements are likely to become endangered if limiting factors are not reversed. Red-listed species and sub-species may be legally designated as, or maybe considered candidates for legal designation as Extirpated, Endangered or Threatened under the Wildlife Act (BC Ministry of Environment 2007, Internet site).
The blue list includes species of special concern (formerly vulnerable) in British Columbia and the yellow list includes species and ecological communities that are secure.
11.2.6 Definition of Environmental Effect Attributes for Marine Mammals Effects on marine mammals are characterized using standardized evaluation criteria for assessing environmental effects, as defined below.

Sec. 52 Application Volume 6B: Environmental and Socio-Economic Assessment (ESA) – Marine Terminal Section 11: Marine Mammals
May 2010 Page 11-7
Direction
• positive: enhancement of population • adverse: detrimental effect to population
Magnitude
The magnitude of an effect is described qualitatively for each KI as negligible, low, moderate and high. Definitions for each KI are given in the appropriate characterization tables.
Geographic Extent
The geographic extent is defined as the cumulative physical area over which there will be an effect expressed as a distance from the marine terminal.
Duration
The duration is the length of exposure to a single occurrence of the effect.
Frequency
• The number of times the effect occurs per day.
Reversibility
• reversible: The KI is able to recover from the effect to a state similar that which existing prior to being affected. Depending on the effect considered, reversibility may be assessed on both an individual (immediate) and population (long-term) level.
• irreversible: The KI is unable to recover from the effect.
11.2.7 Determination of Significance for Marine Mammals A significant residual environmental effect is one that will affect the long-term viability of the population of a KI or impede its recovery.
An environmental effect that affects an individual or group of each KI (or their habitat) in a manner similar to natural variation is not significant.
11.3 General Mitigation Measure for Marine Mammals To reduce potential environmental effects of the Project on marine mammals, Northern Gateway will:
• implement a marine mammal monitoring program at the marine terminal. During inwater construction activities, such as dredging and drilling, trained marine mammal observers (MMOs) will monitor a predetermined safety radius around the acoustic source. If a marine mammal enters the safety radius, construction activity will temporarily stop, until the mammal has moved outside the safety radius.

Sec. 52 Application Volume 6B: Environmental and Socio-Economic Assessment (ESA) – Marine Terminal Section 11: Marine Mammals
Page 11-8 May 2010
• develop work windows for inwater site preparation and construction activities in consultation with the DFO. Work windows will take into consideration seasonal marine mammal diversity and abundance in the PEAA.
• conduct marine mammal detection surveys. During blasting activities, if a mammal is detected in a predetermined danger zone, blasting will be suspended, until the mammal is beyond the danger zone. This is to reduce the exposure of marine mammals to blasting effects.
Presently, best available information (i.e., studies conducted by Northern Gateway, scientific literature, government databases) and ecological theory (lower productivity in winter months) suggests that marine mammal abundance and diversity in Kitimat Arm are reduced during winter. To confirm this assumption, follow-up studies will be undertaken.
Northern Gateway will develop a Blasting Management Plan, as per the requirements of NRCan, and will consult with DFO in developing this plan to avoid and reduce potential environmental effects on marine mammals from underwater blasting. The Blasting Management Plan referred to throughout this section details certain specifics of the plan as it relates to marine mammals. Further details will be developed in conjunction with the Blasting Management Plan outlined in Volume 7A, Appendix A.3.9. The Blasting Management Plan addresses aspects such as:
• efforts to reduce overpressure, including optimum use of explosives for rock blasting. Appropriate measures, such as those recommended by Jordan et al. 2005, will be identified in consultation with DFO.
• use of underwater bubble curtains to contain shock waves from blasting
• identifying the zone of potential physical injury to marine mammals (danger zone), which will be calculated before construction
• regular marine mammal detection surveys of the identified zone of potential physical injury
Based on information from the marine mammal detection surveys, detonation will not take place while a marine mammal is inside the predetermined danger zone. This area will be determined by predictive acoustic modelling, based on the blast design (charge, delay, depth) and the hearing of marine mammals known to occur in the PEAA. The duration of marine mammal detection surveys before and after blasting will be consistent with recent records of presence, peak timing within the PEAA, species biology (e.g., dive duration) and optimal detection conditions (weather, visibility).
11.4 Assessment Methods for Marine Mammals
11.4.1 Data Sources and Fieldwork Data sources include government documents, journal articles, information from regulatory sources and personal communications. It is well known that killer whales are highly valued by Aboriginal peoples.
Field programs included dedicated aerial and vessel-based marine mammal surveys.
For further information regarding data sources, see the Marine Mammals Technical Data Report (TDR) (Wheeler et al. 2010) and Marine Acoustics (2006) TDR (JASCO 2006).

Sec. 52 Application Volume 6B: Environmental and Socio-Economic Assessment (ESA) – Marine Terminal Section 11: Marine Mammals
May 2010 Page 11-9
Literature specific to marine mammals in the PEAA is limited in nature. Two primary sources of information on marine mammal abundance and distribution are used to inform this assessment: field studies conducted for Northern Gateway and data from the British Columbia Cetacean Sightings Network (BCCSN). Records of marine mammal sightings in the PEAA from 1985 to 2009 were obtained by the BCCSN and are presented in the Marine Mammals TDR.
From 2005 to 2009, Northern Gateway conducted 10 marine mammal surveys: two dedicated aerial surveys and eight vessel-based surveys (six dedicated surveys, two opportunistic surveys). For further information, see the Marine Mammals TDR. Information from these surveys has provided a general understanding of distribution patterns of some species over several seasons and limited information on relative abundance, although effort specific to the PEAA was limited. As with the majority of marine mammal studies, it is highly unlikely that all marine mammals present in the study area, even under optimal conditions, would be detected because of limitations in available marine mammal survey procedures and because many marine mammals are underwater for more than 90% of the time.
Information provided by the BCCSN similarly provided general information on typical species detected in the region as collected by a variety of vessel-based observers (un-trained and trained). Evaluation of information from this source was qualitative in nature given that quantitative analyses were not possible because of limitations relating to survey effort (e.g., type, amount and season).
The most important data gaps relate to seasonal timing, fine scale habitat use (e.g., what are the animals doing and where), value of habitat to populations (e.g., feeding, breeding, social habitat), potential concentration areas and abundance estimates. Many species of marine mammals are highly migratory and, therefore, habitat use can vary dramatically throughout the year. Consequently, sampling frequency throughout the year must be adequate to understand such seasonal variability. In addition, several species are rarer than others (e.g., NR killer whales); hence, the likelihood of their detection is notably lower than for other species. For these reasons, and others, further studies by Northern Gateway will be conducted to fill information gaps and contribute to more knowledge concerning marine mammal abundance and seasonal distribution in the PEAA (see Section 11.9 for further details).
In addition to limited baseline data, many long-term and population-level effects (e.g., underwater noise) are not known. Effects of human-induced sound exposure on marine mammals are difficult to assess for a variety of reasons. Basic biological acoustic information for many marine mammals is not available, in part because of logistical constraints associated with controlled experiments on wild, elusive animals. For example, much information on the hearing capabilities of large baleen whales is speculative in nature. In many cases, it is challenging to obtain permits required to study endangered, threatened or important marine mammal species.
Available information on behavioural reactions of marine mammals is typically based on one or a few animals of select species in a captive setting (Kastak and Schusterman 1998; Kastelein et al. 2005) and may not be suited to provide population-level information on similar species. Therefore, there are more published accounts of short-term behavioural responses to noise by marine mammals than of direct auditory or physiological effects (Southall et al. 2007). Further, a difficulty with evaluating the behavioural response of an animal is strongly affected by the context of exposure, motivation and conditioning of the animal (Southall et al. 2007). Short-term, avoidance responses can be relatively straightforward to measure, however more relevant to individual wellbeing and fitness and
Sec. 52 Application Volume 6B: Environmental and Socio-Economic Assessment (ESA) – Marine Terminal Section 11: Marine Mammals
Page 11-10 May 2010
population-wide parameters are the long-term physiological and distributional effects. The influence of these data gaps are addressed in this assessment.
11.4.2 Analytical Techniques for Marine Mammals Underwater acoustic models were developed to predict sound propagation within the PEAA from project activities. Information on underwater noise from berthed tankers and was developed using generic tankers.
This modelling was completed in 2006 but since then the marine terminal location has changed, resulting in the location of the sound source being displaced from the current location of the berths by 500 m. This discrepancy does not change the results of the assessment.
11.5 Overview of Project Effects on Marine Mammals Potential environmental effects from the construction, operation and decommissioning of the Project are similar for all marine mammals. The following overview of potential environmental effects (effects on behaviour due to underwater noise and effects from physical injury due to underwater blasting) provides information relevant to all marine mammals likely to be encountered during the Project.
The species chosen as KIs for this assessment differ notably in their physiology, ecology and distribution; therefore, each potential effect is discussed in relation to the specific KI.
11.5.1 Effects on Behaviour due to Underwater Noise
11.5.1.1 General Noise Background and Definitions
Language and concepts associated with underwater noise are complex; therefore, this section explains basic acoustic terminology and provides background information on underwater noise. For specific definitions associated with sound, also see the Glossary.
Sound travels as a pressure wave through the water column. It is generated from a source (e.g., a ship’s engine or propeller) and detected by a receiver (e.g., the mammalian ear) as a change in pressure. Water is an extremely efficient medium through which sound can travel great distances.
Sound transmission (passage of sound through water) is affected by several factors, including:
• water temperature
• salinity
• pressure
• reflection and refraction off discontinuity gradients (e.g., seasonal layering of water with different properties)
In general, sound level decreases with increasing distance from the source. A marine organism’s ability to perceive the emitted sound depends on the species’ hearing threshold, as well as on the ambient (baseline) noise of the ocean environment. The point at which an animal can begin to detect sound is called its

Sec. 52 Application Volume 6B: Environmental and Socio-Economic Assessment (ESA) – Marine Terminal Section 11: Marine Mammals
May 2010 Page 11-11
auditory threshold. In addition to natural biological sounds, environmental factors such as wind, precipitation and thermal activity, as well as other anthropogenic sounds such as industrial activities, can act to mask and reduce the range over which sounds may be detected.
There are two primary factors to consider in an analysis of underwater acoustics: frequency and sound level. The frequency of sound waves is perceived by humans as pitch, for example, each note on a piano corresponds to a different frequency. Typical frequencies associated with underwater acoustics range between 10 hertz (Hz) and 1 megahertz (MHz) and species vary in the span of frequencies over which they can hear.
Sound pressure levels in a liquid medium may be reported in a variety of ways. The decibel is used to quantify sound levels relative to some 0-decibel (dB) reference level. The underwater standard reference level for a sound source is 1 μPa (micropascal) at 1 m. Received sound is referenced as the sound is referenced as the sound level re 1 μPa; however, the reference level may also be set to an animal’s auditory threshold. For example, several species of dolphins and other toothed whales are renowned for their acute hearing sensitivity in the frequency range of 5 to 50 kilohertz (kHz). Within this range, they have hearing thresholds between 30 and 50 dB re 1 μPa. Therefore, in this example, a certain sound level may be referred to as either 31 dB re 1 μPa or as 1 dB re threshold. Note that hearing thresholds are dependent on the frequency of the sound and are different for each species. This example is for illustrative purposes only and the actual calculation of hearing thresholds is more involved.
11.5.1.2 Baseline Acoustic Conditions
Based on sound measurements in the PEAA, the lowest broadband levels approached 84 dB re µPa (10 Hz to 20 kHz). The ambient noise levels in the 10 to 100 Hz band were as low as 73 dB re µPa. Levels in the 100 Hz to 1 kHz band and levels in the 1 to 20 kHz band both reached as low as 77 dB re µPa. Noise at these lowest levels is attributed to continuous click noise from fish or shrimp.
The lowest ambient sound levels near the Kitimat Terminal in October 2005 approached 84 dB re 1 µPa (broadband, 10 Hz to 20 kHz) (for further information, see the Marine Acoustics [2006] TDR). Field recordings detected five vessel signatures; four were recorded as distant low-level events that produced broadband levels less than 100 dB re 1 µPa, with spectral energy restricted to above 100 Hz. A fifth vessel caused a one-minute sound level average to exceed 120 dB re 1 µPa. This event also had maximum spectral content at very low frequencies between 30 and 40 Hz.
Commercial vessels regularly navigate in the PEAA and consequently contribute to underwater noise. According to the Port of Kitimat, 102 deep-sea vessels, generally ranging from 40,000 to 50,000 deadweight tonnes (dwt), called at the Port of Kitimat in 2007, which is a substantial reduction from the peak volumes in the order of 300 calls per year in 1992 to 1993 (Port of Kitimat Vessel Traffic 1978 to 2007).
There are two commercial marinas and marine structures associated with the following projects within the PEAA: Rio Tinto Alcan Primary Metal British Columbia aluminum smelter, Eurocan Pulp and Paper Co. plant and terminal, Methanex Corporation plant and terminal, and Arthon Construction Ltd. and Sandhill Materials Sandhill Project. A number of commercial fishing vessels and recreational vessels also operate

Sec. 52 Application Volume 6B: Environmental and Socio-Economic Assessment (ESA) – Marine Terminal Section 11: Marine Mammals
Page 11-12 May 2010
within the PEAA, with most traffic in summer. Presently the Methanex Corporation facility imports condensate to their pre-existing terminal at the head of Kitimat Arm.
All vessels operating within the PEAA will contribute sound to the marine environment. In general, source levels for individual ships range from 140 dB re 1 μPa at 1 m for small fishing vessels to 195 dB re 1 μPa at 1 m for fast-moving supertankers (Hildebrand 2003). (For the assessment of the environmental effects of vessel operations when not berthed at the Kitimat Terminal, see Volume 8B.)
Three other projects within or near the PEAA are expected to contribute underwater noise. These projects have received regulatory approval but construction has not yet begun (as of October 2009). Both the Kitimat LNG and the Arthon Construction Ltd. and Sandhill Materials projects involve constructing and operating marine terminals.
Regarding the Kitimat LNG Inc. terminal, underwater noise generated by berth construction in nearby Bish Cove is expected to differ from the Kitimat Terminal for frequencies, distribution and intensity. Construction of the Kitimat LNG Inc. terminal may include vibro-densification and presumably pile driving, two activities not required for the Kitimat Terminal. Vibro-densification produces underwater noise similar in nature to clamshell dredging (Jacques Whitford AXYS 2008). Pile driving (by hammer) is known to produce notably elevated source levels (e.g., 200+ dB re 1 µPa at 1 m) which are capable of travelling large distances (Richardson et al. 1995). The Kitimat LNG Inc. terminal will be approximately 4 km from the Kitimat Terminal.
It is not known whether there will be overlap between construction schedules of the Kitimat LNG Inc. terminal and the Project. Large (up to 250,000 dwt) liquefied natural gas (LNG) carriers on standby at the Kitimat LNG Inc. terminal will produce underwater noise similar to that anticipated for tankers at the Kitimat Terminal.
The plan for the Rio Tinto Alcan Primary Metal British Columbia aluminum smelter, 2 km south of Kitimat, is to operate up to one vessel (60,000 to 80,000 dwt) per week (four carriers per month).
11.5.1.3 Characterization of Underwater Noise
During project construction, operations and decommissioning, underwater noise will be produced by a variety of activities. These will include inwater infrastructure site preparation and construction (dredging and pile drilling) and berthed tankers at the marine terminal. Source levels related to these activities have been measured during previous construction projects (see Table 11-2). For details on the dredging and berthed vessel source levels used in this assessment, see the Marine Acoustics (2006) TDR.
Table 11-2 Estimated Source Levels of Project Activities Project Activity
Details
Source Level
(dB re 1 µPa at 1 m) Dredging Clamshell dredge 161 1
Pile drilling Various vessel-based drilling operations 154–191 2
Tug Pushing/pulling; slow 145–175 1
Tanker On standby (at berth) 168 1
SOURCES: 1 Marine Acoustics (2006) TDR; 2 Richardson et al. 1995.

Sec. 52 Application Volume 6B: Environmental and Socio-Economic Assessment (ESA) – Marine Terminal Section 11: Marine Mammals
May 2010 Page 11-13
In general, underwater sounds from construction activities have the highest acoustic energy at low frequencies (less than 1 kHz; Richardson et al. 1995). To assess the zone of audibility of construction sounds on marine mammals, sound propagation was modelled for a clamshell dredge operating at the Kitimat Terminal (see Figure 11-1). To assess the zone of audibility of operational sound on marine mammals, sound propagation was modelled for a tanker on standby at the Kitimat Terminal (see Figure 11-2).

200 m
100
m
100 m
200 m
100
m
300 m
200
m
100
m
Kitimat
Minette Bay
KitamaatVillage
KitimatTerminal
K i t i
m a
t A
r m
BishCove
EmsleyCove
EmsleyPoint
CostePoint
CosteIsland
ClioBay
GobeilBay
Kitimat River
CreekBish
200 m
100
m
Pipeline Route
Security Fence
Terrestrial PDA
Marine PDA
Sound Level(dB re µPa)
85
90
95
100
105
110
115
120
125
130
135
140
Bathymetric Contour (100 m)
Railway
Road
NP
Jacques Whitford AXYS Ltd.
FIGURE NUMBER:
PROJECTION:
CONTRACTOR: DATE:
AUTHOR: APPROVED BY:PREPARED FOR:PREPARED BY: SCALE:
Predicted Sound Levelsfrom Dredging at Kitimat Terminal
ENB R ID GE N OR TH ER N GA T EW A Y P RO J EC T 11-1
NAD 83DATUM:
1:110,000
UTM 9
CM
100
m
200
m
Inset1:40,000
KitimatTerminal
0 1 2 3
Kilometres
JWA-1048334-1578
REFERENCES: NTDB Topographic Mapsheets provided by the Majesty the Queen in Right of Canada, Department of Natural Resources. All rights reserved.
20090911
R:\2
009F
isca
l\104
8334
_Nor
ther
nGat
eway
_ES
A_2
009Reference: Pipeline Route R

200 m
100
m
100 m
200 m
100
m
300 m
200
m
100
m
Kitimat
Minette Bay
KitamaatVillage
KitimatTerminal
K i t i
m a
t A
r m
BishCove
EmsleyCove
EmsleyPoint
CostePoint
CosteIsland
ClioBay
GobeilBay
Kitimat River
CreekBish
200 m
100
m
Pipeline Route
Security Fence
Terrestrial PDA
Marine PDA
Sound Level
(dB re µPa)
85
90
95
100
105
110
115
120
125
130
135
140
145
150
Bathymetric Contour (100 m)
Railway
Road
NP
Jacques Whitford AXYS Ltd.
FIGURE NUMBER:
PROJECTION:
CONTRACTOR: DATE:
AUTHOR: APPROVED BY:PREPARED FOR:PREPARED BY: SCALE:
ENB R ID GE N OR TH ER N GA TEW A Y PR OJ EC T 11-2
NAD 83DATUM:
1:110,000
UTM 9
CM
100
m
200
m
Inset1:40,000
KitimatTerminal
Predicted Sound Levels from a Tankeron Standby at Kitimat Terminal
0 1 2 3
Kilometres
JWA-1048334-1579
REFERENCES: NTDB Topographic Mapsheets provided by the Majesty the Queen in Right of Canada, Department of Natural Resources. All rights reserved.
20100305
R:\2
009F
isca
l\104
8334
_Nor
ther
nGat
eway
_ES
A_2
009Reference: Pipeline Route R

Sec. 52 Application Volume 6B: Environmental and Socio-Economic Assessment (ESA) – Marine Terminal Section 11: Marine Mammals
Page 11-16 May 2010
11.5.1.4 Potential Effects of Underwater Noise on Marine Mammals
Records of direct physiological auditory effects on marine mammals from underwater sound, induced by dredging or vessels operating on standby were not found. However, potential effects of exposure to elevated sound levels include permanent threshold shifts (PTS), temporary threshold shifts (TTS), behavioural avoidance and auditory masking (Richardson et al. 1995; Nowacek et al. 2007; Southall et al. 2007).
PTS occur when high-intensity sounds cause irreversible physiological injury to the auditory apparatus (Ward 1997; Southall et al. 2007). Depending on the level of exposure, PTS may represent partial or total hearing loss (Ward 1997; Southall et al. 2007). By comparison, TTS, also commonly referred to as auditory fatigue, does not involve any permanent hearing loss (Ward 1997; Southall et al. 2007). TTS occur when sounds of sufficient intensity or duration cause a temporary increase in the absolute auditory threshold loss (e.g., lowest levels capable of sound detection) (Ward 1997; Southall et al. 2007). TTS may last for several seconds to several minutes (Ward 1997; Southall et al. 2007).
Marine mammals are highly dependent on their ability to perceive and discriminate sounds in the marine environment. Sound production and audition are important in spatial orientation and migration, communication, predator and prey detection, courtship displays and mating and locating conspecifics (Richardson et al. 1995; Nowacek et al. 2004). Depending on the species in question, TTS and PTS may lead to (Richardson et al. 1995; Nowacek et al. 2004):
• reduced foraging efficiency • increased predation • reduced fecundity • increased energy expenditure
Reduced hearing ability may also hamper a marine mammal’s ability to detect approaching vessels, leading to an elevated risk of vessel strikes (Terhune and Verboom 1999). (For an assessment of the effects of vessel strikes, see Volume 8B, Section 10.)
Sound levels capable of inducing TTS and PTS in marine mammals are not well established. TTS has only been observed in a few species of pinnipeds and small toothed whales (Southall et al. 2007). PTS has not been observed in any marine mammal (Southall et al. 2007). Estimates of TTS- and PTS-inducing sound levels (i.e., noise exposure levels) are often obtained by extrapolating from known or predicted marine mammal auditory thresholds (Richardson et al. 1995; Southall et al. 2007). However, as much of our knowledge of PTS and TTS is based on research of hearing in terrestrial mammals, estimated marine mammal noise exposure levels are largely speculative (Richardson et al. 1995; Southall et al. 2007). The most recent estimates of TTS- and PTS-inducing sound levels are those proposed by Southall et al. (2007). These values are based on a comprehensive analysis of existing research and are intentionally conservative. Furthermore, these values differ by the type of sound (e.g., single pulse in contrast with non-pulse) and by the functional hearing group (i.e., low, mid and high frequency cetaceans).
Exposure to sound levels below those capable of inducing TTS are unlikely to affect auditory thresholds, but may elicit behavioural effects (Richardson et al. 1995; Nowacek et al. 2004; Southall et al. 2007). Potentially adverse behavioural effects include avoidance of habitat, increased energy expenditure (e.g., flight response) and reduced foraging efficiency. The Federal Register (2005) suggests that sound

Sec. 52 Application Volume 6B: Environmental and Socio-Economic Assessment (ESA) – Marine Terminal Section 11: Marine Mammals
May 2010 Page 11-17
pressure levels in excess of 120 dBRMS re 1 µPa (for continuous sound) may elicit behavioural response in marine mammals. However, because of differences in biology and physiology, different marine mammal species may exhibit behavioural responses at various source levels. For this reason, behavioural responses are discussed separately for each KI.
In addition to inducing behavioural responses, anthropogenic sounds may interfere with a marine mammal’s ability to hear natural sounds of similar frequencies. This phenomenon is known as auditory masking (Richardson et al. 1995; Nowacek et al. 2004). Certain natural sounds are important for the survival and health of marine mammals. These include calls from conspecifics and predators, echolocation clicks from odontocetes (e.g., harbour porpoises) and environmental sounds from sources such as ice and waves. Constant anthropogenic sounds, such as those arising from vessel traffic, are more likely to cause masking than intermittent sounds, such as impact pile driving (Richardson et al. 1995; Nowacek et al. 2004). Intermittent sounds allow a certain degree of hearing and communication between sound pulses (Richardson et al. 1995; Nowacek et al. 2004). For masking to occur, both the anthropogenic sound and the masked sound (e.g., marine mammal calls, environmental sounds) must have similar acoustic frequencies.
11.5.1.5 Other Effects from Underwater Noise
Modelling of underwater noise for the Project (see Marine Acoustics [2006] TDR) predicts that noise levels capable of causing physical auditory damage to marine mammals will not be produced during routine activities associated with construction, operations or decommissioning of the marine terminal (i.e., dredging or vessels on standby).
Marine mammals use underwater noise for several reasons (e.g., to communicate, detect prey) and hence noise from routine terminal activities may mask noises produced, or heard, by marine mammals. This may in turn reduce the ability of a marine mammal to communicate with others or detect prey, for example.
In theory, communication masking will be possible wherever noise levels from routine terminal activities are greater than background (ambient) levels and when they are detectable by marine mammals. This assessment provides the zone of audibility on a KI basis for sounds likely to be generated by activities related to project dredging or berthed tankers on standby. However, very little is known about the long-term environmental effects of communication masking by anthropogenic underwater noise and, consequently, these are not considered further.
11.5.2 Effects on Marine Mammals from Physical Injury due to Blasting
11.5.2.1 Blasting Activity
Construction of the Kitimat Terminal will include both onshore and underwater blasting. Onshore blasting may be used in road development, site grading and tank terminal construction.
Due to steeply sloping bathymetry at the marine terminal and the requirement for seating of berth structure pilings, underwater blasting will be used prior to pile installation.

Sec. 52 Application Volume 6B: Environmental and Socio-Economic Assessment (ESA) – Marine Terminal Section 11: Marine Mammals
Page 11-18 May 2010
Three approved projects in the PEAA may also require underwater blasting. At present, it is not known if the Kitimat LNG Inc. or Arthon Construction Ltd. and Sandhill Materials projects will proceed, and if so whether they will employ underwater blasting as a construction technique; however, it is expected that blasting and other construction activities for these projects would be completed before construction of the Kitimat Terminal begins.
11.5.2.2 Characterization of Potential Effects of Blasting on Marine Mammals
Blasting in or near water produces post-detonation compressive shock waves that are characterized by a rapid rise to a high peak pressure followed by a rapid decay to below ambient hydrostatic pressure (Wright and Hopky 1998). Potential environmental effects of blasting on marine mammals include:
• direct mortality • injury to internal organs • auditory damage • behavioural responses
Marine mammals close to explosive detonations may incur damage to gas-containing organs (Keevin and Hempen 1997). Shock waves produced by blasting are spread to relatively small distances; hence, severe injuries typically occur in a localized area close to the blast source. Wright and Hopky (1998) calculated that slight injuries to lungs and intestines of marine mammals were possible up to 500 m under certain blasting conditions (Wright and Hopky 1998). Safe ranges from underwater explosions for marine mammals are dependent on the size of the marine mammal, as well as the depth and type of explosive charge (Richardson et al. 1995).
In consultation with DFO, underwater blasting for the Kitimat Terminal will comply with DFO guidelines for underwater blasting, which are intended to limit effects on marine mammals (Wright and Hopky 1998).
11.5.3 Effects Not Assessed
11.5.3.1 Sedimentation
Onshore and inwater mitigation measures for managing suspended sediment (e.g., settlement ponds and silt curtains, see Section 7) will reduce potential project environmental effects on marine mammals. In addition, the marine terminal site is currently subject to highly variable and often elevated levels of suspended sediment originating from Kitimat River (see Section 7). Consequently, environmental effects on marine mammals from temporary changes to water quality (increased sediment suspension and sediment quality) during project construction are minor. Therefore, potential environmental effects of changes in water quality on marine mammals are not considered further.
11.5.3.2 Effects on Prey
Northern resident (NR) killer whales primarily consume salmonids, in particular chinook salmon, so salmon migrating to and from Bish Creek and Kitimat River may be an important food source. Therefore, project activities that affect salmon have the potential to affect NR killer whales. Potential environmental

Sec. 52 Application Volume 6B: Environmental and Socio-Economic Assessment (ESA) – Marine Terminal Section 11: Marine Mammals
May 2010 Page 11-19
effects relating to chum salmon are discussed in the marine fish section (Section 10) and results of this analysis suggest minor effects. It is therefore assumed that potential effects from the Project on chinook salmon (present in the PEAA) will be similarly minor. Data specific to the distribution, abundance and important spawning rivers will be collected by Northern Gateway in association or consultation with participating local Aboriginal groups and the DFO.
11.5.3.3 Atmospheric and Liquid Effluent Emissions from Routine Operational Activities
The marine ecological risk assessment (marine ERA; see Section 14) examines the risk that the routine operational activities at the Kitimat Terminal may pose to the ecological health of the marine environment in Kitimat Arm, including marine mammals. The marine ERA evaluates the ecological risks from:
• volatile hydrocarbon and trace element emissions from tanks and valves
• hydrocarbon and trace element emissions from marine engine operations while ships are berthed
• liquid effluent emissions from the marine terminal arising from normal operations and site-wide storm water runoff
Mammalian KIs listed in the marine ERA that are considered to be exposed to chemicals of potential concern (COPC) are the harbour porpoise and the Steller sea lion (see Section 14). The magnitude of effects is assessed as negligible to low.
11.6 Northern Resident Killer Whale
11.6.1 Scope of Assessment for Northern Resident Killer Whale The NR killer whale is a KI for toothed whales because, overall, it is a relatively well studied species, is listed as threatened on Schedule 1 of SARA (COSEWIC 2008; BCCDC 2009, Internet site) and is known to frequent the PEAA (Ford 2005, pers. comm.). Detailed understanding of NR killer whale critical habitat was recognized as a data gap in the national recovery strategy (DFO 2008). Potential critical habitats listed include Caamaño Sound and Whale Channel (within or near the CCAA; DFO 2008).
As top predators, killer whales rely on successively lower trophic levels for food and, therefore, their flourishing is a measure of ecosystem health. For this assessment, NR killer whales are considered a representative species of toothed whales found within the PEAA.
Potential environmental effects of the Project on NR killer whales were determined based on the scope of factors from the Joint Review Panel, federal and provincial regulatory requirements for assessment of environmental effects, and issues raised by the public and participating Aboriginal groups, as well as professional judgment. For a summary of the potential environmental effects on NR killer whales, see Table 11-3.

Sec. 52 Application Volume 6B: Environmental and Socio-Economic Assessment (ESA) – Marine Terminal Section 11: Marine Mammals
Page 11-20 May 2010
Table 11-3 Potential Environmental Effects on Northern Resident Killer Whale
This table identifies the potential environmental effects on NR killer whale that are assessed in this section of the ESA. Each of these environmental effects is discussed in more detail later in this section. Recommendations for mitigation and, if required, follow-up and monitoring are also provided. With the implementation of these mitigation measures where appropriate, the Project is not likely to cause significant adverse environmental effects on marine mammals due to effects on NR killer whale.
Project Activities and Physical Works
Key Environmental Effects on Northern Resident
Killer Whale Relevance to the Assessment Considered in the ESA
Kitimat Terminal (tank terminal and marine terminal) Construction
• Inwater infrastructure site preparation (dredging, pile drilling)
• Effects on behaviour due to underwater noise
• Physical auditory damage due to underwater noise
• Marine mammal communication masking due to underwater noise
• Noise might induce behavioural disturbances
• Noise might cause avoidance • Noise might mask calls • Possible reduced foraging
efficiency • Possible change in prey
availability • Potential to induce PTS or TTS • Behavioural avoidance • Auditory masking
• Blasting associated with inwater or onshore infrastructure site preparation
• Effects on NR killer whale from physical injury due to blasting
• Direct mortality • Injury to internal organs • Auditory damage • Behavioural responses
• Inwater infrastructure construction (marine terminal, berths, pile installation)
• Effects on behaviour due to underwater noise
• Physical auditory damage due to underwater noise
• Marine mammal communication masking due to underwater noise
• Noise might induce behavioural disturbances
• Noise might cause avoidance • Noise might mask calls • Possible reduced foraging
efficiency • Possible change in prey
availability • Potential to induce PTS or TTS • Behavioural avoidance • Auditory masking

Sec. 52 Application Volume 6B: Environmental and Socio-Economic Assessment (ESA) – Marine Terminal Section 11: Marine Mammals
May 2010 Page 11-21
Table 11-3 Potential Environmental Effects on Northern Resident Killer Whale (cont’d)
Project Activities and Physical Works
Key Environmental Effects on Northern Resident
Killer Whale Relevance to the Assessment Considered in the ESA
Kitimat Terminal (tank terminal and marine terminal) Operations
• Berthed tankers (and associated combustion emissions, inert gas exchange, prop wash, noise, boom deployment)
• Effects on behaviour due to underwater noise
• Physical auditory damage due to underwater noise
• Marine mammal communication masking due to underwater noise
• Noise might induce behavioural disturbances
• Noise might cause avoidance • Noise might mask calls • Possible reduced foraging
efficiency • Possible change in prey
availability • Potential to induce PTS or TTS • Behavioural avoidance • Auditory masking
• Inwater infrastructure operations (marine terminal, docking berth and associated lights, noise)
• Effects on behaviour due to underwater noise
• Physical auditory damage due to underwater noise
• Marine mammal communication masking due to underwater noise
• Noise might induce behavioural disturbances
• Noise might cause avoidance • Noise might mask calls • Possible reduced foraging
efficiency • Possible change in prey
availability • Potential to induce PTS or TTS • Behavioural avoidance • Auditory masking
Decommissioning
• Inwater infrastructure site restoration (infrastructure removal)
• Effects on behaviour due to underwater noise
• Physical auditory damage due to underwater noise
• Marine mammal communication masking due to underwater noise
• Noise might induce behavioural disturbances
• Noise might cause avoidance • Noise might mask calls • Possible reduced foraging
efficiency • Possible change in prey
availability • Potential to induce PTS or TTS • Behavioural avoidance • Auditory masking

Sec. 52 Application Volume 6B: Environmental and Socio-Economic Assessment (ESA) – Marine Terminal Section 11: Marine Mammals
Page 11-22 May 2010
Table 11-3 Potential Environmental Effects on Northern Resident Killer Whale (cont’d)
Project Activities and Physical Works
Key Environmental Effects on Northern Resident
Killer Whale Relevance to the Assessment Not Considered in the ESA
Kitimat Terminal (tank terminal and marine terminal) Construction, Operations and Decommissioning
• Inwater infrastructure construction (marine terminal, berths, pile installation)
• Camp operations (waste water disposal)
• Site water runoff from onshore infrastructure operations
• Temporary changes to water quality (increased sediment suspension and sediment quality) associated with terminal construction
• Unlikely to constitute a notable effect on marine mammals. The marine terminal site is currently subject to highly variable and often elevated levels of suspended sediment originating from the Kitimat River (see Section 7).
• Berthed tankers (and associated combustion emissions)
• Health effects of exposure to hydrocarbons and particulate matter in exhaust
• Unlikely to constitute a notable environmental effect on marine mammals. The PEAA represents a small portion of most marine mammal species’ range; therefore, effects of chronic exposure are considered unlikely or minor (see Section 14).
• Inwater infrastructure site preparation and installation, terminal operations and decommissioning
• Project activities that affect salmon also have the potential to affect NR killer whales.
• Effects on the distribution or abundance of chum salmon expected to occur because of routine terminal construction, operations or decommissioning are expected to be inconsequential (see Section 10). Effects on chinook salmon (preferred prey for NR killer whale) from the Project are assumed to be similar to those identified for chum salmon (based on similar physiology). Consequently, potential changes to chinook salmon are also expected to be of negligible magnitude. Data specific to the distribution, abundance and important spawning rivers within the CCAA will be collected by Northern Gateway in association or consultation with participating local Aboriginal groups and DFO.
NOTES: PTS - permanent threshold shift TTS - temporary threshold shift

Sec. 52 Application Volume 6B: Environmental and Socio-Economic Assessment (ESA) – Marine Terminal Section 11: Marine Mammals
May 2010 Page 11-23
11.6.1.1 Spatial Boundaries
The PEAA for NR killer whales is based on the extent of sound propagation from a berthed tanker on standby at the marine terminal (see Figure 11-3). The PEAA includes the majority of Kitimat Arm, extending from the northern end of Kitimat Arm southward to mid-way along Coste Island.
11.6.1.2 Baseline Conditions for Northern Resident Killer Whale
Status
NR killer whales are listed as threatened under COSEWIC and listed on Schedule 1 of SARA primarily for three reasons (COSEWIC 2008):
• small population size • low potential growth rate • anthropogenic threats that may limit their potential recovery or lead to further population decline
Under Schedule 1 of the SARA, a recovery strategy for NR killer whales has been finalized (DFO 2008).
Seasonal Distribution and Occurrence
NR killer whales range from Glacier Bay, Alaska to Grays Harbor, Washington. From June to October, they frequent areas from mid-Vancouver Island to southeastern Alaska (DFO 2008). Their range at other times of the year is poorly understood.
Resident killer whales live in a complex matriarchal society, composed of matrilines, pods and clans. Matrilines are the fundamental unit of resident killer whales and comprise all surviving descendants of a female lineage. Typically, a matriline will consist of an adult female, her offspring and her daughters’ offspring. Pods consist of one or more matrilines that usually travel together. Clans are made up of pods that share one or more characteristic communication calls. There is no evidence that clans are restricted to specific regions, although clans do appear to have regional preferences. Of the three NR killer whale clans (A, G, R) that frequent coastal areas of northern British Columbia, the R clan (composed of the R1 pod and the W1 pod) appears to prefer the northern part of the community’s range (DFO 2008).
Marine mammal surveys did not detect resident killer whales in the PEAA (Marine Mammals TDR). However, opportunistic sighting data1
1 Data obtained from the B.C. Cetacean Sightings Network were collected opportunistically with limited knowledge of the temporal or spatial distribution of observer effort. As a result, absence of sightings at any location does not demonstrate absence of cetaceans.
(1985 to 2009; B.C. Cetacean Sightings Network 2009) suggest that NR killer whales occur within both the PEAA and surrounding areas (B.C. Cetacean Sightings Network 2009; Marine Mammals TDR). At present, it is not known how many NR killer whales annually use the PEAA, or to what degree the PEAA provides suitable habitat. Two large chinook salmon migration rivers (Bish Creek and Kitimat River) are found within the PEAA and NR killer whales are known to follow salmon closely as they return to spawn. Therefore, it is possible that killer whales frequent the PEAA annually and this area has the potential to be an important NR killer whale foraging habitat.

200 m
100
m
100 m
200 m
100
m
300 m
200
m
100
m
Kitimat
Minette Bay
KitamaatVillage
KitimatTerminal
K i t i
m a
t A
r m
BishCove
EmsleyCove
EmsleyPoint
CostePoint
CosteIsland
ClioBay
GobeilBay
Kitimat River
CreekBish
200 m
100
m
Pipeline Route
Security Fence
Terrestrial PDA
Marine PDA
Sound Level(dB re threshold)
0
5
10
15
20
25
30
35
40
45
50
Bathymetric Contour (100 m)
Railway
Road
NP
Jacques Whitford AXYS Ltd.
FIGURE NUMBER:
PROJECTION:
CONTRACTOR: DATE:
AUTHOR: APPROVED BY:PREPARED FOR:PREPARED BY: SCALE:
ENB R ID GE N OR TH ER N GA TEW A Y PR OJ EC T 11-3
NAD 83DATUM:
1:110,000
UTM 9
CM
100
m
200
m
Inset1:40,000
KitimatTerminal
Killer Whale-Predicted Sound Levels above Hearing Threshold
from a Berthed Tanker on Standby, Kitimat Terminal
0 1 2 3
Kilometres
JWA-1048334-1580
REFERENCES: NTDB Topographic Mapsheets provided by the Majesty the Queen in Right of Canada, Department of Natural Resources. All rights reserved.
20100305
R:\2
009F
isca
l\104
8334
_Nor
ther
nGat
eway
_ES
A_2
009Reference: Pipeline Route R

Sec. 52 Application Volume 6B: Environmental and Socio-Economic Assessment (ESA) – Marine Terminal Section 11: Marine Mammals
May 2010 Page 11-25
NR killer whales are most likely to be present within the PEAA between May and October, in pursuit of pre-spawning salmon (Ford 2005, pers. comm.). Chinook salmon are believed to be the primary year-round prey resource despite alternate prey resources such as chum salmon (Ford et al. 2009). After most chinook salmon have migrated upriver to spawn, killer whales prey on chum salmon that arrive in September and October (Ford and Ellis 2005). However, recent evidence correlating chinook availability with killer whale population health suggests that they are dependent on this single prey species despite being capable of exploiting other resources (Ford et al. 2009).
Habitat Requirements and Communication
In general, killer whales are thought to require clean water, healthy prey populations and a physical and acoustic environment that is large and quiet enough for them to communicate effectively, locate and capture prey and maintain other vital life functions (DFO 2008). Typically, NR killer whales feed in areas of high relief subsurface topography along salmon migration routes and may use these geographic features to increase feeding efficiency (Heimlich-Boran 1988).
Killer whales are highly social animals that produce a variety of acoustic signals to communicate, locate prey and acquire information about their surroundings. For a summary of the sounds killer whales make, see Table 11-4 (Richardson et al. 1995; Holt 2008).
Table 11-4 Killer Whale Sound Production Signal type
Frequency range
(kHz) Dominant frequencies
(kHz) Source level
(dB re: 1 µPa at 1 m) Whistles 1.5–181, 3 6–121 1385
Pulsed calls 0.5–252 1–61,2 1602
Clicks (echolocation signals)
12–252 - 180 (peak-peak)2
NOTE: (-) Not applicable
SOURCES: 1 Ford (1989) 2 Richardson et al. (1995) 3 Thomsen et al. (2001) 4 Thomsen et al. (2002) 5 Miller and Tyack (1999) cited in Thomsen et al. (2001)
Pulsed calls, typically separated into discrete and variable categories, are the primary sounds produced by killer whales (Thomsen et al. 2002; Holt 2008). Discrete calls are most often made during long-range activities such as foraging and traveling and are thought to be used to maintain contact among individuals. Variable calls are most often made during close range activities including social traveling and socializing (Thomsen et al. 2002). Whistle calls play an important role in close-range acoustic communication. In one study, whistles were the predominant sound-type recorded during socializing (Thomsen et al. 2002).
Clicks are brief, directional (forward-projecting) pulses of sound that occurs at high intensity and frequency. They are generally used by odontocetes as echolocation signals (Capuzzo et al. 1989).

Sec. 52 Application Volume 6B: Environmental and Socio-Economic Assessment (ESA) – Marine Terminal Section 11: Marine Mammals
Page 11-26 May 2010
Echolocation pulses are typically timed so that one pulse is transmitted and detected before the next pulse. Echolocation “clicks” are used by killer whales to gain information about their surroundings, to locate prey and to avoid obstacles (Holt 2008).
A study on two captive female killer whales demonstrated that the killer whale’s most sensitive auditory frequency is 20 kHz (at 36 dBPEAK-TO-PEAK re 1 µPa), which is similar to that observed for a captive male (15 kHz at 35 dBPEAK-TO-PEAK re:1 µPa) (Szymanski et al. 1999; DFO 2008). Toothed whales commonly have good functional hearing between 0.2 and 100 kHz, and some species have ultrasonic hearing to nearly 200 kHz (Ketten 2002). Killer whales, as well as all other toothed whales, are generally considered not to have sensitive hearing below 0.5 kHz (National Research Council 2003) but have shown behavioural responses to sounds as low as 75 Hz (Szymanski et al. 1999).
Abundance
In 2006, the NR killer whale population numbered 244 individuals (Ford 2008, pers. comm.). In 2007, the R1 pod had four matrilines (R2, R5, R17 and R7) made up of 34 individuals (Ellis et al. 2007). The W1 pod had only one matriline (W3) and consisted of three individuals. Thus, as of 2007, the R clan consisted of 37 individuals. Of these, 11 are known to be females that have previously given birth and two calves were born in 2006 (Ellis et al. 2007). In 2007, the other two clans, A and G, had 120 and 81 individuals, respectively (Ellis et al. 2007). As not all members of the NR killer whale population are seen each year, data on the population are considered less precise than for the better-studied southern resident population (DFO 2008).
Population Trend
Resident killer whale population dynamics are likely regulated primarily by changes in survival rates (Olesiuk et al. 2005). Studies have demonstrated a close correlation between the expected and observed survival rates of resident killer whales and the abundance of chinook salmon (Ford et al. 2009). During the late 1990s, a sharp drop in the coastal abundance of chinook salmon coincided with a notable decline in resident killer whale survival (Ford et al. 2005; Ford et al. 2009).
There is little information on NR killer whale populations before 1960. Between 1964 and 1973, the population is believed to have declined because of the removal of 14 individuals for the live capture fishery. The first killer whale census was completed in 1974 with an estimated 120 whales in the northern resident population. Between 1974 and 1991, the population increased at an average growth rate of 3.4% each year and peaked at 220 whales in 1997. For unknown reasons, in 2003 the northern resident population declined by 7% to 205 whales (DFO 2008). Since then, the population has increased, reaching 244 individuals in 2006.
Current Threats
Identified threats to the NR killer whale population include physical and acoustic disturbances from vessels and other industrial activities, environmental contaminants and reduction in the availability or quality of prey (DFO 2008).

Sec. 52 Application Volume 6B: Environmental and Socio-Economic Assessment (ESA) – Marine Terminal Section 11: Marine Mammals
May 2010 Page 11-27
Known behavioural responses of killer whales to disturbances include disrupted feeding, increased swimming rates, decreased surfacing time and avoidance (Erbe 2002; Morton and Symonds 2002; Williams et al. 2002a; Williams et al. 2002b). Information addressing the effects of behavioural disturbances at a population level is lacking.
Interactions with chemical and biological contaminants can affect killer whale populations directly or indirectly (DFO 2008). For example, persistent organic pollutants have been shown to bioaccumulate in killer whales and may act as carcinogens and endocrine disruptors (Ross 2000; DFO 2008).
11.6.2 Effects on Behaviour due to Underwater Noise The assessment of effects on behaviour due to underwater noise is based on project-specific modelling of how sound propagation may affect killer whales during inwater infrastructure site preparation and installation, marine terminal operations and decommissioning. For a general overview of terms relating to underwater acoustics, physics associated with underwater sound and how noise may influence marine mammals, see Section 11.5.1. This evaluation incorporates available (and commonly used) physical injury and behavioural change criteria, known killer whale reactions and reactions from other toothed whales.
11.6.2.1 Effect Mechanisms
Construction
NR killer whales occurring within the PEAA may be exposed to underwater noise generated by project activities. Inwater infrastructure site preparation activities capable of producing underwater noise include dredging and pile drilling. Underwater noise generated from inwater infrastructure construction (marine terminal, berths and pile installation) is likely to be less than that for site preparation and consequently is not discussed further.
The predicted zone of audibility of noise from a clamshell dredge for killer whales (i.e., where they will hear the dredging sound) is relatively small (less than 1 km2) and concentrated near the source (determined by weighting the noise generated by the dredge by the killer whale’s audiogram; see Figure 11-4).
For this assessment, operation of a clamshell dredge was used as a representative construction-related sound source, though drilling and other construction activities may differ in type and intensity of underwater noise produced (see Table 11-2).
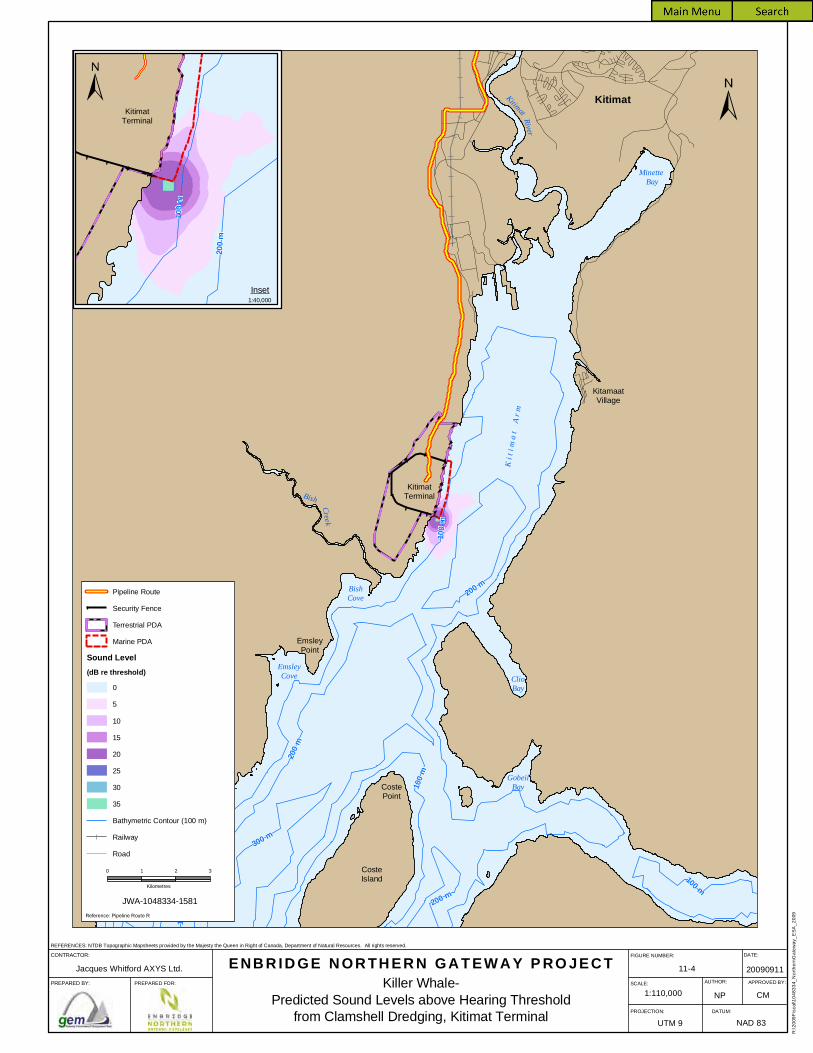
200 m
100
m
100 m
200 m
100
m
300 m
200
m
100
m
Kitimat
Minette Bay
KitamaatVillage
KitimatTerminal
K i t i
m a
t A
r m
BishCove
EmsleyCove
EmsleyPoint
CostePoint
CosteIsland
ClioBay
GobeilBay
Kitimat River
CreekBish
200 m
100
m
Pipeline Route
Security Fence
Terrestrial PDA
Marine PDA
Sound Level(dB re threshold)
0
5
10
15
20
25
30
35
Bathymetric Contour (100 m)
Railway
Road
NP
Jacques Whitford AXYS Ltd.
FIGURE NUMBER:
PROJECTION:
CONTRACTOR: DATE:
AUTHOR: APPROVED BY:PREPARED FOR:PREPARED BY: SCALE:
ENB R ID GE N OR TH ER N GA T EW A Y P RO J EC T 11-4
NAD 83DATUM:
1:110,000
UTM 9
CM
100
m
200
m
Inset1:40,000
KitimatTerminal
Killer Whale-Predicted Sound Levels above Hearing Threshold
from Clamshell Dredging, Kitimat Terminal
0 1 2 3
Kilometres
JWA-1048334-1581
REFERENCES: NTDB Topographic Mapsheets provided by the Majesty the Queen in Right of Canada, Department of Natural Resources. All rights reserved.
20090911
R:\2
009F
isca
l\104
8334
_Nor
ther
nGat
eway
_ES
A_2
009Reference: Pipeline Route R

Sec. 52 Application Volume 6B: Environmental and Socio-Economic Assessment (ESA) – Marine Terminal Section 11: Marine Mammals
May 2010 Page 11-29
Operations
An average of 220 tankers (50 VLCCs, 120 Suezmax and 50 Aframax) will berth at the Kitimat Terminal each year (see Section 2, Table 2-2). Underwater sound will be produced from berthed VLCCs, Suezmax and Aframax tankers, tugs and line-handling boats. Underwater sound generated by berthed vessels on standby will be caused by onboard auxiliary power systems from ship operations and loading. While berthed, main engines will not operate and therefore, will not produce underwater noise.
In comparison to berthed VLCC and other tankers, contributions to the underwater acoustic environment from line-handling boats are likely to be small. (Note: only berthed vessels are assessed in this volume, all other vessel activity is assessed in Volume 8B.) Consequently, underwater sound from line-handling boats is not discussed here.
Acoustic modelling for the Project was completed in 2006 (Marine Acoustics [2006] TDR) and used the underwater sound signature of a generic tanker (240 m in length) for simulations. Future field studies will measure underwater sound from a VLCC. Acoustic modelling will be revised to more accurately simulate esonification produced by project-related vessels. Modelling results will be made available by Northern Gateway once they are complete. The discussion below is based on the 2006 acoustic modelling results.
Broadband source levels emanating from a berthed tanker (onboard auxiliary power equipment) at the Kitimat Terminal will approximate 168 dBRMS re 1 µPa at 1 m (for further information, see the Marine Acoustics [2006] TDR). This noise level will decrease to approximately 120 dBRMS re 1 µPa at 1 km from the source (Hannay 2006, pers. comm.).
Decommissioning
Underwater noise generated from decommissioning of the marine terminal will be similar to those discussed for construction.
11.6.2.2 Mitigation and Effects Management
To reduce the likelihood and extent of adverse effects of underwater noise on killer whales (from construction, operations and decommissioning of the Kitimat Terminal), the following best industry practices and mitigation measures will be implemented:
• Work windows for inwater infrastructure site preparation and construction activities will be developed in consultation with DFO. Work windows will take into consideration seasonal killer whale abundance in the PEAA.
• During inwater construction activities, such as dredging and drilling, trained marine mammal observers (MMOs) will monitor a predetermined safety radius around the acoustic source. If a marine mammal enters the safety radius, construction activity will temporarily stop, until the mammal has moved outside the safety radius.

Sec. 52 Application Volume 6B: Environmental and Socio-Economic Assessment (ESA) – Marine Terminal Section 11: Marine Mammals
Page 11-30 May 2010
• The specified safety radius for the marine mammal monitoring program will be, in part, determined by sound source validation studies of actual equipment used for construction (e.g., dredge and pile-drilling equipment). Inwater sound data from construction equipment will be collected and quickly analyzed to accurately determine appropriate safety distances.
• Propellers of all construction and decommissioning support vessels will be well maintained and regularly visually inspected for damage (e.g., bent blades, nicks in the blade); poorly maintained propellers are known to increase underwater noise.
• Where feasible, construction and decommissioning support vessels will operate at slow speeds to reduce the intensity of noise.
• When possible, vessel operators will slowly increase vessel speeds and avoid rapid acceleration (an activity known to be loud).
• Northern Gateway is committed to incorporating best commercially available technology at the time of the design and construction of the tugs so that they produce the least underwater noise possible. Examples of this technology may include use of Voith-Schneider (VS) and modified Azimuth Stern Drive (ASD) propulsion systems.
• Tankers berthed at the marine terminal will employ measures to reduce underwater noise, including limiting the use of auxiliary generators for power and maintaining auxiliary power equipment.
11.6.2.3 Project Residual Effects
Characterization of the Residual Environmental Effect
Construction
Based on the National Marine Fisheries Service (NMFS 2008; Federal Register 2005) criteria of 120 dBRMS for behavioural responses to continuous sound, clamshell dredging will elicit behavioural responses in killer whales only within approximately 400 m of the dredge (dredging source levels approximate 161 dB re 1 µPa at 1 m; see Figure 11-1). Note that the NMFS criterion is general in nature and applies to all marine mammal species. To better inform this assessment how underwater noise from project-related vessels may influence NR killer whale behaviour, a killer whale-specific and regionally relevant behavioural change threshold was developed. This approach accounts for NR killer whale specific hearing ability and known behavioural responses in relation to underwater noise. Use of acoustic weighing in this assessment partially offsets differences in underwater noise (e.g., acoustic frequency and intensity differences) between vessel-based underwater noise (as studied by Williams et al. 2002a) and sounds generated by dredging.
This species-specific and regionally specific behavioural change threshold was developed from Williams et al. (2002a); they observed NR killer whale behavioural response at received levels of 116 dB dBRMS re 1 µPa (produced by a 5.2-m rigid hull Zodiac). Under the circumstances stated by Williams et al. (2002a), NR killer whales changed behaviour (swam faster, less predictable paths) at 65 dB above the killer whale auditory threshold. To calculate this noise level above the hearing threshold for killer whales, sound

Sec. 52 Application Volume 6B: Environmental and Socio-Economic Assessment (ESA) – Marine Terminal Section 11: Marine Mammals
May 2010 Page 11-31
levels from a small inflatable boat with a broadband received level of 116 dB were weighted by a killer whale audiogram.
The calculation (above auditory threshold) is a form of acoustic weighting, where only sounds capable of detection by killer whales are evaluated. Audiogram weighting is done primarily to account for the notable portion of vessel-based sound (frequency and intensity) that is unlikely to be audible to NR killer whales (as determined by incorporation of known killer whale hearing abilities, or audiogram). Details and methods used for acoustic weighting will be made available to appropriate regulators and management agencies once these studies have been concluded and a data report has been prepared that summarizes the results of the study.
The value of 65 dB above NR killer whale auditory threshold is therefore treated in this assessment as a proxy for NR killer whale behavioural change (including subtle changes such as increased heart rate to more pronounced changes such as habitat avoidance) and is compared against the NMFS 120 dBRMS re 1 µPa criterion.
Using the NMFS criteria of 120 dB suggests killer whales will change behaviour when they are closer than approximately 400 m of the marine terminal. Audiogram weighting (65 dB above hearing threshold criterion) suggests killer whales will not be exposed to underwater noise at this level. Therefore, this assessment has used a conservative 400-m distance to define the area with potential for changes in behaviour during construction.
Behavioural studies suggest harbour porpoises (biologically and physiologically related to killer whales) are moderately reactive to underwater sounds from construction (e.g., Koschinski et al. 2003; Henriksen et al. 2004; Tougaard et al. 2004; Herr et al. 2005). For example, Tougaard et al. (2004) investigated harbour porpoise activity during construction works, some of which were similar to those proposed for the Kitimat Terminal. During construction, harbour porpoises spent less time foraging and displayed reduced acoustic activity compared to periods of no construction. These differences were observed at distances of up to 15 km from the construction site. Acoustic activity of the harbour porpoises resumed to normal levels several hours after construction activity (Tougaard et al. 2004). Therefore, it is possible that killer whales will exhibit temporary behavioural responses near underwater construction activity.
Killer whales are known to avoid areas subjected to continuous elevated acoustic levels (Morton and Symonds 2002). In the past, acoustic harassment devices (AHDs) were installed on fish farms in the Broughton Archipelago off Vancouver Island with the intent of causing acoustic discomfort to pinnipeds and deterring their entrance to aquaculture operations. (An AHD emits a 10-kHz signal at 194 dB re 1 µPa at 1 m and is estimated to reach natural noise levels at 50 km distance.) Killer whales subsequently avoided the Broughton Archipelago, but repopulated this area within six months after removal of AHDs (which are not commonly permitted in Canada). AHDs emit underwater sound often in the form of “strong tone pulses or pulsed frequency sweeps in the 11- to 17-kHz range” and produce source levels of approximately 187 to 195 dB re 1 µPa at 1 m (Richardson et al. 1995). These underwater sounds are notably higher and more continuous than those that are expected from construction activities within the PEAA. This example demonstrates that killer whales will use previously ensonified habitats (i.e., an area in the marine environment within which anthropogenic sounds have been previously introduced).

Sec. 52 Application Volume 6B: Environmental and Socio-Economic Assessment (ESA) – Marine Terminal Section 11: Marine Mammals
Page 11-32 May 2010
As noted earlier, baseline field studies detected vessel-based underwater noise in the PEAA associated with present vessel traffic (for further information, see the Marine Acoustics [2006] TDR). NR killer whales that presently use this habitat are therefore tolerant to some level of increased ambient underwater noise. However, tolerance may include subtle (e.g., change in surfacing rate) or obvious (e.g., avoidance) behavioural response. If such responses increase energy expenditure or reduce foraging efficiency, they may adversely affect killer whale health. Consequences of increased ambient underwater noise conditions to killer whales were identified as a data gap (DFO 2008). However, underwater noise generated by inwater construction activity capable of inducing subtle changes in killer whale behaviour will only affect a small region (e.g., the PDA).
Operations
Graphics depicting predictive modelling results (see Figure 11-2) suggest that noise levels from berthed tankers will exceed the 120 dB re 1 µPa (Federal Register 2005) behavioural response criteria within approximately 1 km of the marine terminal.
Operation plans include the potential for two large vessels berthed at the Kitimat Terminal simultaneously; therefore, the spatial extent of underwater noise in the PEAA is likely to be double that of a single berthed tanker. Therefore, changes in killer whale behaviour, because of underwater noise, may occur in an area up to 2 km from the marine terminal.
The predicted zone of audibility for killer whales of noise from a berthed tanker (i.e., where killer whales will hear the sound) extends up to 6 to 7 km away (as determined by weighting the noise generated by the tanker on standby by the killer whale’s audiogram; see Figure 11-3). In other words, killer whales are unlikely to hear noise from the berthed tanker at distances greater than 7 km. Application of the species specific behavioural change criterion of 65 dB (explained previously) suggests this auditory threshold will not be achieved while a tanker is on standby (see Figure 11-3).
No studies specific to killer whale responses to vessels on standby were found. However, southern resident killer whales continue to frequent critical habitat (as defined in DFO 2008) near the Deltaport container terminal at Roberts Bank (Jacques Whitford AXYS Ltd. 2007, 2008). Comparisons between Roberts Bank and Kitimat Arm killer whale habitats are likely not reasonable given that killer whales may be required to tolerate higher ambient acoustic environments to access important feeding habitat (i.e., Fraser River) and that such habitat has not been identified in Kitimat Arm (though both Bish Creek and Kitimat River are known large salmon rivers that drain into the PEAA). Differences in vessel traffic (frequency, types of vessels, proximity of ferry terminal), oceanographic and physical environments and whale populations further complicate such comparison. This example and that of AHD use in the Broughton Archipelago demonstrate that killer whale response to ensonified habitat is circumstantially variable. It is possible that the existence of a simple behavioural “ambient sound threshold” will actually be complicated by factors such as prey availability, site-fidelity, cultural and social systems. However, based on current information and understanding, the means by which increases to underwater sound influence killer whale habitat use cannot be predicted.
Sec. 52 Application Volume 6B: Environmental and Socio-Economic Assessment (ESA) – Marine Terminal Section 11: Marine Mammals
May 2010 Page 11-33
Though the underwater noise emitted from a tanker on standby is largely of lower frequency than the peak NR killer whale communication range (Marine Acoustics [2006] TDR, Table 11-4), the masking of killer whale communication by berthed tankers is possible within approximately 7 km of the tanker (Figure 11-3).
Summary
Predictive modelling and evaluation of available criteria (and received levels at which killer whales have demonstrated behavioural change) indicates that NR killer whales may change behaviour within 500 m of the marine terminal. Auditory masking of killer whale communications by tankers on standby are predicted within approximately 7 km of the marine terminal and within 1 to 2 km of clamshell dredging activities.
Available information on NR killer whale abundance in the PEAA is limited. However, they are known to occur in the PEAA. Therefore, some unknown, but likely small, portion of the NR killer whale population will be affected by underwater noise from the Project. The PEAA represents a very small portion of available NR killer whale habitat. Therefore, based on available information (results of GEM field studies, BCCSN data and recorded sightings) of humpback whales in the PEAA, underwater noise in this region might affect either individual or small groups of NP humpback whales (magnitude rating of low).
Change in NR killer whale behaviour due to underwater noise generated at the Kitimat Terminal will be confined in geographic extent to the PEAA (and mostly to the PDA) and the duration will be long term (over the course of the Project). Though noise generated by the Project will extend throughout the PEAA, it is predicted that NR killer whales will only hear a small portion of this noise (see Figures 11-3 and 11-4). The frequency of such emissions overall will be continuous (berthed vessels on standby) and environmental effects from these emissions will stop with the completion of the Project (and hence are reversible). For a summary of the residual environmental effects of underwater noise on the behaviour of NR whales, see Table 11-5.
Determination of Significance of Residual Effects
With the mitigation measures and follow-up and monitoring activities (see Section 11.9), the residual project environmental effect of behavioural change due to underwater noise on NR killer whales is predicted to be not significant.

Sec. 52 Application Volume 6B: Environmental and Socio-Economic Assessment (ESA) – Marine Terminal Section 11: Marine Mammals
Page 11-34 May 2010
Table 11-5 Characterization of the Residual Effects on Behaviour due to Underwater Noise - Northern Resident Killer Whale
Activity Direction
Additional Proposed Mitigation/Compensation
Measures1-3
Residual Environmental Effect
Magnitude
Geographic Extent
Duration/
Frequency
Reversibility
Significance
Potential Measurable
Contribution to Regional
Cumulative Environmental
Effects Construction Inwater infrastructure site preparation (dredging, pile drilling)
Adverse • Work windows 1 • Marine mammal monitoring
program2
L 0–1 km Up to 400 days; repeatedly throughout the day
R N N
Inwater infrastructure construction (marine terminal, berths, pile installation)
Adverse • Work windows1 L 0–1 km Less than 400 days; repeatedly throughout the day
R N N
Operations Berthed tankers Adverse • Berthed vessel noise
reduction measures3 L 0–2 km 24 hours; 220
tankers per year R N N
Decommissioning Inwater infrastructure site restoration (infrastructure removal)
Adverse • Marine mammal monitoring program
L 0–1 km Less than 400 days; repeatedly throughout the day
R N N

Sec. 52 Application Volume 6B: Environmental and Socio-Economic Assessment (ESA) – Marine Terminal Section 11: Marine Mammals
May 2010 Page 11-35
Table 11-5 Characterization of the Residual Effects on Behaviour due to Underwater Noise - Northern Resident Killer Whale (cont’d)
Mitigation: 1. Work windows: Work windows for inwater infrastructure site preparation and construction activities will be developed in consultation with DFO. Work windows will take
into consideration seasonal killer whale abundance in the PEAA. 2. Marine mammal monitoring program: Northern Gateway will implement a mandatory marine mammal monitoring program at the marine terminal. During inwater
construction activities (i.e., dredging, drilling), trained MMOs will monitor a pre-determined safety radius (based on a predicted zone of acoustic influence) around the acoustic source. If a marine mammal enters this safety radius, the construction activity will be temporarily stopped until the marine mammal has moved beyond the safety radius.
3. Berthed Vessel Noise Reduction Measures: Tankers berthed at the marine terminal will employ measures to reduce underwater noise, including limiting the use of auxiliary generators for power and maintaining auxiliary power equipment.
Follow-up and Monitoring: Baseline surveys will be done before construction and marine mammal monitoring will be carried out during construction (see Sections 11.3 and 11.9)
KEY Direction: Positive: enhancement of the NR killer whale
population Adverse: deterioration of the NR killer whale
population
Magnitude: Negligible (N) No measurable adverse effects on NR killer
whales are anticipated Low (L) A small group of individuals (e.g., a matriline
or pod of NR killer whales) is affected Moderate (M) Multiple groups of individuals (e.g., two or
more pods of NR killer whales) are affected High (H) A large portion of the NR killer whale
population (e.g., one or more clans) is affected
Geographic Extent: The cumulative physical area over which there will be an effect (distance from marine terminal)
Duration: The length of exposure to a single occurrence of the effect
Frequency: The number of times that the effect occurs per day
Reversibility: R Reversible: The KI is able to
recover from the effect to a state similar to what existed prior to impact. Depending on the effect considered, reversibility may be assessed on both an individual (immediate) and population (long-term) level.
I The KI is unable to recover from the effect
Significance: S Significant N Not Significant
Potential Measurable Contribution to Regional Cumulative Environmental Effects: N No Y Yes

Sec. 52 Application Volume 6B: Environmental and Socio-Economic Assessment (ESA) – Marine Terminal Section 11: Marine Mammals
Page 11-36 May 2010
11.6.2.4 Cumulative Effects Implications
Screening for Cumulative Effects
Underwater noise from the construction and operation of the Kitimat Terminal will overlap spatially and temporally with underwater noise for the following existing projects:
• Eurocan Pulp and Paper Co., or replacement operations • Methanex Corporation • Rio Tinto Alcan Primary Metal BC
Approved projects that will overlap are Kitimat LNG Inc. and Arthon Construction Ltd. and Sandhill Materials project).
However, the biological implications of repeated killer whale behavioural change near the marine terminal and associated habitat avoidance (and predicted communication masking) in a very small portion of their range (PEAA and Kitimat Arm) although unknown, are expected to be of low magnitude. Neither the existing level of underwater noise, nor the project contribution to these emissions, is likely to affect the viability or sustainability of the NR killer whale population. As a result, cumulative environmental effects are not considered further in this assessment.
11.6.2.5 Prediction Confidence
Confidence in the prediction of significance for the environmental effect of behavioural change due to underwater noise is rated as low. This is because:
• use of the PEAA and Kitimat Arm by NR killer whales is not well understood
• long-term population-level effects of exposure to anthropogenic underwater noises are poorly understood
• literature on sound exposure levels that induce behavioural responses in killer whales is limited; therefore, much of this assessment is based on sound exposure levels developed for odontocetes as a whole
As a result of the low level of confidence in the prediction of the environmental effect of behavioural change due to underwater noise, Northern Gateway will undertake a follow-up program to assess the:
• importance of this localized area as potential feeding habitat for killer whales
• response of killer whales and other marine mammals to construction and operational activities
11.6.2.6 Effects on Physical Auditory Systems from Underwater Noise
Underwater noise from construction activities is unlikely to induce PTS or TTS in killer whales within the PEAA. For high-frequency cetaceans such as killer whales, the injury criterion is 230 dBpeak re 1 µPa for non-pulse sounds (Southall et al. 2007). Sounds of this intensity are not predicted for dredging. Sounds produced by a clamshell dredge are assumed to be louder than those produced by pile drilling. Underwater noise from berthed tankers will not exceed the physical injury (PTS, TTS) criteria (230 dBpeak re 1 µPa for non-pulse sounds) proposed by Southall et al. (2007). Use of older injury criteria (180 dBRMS

Sec. 52 Application Volume 6B: Environmental and Socio-Economic Assessment (ESA) – Marine Terminal Section 11: Marine Mammals
May 2010 Page 11-37
re 1 µPa; Federal Register 2005) also suggests PTS and TTS are unlikely during marine terminal construction and operations (clamshell operation or tanker on standby; see Figures 11-1 and 11-2). No records of physical injury to a toothed whale from underwater sound produced during marine terminal construction or operations were found. Therefore, TTS and PTS are not expected.
11.6.2.7 Effects on Communication from Underwater Noise
Masking of killer whale communication by underwater noise from construction (clamshell dredge) is estimated within 1 to 2 km of the marine terminal (Figure 11-4; where noises produced by a clamshell dredge are predicted to be heard by killer whales; as assumed through use of acoustic weighting). Underwater noise from tankers on standby may cause communication masking up to 7 km from the marine terminal (Figure 11-3; where killer whales are predicted to detect noise from a berthed tanker on standby). For masking to occur, a large proportion of noise frequencies generated artificially (construction noise) must overlap with those of killer whale calls. Within the PEAA, killer whales are likely to use calls for foraging (echolocation and discrete pulsed calls are the predominate sounds used during foraging; see Table 11-4). Discrete pulsed calls have dominant frequencies between 1 and 6 kHz, and echolocation frequencies are considerably higher. As most acoustic energy from underwater construction sound is concentrated below 1 kHz (Richardson et al. 1995; Marine Acoustics [2006] TDR), there will be limited overlap of construction sounds and killer whale calls.
11.6.3 Effects on Northern Resident Killer Whale from Physical Injury due to Blasting
11.6.3.1 Effect Mechanisms
For a summary of potential environmental effects of blasting for project construction on marine mammals, see Section 11.5.2.
Terrestrial and underwater blasting for the Kitimat Terminal will only occur during construction. Blasting has the potential to adversely affect NR killer whales within the PEAA. Direct mortality or injuries may occur if a killer whale is near the detonated explosives (e.g., less than 500 m away). Behavioural responses in animals further afield may include avoidance responses, decreased foraging activity and increased energy expenditure.
To reduce the likelihood of injury or direct mortality to NR killer whales, Northern Gateway will develop a detailed Blasting Management Plan, which will use the lowest weight of explosives necessary. Marine mammal detection surveys will also be included in the plan. The objective of the marine mammal detection surveys will be to prevent detonation occurring while a marine mammal is inside a predetermined danger zone, which will be calculated based on the blast design (charge, delay, depth). During blasting activities, if a mammal is detected in a predetermined danger zone, blasting will be suspended until the mammal is outside the danger zone.

Sec. 52 Application Volume 6B: Environmental and Socio-Economic Assessment (ESA) – Marine Terminal Section 11: Marine Mammals
Page 11-38 May 2010
11.6.3.2 Mitigation and Effects Management
The following mitigation measures will be used before or during blasting:
• the zone of potential physical injury (danger zone) to marine mammals will be calculated before construction (based on blast design)
• efforts will be made during the blasting design to reduce overpressure
• underwater bubble curtains will be used to contain shock waves from blasting
• dedicated marine mammal detection surveys will be done up to and beyond the radius of the danger zone before any blasting
These mitigation measures will be included in the Blasting Management Plan. The duration of the marine mammal detection survey before and after blasting will be consistent with recent records of presence, peak timing within the PEAA, species biology (e.g., dive duration) and optimal detection conditions (e.g., weather and visibility).
11.6.3.3 Project Residual Effects
Characterization of the Residual Environmental Effect
Underwater blasting required for the marine terminal may cause direct mortality or physical injury to killer whales if they are near the detonated explosives (e.g., less than 500 m away). Behavioural responses further afield may include avoidance, decreased foraging activity and increased energy expenditure. However, because of the limited time frame for blasting activities (approximately three weeks) and the availability of known effective mitigation measures, it is not expected that behavioural responses will compromise killer whale health.
Blasting will be governed by the Blasting Management Plan (according to DFO guidelines).
Based on this assessment and available effective mitigation measures, the potential environmental effects of blasting on killer whales are of negligible to low magnitude, short-term in duration, likely confined to 500 m of the blast site (for physical damage and will be calculated prior to blasting), likely within the PEAA for behavioural responses (the distance to be determined according to the Blasting Management Plan) sporadic and reversible. For a summary of the residual environmental effects of physical injury due to blasting, see Table 11-6.
Determination of Significance of Residual Effects
With the mitigation measures, the effects on NR killer whales from physical injury due to blasting from the Project on NR killer whales is predicted to be not significant.

Sec. 52 Application Volume 6B: Environmental and Socio-Economic Assessment (ESA) – Marine Terminal Section 11: Marine Mammals
May 2010 Page 11-39
Table 11-6 Characterization of the Residual Effects on Northern Resident Killer Whale from Physical Injury due to Blasting
Activity Direction Additional Proposed
Mitigation/Compensation Measure1-7
Residual Environmental Effect
Magnitude
Geographic Extent
Duration/
Frequency
Reversibility
Significance
Potential Measurable
Contribution to Regional
Cumulative Environmental
Effects Construction Blasting associated with inwater or onshore infrastructure site preparation
Adverse • DFO guidelines1 • Calculation of danger zone2 • Work windows3 • Overpressure reduction4 • Bubble curtains5 • Marine mammal detection surveys6 • Blasting Management Plan7
N to L Physical injury at less than 500 m; Effects on behaviour at greater than 500 m and within the PEAA
Several weeks/ numerous times per day
R (I for PTS) N N
Mitigation: 1. DFO guidelines: Ensure project activities at the Kitimat Terminal comply with DFO guidelines for underwater blasting. 2. Calculation of danger zone: Calculate the zone of potential physical injury (danger zone) to marine mammals before construction (based on blast design). 3. Work windows: Work windows for inwater infrastructure site preparation and construction activities will be developed in consultation with DFO. Work windows will take
into consideration seasonal killer whale abundance in the PEAA. 4. Overpressure reduction: Efforts will be made during the blasting design to reduce overpressure 5. Bubble curtains: Underwater bubble curtains will be used to contain shock waves from blasting. 6. Marine mammal detection surveys: Conduct dedicated marine mammal detection surveys up to and beyond danger zone. During blasting activities, if a mammal is
detected in a predetermined danger zone, blasting will be suspended until the mammal is beyond the danger zone. This is to reduce the exposure of marine mammals to blasting effects.
7. Blasting Management Plan: Develop a Blasting Management Plan that uses the lowest weight of explosives necessary. Mitigation measures identified in this table will also be included in the plan.

Sec. 52 Application Volume 6B: Environmental and Socio-Economic Assessment (ESA) – Marine Terminal Section 11: Marine Mammals
Page 11-40 May 2010
Table 11-6 Characterization of the Residual Effects on Northern Resident Killer Whale from Physical Injury due to Blasting (cont’d)
Follow-up and Monitoring: Baseline surveys will be done before construction and marine mammal monitoring during construction. KEY Refer to Table 11-5

Sec. 52 Application Volume 6B: Environmental and Socio-Economic Assessment (ESA) – Marine Terminal Section 11: Marine Mammals
May 2010 Page 11-41
11.6.3.4 Cumulative Effects Implications
Screening for Cumulative Effects
Because there is no reasonably expected residual environmental effect on NR killer whales from physical injury due to blasting and no other similar sources of physical injury to whales are expected to occur during the blasting activities, cumulative environmental effects are deemed unlikely and are not considered further in this assessment.
11.6.3.5 Prediction Confidence Confidence in the prediction of significance for the environmental effect of physical injury due to blasting is rated as high. This rating is based on the development of the Blasting Management Plan, which will effectively reduce the risk of physical injury to NR killer whales.
11.7 North Pacific Humpback Whale
11.7.1 Scope of Assessment for North Pacific Humpback Whale The NP humpback whale population is a KI because it is known to occur in the PEAA (Marine Mammals TDR) and is listed as threatened on Schedule 1 of the SARA (Government of Canada 2005, Internet site; COSEWIC 2009, Internet site). Critical habitat for humpback whales has not been formally defined. For this assessment, the humpback whale is considered a representative species of baleen whale. Potential environmental effects of the Project on NP humpback whales were determined based on the scope of factors from the Joint Review Panel, federal and provincial regulatory requirements for assessment of environmental effects, and issues raised by the public and participating Aboriginal groups, as well as professional judgment. For a summary of the potential effects on NP humpback whales, see Table 11-7.
Table 11-7 Potential Environmental Effects on North Pacific Humpback Whale
This table identifies the potential environmental effects on NP humpback whale that are assessed in this section of the ESA. Each of these environmental effects is discussed in more detail later in this section. Recommendations for mitigation and, if required, follow-up and monitoring are also provided. With the implementation of these mitigation measures where appropriate, the Project is not likely to cause significant adverse environmental effects on marine mammals due to effects on NP humpback whale.
Project Activities and Physical Works
Key Environmental Effects on North Pacific Humpback Whale Relevance to the Assessment
Considered in the ESA Kitimat Terminal (tank terminal and marine terminal)
Construction • Inwater infrastructure site
preparation (dredging, pile drilling)
• Effects on behaviour due to underwater noise
• Potential to induce PTS or TTS • behavioural avoidance • auditory masking
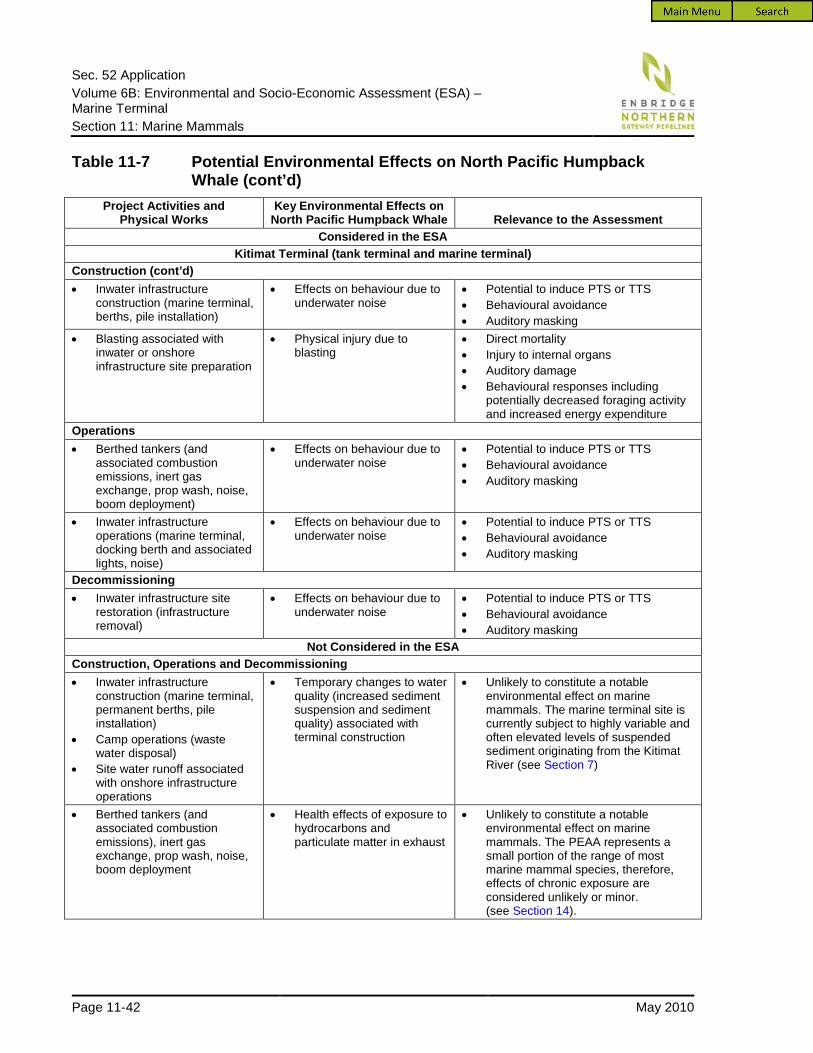
Sec. 52 Application Volume 6B: Environmental and Socio-Economic Assessment (ESA) – Marine Terminal Section 11: Marine Mammals
Page 11-42 May 2010
Table 11-7 Potential Environmental Effects on North Pacific Humpback Whale (cont’d)
Project Activities and Physical Works
Key Environmental Effects on North Pacific Humpback Whale Relevance to the Assessment
Considered in the ESA Kitimat Terminal (tank terminal and marine terminal)
Construction (cont’d) • Inwater infrastructure
construction (marine terminal, berths, pile installation)
• Effects on behaviour due to underwater noise
• Potential to induce PTS or TTS • Behavioural avoidance • Auditory masking
• Blasting associated with inwater or onshore infrastructure site preparation
• Physical injury due to blasting
• Direct mortality • Injury to internal organs • Auditory damage • Behavioural responses including
potentially decreased foraging activity and increased energy expenditure
Operations • Berthed tankers (and
associated combustion emissions, inert gas exchange, prop wash, noise, boom deployment)
• Effects on behaviour due to underwater noise
• Potential to induce PTS or TTS • Behavioural avoidance • Auditory masking
• Inwater infrastructure operations (marine terminal, docking berth and associated lights, noise)
• Effects on behaviour due to underwater noise
• Potential to induce PTS or TTS • Behavioural avoidance • Auditory masking
Decommissioning • Inwater infrastructure site
restoration (infrastructure removal)
• Effects on behaviour due to underwater noise
• Potential to induce PTS or TTS • Behavioural avoidance • Auditory masking
Not Considered in the ESA Construction, Operations and Decommissioning • Inwater infrastructure
construction (marine terminal, permanent berths, pile installation)
• Camp operations (waste water disposal)
• Site water runoff associated with onshore infrastructure operations
• Temporary changes to water quality (increased sediment suspension and sediment quality) associated with terminal construction
• Unlikely to constitute a notable environmental effect on marine mammals. The marine terminal site is currently subject to highly variable and often elevated levels of suspended sediment originating from the Kitimat River (see Section 7)
• Berthed tankers (and associated combustion emissions), inert gas exchange, prop wash, noise, boom deployment
• Health effects of exposure to hydrocarbons and particulate matter in exhaust
• Unlikely to constitute a notable environmental effect on marine mammals. The PEAA represents a small portion of the range of most marine mammal species, therefore, effects of chronic exposure are considered unlikely or minor. (see Section 14).

Sec. 52 Application Volume 6B: Environmental and Socio-Economic Assessment (ESA) – Marine Terminal Section 11: Marine Mammals
May 2010 Page 11-43
11.7.1.1 Spatial Boundaries
The PEAA for NP humpback whale is based on the extent of sound propagation from a berthed tanker at the marine terminal (see Figure 11-5). The PEAA extends from the northern end of Kitimat Arm southward to the north end of Maitland Island (south of Coste Island).
11.7.1.2 Baseline Conditions for North Pacific Humpback Whale
Status
Humpback whales in the North Pacific are listed as special concern on the province of British Columbia’s Blue List and as threatened on Schedule 1 of SARA (BCCDC 2006, Internet site; COSEWIC 2003c). As of November 2009, a formal recovery strategy under SARA is under development.
Seasonal Distribution and Occurrence
Humpback whales migrate between low-latitude winter breeding grounds (e.g., Hawaii, Mexico and Asia) and high-latitude summer feeding grounds (e.g., British Columbia, Alaska and Russia). They are predominantly a coastal species and are generally found in coastal inlets and continental shelf habitats. The geographic distribution and population structure of humpback whales have been derived from historic whaling data, distributions of identified whales, genetic studies, regional song patterns and fluke coloration patterns (Baker et al. 1985; Darling and McSweeney 1985; Baker et al. 1994; Straley 1994; Darling et al. 1996; Calambokidis et al. 1997; Gregr et al. 2000; Calambokidis et al. 2008).
Historical whaling records, photographic identification and genetic studies suggest more than one sub-population may be found in British Columbia (Gregr et al. 2000; Calambokidis et al. 2008; Rambeau 2008). Humpbacks are seen in British Columbia primarily between May and October; however, some animals are present year-round (Rambeau 2008). Researchers observing humpback whales in Douglas Channel suggest presence in this region extends from June to November (Cetacealab 2009, Internet site).
Based on the general migration pattern of NP humpback whales, this species is most likely to occur within the PEAA between May and October (Calambokidis et al. 2001; COSEWIC 2003c; Rambeau 2008). Marine mammal surveys done for the Project from 2005 to 2009 did not detect humpback whales within the PEAA. Most humpback whales observed on these surveys were sighted south of Douglas Channel, closer to the open coast. However, data obtained from the BCCSN (1985 to 2009; in the Marine Mammal TDR) indicates that humpback whales have been sighted near Coste Island and near Kitamaat Village within the PEAA. Humpbacks were recorded opportunistically in the PEAA in December 2006 (Wheeler 2006, pers. comm.).

Kitimat
Minette Bay
KitamaatVillage
KitimatTerminal
K i t i
m a
t A
r m
BishCove
EmsleyCove
EmsleyPoint
CostePoint
CosteIsland
Kitimat
Creek
River
LorettaIsland
MaitlandIsland
ClioBay
GobeilBay
Bish100 m
300 m
200
m
100
m
100 m
200
m
100
m
300 m
100 m
100
m
200 m
100 m
200 m
200 m
100 m
200 m
Pipeline Route
Security Fence
Terrestrial PDA
Marine PDA
Sound Level(dB re threshold)
0
5
10
15
20
25
30
35
40
45
50
55
60
65
70
75
80
Bathymetric Contour (100 m)
Railway
Road
NP
Jacques Whitford AXYS Ltd.
FIGURE NUMBER:
PROJECTION:
CONTRACTOR: DATE:
AUTHOR: APPROVED BY:PREPARED FOR:PREPARED BY: SCALE:
ENB R ID GE N OR TH ER N GA TEW A Y PR OJ EC T 11-5
NAD 83DATUM:
1:150,000
UTM 9
CM
100
m
200
m
Inset1:40,000
KitimatTerminal
Humpback Whale-Predicted Sound Levels above Hearing Threshold
from a Berthed Tanker on Standby, Kitimat Terminal
0 1 2 3
Kilometres
JWA-1048334-1582
REFERENCES: NTDB Topographic Mapsheets provided by the Majesty the Queen in Right of Canada, Department of Natural Resources. All rights reserved.
20100305
R:\2
009F
isca
l\104
8334
_Nor
ther
nGat
eway
_ES
A_2
009Reference: Pipeline Route R

Sec. 52 Application Volume 6B: Environmental and Socio-Economic Assessment (ESA) – Marine Terminal Section 11: Marine Mammals
May 2010 Page 11-45
Habitat Requirements and Communication
The primary prey of the NP humpback whale includes herring, other small schooling fish and krill (Money and Trites 1998). Summer foraging is believed to be highly important to humpback whales. At this time, the principal activity of humpback whales is feeding as they must build up enough fat reserves to sustain them over the entire winter and provide sufficient energy to migrate more than 9,000 km to and from their breeding grounds (Chittleborough 1965). Mature females must also store enough energy to give birth and nurse (Chittleborough 1965).
Humpback whales use sound for communication and feeding (see Table 11-8). Humpback whales produce three distinct types of sounds (Richardson et al. 1995):
• songs associated with reproduction in late fall, winter and spring, usually by solitary males
• sounds made by whales in groups on wintering grounds, typically associated with agonistic behaviour among males competing for dominance and proximity to females
• sounds made on summer feeding habitat
Table 11-8 Humpback Whale Sound Production Signal Type
Frequency Range
(kHz) Dominant Frequencies
(kHz) Source Level
(dB re 1 µPa at 1 m) Song components 0.03–8 0.12–4 144–174 Shrieks - 0.75–1.8 179–181 Horn blast - 0.41–0.42 181–185 Moans 0.20–1.8 0.035–0.36 175 Grunts 0.025–1.9+ - 190 Pulse trains 0.025–1.25 0.025–0.08 179–181 Under water blows 0.1–2 - 158 Fluke and tail slaps 0.03–1.2 - 183–192 Clicks 2–8.2 - -
NOTE: (-) Not available or not applicable
SOURCE: Richardson et al. 1995
Most sounds produced by humpback whales have dominant frequencies below 1 kHz, with source levels that may exceed 190 dB re 1 µPa at 1 m (Richardson et al. 1995). Anatomical evidence suggests that humpback whales are adapted to hear low frequency sounds. From observed reactions to air gun pulses and underwater playback of anthropogenic sounds, it has been determined that humpback whales have dominant hearing components in the 50 to 500 Hz range. Studies have shown that humpback whales react to sounds between 400 and 550 Hz at received levels as low as 102 dB re 1 µPa (Richardson et al. 1995). Humpback whales have also been known to react to sonar signals, beepers and clinkers ranging from 3.1 to 4 kHz (Lien et al. 1990, 1992; Maybaum 1993).

Sec. 52 Application Volume 6B: Environmental and Socio-Economic Assessment (ESA) – Marine Terminal Section 11: Marine Mammals
Page 11-46 May 2010
Abundance
The pre-exploitation abundance estimate (based on whaling data) for the entire North Pacific humpback whale population approximates 15,000 individuals (Rice 1978). Commercial whaling for North Pacific humpback whales ended in 1966 (Best 1993), when the population was estimated to have been reduced to 1,600 individuals (Gambell 1976), although the estimation methods used remain uncertain and their reliability questionable (Calambokidis and Barlow 2004). DFO has catalogued individual humpback whales in British Columbia since 1984 (by photographic identification of tail flukes). Recent analysis of this dataset suggests between 1,428 and 3,856 humpback whales use British Columbia waters, depending on the method used and time frame considered (Rambeau 2008). The most recent estimate for the North Pacific population (excluding calves) is 18,302 individuals (Calambokidis et al. 2008).
Population Trend
Based on photographic identification studies, the North Pacific humpback population is estimated to be increasing at an annual rate of between 4.9% and 6.8% (Calambokidis et al. 2008). In 2006, the Canadian component of the NP humpback whale population was estimated to be increasing annually at 3% to 5% (Rambeau 2008).
Current Threats
Potential threats to humpback whale populations in the North Pacific include acoustic degradation of habitat, potential reductions in food supply, vessel strikes and entanglement in fishing gear (Calambokidis et al. 2008).
11.7.2 Effects on Behaviour due to Underwater Noise The assessment of effects on behaviour due to underwater noise is based on project-specific modelling of how sound propagation during inwater infrastructure site preparation and construction, marine terminal operations and decommissioning may affect NP humpback whales. This evaluation incorporates available effects on physical injury and effects on behaviour criteria and known humpback whale reactions.
11.7.2.1 Effect Mechanisms
Construction
Underwater noise generated during inwater infrastructure site preparation and construction could result in a change in NP humpback whale behaviour in the PEAA. Such underwater noise may induce hearing damage (PTS or TTS), behavioural response and habitat avoidance or communication masking.
For this assessment, operation of a clamshell dredge is used as a representative construction-related sound source, though drilling and other construction activities may differ in type and intensity of underwater noise produced (see Table 11-2).
Operations
For information on berthed tankers and the associated underwater sound, see Section 11.6.2.1.

Sec. 52 Application Volume 6B: Environmental and Socio-Economic Assessment (ESA) – Marine Terminal Section 11: Marine Mammals
May 2010 Page 11-47
Decommissioning
Underwater noise generated from decommissioning of the marine terminal will likely be similar to those discussed for construction, Section 11.6.2.1.
11.7.2.2 Mitigation and Effects Management
To reduce potential change in humpback whale behaviour (due to underwater noise) within the PEAA, the following mitigation measures or best industry standards will be implemented during construction, operations and decommissioning of the Kitimat Terminal:
• Inwater infrastructure site preparation and construction activities will occur during work windows that will be developed in consultation with DFO. Work windows with take into consideration seasonal humpback whale abundance in the PEAA.
• During inwater construction activities, such as dredging and drilling, trained marine mammal observers (MMOs) will monitor a predetermined safety radius around the acoustic source. If a marine mammal enters the safety radius, construction activity will temporarily stop, until the mammal has moved outside the safety radius.
• The propellers of the construction and decommissioning support vessels will be well maintained and visually inspected regularly for damage (e.g., bent blades, nicks in the blade). Poorly maintained propellers are known to increase underwater noise. Where feasible, construction and decommissioning support vessels will operate at slow speeds to reduce the intensity of underwater noise.
• When possible, vessel operators will slowly increase vessels speeds and avoid rapid acceleration (an activity known to be loud).
• Northern Gateway is committed to incorporating best commercially available technology at the time of design or construction of tugs so that they produce the least underwater noise possible. Examples of this technology may include use of Voith-Schneider (VS) and modified Azimuth Stern Drive (ASD) propulsion systems.
• Tankers berthed at the marine terminal will employ measures to reduce underwater noise, including limiting the use of auxiliary generators for power and maintaining auxiliary power equipment.
11.7.2.3 Project Residual Effects
Characterization of the Residual Environmental Effect
Construction
Conservatively, noise generated by a clamshell dredge will be audible to humpback whales up to 24 km away (where received levels are greater than the predicted humpback whale hearing threshold; see Figure 11-6). Modelling of sounds for humpback whale hearing above threshold did not incorporate the influence of ambient conditions. Theoretically, humpback whales can hear below the ambient sound level in Kitimat Arm (approximately 80 dB re 1 µPa). Factoring ambient conditions in above threshold

Sec. 52 Application Volume 6B: Environmental and Socio-Economic Assessment (ESA) – Marine Terminal Section 11: Marine Mammals
Page 11-48 May 2010
modelling results reduces the spatial extent by approximately half, although, only for strong tonal frequencies. Hence, the estimate of 24 km is considered conservative.
Underwater noise from a clamshell dredge will induce effects on behaviours in NP humpback whales up to approximately 400 m, based on the behavioural criteria of 120 dB re 1 µPa established by the NMFS (Federal Register 2005) for continuous noise (see Figure 11-1).
Southall et al. (2007) reviewed three humpback whale related literature sources (McCauley et al. 1996; Frankel and Clark 1998; Biassoni et al. 2000) and concluded clear avoidance at received levels between 118 and 124 dB re 1 µPa. In other words, available literature (Southall et al. 2007) suggests that notable changes to humpback behaviour at received levels as low as 118 dB re 1 µPa are possible. However, this figure of 118 dB re 1 µPa is taken from a study of vessel approaches to humpback whales (McCauley et al. 1996) and not construction-related noise, which are not the same as the operation of a clamshell dredge within a fixed area (i.e., not approaching the whales). Sound levels of 118 dB re 1 µPa may be received only slightly farther from the source than the 120 dB re 1 µPa levels previously discussed (see Figure 11-1). In summary, habitat avoidance or changes in humpback behaviour may be induced, conservatively, within 1 km of construction activities.
Little information exists on reactions of NP humpback whales to coastal activity. In Hawaii, it has been shown that humpback whale mother-and-calf groups may avoid nearshore waters where human activities are intense (Richardson et al. 1995).
Direct information pertaining to humpback whale vocalizations (type, duration, purpose, frequency and rate) in the PEAA is lacking. If humpbacks whales use the PEAA as feeding habitat, then habitat avoidance, changes in behaviour and communication masking may affect foraging efficiency, especially as calls produced while feeding may serve for prey manipulation and as assembly calls (Richardson et al. 1995).
It is not presently known to what degree habitat avoidance, effects on behaviour and communication masking may affect humpback whales in the PEAA during inwater infrastructure site preparation, construction and decommissioning.

Kitimat
Minette Bay
KitimatTerminal
K i t i
m a
t A
r m
BishCove
EmsleyCove
EmsleyPoint
CostePoint
CosteIsland
Kitimat
Bish Creek
River
LorettaIsland
ClioBay
GobeilBay
MaitlandIsland
KitamaatVillage
100 m
300 m
200
m
100
m
200
m
100
m
300 m
100 m
100 m
100
m
200 m
100 m
200 m
200 m
100 m
200 m
NP
Jacques Whitford AXYS Ltd.
FIGURE NUMBER:
PROJECTION:
CONTRACTOR: DATE:
AUTHOR: APPROVED BY:PREPARED FOR:PREPARED BY: SCALE:
ENB R ID GE N OR TH ER N GA T EW A Y P RO J EC T 11-6
NAD 83DATUM:
1:150,000
UTM 9
CM
100
m
200
m
Inset1:40,000
KitimatTerminal
Humpback Whale-Predicted Sound Levels above Hearing Threshold
from Clamshell Dredging, Kitimat Terminal
Pipeline Route
Security Fence
Terrestrial PDA
Marine PDA
Sound Level(dB re threshold)
0
5
10
15
20
25
30
35
40
45
50
55
60
65
70
75
80
Bathymetric Contour (100 m)
Railway
Road
0 1 2 3
Kilometres
JWA-1048334-1583
REFERENCES: NTDB Topographic Mapsheets provided by the Majesty the Queen in Right of Canada, Department of Natural Resources. All rights reserved.
20090911
R:\2
009F
isca
l\104
8334
_Nor
ther
nGat
eway
_ES
A_2
009Reference: Pipeline Route R

Sec. 52 Application Volume 6B: Environmental and Socio-Economic Assessment (ESA) – Marine Terminal Section 11: Marine Mammals
Page 11-50 May 2010
Operations
Low frequency underwater noise generated by a berthed tanker will be audible to humpback whales up to 24 km away (where received levels are greater than the predicted humpback whale hearing threshold; see Figure 11-5). Underwater noise from a berthed tanker will induce effects on behaviours in NP humpback whales up to 1 km from the tanker, based on the behavioural criteria of 120 dB re 1 µPa established by the NMFS (Federal Register 2005) for continuous noise (see Figure 11-2).
Available literature on humpback whale reaction to underwater noise suggests most severe effects on behaviours occur at 118 dB re 1 µPa. Sound of this intensity may span up to a 1-km-wide area around the marine terminal (see Figure 11-2).
Operation plans include the potential for two large vessels berthed at the Kitimat Terminal simultaneously; therefore, the spatial extent of underwater noise in the PEAA is likely to be double that of a single berthed tanker. Changes in humpback whale behaviour, because of underwater noise, may occur in an area up to 2 km from the marine terminal.
Information about humpback whale vocalizations (type, duration, purpose, frequency and rate) in the PEAA is lacking. If humpback whales use the PEAA as feeding habitat, then habitat avoidance, changes in behaviour and communication masking may affect foraging efficiency, especially as calls produced while feeding may serve for prey manipulation and as assembly calls (Richardson et al. 1995). Vessels will be berthed at the Kitimat Terminal throughout the life of the Project. It is not known if humpback whales would habituate to these underwater noise levels.
Summary
With available information, it is not possible to determine how many individuals of the NP humpback population use the PEAA annually. The species is most likely to occur within the PEAA between May and October. However, there is evidence suggesting that humpback whales overwinter in British Columbia to a greater degree than previously believed. Surveys done by the GEM team did not detect humpback whales in the PEAA, but did detect them in the outer channels of the CCAA (see Volume 8B, Figure 10-1). This would suggest that humpback whales do not frequent the PEAA as commonly as they do the outer channels; however, more surveys and studies would be required to confirm this hypothesis. Data obtained from the BCCSN indicates that humpback whales have been sighted near Coste Island and near Kitamaat Village within the PEAA (Marine Mammal TDR). Also, humpback whales were recorded in the PEAA (Wheeler 2006, pers. comm.).
Therefore, based on available information (results of GEM field studies, BCCSN data and recorded sightings) of humpback whales in the PEAA, underwater noise in this region might affect either individual or small groups of NP humpback whales (magnitude rating of low).
Potential change in humpback whale behaviour within the PEAA is expected to extend from construction through the end of operations; therefore, the duration of potential effects on humpback whale behaviour overall is long term.

Sec. 52 Application Volume 6B: Environmental and Socio-Economic Assessment (ESA) – Marine Terminal Section 11: Marine Mammals
May 2010 Page 11-51
During construction, underwater noise will be infrequent and irregular; during operations, underwater noise will be continuous. Underwater noise will extend throughout but is limited to the PEAA. Hence, they are confined spatially. Underwater noise will stop following project decommissioning. Associated effects on habitat use by humpback whale would be expected to be reversible at this time. Acoustically, the PEAA is not considered pristine.
For a summary of the residual environmental effects of underwater noise on humpback whales, see Table 11-9.
Determination of Significance of Residual Effects
Underwater noise from construction, decommissioning and operation of the Kitimat Terminal will potentially change humpback whale behaviour in the PEAA. Application of conservative acoustic hearing threshold criteria suggests humpback whales might avoid areas within 2 km of the marine terminal. Humpback whale communications might be masked up to 24 km from the marine terminal.
Humpback habitat avoidance and communication masking may result in reduced humpback whale foraging opportunity or efficiency. Despite these predicted consequences, the PEAA represents a very small portion of all humpback whale habitats.
Though listed as Threatened on Schedule 1 of SARA, the NP humpback population is believed to be increasing in number and presumably recovering in British Columbia (Calambokidis et al. 2008; Rambeau 2008). Therefore, change of humpback whale behaviour within a very small portion of their range is unlikely to affect the viability or sustainability of the NP humpback population, especially as the PEAA is not considered to be as frequently used by this species as some of the outer areas of Douglas Channel and the outer mainland coast.
The potential effect of NP humpback whale behavioural change is not significant.
11.7.2.4 Cumulative Effects Implications
Screening for Cumulative Effects
Underwater noise from the construction and operation of the Kitimat Terminal will overlap spatially and temporally with underwater noise from the following existing projects:
• Eurocan Pulp and Paper Co. plant and terminal • Methanex Corporation plant and terminal • Rio Tinto Alcan Primary Metal British Columbia aluminum smelter
Approved projects that will overlap are Kitimat LNG Inc. terminal and Arthon Construction Ltd. and Sandhill Materials project.

Sec. 52 Application Volume 6B: Environmental and Socio-Economic Assessment (ESA) – Marine Terminal Section 11: Marine Mammals
Page 11-52 May 2010
Table 11-9 Characterization of the Residual Effects on Behaviour due to Underwater Noise - North Pacific Humpback Whale
Activity Direction Additional Proposed
Mitigation/Compensation Measures1-3
Residual Environmental Effect
Magnitude
Geographic Extent
Duration/
Frequency
Reversibility
Significance
Potential Measurable
Contribution to Regional
Cumulative Environmental
Effects Construction
Inwater infrastructure site preparation (dredging, pile drilling)
Adverse • Work windows1 • Marine mammal monitoring
program2
L Up to 1 km
Up to 400 days; repeatedly throughout the day
R N N
Inwater infrastructure construction (marine terminal, berths, pile installation)
Adverse • Work windows2 L Up to 1 km
Less than 400 days; repeatedly throughout the day
R N N
Operations Berthed tankers (and associated combustion emissions, inert gas exchange, prop wash, noise, boom deployment)
Adverse • Berthed vessel noise reduction measures3
L Up to 2 km
24 hours; 220 tankers per year
R N N
Decommissioning Inwater infrastructure site restoration (infrastructure removal)
Adverse • Work windows1 • Marine mammal monitoring
program2
L Up to 1 km
Less than 400 days; repeatedly throughout the day
R N N

Sec. 52 Application Volume 6B: Environmental and Socio-Economic Assessment (ESA) – Marine Terminal Section 11: Marine Mammals
May 2010 Page 11-53
Table 11-9 Characterization of the Residual Effects on Behaviour due to Underwater Noise - North Pacific Humpback Whale (cont’d)
Mitigation: 1. Work windows: Work windows for inwater infrastructure site preparation and construction activities will be developed in consultation with DFO. Work windows will take
into consideration seasonal humpback whale abundance in the PEAA. 2. Marine mammal monitoring program: Northern Gateway will implement a mandatory marine mammal monitoring program at the marine terminal. During inwater
infrastructure site preparation and construction activities (i.e., dredging, drilling), trained MMOs will monitor a pre-determined safety radius around the acoustic source. If a marine mammal enters this safety radius, the construction activity will be temporarily stopped until the marine mammal has moved beyond the safety radius.
3. Berthed Vessel Noise Reduction Measures: Tankers berthed at the marine terminal will employ measures to reduce underwater noise, including limiting the use of auxiliary generators for power and maintaining auxiliary power equipment.
Follow-up and Monitoring: Baseline surveys before construction and marine mammal monitoring during construction (see Sections 11.3 and 11.9)
KEY Direction: Positive: enhancement of the NP humpback whale
population Adverse: deterioration of the NP humpback whale
population
Magnitude: Negligible (N) No measurable adverse effects on NP
humpback whales are anticipated. Low (L) A small group of individual NP humpback
whales is affected. Moderate (M) The majority of individuals that regularly inhabit
the CCAA is affected High (H) The NP humpback whale population is affected.
Geographic Extent: The cumulative physical area over which there will be an effect (distance from marine terminal)
Duration: The length of exposure to a single occurrence of the effect
Frequency: The number of times that the effect occurs per day
Reversibility: R Reversible: The KI is able to recover
from the effect to a state similar to what existed prior to impact. Depending on the effect considered, reversibility may be assessed on both an individual (immediate) and population (long-term) level.
I The KI is unable to recover from the effect
Significance: S Significant N Not Significant
Potential Measurable Contribution to Regional Cumulative Environmental Effects: N No Y Yes
NOTE: 1At present, abundance estimates for humpbacks that regularly inhabit the CCAA are not available.

Sec. 52 Application Volume 6B: Environmental and Socio-Economic Assessment (ESA) – Marine Terminal Section 11: Marine Mammals
Page 11-54 May 2010
However, the biological implications of repeated humpback whale behavioural change, habitat avoidance (and presumably communication masking) in a very small portion of their range (Kitimat Arm), although unknown, are expected to be of negligible magnitude. Neither the existing level of underwater noise nor the project contribution to these emissions is likely to affect the viability or sustainability of the NP humpback whale population. As a result, cumulative environmental effects are not considered further in this assessment.
11.7.2.5 Prediction Confidence
Confidence in the prediction of significance for the effects on behaviour due to underwater noise is rated as moderate. This rating is based on:
• the very small amount of available NP humpback whale habitat likely to be affected
• limited information on abundance and seasonal use of Kitimat Arm by humpback whales
• the limited understanding of the importance of hearing and sound production in mysticetes compared to odontocetes
• little evidence of the environmental effects of anthropogenic sound on humpback whales
• baseline acoustic data for the PEAA collected during field studies to assess potential project environmental effects on humpback whales
• predictive acoustic modelling as an effective tool for estimating potential acoustic effects on marine mammals
• project-emitted source levels of sounds predicted for the most part from surrogate sources
• reliance on the most stringent of available acoustic thresholds for predicting behavioural (avoidance) changes in humpback whales providing conservative and precautionary projections
Because of the moderate level of confidence in the prediction of the environmental effects of behavioural change due to underwater noise, Northern Gateway will undertake a follow-up program to assess the response of humpback whales and other marine mammals to construction activities and operational activities.
11.7.2.6 Effects on Physical Auditory Systems from Underwater Noise
Based on Southall et al. (2007), sound exposure criteria and predictive modelling, underwater noise from construction activities at the Kitimat Terminal are likely not capable of inducing PTS or TTS in humpback whales within the PEAA (Hannay 2009, pers. comm.). In mysticetes (low frequency cetaceans), TTS is thought to occur at sound pressure levels (non-pulse) in excess of 224 dBPEAK re 1 µPa. Sound intensities equal to, or greater than, 180 dB re 1 µPa (NMFS physical injury criteria; Federal Register 2005) are not predicted by modelling (see Figure 11-1).
Underwater noise from a berthed tanker (as modelled) is unlikely to exceed TTS or PTS injury criteria for baleen whales (Southall et al. 2007; Hannay 2009, pers. comm.). Similarly, sound intensities equal to, or greater than, 180 dB re 1 µPa (NMFS physical injury criteria; Federal Register 2005) are not predicted by modelling (see Figure 11-2).

Sec. 52 Application Volume 6B: Environmental and Socio-Economic Assessment (ESA) – Marine Terminal Section 11: Marine Mammals
May 2010 Page 11-55
11.7.2.7 Effects on Communication from Underwater Noise
Underwater noise generated during marine terminal construction and operations will be of similar (low) frequency to those used by humpback whales for communication. Therefore, communication masking may occur over a relatively large area (up to 24 km from the Kitimat Terminal). Potential masking effects on humpback whales within the PEAA will depend on their proximity to the emission source, the distance between whales and the strength of a call. Information relating to longer-term effects resulting from communication masking to an individual cetacean or population is lacking and, therefore, is not assessed in detail.
11.7.3 Effects on North Pacific Humpback Whale from Physical Injury due to Blasting
11.7.3.1 Effect Mechanisms
Terrestrial and underwater blasting for the Kitimat Terminal will only occur for a short period during construction. Blasting may adversely affect humpback whales within the PEAA. Direct mortality or injuries may occur if a humpback whale is close to the detonated explosives (e.g., less than 500 m).
Information on potential environmental effects of blasting on humpback whales comes from studies done on the east coast of Canada (Todd et al. 1996). Underwater blasting (charges ranged from 1,000 to 5,500 kg) was used at multiple sites to develop site infrastructure between 1992 and 1994 (Todd et al. 1996). Peak sound levels measured one nautical mile from detonation locations varied, but typically ranged from 140 to 150 dB re 1 µPa near 400 Hz.
Blasting activities coincided with peak transient humpback whale abundance, and whereas there were no detectable behavioural changes during the blasting period, incidences of entanglement with fishing gear increased (Todd et al. 1996). Authors of this study suggest exposure to intense levels of sound from blasting may have affected humpback whale hearing thresholds, resulting in decreased sensitivity to acoustic cues produced from fishing nets (Todd et al. 1996). Post-mortem examination of entangled whales revealed damaged ear structures, likely due to shock waves (Ketten et al. 1993). This suggests that environmental effects from blasting can be long term in nature and range from avoidance behaviours to indirect mortality.
11.7.3.2 Mitigation and Effects Management
To reduce the likelihood of injury or direct mortality of humpback whales, Northern Gateway will develop a Blasting Management Plan, as outlined for NR killer whales (see Section 11.6.3.1). This plan will outline measures for the optimum use of explosives. Marine mammal detection surveys will also be included in the plan.
The objective of the marine mammal detection surveys will be to prevent detonation occurring while a marine mammal is inside the predetermined danger zone. The danger zone will be calculated based on the blast design (charge, delay and depth), humpback hearing and seasonal abundance during blasting. During blasting activities, if a mammal is detected in a predetermined danger zone, blasting will be suspended

Sec. 52 Application Volume 6B: Environmental and Socio-Economic Assessment (ESA) – Marine Terminal Section 11: Marine Mammals
Page 11-56 May 2010
until the mammal is beyond the danger zone. This is to reduce the exposure of marine mammals to blasting effects.
The additional mitigation measures for reducing the environmental effects of blasting on NP humpback whales are the same as those described for NR killer whales (see Section 11.6.3.2).
11.7.3.3 Project Residual Effects
Characterization of the Residual Environmental Effect
Blasting for the Kitimat Terminal will occur over a short period and will be governed by the Blasting Management Plan (according to DFO guidelines). In addition, a series of mitigation measures will be implemented to reduce potential adverse environmental effects on humpback whales (e.g., before any blasting, using underwater bubble curtains and dedicated marine mammal detection surveys up to and beyond the area of anticipated environmental effects). Based on this assessment, the potential effects of blasting on humpback whales are considered to be low in magnitude (few individuals may be affected), short-term in duration, confined (PDA and PEAA), sporadic and reversible.
Determination of Significance of Residual
With the mitigation measures, the project environmental effect of physical injury due to blasting on NP humpback whales is predicted to be not significant.
For a summary of the residual environmental effects of physical injury due to blasting, see Table 11-10.
11.7.3.4 Cumulative Effect Implications
Screening for Cumulative Effects
As there is no reasonably expected residual environmental effect on NP humpback whales because of physical injury due to blasting for the Project and no other similar sources of physical injury to whales are expected to occur during the blasting activities for the Project, cumulative environmental effects are deemed unlikely and are not considered further in this assessment.
11.7.3.5 Prediction Confidence
Confidence in the prediction of significance for the environmental effect of physical injury due to blasting is rated as high. This rating is based on the development of the Blasting Management Plan, which will effectively limit the risk of physical injury to NP humpback whales.
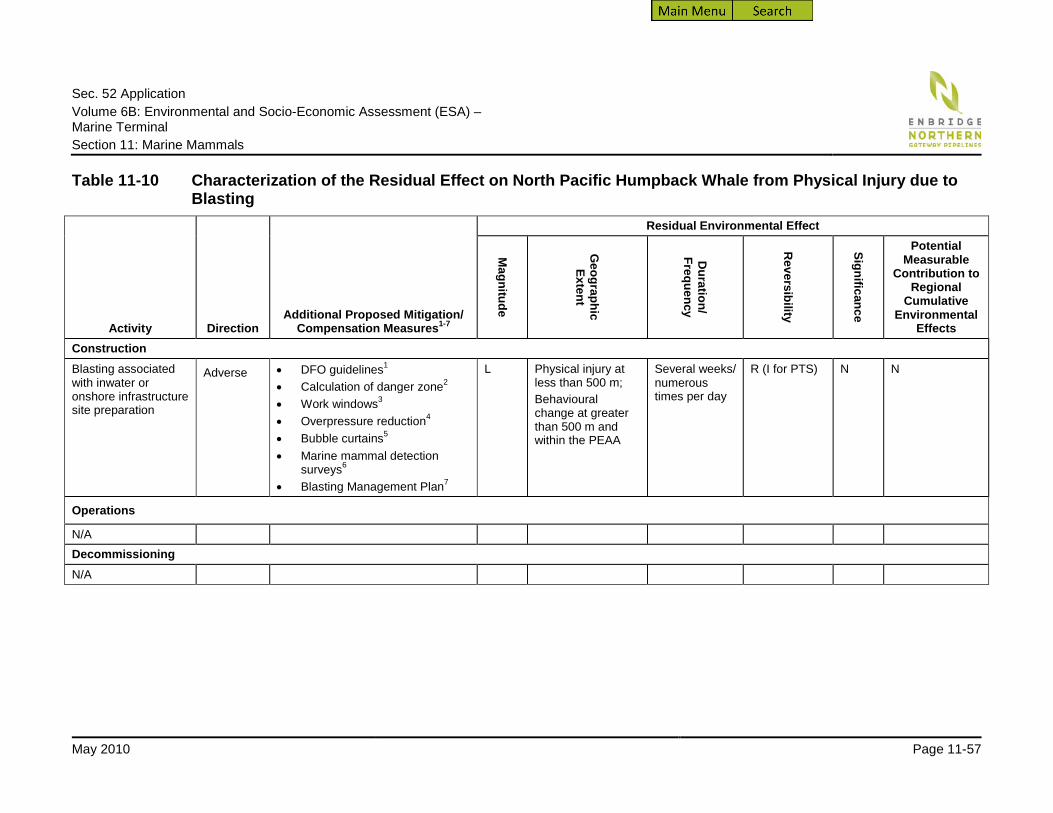
Sec. 52 Application Volume 6B: Environmental and Socio-Economic Assessment (ESA) – Marine Terminal Section 11: Marine Mammals
May 2010 Page 11-57
Table 11-10 Characterization of the Residual Effect on North Pacific Humpback Whale from Physical Injury due to Blasting
Activity Direction Additional Proposed Mitigation/
Compensation Measures1-7
Residual Environmental Effect
Magnitude
Geographic Extent
Duration/
Frequency
Reversibility
Significance
Potential Measurable
Contribution to Regional
Cumulative Environmental
Effects Construction Blasting associated with inwater or onshore infrastructure site preparation
Adverse • DFO guidelines1 • Calculation of danger zone2 • Work windows3 • Overpressure reduction4 • Bubble curtains5 • Marine mammal detection
surveys6 • Blasting Management Plan7
L Physical injury at less than 500 m; Behavioural change at greater than 500 m and within the PEAA
Several weeks/ numerous times per day
R (I for PTS) N N
Operations
N/A Decommissioning N/A

Sec. 52 Application Volume 6B: Environmental and Socio-Economic Assessment (ESA) – Marine Terminal Section 11: Marine Mammals
Page 11-58 May 2010
Table 11-10 Characterization of the Residual Effect on North Pacific Humpback Whale from Physical Injury due to Blasting (cont’d)
Mitigation: 1. DFO guidelines: Project activities at the Kitimat Terminal will comply with DFO guidelines for underwater blasting. 2. Calculation of danger zone: Calculate the zone of potential physical injury (danger zone) to marine mammals before construction (based on blast design) 3. Work windows: Work windows for inwater infrastructure site preparation and construction activities will be developed in consultation with DFO. Work windows will take
into consideration seasonal humpback whale abundance in the PEAA. 4. Overpressure reduction: Efforts will be made during the blasting design to reduce overpressure. 5. Bubble curtains: Underwater bubble curtains will be used to contain shock waves from blasting. 6. Marine mammal detection surveys: Conduct dedicated marine mammal detection surveys up to and beyond the danger zone. During blasting activities, if a mammal is
detected in a predetermined danger zone, blasting will be suspended until the mammal is beyond the danger zone. This is to reduce the exposure of marine mammals to blasting effects.
7. Blasting Management Plan: Develop a Blasting Management Plan that uses the lowest weight of explosives necessary. Mitigation measures identified in this table will also be included.
Follow-up and Monitoring: Baseline surveys before construction and marine mammal monitoring during construction. KEY Refer to Table 11-9
NOTE: N/A – Not applicable

Sec. 52 Application Volume 6B: Environmental and Socio-Economic Assessment (ESA) – Marine Terminal Section 11: Marine Mammals
May 2010 Page 11-59
11.8 Steller Sea Lion
11.8.1 Scope of Assessment for Steller Sea Lion Steller sea lion is a KI because it is listed as a species of special concern on Schedule 1 of SARA (Government of Canada 2005, Internet site; COSEWIC 2009, Internet site) and may occur year-round within the PEAA. They are reasonably well studied and are considered a representative species of pinnipeds found within the PEAA. They are high trophic level consumers and can be viewed as indicators of ecosystem health.
Potential environmental effects of the Project on Steller sea lions were determined based on the scope of factors from the Joint Review Panel, federal and provincial regulatory requirements for assessment of environmental effects, and issues raised by the public and participating Aboriginal groups, as well as professional judgment. For a summary of the potential effects on Steller sea lions, see Table 11-11.
Table 11-11 Potential Environmental Effects on Steller Sea Lion This table identifies the potential environmental effects on Steller sea lion that are assessed in this section of the ESA. Each of these environmental effects is discussed in more detail later in this section. Recommendations for mitigation and, if required, follow-up and monitoring are also provided. With the implementation of these mitigation measures where appropriate, the Project is not likely to cause significant adverse environmental effects on marine mammals due to effects on Steller sea lion.
Project Activities and Physical Works
Key Environmental Effects on Steller Sea Lion Relevance to the Assessment
Considered in the ESA Kitimat Terminal (tank terminal and marine terminal)
Construction
• Onshore infrastructure site preparation (clearing, burning, grading, blasting)
• Onshore infrastructure construction (e.g., tank terminal, inter-connector pipes, support buildings, pumps)
• Effects on behaviour from in-air noise.
• Auditory injury (PTS) and auditory fatigue (TTS)
• Behavioural avoidance • Temporary abandonment of
haul-out sites
• Inwater infrastructure site preparation (dredging, pile drilling)
• Inwater infrastructure construction (marine terminal, berths, pile installation)
• Effects on behaviour due to underwater noise
• Auditory injury (PTS) and auditory fatigue (TTS)
• Behavioural responses • Auditory masking
• Blasting associated with inwater infrastructure
• Physical injury due to blasting • Direct mortality • Injury to internal organs • Auditory damage • Behavioural responses

Sec. 52 Application Volume 6B: Environmental and Socio-Economic Assessment (ESA) – Marine Terminal Section 11: Marine Mammals
Page 11-60 May 2010
Table 11-11 Potential Environmental Effects on Steller Sea Lion (cont’d) Project Activities and
Physical Works Key Environmental Effects on
Steller Sea Lion Relevance to the Assessment Considered in the ESA
Kitimat Terminal (tank terminal and marine terminal) Operations
• Berthed tankers (and associated combustion emissions, inert gas exchange, prop wash, noise, boom deployment)
• Effects on behaviour due to underwater Noise
• TTS, PTS • Behavioural responses • Auditory masking
Decommissioning
• Onshore site restoration (infrastructure removal, site rehabilitation and reclamation)
• Effects on behaviour from in-air acoustic disturbance.
• Auditory injury (PTS) and auditory fatigue (TTS)
• Behavioural avoidance • Temporary abandonment of
haul-out sites
• Inwater site restoration (infrastructure removal)
• Effects on behaviour due to Underwater Noise
• TTS, PTS • Behavioural responses • Auditory masking
Pipelines Construction
• RoW and site preparation (clearing, slash burning/chipping, grading, blasting)
• Temporary and permanent road development (clearing, slash burning/chipping, grading, drainage control, blasting, structures for vehicle crossings)
• Construction equipment and traffic
• Pipeline construction (stringing pipe, setting up pipe, opening ditch, blasting, backfilling, clean-up, instream ditching, welding and lowering-in, temporary dewatering)
• Effects on behaviour from in-air noise.
• Auditory injury (PTS) and auditory fatigue (TTS)
• Behavioural avoidance • Temporary abandonment of
haul-out sites
• Blasting associated with RoW and site preparation
• Blasting associated with temporary and permanent road development
• Blasting associated with pipeline construction
• Effects on physical injury due to blasting
• Direct mortality • Injury to internal organs • Auditory damage and
behavioural responses

Sec. 52 Application Volume 6B: Environmental and Socio-Economic Assessment (ESA) – Marine Terminal Section 11: Marine Mammals
May 2010 Page 11-61
Table 11-11 Potential Environmental Effects on Steller Sea Lion (cont’d) Project Activities and
Physical Works Key Environmental Effects on
Steller Sea Lion Relevance to the Assessment Not Considered in the ESA
Construction, Operations and Decommissioning
• Inwater infrastructure construction (marine terminal, berths, pile installation)
• Camp operations (waste water disposal)
• Site water runoff from onshore infrastructure operations
• Temporary changes to water quality (increased sediment suspension and sediment quality) associated with marine terminal construction
• Unlikely to constitute a notable environmental effect on marine mammals. The marine terminal site is currently subject to highly variable and often elevated levels of suspended sediment originating from the Kitimat River (see Section 7).
11.8.1.1 Spatial Boundaries
The PEAA for Steller sea lions is based on the extent of sound propagation from a berthed tanker on standby at the marine terminal (see Figure 11-7). The PEAA includes the majority of Kitimat Arm, extending from the northern end of Kitimat Arm southward to mid-way along Coste Island.
11.8.1.2 Baseline Conditions for Steller Sea Lion
Status
Steller sea lions are listed both provincially and federally as a species of special concern primarily for the following reasons:
• small number of breeding sites • susceptibility to human disturbance • susceptibility to oil spills
A formal management plan has not been developed for Steller sea lions to date.
Seasonal Distribution and Occurrence
Steller sea lions are widespread throughout coastal waters of British Columbia and may occur year-round within the PEAA. They were observed in the PEAA in April and May 2006, during dedicated marine mammal surveys (for further information, see the Marine Mammals TDR). One was observed at Bish Point in December 2005, immediately south of Bish estuary (Anderson 2005, pers. comm.).
Haulout sites or rookeries are not known to occur within the PEAA. The nearest major haulout site is at the southern end of Ashdown Island, about 75 km south of the PEAA.
The distribution of Steller sea lions in the marine environment is often closely associated with the distribution of their prey. In southern British Columbia, Steller sea lions often congregate in the lower Fraser River during the spring eulachon run (Bigg 1985). They also congregate in estuaries during fall to feed on salmon returning to spawn (Bigg et al. 1990).

200 m
100
m
100 m
200 m
100
m
300 m
200
m
100
m
Kitimat
Minette Bay
KitamaatVillage
KitimatTerminal
K i t i
m a
t A
r m
BishCove
EmsleyCove
EmsleyPoint
CostePoint
CosteIsland
ClioBay
GobeilBay
Kitimat River
CreekBish
Pipeline Route
Security Fence
Terrestrial PDA
Marine PDA
Sound Level(dB re threshold)
0
5
10
15
20
25
30
35
40
45
50
55
Bathymetric Contour (100 m)
Railway
Road
NP
Jacques Whitford AXYS Ltd.
FIGURE NUMBER:
PROJECTION:
CONTRACTOR: DATE:
AUTHOR: APPROVED BY:PREPARED FOR:PREPARED BY: SCALE:
ENB R ID GE N OR TH ER N GA TEW A Y PR OJ EC T 11-7
NAD 83DATUM:
1:110,000
UTM 9
CM
100
m
200
m
Inset1:40,000
KitimatTerminal
Steller Sea Lion -Predicted Sound Levels above Hearing Threshold
from a Berthed Tanker on Standby, Kitimat Terminal
0 1 2 3
Kilometres
JWA-1048334-1584
REFERENCES: NTDB Topographic Mapsheets provided by the Majesty the Queen in Right of Canada, Department of Natural Resources. All rights reserved.
20100305
R:\2
009F
isca
l\104
8334
_Nor
ther
nGat
eway
_ES
A_2
009Reference: Pipeline Route R

Sec. 52 Application Volume 6B: Environmental and Socio-Economic Assessment (ESA) – Marine Terminal Section 11: Marine Mammals
May 2010 Page 11-63
Based on the timing of eulachon and salmon in Kitimat Arm (see Section 10), Steller sea lions are most likely to occur within the PEAA between February and September. Given that Ashdown Island, 75 km from the PEAA, is a winter haulout site, Steller sea lions might also occur in the PEAA during winter (they are known to travel long distances from haulouts in the winter).
Habitat Requirements and Communication
Steller sea lions primarily use rookeries and haulout sites for shore-based habitats. Rookeries are seasonal areas used for breeding, nursing and rearing young, whereas haulouts are non-breeding areas used all year round for rest and socialization. Most rookeries and haulouts occur on areas of exposed rocky shore; however, haulout locations may be more flexible and can include a variety of other substrates (Ban and Trites 2007). No sea lion rookeries or year-round haulouts occur within the PEAA. Ashdown Island, located off the southern tip of Gil Island, is the only identified haulout in the CCAA (75 km south of the PEAA) and hosts sea lions during winter months (see Figure 11-1).
During foraging trips, Steller sea lions may venture many kilometres from rookeries and haulouts. Foraging trips of satellite-tracked adult females in Alaska averaged about 17 km during summer and 153 km during winter (Merrick and Loughlin 1997). In general, Steller sea lions remain within 60 km of land and in water that is less than 400 m deep (COSEWIC 2003b).
Pinnipeds communicate using both airborne and waterborne vocalizations. Research suggests that California sea lions, a similar species, are best adapted to hearing in air (Kastak and Schusterman 1998). Airborne sounds are used by Steller sea lion to establish and defend territories and to compete with other males for access to females (Gentry 1970). Steller females use airborne sounds to establish and maintain mother–pup bonds and to defend territory (Sandegren 1970). Steller sea lions produce clicks, growls, snorts and bleats; in air these vocalizations range from less than 1 to 5 kHz (Peterson and Bartholomew 1969). Underwater sounds of California sea lions are typically limited to barks and clicks at frequencies ranging from 500 Hz to 4 kHz (Schusterman et al. 1966, 1967).
Studies of underwater hearing in male Steller sea lions suggest that they are most sensitive to frequencies from 1 to 16 kHz (Kastelein et al. 2005). For females, the range of best sensitivity is from 16 to 25 kHz, notably higher than that of males (Kastelein et al. 2005). No in-air audiograms were located for this species; however, audiograms do exist for the closely related California sea lion, which was found to be most sensitive to in-air sounds from 2 to 8 kHz (Kastak and Schusterman 1998).
Near the Kitimat Terminal, the background Leq2, 9 h (in-air noise levels) were recorded at levels as low as
18.6 dBA3
2 Leq: the summation of noise events and integrated over a selected period. 3 dBA refers to a sound pressure level that has been A-weighted (in relation to noise humans can detect); this metric therefore is not compatible with sounds and hearing associated with marine mammals.
at nighttime and Leq, 15 h of 21.5 dBA at daytime. These low sound levels are expected given the lack of near and distant anthropogenic sound sources and that dense forest acts as an effective noise absorber.

Sec. 52 Application Volume 6B: Environmental and Socio-Economic Assessment (ESA) – Marine Terminal Section 11: Marine Mammals
Page 11-64 May 2010
Abundance
The Steller sea lion occurs throughout the northwest Pacific from central California north through the Gulf of Alaska, and west through the Aleutian Islands to the Kuril Islands and Kamchatka Peninsula (Loughlin et al. 1984). Since the 1970s, there has been a decline in their overall numbers by over 85% (Loughlin et al. 1992; Trites and Larkin 1996; Calkins et al. 1999). Genetic differences (Bickham et al. 1996) and geographical distribution patterns (Loughlin 1997) form the basis for two recognized and distinct stocks. The western stock occurs west of Cape Suckling (144°) and the eastern stock ranges from southeast Alaska south to California. The western stock is listed as endangered under the US Endangered Species Act. The eastern stock appears to be increasing slightly over its range, but is listed as threatened under the US Endangered Species Act and as Special Concern by COSEWIC in Canada. The 2003 population size for Steller sea lions residing along the British Columbia coast during the breeding season was estimated between 18,400 and 19,700 individuals (Olesiuk 2003). This estimate included individuals of all ages, including non-breeding animals associated with rookeries in southeast Alaska (Olesiuk 2003).
Population Trend
Between 1912 and 1969, predator control programs culled an estimated 49,100 Steller sea lions, and commercial harvests took an additional 5,700 (Bigg 1985). Since the end of these programs, the Steller sea lion population in British Columbia has doubled in size from peak historic levels (Olesiuk 2003). Despite this substantial population growth, no new rookery sites have been reported in British Columbia (COSEWIC 2003b). Since 1970, the British Columbia Steller sea lion population (non-pups) has been increasing at an annual rate of 3.2% (Olesiuk 2003).
Current Threats
Threats to the Steller sea lion population are identified as natural (fluctuations in prey availability, predation and disease) and anthropogenic (hunting, incidental takes in fishing gear, entanglement in debris, catastrophic accidents, environmental contamination, displacement or degradation of habitat and availability of prey) (COSEWIC 2003b).
Steller sea lions are sensitive to human disturbance. Repeated disturbance of breeding or haulout sites by aircraft, boats, construction or fishing activities may result in temporary, and possibly permanent, abandonment of these areas (Lewis 1987; Kucey 2005). Assessing levels of disturbance and recovery in populations of animals is complicated and not fully understood (Kucey 2005). However, displacement from rookeries during pupping is of primary concern with respect to these disturbances. Although the long-term effects of disturbance have not been investigated for the Steller sea lion, studies of other animals have shown that displacement may result in reduced reproductive success, parental care, foraging efficiency, as well as increased stress and vigilance (Andersen et al. 1996; Riffell et al. 1996; Gill et al. 2001; Engelhard et al. 2002). Because there are only three rookeries along the coast of British Columbia, the displacement of animals from even one of these locations could have considerable effects at the population level.

Sec. 52 Application Volume 6B: Environmental and Socio-Economic Assessment (ESA) – Marine Terminal Section 11: Marine Mammals
May 2010 Page 11-65
11.8.2 Effects on Behaviour due to In-Air Noise Presently, several anthropogenic activities produce in-air sound within the PEAA: timber harvesting, commercial and recreational fishing, industrial shipping and overflights by fixed-wing and rotary-wing aircraft.
In-air sound generated by the Project may affect Steller sea lions within the PEAA. The following discussion integrates information on expected levels of in-air sound from the Project during construction, operations and decommissioning, information on Steller sea lions within the PEAA and the species’ known sensitivity to this noise.
11.8.2.1 Effect Mechanisms
Project activities likely to produce loud in-air noise include:
• blasting during onshore infrastructure site preparation (used in road development, site grading and tank terminal construction)
• heavy equipment operation
• onshore construction of the tank terminal
• inwater infrastructure site preparation and construction of the marine terminal
• construction support vehicles
Construction
Based largely on studies of TTS in California sea lions, Southall et al. (2007) estimate that in-air sound 4 levels in excess of 149 dB re (20 µPa)-s(M) are capable of inducing TTS in pinnipeds5
Operations
. It is not expected that in-air noise from construction activities will exceed this sound level except at very close proximities (i.e., within metres). For example, the average in-air sound level of pile driving is approximately 110 dB re (20 µPa)-s(M) at 15 m (Washington State Department of Transport n.d., Internet site). Pile driving is a known loud construction activity. Though not proposed for use in construction of the Kitimat Terminal it serves as a conservative estimate of in-air construction sound.
Received levels of in-air sound capable of invoking changes in sea lion behaviour (hauled out or swimming) were not located; however, the in-air disturbance threshold for sea lions has been determined by NMFS as 100 dBRMS (flat) re 20 µPa (NMFS 2008).
In-air noise from berthed tankers will be less than those from construction related activity. Consequently, change in Steller sea lion behaviour from operation of the Kitimat Terminal will be less likely.
4 Blasting is assumed to result in a single pulse of sound. 5 In-air sound is measured differently than in-water sound.

Sec. 52 Application Volume 6B: Environmental and Socio-Economic Assessment (ESA) – Marine Terminal Section 11: Marine Mammals
Page 11-66 May 2010
Decommissioning
In-air noise generated during decommissioning will likely be similar to those discussed for construction.
11.8.2.2 Mitigation and Effects Management
To reduce the potential adverse environmental effects of in-air noise on Steller sea lions, the following mitigation measures will be implemented:
• work windows for inwater infrastructure site preparation and construction activities will be developed in consultation with DFO. Work windows will take into consideration seasonal Steller sea lion abundance in the PEAA.
• blasting designs will be developed for terrestrial blasting operations to reduce sound propagation at the source
11.8.2.3 Project Residual Effects
Characterization of the Residual Environmental Effect
Heavy equipment operation and underground blasting near northern fur seals generated alert postures (raised heads) at 100 m and 0.6 to 2 km, respectively (Gentry et al. 1990). Presently, no documented study of Steller sea lions being affected by construction activities has been located, although they are known to be a skittish species of pinniped (Kucey 2005).
The closest regularly used Steller sea lion haulout site is approximately 75 km south of the PEAA. In addition, an individual Steller sea lion was observed hauled out 1 to 2 km from the marine terminal at nearby Bish Creek (Anderson 2005, pers. comm.).
In-air sounds generated by construction activity greater than 100 dBRMS (flat) re 20 µPa are likely restricted to within 500 m of the construction site, and therefore are unlikely to induce changes in Steller sea lion behaviour. Examples from the literature (see northern fur seal example, discussed earlier in this section) suggest subtle changes in Steller sea lions are possible if hauled-out within 2 km of the marine terminal but are not expected 75 km away.
Overall, in-air noise from project activities is unlikely to affect Steller sea lion habitat measurably within the PEAA. In-air noise levels from berthed tankers are assumed to be lower than those generated during construction. Based on the expected source levels of construction, operations and decommissioning activities, auditory injury (PTS) and auditory fatigue (TTS) are unlikely to occur. Steller sea lions occurring within the PEAA may exhibit localized (less than 500 m) avoidance of loud construction activities such as blasting.
Known and regularly used Steller sea lion haulouts are unlikely to be affected. Based on this assessment, potential environmental effects of in-air noise on Steller sea lions are considered to be low in magnitude (few individuals affected), short-term in duration, confined, sporadic and reversible.
For a summary of the residual environmental effects of effects on behaviour due to in-air noise, see Table 11-12.
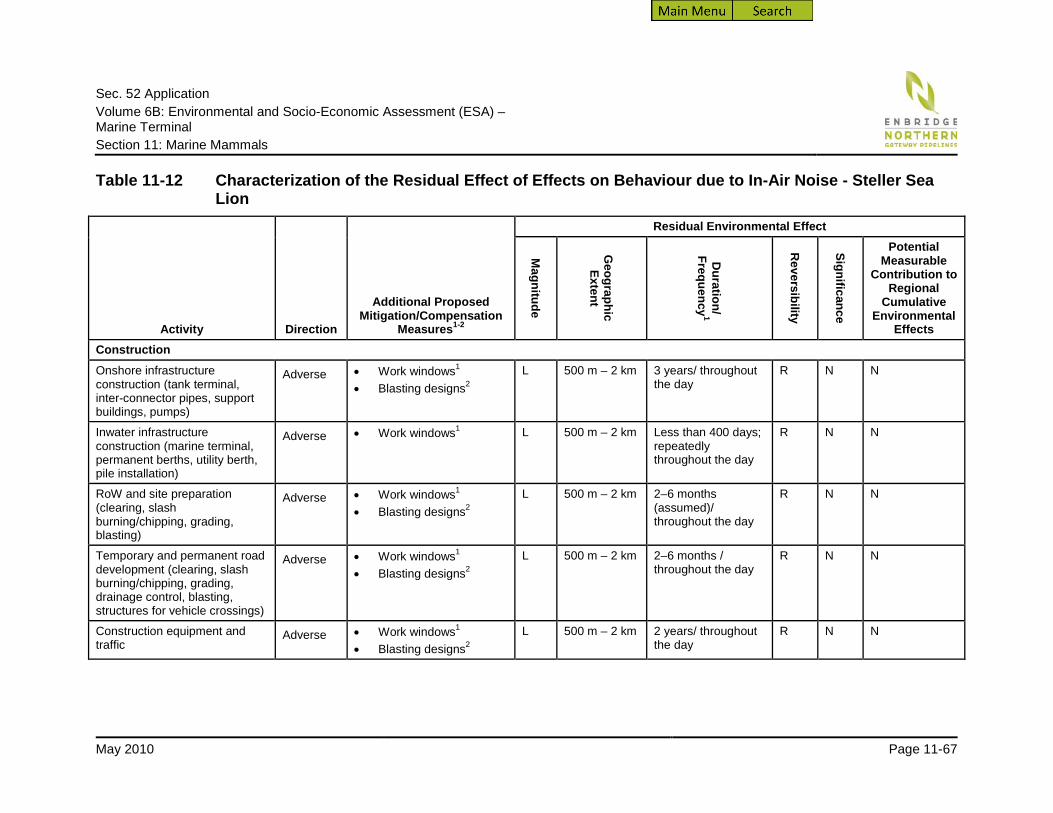
Sec. 52 Application Volume 6B: Environmental and Socio-Economic Assessment (ESA) – Marine Terminal Section 11: Marine Mammals
May 2010 Page 11-67
Table 11-12 Characterization of the Residual Effect of Effects on Behaviour due to In-Air Noise - Steller Sea Lion
Activity Direction
Additional Proposed Mitigation/Compensation
Measures1-2
Residual Environmental Effect
Magnitude
Geographic Extent
Duration/
Frequency1
Reversibility
Significance
Potential Measurable
Contribution to Regional
Cumulative Environmental
Effects Construction
Onshore infrastructure construction (tank terminal, inter-connector pipes, support buildings, pumps)
Adverse • Work windows1 • Blasting designs2
L 500 m – 2 km 3 years/ throughout the day
R N N
Inwater infrastructure construction (marine terminal, permanent berths, utility berth, pile installation)
Adverse • Work windows1 L 500 m – 2 km Less than 400 days; repeatedly throughout the day
R N N
RoW and site preparation (clearing, slash burning/chipping, grading, blasting)
Adverse • Work windows1 • Blasting designs2
L 500 m – 2 km 2–6 months (assumed)/ throughout the day
R N N
Temporary and permanent road development (clearing, slash burning/chipping, grading, drainage control, blasting, structures for vehicle crossings)
Adverse • Work windows1 • Blasting designs2
L 500 m – 2 km 2–6 months / throughout the day
R N N
Construction equipment and traffic
Adverse • Work windows1 • Blasting designs2
L 500 m – 2 km 2 years/ throughout the day
R N N

Sec. 52 Application Volume 6B: Environmental and Socio-Economic Assessment (ESA) – Marine Terminal Section 11: Marine Mammals
Page 11-68 May 2010
Table 11-12 Characterization of the Residual Effect of Effects on Behaviour due to In-Air Noise - Steller Sea Lion (cont’d)
Activity Direction
Additional Proposed Mitigation/Compensation
Measures1-2
Residual Environmental Effect
Magnitude
Geographic Extent
Duration/
Frequency1
Reversibility
Significance
Potential Measurable
Contribution to Regional
Cumulative Environmental
Effects Construction (cont’d)
Pipeline construction (pipe stringing, setting up pipe, opening ditch, blasting, backfilling, clean-up, instream ditching, welding and lowering in, temporary dewatering)
Adverse • Work windows1 • Blasting designs2
L 500 m – 2 km 2–6 months/ throughout the day
R N N
Operations
N/A
Decommissioning
Onshore site restoration (infrastructure removal, site rehabilitation and reclamation)
Adverse • Work windows1 • Blasting designs2
L C Up to 3 years/ throughout the day
R N N
Mitigation: 1. Work windows: Work windows for inwater infrastructure site preparation and construction activities will be developed in consultation with DFO. Work windows
will take into consideration seasonal Steller sea lion abundance in the PEAA. 2. Blasting designs: Blasting designs will be developed for terrestrial blasting operations to reduce sound propagation at the source.
Follow-up and Monitoring: Baseline surveys before construction and marine mammal monitoring during construction (see Sections 11.3 and 11.9)

Sec. 52 Application Volume 6B: Environmental and Socio-Economic Assessment (ESA) – Marine Terminal Section 11: Marine Mammals
May 2010 Page 11-69
Table 11-12 Characterization of the Residual Effect of Effects on Behaviour due to In-Air Noise - Steller Sea Lion (cont’d)
KEY Direction: Positive: enhancement of the
eastern population of Steller sea lions
Adverse: detrimental effect on the eastern population of Steller sea lions
Magnitude: Negligible (N) No measurable
adverse effects on Steller sea lions are anticipated
Low (L) A small number of individual Steller sea lions is affected
Moderate (M) A group of Steller sea lions, such as a seasonal haulout is affected
High (H) A large portion of the eastern population of Steller sea lions, such as a year-round haul out or a rookery, is affected
Geographic Extent: The cumulative physical area over which there will be an effect (distance from marine terminal)
Duration: The length of exposure to a single occurrence of the effect
Frequency: The number of times that the effect occurs per day
Reversibility: R Reversible: The KI is able to
recover from the effect to a state similar to what existed prior to impact. Depending on the effect considered, reversibility may be assessed on both an individual (immediate) and population (long-term) level.
I The KI is unable to recover from the effect
Significance: N not significant S significant
Potential Measurable Contribution to Regional Cumulative Environmental Effects: N No Y Yes
NOTES: 1 Duration and frequency adapted from construction schedule N/A – Not applicable

Sec. 52 Application Volume 6B: Environmental and Socio-Economic Assessment (ESA) – Marine Terminal Section 11: Marine Mammals
Page 11-70 May 2010
Determination of Significance of Residual Effects
With the mitigation, the environmental effect of effects on behaviour due to in-air noise from the Project on Steller sea lions is predicted to be not significant.
11.8.2.4 Cumulative Effect Implications
Screening for Cumulative Effects
In-air noise from the construction and operation of the Kitimat Terminal will overlap spatially and temporally with noise from the following existing projects:
• Eurocan Pulp and Paper Co. plant and terminal • Methanex Corporation plant and terminal • Rio Tinto Alcan Primary Metal British Columbia aluminum smelter
Approved projects that will overlap are Kitimat LNG Inc. terminal and Arthon Construction Ltd. and Sandhill Materials project.
However, the biological implications of repeated Steller sea lion behavioural change, habitat avoidance (and presumably communication masking) in a very small portion of their range (Kitimat Arm), although unknown, are expected to be of negligible magnitude. Neither the existing level of in-air noise nor the project contribution to these emissions is likely to affect the viability or sustainability of the Steller sea lion population. As a result, cumulative environmental effects are not considered further in this assessment.
11.8.2.5 Prediction Confidence
Confidence in the prediction of significance for the environmental effect of behavioural change due to in-air noise on Steller sea lions is rated as moderate. This rating is due largely to:
• the lack of known received levels of in-air sound capable of inducing behavioural change • the fact that Steller sea lion use of the PEAA is not well understood
As a result of the moderate level of confidence in the prediction of the environmental effect of behavioural change due to noise, Northern Gateway will undertake a follow-up program to assess the response of Steller sea lions and other marine mammals to construction and operational activities (see Section 11.9).
11.8.3 Effects on Behaviour due to Underwater Noise
11.8.3.1 Effect Mechanisms
During construction of the marine terminal, Steller sea lions occurring within the PEAA may be exposed to elevated underwater sound levels.
During operations, most anthropogenic sound will originate from berthed tankers. Sound from line-handling boats will be less than that from a berthed tanker and therefore, is not considered further.

Sec. 52 Application Volume 6B: Environmental and Socio-Economic Assessment (ESA) – Marine Terminal Section 11: Marine Mammals
May 2010 Page 11-71
Inwater noise generated from decommissioning activities will likely be similar to those discussed for construction.
11.8.3.2 Mitigation and Effects Management
To reduce the likelihood and extent of potential adverse environmental effects of underwater noise on Steller sea lions, the following mitigation measures and best industry practices will be implemented:
• work windows for inwater infrastructure site preparation and construction activities will be developed in consultation with DFO. Work windows will take into consideration seasonal Steller sea lion abundance in the PEAA.
• underwater bubble curtains will be used to contain shock waves from blasting
11.8.3.3 Project Residual Effects
Characterization of the Residual Environmental Effect
Construction
Like NR killer whales and NP humpback whales, Steller sea lions may avoid areas of the PEAA during loud construction activities. To understand how Steller sea lion behaviour may be changed by underwater construction sound, acoustic modelling of a representative activity (clamshell dredging) was completed (see Figure 11-8).
From this modelling, Steller sea lions are unlikely to demonstrate behavioural responses when the NMFS (Federal Register 2005) criterion of 120 dB re 1 µPa for behavioural responses in marine mammals is considered (see Figure 11-1). In addition, responses of other pinnipeds (e.g., ringed seals, bearded seals) suggest very little change in behaviour is detected at relatively high received noise levels (e.g., 150 to 160 dB re 1 µPa). Based on this, Steller sea lions are unlikely to show behavioural responses during construction of the Kitimat Terminal.
Operations
Source levels from a berthed tanker (160 to 190 dB re 1 µPa at 1 m; see Table 11-2) are unlikely to induce TTS, PTS or behavioural responses in Steller sea lions (for the same reasons outlined for construction).
Vessel-based sound (predominantly low in acoustic frequency) is audible to Steller sea lions, but is outside their range of best sensitivity (see Figure 11-7). Behavioural observations of Steller sea lions suggest these animals are not highly sensitive to underwater vessel sounds. When sea lions are in the water, they are generally tolerant of vessel traffic and have been known to approach fishing vessels (Richardson et al. 1995). Steller sea lions have been observed foraging in areas of high vessel traffic (e.g., Fraser River mouth; Bigg 1985).

200 m
100
m
100 m
200 m
100
m
300 m
200
m
100
m
Kitimat
Minette Bay
KitamaatVillage
KitimatTerminal
K i t i
m a
t A
r m
BishCove
EmsleyCove
EmsleyPoint
CostePoint
CosteIsland
ClioBay
GobeilBay
Kitimat River
CreekBish
200 m
100
m
Pipeline Route
Security Fence
Terrestrial PDA
Marine PDA
Sound Level(dB re threshold)
0
5
10
15
20
25
30
35
40
45
50
55
60
Bathymetric Contour (100 m)
Railway
Road
NP
Jacques Whitford AXYS Ltd.
FIGURE NUMBER:
PROJECTION:
CONTRACTOR: DATE:
AUTHOR: APPROVED BY:PREPARED FOR:PREPARED BY: SCALE:
ENB R ID GE N OR TH ER N GA T EW A Y P RO J EC T 11-8
NAD 83DATUM:
1:110,000
UTM 9
CM
100
m
200
m
Inset1:40,000
KitimatTerminal
Steller Sea Lion -Predicted Sound Levels above Hearing Threshold
from Clamshell Dredging, Kitimat Terminal
0 1 2 3
Kilometres
JWA-1048334-1585
REFERENCES: NTDB Topographic Mapsheets provided by the Majesty the Queen in Right of Canada, Department of Natural Resources. All rights reserved.
20090911
R:\2
009F
isca
l\104
8334
_Nor
ther
nGat
eway
_ES
A_2
009Reference: Pipeline Route R
Sec. 52 Application Volume 6B: Environmental and Socio-Economic Assessment (ESA) – Marine Terminal Section 11: Marine Mammals
May 2010 Page 11-73
Summary
Overall, underwater noise from construction, operations and decommissioning of the Project is not likely to affect Steller sea lions within the PEAA. Based on expected source levels, auditory injury (PTS) and auditory fatigue (TTS), behavioural changes and communication masking are considered unlikely.
Known and regularly used Steller sea lion haulouts will not be affected by construction, operation or decommissioning of the Project. Potential changes in Steller sea lion behaviour (due to underwater noise) during the construction, operation and decommissioning phases are considered to be low in magnitude (few individuals will be affected), both short term (construction) and long term in duration (during life of the Project), confined to the PDA and PEAA, both sporadic and regular (construction will be sporadic, operations will produce regular underwater noise) and reversible.
For a summary of the residual environmental effects of underwater noise, see Table 11-13.
Determination of Significance of Residual Effects
With the mitigation measures, the effects of the Project on behavioural changes in Steller sea lions due to underwater noise are predicted to be not significant.
11.8.3.4 Cumulative Effect Implications
Screening for Cumulative Effects
Screening for cumulative effects of Steller sea lion behavioural change due to underwater noise follows the criteria outlined in Section 4.2.3.2.
Underwater noise from construction and operation of the Kitimat Terminal will overlap spatially and temporally with underwater noise for the following existing projects:
• Eurocan Pulp and Paper Co. plant and terminal • Methanex Corporation plant and terminal • Rio Tinto Alcan Primary Metal British Columbia aluminum smelter
Approved projects that will overlap are Kitimat LNG Inc. terminal and Arthon Construction Ltd. and Sandhill Materials project.
However, the biological implications of repeated Steller sea lion behavioural change, habitat avoidance (and presumably communication masking) in a very small portion of their range (Kitimat Arm) are unknown but are expected to be of negligible magnitude. Neither the existing level of underwater noise nor the project contribution to these emissions is likely to affect the viability or sustainability of the Steller sea lion population. As a result, cumulative environmental effects are not considered further in this assessment.

Sec. 52 Application Volume 6B: Environmental and Socio-Economic Assessment (ESA) – Marine Terminal Section 11: Marine Mammals
Page 11-74 May 2010
Table 11-13 Characterization of the Residual Effects on Behaviour due to Underwater Noise - Steller Sea Lion
Activity Direction
Additional Proposed Mitigation/Compensation
Measures1-3
Residual Environmental Effect
Magnitude
Geographic Extent
Duration/
Frequency
Reversibility
Significance
Potential Measurable
Contribution to Regional
Cumulative Environmental
Effects Construction Inwater infrastructure site preparation (dredging, pile drilling)
Adverse • Work windows1 • Marine mammal monitoring
program2
L Zero (not expected)
N/A N/A N N
Inwater infrastructure construction (marine terminal, berths, pile installation)
Adverse • Marine mammal monitoring program2
L Zero (not expected)
N/A N/A N N
Operations Berthed tankers (and associated combustion emissions, inert gas exchange, prop wash, noise, boom deployment)
Adverse • Berthed vessel noise reduction measures 3
L Zero (not expected)
N/A N/A N N
Decommissioning Inwater site restoration (infrastructure removal)
Adverse • Marine mammal monitoring program
L Zero (not expected)
N/A N/A N N

Sec. 52 Application Volume 6B: Environmental and Socio-Economic Assessment (ESA) – Marine Terminal Section 11: Marine Mammals
May 2010 Page 11-75
Table 11-13 Characterization of the Residual Effects on Behaviour due to Underwater Noise - Steller Sea Lion (cont’d)
Mitigation: 1. Work windows: Work windows for inwater infrastructure site preparation and construction activities will be developed in consultation with DFO. Work windows will take
into consideration seasonal Steller sea lion abundance in the PEAA. 2. Marine mammal monitoring program: Northern Gateway will implement a mandatory marine mammal monitoring program at the marine terminal. During inwater
infrastructure site preparation and construction activities (i.e., dredging, drilling), trained MMOs will monitor a pre-determined safety radius around the acoustic source. If a marine mammal enter this safety radius, the construction activity will be temporarily stopped, until the marine mammal has moved beyond the safety radius.
3. Berthed Vessel Noise Reduction Measures: Tankers berthed at the marine terminal will employ measures to reduce underwater noise, including limiting the use of auxiliary generators for power and maintaining auxiliary power equipment.
Follow-up and Monitoring: Baseline surveys before construction and marine mammal monitoring during construction KEY Refer to Table 11-12
NOTE: N/A – Not applicable

Sec. 52 Application Volume 6B: Environmental and Socio-Economic Assessment (ESA) – Marine Terminal Section 11: Marine Mammals
Page 11-76 May 2010
11.8.3.5 Prediction Confidence
Confidence in the prediction of significance for the environmental effect of behavioural change due to underwater noise is rated as moderate. This rating is based on the following:
• Literature specific to the effects of underwater noise on Steller sea lions is not available.
• Available information on other pinnipeds and previous experience suggest pinnipeds are not greatly affected by underwater noise.
11.8.3.6 Effects on Physical Auditory Systems from Underwater Noise
Based on Southall et al. (2007) sound exposure criteria, underwater noise from construction activities is unlikely to induce PTS or TTS in Steller sea lions within the PEAA. In pinnipeds, TTS from underwater noise is thought to occur at sound pressure levels in excess of 218 dB re 1 µPa. Sounds of this intensity are not predicted to occur during construction of the Kitimat Terminal (see Figure 11-1). Source levels from a tanker on standby (168 dB re 1 µPa at 1 m; see Table 11-2 and Figure 11-2) are unlikely to induce TTS, PTS or behavioural responses in Steller sea lions (for the same reasons outlined for construction).
11.8.4 Effects on Steller Sea Lion from Physical Injury due to Blasting
11.8.4.1 Effect Mechanisms
Terrestrial and underwater blasting will be required during construction of the Kitimat Terminal. Blasting has the potential to physically injure Steller sea lions within the PEAA (for potential environmental effects from in-air noise from blasting, see Section 11.8.2). Direct mortality or injury may occur if a Steller sea lion is close to the detonated explosives (e.g., less than 500 m).
Although pinnipeds, such as Steller sea lions, are not easily affected by underwater noise (see Section 11.8.3), behavioural responses in animals may include avoidance responses, decreased foraging activity and increased energy expenditure.
No information pertaining to known reactions of pinnipeds to underwater sound generated by blasting was found. Potential changes to Steller sea lion behaviour may therefore be expected within the PEAA, but likely will be limited in duration and minor in nature.
11.8.4.2 Mitigation and Effects Management
To reduce the likelihood of injury or direct mortality to Steller sea lions, Northern Gateway will develop a Blasting Management Plan as described for NR killer whales and NP humpback whales.

Sec. 52 Application Volume 6B: Environmental and Socio-Economic Assessment (ESA) – Marine Terminal Section 11: Marine Mammals
May 2010 Page 11-77
11.8.4.3 Residual Effects
Characterization of the Residual Environmental Effect
Underwater blasting for the Project will occur over a short period (approximately three weeks) and will be governed by the Blasting Management Plan (according to DFO guidelines). Mitigation measures (e.g., before any blasting, using underwater bubble curtains and the use of dedicated marine mammal detection surveys up to and beyond the area of anticipated environmental effects) will also be implemented to reduce potential adverse environmental effects on Steller sea lions.
Based on the sensitivity of Steller sea lions to underwater sound and implementation of known effective mitigation measures, the potential environmental effects of blasting on Steller sea lions are considered to be low in magnitude (few animals will be affected), short-term in duration, confined to the PDA or PEAA, sporadic and reversible.
For a summary of the residual environmental effects of injury due to blasting, see Table 11-14.
Determination of Significance of Residual Effects
With the mitigation measures, the potential environmental effects on Steller sea lions (i.e., physical injury due to blasting) are predicted to be not significant.
11.8.4.4 Cumulative Effect Implications
Screening for Cumulative Effects
Because there is no reasonably expected residual environmental effect on Steller sea lions from physical injury due to blasting and no other similar sources of physical injury to sea lions are expected to occur during the blasting activities, cumulative environmental effects are deemed unlikely and are not considered further in this assessment.
11.8.4.5 Prediction Confidence
Confidence in the prediction of significance for the environmental effect of physical injury due to blasting is rated as high. This rating is based on the development of the Blasting Management Plan, which will effectively reduce the risk of physical injury to Steller sea lions.

Sec. 52 Application Volume 6B: Environmental and Socio-Economic Assessment (ESA) – Marine Terminal Section 11: Marine Mammals
Page 11-78 May 2010
Table 11-14 Characterization of the Residual Effect on Steller Sea Lion from Physical Injury due to Blasting
Activity Direction
Additional Proposed Mitigation/Compensation
Measures1-7
Residual Environmental Effect
Magnitude
Geographic Extent
Duration/
Frequency
Reversibility
Significance Potential
Measurable Contribution to
Regional Cumulative
Environmental Effects
Construction Blasting associated with inwater or onshore infrastructure site preparation, temporary and permanent road development, or pipeline construction
Adverse • DFO guidelines1 • Calculation of danger zone2 • Overpressure reduction3 • Bubble curtains4 • Marine mammal detection
surveys5 • Blasting Management Plan6 • Work windows7
L Physical injury at less than 500 m; Behavioural change at greater than 500 m and within the PEAA
Several weeks/ numerous times per day
R (I for PTS)
N N
Operations
N/A Decommissioning N/A

Sec. 52 Application Volume 6B: Environmental and Socio-Economic Assessment (ESA) – Marine Terminal Section 11: Marine Mammals
May 2010 Page 11-79
Table 11-14 Characterization of the Residual Effect on Steller Sea Lion from Physical Injury due to Blasting (cont’d) Mitigation: 1. DFO guidelines: Ensure underwater blasting activities comply with DFO guidelines. 2. Calculation of danger zone: Calculate the zone of potential physical injury (danger zone) to marine mammals before construction (based on blast design). 3. Overpressure reduction: Efforts will be made during the blasting design to reduce overpressure. 4. Bubble curtains: Underwater bubble curtains will be used to contain shock waves from blasting. 5. Marine mammal detection surveys: Conduct dedicated marine mammal detection surveys up to and beyond the danger zone before any blasting. During blasting
activities, if a mammal is detected in a predetermined danger zone, blasting will be suspended until the mammal is beyond the danger zone. This is to reduce the exposure of marine mammals to blasting effects.
6. Blasting Management Plan: Develop a Blasting Management Plan that uses the lowest weight of explosives necessary. Mitigation measures identified in this table will also be included in the plan.
7. Work windows: Work windows for inwater infrastructure site preparation and construction activities will be developed in consultation with DFO. Work windows will take into consideration seasonal Steller sea lion abundance in the PEAA.
Follow-up and Monitoring: Baseline surveys on the current distribution and abundance of marine mammals in the PEAA will be undertaken before construction and marine mammal monitoring during construction and initial operation KEY Refer to Table 11-12
NOTE: N/A – Not applicable

Sec. 52 Application Volume 6B: Environmental and Socio-Economic Assessment (ESA) – Marine Terminal Section 11: Marine Mammals
Page 11-80 May 2010
11.9 Follow-up and Monitoring for Marine Mammals Follow-up studies are included to verify predictions made in the assessment of potential environmental effects on marine mammals. As indicated, information pertaining to marine mammal abundance, behaviour, ecology and distribution within Kitimat Arm is presently limited. Consequently, information on the current distribution and abundance of marine mammals in the PEAA is required to verify predictions of potential environmental effects.
To fill this data gap, dedicated marine mammal studies will be undertaken. Basic elements of these studies will include:
• the use of statistically rigorous distance sampling techniques
• a duration sufficient to provide an accurate baseline (e.g., before construction) which can account for variability between years (about two to three years)
• a minimum sampling frequency capable of resolving seasonal changes in marine mammal abundance (e.g., six to 12 times per year)
• an optimal viewing and detection platform
• behavioural studies of marine mammals, where possible
It would be beneficial to have Aboriginal technicians, preferably from the Haisla First Nation, participating in the studies.
Consideration will also be given to the deployment of hydrophones at or near the Kitimat Terminal to collect data on marine mammal vocalizations. Acoustic studies to determine the degree of change in baseline conditions resulting from project activities and in particular cumulative environmental effects will also be considered.
The following monitoring is to confirm the effectiveness of mitigation measures and to identify and address any environmental effects experienced that were not predicted (i.e., accuracy of the assessment).
During inwater infrastructure site preparation and construction activities (i.e., dredging, drilling), trained MMOs6
6 It would be useful to have Aboriginal technicians, preferably from the Haisla First Nation, participate as MMOs.
will monitor a pre-determined safety radius around the acoustic source. If a Steller sea lion or cetacean enters this safety radius, the construction activity will be temporarily stopped until the marine mammal has moved beyond the safety radius. Safety distances for blasting activities will be specific to Steller sea lions and cetaceans likely present in the PEAA and will be detailed in the Blasting Management Plan.
To evaluate the effectiveness of construction-related mitigation measures, monitoring of marine mammal abundance before, during and after construction will be conducted. This monitoring will incorporate the study design (sampling techniques, duration, frequency, etc.) determined for follow-up and baseline marine mammal detection studies. Potential changes to marine mammal abundance, diversity and behaviour will be reported following termination of construction.

Sec. 52 Application Volume 6B: Environmental and Socio-Economic Assessment (ESA) – Marine Terminal Section 11: Marine Mammals
May 2010 Page 11-81
To evaluate the accuracy of the assessment of potential environmental effects on marine mammals during marine terminal operations, marine mammal surveys of the PEAA will be carried out at regular intervals throughout the construction phase and the initial operational phase. Observers will collect data on marine mammal abundance and distribution in a fashion similar to that described for the follow-up marine mammal detection studies. These data will be compared with data collected during baseline field surveys to determine the nature and extent of changes in marine mammal abundance or distribution, should any occur.
11.10 Summary of Project Environmental Effects on Marine Mammals
For a summary of the residual environmental effects of the Project on marine mammals, see Table 11-15.
11.10.1 Northern Resident Killer Whale Of the activities associated with the construction, operation and decommissioning of the Kitimat Terminal, those creating underwater noise (e.g., dredging and berthed tankers) are the most likely to affect killer whales. This assessment has demonstrated that loud underwater activities (clamshell dredging and berthed tankers) are unlikely to physically harm killer whales and that the effects of changes in their behaviour on the long-term viability of the NR killer whale population are predicted to be negligible in magnitude.
Even though use of the PEAA by NR killer whales is not well understood, potential environmental effects of underwater noise on NR killer whales are predicted to be not significant, primarily because the potential effects are minor and localized relative to the range of the NR killer whale population. Furthermore, the majority of underwater noise associated with construction, operations and decommissioning are believed to be outside the predominant frequency range of NR killer whale hearing.
Blasting is also unlikely to result in injury or direct mortality of killer whales. The Blasting Management Plan will effectively prevent adverse environmental effects.
Based on this assessment, the residual project environmental effects of blasting on NR killer whales are predicted to be not significant.

Sec. 52 Application Volume 6B: Environmental and Socio-Economic Assessment (ESA) – Marine Terminal Section 11: Marine Mammals
Page 11-82 May 2010
Table 11-15 Summary of Residual Environmental Effects on Marine Mammals
Potential Effect Mitigation1-10
Residual Environmental Effect
Magnitude Geographic
Extent Duration/
Frequency Reversibility Significance Prediction Confidence
Construction Effects on behaviour due to underwater noise
• Work windows1 • Berthed vessel noise reduction
measures 2 • Marine mammal monitoring
program3
L 0 – 2 km Up to 400 days; repeatedly throughout the day
R N Low - Moderate
Effects on marine mammals from physical injury due to blasting
• DFO guidelines4 • Calculation of danger zone5 • Overpressure reduction6 • Bubble curtains7 • Marine mammal detection
surveys8 • Blasting Management Plan9
L Physical injury at less than 500 m; Effects on behaviour at greater than 500 m and within the PEAA
Several weeks/numerous times per day
R (I for PTS) N High
Effects on behaviour due to in-air noise
• Work windows1 • Blasting designs10
L 500 m – 2 km 2 months – 2 years/ throughout the day
R N Moderate
Operations Effects on behaviour due to underwater noise
• Berthed vessel noise reduction measures 2
L Up to 2 km 24 hours; 220 tankers per year
R N Low - moderate

Sec. 52 Application Volume 6B: Environmental and Socio-Economic Assessment (ESA) – Marine Terminal Section 11: Marine Mammals
May 2010 Page 11-83
Table 11-15 Summary of Residual Environmental Effects on Marine Mammals (cont’d)
Potential Effect Mitigation1-10
Residual Environmental Effect
Magnitude Geographic
Extent Duration/
Frequency Reversibility Significance Prediction Confidence
Decommissioning Effects on behaviour due to Underwater Noise
• Work windows1 • Berthed vessel noise reduction
measures 2 • Marine mammal monitoring
program3
L 0 – 2 km Up to 400 days; repeatedly throughout the day
R N Low - Moderate
Effects on behaviour due to In-Air Noise
• Work windows1 • Blasting designs10
L 500 m – 2 km 2 months – 2 years/ throughout the day
R N Moderate
Cumulative Environmental Effects N/A Combined Effects Project-specific • Work windows1
• Blasting designs10 • Marine mammal monitoring
program3 • Berthed vessel noise reduction
measures2 DFO guidelines4 • Calculation of danger zone5 • Work windows1 • Overpressure reduction6 • Bubble curtains7 • Marine mammal detection
surveys8 • Blasting Management Plan9
L 0 – 2 km Up to 3 years (in-air), up to 400 days (in-water); regularly throughout the day
R (I for PTS) N Low - Moderate
Cumulative effects • N/A

Sec. 52 Application Volume 6B: Environmental and Socio-Economic Assessment (ESA) – Marine Terminal Section 11: Marine Mammals
Page 11-84 May 2010
Table 11-15 Summary of Residual Environmental Effects on Marine Mammals (cont’d) Mitigation: 1. Work windows: Work windows for inwater infrastructure site preparation and construction activities will be developed in consultation with DFO. Work windows will take
into consideration seasonal NR killer whale, NP humpback whale and Steller sea lion abundance in the PEAA. 2. Berthed Vessel Noise Reduction Measures: Tankers berthed at the marine terminal will employ measures to reduce underwater noise, including limiting the use of
auxiliary generators for power and maintaining auxiliary power equipment. 3. Marine mammal monitoring program: Implement a mandatory marine mammal monitoring program at the marine terminal. During inwater infrastructure site preparation
and construction activities (i.e., dredging, drilling), trained MMOs will monitor a pre-determined safety radius around the acoustic source. If a marine mammal enters this safety radius, the construction activity will be temporarily stopped until the marine mammal has moved beyond the safety radius.
4. DFO guidelines: Ensure project activities at Kitimat Terminal comply with DFO guidelines for underwater blasting. 5. Calculation of danger zone: Calculate the zone of potential physical injury (danger zone) to marine mammals before construction (based on blast design). 6. Overpressure reduction: Efforts will be made during the blasting design to reduce overpressure. 7. Bubble curtains: Underwater bubble curtains will be used to contain shock waves from blasting. 8. Marine mammal detection surveys: Conduct dedicated marine mammal detection surveys up to and beyond the danger zone before any blasting. During blasting
activities, if a mammal is detected in a predetermined danger zone, blasting will be suspended until the mammal is beyond the danger zone. This is to reduce the exposure of marine mammals to blasting effects.
9. Blasting Management Plan: Develop a Blasting Management Plan that uses the lowest weight of explosives necessary. Mitigation measures identified in this table will also be included in the plan.
10. Blasting designs: Blasting designs will be developed for terrestrial blasting operations to reduce sound propagation at the source.
Follow-up and Monitoring: Baseline surveys before construction and marine mammal monitoring during construction and initial operation KEY Refer to Tables 11-5, 11-9 and 11-12
NOTE: N/A – Not applicable

Sec. 52 Application Volume 6B: Environmental and Socio-Economic Assessment (ESA) – Marine Terminal Section 11: Marine Mammals
May 2010 Page 11-85
11.10.2 North Pacific Humpback Whales Of the activities associated with the construction, operation and decommissioning of the Kitimat Terminal (and other projects and activities identified in Volume 6A, Appendix 3A), those creating underwater noise (e.g., dredging and berthed tankers on standby) are the most likely to affect NP humpback whales.
Underwater sounds made by the Project are predominantly within the hearing range of humpback whales. Consequently, habitat avoidance and behavioural changes may occur within small areas near the marine terminal. Communication masking may occur over moderately large areas within Kitimat Arm (and possibly extend slightly beyond Kitimat Arm).
Although use of the PEAA by humpback whales is not well understood, potential environmental effects (habitat avoidance, behavioural change, reduced foraging and communication masking) within Kitimat Arm are unlikely to affect the viability or sustainability of the NP population. This is because Kitimat Arm represents a small portion of total available NP humpback whale habitat.
With mitigation measures (e.g., the Blasting Management Plan), blasting is also unlikely to result in injury or direct mortality of humpback whales.
Based on this assessment and implementation of the mitigation measures, residual environmental effects of the Project on humpback whales are predicted to be not significant.
11.10.3 Summary of Effects on Steller Sea Lion Available literature and previous experience suggests pinnipeds are relatively resilient to in-air and inwater noise. Hence, noises (in-air and inwater) related to construction, operation and decommissioning of the Project are unlikely to affect Steller sea lions.
With the implementation of mitigation measures, the likelihood of adverse environmental effects from the Project on Steller sea lions is considered low. Known and regularly used Steller sea lion haulout sites will not be affected, as the nearest major haulout is approximately 75 km from the PEAA. Individual Steller sea lions hauled out in the PEAA are unlikely to be temporarily displaced by loud construction noise at the Kitimat Terminal, unless they are very close (e.g., less than 50 m).
The Blasting Management Plan will be in place before blasting. Consequently, blasting will not result in auditory injury or direct mortality of Steller sea lions. Although a few individuals might experience limited and temporary changes in behaviour, population level. The magnitude of such changes in behaviour are expected to be negligible.
Based on this assessment, combined residual project environmental effects on Steller sea lions are predicted to be not significant.
Based on this assessment, and with the mitigation measures, residual environmental effects of the Project on marine mammals are predicted to be not significant.

Sec. 52 Application Volume 6B: Environmental and Socio-Economic Assessment (ESA) – Marine Terminal Section 11: Marine Mammals
Page 11-86 May 2010
11.11 References
11.11.1 Literature Cited Andersen, R., J.D.C. Linnell and R. Langvatn. 1996. Short term behavioural and physiological response
of moose Alces alces to military disturbance in Norway. Biological Conservation. 77, 169.
Baird, R.W. 2001. Status of harbour seals, Phoca vitulina, in Canada. Canadian Field-Naturalist 115(4): 663–675.
Baker, C.S., L.M. Herman, A. Perry, W.S. Lawton, J.M. Straley and J.H. Straley. 1985. Population characteristics and migration of summer and late-season humpback whales (Megaptera novaeangliae) in southeastern Alaska. Marine Mammal Science 1: 304–323.
Baker, C.S., M.T. Weinrich, G. Early and S. Palumbi. 1994. Genetic impact of an unusual group mortality among humpback whales. Journal of Heredity 85(1): 53–54.
Ban, S. and A.W. Trites. 2007. Quantification of terrestrial haul-out and rookery characteristics of Steller sea lions. Marine Mammal Science. 23, 496.
Best, P.B. 1993. Increase rates in severely depleted stocks of baleen whales. ICES Journal of Marine Science 50: 169–186.
Biassoni, N., P.J. Miller and P.L. Tyack. 2000. Preliminary Results of the Effects of SURTASS-LFA Sonar on Singing Humpback Whales. Woods Hole Oceanographic Institute. Technical Report 2000-06. Woods Hole, MA.
Bickham, J.W., J.C. Patton and T.R. Loughlin. 1996. High variability for control-region sequences in a marine mammal: Implications for conservation and biogeography of Steller sea lions (Eumetopias jubatus). Journal of Mammalogy 77: 95.
Bigg, M.A. 1985. Status of the Steller sea lion (Eumetopias jubatus) and California sea lion (Zalophus californianus) in British Columbia. Canadian Special Publication on Fisheries and Aquatic Sciences 77. Canadian Government Publishing. Ottawa, ON.
Bigg, M.A., G.M. Ellis, P. Cottrell and L. Milette. 1990. Predation by harbour seals and sea lions on adult salmon in Comox Harbour and Cowichan Bay, British Columbia. Canadian Technical Report of Fisheries and Aquatic Sciences 1769. Fisheries and Oceans Canada. Ottawa, ON.
British Columbia Cetacean Sightings Network (BCCSN). 2005. British Columbia Cetacean Sightings Database. Vancouver Aquarium Marine Science Centre. Vancouver, BC.
Calambokidis, J. and J. Barlow. 2004. Abundance of Blue and Humpback Whales in the Eastern Northern Pacific Estimated by Capture-Recapture and Line-Transect Methods. Marine Mammal Science 20(1): 63–85.
Calambokidis, J., E.A. Falcone, T.J. Quinn, A.M. Burdin, P.J. Clapham, J.K.B. Ford et al. 2008. SPLASH: Structure of Populations, Levels of Abundance and Status of Humpback Whales in the North Pacific. Prepared by Cascadia Research for U.S. Department of Commerce.

Sec. 52 Application Volume 6B: Environmental and Socio-Economic Assessment (ESA) – Marine Terminal Section 11: Marine Mammals
May 2010 Page 11-87
Calambokidis, J., G.H. Steiger, J.M. Straley, L.M. Herman, S. Cerchio, D.R. Salden, et al. 2001. Movements and population structure of humpback whales in the north Pacific. Marine Mammal Science 17(4): 769–794.
Calambokidis, J., G.H. Steiger, J.M. Straley, T.J. Quinn, L.M. Herman, S. Cerchio, et al. 1997. Abundance and Population Structure of Humpback Whales in the North Pacific Basin (Final Report under Contract No. 50ABNF500113). Southwest Fisheries Science Center, National Marine Fisheries Service. La Jolla, CA.
Calkins, D.G., D.C. McAllister and K.W. Pitcher. 1999. Steller sea lion status and trend in southeast Alaska: 1979–1997. Marine Mammal Science 15: 462–477.
Capuzzo, J.M., J.W. Farrington, P. Rantamaki, C.H. Clifford, B.A. Lancaster, D.F. Leavitt et al. 1989. The relationship between lipid concentration and seasonal differences in the distribution of PCBs in Mytilus edulis. Marine Environmental Research 28: 259–264.
Chittleborough, R.G. 1965. Dynamics of two populations of the humpback whale. Megaptera novaeangliae (Borowski). Australian Journal of Marine and Freshwater Research 16: 33–128.
Committee on the Status of Endangered Wildlife in Canada (COSEWIC). 2003a. COSEWIC Assessment and Update Status Report on the Harbour Porpoise Phocoena phocoena (Pacific Ocean Population) in Canada. Committee on the Status of Endangered Wildlife in Canada. Canadian Wildlife Service, Environment Canada. Ottawa, ON.
Committee on the Status of Endangered Wildlife in Canada (COSEWIC). 2003b. COSEWIC Assessment and Update Status Report on the Humpback Whale Megaptera novaeangliae in Canada. Committee on the Status of Endangered Wildlife in Canada. Canadian Wildlife Service, Environment Canada. Ottawa, ON.
Committee on the Status of Endangered Wildlife in Canada (COSEWIC). 2003c. COSEWIC Assessment and Update Status Report on the Steller Sea Lion Eumetopias jubatus in Canada. Committee on the Status of Endangered Wildlife in Canada. Canadian Wildlife Service, Environment Canada. Ottawa, ON.
Committee on the Status of Endangered Wildlife in Canada (COSEWIC). 2008. COSEWIC Assessment and Update Status Report on the Killer Whale Orcinus orca, Southern Resident Population, Northern Resident population, West Coast Transient population, Offshore population and Northwest Atlantic / Eastern Arctic population in Canada. Committee on the Status of Endangered Wildlife in Canada. Canadian Wildlife Service, Environment Canada. Ottawa, ON.
Darling, J.D. and D.J. McSweeney. 1985. Observations on the migrations of North Pacific humpback whales (Megaptera novaeangliae). Canadian Journal of Zoology 63: 308–314.
Darling, J.D., J. Calambokidis, K.C. Balcomb, P. Bloedel, K. Flynn and A. Mochizuki. 1996. Movement of a humpback whale (Megaptera novaeangliae) from Japan to British Columbia and return. Marine Mammal Science 12: 281–287.

Sec. 52 Application Volume 6B: Environmental and Socio-Economic Assessment (ESA) – Marine Terminal Section 11: Marine Mammals
Page 11-88 May 2010
DFO. 1986. The Department of Fisheries and Oceans Policy for the Management of Fish Habitat. Communications Directorate, Department of Fisheries and Oceans Fish Habitat Management Branch. Ottawa, ON.
DFO. 2008. Recovery Strategy for the Northern and Southern Resident Killer Whales (Orcinus orca) in Canada. Species at Risk Act Recovery Series. Recovery Secretariat Ottawa, ON.
Ellis, G.M., J.K.B. Ford and J.R. Towers. 2007. Northern Resident Killer Whales in British Columbia: Photo-Identification Catalogue 2007. Fisheries and Oceans Canada, Pacific Biological Station. Nanaimo, BC.
Engelhard, G.H., A.N.J. Baarspul, M. Broekman, J.C.S. Creuwels and P.J.H. Reijnders. 2002. Human disturbance, nursing behaviour, and lactational pup growth in a declining southern elephant seal (Mirounga leonina) population. Canadian Journal of Zoology 80: 1876–1886.
Erbe, C. 2002. Underwater noise of whale-watching boats and potential effects on killer whales (Orcinus orca), based on an acoustic impact model. Marine Mammal Science 18(2): 394–418.
Evans, P.G.H. and J.A. Raga. 2001. Marine Mammals: Biology and Conservation. Kluwer Academic/Plenum Publishers. New York, NY.
Federal Register. 2005. Doc. 05-525; Endangered Fish and Wildlife; Notice of Intent to Prepare an Environmental Impact Statement. National Oceanic and Atmospheric Administration. United States Environmental Protection Agency.
Ford, J.K.B and G.M. Ellis. 2006. Prey selection and food sharing by fish eating killer whales (Orcinus orca) in British Columbia. Marine Ecology Progress Series 319: 185–199.
Ford, J.K.B. and G.M. Ellis. 2005. Prey selection and food sharing by fish-eating 'resident' killer whales (Orcinus orca) in British Columbia. Canadian Science Advisory Secretariat, Fisheries and Oceans Canada. Ottawa ON.
Ford, J.K.B., G.M. Ellis, P.F. Olesiuk and K.C. Balcomb. 2009. Linking killer whale survival and prey abundance: food limitation in the oceans’ apex predator? Biology Letters 5(5): 1–4.
Frankel, A.S. and C.W. Clark. 1998. Results of low-frequency playback of M-sequence noise to humpback whales, Megaptera novaeangliae, in Hawai’i. Canadian Journal of Zoology 76: 521–535.
Gambell, R. 1976. World whale stocks. Mammal Review 6: 41–53.
Gentry, R. 1970. Social behavior of the Steller sea lion. Ph.D. thesis. Department of Biology, University of California, Santa Cruz. Santa Cruz, CA.
Gentry, R.L., E.C. Gentry and J.F. Gilman. 1990. Responses of Northern Fur Seals to Quarrying Operations. Marine Mammal Science 6(2):151–155.
Gill, J.A., K. Norris and W.J. Sutherland. 2001. The effects of disturbance on habitat use by black-tailed godwits Limosa limosa. Journal of Applied Ecolog. 38: 846–856.
Government of Canada. 2005 Species at Risk Act: A Guide. Species at Risk Public Registry. Ottawa, ON.

Sec. 52 Application Volume 6B: Environmental and Socio-Economic Assessment (ESA) – Marine Terminal Section 11: Marine Mammals
May 2010 Page 11-89
Gregr, E.J., L. Nichol, J.K.B. Ford, G. Ellis and A.W. Trites. 2000. Migration and population structure of northeastern Pacific whales off coastal British Columbia: An analysis of commercial whaling records from 1908–1967. Marine Mammal Science 16(4): 699–727.
Heimlich-Boran, J.R. 1988. Behavioural ecology of killer whales (Orcinus orca) in the Pacific Northwest. Canadian Journal of Zoology 66: 565–578.
Henriksen, O.D., J. Carstensen, J. Tougaard and J. Teilmann. 2004. Effects of the Nysted Offshore Wind Farm construction on harbour porpoises - annual status report for the acoustic T-POD monitoring programme during 2003. Commissioned by ENERGI E2 A/S. National Environmental Research Institute. Roskilde, Denmark.
Herr, H., A. Gilles, M. Scheidat and U. Seiebert. 2005. Distribution of harbour porpoises (Phocoena phocoena) in the German North Sea in relation to density of sea traffic. ASCOBANS 12th Advisory Committee Meeting, 12–14 April, 2005 in Brest, France. Document AC12/Doc.8(P). Submitted by Germany.
Hildebrand, J. 2003. Sources of Anthropogenic Sound in the Marine Environment. Unpublished manuscript. Scripps Institution of Oceanography. University of California San Diego. La Jolla, CA.
Hoelzel, A.R. 2002. Marine Mammal Biology: An Evolutionary Approach. Blackwell Science Ltd. Oxford, UK.
Holt, M.M. 2008. Sound Exposure and Southern Resident Killer Whales (Orcinus orca): A Review of Current Knowledge and Data Gaps. NOAA Technical Memorandum NMFS-NWFSC-89. National Oceanic and Atmospheric Administration. US Department of Commerce.
Jacques Whitford AXYS Ltd. 2007. September 2007 Marine Mammal Survey, Deltaport 3rd Berth Expansion Monitoring. Prepared for Port of Metro Vancouver. Burnaby, BC.
Jacques Whitford AXYS Ltd. 2008. August 2008 Marine Mammal Survey, Deltaport 3rd Berth Expansion Monitoring. Prepared for Port of Metro Vancouver. Burnaby, BC.
JASCO. 2006. Marine Acoustics (2006) Technical Data Report. Prepared for Northern Gateway Pipelines Inc. Burnaby, BC
Jordan, T., K. Hollingshead, M.T. Keevin and G.L. Hempen. 2005. Miami Harbor Deepening - Phase II Dodge-Lummus Island Turning Basin Project and Fisherman’s Channel: Results of Mitigation and Monitoring Measures - June 25 through August 12, 2005 to Protect Dolphins and Manatees During Underwater Blasting. US Army Corps of Engineers. Miami, FL.
Kastak, D. and R. Schusterman. 1998. Low-frequency amphibious hearing in pinnipeds: methods, measurements, noise, and ecology. Journal of the Acoustical Society of America 103(4): 2216–2228.
Kastelein, R.A., R. van Schie, W.C. Verboom and D. de Haan. 2005. Underwater hearing sensitivity of a male and a female Steller sea lion (Eumetopias jubatus). Journal of the Acoustical Society of America 118(3): 1820–1829.

Sec. 52 Application Volume 6B: Environmental and Socio-Economic Assessment (ESA) – Marine Terminal Section 11: Marine Mammals
Page 11-90 May 2010
Keevin, T.M. and G.L. Hempen. 1997. The Environmental Effects of Underwater Explosions, with Methods to Mitigate Impacts. US Army Corps of Engineers, St. Louis District. St. Louis, MO.
Ketten, D.R. 2002. Marine Mammal Auditory Systems: A Summary of Audiometric and Anatomical Data and Implications for Underwater Acoustic Impacts. Polarforschung 72(2/3): 79–92.
Ketten, D.R., J. Lien and S. Todd. 1993. Blast injury in humpback whale ears: evidence and implications. Journal of the Acoustical Society of America 94: 1849–1850.
Koschinski, S., B.M. Culik, O.D. Henriksen, N. Tregenza, G.S. Ellis, C. Jansen. 2003. Behavioural reactions of free-ranging porpoises and seals to the noise of a simulated 2 MW windpower generator. Marine Ecology Progress Series 265: 263–273.
Kucey, L. 2005. Human disturbance and the hauling out behaviour of Steller sea lions (Eumetopias jubatus). M.Sc. thesis. University of British Columbia. Vancouver, BC.
Lewis, J.P. 1987. An evaluation of a census-related disturbance of Steller sea lions. 92 pp. University of Alaska. Fairbanks, AK.
LGL Limited Environmental Research Associates. 2004. A Review of the State of Knowledge of Marine and Shoreline Areas in the Queen Charlotte Basin. University of Northern British Columbia, Northern Land Use Institute. Prince George, BC.
Lien, J., S. Todd and J. Guigne. 1990. Inferences About Perception in Large Cetaceans, Especially Humpback Whales, From Incidental Catches in Fixed Fishing Gear, Enhancement of Nets by “Alarm” Devices, and the Acoustics of Fishing Gear. In J.A. Thomas and R.A. Kastelein (ed.). Sensory Abilities of Cetaceans/Laboratory and Field Evidence. Plenum, New York. 347–362. Cited in Richardson, J., C.R. Greene Jr., C. Malme and D. Thomson. 1995. Marine Mammals and Noise. Academic Press. San Diego, CA.
Lien, J., W. Barney, S. Todd, R. Seton and J. Guzzwell. 1992. Effects of Adding Sounds to Cod Traps on the Probability of Collisions by Humpback Whales. In J.A. Thomas, R.A. Kastelein and A.Ya. Supin (ed.). Marine Mammal Sensory Systems. Plenum, New York. 701–708. Cited in Richardson, J., C.R. Greene Jr., C. Malme and D. Thomson. 1995. Marine Mammals and Noise. Academic Press. San Diego, CA.
Loughlin, T.R. 1997. Using the phylogenetic method to identify Steller sea lion stocks. In Dizon, A., S.J. Chivers and W.F. Perrin (eds.) Molecular genetics of marine mammals. Special Publication No. 3, Society for Marine Mammalogy. Orlando, FL. 159–171.
Loughlin, T.R., A.S. Perlov and V.A. Vladimirov. 1992. Range-wide survey and estimation of total number of Steller sea lions in 1989. Marine Mammal Science. 8, 220–239.
Loughlin, T.R., D.J. Rugh and C.H. Fiscus. 1984. Northern sea lion distribution and abundance: 1956-80. Journal of Wildlife Management. 48, 729–740.
Maybaum, H.L. 1993. Responses of humpback whales to sonar sounds. Journal of the Acoustical Society of America 94(3, Pt. 2):1848–1849. Cited in Richardson, J., C.R. Greene Jr., C. Malme and D. Thomson. 1995. Marine Mammals and Noise. Academic Press. San Diego, CA.

Sec. 52 Application Volume 6B: Environmental and Socio-Economic Assessment (ESA) – Marine Terminal Section 11: Marine Mammals
May 2010 Page 11-91
McCauley, R.D., D.H. Cato and A.F. Jeffery. 1996. A Study of the Impacts of Vessel Noise on Humpback Whales in Hervey Bay. Report prepared for the Queensland Department of Environment and Heritage, Maryborough Office by the Department of Marine Biology, James Cook University. Townsville, QLD, Australia.
Merrick, R.L. and T.R. Loughlin. 1997. Foraging behaviour of adult female and young of the year Steller sea lions in Alaskan waters. Canadian Journal of Zoology 75(5): 776–786.
Money, J.H. and A.W. Trites. 1998. A Preliminary Assessment of the Status of Marine Mammal Populations and Associated Research Needs for the West Coast of Canada. Marine Mammal Research Unit Fisheries Centre, University of British Columbia. Vancouver, BC.
Morton, A.B. and H.K. Symonds. 2002. Displacement of Orcinus orca (L.) by high amplitude sound in British Columbia, Canada. ICES Journal of Marine Science 59: 71–80.
National Marine Fisheries Service (NMFS). 2008. Guidance on ESA - Listed Marine Mammal Consultations. Memorandum for Northwest Region Assistant Regional Administrators from D. Robert Lohn, Northwest Regional Administrator. Seattle, WA.
National Research Council. 2003. Ocean Noise and Marine Mammals. The National Academies Press. Washington DC.
Nowacek, D.P., L.P. Thorne, D.W. Johnston and P.L. Tyack. 2007. Responses of cetaceans to anthropogenic noise. Mammal Review 37(2): 81–115.
Nowacek, D.P., M.P. Johnson and P.L. Tyack. 2004. North Atlantic right whales (Eubalaena glacialis) ignore ships but respond to alerting stimuli. Proceedings of the Royal Society of London. Series B: Biological Sciences (271): 227–231.
Olesiuk, P.F. 1999. An assessment of the status of harbour seals (Phoca vitulina) in British Columbia. Canadian Stock Assessment Secretariat, Fisheries and Oceans Canada. Ottawa, ON.
Olesiuk, P.F. 2003. Recent trends in the abundance of Steller sea lions (Eumetopias jubatus) in British Columbia. National Marine Mammal Review Committee. Nanaimo, BC.
Olesiuk, P.F., G.M. Ellis and J.K.B. Ford. 2005. Life history and population dynamics of northern resident killer whales (Orcinus orca) in British Columbia. Canadian Science Advisory Secretariat Research Document 2005/045. Fisheries and Oceans Canada. Ottawa, ON.
Peterson, R.S. and G.A. Bartholomew. 1969. Airborne vocal communication in the California sea lion, Zalophus californianus. Animal Behaviour. 17: 17–24.
Rambeau, A.L. 2008. Determining abundance and stock structure for a widespread, migratory animal: The case of humpback whales (Megaptera novaeangliae) in British Columbia, Canada. M.Sc. thesis, University of British Columbia. Vancouver, BC.
Rice, D.W. 1978. The humpback whale in the North Pacific: Distribution, exploitation and numbers. In K.S. Norris and R.S. Reeves (eds.). Report on a Workshop on Problems Related to Humpback Whales (Megaptera novaeangliae) in Hawaii. Marine Mammal Commission Report 77/03. US Department of Commerce.

Sec. 52 Application Volume 6B: Environmental and Socio-Economic Assessment (ESA) – Marine Terminal Section 11: Marine Mammals
Page 11-92 May 2010
Richardson, J., C.R. Greene Jr., C. Malme and D. Thomson. 1995. Marine Mammals and Noise. Academic Press. San Diego, CA.
Riffell, S.K., K.J. Gutzwiller and S.H. Anderson. 1996. Does repeated human intrusion cause cumulative declines in avian richness and abundance? Ecological Applications. 6: 492–505.
Ross, P.S. 2000. Marine mammals as sentinels in ecological risk assessment. Humans and Ecological Risk Assessment 6: 277–292.
Sandegren, F.E. 1970. Breeding and maternal behavior of the Steller sea lion (Eumetopias jubatus) in Alaska. 137 pp. University of Alaska. Anchorage, AK.
Schusterman, R.J., R. Gentry and J. Schmook. 1966. Underwater vocalization by sea lions: Social and mirror stimuli. Science. 154: 540–542.
Schusterman, R.J., R. Gentry and J. Schmook. 1967. Underwater sound production by captive California sea lions, Zalophus californianus. Zoologica 52: 21–24.
Southall, B.L., A.E. Bowles, W.T. Ellison, J.J. Finneran, R.L. Gentry and C.R. Greene. 2007. Marine mammal noise exposure criteria: initial scientific recommendations. Aquatic Mammals 33(4): 1–521.
Straley, J.M. 1994. Seasonal characteristics of humpback whales (Megaptera novaeangliae) in southeastern Alaska. Proceedings of the Third Glacier Bay Science Symposium. National Park Service, Anchorage, AK.
Szymanski, M.D., D.E. Bain, K. Kiehl, S. Pennington, S. Wong and K.R. Henry. 1999. Killer whale (Orcinus orca) hearing: auditory brainstem response and behavioral audiograms. Journal of the Acoustical Society of America 106(2): 1134–1141.
Terhune, J.M. and W.C. Verboom. 1999. Right whales and ship noise. Marine Mammal Science 15(1): 256–258.
Thomsen, F., D. Franck and J.K.B. Ford. 2001. Characteristics of whistles from the acoustic repertoire of resident killer whales (Orcinus orca) off Vancouver Island, British Columbia. Journal of the Acoustical Society of America 109(3): 1240–1246.
Thomsen, F., D. Franck and J.K.B. Ford. 2002. On the communicative significance of whistles in wild killer whales (Orcinus orca). Naturwissenschaften 89: 404–407.
Todd, S., P.T. Stevick, J. Lien, F. Marques and D. Ketten. 1996. Behavioural effect of exposure to underwater explosion in humpback whales. Canadian Journal of Zoology 74: 1661–1672.
Tougaard, J., J. Carstensen, O.D. Henriksen, J. Teilmann and J.R. Hansen. 2004. Harbour Porpoises on Horns Rev - Effects of the Horns Rev Wind Farm. Annual Status Report 2003 to Elsam Engineering A/S. Denmark.
Trites, A.W. and P.A. Larkin. 1996. Changes in the abundance of Steller sea lions (Eumetopias jubatus) in Alaska from 1956 to 1992: how many were there? Aquatic Mammals 22: 153–166.

Sec. 52 Application Volume 6B: Environmental and Socio-Economic Assessment (ESA) – Marine Terminal Section 11: Marine Mammals
May 2010 Page 11-93
Wang, J.Y., D.E. Gaskin and B.N. White. 1996. Mitochondrial DNA analysis of harbour porpoise, Phocoena phocoena, subpopulations in North American waters. Canadian Journal of Fisheries and Aquatic Science 53: 1632–1645.
Ward, W.D. 1997. Effects of high-intensity sound. In M. J. Crocker (ed.). Encyclopedia of Acoustics. Vol. 3. John Wiley & Sons, Inc. New York, NY. 1497–1507.
Wheeler, B., A. Rambeau and K. Zottenberg. 2010. Marine Mammals Technical Data Report. Prepared for Northern Gateway Pipelines Inc. Calgary, AB.
Williams, R., A.W. Trites and D.E. Bain. 2002b. Behavioural responses of killer whales (Orcinus orca) to whale-watching boats; opportunistic observations and experimental approaches. Journal of the Zoological Society of London 256: 255–270.
Williams, R., D.E. Bain, J.K.B. Ford and A.W. Trites. 2002a. Behavioural responses of male killer whales to a ‘leap-frogging’ vessel. Journal of Cetacean Research and Management 4(3): 305–310.
Wright, D.G. and G.E. Hopky. 1998. Guidelines for the Use of Explosives in or Near Canadian Fisheries Waters. Canadian Technical Report of Fisheries and Aquatic Sciences 2107. Fisheries and Oceans Canada. Ottawa, ON.
11.11.2 Personal Communications Anderson, T. 2005. Biologist. Opportunistic sightings during field programs in Kitimat Arm. Jacques
Whitford AXYS Ltd. Burnaby, BC. Personal communication, August 2005.
Ford, J.K.B. 2005. Head, Cetacean Research Program. Pacific Biological Station, Fisheries and Oceans Canada. Nanaimo, BC. November 1, 2005.
Ford, J.K.B. 2008. Head, Cetacean Research Program. Pacific Biological Station, Fisheries and Oceans Canada. Nanaimo, BC. E-mail. November 30, 2008.
Hannay, D. 2006. Vice-President, JASCO Research Ltd. Victoria, BC. E-mail. February 21, 2006.
Hannay, D. 2009. Vice President, JASCO Research Ltd. Victoria, BC. E-mail. February 5, 2009.
Nichol, L. 2006. Biologist. Pacific Biological Station, Fisheries and Oceans Canada. Nanaimo, BC. E-mail: January 25, 2006.
Wheeler, B. 2006. Marine Science Practice Lead, Jacques Whitford AXYS Ltd., Burnaby, BC. Conversation. March 2006.
11.11.3 Internet Sites British Columbia Conservation Data Centre (BCCDC). 2009. Species Summary: Orcinus orca pop. 6.
Available at: http://a100.gov.bc.ca/pub/eswp/. Accessed: October 2009.
British Columbia Ministry of Environment (BC MoE). 2007. Provincial Red and Blue Lists. Available at: http://www.env.gov.bc.ca/atrisk/red-blue.html. Accessed: March 2009.

Sec. 52 Application Volume 6B: Environmental and Socio-Economic Assessment (ESA) – Marine Terminal Section 11: Marine Mammals
Page 11-94 May 2010
Cetacealab. 2009. Cetacealab: Humpbacks. Available at: http://cetacealab.org/humpbacks.htm. Accessed: January 2009.
Committee on the Status of Endangered Wildlife in Canada (COSEWIC). 2009. Canadian Species at Risk. Available at: http://www.cosewic.gc.ca/eng/sct1/index_e.cfm. Accessed: September 2009.
District of Kitimat. 2009. Port of Kitimat. Available at: http://www.kitimat.ca/EN/main/business/port-of-kitimat.html. Accessed: September 11, 2009.
Government of Canada. 2005. Species at Risk Act: Schedule 1. Available at: http://www.sararegistry.gc.ca/species/schedules_e.cfm?id=1. Accessed: December 2005.
Washington State Department of Transport. Noise Impact Assessment. Available at: http://www.wsdot.wa.gov/NR/reonlyres/CB776678-A5A7-4929-94DB-2EC74BF63B11/0/BA_ESAMarineMammConsul.pdf. Accessed: February 2009.

Sec. 52 Application Volume 6B: Environmental and Socio-Economic Assessment (ESA) – Marine Terminal Section 12: Marine Birds
May 2010 Page 12-1
12 Marine Birds Marine birds have conservation status and social, cultural, aesthetic and recreational value. Marbled Murrelet, Surf Scoter and Bald Eagle are the representative species assessed. Potential environmental effects include change in habitat, sensory disturbance and the risk of direct mortality. The amount of marine bird habitat affected by the Project is small compared with that available in the area assessed. Marine birds will likely avoid areas of increased noise levels and the duration of these effects will be limited to several weeks during construction. It is expected that direct mortality events will be rare. Mitigation will include identifying and avoiding active nests, key feeding areas and other critical areas; establishing work windows to reduce disturbance during sensitive life history stages such as nesting and rearing; limiting night lighting; and implementing a blasting management plan. Effects of the Project are not expected to cause a long-term decline in abundance or change in distribution of marine birds. With mitigation, residual effects are expected to be not significant.
12.1 Setting for Marine Birds Often referred to as seabirds, the term marine birds encompasses species dependent on marine and coastal ecosystems for one or more life requisites. For this report, marine birds include loons and grebes; albatrosses, fulmars, shearwaters and storm-petrels; cormorants; waders; geese and swans; diving ducks; dabbling ducks; coastal raptors; shorebirds; gulls, jaegers, skuas and terns; alcids and kingfishers.
Marine birds in British Columbia can be divided into four groups based on seasonal abundance and breeding distribution. These are defined as:
• breeding resident • winter resident • summer visitor • spring and fall migrants
Pelagic birds inhabit the open sea beyond the continental shelf and return to shore only to breed. British Columbia’s pelagic seabirds are associated with two broad habitat classes: those that occur most often and in the highest number over the continental shelf, and those that are found mostly at or beyond the shelf break. The shelf waters, especially near inshore banks, support the highest abundance and diversity of birds. The shallow water of Hecate Strait, west of Kitimat is an area with particularly high marine bird densities (see the Marine Birds Technical Data Report [TDR] [d’Entremont 2010]; Morgan et al. 1991).
In British Columbia, there are an estimated 124 marine bird species (Campbell et al. 1990a; Stevens 1995), some of which may comprise populations of tens of thousands of breeding, migrant or wintering birds. The British Columbia coast is an important corridor for millions of migrating birds, especially shorebirds and waterfowl (Slattery et al. 2000). In the general vicinity of Douglas Channel and adjacent sounds and channels, 110 species may occur (see the Marine Birds TDR).
Marine birds are important components of the freshwater and marine environments in which they are found (Milko et al. 2003) and make extensive use of coastal wetlands and nearshore and offshore habitats, including islands, islets and cliffs. In addition to the diversity and abundance of avian life that they

Sec. 52 Application Volume 6B: Environmental and Socio-Economic Assessment (ESA) – Marine Terminal Section 12: Marine Birds
Page 12-2 May 2010
represent, they are an indicator of the status of the marine ecosystem for British Columbia. Many of the colonial breeding marine birds do not breed anywhere else in Canada (Campbell et al. 1990a).
Marine and coastal ecosystems are subject to dramatic large-scale changes and fluctuations in productivity. On the west coast of North America, El Niño events result in elevated water temperatures and decreased abundance of prey species, which can lead to reduced reproductive output and survival rates for marine birds. Human activities may exacerbate natural pressures. In British Columbia, the loss of marine habitats to recreational activities, fish farms, industrial developments and timber harvesting has reduced habitat for marine birds. In addition, the long-term environmental effects of hydrocarbon spills from sources such as outboard engines, bilge water discharge and other vessel operations on the more remote areas of the coastal environment of British Columbia, including marine birds, are not well documented.
12.2 Scope of Assessment for Marine Birds
12.2.1 Key Project Issues for Marine Birds Potential environmental effects can range from minor increases in disturbance to direct mortality. Examples of environmental effects include:
• physical habitat change during construction of the marine terminal. The quality or suitability of breeding and foraging habitat may be affected through a change in habitat.
• sensory disturbances and habitat avoidance resulting from noise and human activities during site clearing, on-land and marine blasting, dredging, and artificial lighting at night. Although marine birds are sensitive to human disturbance, habituation may occur. In general, wildlife habituates to noise levels under 90 dBA (averaged decibel level) or those of a continuous or predictable nature (Gladwin et al. 1988). Birds habituate to sensory disturbance best when the disturbance is predictable and not paired with a negative experience (Ward and Stehn 1989; Steidl and Anthony 2000). Near marine terminal, ambient noise levels during construction in estuaries and inner bays such as Bish Cove are expected to be as low as 40 to 50 dBA in calm conditions. During blasting, noise levels of 100 dB (decibels) could be reached.
• risk of mortality from collisions with project infrastructure or decreased reproductive success if eggs and nestlings are lost during site clearing.
12.2.2 Selection of Key Indicators and Measurable Parameters for Marine Birds To assess the environmental effects on different types of marine birds, key indicators (KIs) or species are identified based on their:
• occurrence and use of available habitats in the project effects assessment area (PEAA) • sensitivity to project effects • importance to local communities and resource users • national or international importance (including status under the Species at Risk Act)

Sec. 52 Application Volume 6B: Environmental and Socio-Economic Assessment (ESA) – Marine Terminal Section 12: Marine Birds
May 2010 Page 12-3
• value as an indicator of environmental effects for related resources and broader systems • ecological importance
Using these criteria, three KIs are selected:
• Marbled Murrelet (Brachyramphus marmoratus): Marbled Murrelets take several years to become reproductively mature and pairs produce only one egg per year (Nelson 1997, Internet site). They invest a large amount of parental resources in fewer offspring, each of which has a relatively high probability of surviving to adulthood. Therefore, they are sensitive to change in marine ecosystems, have a long recovery time from population declines and act as good indicators of ecosystem health (Environment Canada 2004a, Internet site). Marbled Murrelets breed in the region around the Kitimat Terminal and are generally dependent on large trees located in intact stands of forest. They rely on the marine environment for foraging throughout the year.
• Surf Scoter (Melanitta perspicillata): The blue-listed Surf Scoter uses Kitimat Arm and Douglas Channel during non-breeding periods. Surf Scoters spend most of their annual cycle on wintering areas, particularly shallow (less than 10 m) coastal waters (Sea Duck Joint Venture [SDJV] 2004, Internet site). Prey species for these ducks are generally less abundant in winter making it an energetically restrictive time. After the breeding season, Surf Scoters undergo a moult, during which time they are flightless and are dependent on their immediate environment for forage and shelter. Moulting flocks, which may number in the hundreds to thousands, can be found in shallow protected bays and inlets (SDJV 2004, Internet site).
• Bald Eagle (Haliaeetus leucocephalus): Bald Eagles breed throughout British Columbia. They are generally dependent on large trees in intact stands of forest and rely on the marine environment for foraging throughout the year. The Bald Eagle is also a keystone predator that helps regulate other bird populations and has no natural predators of its own (Environment Canada 2000, Internet site). It is the only raptor found throughout the general region around the Kitimat Terminal at all times of the year and consequently acts as a good representative for raptor species. It consumes fish, small mammals and marine birds and is an indicator of wildlife sustainability (Environment Canada 2000, Internet site).
In combination, the ecological requirements of these three KIs overlap extensively with that of marine bird species as a whole. Consequently, if breeding and non-breeding populations and habitat are assessed and monitored, they are good indicators of ecosystem health for the general region around the Kitimat Terminal. By limiting the environmental effects on these KIs, the health of the marine and terrestrial environments can be monitored and mitigation plans developed and adapted.
No seabird colonies are recorded within Kitimat Arm or the greater area of Douglas Channel. For this reason, colonial species are not selected as KIs. The nearest important seabird colonies are on Lucy Island in Chatham Sound and on the chain of small islands on the west side of Aristazabal Island (see the Marine Birds TDR; Bird Studies Canada [BSC] 2008, Internet site).
The environmental effects of the project activities on marine birds and their habitats are characterized by first identifying their ecology and habitat requirements and then relating these to the project activities. Potential environmental effects from the project activities are described based on relevant research and literature, plus the knowledge of the assessors.

Sec. 52 Application Volume 6B: Environmental and Socio-Economic Assessment (ESA) – Marine Terminal Section 12: Marine Birds
Page 12-4 May 2010
The following measurable parameters are identified for assessing environmental effects:
for change in habitat – the location and amount of preferred habitat for supporting life requisites (e.g., nesting, foraging) of the KIs
for sensory disturbance and habitat avoidance – the seasonal occurrence, distribution, relative abundance and density of the KIs in the PEAA (see below)
for risk of mortality – the measurable parameters identified above are taken into consideration along with the potential effects from project activities
12.2.3 Spatial Boundaries for Marine Birds Two geographic assessment areas are identified for each KI: the project development area (PDA) and the PEAA.
The PDA consists of the marine terminal and marine infrastructure and is the same for all three KIs.
The PEAA is larger and includes areas where construction, operations and decommissioning activities may potentially have environmental effects. The marine portion of the PEAA is the same for each KI. This was conservatively established as the area from the head of Kitimat Arm south to between Emsley Point and Coste Point (see Figure 12-1). Because Marbled Murrelet nesting habitat often extends 70 km inland and up to 900 m in elevation, the terrestrial component of the PEAA for this species includes the terrestrial PDA and the RoW, with a 500-m vegetated area extending inland to Nimbus Mountain (see Figure 12-2). The terrestrial PEAA for Bald Eagle is the same as that for Marbled Murrelet because the Bald Eagle also uses the habitat through which the RoW passes. For Surf Scoters, the PEAA has only a marine portion because they do not use terrestrial habitats in the Kitimat area.
For the cumulative effects assessment, the regional effects assessment area (REAA) is considered to be the same as the PEAA, because industrial activity from other projects occurs only within the PEAA.
12.2.4 Temporal Boundaries for Marine Birds This effects assessment for marine birds encompasses all project phases are overlap with KI seasonal use of key habitat.
12.2.5 Regulatory Setting or Administrative Boundaries for Marine Birds Migratory birds, which include marine birds, are federally protected under the Migratory Birds Convention Act (MBCA 1917) and provincially under the British Columbia Wildlife Act. The Canada Wildlife Act also provides for the coordination of wildlife programs and policies that involve birds not protected under the MBCA. In addition, the federal government has international responsibilities for the conservation of bird populations shared with the United States.
The MBCA outlaws the commercial exploitation and wilful destruction (i.e., non-permitted activities) of migratory birds and prohibits the taking of their eggs and disturbance of their nests. Hunting seasons are also regulated under the MBCA.

MK BayMarina
200 m
100
m
100 m
200 m
100
m
300 m
200
m
100
m
Kitimat
Minette Bay
KitamaatVillage
KitimatTerminal
K i t i
m a
t A
r m
BishCove
EmsleyCove
EmsleyPoint
CostePoint
CosteIsland
ClioBay
GobeilBay
Kitimat River
CreekBish
K i l d a l a A r m200 m
100
m
Pipeline Route
Security Fence
Terrestrial PDA
Marine PDA
Marine PEAA
Bathymetric Contour (100 m)
Railway
Road
NP
Jacques Whitford AXYS Ltd.
FIGURE NUMBER:
PROJECTION:
CONTRACTOR: DATE:
AUTHOR: APPROVED BY:PREPARED FOR:PREPARED BY: SCALE:
Marine PEAA for Marine Birds
ENB R ID GE N OR TH ER N GA T EW A Y P RO J EC T 12-1
NAD 83DATUM:
1:110,000
UTM 9
CM
Key Plan1:3,000,000
Hecate StraitPrincess Royal
Island
Pitt IslandBanks Island
Hartley Bay
Kitimat
KitamaatVillage
KitimatTerminal
Doug
lasChannel
DevastationChannel
Foch LagoonGilttoyees Inlet
Ursula Channel
Squally Channel
Principe Channel
CaamañoSound
WrightSound
Emsley CreekEstuary
0 1 2 3
Kilometres
Reference: Pipeline Route R
JWA-1048334-1547
REFERENCES: NTDB Topographic Mapsheets provided by the Majesty the Queen in Right of Canada, Department of Natural Resources. All rights reserved.
R:\2
009F
isca
l\104
8334
_Nor
ther
nGat
eway
_ES
A_2
009
20090911

Minette Bay
KitamaatVillage
KitimatTerminal
K i t i
m a
t A
r m
Clio BayGobeil Bay
CosteIsland
Kitim
at River
Bish Creek
Emsley Cove
Emsley Point
BishCove
CostePoint
NimbusMountain
KP 1170
KP 1160
KP 1150
KP 1140
KP 1130KP 1120 KP 1110
KP 1100
KP 1090KP 1080
KP 1172
100 m
200
m
300 m
200 m100 m
NP
Jacques Whitford AXYS Ltd.
FIGURE NUMBER:
PROJECTION:
CONTRACTOR: DATE:
AUTHOR: APPROVED BY:PREPARED FOR:PREPARED BY: SCALE:
Terrestrial PEAA for Marine Birds
ENB R ID GE N OR TH ER N GA TEW A Y PR OJ EC T 12-2
NAD 83DATUM:
1:350,000
UTM 9
CM
Reference: Pipeline Route R
JWA-1048334-1548
REFERENCES: NTDB Topographic Mapsheets provided by the Majesty the Queen in Right of Canada, Department of Natural Resources. All rights reserved.
Kilometre Post
Pipeline
Tunnel
Security Fence
Terrestrial PDA
Terrestrial PEAA for Marine Birds
Bathymetric Contour (100 m)
Railway
Road
0 2 4 6 8 10
Kilometres
R:\2
009F
isca
l\104
8334
_Nor
ther
nGat
eway
_ES
A_2
009
20091015
Kitimat

Sec. 52 Application Volume 6B: Environmental and Socio-Economic Assessment (ESA) – Marine Terminal Section 12: Marine Birds
May 2010 Page 12-7
The British Columbia Wildlife Act protects active bird nests of indigenous bird species, as well as active and inactive nests of Bald Eagle. Under the Wildlife Act, if a person kills or wounds an indigenous wildlife species, other than prescribed wildlife, the event and the location of the wildlife must be reported to a conservation officer. Failure to do so is an offence under the Wildlife Act.
Species at risk are protected under the federal Species at Risk Act (SARA), which is one of a three-part Government of Canada strategy to protect special status wildlife species. SARA applies to federal lands and protects all wildlife species listed as being at risk and their critical habitat. The other two parts of the strategy include commitments under the Accord for the Protection of Species at Risk, and activities under the Habitat Stewardship Program for Species at Risk.
In British Columbia, all wildlife species are classified as red-, blue-, or yellow-listed. Red- and blue-listed species are considered for formal designation as Endangered or Threatened, either provincially under the British Columbia Wildlife Act or nationally by the Committee on the Status of Endangered Wildlife in Canada (COSEWIC). Yellow-listed species are indigenous species that are ‘Not at Risk’ in British Columbia.
12.2.6 Definition of Environmental Effect Attributes for Marine Birds For the criteria used to characterize the project effects on each KI, see Table 12-1.
Table 12-1 Definitions of Rating Criteria for Assessing Significance of Project Effects
Direction: Adverse Positive
Magnitude: Negligible: Effects can be associated with
annual mortality or displacement of less than 1% of birds in the regional population.
Low: Temporary disturbance limited to the PEAA with no permanent change in suitable habitat within the PEAA. Effects can be associated with mortality or displacement of 1 to 5% of birds in the regional population.
Moderate: Permanent change in habitat limited to the PDA with limited change within the PEAA. Effect can be associated with mortality or displacement of 5 to 10% of birds in the regional population.
High: Permanent change in suitable habitat within the PEAA. Effect can be associated with mortality or displacement of more than 10% of birds in the regional population.
Geographic Extent: Site-specific: Environmental effects
restricted to the PDA Local: Environmental effects restricted
to the PEAA Regional: Environmental effects occur
beyond the PEAA
Duration: Short-term: Effects are measurable for
less than one breeding season (less than one year)
Medium-term: Effects are measurable within one generation or several breeding seasons (2 to 10 years)
Long-term: Effects are measurable for multiple generations or multiple breeding seasons (10 to 20 years)
Permanent: Effects are permanent
Frequency: Occurs once Occurs at sporadic
intervals Occurs on a regular basis
and at regular intervals
Continuous
Reversibility: Reversible Irreversible

Sec. 52 Application Volume 6B: Environmental and Socio-Economic Assessment (ESA) – Marine Terminal Section 12: Marine Birds
Page 12-8 May 2010
12.2.7 Determination of Significance for Marine Birds A residual adverse effect is considered significant when a population of a marine bird species is sufficiently affected to cause a decline in abundance or diversity and/or a change in distribution beyond which natural recruitment (i.e., reproduction and immigration from unaffected areas) will not return the regional population to its former level within two or more generations.
12.3 General Mitigation Measures for Marine Birds The Construction Environmental Protection and Management Plan (EPMP) (see Volume 7A) for the Kitimat Terminal outlines mitigation measures developed by Northern Gateway for routine construction activities. It generally includes:
• environmental inspections that will be completed before construction activities to identify and avoid critical areas (e.g., active nests, critical feeding areas)
• monitoring of environmental effects plans with protocols for adjusting mitigations in an adaptive framework
Constraints mapping has been used to limit the extent of the PDA in preferred habitat for marine birds. As a result, Northern Gateway will use existing disturbed areas to the extent practical, to limit vegetation clearing and change in habitat. In addition, Northern Gateway will implement the following mitigation measures:
• Limit the area of disturbance in the PDA, RoW and extra temporary workspace. Sensitive habitats will be clearly identified as no-machine areas with snow fencing or equivalent.
• Limit blasting. Northern Gateway will develop a Blasting Management Plan. Timing of blasting will be developed in consultation with the Canadian Wildlife Service (CWS), DFO and other regulators, as appropriate.
• Maintain equipment. Equipment will have manufacturer-recommended mufflers or equivalent features and will be maintained in good working order to reduce noise levels.
• Protect nest trees. If a tree containing the nest of a Bald Eagle, Marbled Murrelet or species protected by the British Columbia Wildlife Act is discovered, no-disturbance buffer zones will be established (e.g., Demarchi et al. 2005). Where disturbance is unavoidable, Northern Gateway will consult with the appropriate regulators to discuss possible options and management strategies.
• Establish vessel turning areas.
• Employ turbidity curtains around shallow (i.e., 3 to 4 m) inwater construction dredging and blasting sites to limit possible sedimentation of adjacent habitat.
• Limit night lighting (for Marbled Murrelet and Surf Scoter). The use of lighting at night will be limited, as practical. Where permissible under safety and navigation requirements, outdoor lights will be upward shielded to reduce attraction by birds in flight. All unnecessary outside lights will be extinguished at night. Work periods will be scheduled during daylight hours whenever possible to limit the need for staging lights.

Sec. 52 Application Volume 6B: Environmental and Socio-Economic Assessment (ESA) – Marine Terminal Section 12: Marine Birds
May 2010 Page 12-9
• Use acoustic blankets, where feasible, to reduce above-ground noise from construction activities.
• Issue bird strike alerts. When berthed, vessels will be alerted to the hazards of bird strikes from deck lighting, particularly on nights when visibility is poor. Staff will be notified of key seasonal and daily migratory periods for marine birds and be instructed to be particularly vigilant at these times.
• Use bubble curtains (for Marbled Murrelet and Surf Scoter) to attenuate underwater sound levels.
• Schedule work to minimize disturbance. Where possible, noisy activities will be scheduled during daylight hours where possible. Clearing will be scheduled in consultation with the appropriate regulators (e.g., CWS and BC MoE). Timing of work windows, in consultation with appropriate regulatory authorities will consider sensitive periods such as nesting and rearing.
• Limit noisy equipment. The use of jackhammers or similar machinery that produce high intensity sounds will be limited as possible.
• Prohibit hunting. Employees will be prohibited from hunting while at the Kitimat Terminal.
• Report collisions. Workers and contractors at the Kitimat Terminal will be instructed to report any collisions of birds with structures.
• Properly store and dispose of garbage. Domestic waste will be managed to reduce its attraction to scavengers. Garbage will be securely stored and removed daily to regulated disposal sites. The outdoor storage of organic waste will be prohibited. Northern Gateway will dispose of organic waste at a municipal transfer station on a daily basis. Northern Gateway will also implement a rat control program at the Kitimat Terminal and will encourage contract vessels to do the same.
• Protect birds from powerlines. To protect eagles and other birds of prey from electrocution, energized surfaces will be covered with protective devices manufactured for wires, conductors, powerline insulators and powerline bushings.
12.4 Methods for Marine Birds
12.4.1 Data Sources and Field Work Information sources used in support of this assessment included the SARA registry (Government of Canada 2008, Internet site), the database for the Committee on the Status of Endangered Wildlife in Canada (COSEWIC 2006, Internet site), other assessments near the Project and other information from stakeholders and government departments with applicable expertise. Knowledge of bird use of the habitats potentially affected by the Project is based on scientific (e.g., peer-reviewed) and government reports, other information provided by the above sources, local knowledge of bird populations and the professional judgment of the assessors.
In addition, reconnaissance surveys were used to identify the distribution and relative abundance of marine birds in open water and along shorelines within the PDA and the PEAA. Radar surveys were used to estimate the number and activities of Marbled Murrelet in the PEAA.

Sec. 52 Application Volume 6B: Environmental and Socio-Economic Assessment (ESA) – Marine Terminal Section 12: Marine Birds
Page 12-10 May 2010
The following surveys completed by Northern Gateway contributed to the knowledge of the avifauna habitats potentially affected by the Project:
• terrestrial-based surveys in October 2005, July 2008 and February, April, June and September 2009
• seasonal vessel-based surveys in 2006 (February, April and June),and 2009 (February, April, June and September)
• aerial-based survey in May 2006
• terrestrial- and marine-based radar surveys for Marbled Murrelet in June 2006 and June 2009
Overall, the data that are available to characterize the existing conditions and the existing knowledge regarding project effects on marine birds are judged by the study team to be sufficient to support the environmental and socio-economic assessment (ESA).
12.4.2 Analytical Techniques
Wildlife Habitat Ratings
Wildlife habitat ratings are used as a quantitative tool to assess potential environmental effects on Marbled Murrelet. Wildlife suitability maps were developed for the 1:20,000 terrestrial ecosystem mapping (TEM) of ecosystem units identified in the PEAA. Wildlife suitability is defined as the ability of a habitat (or ecosystem unit) in its current condition to provide the life requisites (e.g., nesting) of a species (Resource Inventory Committee [RIC] 1999). Ratings were developed using the TEM-based wildlife habitat rating protocol (RIC 1999). A four-class rating system (e.g., high, moderate, low or nil) was used and the ecosystem-based resource mapping (ERM) system employed to generate habitat suitability tables and map products (RIC 1999). Where TEM polygons were complex (i.e., one to three ecosystem types), averaging was used to arrive at a single rating for that polygon. Assessing project-specific effects using habitat suitability mapping required a detailed PDA, including all related elements (e.g., areas to be cleared for project infrastructure, new or upgraded road sections). A regional spatial database of existing disturbances (i.e., disturbance coverage) in the PEAA was also used to estimate existing changes to Marbled Murrelet habitat. Habitats rated as high or moderate were considered preferred habitat for nesting. Predicted changes in the availability of preferred habitat are used to assess potential environmental effects of the Project between baseline and construction and operational conditions.
Distribution, Relative Abundance, Density and Seasonal Occurrence
Baseline data collected during the field surveys were used to determine the distribution, relative abundance, density and seasonal occurrence of marine birds. Vessel and shoreline surveys were completed to provide a measure of these parameters in the PEAA. Habitat associations were determined by comparing Marine Bird distributions to shoreline mapping and results of project-specific intertidal surveys. Data from the field surveys were compared with known information of marine birds on the north coast to verify results.

Sec. 52 Application Volume 6B: Environmental and Socio-Economic Assessment (ESA) – Marine Terminal Section 12: Marine Birds
May 2010 Page 12-11
Quantifying Project Effects on Marine Birds
Field data on species abundance and distributions and preliminary engineering drawings for the Project are used to estimate the area of land or sea affected by project activities and structures. Spatial overlays of the project infrastructure and the PEAA are used in combination with spatial information on marine bird habitat and distribution maps to estimate the relative number of birds potentially affected by construction, operations and decommissioning.
12.5 Marbled Murrelet The ecology and habitat requirements described below provide the regional setting and baseline conditions for Marbled Murrelets in the PEAA.
12.5.1 Ecology and Habitat Requirements
Status
The Marbled Murrelet is listed as federally threatened. It was assessed by COSEWIC in 2000 and is included in the SARA registry Schedule 1 (the official list of wildlife species at risk). It is provincially red-listed (British Columbia Conservation Data Centre [BC CDC] 2008, Internet site). The breeding population is ranked as imperilled, but the non-breeding population is considered secure (BC CDC 2008). A global ranking of vulnerable to apparently secure (G3G4) (NatureServe 2008, Internet site) reflects the broad geographic range and variation in the intensity of threats to its survival. Threats are most intense in the south of its range (e.g., California) and less intense in the north (e.g., Alaska and northern British Columbia).
The Marbled Murrelet’s unique life history strategy combines old-growth coniferous habitat (nesting in mature trees) with coastal waters (foraging) and it acts as a good indicator for other old-growth dependent and coastal-foraging species. As a result, the environmental effects of both the marine and terrestrial components of the Project on the species must be assessed.
Seasonal Distribution and Occurrence
Marbled Murrelet are a year-round resident of British Columbia, recorded in most inshore marine areas (RIC 2001) along the coast, including Haida Gwaii1
During preliminary marine surveys, individuals or pairs of murrelets were observed in the PEAA in the protected inlets and bays along Douglas and Devastation Channels, including Bish Cove and Emsley Cove (Horwood 2006). Larger concentrations were observed in sheltered coastal waters near Whale Channel, Campania Sound, Petrel Channel (see the Marine Birds TDR), and in the protected inlets of Foch Lagoon and Gilttoyees Inlet. Relative densities of Marbled Murrelets in the Douglas Channel and
and Vancouver Island (Environment Canada 2004b, Internet site). The nesting period extends from mid-April through early September (Rodway et al. 1992; Hamer and Nelson 1995; Lougheed et al. 2002) with a distinct peak in mid-summer.
1 The name of the Queen Charlotte Islands was changed to Haida Gwaii in December 2009. However, for consistency with source information used for mapping, Queen Charlotte Islands is used on all maps.

Sec. 52 Application Volume 6B: Environmental and Socio-Economic Assessment (ESA) – Marine Terminal Section 12: Marine Birds
Page 12-12 May 2010
surrounding area varied by season with highest numbers occurring during the summer (Marine Birds TDR).
In addition, during dawn and dusk radar surveys in the Northern Coast Marbled Murrelet Management Area (see the Marine Birds TDR) 98 to 107 murrelets were recorded each session passing through Gilttoyees Inlet, just west of Kitimat (Steventon and Holmes 2002). Steventon and Holmes (2002) estimated the maximum density at the head of Kitimat Arm as 2.2 birds/km2 (or 0.02/ha).
Later research by Burger et al. (Burger et al. 2004, Internet site) estimated the breeding density between 0.01 and 0.08 birds/ha along the northern mainland coast of British Columbia. Yen et al. (2004) estimated between 0.00 and 0.01 birds/ha at sites within the PEAA and up to 0.03 birds/ha for sites along the Douglas Channel.
Habitat Requirements
Marbled Murrelets nest in old-growth coniferous forests, and typically forage in protected nearshore (within 0.5 km) waters that are less than 40 m deep (Burger 1995). They will travel long distances (up to 70 km) inland between forage and nest sites (Burger 2002; Hull et al. 2002). In British Columbia, most nests have been found in yellow cedar (Chamaecyparis nootkatensis), western hemlock (Tsuga heterophylla), Sitka spruce (Picea sitchensis), Douglas-fir (Pseudotsuga menziesii) and western red cedar (Thuja plicata) (Burger 2002). Mountain hemlock (Tsuga mertensiana), amabilis fir (Abies amabilis) and red alder (Alnus rubra) are used to a lesser degree. All nest-trees have large boughs with sufficient diameter to support a nest site and landing platform, and have some soft substrate (e.g., moss) to support a nest cup (Burger et al. 2004, Internet site). Tree cover is required above the nest with small gaps in the canopy to provide nest access (Burger 2002).
A survey of large coastal watersheds in British Columbia suggests that only 20% of these watersheds are in pristine condition; more than 65% are affected notably by logging (Moore 1991). By contrast, the shoreline of the PEAA is relatively pristine. Only 0.12% or approximately 3.08 km of shoreline within the PEAA has been altered by docks, wharves, logging, log booming and fishing activities.
The only location of high suitability Marbled Murrelet nesting habitat within the PEAA is at the base of Bish Creek near the Kitimat Terminal (approximately 2.0 ha, see Figure 12-3). Almost all the moderately suitable Marbled Murrelet nesting habitat within the PEAA is restricted to a small portion of the RoW near kilometre post (KP) 1140 (approximately 100 ha) and around the Kitimat Terminal (approximately 100 ha; see inset Figure 12-3). These areas are surrounded by lower quality habitat.

Minette Bay
KitamaatVillage
K i t i
m a
t
Clio BayGobeil Bay
CosteIsland
Kitima
t River
Bish CreekEmsley
Point
CostePoint
NimbusMountain
KP 1170
KP 1160
KP 1150
KP 1140
KP 1130
KP 1120KP 1110
KP 1100
KP 1090KP 1080
Emsley Cove
KP 1172
KitimatTerminal
A r m
100 m
200 m
300
m
200
m
200
m
100 m
200
m
NP
20091104Jacques Whitford AXYS Ltd.
FIGURE NUMBER:
PROJECTION:
CONTRACTOR: DATE:
AUTHOR: APPROVED BY:PREPARED FOR:PREPARED BY: SCALE:
Marbled Murrelet NestingSuitability at Baseline
R:\2
009F
isca
l\104
8334
_Nor
ther
nGat
eway
_ES
A_20
09
12-3
NAD 83DATUM:
1:250,000
UTM9
Key Plan1:2,000,000
Kitimat
Hecate StraitPrincess Royal
Island
Pitt IslandBanks Island
Hartley Bay
KitamaatVillage
KitimatTerminal
ENBRIDGE NORTHERN GATEWAY PROJECT
See Inset
Channel
Doug
las
Foch LagoonGilttoyees Inlet
DevastationChannel
Ursula Channel
100
m
200 m
100
m
Inset1:70,000
KitimatTerminal
Emsley Point
Bish Creek
K i t i
m a
t A
r m
KP 1172
REFERENCES: NTDB Topographic Mapsheets provided by the Majesty the Queen in Right of Canada, Department of Natural Resources. All rights reserved.
JWA-1048334-1549
Reference: Pipeline Route R
Kilometre Post
Pipeline
Tunnel
Security Fence
Terrestrial PDA
Marine PDA
Terrestrial PEAA for Marine Birds
Nesting Suitability
1 - High
2 - Moderate
3 - Low
4 - Nil
Bathymetric Contour (100 m)
Railway
Road
0 2 4 6 8 10
Kilometres
Kitimat


Sec. 52 Application Volume 6B: Environmental and Socio-Economic Assessment (ESA) – Marine Terminal Section 12: Marine Birds
May 2010 Page 12-15
Abundance and Population Trend
British Columbia’s Marbled Murrelet population is estimated at approximately 56,000 breeding individuals (Burger 2002). The northern mainland population between Laredo Sound and the Alaska border is estimated between 10,100 and 14,700 birds.
Marbled Murrelet populations declined during the last century and continue to do so. In southern British Columbia, Marbled Murrelet numbers are correlated with the distribution of old-growth forest (Burger 2001, Internet site; 2002; 2004, Internet site). Most habitat losses and related population declines likely occurred between 1850 and 1970 (BC CDC 2008, Internet site) when much of the old-growth forests along the Strait of Georgia were cleared (Brooks 1926, Internet site; Pearse 1946, Internet site).The local population declined between 25% to 75% during that period (BC CDC 2008, Internet site). More recent declines are estimated at 10% to 30% (BC CDC 2008, Internet site) and are attributed to the continued loss of breeding habitat. However, early records were not based on rigorous data collection, and opinions regarding trends are strongly influenced by information from the southern part of the species range.
Limiting Factors
Loss of nesting habitat has been widely accepted as a major threat to the Marbled Murrelet in the southern part of its range (Piatt et al. 2007). However, the degree to which Marbled Murrelets are sensitive to disturbance is not fully understood. Burger (2002) suggests that Marbled Murrelets may be affected by human activity that occurs within 50 m of a nest site, which is also the sensory disturbance buffer recommended by the Canadian Marbled Murrelet Recovery Team (CMMRT 2003). However, Manley (1999) describes a pair of birds that nested adjacent to logging activity. Zharikov et al. (2006) concluded that Marbled Murrelet can successfully breed in old-growth forests fragmented by logging. Other studies (Burger 2002) concur with this research, provided clearings have some ability to regenerate. The CMMRT (2003) states that artificial edges bordered by uniform maturing forest (e.g., when regenerating stands approach the base of the old-growth canopy) have little or no adverse environmental effects, because the maturing forest should act as a buffer against negative edge effects from predators and adverse microclimate. Malt and Lank (2007) state that edge effects (e.g., nest failure from avian predators) adjacent to recent clear-cuts may decline with time because of successional processes.
Still, new forest fragmentation leads to an increase in forest canopy openings, which can provide predators, particularly avian predators, increased access to nests. The CMMRT states that artificial edges bordered by recent clear-cuts or young forest (less than 40 years) in conjunction with human activities in the area providing food for corvids or other nest predators are most likely to pose risks to nesting murrelets. Consequently, predation pressure on Marbled Murrelet populations may be increasing in some areas.
Bald Eagles, peregrine falcons (Falco peregrinus), and seals prey on Marbled Murrelet at sea, whereas owls and mink (Mustela vison) and other small mammals are believed to be important terrestrial predators of eggs and chicks in the nest (Paine et al. 1990; Lougheed 1999; Malt and Lank 2007).
Existing sources of potential disturbance near the PEAA include:
• timber harvesting • commercial and recreational fishing

Sec. 52 Application Volume 6B: Environmental and Socio-Economic Assessment (ESA) – Marine Terminal Section 12: Marine Birds
Page 12-16 May 2010
• other recreational activities • overflights by aircraft and helicopters • shipping activities at the nearby Rio Tinto Alcan Kitimat aluminum smelter and terminal
The presence of Marbled Murrelets is correlated negatively with increasing boat traffic (Kuletz 1996; Hamer and Thompson 1997; Bellefleur et al. 2009). However, most studies focus not on shipping traffic but on recreational boat traffic, which can interfere with birds foraging in shallow waters. Bellefleur et al. (2009) show that Marbled Murrelet do not flush from foraging habitats if boat traffic is greater than 100 m in distance and in general, slower traffic reduces flushing behaviour.
Inshore foraging makes the species vulnerable to spills of hydrocarbons and entanglement in fishing gear (Burger 2002). In British Columbia, incidents of birds being killed or stunned by the felling of trees have also been recorded (Drent and Guiguet 1961; Harris 1971). Causes of indirect mortality include declines in food supplies linked to El Niño events, and the species may also have to compete for space with aquaculture developments and coastal marinas.
12.5.2 Scope of Assessment for Marbled Murrelet For the potential environmental effects of the Project in both the terrestrial and marine environments in the PEAA and surrounding area, see Table 12-2.
Table 12-2 Potential Environmental Effects on Marbled Murrelet This table identifies the potential environmental effects on Marbled Murrelet that are assessed in this section of the ESA. Each of these environmental effects is discussed in more detail later in this section. Recommendations for mitigation and, if required, follow-up and monitoring are also provided. With the implementation of these mitigation measures where appropriate, the Project is not likely to cause significant adverse environmental effects on marine birds due to effects on Marbled Murrelet.
Project Activities and Physical Works
Key Environmental Effects on Marbled Murrelet Relevance to the Assessment
Considered in the ESA Kitimat Terminal
Construction • Inwater infrastructure site
preparation (dredging, blasting, pile drilling)
• Change in habitat • Alienation of adults and their prey from the PEAA marine habitat
• Change in prey abundance may increase cost of reproduction through increased forage flights
• Sensory disturbance • Adults may abandon nesting habitat if subjected to excessive disturbance
• Adults may abandon the PEAA due to disturbance
• Risk of mortality • Adults may abandon nests if subjected to disturbance during breeding
• Nest predation may increase with forest clearing

Sec. 52 Application Volume 6B: Environmental and Socio-Economic Assessment (ESA) – Marine Terminal Section 12: Marine Birds
May 2010 Page 12-17
Table 12-2 Potential Environmental Effects on Marbled Murrelet (cont’d) Project Activities and
Physical Works Key Environmental Effects on
Marbled Murrelet Relevance to the Assessment Considered in the ESA
Kitimat Terminal Construction (cont’d) • Onshore infrastructure site
preparation (clearing, burning, grading, blasting)
• Change in habitat (breeding habitat)
• Breeding limited to mature forest up to 70 km from ocean
• Sensory disturbance • Alienation from traditional habitats may change behaviour and reduce fitness
• Risk of mortality (breeding habitat)
• Change in population abundance and distribution
• Inwater infrastructure construction (marine terminal, berths, pile installation)
• Onshore infrastructure construction (tank terminal, inter-connector pipes, support buildings, pumps, etc.)
• Change in habitat • Change in prey abundance may affect fitness
• Sensory disturbance • Alienation from habitat • Change in behaviour may affect
physical health of birds • Risk of mortality • Bird strike during daily or seasonal
migration Operations
• Onshore infrastructure operations (tank terminal and associated site water run-off, lights, noise, waste water disposal, emissions)
• Inwater infrastructure operations (marine terminal, berths and associated lights, noise)
• Change in habitat (salinity or temperature changes)
• Prey abundance and distribution may be changed due to altered water parameters
• Distribution may change due to altered water regime and prey abundance
• Sensory disturbance • Alienation from habitat • Change in behaviour may affect
fitness of birds • Some risk of collisions with project
infrastructure due to lights or noise
• Risk of mortality • Enhanced opportunities for scavengers and predators
• Berthed tankers (and associated combustion emissions, prop wash, noise, boom deployment)
• Sensory disturbance • Alienation from habitat • Change in behaviour may affect
fitness of birds Decommissioning
• Onshore site restoration (infrastructure removal)
• Inwater infrastructure site restoration (infrastructure removal)
• Change in habitat • Gain will not be relevant for more than 100 years because mature trees are required for nesting
• Sensory disturbance • Alienation from habitat • Change in behaviour may affect
physical health of birds • Lower risk of bird strike due to lights
• Risk of mortality • Change in population abundance and distribution

Sec. 52 Application Volume 6B: Environmental and Socio-Economic Assessment (ESA) – Marine Terminal Section 12: Marine Birds
Page 12-18 May 2010
12.5.3 Effects on Marbled Murrelet from Changes in Habitat
12.5.3.1 Effect Mechanisms
Construction
Terrestrial
Direct change in Marbled Murrelet breeding habitat, loss of breeding sites, and avoidance of industrial activities could occur, mainly during construction. Potential effects on breeding birds will be limited to areas where the project activities overlap with preferred nesting habitat within 70 km of the coast.
Marine
During construction, a change is likely to occur to approximately 1,000 m of shoreline habitat within the PEAA. However, none of this involves habitats such as eelgrass beds, estuaries and sand or gravel beaches that are used by the important prey species of Marbled Murrelet (e.g., Pacific sand lance [Ammodytes hexapterus] and Pacific herring [Clupea pallasii]).
The Sediment and Erosion Control Plan will be implemented in conjunction with construction-related blasting and dredging. These activities are not expected to result in localized effects on the availability and quality of Marbled Murrelet foraging habitat. Furthermore, Marbled Murrelets routinely make foraging flights in excess of 40 km (Piatt and Naslund 1995), adjusting to a highly localized change in prey distribution.
Minimal scouring of substrates may occur if the shoreline is not protected from construction-related activities. This could result in highly localized and short-term (i.e., hours to days) change in habitat for invertebrates (e.g., euphausiids [krill] and mysids [shrimp]), which are taken by Marbled Murrelet (Burkett 1995).
Operations
Terrestrial
Additional removal of forest is not expected to occur during operations. Regeneration and vegetative encroachment will be controlled in the 25 m wide RoW throughout the project lifespan; but some recovery of habitat will occur over time (from construction to operations), resulting in a possible increase in moderate habitat for Marbled Murrelets during project operations (see Table 12-3).
Marine
During operations, pilings and inwater infrastructure will provide habitat for schooling fish and invertebrates. Discharge of processed fresh water into the surrounding area could result in minor increases in the abundance of small fish if an increase in organic matter occurs. However, given that Marbled Murrelet are not expected to be attracted and use the immediate vicinity of the Kitimat Terminal, potential increases in the availability of some prey are not expected to affect murrelet population abundance or distribution.

Sec. 52 Application Volume 6B: Environmental and Socio-Economic Assessment (ESA) – Marine Terminal Section 12: Marine Birds
May 2010 Page 12-19
Decommissioning
Terrestrial
No change in breeding habitat is expected during decommissioning. Some clearing of vegetative regrowth may be required to gain access to the RoW. This secondary vegetation will not be providing suitable breeding habitat nor likely be acting as a substantial buffer against edge effects (see Limiting Factors in Section 12.6.1), as the RoW will have vegetation control during the life of the Project preventing substantial softening of edges along the RoW.
Marine
The inwater infrastructure will be removed during decommissioning. Habitats for marine birds are expected to return to their pre-construction condition.
12.5.3.2 Mitigation and Effects Management
As noted in Section 12.3, mitigation measures outlined in the Construction EPMP (Volume 7A) will be applied to the construction activities. Specific measures to reduce the effect of change in habitat on Marbled Murrelets include:
• Encroachment into adjacent forested areas will be limited by designating all forested lands outside the designated work area as no-cutting areas, marking those areas (e.g., with brightly coloured fencing, rope or equivalent), and clearly indicating on project construction plans that these are areas of restricted activity.
• Clearing of areas of old-growth forest will be avoided or limited to the extent practical in the PDA and RoW.
• If active Marbled Murrelet nests are discovered during clearing activities, a buffer zone of 200 m of undisturbed vegetation around the nest site will be established. This buffer will provide a habitat patch of approximately 10 ha that will protect the nest from sensory disturbance of loud and disruptive activities. This buffer will remain in place until a professional biologist confirms that the young have fledged or are otherwise no longer present. Where disturbance is unavoidable, Northern Gateway will consult with the appropriate regulators (e.g., CWS and BC MoE) to identify possible options and management strategies.
12.5.3.3 Project Residual Effects
Construction, Terrestrial
For a summary of the amounts of suitable habitat (rated high, moderate, low, or nil) within the terrestrial PEAA, see Table 12-3. Most habitat being assessed is considered low suitability or not suitable. Approximately 3% of the PEAA rated as preferred habitat for nesting (i.e., 0.02% rated as high and 3.02% rated as moderate).

Sec. 52 Application Volume 6B: Environmental and Socio-Economic Assessment (ESA) – Marine Terminal Section 12: Marine Birds
Page 12-20 May 2010
Table 12-3 Habitat Suitability for Marbled Murrelet in the Terrestrial PEAA
Habitat Class
Suitability Rating
Area at Baseline Area at Construction Area at Operations (ha) (%) (ha) (%) (ha) (%)
1 High 2 0.02 2 0.02 2 0.02 2 Moderate 311 3.33 220 2.14 232 2.49 3 Low 2,654 28.49 2,340 25.12 2,328 25.00 4 Nil 6,348 68.15 6,753 72.49 6,753 72.49 Total in PEAA
9,315 100 9,315 100 9,315 100
Marbled Murrelet nest sites are typically highly dispersed (Steventon and Holmes 2002; Burger et al. 2004, Internet site); hence, the probability of disturbing or clearing land at an active nest location is extremely low. The preferred nesting habitats in the PEAA occupy 313 ha (see Table 12-3). During construction, no change is expected to the high suitability habitat. This small patch of habitat is adjacent to Bish Creek immediately southwest of the PDA. Although close to the terminal and within the PEAA, it remains outside the PDA (see Figure 12-4). The moderately suitable habitat within the PEAA primarily consists of two larger patches, one near KP 1140 along the RoW, which is relatively unaffected by the construction; the other overlaps the PDA and the excess cut disposal area, and will be affected.
The low density and occurrence of the nests expected in the PEAA will reduce the potential for environmental effects. Issues can be mitigated by scheduling land clearing activities that are near moderate habitat to times of the year outside the breeding period, which occurs from mid April through late September (Rodway et al. 1992).
Operations, Terrestrial
The cleared RoW may allow predators such as medium to large mammals, corvids and birds of prey to gain greater access to previously forested areas (Donovan et al. 1997; Malt and Lank 2007; see Section 12.5). Additionally, human activity (e.g., all-terrain vehicle [ATV] use) may increase along newly created linear disturbances. These potential increases in predator and human activity may result in habitat avoidance by Marbled Murrelet or reduced nest success within 50 m of the cleared RoW (CMMRT 2003) (see Figure 12-5).

Minette Bay
KitamaatVillage
K i t i
m a
t
Clio BayGobeil Bay
CosteIsland
Kitima
t River
Bish CreekEmsley
Point
CostePoint
NimbusMountain
Emsley Cove
KitimatTerminal
A r m
KP 1170
KP 1160
KP 1150
KP 1140
KP 1130
KP 1120KP 1110
KP 1100
KP 1090KP 1080
KP 1172
100 m
200 m
300
m
200
m
200
m
100 m
200
m
NP
20091104Jacques Whitford AXYS Ltd.
FIGURE NUMBER:
PROJECTION:
CONTRACTOR: DATE:
AUTHOR: APPROVED BY:PREPARED FOR:PREPARED BY: SCALE:
Marbled Murrelet NestingSuitability at Construction
R:\2
009F
isca
l\104
8334
_Nor
ther
nGat
eway
_ES
A_20
09
12-4
NAD 83DATUM:
1:250,000
UTM9
Key Plan1:2,000,000
Kitimat
Hecate StraitPrincess Royal
Island
Pitt IslandBanks Island
Hartley Bay
KitamaatVillage
KitimatTerminal
ENBRIDGE NORTHERN GATEWAY PROJECT
See Inset
Channel
Doug
las
Foch LagoonGilttoyees Inlet
DevastationChannel
Ursula Channel
100
m
200 m
100
m
Inset1:70,000
KitimatTerminal
Emsley Point
Bish Creek
K i t i
m a
t A
r m
KP 1172
REFERENCES: NTDB Topographic Mapsheets provided by the Majesty the Queen in Right of Canada, Department of Natural Resources. All rights reserved.
JWA-1048334-1550
Reference: Pipeline Route R
Kilometre Post
Pipeline
Tunnel
Security Fence
Terrestrial PDA
Marine PDA
Terrestrial PEAA for Marine Birds
Nesting Suitability
1 - High
2 - Moderate
3 - Low
4 - Nil
Bathymetric Contour (100 m)
Railway
Road
Kitimat
0 2 4 6 8 10
Kilometres


Minette Bay
KitamaatVillage
K i t i
m a
t
Clio BayGobeil Bay
CosteIsland
Kitima
t River
Bish CreekEmsley
Point
CostePoint
NimbusMountain
Emsley Cove
KitimatTerminal
A r m
KP 1170
KP 1160
KP 1150
KP 1140
KP 1130
KP 1120KP 1110
KP 1100
KP 1090KP 1080
KP 1172
100 m
200 m
300
m
200
m
200
m
100 m
200
m
NP
20091104Jacques Whitford AXYS Ltd.
FIGURE NUMBER:
PROJECTION:
CONTRACTOR: DATE:
AUTHOR: APPROVED BY:PREPARED FOR:PREPARED BY: SCALE:
Marbled Murrelet NestingSuitability at Operations
R:\2
009F
isca
l\104
8334
_Nor
ther
nGat
eway
_ES
A_20
09
12-5
NAD 83DATUM:
1:250,000
UTM9
Key Plan1:2,000,000
Kitimat
Hecate StraitPrincess Royal
Island
Pitt IslandBanks Island
Hartley Bay
KitamaatVillage
KitimatTerminal
ENBRIDGE NORTHERN GATEWAY PROJECT
See Inset
Channel
Doug
las
Foch LagoonGilttoyees Inlet
DevastationChannel
Ursula Channel
100
m
200 m
100
m
Inset1:70,000
KitimatTerminal
Emsley Point
Bish Creek
K i t i
m a
t A
r m
KP 1172
REFERENCES: NTDB Topographic Mapsheets provided by the Majesty the Queen in Right of Canada, Department of Natural Resources. All rights reserved.
JWA-1048334-1551
Reference: Pipeline Route R
Kilometre Post
Pipeline
Tunnel
Security Fence
Terrestrial PDA
Marine PDA
Terrestrial PEAA for Marine Birds
Nesting Suitability
1 - High
2 - Moderate
3 - Low
4 - Nil
Bathymetric Contour (100 m)
Railway
Road
Kitimat
0 2 4 6 8 10
Kilometres


Sec. 52 Application Volume 6B: Environmental and Socio-Economic Assessment (ESA) – Marine Terminal Section 12: Marine Birds
May 2010 Page 12-25
Summary
Overall, the proportion of Marbled Murrelet nesting habitat within the PEAA affected by construction of the Kitimat Terminal and installation of the pipelines is low. Change in habitat at the Kitimat Terminal will affect approximately 91 ha of preferred habitat for nesting. This represents approximately 29% of the preferred habitat available within the PEAA at baseline conditions. Despite efforts to collect data, nesting densities have not been confirmed in the PEAA. So, using conservative murrelet density estimates (i.e., 0.08 birds/ha [Burger et al. 2004, Internet site]) less than 0.1% of birds in the northern mainland population would be affected by the terrestrial construction activities. This change to habitat is not expected to represent a risk to regional stability of the breeding Marbled Murrelet population.
The creation of forest openings due to land clearing within Marbled Murrelet nesting habitat is not expected to have an effect on productivity (Zharikov et al. 2006). Marbled Murrelets appear to use canopy openings to access their nest sites and frequently choose nest sites adjacent to large natural openings (e.g., creeks, rocky outcrops or avalanche tracks). Malt and Lank (2007) argue that hard edges created from clearing allow predators (e.g., corvids) to access murrelet nests, but these effects lessen as successional vegetation softens the edge (CMMRT 2003; Malt and Lank 2007); (see Limiting Factors in Section 12.5.1).
Although some habitat will be permanently changed, the scale of the Project is relatively small compared with the amount of available habitat in the PEAA and vicinity. Changes to habitat will be long-term, as they will persist for the life of the Project through to the re-establishment of old growth forest along the RoW and the Kitimat Terminal area, but will be reversible. Important habitat for preferred prey species such as Pacific sand lance, Pacific herring and surf smelt (Hypomesus pretiosus) will not be affected by change in habitat. Therefore, project effects on habitat availability and quality are not significant (see Table 12-4).
12.5.3.4 Cumulative Effects Implications
The Project is expected to result in a long-term loss of a relatively small amount of preferred nesting habitat. The Kitimat Terminal is proposed within an area designated as industrial and forest licence lands by the District of Kitimat (2008), so there are previous disturbances that have likely resulted in the loss of nesting habitat. The greatest effect would be from logging practices. However, these are regulated under the Forest and Range Practices Act and must meet the guidelines in the Identified Wildlife Management Strategy. As habitat management is a component of this strategy, environmental effects on murrelet nesting habitat should have been addressed before logging. Based on this context, the cumulative change in preferred nesting habitat is not expected to substantially alter the long-term sustainability of the regional Marbled Murrelet population. The cumulative effects of change in habitat in the PEAA are not significant, and the Project’s contribution to the cumulative effects is also considered not significant.

Sec. 52 Application Volume 6B: Environmental and Socio-Economic Assessment (ESA) – Marine Terminal Section 12: Marine Birds
Page 12-26 May 2010
Table 12-4 Characterization of the Residual Effects on Marbled Murrelet
Activity Effect Direction
Additional Proposed Mitigation/ Compensation
Measures1-12
Residual Environmental Effect
Magnitude
Geographic Extent
Duration/
Frequency
Reversibility
Significance Potential
Measurable Contribution to
Regional Cumulative
Environmental Effects
Construction Inwater infrastructure site preparation (dredging, blasting, pile drilling)
Change in habitat
Adverse • Limit the area of disturbance1
• Limit blasting2 • Maintain equipment3
L (N – M)
L M/S R N N
Sensory disturbance
Adverse • Limit the area of disturbance1
• Limit blasting2 • Maintain equipment3 • Limit night lighting4 • Acoustic blankets5
N L M/S R N N
Risk of mortality
Adverse • Limit the area of disturbance1
• Use hazing techniques6
N S M/S I N N

Sec. 52 Application Volume 6B: Environmental and Socio-Economic Assessment (ESA) – Marine Terminal Section 12: Marine Birds
May 2010 Page 12-27
Table 12-4 Characterization of the Residual Effects on Marbled Murrelet (cont’d)
Activity Effect Direction
Additional Proposed Mitigation/ Compensation
Measures1-11
Residual Environmental Effect
Magnitude
Geographic Extent
Duration/
Frequency
Reversibility
Significance Potential
Measurable Contribution to
Regional Cumulative
Environmental Effects
Construction (cont’d) Onshore infrastructure site preparation (clearing, burning, grading, blasting)
Change in habitat (breeding habitat)
Adverse • Limit the area of disturbance1
• Maintain equipment3 • Protect nest trees7
L (N – M)
L M/S I N N
Sensory disturbance
Adverse • Limit the area of disturbance1
• Maintain equipment3 • Limit night lighting4 • Protect nest trees7
N L M/S R N N
Risk of mortality (breeding habitat)
Adverse • Limit the area of disturbance1
• Protect nest trees7
N S M/S I N N

Sec. 52 Application Volume 6B: Environmental and Socio-Economic Assessment (ESA) – Marine Terminal Section 12: Marine Birds
Page 12-28 May 2010
Table 12-4 Characterization of the Residual Effects on Marbled Murrelet (cont’d)
Activity Effect Direction
Additional Proposed Mitigation/ Compensation
Measures1-12
Residual Environmental Effect
Magnitude
Geographic Extent
Duration/
Frequency
Reversibility
Significance Potential
Measurable Contribution to
Regional Cumulative
Environmental Effects
Construction (cont’d) Inwater infrastructure construction (marine terminal, berths, pile installation) On-shore infrastructure construction (tank terminal, interconnector pipes, support buildings, pumps, etc.)
Change in habitat
Adverse • Limit the area of disturbance1
• Maintain equipment3
L (N – M)
L M/S I N N
Sensory disturbance
Adverse • Maintain equipment3 • Limit night lighting4 • Bubble curtain9
N L M/S R N N
Risk of mortality
Adverse • Limit night lighting4 L L M/S I N N
Change in habitat
Adverse • Turbidity curtain10 L L M/S R N N
Sensory disturbance
Adverse • Bubble curtain9 L L M/S R N N

Sec. 52 Application Volume 6B: Environmental and Socio-Economic Assessment (ESA) – Marine Terminal Section 12: Marine Birds
May 2010 Page 12-29
Table 12-4 Characterization of the Residual Effects on Marbled Murrelet (cont’d)
Activity Effect Direction
Additional Proposed Mitigation/ Compensation
Measures1-12
Residual Environmental Effect
Magnitude
Geographic Extent
Duration/
Frequency
Reversibility
Significance Potential
Measurable Contribution to
Regional Cumulative
Environmental Effects
Operations Onshore infrastructure operations (tank terminal and associated site water run-off, lights, noise, waste water disposal, emissions) Inwater infrastructure operations (marine terminal, berths and associated lights, noise)
Change in habitat (salinity or temperature changes)
Adverse • Maintain equipment3 • Limit discharge to sea11
L L L/S R N N
Sensory disturbance
Adverse • Maintain equipment3 • Bird strike alerts8 • Limit night lighting4
N L L/R R N N
Risk of mortality
• Bird strike alerts8 • Garbage storage and
disposal12
N S L/S I N N
Berthed tankers (and associated combustion emissions, prop wash, noise, boom deployment)
Sensory disturbance
Adverse • Maintain equipment3 • Bird strike alerts8 • Limit night lighting4
N L L/S I N N

Sec. 52 Application Volume 6B: Environmental and Socio-Economic Assessment (ESA) – Marine Terminal Section 12: Marine Birds
Page 12-30 May 2010
Table 12-4 Characterization of the Residual Effects on Marbled Murrelet (cont’d)
Activity Effect Direction
Additional Proposed Mitigation/ Compensation
Measures1-12
Residual Environmental Effect
Magnitude
Geographic Extent
Duration/
Frequency
Reversibility
Significance Potential
Measurable Contribution to
Regional Cumulative
Environmental Effects
Decommissioning Onshore site restoration (infrastructure removal)
Change in habitat
Positive N/A - - - - - -
Sensory disturbance
Adverse • Maintain equipment3 • Limit night lighting4 • Bird strike alerts8
N L M/S R N N
Risk of mortality
Adverse • Limit the area of disturbance1
• Limit night lighting4 • Protect nest trees7 • Garbage storage and
disposal12
N S S/S I N N
Inwater infrastructure site restoration (infrastructure removal)
Change in habitat
Positive N/A - - - - - -
Sensory disturbance
Adverse • Maintain equipment3 • Limit night lighting4 • Bird strike alerts8
N S M/S R N N
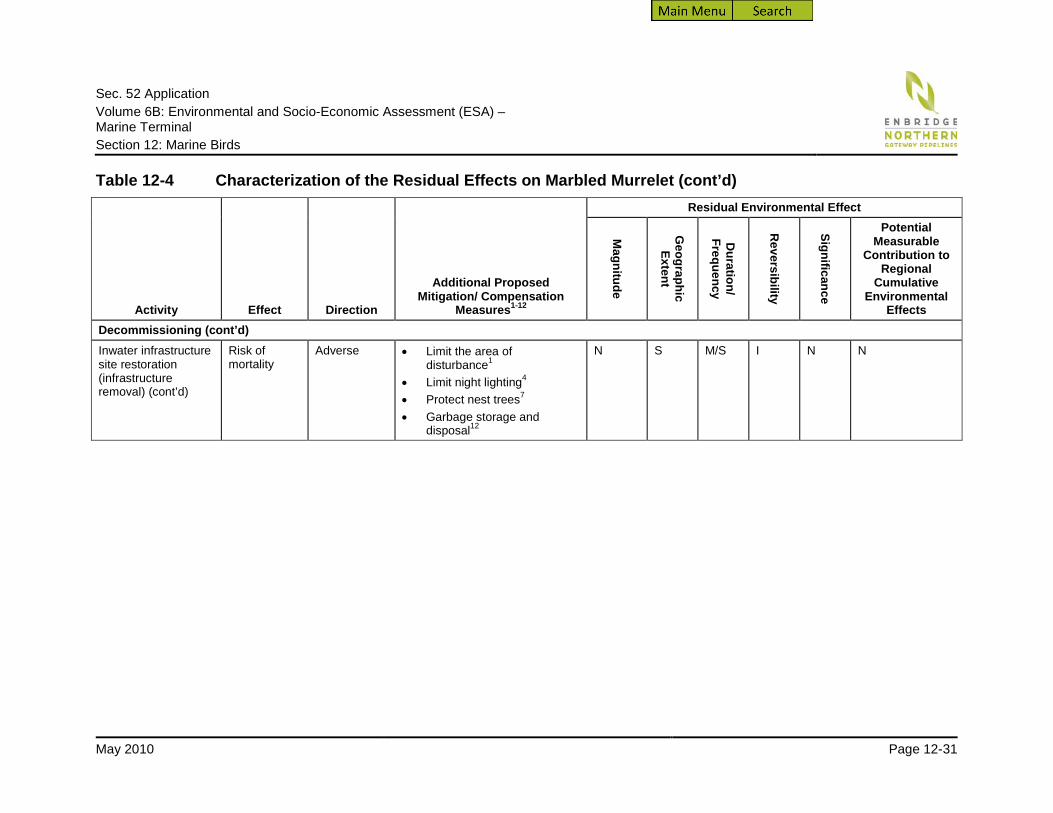
Sec. 52 Application Volume 6B: Environmental and Socio-Economic Assessment (ESA) – Marine Terminal Section 12: Marine Birds
May 2010 Page 12-31
Table 12-4 Characterization of the Residual Effects on Marbled Murrelet (cont’d)
Activity Effect Direction
Additional Proposed Mitigation/ Compensation
Measures1-12
Residual Environmental Effect
Magnitude
Geographic Extent
Duration/
Frequency
Reversibility
Significance Potential
Measurable Contribution to
Regional Cumulative
Environmental Effects
Decommissioning (cont’d) Inwater infrastructure site restoration (infrastructure removal) (cont’d)
Risk of mortality
Adverse • Limit the area of disturbance1
• Limit night lighting4 • Protect nest trees7 • Garbage storage and
disposal12
N S M/S I N N

Sec. 52 Application Volume 6B: Environmental and Socio-Economic Assessment (ESA) – Marine Terminal Section 12: Marine Birds
Page 12-32 May 2010
Table 12-4 Characterization of the Residual Effects on Marbled Murrelet (cont’d) Mitigation: 1. Limit the area of disturbance: Limit the area of disturbance from the PDA. Sensitive habitats will be clearly identified as no-machine areas with snow fencing
or equivalent. 2 Limit blasting: Northern Gateway will develop a Blasting Management Plan. Timing of blasting will be determined in consultation with the CWS. 3 Maintain equipment: Equipment will have manufacturer-recommended mufflers or equivalent features and will be maintained in good working order to reduce
noise levels. 4 Limit night lighting: The use of lighting at night will be limited, as practical. Where permissible under safety and navigation requirements, outdoor lights will be
upward shielded to reduce attraction by birds in flight. All unnecessary outside lights will be extinguished at night. Work periods will be scheduled during daylight hours whenever possible to limit the need for staging lights.
5 Acoustic blankets: Where feasible, acoustic blankets will be used to reduce above-ground noise from construction activities. 6 Hazing techniques: If required, small exploding devices, alarm recordings or raptor call broadcasts will be used to prompt birds to move away from the
blasting zone. 7 Protect nest trees: If a tree containing the nest of a Bald Eagle, Marbled Murrelet or species protected by the British Columbia Wildlife Act is discovered, no-
disturbance buffer zones will be established (e.g., Demarchi et al. 2005). Where disturbance is unavoidable, Northern Gateway will consult with the appropriate regulators to identify possible options and management strategies..
8 Bird strike alerts: When berthed, vessels will be alerted to the hazards of bird strikes from deck lighting, particularly on nights when visibility is poor. Staff will be notified of key seasonal and daily migratory periods for marine birds and be instructed to be particularly vigilant at these times.
9 Bubble curtain: (For Marbled Murrelet and Surf Scoter.) A bubble curtain will be used to attenuate underwater sound levels. 10 Turbidity curtain: Turbidity curtains will be used around shallow (i.e., 3 to 4 m) inwater construction dredging, and blasting to limit possible sedimentation of
adjacent habitat. 11 Limit discharge to sea: Discharge of fresh water during operations will comply with standards established under the British Columbia Waste Management Act,
Petroleum Storage and Distribution Facilities Storm Water Regulation and the Special Waste Regulation. 12 Garbage storage and disposal: Domestic waste will be managed to reduce its attraction to scavengers. Garbage will be securely stored and removed daily to
regulated disposal sites. The outdoor storage of organic waste will be prohibited. Northern Gateway will dispose of organic waste at a municipal transfer station on a daily basis. Northern Gateway will also implement a rat control program at the Kitimat Terminal and will encourage contract vessels to do the same.

Sec. 52 Application Volume 6B: Environmental and Socio-Economic Assessment (ESA) – Marine Terminal Section 12: Marine Birds
May 2010 Page 12-33
Table 12-4 Characterization of the Residual Effects on Marbled Murrelet (cont’d) KEY Magnitude: N Negligible: Effects can be associated
with annual mortality or displacement of less than 1% of birds in the regional population.
L Low: Temporary disturbance limited to the PDA with no permanent change in suitable habitat within the PEAA. Effects can be associated with mortality or displacement of 1 to 5% of birds in the regional population.
M Moderate: Permanent change in habitat limited to the PDA with limited change in suitable habitat within the PEAA. Effect can be associated with mortality or displacement of 5 to 10% of birds in the regional population.
H High: Permanent change in suitable habitat within the PEAA. Effect can be associated with mortality or displacement of more than 10% of birds in the regional population.
Geographic Extent: S Site-specific: Environmental effects
restricted to the PDA L Local: Environmental effects restricted
to the PEAA R Regional: Environmental effects occur
beyond the PEAA
Duration: S Short-term: Effects are measurable for
less than one breeding season (less than one year)
M Medium-term: Effects are measurable within one generation or several breeding seasons (2 to 10 years)
L Long-term: Effects are measurable for multiple generations or multiple breeding seasons (10 to 20 years)
P Permanent: Effects are permanent
Frequency: O Occurs once S Occurs at sporadic
intervals R Occurs on a regular basis
and at regular intervals C Continuous
Reversibility: R Reversible I Irreversible
Significance: S Significant N Not significant
Potential Contribution to Regional Cumulative Effects: Y Yes N No
NOTE: NA – Not Applicable

Sec. 52 Application Volume 6B: Environmental and Socio-Economic Assessment (ESA) – Marine Terminal Section 12: Marine Birds
Page 12-34 May 2010
12.5.4 Effects on Marbled Murrelet from Sensory Disturbance
12.5.4.1 Effect Mechanisms
Construction Noise and human activities that may disturb Marbled Murrelet are onshore and inwater site preparation for the marine terminal, onshore and inwater construction, and pipeline construction.
Operations Disturbance along the RoW is expected to be minimal during operations. Operations will be limited to occasional aerial and ground-based RoW inspections, vegetation control, and operational and maintenance activities around the Kitimat Terminal.
Routine non-shipping operations that may disturb Marbled Murrelet include activities related to hydrocarbon transfers, vehicular and aircraft traffic, and infrastructure maintenance or repairs.
Decommissioning Disturbances during decommissioning are likely to be similar to those experienced during construction. Decommissioning of the pipelines is not expected to result in any additional environmental effects on Marbled Murrelet since the pipelines will remain in place underground and activities will focus on the removal of above ground infrastructure. Decommissioning of the Kitimat Terminal during the breeding season may cause Marbled Murrelets to avoid the PDA and increase the length of their daily travels. However, many murrelets travel 100 km twice a day (Piatt and Naslund 1995) and a detour is not likely to represent a notable increase in energetic costs.
12.5.4.2 Mitigation and Effects Management
Specific measures to reduce the effect of sensory disturbance on Marbled Murrelets include:
• Clearing will be planned for as short a time as possible to reduce sensory disturbance effects. Where possible, it will be done outside nesting, fledging and other sensitive periods, as recommended by the Canadian Wildlife Service and the British Columbia Ministry of Environment.
• Northern Gateway will develop a Blasting Management Plan. Timing of blasting will be developed in consultation with the CWS and other regulators, as appropriate. The Blasting Management Plan will consider hazing techniques, such as small exploding devices, alarm recordings or raptor call broadcasts, to prompt birds to move away from the blasting zone.
• Use of lighting at night will be limited to the extent practical. Where permissible under safety and navigation requirements, outdoor lights will be upward shielded to reduce attraction by birds in flight. All unnecessary outside lights will be extinguished at night. Work periods will be scheduled during daylight hours whenever possible to limit the need for staging lights.

Sec. 52 Application Volume 6B: Environmental and Socio-Economic Assessment (ESA) – Marine Terminal Section 12: Marine Birds
May 2010 Page 12-35
12.5.4.3 Project Residual Effects
Construction
Terrestrial
During the breeding season, Marbled Murrelet may experience disturbance within 50 m of the PDA and RoW, wherever these overlap preferred habitat (CMMRT 2003). Most land clearing in the PEAA will take place before the breeding season. However, some grading, installing and testing of the pipelines will take place during the breeding season.
Marine
Although the normal behaviour patterns of Marbled Murrelet near the Kitimat Terminal may be disrupted initially, the birds may become habituated to construction activities, as long as the disturbances are not associated with other negative experiences (Ward and Stehn 1989; Steidl and Anthony 2000; Goudie and Jones 2004). For example, Marbled Murrelet use habitat at the nearby MK Bay Marina (see Figure 12-1), despite regular disruptions from boating activities.
Operations
Terrestrial
No reports have been published of Marbled Murrelets colliding with towers or experiencing disturbances due to lights. Other species of night-flying seabirds and migrating birds are occasionally attracted to lights at coastal installations and are killed by colliding with them. Weather conditions and the magnitude of bird movements are important factors that influence bird mortality from collisions with tower structures (Crawford 1981). Moisture droplets in the air due to fog or drizzle refract the light and greatly increase the illuminated area, which enhances the attraction (Montevecchi et al. 1999). Birds may also become disoriented by lights, particularly during overcast or foggy conditions and may fly continuously around them. As a result, the birds may expend additional energy, and foraging or migration can be disrupted (Avery et al. 1978; Bourne 1979; Sage 1979). Most reports of bird mortality related to light attraction have been associated with tall buildings or communication towers. Flashing white strobe lights have been shown to reduce such mortality. These could be installed on tall structures at the Kitimat Terminal, if bird mortality occurs, as long as the lighting does not increase visual effects on Kitamaat Village.
Marine
Murrelets may temporarily abandon foraging activity if disturbed by boating traffic (see Section 12.5). However, flushing behaviour is usually associated with aggressive recreational traffic and, as previously noted, Marbled Murrelets are observed close to marinas, ferry terminals and shipping docks, indicating that routine operations are not likely to disturb them.

Sec. 52 Application Volume 6B: Environmental and Socio-Economic Assessment (ESA) – Marine Terminal Section 12: Marine Birds
Page 12-36 May 2010
Summary
During construction, operations and decommissioning, sensory disturbance will affect a small proportion of preferred Marbled Murrelet nesting habitat (285 ha) within the PEAA. The occurrence of Marbled Murrelets in the marine components of the PEAA is fairly common and they can be observed throughout the year. Their relative abundance is low as they typically occur as individuals or small groups (approximately two to five birds) throughout the year. Elsewhere in their range, murrelets have been recorded around industrialized sites such as ferry terminals and were common in Vancouver Harbour until recently. Blasting is the activity most likely to generate loud and unpredictable noise that could disturb nesting and foraging Marbled Murrelets. This is spatially and temporally a highly limited disturbance. Therefore, any habitat avoidance by the birds will likely be temporary.
Environmental effects from sensory disturbance are expected to be short-to-medium-term and sporadic, localized along the RoW and in the PDA, and reversible (see Table 12-4) (i.e., birds will return to the area once the disturbances cease). As a result, sensory disturbances associated with the marine terminal and RoW are not expected to be measurable on the local Marbled Murrelet population and are not significant.
12.5.4.4 Cumulative Effects Implications
Although sensory disturbances from the construction and operations of the Kitimat Terminal will overlap spatially and temporally with similar activities for existing projects (Eurocan Pulp and Paper Co., Methanex Corporation, Rio Tinto Alcan Primary Metal British Columbia) and approved projects (Kitimat LNG Inc., Arthon Construction Ltd. and Sandhill Materials Sandhill Project), the avoidance of breeding and foraging habitats in the PEAA is not expected to be measurable. As mentioned above, Marbled Murrelets occurrence in the PEAA has remained relatively consistent despite the presence of the existing projects. Neither the existing level of sensory disturbances nor the project contribution is likely to affect the viability or sustainability of the Marbled Murrelet population. As a result, cumulative effects are not considered further in this assessment.
12.5.5 Effects on Marbled Murrelet from Direct Mortality
12.5.5.1 Effects Mechanisms
Construction
Direct mortality (e.g., strikes) could occur if birds collide with high features (e.g., crane wires) but the likelihood of this is extremely low. Further, murrelets do not use terrestrial habitat outside the breeding season, and potential mortality effects can be mitigated by performing specific construction activities (e.g., cranes for pilings) outside the breeding window.
Operations
Indirect mortality on Marbled Murrelet could result from increases in scavenger bird species. Although some cleared areas along the RoW will be allowed to revegetate during operations, RoW vegetation will be controlled. As a result, secondary edge effects associated with habitat fragmentation, such as increased movements into old-growth forests by predators (Donovan et al. 1997; George and Brand 2002; Malt and Lank 2007) will persist for the life of the Project.

Sec. 52 Application Volume 6B: Environmental and Socio-Economic Assessment (ESA) – Marine Terminal Section 12: Marine Birds
May 2010 Page 12-37
The potential for increased direct mortality due to artificial lights disorienting the birds was discussed in the sensory disturbance section (see Section 12.5.4).
Decommissioning
During decommissioning, mortality risks along the RoW are estimated to be very low since little activity is expected to occur in this area. The greatest risk of mortality will occur during the decommissioning of the Kitimat Terminal. The risk of mortality during decommissioning will be similar to that described for construction.
12.5.5.2 Mitigation and Effects Management
Specific measures to reduce the risk of mortality on Marbled Murrelets include:
• If active Marbled Murrelet nests are discovered, a buffer zone of 200 m of undisturbed vegetation around the nest site will be established. This buffer will provide a habitat patch of approximately 10 ha that will protect the nest from sensory disturbance from loud and disruptive activities. This buffer will remain in place until a professional biologist confirms that the young have fledged or are otherwise no longer present. Where disturbance is unavoidable, Northern Gateway will consult with appropriate regulators to discuss possible options and management strategies.
• Clearing will be scheduled in consultation with the appropriate regulators (e.g., CWS and BC MoE). Work windows will consider sensitive periods such as nesting and rearing.
• Use of lighting at night will be limited to the extent practical. Where permissible under safety and navigation requirements, outdoor lights will be upward shielded to reduce attraction by birds in flight. All unnecessary outside lights will be extinguished at night. Work periods will be scheduled during daylight hours whenever possible to limit the need for staging lights.
• Domestic waste will be managed to reduce its attraction to scavengers. Garbage will be securely stored and removed daily to regulated disposal sites. The outdoor storage of organic waste will be prohibited. Northern Gateway will dispose of organic waste at a municipal transfer station on a daily basis. Northern Gateway will also implement a rat control program at the Kitimat Terminal and will encourage contract tankers to do the same.
12.5.5.3 Project Residual Effects
Construction
Although vegetation clearing for the Kitimat Terminal, the RoW and access roads may increase predator access to Marbled Murrelet habitat (Malt and Lank 2007), clearing has not been definitively linked to decreased productivity in murrelet breeding (see Section 12.5.1). If predator-related mortality occurs, it is likely to be localized.

Sec. 52 Application Volume 6B: Environmental and Socio-Economic Assessment (ESA) – Marine Terminal Section 12: Marine Birds
Page 12-38 May 2010
Operations
Garbage attracts scavengers such as gull species, corvids and Bald Eagles, which prey on Marbled Murrelet (Blood and Anweiler 1994; Burger 2002; CMMRT 2003; Malt and Lank 2007). Strict management of domestic waste, especially food waste, as well as a prohibition on the feeding of wildlife by workers, will help reduce the attraction of predators to project infrastructure.
Summary
The risk of mortality due to collision with project infrastructure is expected to be low. Indirect effects will be highly localized relative to the availability of preferred habitat in the PEAA and are expected to affect only a small portion (i.e., less than 1%) of the local population (see Table 12-4). Given the size of PDA, as well as the mitigation measures that will be employed, and the low relative abundance and density of murrelets in the area, the risk of mortality for Marbled Murrelet from project activities is not significant.
12.5.5.4 Cumulative Effects Implications
The effects of the Project on the risk of mortality are not expected to be measurable. Although other projects and activities will likely act in combination with the Project to increase the risk of mortality, the cumulative risk in the PEAA is still expected to be low. Existing and future projects will have to consider guidelines for the management and recovery of Marbled Murrelet populations, therefore the cumulative risk of mortality is not significant.
12.5.6 Prediction Confidence There is a general understanding of the distribution and abundance of marine birds in the north coast of British Columbia. Efforts to collect baseline data for the Project have resulted in additional site-specific data that has been used to verify the historic information.
The measurable parameters identified for the effects assessment provide for both a quantitative and a qualitative understanding of residual effects. For change in habitat, habitat measurements for the terrestrial environment have been completed according to accepted protocols and standards (RIC 1999). Assessments of foraging habitat are based on baseline data and assessments completed in other sections (e.g., marine fish, marine invertebrates and marine vegetation).
Limited research has been completed on the effects of sensory disturbance and mortality. However, characterizing these effects in the context of occurrence, distribution and relative abundance provides for a reliable assessment.
The avoidance of habitats is the preferred measure for limiting environmental effects on marine birds and this has been completed to the extent practical during the design and planning for the Project. Other mitigation measures are based on previously completed projects and are known to be effective. Therefore, there is a high level of confidence in the environmental effects assessment for Marbled Murrelet.

Sec. 52 Application Volume 6B: Environmental and Socio-Economic Assessment (ESA) – Marine Terminal Section 12: Marine Birds
May 2010 Page 12-39
12.6 Surf Scoter
12.6.1 Ecology and Habitat Requirements
Status
The Surf Scoter is blue-listed in British Columbia but is not listed by COSEWIC. In British Columbia, it has a ranking of S3 (Special Concern) for the breeding population, which has been declining in western North America, and S4 (Apparently Secure) for the non-breeding population (BC CDC 2008, Internet site). The Surf Scoter is the most numerous wintering sea duck, frequently out numbering all other marine birds (Savard et al. 1998).
Seasonal Distribution and Occurrence
Surf Scoters winter along the entire coast of British Columbia. Males, females and young all likely have different migrations routes (Savard et al. 1998). Males are the first to return to the west coast in late summer to moult. They form large aggregations (from a few hundred to several thousands) in bays and estuaries to undergo a complete prebasic moult (Campbell et al. 1990b; Savard et al. 1998). During moult, they cannot fly and rely on sheltered areas and large flock size for survival. Females and young will join the males on the coast in the fall after undergoing their own moult at or near the breeding areas. Spring migration to their breeding grounds in the Peace River and Fort Nelson lowlands begins in late March and peaks in late April to early May.
Individuals occur in the PEAA during the spring, winter and moulting periods. Results of project field surveys show that relative abundance is highest in the spring. Observations of Surf Scoter have been made in Kemano Bay, Devastation and Douglas channels, Coste Rocks (south end of Coste Island), Kitamaat Village, Kitimat River estuary, Minette Bay, the Eurocan oxbow, the Pollution Control Centre and Lakelse Lake. Up to 800 birds have been observed between Kitamaat Village and Coste Rocks (see the Marine Birds TDR; Hay 1976; Horwood 1992).
Habitat Requirements
Non-breeding habitat includes sheltered freshwater and marine habitats such as bays, harbours and lagoons. At these sites, birds are usually found where water depths are less than 6 m (Campbell et al. 1990b). This species rarely uses estuaries except during migration (Campbell et al. 1990b; Savard et al. 1998).
Mussels, a large part of the bird’s diet, occur within the lower intertidal and upper subtidal zone in rocky coastline areas throughout the PEAA. Pacific herring roe are also an important food source in the PEAA. Herring spawn locally along the foreshore between Kitamaat Village and Minette Bay, in Clio Bay, Kildala Arm and on Coste Island. Within the Kitimat fjord complex, there are spawning beds on both sides of Douglas Channel, on the west side of Ursula Channel, and on the south side of Coste Island (see Figure 12-1).

Sec. 52 Application Volume 6B: Environmental and Socio-Economic Assessment (ESA) – Marine Terminal Section 12: Marine Birds
Page 12-40 May 2010
Surf Scoters frequent the PEAA during winter and spring to rest and forage. They are regularly observed in groups of approximately 40 to 50 individuals. Larger groups (i.e., 400 to 800) have been observed in spring but these are typically associated with herring spawning areas. There are no herring spawning beds within the PDA although there are herring spawning locations scattered throughout the PEAA, mainly north of the PDA through Minette Bay and along the east shoreline of Kitimat Arm (see the Marine Fish and Fish Habitat TDR [Beckett and Munro 2010]).
Abundance and Population Trend
The breeding population in British Columbia is unknown but believed to be relatively small (Fraser et al. 1999). No British Columbia trend data are available but data from 1984 to 1994 show a decline in the North American population (Goudie et al. 1994). In addition, trends for all scoter species in western North America show declines of roughly 50% since 1950 (Bellrose 1980; Martell et al. 1984; Horwood 1992; SDJV 2004, Internet site). In spring, the population along coastal British Columbia has been estimated at 650,000 individuals (Vermeer 1981), with flocks of up to 300,000 birds (Martin 1978). Migrant and winter populations of Surf Scoter in British Columbia may contain 30 to 50% of the global population (Campbell et al. 1990b).
Limiting Factors
Reasons for the decline in the number of North American Surf Scoter are unknown. Contributing factors could include an increase in urbanization, chemical contamination and hunting pressure (Kehoe 1994). Urbanization and industrialization of many coastal bays and estuaries have contributed to the degradation of winter habitat (NatureServe 2008, Internet site). Winter food supplies have been exposed to chemical contamination and heavy metal accumulation, which may affect the reproductive success. Surf scoters may also be vulnerable to over-harvesting from hunting (Kehoe 1994).
12.6.2 Scope of Assessment for Surf Scoter Since there has been no documented breeding in the Kitimat area, the scope of the assessment focuses on potential environmental effects on non-breeding Surf Scoter (e.g., migrating, wintering and/or moulting) in the marine environment. See Table 12-5 for the construction, operations and decommissioning activities that may affect Surf Scoter.

Sec. 52 Application Volume 6B: Environmental and Socio-Economic Assessment (ESA) – Marine Terminal Section 12: Marine Birds
May 2010 Page 12-41
Table 12-5 Potential Environmental Effects on Surf Scoter This table identifies the potential environmental effects on Surf Scoter that are assessed in this section of the ESA. Each of these environmental effects is discussed in more detail later in this section. Recommendations for mitigation and, if required, follow-up and monitoring are also provided. With the implementation of these mitigation measures where appropriate, the Project is not likely to cause significant adverse environmental effects on marine birds due to effects on Surf Scoter.
Project Activities and Physical Works
Key Environmental Effects on Surf Scoter Relevance to the Assessment
Considered in the ESA Kitimat Terminal
Construction
• Inwater infrastructure site preparation (dredging, blasting, pile drilling)
• Change in habitat • Change in foraging habitat
• Sensory disturbance • Avoidance or stress to birds in area
• Risk of mortality • May cause bird strikes
• Onshore infrastructure site preparation (clearing, burning, grading, blasting)
• Sensory disturbance • Avoidance or stress to birds
• Inwater infrastructure construction (marine terminal, berths, pile installation)
• Change in habitat • Provide habitat for marine invertebrate prey
• Sensory disturbance • Avoidance or stress to birds
• Risk of mortality • May cause bird strikes
• Onshore infrastructure construction (tank terminal, inter-connector pipes, support buildings, pumps, etc.)
• Sensory disturbance • Avoidance or stress to birds
Operations
• Inwater infrastructure PDA (marine terminal, berths and associated shading, underwater structures)
• Sensory disturbance • Avoidance or stress to birds
• Risk of mortality • May cause bird strikes
• Onshore infrastructure operations (tank terminal and associated site water run-off, lights, noise, waste water disposal, emissions)
• Sensory disturbance • Avoidance or stress to birds
• Risk of mortality • May cause bird strikes
• Inwater infrastructure operations (marine terminal, berths and associated lights, noise)
• Change in habitat (salinity or temperature changes)
• May change habitat for forage species
• Sensory disturbance • Avoidance or stress to birds • Risk of mortality • May cause bird strikes
• Berthed tankers (and associated combustion emissions, prop wash, noise, boom deployment)
• Sensory disturbance • Avoidance or stress to birds

Sec. 52 Application Volume 6B: Environmental and Socio-Economic Assessment (ESA) – Marine Terminal Section 12: Marine Birds
Page 12-42 May 2010
Table 12-5 Potential Environmental Effects on Surf Scoter (cont’d) Project Activities and
Physical Works Key Environmental Effects on
Surf Scoter Relevance to the Assessment Considered in the ESA
Kitimat Terminal Decommissioning • Inwater infrastructure site
restoration (infrastructure removal)
• Change in habitat • Loss of habitat used by forage species
• Marine structures will not be removed and no equipment will be removed by vessel
• Sensory disturbance • Avoidance or stress to birds • Onshore site restoration
(infrastructure removal) • Sensory disturbance • Avoidance or stress to birds
12.6.3 Effects on Surf Scoter from Changes in Habitat
12.6.3.1 Effect Mechanisms
Construction
A change in foraging habitat will occur mainly during site preparation for the marine terminal. Activities will include blasting, dredging and drilling for piles. These activities may adversely affect aquatic invertebrates (e.g., mussels) in the PDA through direct loss, or increased sedimentation, changing the quality of scoter foraging habitat. Installation of pilings and wharf structures will provide habitat for Surf Scoter prey such as molluscs and crustaceans, and the creation of new hard surfaces is expected to provide a net gain of habitat upon completion of construction.
Operations
During operations, surface water runoff from the tank and manifold areas will be directed to, and stored in, the impoundment reservoir. Excess surface water runoff from the impoundment reservoir will be released into the marine environment through a subtidal, perforated pipe after treatment so that the oil-in-water concentration is less than 15 ppm. Surface water runoff from the area outside the tank and manifold areas will be controlled so that this water will be released outside the boomed zone of the berthing facilities to the extent practical. Because freshwater inputs are very common and abundant in the north coast fjord system, no effect on the availability of benthic forage species for Surf Scoter is expected.
After several years of operations, pilings and other inwater infrastructure may become established as habitat for schooling fish and invertebrates. Surf Scoter may eventually be attracted to the marine terminal, if large numbers of mussels become established in the mooring structures and pilings.
Decommissioning
Inwater infrastructure will be removed, but the consequent change in habitat for forage species such as mussels will be minor and, over time, the habitat will return to pre-construction conditions.

Sec. 52 Application Volume 6B: Environmental and Socio-Economic Assessment (ESA) – Marine Terminal Section 12: Marine Birds
May 2010 Page 12-43
12.6.3.2 Mitigation and Effects Management
Specific measures to reduce the effect of change in habitat on Surf Scoters will focus on dredging and blasting activities, to limit the extent of sedimentation in the marine environment.
12.6.3.3 Project Residual Effects
Based on results of field surveys, Surf Scoters are not actively using areas within the PDA. Most birds were observed during the spring and were primarily flying through the area. During construction, change in Surf Scoter habitat will be restricted to localized areas within the PDA (e.g., dredging and blasting sites, locations of infrastructure). Preparation of the nearshore and inwater infrastructure will affect approximately 1% (1.0 km of 70 km) of the undisturbed shoreline in the PEAA. This area is primarily exposed rock beach that provides patchy distribution of prey species (e.g., mussels) (British Columbia Integrated Land Management Bureau [ILMB] 2007, Internet site). The inwater infrastructure will change some foraging habitat during the life of the Project. However, the new hard surfaces are expected to provide habitat for mussels and other prey. Surf Scoter may be unable to use this habitat during operations (e.g., due to sensory disturbance and avoidance) but the overall effect of change in habitat as a result of construction and operations of the Project will be of a low magnitude given the abundance of foraging habitats in the PEAA.
Other foraging habitats in the PEAA (e.g., herring spawning locations) will not be affected by the construction and operation of the Project. Sedimentation from dredging activities will be limited to a few hundred metres from the PDA (see Section 7) and is not anticipated to affect spawning beds. Given the exposed nature of the PDA, it does not provide suitable habitat for moulting birds.
The effects of change in habitat are expected to be localized and to affect only a relatively small proportion of the regional Surf Scoter population (see Table 12-6). As a result, effects are not expected to be measurable and are predicted to be not significant.
12.6.3.4 Cumulative Effects Implications Project-specific residual environmental effects on Surf Scoter habitat are expected to be highly localized, short-term and reversible. Although other developments have resulted in similar changes to habitat, these effects are also highly localized and have not limited the occurrences of Surf Scoters in the PEAA.
Therefore, as the effects of these other activities and projects on Surf Scoter habitat are unlikely to interact cumulatively with similar project effects to an extent that would affect the long-term sustainability of the Surf Scoter population, cumulative effects on habitat are not significant.

Sec. 52 Application Volume 6B: Environmental and Socio-Economic Assessment (ESA) – Marine Terminal Section 12: Marine Birds
Page 12-44 May 2010
Table 12-6 Characterization of the Residual Effects on Surf Scoter
Activity Effect Direction
Additional Proposed Mitigation/ Compensation
Measures1-16
Residual Environmental Effect
Magnitude
Geographic Extent
Duration/
Frequency
Reversibility
Significance Potential
Measurable Contribution to
Regional Cumulative
Environmental Effects
Construction Inwater infrastructure site preparation (dredging, blasting, pile drilling)
Change in habitat
Adverse • Limit the area of disturbance1
• Turbidity curtain10
L L L/O R N N
Sensory disturbance
Adverse • Maintain equipment3 • Limit night lighting4 • Acoustic blankets5 • Work windows13 • Limit blasting2
L L M/S R N N
Risk of mortality
Adverse • Limit blasting2 • Limit noisy equipment16 • Prohibit hunting14 • Reporting15
N - L L M/S I N N
Onshore site preparation (clearing, burning, grading, blasting)
Sensory disturbance
Adverse • Maintain equipment3 • Limit night lighting4 • Acoustic blankets5 • Work windows13
L L S/S R N N

Sec. 52 Application Volume 6B: Environmental and Socio-Economic Assessment (ESA) – Marine Terminal Section 12: Marine Birds
May 2010 Page 12-45
Table 12-6 Characterization of the Residual Effects on Surf Scoter (cont’d)
Activity Effect Direction
Additional Proposed Mitigation/ Compensation
Measures1-16
Residual Environmental Effect
Magnitude
Geographic Extent
Duration/
Frequency
Reversibility
Significance Potential
Measurable Contribution to
Regional Cumulative
Environmental Effects
Construction (cont’d) Inwater infrastructure construction (marine terminal, berths, pile installation)
Change in habitat
Positive • N/A (effect positive) N/A N/A N/A N/A N/A N
Sensory disturbance
Adverse • Maintain equipment3 • Limit number of piles • Limit night lighting4 • Work windows13 • Bubble curtain9
L L M/R R N N
Risk of mortality
Adverse • Limit night lighting4 • Prohibit hunting14 • Reporting15
L S S/R R N N
Onshore infrastructure construction (tank terminal, interconnector pipes, support buildings, pumps, etc.)
Sensory disturbance
Adverse • Maintain equipment3 • Limit number of piles • Limit night lighting4 • Work windows13 • Acoustic Blankets5
L L M/R R N N

Sec. 52 Application Volume 6B: Environmental and Socio-Economic Assessment (ESA) – Marine Terminal Section 12: Marine Birds
Page 12-46 May 2010
Table 12-6 Characterization of the Residual Effects on Surf Scoter (cont’d)
Activity Effect Direction
Additional Proposed Mitigation/ Compensation
Measures1-16
Residual Environmental Effect
Magnitude
Geographic Extent
Duration/
Frequency
Reversibility
Significance Potential
Measurable Contribution to
Regional Cumulative
Environmental Effects
Operations Inwater infrastructure PDA (marine terminal berths and associated shading, underwater structures)
Sensory disturbance
Adverse • Maintain equipment3 • Limit night lighting4 • Work windows13
N L L/R R N N
Risk of mortality
Adverse • Limit night lighting4 • Prohibit hunting14 • Reporting15
N S L/S I N N
Inwater infrastructure operations (marine terminal, berths and associated lights, noise)
Change in habitat
Adverse • Limit the area of disturbance1
N S L/R R N N
Sensory disturbance
Adverse • Maintain equipment3 • limit night lighting4 • Work windows13
N L L/R R N N
Risk of mortality
Adverse • Limit night lighting4 • Prohibit hunting14 • Reporting15
N S L/S I N N

Sec. 52 Application Volume 6B: Environmental and Socio-Economic Assessment (ESA) – Marine Terminal Section 12: Marine Birds
May 2010 Page 12-47
Table 12-6 Characterization of the Residual Effects on Surf Scoter (cont’d)
Activity Effect Direction
Additional Proposed Mitigation/ Compensation
Measures1-16
Residual Environmental Effect
Magnitude
Geographic Extent
Duration/
Frequency
Reversibility
Significance Potential
Measurable Contribution to
Regional Cumulative
Environmental Effects
Operations (cont’d) Onshore infrastructure operations (tank terminal and associated site water run-off, lights, noise, waste water disposal, emissions)
Sensory disturbance
Adverse • Maintain equipment3 • Limit night lighting4 • Work windows13
N L L/R R N N
Risk of mortality
Adverse • Limit night lighting4 • Prohibit hunting14 • Reporting15
N S L/S I N N
Berthed tankers Sensory disturbance
Adverse • Limit night lighting4 L S L/S R N N
Decommissioning Onshore site restoration (infrastructure removal)
Sensory disturbance
Adverse • Maintain equipment3 • Limit night lighting4 • Work windows13
L L M/S R N N
Inwater infrastructure site restoration (infrastructure removal)
Change in habitat
Adverse • Limit the area of disturbance1
• Turbidity curtain10
L L M/S R N N
Sensory disturbance
Adverse • Maintain equipment3 • Limit night lighting4 • Work windows13
L L M/S R N N
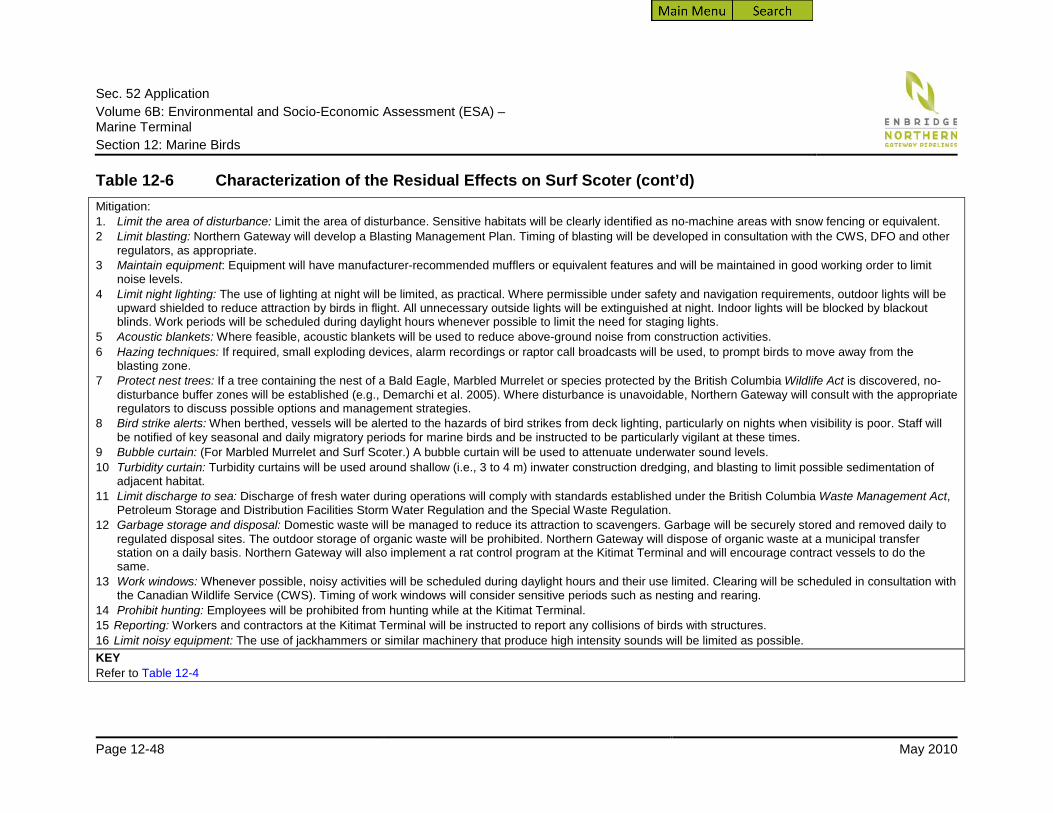
Sec. 52 Application Volume 6B: Environmental and Socio-Economic Assessment (ESA) – Marine Terminal Section 12: Marine Birds
Page 12-48 May 2010
Table 12-6 Characterization of the Residual Effects on Surf Scoter (cont’d) Mitigation: 1. Limit the area of disturbance: Limit the area of disturbance. Sensitive habitats will be clearly identified as no-machine areas with snow fencing or equivalent. 2 Limit blasting: Northern Gateway will develop a Blasting Management Plan. Timing of blasting will be developed in consultation with the CWS, DFO and other
regulators, as appropriate. 3 Maintain equipment: Equipment will have manufacturer-recommended mufflers or equivalent features and will be maintained in good working order to limit
noise levels. 4 Limit night lighting: The use of lighting at night will be limited, as practical. Where permissible under safety and navigation requirements, outdoor lights will be
upward shielded to reduce attraction by birds in flight. All unnecessary outside lights will be extinguished at night. Indoor lights will be blocked by blackout blinds. Work periods will be scheduled during daylight hours whenever possible to limit the need for staging lights.
5 Acoustic blankets: Where feasible, acoustic blankets will be used to reduce above-ground noise from construction activities. 6 Hazing techniques: If required, small exploding devices, alarm recordings or raptor call broadcasts will be used, to prompt birds to move away from the
blasting zone. 7 Protect nest trees: If a tree containing the nest of a Bald Eagle, Marbled Murrelet or species protected by the British Columbia Wildlife Act is discovered, no-
disturbance buffer zones will be established (e.g., Demarchi et al. 2005). Where disturbance is unavoidable, Northern Gateway will consult with the appropriate regulators to discuss possible options and management strategies.
8 Bird strike alerts: When berthed, vessels will be alerted to the hazards of bird strikes from deck lighting, particularly on nights when visibility is poor. Staff will be notified of key seasonal and daily migratory periods for marine birds and be instructed to be particularly vigilant at these times.
9 Bubble curtain: (For Marbled Murrelet and Surf Scoter.) A bubble curtain will be used to attenuate underwater sound levels. 10 Turbidity curtain: Turbidity curtains will be used around shallow (i.e., 3 to 4 m) inwater construction dredging, and blasting to limit possible sedimentation of
adjacent habitat. 11 Limit discharge to sea: Discharge of fresh water during operations will comply with standards established under the British Columbia Waste Management Act,
Petroleum Storage and Distribution Facilities Storm Water Regulation and the Special Waste Regulation. 12 Garbage storage and disposal: Domestic waste will be managed to reduce its attraction to scavengers. Garbage will be securely stored and removed daily to
regulated disposal sites. The outdoor storage of organic waste will be prohibited. Northern Gateway will dispose of organic waste at a municipal transfer station on a daily basis. Northern Gateway will also implement a rat control program at the Kitimat Terminal and will encourage contract vessels to do the same.
13 Work windows: Whenever possible, noisy activities will be scheduled during daylight hours and their use limited. Clearing will be scheduled in consultation with the Canadian Wildlife Service (CWS). Timing of work windows will consider sensitive periods such as nesting and rearing.
14 Prohibit hunting: Employees will be prohibited from hunting while at the Kitimat Terminal. 15 Reporting: Workers and contractors at the Kitimat Terminal will be instructed to report any collisions of birds with structures. 16 Limit noisy equipment: The use of jackhammers or similar machinery that produce high intensity sounds will be limited as possible. KEY Refer to Table 12-4

Sec. 52 Application Volume 6B: Environmental and Socio-Economic Assessment (ESA) – Marine Terminal Section 12: Marine Birds
May 2010 Page 12-49
12.6.4 Effects on Surf Scoter from Sensory Disturbance
12.6.4.1 Effect Mechanisms
Construction Noise and human activity associated with construction activities may cause sensory disturbance for Surf Scoters forcing them away from foraging areas and increasing their energetic costs, resulting in reduced fitness.
Operations Equipment noise and human activity may cause habitat avoidance and increased stress levels among Surf Scoter. Most of the activity and noise at the Kitimat Terminal will occur when tankers are berthed. Activities inside the security fence will occur away from the shoreline so are not expected to disturb Surf Scoter as much as activities in the marine terminal. Some birds may return to the Kitimat Terminal during intervening periods of less noise and activity.
Decommissioning Noise and human activity associated decommissioning activities, particularly for the marine terminal, may cause sensory disturbance.
12.6.4.2 Mitigation and Effects Management
Specific measures to reduce the effect of sensory disturbance on Surf Scoters are: • Where feasible, acoustic blankets will be used to reduce above-ground noise from construction
activities. Bubble curtains will also be used, where appropriate, to attenuate underwater sound levels.
• Noisy activities will be limited and will be scheduled during daylight hours. • Northern Gateway will develop a Blasting Management Plan. Timing of blasting will be developed in
consultation with the CWS, DFO and other regulators, as appropriate. The Blasting Management Plan will consider hazing techniques, if required, such as small exploding devices, alarm recordings or raptor call.
12.6.4.3 Project Residual Effects
During construction and decommissioning, ongoing human activities and noise (particularly in the nearshore area) will likely result in the displacement of a small number of Surf Scoters during periods when birds are present in the area (primarily in spring). Birds are expected to avoid the PDA during this activity as well as during project operations. Disturbed birds will likely move to similar habitats in adjacent areas with less noise and human activity without causing unnecessary stress to individuals.
Surf Scoters are expected to concentrate in suitable foraging and moulting habitat that exists in other parts of the PEAA, so only 20 to 30 birds are expected to be potentially affected by sensory disturbance in the PDA at a particular time. Since the Project does not directly overlap with herring spawning locations, larger groups of birds will not be affected.

Sec. 52 Application Volume 6B: Environmental and Socio-Economic Assessment (ESA) – Marine Terminal Section 12: Marine Birds
Page 12-50 May 2010
Disturbances are not anticipated to affect the long-term viability of individual birds or populations in the PEAA. Once activities and noise cease, birds are expected to return to the area (i.e., environmental effects are reversible) (see Table 12-6). As a result, effects of sensory disturbance from the Project on Surf Scoter are expected to be not significant.
12.6.4.4 Cumulative Effects Implications
Although sensory disturbances from the construction and operations of the Kitimat Terminal will overlap spatially and temporally with similar activities for existing projects (Eurocan Pulp and Paper Co., Methanex Corporation, Rio Tinto Alcan Primary Metal British Columbia) and approved projects (Kitimat LNG Inc., Arthon Construction Ltd. and Sandhill Materials), the avoidance of foraging and moulting habitats in the PEAA is not expected to be measurable. The occurrence of Surf Scoters in the PEAA has remained relatively consistent despite the presence of the existing projects. Neither the existing level of sensory disturbances nor the project contribution is likely to affect the viability or sustainability of the Surf Scoter population. As a result, cumulative effects are not considered further in this assessment.
12.6.5 Effects on Surf Scoter from Direct Mortality
12.6.5.1 Effect Mechanisms
Construction
The mortality of waterfowl due to vessel and construction night lighting has been documented (Black 2005), but this effect remains largely unstudied. The risk of mortality to Surf Scoter may occur through collisions with equipment and infrastructure, although no formal data appear to substantiate this risk specifically for scoters (Savard et al. 1998). Consequently, collisions are expected to be rare, and mitigation measures will be taken to avoid them. Scoters could also be killed or injured by blasting during construction, but given that safety zones will be maintained around blast areas, little or no mortality of Surf Scoter is expected from this source. No mortality of young is expected since there has been no confirmed breeding of scoters in the PEAA.
Operations
The risk of mortality to Surf Scoter through collisions with equipment and infrastructure is similar to what might occur during construction. However, mortality events are expected to be rare.
Decommissioning
Project effects during decommissioning will be similar to those during construction, except that blasting will not occur. The risk of mortality during this phase would be lower than during construction.

Sec. 52 Application Volume 6B: Environmental and Socio-Economic Assessment (ESA) – Marine Terminal Section 12: Marine Birds
May 2010 Page 12-51
12.6.5.2 Mitigation and Effects Management
Specific measures to reduce the risk of mortality on Surf Scoters are as follows:
• Where blasting is necessary, Northern Gateway will develop a Blasting Management Plan. Timing of blasting will be developed in consultation with the CWS, DFO and other regulators, as appropriate. The Blasting Management Plan will consider hazing techniques, if required, such as small exploding devices, alarm recordings or raptor call.
• Use of lighting at night will be limited to the extent practical. Where permissible under safety and navigation requirements, outdoor lights will be upward shielded to reduce attraction by birds in flight. All unnecessary outside lights will be extinguished at night. Indoor lights will be blocked by blackout blinds. Work periods will be scheduled during daylight hours whenever practical to limit the need for staging lights.
12.6.5.3 Project Residual Effects
Risk of mortality to Surf Scoter during construction is anticipated to be very low, given the numbers of birds that occur in the PEAA and their behaviour and the types of project design features and mitigation proposed. The overall effect on mortality is expected to be low due to the localized nature of the environmental effects and the small proportion of the local and regional populations that will be affected (see Table 12-6). As a result, effect of mortality risks associated with the Project on Surf Scoter is predicted to be not significant.
12.6.5.4 Cumulative Effects Implications
A change in the risk of mortality to Surf Scoters from project-related effects is not expected to be measurable. Although other projects and activities will likely act in combination with the Project to increase the risk of mortality, the cumulative risk in the PEAA is still expected to be low. The Project's contribution to the cumulative risk of mortality to Surf Scoters is not expected to affect the viability or sustainability of the local population and is not significant.
12.6.6 Prediction Confidence As described in Section 12.5.6, there is sufficient data available for a reliable assessment of effects on marine birds. Therefore, there is a high level of confidence in the environmental effects assessment for Surf Scoter.
12.7 Bald Eagle
12.7.1 Ecology and Habitat Requirements
Status
The Bald Eagle (Haliaeetus leucocephalus) is yellow-listed (i.e., indigenous and Not at Risk) in British Columbia and is designated as Not at Risk by COSEWIC. The provincial population is ranked as apparently secure (BC CDC 2008, Internet site). It is the most common raptor in the PEAA.

Sec. 52 Application Volume 6B: Environmental and Socio-Economic Assessment (ESA) – Marine Terminal Section 12: Marine Birds
Page 12-52 May 2010
Seasonal Distribution and Occurrence
Bald Eagles are present in British Columbia throughout the year. Their nesting density varies with geography but is highest in coastal habitats (Campbell et al. 1990a; Blood and Anweiler 1994). In winter, an estimated 90% of the British Columbia population is concentrated along the coast in marine environments and river valleys west of the Coast Range (Campbell et al. 1990a; Blood and Anweiler 1994). Blood and Anweiler (1994) use a five-scale ranking system to characterize Bald Eagle habitat. The majority of the Kitimat region falls within the highest rank (very high abundance) and the PEAA is ranked second (high abundance) for nesting Bald Eagle. Bald Eagles occur on open salt water and estuarine habitat in the PEAA. They have been observed along Kitimat Arm and occur throughout Douglas Channel. Numerous Bald Eagles have been recorded at Bish Cove and Emsley Cove (see Figure 12-1; Horwood 2006). Despite high habitat rankings made by Blood and Anweiler (1994) who estimated 9 nests per 100 km along the North Coast, no Bald Eagle nests were observed within the PEAA during marine bird surveys for the Project.
Habitat Requirements
Bald Eagles require large nesting trees close to food (Blood and Anweiler 1994). Approximately 65% of Bald Eagle nests in the province are near marine habitat—on islands, in estuaries and at the mouths of rivers and creeks where fish, aquatic birds and intertidal invertebrates are plentiful (Campbell et al. 1990a; Blood and Anweiler 1994). During fall and winter, Bald Eagle frequent ice-free aquatic habitats between sea level and 2,380 m elevation, including marine areas, rivers, lakes, sloughs and wetlands (Campbell et al. 1990a; Blood and Anweiler 1994). Many can be found near salmon streams during the spawning season (Blood and Anweiler 1994).
Perching and roosting habitat is also an important component of Bald Eagle winter habitat (Blood and Anweiler 1994) but, in general, winter habitat suitability is defined by food availability, presence of roost sites that provide protection from inclement weather, and absence of human disturbance (Buehler 2000, Internet site). Similarly, nesting areas with considerable shoreline development or human activity have nests farther from the shoreline than nest sites in less developed areas (Buehler 2000, Internet site).
Abundance and Population Trend
Gerrard (1983) estimated the population of Bald Eagle in North America in 1980 as 70,500, with 28,500 in British Columbia. Farr and Dunbar (1988) estimated the number of Bald Eagle in British Columbia at 20,000 to 30,000. (Davies 1985) estimated the total number of adult Bald Eagles in British Columbia at 15,000, with 4,000 on the north coast, 5,000 on the south coast and 6,000 throughout the interior. Blood and Anweiler (1994) estimated the total number including immature in the province to be 29,970 with 21,400 on the coast and 8,570 in the interior.
The number of Bald Eagle breeding and wintering in British Columbia has increased substantially since the 1960s. There are now over 10 times as many wintering Bald Eagles in coastal British Columbia than during the 1960s (increasing annually by 8%), and the breeding Bald Eagle population has increased by an average annual rate of 6% over the same period (Environment Canada 2000, Internet site).
Sec. 52 Application Volume 6B: Environmental and Socio-Economic Assessment (ESA) – Marine Terminal Section 12: Marine Birds
May 2010 Page 12-53
Limiting Factors
Factors attributed to the decline in the number of Bald Eagles in North America are habitat loss or alteration, pesticide contamination and hunting (Blood and Anweiler 1994; Watson and Rodrick 2004, Internet site). In addition, the permanent loss of nest, roost and perch trees and the removal of buffers is a chronic minor threat to both nesting and wintering eagle populations (Blood and Anweiler 1994; Watson and Rodrick 2004, Internet site).
Pesticide and chemical use by agriculture and industry from the 1940s to the early 1970s was a major factor in the population decline (Blood and Anweiler 1994; Watson and Rodrick 2004, Internet site). Contaminant residues, especially from DDT, were found in adult birds, eggs and nestlings, and in their food sources, which led to reproductive failures (Blood and Anweiler 1994). Hunting of Bald Eagles was also a major cause of population declines until at least 1980 (Blood and Anweiler 1994).
12.7.2 Scope of the Assessment for Bald Eagle Bald Eagles use the terrestrial and marine environments of the PEAA. Therefore, both areas are discussed in the assessment (see Table 12-7).
12.7.3 Effects on Bald Eagle from Changes in Habitat
12.7.3.1 Effect Mechanisms
Construction
Vegetation clearing within the Kitimat Terminal PDA will remove approximately 165 ha of mature coastal forest as some of the area has already been cleared from forestry operations. Based on the preferred habitat requirements (see Section 12.7.1) and results of baseline investigations, this area within the PDA likely provides only roosting or perching habitat for Bald Eagles.
Clearing of the RoW for the powerline will create forest edge habitat along each side of the RoW. This may have a benefit for Bald Eagles, as they prefer forest edge habitat for nesting (Blood and Anweiler 1994), and may increase access to prey species.

Sec. 52 Application Volume 6B: Environmental and Socio-Economic Assessment (ESA) – Marine Terminal Section 12: Marine Birds
Page 12-54 May 2010
Table 12-7 Potential Environmental Effects on Bald Eagle This table identifies the potential environmental effects on Bald Eagle that are assessed in this section of the ESA. Each of these environmental effects is discussed in more detail later in this section. Recommendations for mitigation and, if required, follow-up and monitoring are also provided. With the implementation of these mitigation measures where appropriate, the Project is not likely to cause significant adverse environmental effects on marine birds due to effects on Bald Eagle.
Project Activities and Physical Works
Key Environmental Effects on Bald Eagle Relevance to the Assessment
Considered in the ESA Kitimat Terminal
Construction
• Inwater infrastructure site preparation (dredging, blasting, pile drilling)
• Sensory disturbance • Avoidance or stress to birds in area
• Onshore infrastructure site preparation (clearing, burning, grading, blasting)
• Change in habitat (breeding habitat)
• Loss of potential nest and perching trees
• Sensory disturbance • Alienation from habitat • Change in behaviour may affect
physical health of birds
• Risk of mortality (breeding habitat)
• Change in population abundance and distribution
• Inwater infrastructure construction (marine terminal, berths, pile installation)
• Sensory disturbance • Alienation from habitat • Change in behaviour may affect
physical health of birds
• Onshore infrastructure construction (tank terminal, inter-connector pipes, support buildings, pumps, etc.)
• Sensory disturbance • Alienation from habitat • Change in behaviour may affect
physical health of birds
Operations
• Onshore infrastructure PDA (tank terminal and associated cleared surfaces, less permeable surfaces, storm water management systems)
• Sensory disturbance • Change in behaviour may affect physical health of birds
• Inwater infrastructure PDA (marine terminal, berths and associated shading, underwater structures)
• Sensory disturbance • Change in behaviour may affect physical health of birds

Sec. 52 Application Volume 6B: Environmental and Socio-Economic Assessment (ESA) – Marine Terminal Section 12: Marine Birds
May 2010 Page 12-55
Table 12-7 Potential Environmental Effects on Bald Eagle (cont’d) Project Activities and
Physical Works Key Environmental Effects on
Bald Eagle Relevance to the Assessment Considered in the ESA
Kitimat Terminal Operations (cont’d)
• Onshore infrastructure operations (tank terminal and associated site water run-off, lights, noise, waste water disposal, emissions)
• Sensory disturbance • Alienation from habitat • Change in behaviour may affect
physical health of bird
• Risk of mortality • Hazardous trash may result in mortality or change in physical condition
• Collisions with overhead powerlines
• Inwater infrastructure operations (marine terminal, berths and associated lights, noise)
• Sensory disturbance • Alienation from habitat • Change in behaviour may affect
physical health of birds Decommissioning
• Onshore site restoration (infrastructure removal)
• Change in habitat • Gain will not be relevant for >100 years because mature trees are required for nesting; not considered a positive effect
• Sensory disturbance • Alienation from habitat • Change in behaviour may affect
physical health of birds • Low risk of bird strikes due to
lights
• Inwater infrastructure site restoration (infrastructure removal)
• Sensory disturbance • Alienation from habitat • Change in behaviour may affect
physical health of birds • Low risk of bird strikes due to
lights
Operations
A change in habitat due to the area developed for infrastructure will persist during the operations of the Project. Eagles may use project infrastructure (e.g., powerline poles) as roosts and perching sites (Demarchi et al. 2005). It is anticipated that Bald Eagles will habituate to the change in habitat.
Decommissioning
Pilings and other inwater infrastructure will be removed during decommissioning, and the habitat is expected to return to preconstruction conditions. The reclaimed terrestrial area will not be used for nesting for several generations, due to the lack of mature trees for suitable nesting sites.

Sec. 52 Application Volume 6B: Environmental and Socio-Economic Assessment (ESA) – Marine Terminal Section 12: Marine Birds
Page 12-56 May 2010
12.7.3.2 Mitigation and Effects Management
Specific measures to reduce the change in habitat for Bald Eagle are as follows:
Pre-identify, flag and monitor potential Bald Eagle nests.
Establish a no-clearing buffer at least two tree length radius from any active Bald Eagle nest found within or near the PDA. Efforts will be made to avoid high-impact activities within 200 m of active nests. Where disturbance in unavoidable, Northern Gateway will consult with the appropriate regulators to discuss possible options and management strategies.
Avoid clearing during the summer months, where practical, to avoid nesting and rearing periods. The preferred clearing time will be determined in consultation with CWS and BC MoE. Where disturbance is unavoidable, Northern Gateway will consult with the appropriate regulators to discuss possible options and management strategies.
12.7.3.3 Project Residual Effects
Change in habitat for Bald Eagle will be localized to the PDA and RoW and will occur during construction. Change in terrestrial habitat will consist of the loss of mature forest and its conversion to developed areas or early successional shrub habitat. This effect will persist through operations and decommissioning of the Project. Affected habitat will eventually recover after the decommissioning of inland structures and reclamation. Based on density estimates and the relative abundance (see Section 12.7.1) of eagles for the PEAA, several birds could be affected by the change in habitat. Although, it is expected that there is currently occasional use of the habitats in the PDA by eagles, as there are no unique habitat features within the PDA where large numbers of Bald Eagles would concentrate (e.g., salmon streams). Birds that do use the area would have other available habitats in the PEAA.
Within the PEAA, 1% to 5% of the regional population may be affected, but these effects are not expected to be measurable beyond one breeding season. Breeding Bald Eagles will likely relocate to adjacent habitat because Bald Eagle pairs are known to build secondary nests within their territory (Driscoll et al. 1999). Given the response of Bald Eagles to changes in habitat, the localized nature of the environmental effects, the small proportion of the regional Bald Eagle population affected, and the presence of similar habitat in the area, effects of change in habitat from project activities are not significant.
12.7.3.4 Cumulative Effects Implications
The Project is expected to result in a long-term loss of a relatively small amount of habitat that is used by Bald Eagles for roosting and perching, but in the context of the PEAA this is not expected to be a measurable effect. Although other developments have resulted in similar changes in habitat, these effects are highly localized and have not limited the occurrences of Bald Eagle in the PEAA. Therefore, as the effects of these other activities and projects on Bald Eagle habitat are unlikely to interact cumulatively with the similar project effects to an extent that would affect the long-term sustainability of the Bald Eagle population, cumulative effects on habitat are not significant.

Sec. 52 Application Volume 6B: Environmental and Socio-Economic Assessment (ESA) – Marine Terminal Section 12: Marine Birds
May 2010 Page 12-57
12.7.4 Effects on Bald Eagle from Sensory Disturbance
12.7.4.1 Effect Mechanisms
Construction
Birds of prey, such as the Bald Eagle, depend on hearing for survival and social interaction. Therefore, diminished hearing from noise disturbance may adversely affect these birds. Although individual eagles vary in their responses, in British Columbia, Bald Eagle appear to have a moderate to high ability to tolerate human activity (Steidl and Anthony 1996; Buehler 2000, Internet site; Steidl and Anthony 2000; Demarchi et al. 2005). Eagles may become tolerant of people as their encounters with them increase (Conrad and Stillwell 1984; Knight and Knight 1984). They are known to complete nesting successfully after experiencing disturbances, but may be more likely to change their nest location the following year (Grier 1969; Fraser et al. 1985; Anthony et al. 1994). Intraspecific competition may increase if individuals are temporarily displaced into habitat already occupied by other Bald Eagles.
Sensory disturbance will be most severe during the construction period for the Kitimat Terminal and may be caused by:
• onshore site preparation for the infrastructure inside the security fence • inwater preparation and construction of the marine terminal • pipeline construction
Construction and maintenance during the nesting season could cause Bald Eagles that are nesting near areas of disturbance to abandon their nests. Disturbance effects will persist only during construction. Bald Eagles are expected to resume use of habitat near construction sites once sensory disturbances are reduced or cease to exist.
Operations
Routine operations activities that may disturb Bald Eagle include human activity in and around the Kitimat Terminal, vehicular traffic and maintenance or repairs to project infrastructure. Additional sensory disturbance may result from heavy equipment. Disturbance effects will be localized (i.e., immediate around the Kitimat Terminal) and will continue for the life of the Project. Eagles that remain in the area will likely habituate to the disturbance.
Decommissioning
Decommissioning activities will have similar environmental effects to those related to construction (except no blasting will occur). Eagles that remain in the area will likely habituate to the disturbance. Once activities cease, it is expected that Bald Eagles will resume use of the area.

Sec. 52 Application Volume 6B: Environmental and Socio-Economic Assessment (ESA) – Marine Terminal Section 12: Marine Birds
Page 12-58 May 2010
12.7.4.2 Mitigation and Effects Management
Specific measures to reduce the effect of sensory disturbance on Bald Eagles are as follows:
• Clearing will be planned for as short a time as practical to reduce sensory disturbance effects. Where possible, it will be done outside nesting, fledging and other sensitive periods, as recommended by the Canadian Wildlife Service and the British Columbia Ministry of Environment.
• Establish a no-clearing buffer of at least a two-tree length radius from any active Bald Eagle nest found within or near the PDA. Efforts will be made to avoid high-impact activities within 200 m of active nests. Where disturbance is unavoidable, Northern Gateway will consult with the appropriate regulators to discuss possible options and management strategies.
• Avoid clearing during the summer months, where practical, to avoid nesting and rearing periods. The preferred clearing time will be determined in consultation with the CWS and BC MoE. Where disturbance is unavoidable, Northern Gateway will consult with regulators to identify possible options and management strategies.
• Domestic waste will be managed to reduce its attraction to scavengers. Garbage will be securely stored and removed daily to regulated disposal sites. The outdoor storage of organic waste will be prohibited. Northern Gateway will dispose of organic waste at a municipal transfer station on a daily basis. Northern Gateway will also implement a rat control program at the Kitimat Terminal and will encourage contract tankers to do the same.
12.7.4.3 Project Residual Effects
There are no documented Bald Eagle nests within and near the PDA, so sensory disturbance would be limited to those birds that are roosting or perching. Construction activities may cause them to move temporarily to other suitable habitats within the PEAA. After construction, Bald Eagles will likely habituate to the operational disturbances and would continue their occasional use of the area.
Given the relatively small portion of the regional population that will be affected, and the ability of affected animals to access similar habitat in nearby areas, effects of sensory disturbance from the Project on Bald Eagles are not expected to be measurable and are predicted to be not significant.
12.7.4.4 Cumulative Effects Implications
Although sensory disturbances from the construction and operations of the Kitimat Terminal will overlap spatially and temporally with similar activities for existing projects (Eurocan Pulp and Paper Co., Methanex Corporation, Rio Tinto Alcan Primary Metal British Columbia) and approved projects (Kitimat LNG Inc., Arthon Construction Ltd. and Sandhill Materials), habitat avoidance by Bald Eagles in the PEAA is not expected to be measurable. The occurrence of Bald Eagles in the PEAA has remained relatively consistent despite the presence of the existing projects. Neither the existing level of sensory disturbances nor the project contribution is likely to affect the viability or sustainability of the Bald Eagle population. As a result, cumulative effects are not considered further in this assessment.

Sec. 52 Application Volume 6B: Environmental and Socio-Economic Assessment (ESA) – Marine Terminal Section 12: Marine Birds
May 2010 Page 12-59
12.7.5 Effects on Bald Eagle from Direct Mortality
12.7.5.1 Effect Mechanisms
Construction
Land clearing for the PDA will need to occur prior to the start of construction for the terminal. The specific timing for clearing of the PDA will be determined in consultation with appropriate regulatory agencies. Because neither active nor inactive Bald Eagle nests have been identified within the PDA, the risk of mortality to nestlings or adult birds is considered to be negligible in magnitude. If active nests are discovered during preconstruction nest surveys, management plans will be developed, so these nests are not disturbed.
Operations
Collisions with powerlines and electrocution are major causes of human-induced mortality of Bald Eagle in British Columbia (Blood and Anweiler 1994). Electrocution poses a serious threat to raptor safety when powerlines are used as perches or nesting platforms. Large raptors can be electrocuted by powerlines if they make simultaneous contact with two conductors or contact one conductor while perched on a structure that is earthed. Bald Eagles, especially juveniles, often hunt from powerline structures; and consequently may be exposed to electrocution (Bridges and Anderson no date) or collisions with the lines. Wires can also pose collision hazards, particularly for young birds learning to fly or where raptors are concentrated such as at salmon-spawning streams or migration or staging areas (Demarchi et al. 2005).
Decommissioning
Decommissioning activities are not expected to increase the risk of mortality of Bald Eagles since the birds are not likely to nest on structures at the Kitimat Terminal that will be removed during decommissioning.
12.7.5.2 Mitigation and Effects Management
Specific measures to reduce the risk of mortality to Bald Eagles are as follows:
• Clearing will be planned for as short a time as practical to reduce sensory disturbance effects. Where practical, it will be done outside nesting, fledging and other sensitive periods, as recommended by the Canadian Wildlife Service and the British Columbia Ministry of Environment.
• Establish a no-clearing buffer at least two tree length radius from any active Bald Eagle nest found within or near the PDA. Efforts will be made to avoid high-impact activities within 200 m of active nests. Where disturbance is unavoidable, Northern Gateway will consult with the appropriate regulators to discuss possible options and management strategies.

Sec. 52 Application Volume 6B: Environmental and Socio-Economic Assessment (ESA) – Marine Terminal Section 12: Marine Birds
Page 12-60 May 2010
• Clearing will be scheduled in consultation with the CWS and the provincial wildlife management agencies. Work windows will consider sensitive periods such as nesting and rearing. Where disturbance is unavoidable, Northern Gateway will consult with the appropriate regulators to discuss possible options and management strategies.
• To protect eagles and other birds of prey from electrocution, energized surfaces will be covered with protective devices manufactured for wires, conductors, powerline insulators and powerline bushings.
• Investigate placement of perch deterrents such as triangles, single dowels, multiple points and anti-perching irons. Triangles are very effective for large- to medium-sized raptors, but placement is important because raptors have been known to use triangles as perching devices.
12.7.5.3 Project Residual Effects
Since mortality events would be very rare and limited locally, the risk of mortality to Bald Eagle adults or young during construction is considered very low. With the measures put in place to deter birds from powerline and poles, the risk of collisions and electrocutions will be mitigated. As a result, changes to the risk of mortality from the Project on Bald Eagles are predicted to be not significant (see Table 12-8).
12.7.5.4 Cumulative Effects Implications
The effects of the Project on the risk of mortality of Bald Eagles are not expected to be measurable. Although other projects and activities will likely act in combination with the Project to increase the risk of mortality, the cumulative risk in the PEAA is still expected to be low. Existing and future projects will have to consider regulations, standards and guidelines for the management of Bald Eagle nests, thereby mitigating this risk. The Project’s contribution to the cumulative risk of mortality to Bald Eagles is not expected to affect the viability or sustainability of the local population and is considered not significant.
12.7.6 Prediction Confidence As described in Section 12.5.6, there is sufficient data available for a reliable assessment of effects on marine birds. Therefore, there is a high level of confidence in the environmental effects assessment for Bald Eagle.
12.8 Follow-up and Monitoring for Marine Birds Given that environmental effects on marine birds are not expected to be measurable, no follow-up or monitoring programs are planned. However, a record of marine birds will be kept in order to document the occurrence of individuals on site.

Sec. 52 Application Volume 6B: Environmental and Socio-Economic Assessment (ESA) – Marine Terminal Section 12: Marine Birds
May 2010 Page 12-61
Table 12-8 Characterization of the Residual Effects on Bald Eagle
Activity Effect Direction
Additional Proposed Mitigation/Compensation
Measures1-6
Residual Environmental Effect
Magnitude
Geographic Extent
Duration/
Frequency
Reversibility
Significance Potential Measurable
Contribution to Regional Cumulative
Environmental Effects Construction Inwater infrastructure site preparation (dredging, blasting, pile drilling)
Sensory disturbance
Adverse • Limit the area of disturbance1
• Limit blasting2 • Maintain equipment3 • Use acoustic blankets4
L S M/R R N N
Onshore infrastructure site preparation (clearing, burning, grading, blasting)
Change in habitat
Adverse • Limit the area of disturbance1
• Maintain equipment3 • Protect nest trees5
M L M/S I N N
Sensory disturbance
Adverse • Limit the area of disturbance1
• Maintain equipment3 • Protect nest trees
L S M/S R N N
Risk of mortality Adverse • Limit the area of disturbance1
• Protect nest trees5
N L M/R I N N

Sec. 52 Application Volume 6B: Environmental and Socio-Economic Assessment (ESA) – Marine Terminal Section 12: Marine Birds
Page 12-62 May 2010
Table 12-8 Characterization of the Residual Effects on Bald Eagle (cont’d)
Activity Effect Direction
Additional Proposed Mitigation/Compensation
Measures1-6
Residual Environmental Effect
Magnitude
Geographic Extent
Duration/
Frequency
Reversibility
Significance Potential Measurable
Contribution to Regional Cumulative
Environmental Effects Construction (cont’d) Inwater infrastructure construction (marine terminal, berths, pile installation)
Sensory disturbance
Adverse • Maintain equipment3 N S S/S R N N
Onshore infrastructure construction (tank terminal, interconnector pipes, support buildings, pumps, etc.)
Sensory disturbance
Adverse • Maintain equipment3 N S S/S R N N
Operations Onshore infrastructure PDA (tank terminal and associated cleared surfaces, storm water management systems)
Sensory disturbance
Adverse • Maintain equipment3 • Protect nest trees5
L L L/S R N N
Inwater infrastructure PDA (marine terminal, berths and associated shading, underwater structures)
Sensory disturbance
Adverse • Maintain equipment3 L L L/S R N N

Sec. 52 Application Volume 6B: Environmental and Socio-Economic Assessment (ESA) – Marine Terminal Section 12: Marine Birds
May 2010 Page 12-63
Table 12-8 Characterization of the Residual Effects on Bald Eagle (cont’d)
Activity Effect Direction
Additional Proposed Mitigation/Compensation
Measures1-6
Residual Environmental Effect
Magnitude
Geographic Extent
Duration/
Frequency
Reversibility
Significance Potential Measurable
Contribution to Regional Cumulative
Environmental Effects Operations (cont’d) Onshore infrastructure operations (tank terminal and associated site water run-off, lights, noise, waste water disposal, emissions)
Sensory disturbance
Adverse • Maintain equipment3 • Protect nest trees5
L L L/S R N N
Risk of mortality Adverse • Protect nest trees5 • Garbage storage and
disposal6
L S L/S R N N
Inwater infrastructure operations (marine terminal, berths and associated lights, noise)
Sensory disturbance
Adverse • Maintain equipment3 L L L/S R N N
Decommissioning Onshore site restoration (infrastructure removal)
Change in habitat
Adverse • Maintain equipment3 • Protect nest trees5
L L M/S R N N
Sensory disturbance
Adverse • Maintain equipment3 L S M/S R N N
Inwater infrastructure site restoration (infrastructure removal)
Sensory disturbance
Adverse • Maintain equipment3 L S M/S R N N

Sec. 52 Application Volume 6B: Environmental and Socio-Economic Assessment (ESA) – Marine Terminal Section 12: Marine Birds
Page 12-64 May 2010
Table 12-8 Characterization of the Residual Effects on Bald Eagle (cont’d) Mitigation: 1 Limit the area of disturbance: Limit the area of disturbance from the PDA. Sensitive habitats will be clearly identified as no-machine areas with snow fencing or
equivalent. 2 Limit blasting: Northern Gateway will develop a Blasting Management Plan. Timing of work windows will be determined in consultation with the CWS. 3 Maintain equipment: Equipment will have manufacturer-recommended mufflers or equivalent features and will be maintained in good working order to reduce
noise levels. 4 Acoustic blankets: Where feasible, acoustic blankets will be used to reduce above-ground noise from construction activities. 5 Protect nest trees: If a tree containing the nest of a Bald Eagle, Marbled Murrelet or species protected by the British Columbia Wildlife Act is discovered, no-
disturbance buffer zones will be established (e.g., Demarchi et al. 2005). Where disturbance is unavoidable, Northern Gateway will consult with the appropriate regulators to discuss possible options and management strategies. If relocation of a Bald Eagle nest is required, an application to the Ministry of Environment for an exemption to the British Columbia Wildlife Act will be necessary.
6 Garbage storage and disposal: Domestic waste will be managed to reduce its attraction to scavengers. Garbage will be securely stored and removed daily to regulated disposal sites. The outdoor storage of organic waste will be prohibited. Northern Gateway will dispose of organic waste at a municipal transfer station on a daily basis. Northern Gateway will also implement a rat control program at the Kitimat Terminal and will encourage contract tankers to do the same.
KEY Refer to Table 12-4

Sec. 52 Application Volume 6B: Environmental and Socio-Economic Assessment (ESA) – Marine Terminal Section 12: Marine Birds
May 2010 Page 12-65
12.9 Summary of Effects for Marine Birds Marine birds will be affected by project construction, operations and decommissioning (see Table 12-9). Most disturbances are predicted to occur during construction.
The effect of change in habitat due to construction activities (e.g., vegetation clearing, blasting, dredging) and the introduction of new solid substrates in the water column is predicted to be not significant. The extent of the change will be site-specific in an area that presently supports a relatively small number of marine birds. The magnitude of environmental effects is considered low and the presence of other similar habitat in the PEAA is expected to compensate for any change in the PDA. Further, marine birds do not substantially rely on the habitat within and near the PDA and there is more suitable habitat in other areas of the PEAA. The environmental effects of blasting and dredging will be medium-term and limited to construction. The addition of new hard substrates will provide habitat for invertebrate food sources (e.g., mussels) for marine birds.
Sensory disturbance from construction activities (e.g., blasting, dredging, drilling) is predicted to be not significant to marine birds. Environmental effects are likely to be experienced by individual birds but are expected to have a negligible to low magnitude effect on populations. Therefore, the magnitude is considered negligible to low. The geographic extent of environmental effects is considered to be local, because sensory disturbance will remain around the PDA. Marine birds will likely avoid areas of increased noise levels. However, the duration of these environmental effects will be short-term because activities such as dredging and blasting will be limited to several weeks during construction and the environmental effects will be reversible once the activities cease.
The potential destruction of nest, collisions with powerlines and lights and electrocution on powerlines pose the greatest risk of mortality. Even without mitigation, this risk is considered low as occurrences are expected to be rare with only a limited number of individual birds potentially being affected. Mitigation measures will be implemented to further reduce this risk. The viability and sustainability of populations are not expected to be affected.
Although cumulative environmental effects are not anticipated, Northern Gateway will work with other industrial users in the Kitimat Arm area to monitor responses of marine birds to cumulative sensory disturbances and other environmental effects.
Prediction confidence is considered high because:
• the potential environmental effects of construction and operations are understood • the habitats used by marine birds within the PDA are common throughout the PEAA • the extent to which marine birds use these habitats is generally understood
In summary, the residual and cumulative environmental effects on marine birds from the project activities are not significant.

Sec. 52 Application Volume 6B: Environmental and Socio-Economic Assessment (ESA) – Marine Terminal Section 12: Marine Birds
Page 12-66 May 2010
Table 12-9 Summary of Residual Environmental Effects on Marine Birds
Potential Effect Mitigation1-16
Residual Environmental Effect
Magnitude
Geographic Extent
Duration/
Frequency
Reversibility
Significance Prediction Confidence Construction Change in habitat • Limit the area of disturbance1
• Limit blasting2 • Maintain equipment3 • Protect nest trees4 • Establish vessel turning areas5 • Turbidity curtain6
N-L L M/S R N High
Sensory disturbance • Limit the area of disturbance1 • Limit blasting2 • Maintain equipment3 • Protect nest trees4 • Limit night lighting7 • Acoustic blankets8 • Bird strike alerts9 • Bubble curtain10 • Work windows11
N-L L M/S R N High

Sec. 52 Application Volume 6B: Environmental and Socio-Economic Assessment (ESA) – Marine Terminal Section 12: Marine Birds
May 2010 Page 12-67
Table 12-9 Summary of Residual Environmental Effects on Marine Birds (cont’d)
Potential Effect Mitigation1-16
Residual Environmental Effect
Magnitude
Geographic Extent
Duration/
Frequency
Reversibility
Significance Prediction Confidence Construction (cont’d) Risk of mortality • Limit the area of disturbance1
• Limit blasting2 • Protect nest trees4 • Limit night lighting7 • Bird strike alerts9 • Limit noisy equipment12 • Prohibit hunting13 • Reporting14
N-L L M/S R N High
Operations Change in habitat • Maintain equipment3 L L L/S R N High
Sensory disturbance • Maintain equipment3 • Bird strike alerts9 • Limit night lighting7 • Work windows11
N-L L L/S R N High
Risk of mortality • Limit night lighting7 • Bird strike alerts9 • Prohibit hunting13 • Reporting14 • Garbage storage and disposal15 • Protection on powerlines16
N-L L L/S R N High

Sec. 52 Application Volume 6B: Environmental and Socio-Economic Assessment (ESA) – Marine Terminal Section 12: Marine Birds
Page 12-68 May 2010
Table 12-9 Summary of Residual Environmental Effects on Marine Birds (cont’d)
Potential Effect Mitigation1-16
Residual Environmental Effect
Magnitude
Geographic Extent
Duration/
Frequency
Reversibility
Significance Prediction Confidence Decommissioning Change in habitat • Limit the area of disturbance1
• Turbidity curtain6 N-L L M/S R N High
Sensory disturbance • Maintain equipment3 • Limit night lighting7 • Bird strike alerts9 • Work windows11
N-L L M/S R N High
Risk of mortality • Limit the area of disturbance1 • Protect nest trees4 • Limit night lighting7 • Prohibit hunting13 • Reporting14 • Garbage storage and disposal15
N-L L M/S R N High

Sec. 52 Application Volume 6B: Environmental and Socio-Economic Assessment (ESA) – Marine Terminal Section 12: Marine Birds
May 2010 Page 12-69
Table 12-9 Summary of Residual Environmental Effects on Marine Birds (cont’d)
Potential Effect Mitigation1-16
Residual Environmental Effect
Magnitude
Geographic Extent
Duration/
Frequency
Reversibility
Significance Prediction Confidence Cumulative Environmental Effects
Change in habitat • Limit the area of disturbance1 • Protect nest trees4 • Turbidity curtain6
L L M/O R N High
Sensory disturbance • Limit blasting2 • Maintain equipment3 • Limit night lighting7 • Acoustic blankets8 • Bird strike alerts9 • Bubble curtain10 • Work windows11
L L M/S R N High
Risk of mortality • Limit blasting2 • Limit night lighting7 • Bird strike alerts9 • Prohibit hunting13 • Reporting14
L L M/S R N High

Sec. 52 Application Volume 6B: Environmental and Socio-Economic Assessment (ESA) – Marine Terminal Section 12: Marine Birds
Page 12-70 May 2010
Table 12-9 Summary of Residual Environmental Effects on Marine Birds (cont’d)
Potential Effect Mitigation1-16
Residual Environmental Effect
Magnitude
Geographic Extent
Duration/
Frequency
Reversibility
Significance Prediction Confidence Combined Effects Change in habitat • Limit the area of disturbance1
• Protect nest trees4 • Establish vessel turning areas5 • Turbidity curtain6
N-L L L/S R N High
Sensory disturbance • Limit blasting2 • Maintain equipment3 • Limit night lighting7 • Acoustic blankets8 • Bird strike alerts9 • Bubble curtain10 • Work windows11
N-L L L/S R N High
Risk of mortality • Limit blasting2 • Limit night lighting7 • Bird strike alerts9 • Prohibit hunting13 • Reporting14
N-L L L/S R N High

Sec. 52 Application Volume 6B: Environmental and Socio-Economic Assessment (ESA) – Marine Terminal Section 12: Marine Birds
May 2010 Page 12-71
Table 12-9 Summary of Residual Environmental Effects on Marine Birds (cont’d) Mitigation: 1 Limit the area of disturbance: Limit the area of disturbance. Sensitive habitats will be clearly identified as no-machine areas with snow fencing or equivalent. 2 Limit blasting: Northern Gateway will develop a Blasting Management Plan. Timing of blasting will be developed in consultation with the CWS, DFO and other
regulators, as appropriate. 3 Maintain equipment: Equipment will have manufacturer-recommended mufflers or equivalent features and will be maintained in good working order to reduce
noise levels. 4 Protect nest trees: If a tree containing the nest of a Bald Eagle, Marbled Murrelet or species protected by the British Columbia Wildlife Act is discovered, no-
disturbance buffer zones will be established (e.g., Demarchi et al. 2005). Where disturbance is unavoidable, Northern Gateway will consult with the appropriate regulators to discuss possible options and management strategies.
5 Establish vessel turning areas. 6 Turbidity curtain: Turbidity curtains will be used around shallow (i.e., 3 to 4 m) inwater construction dredging and blasting sites to limit possible sedimentation of
adjacent habitat. 7 Limit night lighting: (For Marbled Murrelet and Surf Scoter.) The use of lighting at night will be limited, as practical. Where permissible under safety and
navigation requirements, outdoor lights will be upward shielded to reduce attraction by birds in flight. All unnecessary outside lights will be extinguished at night. Indoor lights will be blocked by blackout blinds. Work periods will be scheduled during daylight hours whenever possible to limit the need for staging lights.
8 Acoustic blankets: Where feasible, acoustic blankets will be used to reduce above-ground noise from construction activities. 9 Bird strike alerts: When berthed, vessels will be alerted to the hazards of bird strikes from deck lighting, particularly on nights when visibility is poor. Staff will be
notified of key seasonal and daily migratory periods for marine birds and be instructed to be particularly vigilant at these times. 10 Bubble curtain: (For Marbled Murrelet and Surf Scoter.) A bubble curtain will be used to attenuate underwater sound levels. 11 Work windows: Whenever possible, noisy activities will be scheduled during daylight hours and limited. Clearing will be scheduled in consultation with CWS
and BC MoE. Timing of work windows will consider sensitive periods such as nesting and rearing. 12 Limit noisy equipment: The use of jackhammers or similar machinery that produce high intensity sounds will be limited as possible. 13 Prohibit hunting: Employees will be prohibited from hunting while at the Kitimat Terminal. 14 Reporting: Workers and contractors at the Kitimat Terminal will be instructed to report any collisions of birds with structures. 15 Garbage storage and disposal: Domestic waste will be managed to reduce its attraction to scavengers. Garbage will be securely stored and removed daily to
regulated disposal sites. The outdoor storage of organic waste will be prohibited. Northern Gateway will dispose of organic waste at a municipal transfer station on a daily basis. Northern Gateway will also implement a rat control program at the Kitimat Terminal and will encourage contract vessels to do the same.
16 Protection on powerlines: To protect eagles and other birds of prey from electrocution, energized surfaces will be covered with protective devices manufactured for wires, conductors, powerline insulators and powerline bushings.
Follow-up and Monitoring: Maintain a record of marine bird occurrences in the PEAA. KEY Refer to Table 12-4 for a description of the effects characteristics.

Sec. 52 Application Volume 6B: Environmental and Socio-Economic Assessment (ESA) – Marine Terminal Section 12: Marine Birds
Page 12-72 May 2010
12.10 References
12.10.1 Literature Cited Anthony, R.G., R.J. Steidl and K. McGarigal. 1994. Recreation and bald eagles in the Pacific Northwest.
In R.L. Knight and K. J. Gutzwiller (eds.). Wildlife and Recreationists: Coexistence through Management and Research. Island Press, Washington, DC. 223–242.
Avery, M.L., P.F. Springer and N.S. Dailey. 1978. Avian Mortality at Man-made Structures: An Annotated Bibliography. FWS/OBS-78/58. United States Fish and Wildlife Service. Washington, DC.
Beckett, J. and K. Munro. 2010. Marine Fish and Fish Habitat Technical Data Report. Prepared for Northern Gateway Pipelines Inc. Calgary, AB.
Bellefleur, D., P. Lee and R.A. Ronconi. 2009. The impact of recreational boat traffic on marbled murrelets (Brachyramphus marmoratus). Journal of Environmental Management 90(1): 531–538.
Bellrose, F.C. 1980. Ducks, Geese, and Swans of North America. Stackpole Books. Harrisburg, PA. Cited in Fraser, D.F., W.L. Harper, S.G. Cannings and J.M. Cooper. 1999. Rare Birds of British Columbia. Wildlife Branch and Resource Inventory Branch, British Columbia Ministry of Environment, Lands and Parks. Victoria, BC.
Black, A. 2005. Light induced seabird mortality on vessels operating in the Southern Ocean: incidents and mitigation measures. Antarctic Science 17(01): 67–68
Blood, D.A. and G.G. Anweiler. 1994. Status of the Bald Eagle in British Columbia. British Columbia Ministry of Environment, Lands and Parks, Wildlife Branch. Working Report WR-62. Victoria, BC.
Bourne, W.R.P. 1979. Birds and gas flares. Marine Pollution Bulletin 10: 124–125.
Bridges, J.M. and T. Anderson. No date. Mitigating the Impacts of Electric Facilities to Birds. Unpublished paper available from the Western Area Power Administration. Lakewood, CO.
Burger, A.E. 1995. Marine Distribution, Abundance and Habitats of Marbled Murrelets in British Columbia. USDA Forest Service General Technical Report PSW-152. US Department of Agriculture, Forest Service, Pacific Southwest Research Station. Albany, CA.
Burger, A.E. 2002. Conservation Assessment of Marbled Murrelets in British Columbia: A Review of the Biology, Populations, Habitat Associations and Conservation. (Technical Report Series No. 387). Canadian Wildlife Service, Environmental Conservation Branch, Environment Canada. Ottawa, ON.
Burkett, E.E. 1995. Marbled Murrelet food habits and prey ecology. In C.J. Ralph, G.L. Hunt Jr., M.G. Raphael and J.F. Piatt (eds.). Ecology and Conservation of the Marbled Murrelet. US Department of Agriculture, Forest Service. General Technical Report PSW-GTR-152. 223–246.
Campbell, R.W., N.K. Dawe, I. McTaggert-Cowan, J.M. Cooper, G.W. Kaiser and M.C.E. McNall. 1990a. The Birds of British Columbia. Vol. 1. Nonpasserines: Loons through Waterfowl. Royal British Columbia Museum. Victoria, BC. Canadian Wildlife Service. Delta, BC.

Sec. 52 Application Volume 6B: Environmental and Socio-Economic Assessment (ESA) – Marine Terminal Section 12: Marine Birds
May 2010 Page 12-73
Campbell, R.W., N.K. Dawe, I. McTaggert-Cowan, J.M. Cooper, G.W. Kaiser and M.C.E. McNall. 1990b. The Birds of British Columbia, Vol. 2. Nonpasserines: Diurnal Birds of Prey through Woodpeckers. Royal British Columbia Museum. Victoria, BC. Canadian Wildlife Service. Delta, BC.
Canadian Marbled Murrelet Recovery Team (CMMRT). 2003. Marbled Murrelet Conservation Assessment 2003, Part B - Marbled Murrelet Recovery Team Advisory Document on Conservation and Management (CMMRT Working Document No. 1.). Canadian Wildlife Service. Delta, BC.
Conrad, E.T. and J.E. Stillwell. 1984. Wintering Bald Eagles at Millerton Lake, 1983-84. Unpublished report available from Millerton State Recreation Area, California Department of Parks and Recreation. Sacramento, CA.
Crawford, R.L. 1981. Weather, migration and autumn bird kills at a north Florida TV tower. Wilson Bulletin 93: 189–195.
Davies, R.G. 1985. A note on the population status of bald eagles in British Columbia. In J. M. Gerrard and T. N. Ingram (eds.). The Bald Eagle in Canada. White Horse Plains Publishers. Headingley, MB. 63–65.
d’Entremont, M. 2010. Marine Birds Technical Data Report. Prepared for Northern Gateway Pipelines Inc. Calgary, AB.
Demarchi, M.W., M.D. Bentley and L. Sopuck. 2005. Best Management Practices for Raptor Conservation during Urban and Rural Land Development in British Columbia. Unpublished paper prepared for British Columbia Ministry of Water, Land and Air Protection. Victoria, BC.
District of Kitimat. 2008. Official Community Plan 2008. District of Kitimat. Kitimat, BC.
Donovan, T.M., P.W. Jones, E.M. Annand and F.R.I. Thompson. 1997. Variation in local-scale edge effects: mechanisms and landscape context. Ecology 78: 2064–2075.
Drent, R.H. and C.J. Guiguet. 1961. A catalogue of British Columbia seabirds. Occasional Papers of the British Columbia Provincial Museum 12. Victoria, BC.
Driscoll, J.T., G.L. Beatty and J.G. Koloszar. 1999. Arizona Bald Eagle 1998 Nest Survey. Nongame and Endangered Wildlife Program Technical Report 138. Arizona Game and Fish Department. Phoenix, AZ.
Farr, A. and D.L. Dunbar. 1988. British Columbia’s 1988 Midwinter Bald Eagle Survey. Unpublished report. British Columbia Ministry of Environment. Surrey, BC.
Fraser, D.F., W.L. Harper, S.G. Cannings and J.M. Cooper. 1999. Rare Birds of British Columbia. Wildlife Branch and Resource Inventory Branch, British Columbia Ministry of Environment, Lands and Parks. Victoria, BC.
Fraser, J.D., L.D. Frenzel and J.E. Mathisen. 1985. The impact of human activities on breeding bald eagles in north-central Minnesota. Journal of Wildlife Management 49: 585–592.

Sec. 52 Application Volume 6B: Environmental and Socio-Economic Assessment (ESA) – Marine Terminal Section 12: Marine Birds
Page 12-74 May 2010
George, T.L. and A.L. Brand. 2002. The effects of habitat fragmentation on birds in coast redwood forests. In T.L. George and D. Dobkin (eds.) The effects of habitat fragmentation on western bird populations. Studies in Avian Biology 25. Cooper Ornithological Society. Camarillo, CA. 92–101.
Gerrard, J.M. 1983. A review of the current status of bald eagles in North America. In D.M. Bird (ed.). Biology and Management of Bald Eagles and Ospreys. Ste. Anne de Bellevue, QC. 5–22. Cited in D.A. Blood and G.G. Anweiler. 1994. Status of the Bald Eagle in British Columbia. British Columbia Ministry of Environment, Lands and Parks, Wildlife Branch. Working Report WR-62. Victoria, BC.
Gladwin, D.N., K.M. Manci and R. Villella. 1988. Effects of Aircraft Noise and Sonic Booms on Domestic Animals and Wildlife: Bibliographic Abstracts. National Ecology Research Center. Fort Collins, CO.
Goudie, R.I., S. Brault, B. Conant, A.V. Kondratyev, M.P. Petersen and K. Vermeer. 1994. The status of sea ducks in the north Pacific Rim: towards their conservation and management. In Transactions of the 59th North American Wildlife and Natural Resource Conference. Wildlife Management Institute, Washington, DC. 27–49. Cited in D.F. Fraser, W.L. Harper, S.G. Cannings and J.M. Cooper. 1999. Rare Birds of British Columbia. Wildlife Branch and Resource Inventory Branch, British Columbia Ministry of Environment, Lands and Parks, Victoria, BC.
Goudie, R.I. and I.L. Jones. 2004. Dose-response relationships of harlequin duck behaviour to noise from low-level military over-flights in central Labrador. Environmental Conservation 31(4):1–10.
Grier, J.W. 1969. Bald eagle behavior and productivity responses to climbing to nests. Journal of Wildlife Management 33: 961–966.
Hamer, M.P. and S.K. Nelson. 1995. Nesting chronology of the Marbled Murrelet. In C.J. Ralph, G.L. Hunt, M.G. Raphael and J.P. Piatt (eds.). Ecology and Conservation of the Marbled Murrelet. Pacific Southwest Research Station, Forest Service. US Department of Agriculture. 49–56.
Hamer, T.E. and C. Thompson. 1997. Avoidance of Boats by Marbled Murrelets during Marine Surveys. US Fish and Wildlife Service. Olympia, WA.
Harris, R.D. 1971. Further evidence of tree nesting in the marbled murrelet. Canadian Field-Naturalist 85: 67–68.
Hay, R.B. 1976. An Environmental Study on the Kitimat Region with Special Reference to the Kitimat River Estuary. Prepared for The Canadian Wildlife Service. Delta, BC.
Horwood, D. 1992. Birds of the Kitimat Valley. Kitimat Centennial Museum. Kitimat, BC.
Horwood, D. 2006. Bird Observation Database and Report for Emsley Cove and Bish Cove. Unpublished database and report prepared for Jacques Whitford Limited. Calgary, AB.
Hull, C.L., B. Vanderkist, L. Lougheed, G. Kaiser and F. Cooke. 2002. Body mass variation in marbled murrelets in British Columbia, Canada. Ibis 144(2): E88–95.

Sec. 52 Application Volume 6B: Environmental and Socio-Economic Assessment (ESA) – Marine Terminal Section 12: Marine Birds
May 2010 Page 12-75
Knight, R.L. and S.K. Knight. 1984. Responses of wintering bald eagles to boating activity. Journal of Wildlife Management 48: 999–1004.
Kuletz, K.J. 1996. Marbled murrelet abundance and breeding activity at Naked Island, Prince William Sound, and Kachemak Bay, Alaska, before and after the Exxon Valdez oil spill. In: J. Rice, R.B. Spies, D.A. Wolfe and B.A. Wright (eds.). Proceedings of the Exxon Valdez Oil Spill Symposium. American Fisheries Society Symposium 18. 770–784.
Lougheed, C. 1999. Breeding Chronology, Breeding Success, Distribution and Movements of Marbled Murrelets (Brachyramphus marmoratus) in Desolation Sound, British Columbia. M.Sc. thesis. Simon Fraser University. Burnaby, BC.
Lougheed, C., B.A. Vanderkist, L.W. Lougheed and F. Cooke. 2002. Techniques for investigating breeding chronology in marbled murrelets, Desolation Sound, British Columbia. Condor 104: 319–330.
Malt, J. and D. Lank. 2007. Temporal dynamics of edge effects on nest predation risk for the marbled murrelet. Biological Conservation 140: 160–163.
Manley, I. 1999. Behaviour and Habitat Selection of Marbled Murrelets Nesting on the Sunshine Coast. M.Sc. thesis. Simon Fraser University. Burnaby, BC.
Martell, A.M., D.M. Dickinson and L.M. Casselman. 1984. Wildlife of the MacKenzie Delta Region. Occasional Publication 15. Boreal Institute for Northern Studies, University of Alberta. Edmonton, AB. Cited in D.F. Fraser, W.L. Harper, S.G. Cannings and J.M. Cooper. 1999. Rare Birds of British Columbia. Wildlife Branch and Resource Inventory Branch, British Columbia Ministry of Environment, Lands and Parks. Victoria, BC.
Martin, P.W. 1978. A Winter Inventory of the Shoreline and Marine Oriented Birds and Mammals of Chatham Sound. Victoria, BC. Unpublished report available from the British Columbia Fish and Wildlife Branch. Cited in R.W. Campbell, N.K. Dawe, I. McTaggert-Cowan, J.M. Cooper, G.W. Kaiser and M.C.E. McNall. 1990. The Birds of British Columbia. Vol. 1. Nonpasserines: Loons through Waterfowl. Royal British Columbia Museum. Victoria, BC. Canadian Wildlife Service. Delta, BC.
Milko R., D. Loney, R. Elliot and G. Donaldson. 2003. Wings Over Water: Canada’s Waterbird Conservation Plan. Canadian Wildlife Service, Environment Canada. Ottawa, ON.
Montevecchi, W.A., F.K. Wiese, G. Davoren, A.W. Diamond, F. Huettmann and J. Linke. 1999. Seabird Attraction to Offshore Platforms and Seabird Monitoring from Offshore Support Vessels and Other Ships. Literature Review and Monitoring Designs. Prepared for the Canadian Association of Petroleum Producers. St. John’s, NL.
Moore, K. 1991. Coastal Watersheds: An Inventory of Watersheds in the Coastal Temperate Forests of British Columbia. Earthlife Canada Foundation in association with Ecotrust and Conservation International. Vancouver, BC.
Morgan, K.H., K. Vermeer and R.W. McKelvey. 1991. Atlas of Pelagic Birds of Western Canada. Occasional Paper No. 72. Canadian Wildlife Service. Delta, BC.

Sec. 52 Application Volume 6B: Environmental and Socio-Economic Assessment (ESA) – Marine Terminal Section 12: Marine Birds
Page 12-76 May 2010
Paine, R.T., J.T. Wooton and P.D. Boersma. 1990. Direct and indirect effects on peregrine falcon predation on seabird abundance. The Auk 107:1–9.
Piatt, J.F. and N.L. Naslund. 1995. Abundance, Distribution, and Population Status of Marbled Murrelets in Alaska. USDA Forest Service General Technical Report PSW-152. US Department of Agriculture, Forest Service, Pacific Southwest Research Station. Albany, CA.
Piatt, J.F., K.J. Kuletz, A.E. Burger, S.A. Hatch, V.L. Friesen, T.P. Birt, et al. 2007. Status Review of the Marbled Murrelet (Brachyramphus marmoratus) in Alaska and British Columbia. US Geological Survey Open-File Report 2006-1387.
Resource Inventory Committee (RIC). 1999. Inventory Methods for Waterfowl and Allied Species: Loons, Grebes, Swans, Geese, Ducks, American Coots and Sandhill Cranes. Standards for components of British Columbia’s biodiversity No. 18, Version 2.0. Ministry of Environment, Lands and Parks, Resources Inventory Branch. Victoria, BC.
Resource Inventory Committee (RIC). 2001. Inventory Methods for Marbled Murrelets in Marine and Terrestrial Habitats. Standards for components of British Columbia’s biodiversity No. 10, Version 2.0. Ministry of Environment, Lands and Parks, Resources Inventory Branch. Victoria, BC.
Rodway, M.S., H.R. Carter, S.G. Sealy and R.W. Campbell. 1992. Status of marbled murrelets in British Columbia. In H.R. Carter and M.L. Morrison (eds.). Status and Conservation of the Marbled Murrelet in North America. Proceedings of the Western Foundation of Vertebrate Zoology 5:17–41. Cited in RIC. 2001. Inventory Methods for Marbled Murrelets in Marine and Terrestrial Habitats. Standards for components of British Columbia’s biodiversity No. 10, Version 2.0. Ministry of Environment, Lands and Parks, Resources Inventory Branch. Victoria, BC.
Sage, B. 1979. Flare up over North Sea birds. New Scientist 82: 464–466.
Savard, J.-P.L., D. Bordage and A. Reed. 1998. Surf Scoter (Melanitta perspicillata). In A. Poole and F. Gill (eds.). The Birds of North America No. 363. The Academy of Natural Sciences. Philadelphia, PA. Cited in Fraser, D.F., W.L. Harper, S.G. Cannings and J.M. Cooper. 1999. Rare birds of British Columbia. Wildlife Branch and Resource Inventory Branch, British Columbia Ministry of Environment, Lands and Parks, Victoria, BC.
Slattery, S.M., B.T. Gray, L.J. Bogdan, K.L. Guyn, D. Buffet, J.D. Griffith, I.M. Barnett and R. Fowler. 2000. A Proposal for Habitat Conservation in the Fraser River Delta. British Columbia Coastal Field Office, Ducks Unlimited Canada.
Steidl, R.J. and R.G. Anthony. 1996. Responses of bald eagles to human activity during the summer in interior Alaska. Ecological Applications 6(2): 482–491.
Steidl, R.J. and R.G. Anthony. 2000. Experimental effects of human activity on breeding bald eagles. Ecological Applications 10(1): 258–268.
Stevens, V. 1995. Wildlife Diversity in British Columbia: Distribution and Habitat Use of Amphibians, Reptiles, Birds, and Mammals in Biogeoclimatic Zones. Working Paper 04/1995. British Columbia Ministry of Forests (Research Branch) and British Columbia Ministry of Environment, Lands, and Parks (Wildlife Branch). Victoria, BC.

Sec. 52 Application Volume 6B: Environmental and Socio-Economic Assessment (ESA) – Marine Terminal Section 12: Marine Birds
May 2010 Page 12-77
Steventon, J.D. and N.P. Holmes. 2002. A radar-based inventory of marbled murrelets (Brachyramphus marmoratus), northern mainland coast of British Columbia. Unpublished report. British Columbia Ministry of Forests, Prince Rupert Region. Smithers, BC.
Vermeer, K. 1981. Food and populations of surf scoters in British Columbia. Wildfowl 32: 107–116. Cited in Fraser, D.F., W.L. Harper, S.G. Cannings and J.M. Cooper. 1999. Rare Birds of British Columbia. Wildlife Branch and Resource Inventory Branch, British Columbia Ministry of Environment, Lands and Parks. Victoria, BC.
Ward, D.H. and R.A. Stehn. 1989. Response of Brant and Other Geese to Aircraft Disturbances at Izembek Lagoon, Alaska. Final Report 14-12-0001-30332. US Fish and Wildlife Service. Anchorage, AK.
Yen, P.P.W., F. Huettman and F. Cooke. 2004. A large-scale model for the at-sea distribution and abundance of marbled murrelets (Brachyramphus marmoratus) during the breeding season in coastal British Columbia, Canada. Ecological Modelling 171: 395–413.
Zharikov, Y., D.B. Lank, F. Huettmann, R.W. Bradley, N. Parker and P.P.-W. Yen. 2006. Habitat selection and breeding success in a forest-nesting alcid, the marbled murrelet, in two landscapes with different degrees of forest fragmentation. Landscape Ecology 21(1): 107–120.
12.10.2 Internet Sites BC Integrated Land Management Bureau (ILMB). 2007. Coastal Resource Information Management
System. Available at: http://ilmbwww.gov.bc.ca/cis/coastal/others/crimsindex.htm. Accessed: August 2008.
Bird Studies Canada (BSC). 2008. Canadian Important Bird Areas Catalogue. Available at: http://www.bsc-eoc.org/iba/IBAsites.html. Accessed: August 2008.
British Columbia Conservation Data Centre (BC CDC). 2008. B.C. Species and Ecosystems Explorer. Available at: http://a100.gov.bc.ca/pub/eswp. Accessed: July 2008.
British Columbia Ministry of Environment (BC MoE). 2008. Provincial Guidelines and BMOs. Available at: http://www.env.gov.bc.ca/wld/BMP/bmpintro.html#provincial. Accessed: August 2008.
Brooks, A. 1926. Scarcity of the Marbled Murrelet. Murrelet (7): 39. Cited in BC Conservation Data Centre. 2006. Conservation Status Report: Brachyramphus marmoratus. BC Ministry of Sustainable Resource Management. Available at: http://a100.gov.bc.ca/pub/eswp. Accessed: January 2006.
Buehler, D.A. 2000. Bald Eagle (Haliaeetus leucocephalus), The Birds of North America. Available at: http://bna.birds.cornell.edu.bnaproxy.birds.cornell.edu/bna/species/506doi:10.2173/bna.506. Accessed: August 2008.

Sec. 52 Application Volume 6B: Environmental and Socio-Economic Assessment (ESA) – Marine Terminal Section 12: Marine Birds
Page 12-78 May 2010
Burger, A.E. 2001. Using radar to estimate populations and assess habitat associations of marbled murrelets. Journal of Wildlife Management 65: 696–715. Cited in BC Conservation Data Centre. 2006. Conservation Status Report: Brachyramphus marmoratus. British Columbia Ministry of Sustainable Resource Management. Available at: http://a100.gov.bc.ca/pub/eswp. Accessed: January 2006.
Burger, A.E., T.A. Chatwin, S.A. Culin, N.P. Holmes, I.A. Manley, M.H. Mather, et al. 2004. Application of radar surveys in the management of nesting habitat for marbled murrelets Brachyramphus marmoratus. Marine Ornithology 32: 1–11. Cited in BC Conservation Data Centre. 2006. Conservation Status Report: Brachyramphus marmoratus. British Columbia Ministry of Sustainable Resource Management. Available at: http://a100.gov.bc.ca/pub/eswp/. Accessed: January 2006.
Committee on the Status of Endangered Wildlife in Canada (COSEWIC). 2006. Canadian Species at Risk. Available at: http://www.cosewic.gc.ca/eng/sct0/index_e.cfm#sar. Accessed: April 2006.
Environment Canada. 2000. Bald Eagle: An Indicator of Wildlife Sustainability in British Columbia. Available at: http://ecoinfo.org/env_ind/region/baldeagle/eagle_e.cfm. Accessed: August 2008.
Environment Canada. 2004a. Seabirds: An Indicator of Marine Ecosystem Status for Coastal British Columbia. Available at: http://www.ecoinfo.org/env_ind/region/seabird/seabird_e.cfm. Accessed: July 2008.
Environment Canada. 2004b. Species at Risk: Marbled Murrelet (Brachyramphus marmoratus). Available at: http://www.sararegistry.gc.ca/species/speciesDetails_e.cfm?sid=39. Accessed: January 2006.
Government of Canada. 2008. Species at Risk Public Registry. Available at: http://www.sararegistry.gc.ca/. Accessed: 2008.
NatureServe. 2008. NatureServe Explorer: An Online Encyclopedia of Life [web application]. Version 7.1. NatureServe, Arlington, Virginia. Available http://www.natureserve.org/explorer Accessed: 2008.
Nelson, S.K. 1997. Marbled Murrelet (Brachyramphus marmoratus). Available at: http://bna.birds.cornell.edu.bnaproxy.birds.cornell.edu/bna/species/276doi:10.2173/bna.276 Accessed: August 2008.
Pearse, T. 1946. Notes on changes in bird populations in the vicinity of Comox, Vancouver Island – 1917 to 1944. Murrelet 27: 4–9. Cited in BC Conservation Data Centre. 2006. Conservation Status Report: Brachyramphus marmoratus. British Columbia Ministry of Sustainable Resource Management. Available at http://a100.gov.bc.ca/pub/eswp. Accessed: January 2006.
Sea Duck Joint Venture (SDJV). 2004. Surf Scoter (Melanitta perspicillata). Sea Duck Information Series Sheet 14. Available at: http://www.seaduckjv.org/infoseries/susc_sppfactsheet.pdf. Accessed: July 2008.

Sec. 52 Application Volume 6B: Environmental and Socio-Economic Assessment (ESA) – Marine Terminal Section 12: Marine Birds
May 2010 Page 12-79
Watson, J.W. and E.A. Rodrick. 2004. Bald eagle (Haliaeetus leucocephalus). In E.M. Larsen, J.M. Azerrad and N. Nordstrom (eds.). Management Recommendations for Washington's Priority Species, Volume IV: Birds. Available at: http://wdfw.wa.gov/hab/phs/vol4/baldeagle.pdf. Accessed: January 2009.


Sec. 52 Application Volume 6B: Environmental and Socio-Economic Assessment (ESA) – Marine Terminal Section 13: Marine Fisheries
May 2010 Page 13-1
13 Marine Fisheries Commercial fisheries include Pacific salmon, Pacific halibut, prawn, shrimp, red sea urchin, octopus, and some groundfish. The food, social and ceremonial (FSC) fishery is important for spiritual and cultural purposes and as a key food source. Commercial-recreational fisheries include lodges, outfitters and vessel charters offering recreational fishing experiences. Recreational fishing has economic benefits to local industry and considers resident and out-of-town anglers who fish for sport, enjoyment and food. The potential environmental effect assessed was restriction of access to fishing grounds. Mitigation will include establishing a fisheries liaison committee (FLC) to facilitate effective communication with commercial, FSC, commercial-recreational and recreational fishers along with regulators and other interested parties to address specific fisheries issues and develop mutually acceptable solutions. After mitigation, environmental effects are expected to be not significant.
13.1 Setting for Marine Fisheries To assess potential effects of the Project on marine fisheries, the following four categories of fisheries are considered:
• commercial fisheries • FSC fisheries • commercial-recreational fishing • recreational fishing
The marine fisheries valued environmental component (VEC) is subdivided into these four categories because each has different characteristics, socio-economic values and is managed independently, yet all depend on the aggregate species comprising the marine fisheries VEC. This assessment focuses on potential effects on the four fishery categories from project activities during construction, operations and decommissioning.
For this assessment, most of available statistical data were for commercial fisheries; however, there are recreational and aboriginal (FSC) fisheries data available for entire fisheries management areas (FMAs)1
The importance of FSC fishing was impressed upon Northern Gateway during interviews with Aboriginal residents in communities such as Kitamaat Village, Hartley Bay, Kitkatla, Prince Rupert and Lax Kw’alaams. Although some members of the Aboriginal community are more active in the fishery than others, all of the Aboriginal coastal communities traditionally harvest fish and shellfish in the area. Northern Gateway is currently conducting engagement with participating coastal and interior Aboriginal communities; this engagement includes assessing their interest in completing Aboriginal traditional knowledge (ATK) community reports. Opportunity to participate in, or conduct community reports will be respectfully extended. Additional FSC information may become available from these studies, such as
(versus further subdivided subareas). Additional characterizations, such as management strategies and opinions, are included in the assessment to help provide an overview of each fishery.
1 FMAs are administered by Fisheries and Oceans Canada (DFO); they are based on a numbering system (e.g., FMA 5) and are further subdivided into subareas (e.g., FMA 5-1).

Sec. 52 Application Volume 6B: Environmental and Socio-Economic Assessment (ESA) – Marine Terminal Section 13: Marine Fisheries
Page 13-2 May 2010
information on fisheries and marine resources use and specific information on species, gathering and harvesting methods, seasons of use, sites of significance, and travel routes.
13.1.1.1 Commercial Fisheries
Commercial fisheries are assessed because of their economic and employment importance to British Columbia’s communities within the PEAA. Commercially targeted species are identified, and data are examined on landed weight, dollar value and fishing effort. Commercial fisheries in the PEAA are generally active year round, although seasonal openings are governed by species abundance and run timings (e.g., salmon). Fisheries and Oceans Canada (DFO) Management Subarea 6-1 comprises the entirety of the PEAA and provides the spatial boundary for the assessment of marine fisheries at the marine terminal (see Section 13.2.3).
Key species harvested within Subarea 6-1 include Pacific salmon, Pacific halibut, prawn2
13.1.1.2 Food, Social and Ceremonial Fishery
, shrimp, red sea urchin, octopus and some groundfish.
The FSC fishery targets species similar to those of commercial and recreational fisheries. DFO manages this fishery based on species abundance and in consultation with participating Aboriginal groups. Aboriginal groups rely on the resource as a substantial portion of their diet and for spiritual and cultural purposes.
13.1.1.3 Commercial-Recreational Fishing
The commercial-recreational fishery includes lodges, outfitters and charters (where individuals pay a fee to be taken recreational fishing; often, individuals are non-resident anglers). The commercial-recreational fishery has both social and economic importance to the local communities and to British Columbia’s tourism industry.
13.1.1.4 Recreational Fishing
Recreational fishing is included because of its economic benefits to local industry (e.g., tackle shops and accommodations) and popularity as a leisure activity for local residents and out-of-town fishers who fish for sport, enjoyment and for food. DFO manages the marine recreational fishery under the classification Tidal Waters, to recognize its distinction from freshwater fisheries.
2 For this assessment, the term prawn refers solely to spot prawn Pandalus platyceros, while the generic term shrimp refers to all other species of Pandalus and Pandalopsis.

Sec. 52 Application Volume 6B: Environmental and Socio-Economic Assessment (ESA) – Marine Terminal Section 13: Marine Fisheries
May 2010 Page 13-3
13.2 Scope of Assessment for Marine Fisheries
13.2.1 Key Project Issues for Marine Fisheries Potential effects of the marine terminal construction, operations and decommissioning on marine fisheries include:
• restriction of access to fishing grounds • loss or damage to fishing gear • change in distribution and abundance of harvested species • aesthetics and visual effects
Restriction of access to fishing grounds during construction, operations and decommissioning are considered in this assessment (see Table 13-1). Identification of environmental effects was based on the scope of factors from the Joint Review Panel Agreement and input from DFO, marine fishers, participating Aboriginal groups and professional judgment.
Table 13-1 Potential Environmental Effects of the Marine Terminal on Marine Fisheries
This table identifies the potential environmental effects on marine fisheries that are assessed in this section of the ESA. Each of these environmental effects is discussed in more detail later in this section. Recommendations for mitigation and, if required, follow-up and monitoring are also provided. With the implementation of these mitigation measures where appropriate, the Project is not likely to cause significant adverse environmental effects on marine fisheries.
Project Activities and Physical Works
Key Environmental Effects on Marine Fisheries Relevance to the Assessment
Considered in the ESA Construction Inwater infrastructure site preparation (dredging, blasting, pile drilling)
Restriction of access to fishing grounds
Potential economic loss because of reduced fishing opportunity
Inwater infrastructure construction (marine terminal, berths, pile installation)
Restriction of access to fishing grounds
Potential economic loss because of reduced fishing opportunity
Operations Inwater infrastructure PDA (marine terminal, berths and associated shading, underwater structures)
Restriction of access to fishing grounds
Potential economic loss because of reduced fishing opportunity

Sec. 52 Application Volume 6B: Environmental and Socio-Economic Assessment (ESA) – Marine Terminal Section 13: Marine Fisheries
Page 13-4 May 2010
Table 13-1 Potential Environmental Effects of the Marine Terminal on Marine Fisheries (cont’d)
Project Activities and Physical Works
Key Environmental Effects on Marine Fisheries Relevance to the Assessment
Considered in the ESA Decommissioning Inwater infrastructure site restoration (infrastructure removal)
Restriction of access to fishing grounds
Potential economic loss because of reduced fishing opportunity
The potential effect of loss or damage to fishing gear is addressed in Volume 8B and is not considered further in this volume.
Potential change in distribution and abundance of harvested species is assessed in Section 9 (Marine Invertebrates) and Section 10 (Marine Fish) of this volume. Both assessments conclude that construction, routine operations and decommissioning of the marine terminal will not affect the viability of marine invertebrate or marine fish. Therefore, this effect is not considered further in this assessment.
The aesthetic, visual and noise (i.e., sensory) effects of routine terminal operations, on marine and land-based recreational and commercial-recreational fishing and related stakeholders, within the Douglas Channel area in the PEAA have been addressed as part of the effects assessment for non-traditional land and resource use (see Volume 6C, Section 5). That assessment concludes residual effects of the marine terminal on visual and aesthetic resources are not significant. This effect is not considered further in this assessment
13.2.2 Selection of Valued Environmental Components and Measurable Parameters for Marine Fisheries
The following measurable parameters are selected because they are quantifiable; and they address the potential effects of the marine terminal on FMA 6 and FMA 6-1 based on available data: as they relate to annual changes in openings and closure durations and trends in adjacent fisheries (e.g., FMA 5)
13.2.3 Spatial Boundaries for Marine Fisheries The marine PDA and the PEAA are the two geographic areas identified for marine fisheries. The marine PDA encompasses the marine terminal and the restricted 150-m marine safety zone around the terminal. During operations, non-project-related vessels and activities will be excluded from the marine PDA. The PEAA includes the marine PDA and the area within which the Project is most likely to have an environmental effect on marine fishing activities. To be consistent with the FMAs identified by DFO, the PEAA was defined as being the same as FMA Subarea 6-1 (see Figure 13-1).
13.2.4 Temporal Boundaries for Marine Fisheries The temporal boundaries of the effects assessment include all phases of the Project and the overlays with those phases with the timing of fishing effort.

Skeena
Exstew
Terrace
Lakelse Lake
Kitimat
KitamaatVillageKitimat
Terminal
Loretta Is.
HawkesburyIsland
Princess RoyalIsland
Hartley Bay
PittIsland
PorcherIsland
StephensIsland
McCauleyIsland
BanksIsland
TrutchIsland
DewdneyIs.
Campania Is.
GilIsland
FinIs.
AristazabalIsland
PriceIsland
SwindleIsland
RoderickIsland
SusanIsland
DowagerIsland
Sara
h Is
.
GoschenIsland
GurdIs.
DolphinIs. Spicer
Is.
KennedyIsland
SmithIsland
PrescottIs.
MelvilleIsland
DigbyIs.
Prince Rupert
Kitkatla
Klemtu
FarrantIs.
GribbellIsland
Maitland Is.
RennisonIs.
Beauchemin Channel
LaredoSound
Laredo Channel
Estevan Sound
Squally Channel
CampaniaSound
CaamañoSound
NepeanSound
Otter Channel
WrightSound
Whale Channel
Lared
o Inle
t
Finlay
son C
hann
el
Doug
las C
hann
el
Verney
Passage
Kitim
at Ar
m
Principe Channel
ChathamSound
Skeena River
Grenville Channel
BrowningEntrance
Ogden C
hannel
Kitkatla Channel
BonillaIs.
HecateStrait
Gardner Canal
TripleIslands
6-1
6-9
6-4
6-2
6-5
6-3
6-20
6-10
6-13
6-6
6-16
6-19
6-12
6-7
6-17
6-14
6-25
6-28
6-11
6-8
6-18
6-15
6-236-26
6-21
6-22
6-27
6-24
Pipeline Route
Marine PEAA
Fisheries Management Area 6
Fisheries Management Subarea
Railway
Road
River / Stream
NP
Jacques Whitford AXYS Ltd.
FIGURE NUMBER:
PROJECTION:
CONTRACTOR: DATE:
AUTHOR: APPROVED BY:PREPARED FOR:PREPARED BY: SCALE:
DFO Fisheries Management Area 6and Subareas
ENB R ID GE N OR TH ER N GA TEW A Y PR OJ EC T
R:\2
009F
isca
l\104
8334
_Nor
ther
nGat
eway
_ES
A_2
009
13-1
NAD 83DATUM:
1:1,100,000
UTM 9
CM
6-x
20090911
0 10 20 30
Kilometres
Reference: Pipeline Route R
JWA-1048334-1529
REFERENCES: NTDB Topographic Mapsheets provided by the Majesty the Queen in Right of Canada, Department of Natural Resources. All rights reserved.

Sec. 52 Application Volume 6B: Environmental and Socio-Economic Assessment (ESA) – Marine Terminal Section 13: Marine Fisheries
Page 13-6 May 2010
13.2.5 Regulatory Setting or Administrative Boundaries for Marine Fisheries Commercial fishing activities are regulated and managed by DFO under the authority of the Fisheries Act and the regulations made under the Fisheries Act. Key habitat protection provisions are in the Act as well as authority for the department’s activities.
Fishery regulations apply to commercial, recreational and Aboriginal communal fishing and related activities across the nation, and cover:
• closing times, fishing quotas and size and weight limits of fish and invertebrates • documents, registrations and licensing • identification of fishing vessels and fishing gear • observers on high seas vessels • assisting persons engaged in the enforcement or administration of the Fisheries Act • fishing for experimental, scientific, educational or public display purposes • fishing in waters other than Canadian fisheries waters
The Pacific Fishery Regulations (Government of Canada 1993) contain provisions specific to Pacific Region fisheries and apply to:
• fishing by all commercial fishers
• fishing for tuna from Canadian vessels on the high seas
• harvesting marine plants from Canadian fisheries waters outside of the geographical limit of the province
The Pacific Fishery Regulations do not apply to:
• recreational fishing • taking fish from an aquaculture site • fishing for marine mammals • fishing from a foreign fishing vessel, as defined in Section 2 of the Coastal Fisheries Protection Act
Marine recreational fishing activities in British Columbia are regulated by the Fisheries Act and are summarized in the British Columbia Tidal Waters Sport Fishing Guide (DFO 2007a).
13.2.6 Definition of Environmental Effect Attributes for Marine Fisheries Sustaining populations is fundamental to the viability of the marine fisheries, as is access to the fishery when open. Disruption by effects can reduce the population of harvested species or reduce access to the fishery for a period during its opening. Effects on the commercial fishery component are characterized using the following criteria.
Direction
• adverse: a decrease in the viability of marine fisheries (e.g., reduction in, catch, effort and/or value of harvested species) as a result of restricted access to the fishing grounds

Sec. 52 Application Volume 6B: Environmental and Socio-Economic Assessment (ESA) – Marine Terminal Section 13: Marine Fisheries
May 2010 Page 13-7
• positive: an increase in the viability of marine fisheries (e.g., increase in, catch, effort and/or value of harvested species) as a result of restricted access to the fishing grounds
• neutral: no change in the viability of marine fisheries (e.g., nil or low change in catch, effort and/or value of harvested species) as a result of restricted access to the fishing grounds
Magnitude
• negligible: no measurable adverse environmental effects expected
• low: restricted access to fishing grounds results in a 1% to 10% decrease in the number of recreational licences sold, catch, effort and/or value of harvested species as data are available
• moderate: restricted access to fishing grounds results in an 11% to 20% decrease in the number of recreational licences sold, catch, effort and/or value of harvested species as data are available high: restricted access to fishing grounds results in a 21% or greater decrease in the number of recreational licences sold, catch, effort and/or value of harvested species as data are available
Geographic Extent
• site-specific: the marine PDA • local: the PEAA • regional: beyond the PEAA
Duration
• short term: effects limited to openings during one calendar year • medium term: effects extend for two to five years following the disturbance • long term: effects extend past five years • permanent: effects are permanent
Frequency
• once: an environmental effect that occurs only once • sporadic: an environmental effects that occurs at sporadic intervals • regularly: an environmental effects that occurs at regular intervals • continuous: an environmental effect that occurs continuously
Reversibility
• reversible: an environmental effect on a fishery is considered reversible if fishing is able to return to pre-disturbance conditions, with mitigation
• irreversible: an environmental effect is considered irreversible if fishing is not able to return to pre-disturbance conditions, with mitigation

Sec. 52 Application Volume 6B: Environmental and Socio-Economic Assessment (ESA) – Marine Terminal Section 13: Marine Fisheries
Page 13-8 May 2010
13.2.7 Determination of Significance for Marine Fisheries The project effects on marine fisheries are categorized as significant if any of the following is predicted to occur:
• changes (positive or negative) to the species-specific commercial catches for FMA 6 (PEAA) greater than 20% of historical (post 1998) means and trends of the fishery, taking into consideration any closures and established quotas set by DFO that may influence the annual differences
• changes (positive or negative) to the salmon recreational and commercial-recreational catch in FMA 6 greater than 20% of historical (post 1998) means and trends of the fishery, taking into consideration any closures and established quotas set by DFO that may influence the annual differences
• changes (positive or negative) in the number of salmon recreational and commercial-recreational licences sold within FMA 6 are greater than 20% of historical (post 1998) means and trends of the fishery, taking into consideration any closures and established quotas set by DFO that may influence the annual differences
13.3 General Mitigation Measures for Marine Fisheries Northern Gateway is committed to limiting environmental effects on commercial, FSC, commercial-recreational and recreational fishing activities. Northern Gateway considers communication and mutual decision-making to be fundamental to achieving this.
Mitigation will follow adaptive management principles, which provide an important framework for evaluating project effects and the effectiveness of mitigation and compensation measures. Effectiveness evaluations through monitoring will also provide the basis for developing corrective measures or measures to improve environmental performance. The approach is expected to evolve as the Project develops and as interested parties provide valuable contributions to the process.
Northern Gateway proposes to establish a FLC that includes Aboriginal, commercial and local fisheries representatives who will provide advice on means to reduce the effects of terminal operations on marine fisheries and other resource use. The FLC will facilitate communication with commercial, FSC, commercial-recreational and recreational fishers and with regulators and other interested parties. In the case of the commercial-recreational and recreational fisheries, a catch-monitoring program is proposed. The program would begin before construction and continue through operations to decommissioning. The program would focus on obtaining accurate catch and effort data, which would form the basis for evaluating project effects. Northern Gateway recognizes that the coastal Aboriginal groups, given their interests, may choose to have a separate committee to address the FSC fishery, either additionally or alternatively.
Potential mitigation could include measures to reduce conflicts with commercial fishery openings (e.g., hours to days) or other fishing activities, as well as initiatives to improve fishing in other areas outside the marine PDA. The committee would also provide a forum for the communication and discussion of issues relating to the Project such as approximate schedules for construction and VLCC traffic, and reviewing and contributing to follow-up and monitoring programs within the context of adaptive management principles. This concept has been successfully applied in Newfoundland where One

Sec. 52 Application Volume 6B: Environmental and Socio-Economic Assessment (ESA) – Marine Terminal Section 13: Marine Fisheries
May 2010 Page 13-9
Ocean was established in 2002 by the fishing and petroleum industries of Newfoundland and Labrador to promote mutual understanding. The FLC would be project-specific and of a smaller scale than One Ocean. However, the principles of using the FLC to promote mutual understanding and decision-making will be used to full advantage.
General mitigation measures that will be used to reduce effects on marine fisheries include:
• adhering to published construction timing windows or windows determined in consultation with DFO in the marine environment
• complying with water quality criteria, guidelines and standards for protecting marine life
• complying with the provisions of approvals under the Navigable Waters Protection Act and the Fisheries Act
• respecting FSC fishing rights related to sacred and ceremonial locations and the rights of commercial, commercial-recreational and recreational fishers
• preparing an Information Booklet on the navigation and safety requirements that will be applicable when the terminal is operational. The booklet will be developed in consultation with government agencies. Aboriginal organizations and the FLC will also be consulted. The booklet will address items such as vessel requirements and operational protocols during ship transits, berthing and loading, vessel routes, the whale-monitoring program, and other project-related activities associated with the terminal. Subject to safety considerations, the booklet will explain that certain vessel transit approaches are preferred during specific seasons to avoid whale concentration areas and will discuss the importance of adhering to these measures. For more details about vessel movements, their effects, and vessel transit approaches, see Volume 8B.
• implementing the Storm Water Management Plan and Sediment and Erosion Control Plan at the tank terminal to limit erosion resulting from runoff, and to reduce sedimentation in nearshore waters
• observing inwater work windows for aquatic activities such as dredging and blasting. Timing of work windows will be determined in consultation with DFO. These windows will consider the timing of migration, spawning, nearshore rearing and egg development for important fisheries species.
• MTCS will be advised of the intentions of tanker traffic, will monitor transits and if required issue advisory instructions to other shipping
• posting a notice to anglers at local and regional tackle shops, marinas, media outlets (radio, newspapers) and e-mails to local and regional fishing clubs, guides and lodges that may be affected by the construction timing and duration or other critical operations at the marine terminal
• enforcement of a company policy that restricts recreational fish and invertebrate harvesting from the marine terminal and ancillary facilities by all construction and operations personnel
In addition to these measures, Northern Gateway has developed a Construction Environmental Protection and Management Plan (EPMP) that outlines the protection measures to reduce potential environmental effects during construction (see Volume 7A). The EPMP also encompasses compliance and environmental effects monitoring programs.
Sec. 52 Application Volume 6B: Environmental and Socio-Economic Assessment (ESA) – Marine Terminal Section 13: Marine Fisheries
Page 13-10 May 2010
13.4 Assessment Methods for Marine Fisheries Assessment methods for marine fisheries include a literature review and collection of data from DFO statistical services, internet and departmental sources, and interviews with local residents (see the Marine Fisheries Technical Data Report [TDR] [Triton 2010]). Assessing the effects of the change in distribution and abundance of harvested species is discussed in Section 9 (Marine Invertebrates) and Section 10 (Marine Fish) and will not be discussed further.
13.4.1 Data Sources and Fieldwork The availability of commercial fisheries data at the subarea level is more readily available than other marine fisheries categories. As such, commercial fisheries data holds much of the focus for individual species and subareas. Available data that describe the commercial, FSC, commercial-recreational and recreational fisheries focus on area-wide statistics rather than subarea, and are therefore difficult to align with the PDA. Additional information was collected through responses to questionnaires circulated to local charter and lodge operators, and publically available website information. Additional information on the FSC Fishery may become available through ATK community reports. The Project’s Aboriginal Relations team will continue to engage and share information with coastal and interior Aboriginal groups as the Project progresses. Opportunities to participate in, or conduct, community reports will be respectfully extended.
DFO collates and maintains statistical data for a wide range of fisheries activities, including commercial fishery landings and aquaculture activities. The following data were requested for all commercial, recreational and Aboriginal fisheries landings for FMA 6 and associated subareas from 1998 to 2008:
• landings by species • landings by weight • value of landings • gear type • number of fishing vessels (salmon species only)
DFO provided landings data for the following species in Subarea 6-1 (PEAA):
• Pacific salmon (chum, pink, chinook, coho and sockeye) • groundfish • Pacific halibut • shrimp • prawn • red sea urchin • octopus
Existing data and information have been obtained from several sources including agency literature, electronic resources (e.g., websites), and interviews with local residents (see the Marine Fisheries TDR).
DFO is the primary source of information for commercial landings data and related information pertaining to licences, openings, quotas and management practices. Contact with DFO personnel includes visits to the DFO office in Prince Rupert, telephone conversations, letters and e-mail correspondence. The

Sec. 52 Application Volume 6B: Environmental and Socio-Economic Assessment (ESA) – Marine Terminal Section 13: Marine Fisheries
May 2010 Page 13-11
DFO information is subject to a key constraint, which has been taken into consideration when environmental effects from the Project were assessed. When making commercial landings data available, DFO applies the three-party rule. The three-party rule is applied if three or fewer vessels report landings from the same subarea during the fishing season. The information is considered confidential and is not released in a form that could be traced to individual vessels. If three or fewer vessels report landings in a specific subarea, DFO summarizes those data with other subareas. Any analysis of the data must take into consideration whether the three-party rule has been applied so that inaccurate conclusions are not drawn in relation to fishing intensity and trends among management areas, subareas and calendar years.
Data from 1998 to 2008 (Marine Fisheries TDR) have been extracted to illustrate the importance of Subarea 6-1. Data in the Marine Fisheries TDR include statistical data extracts from DFO reporting services, data from the DFO commercial statistics website, other management plans and available literature.
13.5 Baseline Conditions for Marine Fisheries FMA Subarea 6-1 (PEAA) is used as the assessment area for routine effects of the marine terminal on commercial fisheries because more site-specific information is not available. Commercial–recreational, recreational and FSC fisheries data are not available at the subarea level and therefore the assessment is based on data from the whole of FMA 6.
13.5.1 Commercial Fisheries Because of data restrictions from the three-party rule, limited data were released for individual subareas. In the interest of accuracy, only data reported for individual subareas were used. As a result, the reported figures are likely to be an under representation of actual weights and values.
13.5.1.1 Pacific Salmon
Combined landings for Pacific salmon species from 1998 to 2008 for Subarea 6-1 and the remaining FMA 6 subareas are provided in Table 13-2. Subarea 6-1 represents between 0.6% and 15.6% of the total Pacific salmon landings in FMA 6, and 0.02% and 1.38% of total British Columbia landings from 1998 to 2008. In terms of financial value, salmon landings from FMA 6 represented between 0.84% and 11.65% of the total FMA 6 value and 0.01% and 0.67% of the total British Columbia value during the same period (Marine Fisheries TDR).
Landings data for Pacific salmon in Subarea 6-1 include all five British Columbia species of salmon (i.e., pink, chum, coho, sockeye and chinook). Chum and pink salmon were the main species caught in FMA 6-1 from 1998 to 2008, consistent with overall catches of FMA 6 (Marine Fisheries TDR).
Because of the three-party rule, a large portion of landings are reported to an unspecified subarea or are reported as having no landings, although landings Subarea 6-1 data amalgamated with other subareas suggests that there is fishing (Marine Fisheries TDR). The combination of these two factors makes data interpretation difficult.

Sec. 52 Application Volume 6B: Environmental and Socio-Economic Assessment (ESA) – Marine Terminal Section 13: Marine Fisheries
Page 13-12 May 2010
Table 13-2 Salmon Landings in FMA 6 Subareas (1998 to 2008)
Subarea Year
1998 1999 2000 2001 2002 2003 2004 2005 2006 2007 2008 Subarea 6-1 (PEAA) (kg)
0 0 0 20,174 0 0 160,926 388,,082 3,905 0 1,052
All other FMA 6 subareas (kg)
0 0 2,462,031 295,156 1,614,260 8,186,648 968,290 8,590,722 300,665 37,580 10,381
Subtotal (kg) 0 0 2,462,031 315,330 1,614,260 8,186,648 968,290 8,590,722 300,665 37,580 11,433 Data subject to three party rule (kg)
0 0 210,638 3,040,971 407,168 167,771 63,035 73,309 28,600 3,021,489 14,026
Total (kg) 0 0 2,672,669 3,356,301 2,021,428 8,356,419 1,192,251 9,052,113 333,170 3,059,069 25,459
NOTES: Records of “0” are often reported because of the three-party rule.
SOURCE: Marine Fisheries TDR

Sec. 52 Application Volume 6B: Environmental and Socio-Economic Assessment (ESA) – Marine Terminal Section 13: Marine Fisheries
May 2010 Page 13-13
Salmon in Subarea 6-1 are targeted using gill nets and purse seine gear. Gill nets are the prominent gear type used between 1998 and 2008 (see Figure 13-2). The fishery is open for short, often unpredictable periods during July and August, commonly one day at a time, with timings for each subsequent day determined at the end of the most recent day of fishing (DFO 2008c). Subarea 6-1 has the highest number of vessels fishing over all years and all fishing methods. Between 1998 and 2008, 243 vessels targeted salmon using gill nets and 14 vessels used purse seining (Marine Fisheries TDR).
Figure 13-2 Fishing Gear Type in Subarea 6-1, 1998 to 2008
13.5.1.2 Groundfish
Groundfish is the broad term used to categorize demersal or benthic fish, i.e., fish that dwell at or near the bottom of the ocean. Groundfish species are caught by targeted fishing and as bycatch. This is reflected in the management of the fishery, where some species are included in the quota system and others are not. Currently, the groundfish quota management system for FMA 6 includes (DFO 2009a):
• 16 species of rockfish: canary, longspine thornyhead, Pacific ocean perch, quillback, copper, china, tiger, redstripe, rougheye, shortspine thornyhead, shortraker, silvergray, widow, yelloweye, yellowmouth and yellowtail
• lingcod, dogfish, hake, pollock, Pacific cod
• dover sole, lemon sole, petrale sole
• arrowtooth flounder, Pacific halibut, sablefish
• big skate and longnose skate
Data collected to date indicate that the Pacific halibut fishery is a substantial component of the commercial fishery. Therefore, this species and its catch data are discussed separately in this assessment.

Sec. 52 Application Volume 6B: Environmental and Socio-Economic Assessment (ESA) – Marine Terminal Section 13: Marine Fisheries
Page 13-14 May 2010
Groundfish landings data are collected and provided by DFO according to fishing gear type (i.e., groundfish by hookline and groundfish by trawl). Groundfish by hookline (long lining) involves a main fishing line with a series of shorter lines with baited hooks attached at intervals. Groundfish by trawl is the largest fishery on the west coast of Canada, with landings ranging from 56 million kg to 148 million kg (DFO 2009, Internet site).
Data released by DFO in 2009 for the years 1998 to 2008 show no commercial fishery catch data for groundfish or any vessels targeting groundfish in Subarea 6-1. However, much of the data released was reported to the unspecified Subarea 6-0. Data from an earlier request for the years between 1999 and 2004 show 16 species (see above list) caught by hookline to total 76,000 kg. About 60% of these were rockfish. Approximately 34% were lingcod, and the remaining species contributed less than 6%. Additional species caught by hookline have not been reported by subarea (DFO 2008b). For each year between 1999 and 2004, a portion of groundfish landings was recorded to unspecified subareas, which may have included Subarea 6-1. In 2003, landings were recorded for Subarea 6-1, but landing weights are unavailable because of the application of the three-party rule, indicating that three or fewer commercial vessels targeted groundfish in 2003 (DFO 2008b).
Most groundfish species represent annual fisheries that are open year round or until the total allowable catch has been reached. The current fishing year for sablefish, groundfish trawl, other groundfish and rockfish by hook and line is open from February 21, 2009 to February 20, 2010, essentially making this a year-round fishery. However, closures for some species and areas can change annually and within a season (DFO 2009a).
13.5.1.3 Pacific Halibut
Pacific halibut is an important commercial fishery for British Columbia, with total provincial landings of approximately 4.8 million to 7.8 million kg between 1998 and 2008 (Marine Fisheries TDR).
Because of the three-party rule, no landings were recorded for Subarea 6-1. However, three commercial fishing vessels were reported to be targeting halibut between 1998 and 2008. This represented approximately 0.6% of the entire fleet (Marine Fisheries TDR) and landings from these vessels were subjected to the three party rule when reported in 1998, 2004 and 2007. The landings data were combined with Subarea 6-2 and Subarea 6-28 in 1998 and Subarea 6-2 in 2004 and 2007.
The 2009 Pacific halibut fishery opened at 12:00 noon Pacific Time on March 21, 2009 and closed at 12:00 noon Pacific Time on November 15, 2009, or once the total allowable catch had been reached (DFO 2009a).
13.5.1.4 Prawn
In Subarea 6-1, 13 prawn-trapping vessels were recorded between 1998 and 2008, representing 5.4% of the entire fleet targeting prawn in FMA 6. During the same period, 29 vessels were recorded targeting prawn and shrimp by trawl fishing methods in Subarea 6-1, representing 33% of the entire fleet. Prawn landings data for both trap and trawl fishing methods from FMA 6-1 between 1998 and 2008 were only reported for 1998 (trawl) and 2000 (trap) due to the three-party rule. The landings for these years were 4 kg and 1,968 kg, respectively, accounting for 0.01% and 3.73% of FMA 6 and 0.0002% and 0.13% of

Sec. 52 Application Volume 6B: Environmental and Socio-Economic Assessment (ESA) – Marine Terminal Section 13: Marine Fisheries
May 2010 Page 13-15
the total provincial landings. It could be speculated that much of the catch was reported to an unspecified subarea and therefore data was unavailable for Subarea 6-1. The financial value of the prawn fishery in FMA 6 between 1998 and 2008 ranged between Can$295,108 and Can$1,143,262 (DFO 2008a, Internet site).
The prawn fishery uses baited traps of varying size that are laid out along a bottom line, with the position of the traps shown by surface buoys (DFO 2008d, Internet site). The fishery opens no earlier than 12:00 noon on May 1, and closures of local areas are announced as spawner indices reach management targets. A spawner index is the biological reference point to which the fishery is managed. It is a measure of the average number of females or transitions (pre-females) caught per standard trap with standard bait fished for a 24-hour period (soak). The spawner index was introduced by DFO in 1979 (DFO 2008a).
The commercial fishery for 2008 began on May 1 and lasted 58 days, one day shorter than in 2005, 2006 and 2007. This compares with 63 days in 2004, 72 days in 2003, 66 days in 2002 and 78 days in 2001 (DFO 2009b).
13.5.1.5 Shrimp
Landings data show both trap and trawl gear were used in the commercial harvest of shrimp in FMA 6 including Subarea 6-1 (see Table 13-3). The number of vessels targeting shrimp were the same as those targeting prawn (Marine Fisheries TDR).
Table 13-3 Shrimp Landings by Trap and Trawl in FMA 6 and Subarea 6-1
Year
Shrimp by Trap (Gear Code 97) (kg)
Shrimp by Trawl (Gear Code 57) (kg)
FMA 6 Subarea 6-1 FMA 6 Subarea 6-1 1998 773 0 12,875 7,359 1999 2,312 NA 13,104 NA 2000 4,768 1,200 10,367 NA 2001 6,311 NA 6,942 NA 2002 4,405 NA 8,583 4,074 2003 3,762 NA 4,896 3,118 2004 617 NA 4,068 NA 2005 1,624 0 5,353 1,399 2006 352 0 5,366 NA 2007 826 0 917 55 2008 0 0 3,783 1,221
NOTE: NA – No weight available because of the three-party rule.
SOURCE: Marine Fisheries TDR.

Sec. 52 Application Volume 6B: Environmental and Socio-Economic Assessment (ESA) – Marine Terminal Section 13: Marine Fisheries
Page 13-16 May 2010
Financial value of landings for FMA 6 between 1998 and 2008 for all species of shrimp represented between 0.02% and 0.92% for all of British Columbia (Marine Fisheries TDR).
The trawl fishery is generally open year round with no official closing date (the management plan states April 1, 2008 through March 31, 2009). However, the fishery closes when the catch ceiling3
13.5.1.6 Red Sea Urchin
or action level for a given area is reached (DFO 2008d).
The shrimp-by-trap fishery is managed in the same way as the prawn-by-trap fishery. Opening on May 1, the fishery closes when the spawner indices approach management targets (DFO 2008a).
Red sea urchins are commercially harvested by divers for their roe, which is marketed almost exclusively to Japan. The yield of the roe from an urchin ranges between 5% and 15% of the total body weight. The 2008–2009 commercial fishery opened no earlier than August 1, 2008 and closed on July 31, 2009. Scheduled open times are managed, to maintain optimal value for the sea urchin roe. The North Coast Fishery is scheduled to provide a continuous year-round supply of high quality product, and the fishery is closed once the TAC has been reached, or by additional in-season closures.
Between 1998 and 2008, only one vessel was reported to be targeting red sea urchins from within Subarea 6-1 (Marine Fisheries TDR). Landings data for red sea urchin within the PEAA were not reported for Subarea 6-1 (the PEAA) between 1998 and 2008 because of the three-party rule. Combined landings reported in 2002 for Subarea 6-1 and Subarea 6-10 combined were 141,200 kg (DFO 2008c).
13.5.1.7 Octopus
In November 1999, DFO announced management and licensing changes to the octopus fishery to provide a more precautionary and phased approach to the developing fishery. The new approach provides for input from scientific experiments to inform management of the fishery. As of August 2007, the octopus fishery is under an exploratory fishing licence (DFO 2007b). Before 1992, octopus were harvested by both trap and diving methods, and a limited amount as bycatch from trawl fisheries. Today, the harvest is by diving (DFO 2007b).
The dive fishery is mainly in southern coastal British Columbia, with most landings on the east coast of Vancouver Island. Landings on the west coast of Vancouver Island and north coast areas, although increasing, are considered minor (DFO 2007b). The total value of the provincial octopus fishery ranges from Can$86,849 in 2007 to Can$470,360 in 2002 (DFO 2009, Internet site). Harvest data for Subarea 6-1 were limited because of the three-party rule. The only landings available were caught as bycatch of a shrimp trawl in 2005 and 14 kg were landed. Landings from Subarea 6-1 with the three-party rule applied occurred as bycatch from the shrimp by trawl survey in 2004 and from prawn and shrimp traps in 1998, 1999, 2001, 2003 and 2004. Vessel effort data suggest that there is no target octopus fishery in Subarea 6-1 and therefore all landed octopus are bycatch (Marine Fisheries TDR).
3 Catch ceiling is the total allowable catch defined by a pre-season biomass forecast, or survey biomass index and harvest rate of 25% to 33%, or defined by an arbitrary precautionary quota. The action level is determined when action, such as a fishery closure, occurs (DFO 2008d).

Sec. 52 Application Volume 6B: Environmental and Socio-Economic Assessment (ESA) – Marine Terminal Section 13: Marine Fisheries
May 2010 Page 13-17
The 2008–2009 exploratory fishery was scheduled to open no earlier than August 1, 2008 and close no later than July 31, 2009, with variations within FMAs (DFO 2008e). The minimum individual size limit is 2 kg (DFO 2008e).
13.5.2 FSC Fishery Northern Gateway recognizes the FSC fishery as an important component of the traditional lifeways of Aboriginal groups within the PEAA. Aboriginal groups have long-standing traditions of fishing, gathering and practicing cultural activities in the area. Aboriginal groups in the region continue to depend on these resources for key elements of their diets. Beyond contributing to diet, the marine and coastal environments are spiritually and culturally important.
FSC fisheries are managed through Comprehensive Fishing Agreements and communal licensing regulations. Data available for FSC fisheries were from FMA 6 between 1999 and 2005. Sockeye salmon was the most abundant species landed, followed by other salmon species. Interviews with individuals from participating Aboriginal groups suggest that other species targeted in Subarea 6-1 that are not recorded in the data from DFO include other crab species, cockles, clams, sea urchins, sea cucumber, eulachon, black cod, ling cod and Pacific cod (Marine Fisheries TDR).
Because limited information on the FSC fishery is available, the assessment of effects included in this marine fisheries assessment is based on qualitative and preliminary information.
SOURCE: Marine Fisheries TDR
Figure 13-3 Fisheries Management Areas 6 Aboriginal Catch, 1999 to 2005

Sec. 52 Application Volume 6B: Environmental and Socio-Economic Assessment (ESA) – Marine Terminal Section 13: Marine Fisheries
Page 13-18 May 2010
13.5.3 Commercial-Recreational Fishery
Fishery Overview
Many non-resident anglers and a small percentage of resident anglers will hire a third party to package one or more services, such as travel, accommodation, goods, guiding and equipment, to facilitate their fishing experience. Interviews with five local charter and lodge operators in the Kitimat area indicated that, on average, 52% of customers originated from the United States or other foreign countries, and 32% were Canadian from outside of British Columbia (Marine Fisheries TDR).
The commercial-recreational fishery consists of outfitters, charters and lodges, which are an important component of local tourism industries in Kitimat, and use the waters within the marine PDA and PEAA. The socio-economic contributions from commercial-recreational fishing are important to communities such as Kitimat, Kitamaat Village and Hartley Bay (DFO 2007c).
In British Columbia, total expenditures directly linked to tidal water recreational fishing totalled over Can$360 million in 2005 and included food, lodging, transportation, fishing services and supplies (DFO 2008c, Internet site). The economic stability of the commercial-recreational fishery depends on numbers of fish harvested, as well as maintaining opportunities for fishing and an expectation of catching fish (British Columbia Ministry of Environment 2009, Internet site). Operators are expecting client numbers to be somewhat reduced in 2009. Nonetheless, commercial-recreational fishing remains an important sector of the economy within the PEAA.
Within the PEAA, commercial–recreational fishing occurs in Kitimat Arm and Douglas Channel. The following prime locations have been identified (Marine Fisheries TDR):
• Moon Bay Marina down to Bish Cove (a ‘wall’ area on the western shoreline), popular for the winter chinook run and prawning
• Bish Creek
• Kitimat Arm area leading into all rivers and creeks (Kitimat River, Gilttoyees Inlet and Kildala Inlet)
• Kitimat River Estuary (from the MK Bay Marina, crossing the mouth of the Kitimat River and ending at the Eurocan bulk loading facility)
• “The Docks” (where fishermen weave in and out of the marine docks associated with Eurocan and Rio Tinto Alcan)
• “The Wall” (beginning at Wathlsto Creek and ending at Clio Bay on the eastern shoreline); particularly popular in the spring
Regulatory Management and Licensing Information
Fishers are required to obtain a licence when they are commercial-recreational fishing (i.e., have paid a service to take them fishing). However, under DFO guidelines, this activity is still managed according to recreational fishing rules. These rules are described for the recreational fishery (Section 13.5.4).

Sec. 52 Application Volume 6B: Environmental and Socio-Economic Assessment (ESA) – Marine Terminal Section 13: Marine Fisheries
May 2010 Page 13-19
Target Species and Timing
The charter and lodge operations within the Kitimat area generally operate between May and September, coinciding with salmon migration and the summer months. The most important months of the year are:
• June to August for salmon • February to March for winter (immature) chinook • April to May for specialized fishing • August to September, also for specialized fishing
Targeted species include salmon, halibut and rockfish, primarily caught by trolling and jigging, and invertebrate species such as Dungeness crab and prawn, which are caught using trapping methods.
Migratory runs of salmon begin entering the Kitimat Arm in early May, many on their way back to the Kitimat hatchery, and continue to do so until October (Marine Fisheries TDR). Chinook salmon is a prized catch, being the largest of the salmon species, with the world record standing at 57.27 kg (DFO 2008b, Internet site). Within the PEAA, the peak runs for chinook fishing are June and July. Following the chinook runs are chum and pink salmon, which peak during July and August, then sockeye in August, and coho in September. Steelhead runs peak during April. The commercial-recreational fishery also targets Pacific halibut, rockfish, sea bass, lingcod, and crabs and prawn (among other invertebrate species) on a year-round basis (Alain’s Deep Sea Charter 2005, Internet site; Doorselfin Adventures 2008, Internet site; Eagle Edge Ocean Charters and Guiding 2008, Internet site; Nautical West Adventures 2008, Internet site; Tookus Inn Lodge 2008, Internet site; King Pacific Lodge 2009, Internet site; Reliable Guide and Charter Ltd. 2009, Internet site; Steelhead Heaven 2009, Internet site).
13.5.4 Recreational Fishery The assessment of the recreational fishery focuses on FMA 6. Subarea information is not systematically collected. Where possible, reference to these areas is made from information collected through interviews, literature and websites.
Fishery Overview
British Columbia offers a relatively healthy wild fish and shellfish resource and a comparatively natural environment that attracts anglers from around British Columbia, elsewhere in Canada and worldwide. As of 2005, 4% of the population of British Columbia were active tidal (saltwater) anglers, with an overall participation of 106,300 anglers (resident, Canadian and international).
Northern Gateway recognizes recreational fishing is an important activity and source of food for many local residents and tourists. Recreational fishing holds worldwide importance in the Kitimat Arm area and attracts local, Canadian and international anglers every year. Fishing locations are similar to those of the commercial–recreational fishers. Surveys of local charter operators indicate that there are prime recreational fishing spots near the marine terminal and in the PEAA. These include all shoreline areas within 25 to 30 nautical miles from the MK Bay Marina, “The Wall” on the eastern shoreline, and Moon Bay Marina down to Bish Cove, (which coincides with the marine terminal area on the eastern shoreline of the Kitimat Arm). These areas are used at different times of the year. For example, “The Wall” is

Sec. 52 Application Volume 6B: Environmental and Socio-Economic Assessment (ESA) – Marine Terminal Section 13: Marine Fisheries
Page 13-20 May 2010
popular during the spring and the Moon Bay Marina down to Bish Cove area is popular in the winter (Marine Fisheries TDR).
Recreational fishing has an economic component, because major and minor purchases, as well as trip costs, are required for an individual to be an active angler. Major purchases and investments wholly attributable to recreational fishing included vehicles, boating equipment and camping gear. The total purchases and investments by active tidal water anglers in British Columbia was over Can$260 million in 2005 (DFO 2008c, Internet site).
Regulatory Management and Licensing Information
Under the Fisheries Act, DFO is responsible for the day-to-day management of tidal recreational fisheries (marine fisheries). The management framework for the fishery takes into consideration the status of the fish and invertebrate stocks commonly targeted by recreational fishers, and the importance of the activity for both social and subsistence gain to local fishing communities and fishers from out of town. DFO is responsible for the following aspects of the fishery (DFO 2007a):
• opening and closing times for species • the fishing gear allowed • limits for both size and pieces (fish or invertebrates) that each fisher is allowed to take • packing and travel guidelines
Licensing data are available, as anglers are required to obtain a tidal waters sport fishing licence to fish on the coast of British Columbia. Annual or one- to five-day licences are available, valid in all tidal waters on the British Columbia coast. The total number of active anglers in British Columbia in 2005 was 276,194 with the total number of days fished in 2005 exceeding 2 million (DFO 2008c, Internet site).
Recreational Catch Statistics
Government management programs and strategies emphasize the importance of engaging all stakeholders (DFO 2008c, Internet site). DFO collects recreational effort and catch data via creel surveys, lodge logbooks and other sources. Data are often combined (e.g., north and central coast, which covers statistical areas 1 to 10, and the Georgia Strait, which covers statistical areas 13 to 19, 28 and 29). Recreational catch data by subarea is not available. The method of data collection and units used varies (DFO 2005, Internet site), making it difficult to accurately quantify baseline conditions, and complete an assessment of effects of the marine terminal on recreational fishing.
Data for recreational fishing was provided between 1999 and 2007 (in contrast to that of the commercial data from 1998 to 2008). The three main species caught recreationally in British Columbia tidal waters are chinook, coho and pink salmon (DFO 2007c). Consistent with the overall British Columbia catch, chinook and coho are two most commonly caught species in FMA 6, followed by rockfish species (see Figure 13-4) (DFO 2005, Internet site). Several other species and groups of fish are also targeted in FMA 6 (see Figure 13-4).

Sec. 52 Application Volume 6B: Environmental and Socio-Economic Assessment (ESA) – Marine Terminal Section 13: Marine Fisheries
May 2010 Page 13-21
SOURCE: Marine Fisheries TDR
Figure 13-4 Fisheries Management Area 6 Recreational Catch, 1998 to 2007
13.6 Effects on Marine Fisheries from Restriction of Access to Fishing Grounds
The effects from restriction of access to fishing grounds apply to all of commercial, FSC, commercial-recreational and recreational fisheries. Therefore, they are not discussed separately in the effects assessment.
13.6.1 Baseline Conditions Species targeted by marine fisheries in the PEAA are salmon, Pacific halibut, groundfish, prawn, shrimp (by trap and trawl), red sea urchin and octopus. The periods during which these species are harvested commercially are:
• salmon – July and August • Pacific halibut – March to November • groundfish – throughout the year • prawn and shrimp by trap – May to June • shrimp by trawl – throughout the year • red sea urchin – throughout the year • octopus – throughout the year

Sec. 52 Application Volume 6B: Environmental and Socio-Economic Assessment (ESA) – Marine Terminal Section 13: Marine Fisheries
Page 13-22 May 2010
Recreational fishing for most species continues year round, whereas species such as salmon might be subject to timing and limit restrictions. The restrictions are determined by DFO, based on several factors, including closures for conservation, limits associated with certain species such as salmon and some groundfish, and the presence of algae responsible for paralytic shellfish poisoning.
In terms of landings weights and financial value, the salmon fishery is the most important commercial fishery in Subarea 6-1 (i.e., the PEAA) (Marine Fisheries TDR). The fishery is targeted using gill and purse seine nets and is open for restricted periods between July and August (DFO 2008c).
13.6.2 Effects on Marine Fisheries from Restriction of Access to Fishing Grounds
13.6.2.1 Effects Mechanisms
Throughout the life of the Project, only project-related vessels will have permission to operate within the marine PDA. As a result, marine fishers will not have access to the marine PDA until the site is decommissioned.
13.6.2.2 Mitigation and Effects Management
Northern Gateway intends to form and maintain an FLC to develop specific measures and protocols to limit the effects of restricted access on marine fisheries. To be effective, FLC membership should include a broad range of fishers representing the four component fisheries of the marine fisheries VEC. The issues to be addressed by the FLC will vary depending on the type of fishery being discussed.
13.6.2.3 Project Residual Effects
See Table 13-4 for a summary of the residual effects of the restriction of access to fishing grounds on marine fisheries.
Because of the restricted and often unpredictable timing of the salmon fishery, the potential for environmental effects is considered greater than for other species (e.g., a fishery could be opened for a short duration, based on abundance, concomitantly with scheduled tanker traffic through the PEAA or PDA). Other fisheries in the area are generally open longer, often year round. Assessment of effects on marine fisheries focuses on the commercial salmon fishery, with some consideration for other species known to be fished in the PEAA.

Sec. 52 Application Volume 6B: Environmental and Socio-Economic Assessment (ESA) – Marine Terminal Section 13: Marine Fisheries
May 2010 Page 13-23
Table 13-4 Characterization of the Residual Effects on Marine Fisheries from Restriction of Access to Fishing Grounds
Activity Direction
Additional Proposed Mitigation/ Compensation
Measures
Residual Environmental Effect
Magnitude
Geographic Extent
Duration/
Frequency
Reversibility
Significance Potential
Measurable Contribution to
Regional Cumulative
Environmental Effects
All Phases Inwater infrastructure PDA
Adverse • FLC • Framework2 • Information booklet3 • Marine traffic guide4 • EPMP5
L S L/C R N N
Mitigation: 1. Fisheries liaison committee: Northern Gateway proposes establishing a fisheries liaison committee so that there is effective communication
and cooperation between the marine terminal operators and marine fisheries. The committee would provide a forum for the communication and discussion of any issues relating to the Project.
2. Framework: A format or framework for working with the local fishing community will be established, for discussing measures to be undertaken by involved parties for minimizing the potential for adverse effects.
3. Information booklet: In consultation with the appropriate agencies, Northern Gateway will prepare a booklet with details about navigational and safety requirements that will apply when the marine terminal is operational.
4. Northern Gateway marine traffic guide: A marine traffic guide will be produced and the tankers and all marine terminal associated vessels will adhere (within the limits of ship and navigational safety) to the requirements of the guide.
5. EPMP: The EPMP provides the protection measures developed by Northern Gateway for routine activities associated with construction. The Construction EPMP lists mitigation measures to be implemented in all areas of construction to limit potential effects, and has compliance and effects monitoring programs (see Volume 7A).

Sec. 52 Application Volume 6B: Environmental and Socio-Economic Assessment (ESA) – Marine Terminal Section 13: Marine Fisheries
Page 13-24 May 2010
Table 13-4 Characterization of the Residual Effects on Marine Fisheries from Restriction of Access to Fishing Grounds (cont’d)
Follow-up and Monitoring: Incident Records: Records of all reported fishing gear loss or damage will be maintained and reviewed on a regular basis. Pacific salmon and Pacific herring distribution monitoring: A monitoring program will be developed in consultation with regulators and in
conjunction with other users of the upper Kitimat Arm. KEY Magnitude: N Negligible: No measurable
adverse effects anticipated L Low: Potential disruption of
the fishery for less than 10% of the duration of the fishery opening where overall resource viability is not anticipated to be reduced
M Moderate: Potential disruption of fishery for between 10% and 20% of the duration of the opening
H High: Potential disruption of the fishery for greater than 20% of the duration of the opening
Geographic Extent: S Site-specific: the marine PDA C Confined to the immediate area
through which the vessel is passing at any given time
L Local: the PEAA R Regional: beyond the PEAA
Duration: S Short term: Effects limited to
openings during one calendar year. M Medium term: Effects extend for two
years to five years following the disturbance.
L Long term: Effects extend past five years.
P Permanent: Effects are permanent
Frequency: O Occurs once. S Occurs at sporadic
intervals. R Occurs on a regular
basis and at regular intervals.
C Continuous.
Reversibility: R Reversible I Irreversible
Significance: S Significant N Not Significant
Potential Contribution to Regional Cumulative Effects: Yes Project-related effects on
marine fisheries are likely to contribute significantly to regional cumulative changes on marine fisheries in the PEAA
No Project-related effects on marine fisheries are not likely to contribute significantly to regional cumulative changes on marine fisheries in the PEAA

Sec. 52 Application Volume 6B: Environmental and Socio-Economic Assessment (ESA) – Marine Terminal Section 13: Marine Fisheries
May 2010 Page 13-25
The commercial salmon fishery is open for restricted periods during July and August and attracts a large number of vessels to the PEAA (Marine Fisheries TDR). The exclusion of marine fishers from the marine PDA is expected to reduce the size of the total available fishing area within the PEAA by a small amount (i.e., the total area of the marine PDA is less than 1% of the area of the PEAA).
The extent of commercially used fixed fishing gear in the marine PDA is unclear. However, during interviews in October 2005, commercial fishers indicated that traps for prawns were used in coastal areas near Kitimat and Douglas Channel, generally from May to mid-July (Marine Fisheries TDR). Landings data show shrimp are taken by trap and trawl in Subarea 6-1. However, the exact locations of these commercial fishing activities in relation to the marine PDA are unknown. Subarea 6-1 is closed to commercial crab fishing (DFO 2009c), and although some octopus are taken in Subarea 6-1, the locations and landings are not available (Marine Fisheries TDR). These limitations reflect the confidentiality associated with the three-party rule and the lack of spatial data that represents the locations of fishing spots and effort.
Construction and operations of the marine terminal are also predicted to affect the commercial-recreational and recreational, and to some extent the commercial and FSC fisheries within the PDA. Although there are insufficient or incomplete data that accurately describe catch or effort expended in marine fisheries within the PDA, the alienation of the Moon Bay Marina to Bish Cove area, popular with anglers, will affect a portion of the commercial-recreational and recreational fisheries. However, numerous other areas along the west bank of the PEAA and PDA approaches will continue to be available to provide opportunities to all marine fishery components.
Project effects on invertebrates and fish were assessed elsewhere (see Sections 9 and 10) and were determined to be not significant.
Based on these observations and conclusions, the potential effects of the Project on the four component marine fisheries within the PDA and PEAA are considered to be of low magnitude.
After decommissioning, as marine fisheries will be able to resume fishing within the former marine PDA, the effect will be reversible. Liaison with the fishing community and terminal management procedures (FLC and Northern Gateway marine traffic guide) will be used to reduce the potential for interference with fishing activities throughout the life of the Project.
After the application of mitigation measures, it is assumed there will be alternative fishing grounds and management strategies to work with fishers and to help avoid potential effects. As a result, effects of restricted access by the Project on the four component marine fisheries are predicted to be not significant.
13.6.3 Cumulative Effects Implications Several facilities are located on the foreshore areas of the PEAA including:
• the Port of Kitimat
• two commercial marinas
• the wharfs and marine structures from the Kitimat aluminum smelter and terminal of Rio Tinto Alcan Primary Metal British Columbia (Rio Tinto Alcan)

Sec. 52 Application Volume 6B: Environmental and Socio-Economic Assessment (ESA) – Marine Terminal Section 13: Marine Fisheries
Page 13-26 May 2010
• the Eurocan Pulp and Paper Co. plant and terminal (scheduled to cease operations in 2010)
• the Methanex Corporation plant and terminal
• numerous other small wharfs and jetties
The Project will limit marine fisher access in the marine PDA.
Two approved projects are proposed in the Kitimat area: the Kitimat LNG Terminal and Arthon Construction Ltd. and Sandhill Materials’ Sandhill Project. The Kitimat LNG Project is at Bish Cove, and the others are located within the developed area of the Kitimat harbour. There is one future case project: Kitimat-Summit Lake Natural Gas Pipeline Looping Project, proposed by Pacific Trail Pipelines. The construction schedules for the Kitimat LNG terminal, and the Arthon Construction Ltd. and Sandhill Materials Project are not known, but it is assumed that they will be complete and operational before the beginning of construction for the Project. Therefore, there is a potential for cumulative effects on potential restriction of access to fishing grounds. Assuming these other developments also have a restricted access zone of a similar size to that of the marine terminal, and that most commercial fishing occurs away from the most developed areas in the upper area of Kitimat Arm, cumulative effects of restricted access to marine fishing areas are anticipated to be not significant. However, Northern Gateway will work with other industrial users in Kitimat Arm and with marine fishers to reduce potential disturbance effects, particularly during peak fishing periods (e.g., the salmon fishery openings).
13.6.4 Prediction Confidence There will be exclusion of an unknown number of recreational fishers from the terminal area including Moon Bay Marina down to Bish Cove, which is a noted fishing area. Although the extent of the PDA is small relative to the PEAA, it may or may not support a disproportionate number of recreational fishers. There is a low level of certainty for the prediction of not significant for project residual effects and cumulative effects of the restriction of access to fishing grounds. Prediction confidence is considered low because little data are available on the locations of fishing sites for marine fisheries (including fish and invertebrates) within the marine PDA. Prediction certainty is expected to increase as further information is obtained about the location and timing of fishing.
13.7 Follow-up and Monitoring for Marine Fisheries In addition to the mitigation measures described, further follow-up and monitoring activities will be implemented by Northern Gateway around their specific requirements while working to limit the potential effect. These additional efforts reflect the broad and complex nature of the four component fisheries, as well as the large variability inherent with landings, fishing effort, and quota assignments from DFO. Given these circumstances and observations, follow-up and monitoring for the four fisheries may include:
• Commercial – Annual landings and identification of fishing areas for salmon will be reviewed. The review period extend through construction (i.e., two years) and at least the first three years of operations (i.e., total of five years), and be subject to adjustment based on the quality of the data and level of certainty the data provide to understanding the commercial fishery. This would be complemented by information obtained from interviews and observations of fishing activities, as well

Sec. 52 Application Volume 6B: Environmental and Socio-Economic Assessment (ESA) – Marine Terminal Section 13: Marine Fisheries
May 2010 Page 13-27
as from the FLC. Landings will be obtained from DFO online, although the delays in reporting and posting the data will require dialogue with commercial fishers, as much as practical given the three-party rule.
• Food, Social and Ceremonial – Follow-up and monitoring recommendations will be supplemented by information from the ATK community reports.
• Commercial-recreational – The monitoring period should be at least five years. This fishery consists of destination lodges and locally guided fishing charters. As this fishery is important to the local economy, the magnitude of the fishery needs to be better understood.
• Recreational – The monitoring period should be at least five years for all recreational species caught and should continue through construction and part of operations, until environmental effects predictions can be confidently reached and demonstrated. The types of activities will include creel surveys, observations of fishing activities, discussions with fishers as part of the FLC, and obtaining data from DFO for recreational fishing. Discussions with the Sport Fishing Advisory Council and individuals from Sport Fishing BC could also be valuable.
Although the effects on marine fisheries from aesthetic and auditory disturbance are considered not significant (Volume 6C, Section 5), it is recognized that the presence of the terminal and project-related vessels will detrimentally affect the quality of experience for some fishers. Therefore, Northern Gateway will work with the FLC to identify measures to limit negative sensory disturbances.
Follow-up and monitoring are considered conceptual at this stage, and refinements are expected in the context of adaptive management as further information is obtained.
Close integration of the monitoring programs for marine invertebrates, marine fish and marine fisheries will be necessary to optimize the effectiveness and the quality of the monitoring programs.
13.8 Summary of Environmental Effects on Marine Fisheries The residual effects of the restriction of access to fishing grounds on marine fisheries are considered to be not significant. This assessment is based on the current understanding of the project components and level of marine fishing in the marine PDA and PEAA.
The highest risk of project interference with fishing activities will occur during construction, particularly when dredging, blasting and site preparation are underway. Northern Gateway will implement mitigation measures to reduce potential effects.
See Table 13-5 for a summary of the assessment of project-related effects on marine fisheries during routine marine terminal construction, operations and decommissioning.

Sec. 52 Application Volume 6B: Environmental and Socio-Economic Assessment (ESA) – Marine Terminal Section 13: Marine Fisheries
Page 13-28 May 2010
Table 13-5 Summary of Residual Environmental Effects on Marine Fisheries
Potential Environmental
Effect Mitigation Measures
Residual Environmental Effect
Magnitude Geographic
Extent Duration/
Frequency Reversibility Significance Prediction
Confidence Construction Restriction of access to fishing grounds
• FLC3 • Information booklet4 • Marine traffic guide5
L S L/C R N M
Operations Restriction of access to fishing grounds
• FLC3 • Information booklet4 • Marine traffic guide5
L S L/C R N M
Decommissioning Restriction of access to fishing grounds
• FLC3 • Information booklet4 • Marine traffic guide5
L S S/C R N M

Sec. 52 Application Volume 6B: Environmental and Socio-Economic Assessment (ESA) – Marine Terminal Section 13: Marine Fisheries
May 2010 Page 13-29
Table 13-5 Summary of Residual Environmental Effects on Marine Fisheries (cont’d)
Potential Environmental
Effect Mitigation Measures
Residual Environmental Effect
Magnitude Geographic
Extent Duration/
Frequency Reversibility Significance Prediction
Confidence Cumulative Environmental Effects Restriction of access to fishing grounds
• EPMP1 • Limit area of disturbance in
marine PDA2 • FLC3 • Information booklet4 • Marine traffic guide5 • Variable level blasting6 • Work windows7 • Dredge technology8
L L S/C R N L

Sec. 52 Application Volume 6B: Environmental and Socio-Economic Assessment (ESA) – Marine Terminal Section 13: Marine Fisheries
Page 13-30 May 2010
Table 13-5 Summary of Residual Environmental Effects on Marine Fisheries (cont’d) Mitigation: 1. EPMP: The Construction EPMP lists mitigation measures to be implemented in all areas of construction, to reduce potential effects, and has
compliance and effects monitoring programs. 2. Limit area of disturbance in the marine PDA: Dredging and blasting will be limited to that which is absolutely necessary to complete
construction. 3. Fisheries Liaison Committee: Northern Gateway proposes establishing an FLC so that there is effective communication and cooperation
between the marine terminal operators and marine fisheries. The committee would provide a forum for the communication and discussion of any issues relating to the Project. The committee would be provided with project information, which may have an impact on fisheries operations.
4. Information booklet: In consultation with the appropriate agencies, Northern Gateway will prepare a booklet with details about the vessel navigational and safety requirements that will apply when the terminal is operational.
5. Northern Gateway marine traffic guide: A marine traffic guide will be produced and the tankers and all project-related vessels will adhere (within the limits of ship and navigational safety) to the requirements of the plan.
6. Blasting Plan: A blasting plan will consider sensitive species and life stages. 7. Work windows: Regulatory approved work windows will be observed for inwater activities such as dredging and blasting. Work windows are
determined in consultation with DFO in order to reduce potential effects on sensitive species such as spawning fish and eelgrass. 8. Dredge technology: Use of a dredging system to limit sediment effects, where practical. Follow-up and Monitoring: Catch and effort will be monitored for recreational and commercial-recreational fisheries from before construction through to at least the first three years of operations.

Sec. 52 Application Volume 6B: Environmental and Socio-Economic Assessment (ESA) – Marine Terminal Section 13: Marine Fisheries
May 2010 Page 13-31
Table 13-5 Summary of Residual Environmental Effects on Marine Fisheries (cont’d) KEY Magnitude: N Negligible: No measurable
adverse effects anticipated L Low: Affects a specific group
of localized individuals within a population but does not affect other trophic levels or the population itself
M Moderate: Affects a portion of a population and may change its abundance and/or distribution over one or more generations, but does not threaten the integrity of that population or any population dependent upon it
H High: Causes a decline in abundance/ distribution of an entire population or species, beyond which natural recruitment would not return that population or species, or any population or species dependent upon it, to its former level within several generations
Geographic Extent: S Site-specific: the marine PDA L Local: the PEAA R Regional: the CCAA
Duration: S Short term: Effects
noticeable during construction and decommissioning
M Medium term: Effects noticeable less than two years after construction is complete
L Long term: Effects noticeable more than two years after construction is complete
P Permanent: Effects are permanent
Frequency: O Occurs once S Occurs at sporadic intervals R Occurs on a regular basis
and at regular intervals C Continuous
Reversibility: R Reversible I Irreversible
Significance: S Significant N Not Significant
Prediction Confidence: H High M Moderate L Low

Sec. 52 Application Volume 6B: Environmental and Socio-Economic Assessment (ESA) – Marine Terminal Section 13: Marine Fisheries
Page 13-32 May 2010
13.9 References
13.9.1 Literature Cited DFO (Fisheries and Oceans Canada). 2007a. 2007–2009 British Columbia Tidal Waters Sport Fishing
Guide. Vancouver, BC.
DFO. 2007b. Pacific Region, Exploratory Fishery Guidelines, Octopus by Dive, August 15, 2007 to July 31, 2008. Fisheries and Oceans Canada, Pacific Region. Vancouver, BC.
DFO. 2007c. Survey of Recreational Fishing in Canada, 2005. Economic Analysis and Statistics Policy Sector, Fisheries and Oceans Canada. Ottawa, ON.
DFO. 2008a. Pacific Region Integrated Fisheries Management Plan, Prawn and Shrimp by Trap, May 1, 2008 to April 30, 2009. Fisheries and Oceans Canada, Pacific Region. Vancouver, B.C.
DFO. 2008b. Commercial Fisheries Landings Statistics. Unpublished dataset.
DFO. 2008c. Pacific Region, Integrated Fisheries Management Plan, Salmon Northern B.C., June 1 2008 to May 31, 2009. Fisheries and Oceans Canada, Pacific Region. Vancouver, BC.
DFO. 2008d. Pacific Region, Integrated Fisheries Management Plan, Shrimp Trawl, April 1, 2008 to March 31, 2009. Fisheries and Oceans Canada, Pacific Region. Vancouver, BC.
DFO. 2008e. Pacific Region, Integrated Fisheries Management Plan, Exploratory Fishery Guidelines, Octopus by Dive, August 1, 2008 to July 31, 2009. Fisheries and Oceans Canada, Pacific Region. Vancouver, BC.
DFO. 2009a. Pacific Region, Integrated Fisheries Management Plan, Groundfish, February 21, 2009 to February 20, 2010. Fisheries and Oceans Canada, Pacific Region. Vancouver, BC.
DFO. 2009b. Pacific Region, Integrated Fisheries Management Plan, Prawn and Shrimp by Trap, May 1, 2009 to April 30, 2010. Fisheries and Oceans Canada, Pacific Region. Vancouver, BC.
DFO. 2009c. Pacific Region, Integrated Fisheries Management Plan, Crab by Trap, January 1, 2009 to December 31, 2009, Fisheries and Oceans Canada, Pacific Region. Vancouver, BC.
Government of Canada. 1993. Pacific Fishery Regulations, 1993. (SOR/93-54). Department of Justice. Ottawa, ON.
Triton Consultants Ltd. 2010. Marine Fisheries Technical Data Report. Prepared for: Northern Gateway Pipelines Inc. Calgary, AB.
13.9.2 Internet Sites Alain's Deep Sea Charter. 2005. Douglas Channel. Accessed: May 2009. Available at:
http://www.alaindeepseacharter.com/douglas.html
British Columbia, Ministry of the Environment. 2009. Recreational Freshwater Fishing. Accessed: March 12, 2009. Available at: http://www.env.gov.bc.ca/fw/fish/
Sec. 52 Application Volume 6B: Environmental and Socio-Economic Assessment (ESA) – Marine Terminal Section 13: Marine Fisheries
May 2010 Page 13-33
DFO. 2005. Recreational Catch Statistics. Accessed: March 12, 2009. Available at: http://www-sci.pac.dfo-mpo.gc.ca/sa/Recreational/default_e.htm
DFO. 2008a. Summary of Commercial Statistics. Accessed: December 2008. Available at: http://www-sci.pac.dfo-mpo.gc.ca/sa/Commercial/AnnSumm_e.htm
DFO. 2008b. Do you know: Chinook Salmon? Accessed: March 2009. Available at: http://www.pac.dfo-mpo.gc.ca/species/salmon/salmon_facts/chinook_e.htm
DFO. 2008c. Welcome to Recreational Fishing in the Pacific Region. Accessed: March 16, 2009. Available at: http://www.pac.dfo-mpo.gc.ca/recfish/default_e.htm
DFO. 2008d. Underwater World-Selected Shrimps of British Columbia. Accessed: May 13, 2009. Available at: http://www.dfo-mpo.gc.ca/zone/underwater_sous-marin/shrimp/shrimp-crevette-eng.htm
DFO. 2009. Summary Commercial Statistics. Available at: http://www-sci.pac.dfo-mpo.gc.ca/sa/Commercial/AnnSumm_e.htm Accessed: December 2008.
Doorselfin Adventures. 2008. Fishing Calendar. Accessed: May 2009. Available at: http://www.doorselfinadventures.com/doorselfincalendar.html
Eagle Edge Ocean Charters and Guiding. 2008. Ocean Probabilities. Accessed: May 2009. Available at: http://eagleedge.net/eagleedgepackages.html
King Pacific Lodge. 2009. Seasonal Activity and Wildlife Calendar. Accessed: May 4, 2009. Available at: http://www.kingpacificlodge.com/kpl_activity_chart.pdf
Nautical West Adventures. 2008. Fish Species Calendar. Accessed: May 4, 2009. Available at: http://www.nauticalwest.com/species-calendar.htm
Reliable Guide and Charter Ltd. 2009. Freshwater-Saltwater Drift Boat and Jetboat Charters. Accessed: May 4, 2009. Available at: http://geocastle.com/kitimat/reliablecharters.htm#top.
Steelhead Heaven. 2009. Fishing Season. Accessed: May 4, 2009. Available at: http://www.steelheadheaven.com/seasons.htm
Tookus Inn Lodge. 2008. Regional Information and Links; Fish, Activities and Local Wildlife. Available at: http://www.tookusinn.com/Regional%20Info%20and%20links.htm


Sec. 52 Application Volume 6B: Environmental and Socio-Economic Assessment (ESA) – Marine Terminal Section 14: Ecological Risk Assessment for Routine Activities Associated with the Kitimat Terminal
May 2010 Page 14-1
14 Ecological Risk Assessment for Routine Activities Associated with the Kitimat Terminal
This section summarizes the results of the marine environment ecological risk assessment (marine ERA) for the Kitimat Terminal. Detailed results are provided in the Marine Ecological Risk Assessment for Kitimat Terminal Operations Technical Data Report (TDR; Stephenson et al. 2010).
The marine ERA explains risks that the routine operational activities at the Kitimat Terminal might pose to the ecological health of the marine environment in Kitimat Arm.
This marine ERA evaluates the ecological risks from:
• volatile hydrocarbon and trace element emissions from tanks and valves
• hydrocarbon and trace element emissions from berthed vessel engines
• liquid effluent emissions from the marine terminal arising from normal operations and site-wide storm water runoff
14.1 Fundamentals of Risk Assessment ERA is defined as a process that evaluates the likelihood that adverse ecological effects may occur or are occurring as a result of exposure to one or more ecological stressors (United States Environmental Protection Agency [U.S. EPA]1998). Typically, ERAs evaluate chemical and non-chemical stressors and to support appropriate environmental decision-making. Ecological stressors may be chemical, physical or biological. For this marine ERA, the stressors considered are chemical substances that might be released to the environment because of routine operational activities at the Kitimat Terminal.
Any chemical might cause an adverse environmental effect, but the following three key factors must be present for a risk to be realized:
• a chemical that might be an environmental hazard • a receptor organism of that chemical, which might be affected • environmental pathways that cause the receptor organism to be exposed to the hazard
However, even when all three factors are simultaneously present, considerations such as chemical concentrations, duration of exposure, and the specific pathways by which ecological receptors are exposed to chemicals determine whether there might be an adverse environmental effect.
To quantify the potential for ecological risk, a standard ERA methodology is followed (U.S. EPA 1998; Canadian Council of Ministers of the Environment [CCME] 1996, 1997). This methodology includes:
• problem formulation (including resource identification) • exposure assessment • hazard assessment • risk characterization • discussion of certainty and confidence in the predictions • statement of conclusions

Sec. 52 Application Volume 6B: Environmental and Socio-Economic Assessment (ESA) – Marine Terminal Section 14: Ecological Risk Assessment for Routine Activities Associated with the Kitimat Terminal
Page 14-2 May 2010
14.2 Approach The approach to completing an ERA for the operations of the Kitimat Terminal consists of the following steps:
• identification of an appropriate geographic area • development of modelling examples • identification of chemicals of potential concern (COPC) emitted to the marine environment • approach to modelling of loadings of COPCs • approach to completing the exposure assessment • approach to completing the hazard assessment
Risk assessments are conducted using conservative assumptions, which tend to overestimate exposure and risk, and are intended to be iterative or tiered in application. Therefore, if a preliminary ERA finds that wildlife exposures to COPCs are below levels considered to cause risk, it is unlikely that adverse effects will occur. However, if the finding in a preliminary ERA is that wildlife exposures may exceed levels considered safe, that does not necessarily mean that adverse effects will occur. Rather, an additional detailed analysis is advisable to determine more precisely whether the preliminary conclusion withstands more rigorous and less conservative analysis.
For modelling specific effects on the marine environment and biological receptors, an operational life of 50 years is assumed for the Kitimat Terminal.
14.2.1 Spatial Boundary The highest level of chemical emissions from the Kitimat Terminal into the marine environment would be in the Kitimat Arm area, extending north to the town of Kitimat and approximately 5 km south of the Kitimat Terminal to Clio Bay and Emsley Cove (see Figure 14-11
1 The south boundary of the Emsley Point compartment in Figure 14-1 does not match the PEAA south boundary because the compartment modelling exercise was done before the PEAA boundary was established.
). This is the project effects assessment area (PEAA) for the marine ERA.
The PEAA is subdivided into five marine water compartments (K1 – Kitimat Arm 1; K2 – Kitimat Arm 2; T – Terminal; CB – Clio Bay; and EP – Emsley Point, which are further subdivided into surface and deep layers) that are delineated using prominent geographical features and professional judgement (see Figure 14-1). Five additional compartments beyond the boundaries of the PEAA are considered for modelling purposes (CO – West Side of Coste Island; AP – Amos Passage; KA – Kildala Arm; NS – Nanakwa Shoal; and DC – Douglas Channel). The concentrations of chemicals of potential concern (COPCs) in the water and sediment of each model compartment are determined using a marine water quality model and a marine sediment quality model, respectively.

NS
CO
EP
T
K2
K1
AP KA
DC
CB
100 m
300
m
200 m
100
m
200 m
100 m
200 m
100
m
100
m
100
m
100 m300 m
200 m
100
m
200
m
100 m
100
m
200 m
100
m10
0 m
200 m
Pipeline Route
Security Fence
Terrestrial PDA
Marine PEAA
Water QualityCompartment Boundary
Watershed Boundary
Bathymetric Contour (100 m)
Railway
Road
NP
Jacques Whitford AXYS Ltd.
FIGURE NUMBER:
PROJECTION:
CONTRACTOR: DATE:
AUTHOR: APPROVED BY:PREPARED FOR:PREPARED BY: SCALE:
ENB R ID GE N OR TH ER N GA TEW A Y PR OJ EC T
NAD 83DATUM:
UTM 9
CM
KitamaatVillage
Emsley Cove
14-1
1:220,000
20091029
Marine Water QualityModel Compartments
CosteIsland
Kitimat Terminal
Gobeil Bay
Clio Bay
Kitimat
MaitlandIsland
LorettaIsland
Reference: Pipeline Route R
0 1 2 3 4 5
Kilometres
JWA-1048334-1627
R:\2
009F
isca
l\104
8334
_Nor
ther
nGat
eway
_ES
A_2
009

Sec. 52 Application Volume 6B: Environmental and Socio-Economic Assessment (ESA) – Marine Terminal Section 14: Ecological Risk Assessment for Routine Activities Associated with the Kitimat Terminal
Page 14-4 May 2010
Each model compartment is considered as a potential marine ecological resource location, where marine biota identified as selected representative species may be exposed to COPCs in the environment. The representative species include marine plants benthic invertebrates, fish, marine birds, a shore bird, marine mammals and a semi-aquatic mammal living along the shoreline. Risks to the representative species arising from exposure to COPCs are considered individually and collectively to determine whether there may be adverse environmental effects of the Kitimat Terminal operations on the marine environment.
14.2.2 Cumulative Assessment Cases Only the operations of the Kitimat Terminal are considered because emissions to the marine environment from construction and decommissioning are unrelated to the handling and storage of hydrocarbons.
Three cases are evaluated:
• Base Case: existing conditions and industry in the region, before the construction and operations of the Kitimat Terminal
• Project Case: the Kitimat Terminal in isolation, to assess the potential environmental effects of the Kitimat Terminal alone
• Application Case: the combination of the Base and Project cases and is intended to assess the potential environmental effects of the Kitimat Terminal in combination with other past or existing sources in the PEAA
This marine ERA does not attempt to provide a cumulative environmental effects arising from the construction, operations, or decommissioning of other projects that may presently be in the planning stages, since the data required to evaluate such projects quantitatively are not available.
14.2.3 Potential COPC Emissions from the Marine Terminal into the Marine Environment
Two main release pathways for COPCs are considered: atmospheric release and liquid effluent discharge. Air dispersion models and water quality models are used to estimate the potential loadings of COPCs in different geographic areas within the PEAA.
14.2.3.1 Atmospheric Release
Low levels of COPCs will be released to the atmosphere because of volatile hydrocarbon and trace element losses from hydrocarbon tanks, the network of transfer pipelines, and emissions from marine vessel engines while tankers are berthed. Concentrations of these substances in air and deposition rates to soil and the marine environment are estimated conservatively at selected locations within the PEAA.
The air emission sources assumed in modelling include 16 hydrocarbon tanks (containing diluted bitumen, synthetic oil, or condensate), two large marine vessels while berthed (one very large crude carrier class tanker for oil and one Suezmax class tanker for condensate) and six escort or harbour tugs. The marine vessels are assumed to be fuelled by No. 6 bunker C with a sulphur content of 2.7%.

Sec. 52 Application Volume 6B: Environmental and Socio-Economic Assessment (ESA) – Marine Terminal Section 14: Ecological Risk Assessment for Routine Activities Associated with the Kitimat Terminal
May 2010 Page 14-5
14.2.3.2 Liquid Effluent Discharge
For COPCs associated with liquid effluent discharge, chemicals are screened based upon chemical analyses of representative hydrocarbon samples, followed by an analysis that takes into consideration:
• oil in water concentration after treatment by an oil-water separator
• the relative solubility of various hydrocarbon fractions
• the potential for hydrocarbons to weather in the impoundment reservoir or the firewater reservoir, before being discharged
All polycyclic aromatic hydrocarbon (PAH), as well as benzene, toluene, ethylbenzene, xylene (BTEX) and total petroleum hydrocarbon (TPH) compounds are carried forward as COPCs regardless of concentrations measured in the representative hydrocarbon samples. In addition, substances exhibiting concentrations in the marine environment in exceedance of guidelines criteria (as part of the Base Case), are also considered as COPCs. All COPCs modelled in this risk assessment are presented in Table 14-1.
Even with best practices in place, low levels of liquid hydrocarbon release to the environment may be unavoidable during operations. Such releases will be recovered and recycled to the extent possible, and solids will be disposed of in an appropriate manner. Any associated water will be directed to the impoundment reservoir used to manage surface water runoff from the tank and manifold areas of the tank terminal. Water from the impoundment reservoir may be sent to the firewater reservoir. Excess water from the impoundment and firewater reservoirs will be tested to confirm that the concentration of oil is less than 15 parts per million (ppm), before its discharge into the marine environment. Excess water will be released through a subtidal, perforated pipe that will be located away from the boomed zone of the berths. Surface water runoff from the area outside the tank and manifold areas will be controlled so that this water will be released outside the boomed zone of the berthing structure, to the extent practical. The concentrations of hydrocarbon and trace element COPCs in this effluent are estimated conservatively also (see Table 14-1).
14.2.3.3 Modelling of Loadings of Chemicals of Potential Concern
Loadings of COPCs to the marine environment from atmospheric deposition are applied to each compartment of the marine water quality model. Loadings of COPCs to the marine environment from liquid effluent discharge are applied to compartments of the marine water quality model that are adjacent to the Kitimat Terminal. Once in the marine environment, COPCs are modelled to disperse throughout the PEAA in response to the effects of tide, freshwater runoff and stratification due to salinity differences.
The marine water quality model simulations extended over a three-year period, taking into consideration realistic tidal and runoff processes. The mean daily seawater concentrations in each model compartment, for each day of a standard year are input to the marine sediment quality model to evaluate the potential for COPCs to accumulate in sediment over a 50-year period. The marine sediment quality model considers two types of sediments: those associated with salt marshes and mudflats in the intertidal zone and those located in the sub-tidal zone. The potential accumulation of COPCs in biota, such as marine plants, marine invertebrates, and fish (possible food or prey for representative species) is considered at the end of the modelling period.

Sec. 52 Application Volume 6B: Environmental and Socio-Economic Assessment (ESA) – Marine Terminal Section 14: Ecological Risk Assessment for Routine Activities Associated with the Kitimat Terminal
Page 14-6 May 2010
Table 14–1 Concentrations of Organic and Trace Element Chemicals of Potential Concern in the Liquid Effluent Discharge
Chemical of Potential Concern
Total Effluent Concentration
(mg/L)
Chemical of Potential Concern
Total Effluent Concentration
(mg/L) Trace Elements PAH
Barium 3.61E-05 1-Methylnaphthalene 3.53E-03 Boron 2.22E-05 2-Methylnaphthalene 2.73E-03 Cadmium 4.06E-07 Acenaphthene N/A Manganese 1.85E-05 Acenaphthylene N/A Molybdenum 4.33E-04 Anthracene 1.34E-04 Nickel 3.19E-03 Benzo(a)anthracene 5.98E-05 Tin 1.29E-04 Benzo(b)fluoranthene N/A Vanadium 8.78E-03 Benzo(k)fluoranthene N/A Zinc 6.40E-06 Benzo(ghi)perylene N/A Phenolic Compounds Benzo(a)pyrene N/A 2.4-dimethylphenol 2.62E-05 Benzo(e)pyrene N/A 2,4-dinitrophenol 9.92E-05 Chrysene N/A Phenol 1.79E-05 Dibenzo(a,h)anthracene N/A TPH Fractions Fluoranthene N/A Aromatics Fluorene 3.05E-04 >C8 – C10 4.53E-01 Indeno(123-cd)pyrene N/A >C10 – C12 5.26E-01 Naphthalene 5.69E-03 >C12 – C16 5.75E-01 Phenanthrene 2.07E-04 >C16 – C21 6.36E-01 Pyrene 2.50E-04 >C21 – C32 1.17E+00 BTEX
Aliphatics Benzene 2.62E-01 >C6 – C8 3.71E+00 Toluene 7.24E-01 >C8 – C10 4.86E-01 Ethylbenzene 1.37E-01 >C10 – C12 4.19E-01 Xylenes (total m,o,p) 6.96E-01 >C12 – C16 8.17E-01 VOC
>C16 – C21 9.25E-01 1,2,4-trichlorobenzene 8.44E-02 >C21 – C32 1.43E+00 1,3,5-trimethylbenzene 4.96E-02
NOTES: BTEX benzene, toluene, ethylbenzene, xylene N/A – not applicable because it was not detected in the representative hydrocarbon samples. PAH polycyclic aromatic hydrocarbon TPH total petroleum hydrocarbon VOC volatile organic compound

Sec. 52 Application Volume 6B: Environmental and Socio-Economic Assessment (ESA) – Marine Terminal Section 14: Ecological Risk Assessment for Routine Activities Associated with the Kitimat Terminal
May 2010 Page 14-7
14.2.4 Exposure Assessment The exposure assessment evaluates the extent to which each representative species will come in contact with COPCs released from the Kitimat Terminal. The amount of contact depends on their habitat preferences, diet, behaviour, body weight, and food and water ingestion rates, as well as the expected fate and transport of the individual COPC in the environment.
To determine the total exposure of each representative species to COPCs, all potential exposure routes are considered simultaneously for COPCs modelled in the marine environment (Figure 14-2). The exposure routes include:
• direct exposure to COPCs in water and sediment for community-level receptors (marine plants fish and invertebrates)
• direct ingestion of water and sediment for the avian and mammalian representative species
• exposure through ingestion of relevant dietary items (e.g., marine plants, invertebrates and fish) for the avian and mammalian representative species
In all model compartments, the potential risk of environmental effects is evaluated for the following aquatic and sediment community-level receptors:
• marine plants exposed to COPCs in water • benthic invertebrates and fish exposed to COPCs in sediment • fish and invertebrates exposed to COPCs in water
The following avian and mammalian representative species are assumed to be exposed to COPCs in each model compartment:
• Bald Eagle (Haliaeetus leucocephalus) - a large, piscivorous bird that seizes prey from the water surface or may feed on carrion)
• Marbled Murrelet (Brachyramphus marmoratus) - a generalist seabird nesting in old-growth forest, but also living on the water surface and feeding on small fish and invertebrates. It is a species at risk.
• Spotted Sandpiper (Actitis macularia) - a shorebird feeding on invertebrates on exposed mudflats and salt marsh sediments
• Surf Scoter (Melanitta perspicillata) - a sea duck feeding on invertebrates in the intertidal zone
• coastal-dwelling American mink (Mustela vison) - a small piscivorous mammal feeding on fish and invertebrates in the intertidal zone
• harbour porpoise (Phocoena phocoena vomerina) - a marine mammal living in the offshore area, and feeding on fish and invertebrates. It is a species at risk.
• Steller sea lion (Eumetopias jubatus) - a marine mammal feeding on fish and invertebrates in the intertidal and nearshore areas. It is a species at risk.
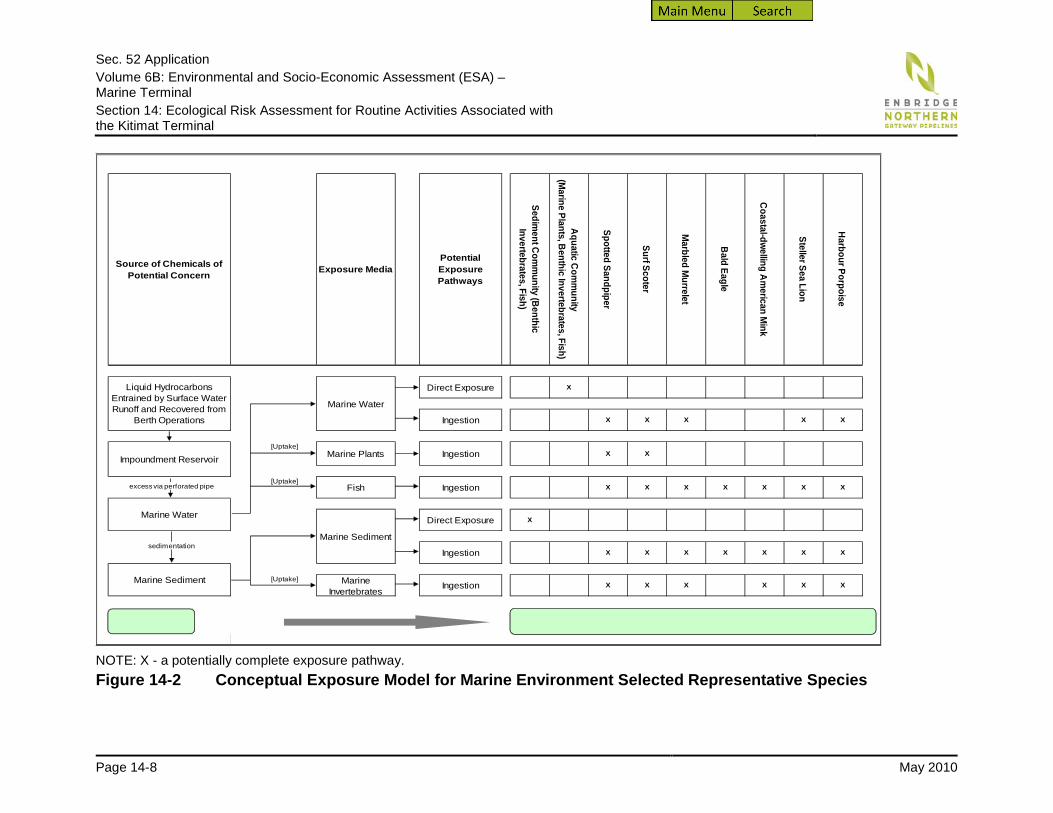
Sec. 52 Application Volume 6B: Environmental and Socio-Economic Assessment (ESA) – Marine Terminal Section 14: Ecological Risk Assessment for Routine Activities Associated with the Kitimat Terminal
Page 14-8 May 2010
Direct Exposure X
Marine Water
Ingestion X X X X X
[Uptake]Marine Plants Ingestion X X
[Uptake]Fish Ingestion X X X X X X X
Direct Exposure X
Marine Sediment
Ingestion X X X X X X X
[Uptake] Marine Invertebrates
Ingestion X X X X X X
N t
Marine Water
Marine Sediment
Liquid Hydrocarbons Entrained by Surface Water Runoff and Recovered from
Berth Operations
Sediment Com
munity (Benthic
Invertebrates, Fish)
Impoundment Reservoir
Exposure MediaPotential Exposure Pathways
Aquatic Comm
unity (M
arine Plants, Benthic Invertebrates, Fish)
Spotted Sandpiper
Surf Scoter
Marbled M
urrelet
Bald Eagle
Coastal-dwelling American M
ink
Steller Sea Lion
Harbour Porpoise
Source of Chemicals of Potential Concern
excess via perforated pipe
sedimentation
NOTE: X - a potentially complete exposure pathway. Figure 14-2 Conceptual Exposure Model for Marine Environment Selected Representative Species

Sec. 52 Application Volume 6B: Environmental and Socio-Economic Assessment (ESA) – Marine Terminal Section 14: Ecological Risk Assessment for Routine Activities Associated with the Kitimat Terminal
May 2010 Page 14-9
14.2.5 Hazard Assessment The hazard assessment identifies the level (exposure concentration or receptor dose) at which COPCs have the potential to cause effects on receptor health. For a representative species, the threshold concentrations or doses above which adverse effects are expected are established in the primary literature, in reports prepared under regulatory sponsorship in various jurisdictions and, in some cases, by regulatory agencies directly. These threshold concentrations are referred to as community benchmarks (for community-level representative species) or toxicity reference values (TRVs) for avian and mammalian representative species. In selecting appropriate effect magnitude benchmarks or TRVs, preference is given to those derived through comprehensive review of effects-based studies. Guidelines such as the CCME water and sediment quality guidelines for the protection of aquatic life are relevant in a generic context, and are used to screen COPC concentrations in water and sediment to determine whether an ERA is required. However, the guidelines are highly conservative in nature and are not suitable as effect magnitude benchmarks.
For avian and mammalian representative species, the potential for adverse effects is quantified by comparing the expected daily dose of each COPC to which an organism is expected to be exposed to the TRV for that COPC. The quotient of the two ([COPC daily dose]/[TRV]) is referred to as a hazard quotient (HQ). An HQ less than 1.0 indicates that the exposure concentration is less than the threshold of toxicity for the COPC evaluated. Given the conservative approach to the estimation of exposure and selection of TRV, an HQ of 1.0 or less is not expected to result in adverse effects, and no further analysis is required. On the other hand, an HQ of greater than 1.0 does not necessarily indicate an unacceptable level of risk. In these cases, values greater than 1.0 indicate that there is a possibility of adverse environmental effects and indicates a need for more careful review of both predicted exposure levels and TRV. As a result, an HQ greater than 1.0 should be interpreted carefully, and further, more focused investigations might be required to provide a more realistic estimate of the level of risk.
14.3 Results of the Marine Ecological Risk Assessment The effect magnitudes for the water and sediment community-level representative species are generally rated as negligible or low for the Base, Project, and Application Cases (Tables 14-2 to 14-4). The only exceptions occur in the Base Case, where benzo(b)fluoranthene (a polycyclic aromatic hydrocarbon) and the trace elements barium, manganese and zinc, are predicted to be present in water at concentrations that could cause moderate effects on aquatic community receptors such as fish and plankton. However, these potential Base Case environmental effects are based on:
• the maximum measured concentration of COPCs in water • the assumption that 100% of the measured concentration of each COPC is bioavailable
In each case, the contribution of the Project Case to the overall Application Case is negligible (i.e., the majority of the observed effect is the result of existing industrial activities in the PEAA).
For avian and mammalian representative species, all calculated HQ values are below thresholds that indicate a potential risk of adverse effect for all cases (Tables 14-5 to 14-7). Further details are provided in the Marine Ecological Risk Assessment for Kitimat Terminal Operations TDR.

Sec. 52 Application Volume 6B: Environmental and Socio-Economic Assessment (ESA) – Marine Terminal Section 14: Ecological Risk Assessment for Routine Activities Associated with the Kitimat Terminal
Page 14-10 May 2010
Three representative species are classified as species at risk: Marbled Murrelet, Steller sea lion and harbour porpoise. HQ values for mammalian and avian representative species for the Base, Project and Application cases are listed in Tables 14-5, 14-6 and 14-7, respectively. For the Marbled Murrelet, the Steller sea lion, and the harbour porpoise, the exposure to trace elements results in the highest HQ values for the Application Case. For both the Steller sea lion and the harbour porpoise, the highest value is from exposure to molybdenum, which is nevertheless below established HQ thresholds for the protection of individuals of species at risk for both species. The Project Case contribution to these HQ values is negligible (less than 0.06% of the total). For Marbled Murrelet, the exposure to trace elements result in the highest HQ values for the Application Case, with the highest value resulting of exposure to nickel, also below the established HQ threshold. The project-related contribution to the nickel HQ is less than 0.06% of the total HQ.
Table 14–2 Base Case Effects Magnitude for Water and Sediment Community-level Selected Representative Species
Constituents Surface Sea
Water Deep Sea Water Nearshore Sediments
Offshore Sediments
BTEX Benzene Negligible a Negligible a Negligible Negligible Ethylbenzene Negligible a Negligible a Negligible Negligible Toluene Negligible a Negligible a Negligible Negligible Xylenes Negligible a Negligible a Negligible Negligible TPH - CCME CWS Aliphatics >C06-C08 - F1 --- b --- b Negligible --- b Aliphatics >C08-C10 - F1 --- b --- b Negligible --- b Aromatics >C08-C10 - F1 --- b --- b Low --- b Aliphatics >C10-C12 - F2 --- b --- b Negligible --- b Aliphatics >C12-C16 - F2 --- b --- b Negligible --- b Aromatics >C10-C12 - F2 --- b --- b Low --- b Aromatics >C12-C16 - F2 --- b --- b Negligible --- b Aliphatics >C16-C21 - F3 --- b,c --- b,c --- b,c --- b,c Aliphatics >C21-C34 - F3 --- b,c --- b,c --- b,c --- b,c Aromatics >C16-C21 - F3 --- b --- b Negligible --- b Aromatics >C21-C34 - F3 --- b --- b Low --- b Polycyclic Aromatic Hydrocarbons Low Molecular Weight PAH Acenaphthene Low Low Low Negligible Acenaphthylene Low Low Negligible Negligible Anthracene Low Low Low Negligible Fluorene Low Low Negligible Negligible

Sec. 52 Application Volume 6B: Environmental and Socio-Economic Assessment (ESA) – Marine Terminal Section 14: Ecological Risk Assessment for Routine Activities Associated with the Kitimat Terminal
May 2010 Page 14-11
Table 14–2 Base Case Effects Magnitude for Water and Sediment Community-level Selected Representative Species (cont’d)
Constituents Surface Sea
Water Deep Sea Water Nearshore Sediments
Offshore Sediments
Low Molecular Weight PAH (cont’d) 1-Methylnaphthalene --- b --- b --- b --- b 2-Methylnaphthalene Low Low Low Negligible Naphthalene Low Low Low Negligible Phenanthrene Low Low Low Low High Molecular Weight PAH Fluoranthene Low Low Low Low Benz(a)anthracene Low Low Low Low Benzo(a)pyrene Low Low Negligible Low Benzo(e)pyrene --- b --- b --- b --- b Benzo(b)fluoranthene Moderate d Moderate d Low Low Benzo(g,h,i)perylene Low Low Negligible Low Benzo(k)fluoranthene Low Low Negligible Negligible Chrysene Low Low Low Low Dibenz(a,h)anthracene Low Low Negligible Low Indeno(1,2,3-cd)pyrene Low Low Negligible Low Pyrene Low Low Low Low Volatile Organic Compounds 1,2,4-Trichlorobenzene --- b --- b --- b --- b 1,3,5-Trimethylbenzene --- b --- b --- b --- b Phenolic Compounds Phenol --- b --- b --- b --- b 2,4-Dimethylphenol --- b --- b --- b --- b 2,4-Dinitrophenol --- b --- b --- b --- b Trace Elements Barium Moderate d Moderate d Low Low Boron Low Low --- b Low Cadmium Low Low Low Low Manganese Moderate d Moderate d Negligible Low Molybdenum Low Low Low Negligible Nickel Low Low Low Low
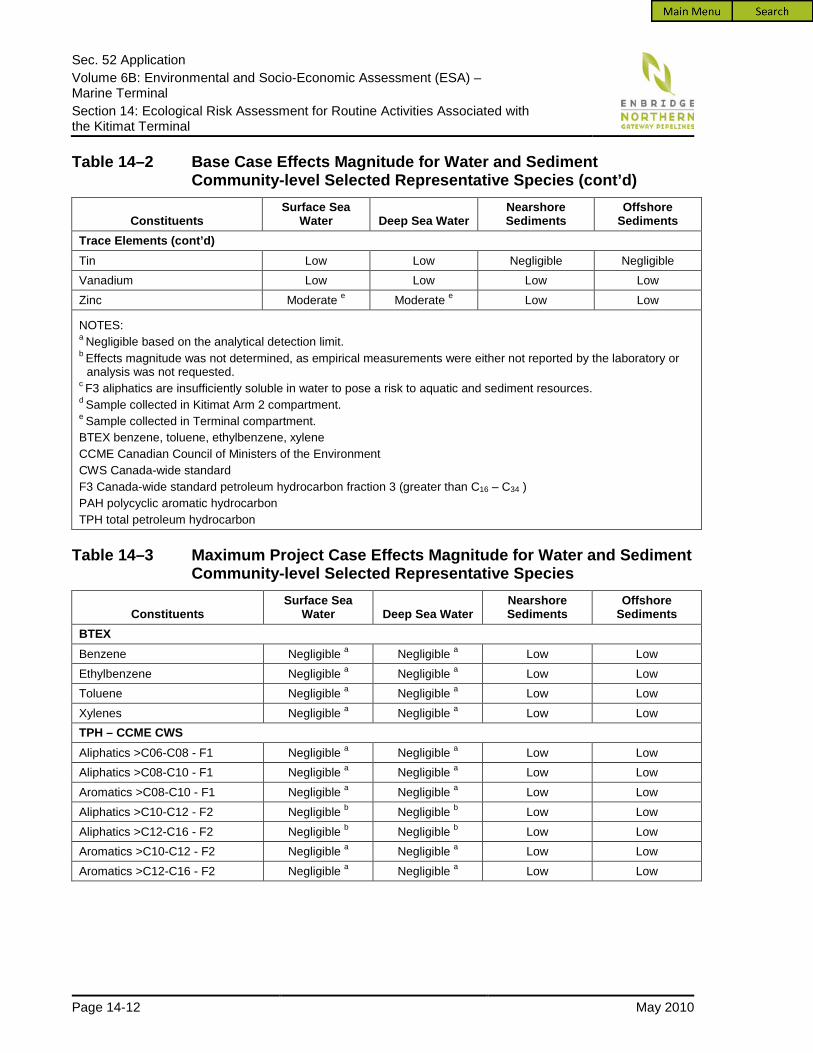
Sec. 52 Application Volume 6B: Environmental and Socio-Economic Assessment (ESA) – Marine Terminal Section 14: Ecological Risk Assessment for Routine Activities Associated with the Kitimat Terminal
Page 14-12 May 2010
Table 14–2 Base Case Effects Magnitude for Water and Sediment Community-level Selected Representative Species (cont’d)
Constituents Surface Sea
Water Deep Sea Water Nearshore Sediments
Offshore Sediments
Trace Elements (cont’d) Tin Low Low Negligible Negligible Vanadium Low Low Low Low Zinc Moderate e Moderate e Low Low
NOTES: a Negligible based on the analytical detection limit. b Effects magnitude was not determined, as empirical measurements were either not reported by the laboratory or
analysis was not requested. c F3 aliphatics are insufficiently soluble in water to pose a risk to aquatic and sediment resources. d Sample collected in Kitimat Arm 2 compartment. e Sample collected in Terminal compartment. BTEX benzene, toluene, ethylbenzene, xylene CCME Canadian Council of Ministers of the Environment CWS Canada-wide standard F3 Canada-wide standard petroleum hydrocarbon fraction 3 (greater than C16 – C34 ) PAH polycyclic aromatic hydrocarbon TPH total petroleum hydrocarbon
Table 14–3 Maximum Project Case Effects Magnitude for Water and Sediment Community-level Selected Representative Species
Constituents Surface Sea
Water Deep Sea Water Nearshore Sediments
Offshore Sediments
BTEX Benzene Negligible a Negligible a Low Low Ethylbenzene Negligible a Negligible a Low Low Toluene Negligible a Negligible a Low Low Xylenes Negligible a Negligible a Low Low TPH – CCME CWS Aliphatics >C06-C08 - F1 Negligible a Negligible a Low Low Aliphatics >C08-C10 - F1 Negligible a Negligible a Low Low Aromatics >C08-C10 - F1 Negligible a Negligible a Low Low Aliphatics >C10-C12 - F2 Negligible b Negligible b Low Low Aliphatics >C12-C16 - F2 Negligible b Negligible b Low Low Aromatics >C10-C12 - F2 Negligible a Negligible a Low Low Aromatics >C12-C16 - F2 Negligible a Negligible a Low Low
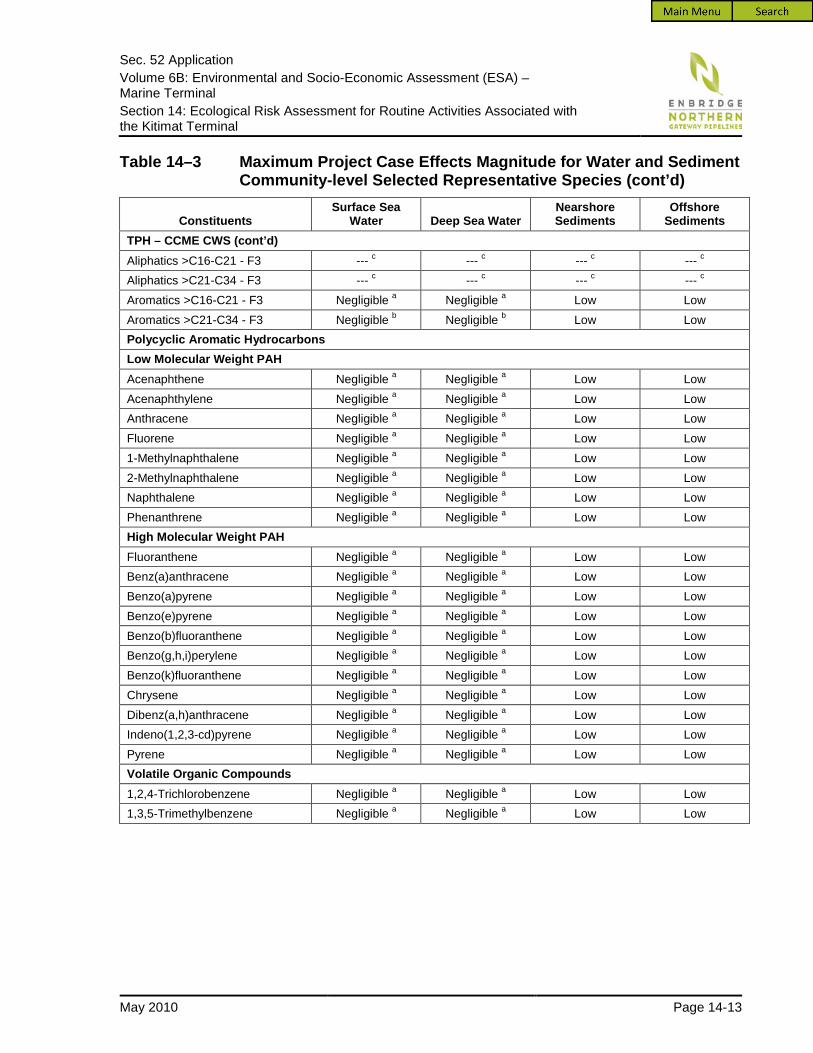
Sec. 52 Application Volume 6B: Environmental and Socio-Economic Assessment (ESA) – Marine Terminal Section 14: Ecological Risk Assessment for Routine Activities Associated with the Kitimat Terminal
May 2010 Page 14-13
Table 14–3 Maximum Project Case Effects Magnitude for Water and Sediment Community-level Selected Representative Species (cont’d)
Constituents Surface Sea
Water Deep Sea Water Nearshore Sediments
Offshore Sediments
TPH – CCME CWS (cont’d) Aliphatics >C16-C21 - F3 --- c --- c --- c --- c Aliphatics >C21-C34 - F3 --- c --- c --- c --- c Aromatics >C16-C21 - F3 Negligible a Negligible a Low Low Aromatics >C21-C34 - F3 Negligible b Negligible b Low Low Polycyclic Aromatic Hydrocarbons Low Molecular Weight PAH Acenaphthene Negligible a Negligible a Low Low Acenaphthylene Negligible a Negligible a Low Low Anthracene Negligible a Negligible a Low Low Fluorene Negligible a Negligible a Low Low 1-Methylnaphthalene Negligible a Negligible a Low Low 2-Methylnaphthalene Negligible a Negligible a Low Low Naphthalene Negligible a Negligible a Low Low Phenanthrene Negligible a Negligible a Low Low High Molecular Weight PAH Fluoranthene Negligible a Negligible a Low Low Benz(a)anthracene Negligible a Negligible a Low Low Benzo(a)pyrene Negligible a Negligible a Low Low Benzo(e)pyrene Negligible a Negligible a Low Low Benzo(b)fluoranthene Negligible a Negligible a Low Low Benzo(g,h,i)perylene Negligible a Negligible a Low Low Benzo(k)fluoranthene Negligible a Negligible a Low Low Chrysene Negligible a Negligible a Low Low Dibenz(a,h)anthracene Negligible a Negligible a Low Low Indeno(1,2,3-cd)pyrene Negligible a Negligible a Low Low Pyrene Negligible a Negligible a Low Low Volatile Organic Compounds 1,2,4-Trichlorobenzene Negligible a Negligible a Low Low 1,3,5-Trimethylbenzene Negligible a Negligible a Low Low

Sec. 52 Application Volume 6B: Environmental and Socio-Economic Assessment (ESA) – Marine Terminal Section 14: Ecological Risk Assessment for Routine Activities Associated with the Kitimat Terminal
Page 14-14 May 2010
Table 14–3 Maximum Project Case Effects Magnitude for Water and Sediment Community-level Selected Representative Species (cont’d)
Constituents Surface Sea
Water Deep Sea Water Nearshore Sediments
Offshore Sediments
Phenolic Compounds Phenol Negligible a Negligible a Low Low 2,4-Dimethylphenol Negligible a Negligible a Low Low 2,4-Dinitrophenol Negligible a Negligible a Low Low Trace Elements Barium Negligible a Negligible a Low Low Boron Negligible a Negligible a Low Low Cadmium Negligible a Negligible a Low Low Manganese Negligible a Negligible a Low Low Molybdenum Negligible a Negligible a Low Low Nickel Negligible a Negligible a Low Low Tin Negligible a Negligible a Low Low Vanadium Negligible a Negligible a Low Low Zinc Negligible a Negligible a Low Low
NOTES: a Negligible based on the detection limit. b Negligible based on 1/3 CHC5 value. c F3 aliphatics are insufficiently soluble in water to pose a risk to aquatic and sediment resources. BTEX benzene, toluene, ethylbenzene, xylene CCME Canadian Council of Ministers of the Environment CHC5 chronically hazardous concentration – 5th percentile CWS Canada-wide standard F3 Canada-wide standard petroleum hydrocarbon fraction 3 (greater than C16 – C34 ) PAH polycyclic aromatic hydrocarbon TPH total petroleum hydrocarbon

Sec. 52 Application Volume 6B: Environmental and Socio-Economic Assessment (ESA) – Marine Terminal Section 14: Ecological Risk Assessment for Routine Activities Associated with the Kitimat Terminal
May 2010 Page 14-15
Table 14–4 Maximum Application Case Effects Magnitude for Water and Sediment Community-level Selected Representative Species
Constituents Surface Sea
Water Deep Sea Water Nearshore Sediments
Offshore Sediments
BTEX Benzene Negligible a Negligible a Low Low Ethylbenzene Negligible a Negligible a Low Low Toluene Low Low Low Low Xylenes Low Low Low Low TPH - CCME CWS Aliphatics >C06-C08 - F1 Negligible a Negligible a Low Low Aliphatics >C08-C10 - F1 Negligible a Negligible a Low Low Aromatics >C08-C10 - F1 Negligible a Negligible a Low Low Aliphatics >C10-C12 - F2 Negligible b Negligible b Low Low Aliphatics >C12-C16 - F2 Negligible b Negligible b Low Low Aromatics >C10-C12 - F2 Negligible a Negligible a Low Low Aromatics >C12-C16 - F2 Negligible a Negligible a Low Low Aliphatics >C16-C21 - F3 --- c --- c --- c --- c Aliphatics >C21-C34 - F3 --- c --- c --- c --- c Aromatics >C16-C21 - F3 Negligible a Negligible a Low Low Aromatics >C21-C34 - F3 Negligible b Negligible b Low Low Polycyclic Aromatic Hydrocarbons Low Molecular Weight PAH Acenaphthene Low Low Low Low Acenaphthylene Low Low Low Low Anthracene Low Low Low Low Fluorene Low Low Low Low 1-Methylnaphthalene Negligible a Negligible a Low Low 2-Methylnaphthalene Low Low Low Low Naphthalene Low Low Low Low Phenanthrene Low Low Low Low High Molecular Weight PAH Fluoranthene Low Low Low Low Benz(a)anthracene Low Low Low Low Benzo(a)pyrene Low Low Low Low Benzo(e)pyrene Negligible a Negligible a Low Low Benzo(b)fluoranthene Moderate Moderate Low Low Benzo(g,h,i)perylene Low Low Low Low

Sec. 52 Application Volume 6B: Environmental and Socio-Economic Assessment (ESA) – Marine Terminal Section 14: Ecological Risk Assessment for Routine Activities Associated with the Kitimat Terminal
Page 14-16 May 2010
Table 14–4 Maximum Application Case Effects Magnitude for Water and Sediment Community-level Selected Representative Species (cont’d)
Constituents Surface Sea
Water Deep Sea Water Nearshore Sediments
Offshore Sediments
High Molecular Weight PAH (cont’d) Benzo(k)fluoranthene Low Low Low Low Chrysene Low Low Low Low Dibenz(a,h)anthracene Low Low Low Low Indeno(1,2,3-cd)pyrene Low Low Low Low Pyrene Low Low Low Low Volatile Organic Compounds 1,2,4-Trichlorobenzene Negligible a Negligible a Low Low 1,3,5-Trimethylbenzene Negligible a Negligible a Low Low Phenolic Compounds Phenol Negligible a Negligible a Low Low 2,4-Dimethylphenol Negligible a Negligible a Low Low 2,4-Dinitrophenol Negligible a Negligible a Low Low Trace Elements Barium Moderate Moderate Low Low Boron Low Low Low Low Cadmium Low Low Low Low Manganese Moderate Moderate Low Low Molybdenum Low Low Low Low Nickel Low Low Low Low Tin Low Low Low Low Vanadium Low Low Low Low Zinc Moderate Moderate Low Low
NOTES: a Negligible based on the detection limit. b Negligible based on 1/3 CHC5 value. c F3 aliphatics are insufficiently soluble in water to pose a risk to aquatic and sediment resources. BTEX benzene, toluene, ethylbenzene, xylene CCME Canadian Council of Ministers of the Environment CHC5 chronically hazardous concentration – 5th percentile CWS Canada-wide standard PAH polycyclic aromatic hydrocarbon TPH total petroleum hydrocarbon

Sec. 52 Application Volume 6B: Environmental and Socio-Economic Assessment (ESA) – Marine Terminal Section 14: Ecological Risk Assessment for Routine Activities Associated with the Kitimat Terminal
May 2010 Page 14-17
Table 14–5 Maximum Base Case Hazard Quotients for Avian and Mammalian Selected Representative Species
Constituents Spotted
Sandpiper Surf Scoter Marbled Murrelet Bald Eagle
Coastal-dwelling
American Mink Steller Sea
Lion Harbour Porpoise
BTEX Benzene --- a --- a --- a --- a 6.76E-07 3.63E-06 2.47E-06 Ethylbenzene --- a --- a --- a --- a 2.03E-06 8.70E-06 5.32E-06 Toluene --- a --- a --- a --- a 1.14E-06 5.56E-06 3.49E-06 Xylenes --- a --- a --- a --- a 1.77E-06 7.57E-06 4.62E-06 TPH - CCME CWS Aliphatics >C06-C08 - F1 4.26E-05 3.09E-05 --- b 1.89E-06 3.21E-06 6.57E-06 --- b Aliphatics >C08-C10 - F1 8.36E-05 6.00E-05 --- b 3.79E-06 6.28E-06 1.29E-05 --- b Aromatics >C08-C10 - F1 8.60E-05 6.28E-05 --- b 3.79E-06 6.48E-06 1.32E-05 --- b F1 - Total 2.12E-04 1.54E-04 --- b 9.46E-06 1.60E-05 3.27E-05 --- b Aliphatics >C10-C12 - F2 3.29E-04 2.33E-04 --- b 1.51E-05 2.46E-05 5.09E-05 --- b Aliphatics >C12-C16 - F2 6.02E-04 4.19E-04 --- b 2.84E-05 4.48E-05 9.34E-05 --- b Aromatics >C10-C12 - F2 2.70E-03 1.96E-03 --- b 1.19E-04 2.03E-04 4.16E-04 --- b Aromatics >C12-C16 - F2 3.19E-03 2.31E-03 --- b 1.42E-04 2.40E-04 4.92E-04 --- b F2 - Total 6.81E-03 4.93E-03 --- b 3.05E-04 5.13E-04 1.05E-03 --- b Aliphatics >C16-C21 - F3 1.20E-04 6.88E-05 --- b 7.10E-06 8.55E-06 1.92E-05 --- b Aliphatics >C21-C34 - F3 1.20E-04 6.88E-05 --- b 7.10E-06 8.55E-06 1.92E-05 --- b Aromatics >C16-C21 - F3 3.90E-03 3.17E-03 --- b 1.42E-04 3.03E-04 5.91E-04 --- b Aromatics >C21-C34 - F3 1.16E-02 9.29E-03 --- b 4.35E-04 8.99E-04 1.76E-03 --- b F3 - Total 1.58E-02 1.26E-02 --- b 5.92E-04 1.22E-03 2.39E-03 --- b Total TPH HQ = 2.28E-02 1.77E-02 --- b 9.06E-04 1.75E-03 3.48E-03 --- b

Sec. 52 Application Volume 6B: Environmental and Socio-Economic Assessment (ESA) – Marine Terminal Section 14: Ecological Risk Assessment for Routine Activities Associated with the Kitimat Terminal
Page 14-18 May 2010
Table 14–5 Maximum Base Case Hazard Quotients for Avian and Mammalian Selected Representative Species (cont’d)
Constituents Spotted
Sandpiper Surf Scoter Marbled Murrelet Bald Eagle
Coastal-dwelling
American Mink Steller Sea
Lion Harbour Porpoise
Polycyclic Aromatic Hydrocarbons Low Molecular Weight PAH Acenaphthene --- a --- a --- a --- a 3.47E-06 2.39E-06 2.36E-06 Acenaphthylene --- a --- a --- a --- a 3.44E-06 2.39E-06 2.37E-06 Anthracene --- a --- a --- a --- a 3.50E-06 2.40E-06 2.39E-06 Fluorene --- a --- a --- a --- a 3.45E-06 2.40E-06 2.39E-06 1-Methylnaphthalene --- a,b --- a,b --- a,b --- a,b --- b --- b --- b 2-Methylnaphthalene --- a --- a --- a --- a 4.16E-06 3.33E-06 3.48E-06 Naphthalene --- a --- a --- a --- a 3.59E-06 2.46E-06 2.42E-06 Phenanthrene --- a --- a --- a --- a 1.20E-05 6.48E-06 4.98E-06 Total LPAH HQ = 3.37E-05 2.19E-05 2.04E-05 High Molecular Weight PAH Fluoranthene --- a --- a --- a --- a 6.34E-06 3.63E-06 3.24E-06 Benz(a)anthracene --- a --- a --- a --- a 3.34E-05 2.70E-05 3.06E-05 Benzo(a)pyrene --- a --- a --- a --- a 3.26E-05 2.49E-05 2.95E-05 Benzo(e)pyrene --- a,b --- a,b --- a,b --- a,b --- b --- b --- b

Sec. 52 Application Volume 6B: Environmental and Socio-Economic Assessment (ESA) – Marine Terminal Section 14: Ecological Risk Assessment for Routine Activities Associated with the Kitimat Terminal
May 2010 Page 14-19
Table 14–5 Maximum Base Case Hazard Quotients for Avian and Mammalian Selected Representative Species (cont’d)
Constituents Spotted
Sandpiper Surf Scoter Marbled Murrelet Bald Eagle
Coastal-dwelling
American Mink Steller Sea
Lion Harbour Porpoise
High Molecular Weight PAH (cont’d) Benzo(b)fluoranthene --- a --- a --- a --- a 4.10E-05 3.88E-05 4.77E-05 Benzo(g,h,i)perylene --- a --- a --- a --- a 3.26E-05 2.31E-05 2.56E-05 Benzo(k)fluoranthene --- a --- a --- a --- a 3.26E-05 2.25E-05 2.23E-05 Chrysene --- a --- a --- a --- a 4.67E-05 3.26E-05 3.31E-05 Dibenz(a,h)anthracene --- a --- a --- a --- a 3.25E-05 2.25E-05 2.29E-05 Indeno(1,2,3-cd)pyrene --- a --- a --- a --- a 3.26E-05 2.38E-05 2.67E-05 Pyrene --- a --- a --- a --- a 4.71E-05 2.99E-05 3.03E-05 Total HPAH HQ = 3.37E-04 2.49E-04 2.72E-04 Total PAH HQ = 3.71E-04 2.70E-04 2.92E-04 Volatile Organic Compounds 1,2,4-Trichlorobenzene --- a,b --- a,b --- a,b --- a,b --- b --- b --- b 1,3,5-Trimethylbenzene --- a,b --- a,b --- a,b --- a,b --- b --- b --- b Phenolic Compounds Phenol --- a,b --- a,b --- a,b --- a,b --- b --- b --- b 2,4-Dimethylphenol --- a,b --- a,b --- a,b --- a,b --- b --- b --- b 2,4-Dinitrophenol --- a,b --- a,b --- a,b --- a,b --- b --- b --- b Trace Elements Barium 1.20E-03 2.21E-03 8.31E-04 3.75E-04 5.33E-04 3.13E-04 3.07E-04 Boron 7.15E-03 2.13E-03 2.54E-02 1.46E-03 8.86E-04 1.74E-02 1.53E-02 Cadmium 4.63E-02 5.42E-02 1.60E-02 1.40E-03 1.11E-02 2.17E-02 6.98E-03

Sec. 52 Application Volume 6B: Environmental and Socio-Economic Assessment (ESA) – Marine Terminal Section 14: Ecological Risk Assessment for Routine Activities Associated with the Kitimat Terminal
Page 14-20 May 2010
Table 14–5 Maximum Base Case Hazard Quotients for Avian and Mammalian Selected Representative Species (cont’d)
Constituents Spotted
Sandpiper Surf Scoter Marbled Murrelet Bald Eagle
Coastal-dwelling
American Mink Steller Sea
Lion Harbour Porpoise
Trace Elements (cont’d) Manganese 3.02E-03 2.16E-03 3.21E-03 5.10E-04 1.76E-03 2.62E-03 3.21E-03 Molybdenum 2.08E-03 1.94E-03 5.21E-03 3.24E-03 5.64E-02 2.17E-01 1.23E-01 Nickel 6.97E-02 6.27E-02 1.65E-01 7.58E-02 3.66E-02 2.74E-02 2.79E-02 Tin 2.88E-03 3.93E-03 1.36E-03 1.21E-03 6.61E-04 2.07E-03 9.21E-04 Vanadium 1.49E-01 1.34E-01 1.61E-01 5.81E-02 1.49E-02 5.42E-02 3.04E-02 Zinc 6.28E-02 6.92E-02 6.23E-02 2.38E-02 9.68E-03 3.06E-02 1.63E-02
NOTES: a An ecological hazard quotient could not be calculated because no toxicity reference value was available for this chemical and receptor combination. b An ecological hazard quotient was not calculated because this chemical was not assessed in the Base Case for this pathway and receptor combination. BTEX benzene, toluene, ethylbenzene, xylene CCME Canadian Council of Ministers of the Environment CWS Canada-wide standard PAH polycyclic aromatic hydrocarbon TPH total petroleum hydrocarbon

Sec. 52 Application Volume 6B: Environmental and Socio-Economic Assessment (ESA) – Marine Terminal Section 14: Ecological Risk Assessment for Routine Activities Associated with the Kitimat Terminal
May 2010 Page 14-21
Table 14–6 Project Case Hazard Quotients for Avian and Mammalian Selected Representative Species
Constituents Spotted Sandpiper Surf Scoter Marbled Murrelet Bald Eagle Coastal-dwelling American Mink Steller Sea Lion Harbour Porpoise
BTEX Benzene --- a --- a --- a --- a 1.23E-08 (K2) 1.07E-07 (K2) 6.90E-08 (K2) Ethylbenzene --- a --- a --- a --- a 3.56E-08 (K2) 1.60E-07 (K2) 9.48E-08 (K2) Toluene --- a --- a --- a --- a 5.20E-08 (K2) 2.71E-07 (K2) 1.64E-07 (K2) Xylenes --- a --- a --- a --- a 8.21E-08 (K2) 3.62E-07 (K2) 2.13E-07 (K2) TPH - CCME CWS Aliphatics >C06-C08 - F1 2.12E-05 (K2) 2.41E-05 (K2) 5.51E-05 (K2) 4.25E-05 (K2) 1.45E-05 (K2) 5.94E-05 (K2) 3.44E-05 (K2) Aliphatics >C08-C10 - F1 2.14E-05 (K2) 2.50E-05 (K2) 5.71E-05 (K2) 4.43E-05 (K2) 1.51E-05 (K2) 6.11E-05 (K2) 3.53E-05 (K2) Aromatics >C08-C10 - F1 5.43E-07 (K2) 5.92E-07 (K2) 1.36E-06 (K2) 1.03E-06 (K2) 3.53E-07 (K2) 1.48E-06 (K2) 8.61E-07 (K2) F1 - Total 4.32E-05 (K2) 4.98E-05 (K2) 1.14E-04 (K2) 8.78E-05 (K2) 3.00E-05 (K2) 1.22E-04 (K2) 7.06E-05 (K2) Aliphatics >C10-C12 - F2 2.90E-05 (K2) 3.41E-05 (K2) 7.80E-05 (K2) 6.06E-05 (K2) 2.07E-05 (K2) 8.35E-05 (K2) 4.82E-05 (K2) Aliphatics >C12-C16 - F2 1.11E-03 (K2) 1.31E-03 (K2) 3.03E-03 (K2) 2.36E-03 (K2) 8.03E-04 (K2) 3.24E-03 (K2) 1.88E-03 (K2) Aromatics >C10-C12 - F2 2.03E-06 (K2) 2.23E-06 (K2) 4.97E-06 (K2) 3.81E-06 (K2) 1.30E-06 (K2) 5.38E-06 (K2) 3.11E-06 (K2) Aromatics >C12-C16 - F2 4.68E-06 (K2) 5.12E-06 (K2) 1.08E-05 (K2) 8.33E-06 (K2) 2.88E-06 (K2) 1.17E-05 (K2) 6.71E-06 (K2) F2 - Total 1.14E-03 (K2) 1.35E-03 (K2) 3.12E-03 (K2) 2.43E-03 (K2) 8.28E-04 (K2) 3.34E-03 (K2) 1.93E-03 (K2) Aliphatics >C16-C21 - F3 1.11E-06 (K2) 6.31E-07 (K2) 2.06E-07 (K1) 6.49E-08 (K2) 7.82E-08 (K2) 1.86E-07 (K2) 3.81E-08 (K1) Aliphatics >C21-C34 - F3 4.42E-06 (K2) 2.52E-06 (K2) 8.13E-07 (K1) 2.60E-07 (K2) 3.13E-07 (K2) 7.19E-07 (K2) 1.36E-07 (K1) Aromatics >C16-C21 - F3 1.66E-05 (K2) 1.85E-05 (K2) 3.79E-05 (K2) 2.91E-05 (K2) 1.01E-05 (K2) 4.05E-05 (K2) 2.33E-05 (K2) Aromatics >C21-C34 - F3 2.35E-04 (K2) 2.64E-04 (K2) 5.51E-04 (K2) 4.26E-04 (K2) 1.47E-04 (K2) 5.90E-04 (K2) 3.39E-04 (K2) F3 - Total 2.57E-04 (K2) 2.86E-04 (K2) 5.90E-04 (K2) 4.55E-04 (K2) 1.58E-04 (K2) 6.31E-04 (K2) 3.62E-04 (K2) Total TPH HQ = 1.44E-03 (K2) 1.69E-03 (K2) 3.83E-03 (K2) 2.97E-03 (K2) 1.02E-03 (K2) 4.10E-03 (K2) 2.37E-03 (K2) Polycyclic Aromatic Hydrocarbons Low Molecular Weight PAH Acenaphthene --- a --- a --- a --- a 2.77E-13 (K1) 2.23E-13 (K1) 2.31E-13 (K1) Acenaphthylene --- a --- a --- a --- a 4.18E-15 (K1) 3.35E-15 (K1) 3.47E-15 (K1) Anthracene --- a --- a --- a --- a 4.06E-10 (K2) 3.22E-10 (K2) 3.33E-10 (K2) Fluorene --- a --- a --- a --- a 4.62E-10 (K2) 3.69E-10 (K2) 3.81E-10 (K2) 1-Methylnaphthalene --- a --- a --- a --- a 2.49E-09 (K2) 2.02E-09 (K2) 2.09E-09 (K2) 2-Methylnaphthalene --- a --- a --- a --- a 1.88E-09 (K2) 1.52E-09 (K2) 1.58E-09 (K2) Naphthalene --- a --- a --- a --- a 1.08E-09 (K2) 9.22E-10 (K2) 9.67E-10 (K2) Phenanthrene --- a --- a --- a --- a 6.28E-10 (K2) 4.99E-10 (K2) 5.15E-10 (K2) Total LPAH HQ = 6.95E-09 (K2) 5.65E-09 (K2) 5.87E-09 (K2)


Sec. 52 Application Volume 6B: Environmental and Socio-Economic Assessment (ESA) – Marine Terminal Section 14: Ecological Risk Assessment for Routine Activities Associated with the Kitimat Terminal
May 2010 Page 14-23
Table 14–6 Project Case Hazard Quotients for Avian and Mammalian Selected Representative Species (cont’d)
Constituents Spotted Sandpiper Surf Scoter Marbled Murrelet Bald Eagle Coastal-dwelling American Mink Steller Sea Lion Harbour Porpoise
High Molecular Weight PAH Fluoranthene --- a --- a --- a --- a 8.08E-13 (K1) 6.37E-13 (K1) 6.55E-13 (K1) Benz(a)anthracene --- a --- a --- a --- a 2.73E-08 (K2) 2.15E-08 (K2) 2.21E-08 (K2) Benzo(a)pyrene --- a --- a --- a --- a 4.00E-10 (K1) 3.12E-10 (K1) 3.19E-10 (K1) Benzo(e)pyrene --- a --- a --- a --- a 4.08E-11 (K1) 3.21E-11 (K1) 3.30E-11 (K1) Benzo(b)fluoranthene --- a --- a --- a --- a 3.08E-11 (K1) 2.43E-11 (K1) 2.51E-11 (K1) Benzo(g,h,i)perylene --- a --- a --- a --- a 1.13E-10 (K1) 8.85E-11 (K1) 9.11E-11 (K1) Benzo(k)fluoranthene --- a --- a --- a --- a 2.91E-11 (K1) 2.30E-11 (K1) 2.37E-11 (K1) Chrysene --- a --- a --- a --- a 1.87E-11 (K1) 1.48E-11 (K1) 1.52E-11 (K1) Dibenz(a,h)anthracene --- a --- a --- a --- a 8.32E-11 (K1) 6.54E-11 (K1) 6.73E-11 (K1) Indeno(1,2,3-cd)pyrene --- a --- a --- a --- a 1.34E-10 (K1) 1.05E-10 (K1) 1.09E-10 (K1) Pyrene --- a --- a --- a --- a 1.82E-08 (K2) 1.43E-08 (K2) 1.47E-08 (K2) Total HPAH HQ = 4.62E-08 (K2) 3.64E-08 (K2) 3.75E-08 (K2) Total PAH HQ = 5.32E-08 (K2) 4.21E-08 (K2) 4.33E-08 (K2) Volatile Organic Compounds 1,2,4-Trichlorobenzene --- a --- a --- a --- a 1.80E-07 (K2) 6.94E-07 (K2) 3.87E-07 (K2) 1,3,5-Trimethylbenzene --- a --- a --- a --- a 1.87E-08 (K2) 7.88E-08 (K2) 4.58E-08 (K2) Phenolic Compounds Phenol --- a --- a --- a --- a 1.75E-14 (K2) 3.95E-13 (K2) 2.70E-13 (K2) 2,4-Dimethylphenol --- a --- a --- a --- a 8.81E-13 (K2) 8.70E-12 (K2) 5.69E-12 (K2) 2,4-Dinitrophenol --- a --- a --- a --- a 1.21E-12 (K2) 4.38E-11 (K2) 3.03E-11 (K2) Trace Elements Barium 1.55E-10 (K1) 2.33E-10 (K1) 5.21E-11 (K1) 1.92E-11 (K1) 5.15E-11 (K1) 2.53E-11 (K1) 1.57E-11 (K1) Boron 1.31E-11 (K2) 1.36E-11 (K2) 3.77E-12 (K1) 3.73E-13 (K2) 1.97E-12 (K2) 6.45E-12 (K2) 2.76E-12 (K2) Cadmium 3.80E-05 (K1) 4.44E-05 (K1) 9.48E-06 (K1) 1.04E-08 (K1) 8.26E-06 (K1) 1.30E-05 (K1) 2.14E-06 (K1) Manganese 5.23E-10 (K1) 3.64E-10 (K1) 1.03E-09 (K1) 5.20E-10 (K1) 1.30E-09 (K1) 9.85E-10 (K1) 9.83E-10 (K1) Molybdenum 5.48E-07 (K2) 6.20E-07 (K2) 1.32E-07 (K1) 2.13E-09 (K2) 2.01E-06 (K2) 3.24E-06 (K2) 5.31E-07 (K1) Nickel 5.89E-06 (K2) 4.99E-06 (K2) 1.07E-05 (K2) 5.40E-06 (K2) 2.62E-06 (K2) 1.95E-06 (K2) 1.94E-06 (K2) Tin 1.18E-07 (K2) 1.46E-07 (K2) 4.59E-07 (K2) 5.15E-07 (K2) 1.67E-07 (K2) 6.63E-07 (K2) 3.78E-07 (K2) Vanadium 1.73E-05 (K2) 1.36E-05 (K2) 2.95E-05 (K1) 1.48E-05 (K2) 3.16E-06 (K2) 1.20E-05 (K2) 6.63E-06 (K2) Zinc 1.72E-07 (K1) 1.84E-07 (K1) 1.09E-07 (K1) 4.98E-08 (K1) 2.22E-08 (K1) 6.70E-08 (K1) 3.23E-08 (K1)
NOTES: a An ecological hazard quotient could not be calculated because no toxicity reference value was available for this chemical and receptor combination. BTEX benzene, toluene, ethylbenzene, xylene CCME Canadian Council of Ministers of the Environment CWS Canada-wide standard PAH polycyclic aromatic hydrocarbon TPH total petroleum hydrocarbon


Sec. 52 Application Volume 6B: Environmental and Socio-Economic Assessment (ESA) – Marine Terminal Section 14: Ecological Risk Assessment for Routine Activities Associated with the Kitimat Terminal
May 2010 Page 14-25
Table 14–7 Application Case Hazard Quotients for Avian and Mammalian Selected Representative Species
Constituents Spotted Sandpiper Surf Scoter Marbled Murrelet Bald Eagle Coastal-dwelling American Mink Steller Sea Lion Harbour Porpoise
BTEX Benzene --- a --- a --- a --- a 6.88E-07 (K2) 3.73E-06 (K2) 2.54E-06 (K2) Ethylbenzene --- a --- a --- a --- a 2.06E-06 (K2) 8.86E-06 (K2) 5.42E-06 (K2) Toluene --- a --- a --- a --- a 1.20E-06 (K2) 5.83E-06 (K2) 3.66E-06 (K2) Xylenes --- a --- a --- a --- a 1.86E-06 (K2) 7.94E-06 (K2) 4.83E-06 (K2) TPH - CCME CWS Aliphatics >C06-C08 - F1 6.38E-05 (K2) 5.51E-05 (K2) 5.51E-05 (K2) 4.44E-05 (K2) 1.77E-05 (K2) 6.60E-05 (K2) 3.44E-05 (K2) Aliphatics >C08-C10 - F1 1.05E-04 (K2) 8.50E-05 (K2) 5.71E-05 (K2) 4.81E-05 (K2) 2.14E-05 (K2) 7.40E-05 (K2) 3.53E-05 (K2) Aromatics >C08-C10 - F1 8.65E-05 (K2) 6.34E-05 (K2) 1.36E-06 (K2) 4.82E-06 (K2) 6.84E-06 (K2) 1.47E-05 (K2) 8.61E-07 (K2) F1 – Total 2.55E-04 (K2) 2.03E-04 (K2) 1.14E-04 (K2) 9.73E-05 (K2) 4.60E-05 (K2) 1.55E-04 (K2) 7.06E-05 (K2) Aliphatics >C10-C12 - F2 3.58E-04 (K2) 2.67E-04 (K2) 7.80E-05 (K2) 7.57E-05 (K2) 4.53E-05 (K2) 1.34E-04 (K2) 4.82E-05 (K2) Aliphatics >C12-C16 - F2 1.71E-03 (K2) 1.73E-03 (K2) 3.03E-03 (K2) 2.39E-03 (K2) 8.48E-04 (K2) 3.34E-03 (K2) 1.88E-03 (K2) Aromatics >C10-C12 - F2 2.70E-03 (K2) 1.96E-03 (K2) 4.97E-06 (K2) 1.23E-04 (K2) 2.05E-04 (K2) 4.21E-04 (K2) 3.11E-06 (K2) Aromatics >C12-C16 - F2 3.19E-03 (K2) 2.32E-03 (K2) 1.08E-05 (K2) 1.50E-04 (K2) 2.43E-04 (K2) 5.04E-04 (K2) 6.71E-06 (K2) F2 – Total 7.96E-03 (K2) 6.28E-03 (K2) 3.12E-03 (K2) 2.73E-03 (K2) 1.34E-03 (K2) 4.40E-03 (K2) 1.93E-03 (K2) Aliphatics >C16-C21 - F3 1.22E-04 (K2) 6.95E-05 (K2) 2.06E-07 (K1) 7.16E-06 (K2) 8.63E-06 (K2) 1.93E-05 (K2) 3.81E-08 (K1) Aliphatics >C21-C34 - F3 1.25E-04 (K2) 7.14E-05 (K2) 8.13E-07 (K1) 7.36E-06 (K2) 8.86E-06 (K2) 1.99E-05 (K2) 1.36E-07 (K1) Aromatics >C16-C21 - F3 3.92E-03 (K2) 3.18E-03 (K2) 3.79E-05 (K2) 1.71E-04 (K2) 3.13E-04 (K2) 6.32E-04 (K2) 2.33E-05 (K2) Aromatics >C21-C34 - F3 1.19E-02 (K2) 9.56E-03 (K2) 5.51E-04 (K2) 8.61E-04 (K2) 1.05E-03 (K2) 2.35E-03 (K2) 3.39E-04 (K2) F3 – Total 1.60E-02 (K2) 1.29E-02 (K2) 5.90E-04 (K2) 1.05E-03 (K2) 1.38E-03 (K2) 3.03E-03 (K2) 3.62E-04 (K2) Total TPH HQ = 2.42E-02 (K2) 1.94E-02 (K2) 3.83E-03 (K2) 3.88E-03 (K2) 2.76E-03 (K2) 7.58E-03 (K2) 2.37E-03 (K2) Polycyclic Aromatic Hydrocarbons Low Molecular Weight PAH Acenaphthene --- a --- a --- a --- a 3.47E-06 (K1) 2.39E-06 (K1) 2.36E-06 (K1) Acenaphthylene --- a --- a --- a --- a 3.44E-06 (K1) 2.39E-06 (K1) 2.37E-06 (K1) Anthracene --- a --- a --- a --- a 3.50E-06 (K2) 2.40E-06 (K2) 2.39E-06 (K2) Fluorene --- a --- a --- a --- a 3.45E-06 (K2) 2.40E-06 (K2) 2.39E-06 (K2) 1-Methylnaphthalene --- a --- a --- a --- a 2.49E-09 (K2) 2.02E-09 (K2) 2.09E-09 (K2) 2-Methylnaphthalene --- a --- a --- a --- a 4.16E-06 (K2) 3.34E-06 (K2) 3.48E-06 (K2) Naphthalene --- a --- a --- a --- a 3.59E-06 (K2) 2.46E-06 (K2) 2.42E-06 (K2) Phenanthrene --- a --- a --- a --- a 1.20E-05 (K2) 6.49E-06 (K2) 4.98E-06 (K2) Total LPAH HQ = 3.37E-05 (K2) 2.19E-05 (K2) 2.04E-05 (K2) High Molecular Weight PAH Fluoranthene --- a --- a --- a --- a 6.34E-06 (K1) 3.63E-06 (K1) 3.24E-06 (K1) Benz(a)anthracene --- a --- a --- a --- a 3.34E-05 (K2) 2.70E-05 (K2) 3.06E-05 (K2) Benzo(a)pyrene --- a --- a --- a --- a 3.26E-05 (K1) 2.49E-05 (K1) 2.95E-05 (K1) Benzo(e)pyrene --- a --- a --- a --- a 4.08E-11 (K1) 3.21E-11 (K1) 3.30E-11 (K1) Benzo(b)fluoranthene --- a --- a --- a --- a 4.10E-05 (K1) 3.88E-05 (K1) 4.77E-05 (K1) Benzo(g,h,i)perylene --- a --- a --- a --- a 3.26E-05 (K1) 2.31E-05 (K1) 2.56E-05 (K1) Benzo(k)fluoranthene --- a --- a --- a --- a 3.26E-05 (K1) 2.25E-05 (K1) 2.23E-05 (K1)


Sec. 52 Application Volume 6B: Environmental and Socio-Economic Assessment (ESA) – Marine Terminal Section 14: Ecological Risk Assessment for Routine Activities Associated with the Kitimat Terminal
May 2010 Page 14-27
Table 14–7 Application Case Hazard Quotients for Avian and Mammalian Selected Representative Species (cont’d)
Constituents Spotted Sandpiper Surf Scoter Marbled Murrelet Bald Eagle Coastal-dwelling American Mink Steller Sea Lion Harbour Porpoise
Polycyclic Aromatic Hydrocarbons (cont’d) Low Molecular Weight PAH (cont’d) Chrysene --- a --- a --- a --- a 4.67E-05 (K1) 3.26E-05 (K1) 3.31E-05 (K1) Dibenz(a,h)anthracene --- a --- a --- a --- a 3.25E-05 (K1) 2.25E-05 (K1) 2.29E-05 (K1) Indeno(1,2,3-cd)pyrene --- a --- a --- a --- a 3.26E-05 (K1) 2.38E-05 (K1) 2.67E-05 (K1) Pyrene --- a --- a --- a --- a 4.71E-05 (K2) 2.99E-05 (K2) 3.03E-05 (K2) Total HPAH HQ = 3.38E-04 (K2) 2.49E-04 (K2) 2.72E-04 (K2) Total PAH HQ = 3.71E-04 (K2) 2.71E-04 (K2) 2.92E-04 (K2) Volatile Organic Compounds 1,2,4-Trichlorobenzene --- a --- a --- a --- a 1.80E-07 (K2) 6.94E-07 (K2) 3.87E-07 (K2) 1,3,5-Trimethylbenzene --- a --- a --- a --- a 1.87E-08 (K2) 7.88E-08 (K2) 4.58E-08 (K2) Phenolic Compounds Phenol --- a --- a --- a --- a 1.75E-14 (K2) 3.95E-13 (K2) 2.70E-13 (K2) 2,4-Dimethylphenol --- a --- a --- a --- a 8.81E-13 (K2) 8.70E-12 (K2) 5.69E-12 (K2) 2,4-Dinitrophenol --- a --- a --- a --- a 1.21E-12 (K2) 4.38E-11 (K2) 3.03E-11 (K2) Trace Elements Barium 1.20E-03 (K1) 2.21E-03 (K1) 8.31E-04 (K1) 3.75E-04 (K1) 5.33E-04 (K1) 3.13E-04 (K1) 3.07E-04 (K1) Boron 7.15E-03 (K2) 2.13E-03 (K2) 2.54E-02 (K1) 1.46E-03 (K2) 8.86E-04 (K2) 1.74E-02 (K2) 1.53E-02 (K2) Cadmium 4.63E-02 (K1) 5.42E-02 (K1) 1.60E-02 (K1) 1.40E-03 (K1) 1.11E-02 (K1) 2.17E-02 (K1) 6.98E-03 (K1) Manganese 3.02E-03 (K1) 2.16E-03 (K1) 3.21E-03 (K1) 5.10E-04 (K1) 1.76E-03 (K1) 2.62E-03 (K1) 3.21E-03 (K1) Molybdenum 2.08E-03 (K2) 1.94E-03 (K2) 5.21E-03 (K1) 3.24E-03 (K2) 5.64E-02 (K2) 2.17E-01 (K2) 1.23E-01 (K1) Nickel 6.97E-02 (K2) 6.27E-02 (K2) 1.65E-01 (K2) 7.58E-02 (K2) 3.66E-02 (K2) 2.74E-02 (K2) 2.79E-02 (K2) Tin 2.88E-03 (K2) 3.93E-03 (K2) 1.36E-03 (K2) 1.22E-03 (K2) 6.62E-04 (K2) 2.07E-03 (K2) 9.21E-04 (K2) Vanadium 1.49E-01 (K2) 1.34E-01 (K2) 1.61E-01 (K1) 5.81E-02 (K2) 1.49E-02 (K2) 5.42E-02 (K2) 3.04E-02 (K2) Zinc 6.28E-02 (K1) 6.92E-02 (K1) 6.23E-02 (K1) 2.38E-02 (K1) 9.68E-03 (K1) 3.06E-02 (K1) 1.63E-02 (K1)
NOTES: a An ecological hazard quotient could not be calculated because no toxicity reference value was available for this chemical and receptor combination. BTEX benzene, toluene, ethylbenzene, xylene CCME Canadian Council of Ministers of the Environment CWS Canada-wide standard PAH polycyclic aromatic hydrocarbon TPH total petroleum hydrocarbon


Sec. 52 Application Volume 6B: Environmental and Socio-Economic Assessment (ESA) – Marine Terminal Section 14: Ecological Risk Assessment for Routine Activities Associated with the Kitimat Terminal
May 2010 Page 14-29
14.4 Prediction Confidence Prediction confidence for the marine ERA is based on the following six major aspects:
• selection of COPCs • selection of species • environmental fate and transport modelling • resource-specific toxicity data • resource exposure to COPCs and HQ calculations • chemical speciation and bioavailability
The selection of COPCs was based on chemical analyses of representative hydrocarbon samples. Substances that are present in the hydrocarbons at a concentration of less than 1 mg/kg are of minimal concern. All PAH, as well as BTEX and TPH compounds, are COPCs regardless of concentrations measured in the representative hydrocarbon samples. Therefore, COPCs assessed may include chemicals that are not expected to be released into the marine environment. In addition, substances exhibiting concentrations in the marine environment in exceedance of guidelines criteria (as part of the Base Case), are also considered as COPCs. All COPCs modelled in this risk assessment are presented in Table 14-1.
The selection of species is based on known species inventories in the PEAA and comprised of species that could collectively represent various levels of exposure due to differences in life-history attributes. Although this overall approach is reliable, the quality of many required species attributes (e.g., ingestion rates) may vary. On the other hand, the representative species are modelled as solely inhabiting a single model compartment, which would overestimate their exposure to COPCs if, in fact, they move between compartments or migrate.
Environmental fate and transport models use average environmental data and simplified representations of the environment and processes involved in order to model the fate and transport of COPCs. Although the overall model structures are reliable, the quality of many of the parameter values describing the environmental fate and partitioning (i.e., distribution) of COPCs varies. In such situations, conservative assumptions might overestimate environmental COPC concentrations.
For several COPCs, the available toxicity database is very limited and, consequently, the TRV for these substances are occasionally based on less-than-optimal toxicological studies. Uncertainty factors are, therefore, often necessary to modify available toxicological data and are applied in a manner that is consistent with regulatory guidance. In addition, toxicological testing of environmental contaminants is not nearly as extensive for avian species as for mammalian species. As a result, avian TRV for many COPCs are unavailable.
For assessing the maximum potential exposure to COPCs, HQs are calculated for all representative species in each of the appropriate model compartments where they might be found. This assumption is conservative because it overestimates the exposure of certain representative species to COPCs. Many marine fauna (e.g., fish, birds, mammals and crab) are mobile and may move among compartments and outside of the PEAA, thereby reducing potential exposure to COPCs. Thus, the actual exposure to COPCs in water and sediment of food (e.g., invertebrates and fish) and representative species are likely to be lower than the assumed exposure.

Sec. 52 Application Volume 6B: Environmental and Socio-Economic Assessment (ESA) – Marine Terminal Section 14: Ecological Risk Assessment for Routine Activities Associated with the Kitimat Terminal
Page 14-30 May 2010
Trace elements are part of the natural environment and exist in many different forms. In water, trace elements are rarely present in their elemental form, but more commonly present as either free dissolved ionic species, associated to other organic or inorganic species, or bound to solids. Because it is extremely difficult to predict the form of an element, the TRV and toxicity benchmark studies typically assess relatively potent forms of the trace elements, even though those particular forms might not occur naturally within the PEAA.
The bioavailability of trace elements can decrease when they bind to sediment solids. To be conservative, most trace elements in sediment are assumed to be fully bioavailable to biota. However, this level of bioavailability was considered to be unrealistic for the metals barium, manganese and vanadium as part of the Base Case. All Kitimat Terminal-related discharges are assumed to be completely (i.e., 100%) bioavailable upon release into the marine environment through the sub-tidal perforated pipe into the water and sediments. For all other COPCs, assuming complete bioavailability is highly conservative and would result in higher HQ estimates.
The marine ERA incorporates measured data to the extent practical, with conservative assumptions used in the exposure and hazard assessments. Therefore, it is unlikely that the risk of adverse effects on the marine environment is underestimated. This conclusion is further supported by the small contribution that the Project Case makes to the magnitude and HQ values for the Application Case, where both Base Case and Project Case effect magnitudes and HQ values are available for comparison.
14.5 Follow-up and Monitoring The following monitoring programs will be developed and implemented for a minimum of three years following the start of operations at the Kitimat Terminal (the need for ongoing monitoring will be determined based on the findings of the monitoring programs and through discussions with Health Canada and Environment Canada):
• effluent quality monitoring: weekly measurements of BTEX/TPH compounds and trace elements concentrations in the liquid effluent discharge resulting from operations at the Kitimat Terminal
• air quality monitoring: annual measurements of BTEX/TPH compounds and trace elements concentration in the air surrounding the Kitimat Terminal, ideally at or near the security fence
• water quality monitoring: annual measurements of BTEX/TPH compounds in the marine water receiving environment, representing near-field, far-field and reference areas
• sediment quality monitoring: annual measurements of BTEX/TPH compounds in the marine sediment receiving environment, representing near-field, far-field and reference areas
Both the effluent and air quality monitoring programs should be carried out by Northern Gateway. However, it would be feasible for a community-based organization to undertake the water and sediment quality monitoring.

Sec. 52 Application Volume 6B: Environmental and Socio-Economic Assessment (ESA) – Marine Terminal Section 14: Ecological Risk Assessment for Routine Activities Associated with the Kitimat Terminal
May 2010 Page 14-31
14.6 Summary of Ecological Risk Assessment for Routine Activities Associated with the Kitimat Terminal
The marine ERA was done to determine the risk that routine operational activities at the Kitimat Terminal may pose to the ecological health of the marine environment in Kitimat Arm, which is expected to receive the highest level of chemical emissions from activities at Kitimat Terminal. Chemical emissions considered in the ERA included both atmospheric releases such as hydrocarbons and trace metals from tanks, valves, and berthed vessel engines, and liquid effluent emissions from the marine terminal arising from normal operations and site-wide storm water runoff.
The extent to which community-level receptors (marine plants, fish and invertebrates) and avian and mammalian species will come into contact with the COPCs released from Kitimat Terminal was evaluated. The potential for adverse effects as a result of exposure to these COPCs was determined by comparing the expected concentrations or daily dose of each COPC to which an organism is expected to be exposed, to the threshold concentration or dose above which an adverse effect may be expected (as established in primary literature).
For mammalian and avian selected species, the predicted exposures are all below the threshold levels, indicating that adverse effects are not expected. Generally, and with minor exceptions, effects magnitudes for the community-level receptors are rated negligible or low. Existing (Base Case) conditions of benzo(a)fluoranthene (a polycyclic aromatic hydrocarbon) and trace elements barium, manganese and zinc are predicted to cause moderate effects in community-level receptors such as fish, based on the maximum measured concentrations of these chemicals in water. However, the contribution of the Project is negligible (the majority of the predicted effects are the result of existing industrial activities in the PEAA).
14.7 References CCME (Canadian Council of Ministers of the Environment). 1996. A Framework for Ecological Risk
Assessment: General Guidance.
CCME (Canadian Council of Ministers of the Environment). 1997. A Framework for Ecological Risk Assessment: Technical Appendices.
Stephenson, M., A. St-Amand, P. Mazzocco and J-M. De Vink. 2010. Marine Ecological Risk Assessment for Kitimat Terminal Operations Technical Data Report. Prepared for Northern Gateway Pipelines Inc. Calgary, AB.
U.S. EPA (United States Environmental Protection Agency). 1998. Guidelines for Ecological Risk Assessment. EPA/630/R-95/002F.


Sec. 52 Application Volume 6B: Environmental and Socio-Economic Assessment (ESA) – Marine Terminal Section 15: Effects of the Environment on the Marine Terminal
May 2010 Page 15-1
15 Effects of the Environment on the Marine Terminal
15.1 Overview The marine terminal is seaward from the upper edge of the marine riparian area. It includes a 150-m wide safety zone seaward from the berthing structures. Infrastructure at the marine terminal includes two tanker berths equipped for loading oil tankers and unloading condensate tankers and one utility berth. Since 2005, studies have been undertaken by Northern Gateway to reduce effects on the environment to enhance the long-term integrity of the Kitimat Terminal.
The terminal has been configured to limit exposure to terrain hazards; however, ongoing geomorphic processes such as shallow to moderately deep landslides, debris flows, rockfall and tsunamis could, in the absence of suitable mitigation measures, result in damage to the marine terminal infrastructure. Detailed engineering design will take these potential hazards into account.
15.2 Effects of Slope Failure on the Marine Terminal Terrain instability has the potential to affect both project design and operations. A primary focus is slope stability and the potential for movements that might affect the integrity of the marine terminal. In particular, the following processes are considered:
• slope failure resulting from shallow to moderately deep slides, debris flows, and rock fall • seismicity • tsunami
15.2.1 Slope Failure Slope movements and failures such as shallow to moderately deep slides, debris flows and rockfall are naturally occurring phenomena. The west side of Kitimat Arm, above the marine terminal, has been identified through field investigations as a site that could be susceptible to slope failure. Specifically, small slides of overburden down steeply inclined slopes, small debris flows and possible local rock fall have been identified as potential hazards. Design of cut slopes required for site development and access will also require consideration of rock and soil stability. Rock fall and falls of snow or ice from cut slopes will be additional considerations. Variations in climate and weather patterns, in association with the local terrain and geological conditions, can produce changes to slide movement patterns and occurrences over time. Ongoing engineering studies have allowed for these kinds of issues, which will be further considered during detailed engineering.

Sec. 52 Application Volume 6B: Environmental and Socio-Economic Assessment (ESA) – Marine Terminal Section 15: Effects of the Environment on the Marine Terminal
Page 15-2 May 2010
15.2.1.1 Potential Changes
Potential effects on the marine terminal from changes in terrain stability are as follows:
• Shallow to moderately deep slides and debris flows generally result in the movement of soil and surficial materials. These kinds of slides might damage or disrupt marine terminal infrastructure.
• Rock fall might damage berthing infrastructure at the marine terminal.
• Snow or ice fall might be local hazards.
15.2.1.2 Design Considerations and Mitigation
General mitigation measures that will be considered include:
• avoid or limit problem areas with access routes to the terminal
• control ground and surface water to reduce infiltration and reduce the potential for triggering or accelerating slides
• provide catchment, control berms or use of other methods, if required, for control or routing of debris flows
• design rock and soil cuts to produce stable slopes and to control rock fall
• passive rock fall protection including meshing, anchoring, ditch and berm design and scaling
• active rock fall mitigation methods, such as catch fences, will be considered, if required
• remove glaciomarine clay soils in key areas, as required, along the access and the pipeline route to the marine terminal
Geotechnical considerations are provided in Volume 3, Appendix E.
15.2.1.3 Conclusion
Slope stability hazards at the marine terminal will be mitigated, as required. Given the project design and the mitigation measures, the remaining effects of slope failure on the marine terminal are predicted to be not significant.
15.2.2 Seismicity The seismic conditions along the coast from northern Vancouver Island to Haida Gwaii1
1 The name of Queen Charlotte Islands was changed to Haida Gwaii in December 2009. However, for consistency with source information used for mapping, Queen Charlotte Islands is used on all maps.
, and including the area west of Kitimat, are dominated by the oceanic Pacific Plate, which is sliding to the northwest at about 6 cm/year relative to the North American Continental Plate along the Queen Charlotte Fault on the western side of Haida Gwaii (Natural Resources Canada 2009, Internet site).

Sec. 52 Application Volume 6B: Environmental and Socio-Economic Assessment (ESA) – Marine Terminal Section 15: Effects of the Environment on the Marine Terminal
May 2010 Page 15-3
The largest historical earthquake in Canada (magnitude 8.1) occurred on the Queen Charlotte Fault on August 22, 1949 and most of the seismic events near the coast are associated with this fault (see Figure 15-1). However, since the Queen Charlotte Fault is over 300 km west of Kitimat, the level of ground shaking at Kitimat that would be produced by a large magnitude event would be only moderate.
SOURCE: Atkinson (2009)
Figure 15-1 Recorded Seismicity in Western Canada The figure shows recorded seismicity (magnitude greater than 1) through 2005 together with the Geological Survey of Canada R-model source zone models and sites used in seismic studies for the Project. The pipeline route is shown by the dashed black line. Note the absence of any large recorded earthquakes near the pipeline route. Most of the large seismic events have occurred along the Queen Charlotte Fault west of Haida Gwaii.
The source zones used in the seismic modelling are shown by the solid and dashed brown lines. The names are QCFR (Queen Charlotte Fault), HECR (Hecate Strait), CST (Coastal), NBC (Northern BC), ROC (Rocky Mountain Fold and Thrust Belt) and NAB (Northern Alberta). Three city locations shown are Edmonton (Edm), Prince George (P. Geo) and Prince Rupert (P. Rup).
On the mainland coast near Kitimat and farther east, only a few small events have been recorded. These events are likely located on crustal faults. The largest earthquake recorded in the southern Cordillera was a magnitude 6.0 in 1918 near Valemount in the Rocky Mountain trench, almost 300 km south of the pipeline route. In 1986, a magnitude 5.5 earthquake occurred near Prince George (60 km south of the pipeline route) causing some minor damage (Natural Resources Canada 2009, Internet site).

Sec. 52 Application Volume 6B: Environmental and Socio-Economic Assessment (ESA) – Marine Terminal Section 15: Effects of the Environment on the Marine Terminal
Page 15-4 May 2010
The seismic conditions at the west end of the pipeline route are characterized as moderate with peak ground accelerations (PGA) of 12%g (National Building Code of Canada [NBCC] Soil Type B equivalent to soft rock). To the east, the PGA values decrease to low but not zero values. Further information on seismicity relative to terrain hazards and to the design of the pipelines and infrastructure is provided in Volume 3, Appendix E.
Seismic conditions at the marine terminal are characterized as moderate, with PGA of 12%g (NBCC Soil Type B equivalent to soft rock). By comparison, the PGA for Vancouver is approximately 46%g (NBCC Soil Type C equivalent to dense soil) (NBCC 2005). All values quoted are for a return period of 1 in 2,475 years or approximately 1:2500 years.
The predicted level of seismic shaking at the Kitimat Terminal could be capable of inducing strength losses in susceptible zones of glaciomarine clays at the tank terminal, potentially resulting in low angle slides in some deposits. Marine clay will be removed in selected areas at the tank terminal, and the stability of remaining clays will be a factor in designs for the area. This will provide protection for the marine terminal.
Seismic shaking could potentially mobilize landslides or rockfalls. Such movements would most likely occur on pre-existing slides or on terrain susceptible to such failures, and would involve movements of existing slides or areas prone to failure such as rockfall. In general, slope stability is a geotechnical consideration and terrain susceptible to such movements would most likely be considered susceptible to movement under non-seismic conditions. Infrastructure, including the marine terminal, has generally been located to avoid areas prone to slope movement. The mitigation strategies for non-seismic slide considerations will also serve to mitigate seismic conditions. As a result, potential effects on the marine terminal will be mitigated.
15.2.2.1 Potential Changes
Potential effects on the marine terminal from seismic events and corresponding design measures:
• Landslides, including slides in glaciomarine sensitive clays, might occur in response to seismic motions, but the potential for movement will be mitigated during design for static conditions. The effect will be not significant.
• Glaciomarine clay, which might be susceptible to seismically induced sliding, will be removed from selected areas, such as below tank foundations; in other areas, its removal will be considered during detailed design.
• Cut slopes will be designed to allow for seismic motions.
• Infrastructure will be designed with appropriate consideration of seismic conditions.
15.2.2.2 Design Considerations and Mitigation
The marine terminal will be designed for appropriate seismic forces with reference to applicable codes and engineering practice. Mitigation strategies are further detailed in the Environmental Protection and Management Plan (Volume 7A). Geotechnical considerations are provided in Volume 3, Appendix E.

Sec. 52 Application Volume 6B: Environmental and Socio-Economic Assessment (ESA) – Marine Terminal Section 15: Effects of the Environment on the Marine Terminal
May 2010 Page 15-5
Operating protocols will include definition of operating procedures relative to seismic events of defined magnitudes. The operating protocols will include definition of seismic conditions under which the Project would continue to operate or be shut down for further evaluation.
15.2.2.3 Conclusion
Seismic effects on the marine terminal can be satisfactorily mitigated by appropriate design measures. The remaining effects of seismicity on the marine terminal are predicted to be not significant.
15.2.3 Tsunami A tsunami is a series of waves with long wave length and period, generated in a body of water by an impulsive disturbance that displaces the water. Tsunamis triggered by subaqueous fault movements (usually associated with large earthquakes), subaqueous landslides and terrestrial landslides entering Kitimat Arm have been considered. Further details are provided in Volume 3, Appendix E.
15.2.3.1 Seismically Induced Tsunamis
Large seismically induced tsunami events have occurred at many locations around the Pacific Basin, including very large events generated by the year 1700 subduction earthquake on the Cascadia Subduction Zone, west of Vancouver Island. It is probable that the North Coast fjords are protected to a large extent by Haida Gwaii and other coastal islands from Cascadia subduction zone tsunamis; however, some effects may be felt as a result of refracted waves. There are no faults in the immediate vicinity of the Project that could generate a tsunami event. An evaluation of seismically generated tsunami amplitudes for the British Columbia coast indicated that the maximum expected tsunami deep water amplitude is about 2 m in Kitimat Arm, originating from a seismic event similar to the 1964 Alaskan Earthquake (Dunbar et al. 1989). Surface water current speeds under deepwater conditions are predicted to be between 0.02 to 0.03 m/s and the time of rise from mean sea level to maximum would be about half an hour. Such events will be accounted for in the design of dock freeboards and other structural considerations; therefore, they will not pose an undue hazard to ships at berth or to the marine terminal.
15.2.3.2 Landslide-Induced Tsunamis
Landslide-generated tsunamis can be caused both by subaerial landslides that enter a standing waterbody and by subaqueous (underwater) slides. There have been two subaqueous failures in the northern part of Kitimat Arm that have resulted in tsunamis in 1974 and 1975. No sources of subaerial landslides that could generate a large tsunami have been identified in Kitimat Arm.
On October 17, 1974, shortly after low tide and immediately following unusually high flows in the Kitimat River, an approximately 20 ft (6.1 m) high wave occurred. The river flows were the highest on record to that date (10 years of record to 1974) and correlation with other river flow records suggests that they were probably the highest flows over a period of at least 25 years. The initial occurrence at Kitamaat Village on the east side of the arm was reported to be a wave trough indicating that the wave was moving toward the west. This wave has been associated with an underwater slide at the northeast corner of the arm. There was no reported damage to wharves in the area, although the wave did loosen the moorings of a barge and damaged boats in nearby marinas.

Sec. 52 Application Volume 6B: Environmental and Socio-Economic Assessment (ESA) – Marine Terminal Section 15: Effects of the Environment on the Marine Terminal
Page 15-6 May 2010
The second significant tsunami event in the Kitimat Arm area occurred on April 27, 1975 at about 10:05 am, shortly after low tide. The wave was approximately 25 ft (7.6 m) high. The slide that caused this failure was apparently associated with construction activities, specifically fills placed at Moon Bay at the northwest corner of the arm. By the end of January 1975, Rivtow Straits had built a timber crib wharf structure (75 m x 20 m) at Moon Bay, on the west side of Kitimat Arm. The face of the crib was 6 m to 7.5 m high with fill having been emplaced outward from the beach to create a loading platform. At the time of failure, in late April, Rivtow Straits was in the process of constructing a breakwater from rockfill and dredged material obtained from the shallow subtidal zone just seaward of the construction site. The breakwater was below the high tide level at the time of failure. The failure started at the breakwater and within two minutes had propagated around the shoreline to the crib wharf area which was engulfed in the failure and swept away. The failure, which took place in soft cohesive marine clay and material from the delta front, ran down the sidewall of the arm and several kilometers down the arm. Retrogressive failures continued through April 28 and included subaerial erosion but caused no tsunamis. Direct damage was $1.32 million (1986 dollars).
15.2.3.3 Summary
Tsunamis generated by local underwater slides are possible in Kitimat Arm. Two events occurred over a six-month period in 1974-1975. These two events appear to have been the only major events over a very long time, at least for several hundred years. Ongoing work is expected to continue to increase the understanding of the subaqueous slide potential in Kitimat Arm. Work to date suggests that the potential for a naturally occurring tsunamigenic slide in Kitimat Arm is low. During detailed engineering, other sources of potential slides along Kitimat Arm will be investigated and a review will be completed of the likely magnitude and frequency for potential future tsunami events relative to the berthing structures. It appears that the 1975 event could have been avoided by appropriate engineering investigations and design.
Seismically generated tsunamis appear be negligible for ships at berth.
15.2.3.4 Potential Changes
Based on information available to date, potential effects on the marine terminal from a tsunami event include higher than usual water levels at the berthing structures and possibly waves from naturally occurring tsunamis in Kitimat Arm. The potential effects of tsunamis are limited to the marine terminal and ships at the berths; no other infrastructure such as the tank terminal or pipeline would be directly affected.
15.2.3.5 Design Considerations and Mitigation
Further work to determine the magnitude and frequency of tsunami events in Kitimat Arm will be carried out during detailed design. The design and operation of the marine terminal will take into account appropriate wave heights and characteristics. Warning systems for tsunamis generated by offshore earthquakes will be coordinated with existing Pacific Basin tsunami warning systems. Infrastructure and operational methods will be designed to take account of tsunamis that would likely to be generated by
Sec. 52 Application Volume 6B: Environmental and Socio-Economic Assessment (ESA) – Marine Terminal Section 15: Effects of the Environment on the Marine Terminal
May 2010 Page 15-7
underwater slides. This information will also be available to regulatory bodies concerning investigation and design relative to large fills that may be proposed by others in the Kitimat Arm area.
15.2.3.6 Conclusion
During detailed engineering, further work will be done on the potential effects posed by tsunamis on the marine terminal, berthed vessels, and operational activities. Based on presently available information, the potential effects of tsunamis can be mitigated by suitable design and operation methods. The residual effects of a tsunami on the marine terminal are predicted to be not significant.
15.3 References
15.3.1 Literature Cited Atkinson, G.M. 2009. Preliminary Seismic Evaluation of Enbridge Northern Gateway Pipelines Project.
Report prepared for AMEC Earth & Environmental.
Dunbar, D.S., P.H. Leblond and D.O. Hodgins. 1989. Evaluation of Tsunami Levels along the British Columbia Coast. Report prepared for Fisheries and Oceans Canada (DFO).
National Building Code of Canada (NBCC). 2005. National Research Council of Canada, Division B, Appendix C Climatic and Seismic Information for Building Design in Canada, Commentary J Design for Seismic Effects.
15.3.2 Internet Sites Natural Resources Canada. 2009. Seismic zones in Western Canada. Background on Earthquakes in
Western Canada. Available at: http://earthquakescanada.nrcan.gc.ca/zones/westcan-eng.php


Sec. 52 Application Volume 6B: Environmental and Socio-Economic Assessment (ESA) – Marine Terminal Section 16: Conclusion
May 2010 Page 16-1
16 Conclusion Volume 6B of the environmental and socio-economic assessment (ESA) identifies and evaluates potential effects on the environment from the Project’s marine terminal activities, specifically activities related to the marine terminal’s construction, operations, and decommissioning.
The following valued environmental components (VECs) are assessed for potential environmental effects from the Project:
• marine sediment and water quality
• marine vegetation
• marine invertebrates
• marine fish
• marine mammals
• marine birds
• marine fisheries (commercial fisheries; food, social and ceremonial (FSC) fisheries; commercial-recreational fishing; and recreational fishing)
16.1 Mitigation Measures Examples of mitigation measures to address project effects at the marine terminal on the marine environment include:
• developing work windows, in consultation with Fisheries and Oceans Canada (DFO), for inwater site preparation and construction activities to consider sensitive natural processes such as nesting or spawning periods
• deploying silt curtains to reduce dispersion and duration of suspended sediments
• developing, in consultation with the DFO, a blasting management plan
• deploying bubble curtains to contain shock waves and reduce underwater noise propagation
• implementing a monitoring and detection program to assure activities do not start, and are stopped, when marine mammals are within a predetermined danger zone
16.2 Summary of Environmental Effects Potential effects on water and sediment quality, changes in habitat, physical injury or direct mortality, and restricted access or aesthetic effects are broad categories that capture issues for all VECs in the assessment. The construction phase has the greatest potential for adverse effects for the identified VECs. Site preparation and infrastructure development will include dredging, blasting, grading and pile drilling. These activities could create acoustical disturbances, change habitat, affect habitat quality through resuspension of sediment and increase the risk of injury or direct mortality. Decommissioning activities

Sec. 52 Application Volume 6B: Environmental and Socio-Economic Assessment (ESA) – Marine Terminal Section 16: Conclusion
Page 16-2 May 2010
are determined to be of least concern—the activities will cause the least disturbance and mitigation developed for construction activities will be effective in the decommissioning phase.
After the application of mitigation, there will be residual environmental effects. Dredging will create a localized sediment plume, inwater site preparation and installation of marine terminal infrastructure will alter a small proportion of the available marine habitat in the project development area (PDA), berthed tankers will create sound that will be heard by whales in the project effects assessment area and fishing will be restricted from the PDA. In no case is any effect found to be significant, either as a stand-alone project effect or as a contributor to the cumulative effects of projects in the area.
Species monitoring will be done for some species of fish and catch statistics will be monitored for the four categories of marine fisheries. In many cases, further follow-up and monitoring is not warranted given a high level of confidence that the effects of the Project are not significant.
Sec. 52 Application Volume 6B: Environmental and Socio-Economic Assessment (ESA) – Marine Terminal Section 17: Acronyms and Abbreviations
May 2010 Page 17-1
17 Acronyms and Abbreviations μmol/g .................................................................................................. micromole per gram µPa ..................................................................................................................... micropascal 3D ............................................................................................................. three-dimensional AHD .......................................................................................... acoustic harassment device asl ................................................................................................................. above sea level ATK .................................................................................. Aboriginal traditional knowledge ATV .......................................................................................................... all-terrain vehicle AVS ..................................................................................................... acid volatile sulphide AVS/SEM .............................. acid volatile sulphides/simultaneous extracted metals (ratio) BC .............................................................................................................. British Columbia BCCDC ........................................................... British Columbia Conservation Data Centre BCCSN ............................................................................... BC Cetacean Sighting Network BOD ........................................................................................... biological oxygen demand BSC ...................................................................................................... Bird Studies Canada BTEX .............................................................. benzene, toluene, ethylbenzene and xylenes Can$ ............................................................................................................ Canadian dollar CCAA .............................................................................. confined channel assessment area CCME ........................................................ Canadian Council of Ministers of Environment CHC5 ............................................... chronically hazardous concentration – fifth percentile cm/year ................................................................................................. centimetres per year CMMRT ......................................................... Canadian Marbled Murrelet Recovery Team CO2 ................................................................................................................ carbon dioxide COD ............................................................................................. chemical oxygen demand COPC .................................................................................... chemical of potential concern COSEWIC .............................. Committee on the Status of Endangered Wildlife in Canada CWS .................................................................................................. Canada-wide standard dB .............................................................................................................................. decibel dBA ....................................................................................................... A-weighted decibel dBRMS ....................................................................... root-mean-square sound pressure level DFO ........................................................................................ Fisheries and Oceans Canada DL ...................................................................................................................detection limit dwt ............................................................................................................ deadweight tonne EPA ................................................................................ Environmental Protection Agency EPC ......................................................................................... exposure point concentration EPMP ................................ Construction Environmental Protection and Management Plan ERA ............................................................................................. ecological risk assessment ERM ............................................................................. ecosystem-based resource mapping ESA ............................................................ environmental and socio-economic assessment EVS ................................................................................... EVS Environmental Consultants FLC ............................................................................................. fisheries liaison committee

Sec. 52 Application Volume 6B: Environmental and Socio-Economic Assessment (ESA) – Marine Terminal Section 17: Acronyms and Abbreviations
Page 17-2 May 2010
FMA ......................................................................................... Fisheries Management Area FSC ............................................................................................ food, social and ceremonial HADD ............................................................. harmful alteration, disruption or destruction HHWLT.................................................................................... higher high water, large tide HPAH ......................................... high molecular weight polycyclic aromatic hydrocarbons HQ ................................................................................................................ hazard quotient Hz .................................................................................................................................. hertz ILMB ......................................................................... Integrated Land Management Bureau ISQG ............................................................................... interim sediment quality guideline JASCO ............................................................................................... JASCO Research Ltd. kHz ......................................................................................................................... kilohertz KI ...................................................................................................................... key indicator KLNG ....................................................................................................... Kitimat LNG Inc. KP ................................................................................................................... kilometre post kPa ........................................................................................................................ kilopascal Leq .......................................................................................... energy equivalent sound level LNG ...................................................................................................... liquefied natural gas LPAH .......................................... low molecular weight polycyclic aromatic hydrocarbons m2/a .................................................................................................... square metres per year m3 ...................................................................................................................... cubic metres MBCA ................................................................................ Migratory Birds Convention Act mg/kg .............................................................................................. milligrams per kilogram mg/L ....................................................................................................... milligrams per litre MHz ...................................................................................................................... megahertz MMO ............................................................................................ marine mammal observer MMS ..................................................................................... Minerals Management Service MOE .............................................................................................. Ministry of Environment NA ............................................................................................................ data not available NMFS ............................................................................. National Marine Fisheries Service Northern Gateway ................................... Northern Gateway Pipelines Limited Partnership NP .................................................................................................................... North Pacific NR ............................................................................................................. northern resident NRC ............................................................................................ National Research Council NTU .......................................................................................... nephelometric turbidity unit OCDD ....................................................................................... octachlorodibenzo-p-dioxin PAH .................................................................................. polycyclic aromatic hydrocarbon PCB ............................................................................................... polychlorinated biphenyl PDA .............................................................................................. project development area PEAA ................................................................................... project effects assessment area PEL ..................................................................................................... probable effects level pg ............................................................................................................................ picogram pg/g ........................................................................................................ picograms per gram POP ............................................................................................ persistent organic pollutant

Sec. 52 Application Volume 6B: Environmental and Socio-Economic Assessment (ESA) – Marine Terminal Section 17: Acronyms and Abbreviations
May 2010 Page 17-3
ppm ............................................................................................................. parts per million ppt ............................................................................................................ parts per thousand PTS ............................................................................................... permanent threshold shift REAA ................................................................................. regional effects assessment area ROV ............................................................................................ remotely operated vehicle SARA ....................................................................................................... Species at Risk Act SCUBA ........................................................ self-contained underwater breathing apparatus SDJV ............................................................................................... Sea Duck Joint Venture SEM ....................................................................................simultaneously extracted metals SPL ....................................................................................................... sound pressure level spp. .................................................................................................................... species (pl.) SRANK ................................................................... (provincial) Conservation Status Rank TCDD ........................................................................... 2,3,7,8 tetrachlorodibenzo-p-dioxin TDR ...................................................................................................... technical data report TEF ............................................................................................. toxicity equivalency factor TEM ...................................................................................... terrestrial ecosystem mapping TEQ ......................................................................................................... toxicity equivalent TOC ....................................................................................................... total organic carbon TPH ........................................................................................ total petroleum hydrocarbons TRV ................................................................................................. toxicity reference value TSS ..................................................................................................... total suspended solids TTS ............................................................................................... temporary threshold shift VEC ................................................................................. valued environmental component VHF ....................................................................................................... very high frequency VLCC .............................................................................................. very large crude carrier VOC ........................................................................................... volatile organic compound VS ............................................................................................................... Voith-Schneider WHO ......................................................................................... World Health Organization WMP ............................................................................................... water management plan


Sec. 52 Application Volume 6B: Environmental and Socio-Economic Assessment (ESA) – Marine Terminal Section 18: Glossary
May 2010 Page 18-1
18 Glossary abiotic Physical rather than biological; not derived from living organisms.
acoustic blankets Typically quilted insulation sheeting placed around industrial and construction equipment to attenuate sound during operation, especially where the sound exceeds hearing threshold limits. For this assessment, includes bubble curtains.
acoustic harassment device Loud underwater sound emitter used to deter marine mammals from entering aquaculture operations.
action level A level that is decided upon for when action (such as a fishery closure) occurs.
acute In toxicology, a toxicity test, exposure, or response to a chemical substance that is completed or manifests in a short timeframe, usually less than 30 days.
adaptive management A structured, iterative process of optimal decision making in the face of uncertainty, with an aim to reducing uncertainty over time via system monitoring.
additive interaction In toxicology, chemicals that are structurally similar, that have similar mechanisms of toxicity, and affect the same target tissue or organ in the body, may be assumed to have additive toxicity.
algae A large and diverse group of simple, typically autotrophic organisms that are photosynthetic like terrestrial plants. The largest and most complex marine forms are seaweed. (See phytoplankton.)
aliphatic In relation to petroleum hydrocarbons, aliphatic hydrocarbons are those that do not contain aromatic rings; rather they are linear or branched molecules.
allometric model A model scaling a physiological process or the toxicity of a chemical substance to the size or body weight of an animal.
amphipod A member of an order of animals that includes many species of small shrimp-like crustaceans with feet on both sides of the carapace.
anadromous fish Fish that travel up freshwater watercourses from the sea to spawn.
aquaculture The farming of organisms including molluscs, crustaceans and aquatic plants, implying the cultivation of aquatic populations under controlled conditions.

Sec. 52 Application Volume 6B: Environmental and Socio-Economic Assessment (ESA) – Marine Terminal Section 18: Glossary
Page 18-2 May 2010
aromatic In relation to petroleum hydrocarbons, aromatic hydrocarbons are those that have a molecular structure characterized by the presence of one or more aromatic ring structures composed of six carbon atoms with double bonds, as in the case of benzene.
audiogram Auditory sensitivity represented in a graphical manner. Audiograms are species-specific curves of absolute auditory threshold (threshold in the absence of much background noise) versus frequency.
auditory threshold The point at which an animal can begin to detect sound in the absence of significant background noise. Auditory thresholds vary with frequency and are species-specific.
avian Pertaining to or derived from birds.
avifauna Birds.
Base Case The existing environment potentially affected, or baseline conditions that were measured or reported as analytical data.
baseline conditions The environmental, social, economic and community conditions existing before the construction and operation of a project. These conditions are assumed to include the effects of other past and present projects and activities. Used as the starting point to determine project effects.
bathymetry Seafloor terrain as measured by depth sounding or radar.
benchmark In ecological risk assessment, a target concentration to which predicted concentrations of chemical substances can be compared to determine whether risks are assessed.
benthic Refers to a region at or near the bottom of a body of water, or to organisms living there.
berth The space allotted to a vessel at anchor or at a wharf. The Kitimat Terminal has two tanker berths and one utility berth.
bioaccumulation A term used to describe the processes by which a chemical may be accumulated by organisms as a result of exposure to that chemical in water, sediment or soil.
bioavailability The fraction of the total amount of a chemical in environmental media (i.e., water, sediment, soil or biological tissues ingested as food), which can be absorbed by an organism either directly from the media as a result of external exposure, or after being ingested.
biodiversity The variety of life forms within a given ecosystem, often used as a measure of system health. Its reduction over a range leading to monoculture is generally considered to degrade the health of the ecosystem.

Sec. 52 Application Volume 6B: Environmental and Socio-Economic Assessment (ESA) – Marine Terminal Section 18: Glossary
May 2010 Page 18-3
bioherm A mass of rock constructed from the remains of marine organisms, such as coral, molluscs or algae.
biomagnification The sequence of processes resulting in higher concentrations of chemical contaminant substances in organisms at higher levels in the food chain (at higher trophic levels).
biomass The amount of living biological organisms in a given area or ecosystem at a given time. (In fisheries, the total weight of all fish in the stock, added together.)
biotic Relating to life or to living organisms.
biotoxin A toxic substance produced by a living organism.
bioturbation The mixing of sediment by living organisms.
bivalve A marine or freshwater mollusc belonging to the taxonomic class Bivalvia. It has a soft body with plate-like gills enclosed within two shells hinged together.
bubble curtain An air manifold made of rubber, plastic, or steel tubing that distributes many small air bubbles around a marine piling while it is being driven, to reduce acoustic propagation that could harm nearby fish or marine mammals.
by-catch Fish caught incidentally when fishers are in pursuit of a directed species.
catch ceiling A total allowable catch defined by a pre-season biomass forecast, or survey biomass index and harvest rate of 25% to 33%, or defined by an arbitrary precautionary quota.
cetacean A member of the taxonomic order that includes mammals, such as whales, dolphins and porpoises, with fin-like forelimbs but no hind limbs.
chronic In toxicology, a toxicity test, exposure, or response to a chemical substance that is completed or manifest over a long period of time, usually more than 90 days, and commonly extending to one or more life spans.
clamshell dredge Least invasive dredging method. Only about 1% of the material from each grab will escape from the clamshell underwater.
closed pond Where commercial fishers catch herring in spawning condition and place them in an enclosed pond with kelp lines.
commercial fishery The capture of fish or invertebrates for commercial purposes.
condensate A low volatility hydrocarbon equivalent to diluent.

Sec. 52 Application Volume 6B: Environmental and Socio-Economic Assessment (ESA) – Marine Terminal Section 18: Glossary
Page 18-4 May 2010
congener A variant configuration of a common chemical structure; e.g., polychlorinated biphenyls (PCBs) occur in 209 different forms, or congeners.
conservative In risk assessment, a philosophy of conservatism is widely used to ensure that risks are more likely to be overestimated, than underestimated. For example, when a parameter value or COPC concentration in the environment is not known with a high level of confidence, a value will be conservatively selected so that the estimated risk is likely to err on the high side, rather than being underestimated.
conservation Sustainable use that safeguards ecological processes and genetic diversity for present and future generations.
constraints mapping A technique that uses geographic information systems (GIS) technology to assign values to spatial data to produce a map that represents the highest to lowest environmental risk for a study area.
contaminant Any potentially toxic material accumulated in the atmosphere, on land, in sediment, or dissolved in water, often attributed to ongoing or historic human activities.
continental shelf The submerged margin of a continental mass extending from the shore to the first prominent break in slope.
creel survey An accurate and reliable technique used to obtain information on a recreational fishery. It involves interviewing anglers to collect details about, catch (species, length, weight), time spent fishing, type of fishing (boat or shore) and the distance they have travelled to go fishing.
critical habitat A geographical area occupied by a species that is essential for its survival.
decking Dividing a required blast into two or more smaller detonations that are staged to mitigate the overpressure of a single blast.
demersal Living, or found, near or in the deepest part of a body of water.
demographics The statistical data of a population, especially those showing average age, income and education.
diluted bitumen
A hydrocarbon consisting of bitumen diluted with condensate in order to reduce its viscosity, rendering it suitable to be transported via a pipeline. In addition to condensate, other substances can be used as the diluent (e.g., naphtha and synthetic oil).

Sec. 52 Application Volume 6B: Environmental and Socio-Economic Assessment (ESA) – Marine Terminal Section 18: Glossary
May 2010 Page 18-5
dioxins A group of toxic organic chemicals that form as airborne by-products of human activities such as fuel combustion, or of natural processes such as forest fires and volcanoes. After depositing in water, dioxins bind to small particles or plankton and progressively accumulate in larger species up the food chain.
dredging Bulk removal of underwater material with a dredge and barge.
echolocation Mechanism used by some marine mammals (e.g., dolphins and porpoises) to detect prey and obstacles. Sounds produced by the marine mammal bounce off objects or other species in the environment, then return to the marine mammal and are interpreted.
ecological Related to the interdependence of living organisms in an environment.
ecosystem An integrated and stable association of all living organisms and the nonliving physical and chemical factors of their environment, within a defined physical location.
endangered A species facing imminent extirpation or extinction.
energetic Possessing, exerting or displaying energy.
Enteromorpha A genus of green algae that is dominant in coastal wetlands with high nitrogen levels.
estuarine circulation Occurs when fresh or brackish water flows seaward near the surface of an estuary, while denser, more saline ocean water flows inward by convection near the bottom.
euphotic zone Near-surface water body layers with sufficient sunlight penetration to allow photosynthesis in organisms such as phytoplankton (algae).
eutrophication Excessive accumulation of nitrogen or phosphorus-bearing nutrients, commonly from runoff into in an aquatic ecosystem, often resulting in increased algae that starve fish and other marine species of oxygen.
exclusion zone The zone around the marine PDA from which vessels are excluded. (See marine safety zone.)
exposure point concentration A conservative estimate of the average concentration of a chemical substance in water, sediment, soil, or food (i.e., biological tissues) that an organism may be exposed to in the environment.
fauna Animal species.
fish habitat Spawning and nursery grounds, rearing, food supply and migration areas on which fish, shellfish and crustaceans depend directly or indirectly to carry out their life processes.

Sec. 52 Application Volume 6B: Environmental and Socio-Economic Assessment (ESA) – Marine Terminal Section 18: Glossary
Page 18-6 May 2010
Fisheries Liaison Committee A group consisting of Northern Gateway staff, other industrial users in Kitimat Arm, and a broad range of local fishers, intended to promote communication and mutual understanding and develop ways to minimize project-related effects on the fisheries.
fishery The occupation or industry of catching, processing, or selling fish or shellfish.
fishing effort The amount of fishing used to obtain the catch. It can be expressed in numbers of traps hauled, hours or days trawling, and numbers of hooks on longlines.
fishing gear Gear used to catch fish or other species, i.e., gill nets, traps, longlines and seine nets.
fitness The ability of an individual (or population) to survive and reproduce in a given environment.
fixed gear A type of fishing gear that is set in a stationary position. Examples include longlines, handlines and gillnets.
fledging The process or parental care of a young bird, i.e., a fledgling, learning to fly.
flora Plant species.
food, social and ceremonial fishery
First Nations’ domestic fishing rights, which have priority second only to conservation.
fugitive emission Emissions from a facility that are uncontrolled, or incompletely controlled, and which may be released from an area or from many small point sources, as opposed to stack emissions, which are released from a single point source and are more readily amenable to control measures and monitoring.
furans One of a group of toxic organic chemicals. (See dioxins.)
generation time the time required for a generation of individuals to be born, reach sexual maturity, and reproduce
geoduck A very large edible clam.
gill net A monofilament netting that is either weighted to the ocean floor or set adrift. Fish are caught as they try to swim through the webbing, entangling their gills.
groundfish Fish that generally feed and dwell near the bottom (the ‘ground’) of the ocean.
habitat The natural environment of an organism; a place that is natural for the life and growth of an organism.

Sec. 52 Application Volume 6B: Environmental and Socio-Economic Assessment (ESA) – Marine Terminal Section 18: Glossary
May 2010 Page 18-7
habitat suitability The ability of a habitat to support survival and reproduction of wildlife or a wildlife species.
half-life The period of time required for the loss, degradation, or radioactive decay of a quantity of a substance to one-half the original quantity of that substance.
halocline A vertical zone below the uniformly saline mixed surface layer in an ocean water column, in which salinity changes rapidly with depth. Water density can be affected when temperature changes are involved. (See thermocline.)
hatchery A facility where fish eggs are hatched and the young (fry) are raised, especially stock populations.
hazard quotient Where chemical substances have additive interactions, the hazard index values for two or more substances may be summed to estimate a hazard quotient for a class of substances having similar chemical structure, mode of toxic action, and target tissue or organ. Where a hazard quotient value is less than one, it is concluded that there is not a significant risk present.
hazing The use of techniques such as small exploding devices, alarm recordings or raptor call broadcasts, to prompt birds to move away from a blasting zone or other construction hazard.
hookline Fishing gear consisting of a series of baited hooks attached to a long line. The line can be weighted, for fishing on the ocean bottom, or be suspended on floats in the water column. This is a type of fixed gear. (See also longline.)
horse clam A clam that lives in the sand and mud.
hydrophone A microphone designed to be used underwater for recording or listening to underwater sound.
incidental fishery See by-catch.
infaunal Living within bottom sediments just below the surface of the seabed.
intertidal zone The area of the shoreline exposed and submerged by the tide cycle.
invertebrate An organism that does not have a backbone, such as a crab or mollusk.
isopod A member of an order of small crustaceans with seven pairs of legs.
kelp A large, brown, cold-water seaweed.
Kitimat Terminal
In the context of the ESA, the Kitimat Terminal includes both marine and land-based infrastructure associated with the tank terminal and the marine terminal to be developed near Kitimat, British Columbia, as part of the Enbridge Northern Gateway Project.

Sec. 52 Application Volume 6B: Environmental and Socio-Economic Assessment (ESA) – Marine Terminal Section 18: Glossary
Page 18-8 May 2010
landings The landed amount of a species that has been caught.
littoral Shallow shore area where light can usually penetrate to the bottom and that is often occupied by rooted aquatic plants. The extent of the plants might mark the boundaries of the zone.
live capture fishery The occupation or industry of capturing live aquatic animals for aquaria or zoos without harming them.
longline Fishing gear consisting of a series of baited hooks attached to a long line. The line can be weighted, for fishing on the ocean bottom, or be suspended on floats in the water column. This is a type of fixed gear. (See also hookline.)
Macrocystis A genus of giant brown kelp that can grow in depths of 30 m or more, with upper portions floated on the sea surface by air bladders.
macrophyte An aquatic plant growing in intertidal areas that provides cover and substrate for marine invertebrates, produces oxygen, and acts as food.
marine invertebrate An aquatic organism, such as a crab or mollusc, without a backbone.
marine riparian vegetation Any vegetation on land within 20 to 30 m of the tidewater, forming the interface between terrestrial and aquatic ecosystems. For example, the marine terminal riparian zone hosts western hemlock, red cedar, firs, Sitka spruce and small shrubs.
marine safety zone A 150-m exclusion zone in Kitimat Arm (including a 100-m water lot) seaward of marine terminal berth structures, created to satisfy the safety and security requirements of the Project.
masking Obscuring of sounds by interfering sounds of similar frequencies.
matriline The fundamental communal unit of resident killer whales, comprising all surviving descendants of a female lineage.
measured baseline Measured concentrations of chemical substances in the project effects assessment area, used to estimate existing levels of risk to the marine environment.
migration The movement of a population from one area to another for purposes such as feeding or breeding.
mitigation Measures to avoid, reduce or eliminate adverse effects on the environment, society, economies and communities.
moulting A process in which birds’ feathers spontaneously regenerate. Almost all species of birds moult at least annually, usually after the breeding season. This is known as the prebasic moult.
mudline Surface substrate or material (rock, sand or mud).

Sec. 52 Application Volume 6B: Environmental and Socio-Economic Assessment (ESA) – Marine Terminal Section 18: Glossary
May 2010 Page 18-9
mysticete A baleen or filter-feeding cetacean, such as a humpback whale.
natural recruitment The establishment of species through natural processes.
odontocete A toothed cetacean, such as a killer whale.
old-growth coniferous forests A type of forest that has attained great age and so exhibits unique biological features.
open pond Where herring in the ocean environment choose lines that have been placed in known spawning areas as a substrate to spawn on.
overpressure Blast overpressure is the sharp instantaneous rise in ambient atmospheric pressure resulting from explosive detonation.
paralethal effects Near-lethal effects. Paralethal and lethal effects include reduced fish growth rate and density, delayed hatching, increased predation, moderate to severe habitat degradation and incremental rates of mortality.
paralytic shellfish poisoning Food poisoning that results from the consumption of shellfish.
pascal The unit of measure for sound pressure waves. Pressure is measured as force (by newton) per unit area, thus one pascal is equivalent to one newton per square metre.
peak–peak The difference between the maximum positive and maximum negative instantaneous peak pressure.
pelagic Inhabiting the open sea over or beyond the continental shelf and returning to shore only to breed.
perch deterrents Devices such as triangles, single dowels, multiple points and anti-perching irons that are placed on dangerous infrastructure (e.g., powerlines and poles) to deter birds from perching there.
permanent threshold shift A permanent impairment of hearing sensitivity, which does not return to pre-sound-exposure levels.
persistent organic pollutants Chemical substances that persist and travel in the environment, bioaccumulate up the food chain in animal tissues, and can have significant adverse effects on all living organisms. As industrial products or by-products found in pesticides, solvents, fire-retardants, or pharmaceuticals, most are chlorine-benzene compounds like polycyclic aromatic hydrocarbons such as dioxins and furans, or polychlorinated biphenyls.
photic Designating or relating to the layer of a water body that is penetrated by sufficient sunlight to allow photosynthesis to occur.

Sec. 52 Application Volume 6B: Environmental and Socio-Economic Assessment (ESA) – Marine Terminal Section 18: Glossary
Page 18-10 May 2010
phytoplankton Microscopic plants that live by photosynthesis in the surface layer of oceans and other water bodies. Often in mass groups that appear green because of the chlorophyll in their cells, they account for half of all photosynthetic activity on Earth and much of the oxygen in the Earth's atmosphere.
pinniped A semi-aquatic mammal, such as a seal, sea lion or walrus.
plankton Aquatic organisms, including zooplankton and phytoplankton, that live in the surface layer of oceans and other water bodies and play a significant role in aquatic food webs and in aquatic and atmospheric oxygen balances. Zooplankton include minute animals such as protozoans, as well as larger ones such as jellyfish, copepods, or krill, while phytoplankton or algae are microscopic plant species that live by photosynthesis, often in large concentrations or ‘blooms’.
plume A measurable and often visible area of increased TSS spreading into a body of water from a source of disturbance or effluent such as a waste pipe or tributary stream.
polychlorinated biphenyls A class of toxic organic chemical compounds, once widely used in adhesives, paints, fire retardants, and as coolants, whose production had been widely banned by 1979. Some use continues in closed systems such as capacitors and transformers. PCBs are known to persist in sediments in Kitimat Arm.
polycyclic aromatic hydrocarbons
A group of 16 toxic chemicals from a variety of sources including atmospheric and effluent discharge from aluminum smelters, woodstove exhaust and residential waste.
prawn The spot shrimp, Pandalus platyceros.
prebasic moult The moult by which most birds replace all of their feathers, usually occurring annually after the breeding season.
probable effects level The level above which adverse effects are expected to occur frequently.
pseudofaeces Material removed from the water flow, aggregated, and rejected before it enters the gut of filter feeders.
raptors Birds of prey such as eagles, hawks, or falcons.
recolonization The reclaiming of species habitat disturbed during construction.
restoration Activities beyond reclamation including measures to restore the ecological integrity of affected lands.
ring-net fishing A two-boat operation, where each boat has an end of the net, and one boat tows the end of the net around to meet the other boat, essentially forming a ring or circle. The boats then close the ring and the net is hauled in.

Sec. 52 Application Volume 6B: Environmental and Socio-Economic Assessment (ESA) – Marine Terminal Section 18: Glossary
May 2010 Page 18-11
rookeries In the context of this assessment, onshore locations used by Steller sea lions for mating, pupping and pup rearing.
salmon Fish species of the Salmonidae family. Salmon species spawn in fresh water but live at sea, returning to the rivers only to reproduce.
sediment parameters General characteristics, such as particle size and total organic carbon content, as well as specific contaminants, including hydrocarbons, metals, dioxins and furans.
seine net A large fishing net suspended from floatlines on the water surface that hangs vertically in the water like a long fence, with weights attached along its bottom edge. It is used to encircle a school of fish, with a boat pulling one end and driving around the area in a circle.
sensory disturbance Unfamiliar strong noise, light, or obstacles inducing collision. Sensory disturbance from project construction activities (e.g., from drilling, blasting, pile driving, dredging, aviation, lights at night, etc.) is predicted to be not significant to marine birds.
sessile Fixed in one position; immobile (e.g., mussels and sponges).
shrimp Species of Pandalus, except for P. platyceros, and all species of Pandalopsis.
silt curtain An extended length of polypropylene sheeting suspended from floatation units and weighted with chain along its bottom edge. It is deployed from the shoreline out to a given water depth to control silt dispersal during dredging.
silt fence Woven geotextile fabric attached to wooden stakes at regular intervals along a site perimeter, to prevent or control erosion or siltation during construction and land clearing activities.
skein Fish eggs still held in the membrane of adult fish.
sound pressure level The local pressure deviation from the ambient (average, or equilibrium) pressure caused by a sound wave.
spawner index The biological reference point to which a fishery is managed. A measure of the average number of females or transitions (pre-females) caught per standard trap with standard bait fished for a 24-hour period (soak). The spawner index was introduced by DFO in 1979.
spawning Fish and marine invertebrate reproduction involving eggs or live young.
spawn-on-kelp Marine kelp blades covered in herring eggs.
Sec. 52 Application Volume 6B: Environmental and Socio-Economic Assessment (ESA) – Marine Terminal Section 18: Glossary
Page 18-12 May 2010
species at risk Species that are listed under Schedule 1 of the Species at Risk Act (SARA) as extirpated, endangered or threatened and/or are red-listed by the British Columbia Conservation Data Centre. Although British Columbia does not have a stand-alone endangered species act, red-listed vertebrates may be legally designated as endangered or threatened under British Columbia’s Wildlife Act.
species diversity The variety of life forms within a given ecosystem, often used as a measure of system health. Its reduction over a range leading to monoculture is generally considered to degrade the health of the ecosystem.
spectral Pertaining to the frequencies, amplitudes and phases comprising a sound wave.
stemming Firmly plugging a blasting drillhole to increase blast effectiveness and reduce the charge needed to break rock. (See also decking.)
stratification Separation of layers based on chemical (salinity) or physical features (temperature), which prevents mixing.
sublethal effects Adverse but non-lethal effects on fish species. (See also paralethal.)
subsistence fishing Fishing for food, not for commercial purposes.
substrate 1. A surface on which an organism grows or to which it is attached. 2. The hard material that directly underlies soil layers.
succession The gradual spreading and recovery of forest vegetation over time, particularly in areas that have been cleared.
Suezmax Largest tankers capable of transiting the Suez Canal fully loaded.
suspension feeder An animal that feeds on organisms that are suspended within the water column.
sustainability The ability of an ecosystem to maintain ecological processes, functions, biodiversity and productivity into the future.
synthetic oil A hydrocarbon that is the result of processing or upgrading a heavy crude feedstock to obtain a hydrocarbon with more desirable characteristics.
temporary threshold shift A temporary impairment of hearing sensitivity (increase in the minimum detectible sound level), which returns to normal levels (pre-sound-exposure) over time. Also referred to as auditory fatigue.
threatened Referring to a wildlife species that is likely to become an endangered species if nothing is done to reverse the factors leading to its extirpation or extinction.

Sec. 52 Application Volume 6B: Environmental and Socio-Economic Assessment (ESA) – Marine Terminal Section 18: Glossary
May 2010 Page 18-13
toxicity reference value In ecological risk assessments, the dose level for a specific chemical substance, selected to represent a threshold above which adverse environmental effects to the health of a given type of organism may be expected.
three-party rule If three or fewer vessels report landings from the same subarea during the fishing season (i.e., open to close of the fishery), the information is considered confidential, and is not released in a form that could be traced to individual vessels.
total allowable catch The total amount of fish allowed to be caught from a particular stock by all resource users over a particular period.
total suspended solids The total particulate matter (i.e., total suspended sediments) suspended in a unit of liquid. Particles can include microscopic biota, clay, or silt with attached organic and inorganic nutrients, mixed in the water column by currents or waves. Primary sources include river runoff, biological production and atmospheric fallout, with anthropogenic contributions from wastewater effluent and substrate disturbances.
toxicity equivalent A standard measure of the combined toxicity of all dioxins and furans measured in a sample. The toxic equivalent is calculated using toxic equivalency factors for the individual dioxin and furan congeners established for specific receptors (human, mammal, fish, etc.).
trace element Defined in the context of an ecological risk assessment as being an element present in the liquid hydrocarbons at a concentration greater than 1 mg/kg, that is not of low inherent toxicity, or a major mineral forming element.
trawl A strong fishing net used for dragging along the sea bottom or mid-water to catch fish.
trophic Pertaining to community composition and feeding relationships of marine organisms.
turbidity The cloudiness or haziness of a fluid caused by individual particles (suspended solids) that are generally invisible to the naked eye, similar to smoke in air. The measurement of turbidity is a key test of water quality. (See total suspended solids.)
very large crude carrier A class of large oil tanker that will call at the Kitimat Terminal.
VHF notice A verbal broadcast over the VHF radio to inform mariners and fishers.
water management plan A plan that will be implemented at the tank terminal to limit erosion from runoff and reduce sedimentation in nearshore waters. Mitigation measures include silt fences and sediment settlement ponds, where appropriate.

Sec. 52 Application Volume 6B: Environmental and Socio-Economic Assessment (ESA) – Marine Terminal Section 18: Glossary
Page 18-14 May 2010
water quality ESA water quality parameters include turbidity, total suspended solids, salinity, temperature, pH, nutrients, metals and hydrocarbons.
work window A selected temporal period for working that is based on mitigation strategies for a particular organism.
zooplankton A broad category of waterborne animals ranging from minute protozoans to larger organisms, such as jellyfish, copepods, krill, or even juvenile fish. Most drift with currents, but some use locomotion to feed or to avoid predators. They consume phytoplankton or other zooplankton and play a key role in aquatic food webs.
Related Documents