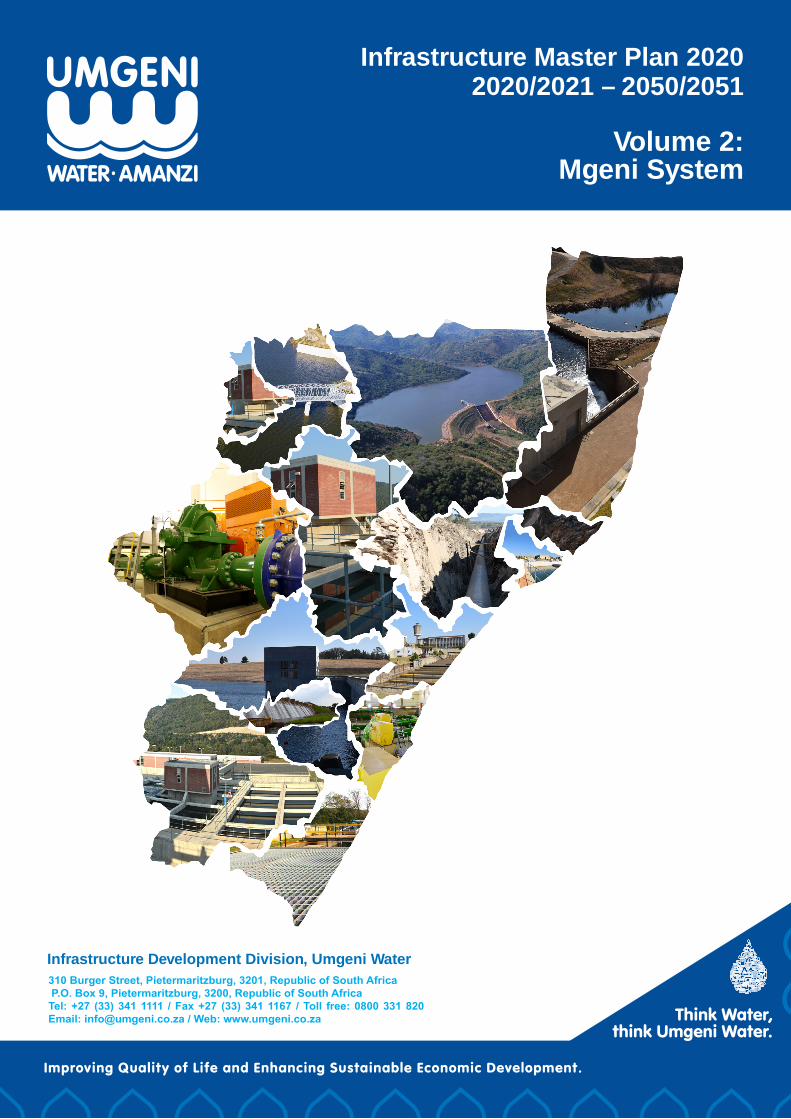
Infrastructure Development Division, Umgeni Water 310 Burger Street, Pietermaritzburg, 3201, Republic of South Africa P.O. Box 9, Pietermaritzburg, 3200, Republic of South Africa Tel: +27 (33) 341 1111 / Fax +27 (33) 341 1167 / Toll free: 0800 331 820 Email: [email protected] / Web: www.umgeni.co.za Infrastructure Master Plan 2020 2020/2021 – 2050/2051 Volume 2: Mgeni System Improving Quality of Life and Enhancing Sustainable Economic Development. Think Water, think Umgeni Water.

Welcome message from author
This document is posted to help you gain knowledge. Please leave a comment to let me know what you think about it! Share it to your friends and learn new things together.
Transcript
Infrastructure Development Division, Umgeni Water310 Burger Street, Pietermaritzburg, 3201, Republic of South Africa P.O. Box 9, Pietermaritzburg, 3200, Republic of South AfricaTel: +27 (33) 341 1111 / Fax +27 (33) 341 1167 / Toll free: 0800 331 820 Email: [email protected] / Web: www.umgeni.co.za
Infrastructure Master Plan 20202020/2021 – 2050/2051
Volume 2:Mgeni System
Improving Quality of Life and Enhancing Sustainable Economic Development.
Think Water, think Umgeni Water.
For further information, please contact:
Planning Services
Infrastructure Development Division
Umgeni Water
P.O.Box 9, Pietermaritzburg, 3200
KwaZulu‐Natal, South Africa
Tel: 033 341‐1522
Fax: 033 341‐1218
Email: [email protected]
Web: www.umgeni.co.za

i
PREFACE This Infrastructure Master Plan 2020 describes:
Umgeni Water’s infrastructure plans for the financial period 2020/2021 – 2050/2051, and
Infrastructure master plans for other areas outside of Umgeni Water’s Operating Area but
within KwaZulu-Natal.
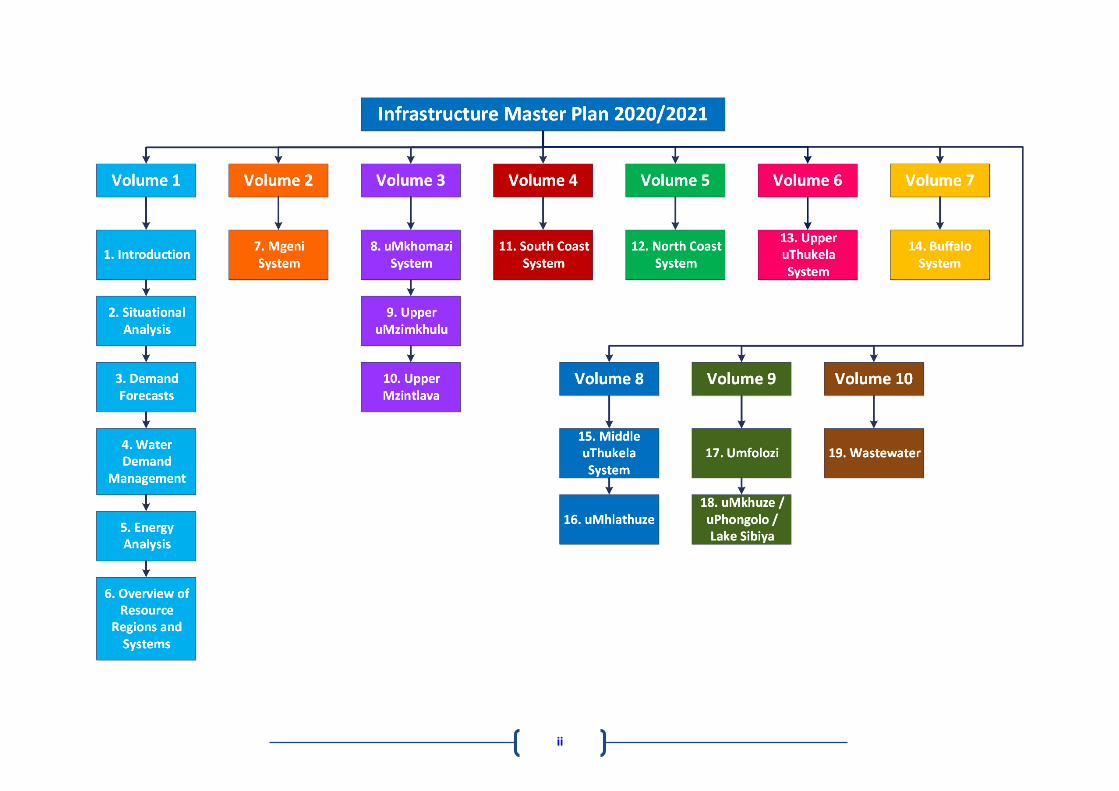
It is a comprehensive technical report that provides information on current infrastructure and on future infrastructure development plans. This report replaces the last comprehensive Infrastructure Master Plan that was compiled in 2019 and which only pertained to the Umgeni Water Operational area. The report is divided into ten volumes as per the organogram below. Volume 1 includes the following sections and a description of each is provided below:
Section 2 describes the most recent changes and trends within the primary environmental dictates that
influence development plans within the province.
Section 3 relates only to the Umgeni Water Operational Areas and provides a review of historic water sales
against past projections, as well as Umgeni Water’s most recent water demand projections, compiled at the end
of 2019.
Section 4 describes Water Demand Management initiatives that are being undertaken by the utility and the
status of Water Demand Management Issues in KwaZulul-Natal.
Section 5, which also relates to Umgeni Water’s Operational Area, contains a high level review of the energy
consumption used to produce the water volumes analysed in Section 3.
Section 6 provides an overview of the water resource regions and systems supplied within these regions.
The next eight volumes describe the current water resource situation and water supply infrastructure of the various systems in KwaZulu-Natal, including:
Volume 2 Section 7 Mgeni System. Volume 3 Section 8 uMkhomazi System
Section 9 uMzimkhulu System Section 10 Mzintlava System
Volume 4- Section 11 South Coast System Volume 5 Section 12 North Coast System Volume 6 Section 13 Upper uThukela System Volume 7 Section 14 Buffalo System Volume 8 Section 15 Middle uThukela System
Section 16 Mhlathuze System
Volume 9 Section 17 Umfolozi System Section 18 uMkhuze / uPhongolo / Lake Sibiya System
Volume 10, Section 19 describes the wastewater works currently operated by Umgeni Water (shown in pale brown in the adjacent figure) and provides plans for development of additional wastewater treatment facilities. The status of wastewater treatment in WSA’s that are not supplied by Umgeni Water are also described in this section.
ii
iii
It is important to note that information presented in this report is in a summarised form and it is recommended that the reader refer to relevant planning reports if more detail is sought. Since the primary focus of this Infrastructure Master Plan is on bulk supply networks, the water resource infrastructure development plans are not discussed at length. The Department of Water and Sanitation (DWS), as the responsible authority, has undertaken the regional water resource development investigations. All of these investigations have been conducted in close collaboration with Umgeni Water and other major stakeholders in order to ensure that integrated planning occurs. Details on these projects can be obtained directly from DWS, Directorate: Options Analysis (East). The Infrastructure Master Plan is a dynamic and evolving document. Outputs from current planning
studies, and comments received on this document will therefore be taken into account in the
preparation of the next update.
iv
TABLE OF CONTENTS Preface ......................................................................................................................................................... i Table of Contents ....................................................................................................................................... iv List of Figures .............................................................................................................................................. v List of Tables ............................................................................................................................................ viii List of Acronyms .......................................................................................................................................... x List of Units .............................................................................................................................................. xiii 7. Mgeni System ...................................................................................................................................1
7.1 Synopsis of Mgeni System ......................................................................................................1 7.2 Water Resources of the Mgeni System ..................................................................................8
7.2.1 Description of the Mgeni System Water Resource Regions ........................................8 7.2.2 Reserve ...................................................................................................................... 28 7.2.3 Climate Change Impacts ............................................................................................ 29 7.2.4 Existing Infrastructure and Yields .............................................................................. 31 7.2.5 Operating Rules ......................................................................................................... 40
7.3 Supply Systems .................................................................................................................... 43 7.3.1 Description of the Mgeni System .............................................................................. 43 7.3.2 Status Quo and Limitations of the Mgeni System ..................................................... 83
7.4 Water Balance/Availability ................................................................................................ 101 7.5 Recommendations for the Mgeni System ......................................................................... 102
7.5.1 System Components ............................................................................................... 102 7.5.2 Projects.................................................................................................................... 115
7.6 Management and Operation of uMgungundlovu Water Treatment Plants (WTPs) ......... 141 7.6.1 Appelsbosch WTP .................................................................................................... 143 7.6.2 Lidgetton WTP ......................................................................................................... 147 7.6.3 Mpofana WTP ......................................................................................................... 153 7.6.4 Rosetta WTP ............................................................................................................ 158
7.7 uMzinyathi Water Treatment Plants ................................................................................. 161 7.7.1 Muden WTP and Supply System ............................................................................. 161
7.8 Recommendations for the uMzinyathi Water Treatment Plants ...................................... 169 7.8.1 Projects.................................................................................................................... 171
References ............................................................................................................................................. 173 Acknowledgements ......................................................................................................................................I
v
LIST OF FIGURES Figure 7.1 General layout of the Mgeni System ........................................................................................ 2 Figure 7.2 Network chart of the Mgeni System. ....................................................................................... 3 Figure 7.3 General layout of the Upper Mgeni System. ............................................................................ 4 Figure 7.4 Schematic of the Upper Mgeni System. ................................................................................... 5 Figure 7.5 General layout of the Lower Mgeni System. ............................................................................ 6 Figure 7.6 Schematic of the Lower Mgeni System. ................................................................................... 7 Figure 7.7 General layout of the Mooi/Mgeni Region (DEA and GTI 2018; KZN DoT 2017; MDB 2016;
Umgeni Water 2020; WR2012). ............................................................................................... 9 Figure 7.8 Groundwater potential in the Mooi/Mgeni Region (KZN DoT 2011; MDB 2016; Umgeni
Water 2017; WR2012). ........................................................................................................... 12 Figure 7.9 Percentage compliance vs. non-compliance with the Resource Quality Objective for Midmar
Dam. ....................................................................................................................................... 14 Figure 7.10 Percentage compliance vs. non-compliance with the Resource Quality Objective for Spring
Grove Dam. ............................................................................................................................. 15 Figure 7.11 Percentage compliance vs. non-compliance with the Resource Quality Objective for Mearns.
16 Figure 7.12 Percentage compliance vs. non-compliance with the Resource Quality Objective for Nagle
Dam. ....................................................................................................................................... 17 Figure 7.13 Percentage compliance vs. non-compliance with the Resource Quality Objective for Inanda
Dam. ....................................................................................................................................... 18 Figure 7.14 Percentage of Msunduzi catchment river sites with E. coli results > 10000 per 100 ml. ...... 19 Figure 7.15 Darvill WWW Annual Median Inflow Volume and Msunduzi River Sites with E. coli Numbers
>10 000 per 100l..................................................................................................................... 20 Figure 7.16 Mean and average E. coli values for the Pietermaritzburg Rivers: 2010 – 2019. .................. 21 Figure 7.17 Locality map of the uMkhomazi, uMlaza and uMngeni river catchments. ............................ 23 Figure 7.18 General layout of the Mkhomazi Region (DEA and GTI 2018; KZN DoT 2017; MDB 2016;
Umgeni Water 2020; WR2012). ............................................................................................. 24 Figure 7.19 Groundwater potential in the Mkhomazi Region (KZN DoT 2011; MDB 2016; Umgeni Water
2017; WR2012). ...................................................................................................................... 26 Figure 7.20 Percentage compliance vs. non-compliance with the Resource Quality Objective for the
Home Farm Dam. ................................................................................................................... 27 Figure 7.21 Midmar Dam. .......................................................................................................................... 33 Figure 7.22 Albert Falls Dam. .................................................................................................................... 34 Figure 7.23 Nagle Dam. ............................................................................................................................. 35 Figure 7.24 Inanda Dam. ........................................................................................................................... 36 Figure 7.25 Mearns Weir. .......................................................................................................................... 37 Figure 7.26 Spring Grove Dam. .................................................................................................................. 38 Figure 7.27 Henley Dam. ........................................................................................................................... 39 Figure 7.28 Schematic of the Mgeni System. ............................................................................................ 41 Figure 7.29 Midmar Water Treatment Plant after the upgrade. .............................................................. 44 Figure 7.30 General Layout of the Howick-North Sub-System. ................................................................ 48 Figure 7.31 General Layout of the Howick-West Sub-System................................................................... 50 Figure 7.32 General Layout of the Midmar WTP to Umlaas Road Reservoir Sub-System. ....................... 55 Figure 7.33 Pipeline configuration between D.V. Harris WTP and World’s View Reservoir. .................... 58
vi
Figure 7.34 General Layout of the Umlaas Road Reservoir Sub-System. .................................................. 62 Figure 7.35 D.V. Harris Water Treatment Plant. ....................................................................................... 64 Figure 7.36 General layout of the uMshwathi Sub-System....................................................................... 68 Figure 7.37 Layout of the Central Supply System. .................................................................................... 75 Figure 7.38 Distribution of Demands in Upper Mgeni per WSAs (October 2018). ................................... 83 Figure 7.39 Water demand from Midmar WTP. ....................................................................................... 85 Figure 7.40 Analysis of historical production at Midmar WTP (November 2018 to October 2019). ........ 86 Figure 7.41 Water demand from D. V. Harris WTP. .................................................................................. 90 Figure 7.42 Analysis of historical production at D.V. Harris WTP (November 2018 to October 2019). ... 91 Figure 7.43 Analysis of historical production at Durban Heights WTP from November 2018 to October
2019. ....................................................................................................................................... 93 Figure 7.44 Historical demand curve for Durban Heights WTP. ............................................................... 94 Figure 7.45 Extent of the South Coast Augmentation Scheme. ................................................................ 95 Figure 7.46 Analysis of historical production at Wiggins WTP from November 2017 to October 2018. .. 96 Figure 7.47 Historical demand curve for Wiggins WTP. ............................................................................ 97 Figure 7.48 Maphephethwa Water Treatment Plant. ............................................................................... 99 Figure 7.49 Analysis of historical production at Maphephethwa WTP from November 2017 to October
2018. ..................................................................................................................................... 100 Figure 7.50 Historical demand curve and projections for Maphephethwa WTP. ................................... 100 Figure 7.51 Mgeni System balance.......................................................................................................... 101 Figure 7.52 Proposed water resource infrastructure in the Mkhomazi Region (KZN DoT 2011; MDB
2016; Umgeni Water 2017; WR2012). ................................................................................. 103 Figure 7.53 Artistic impression of Smithfield Dam. ................................................................................. 104 Figure 7.54 Demand on the Upper Mgeni System as at October 2019. ................................................. 106 Figure 7.55 Five year demand projection for the Upper Mgeni System. ................................................ 107 Figure 7.56 Ten year demand projection for the Upper Mgeni System. ................................................ 108 Figure 7.57 Twenty year demand projection for the Upper Mgeni System. .......................................... 109 Figure 7.58 Thirty year demand projection for the Upper Mgeni System. ............................................. 110 Figure 7.59 Schematic of the Lower Mgeni System. ............................................................................... 114 Figure 7.60 uMkhomazi Water Project. .................................................................................................. 116 Figure 7.61 Layout of Water Treatment Plant. ....................................................................................... 117 Figure 7.62 Layout of pipeline. ................................................................................................................ 118 Figure 7.63 General layout of the Impendle Project Areas. .................................................................... 121 Figure 7.64 Greater Mpofana Bulk Water Supply Scheme. .................................................................... 124 Figure 7.65 Schematic of Greater Mpofana BWSS. ................................................................................. 125 Figure 7.66 General Layout of Midmar WTP upgrade. ........................................................................... 127 Figure 7.67 General layout of the proposed Howick-West Reservoir. .................................................... 129 Figure 7.68 General layout of the Umbumbulu Pump Station Upgrade. ................................................ 132 Figure 7.69 General layout of the Vulindlela System. ............................................................................. 133 Figure 7.70 Vulindlela Upgrade. .............................................................................................................. 135 Figure 7.71 Table Mountain Upgrade. .................................................................................................... 137 Figure 7.72 Layout of the proposed hydropower unit at the Mpofana Outfall. ..................................... 140 Figure 7.73 General layout of the four uMgungundlovu WTPs being operated and managed by Umgeni
Water. ................................................................................................................................... 142 Figure 7.74 Dam supplying Appelsbosch WTP (Umgeni Water 2015). ................................................... 144 Figure 7.75 Schematic of the Appelsbosch System (subject to verification). ......................................... 145 Figure 7.76 Analysis of historical production at Applesbosch WTP (November 2018 to October 2019).
146
vii
Figure 7.77 Water demand from Appelsbosch WTP. .............................................................................. 147 Figure 7.78 Lidgetton WTP sand wash bays with old dosing system (uMgungundlovu District
Municipality 2010) ................................................................................................................ 149 Figure 7.79 Schematic of the Lidgetton System (subject to verification). .............................................. 149 Figure 7.80 1 Ml/day being constructed at the Lidgetton System. ......................................................... 150 Figure 7.81 Analysis of historical production at Lidgetton WTP (November 2018 to October 2019). ... 151 Figure 7.82 Water demand from Lidgetton WTP. ................................................................................... 152 Figure 7.83 Schematic of the Mpofana System (subject to verification). ............................................... 154 Figure 7.84 Mpofana WTP (uMgungundlovu District Municipality 2010). ............................................. 155 Figure 7.85 Analysis of historical production at Mpofana WTP (November 2018 to October 2019). .... 155 Figure 7.86 Water demand from Mpofana WTP. .................................................................................... 156 Figure 7.87 Mpofana Package Plant. ....................................................................................................... 157 Figure 7.88 Rosetta WTP (uMgungundlovu District Municipality 2010). ................................................ 159 Figure 7.89 Schematic of the Rosetta System (subject to verification). ................................................. 159 Figure 7.90 Analysis of historical production at Rosetta WTP (November 2018 to October 2019). ...... 160 Figure 7.91 Water demand from Rosetta WTP. ...................................................................................... 160 Figure 7.92 Muden WTP supply system. ................................................................................................. 162 Figure 7.93 Schematic of the Muden Supply System. ............................................................................. 163 Figure 7.94 Aerial view of the Muden WTP (Google Earth 2018). .......................................................... 165 Figure 7.95 General layout of the Muden WTP upgrade. ....................................................................... 171
viii
LIST OF TABLES Table 7.1 Hydrological characteristics of the Mooi/Mgeni Region (UW,2019). .................................... 10 Table 7.2 Water quality sampling points within Msunduzi catchment. ................................................ 19 Table 7.3 Hydrological characteristics of uMkhomazi River catchment (DWS 2015). ........................... 22 Table 7.4 Hydrological characteristics of the uMkhomazi Region (Umgeni Water 2002 and DWA
2013). ................................................................................................................................... 25 Table 7.5 Summary of environmental (compensation) flow requirements. ......................................... 28 Table 7.6 Umgeni Water 2019 Climate Change Study results and recommendations (2019: 54 – 56). 30 Table 7.7 Characteristics of Midmar Dam (DWS 2003; 2016a). ............................................................. 33 Table 7.8 Characteristics of Albert Falls Dam (DWS 1993; 2016b). ....................................................... 34 Table 7.9 Characteristics of Nagle Dam (DWS 2004; Umgeni Water 2015)........................................... 35 Table 7.10 Characteristics of Inanda Dam (DWS 1990). ......................................................................... 36 Table 7.11 Characteristics of Mearns Weir (DWS, 2003). ....................................................................... 37 Table 7.12 Characteristics of Spring Grove Dam (DWS 2013; Umgeni Water 2013). ............................. 38 Table 7.13 Characteristics of Henley Dam (Umgeni Water 2017). ......................................................... 39 Table 7.14 Existing Dams in the Mooi/Mgeni Region. ............................................................................ 40 Table 7.15 Yield Information for the existing water resource infrastructure in the Mooi/Mgeni Region
including transfers from the MMTS. .................................................................................... 40 Table 7.16 Sub-divisions of the Upper Mgeni System. ........................................................................... 43 Table 7.17 Characteristics of the Midmar WTP. ..................................................................................... 45 Table 7.18 Pipeline details: ‘251 Pipeline. .............................................................................................. 46 Table 7.19 Pump station details: Midmar Raw Water Pump Station. .................................................... 46 Table 7.20 Clearwell details: Midmar WTP. ............................................................................................ 46 Table 7.21 Reservoir details: Howick-North Reservoir Complex. ........................................................... 49 Table 7.22 Pump details: Howick-North Sub-System. ............................................................................ 49 Table 7.23 Pipeline details: Howick-North Sub-System. ......................................................................... 49 Table 7.24 Pump details: Howick-West Sub-System. ............................................................................. 51 Table 7.25 Reservoir details: Howick-West Sub-System......................................................................... 52 Table 7.26 Pipeline details: Howick-West Sub-System. .......................................................................... 53 Table 7.27 Reservoir details: Midmar WTP to Umlaas Road Reservoir Sub-System. ............................. 56 Table 7.28 Tunnel details: Upper Mgeni System. ................................................................................... 56 Table 7.29 Pipeline details: Midmar WTP to Umlaas Road Reservoir Sub-System. ............................... 57 Table 7.30 Pump details: Thornville/Hopewell Supply. .......................................................................... 60 Table 7.31 Reservoir details: Umlaas Road Reservoir Sub-System. ........................................................ 63 Table 7.32 Pipeline details: Umlaas Road Reservoir Sub-System. .......................................................... 63 Table 7.33 Characteristics of D.V. Harris WTP. ....................................................................................... 65 Table 7.34 Details of the D.V. Harris clearwells. ..................................................................................... 66 Table 7.35 Pipeline details: ’51 Pipeline. ................................................................................................ 66 Table 7.36 Pipeline details: Wartburg Sub-System. ................................................................................ 70 Table 7.37 Pump details: Wartburg Sub-System. ................................................................................... 71 Table 7.38 Reservoir details: Wartburg Sub-System. ............................................................................. 72 Table 7.39 Characteristics of the Durban Heights WTP. ......................................................................... 74 Table 7.40 Tunnel details: Nagle Aqueduct System (Aqueduct 1 and 2). ............................................... 76 Table 7.41 Tunnel details: Nagle Aqueduct System (Aqueduct 3 and 4). ............................................... 77 Table 7.42 Siphon Pipeline details: Nagle Aqueducts. ............................................................................ 78
ix
Table 7.43 Reservoir details: Durban Heights WTP. ............................................................................... 78 Table 7.44 Pump details: Durban Heights WTP. ..................................................................................... 78 Table 7.45 Characteristics of the Wiggins WTP. ..................................................................................... 79 Table 7.46 Tunnel details: Inanda-Wiggins Aqueduct System. ............................................................... 80 Table 7.47 Pipeline details: Inanda-Wiggins Aqueduct. ......................................................................... 80 Table 7.48 Reservoir details: Wiggins WTP. ............................................................................................ 81 Table 7.49 Pump details: Wiggins WTP. ................................................................................................. 81 Table 7.50 Characteristics of the Maphephethwa WTP. ........................................................................ 82 Table 7.51 Yield Information for Mgeni System. .................................................................................. 101 Table 7.52 Proposed water resource infrastructure for the Mkhomazi Region. .................................. 104 Table 7.53 Yields for proposed water resource infrastructure for Mkhomazi Region (DWA 2013). ... 105 Table 7.54 Project description: uMkhomazi Water Project. ................................................................. 118 Table 7.55 Project information: Impendle BWSS. ................................................................................ 122 Table 7.56 Project information: Greater Mpofana Bulk Water Supply Scheme. .................................. 126 Table 7.57 Water forecasts for the Greater Mpofana BWSS. ............................................................... 127 Table 7.58 Storage Requirement at Howick-West Reservoir. .............................................................. 130 Table 7.59 Project information: Howick-West Reservoir Upgrade. ...................................................... 130 Table 7.60 Project information: Umbumbulu. ...................................................................................... 131 Table 7.61 Project information: Vulindlela Upgrade. ........................................................................... 134 Table 7.62 Project information: Table Mountain Upgrade................................................................... 138 Table 7.63 Characteristics of the Appelsbosch WTP............................................................................. 143 Table 7.64 Characteristics of the Lidgetton WTP. ................................................................................. 148 Table 7.65 Characteristics of Mpofana WTP. ........................................................................................ 153 Table 7.66 Characteristics of the Rosetta WTP. .................................................................................... 158 Table 7.67 Summary of Muden WTP Supply System existing infrastructure (DWS 2011). .................. 161 Table 7.68 Characteristics of the Muden WTP. .................................................................................... 164 Table 7.69 Pump details: Muden Supply System. ................................................................................. 166 Table 7.70 Reservoir details: Muden Supply System. ........................................................................... 167 Table 7.71 Pipeline details: Muden Supply System. ............................................................................. 168 Table 7.72 Project information: Muden BWSS. .................................................................................... 172
x
LIST OF ACRONYMS AADD Annual Average Daily Demand
AC Asbestos Cement
ADWF API
Average Dry Weather Flow Antecedent Precipitation Index
AsgiSA Accelerated and Shared Growth Initiative of South Africa
AVGF Autonomous Valveless Gravity Filter
BID Background Information Document
BPT Break Pressure Tank
BWL Bottom Water Level
BWSP Bulk Water Services Provider
BWSS Bulk Water Supply Scheme
CAPEX Capital Expenditure
CMA Catchment Management Agency
CoGTA Department of Co-operative Governance and Traditional Affairs
CWSS Community Water Supply and Sanitation project
DAEA Department of Agriculture and Environmental Affairs
DEA Department of Environmental Affairs
DFA Development Facilitation Act (65 of 1995)
DM District Municipality
DMA District Management Area
DRDLR Department of Rural Development and Land Reform
DWA DWS
Department of Water Affairs Department of Water and Sanitation
DWAF Department of Water Affairs and Forestry
EFR Estuarine Flow Requirements
EIA Environmental Impact Assessment
EKZN Wildlife Ezemvelo KZN Wildlife
EMP Environmental Management Plan
EWS eThekwini Water Services
EXCO Executive Committee
FC Fibre Cement
FL Floor level
FSL Full Supply level
GCM General Circulation Model
GDP Gross Domestic Product
GDPR Gross Domestic Product of Region
GVA Gross Value Added
HDI Human Development Index
IDP Integrated Development Plan
IFR In-stream Flow Requirements
xi
IMP Infrastructure Master Plan
IRP Integrated Resource Plan
ISP Internal Strategic Perspective
IWRM Integrated Water Resources Management
KZN KwaZulu-Natal
LM Local Municipality
LUMS Land Use Management System
MA Moving Average
MAP Mean Annual Precipitation
MAR Mean Annual Runoff
MBR Membrane Bioreactor
MMTS Mooi-Mgeni Transfer Scheme
MMTS-1 Mooi-Mgeni Transfer Scheme Phase 1
MMTS-2 Mooi-Mgeni Transfer Scheme Phase 2
mPVC Modified Polyvinyl Chloride
MTEF Medium-Term Expenditure Framework
MTSF Medium-Term Strategic Framework
MWP Mkomazi Water Project
MWP-1 Mkomazi Water Project Phase 1
NCP-1 North Coast Pipeline I
NCP-2 North Coast Pipeline II
NCSS North Coast Supply System
NGS Natal Group Sandstone
NPV Net Present Value
NSDP National Spatial Development Perspective
NWSP National Water Sector Plan
OPEX Operating Expenditure
p.a. Per annum
PES PEST
Present Ecological Status Political, Economical, Sociological and Technological
PGDS Provincial Growth and Development Strategy
PPDC Provincial Planning and Development Commission (KZN’s)
PSEDS Provincial Spatial Economic Development Strategy
PWSP Provincial Water Sector Plan
RCC Roller Compacted Concrete
RDP Reconstruction and Development Programme
RO Reverse Osmosis
ROD Record of Decision
RQO Resource Quality Objective
SCA South Coast Augmentation
SCP South Coast Pipeline
SCP-1 South Coast Pipeline Phase 1
xii
SCP-2a South Coast Pipeline Phase 2a
SCP-2b South Coast Pipeline Phase 2b
SDF Spatial Development Framework
SHR St Helen’s Rock (near Port Shepstone)
STEEPLE Social/demographic, Technological, Economic, Environmental (Natural), Political, Legal and Ethical
SWRO Seawater Reverse Osmosis
TEC Target Ecological Category
TBM Tunnel Boring Machine
TLC Transitional Local Council
TWL Top Water Level
uPVC Unplasticised Polyvinyl Chloride
UW Umgeni Water
WA Western Aqueduct
WC Water Conservation
WDM Water Demand Management
WMA Water Management Area
WRC Water Research Commission
WSA Water Services Authority
WSDP Water Services Development Plan
WSNIS Water Services National Information System
WSP Water Services Provider
WTP Water Treatment Plant
WWW Wastewater Works
Spellings of toponyms have been obtained from the Department of Arts and Culture (DAC). DAC provides the official spelling of place names and the spellings, together with the relevant gazette numbers, can be accessed at http://www.dac.gov.za/content/toponymic-guidelines-map-and-other-editors. When using any part of this report as a reference, please cite as follows: Umgeni Water, 2019. Umgeni Water Infrastructure Master Plan 2020/2021 – 2050/51, Vol 1 - 10. Prepared by Planning Services, June 2020.
xiii
LIST OF UNITS Length/Distance: mm millimetre
m metre
km kilometre
Area: m2 square metres
ha hectare
km2 square kilometres
Level/Altitude: mASL metres above sea-level
Time: s second
min minute
hr hour
Volume: m3 cubic metres
Mℓ megalitre
million m3 million cubic metres
mcm million cubic metres
Water Use/Consumption/Treatment/Yield: ℓ/c/day litre per capita per day
kℓ/day kilolitre per day
Mℓ/day megalitre per day
million m3/annum million cubic metres per annum
kg/hr kilograms per hour
Flow velocity/speed: m/s metres per second
Flow: m3/s cubic metres per second
ℓ/hr litres per hour
m3/hr cubic metres per hour
1
7. MGENI SYSTEM
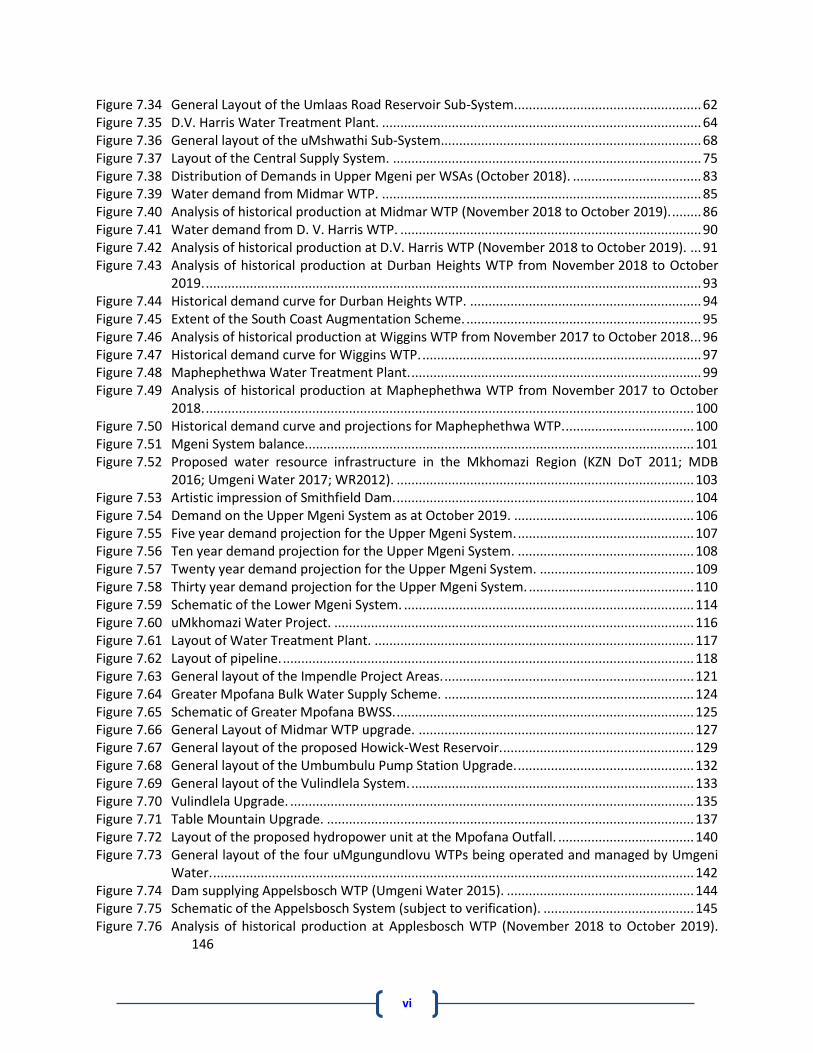
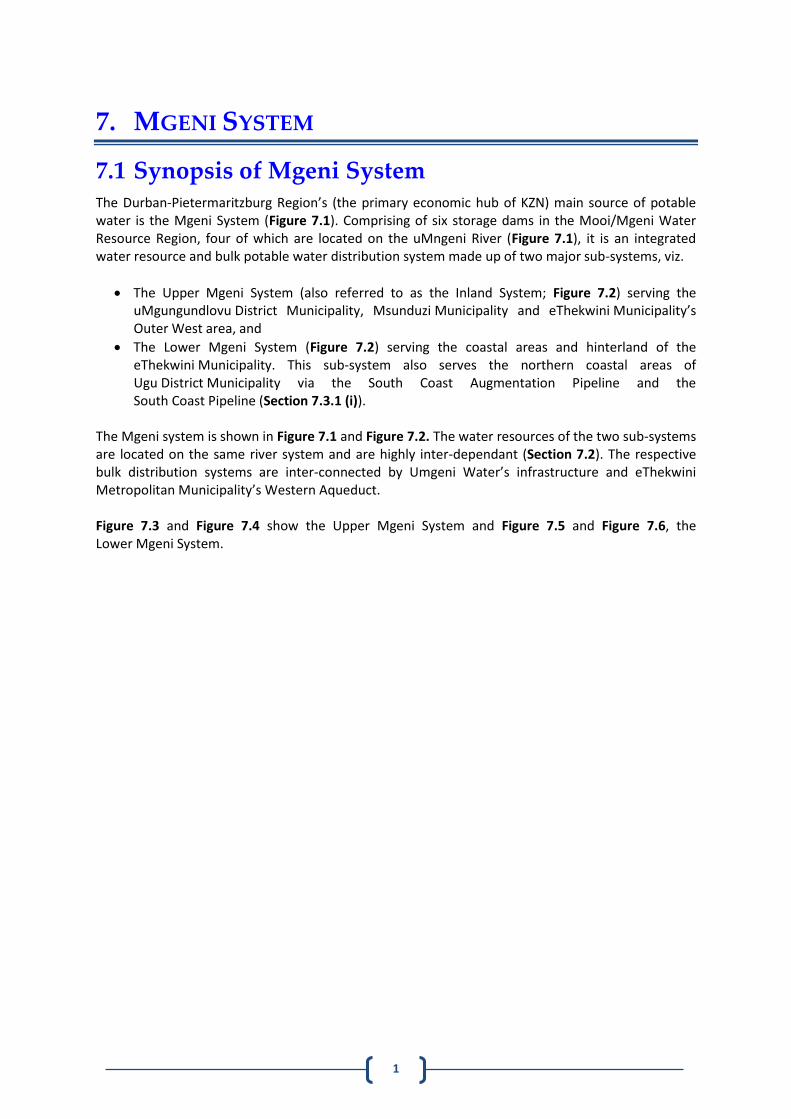
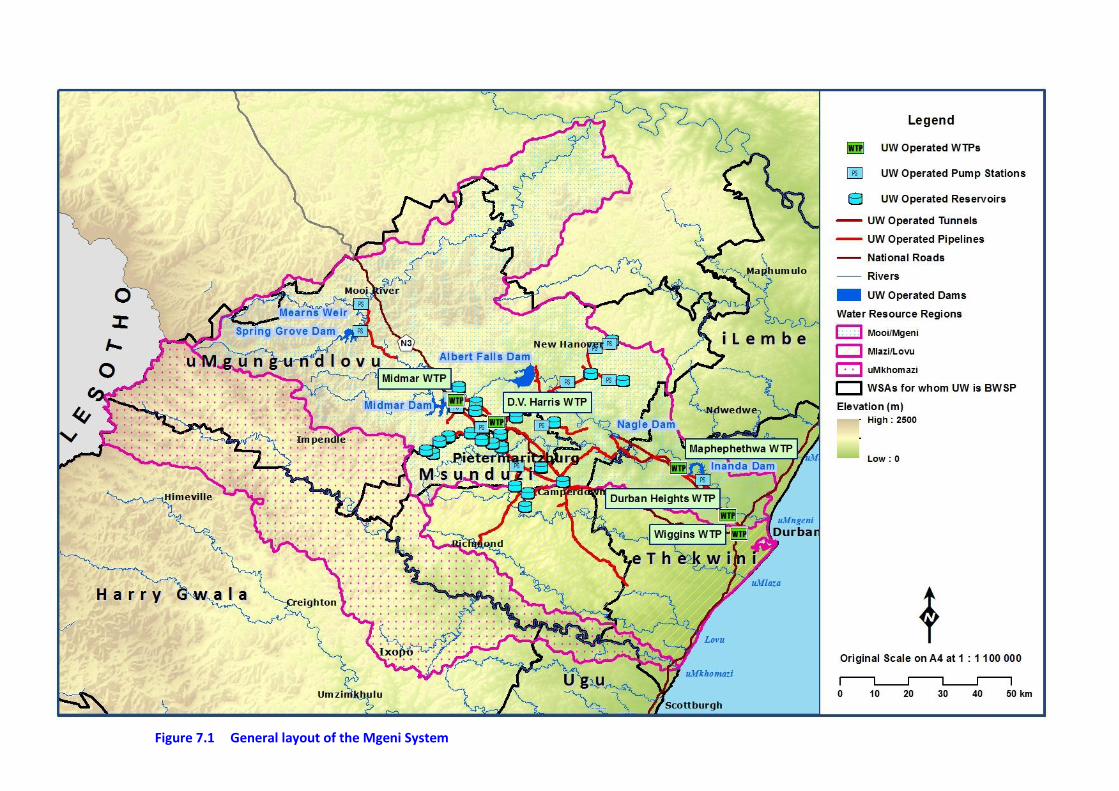
7.1 Synopsis of Mgeni System The Durban-Pietermaritzburg Region’s (the primary economic hub of KZN) main source of potable water is the Mgeni System (Figure 7.1). Comprising of six storage dams in the Mooi/Mgeni Water Resource Region, four of which are located on the uMngeni River (Figure 7.1), it is an integrated water resource and bulk potable water distribution system made up of two major sub-systems, viz.
The Upper Mgeni System (also referred to as the Inland System; Figure 7.2) serving the uMgungundlovu District Municipality, Msunduzi Municipality and eThekwini Municipality’s Outer West area, and
The Lower Mgeni System (Figure 7.2) serving the coastal areas and hinterland of the eThekwini Municipality. This sub-system also serves the northern coastal areas of Ugu District Municipality via the South Coast Augmentation Pipeline and the South Coast Pipeline (Section 7.3.1 (i)).
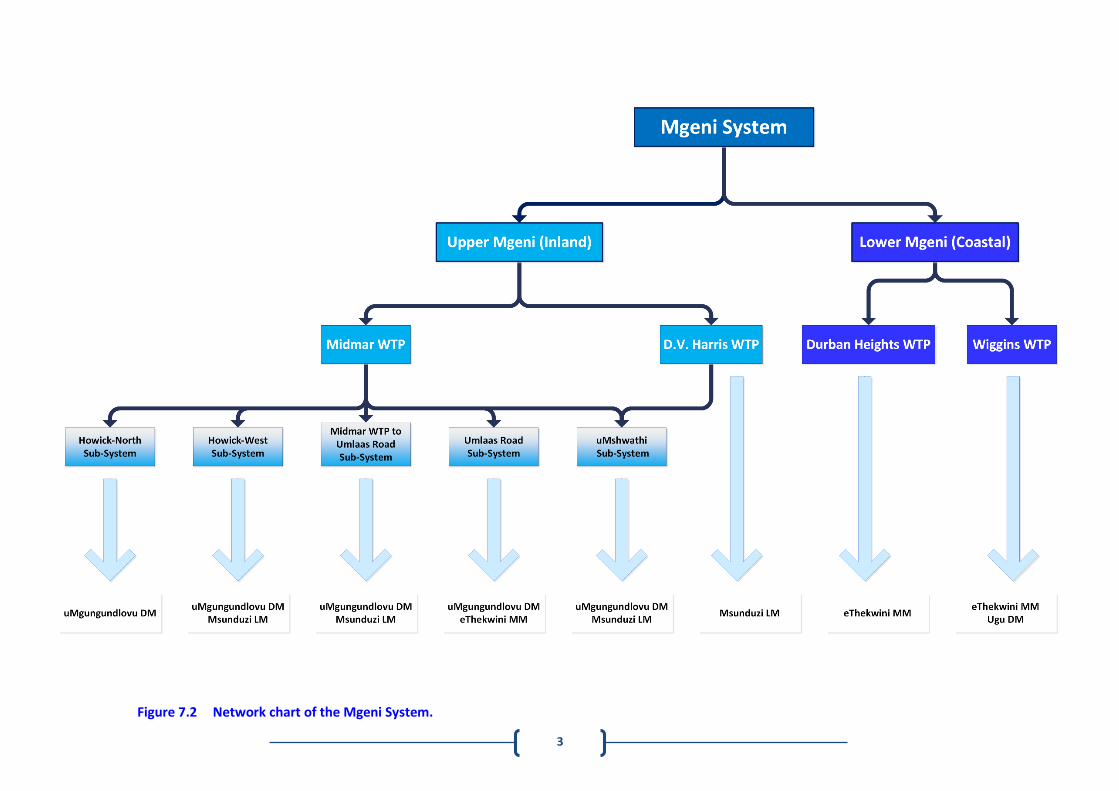
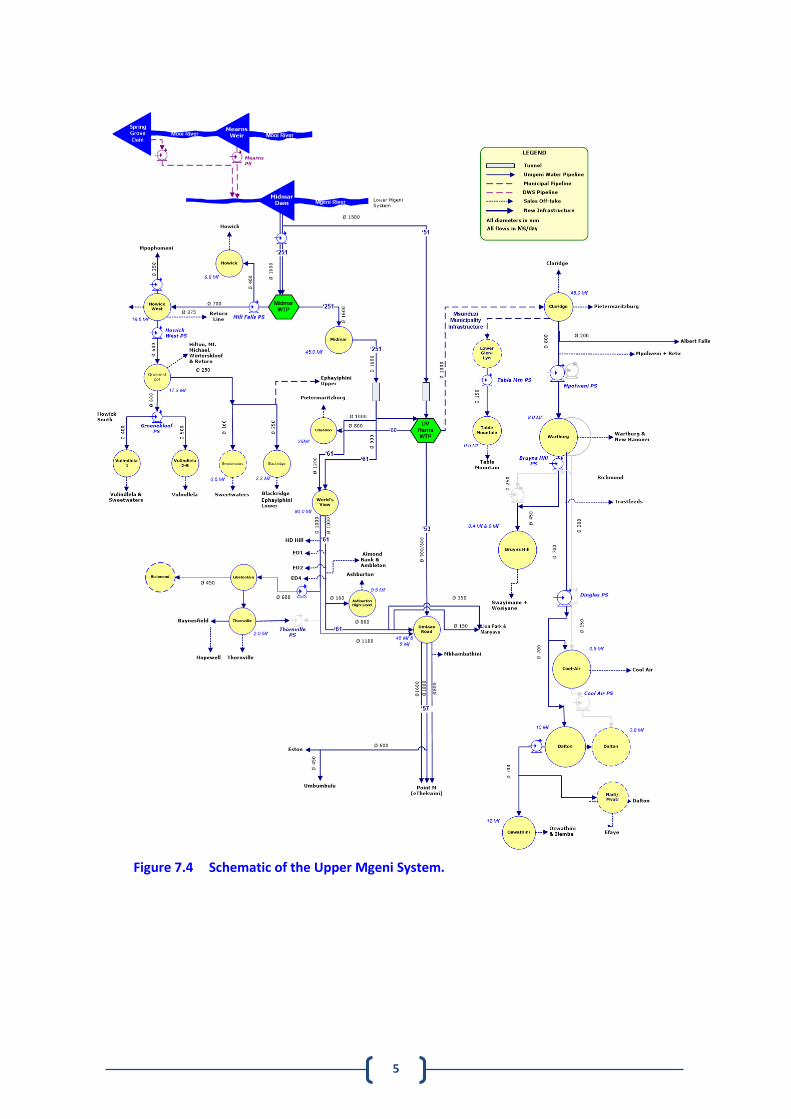
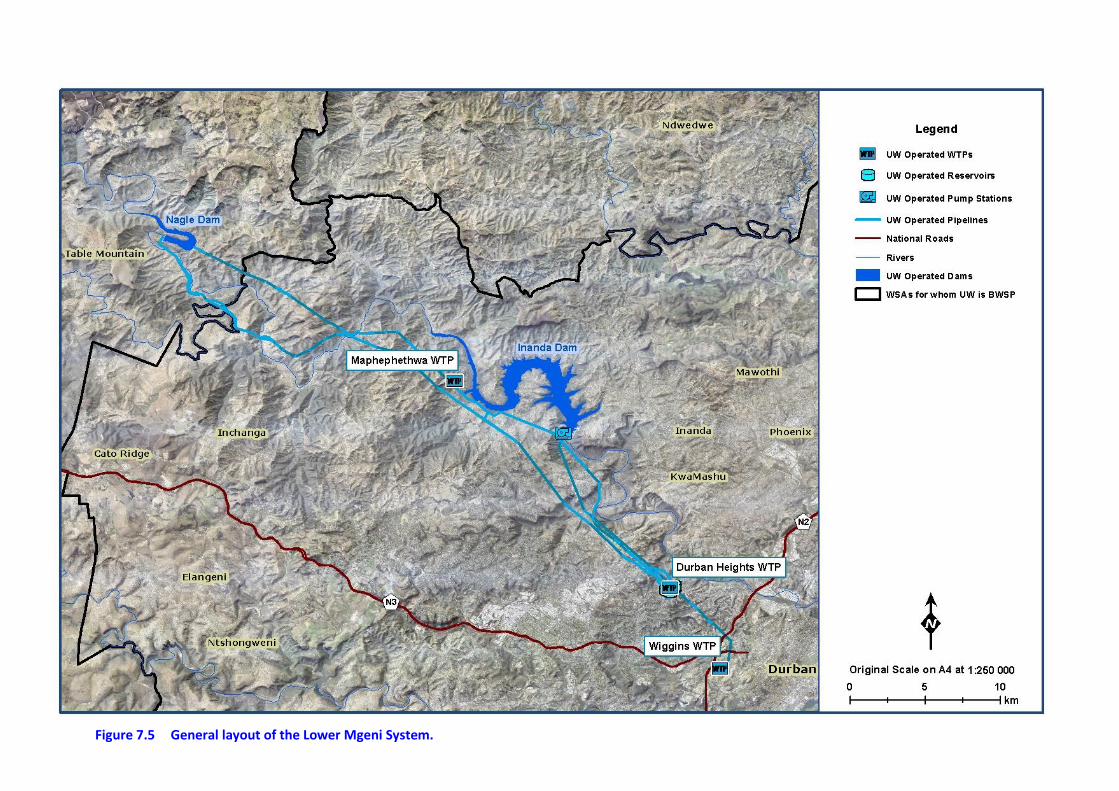
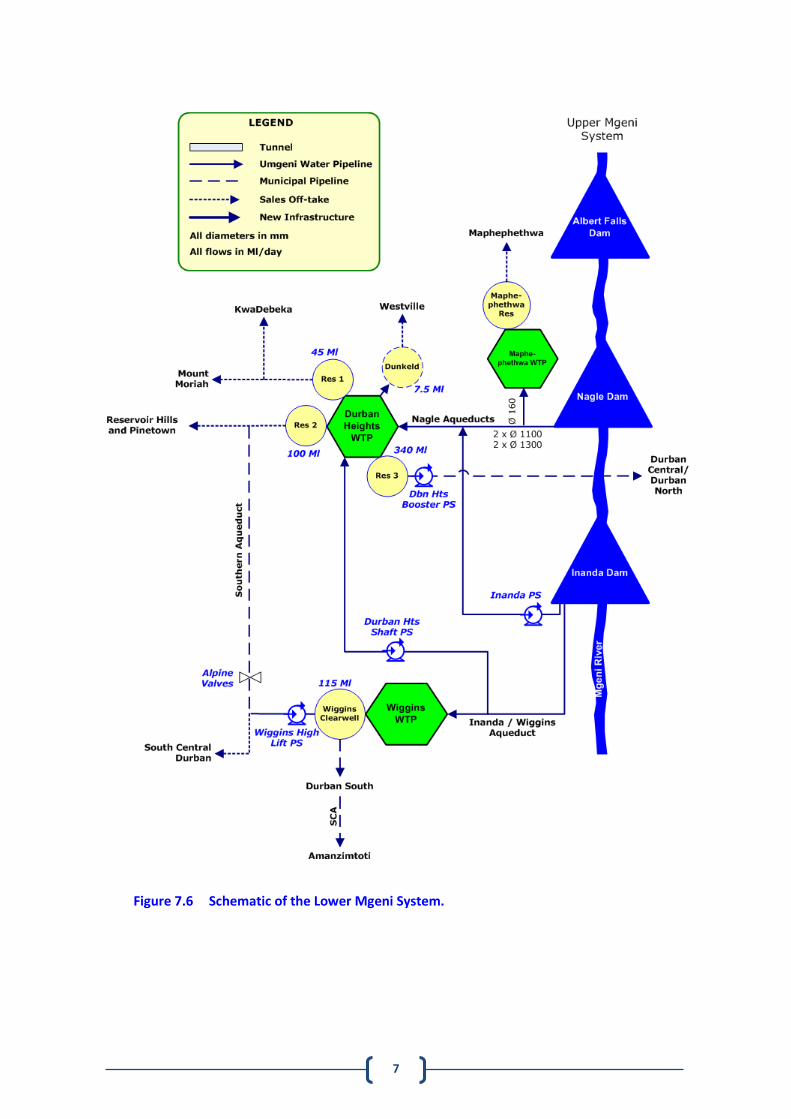
The Mgeni system is shown in Figure 7.1 and Figure 7.2. The water resources of the two sub-systems are located on the same river system and are highly inter-dependant (Section 7.2). The respective bulk distribution systems are inter-connected by Umgeni Water’s infrastructure and eThekwini Metropolitan Municipality’s Western Aqueduct. Figure 7.3 and Figure 7.4 show the Upper Mgeni System and Figure 7.5 and Figure 7.6, the Lower Mgeni System.
2
Figure 7.1 General layout of the Mgeni System
3
Figure 7.2 Network chart of the Mgeni System.
4 Figure 7.3 General layout of the Upper Mgeni System.
5
Figure 7.4 Schematic of the Upper Mgeni System.
6
Figure 7.5 General layout of the Lower Mgeni System.
7
Figure 7.6 Schematic of the Lower Mgeni System.
8
7.2 Water Resources of the Mgeni System
7.2.1 Description of the Mgeni System Water Resource
Regions
(a) Mooi/Mgeni Water Resource Region
(i) Overview
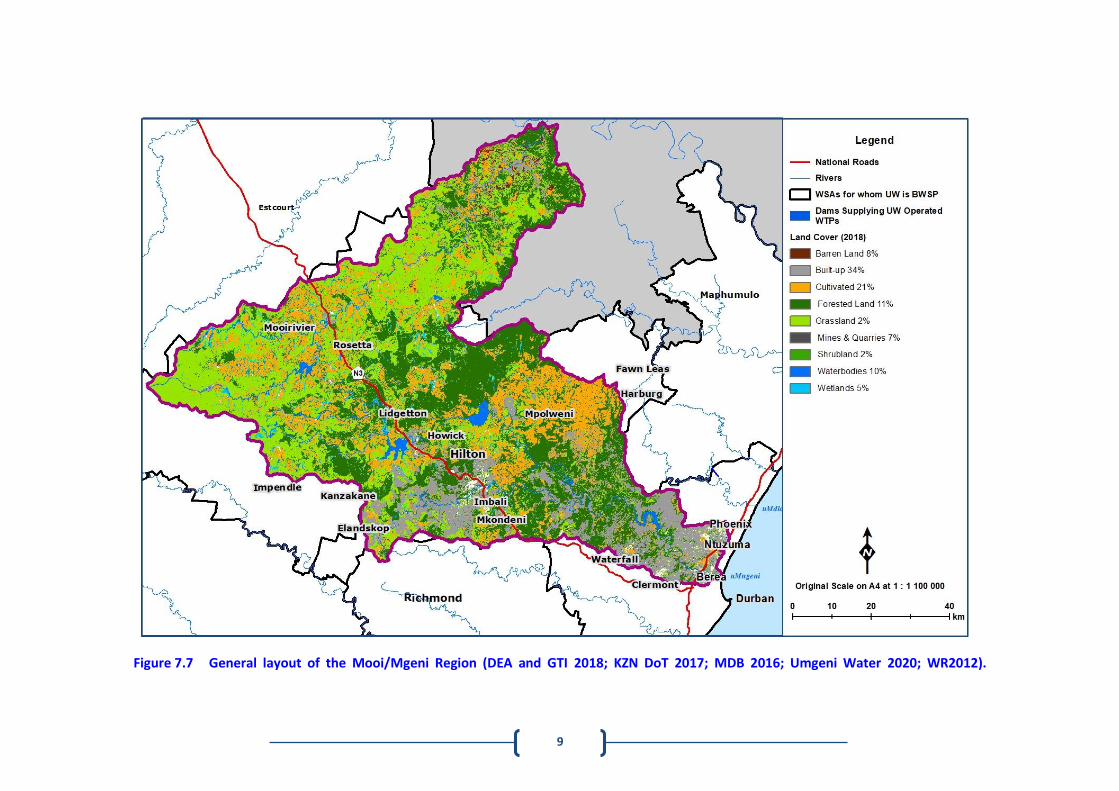
The Mooi/Mgeni region (Figure 7.7) comprises of the two tertiary catchments of U20 (uMngeni River) and V20 (Mooi River). Water is stored in the Mooi River Catchment and transferred to the Mgeni System to augment supply. While the focus on the Mooi River is on the upper reaches and the associated water transfer to the Mgeni, downstream parts of the Mooi River catchment are also of interest to Umgeni Water as they influence releases of water from the Mearns Weir, which in turn impacts on water available for transfer to the Mgeni System. The major urban centres of Durban and Pietermaritzburg are situated within the Mgeni catchment. There are a number of other urban and peri-urban centres within this region including Mooi River, Rosetta, Nottingham Road, Howick, Wartburg, Cato Ridge, and the greater surrounds of both Durban and Pietermaritzburg. The urban centres from Howick towards the coast receive their water from the Mgeni system. The uMngeni River has been fully developed with the construction of four major dams, viz. Nagle (1950), Midmar (1965), Albert Falls (1976) and Inanda (1988). Both the Mooi and Mgeni catchments are no longer open to stream flow reduction activities such as afforestation, expansion of irrigated agriculture or the construction of storage dams, i.e. they are ‘closed’ catchments. The predominant land use in the Mooi catchment is commercial agriculture, and there is large-scale irrigation of pastures and summer cash crops, with an estimated water requirement of 51 million m3/annum (Mooi-Mgeni Hydrology Update Study, 2019). The other large water use is transfers out to the Mgeni catchment. In 1983, during a period of severe drought, the Mearns Emergency Transfer Scheme was constructed by DWS to enable water to be transferred from the Mooi River into the Mgeni catchment. The scheme consisted of a 3 m high weir and a pump station at Mearns on the Mooi River, a 13.3 km long, 1 400 mm diameter steel rising main to a break pressure tank situated at Nottingham Road and a 8.3 km long 900 mm diameter steel gravity main to an outfall structure on the Mpofana River. The emergency scheme was operated for a short period until the drought broke and was then mothballed until 1993 when Umgeni Water re-commissioned it for a short period again during a drought cycle. Since then the Mearns Emergency Transfer Scheme was operated as and when required until the commissioning of the Mooi-Mgeni Transfer Scheme Phase 1 (MMTS-1) in 2003. The MMTS-1 ensured that a maximum flow of 3.2 m3/s could be transferred from the Mooi River into the Mgeni catchment on a more sustained basis than was possible before. Raw water is pumped from a larger Mearns Weir on the Mooi River via the transfer pipeline to an outfall on the Mpofana River. From the Mpofana River the water flows into the Lions River and then into the Mgeni River upstream of Midmar Dam. Phase 2 of the Mooi-Mgeni Transfer Scheme (MMTS-2), which incorporates Spring Grove Dam on the Mooi River and a transfer scheme to pump 4.5 m3/s was completed in 2016. The MMTS-2 has the flexibility of pumping 4.5 m3/s on a continuous basis from Spring Grove Dam or 3.2 m3/s from the Mearns Weir plus 1.3 m3/s from Spring Grove Dam. Operation of this scheme depends on the levels in each of these water resources as well as the need for water at Midmar Dam.
9
Figure 7.7 General layout of the Mooi/Mgeni Region (DEA and GTI 2018; KZN DoT 2017; MDB 2016; Umgeni Water 2020; WR2012).
10
(ii) Surface Water
The hydrological statistics of the catchments in the Mooi-Mgeni Region are summarised in Table 7.1.
Table 7.1 Hydrological characteristics of the Mooi/Mgeni Region (UW,2019).
Region River (Catchment) Area (km2)
Annual Average
Evaporation (mm)
Rainfall (mm)
Natural Runoff (million
m3/annum)
Natural Runoff (mm)
Mooi/Mgeni Mooi River (V20) up to Mearns
1,637 1,342 800 306.1 187
uMngeni River (U20) 4,439 1,214 932 685.8 155
(iii) Groundwater
The Mooi/Mgeni Region occurs in the KwaZulu-Natal Coastal Foreland and North-western Middleveld Groundwater Regions (Section 2). This Groundwater Region is characterised by intergranular and fracture rock aquifers with extremely low to medium development potential. The underlying geology is mostly arenaceous rocks of the Ecca Formation.
Hydrogeological Units The hydrogeologically relevant lithologies recognised in the Mooi/Mgeni region comprise sandstone, tillite and mudstone/shale supporting fractured groundwater regimes and dolerite intrusions and granite/gneiss supporting fractured and weathered groundwater regimes.
Geohydrology The overall median yield (0.33 ℓ/s) of boreholes tapping the Natal Group Sandstone (NGS) identifies this lithology as one of the more productive hydrogeological units in the Mgeni catchment. The highest percentage of boreholes (8%) yielding greater than 4.5 ℓ/s can be found in this lithology. The mudstone/shale of the Ecca Group occurs almost entirely inland at the head of uMngeni River and is the dominant lithology around Pietermaritzburg and Howick. Boreholes tapping these lithologies have median yields of 0.4 ℓ/s. The tillite of the Dwyka Formation in the Mgeni catchment supports an overall median yield of 0.14 ℓ/s and a relatively high percentage (40%) of dry boreholes. The granite/gneisses of the Natal Metamorphic Province (NMP) flank uMngeni River and are concentrated around Nagle and Inanda dams. This lithological unit supports a median yield of 0.18 ℓ/s. An analysis of baseflow-derived stream run-off values per quaternary catchment in the Mgeni catchment suggests that groundwater recharge from rainfall varies in the range 3% to 7% of the mean annual precipitation.
11
In the Mooi catchment, natural groundwater discharge occurs in the form of springs, seeps and in isolated cases, uncapped artesian boreholes. The wetlands and dams in the headwaters of the Mooi River are supported by perennial groundwater seeps associated with the dolerite sill intrusions in the mudstone/shale lithologies. Springs rising in the sandstone and granite/gneiss lithologies relate to structural features (faults and fracture zones, lineaments). An analysis of baseflow-derived stream run-off values per quaternary catchment suggests that groundwater recharge from rainfall varies in the range 3% to 7% of the mean annual precipitation, similar to that found in the Mgeni catchment.
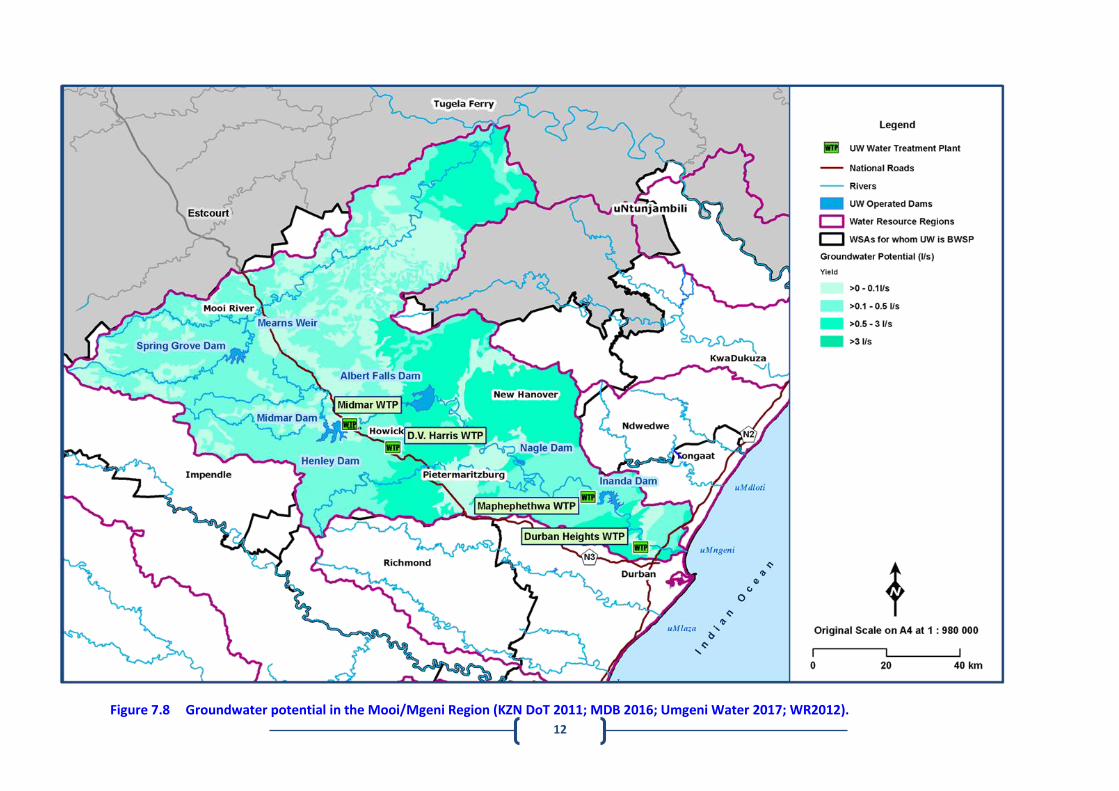
Groundwater Potential The greatest widespread demand on the groundwater resources in the Mooi-Mgeni Region is represented by its use as a source of potable water for communities in the rural areas and, to a lesser extent, households in the farming areas. Other demands of a more concentrated nature are represented by its use to supplement rainfall and traditional surface water supplies for irrigation. The sandstone of the Natal Group represents the most productive groundwater-bearing lithology, followed by mudstone/shale lithologies, the granite/gneiss lithologies and the tillite sediments of the Dwyka Tillite Formation. A good to fair correlation exists between boreholes supporting yields in the moderate (greater than 0.5 ℓ/s to less than 3.0 ℓ/s) and high (greater than 3.0 ℓ/s) classification ranges and structural features represented by faults and remotely sensed lineaments (Figure 7.8).
12
Figure 7.8 Groundwater potential in the Mooi/Mgeni Region (KZN DoT 2011; MDB 2016; Umgeni Water 2017; WR2012).
13
(iv) Water Quality
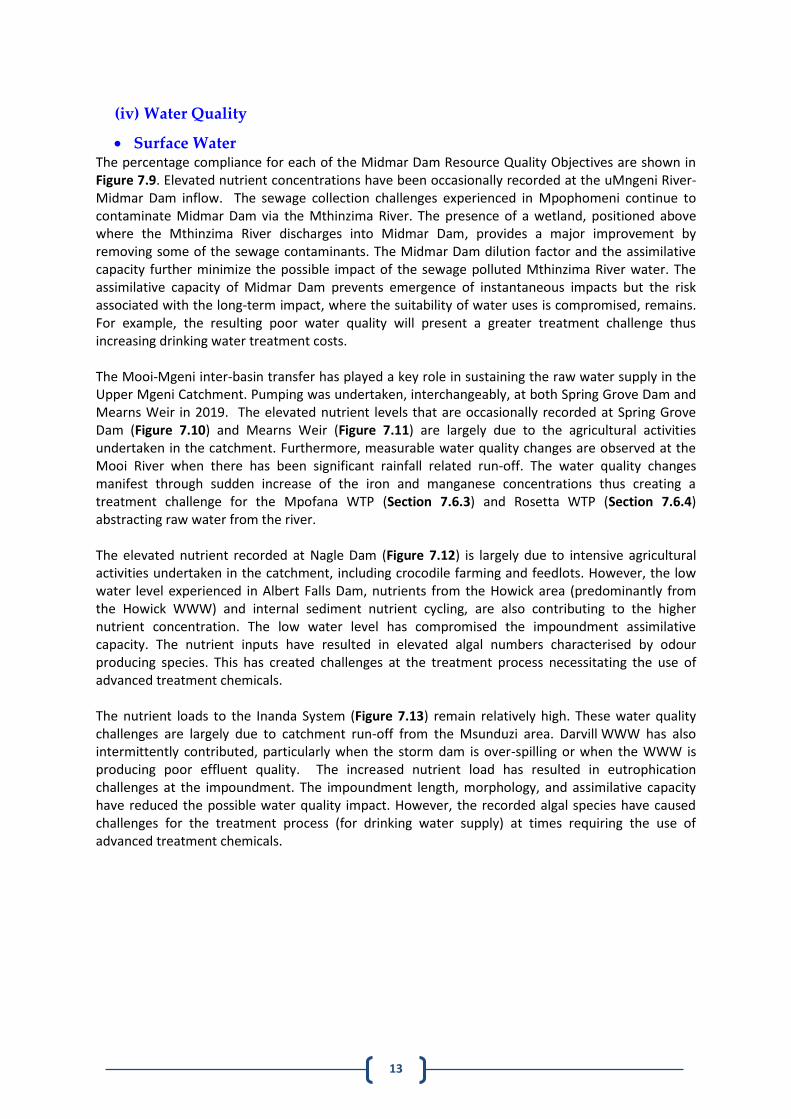
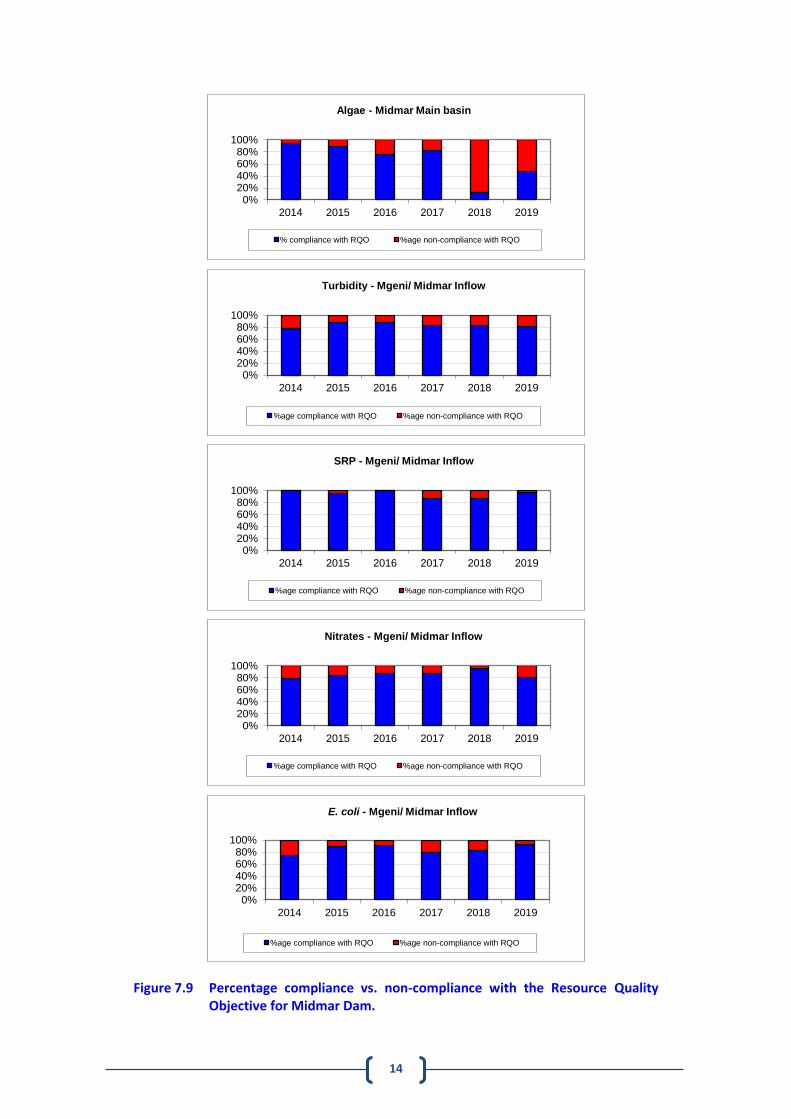
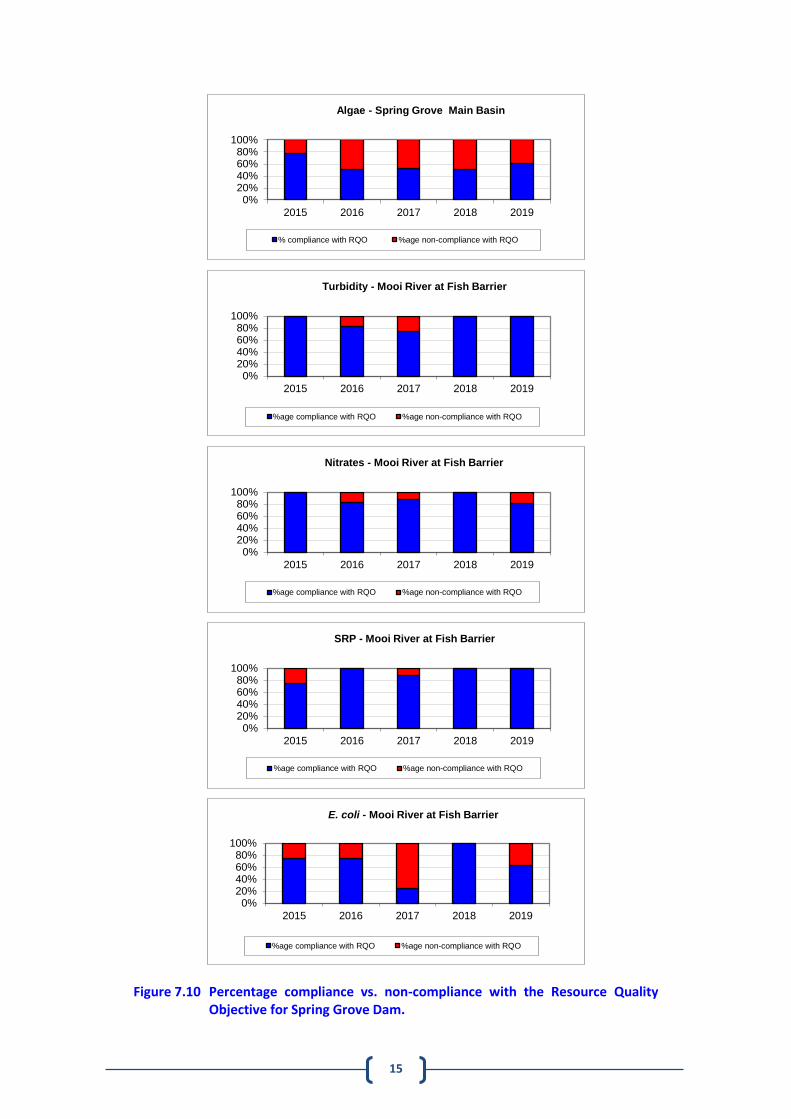
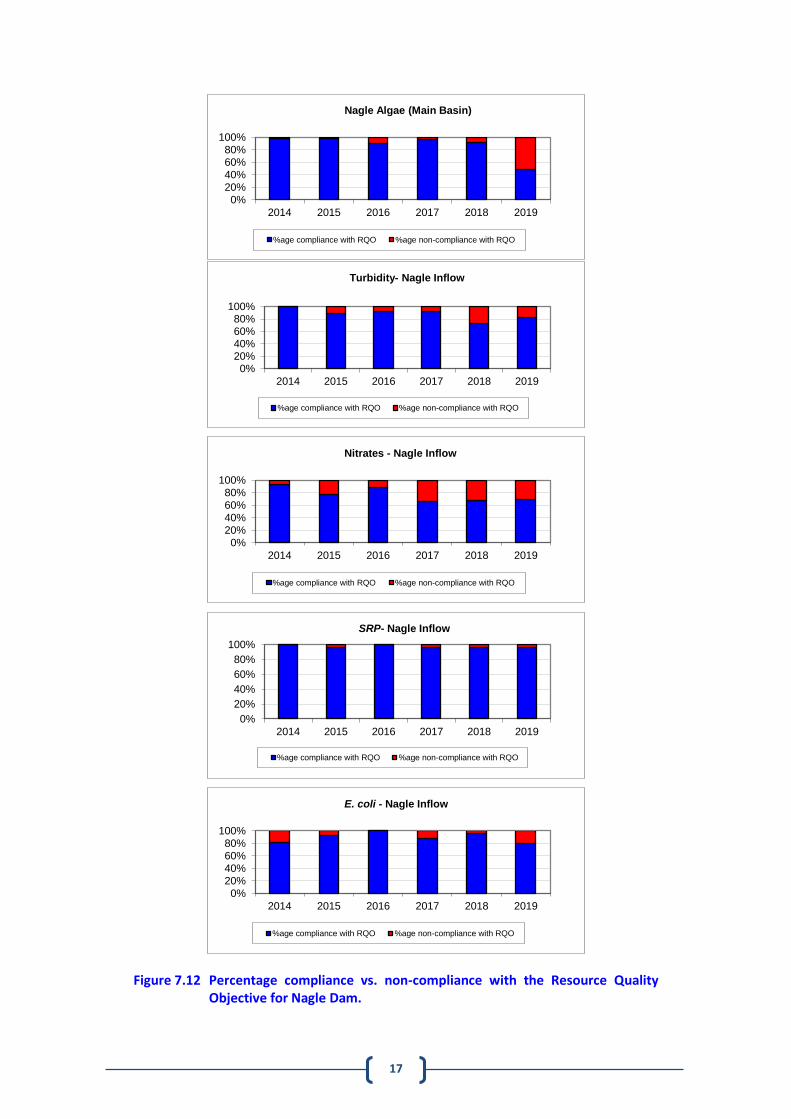
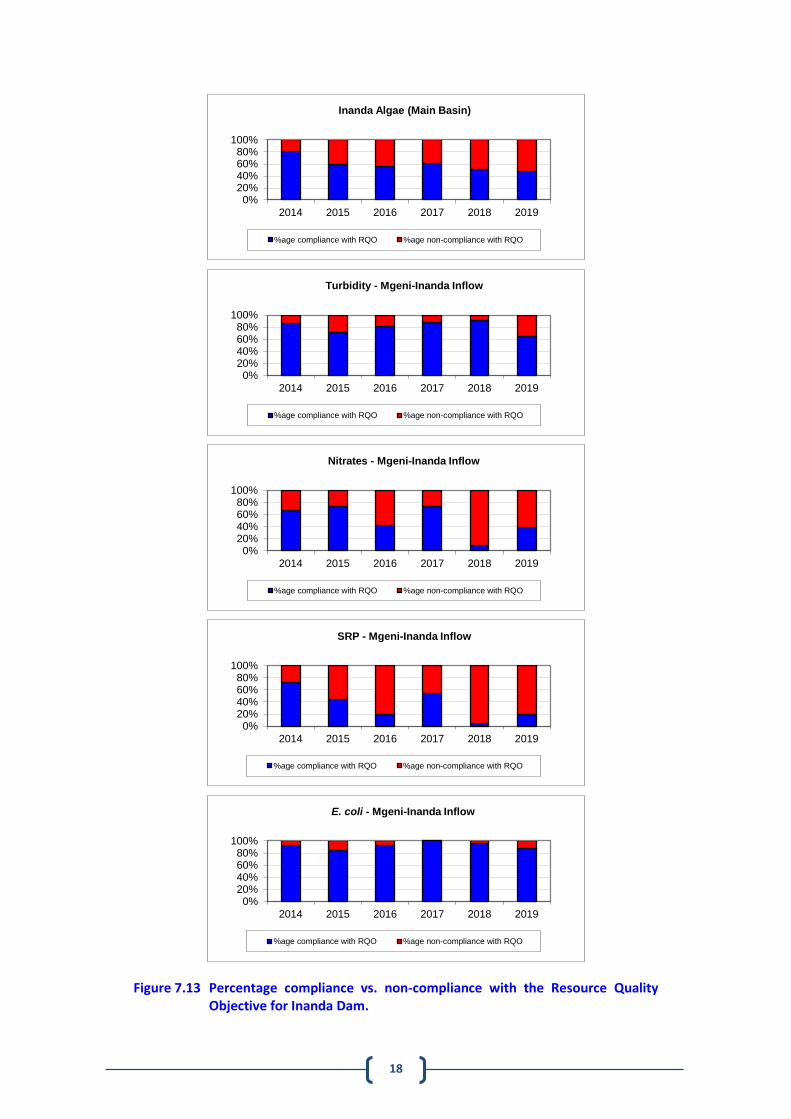
Surface Water The percentage compliance for each of the Midmar Dam Resource Quality Objectives are shown in Figure 7.9. Elevated nutrient concentrations have been occasionally recorded at the uMngeni River-Midmar Dam inflow. The sewage collection challenges experienced in Mpophomeni continue to contaminate Midmar Dam via the Mthinzima River. The presence of a wetland, positioned above where the Mthinzima River discharges into Midmar Dam, provides a major improvement by removing some of the sewage contaminants. The Midmar Dam dilution factor and the assimilative capacity further minimize the possible impact of the sewage polluted Mthinzima River water. The assimilative capacity of Midmar Dam prevents emergence of instantaneous impacts but the risk associated with the long-term impact, where the suitability of water uses is compromised, remains. For example, the resulting poor water quality will present a greater treatment challenge thus increasing drinking water treatment costs. The Mooi-Mgeni inter-basin transfer has played a key role in sustaining the raw water supply in the Upper Mgeni Catchment. Pumping was undertaken, interchangeably, at both Spring Grove Dam and Mearns Weir in 2019. The elevated nutrient levels that are occasionally recorded at Spring Grove Dam (Figure 7.10) and Mearns Weir (Figure 7.11) are largely due to the agricultural activities undertaken in the catchment. Furthermore, measurable water quality changes are observed at the Mooi River when there has been significant rainfall related run-off. The water quality changes manifest through sudden increase of the iron and manganese concentrations thus creating a treatment challenge for the Mpofana WTP (Section 7.6.3) and Rosetta WTP (Section 7.6.4) abstracting raw water from the river. The elevated nutrient recorded at Nagle Dam (Figure 7.12) is largely due to intensive agricultural activities undertaken in the catchment, including crocodile farming and feedlots. However, the low water level experienced in Albert Falls Dam, nutrients from the Howick area (predominantly from the Howick WWW) and internal sediment nutrient cycling, are also contributing to the higher nutrient concentration. The low water level has compromised the impoundment assimilative capacity. The nutrient inputs have resulted in elevated algal numbers characterised by odour producing species. This has created challenges at the treatment process necessitating the use of advanced treatment chemicals. The nutrient loads to the Inanda System (Figure 7.13) remain relatively high. These water quality challenges are largely due to catchment run-off from the Msunduzi area. Darvill WWW has also intermittently contributed, particularly when the storm dam is over-spilling or when the WWW is producing poor effluent quality. The increased nutrient load has resulted in eutrophication challenges at the impoundment. The impoundment length, morphology, and assimilative capacity have reduced the possible water quality impact. However, the recorded algal species have caused challenges for the treatment process (for drinking water supply) at times requiring the use of advanced treatment chemicals.
14
Figure 7.9 Percentage compliance vs. non-compliance with the Resource Quality Objective for Midmar Dam.
0%20%40%60%80%
100%
2014 2015 2016 2017 2018 2019
Algae - Midmar Main basin
% compliance with RQO %age non-compliance with RQO
0%20%40%60%80%
100%
2014 2015 2016 2017 2018 2019
Turbidity - Mgeni/ Midmar Inflow
%age compliance with RQO %age non-compliance with RQO
0%20%40%60%80%
100%
2014 2015 2016 2017 2018 2019
SRP - Mgeni/ Midmar Inflow
%age compliance with RQO %age non-compliance with RQO
0%20%40%60%80%
100%
2014 2015 2016 2017 2018 2019
Nitrates - Mgeni/ Midmar Inflow
%age compliance with RQO %age non-compliance with RQO
0%20%40%60%80%
100%
2014 2015 2016 2017 2018 2019
E. coli - Mgeni/ Midmar Inflow
%age compliance with RQO %age non-compliance with RQO
15
Figure 7.10 Percentage compliance vs. non-compliance with the Resource Quality Objective for Spring Grove Dam.
0%20%40%60%80%
100%
2015 2016 2017 2018 2019
Algae - Spring Grove Main Basin
% compliance with RQO %age non-compliance with RQO
0%20%40%60%80%
100%
2015 2016 2017 2018 2019
Turbidity - Mooi River at Fish Barrier
%age compliance with RQO %age non-compliance with RQO
0%20%40%60%80%
100%
2015 2016 2017 2018 2019
Nitrates - Mooi River at Fish Barrier
%age compliance with RQO %age non-compliance with RQO
0%20%40%60%80%
100%
2015 2016 2017 2018 2019
SRP - Mooi River at Fish Barrier
%age compliance with RQO %age non-compliance with RQO
0%20%40%60%80%
100%
2015 2016 2017 2018 2019
E. coli - Mooi River at Fish Barrier
%age compliance with RQO %age non-compliance with RQO
16
Figure 7.11 Percentage compliance vs. non-compliance with the Resource Quality Objective for Mearns.
0%20%40%60%80%
100%
2014 2015 2016 2017 2018 2019
Algae - Mearns Main Basin
% compliance with RQO %age non-compliance with RQO
0%20%40%60%80%
100%
2014 2015 2016 2017 2018 2019
Turbidity - Mearns Main Basin
% compliance with RQO %age non-compliance with RQO
0%20%40%60%80%
100%
2014 2015 2016 2017 2018 2019
Nitrates - Mearns Main Basin
% compliance with RQO %age non-compliance with RQO
0%20%40%60%80%
100%
2014 2015 2016 2017 2018 2019
SRP - Mearns Main Basin
% compliance with RQO %age non-compliance with RQO
0%20%40%60%80%
100%
2014 2015 2016 2017 2018 2019
E. coli - Mearns Main Basin
% compliance with RQO %age non-compliance with RQO
17
Figure 7.12 Percentage compliance vs. non-compliance with the Resource Quality Objective for Nagle Dam.
0%20%40%60%80%
100%
2014 2015 2016 2017 2018 2019
Nagle Algae (Main Basin)
%age compliance with RQO %age non-compliance with RQO
0%20%40%60%80%
100%
2014 2015 2016 2017 2018 2019
Turbidity- Nagle Inflow
%age compliance with RQO %age non-compliance with RQO
0%20%40%60%80%
100%
2014 2015 2016 2017 2018 2019
Nitrates - Nagle Inflow
%age compliance with RQO %age non-compliance with RQO
0%
20%
40%
60%
80%
100%
2014 2015 2016 2017 2018 2019
SRP- Nagle Inflow
%age compliance with RQO %age non-compliance with RQO
0%20%40%60%80%
100%
2014 2015 2016 2017 2018 2019
E. coli - Nagle Inflow
%age compliance with RQO %age non-compliance with RQO
18
Figure 7.13 Percentage compliance vs. non-compliance with the Resource Quality Objective for Inanda Dam.
0%20%40%60%80%
100%
2014 2015 2016 2017 2018 2019
Inanda Algae (Main Basin)
%age compliance with RQO %age non-compliance with RQO
0%20%40%60%80%
100%
2014 2015 2016 2017 2018 2019
Turbidity - Mgeni-Inanda Inflow
%age compliance with RQO %age non-compliance with RQO
0%20%40%60%80%
100%
2014 2015 2016 2017 2018 2019
Nitrates - Mgeni-Inanda Inflow
%age compliance with RQO %age non-compliance with RQO
0%20%40%60%80%
100%
2014 2015 2016 2017 2018 2019
SRP - Mgeni-Inanda Inflow
%age compliance with RQO %age non-compliance with RQO
0%20%40%60%80%
100%
2014 2015 2016 2017 2018 2019
E. coli - Mgeni-Inanda Inflow
%age compliance with RQO %age non-compliance with RQO
19
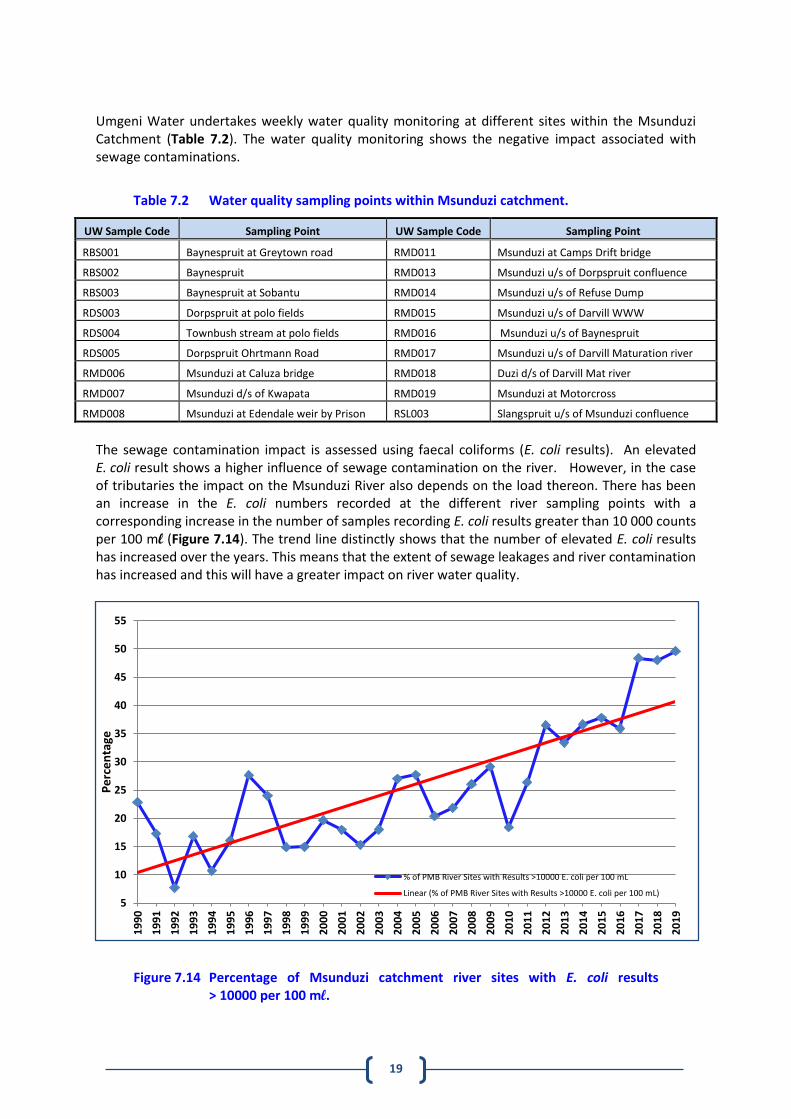
Umgeni Water undertakes weekly water quality monitoring at different sites within the Msunduzi Catchment (Table 7.2). The water quality monitoring shows the negative impact associated with sewage contaminations.
Table 7.2 Water quality sampling points within Msunduzi catchment.
UW Sample Code Sampling Point UW Sample Code Sampling Point
RBS001 Baynespruit at Greytown road RMD011 Msunduzi at Camps Drift bridge
RBS002 Baynespruit RMD013 Msunduzi u/s of Dorpspruit confluence
RBS003 Baynespruit at Sobantu RMD014 Msunduzi u/s of Refuse Dump
RDS003 Dorpspruit at polo fields RMD015 Msunduzi u/s of Darvill WWW
RDS004 Townbush stream at polo fields RMD016 Msunduzi u/s of Baynespruit
RDS005 Dorpspruit Ohrtmann Road RMD017 Msunduzi u/s of Darvill Maturation river
RMD006 Msunduzi at Caluza bridge RMD018 Duzi d/s of Darvill Mat river
RMD007 Msunduzi d/s of Kwapata RMD019 Msunduzi at Motorcross
RMD008 Msunduzi at Edendale weir by Prison RSL003 Slangspruit u/s of Msunduzi confluence
The sewage contamination impact is assessed using faecal coliforms (E. coli results). An elevated E. coli result shows a higher influence of sewage contamination on the river. However, in the case of tributaries the impact on the Msunduzi River also depends on the load thereon. There has been an increase in the E. coli numbers recorded at the different river sampling points with a corresponding increase in the number of samples recording E. coli results greater than 10 000 counts per 100 ml (Figure 7.14). The trend line distinctly shows that the number of elevated E. coli results has increased over the years. This means that the extent of sewage leakages and river contamination has increased and this will have a greater impact on river water quality.
Figure 7.14 Percentage of Msunduzi catchment river sites with E. coli results > 10000 per 100 ml.
5
10
15
20
25
30
35
40
45
50
55
19
90
19
91
19
92
19
93
19
94
19
95
19
96
19
97
19
98
19
99
20
00
20
01
20
02
20
03
20
04
20
05
20
06
20
07
20
08
20
09
20
10
20
11
20
12
20
13
20
14
20
15
20
16
20
17
20
18
20
19
Pe
rce
nta
ge
% of PMB River Sites with Results >10000 E. coli per 100 mL
Linear (% of PMB River Sites with Results >10000 E. coli per 100 mL)
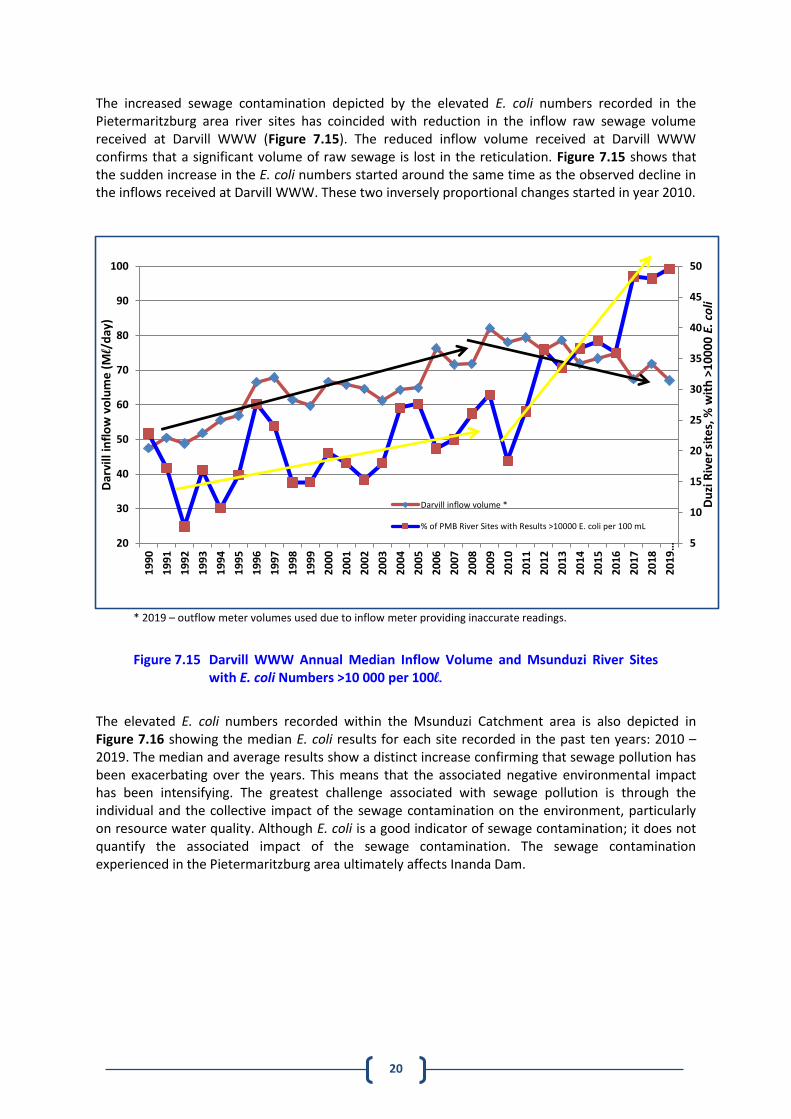
20
The increased sewage contamination depicted by the elevated E. coli numbers recorded in the Pietermaritzburg area river sites has coincided with reduction in the inflow raw sewage volume received at Darvill WWW (Figure 7.15). The reduced inflow volume received at Darvill WWW confirms that a significant volume of raw sewage is lost in the reticulation. Figure 7.15 shows that the sudden increase in the E. coli numbers started around the same time as the observed decline in the inflows received at Darvill WWW. These two inversely proportional changes started in year 2010.
* 2019 – outflow meter volumes used due to inflow meter providing inaccurate readings.
Figure 7.15 Darvill WWW Annual Median Inflow Volume and Msunduzi River Sites with E. coli Numbers >10 000 per 100l.
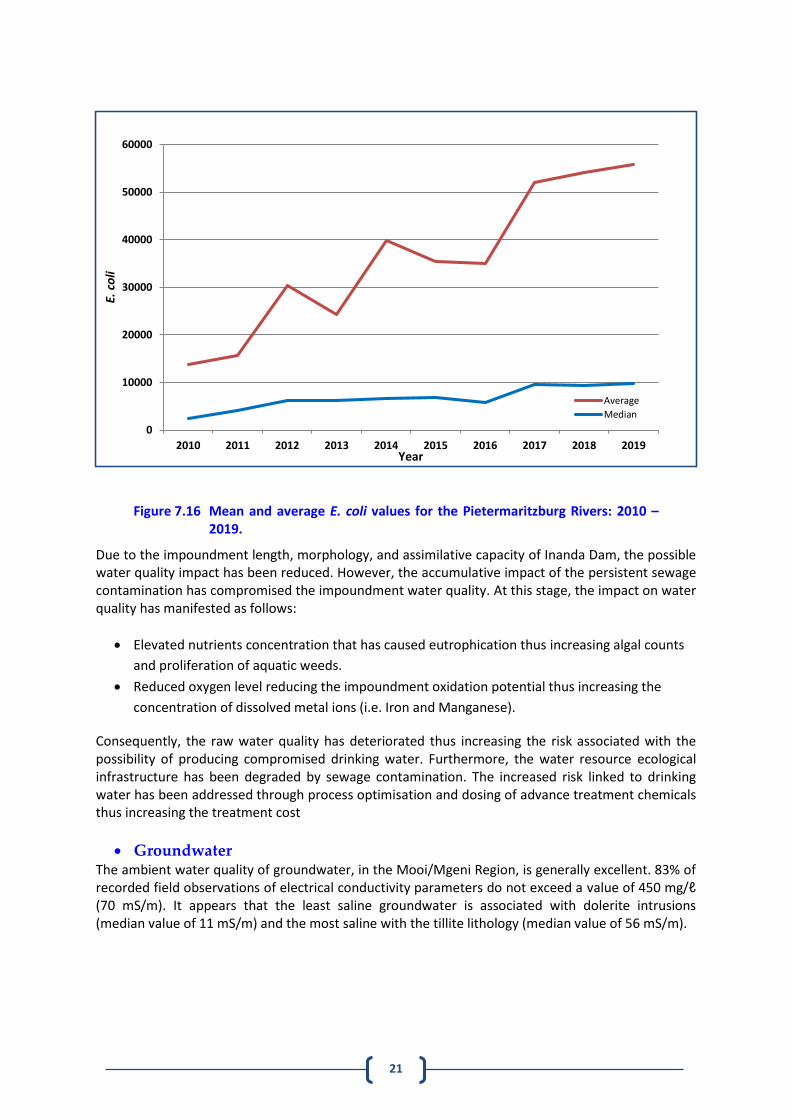
The elevated E. coli numbers recorded within the Msunduzi Catchment area is also depicted in Figure 7.16 showing the median E. coli results for each site recorded in the past ten years: 2010 – 2019. The median and average results show a distinct increase confirming that sewage pollution has been exacerbating over the years. This means that the associated negative environmental impact has been intensifying. The greatest challenge associated with sewage pollution is through the individual and the collective impact of the sewage contamination on the environment, particularly on resource water quality. Although E. coli is a good indicator of sewage contamination; it does not quantify the associated impact of the sewage contamination. The sewage contamination experienced in the Pietermaritzburg area ultimately affects Inanda Dam.
5
10
15
20
25
30
35
40
45
50
20
30
40
50
60
70
80
90
100
19
90
19
91
19
92
19
93
19
94
19
95
19
96
19
97
19
98
19
99
20
00
20
01
20
02
20
03
20
04
20
05
20
06
20
07
20
08
20
09
20
10
20
11
20
12
20
13
20
14
20
15
20
16
20
17
20
18
20
19
…
Du
zi R
ive
r si
tes,
% w
ith
>1
00
00
E.
coli
Dar
vill
infl
ow
vo
lum
e (
Ml/
day
)
Darvill inflow volume *
% of PMB River Sites with Results >10000 E. coli per 100 mL
21
Figure 7.16 Mean and average E. coli values for the Pietermaritzburg Rivers: 2010 – 2019.
Due to the impoundment length, morphology, and assimilative capacity of Inanda Dam, the possible water quality impact has been reduced. However, the accumulative impact of the persistent sewage contamination has compromised the impoundment water quality. At this stage, the impact on water quality has manifested as follows:
Elevated nutrients concentration that has caused eutrophication thus increasing algal counts
and proliferation of aquatic weeds.
Reduced oxygen level reducing the impoundment oxidation potential thus increasing the
concentration of dissolved metal ions (i.e. Iron and Manganese).
Consequently, the raw water quality has deteriorated thus increasing the risk associated with the possibility of producing compromised drinking water. Furthermore, the water resource ecological infrastructure has been degraded by sewage contamination. The increased risk linked to drinking water has been addressed through process optimisation and dosing of advance treatment chemicals thus increasing the treatment cost
Groundwater The ambient water quality of groundwater, in the Mooi/Mgeni Region, is generally excellent. 83% of recorded field observations of electrical conductivity parameters do not exceed a value of 450 mg/ℓ (70 mS/m). It appears that the least saline groundwater is associated with dolerite intrusions (median value of 11 mS/m) and the most saline with the tillite lithology (median value of 56 mS/m).
0
10000
20000
30000
40000
50000
60000
2010 2011 2012 2013 2014 2015 2016 2017 2018 2019
E. c
oli
Year
Average
Median
22
(b) uMkhomazi Region
(i) Overview
The uMkhomazi River has its source at an elevation of approximately 3 000 m above sea level in the Drakensberg Mountains. The river flows in a south-easterly direction and enters the Indian Ocean near the town of uMkomaas about 40 km south of Durban. Several large tributaries, including the Loteni, Nzinga, Mkomazane, Elands and iXobho rivers flow into the uMkhomazi. The region includes the small towns of Bulwer, Impendle, Ixopo, Mkhomazi, Craigieburn and Magabheni which have small water requirements. The Department of Water and Sanitation Reconciliation Strategy Study (DWA, 2010) confirmed that the uMkhomazi Water Project, which includes the transfer of water from Smithfield Dam on the uMkhomazi River to the Mgeni System (Section 7.5.2 (a)), would be the most feasible for augmenting the water resources of the Mgeni System (Figure 7.17). From a hydrological perspective, the uMkhomazi River Catchment comprises the tertiary catchment U10, as shown in Figure 7.18. The uMkhomazi River Catchment has a catchment area of 4 387 km². There is an estimated total of almost 1 000 small dams in the catchment with a combined storage of over 30 million m3 (DWS, 2015). The catchment is currently fairly undeveloped with the main land use activities being commercial forestry and irrigation in the central catchment areas around the towns of Bulwer, Richmond, Ixopo and Impendle. There is a large industrial abstraction for Sappi Saiccor near the coastal town of Umkomaas. The catchment is the third largest river in KwaZulu-Natal in terms of mean annual runoff also known as MAR.
(ii) Surface Water
The hydrological characteristics for this region are summarised in Table 7.3 and Table 7.4. This catchment has an annual natural runoff of 1 078 million m³, 67% of which is generated upstream of the proposed Smithfield Dam site.
Table 7.3 Hydrological characteristics of uMkhomazi River catchment (DWS 2015).
Quaternary Catchment
Incremental Area (km2)
MAP (mm)
MAE (mm)
Incremental Natural MAR
(Million m3/annum)
(mm/annum) (% MAP)
U10A 418 1287 1,300 209.52 501 39
U10B 392 1176 1,300 164.49 420 36
U10C 267 1091 1,300 96.70 362 33
U10D 337 999 1,300 98.22 291 29
U10E 327 1034 1,300 100.92 309 30
U10F 379 963 1,300 67.08 177 18
U10G 353 981 1,250 70.12 199 20
U10H 458 924 1,200 82.66 180 20
U10J 505 878 1,200 77.99 154 18
U10K 364 793 1,200 40.42 111 14
U10L 307 758 1,200 29.56 96 13
U10M 280 858 1,200 40.06 143 17
Total 4387 981 1,252 1077.74 246 25
23 Figure 7.17 Locality map of the uMkhomazi, uMlaza and uMngeni river catchments.
24
Figure 7.18 General layout of the Mkhomazi Region (DEA and GTI 2018; KZN DoT 2017; MDB 2016; Umgeni Water 2020; WR2012).
25
Table 7.4 Hydrological characteristics of the uMkhomazi Region (Umgeni Water 2002 and DWA 2013).
Region River (Catchment) Incremental Area
(km2)
Annual Average
MAE (mm)
Rainfall (mm)
Natural Runoff (million
m3/annum)
Natural Runoff (mm)
Mkhomazi Impendle 1,422 1,300 1,138 567.9 399.4
Smithfield 632 1,300 1,017 163.2 258.2
Ngwadini 2,242 1,200 875 324.5 144.7
Mkhomazi Estuary 91 1,200 855 11.3 124.2
Luhane 46.3 1,361 980 7.5* 161.9
* Present day MAR
(iii) Groundwater
The Mkhomazi Region occurs in the KwaZulu-Natal Coastal Foreland and Northwestern Middleveld Groundwater Regions (Section 2). As such this Groundwater Region is characterised by a combination of intergranular and fractured arenaceous rocks.
Hydrogeological Units The hydrogeologically relevant lithologies recognised in the Mkhomazi Region comprise sandstone, tillite and mudstone/shale supporting fractured groundwater regimes and dolerite intrusions and granite/gneiss supporting fractured and weathered groundwater regimes.
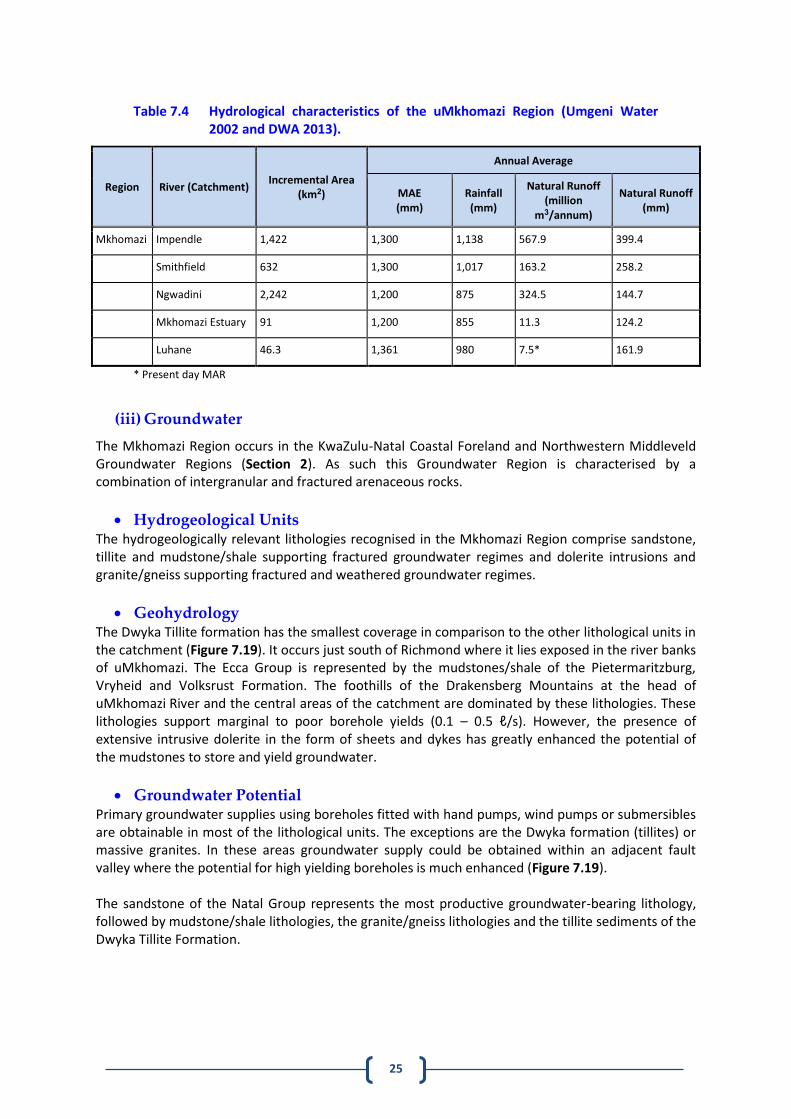
Geohydrology The Dwyka Tillite formation has the smallest coverage in comparison to the other lithological units in the catchment (Figure 7.19). It occurs just south of Richmond where it lies exposed in the river banks of uMkhomazi. The Ecca Group is represented by the mudstones/shale of the Pietermaritzburg, Vryheid and Volksrust Formation. The foothills of the Drakensberg Mountains at the head of uMkhomazi River and the central areas of the catchment are dominated by these lithologies. These lithologies support marginal to poor borehole yields (0.1 – 0.5 ℓ/s). However, the presence of extensive intrusive dolerite in the form of sheets and dykes has greatly enhanced the potential of the mudstones to store and yield groundwater.
Groundwater Potential Primary groundwater supplies using boreholes fitted with hand pumps, wind pumps or submersibles are obtainable in most of the lithological units. The exceptions are the Dwyka formation (tillites) or massive granites. In these areas groundwater supply could be obtained within an adjacent fault valley where the potential for high yielding boreholes is much enhanced (Figure 7.19). The sandstone of the Natal Group represents the most productive groundwater-bearing lithology, followed by mudstone/shale lithologies, the granite/gneiss lithologies and the tillite sediments of the Dwyka Tillite Formation.
26
Figure 7.19 Groundwater potential in the Mkhomazi Region (KZN DoT 2011; MDB 2016; Umgeni Water 2017; WR2012).
27
Boreholes favourably located in the Natal Group Sandstone (NGS) provide good yields. Yields of 3 ℓ/s (greater than 10 000 ℓ/hr) are not uncommon where large scale fracturing/faulting provide conduits for groundwater movement Boreholes located in metamorphic lithologies (gneisses) indicate yield characteristics in the range 0.1 to 0.5 ℓ/s, with a median value of 0.3 ℓ/s.
(iv) Water Quality
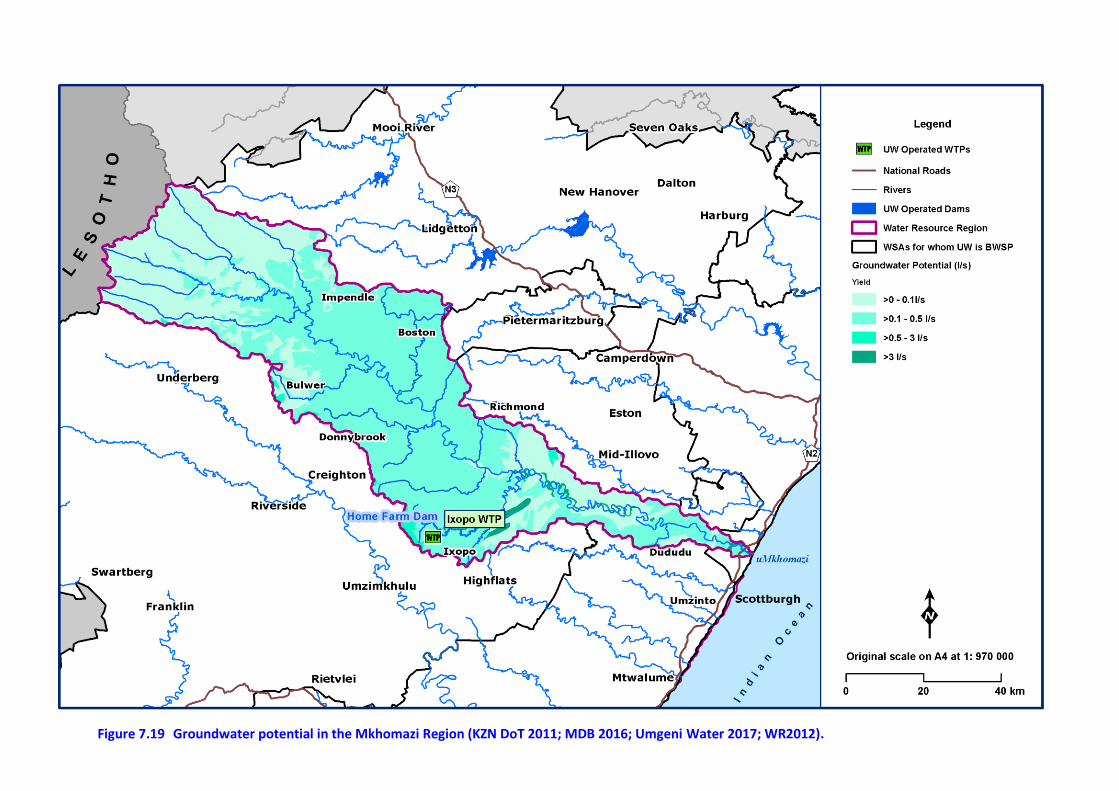
Although the reported water quality indicators do not suggest a significant water quality related problem (Figure 7.20), the Home Farm Dam, in the Ixopo System, is currently infested by aquatic weeds. The infestation is able to develop largely due to the on-going sewage collection challenges experienced in the area. Most of the raw sewage is lost (due to sewer leakages) within the sewer network, thus contaminating the water resources. Mechanical clearing and weed bio-control re-introduction has been instituted at Home Farm Dam.
Figure 7.20 Percentage compliance vs. non-compliance with the Resource Quality Objective for the Home Farm Dam.
0%20%40%60%80%
100%
2014 2015 2016 2017 2018 2019
Algae - Home Farm Dam
%age compliance with RQO %age non-compliance with RQO
0%
50%
100%
2014 2015 2016 2017 2018 2019
Turbidity- Home Farm Dam
%age compliance with RQO %age non-compliance with RQO
0%
50%
100%
2014 2015 2016 2017 2018 2019
E. coli - Home Farm Dam
%age compliance with RQO %age non-compliance with RQO
28
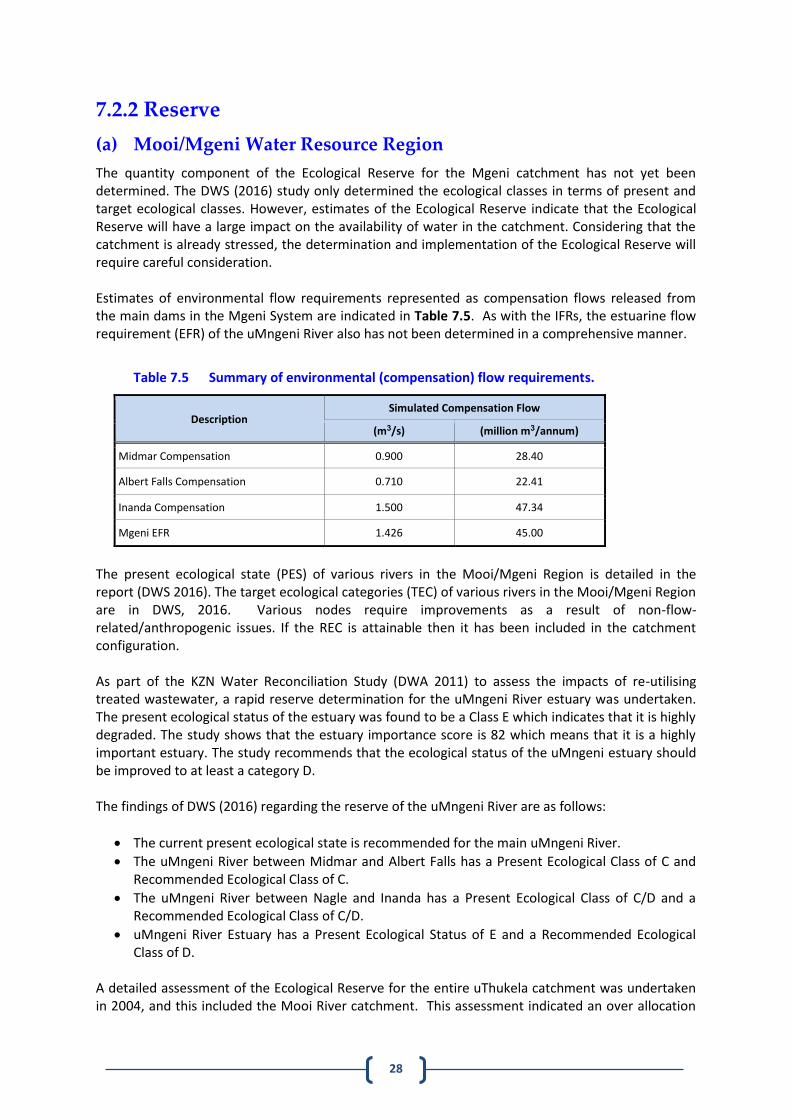
7.2.2 Reserve
(a) Mooi/Mgeni Water Resource Region
The quantity component of the Ecological Reserve for the Mgeni catchment has not yet been determined. The DWS (2016) study only determined the ecological classes in terms of present and target ecological classes. However, estimates of the Ecological Reserve indicate that the Ecological Reserve will have a large impact on the availability of water in the catchment. Considering that the catchment is already stressed, the determination and implementation of the Ecological Reserve will require careful consideration. Estimates of environmental flow requirements represented as compensation flows released from the main dams in the Mgeni System are indicated in Table 7.5. As with the IFRs, the estuarine flow requirement (EFR) of the uMngeni River also has not been determined in a comprehensive manner.
Table 7.5 Summary of environmental (compensation) flow requirements.
Description Simulated Compensation Flow
(m3/s) (million m3/annum)
Midmar Compensation 0.900 28.40
Albert Falls Compensation 0.710 22.41
Inanda Compensation 1.500 47.34
Mgeni EFR 1.426 45.00
The present ecological state (PES) of various rivers in the Mooi/Mgeni Region is detailed in the report (DWS 2016). The target ecological categories (TEC) of various rivers in the Mooi/Mgeni Region are in DWS, 2016. Various nodes require improvements as a result of non-flow-related/anthropogenic issues. If the REC is attainable then it has been included in the catchment configuration. As part of the KZN Water Reconciliation Study (DWA 2011) to assess the impacts of re-utilising treated wastewater, a rapid reserve determination for the uMngeni River estuary was undertaken. The present ecological status of the estuary was found to be a Class E which indicates that it is highly degraded. The study shows that the estuary importance score is 82 which means that it is a highly important estuary. The study recommends that the ecological status of the uMngeni estuary should be improved to at least a category D. The findings of DWS (2016) regarding the reserve of the uMngeni River are as follows:
The current present ecological state is recommended for the main uMngeni River.
The uMngeni River between Midmar and Albert Falls has a Present Ecological Class of C and Recommended Ecological Class of C.
The uMngeni River between Nagle and Inanda has a Present Ecological Class of C/D and a Recommended Ecological Class of C/D.
uMngeni River Estuary has a Present Ecological Status of E and a Recommended Ecological Class of D.
A detailed assessment of the Ecological Reserve for the entire uThukela catchment was undertaken in 2004, and this included the Mooi River catchment. This assessment indicated an over allocation
29
of water, particularly on the Little Mooi River. In order to ensure that the correct Reserve flows are maintained in the Little Mooi River, an approximate 50% curtailment of the existing registered irrigation and afforestation is required. Additionally, all existing farm dams will be required to release their rightful share of the Reserve. Currently none of these dams are contributing to the Reserve. Hence a compulsory licensing process will need to be completed by DWS before the Reserve can be fully implemented in the Mooi catchment. The necessary river outlets have been included into the design of Spring Grove Dam to ensure that it will be able to release the required volumes of water needed for the Reserve.
(b) Mkhomazi Water Resource Region
No comprehensive assessment, using the accepted standardised methodology, has been undertaken of the ecological Reserve of uMkhomazi River to date. A Reserve determination was undertaken in the late 1990’s as part of the pre-feasibility investigations into a transfer scheme from uMkhomazi to uMngeni catchment. The DWS (2016) study found that the present ecological state of the uMkhomazi River is in a B class in the upper reaches and a C class in the lower reaches. These ecological classes are also recommended for the proposed Mkhomazi-Mgeni Transfer Scheme, also known as the uMkhomazi Water Project (Section 7.5.2 (a)). Taking into account the current conditions of the estuary with a present ecological class of a C, the reversibility of the current impacts and the ecological importance and the conservation requirements of the uMkhomazi Estuary, the current recommendation is for an ecological Class B category. The present ecological state (PES) of various rivers in the Mkhomazi Region is detailed in the DWS report (DWS, 2016). The targeted ecological categories (TEC) of various rivers in the Mkhomazi Region are in the report. Various nodes require improvements as a result of non-flow-related/anthropogenic issues. If the REC is attainable then it has been included in the catchment configuration.
7.2.3 Climate Change Impacts
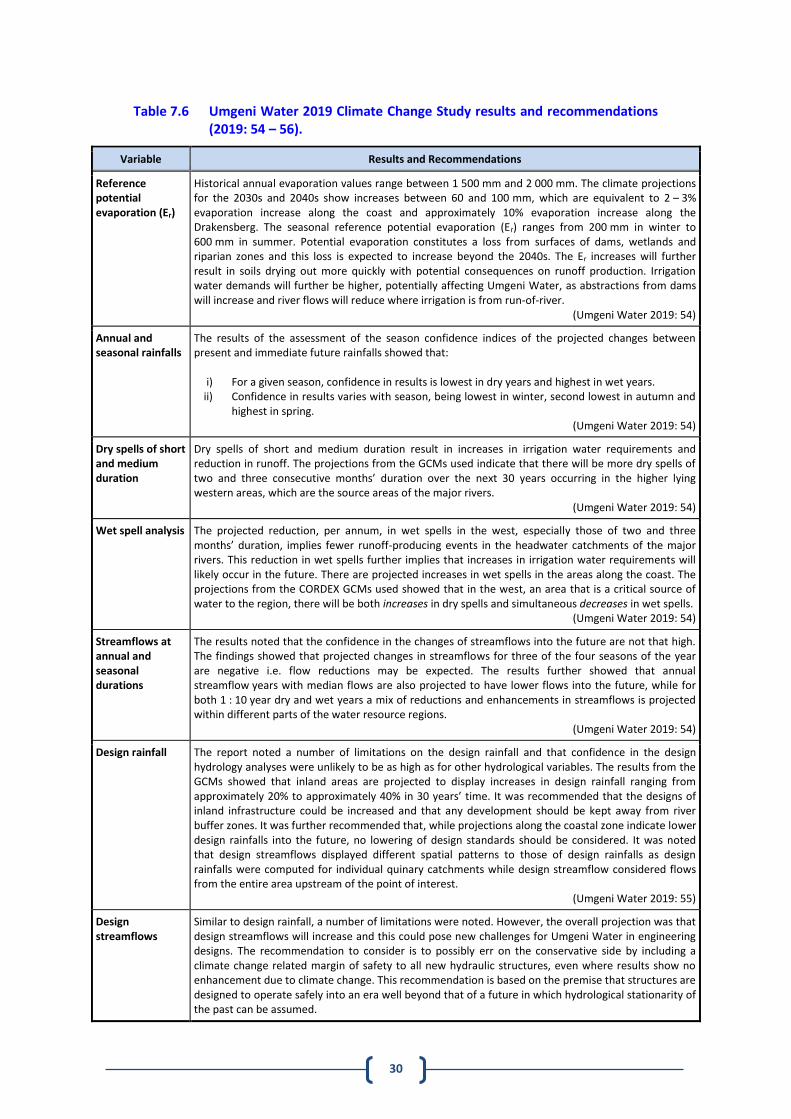
In August 2019, Umgeni Water updated a 2012 study that investigated the potential impacts of climate change on the Mooi/Mgeni, Mkomazi, Mlazi/Lovu, Mdloti and Mvoti water resource regions. The 2019 study used ten selected Global Circulation Models (GCMs) from Phase 5 of the Coupled Model Intercomparison Project (commonly referred to as CMIP51). The results and recommendations of this report are summarised in Table 7.6.
1 https://esgf-node.llnl.gov/projects/cmip5/.
30
Table 7.6 Umgeni Water 2019 Climate Change Study results and recommendations (2019: 54 – 56).
Variable Results and Recommendations
Reference potential evaporation (Er)
Historical annual evaporation values range between 1 500 mm and 2 000 mm. The climate projections for the 2030s and 2040s show increases between 60 and 100 mm, which are equivalent to 2 – 3% evaporation increase along the coast and approximately 10% evaporation increase along the Drakensberg. The seasonal reference potential evaporation (Er) ranges from 200 mm in winter to 600 mm in summer. Potential evaporation constitutes a loss from surfaces of dams, wetlands and riparian zones and this loss is expected to increase beyond the 2040s. The Er increases will further result in soils drying out more quickly with potential consequences on runoff production. Irrigation water demands will further be higher, potentially affecting Umgeni Water, as abstractions from dams will increase and river flows will reduce where irrigation is from run-of-river.
(Umgeni Water 2019: 54)
Annual and seasonal rainfalls
The results of the assessment of the season confidence indices of the projected changes between present and immediate future rainfalls showed that:
i) For a given season, confidence in results is lowest in dry years and highest in wet years. ii) Confidence in results varies with season, being lowest in winter, second lowest in autumn and
highest in spring. (Umgeni Water 2019: 54)
Dry spells of short and medium duration
Dry spells of short and medium duration result in increases in irrigation water requirements and reduction in runoff. The projections from the GCMs used indicate that there will be more dry spells of two and three consecutive months’ duration over the next 30 years occurring in the higher lying western areas, which are the source areas of the major rivers.
(Umgeni Water 2019: 54)
Wet spell analysis The projected reduction, per annum, in wet spells in the west, especially those of two and three months’ duration, implies fewer runoff-producing events in the headwater catchments of the major rivers. This reduction in wet spells further implies that increases in irrigation water requirements will likely occur in the future. There are projected increases in wet spells in the areas along the coast. The projections from the CORDEX GCMs used showed that in the west, an area that is a critical source of water to the region, there will be both increases in dry spells and simultaneous decreases in wet spells.
(Umgeni Water 2019: 54)
Streamflows at annual and seasonal durations
The results noted that the confidence in the changes of streamflows into the future are not that high. The findings showed that projected changes in streamflows for three of the four seasons of the year are negative i.e. flow reductions may be expected. The results further showed that annual streamflow years with median flows are also projected to have lower flows into the future, while for both 1 : 10 year dry and wet years a mix of reductions and enhancements in streamflows is projected within different parts of the water resource regions.
(Umgeni Water 2019: 54)
Design rainfall The report noted a number of limitations on the design rainfall and that confidence in the design hydrology analyses were unlikely to be as high as for other hydrological variables. The results from the GCMs showed that inland areas are projected to display increases in design rainfall ranging from approximately 20% to approximately 40% in 30 years’ time. It was recommended that the designs of inland infrastructure could be increased and that any development should be kept away from river buffer zones. It was further recommended that, while projections along the coastal zone indicate lower design rainfalls into the future, no lowering of design standards should be considered. It was noted that design streamflows displayed different spatial patterns to those of design rainfalls as design rainfalls were computed for individual quinary catchments while design streamflow considered flows from the entire area upstream of the point of interest.
(Umgeni Water 2019: 55)
Design streamflows
Similar to design rainfall, a number of limitations were noted. However, the overall projection was that design streamflows will increase and this could pose new challenges for Umgeni Water in engineering designs. The recommendation to consider is to possibly err on the conservative side by including a climate change related margin of safety to all new hydraulic structures, even where results show no enhancement due to climate change. This recommendation is based on the premise that structures are designed to operate safely into an era well beyond that of a future in which hydrological stationarity of the past can be assumed.
31
(Umgeni Water 2019: 55 – 56)
7.2.4 Existing Infrastructure and Yields
(a) Mooi/Mgeni Water Resource Region
There are four major dams on the uMngeni River, namely Midmar (Figure 7.21), Albert Falls (Figure 7.22), Nagle (Figure 7.23) and Inanda (Figure 7.24) dams. These dams are all used as part of the water supply system. The characteristics of these dams are summarised in Table 7.7, Table 7.8, Table 7.9, and Table 7.10 respectively. The silt surveys for dams in the Mooi/Mgeni System should be undertaken every 15 years. As part of the Mooi/Mgeni Transfer Scheme, water is pumped from either Spring Grove Dam or Mearns Weir located in the Mooi River catchment. The characteristics of Mearns Weir and Spring Grove Dam (Figure 7.25 and Figure 7.26) are summarised in Table 7.11, and Table 7.12. Henley Dam (Figure 7.27 and Table 7.13), situated on the Msunduzi River, a tributary of uMngeni River is no longer used for water supply purposes. All significant dams within the Mooi/Mgeni Region are listed in Table 7.14. Raw water is supplied from Midmar Dam under gravity to DV Harris WTP, and under pumping (8 m lift) to Midmar WTP. Water is released from Albert Falls Dam to Nagle Dam from where it is supplied under gravity to Durban Heights WTP. Raw water is supplied from Inanda Dam under gravity to Wiggins WTP. It is possible to pump water from Inanda Dam to Durban Heights WTP utilising two different pump sets, viz. the ‘Shaft’ pumps, comprising three pumps capable of delivering a maximum of 140Mℓ/day with one standby, and the ‘Inanda’ pumps, comprising two pumps capable of delivering a maximum of 120Mℓ/day. Pumping from Inanda Dam has not been maximized over the past year as a result of operational challenges (a burst) on one of the Nagle Aqueducts connected to the pumping line. Under normal conditions, it is possible to pump a total of 260Mℓ/day from Inanda Dam to Durban Heights WTP. A fourth Shaft Pump, delivering 40Mℓ/day can increase the total pumping capacity to approximately 280Mℓ/day although this could impact scheduled maintenance and operational flexibility and hence the maximum delivery is limited to 140Mℓ/d.
Near full capacity pumping was achieved from Spring Grove Dam and Mearns Weir during the past year. The benefit of this pumping has been evident at Midmar Dam where the level would have been much lower had pumping not taken place. Other than Mearns Weir and Spring Grove Dam, there is one additional major dam in the catchment, i.e. Craigieburn Dam on the Mnyamvubu River, which is a tributary of the Mooi River. Craigieburn Dam is owned and operated by DWS. It has a capacity of 23.5 million m3 and mainly supplies water to approximately 2000 ha of predominantly citrus farming irrigation downstream of the dam and along the Mooi River at Muden. There is also an intention to supply water from this dam to Greytown for treatment and potable distribution. There is an abundance of farm dams in the Mooi catchment, especially in the upper reaches. The yield information of the existing water resources infrastructure was revised in 2019 based on a re-evaluation of the hydrology of both Mooi and Mgeni catchments and is presented in Table 7.15.
The yield results from UW (2019) were based on improved calibration of rainfall runoff modelling. Changes in yield values, when compared against previous studies, are as a result of additional rainfall and runoff data as well as revised land-use data. Good calibrations improved the confidence in the hydrology records and also resolved some imbalance issues noted in the previous models used to simulate the Mgeni system.

32
A key recommendation of the study was that available yield volumes, determined for the dams in the Mooi-Mgeni System, should be reduced by raw water conveyance losses when compared with the potable water requirements of the system. The Midmar System showed minimal raw water losses whilst the Nagle System showed losses of up to 8% and the Inanda System a 5% loss for raw water conveyance.
When these raw water conveyance losses are applied to the yields, the resultant yields come back to the ball park of what they were before, therefore the yield figures have not been changed on the supply systems.
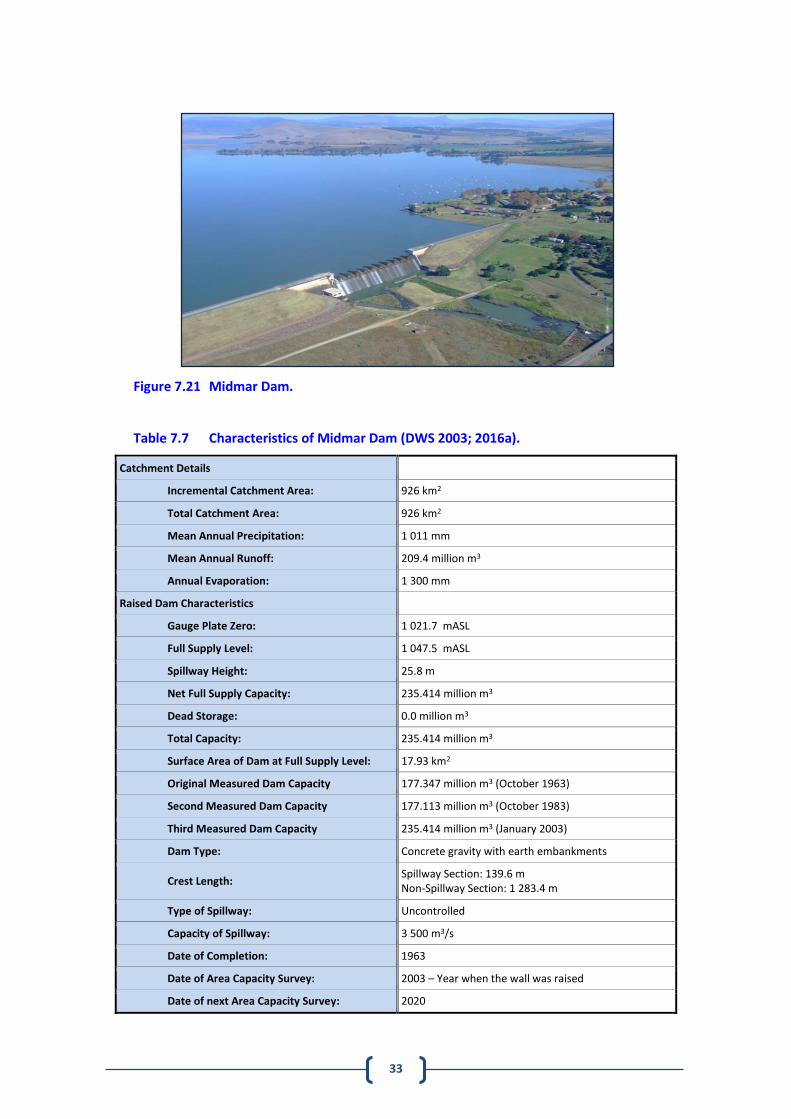
33
Figure 7.21 Midmar Dam.
Table 7.7 Characteristics of Midmar Dam (DWS 2003; 2016a).
Catchment Details
Incremental Catchment Area: 926 km2
Total Catchment Area: 926 km2
Mean Annual Precipitation: 1 011 mm
Mean Annual Runoff: 209.4 million m3
Annual Evaporation: 1 300 mm
Raised Dam Characteristics
Gauge Plate Zero: 1 021.7 mASL
Full Supply Level: 1 047.5 mASL
Spillway Height: 25.8 m
Net Full Supply Capacity: 235.414 million m3
Dead Storage: 0.0 million m3
Total Capacity: 235.414 million m3
Surface Area of Dam at Full Supply Level: 17.93 km2
Original Measured Dam Capacity 177.347 million m3 (October 1963)
Second Measured Dam Capacity 177.113 million m3 (October 1983)
Third Measured Dam Capacity 235.414 million m3 (January 2003)
Dam Type: Concrete gravity with earth embankments
Crest Length: Spillway Section: 139.6 m Non-Spillway Section: 1 283.4 m
Type of Spillway: Uncontrolled
Capacity of Spillway: 3 500 m3/s
Date of Completion: 1963
Date of Area Capacity Survey: 2003 – Year when the wall was raised
Date of next Area Capacity Survey: 2020
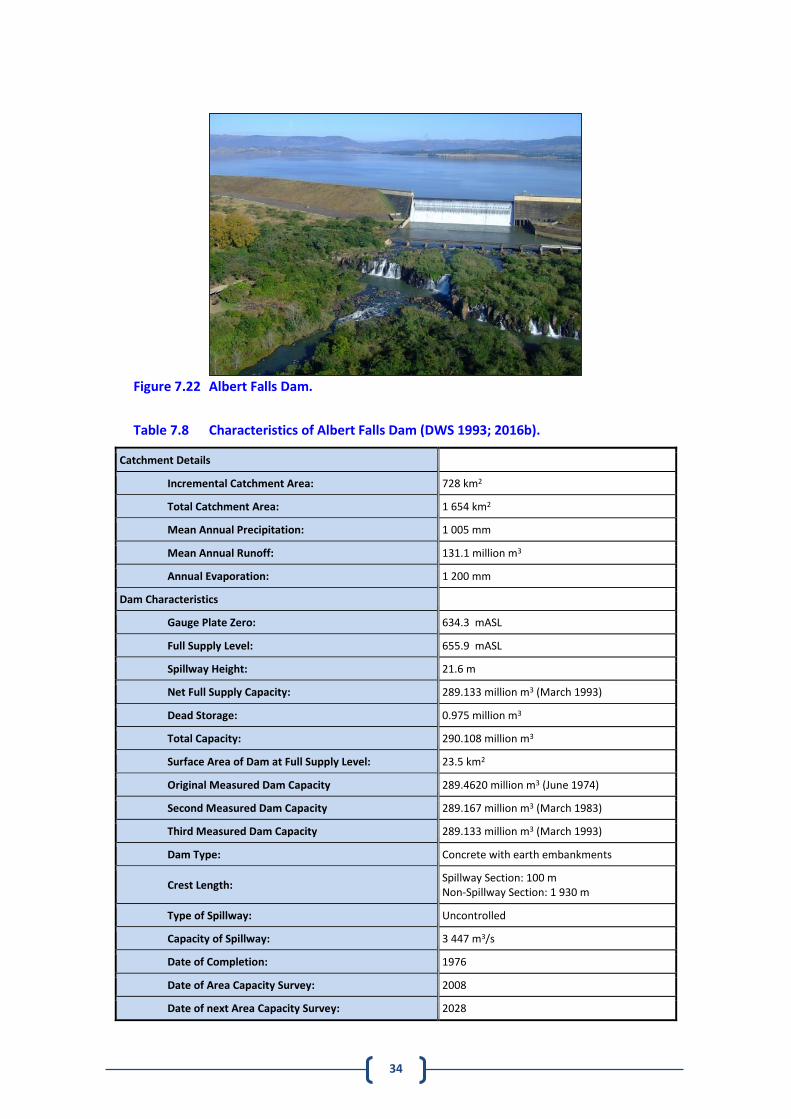
34
Figure 7.22 Albert Falls Dam.
Table 7.8 Characteristics of Albert Falls Dam (DWS 1993; 2016b).
Catchment Details
Incremental Catchment Area: 728 km2
Total Catchment Area: 1 654 km2
Mean Annual Precipitation: 1 005 mm
Mean Annual Runoff: 131.1 million m3
Annual Evaporation: 1 200 mm
Dam Characteristics
Gauge Plate Zero: 634.3 mASL
Full Supply Level: 655.9 mASL
Spillway Height: 21.6 m
Net Full Supply Capacity: 289.133 million m3 (March 1993)
Dead Storage: 0.975 million m3
Total Capacity: 290.108 million m3
Surface Area of Dam at Full Supply Level: 23.5 km2
Original Measured Dam Capacity 289.4620 million m3 (June 1974)
Second Measured Dam Capacity 289.167 million m3 (March 1983)
Third Measured Dam Capacity 289.133 million m3 (March 1993)
Dam Type: Concrete with earth embankments
Crest Length: Spillway Section: 100 m Non-Spillway Section: 1 930 m
Type of Spillway: Uncontrolled
Capacity of Spillway: 3 447 m3/s
Date of Completion: 1976
Date of Area Capacity Survey: 2008
Date of next Area Capacity Survey: 2028
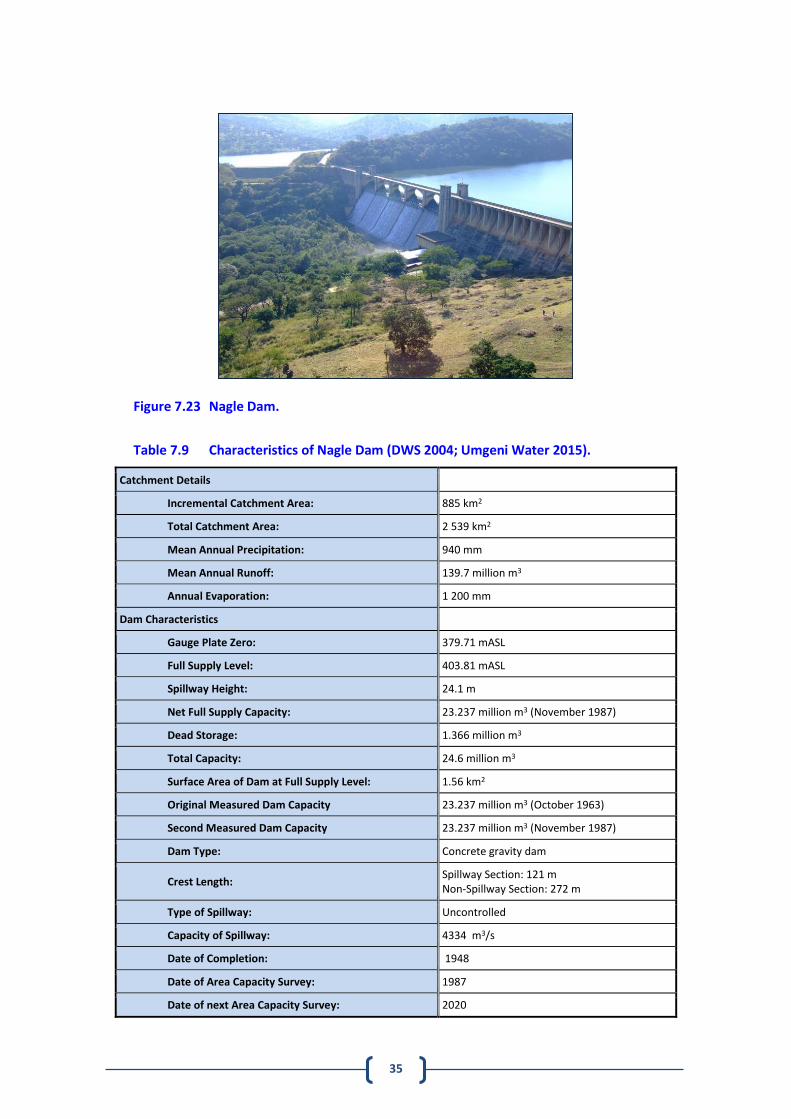
35
Figure 7.23 Nagle Dam.
Table 7.9 Characteristics of Nagle Dam (DWS 2004; Umgeni Water 2015).
Catchment Details
Incremental Catchment Area: 885 km2
Total Catchment Area: 2 539 km2
Mean Annual Precipitation: 940 mm
Mean Annual Runoff: 139.7 million m3
Annual Evaporation: 1 200 mm
Dam Characteristics
Gauge Plate Zero: 379.71 mASL
Full Supply Level: 403.81 mASL
Spillway Height: 24.1 m
Net Full Supply Capacity: 23.237 million m3 (November 1987)
Dead Storage: 1.366 million m3
Total Capacity: 24.6 million m3
Surface Area of Dam at Full Supply Level: 1.56 km2
Original Measured Dam Capacity 23.237 million m3 (October 1963)
Second Measured Dam Capacity 23.237 million m3 (November 1987)
Dam Type: Concrete gravity dam
Crest Length: Spillway Section: 121 m Non-Spillway Section: 272 m
Type of Spillway: Uncontrolled
Capacity of Spillway: 4334 m3/s
Date of Completion: 1948
Date of Area Capacity Survey: 1987
Date of next Area Capacity Survey: 2020
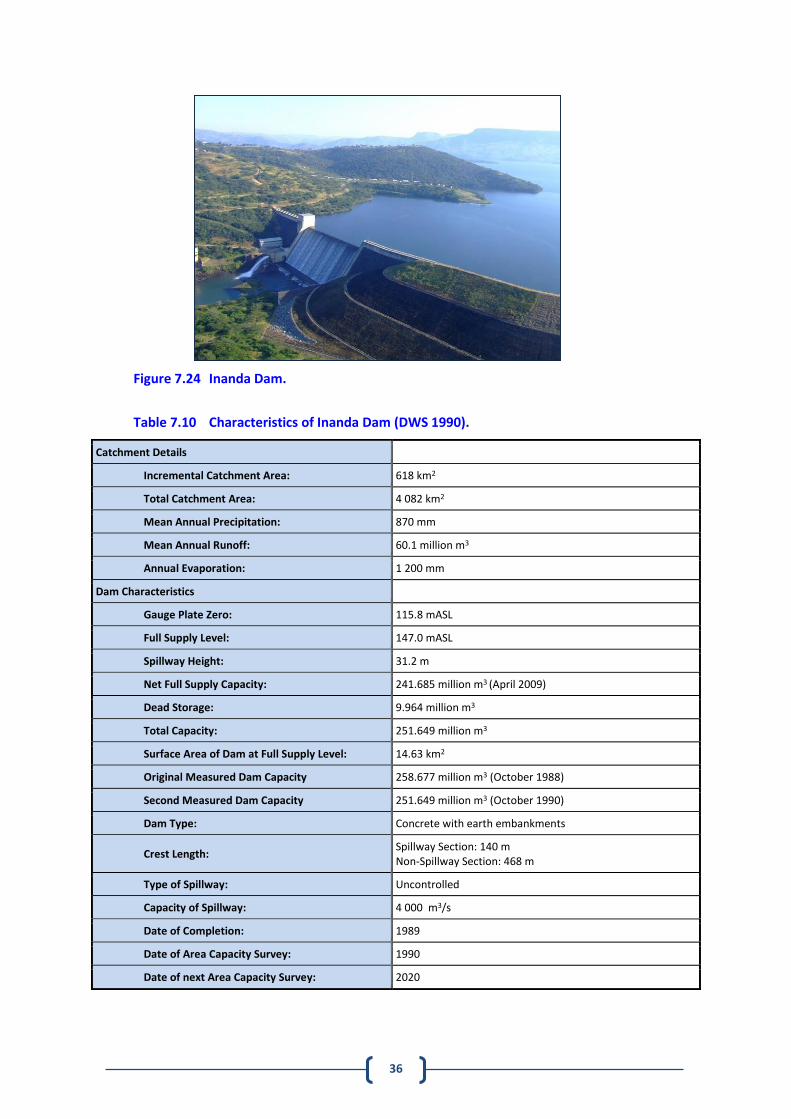
36
Figure 7.24 Inanda Dam.
Table 7.10 Characteristics of Inanda Dam (DWS 1990).
Catchment Details
Incremental Catchment Area: 618 km2
Total Catchment Area: 4 082 km2
Mean Annual Precipitation: 870 mm
Mean Annual Runoff: 60.1 million m3
Annual Evaporation: 1 200 mm
Dam Characteristics
Gauge Plate Zero: 115.8 mASL
Full Supply Level: 147.0 mASL
Spillway Height: 31.2 m
Net Full Supply Capacity: 241.685 million m3 (April 2009)
Dead Storage: 9.964 million m3
Total Capacity: 251.649 million m3
Surface Area of Dam at Full Supply Level: 14.63 km2
Original Measured Dam Capacity 258.677 million m3 (October 1988)
Second Measured Dam Capacity 251.649 million m3 (October 1990)
Dam Type: Concrete with earth embankments
Crest Length: Spillway Section: 140 m Non-Spillway Section: 468 m
Type of Spillway: Uncontrolled
Capacity of Spillway: 4 000 m3/s
Date of Completion: 1989
Date of Area Capacity Survey: 1990
Date of next Area Capacity Survey: 2020
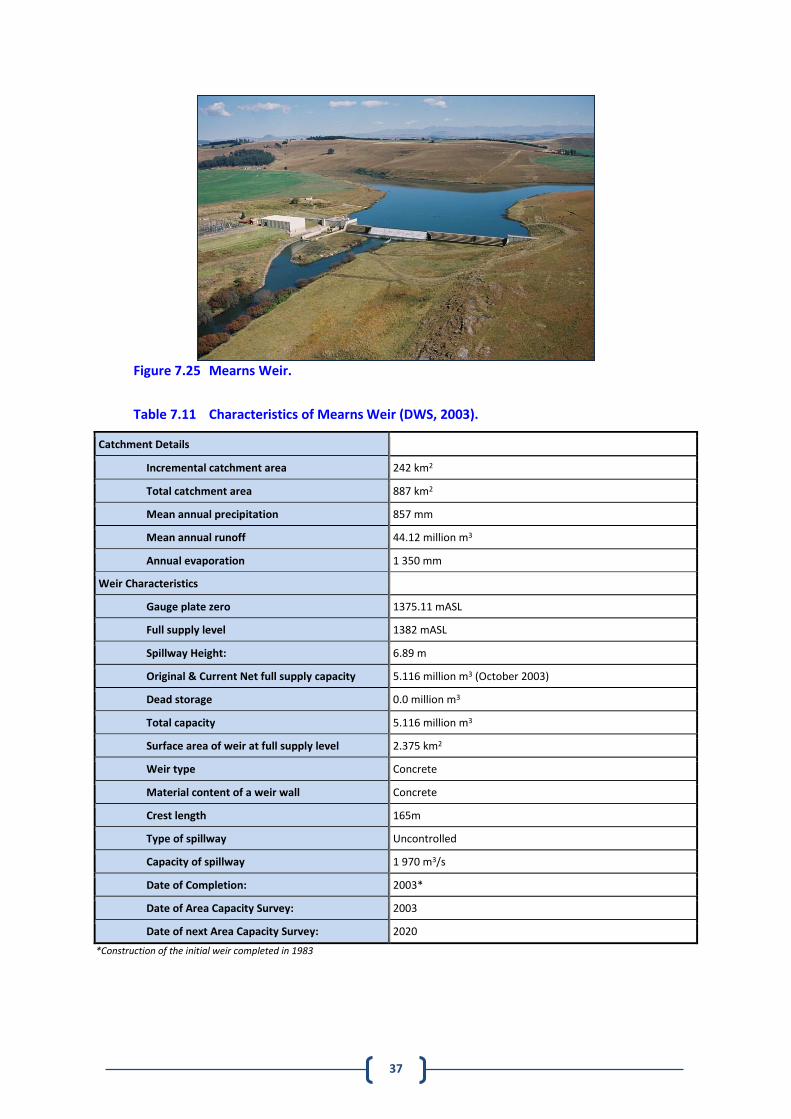
37
Figure 7.25 Mearns Weir.
Table 7.11 Characteristics of Mearns Weir (DWS, 2003).
Catchment Details
Incremental catchment area 242 km2
Total catchment area 887 km2
Mean annual precipitation 857 mm
Mean annual runoff 44.12 million m3
Annual evaporation 1 350 mm
Weir Characteristics
Gauge plate zero 1375.11 mASL
Full supply level 1382 mASL
Spillway Height: 6.89 m
Original & Current Net full supply capacity 5.116 million m3 (October 2003)
Dead storage 0.0 million m3
Total capacity 5.116 million m3
Surface area of weir at full supply level 2.375 km2
Weir type Concrete
Material content of a weir wall Concrete
Crest length 165m
Type of spillway Uncontrolled
Capacity of spillway 1 970 m3/s
Date of Completion: 2003*
Date of Area Capacity Survey: 2003
Date of next Area Capacity Survey: 2020
*Construction of the initial weir completed in 1983
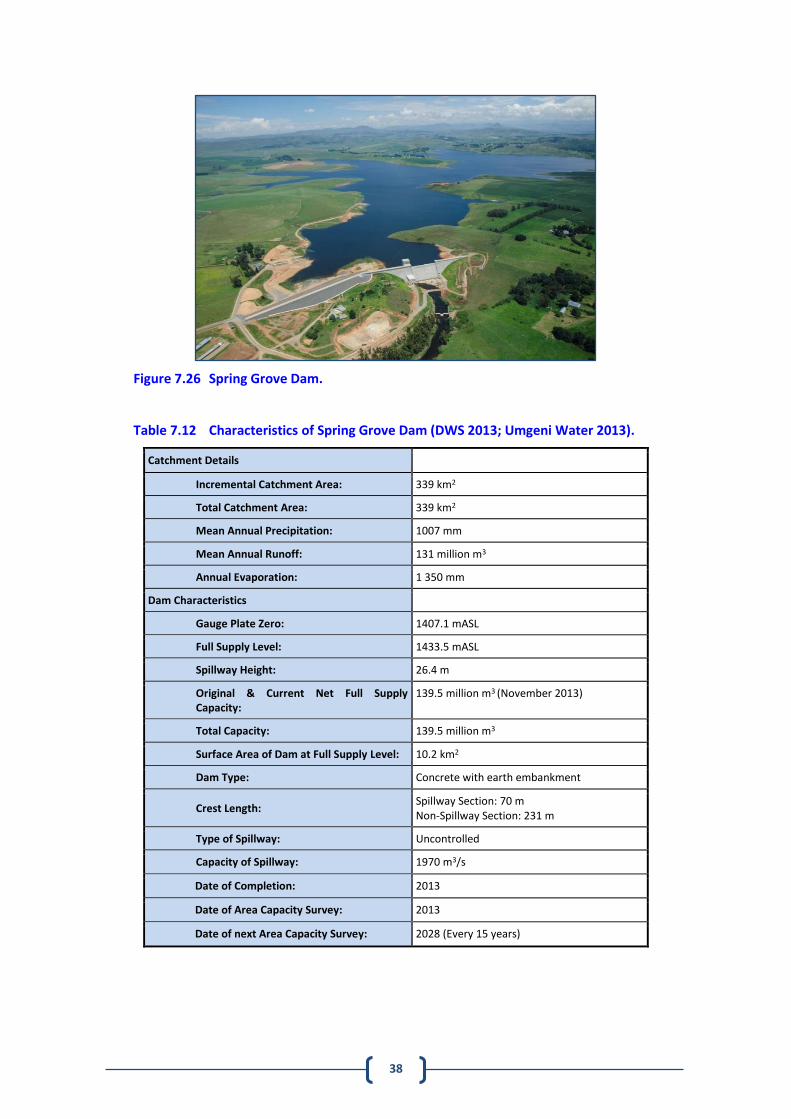
38
Figure 7.26 Spring Grove Dam.
Table 7.12 Characteristics of Spring Grove Dam (DWS 2013; Umgeni Water 2013).
Catchment Details
Incremental Catchment Area: 339 km2
Total Catchment Area: 339 km2
Mean Annual Precipitation: 1007 mm
Mean Annual Runoff: 131 million m3
Annual Evaporation: 1 350 mm
Dam Characteristics
Gauge Plate Zero: 1407.1 mASL
Full Supply Level: 1433.5 mASL
Spillway Height: 26.4 m
Original & Current Net Full Supply Capacity:
139.5 million m3 (November 2013)
Total Capacity: 139.5 million m3
Surface Area of Dam at Full Supply Level: 10.2 km2
Dam Type: Concrete with earth embankment
Crest Length: Spillway Section: 70 m Non-Spillway Section: 231 m
Type of Spillway: Uncontrolled
Capacity of Spillway: 1970 m3/s
Date of Completion: 2013
Date of Area Capacity Survey: 2013
Date of next Area Capacity Survey: 2028 (Every 15 years)
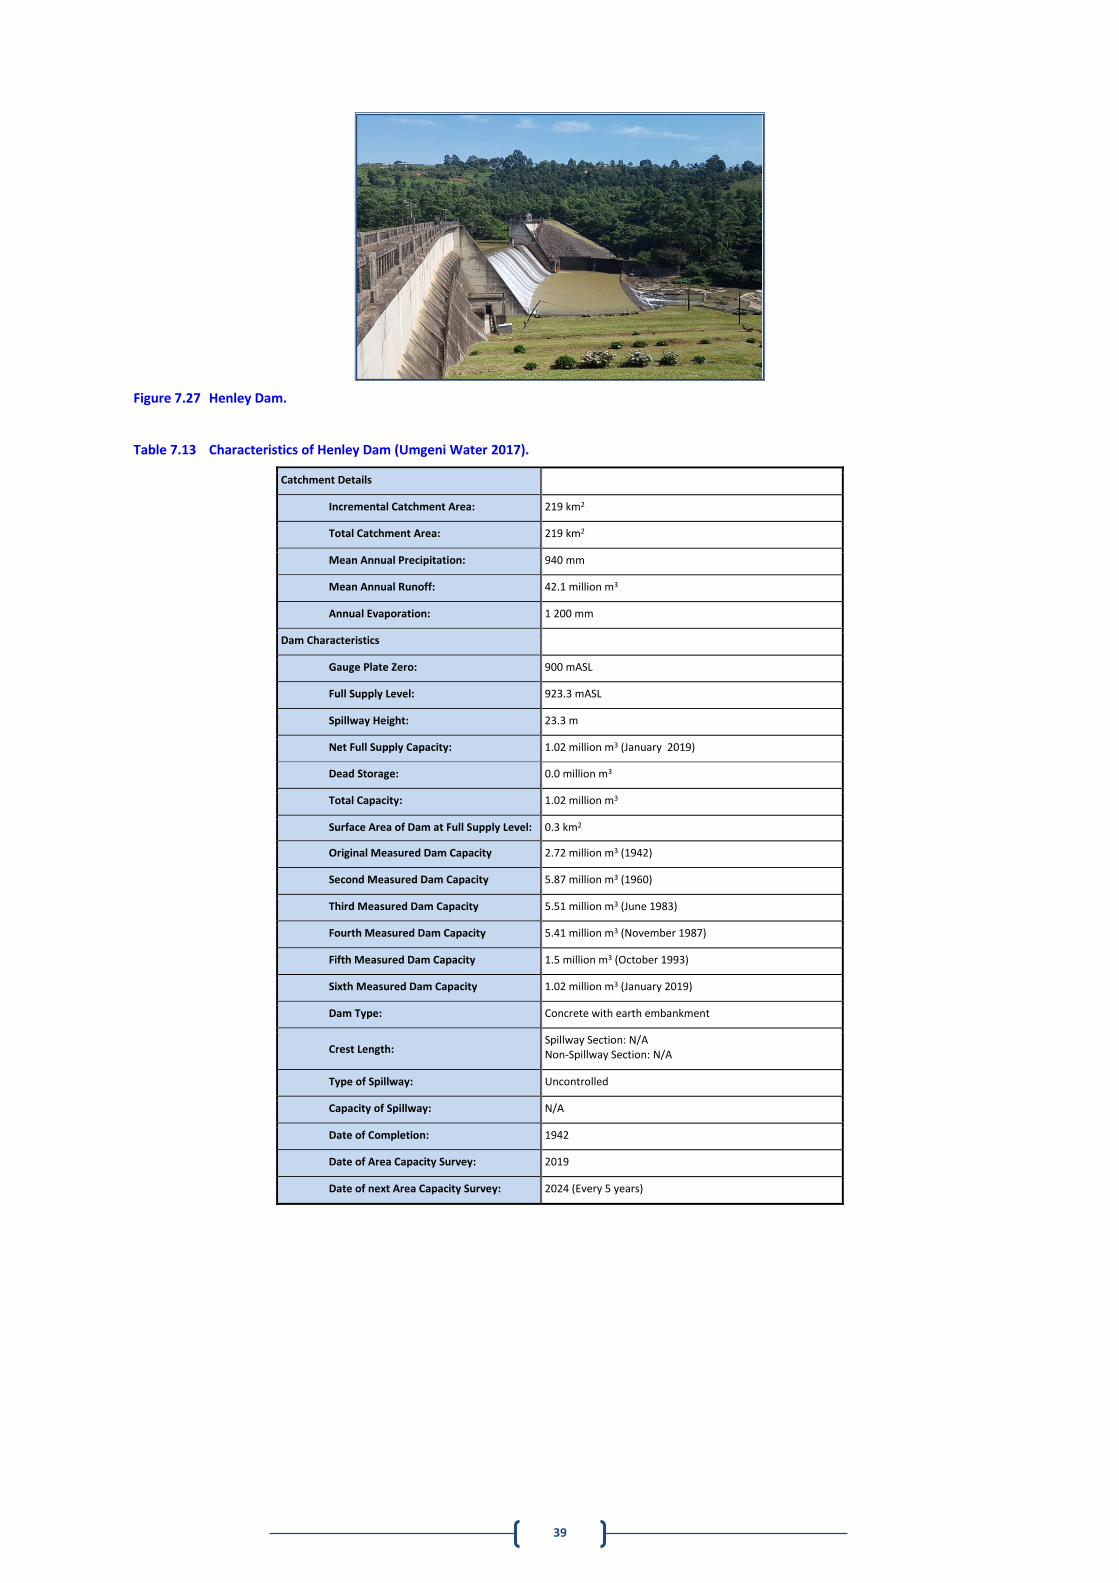
39
Figure 7.27 Henley Dam.
Table 7.13 Characteristics of Henley Dam (Umgeni Water 2017).
Catchment Details
Incremental Catchment Area: 219 km2
Total Catchment Area: 219 km2
Mean Annual Precipitation: 940 mm
Mean Annual Runoff: 42.1 million m3
Annual Evaporation: 1 200 mm
Dam Characteristics
Gauge Plate Zero: 900 mASL
Full Supply Level: 923.3 mASL
Spillway Height: 23.3 m
Net Full Supply Capacity: 1.02 million m3 (January 2019)
Dead Storage: 0.0 million m3
Total Capacity: 1.02 million m3
Surface Area of Dam at Full Supply Level: 0.3 km2
Original Measured Dam Capacity 2.72 million m3 (1942)
Second Measured Dam Capacity 5.87 million m3 (1960)
Third Measured Dam Capacity 5.51 million m3 (June 1983)
Fourth Measured Dam Capacity 5.41 million m3 (November 1987)
Fifth Measured Dam Capacity 1.5 million m3 (October 1993)
Sixth Measured Dam Capacity 1.02 million m3 (January 2019)
Dam Type: Concrete with earth embankment
Crest Length: Spillway Section: N/A Non-Spillway Section: N/A
Type of Spillway: Uncontrolled
Capacity of Spillway: N/A
Date of Completion: 1942
Date of Area Capacity Survey: 2019
Date of next Area Capacity Survey: 2024 (Every 5 years)
40
Table 7.14 Existing Dams in the Mooi/Mgeni Region.
Impoundment River Capacity
(million m3) Purpose
Spring Grove Dam Mooi 139.5 Domestic
Craigie Burn Dam Mnyamvubu 23.5 Irrigation
Mearns Weir Mooi 5.1 Domestic
Midmar Dam uMngeni 235.4 Domestic
Albert Falls Dam uMngeni 289.1 Domestic
Nagle Dam uMngeni 23.2 Domestic
Inanda Dam uMngeni 241.7 Domestic
Table 7.15 Yield Information for the existing water resource infrastructure in the Mooi/Mgeni Region including transfers from the MMTS.
Phase Position in
system Historic Firm
Yield Stochastic Yield
(1 in 50 years risk of failure)
Stochastic Yield (1 in 100 years’ risk of failure)
- - million
m3/annum million
m3/annum Mℓ/day
million m3/annum
Mℓ/day
MMTS
Midmar Dam 167 195.0 534.0 183.0 501.4
Nagle Dam 277 348.0 953.4 333 912.3
Inanda Dam 416 446.0 1221.9 434 1189.0
Note: Yields indicated above are obtained from the UW Report MGENI-MOOI SYSTEM HYDROLOGY UPDATE STUDY, 2019. Note that these yield figures represent volumes of water that can be abstracted from the dams and they do not consider the losses of water that occurs within the raw water bulk infrastructure.
Groundwater is mainly utilised in the Mgeni catchment by private landowners as the majority of towns are supplied by reticulated surface water. Groundwater is utilised to supplement irrigation and for stock watering. The exception is the Nottingham Road and Rosetta areas which are supplied by production boreholes. Very high yielding boreholes (140 kℓ/hr) have been drilled in the area. The contact zones between the shale’s, sandstone and the intrusive dolerite dykes are the water bearing features in the areas. There are no faults or other structural features to target. In the Howick area groundwater is abstracted and bottled for commercial purposes. Although not accurately known it has been reported that the formal settlement of Mfolweni currently obtains their domestic water supply (in the order of 2 000 kℓ/day) from boreholes.
7.2.5 Operating Rules
(a) Mooi/Mgeni Water Resource Region
The Mgeni and Mooi River Systems are relatively complex in terms of their operation. In addition to the four dams, the Mgeni River System is augmented from the Mooi River System using the MMTS. The dams on the uMngeni River supply water directly to demand centres via various routes, allowing for flexibility in terms of the operation of the system (refer to description in the previous section and to the system schematic (Figure 7.28).
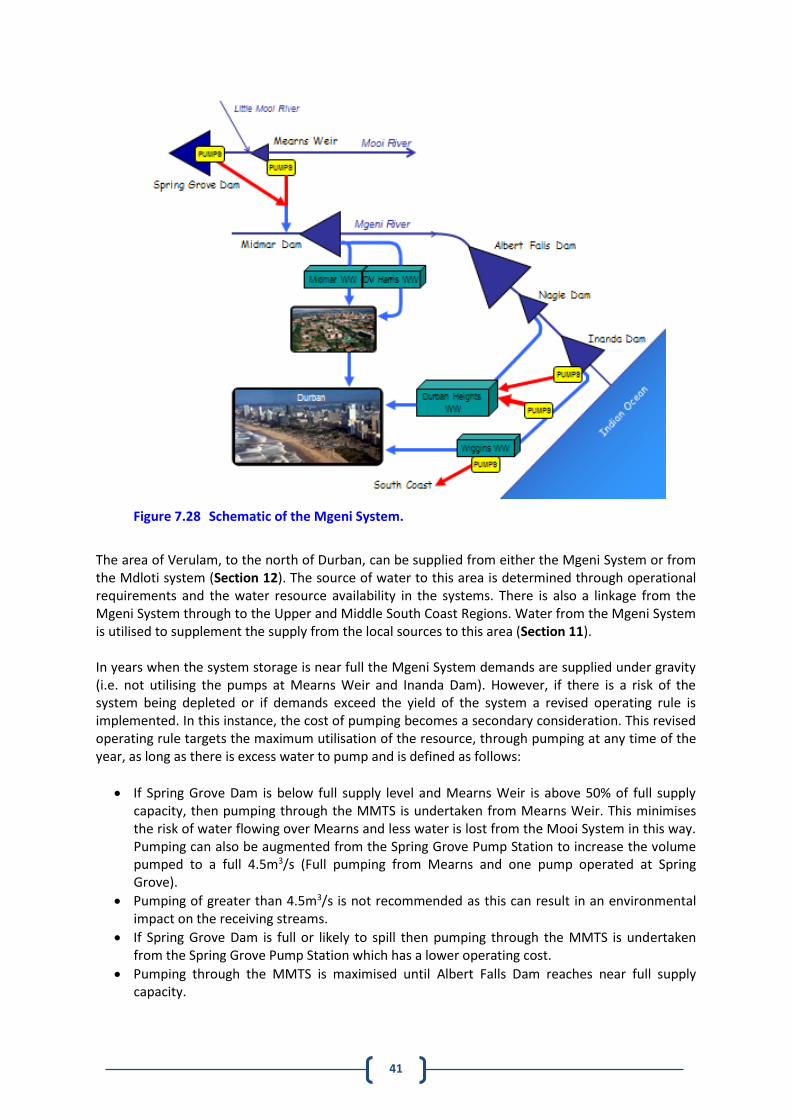
41
Figure 7.28 Schematic of the Mgeni System.
The area of Verulam, to the north of Durban, can be supplied from either the Mgeni System or from the Mdloti system (Section 12). The source of water to this area is determined through operational requirements and the water resource availability in the systems. There is also a linkage from the Mgeni System through to the Upper and Middle South Coast Regions. Water from the Mgeni System is utilised to supplement the supply from the local sources to this area (Section 11). In years when the system storage is near full the Mgeni System demands are supplied under gravity (i.e. not utilising the pumps at Mearns Weir and Inanda Dam). However, if there is a risk of the system being depleted or if demands exceed the yield of the system a revised operating rule is implemented. In this instance, the cost of pumping becomes a secondary consideration. This revised operating rule targets the maximum utilisation of the resource, through pumping at any time of the year, as long as there is excess water to pump and is defined as follows:
If Spring Grove Dam is below full supply level and Mearns Weir is above 50% of full supply capacity, then pumping through the MMTS is undertaken from Mearns Weir. This minimises the risk of water flowing over Mearns and less water is lost from the Mooi System in this way. Pumping can also be augmented from the Spring Grove Pump Station to increase the volume pumped to a full 4.5m3/s (Full pumping from Mearns and one pump operated at Spring Grove).
Pumping of greater than 4.5m3/s is not recommended as this can result in an environmental impact on the receiving streams.
If Spring Grove Dam is full or likely to spill then pumping through the MMTS is undertaken from the Spring Grove Pump Station which has a lower operating cost.
Pumping through the MMTS is maximised until Albert Falls Dam reaches near full supply capacity.
42
Water is released from Albert Falls Dam to Nagle Dam from where water flows under gravity to the Durban Heights WTP.
If Nagle Dam is spilling, then water is supplied to Durban Heights under gravity only and no pumping from Inanda Dam is undertaken;
When Nagle or Albert Falls Dams are below full supply capacity and are unlikely to reach full supply capacity in the season then the supply of water to the Durban Heights WTP is maximised through pumping from Inanda Dam and augmented with supply, under gravity, from Nagle Dam. In this instance, all the Inanda Dam pumps, including the Shaft pumps, are operated to maximise the supply from Inanda Dam and prevent spills as far as possible; and
Allow for possible down-time on all pumping routes in the system to account for scheduled maintenance and unplanned operational interruptions (e.g. as a result of power failures).
The option to use rainfall forecasts to try to predict dam levels and therefore optimise pumping requirements is available. Research is currently being undertaken to determine a methodology to forecast periods of high and low rainfall. The objective of this is to refine the pumping operating rule and determine periods when pumping could be decreased so as to minimise unnecessary energy usage.
(b) Mkhomazi Water Resource Region
The current water resources of the Mgeni System are insufficient to meet the long-term water demands of the system (DWS, 2015). The DWS Reconciliation Strategy Study (DWS, 2017) indicates that a development on the uMkhomazi River, the third-largest river in KwaZulu-Natal in terms of mean annual runoff (MAR), to transfer water to the existing Mgeni System, is the most feasible option for supporting the Mgeni System. The proposed uMkhomazi Water Project comprises the following components (DWS, 2015):
A 251 million m3 dam at Smithfield on the uMkhomazi River;
A 32 km tunnel between the Smithfield Dam and Baynesfield in the uMlaza Catchment;
A new 15.7 million m3 Langa Balancing Dam near the outlet of the tunnel;
Raw water pipelines to transfer water from the Langa Balancing Dam to a 600 Mℓ/day WTP; and
A gravity potable water pipeline to link this system to Umgeni Water’s 57’ Pipeline. This scheme would have a 1:100 yield of 600 Mℓ/day and this should accommodate the increase in demand in the Mgeni system for 30 to 40 years. Once the yield of the Smithfield Dam is fully utilised then an additional dam could be constructed on the uMkhomazi River at Impendle and, with an additional tunnel at Smithfield Dam, the yield of the system would then increase by an additional 600 Mℓ/day allowing for the long term growth of the system. The uMkhomazi Water Project is described in Section 7.5.2 (a).
43
7.3 Supply Systems
7.3.1 Description of the Mgeni System
(a) Overview of Upper Mgeni System
The Upper Mgeni System currently serves urban, peri-urban and rural settlements within the uMgungundlovu, Msunduzi and eThekwini (Outer West) municipal areas (Figure 7.4). The system extends from Howick / Mpophomeni / Vulindlela in the west, to Wartburg / New Hanover / Dalton / Ozwatini in the east, to Cato Ridge / Mpumulanga in the South and to Eston / Umbumbulu in the South West. With the recent commissioning of eThekwini Metro Municipality’s Western Aqueduct, the system has now been further extended to the Ntuzuma / Inanda / KwaMashu Supply Systems. The system derives its water resource from the Upper Mgeni River, fed from Midmar Dam, with augmentation from the Mooi-Mgeni Transfer Scheme (MMTS) (Section 7.2.3 (a)). Water is treated at two Water Treatment Plants (WTP’s), namely the Midmar WTP located in Howick and the D.V. Harris WTP located in Pietermaritzburg. For the purpose of describing the Upper Mgeni System, it has been divided into Sub-Systems which have been further divided into links. This is illustrated in Table 7.16.
Table 7.16 Sub-divisions of the Upper Mgeni System.
Sub-System Water Treatment Plant
Link
Howick-North Midmar Mill Falls Pump Station to Howick-North Reservoir
Howick-West Midmar Mill Falls Pump Station to Howick-West Reservoir Howick-West Reservoir to Groenekloof Reservoir Groenekloof Reservoir Supply Area
Midmar WTP to Umlaas Road Reservoir
Midmar ‘251 Pipeline: Midmar WTP to D.V. Harris Off-Take ’53 Pipeline: D.V. Harris WTP to Umlaas Road Reservoir ’61 Pipeline: D.V. Harris WTP to World’s View Reservoir ’61 Pipeline: World’s View Reservoir to ED2 ’61 Pipeline: ED2 to Umlaas Road Reservoir Ashburton Supply Richmond Pipeline Thornville/Hopewell Supply
Umlaas Road Reservoir Midmar & D.V. Harris
’57 Pipeline Eston / Umbumbulu Pipeline Lion Park / Manyavu Pipeline
uMshwathi BWSS D.V. Harris Msunduzi Supply ’69 Pipeline (Claridge Reservoir to Wartburg Reservoir) Wartburg Reservoir to Bruyns Hill Reservoir Wartburg Reservoir to Dalton Reservoir Dalton Reservoir to Ozwathini Reservoir
(b) Midmar Water Treatment Plant
The Midmar WTP (Figure 7.29, Table 7.17), which was commissioned in 1996, draws raw water from Midmar Dam. Water from the dam is supplied under pumping via the ‘251 Pipeline (Table 7.18). The ‘251 raw water pipeline consists of two sections (one that has recently been constructed and commissioned) – two gravity pipelines feed water from the dam to a raw water pump station, and two rising mains from the pump station to the WTP. The new raw water pipeline was implemented
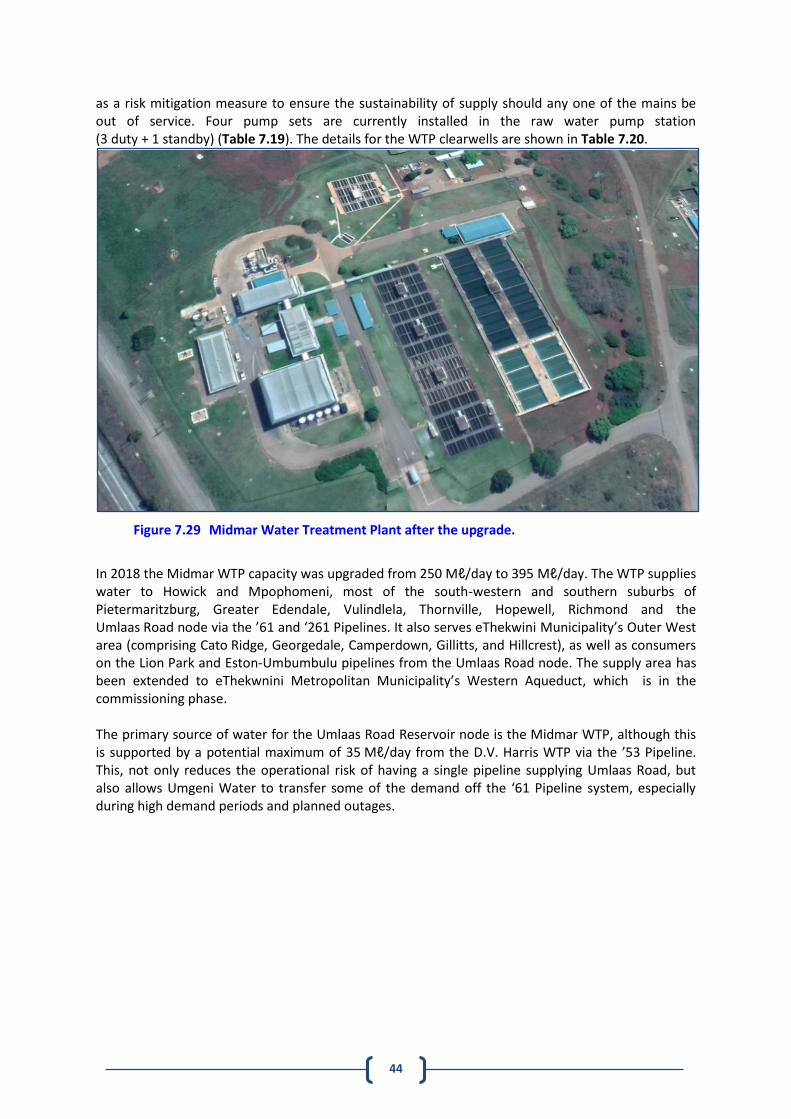
44
as a risk mitigation measure to ensure the sustainability of supply should any one of the mains be out of service. Four pump sets are currently installed in the raw water pump station (3 duty + 1 standby) (Table 7.19). The details for the WTP clearwells are shown in Table 7.20.
Figure 7.29 Midmar Water Treatment Plant after the upgrade.
In 2018 the Midmar WTP capacity was upgraded from 250 Mℓ/day to 395 Mℓ/day. The WTP supplies water to Howick and Mpophomeni, most of the south-western and southern suburbs of Pietermaritzburg, Greater Edendale, Vulindlela, Thornville, Hopewell, Richmond and the Umlaas Road node via the ’61 and ‘261 Pipelines. It also serves eThekwini Municipality’s Outer West area (comprising Cato Ridge, Georgedale, Camperdown, Gillitts, and Hillcrest), as well as consumers on the Lion Park and Eston-Umbumbulu pipelines from the Umlaas Road node. The supply area has been extended to eThekwnini Metropolitan Municipality’s Western Aqueduct, which is in the commissioning phase. The primary source of water for the Umlaas Road Reservoir node is the Midmar WTP, although this is supported by a potential maximum of 35 Mℓ/day from the D.V. Harris WTP via the ’53 Pipeline. This, not only reduces the operational risk of having a single pipeline supplying Umlaas Road, but also allows Umgeni Water to transfer some of the demand off the ‘61 Pipeline system, especially during high demand periods and planned outages.
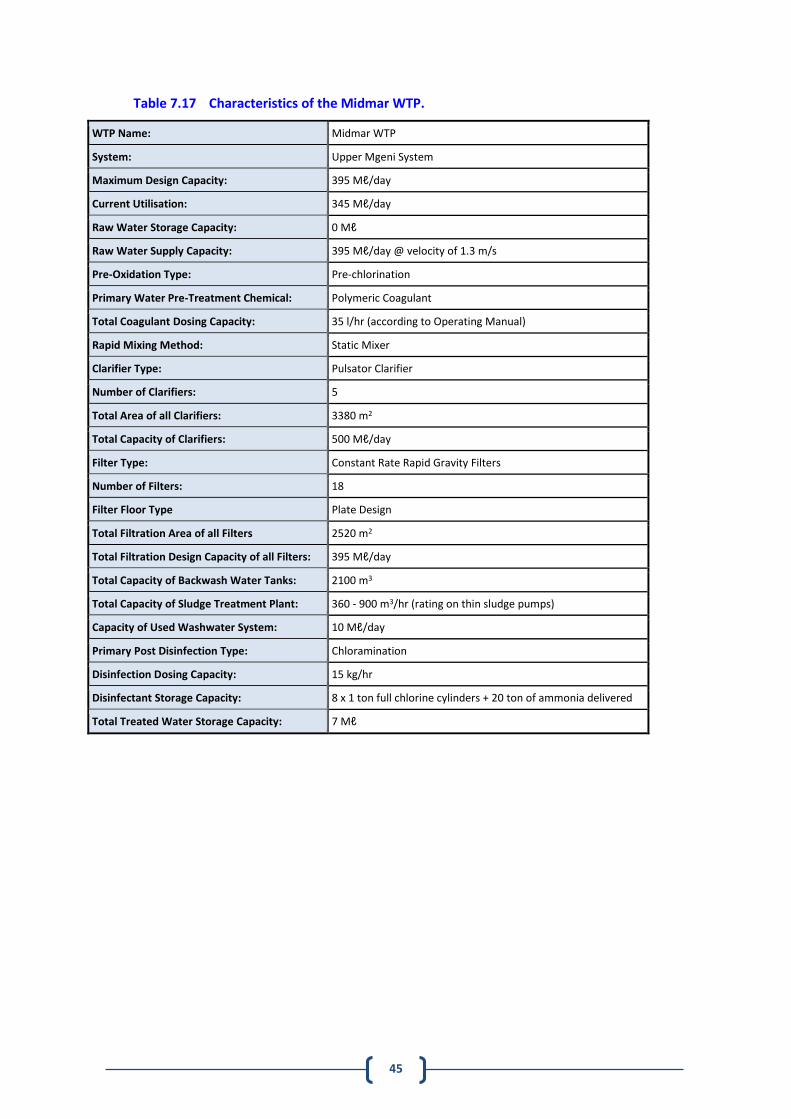
45
Table 7.17 Characteristics of the Midmar WTP.
WTP Name: Midmar WTP
System: Upper Mgeni System
Maximum Design Capacity: 395 Mℓ/day
Current Utilisation: 345 Mℓ/day
Raw Water Storage Capacity: 0 Mℓ
Raw Water Supply Capacity: 395 Mℓ/day @ velocity of 1.3 m/s
Pre-Oxidation Type: Pre-chlorination
Primary Water Pre-Treatment Chemical: Polymeric Coagulant
Total Coagulant Dosing Capacity: 35 l/hr (according to Operating Manual)
Rapid Mixing Method: Static Mixer
Clarifier Type: Pulsator Clarifier
Number of Clarifiers: 5
Total Area of all Clarifiers: 3380 m2
Total Capacity of Clarifiers: 500 Mℓ/day
Filter Type: Constant Rate Rapid Gravity Filters
Number of Filters: 18
Filter Floor Type Plate Design
Total Filtration Area of all Filters 2520 m2
Total Filtration Design Capacity of all Filters: 395 Mℓ/day
Total Capacity of Backwash Water Tanks: 2100 m3
Total Capacity of Sludge Treatment Plant: 360 - 900 m3/hr (rating on thin sludge pumps)
Capacity of Used Washwater System: 10 Mℓ/day
Primary Post Disinfection Type: Chloramination
Disinfection Dosing Capacity: 15 kg/hr
Disinfectant Storage Capacity: 8 x 1 ton full chlorine cylinders + 20 ton of ammonia delivered
Total Treated Water Storage Capacity: 7 Mℓ
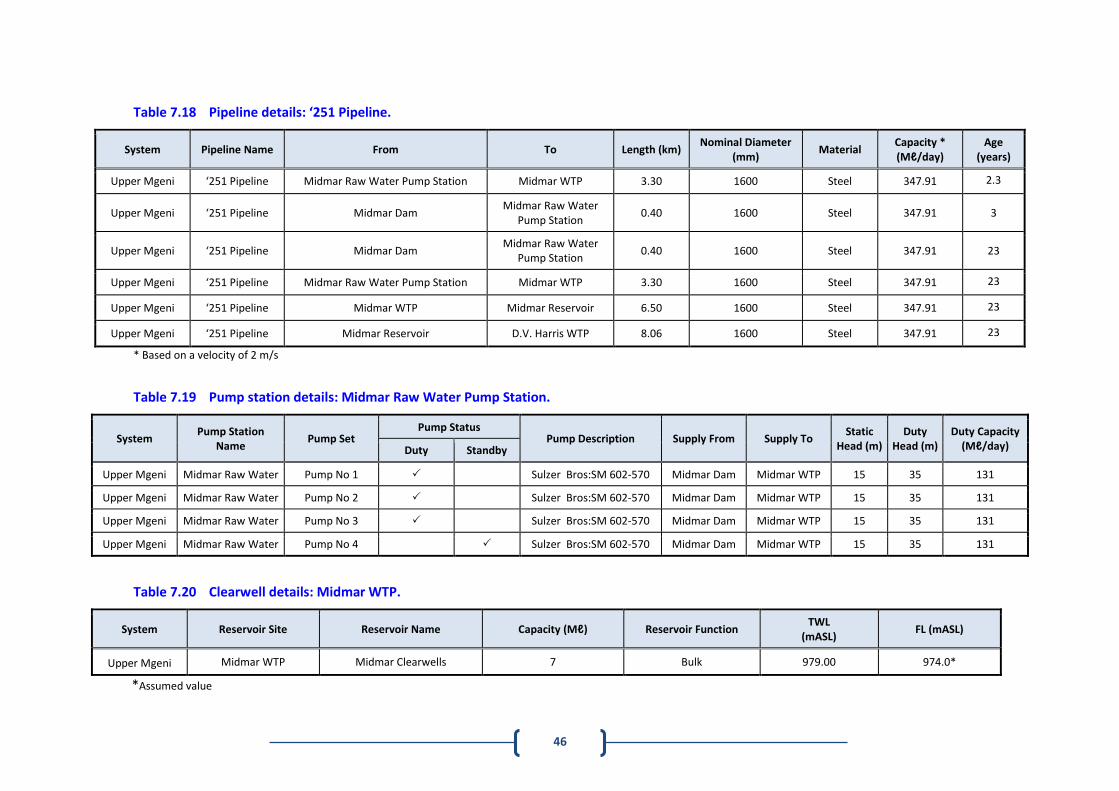
46
Table 7.18 Pipeline details: ‘251 Pipeline.
System Pipeline Name From To Length (km) Nominal Diameter
(mm) Material
Capacity * (Mℓ/day)
Age (years)
Upper Mgeni ‘251 Pipeline Midmar Raw Water Pump Station Midmar WTP 3.30 1600 Steel 347.91 2.3
Upper Mgeni ‘251 Pipeline Midmar Dam Midmar Raw Water
Pump Station 0.40 1600 Steel 347.91 3
Upper Mgeni ‘251 Pipeline Midmar Dam Midmar Raw Water
Pump Station 0.40 1600 Steel 347.91 23
Upper Mgeni ‘251 Pipeline Midmar Raw Water Pump Station Midmar WTP 3.30 1600 Steel 347.91 23
Upper Mgeni ‘251 Pipeline Midmar WTP Midmar Reservoir 6.50 1600 Steel 347.91 23
Upper Mgeni ‘251 Pipeline Midmar Reservoir D.V. Harris WTP 8.06 1600 Steel 347.91 23
* Based on a velocity of 2 m/s
Table 7.19 Pump station details: Midmar Raw Water Pump Station.
System Pump Station
Name Pump Set
Pump Status Pump Description Supply From Supply To
Static Head (m)
Duty Head (m)
Duty Capacity (Mℓ/day) Duty Standby
Upper Mgeni Midmar Raw Water Pump No 1 Sulzer Bros:SM 602-570 Midmar Dam Midmar WTP 15 35 131
Upper Mgeni Midmar Raw Water Pump No 2 Sulzer Bros:SM 602-570 Midmar Dam Midmar WTP 15 35 131
Upper Mgeni Midmar Raw Water Pump No 3 Sulzer Bros:SM 602-570 Midmar Dam Midmar WTP 15 35 131
Upper Mgeni Midmar Raw Water Pump No 4 Sulzer Bros:SM 602-570 Midmar Dam Midmar WTP 15 35 131
Table 7.20 Clearwell details: Midmar WTP.
System Reservoir Site Reservoir Name Capacity (Mℓ) Reservoir Function TWL
(mASL) FL (mASL)
Upper Mgeni Midmar WTP Midmar Clearwells 7 Bulk 979.00 974.0*
*Assumed value
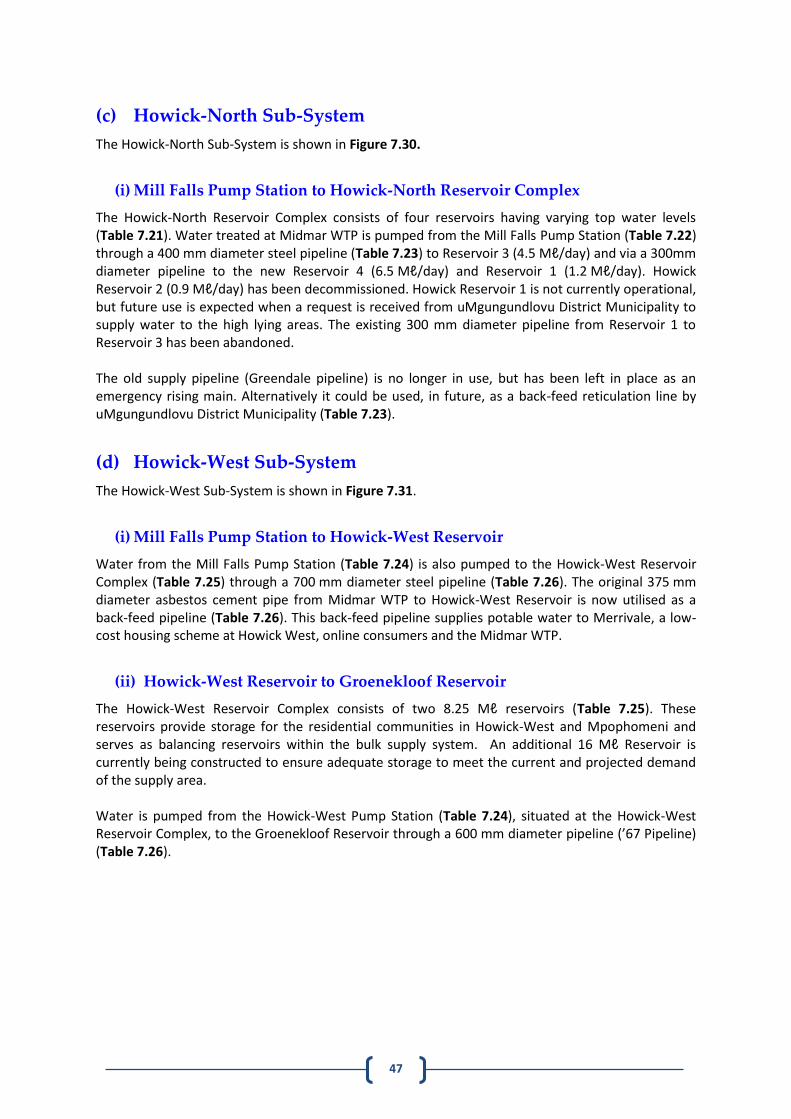
47
(c) Howick-North Sub-System
The Howick-North Sub-System is shown in Figure 7.30.
(i) Mill Falls Pump Station to Howick-North Reservoir Complex
The Howick-North Reservoir Complex consists of four reservoirs having varying top water levels (Table 7.21). Water treated at Midmar WTP is pumped from the Mill Falls Pump Station (Table 7.22) through a 400 mm diameter steel pipeline (Table 7.23) to Reservoir 3 (4.5 Mℓ/day) and via a 300mm diameter pipeline to the new Reservoir 4 (6.5 Mℓ/day) and Reservoir 1 (1.2 Mℓ/day). Howick Reservoir 2 (0.9 Mℓ/day) has been decommissioned. Howick Reservoir 1 is not currently operational, but future use is expected when a request is received from uMgungundlovu District Municipality to supply water to the high lying areas. The existing 300 mm diameter pipeline from Reservoir 1 to Reservoir 3 has been abandoned. The old supply pipeline (Greendale pipeline) is no longer in use, but has been left in place as an emergency rising main. Alternatively it could be used, in future, as a back-feed reticulation line by uMgungundlovu District Municipality (Table 7.23).
(d) Howick-West Sub-System
The Howick-West Sub-System is shown in Figure 7.31.
(i) Mill Falls Pump Station to Howick-West Reservoir
Water from the Mill Falls Pump Station (Table 7.24) is also pumped to the Howick-West Reservoir Complex (Table 7.25) through a 700 mm diameter steel pipeline (Table 7.26). The original 375 mm diameter asbestos cement pipe from Midmar WTP to Howick-West Reservoir is now utilised as a back-feed pipeline (Table 7.26). This back-feed pipeline supplies potable water to Merrivale, a low-cost housing scheme at Howick West, online consumers and the Midmar WTP.
(ii) Howick-West Reservoir to Groenekloof Reservoir
The Howick-West Reservoir Complex consists of two 8.25 Mℓ reservoirs (Table 7.25). These reservoirs provide storage for the residential communities in Howick-West and Mpophomeni and serves as balancing reservoirs within the bulk supply system. An additional 16 Mℓ Reservoir is currently being constructed to ensure adequate storage to meet the current and projected demand of the supply area. Water is pumped from the Howick-West Pump Station (Table 7.24), situated at the Howick-West Reservoir Complex, to the Groenekloof Reservoir through a 600 mm diameter pipeline (’67 Pipeline) (Table 7.26).
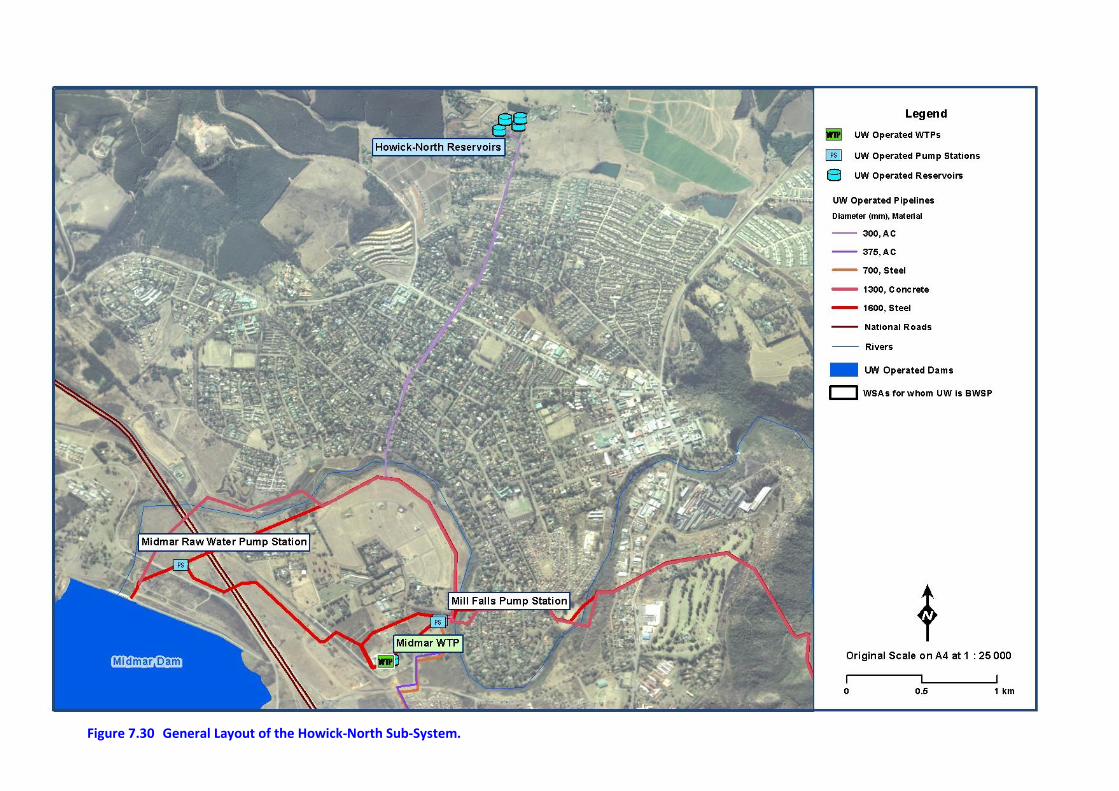
48
Figure 7.30 General Layout of the Howick-North Sub-System.
49
Table 7.21 Reservoir details: Howick-North Reservoir Complex.
System Reservoir Site Reservoir Name Capacity
(Mℓ) Reservoir Function
TWL (mASL)
FL (mASL)
Upper Mgeni Howick-North
Howick-North Reservoir 1 Not currently in service)
1.2 Terminal 1113.98 1111.30
Upper Mgeni Howick-North
Howick-North Reservoir 2 (Decommissioned)
0.9 Terminal 1104.81 1102.06
Upper Mgeni Howick-North Howick-North Reservoir 3 4.5 Terminal 1105.66 1098.04
Upper Mgeni Howick-North Howick-North Reservoir 4 6.5 Terminal 1105.66 1098.04
Table 7.22 Pump details: Howick-North Sub-System.
System Pump Station Name Pump Set Pump Status Pump
Description Supply From Supply To
Static Head (m)
Duty Head (m)
Duty Capacity (Mℓ/day) Duty Standby
Upper Mgeni Mill Falls Howick Pump No 1 KSB:WKLn 125-3 Midmar WTP Howick Reservoir 75 99.0 4.5
Upper Mgeni Mill Falls Howick Pump No 2 KSB:WKLn 125-3 Midmar WTP Howick Reservoir 75 99.0 4.5
Upper Mgeni Mill Falls Howick Pump No 3 KSB:ETA 150-50 Midmar WTP Howick Reservoir 75 77.4 6.9
Table 7.23 Pipeline details: Howick-North Sub-System.
System Pipeline Name From To Length
(km) Nominal Diameter
(mm) Material
Capacity * (Mℓ/day)
Age (years)
Upper Mgeni Howick Pipeline Mill Falls Pump Station Howick Reservoir 2.5 400 Steel 16.30 23
Upper Mgeni Howick Pipeline Mill Falls Pump Station Howick Reservoir 2.5 300 AC 9.20 48
* Based on a velocity of 1.5 m/s
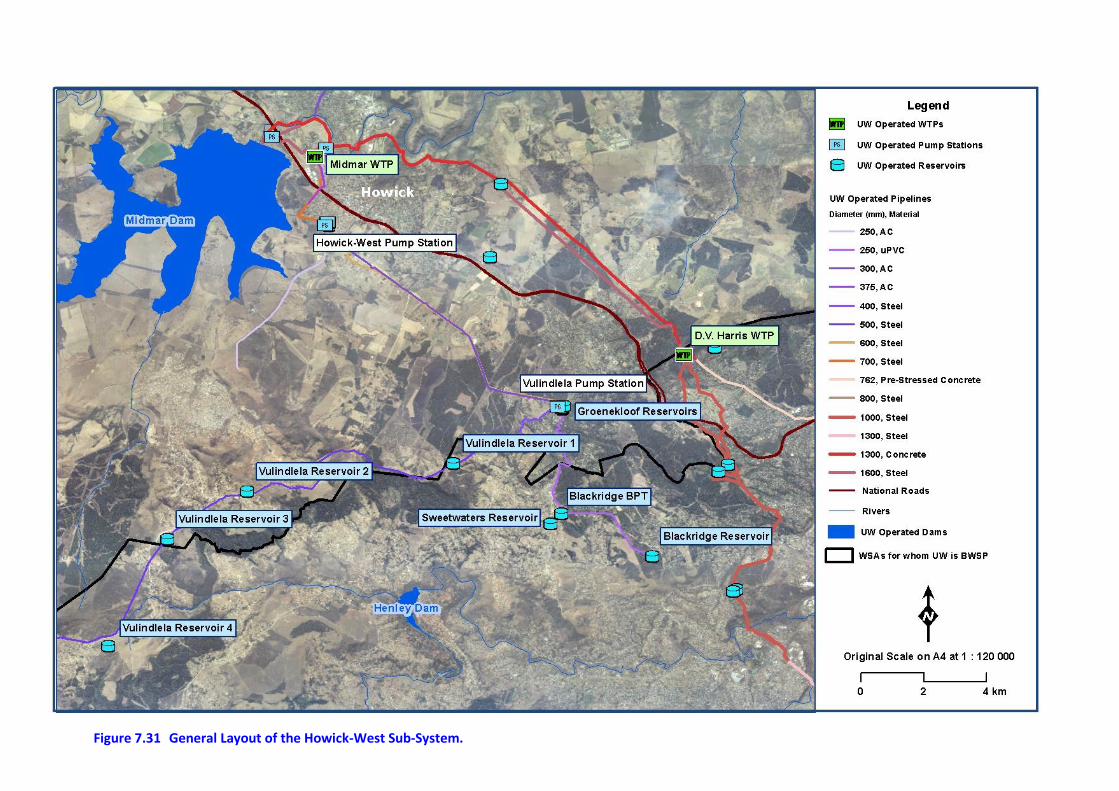
50
Figure 7.31 General Layout of the Howick-West Sub-System.
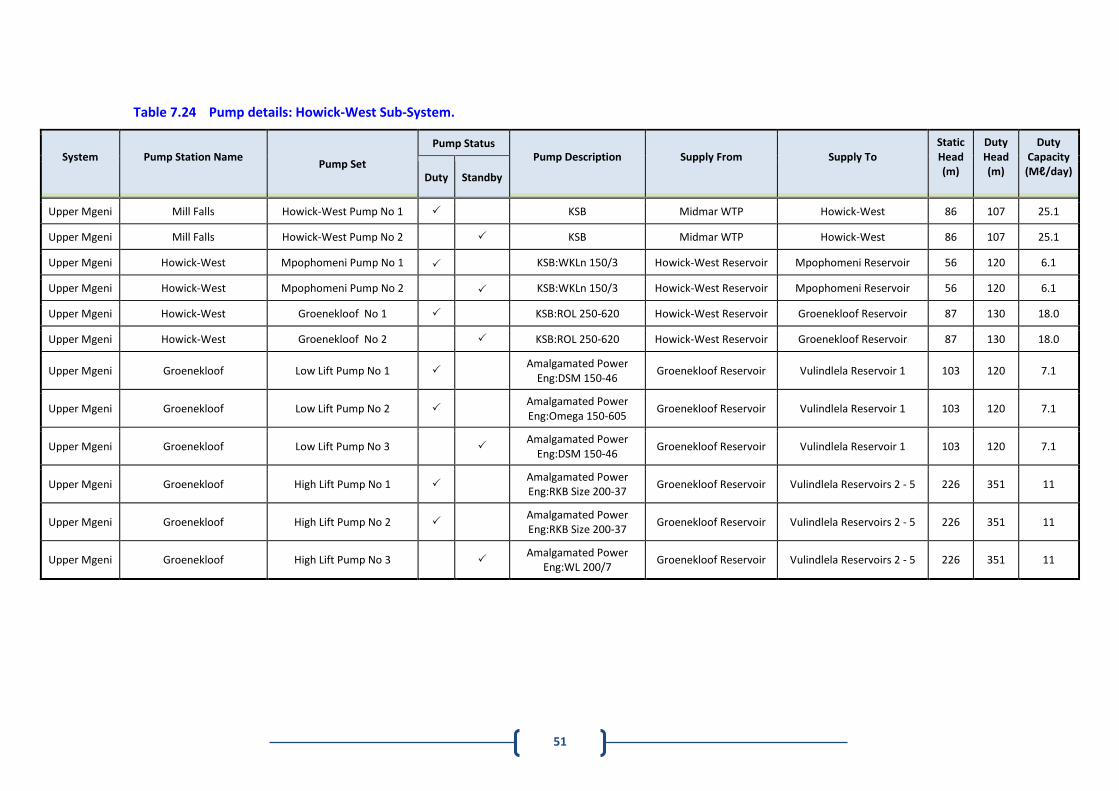
51
Table 7.24 Pump details: Howick-West Sub-System.
System
Pump Station Name
Pump Set
Pump Status Pump Description
Supply From
Supply To
Static Head (m)
Duty Head (m)
Duty Capacity (Mℓ/day)
Duty Standby
Upper Mgeni Mill Falls Howick-West Pump No 1 KSB Midmar WTP Howick-West 86 107 25.1
Upper Mgeni Mill Falls Howick-West Pump No 2 KSB Midmar WTP Howick-West 86 107 25.1
Upper Mgeni Howick-West Mpophomeni Pump No 1 KSB:WKLn 150/3 Howick-West Reservoir Mpophomeni Reservoir 56 120 6.1
Upper Mgeni Howick-West Mpophomeni Pump No 2 KSB:WKLn 150/3 Howick-West Reservoir Mpophomeni Reservoir 56 120 6.1
Upper Mgeni Howick-West Groenekloof No 1 KSB:ROL 250-620 Howick-West Reservoir Groenekloof Reservoir 87 130 18.0
Upper Mgeni Howick-West Groenekloof No 2 KSB:ROL 250-620 Howick-West Reservoir Groenekloof Reservoir 87 130 18.0
Upper Mgeni Groenekloof Low Lift Pump No 1 Amalgamated Power
Eng:DSM 150-46 Groenekloof Reservoir Vulindlela Reservoir 1 103 120 7.1
Upper Mgeni Groenekloof Low Lift Pump No 2 Amalgamated Power Eng:Omega 150-605
Groenekloof Reservoir Vulindlela Reservoir 1 103 120 7.1
Upper Mgeni Groenekloof Low Lift Pump No 3 Amalgamated Power
Eng:DSM 150-46 Groenekloof Reservoir Vulindlela Reservoir 1 103 120 7.1
Upper Mgeni Groenekloof High Lift Pump No 1 Amalgamated Power Eng:RKB Size 200-37
Groenekloof Reservoir Vulindlela Reservoirs 2 - 5 226 351 11
Upper Mgeni Groenekloof High Lift Pump No 2 Amalgamated Power Eng:RKB Size 200-37
Groenekloof Reservoir Vulindlela Reservoirs 2 - 5 226 351 11
Upper Mgeni Groenekloof High Lift Pump No 3 Amalgamated Power
Eng:WL 200/7 Groenekloof Reservoir Vulindlela Reservoirs 2 - 5 226 351 11
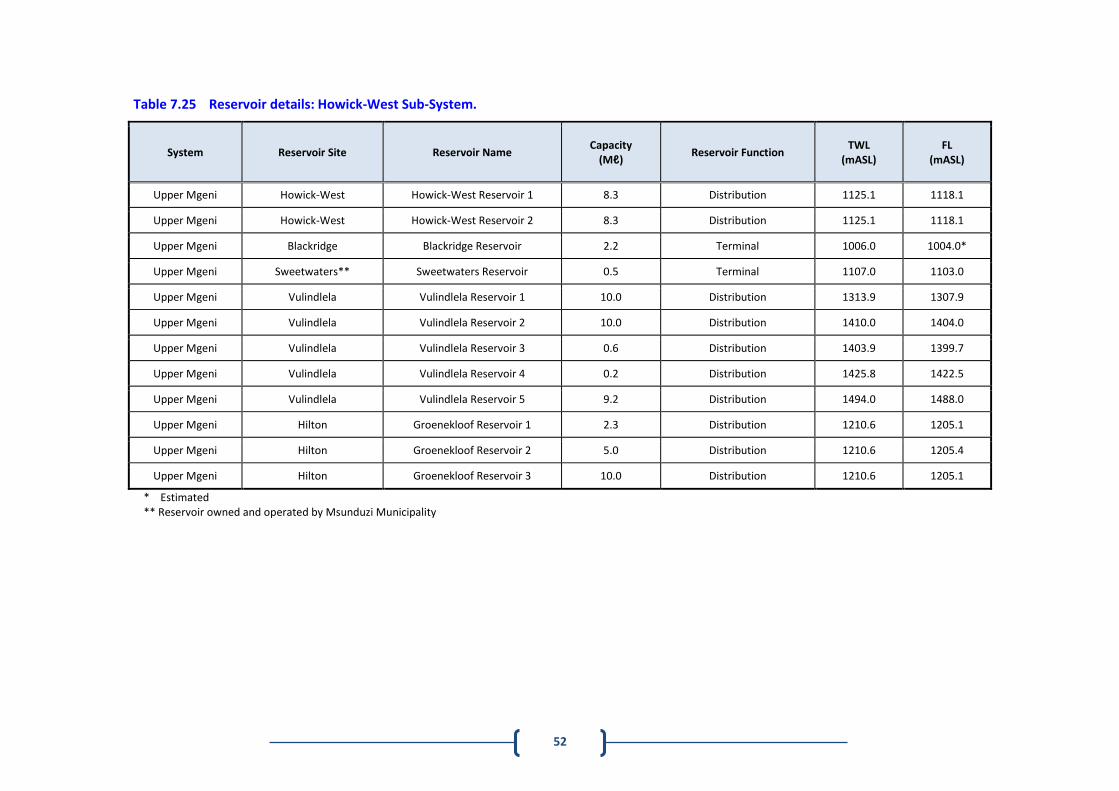
52
Table 7.25 Reservoir details: Howick-West Sub-System.
System Reservoir Site Reservoir Name Capacity
(Mℓ) Reservoir Function
TWL (mASL)
FL (mASL)
Upper Mgeni Howick-West Howick-West Reservoir 1 8.3 Distribution 1125.1 1118.1
Upper Mgeni Howick-West Howick-West Reservoir 2 8.3 Distribution 1125.1 1118.1
Upper Mgeni Blackridge Blackridge Reservoir 2.2 Terminal 1006.0 1004.0*
Upper Mgeni Sweetwaters** Sweetwaters Reservoir 0.5 Terminal 1107.0 1103.0
Upper Mgeni Vulindlela Vulindlela Reservoir 1 10.0 Distribution 1313.9 1307.9
Upper Mgeni Vulindlela Vulindlela Reservoir 2 10.0 Distribution 1410.0 1404.0
Upper Mgeni Vulindlela Vulindlela Reservoir 3 0.6 Distribution 1403.9 1399.7
Upper Mgeni Vulindlela Vulindlela Reservoir 4 0.2 Distribution 1425.8 1422.5
Upper Mgeni Vulindlela Vulindlela Reservoir 5 9.2 Distribution 1494.0 1488.0
Upper Mgeni Hilton Groenekloof Reservoir 1 2.3 Distribution 1210.6 1205.1
Upper Mgeni Hilton Groenekloof Reservoir 2 5.0 Distribution 1210.6 1205.4
Upper Mgeni Hilton Groenekloof Reservoir 3 10.0 Distribution 1210.6 1205.1
* Estimated ** Reservoir owned and operated by Msunduzi Municipality
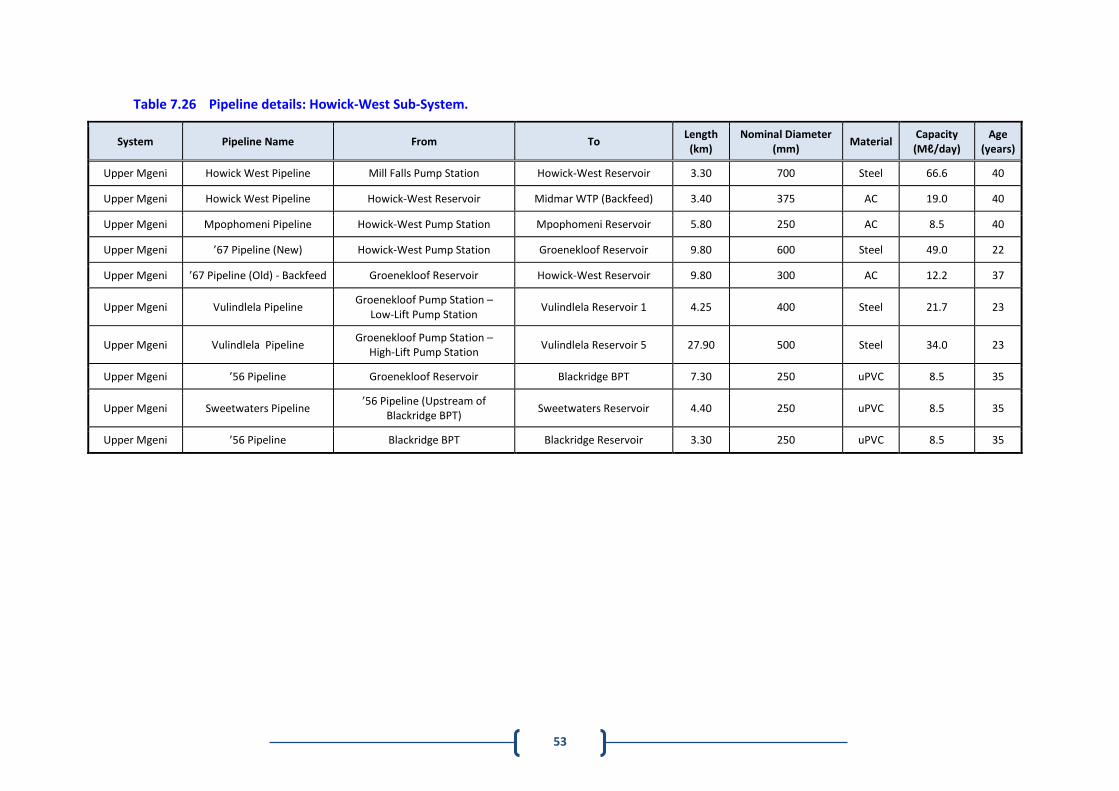
53
Table 7.26 Pipeline details: Howick-West Sub-System.
System Pipeline Name From To Length
(km) Nominal Diameter
(mm) Material
Capacity (Mℓ/day)
Age (years)
Upper Mgeni Howick West Pipeline Mill Falls Pump Station Howick-West Reservoir 3.30 700 Steel 66.6 40
Upper Mgeni Howick West Pipeline Howick-West Reservoir Midmar WTP (Backfeed) 3.40 375 AC 19.0 40
Upper Mgeni Mpophomeni Pipeline Howick-West Pump Station Mpophomeni Reservoir 5.80 250 AC 8.5 40
Upper Mgeni ’67 Pipeline (New) Howick-West Pump Station Groenekloof Reservoir 9.80 600 Steel 49.0 22
Upper Mgeni ’67 Pipeline (Old) - Backfeed Groenekloof Reservoir Howick-West Reservoir 9.80 300 AC 12.2 37
Upper Mgeni Vulindlela Pipeline Groenekloof Pump Station –
Low-Lift Pump Station Vulindlela Reservoir 1 4.25 400 Steel 21.7 23
Upper Mgeni Vulindlela Pipeline Groenekloof Pump Station –
High-Lift Pump Station Vulindlela Reservoir 5 27.90 500 Steel 34.0 23
Upper Mgeni ’56 Pipeline Groenekloof Reservoir Blackridge BPT 7.30 250 uPVC 8.5 35
Upper Mgeni Sweetwaters Pipeline ’56 Pipeline (Upstream of
Blackridge BPT) Sweetwaters Reservoir 4.40 250 uPVC 8.5 35
Upper Mgeni ’56 Pipeline Blackridge BPT Blackridge Reservoir 3.30 250 uPVC 8.5 35
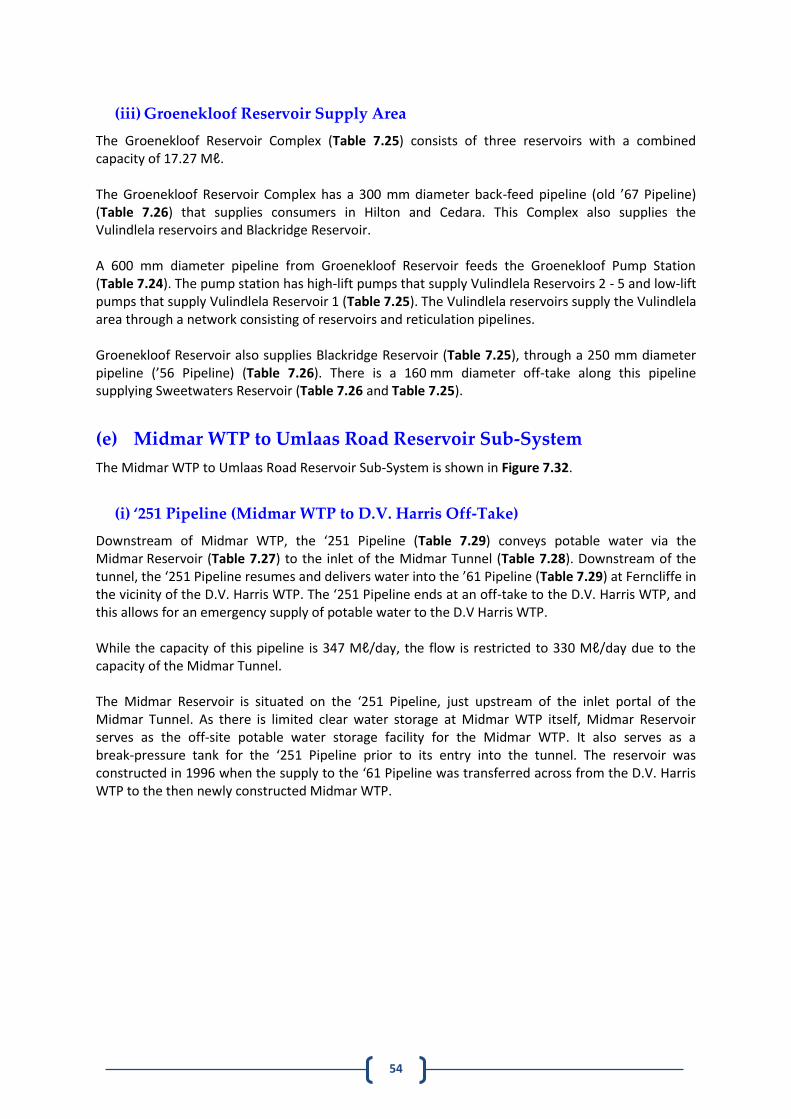
54
(iii) Groenekloof Reservoir Supply Area
The Groenekloof Reservoir Complex (Table 7.25) consists of three reservoirs with a combined capacity of 17.27 Mℓ. The Groenekloof Reservoir Complex has a 300 mm diameter back-feed pipeline (old ’67 Pipeline) (Table 7.26) that supplies consumers in Hilton and Cedara. This Complex also supplies the Vulindlela reservoirs and Blackridge Reservoir. A 600 mm diameter pipeline from Groenekloof Reservoir feeds the Groenekloof Pump Station (Table 7.24). The pump station has high-lift pumps that supply Vulindlela Reservoirs 2 - 5 and low-lift pumps that supply Vulindlela Reservoir 1 (Table 7.25). The Vulindlela reservoirs supply the Vulindlela area through a network consisting of reservoirs and reticulation pipelines. Groenekloof Reservoir also supplies Blackridge Reservoir (Table 7.25), through a 250 mm diameter pipeline (’56 Pipeline) (Table 7.26). There is a 160 mm diameter off-take along this pipeline supplying Sweetwaters Reservoir (Table 7.26 and Table 7.25).
(e) Midmar WTP to Umlaas Road Reservoir Sub-System
The Midmar WTP to Umlaas Road Reservoir Sub-System is shown in Figure 7.32.
(i) ‘251 Pipeline (Midmar WTP to D.V. Harris Off-Take)
Downstream of Midmar WTP, the ‘251 Pipeline (Table 7.29) conveys potable water via the Midmar Reservoir (Table 7.27) to the inlet of the Midmar Tunnel (Table 7.28). Downstream of the tunnel, the ‘251 Pipeline resumes and delivers water into the ’61 Pipeline (Table 7.29) at Ferncliffe in the vicinity of the D.V. Harris WTP. The ‘251 Pipeline ends at an off-take to the D.V. Harris WTP, and this allows for an emergency supply of potable water to the D.V Harris WTP. While the capacity of this pipeline is 347 Mℓ/day, the flow is restricted to 330 Mℓ/day due to the capacity of the Midmar Tunnel. The Midmar Reservoir is situated on the ‘251 Pipeline, just upstream of the inlet portal of the Midmar Tunnel. As there is limited clear water storage at Midmar WTP itself, Midmar Reservoir serves as the off-site potable water storage facility for the Midmar WTP. It also serves as a break-pressure tank for the ‘251 Pipeline prior to its entry into the tunnel. The reservoir was constructed in 1996 when the supply to the ‘61 Pipeline was transferred across from the D.V. Harris WTP to the then newly constructed Midmar WTP.
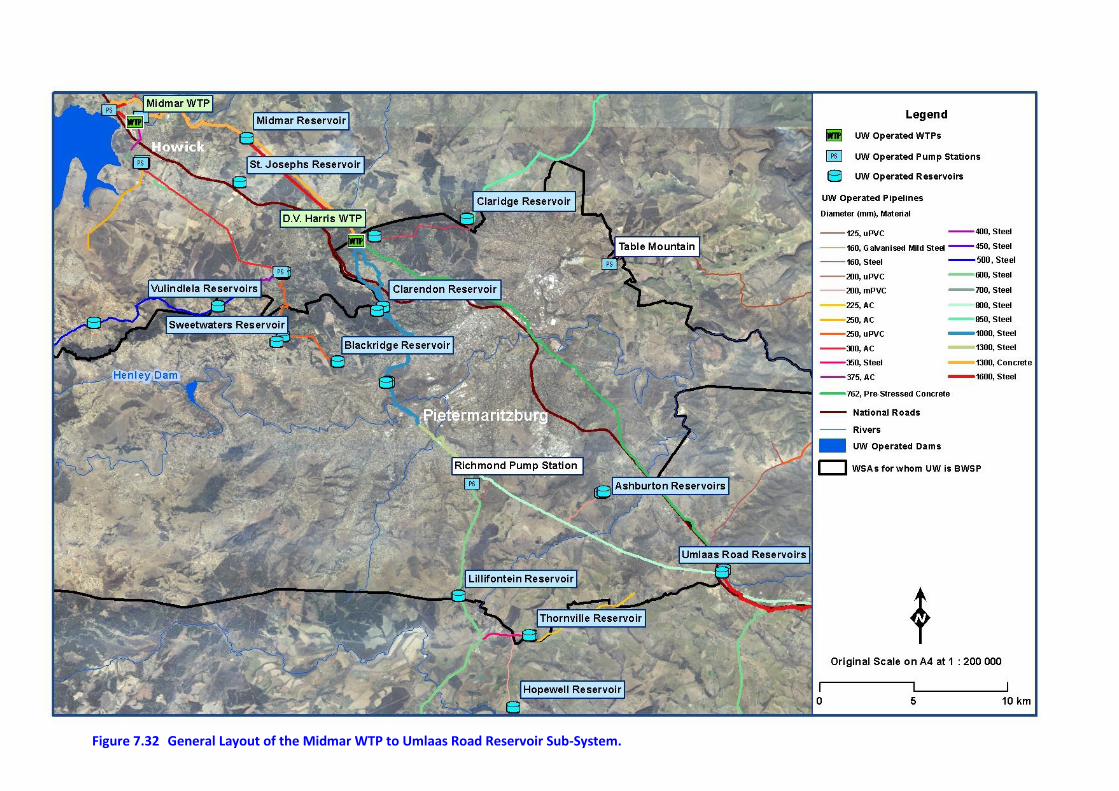
55 Figure 7.32 General Layout of the Midmar WTP to Umlaas Road Reservoir Sub-System.
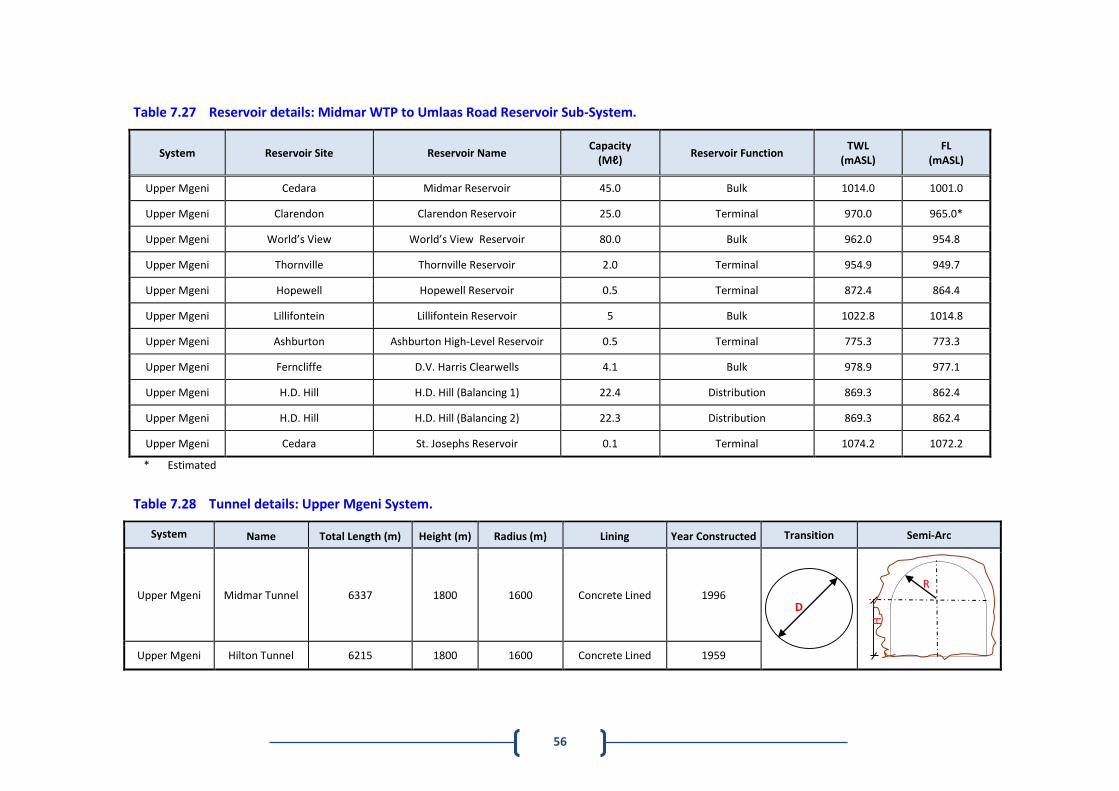
56
Table 7.27 Reservoir details: Midmar WTP to Umlaas Road Reservoir Sub-System.
System Reservoir Site Reservoir Name Capacity
(Mℓ) Reservoir Function
TWL (mASL)
FL (mASL)
Upper Mgeni Cedara Midmar Reservoir 45.0 Bulk 1014.0 1001.0
Upper Mgeni Clarendon Clarendon Reservoir 25.0 Terminal 970.0 965.0*
Upper Mgeni World’s View World’s View Reservoir 80.0 Bulk 962.0 954.8
Upper Mgeni Thornville Thornville Reservoir 2.0 Terminal 954.9 949.7
Upper Mgeni Hopewell Hopewell Reservoir 0.5 Terminal 872.4 864.4
Upper Mgeni Lillifontein Lillifontein Reservoir 5 Bulk 1022.8 1014.8
Upper Mgeni Ashburton Ashburton High-Level Reservoir 0.5 Terminal 775.3 773.3
Upper Mgeni Ferncliffe D.V. Harris Clearwells 4.1 Bulk 978.9 977.1
Upper Mgeni H.D. Hill H.D. Hill (Balancing 1) 22.4 Distribution 869.3 862.4
Upper Mgeni H.D. Hill H.D. Hill (Balancing 2) 22.3 Distribution 869.3 862.4
Upper Mgeni Cedara St. Josephs Reservoir 0.1 Terminal 1074.2 1072.2
* Estimated
Table 7.28 Tunnel details: Upper Mgeni System.
System Name Total Length (m) Height (m) Radius (m) Lining Year Constructed Transition Semi-Arc
Upper Mgeni Midmar Tunnel 6337 1800 1600 Concrete Lined 1996
Upper Mgeni Hilton Tunnel 6215 1800 1600 Concrete Lined 1959
D
R
H
57
Table 7.29 Pipeline details: Midmar WTP to Umlaas Road Reservoir Sub-System.
System Pipeline Name From To Length (km) Nominal Diameter
(mm) Material
Capacity * (Mℓ/day)
Age (years)
Upper Mgeni ‘251 Pipeline Midmar WTP Midmar Reservoir 6.50 1600 Steel 347.9 23
Upper Mgeni ‘251 Pipeline Midmar Tunnel Outlet D.V. Harris WTP 8.06 1600 Steel 347.9 23
Upper Mgeni ’61 Pipeline D.V. Harris WTP World’s View Reservoir 6.20 1000, 900 and 800 Steel 330.0 40
Upper Mgeni ’60 Pipeline D.V. Harris WTP World’s View Reservoir 6.20 900 and 1200 Steel 330.0 6
Upper Mgeni ’61 Pipeline World’s View Reservoir H.D. Hill 29.60 1000 and 1000 Steel 271.7 40
Upper Mgeni ’61 Pipeline H.D. Hill ED2 (Duplication) 8.90 1000 and 1000 Steel 271.7 17
Upper Mgeni ’61 Pipeline ED2 Richmond P/L off-take 4.0 800 Steel 87.0 40
Upper Mgeni ’61 Pipeline ED2 Richmond P/L off-take
(Augmentation) 4 1300 Steel 229.5 8
Upper Mgeni ’61 Pipeline Richmond P/L off-take Umlaas Road 13.00 800 Steel 87.0 40
Upper Mgeni ’61 Pipeline ED4 Umlaas Road 13.00 1100 Steel 133 5
Upper Mgeni Ambleton Pipeline Off-Take from ’61 Pipeline Ambleton Reservoir 2.00 160 Steel 3.5 27
Upper Mgeni Ashburton Pipeline Off-Take from ’61 Pipeline Ashburton Reservoir 2.70 160 Galvanised Mild Steel
3.5 27
Upper Mgeni ’Richmond Pipeline Lillifontein Reservoir Thornville Reservoir 1 4.9 350 Steel 6.2 5
Upper Mgeni ’Richmond Pipeline Lillifontein Reservoir Richmond Reservoir 22.6 450 Steel 7.6 5
Upper Mgeni Hopewell Pipeline Thornville Reservoir Hopewell Reservoir 4.91 200 mPVC 5.4 33
Upper Mgeni Thornville Thornville Reservoir De-commissioned Pump
Station 7.90 160/200 Steel/AC 8.9 33
Upper Mgeni Baynesfield Thornville Reservoir Baynesfield 4.95 200 AC 5.4 33
Upper Mgeni ’53 Pipeline D.V. Harris WTP Umlaas Road 26.60 762 Pre-Stressed
Concrete 35.0 61
* Capacity based on velocity of 2 m/s
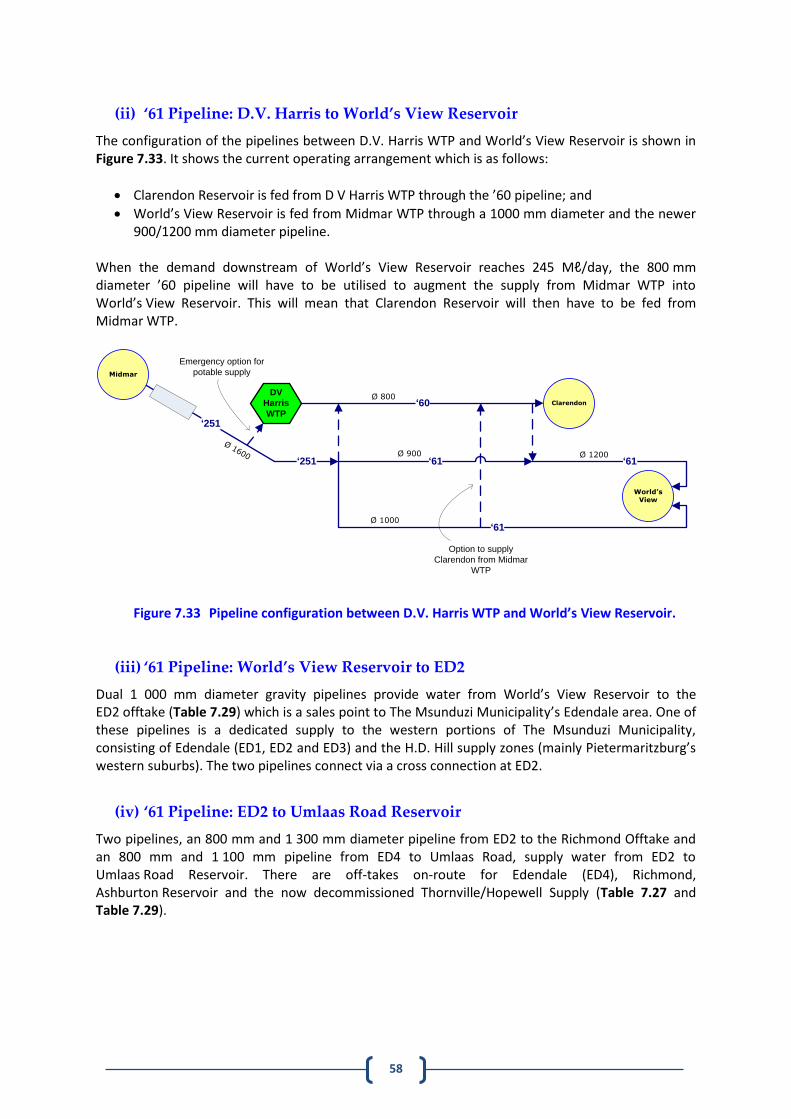
58
(ii) ‘61 Pipeline: D.V. Harris to World’s View Reservoir
The configuration of the pipelines between D.V. Harris WTP and World’s View Reservoir is shown in Figure 7.33. It shows the current operating arrangement which is as follows:
Clarendon Reservoir is fed from D V Harris WTP through the ’60 pipeline; and
World’s View Reservoir is fed from Midmar WTP through a 1000 mm diameter and the newer 900/1200 mm diameter pipeline.
When the demand downstream of World’s View Reservoir reaches 245 Mℓ/day, the 800 mm diameter ’60 pipeline will have to be utilised to augment the supply from Midmar WTP into World’s View Reservoir. This will mean that Clarendon Reservoir will then have to be fed from Midmar WTP.
Ø 1200Ø 900
Ø 800
Ø 1000
Ø 1600
Midmar
‘251
DV
Harris
WTP
‘61
‘61
Clarendon
World’s View
‘251
‘60
‘61
Emergency option for
potable supply
Option to supply
Clarendon from Midmar
WTP
Figure 7.33 Pipeline configuration between D.V. Harris WTP and World’s View Reservoir.
(iii) ‘61 Pipeline: World’s View Reservoir to ED2
Dual 1 000 mm diameter gravity pipelines provide water from World’s View Reservoir to the ED2 offtake (Table 7.29) which is a sales point to The Msunduzi Municipality’s Edendale area. One of these pipelines is a dedicated supply to the western portions of The Msunduzi Municipality, consisting of Edendale (ED1, ED2 and ED3) and the H.D. Hill supply zones (mainly Pietermaritzburg’s western suburbs). The two pipelines connect via a cross connection at ED2.
(iv) ‘61 Pipeline: ED2 to Umlaas Road Reservoir
Two pipelines, an 800 mm and 1 300 mm diameter pipeline from ED2 to the Richmond Offtake and an 800 mm and 1 100 mm pipeline from ED4 to Umlaas Road, supply water from ED2 to Umlaas Road Reservoir. There are off-takes on-route for Edendale (ED4), Richmond, Ashburton Reservoir and the now decommissioned Thornville/Hopewell Supply (Table 7.27 and Table 7.29).
59
(v) Ashburton Supply
An off-take from the ’61 Pipeline supplies the Ashburton High-Level Reservoir (Table 7.27) through a 160mm diameter galvanised mild steel pipeline (Table 7.29). The reservoir feeds directly into the Msunduzi Municipality’s Ashburton Lower Reservoir. The supply zone of this reservoir is the Ashburton and Lynnfield Park areas.
(vi) Richmond/Thornville/Hopewell Supply
A 600 mm diameter off-take from the ’61 Pipeline supplies the Lillifontein Reservoir via the Richmond Pump Station. The Thornville Reservoir (Table 7.27) is supplied under gravity through a 350 mm diameter pipeline (Table 7.30). The reservoir serves the Thornville and Baynesfield area. An off-take on the pipeline to Baynesfield supplies water to the Hopewell Reservoir (Table 7.27) which serves as reticulation storage for the Hopewell community. The rising main from the ’61 Pipeline to Thornville is now used as a back-feed gravity main to supply users along that line (i.e. supply is now from the Thornville Reservoir to the Thornville Pump Station). The Thornville Pump Station has been decommissioned.
(vii) 53 Pipeline: D. V. Harris WTP to Umlaas Road Reservoir
The ’53 Pipeline is a pre-stressed concrete pipeline that was commissioned in 1968 (Table 7.29). It was initially constructed to supply raw water from Midmar Dam to the Umlaas Road WTP. The pipeline was decommissioned in 2002 and the Umlaas Road Reservoir then only received potable water from the Midmar WTP via the ’61 Pipeline. The ’53 Pipeline was re-commissioned in 2006 as a potable pipeline from the D.V. Harris WTP to augment the supply to Umlaas Road Reservoir.
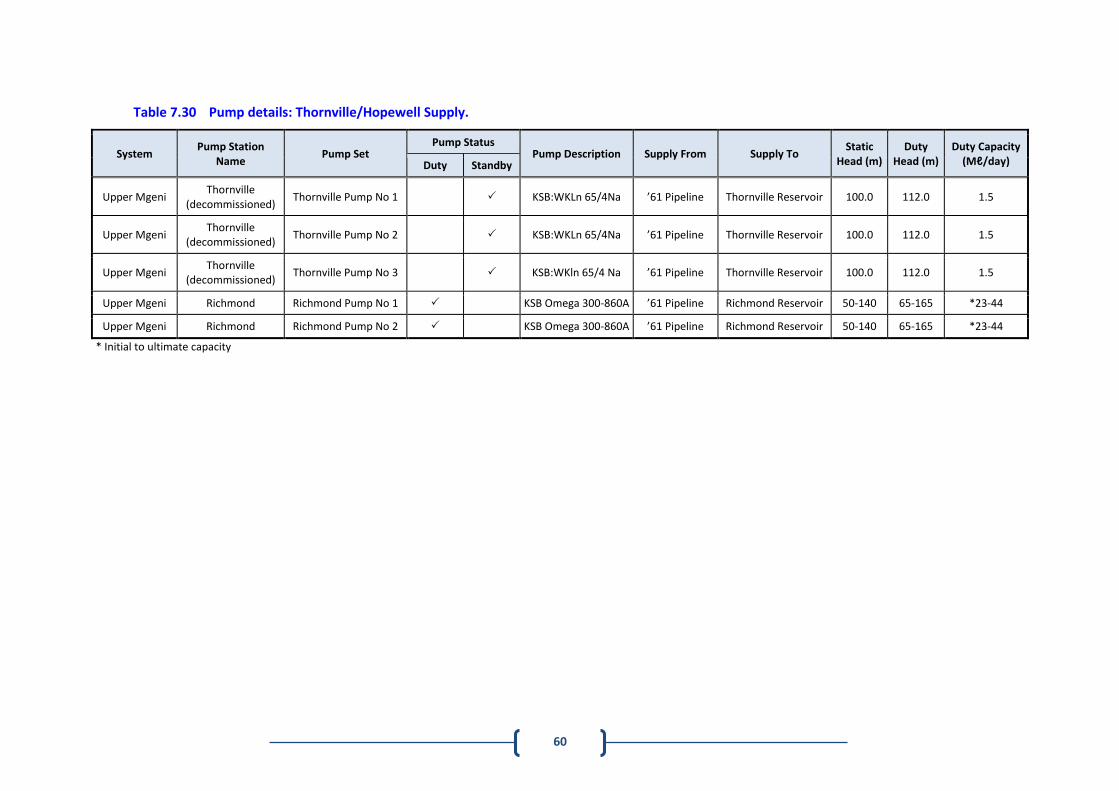
60
Table 7.30 Pump details: Thornville/Hopewell Supply.
System Pump Station
Name Pump Set
Pump Status Pump Description Supply From Supply To
Static Head (m)
Duty Head (m)
Duty Capacity (Mℓ/day) Duty Standby
Upper Mgeni Thornville
(decommissioned) Thornville Pump No 1 KSB:WKLn 65/4Na ’61 Pipeline Thornville Reservoir 100.0 112.0 1.5
Upper Mgeni Thornville
(decommissioned) Thornville Pump No 2 KSB:WKLn 65/4Na ’61 Pipeline Thornville Reservoir 100.0 112.0 1.5
Upper Mgeni Thornville
(decommissioned) Thornville Pump No 3 KSB:WKln 65/4 Na ’61 Pipeline Thornville Reservoir 100.0 112.0 1.5
Upper Mgeni Richmond Richmond Pump No 1 KSB Omega 300-860A ’61 Pipeline Richmond Reservoir 50-140 65-165 *23-44
Upper Mgeni Richmond Richmond Pump No 2 KSB Omega 300-860A ’61 Pipeline Richmond Reservoir 50-140 65-165 *23-44
* Initial to ultimate capacity
61
(f) Umlaas Road Reservoir Sub-System
The Umlaas Road Reservoir Sub-System is shown in Figure 7.34. The Umlaas Road Reservoir Complex consists of a 9 Mℓ reservoir and a 45 Mℓ reservoir (Table 7.31), which is interlinked. The reservoir complex has two off-takes. One feeds the ’57 Pipeline (Table 7.32) and the other the Lion Park Pipeline (Table 7.32). The Lion Park Pipeline is currently fed directly from the ’61 Pipeline to ensure adequate pressure along the newly commissioned pipeline.
(i) ’57 Pipeline
The ’57, ‘157 and ‘257 Pipelines (800, 1000 and 1600 mm diameter respectively) run from Umlaas Road Reservoir to Point M, the sales point to eThekwini Municipality (Table 7.32).
(ii) Eston/Umbumbulu Pipeline
Downstream of Umlaas Road Reservoir, the Eston/Umbumbulu Pipeline draws water from the 1000 mm diameter ’57 Pipeline. It feeds eThekwini Municipality’s Umbumbulu Reservoir. En route, there is an off-take to the Eston Reservoir (Table 7.31). Further off-takes from this pipeline feed into the Greater Eston Bulk Water Supply Scheme and the Mid Illovu system.
(iii) Lion Park / Manyavu Pipeline
There are off-takes along the route of the 800 mm diameter ’57 Pipeline for Mkhambathini Municipality (Table 7.32). The supply to eThekwini Municipality has been decommissioned. A 150 mm diameter AC pipeline and a newly constructed 350 mm diameter steel pipeline, off-take from the ’61 Pipeline, supplies individual consumers along the Lion Park road. This pipeline was extended in 2011 to feed the rural area of Manyavu (Table 7.32).
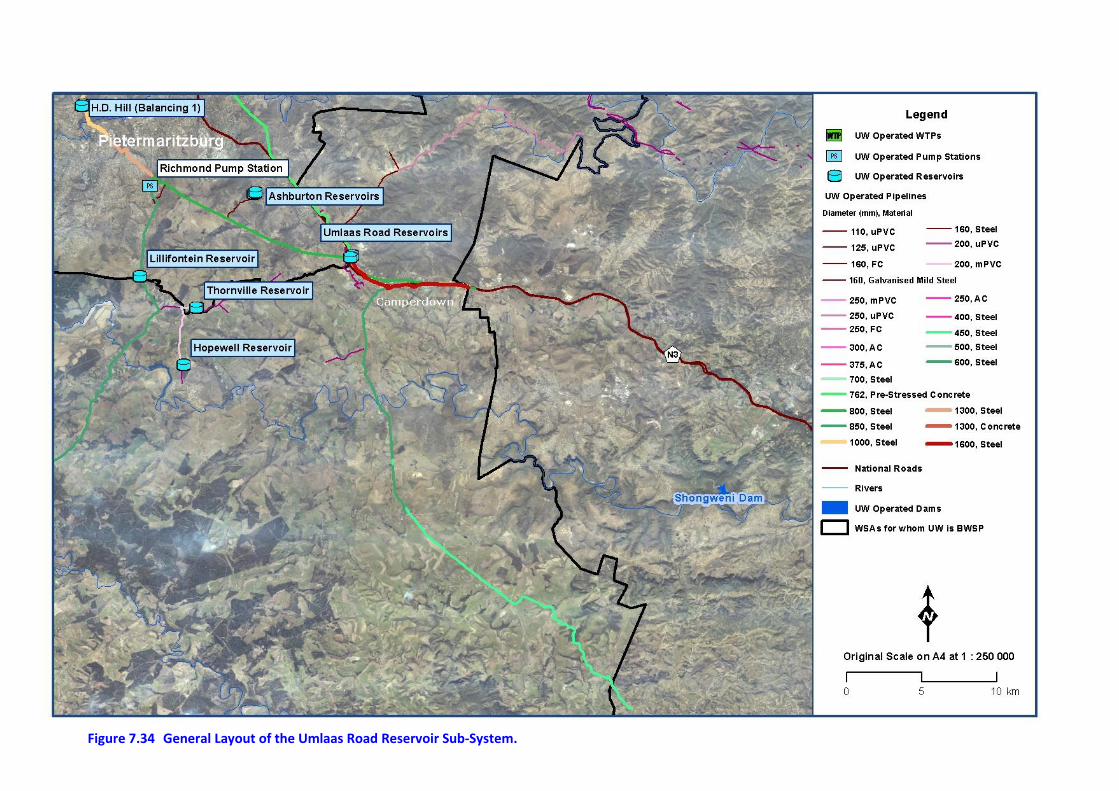
62 Figure 7.34 General Layout of the Umlaas Road Reservoir Sub-System.
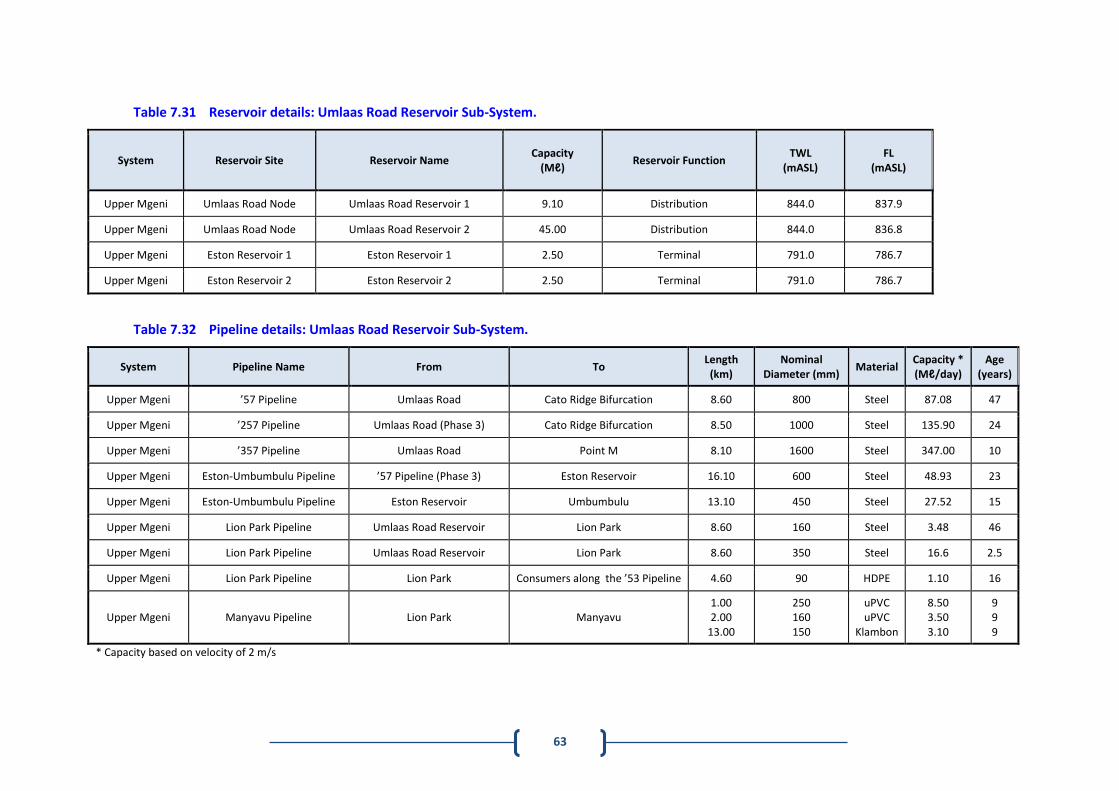
63
Table 7.31 Reservoir details: Umlaas Road Reservoir Sub-System.
System Reservoir Site Reservoir Name Capacity
(Mℓ) Reservoir Function
TWL (mASL)
FL (mASL)
Upper Mgeni Umlaas Road Node Umlaas Road Reservoir 1 9.10 Distribution 844.0 837.9
Upper Mgeni Umlaas Road Node Umlaas Road Reservoir 2 45.00 Distribution 844.0 836.8
Upper Mgeni Eston Reservoir 1 Eston Reservoir 1 2.50 Terminal 791.0 786.7
Upper Mgeni Eston Reservoir 2 Eston Reservoir 2 2.50 Terminal 791.0 786.7
Table 7.32 Pipeline details: Umlaas Road Reservoir Sub-System.
System Pipeline Name From To Length
(km) Nominal
Diameter (mm) Material
Capacity * (Mℓ/day)
Age (years)
Upper Mgeni ’57 Pipeline Umlaas Road Cato Ridge Bifurcation 8.60 800 Steel 87.08 47
Upper Mgeni ’257 Pipeline Umlaas Road (Phase 3) Cato Ridge Bifurcation 8.50 1000 Steel 135.90 24
Upper Mgeni ’357 Pipeline Umlaas Road Point M 8.10 1600 Steel 347.00 10
Upper Mgeni Eston-Umbumbulu Pipeline ’57 Pipeline (Phase 3) Eston Reservoir 16.10 600 Steel 48.93 23
Upper Mgeni Eston-Umbumbulu Pipeline Eston Reservoir Umbumbulu 13.10 450 Steel 27.52 15
Upper Mgeni Lion Park Pipeline Umlaas Road Reservoir Lion Park 8.60 160 Steel 3.48 46
Upper Mgeni Lion Park Pipeline Umlaas Road Reservoir Lion Park 8.60 350 Steel 16.6 2.5
Upper Mgeni Lion Park Pipeline Lion Park Consumers along the ’53 Pipeline 4.60 90 HDPE 1.10 16
Upper Mgeni Manyavu Pipeline Lion Park Manyavu 1.00 2.00
13.00
250 160 150
uPVC uPVC
Klambon
8.50 3.50 3.10
9 9 9
* Capacity based on velocity of 2 m/s
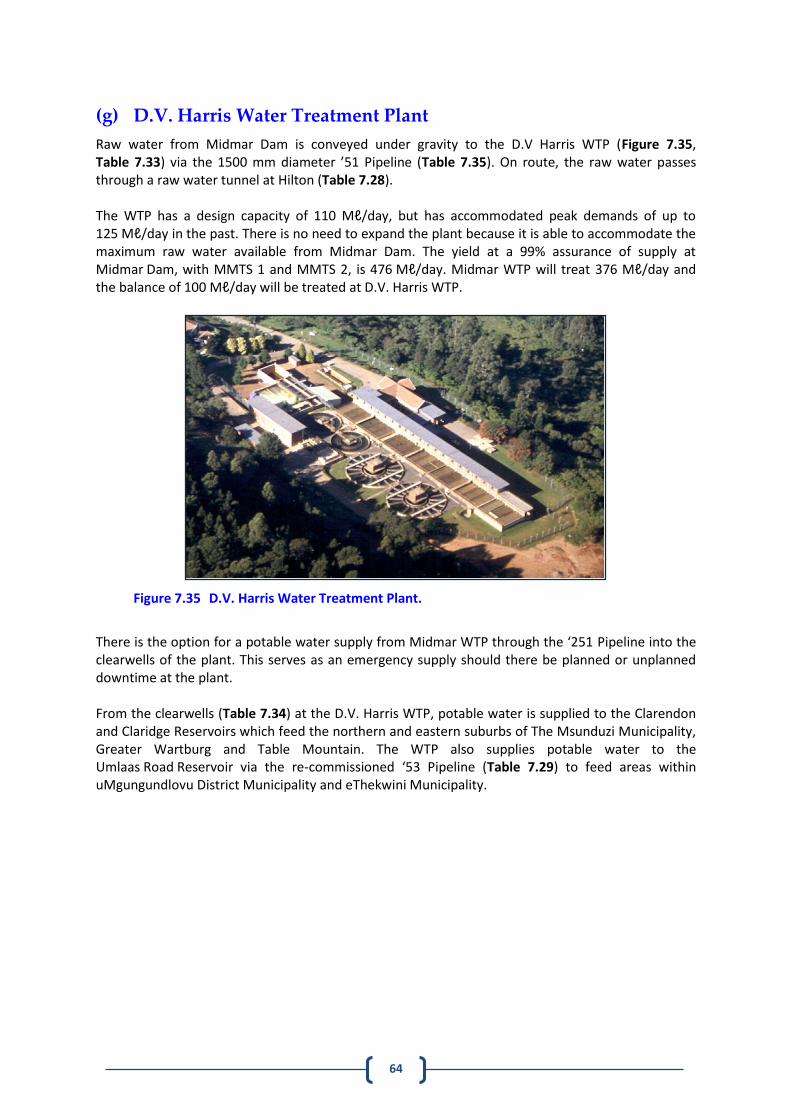
64
(g) D.V. Harris Water Treatment Plant
Raw water from Midmar Dam is conveyed under gravity to the D.V Harris WTP (Figure 7.35, Table 7.33) via the 1500 mm diameter ’51 Pipeline (Table 7.35). On route, the raw water passes through a raw water tunnel at Hilton (Table 7.28). The WTP has a design capacity of 110 Mℓ/day, but has accommodated peak demands of up to 125 Mℓ/day in the past. There is no need to expand the plant because it is able to accommodate the maximum raw water available from Midmar Dam. The yield at a 99% assurance of supply at Midmar Dam, with MMTS 1 and MMTS 2, is 476 Mℓ/day. Midmar WTP will treat 376 Mℓ/day and the balance of 100 Mℓ/day will be treated at D.V. Harris WTP.
Figure 7.35 D.V. Harris Water Treatment Plant.
There is the option for a potable water supply from Midmar WTP through the ‘251 Pipeline into the clearwells of the plant. This serves as an emergency supply should there be planned or unplanned downtime at the plant. From the clearwells (Table 7.34) at the D.V. Harris WTP, potable water is supplied to the Clarendon and Claridge Reservoirs which feed the northern and eastern suburbs of The Msunduzi Municipality, Greater Wartburg and Table Mountain. The WTP also supplies potable water to the Umlaas Road Reservoir via the re-commissioned ‘53 Pipeline (Table 7.29) to feed areas within uMgungundlovu District Municipality and eThekwini Municipality.
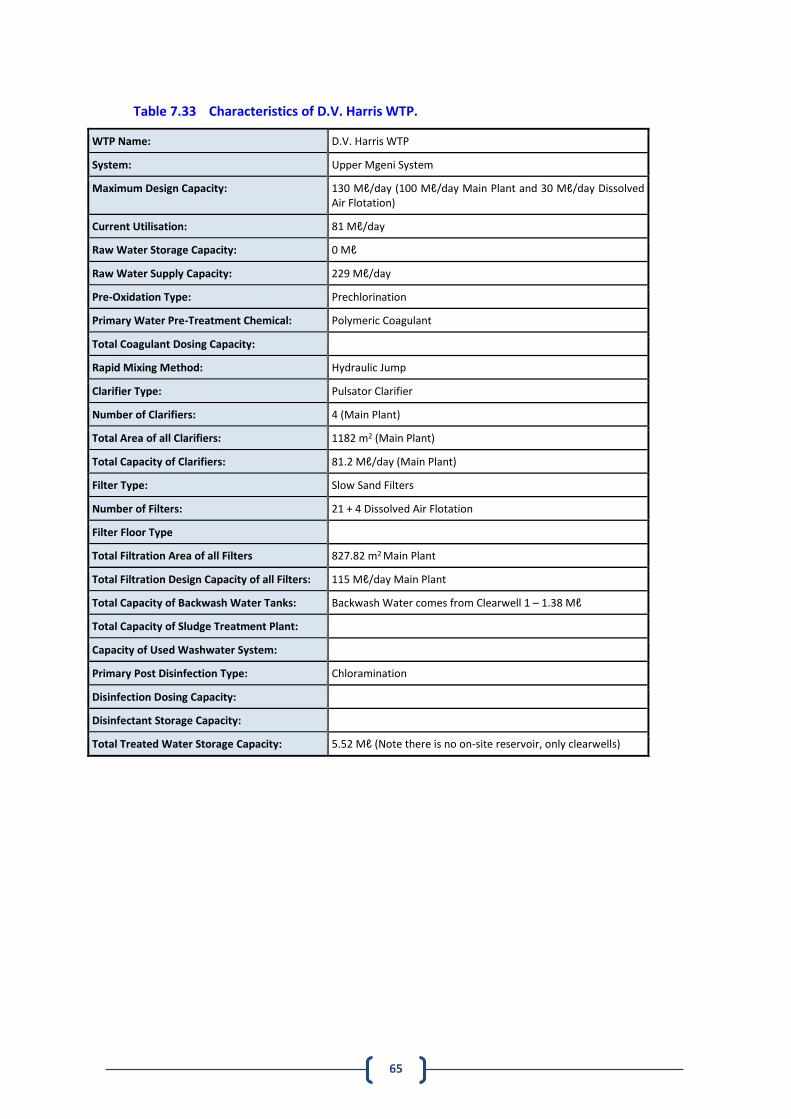
65
Table 7.33 Characteristics of D.V. Harris WTP.
WTP Name: D.V. Harris WTP
System: Upper Mgeni System
Maximum Design Capacity: 130 Mℓ/day (100 Mℓ/day Main Plant and 30 Mℓ/day Dissolved Air Flotation)
Current Utilisation: 81 Mℓ/day
Raw Water Storage Capacity: 0 Mℓ
Raw Water Supply Capacity: 229 Mℓ/day
Pre-Oxidation Type: Prechlorination
Primary Water Pre-Treatment Chemical: Polymeric Coagulant
Total Coagulant Dosing Capacity:
Rapid Mixing Method: Hydraulic Jump
Clarifier Type: Pulsator Clarifier
Number of Clarifiers: 4 (Main Plant)
Total Area of all Clarifiers: 1182 m2 (Main Plant)
Total Capacity of Clarifiers: 81.2 Mℓ/day (Main Plant)
Filter Type: Slow Sand Filters
Number of Filters: 21 + 4 Dissolved Air Flotation
Filter Floor Type
Total Filtration Area of all Filters 827.82 m2 Main Plant
Total Filtration Design Capacity of all Filters: 115 Mℓ/day Main Plant
Total Capacity of Backwash Water Tanks: Backwash Water comes from Clearwell 1 – 1.38 Mℓ
Total Capacity of Sludge Treatment Plant:
Capacity of Used Washwater System:
Primary Post Disinfection Type: Chloramination
Disinfection Dosing Capacity:
Disinfectant Storage Capacity:
Total Treated Water Storage Capacity: 5.52 Mℓ (Note there is no on-site reservoir, only clearwells)
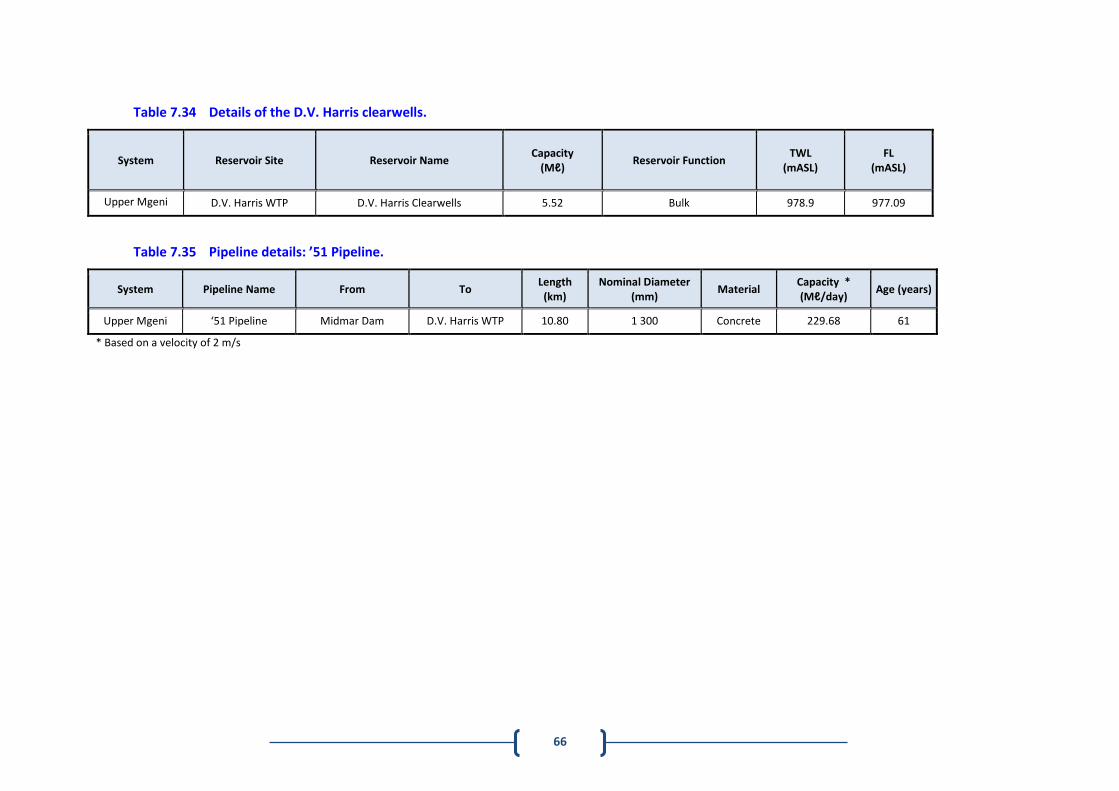
66
Table 7.34 Details of the D.V. Harris clearwells.
System Reservoir Site Reservoir Name Capacity
(Mℓ) Reservoir Function
TWL (mASL)
FL (mASL)
Upper Mgeni D.V. Harris WTP D.V. Harris Clearwells 5.52 Bulk 978.9 977.09
Table 7.35 Pipeline details: ’51 Pipeline.
System Pipeline Name From To Length
(km) Nominal Diameter
(mm) Material
Capacity * (Mℓ/day)
Age (years)
Upper Mgeni ‘51 Pipeline Midmar Dam D.V. Harris WTP 10.80 1 300 Concrete 229.68 61
* Based on a velocity of 2 m/s
67
(h) uMshwathi Sub-System
The D.V. Harris WTP supplies the uMshwathi BWSS (Figure 7.36). This includes supply to the Wartburg and Table Mountain areas. Water is sold to The Msunduzi Municipality at the WTP and is then conveyed to Claridge Reservoir. At this point, the water is “bought back” from Msunduzi Municipality to supply Greater Wartburg. Another “buy back” point further downstream of Msunduzi Municipality’s infrastructure at Lower Glen Lyn supplies Table Mountain.
(i) Table Mountain Supply
Umgeni Water purchases water from The Msunduzi Municipality at the municipality’s Lower Glen-Lyn Break Pressure Tank. An off-take from the break pressure tank supplies the Table Mountain Pipeline (Table 7.36), which feeds the Table Mountain Reservoir (Table 7.36). From the Table Mountain Reservoir, potable water is supplied to the rural communities in Table Mountain within the uMgungundlovu District Municipality.
(ii) ’69 Pipeline (Claridge Reservoir to Wartburg Reservoir)
Umgeni Water’s Wartburg Pipeline, also known as the ‘69 Pipeline, supplies potable water to the Albert Falls, Wartburg, Cool Air, New Hanover, Dalton and Swayimane areas, as well as individual households en-route (Table 7.36). Water is currently conveyed between D.V. Harris WTP and Claridge Reservoir along a 6.7 km long 1 000 mm diameter steel pipeline, which is owned by The Msunduzi Municipality. Umgeni Water buys water back from The Msunduzi Municipality at Claridge Reservoir. Potable water from the Claridge Reservoir flows under gravity through the ’69 Pipeline (see above) to the Wartburg Pump Station (Table 7.37). There are off-takes to Albert Falls, Mpolweni as well as private connections en-route. From the pump station, the ’69 Pipeline continues as a rising main to the Wartburg Reservoir (Table 7.37). Phases 1, 2 and 3 of the uMshwathi Regional Bulk Water Supply Scheme (BWSS) (Section 7.5.2 (f)) have been completed and fully commissioned. A new 800mm diameter pipeline has been constructed (Phase 1) in parallel to the existing 300 mm diameter pipeline from Claridge Reservoir to Wartburg. Similarly, a new pump station has been constructed to boost pressure in this line. The new pump station, named the Mpolweni Pump Station, was commissioned at the end of June 2019. The existing 300 mm diameter NB steel pipeline will be used as a back feed line from Wartburg Reservoir to supply the existing consumers along this line. Similarly, the existing 300 mm diameter NB steel section from Claridge Reservoir will be used to supply the existing consumers and the Albert Falls area.
(iii) Wartburg Reservoir to Bruyns Hill Reservoir
Bruyns Hill Reservoir (Table 7.38) is supplied via a 250 mm diameter steel pipeline from the Wartburg Reservoir. The pipeline is initially a gravity line to the Bruyns Hill Pump Station (Table 7.37) and then a 250 mm diameter rising main to the Bruyns Hill Reservoir. A new pump station at Wartburg Reservoir and a 450 mm diameter steel rising main have been commissioned and will meet current and the projected demands of the Bruyns Hill Supply System.
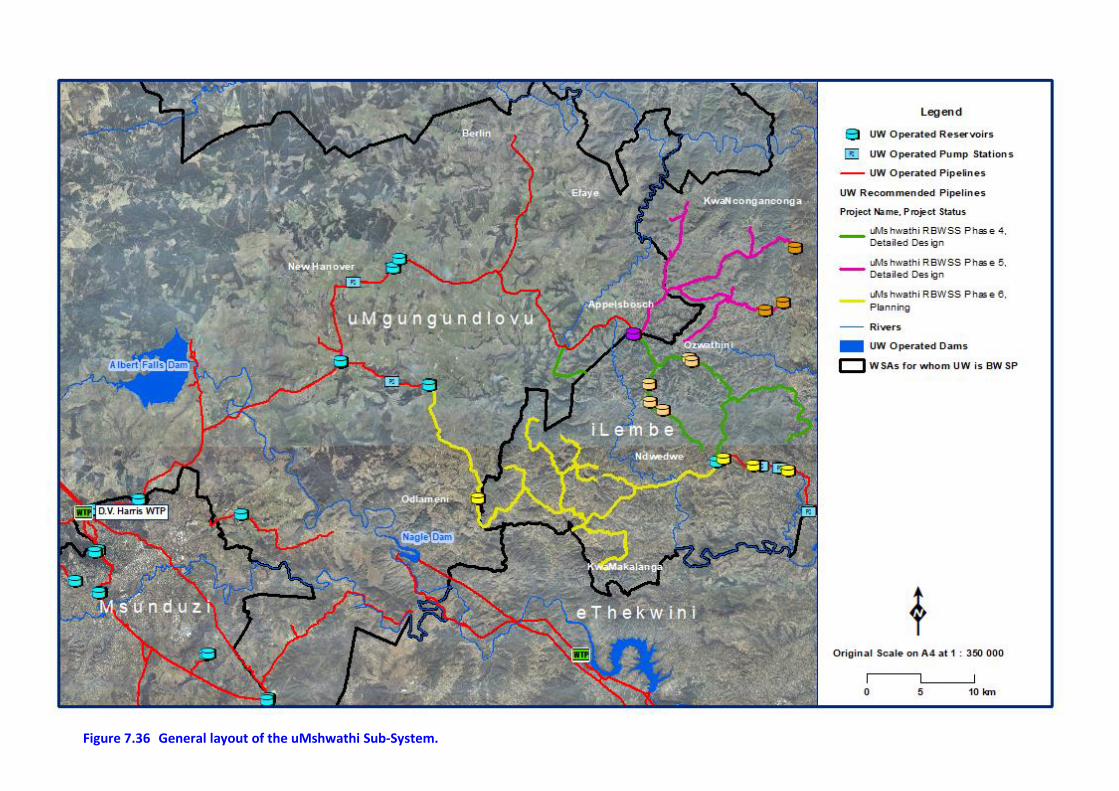
68 Figure 7.36 General layout of the uMshwathi Sub-System.
69
(iv) Wartburg to Dalton
Wartburg Reservoir supplies Cool Air Reservoir via the Dingle Pump Station (Table 7.37). En-route it supplies Trustfeeds and New Hanover. A further pump station at Cool Air Reservoir pumps water to Dalton Reservoir (Table 7.38). Phase 2 of the uMshwati BWSS, which comprises the installation of a 700 mm diameter NB steel pipeline from Wartburg Reservoir to a newly constructed 10 Mℓ Reservoir and a new booster pump station has been completed and commissioned.
(v) Dalton to Ozwathini
Phase 3 of the uMshwati BWSS comprises the recently constructed 700 mm diameter NB steel pipeline from Dalton Reservoir to a 12 Mℓ Ozwathini Reservoir and a new booster pump station. The reservoir was completed at the end of August 2019. There will be an off-take to the Efaye community and Montebello Hospital along this pipeline.
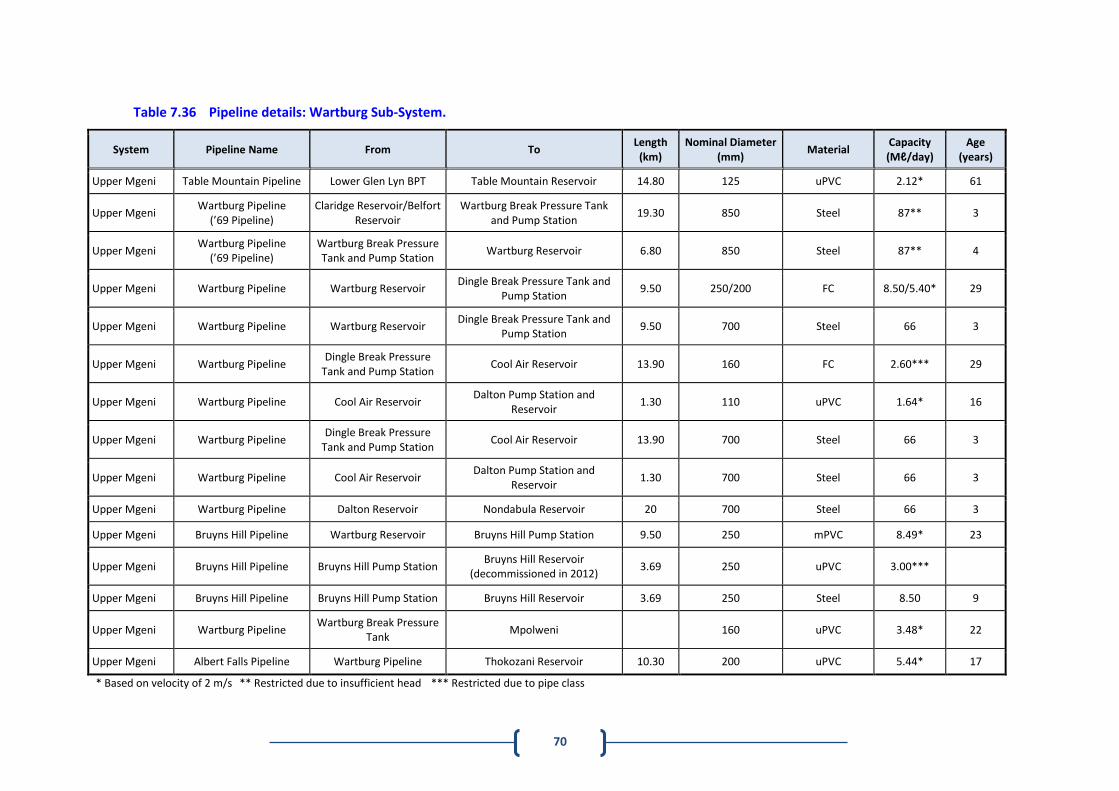
70
Table 7.36 Pipeline details: Wartburg Sub-System.
System Pipeline Name From To Length
(km) Nominal Diameter
(mm) Material
Capacity (Mℓ/day)
Age (years)
Upper Mgeni Table Mountain Pipeline Lower Glen Lyn BPT Table Mountain Reservoir 14.80 125 uPVC 2.12* 61
Upper Mgeni Wartburg Pipeline
(’69 Pipeline) Claridge Reservoir/Belfort
Reservoir Wartburg Break Pressure Tank
and Pump Station 19.30 850 Steel 87** 3
Upper Mgeni Wartburg Pipeline (’69 Pipeline)
Wartburg Break Pressure Tank and Pump Station
Wartburg Reservoir 6.80 850 Steel 87** 4
Upper Mgeni Wartburg Pipeline Wartburg Reservoir Dingle Break Pressure Tank and
Pump Station 9.50 250/200 FC 8.50/5.40* 29
Upper Mgeni Wartburg Pipeline Wartburg Reservoir Dingle Break Pressure Tank and
Pump Station 9.50 700 Steel 66 3
Upper Mgeni Wartburg Pipeline Dingle Break Pressure
Tank and Pump Station Cool Air Reservoir 13.90 160 FC 2.60*** 29
Upper Mgeni Wartburg Pipeline Cool Air Reservoir Dalton Pump Station and
Reservoir 1.30 110 uPVC 1.64* 16
Upper Mgeni Wartburg Pipeline Dingle Break Pressure
Tank and Pump Station Cool Air Reservoir 13.90 700 Steel 66 3
Upper Mgeni Wartburg Pipeline Cool Air Reservoir Dalton Pump Station and
Reservoir 1.30 700 Steel 66 3
Upper Mgeni Wartburg Pipeline Dalton Reservoir Nondabula Reservoir 20 700 Steel 66 3
Upper Mgeni Bruyns Hill Pipeline Wartburg Reservoir Bruyns Hill Pump Station 9.50 250 mPVC 8.49* 23
Upper Mgeni Bruyns Hill Pipeline Bruyns Hill Pump Station Bruyns Hill Reservoir
(decommissioned in 2012) 3.69 250 uPVC 3.00***
Upper Mgeni Bruyns Hill Pipeline Bruyns Hill Pump Station Bruyns Hill Reservoir 3.69 250 Steel 8.50 9
Upper Mgeni Wartburg Pipeline Wartburg Break Pressure
Tank Mpolweni 160 uPVC 3.48* 22
Upper Mgeni Albert Falls Pipeline Wartburg Pipeline Thokozani Reservoir 10.30 200 uPVC 5.44* 17
* Based on velocity of 2 m/s ** Restricted due to insufficient head *** Restricted due to pipe class
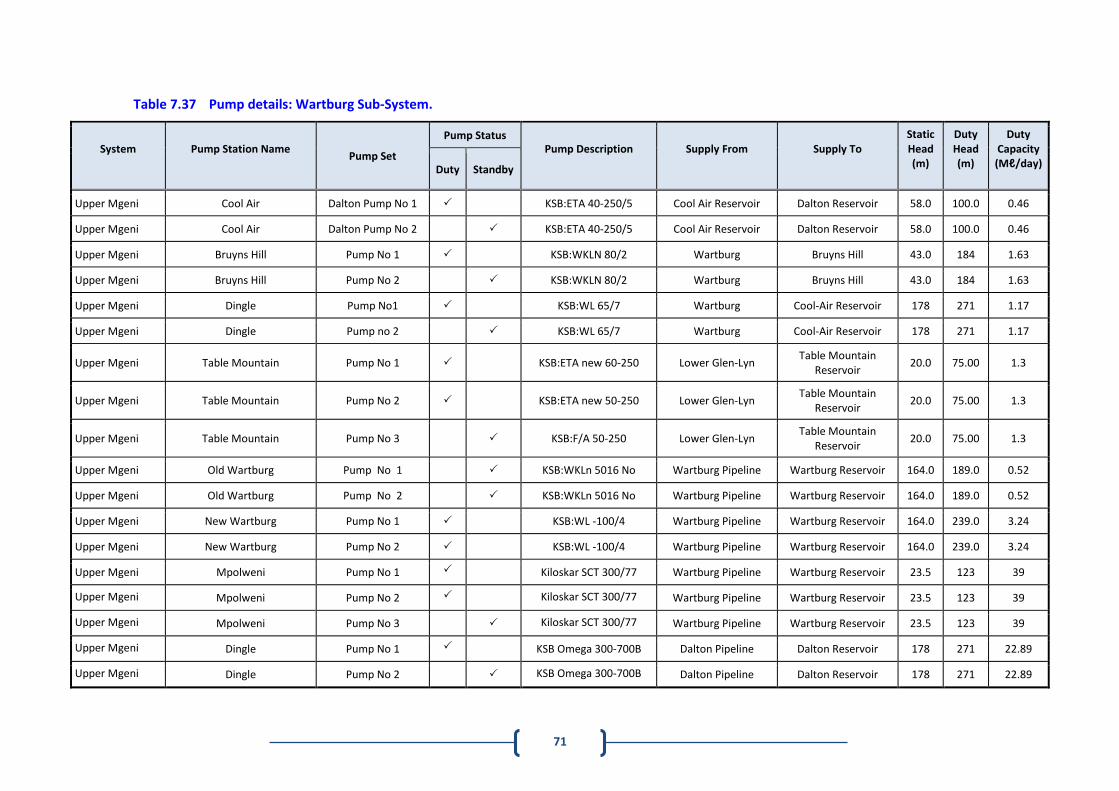
71
Table 7.37 Pump details: Wartburg Sub-System.
System
Pump Station Name
Pump Set
Pump Status Pump Description
Supply From
Supply To
Static Head (m)
Duty Head (m)
Duty Capacity (Mℓ/day)
Duty Standby
Upper Mgeni Cool Air Dalton Pump No 1 KSB:ETA 40-250/5 Cool Air Reservoir Dalton Reservoir 58.0 100.0 0.46
Upper Mgeni Cool Air Dalton Pump No 2 KSB:ETA 40-250/5 Cool Air Reservoir Dalton Reservoir 58.0 100.0 0.46
Upper Mgeni Bruyns Hill Pump No 1 KSB:WKLN 80/2 Wartburg Bruyns Hill 43.0 184 1.63
Upper Mgeni Bruyns Hill Pump No 2 KSB:WKLN 80/2 Wartburg Bruyns Hill 43.0 184 1.63
Upper Mgeni Dingle Pump No1 KSB:WL 65/7 Wartburg Cool-Air Reservoir 178 271 1.17
Upper Mgeni Dingle Pump no 2 KSB:WL 65/7 Wartburg Cool-Air Reservoir 178 271 1.17
Upper Mgeni Table Mountain Pump No 1 KSB:ETA new 60-250 Lower Glen-Lyn Table Mountain
Reservoir 20.0 75.00 1.3
Upper Mgeni Table Mountain Pump No 2 KSB:ETA new 50-250 Lower Glen-Lyn Table Mountain
Reservoir 20.0 75.00 1.3
Upper Mgeni Table Mountain Pump No 3 KSB:F/A 50-250 Lower Glen-Lyn Table Mountain
Reservoir 20.0 75.00 1.3
Upper Mgeni Old Wartburg Pump No 1 KSB:WKLn 5016 No Wartburg Pipeline Wartburg Reservoir 164.0 189.0 0.52
Upper Mgeni Old Wartburg Pump No 2 KSB:WKLn 5016 No Wartburg Pipeline Wartburg Reservoir 164.0 189.0 0.52
Upper Mgeni New Wartburg Pump No 1 KSB:WL -100/4 Wartburg Pipeline Wartburg Reservoir 164.0 239.0 3.24
Upper Mgeni New Wartburg Pump No 2 KSB:WL -100/4 Wartburg Pipeline Wartburg Reservoir 164.0 239.0 3.24
Upper Mgeni Mpolweni Pump No 1 Kiloskar SCT 300/77 Wartburg Pipeline Wartburg Reservoir 23.5 123 39
Upper Mgeni Mpolweni Pump No 2 Kiloskar SCT 300/77 Wartburg Pipeline Wartburg Reservoir 23.5 123 39
Upper Mgeni Mpolweni Pump No 3 Kiloskar SCT 300/77 Wartburg Pipeline Wartburg Reservoir 23.5 123 39
Upper Mgeni Dingle Pump No 1 KSB Omega 300-700B Dalton Pipeline Dalton Reservoir 178 271 22.89
Upper Mgeni Dingle Pump No 2 KSB Omega 300-700B Dalton Pipeline Dalton Reservoir 178 271 22.89
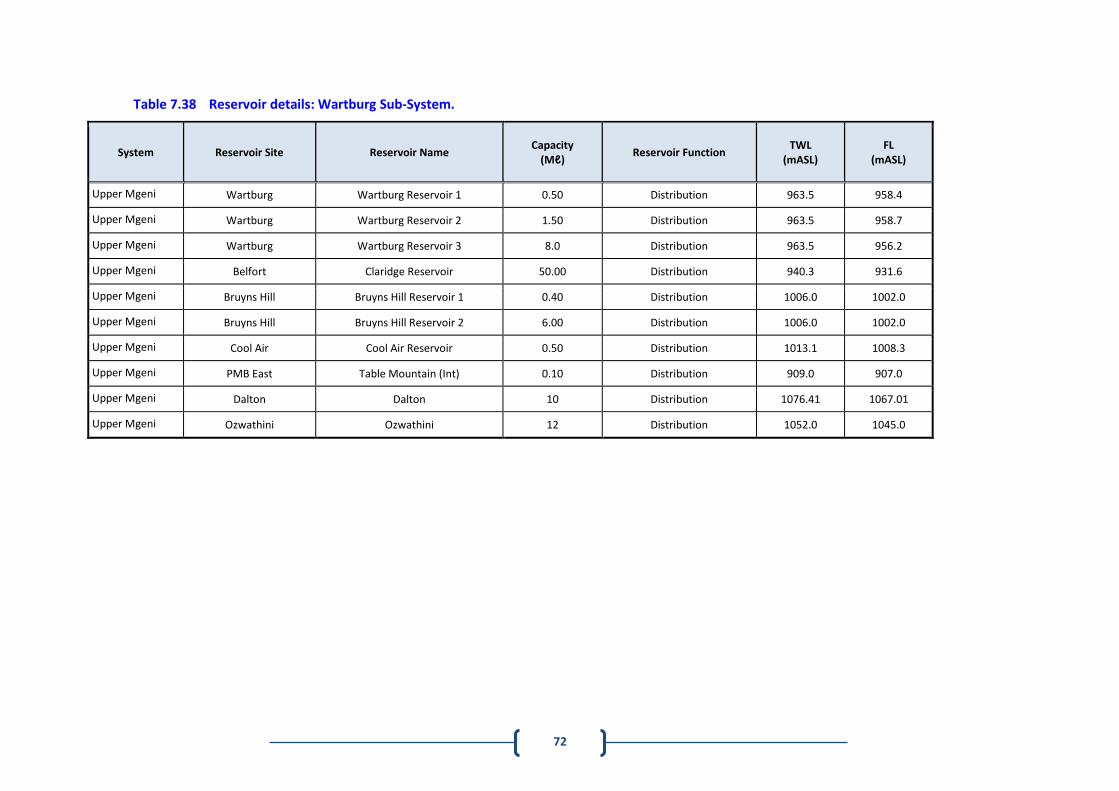
72
Table 7.38 Reservoir details: Wartburg Sub-System.
System Reservoir Site Reservoir Name Capacity
(Mℓ) Reservoir Function
TWL (mASL)
FL (mASL)
Upper Mgeni Wartburg Wartburg Reservoir 1 0.50 Distribution 963.5 958.4
Upper Mgeni Wartburg Wartburg Reservoir 2 1.50 Distribution 963.5 958.7
Upper Mgeni Wartburg Wartburg Reservoir 3 8.0 Distribution 963.5 956.2
Upper Mgeni Belfort Claridge Reservoir 50.00 Distribution 940.3 931.6
Upper Mgeni Bruyns Hill Bruyns Hill Reservoir 1 0.40 Distribution 1006.0 1002.0
Upper Mgeni Bruyns Hill Bruyns Hill Reservoir 2 6.00 Distribution 1006.0 1002.0
Upper Mgeni Cool Air Cool Air Reservoir 0.50 Distribution 1013.1 1008.3
Upper Mgeni PMB East Table Mountain (Int) 0.10 Distribution 909.0 907.0
Upper Mgeni Dalton Dalton 10 Distribution 1076.41 1067.01
Upper Mgeni Ozwathini Ozwathini 12 Distribution 1052.0 1045.0
73
(i) Lower Mgeni System
The Lower Mgeni System (Figure 7.5 and Figure 7.6) serves the greater eThekwini Municipal area from lower Pinetown/KwaDabeka in the west, to Phoenix/Inanda/Verulam in the north, to the Durban seaboard in the east and to Amanzimtoti/KwaMakuta in the south. It also provides water to the northern coastal areas of Ugu District Municipality. The system derives its water resources from the uMngeni River, being fed from Nagle and Inanda Dams, which are supported by Albert Falls Dam, Midmar Dam and the MMTS. Water is treated at Umgeni Water’s Durban Heights WTP (Table 7.39) located in Westville, Wiggins WTP (Table 7.45) located in Cato Manor and Maphephethwa WTP (Table 7.50) located in the Inanda Dam area. Umgeni Water sells water to eThekwini Municipality “at the fence” of these WTPs and thus does not own nor operate the bulk distribution pipelines downstream of these WTPs. However, operational and infrastructure changes within the eThekwini Municipality’s system, which is served by these WTPs, have a profound influence on the WTPs operational and infrastructure requirements. Continuous effort (Umgeni Water in collaboration with eThekwini Municipality) has gone into optimising the overall efficiency of the distribution system to share the load better between the two large WTPs. One example of these initiatives has involved the transfer of demand from areas previously supplied from Durban Heights WTP onto Wiggins WTP. This demand transfer commenced in January 2005 and involved the transfer of 40 - 60 Mℓ/day onto Wiggins WTP. Durban Heights WTP has a rated capacity of 615 Mℓ/day. The primary raw water source for the WTP is Nagle Dam, which has limited storage and is in turn supplied from Albert Falls Dam located on the uMngeni River. Raw water is conveyed from Nagle Dam to Durban Heights WTP via two systems comprising a series of siphons and gravity tunnels. System 1, Nagle Aqueducts 1 and 2, comprises 11 tunnels (14.57 km) which are inter-connected by siphons (29.7 km) with a capacity of 260 Mℓ/day. System 2, Nagle Aqueducts 3 and 4 comprises 6 tunnels (21.3 km) which are inter-connected by siphons (15.4 km) with a capacity of 440 Mℓ/day. Durban Heights WTP is primarily gravity-fed with raw water from Nagle Dam via Aqueducts 1 to 4 as shown in Figure 7.37 and detailed in Table 7.40, Table 7.41 and Table 7.42. Aqueducts 1 to 4 have a total design capacity of 700 Mℓ/day at a total head of 404 metres above sea level (mASL), which is the top water level (TWL) of Nagle Dam.
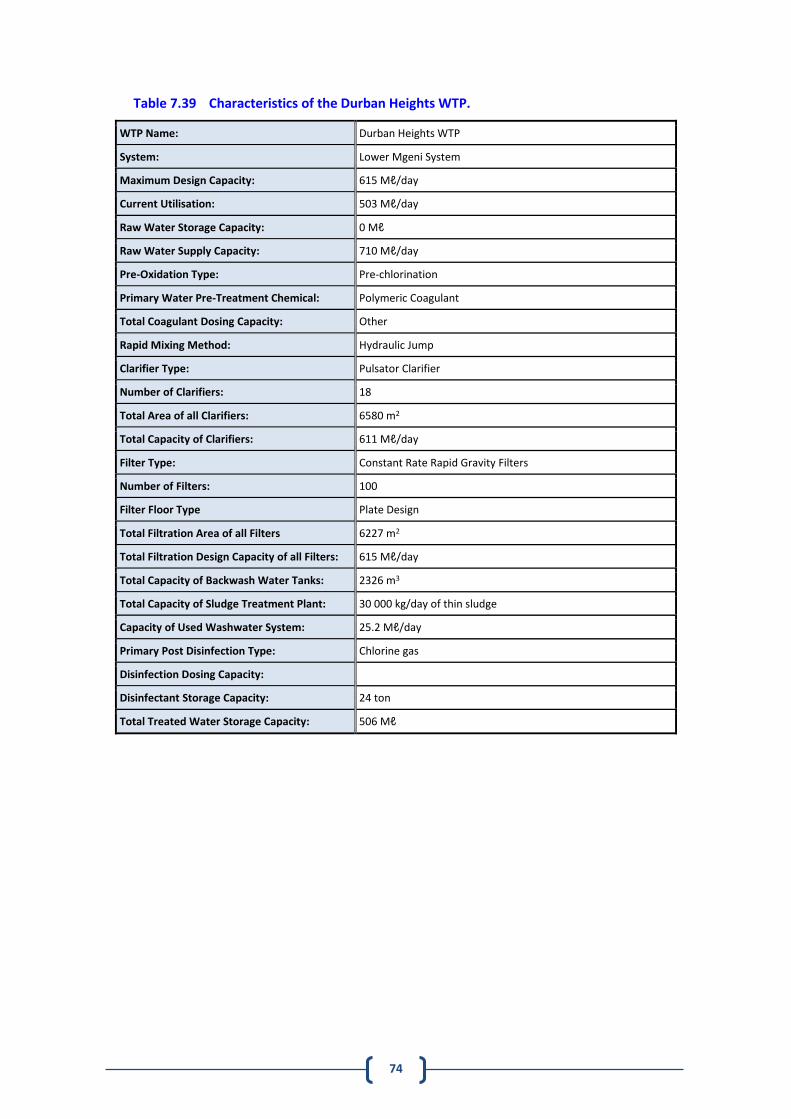
74
Table 7.39 Characteristics of the Durban Heights WTP.
WTP Name: Durban Heights WTP
System: Lower Mgeni System
Maximum Design Capacity: 615 Mℓ/day
Current Utilisation: 503 Mℓ/day
Raw Water Storage Capacity: 0 Mℓ
Raw Water Supply Capacity: 710 Mℓ/day
Pre-Oxidation Type: Pre-chlorination
Primary Water Pre-Treatment Chemical: Polymeric Coagulant
Total Coagulant Dosing Capacity: Other
Rapid Mixing Method: Hydraulic Jump
Clarifier Type: Pulsator Clarifier
Number of Clarifiers: 18
Total Area of all Clarifiers: 6580 m2
Total Capacity of Clarifiers: 611 Mℓ/day
Filter Type: Constant Rate Rapid Gravity Filters
Number of Filters: 100
Filter Floor Type Plate Design
Total Filtration Area of all Filters 6227 m2
Total Filtration Design Capacity of all Filters: 615 Mℓ/day
Total Capacity of Backwash Water Tanks: 2326 m3
Total Capacity of Sludge Treatment Plant: 30 000 kg/day of thin sludge
Capacity of Used Washwater System: 25.2 Mℓ/day
Primary Post Disinfection Type: Chlorine gas
Disinfection Dosing Capacity:
Disinfectant Storage Capacity: 24 ton
Total Treated Water Storage Capacity: 506 Mℓ
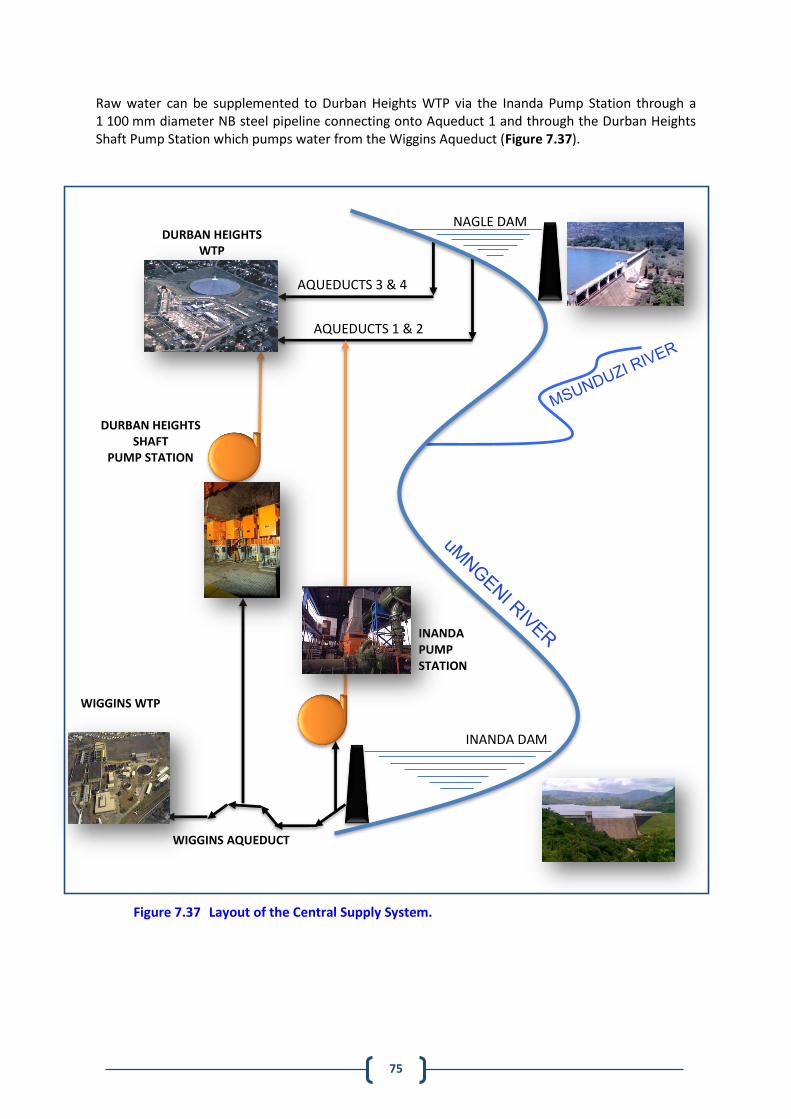
75
Raw water can be supplemented to Durban Heights WTP via the Inanda Pump Station through a 1 100 mm diameter NB steel pipeline connecting onto Aqueduct 1 and through the Durban Heights Shaft Pump Station which pumps water from the Wiggins Aqueduct (Figure 7.37).
Figure 7.37 Layout of the Central Supply System.
INANDA DAM
DURBAN HEIGHTS WTP
INANDA PUMP STATION
WIGGINS AQUEDUCT
AQUEDUCTS 3 & 4
DURBAN HEIGHTS SHAFT
PUMP STATION
WIGGINS WTP
AQUEDUCTS 1 & 2
NAGLE DAM
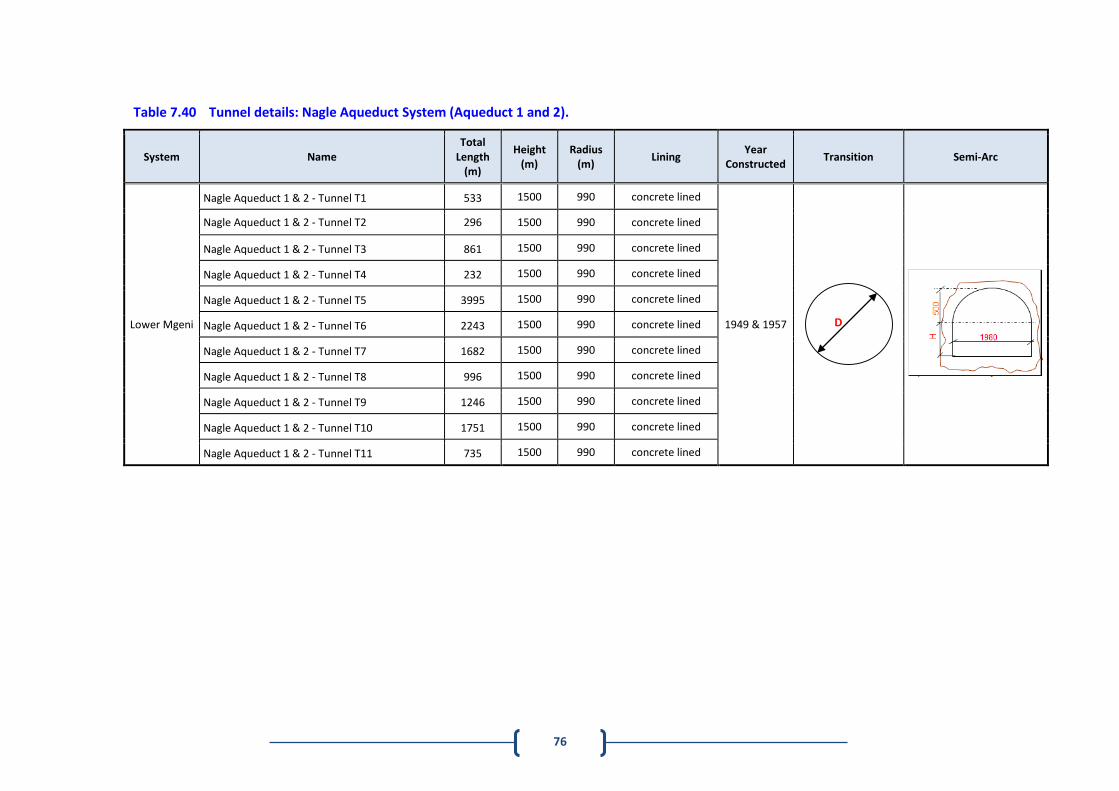
76
Table 7.40 Tunnel details: Nagle Aqueduct System (Aqueduct 1 and 2).
System Name Total
Length (m)
Height (m)
Radius (m)
Lining Year
Constructed Transition Semi-Arc
Lower Mgeni
Nagle Aqueduct 1 & 2 - Tunnel T1 533 1500 990 concrete lined
1949 & 1957
Nagle Aqueduct 1 & 2 - Tunnel T2 296 1500 990 concrete lined
Nagle Aqueduct 1 & 2 - Tunnel T3 861 1500 990 concrete lined
Nagle Aqueduct 1 & 2 - Tunnel T4 232 1500 990 concrete lined
Nagle Aqueduct 1 & 2 - Tunnel T5 3995 1500 990 concrete lined
Nagle Aqueduct 1 & 2 - Tunnel T6 2243 1500 990 concrete lined
Nagle Aqueduct 1 & 2 - Tunnel T7 1682 1500 990 concrete lined
Nagle Aqueduct 1 & 2 - Tunnel T8 996 1500 990 concrete lined
Nagle Aqueduct 1 & 2 - Tunnel T9 1246 1500 990 concrete lined
Nagle Aqueduct 1 & 2 - Tunnel T10 1751 1500 990 concrete lined
Nagle Aqueduct 1 & 2 - Tunnel T11 735 1500 990 concrete lined
D
R
H
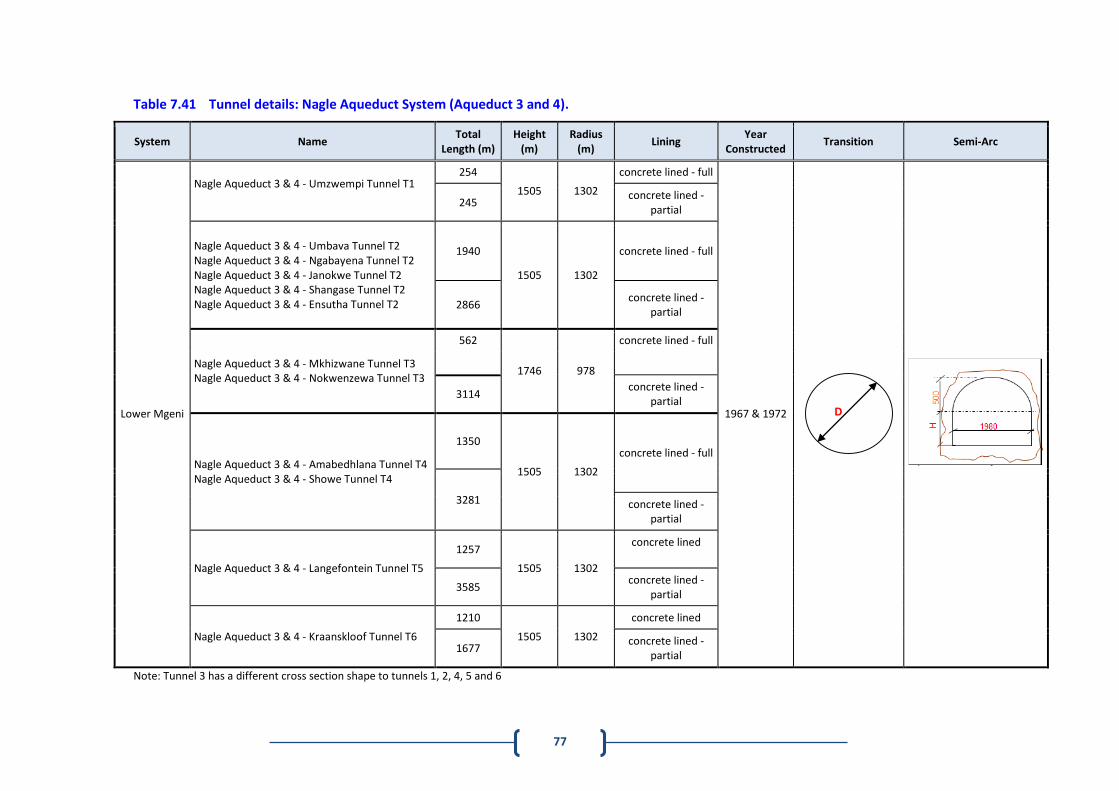
77
Table 7.41 Tunnel details: Nagle Aqueduct System (Aqueduct 3 and 4).
System Name Total
Length (m) Height
(m) Radius
(m) Lining
Year Constructed
Transition Semi-Arc
Lower Mgeni
Nagle Aqueduct 3 & 4 - Umzwempi Tunnel T1
254
1505 1302
concrete lined - full
1967 & 1972
245 concrete lined -
partial
Nagle Aqueduct 3 & 4 - Umbava Tunnel T2 Nagle Aqueduct 3 & 4 - Ngabayena Tunnel T2 Nagle Aqueduct 3 & 4 - Janokwe Tunnel T2 Nagle Aqueduct 3 & 4 - Shangase Tunnel T2 Nagle Aqueduct 3 & 4 - Ensutha Tunnel T2
1940
1505 1302
concrete lined - full
2866 concrete lined -
partial
Nagle Aqueduct 3 & 4 - Mkhizwane Tunnel T3 Nagle Aqueduct 3 & 4 - Nokwenzewa Tunnel T3
562
1746 978
concrete lined - full
3114 concrete lined -
partial
Nagle Aqueduct 3 & 4 - Amabedhlana Tunnel T4 Nagle Aqueduct 3 & 4 - Showe Tunnel T4
1350
1505 1302
concrete lined - full
3281 concrete lined - partial
Nagle Aqueduct 3 & 4 - Langefontein Tunnel T5
1257
1505 1302
concrete lined
3585 concrete lined -
partial
Nagle Aqueduct 3 & 4 - Kraanskloof Tunnel T6
1210
1505 1302
concrete lined
1677 concrete lined -
partial
Note: Tunnel 3 has a different cross section shape to tunnels 1, 2, 4, 5 and 6
D
R
H
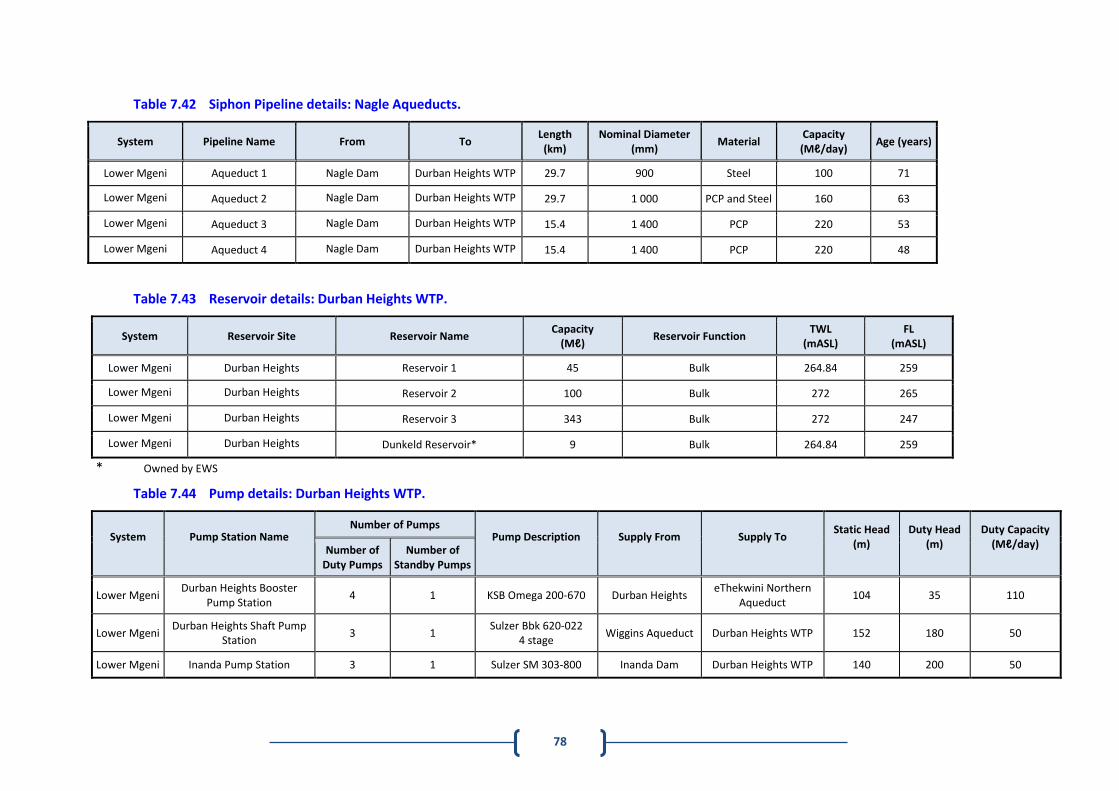
78
Table 7.42 Siphon Pipeline details: Nagle Aqueducts.
System Pipeline Name From To Length
(km) Nominal Diameter
(mm) Material
Capacity (Mℓ/day)
Age (years)
Lower Mgeni Aqueduct 1 Nagle Dam Durban Heights WTP 29.7 900 Steel 100 71
Lower Mgeni Aqueduct 2 Nagle Dam Durban Heights WTP 29.7 1 000 PCP and Steel 160 63
Lower Mgeni Aqueduct 3 Nagle Dam Durban Heights WTP 15.4 1 400 PCP 220 53
Lower Mgeni Aqueduct 4 Nagle Dam Durban Heights WTP 15.4 1 400 PCP 220 48
Table 7.43 Reservoir details: Durban Heights WTP.
System Reservoir Site Reservoir Name Capacity
(Mℓ) Reservoir Function
TWL (mASL)
FL (mASL)
Lower Mgeni Durban Heights Reservoir 1 45 Bulk 264.84 259
Lower Mgeni Durban Heights Reservoir 2 100 Bulk 272 265
Lower Mgeni Durban Heights Reservoir 3 343 Bulk 272 247
Lower Mgeni Durban Heights Dunkeld Reservoir* 9 Bulk 264.84 259
* Owned by EWS
Table 7.44 Pump details: Durban Heights WTP.
System
Pump Station Name
Number of Pumps Pump Description
Supply From
Supply To
Static Head (m)
Duty Head (m)
Duty Capacity (Mℓ/day)
Number of
Duty Pumps Number of
Standby Pumps
Lower Mgeni Durban Heights Booster
Pump Station 4 1 KSB Omega 200-670 Durban Heights
eThekwini Northern Aqueduct
104 35 110
Lower Mgeni Durban Heights Shaft Pump
Station 3 1
Sulzer Bbk 620-022 4 stage
Wiggins Aqueduct Durban Heights WTP 152 180 50
Lower Mgeni Inanda Pump Station 3 1 Sulzer SM 303-800 Inanda Dam Durban Heights WTP 140 200 50
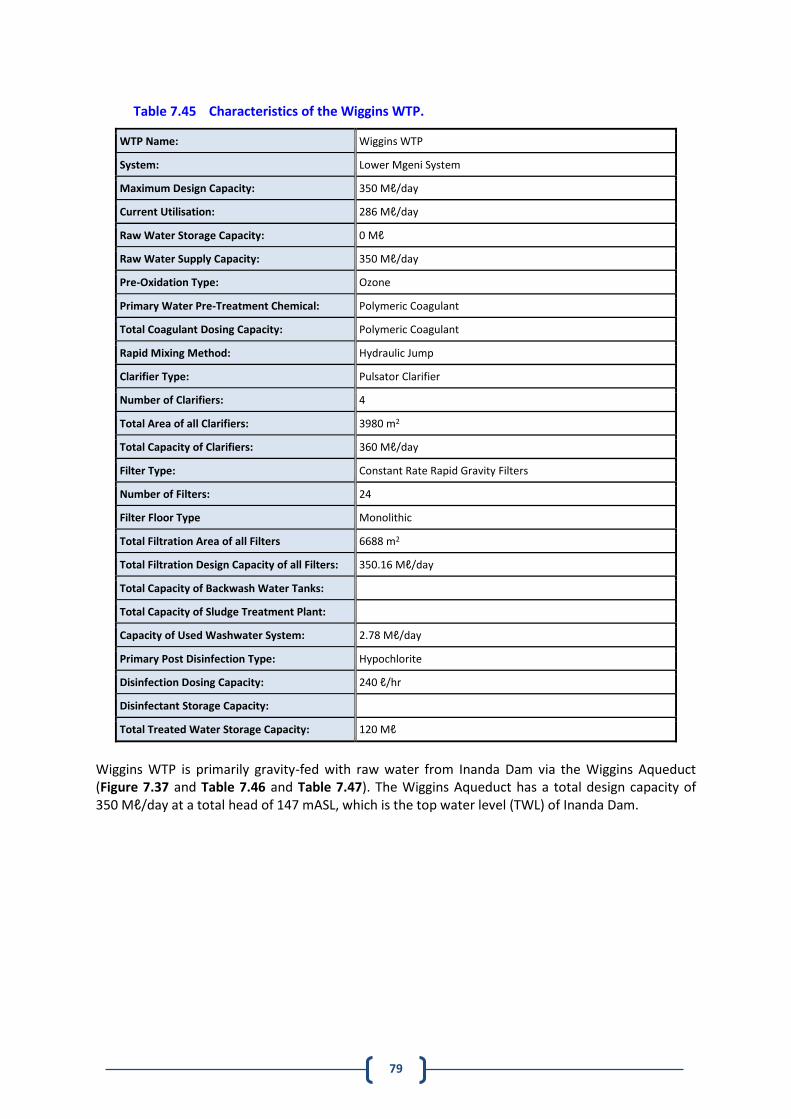
79
Table 7.45 Characteristics of the Wiggins WTP.
WTP Name: Wiggins WTP
System: Lower Mgeni System
Maximum Design Capacity: 350 Mℓ/day
Current Utilisation: 286 Mℓ/day
Raw Water Storage Capacity: 0 Mℓ
Raw Water Supply Capacity: 350 Mℓ/day
Pre-Oxidation Type: Ozone
Primary Water Pre-Treatment Chemical: Polymeric Coagulant
Total Coagulant Dosing Capacity: Polymeric Coagulant
Rapid Mixing Method: Hydraulic Jump
Clarifier Type: Pulsator Clarifier
Number of Clarifiers: 4
Total Area of all Clarifiers: 3980 m2
Total Capacity of Clarifiers: 360 Mℓ/day
Filter Type: Constant Rate Rapid Gravity Filters
Number of Filters: 24
Filter Floor Type Monolithic
Total Filtration Area of all Filters 6688 m2
Total Filtration Design Capacity of all Filters: 350.16 Mℓ/day
Total Capacity of Backwash Water Tanks:
Total Capacity of Sludge Treatment Plant:
Capacity of Used Washwater System: 2.78 Mℓ/day
Primary Post Disinfection Type: Hypochlorite
Disinfection Dosing Capacity: 240 ℓ/hr
Disinfectant Storage Capacity:
Total Treated Water Storage Capacity: 120 Mℓ
Wiggins WTP is primarily gravity-fed with raw water from Inanda Dam via the Wiggins Aqueduct (Figure 7.37 and Table 7.46 and Table 7.47). The Wiggins Aqueduct has a total design capacity of 350 Mℓ/day at a total head of 147 mASL, which is the top water level (TWL) of Inanda Dam.
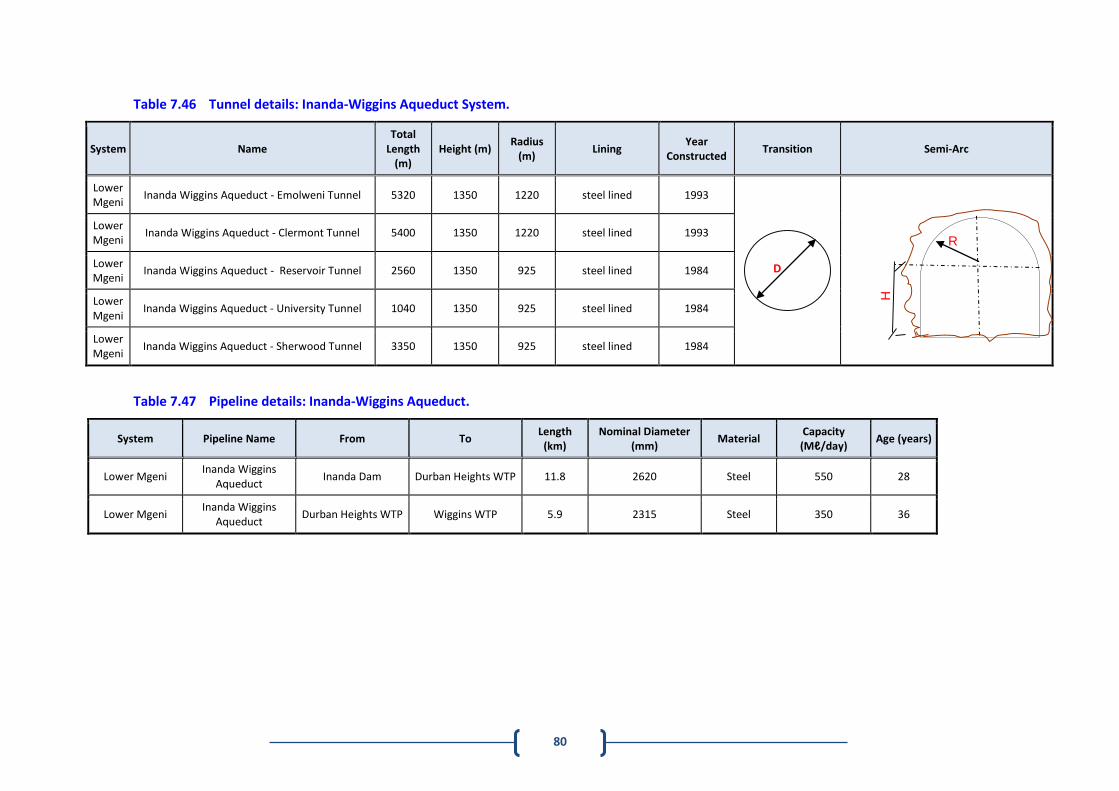
80
Table 7.46 Tunnel details: Inanda-Wiggins Aqueduct System.
System Name Total
Length (m)
Height (m) Radius
(m) Lining
Year Constructed
Transition Semi-Arc
Lower Mgeni
Inanda Wiggins Aqueduct - Emolweni Tunnel 5320 1350 1220 steel lined 1993
Lower Mgeni
Inanda Wiggins Aqueduct - Clermont Tunnel 5400 1350 1220 steel lined 1993
Lower Mgeni
Inanda Wiggins Aqueduct - Reservoir Tunnel 2560 1350 925 steel lined 1984
Lower Mgeni
Inanda Wiggins Aqueduct - University Tunnel 1040 1350 925 steel lined 1984
Lower Mgeni
Inanda Wiggins Aqueduct - Sherwood Tunnel 3350 1350 925 steel lined 1984
Table 7.47 Pipeline details: Inanda-Wiggins Aqueduct.
System Pipeline Name From To Length
(km) Nominal Diameter
(mm) Material
Capacity (Mℓ/day)
Age (years)
Lower Mgeni Inanda Wiggins
Aqueduct Inanda Dam Durban Heights WTP 11.8 2620 Steel 550 28
Lower Mgeni Inanda Wiggins
Aqueduct Durban Heights WTP Wiggins WTP 5.9 2315 Steel 350 36
D
R
H
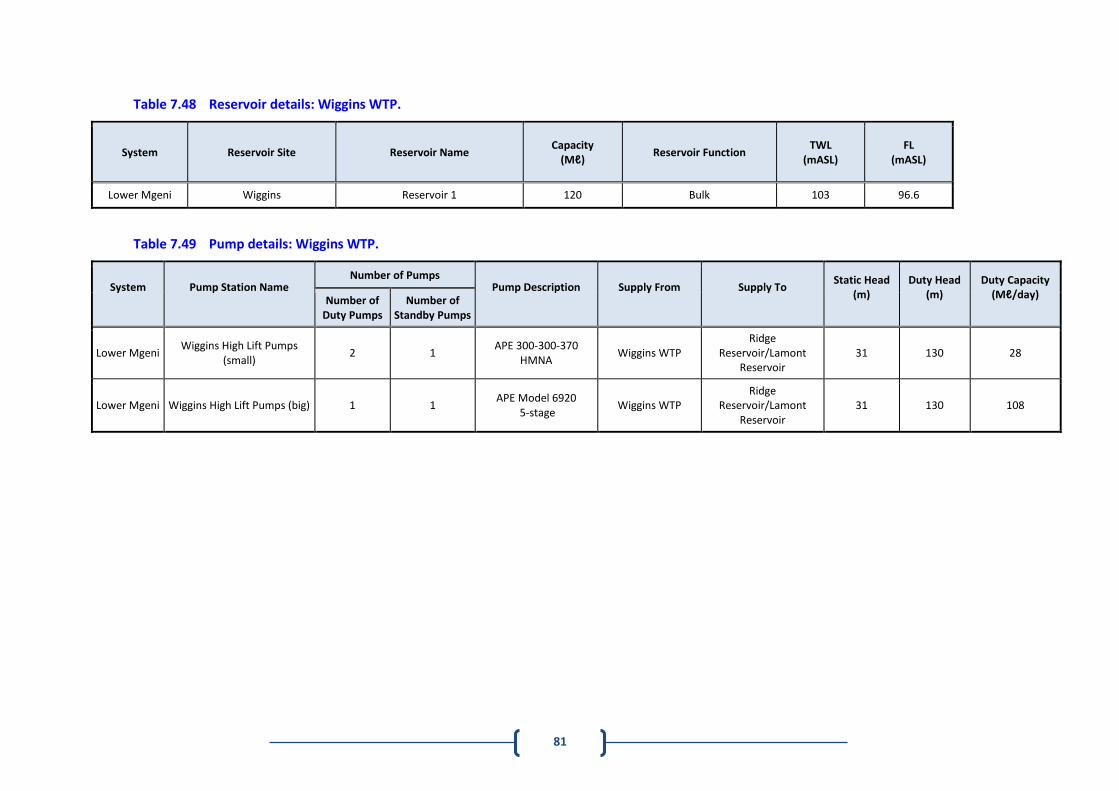
81
Table 7.48 Reservoir details: Wiggins WTP.
System Reservoir Site Reservoir Name Capacity
(Mℓ) Reservoir Function
TWL (mASL)
FL (mASL)
Lower Mgeni Wiggins Reservoir 1 120 Bulk 103 96.6
Table 7.49 Pump details: Wiggins WTP.
System
Pump Station Name
Number of Pumps Pump Description
Supply From
Supply To
Static Head (m)
Duty Head (m)
Duty Capacity (Mℓ/day)
Number of
Duty Pumps Number of
Standby Pumps
Lower Mgeni Wiggins High Lift Pumps
(small) 2 1
APE 300-300-370 HMNA
Wiggins WTP Ridge
Reservoir/Lamont Reservoir
31 130 28
Lower Mgeni Wiggins High Lift Pumps (big) 1 1 APE Model 6920
5-stage Wiggins WTP
Ridge Reservoir/Lamont
Reservoir 31 130 108
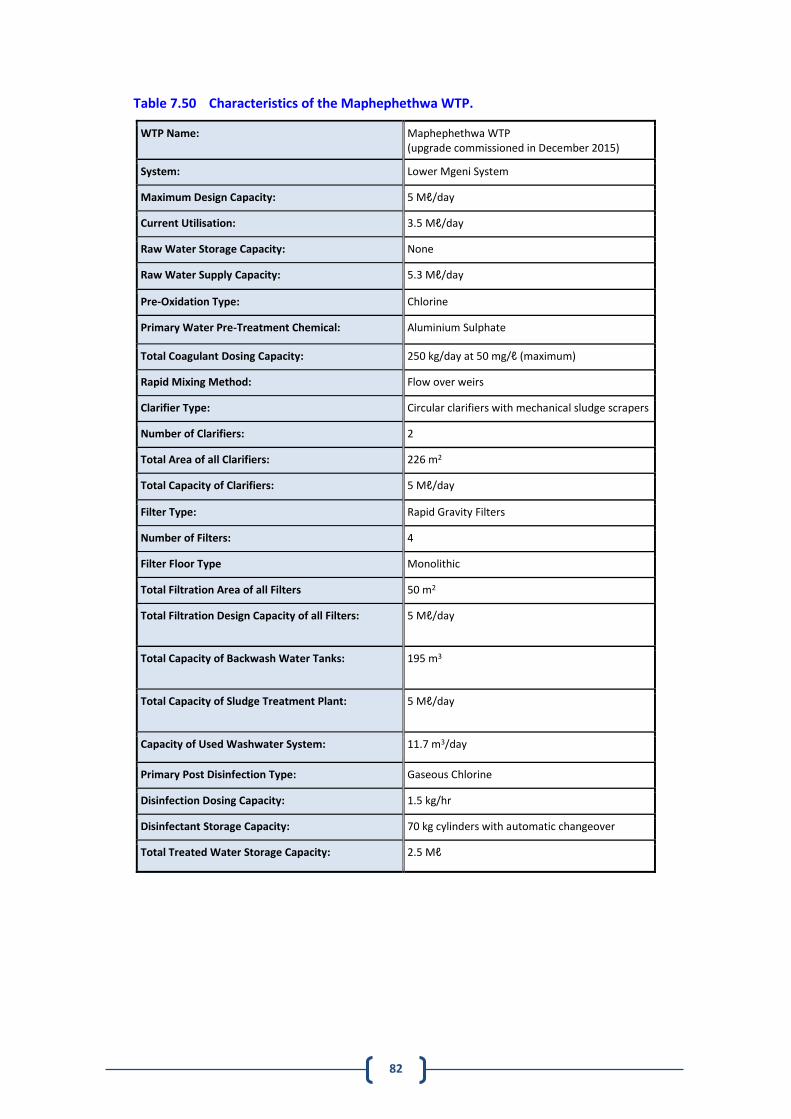
82
Table 7.50 Characteristics of the Maphephethwa WTP.
WTP Name: Maphephethwa WTP (upgrade commissioned in December 2015)
System: Lower Mgeni System
Maximum Design Capacity: 5 Mℓ/day
Current Utilisation: 3.5 Mℓ/day
Raw Water Storage Capacity: None
Raw Water Supply Capacity: 5.3 Mℓ/day
Pre-Oxidation Type: Chlorine
Primary Water Pre-Treatment Chemical: Aluminium Sulphate
Total Coagulant Dosing Capacity: 250 kg/day at 50 mg/ℓ (maximum)
Rapid Mixing Method: Flow over weirs
Clarifier Type: Circular clarifiers with mechanical sludge scrapers
Number of Clarifiers: 2
Total Area of all Clarifiers: 226 m2
Total Capacity of Clarifiers: 5 Mℓ/day
Filter Type: Rapid Gravity Filters
Number of Filters: 4
Filter Floor Type Monolithic
Total Filtration Area of all Filters 50 m2
Total Filtration Design Capacity of all Filters: 5 Mℓ/day
Total Capacity of Backwash Water Tanks: 195 m3
Total Capacity of Sludge Treatment Plant: 5 Mℓ/day
Capacity of Used Washwater System: 11.7 m3/day
Primary Post Disinfection Type: Gaseous Chlorine
Disinfection Dosing Capacity: 1.5 kg/hr
Disinfectant Storage Capacity: 70 kg cylinders with automatic changeover
Total Treated Water Storage Capacity: 2.5 Mℓ
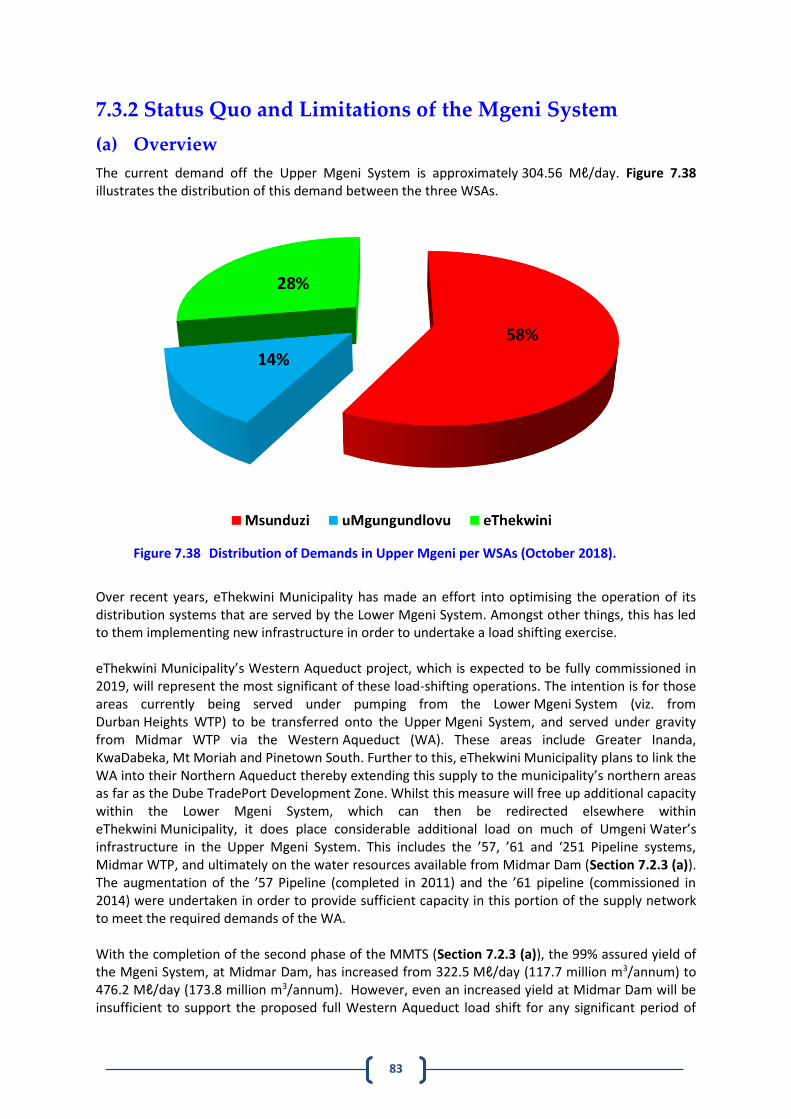
83
7.3.2 Status Quo and Limitations of the Mgeni System
(a) Overview
The current demand off the Upper Mgeni System is approximately 304.56 Mℓ/day. Figure 7.38 illustrates the distribution of this demand between the three WSAs.
Figure 7.38 Distribution of Demands in Upper Mgeni per WSAs (October 2018).
Over recent years, eThekwini Municipality has made an effort into optimising the operation of its distribution systems that are served by the Lower Mgeni System. Amongst other things, this has led to them implementing new infrastructure in order to undertake a load shifting exercise. eThekwini Municipality’s Western Aqueduct project, which is expected to be fully commissioned in 2019, will represent the most significant of these load-shifting operations. The intention is for those areas currently being served under pumping from the Lower Mgeni System (viz. from Durban Heights WTP) to be transferred onto the Upper Mgeni System, and served under gravity from Midmar WTP via the Western Aqueduct (WA). These areas include Greater Inanda, KwaDabeka, Mt Moriah and Pinetown South. Further to this, eThekwini Municipality plans to link the WA into their Northern Aqueduct thereby extending this supply to the municipality’s northern areas as far as the Dube TradePort Development Zone. Whilst this measure will free up additional capacity within the Lower Mgeni System, which can then be redirected elsewhere within eThekwini Municipality, it does place considerable additional load on much of Umgeni Water’s infrastructure in the Upper Mgeni System. This includes the ’57, ’61 and ‘251 Pipeline systems, Midmar WTP, and ultimately on the water resources available from Midmar Dam (Section 7.2.3 (a)). The augmentation of the ’57 Pipeline (completed in 2011) and the ’61 pipeline (commissioned in 2014) were undertaken in order to provide sufficient capacity in this portion of the supply network to meet the required demands of the WA. With the completion of the second phase of the MMTS (Section 7.2.3 (a)), the 99% assured yield of the Mgeni System, at Midmar Dam, has increased from 322.5 Mℓ/day (117.7 million m3/annum) to 476.2 Mℓ/day (173.8 million m3/annum). However, even an increased yield at Midmar Dam will be insufficient to support the proposed full Western Aqueduct load shift for any significant period of
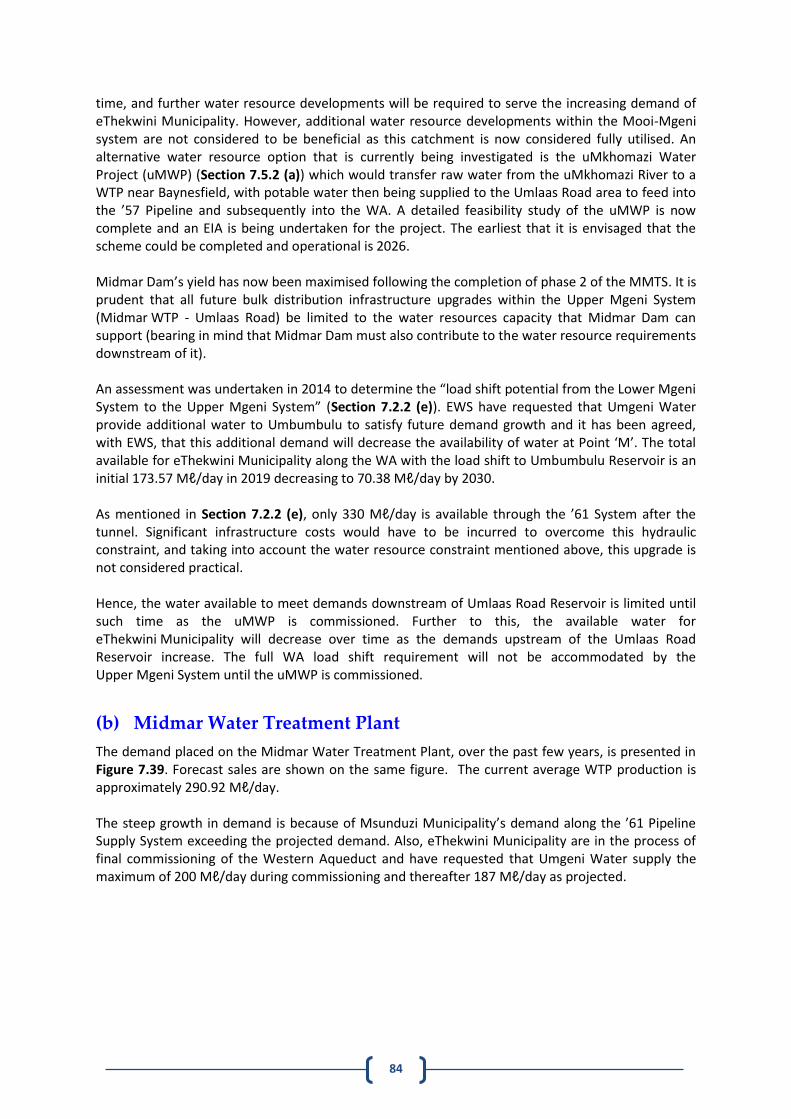
84
time, and further water resource developments will be required to serve the increasing demand of eThekwini Municipality. However, additional water resource developments within the Mooi-Mgeni system are not considered to be beneficial as this catchment is now considered fully utilised. An alternative water resource option that is currently being investigated is the uMkhomazi Water Project (uMWP) (Section 7.5.2 (a)) which would transfer raw water from the uMkhomazi River to a WTP near Baynesfield, with potable water then being supplied to the Umlaas Road area to feed into the ’57 Pipeline and subsequently into the WA. A detailed feasibility study of the uMWP is now complete and an EIA is being undertaken for the project. The earliest that it is envisaged that the scheme could be completed and operational is 2026. Midmar Dam’s yield has now been maximised following the completion of phase 2 of the MMTS. It is prudent that all future bulk distribution infrastructure upgrades within the Upper Mgeni System (Midmar WTP - Umlaas Road) be limited to the water resources capacity that Midmar Dam can support (bearing in mind that Midmar Dam must also contribute to the water resource requirements downstream of it). An assessment was undertaken in 2014 to determine the “load shift potential from the Lower Mgeni System to the Upper Mgeni System” (Section 7.2.2 (e)). EWS have requested that Umgeni Water provide additional water to Umbumbulu to satisfy future demand growth and it has been agreed, with EWS, that this additional demand will decrease the availability of water at Point ‘M’. The total available for eThekwini Municipality along the WA with the load shift to Umbumbulu Reservoir is an initial 173.57 Mℓ/day in 2019 decreasing to 70.38 Mℓ/day by 2030. As mentioned in Section 7.2.2 (e), only 330 Mℓ/day is available through the ’61 System after the tunnel. Significant infrastructure costs would have to be incurred to overcome this hydraulic constraint, and taking into account the water resource constraint mentioned above, this upgrade is not considered practical. Hence, the water available to meet demands downstream of Umlaas Road Reservoir is limited until such time as the uMWP is commissioned. Further to this, the available water for eThekwini Municipality will decrease over time as the demands upstream of the Umlaas Road Reservoir increase. The full WA load shift requirement will not be accommodated by the Upper Mgeni System until the uMWP is commissioned.
(b) Midmar Water Treatment Plant
The demand placed on the Midmar Water Treatment Plant, over the past few years, is presented in Figure 7.39. Forecast sales are shown on the same figure. The current average WTP production is approximately 290.92 Mℓ/day. The steep growth in demand is because of Msunduzi Municipality’s demand along the ’61 Pipeline Supply System exceeding the projected demand. Also, eThekwini Municipality are in the process of final commissioning of the Western Aqueduct and have requested that Umgeni Water supply the maximum of 200 Mℓ/day during commissioning and thereafter 187 Mℓ/day as projected.
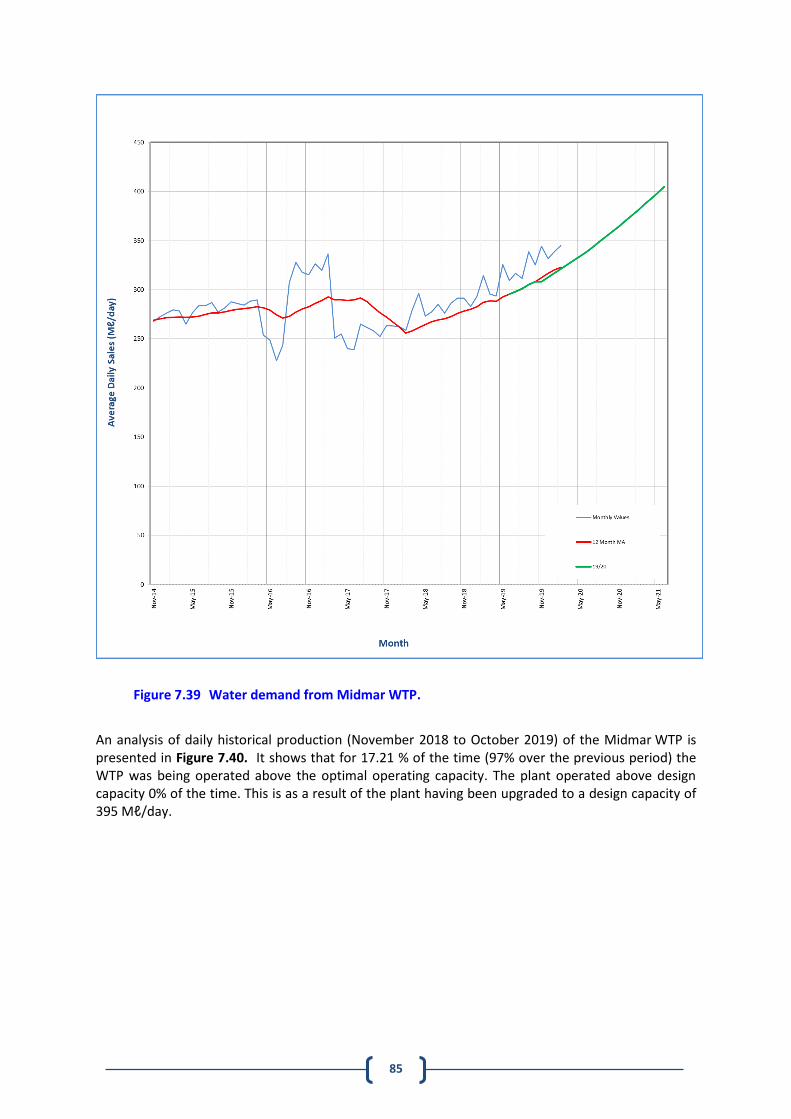
85
An analysis of daily historical production (November 2018 to October 2019) of the Midmar WTP is presented in Figure 7.40. It shows that for 17.21 % of the time (97% over the previous period) the WTP was being operated above the optimal operating capacity. The plant operated above design capacity 0% of the time. This is as a result of the plant having been upgraded to a design capacity of 395 Mℓ/day.
Figure 7.39 Water demand from Midmar WTP.
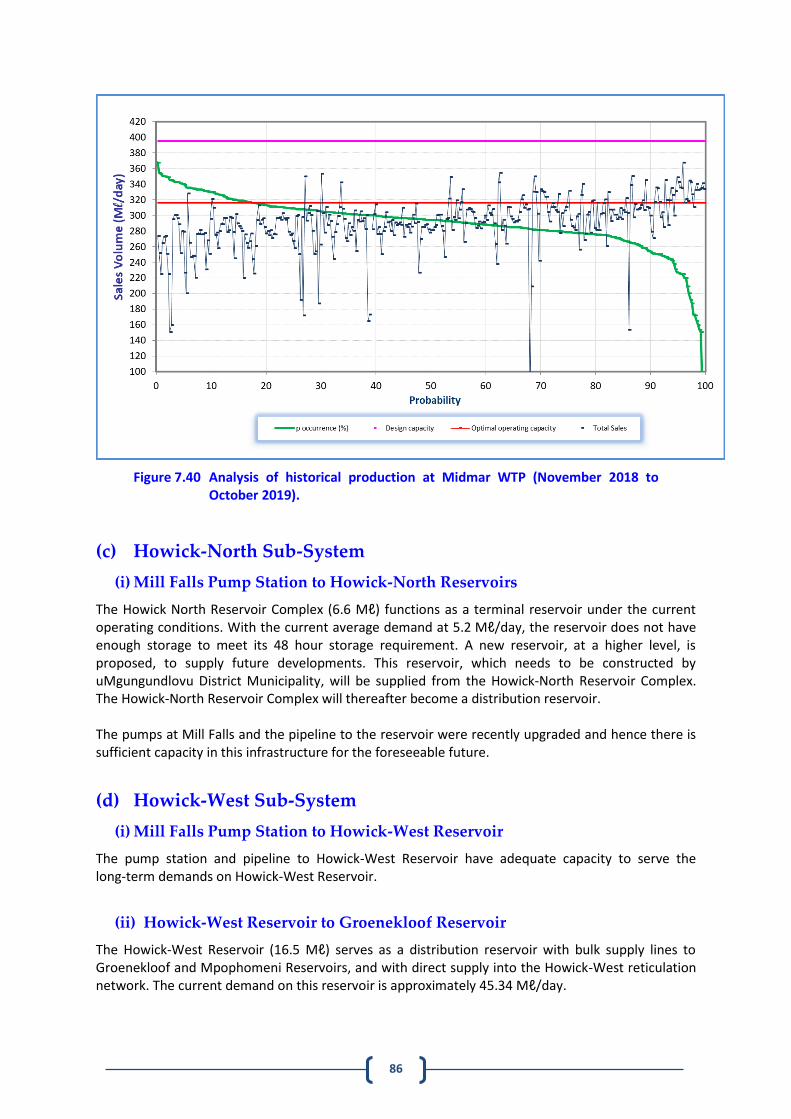
86
Figure 7.40 Analysis of historical production at Midmar WTP (November 2018 to October 2019).
(c) Howick-North Sub-System
(i) Mill Falls Pump Station to Howick-North Reservoirs
The Howick North Reservoir Complex (6.6 Mℓ) functions as a terminal reservoir under the current operating conditions. With the current average demand at 5.2 Mℓ/day, the reservoir does not have enough storage to meet its 48 hour storage requirement. A new reservoir, at a higher level, is proposed, to supply future developments. This reservoir, which needs to be constructed by uMgungundlovu District Municipality, will be supplied from the Howick-North Reservoir Complex. The Howick-North Reservoir Complex will thereafter become a distribution reservoir. The pumps at Mill Falls and the pipeline to the reservoir were recently upgraded and hence there is sufficient capacity in this infrastructure for the foreseeable future.
(d) Howick-West Sub-System
(i) Mill Falls Pump Station to Howick-West Reservoir
The pump station and pipeline to Howick-West Reservoir have adequate capacity to serve the long-term demands on Howick-West Reservoir.
(ii) Howick-West Reservoir to Groenekloof Reservoir
The Howick-West Reservoir (16.5 Mℓ) serves as a distribution reservoir with bulk supply lines to Groenekloof and Mpophomeni Reservoirs, and with direct supply into the Howick-West reticulation network. The current demand on this reservoir is approximately 45.34 Mℓ/day.
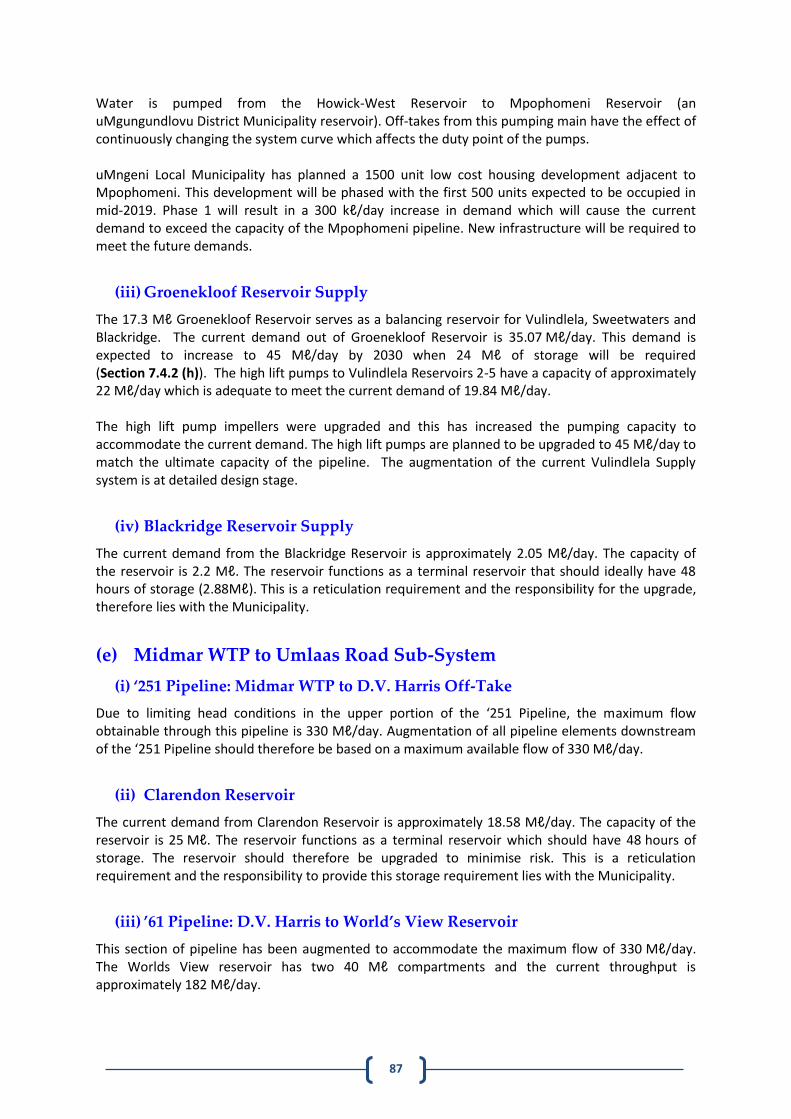
87
Water is pumped from the Howick-West Reservoir to Mpophomeni Reservoir (an uMgungundlovu District Municipality reservoir). Off-takes from this pumping main have the effect of continuously changing the system curve which affects the duty point of the pumps. uMngeni Local Municipality has planned a 1500 unit low cost housing development adjacent to Mpophomeni. This development will be phased with the first 500 units expected to be occupied in mid-2019. Phase 1 will result in a 300 kℓ/day increase in demand which will cause the current demand to exceed the capacity of the Mpophomeni pipeline. New infrastructure will be required to meet the future demands.
(iii) Groenekloof Reservoir Supply
The 17.3 Mℓ Groenekloof Reservoir serves as a balancing reservoir for Vulindlela, Sweetwaters and Blackridge. The current demand out of Groenekloof Reservoir is 35.07 Mℓ/day. This demand is expected to increase to 45 Mℓ/day by 2030 when 24 Mℓ of storage will be required (Section 7.4.2 (h)). The high lift pumps to Vulindlela Reservoirs 2-5 have a capacity of approximately 22 Mℓ/day which is adequate to meet the current demand of 19.84 Mℓ/day. The high lift pump impellers were upgraded and this has increased the pumping capacity to accommodate the current demand. The high lift pumps are planned to be upgraded to 45 Mℓ/day to match the ultimate capacity of the pipeline. The augmentation of the current Vulindlela Supply system is at detailed design stage.
(iv) Blackridge Reservoir Supply
The current demand from the Blackridge Reservoir is approximately 2.05 Mℓ/day. The capacity of the reservoir is 2.2 Mℓ. The reservoir functions as a terminal reservoir that should ideally have 48 hours of storage (2.88Mℓ). This is a reticulation requirement and the responsibility for the upgrade, therefore lies with the Municipality.
(e) Midmar WTP to Umlaas Road Sub-System
(i) ‘251 Pipeline: Midmar WTP to D.V. Harris Off-Take
Due to limiting head conditions in the upper portion of the ‘251 Pipeline, the maximum flow obtainable through this pipeline is 330 Mℓ/day. Augmentation of all pipeline elements downstream of the ‘251 Pipeline should therefore be based on a maximum available flow of 330 Mℓ/day.
(ii) Clarendon Reservoir
The current demand from Clarendon Reservoir is approximately 18.58 Mℓ/day. The capacity of the reservoir is 25 Mℓ. The reservoir functions as a terminal reservoir which should have 48 hours of storage. The reservoir should therefore be upgraded to minimise risk. This is a reticulation requirement and the responsibility to provide this storage requirement lies with the Municipality.
(iii) ’61 Pipeline: D.V. Harris to World’s View Reservoir
This section of pipeline has been augmented to accommodate the maximum flow of 330 Mℓ/day. The Worlds View reservoir has two 40 Mℓ compartments and the current throughput is approximately 182 Mℓ/day.
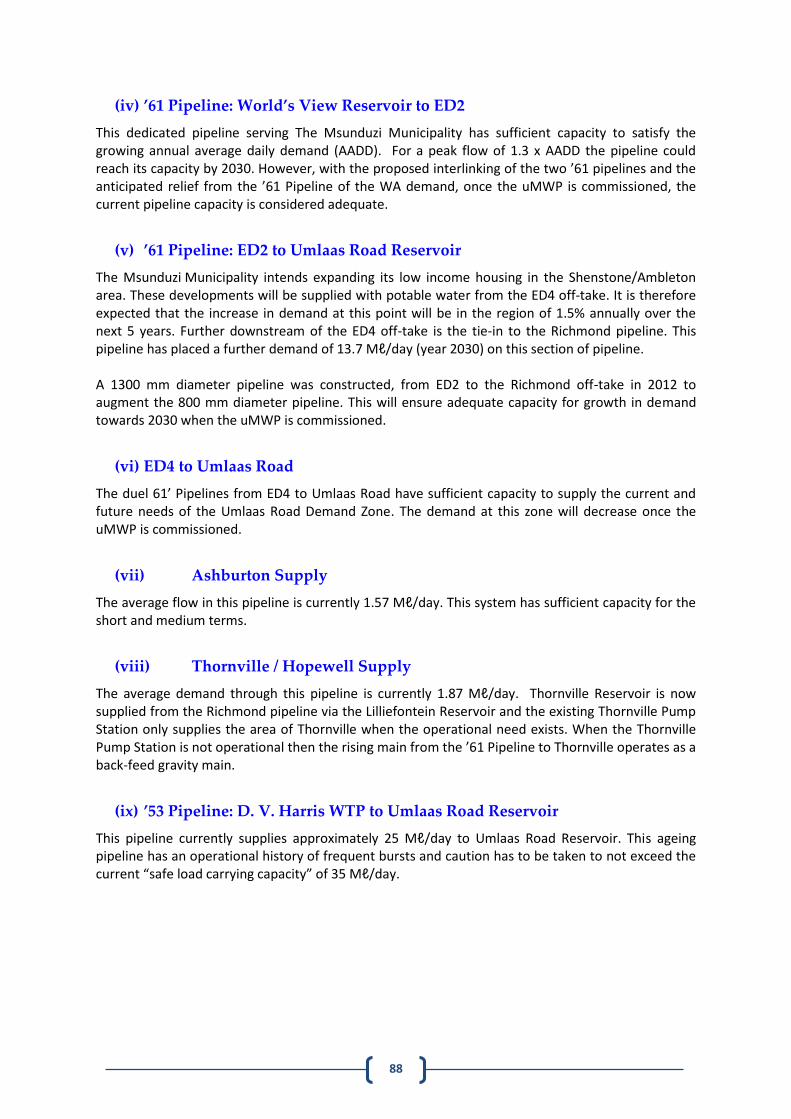
88
(iv) ’61 Pipeline: World’s View Reservoir to ED2
This dedicated pipeline serving The Msunduzi Municipality has sufficient capacity to satisfy the growing annual average daily demand (AADD). For a peak flow of 1.3 x AADD the pipeline could reach its capacity by 2030. However, with the proposed interlinking of the two ’61 pipelines and the anticipated relief from the ’61 Pipeline of the WA demand, once the uMWP is commissioned, the current pipeline capacity is considered adequate.
(v) ’61 Pipeline: ED2 to Umlaas Road Reservoir
The Msunduzi Municipality intends expanding its low income housing in the Shenstone/Ambleton area. These developments will be supplied with potable water from the ED4 off-take. It is therefore expected that the increase in demand at this point will be in the region of 1.5% annually over the next 5 years. Further downstream of the ED4 off-take is the tie-in to the Richmond pipeline. This pipeline has placed a further demand of 13.7 Mℓ/day (year 2030) on this section of pipeline. A 1300 mm diameter pipeline was constructed, from ED2 to the Richmond off-take in 2012 to augment the 800 mm diameter pipeline. This will ensure adequate capacity for growth in demand towards 2030 when the uMWP is commissioned.
(vi) ED4 to Umlaas Road
The duel 61’ Pipelines from ED4 to Umlaas Road have sufficient capacity to supply the current and future needs of the Umlaas Road Demand Zone. The demand at this zone will decrease once the uMWP is commissioned.
(vii) Ashburton Supply
The average flow in this pipeline is currently 1.57 Mℓ/day. This system has sufficient capacity for the short and medium terms.
(viii) Thornville / Hopewell Supply
The average demand through this pipeline is currently 1.87 Mℓ/day. Thornville Reservoir is now supplied from the Richmond pipeline via the Lilliefontein Reservoir and the existing Thornville Pump Station only supplies the area of Thornville when the operational need exists. When the Thornville Pump Station is not operational then the rising main from the ’61 Pipeline to Thornville operates as a back-feed gravity main.
(ix) ’53 Pipeline: D. V. Harris WTP to Umlaas Road Reservoir
This pipeline currently supplies approximately 25 Mℓ/day to Umlaas Road Reservoir. This ageing pipeline has an operational history of frequent bursts and caution has to be taken to not exceed the current “safe load carrying capacity” of 35 Mℓ/day.
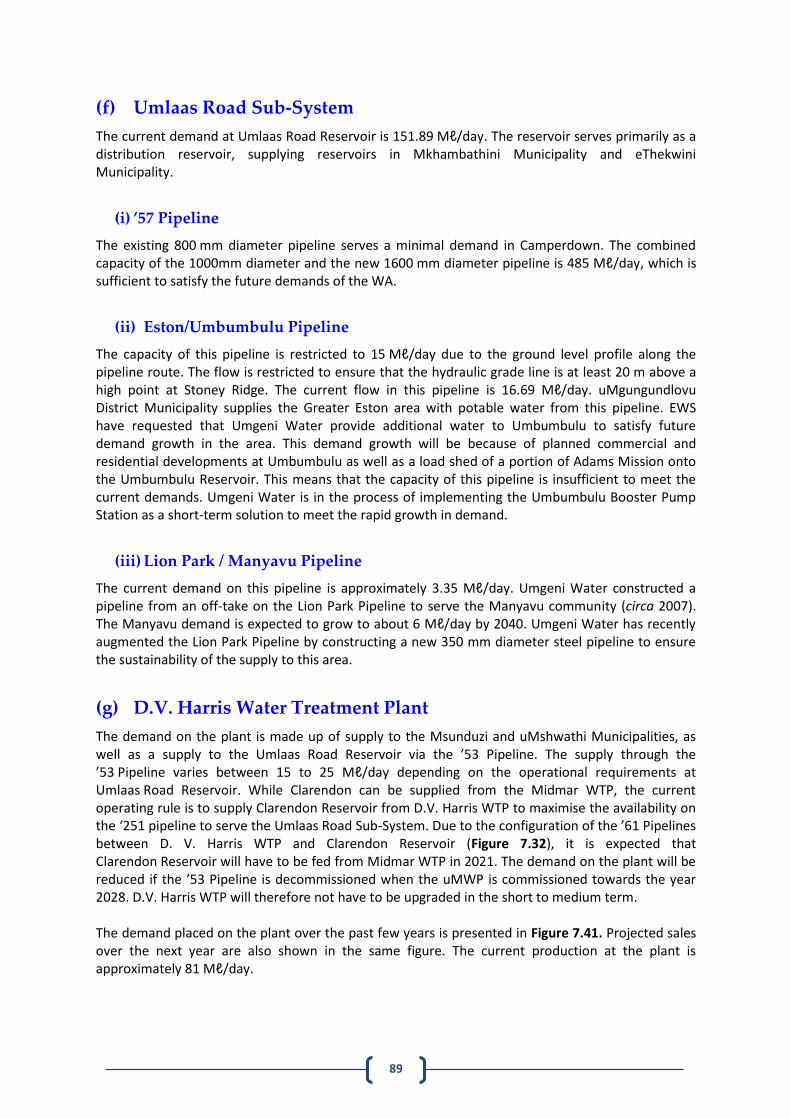
89
(f) Umlaas Road Sub-System
The current demand at Umlaas Road Reservoir is 151.89 Mℓ/day. The reservoir serves primarily as a distribution reservoir, supplying reservoirs in Mkhambathini Municipality and eThekwini Municipality.
(i) ’57 Pipeline
The existing 800 mm diameter pipeline serves a minimal demand in Camperdown. The combined capacity of the 1000mm diameter and the new 1600 mm diameter pipeline is 485 Mℓ/day, which is sufficient to satisfy the future demands of the WA.
(ii) Eston/Umbumbulu Pipeline
The capacity of this pipeline is restricted to 15 Mℓ/day due to the ground level profile along the pipeline route. The flow is restricted to ensure that the hydraulic grade line is at least 20 m above a high point at Stoney Ridge. The current flow in this pipeline is 16.69 Mℓ/day. uMgungundlovu District Municipality supplies the Greater Eston area with potable water from this pipeline. EWS have requested that Umgeni Water provide additional water to Umbumbulu to satisfy future demand growth in the area. This demand growth will be because of planned commercial and residential developments at Umbumbulu as well as a load shed of a portion of Adams Mission onto the Umbumbulu Reservoir. This means that the capacity of this pipeline is insufficient to meet the current demands. Umgeni Water is in the process of implementing the Umbumbulu Booster Pump Station as a short-term solution to meet the rapid growth in demand.
(iii) Lion Park / Manyavu Pipeline
The current demand on this pipeline is approximately 3.35 Mℓ/day. Umgeni Water constructed a pipeline from an off-take on the Lion Park Pipeline to serve the Manyavu community (circa 2007). The Manyavu demand is expected to grow to about 6 Mℓ/day by 2040. Umgeni Water has recently augmented the Lion Park Pipeline by constructing a new 350 mm diameter steel pipeline to ensure the sustainability of the supply to this area.
(g) D.V. Harris Water Treatment Plant
The demand on the plant is made up of supply to the Msunduzi and uMshwathi Municipalities, as well as a supply to the Umlaas Road Reservoir via the ’53 Pipeline. The supply through the ’53 Pipeline varies between 15 to 25 Mℓ/day depending on the operational requirements at Umlaas Road Reservoir. While Clarendon can be supplied from the Midmar WTP, the current operating rule is to supply Clarendon Reservoir from D.V. Harris WTP to maximise the availability on the ‘251 pipeline to serve the Umlaas Road Sub-System. Due to the configuration of the ’61 Pipelines between D. V. Harris WTP and Clarendon Reservoir (Figure 7.32), it is expected that Clarendon Reservoir will have to be fed from Midmar WTP in 2021. The demand on the plant will be reduced if the ’53 Pipeline is decommissioned when the uMWP is commissioned towards the year 2028. D.V. Harris WTP will therefore not have to be upgraded in the short to medium term. The demand placed on the plant over the past few years is presented in Figure 7.41. Projected sales over the next year are also shown in the same figure. The current production at the plant is approximately 81 Mℓ/day.
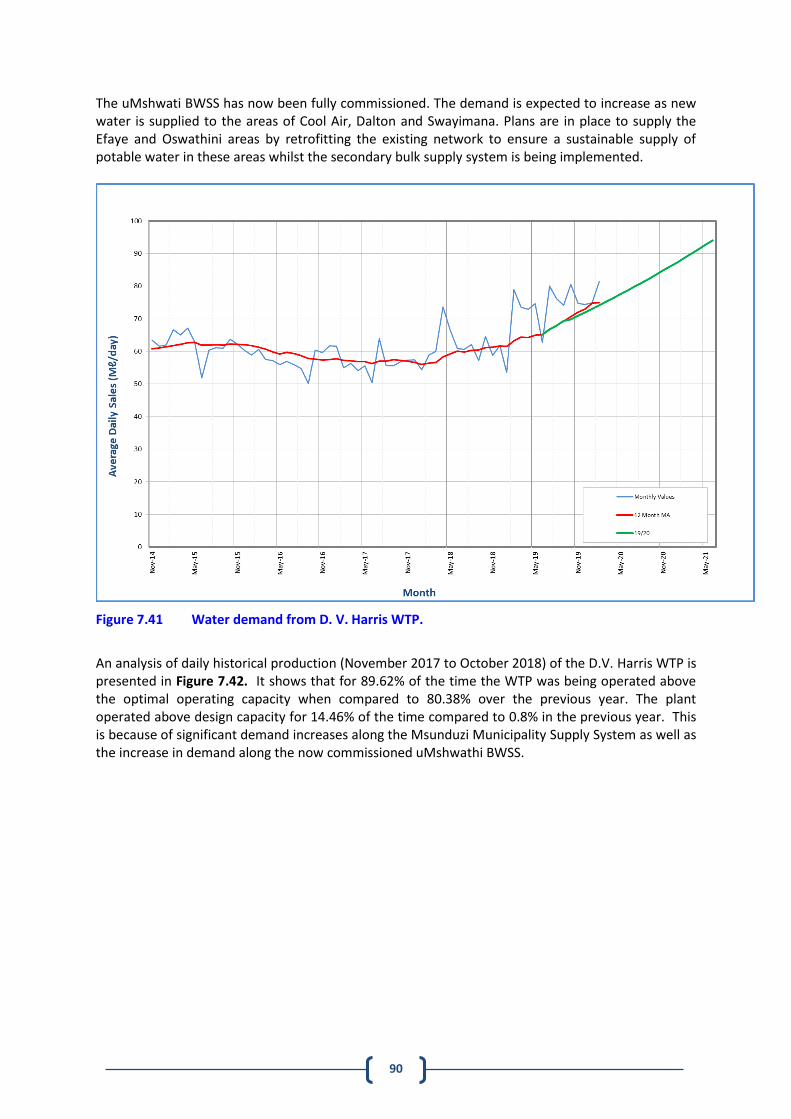
90
The uMshwati BWSS has now been fully commissioned. The demand is expected to increase as new water is supplied to the areas of Cool Air, Dalton and Swayimana. Plans are in place to supply the Efaye and Oswathini areas by retrofitting the existing network to ensure a sustainable supply of potable water in these areas whilst the secondary bulk supply system is being implemented.
Figure 7.41 Water demand from D. V. Harris WTP.
An analysis of daily historical production (November 2017 to October 2018) of the D.V. Harris WTP is presented in Figure 7.42. It shows that for 89.62% of the time the WTP was being operated above the optimal operating capacity when compared to 80.38% over the previous year. The plant operated above design capacity for 14.46% of the time compared to 0.8% in the previous year. This is because of significant demand increases along the Msunduzi Municipality Supply System as well as the increase in demand along the now commissioned uMshwathi BWSS.
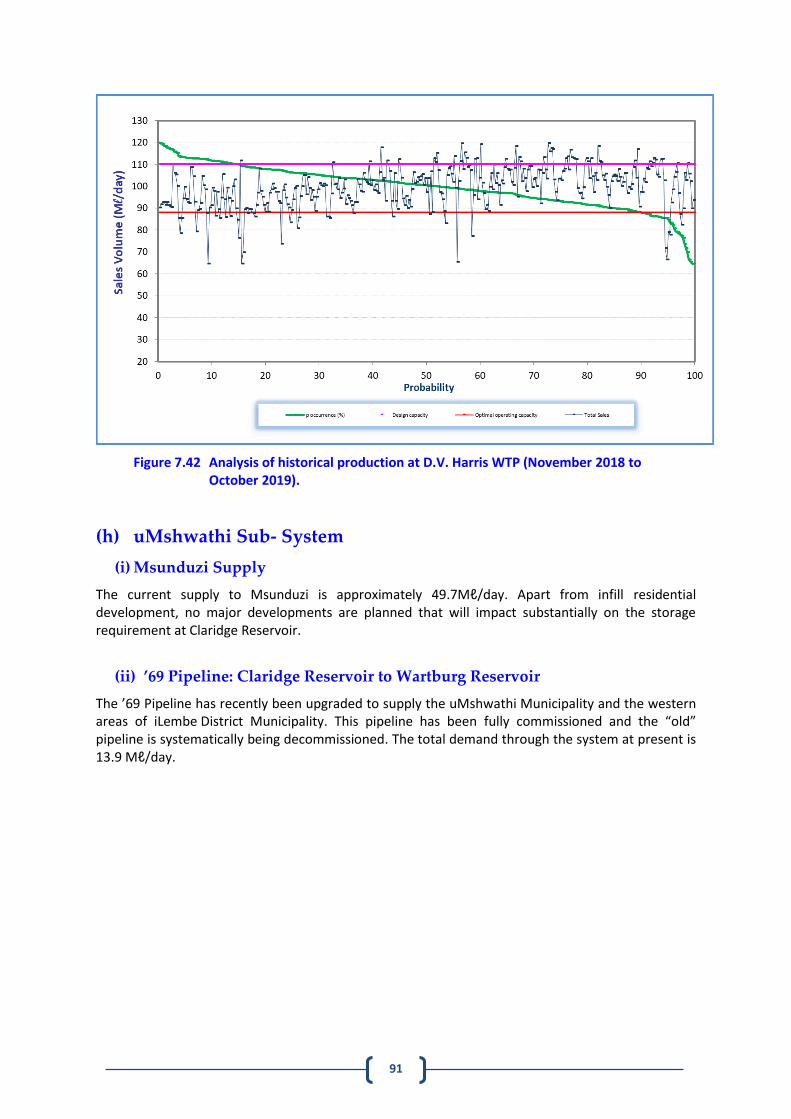
91
Figure 7.42 Analysis of historical production at D.V. Harris WTP (November 2018 to October 2019).
(h) uMshwathi Sub- System
(i) Msunduzi Supply
The current supply to Msunduzi is approximately 49.7Mℓ/day. Apart from infill residential development, no major developments are planned that will impact substantially on the storage requirement at Claridge Reservoir.
(ii) ’69 Pipeline: Claridge Reservoir to Wartburg Reservoir
The ’69 Pipeline has recently been upgraded to supply the uMshwathi Municipality and the western areas of iLembe District Municipality. This pipeline has been fully commissioned and the “old” pipeline is systematically being decommissioned. The total demand through the system at present is 13.9 Mℓ/day.
92
(iii) Wartburg Reservoir to Bruyns Hill Reservoir
The Wartburg Reservoir functions primarily as a bulk reservoir for the Bruyns Hill and Cool Air Reservoirs. To function as a bulk reservoir, it should have 15 hours of the AADD supply to Cool Air and Bruyns Hill Reservoirs. Water demands from the Swayimane area have consistently increased over the years. This growth is expected to continue with the planning of further low cost housing in the area. iLembe District Municipality has also requested a supply to its Southern Ndwedwe region from Bruyns Hill. The pipeline from Bruyns Hill Pump Station to Bruyns Hill Reservoir has been upgraded to a 250 mm diameter steel pipe which has a capacity of 8.5 Mℓ/day. There is, however, a hydraulic constraint between Wartburg Reservoir and Bruyns Hill Pump Station. The supply from Wartburg Reservoir to Bruyns Hill Pump Station has been completed and can now support this new demand node. The storage capacity at Bruyns Hill Reservoir has been increased and should be adequate for the next 20 years.
(iv) Wartburg Reservoir to Dalton Reservoir
The supply pipelines from Wartburg Reservoir to Dalton are adequate for the current demand. Phases 2 and 3 of the uMshwathi BWSS are complete and have now been commissioned.
(i) Durban Heights Water Treatment Plant
Construction of the 400 Mℓ/day Western Aqueduct (WA) has now been commissioned by eThekwini Municipality (excluding Contract 5, which has been postponed to 2025). Sub-systems supplied from Durban Heights WTP and which are planned to be transferred to the WA include: Outer and Inner West, Tshelimnyama, Pinetown, Kwadabeka, Ntuzuma and Mzinyathi. Water currently available from Point M to the WA, based on the 1:100 year yield from the Mgeni system, is approximately 200 Mℓ/day until the proposed uMkhomazi Water Project (uMWP) is commissioned (Section 7.4.2 (a)). eThekwini Municipality plan to transfer the demands off Durban Heights WTP and onto the proposed Western Aqueduct. However, until the uMWP has been commissioned, Durban Heights WTP will need to continue to supply Pinetown with 50 Mℓ/day and a minimum pumping of 30 Mℓ/day to Ntuzuma. No significant reduction in sales is anticipated once the Western Aqueduct is commissioned in 2019. The reduction in demand on Durban Heights is likely to be approximately 20 Mℓ/day. The approximate 20 Mℓ/day that will initially be freed up will be utilised to meet the increasing demands of other nodes along the extension of the Northern Aqueduct. These include the demands of new housing developments in the Verulam/Tongaat area, Grange and that of the proposed Dube TradePort. An analysis of historical production for the Durban Heights WTP (November 2018 to October 2019) is presented in Figure 7.43, and shows that for 65.7% of the time the WTP was being operated above the optimal operating capacity (80% of design capacity) and 0% of the time the WTP was operated at above design capacity. The previous year Durban Heights WTP was operating above the optimal operating capacity for 46.1% of the time. This indicates an increase in demand from the WTP over the last year and may be attributed to water restrictions being lifted following the drought.
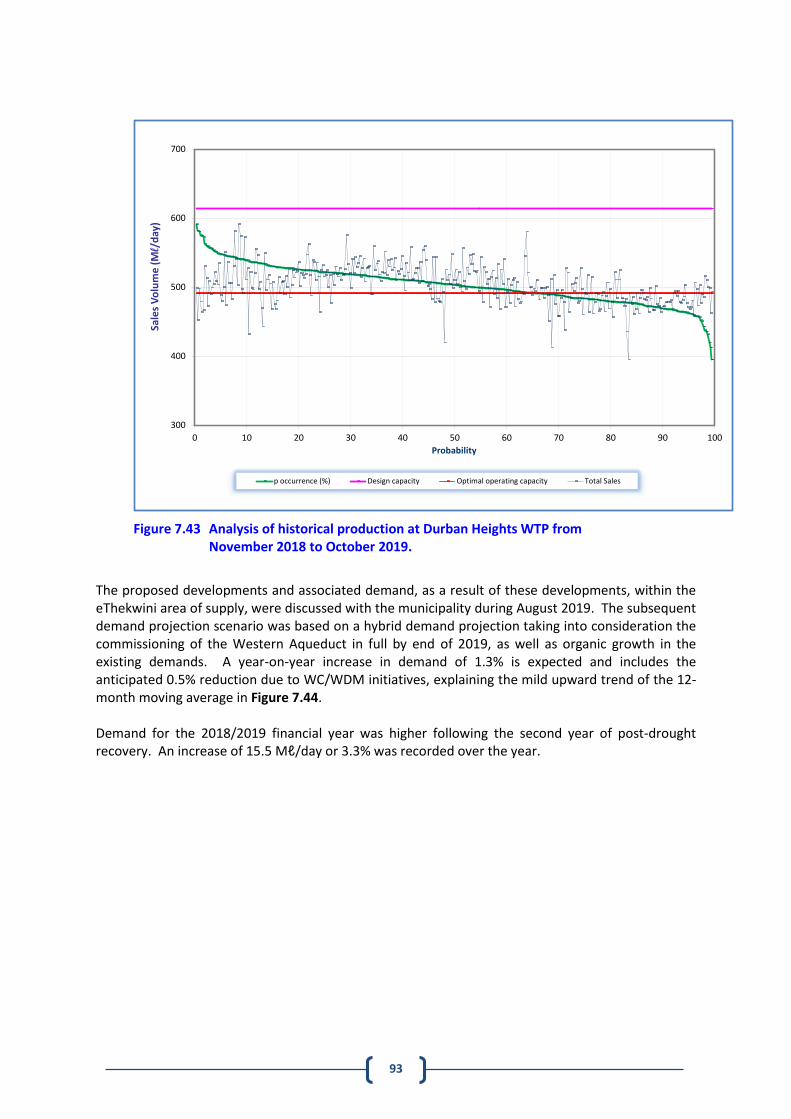
93
Figure 7.43 Analysis of historical production at Durban Heights WTP from November 2018 to October 2019.
The proposed developments and associated demand, as a result of these developments, within the eThekwini area of supply, were discussed with the municipality during August 2019. The subsequent demand projection scenario was based on a hybrid demand projection taking into consideration the commissioning of the Western Aqueduct in full by end of 2019, as well as organic growth in the existing demands. A year-on-year increase in demand of 1.3% is expected and includes the anticipated 0.5% reduction due to WC/WDM initiatives, explaining the mild upward trend of the 12-month moving average in Figure 7.44. Demand for the 2018/2019 financial year was higher following the second year of post-drought recovery. An increase of 15.5 Mℓ/day or 3.3% was recorded over the year.
300
400
500
600
700
0 10 20 30 40 50 60 70 80 90 100
Sale
s V
olu
me
(M
l/d
ay)
Probability
p occurrence (%) Design capacity Optimal operating capacity Total Sales
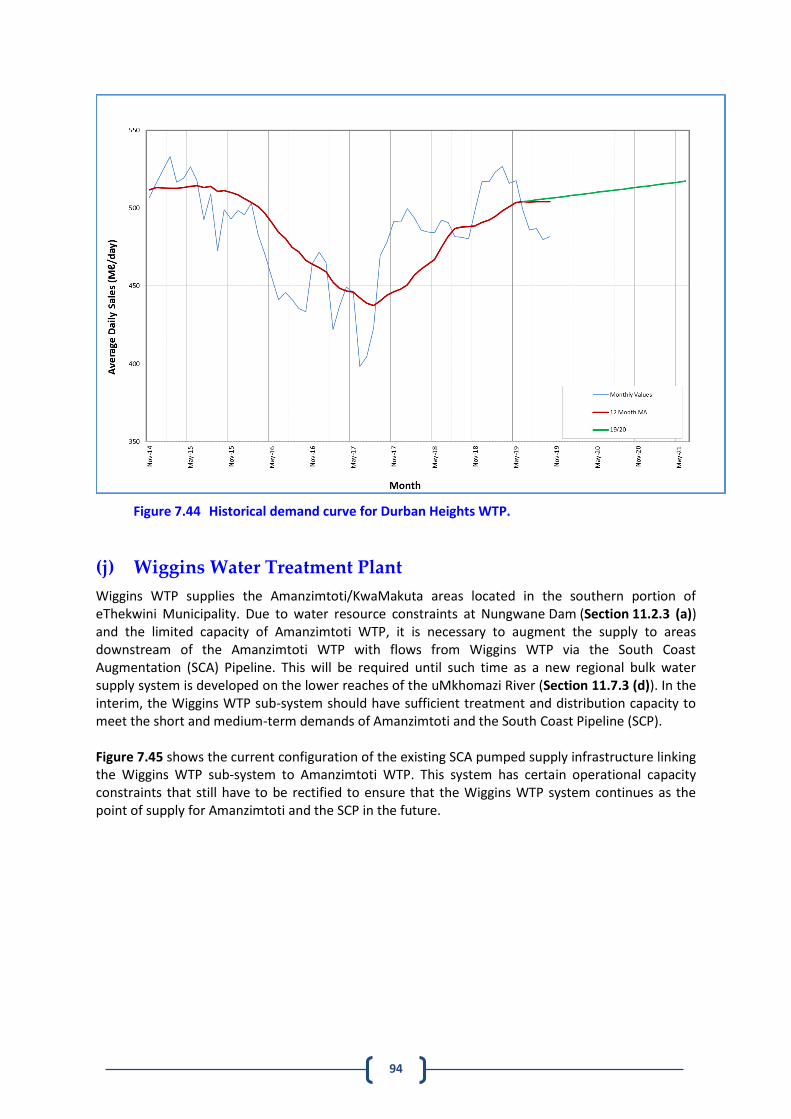
94
Figure 7.44 Historical demand curve for Durban Heights WTP.
(j) Wiggins Water Treatment Plant
Wiggins WTP supplies the Amanzimtoti/KwaMakuta areas located in the southern portion of eThekwini Municipality. Due to water resource constraints at Nungwane Dam (Section 11.2.3 (a)) and the limited capacity of Amanzimtoti WTP, it is necessary to augment the supply to areas downstream of the Amanzimtoti WTP with flows from Wiggins WTP via the South Coast Augmentation (SCA) Pipeline. This will be required until such time as a new regional bulk water supply system is developed on the lower reaches of the uMkhomazi River (Section 11.7.3 (d)). In the interim, the Wiggins WTP sub-system should have sufficient treatment and distribution capacity to meet the short and medium-term demands of Amanzimtoti and the South Coast Pipeline (SCP). Figure 7.45 shows the current configuration of the existing SCA pumped supply infrastructure linking the Wiggins WTP sub-system to Amanzimtoti WTP. This system has certain operational capacity constraints that still have to be rectified to ensure that the Wiggins WTP system continues as the point of supply for Amanzimtoti and the SCP in the future.
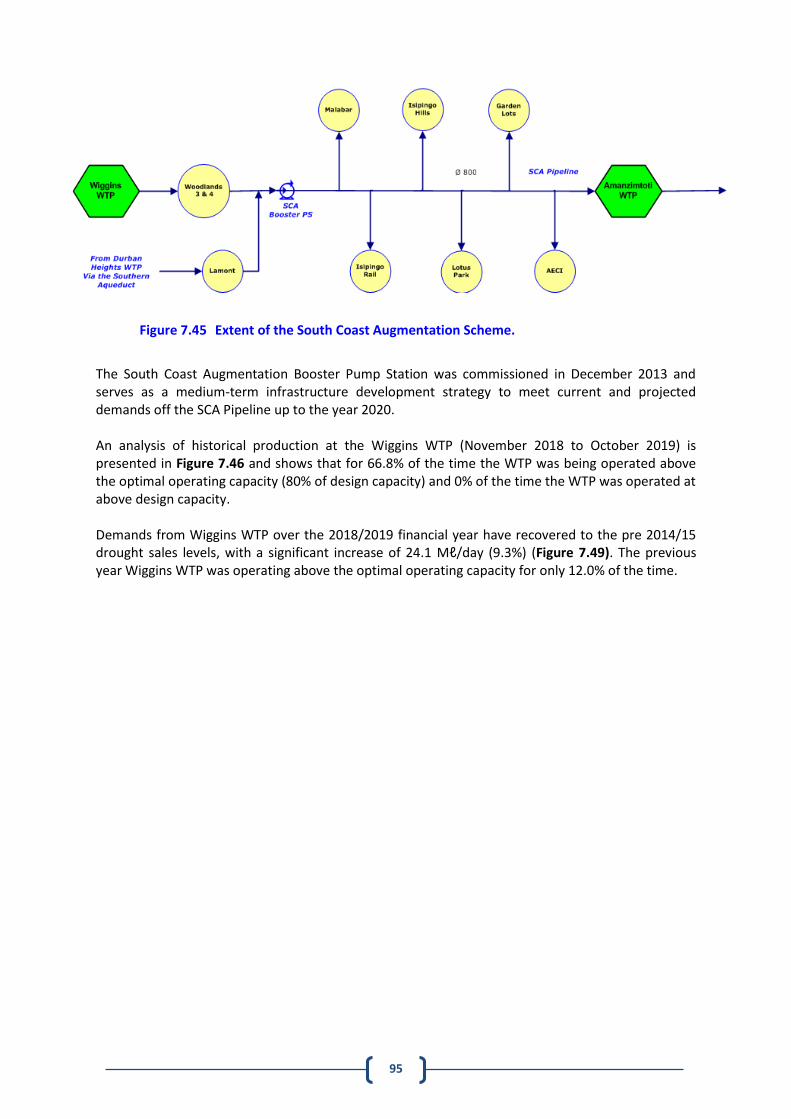
95
The South Coast Augmentation Booster Pump Station was commissioned in December 2013 and serves as a medium-term infrastructure development strategy to meet current and projected demands off the SCA Pipeline up to the year 2020. An analysis of historical production at the Wiggins WTP (November 2018 to October 2019) is presented in Figure 7.46 and shows that for 66.8% of the time the WTP was being operated above the optimal operating capacity (80% of design capacity) and 0% of the time the WTP was operated at above design capacity. Demands from Wiggins WTP over the 2018/2019 financial year have recovered to the pre 2014/15 drought sales levels, with a significant increase of 24.1 Mℓ/day (9.3%) (Figure 7.49). The previous year Wiggins WTP was operating above the optimal operating capacity for only 12.0% of the time.
Figure 7.45 Extent of the South Coast Augmentation Scheme.
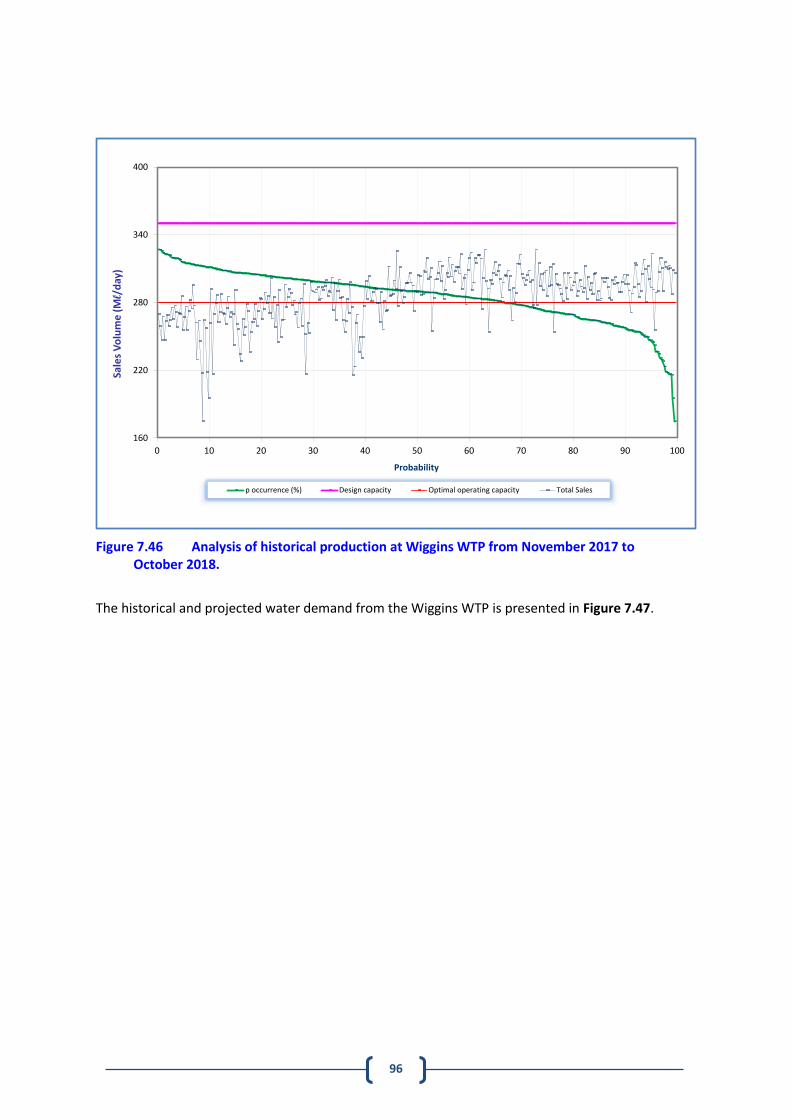
96
Figure 7.46 Analysis of historical production at Wiggins WTP from November 2017 to October 2018.
The historical and projected water demand from the Wiggins WTP is presented in Figure 7.47.
160
220
280
340
400
0 10 20 30 40 50 60 70 80 90 100
Sale
s V
olu
me
(M
l/d
ay)
Probability
p occurrence (%) Design capacity Optimal operating capacity Total Sales
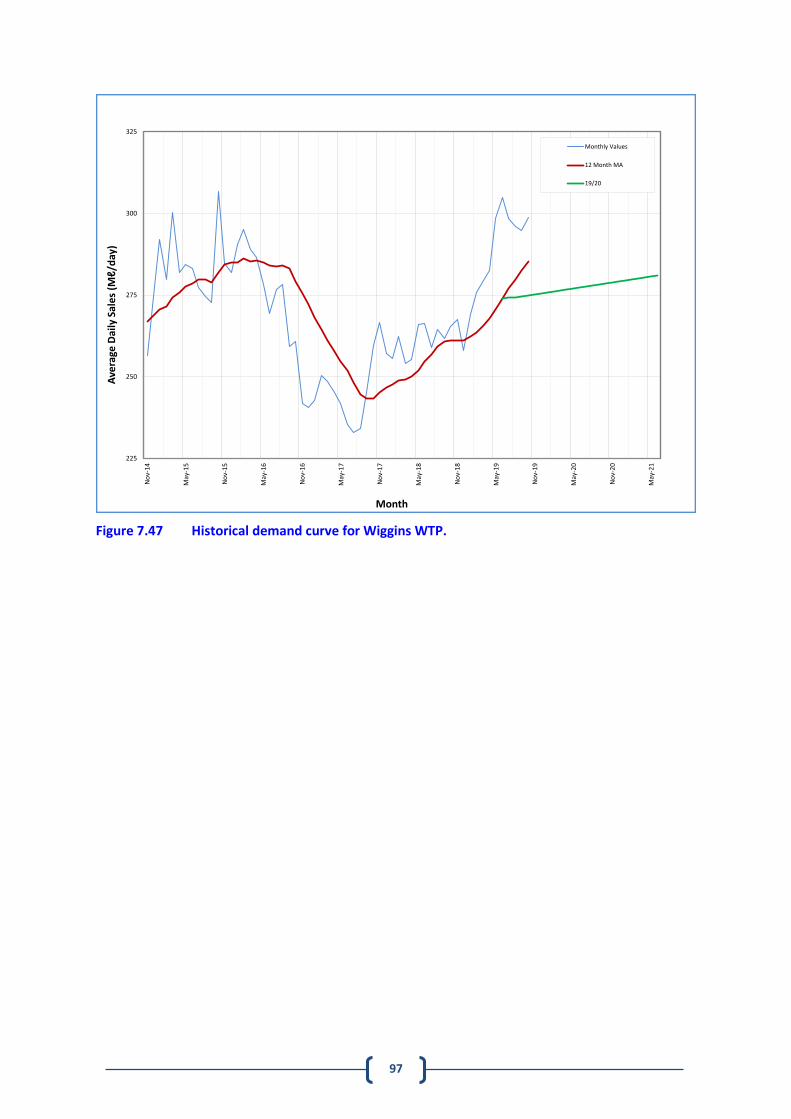
97
Figure 7.47 Historical demand curve for Wiggins WTP.
225
250
275
300
325
No
v-1
4
May
-15
No
v-1
5
May
-16
No
v-1
6
May
-17
No
v-1
7
May
-18
No
v-1
8
May
-19
No
v-1
9
May
-20
No
v-2
0
May
-21
Ave
rage
Dai
ly S
ale
s (M
ℓ/d
ay)
Month
Monthly Values
12 Month MA
19/20
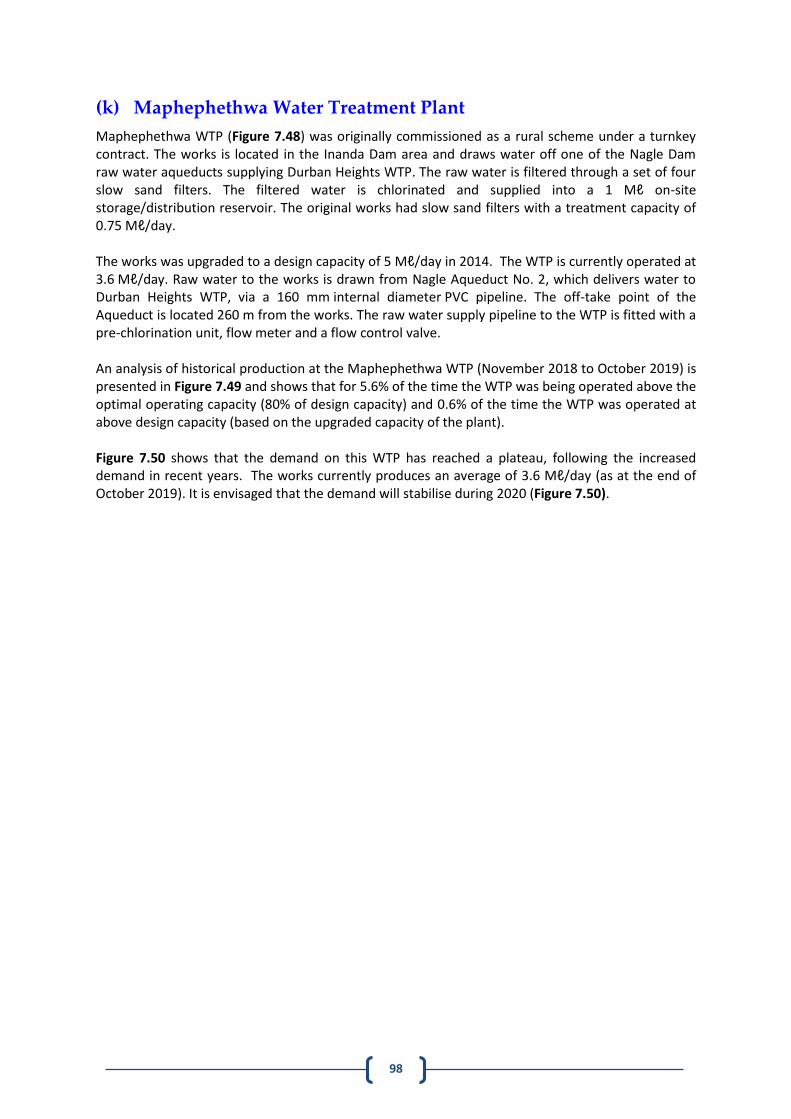
98
(k) Maphephethwa Water Treatment Plant
Maphephethwa WTP (Figure 7.48) was originally commissioned as a rural scheme under a turnkey contract. The works is located in the Inanda Dam area and draws water off one of the Nagle Dam raw water aqueducts supplying Durban Heights WTP. The raw water is filtered through a set of four slow sand filters. The filtered water is chlorinated and supplied into a 1 Mℓ on-site storage/distribution reservoir. The original works had slow sand filters with a treatment capacity of 0.75 Mℓ/day. The works was upgraded to a design capacity of 5 Mℓ/day in 2014. The WTP is currently operated at 3.6 Mℓ/day. Raw water to the works is drawn from Nagle Aqueduct No. 2, which delivers water to Durban Heights WTP, via a 160 mm internal diameter PVC pipeline. The off-take point of the Aqueduct is located 260 m from the works. The raw water supply pipeline to the WTP is fitted with a pre-chlorination unit, flow meter and a flow control valve. An analysis of historical production at the Maphephethwa WTP (November 2018 to October 2019) is presented in Figure 7.49 and shows that for 5.6% of the time the WTP was being operated above the optimal operating capacity (80% of design capacity) and 0.6% of the time the WTP was operated at above design capacity (based on the upgraded capacity of the plant). Figure 7.50 shows that the demand on this WTP has reached a plateau, following the increased demand in recent years. The works currently produces an average of 3.6 Mℓ/day (as at the end of October 2019). It is envisaged that the demand will stabilise during 2020 (Figure 7.50).
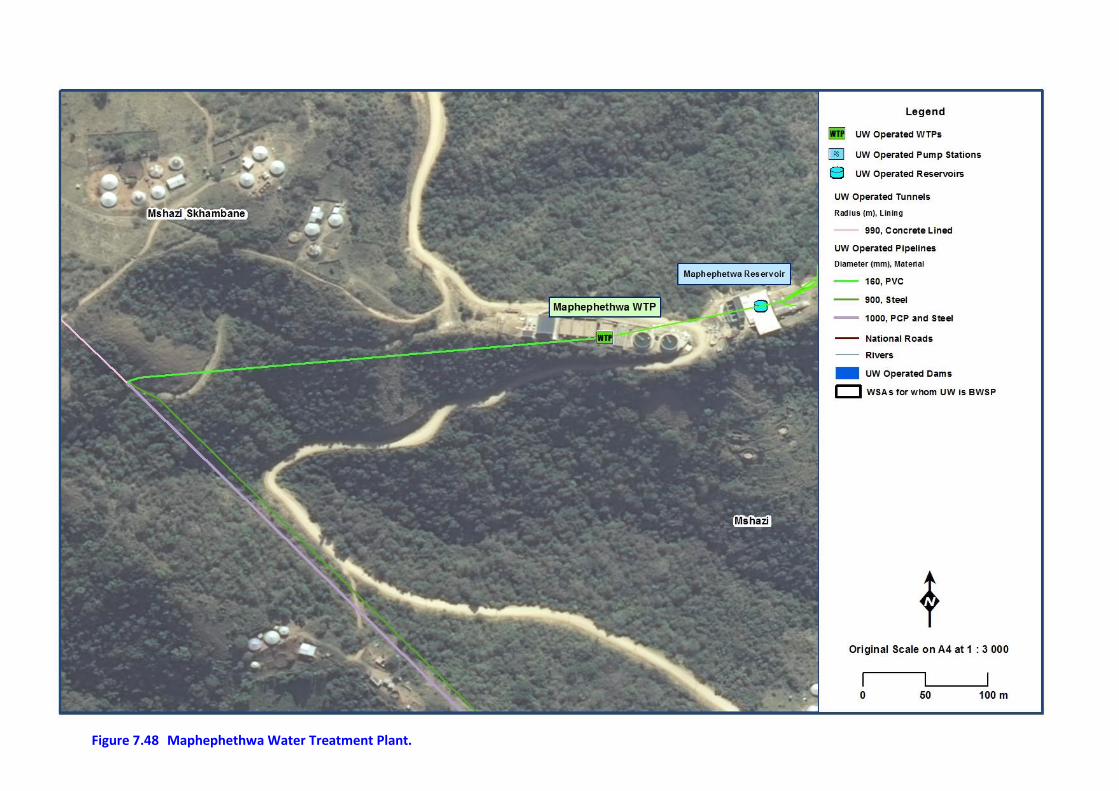
99
Figure 7.48 Maphephethwa Water Treatment Plant.
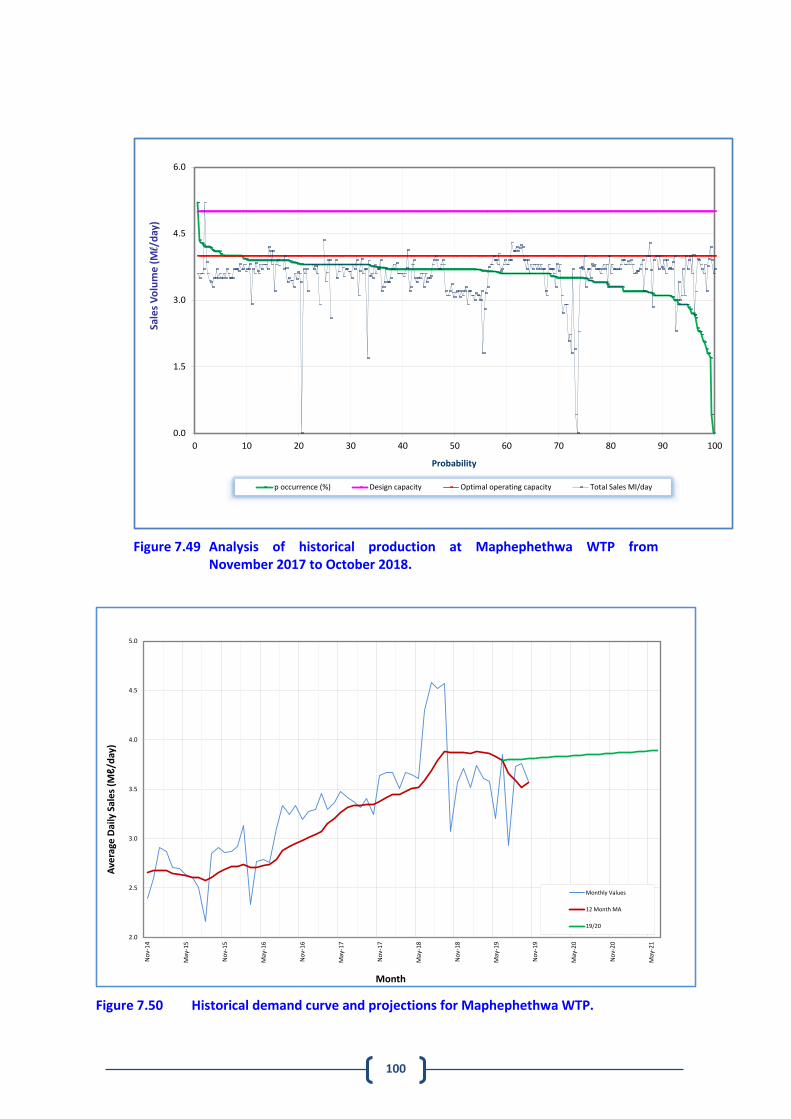
100
Figure 7.49 Analysis of historical production at Maphephethwa WTP from November 2017 to October 2018.
Figure 7.50 Historical demand curve and projections for Maphephethwa WTP.
0.0
1.5
3.0
4.5
6.0
0 10 20 30 40 50 60 70 80 90 100
Sale
s V
olu
me
(M
l/d
ay)
Probability
p occurrence (%) Design capacity Optimal operating capacity Total Sales Ml/day
2.0
2.5
3.0
3.5
4.0
4.5
5.0
No
v-1
4
May
-15
No
v-1
5
May
-16
No
v-1
6
May
-17
No
v-1
7
May
-18
No
v-1
8
May
-19
No
v-1
9
May
-20
No
v-2
0
May
-21
Ave
rage
Dai
ly S
ale
s (M
ℓ/d
ay)
Month
Monthly Values
12 Month MA
19/20
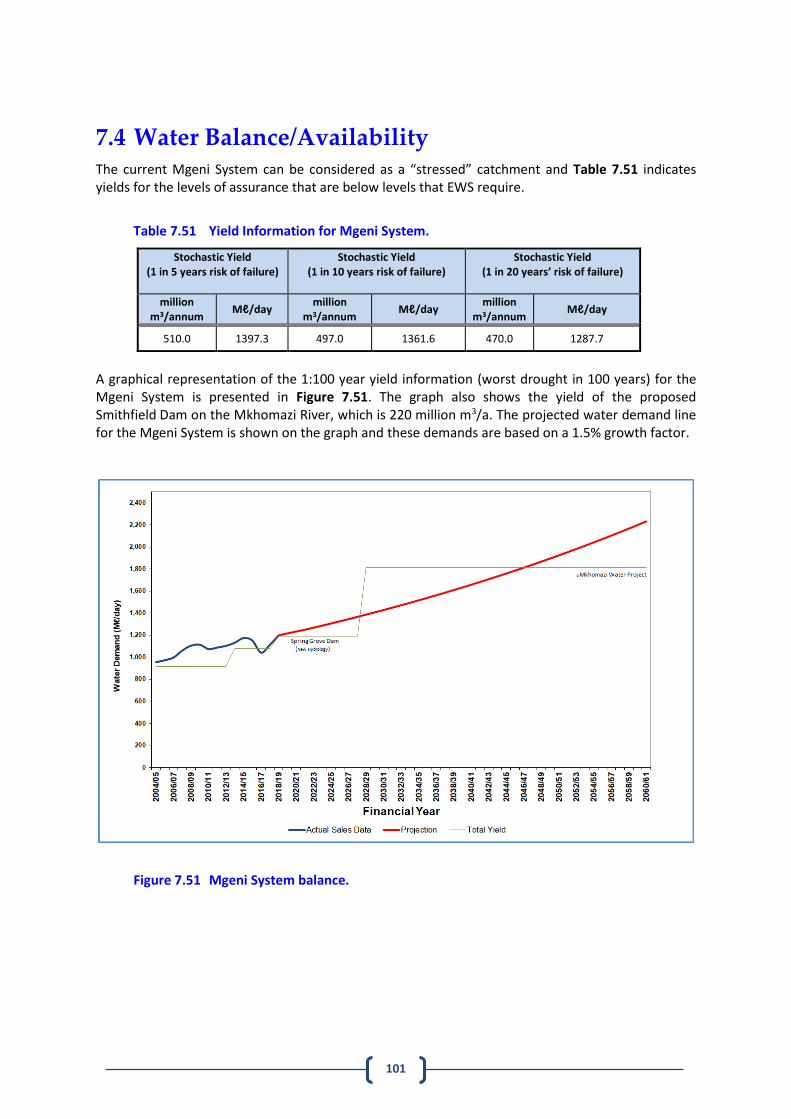
101
7.4 Water Balance/Availability The current Mgeni System can be considered as a “stressed” catchment and Table 7.51 indicates yields for the levels of assurance that are below levels that EWS require.
Table 7.51 Yield Information for Mgeni System.
Stochastic Yield (1 in 5 years risk of failure)
Stochastic Yield (1 in 10 years risk of failure)
Stochastic Yield (1 in 20 years’ risk of failure)
million m3/annum
Mℓ/day million
m3/annum Mℓ/day
million m3/annum
Mℓ/day
510.0 1397.3 497.0 1361.6 470.0 1287.7
A graphical representation of the 1:100 year yield information (worst drought in 100 years) for the Mgeni System is presented in Figure 7.51. The graph also shows the yield of the proposed Smithfield Dam on the Mkhomazi River, which is 220 million m3/a. The projected water demand line for the Mgeni System is shown on the graph and these demands are based on a 1.5% growth factor.
Figure 7.51 Mgeni System balance.
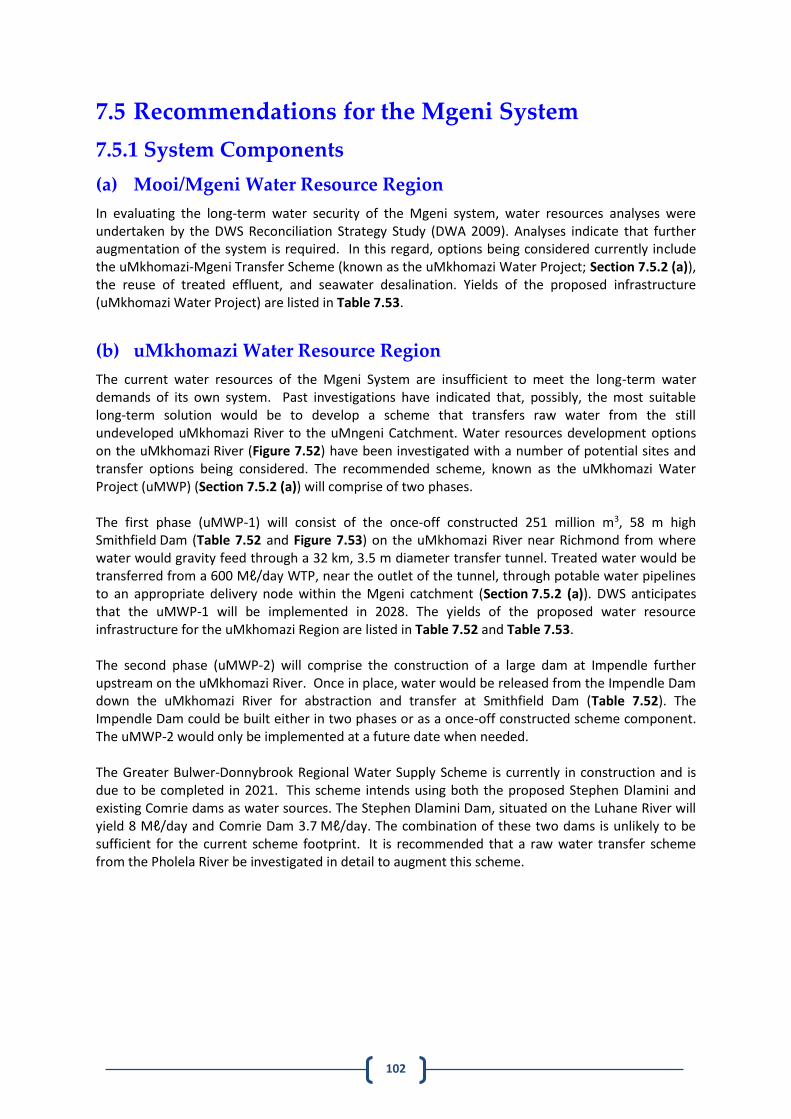
102
7.5 Recommendations for the Mgeni System
7.5.1 System Components
(a) Mooi/Mgeni Water Resource Region
In evaluating the long-term water security of the Mgeni system, water resources analyses were undertaken by the DWS Reconciliation Strategy Study (DWA 2009). Analyses indicate that further augmentation of the system is required. In this regard, options being considered currently include the uMkhomazi-Mgeni Transfer Scheme (known as the uMkhomazi Water Project; Section 7.5.2 (a)), the reuse of treated effluent, and seawater desalination. Yields of the proposed infrastructure (uMkhomazi Water Project) are listed in Table 7.53.
(b) uMkhomazi Water Resource Region
The current water resources of the Mgeni System are insufficient to meet the long-term water demands of its own system. Past investigations have indicated that, possibly, the most suitable long-term solution would be to develop a scheme that transfers raw water from the still undeveloped uMkhomazi River to the uMngeni Catchment. Water resources development options on the uMkhomazi River (Figure 7.52) have been investigated with a number of potential sites and transfer options being considered. The recommended scheme, known as the uMkhomazi Water Project (uMWP) (Section 7.5.2 (a)) will comprise of two phases. The first phase (uMWP-1) will consist of the once-off constructed 251 million m3, 58 m high Smithfield Dam (Table 7.52 and Figure 7.53) on the uMkhomazi River near Richmond from where water would gravity feed through a 32 km, 3.5 m diameter transfer tunnel. Treated water would be transferred from a 600 Mℓ/day WTP, near the outlet of the tunnel, through potable water pipelines to an appropriate delivery node within the Mgeni catchment (Section 7.5.2 (a)). DWS anticipates that the uMWP-1 will be implemented in 2028. The yields of the proposed water resource infrastructure for the uMkhomazi Region are listed in Table 7.52 and Table 7.53. The second phase (uMWP-2) will comprise the construction of a large dam at Impendle further upstream on the uMkhomazi River. Once in place, water would be released from the Impendle Dam down the uMkhomazi River for abstraction and transfer at Smithfield Dam (Table 7.52). The Impendle Dam could be built either in two phases or as a once-off constructed scheme component. The uMWP-2 would only be implemented at a future date when needed. The Greater Bulwer-Donnybrook Regional Water Supply Scheme is currently in construction and is due to be completed in 2021. This scheme intends using both the proposed Stephen Dlamini and existing Comrie dams as water sources. The Stephen Dlamini Dam, situated on the Luhane River will yield 8 Mℓ/day and Comrie Dam 3.7 Mℓ/day. The combination of these two dams is unlikely to be sufficient for the current scheme footprint. It is recommended that a raw water transfer scheme from the Pholela River be investigated in detail to augment this scheme.
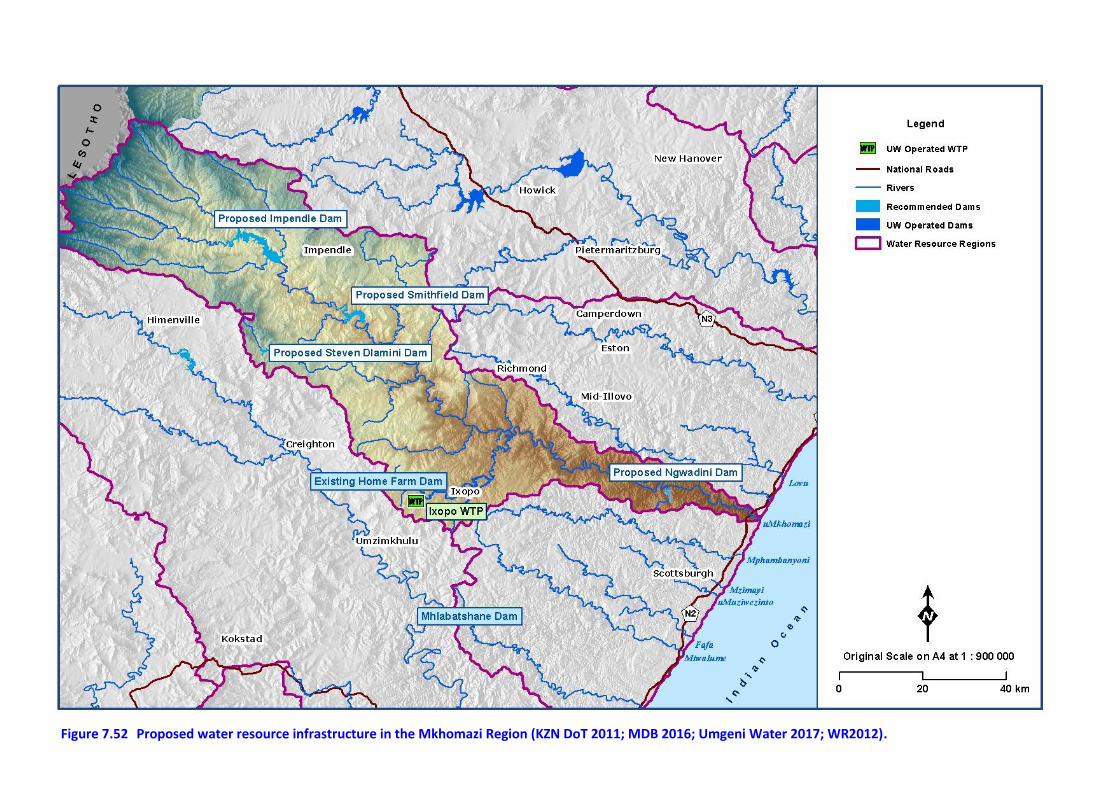
103
Figure 7.52 Proposed water resource infrastructure in the Mkhomazi Region (KZN DoT 2011; MDB 2016; Umgeni Water 2017; WR2012).
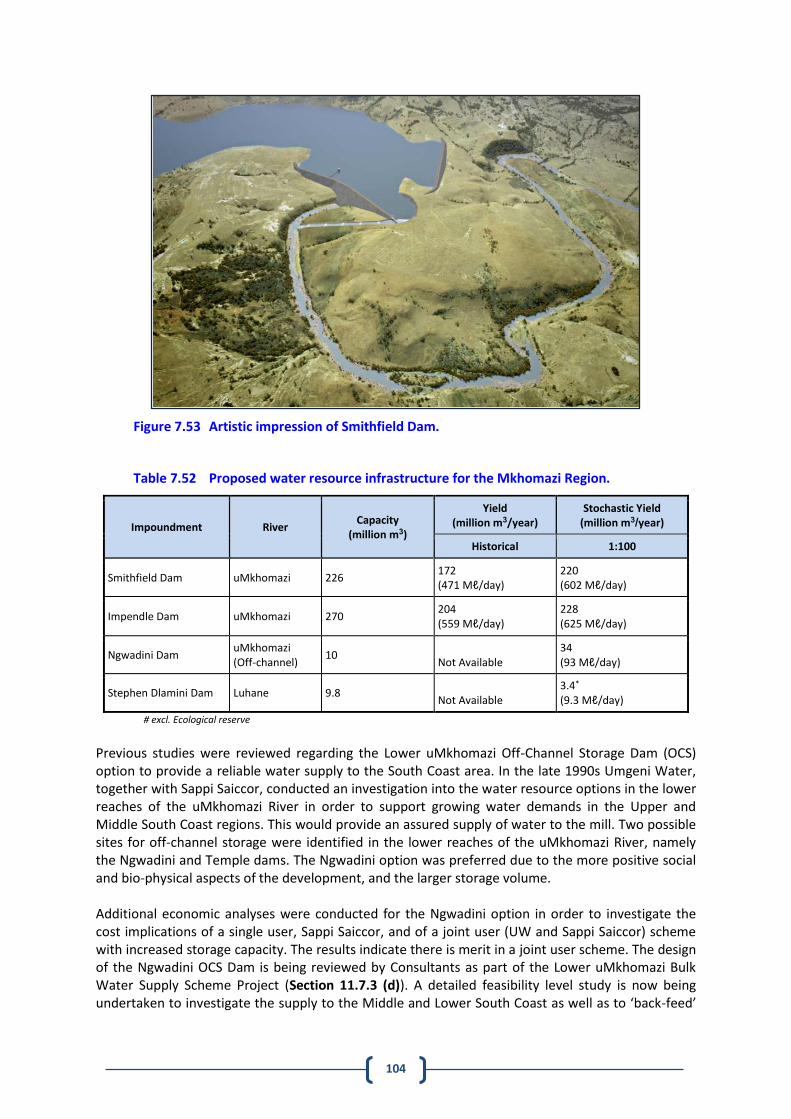
104
Figure 7.53 Artistic impression of Smithfield Dam.
Table 7.52 Proposed water resource infrastructure for the Mkhomazi Region.
Impoundment River Capacity
(million m3)
Yield (million m3/year)
Stochastic Yield (million m3/year)
Historical 1:100
Smithfield Dam uMkhomazi 226 172 (471 Mℓ/day)
220 (602 Mℓ/day)
Impendle Dam uMkhomazi 270 204 (559 Mℓ/day)
228 (625 Mℓ/day)
Ngwadini Dam uMkhomazi (Off-channel)
10 Not Available
34 (93 Mℓ/day)
Stephen Dlamini Dam Luhane 9.8 Not Available
3.4* (9.3 Mℓ/day)
# excl. Ecological reserve
Previous studies were reviewed regarding the Lower uMkhomazi Off-Channel Storage Dam (OCS) option to provide a reliable water supply to the South Coast area. In the late 1990s Umgeni Water, together with Sappi Saiccor, conducted an investigation into the water resource options in the lower reaches of the uMkhomazi River in order to support growing water demands in the Upper and Middle South Coast regions. This would provide an assured supply of water to the mill. Two possible sites for off-channel storage were identified in the lower reaches of the uMkhomazi River, namely the Ngwadini and Temple dams. The Ngwadini option was preferred due to the more positive social and bio-physical aspects of the development, and the larger storage volume. Additional economic analyses were conducted for the Ngwadini option in order to investigate the cost implications of a single user, Sappi Saiccor, and of a joint user (UW and Sappi Saiccor) scheme with increased storage capacity. The results indicate there is merit in a joint user scheme. The design of the Ngwadini OCS Dam is being reviewed by Consultants as part of the Lower uMkhomazi Bulk Water Supply Scheme Project (Section 11.7.3 (d)). A detailed feasibility level study is now being undertaken to investigate the supply to the Middle and Lower South Coast as well as to ‘back-feed’
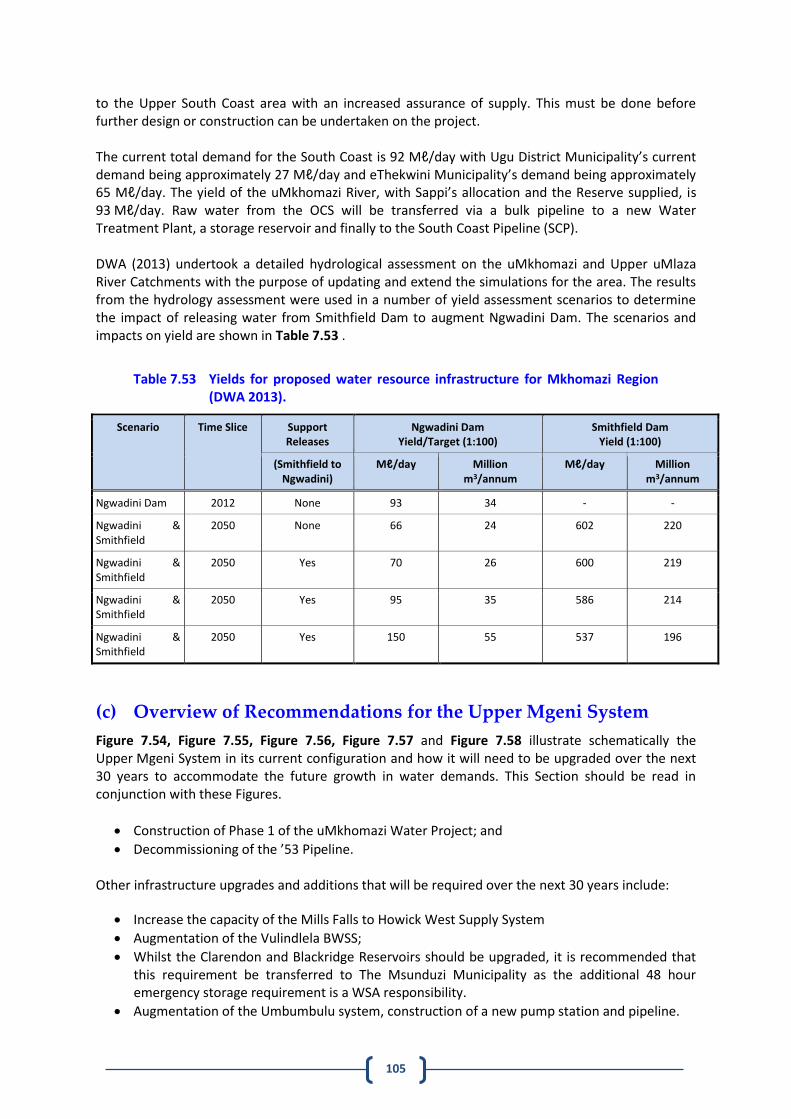
105
to the Upper South Coast area with an increased assurance of supply. This must be done before further design or construction can be undertaken on the project. The current total demand for the South Coast is 92 Mℓ/day with Ugu District Municipality’s current demand being approximately 27 Mℓ/day and eThekwini Municipality’s demand being approximately 65 Mℓ/day. The yield of the uMkhomazi River, with Sappi’s allocation and the Reserve supplied, is 93 Mℓ/day. Raw water from the OCS will be transferred via a bulk pipeline to a new Water Treatment Plant, a storage reservoir and finally to the South Coast Pipeline (SCP). DWA (2013) undertook a detailed hydrological assessment on the uMkhomazi and Upper uMlaza River Catchments with the purpose of updating and extend the simulations for the area. The results from the hydrology assessment were used in a number of yield assessment scenarios to determine the impact of releasing water from Smithfield Dam to augment Ngwadini Dam. The scenarios and impacts on yield are shown in Table 7.53 .
Table 7.53 Yields for proposed water resource infrastructure for Mkhomazi Region (DWA 2013).
Scenario Time Slice Support Releases
Ngwadini Dam Yield/Target (1:100)
Smithfield Dam Yield (1:100)
(Smithfield to Ngwadini)
Mℓ/day Million m3/annum
Mℓ/day Million m3/annum
Ngwadini Dam 2012 None 93 34 - -
Ngwadini & Smithfield
2050 None 66 24 602 220
Ngwadini & Smithfield
2050 Yes 70 26 600 219
Ngwadini & Smithfield
2050 Yes 95 35 586 214
Ngwadini & Smithfield
2050 Yes 150 55 537 196
(c) Overview of Recommendations for the Upper Mgeni System
Figure 7.54, Figure 7.55, Figure 7.56, Figure 7.57 and Figure 7.58 illustrate schematically the Upper Mgeni System in its current configuration and how it will need to be upgraded over the next 30 years to accommodate the future growth in water demands. This Section should be read in conjunction with these Figures.
Construction of Phase 1 of the uMkhomazi Water Project; and
Decommissioning of the ’53 Pipeline. Other infrastructure upgrades and additions that will be required over the next 30 years include:
Increase the capacity of the Mills Falls to Howick West Supply System
Augmentation of the Vulindlela BWSS;
Whilst the Clarendon and Blackridge Reservoirs should be upgraded, it is recommended that this requirement be transferred to The Msunduzi Municipality as the additional 48 hour emergency storage requirement is a WSA responsibility.
Augmentation of the Umbumbulu system, construction of a new pump station and pipeline.
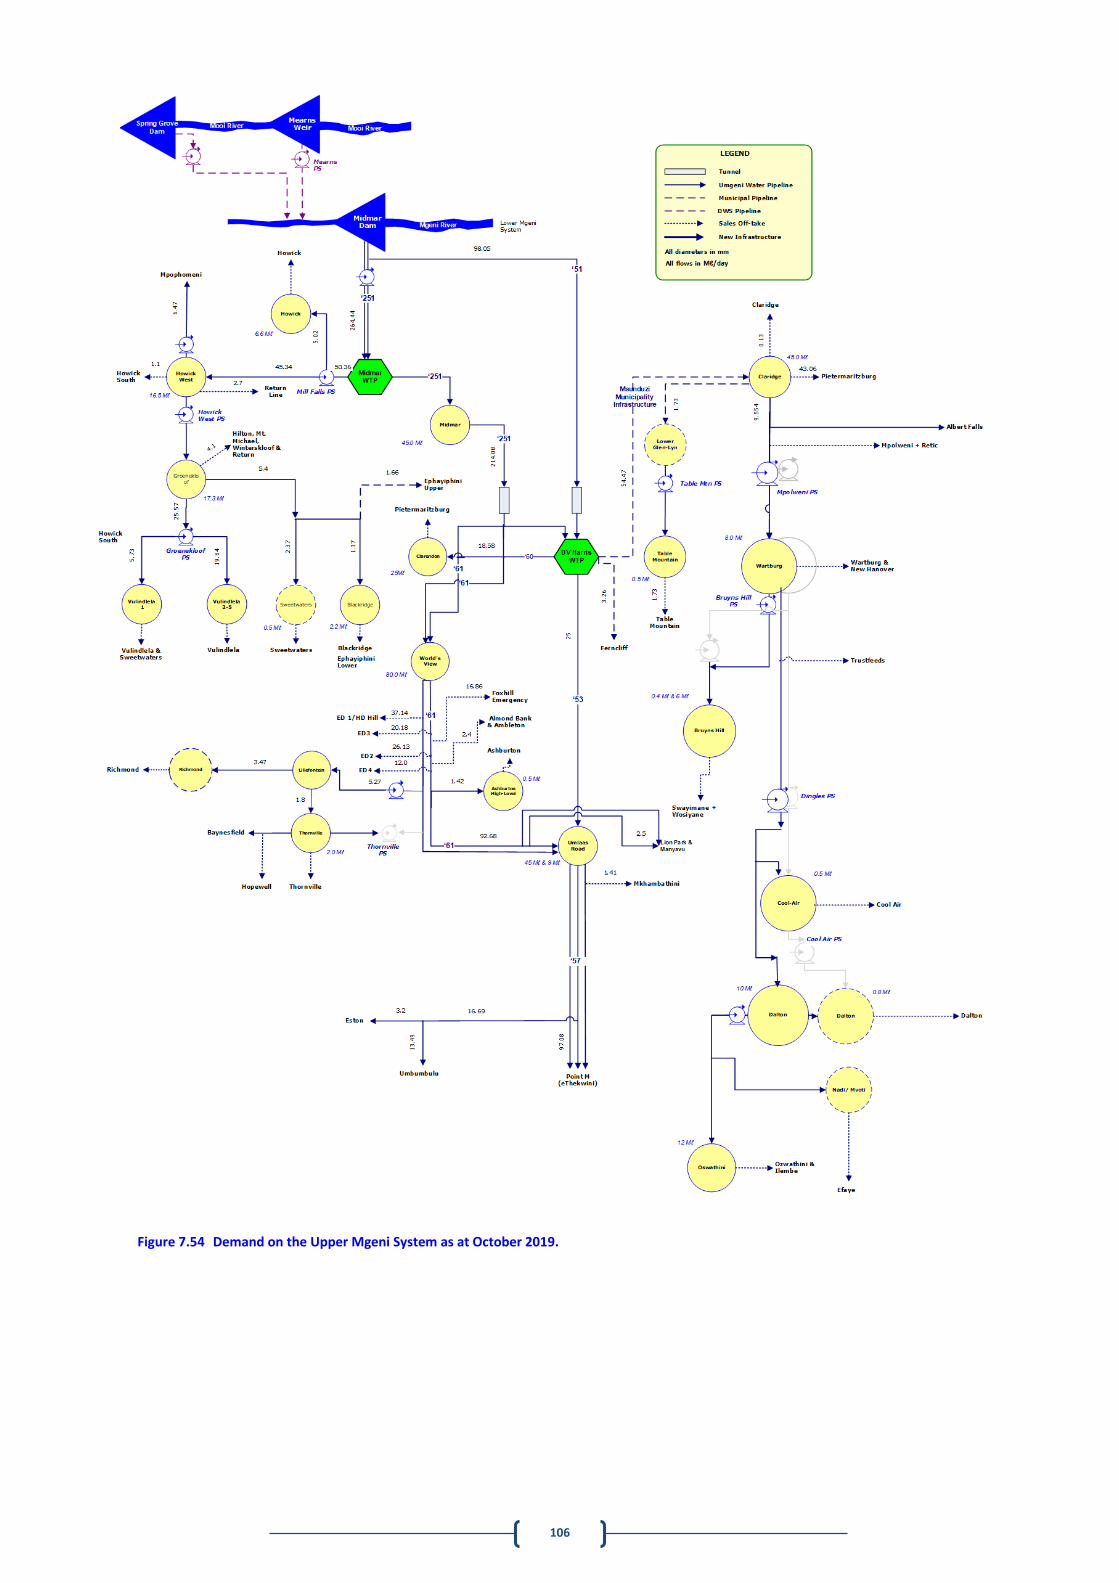
106
Figure 7.54 Demand on the Upper Mgeni System as at October 2019.
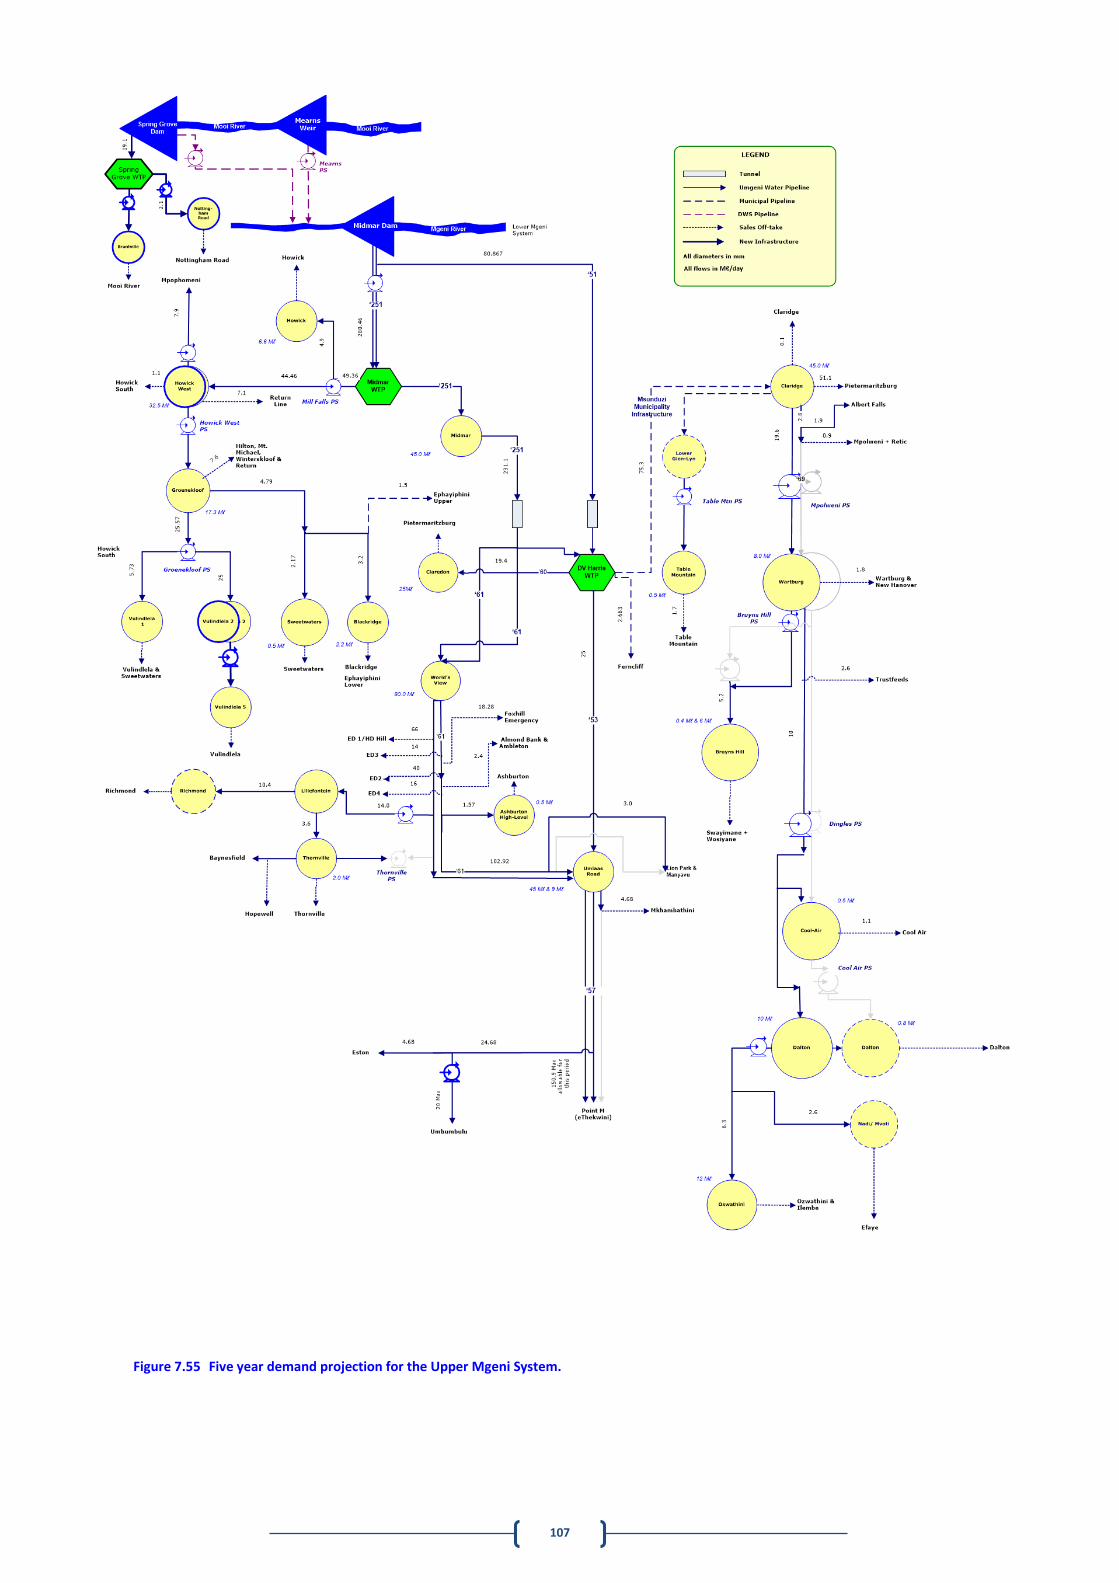
107
Figure 7.55 Five year demand projection for the Upper Mgeni System.
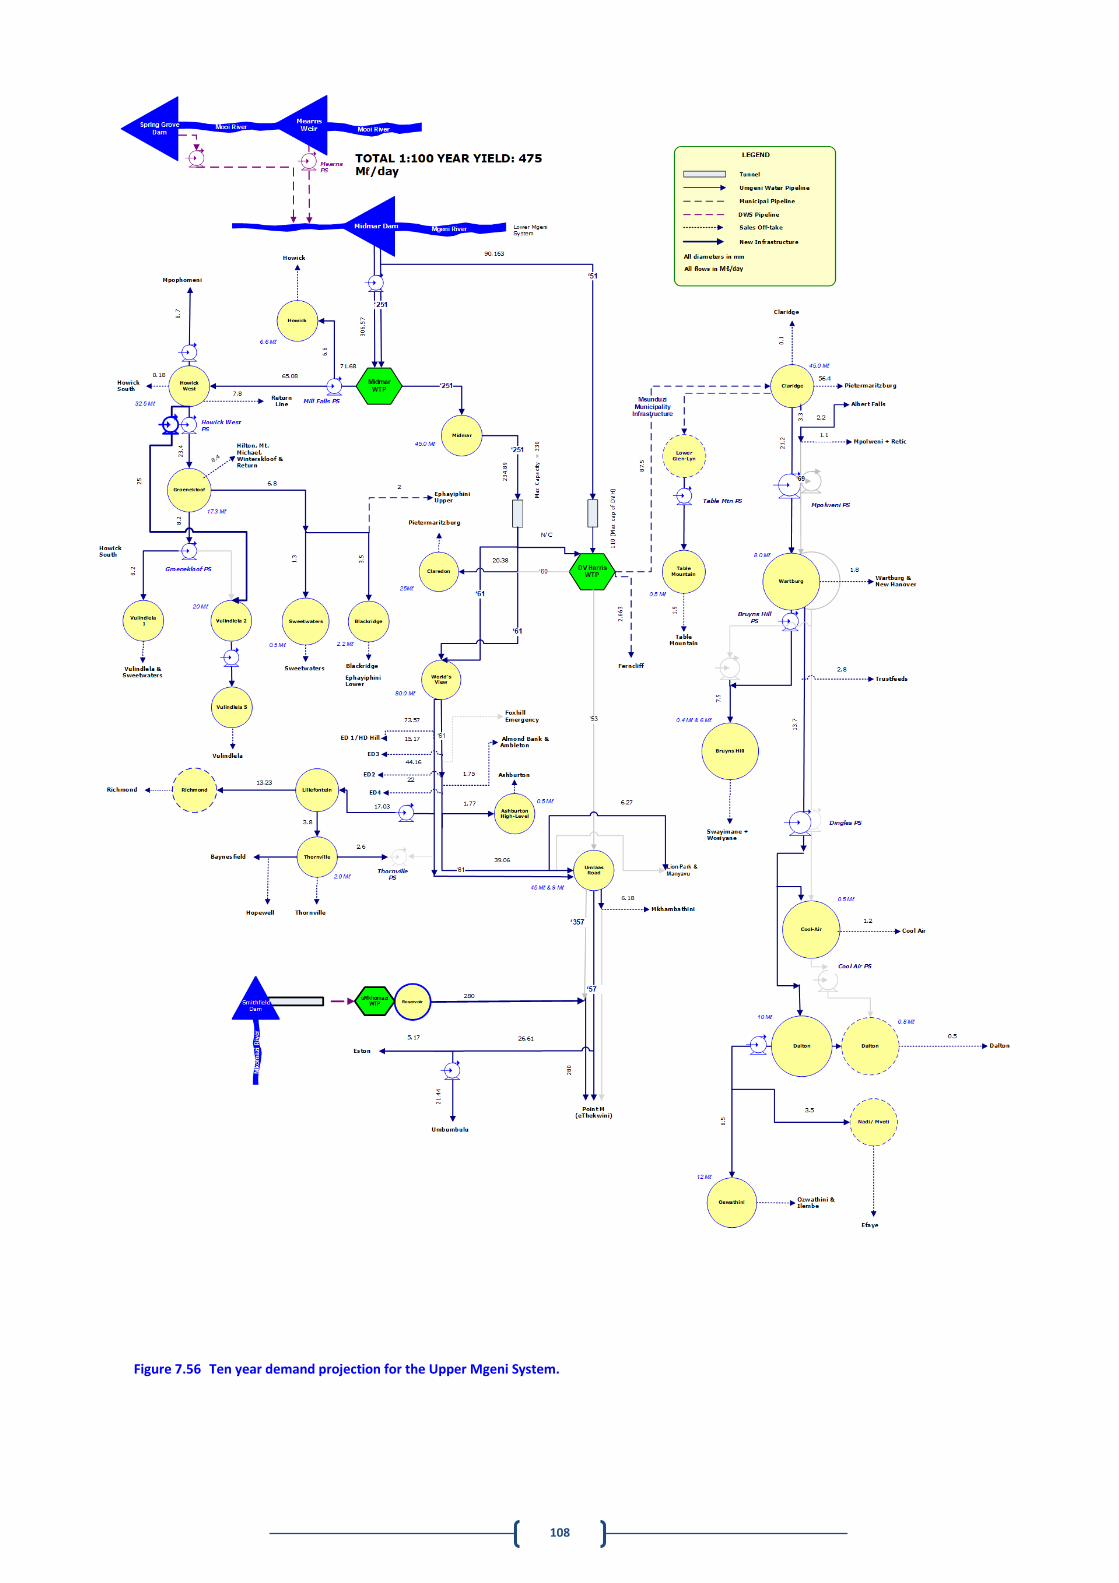
108
Figure 7.56 Ten year demand projection for the Upper Mgeni System.
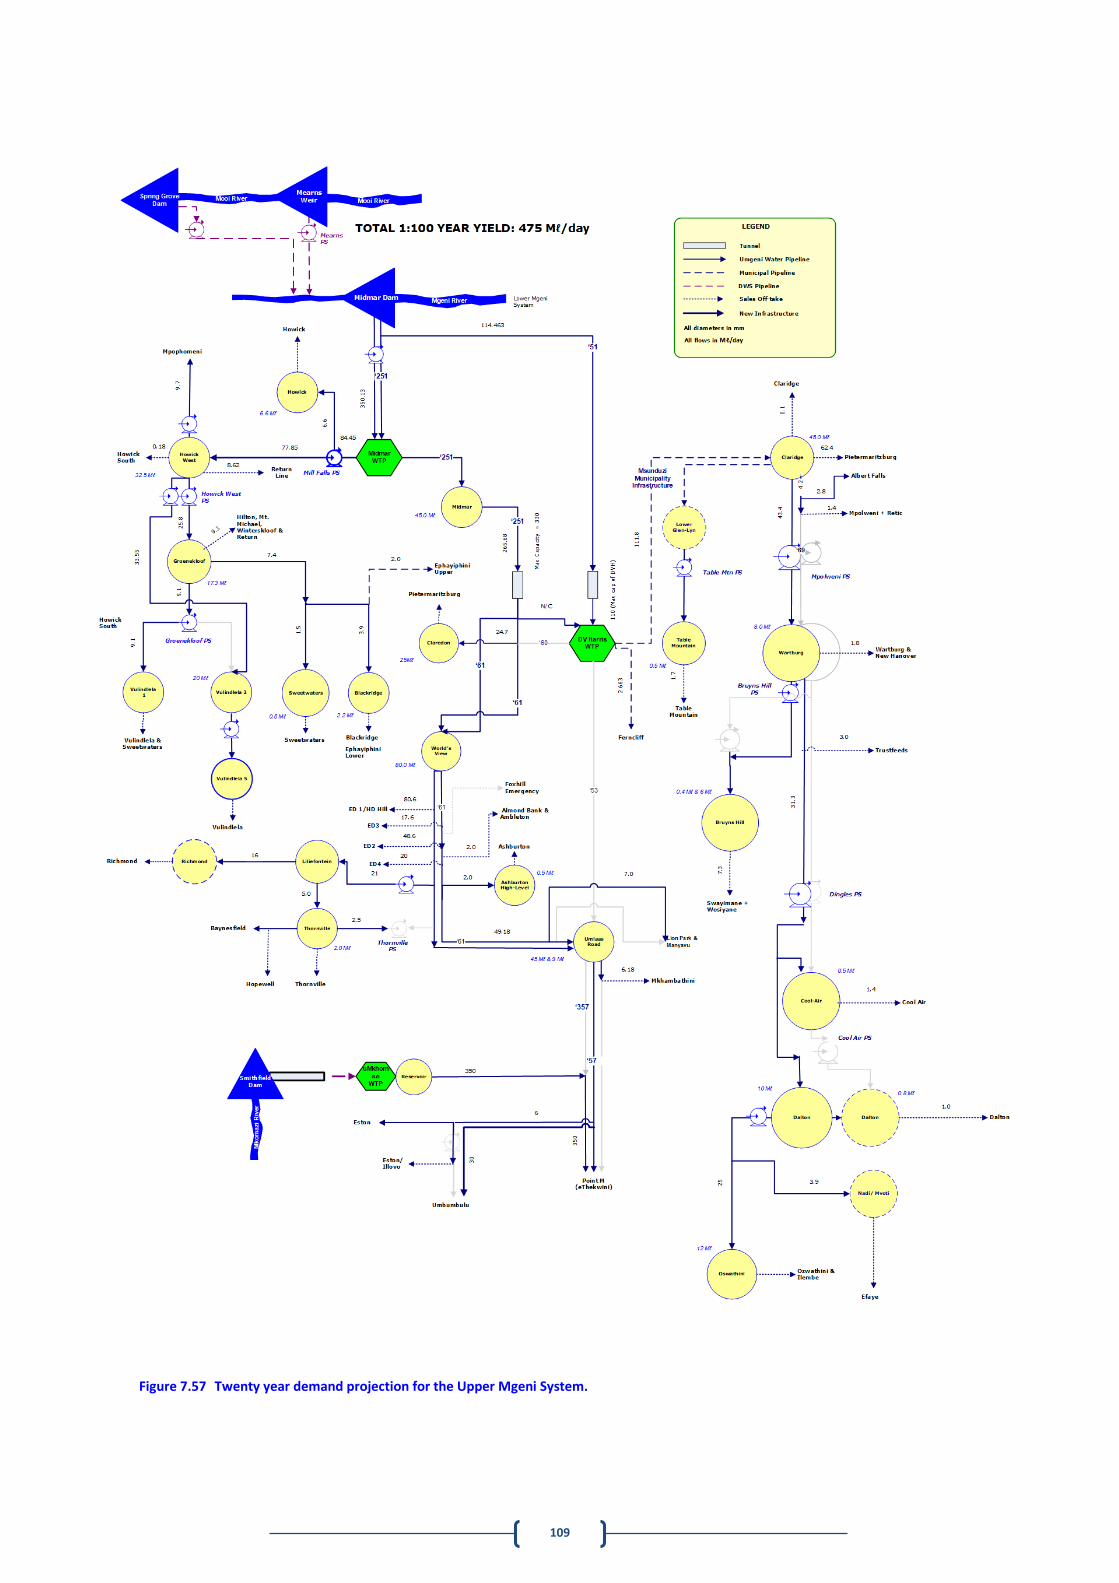
109
Figure 7.57 Twenty year demand projection for the Upper Mgeni System.
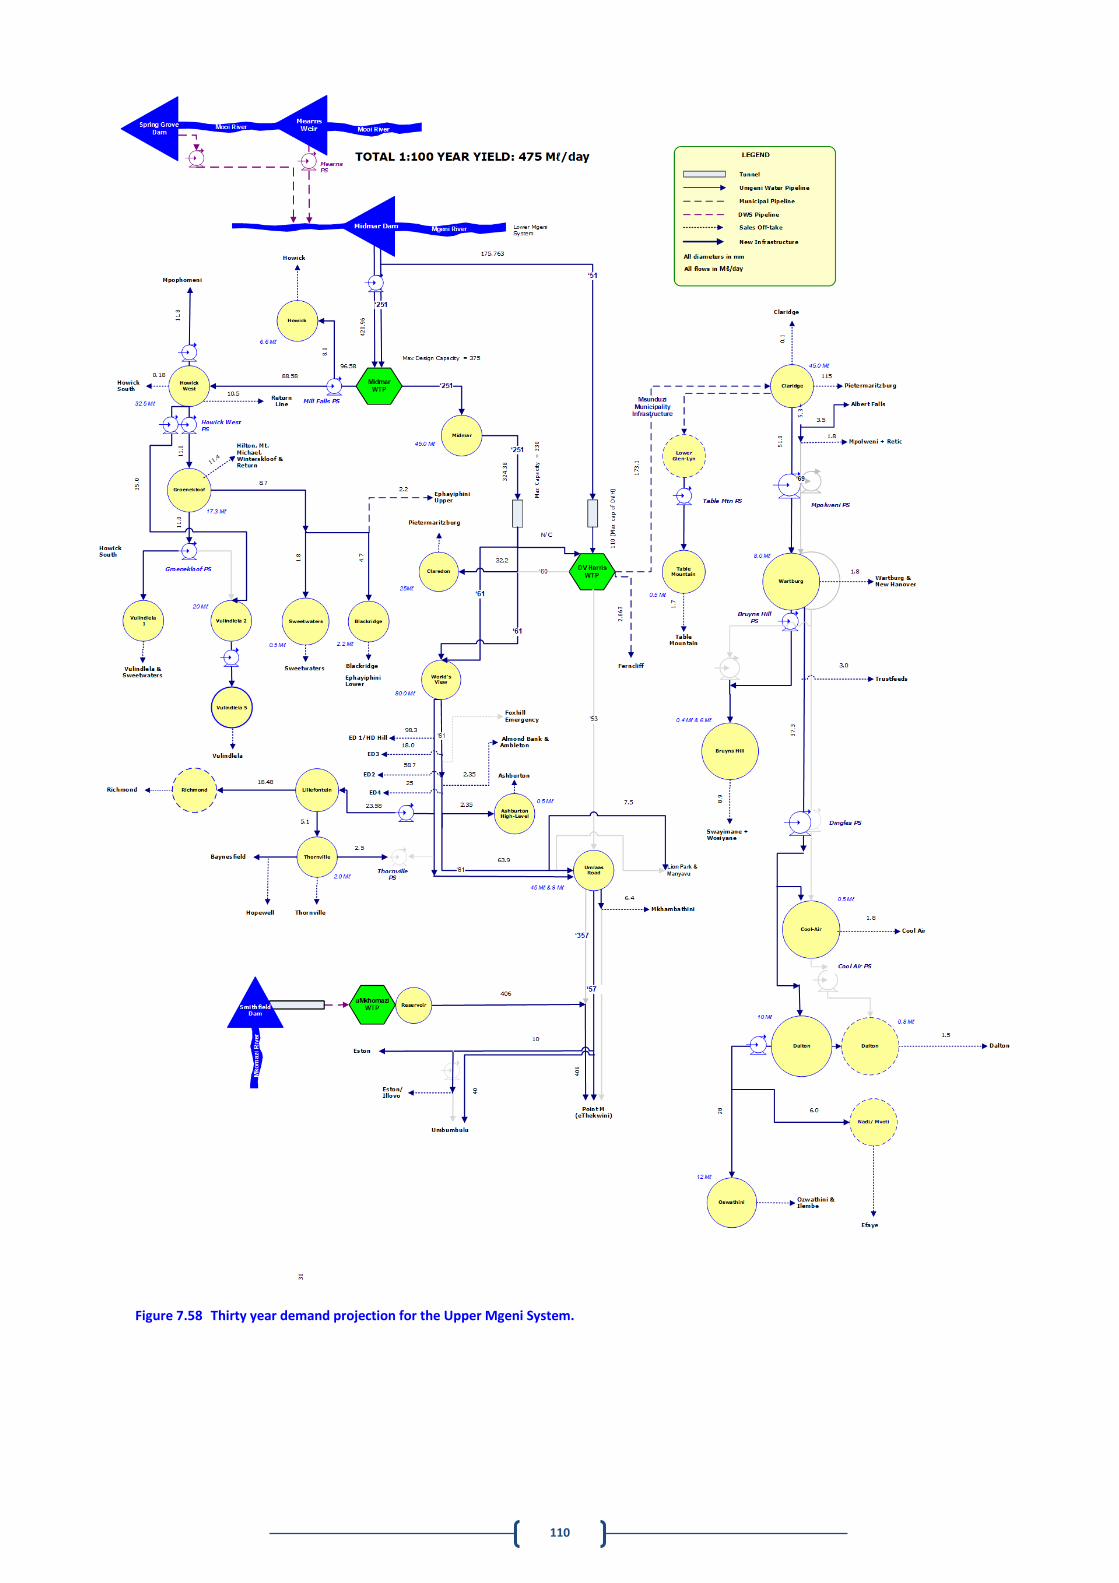
110
Figure 7.58 Thirty year demand projection for the Upper Mgeni System.
111
(d) Midmar Water Treatment Plant
The Western Aqueduct will be fully commissioned in 2020/2021. The Midmar WTP has now been upgraded from its treatment capacity of 250 Mℓ/day to 375 Mℓ/day (2018) to accommodate the new demand on the Western Aqueduct. Midmar WTP and D.V. Harris WTP, combined, can now supply 485 Mℓ/day. This is slightly above the 99% assured yield of Midmar Dam of 475 Mℓ/day (173.7 million m3/annum) when supported by the MMTS.
(e) Howick-North Sub-System
The Howick Reservoir Complex will have to supply newly developed areas to the north of Howick. This high level reservoir serves as a distribution reservoir that should have 48 hours of storage. The total storage is currently 6.6 Mℓ/day following the addition of a 6.5 Mℓ reservoir in October 2014 and the total current demand is 5.02 Mℓ/day.
(f) Howick-West Sub-System
(i) Mills Falls to Howick - West Reservoir
The rapid growth in demand of the Vulindlela Supply System impacts on the capacity of the upstream supply systems, especially the Mills Falls to Howick West Supply System. This system must be augmented to a meet the 20-year demand of 85 Mℓ/day, starting in 2025.
(ii) Howick - West Reservoir to Groenekloof Reservoir
Storage at Howick-West Reservoir is currently being increased by 16 Mℓ to bring the total storage to 32.5 Mℓ (Section 7.5.2 (d)). This would then adequately serve as a distribution reservoir until 2030. A new 400 mm diameter pipeline, dedicated to serve the Mpophomeni area, will be required by UMDM once the new Khayalisha housing development is constructed. The existing 250 mm diameter pipeline will then become a backfeed from the Mpophomeni Reservoir.
(iii) Vulindlela BWSS
The current demand on the Vulindlela BWSS is approximately 25.57 Mℓ/day and the projected demand is 63.1 Mℓ/day in 2049. The existing capacity of the system is capable of serving the current demand; although, future growth will exceed the system capacity. Extensive hydraulic analyses were conducted to optimise the hydraulic efficiency of the Vulindlela BWSS. The results of the hydraulic analyses indicated that the following infrastructure requirements, which are currently in detailed design stage (Section 7.5.2 (h)), are needed:
Construct a new pump station at Howick West Reservoir Complex by installing 3 x 22 Mℓ/day pump sets (2 x operating and 1 x standby).
Construct an 800 mm diameter pipeline of 11 km in length from Howick West Pump Station to Reservoir 2.
Construct a Pump Station at Reservoir 2 consisting of 2 x 18 Mℓ/day pump sets (1 x operating and 1 x standby).
112
Construct one 15 Mℓ Reservoir (25 Mℓ required in total) at the Reservoir 2 site as additional storage to the existing 10 Mℓ reservoir.
Construct a back-feed pipeline of 200mm diameter with a length of 6 km, from Reservoir 5 to supply Reservoir 3 and Reservoir 4.
.
(g) Midmar WTP to Umlaas Road Sub-System
(i) ’61 Pipeline: World’s View Reservoir to ED2
This section of infrastructure allows for the maximum of 330 Ml/day that the tunnels can deliver. No further infrastructure is required.
(ii) Thornville/Hopewell Supply
Thornville Reservoir is now supplied from both the Richmond pipeline and the existing Thornville Pump Station. The rising main from the ’61 Pipeline to Thornville is operated as a back-feed gravity main when supplying water to Thornville from the Richmond Pipeline.
(iii) ’53 Pipeline: D. V. Harris WTP to Umlaas Road Reservoir
This pipeline needs to remain operational until such time as the uMWP is commissioned. Thereafter it is recommended that it be decommissioned. In the interim, caution should be taken not to exceed the “safe load carrying capacity” of 35 Mℓ/day.
(h) Umlaas Road Sub-System
An analysis of the Umlaas Road Reservoir Complex showed that the augmentation to the ’61 Pipeline system resulted in little or no stress on the reservoirs. This coupled with the fact that eThekwini Municipality have indicated that they have sufficient storage in their system, and that they do not wish Umgeni Water to augment the Umlaas Road storage, means that there is no planned augmentation of storage at Umlaas Road. Additional storage will be constructed as part of the uMWP.
(i) Eston/Umbumbulu Pipeline
The capacity of this pipeline is restricted to 15 Mℓ/day due to the ground level profile along the pipeline route. The flow is restricted to ensure that the hydraulic grade line is at least 20 m above a high point at Stoney Ridge. A booster pump station will be constructed to increase the flow through this pipeline to a maximum 22 Mℓ/day (Section 8.5.2 (e)). The projected growth in demand is envisaged to peak at 50 Mℓ/day by the year 2047. To ensure the sustainability of supply, Umgeni Water has initiated a feasibility study to augment the existing supply system with a new pipeline.
(i) Wartburg Sub-System
New bulk supply infrastructure has been constructed to meet the projected demands of both existing consumers as well as the areas of greater Efaye, Ozwathini and Southern Ndwedwe (Section 7.5.2 (f) and Section 12.5.2 (a)).
113
The infrastructure is as follows:
26 km, 850 mm diameter pipeline from Claridge to Wartburg (construction completed in November 2015) including a 1.25 MW booster pump station (March 2018) and 8 Mℓ Reservoir at Wartburg (construction completed in July 2017).
15.5 km 700 mm diameter pipeline from Wartburg to Dalton including a 1.35 MW booster pump station and 10 Mℓ Reservoir at Dalton (November 2017).
10.7 km 750 mm diameter pipeline from Dalton to Fawn Leas (April 2018).
21.7 km long 700 mm diameter pipeline (June 2017) from Fawn Leas to a new 7 Mℓ reservoir (December 2018) at Ozwathini including a 0.5 MW booster pump station at Dalton (June 2017).
14.5 km long, 350 mm diameter pipeline from Fawn Leas to an existing reservoir at Nadi Mvoti (in Efaye) (June 2017).
(ii) Wartburg Reservoir to Bruyns Hill Reservoir
The 260 mm diameter Bruyns Hill pipeline between Bruyns Hill Pump Station and Bruyns Hill Reservoir was commissioned in 2012. The pipeline between Wartburg Reservoir and the existing Bruyns Hill pump station will have to be upgraded (Section 7.5.2 (g)). The existing pipeline system can only supply, under ideal conditions, a maximum of 6.4 Mℓ/day at a velocity of 1.5 m/s. This will not meet the ultimate demand of the area of supply. The Wartburg to Bruyns Hill Pipeline project will provide adequate supply to current and future supply areas and will eliminate non-supply issues at Swayimane. The project, which is complete, consists of two components:
Construction of a pipeline from Wartburg Reservoir to Bruyns Hill Pump Station; and
A pump station near the Wartburg Reservoir site.
(j) Recommendations for Lower Mgeni System
Figure 7.59 illustrates, schematically, the demands on the Lower Mgeni System in its current configuration. Future demands in this area will be supplied by the Lower Mgeni System Water Treatment Plants and through the Western Aqueduct. As such there are no new infrastructure projects planned for this area at this time. The following project has, however, been recommended to address operational challenges:
Replacement of the existing pump sets at the Wiggins High Lift Pump Station (HLPS). There is a short term risk of pump failure (non-supply) as the existing pumps are not appropriate for the current application. The project, currently at Detailed Design Stage, will not alter the capacity of the pump station but aims to satisfy the duty envelope more efficiently from both an energy and maintenance perspective. The HLPS was originally (1996) used as an emergency back-up supply to Durban Heights but has more recently become a permanent supply. In the long term there is a need to consider system optimisation of the municipality’s distribution network considering future demands and reliance on the HLPS.
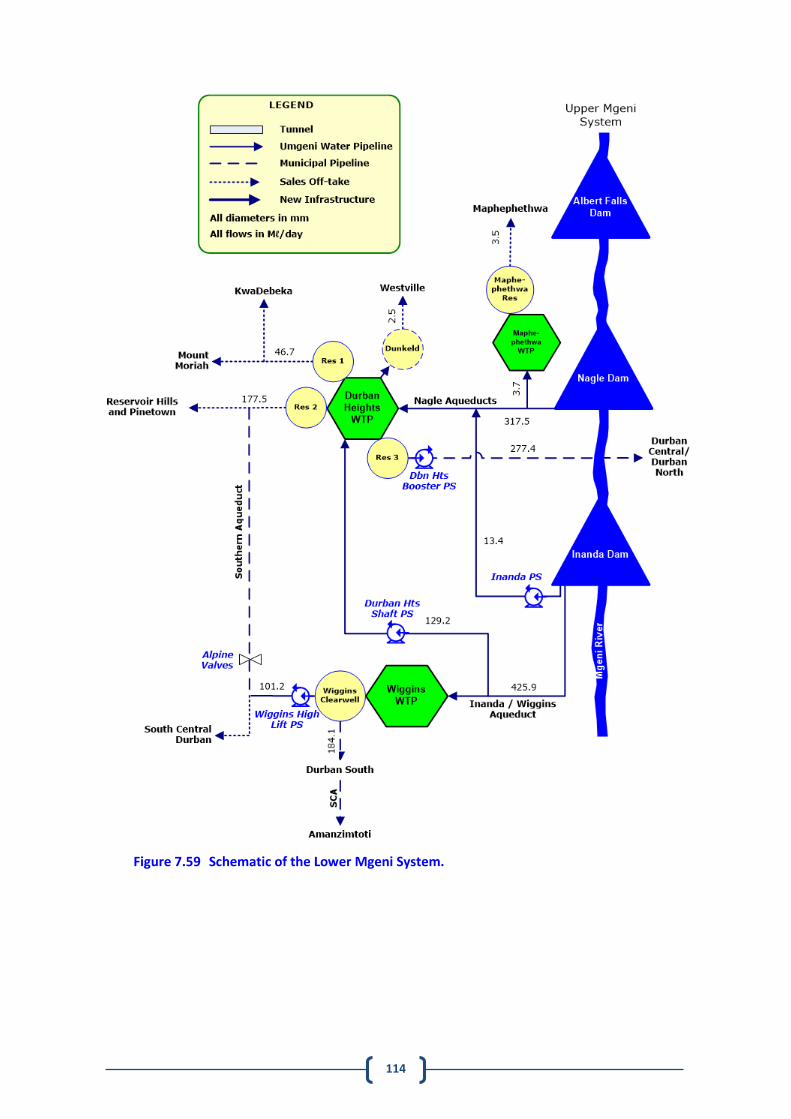
114
Figure 7.59 Schematic of the Lower Mgeni System.
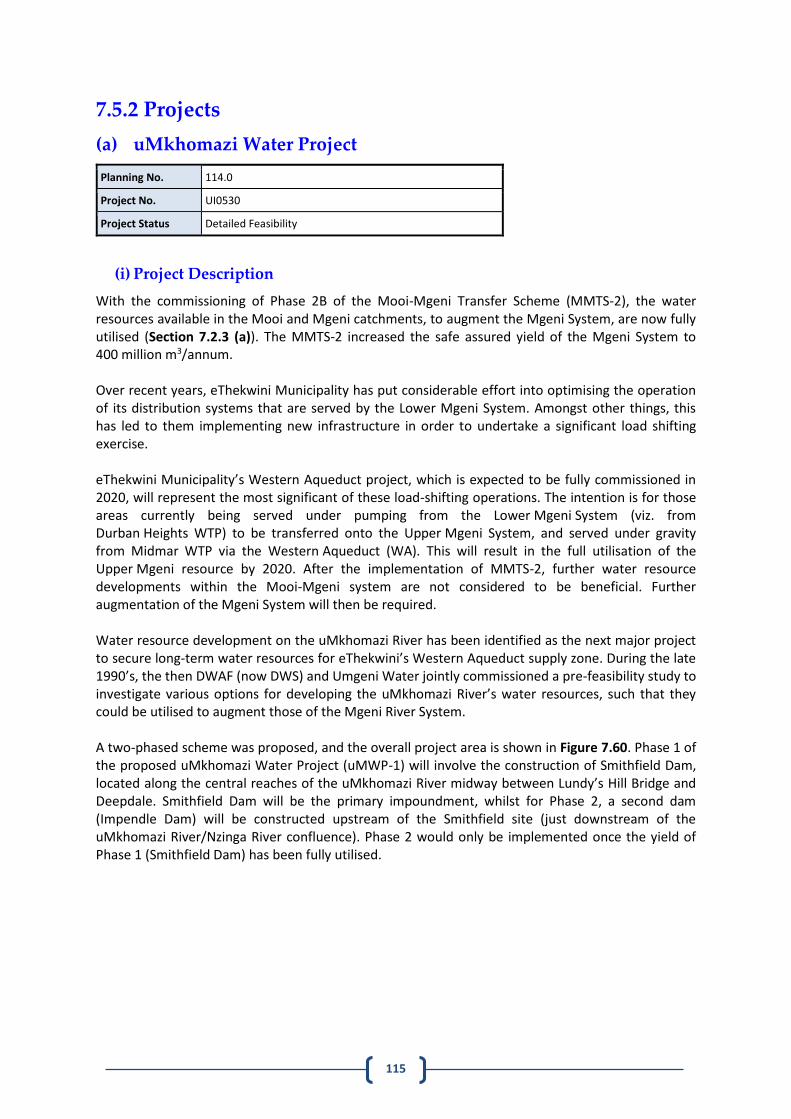
115
7.5.2 Projects
(a) uMkhomazi Water Project
Planning No. 114.0
Project No. UI0530
Project Status Detailed Feasibility
(i) Project Description
With the commissioning of Phase 2B of the Mooi-Mgeni Transfer Scheme (MMTS-2), the water resources available in the Mooi and Mgeni catchments, to augment the Mgeni System, are now fully utilised (Section 7.2.3 (a)). The MMTS-2 increased the safe assured yield of the Mgeni System to 400 million m3/annum. Over recent years, eThekwini Municipality has put considerable effort into optimising the operation of its distribution systems that are served by the Lower Mgeni System. Amongst other things, this has led to them implementing new infrastructure in order to undertake a significant load shifting exercise. eThekwini Municipality’s Western Aqueduct project, which is expected to be fully commissioned in 2020, will represent the most significant of these load-shifting operations. The intention is for those areas currently being served under pumping from the Lower Mgeni System (viz. from Durban Heights WTP) to be transferred onto the Upper Mgeni System, and served under gravity from Midmar WTP via the Western Aqueduct (WA). This will result in the full utilisation of the Upper Mgeni resource by 2020. After the implementation of MMTS-2, further water resource developments within the Mooi-Mgeni system are not considered to be beneficial. Further augmentation of the Mgeni System will then be required. Water resource development on the uMkhomazi River has been identified as the next major project to secure long-term water resources for eThekwini’s Western Aqueduct supply zone. During the late 1990’s, the then DWAF (now DWS) and Umgeni Water jointly commissioned a pre-feasibility study to investigate various options for developing the uMkhomazi River’s water resources, such that they could be utilised to augment those of the Mgeni River System. A two-phased scheme was proposed, and the overall project area is shown in Figure 7.60. Phase 1 of the proposed uMkhomazi Water Project (uMWP-1) will involve the construction of Smithfield Dam, located along the central reaches of the uMkhomazi River midway between Lundy’s Hill Bridge and Deepdale. Smithfield Dam will be the primary impoundment, whilst for Phase 2, a second dam (Impendle Dam) will be constructed upstream of the Smithfield site (just downstream of the uMkhomazi River/Nzinga River confluence). Phase 2 would only be implemented once the yield of Phase 1 (Smithfield Dam) has been fully utilised.
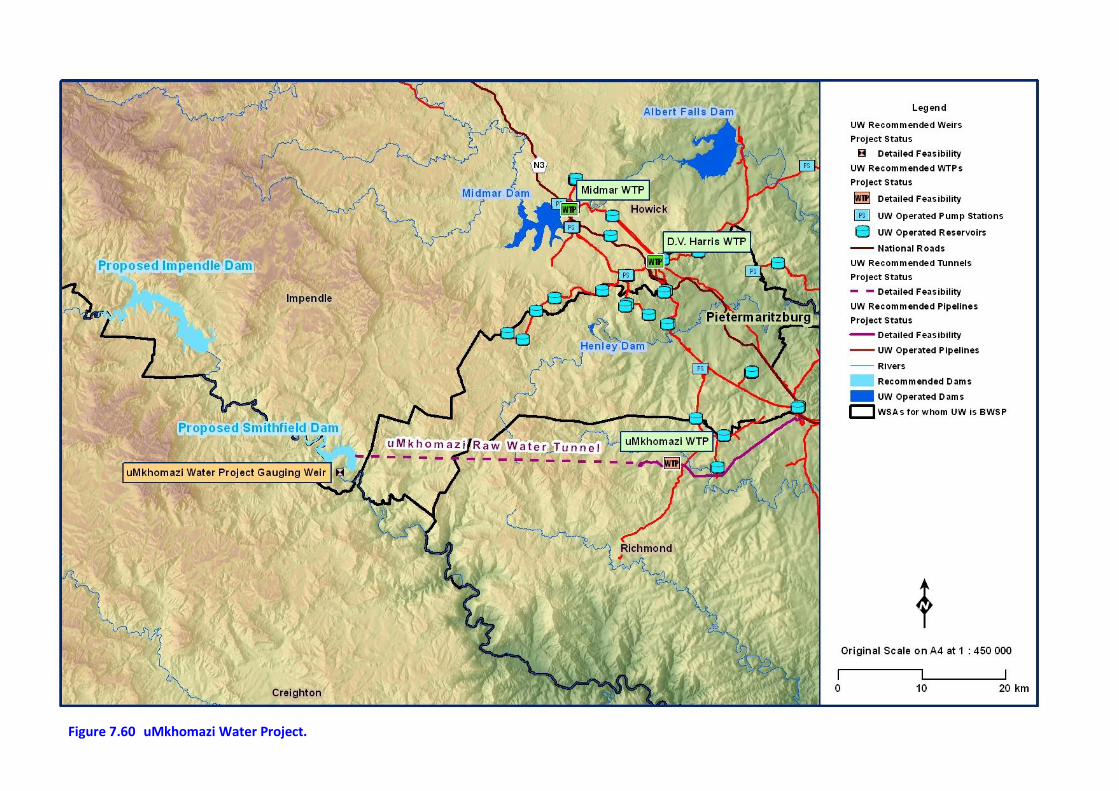
116
Figure 7.60 uMkhomazi Water Project.
117
Succinct details of the proposed potable water infrastructure are as follows: Water treatment plant design: In order to meet the proposed phased increases in demand as well as a requirement to provide support to the Mgeni System, the capacity of the uMWP-1 WTP is proposed to be 500 Ml/day. A further 125 Ml/day phase would be required in 2044. The proposed WTP layout (Figure 7.61) was constrained by the requirement for gravity supply in the overall system between Smithfield Dam and the Umlaas Road tie-in, as well as a requirement to keep the WTP footprint to a minimum. The proposed plant layout combines features of accessible and compact unit process configuration, minimum lengths of interconnecting pipework, minimum volume of excavation and ease of future extension. The recommended WTP processes are pre-chlorination, coagulation/flocculation, high-rate clarifiers, rapid gravity filtration, granular activated carbon (GAC) filtration, final chlorination and sludge treatment.
Figure 7.61 Layout of Water Treatment Plant.
Potable water reservoir: The potable water reservoir was sized to accommodate a minimum of six hours of the daily WTP capacity. Based on the WTP phasing discussed above the first 500 Ml/day WTP phase would require 125 Ml of storage, with a further 31.25 Ml/day required when the next 125 Ml/day WTP phase is constructed in 2044, i.e. a total of 156.25 Ml of storage for the uMWP-1. The reservoir for the uMWP-1 would require a footprint of 2.2 hectares. In light of a requirement to keep the WTP footprint to a minimum, it was proposed that potable water storage be constructed beneath various WTW structures. Potable water pipeline: The potable water pipeline (Figure 7.62) was designed to accommodate an average annual daily demand of 602 Ml/day; equivalent to the 1:100 year yield of the Smithfield. The peak design capacity was 753 Ml/day. Pipelines ranging from 2 820 mm diameter (15.1 km) to 2 540 mm diameter is proposed to convey the peak demand of 753 Ml/day.
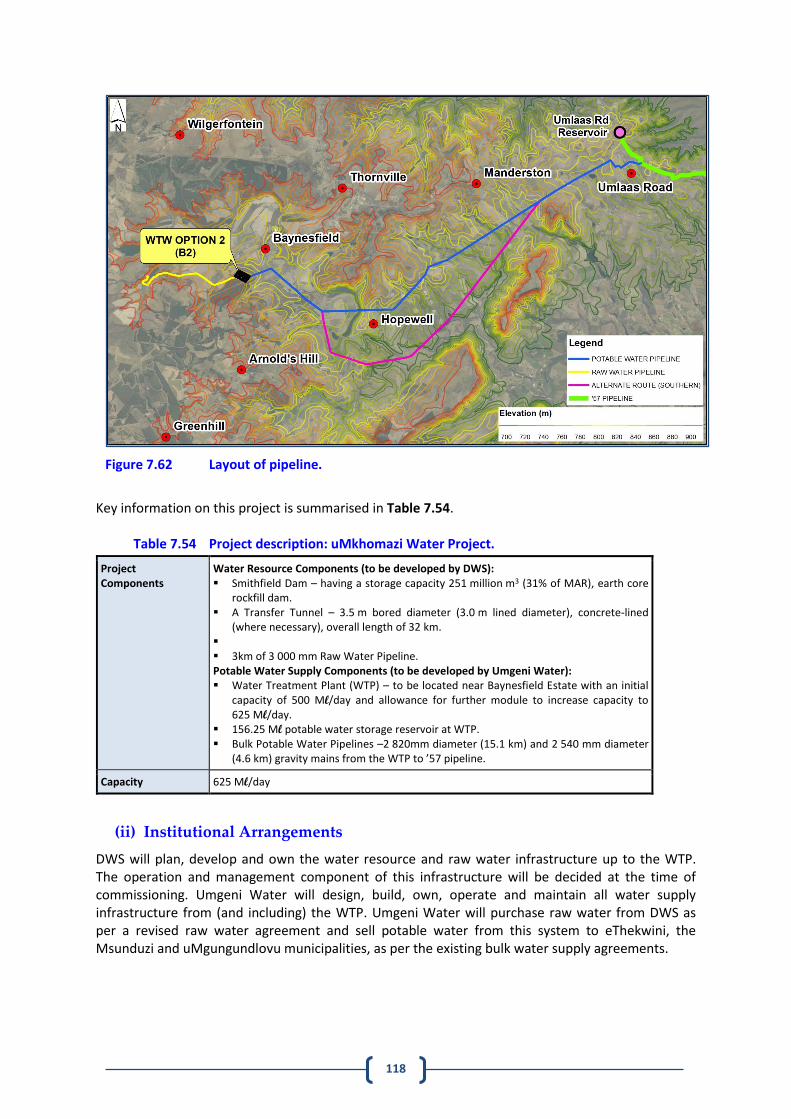
118
Figure 7.62 Layout of pipeline.
Key information on this project is summarised in Table 7.54.
Table 7.54 Project description: uMkhomazi Water Project.
Project Components
Water Resource Components (to be developed by DWS): Smithfield Dam – having a storage capacity 251 million m3 (31% of MAR), earth core
rockfill dam. A Transfer Tunnel – 3.5 m bored diameter (3.0 m lined diameter), concrete-lined
(where necessary), overall length of 32 km. 3km of 3 000 mm Raw Water Pipeline. Potable Water Supply Components (to be developed by Umgeni Water): Water Treatment Plant (WTP) – to be located near Baynesfield Estate with an initial
capacity of 500 Ml/day and allowance for further module to increase capacity to 625 Ml/day.
156.25 Ml potable water storage reservoir at WTP. Bulk Potable Water Pipelines –2 820mm diameter (15.1 km) and 2 540 mm diameter
(4.6 km) gravity mains from the WTP to ’57 pipeline.
Capacity 625 Ml/day
(ii) Institutional Arrangements
DWS will plan, develop and own the water resource and raw water infrastructure up to the WTP. The operation and management component of this infrastructure will be decided at the time of commissioning. Umgeni Water will design, build, own, operate and maintain all water supply infrastructure from (and including) the WTP. Umgeni Water will purchase raw water from DWS as per a revised raw water agreement and sell potable water from this system to eThekwini, the Msunduzi and uMgungundlovu municipalities, as per the existing bulk water supply agreements.
119
(iii) Beneficiaries
The scheme will primarily serve the eThekwini Municipal area and to a lesser extent portions of uMgungundlovu District Municipality. Assuming 200 l/person/day, the estimated number of beneficiaries from the anticipated capacity of 625 Ml/day may be 3 125 000 people.
(iv) Implementation
The project is divided into three components:
Module 1: Technical Feasibility Study: Raw Water (Appointment by Department of Water and Sanitation). The study was completed in 2015;
Module 2: Environmental Impact Assessment (Joint appointment by Department of Water Affairs and Umgeni Water). Report was submitted in December 2016 but further work required on the raw water component.;
Module 3: Technical Feasibility Study: Potable Water (Appointment of PSP by Umgeni Water). The study was completed in 2015.
The project should have been implemented by 2020 in order to achieve a 99% level of assurance of supply to the Mgeni System. However, the earliest probable commissioning of this scheme is 2028. The estimated cost of the entire project (raw and potable components) is approximately R 33 billion at 2019 prices. This is made up of R 24.5 billion for the raw water component to be implemented by DWS and R 8 billion for the potable component to be implemented by Umgeni Water.
120
(b) Impendle BWSS
Planning No. 105.44
Project No. UI0544A
Project Status Detailed design
(i) Project Description
The area of Impendle has unreliable sources of water and many small run-off-river abstraction and borehole schemes. This project will increase the level of assurance of supply to the community of Impendle as requested by uMgungundlovu District Municipality. The water schemes are part of the Impendle bulk water supply project for the Impendle Local Municipality. The Impendle Municipality’s topography predominantly comprises rolling hills, mountains and scattered settlements covering an area of 948 km2. Due to the nature of the area’s topography and extended scattered settlements, two separate bulk water supply schemes are proposed. One bulk scheme will serve the north western part of the Municipality that includes communities from Stepmore to the Lotheni area. The second bulk scheme will provide water to the communities on the east (Figure 7.63).
Stepmore The proposed source for the scheme is a new river intake to be constructed on the uMkhomazi River. Raw water from this intake will be delivered to a proposed Stepmore Water Treatment Plant (WTP), where the water will be purified. The WTP is situated on a greenfield site and will have a initial capacity of 1.6 Ml/day upgradable to 3.0 Ml/day when required. From a high-lift pump station within the WTP site, purified water will be delivered through a clear water rising main to Lotheni 1 Reservoir with a capacity of 1Mℓ. From Lotheni 1 Reservoir a gravity main will convey water to Lotheni 2 Reservoir. From the Lotheni 1 and 2 Reservoirs, distribution mains will convey the water by gravity to existing distribution networks in the areas of Stepmore, Inkangala and Lotheni. Umgeni Water will be responsible for the implementation of the Bulk Works from the Abstraction and Water Treatment Plant to the Lotheni 2 Reservoir.
Nzinga The proposed source for the scheme is a new river intake to be constructed on the uMkhomazi River. Raw water from this intake will be pumped to the proposed Nzinga Raw Water Pump Station (NRWPS) located approximately 190 metres from the intake structure. From the NRWPS, raw water will be delivered through a 325/355 mm diameter x 7.6 km long rising main to the Nzinga WTP located on the same site as the existing WTP. The pipeline is designed to supply 275 kℓ/hr of raw water. The BWSS will be operated and maintained by Umgeni Water. Key information on this project is summarised in Table 7.55.
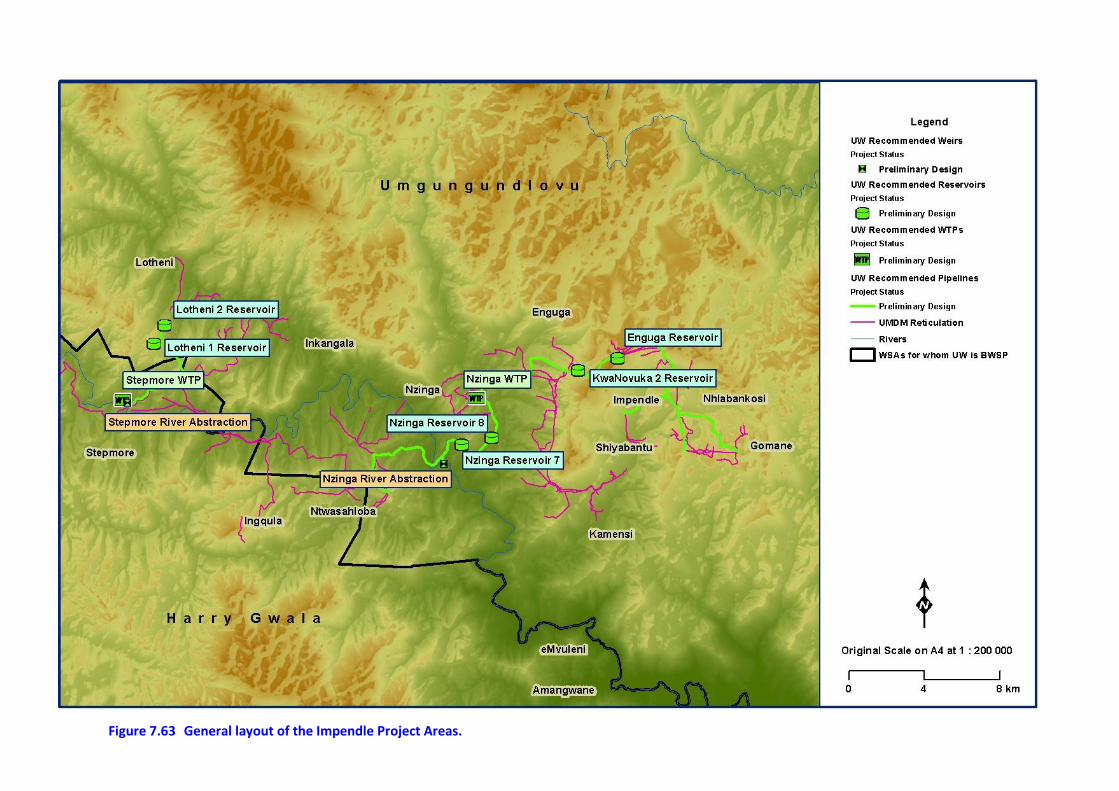
121
Figure 7.63 General layout of the Impendle Project Areas.
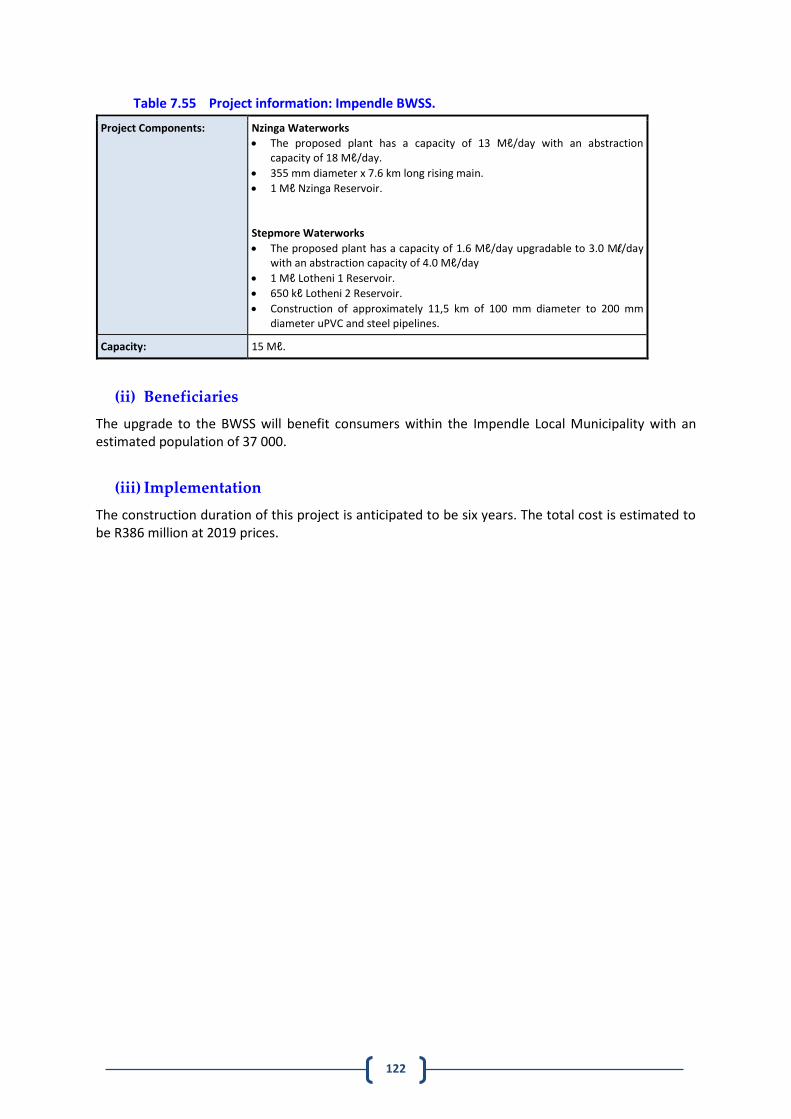
122
Table 7.55 Project information: Impendle BWSS.
Project Components: Nzinga Waterworks
The proposed plant has a capacity of 13 Mℓ/day with an abstraction capacity of 18 Mℓ/day.
355 mm diameter x 7.6 km long rising main.
1 Mℓ Nzinga Reservoir.
Stepmore Waterworks
The proposed plant has a capacity of 1.6 Mℓ/day upgradable to 3.0 Ml/day with an abstraction capacity of 4.0 Mℓ/day
1 Mℓ Lotheni 1 Reservoir.
650 kℓ Lotheni 2 Reservoir.
Construction of approximately 11,5 km of 100 mm diameter to 200 mm diameter uPVC and steel pipelines.
Capacity: 15 Mℓ.
(ii) Beneficiaries
The upgrade to the BWSS will benefit consumers within the Impendle Local Municipality with an estimated population of 37 000.
(iii) Implementation
The construction duration of this project is anticipated to be six years. The total cost is estimated to be R386 million at 2019 prices.
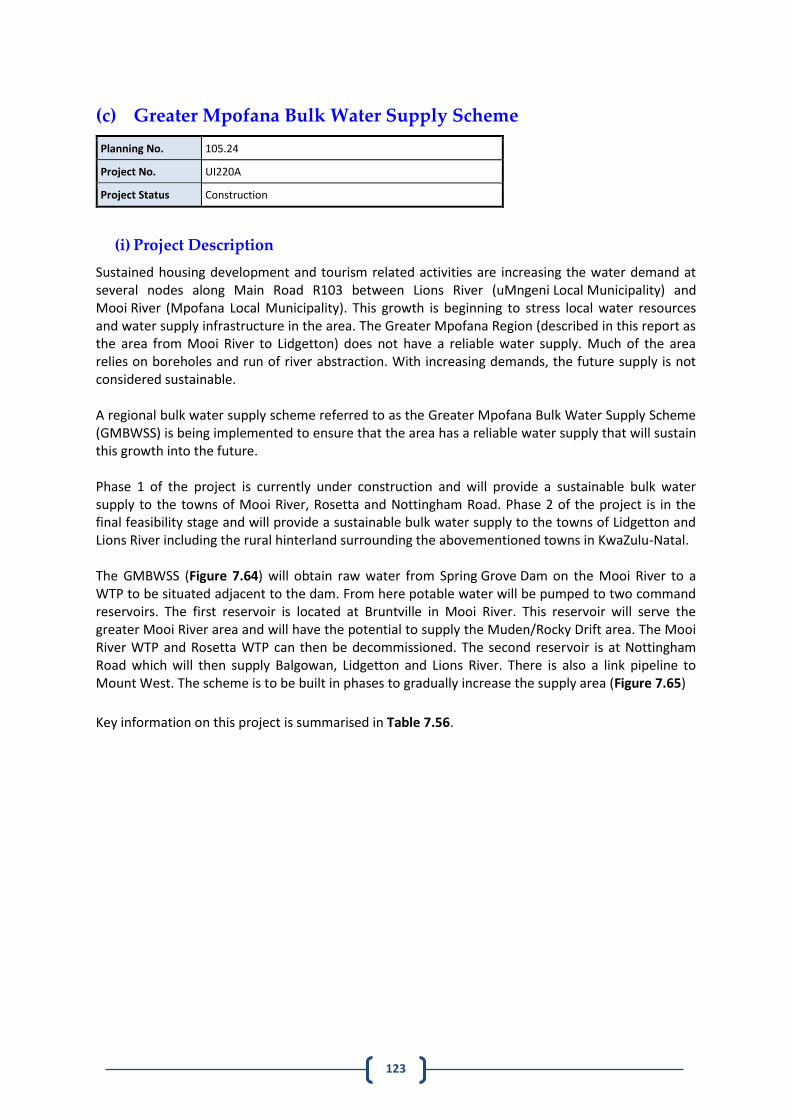
123
(c) Greater Mpofana Bulk Water Supply Scheme
Planning No. 105.24
Project No. UI220A
Project Status Construction
(i) Project Description
Sustained housing development and tourism related activities are increasing the water demand at several nodes along Main Road R103 between Lions River (uMngeni Local Municipality) and Mooi River (Mpofana Local Municipality). This growth is beginning to stress local water resources and water supply infrastructure in the area. The Greater Mpofana Region (described in this report as the area from Mooi River to Lidgetton) does not have a reliable water supply. Much of the area relies on boreholes and run of river abstraction. With increasing demands, the future supply is not considered sustainable. A regional bulk water supply scheme referred to as the Greater Mpofana Bulk Water Supply Scheme (GMBWSS) is being implemented to ensure that the area has a reliable water supply that will sustain this growth into the future. Phase 1 of the project is currently under construction and will provide a sustainable bulk water supply to the towns of Mooi River, Rosetta and Nottingham Road. Phase 2 of the project is in the final feasibility stage and will provide a sustainable bulk water supply to the towns of Lidgetton and Lions River including the rural hinterland surrounding the abovementioned towns in KwaZulu-Natal. The GMBWSS (Figure 7.64) will obtain raw water from Spring Grove Dam on the Mooi River to a WTP to be situated adjacent to the dam. From here potable water will be pumped to two command reservoirs. The first reservoir is located at Bruntville in Mooi River. This reservoir will serve the greater Mooi River area and will have the potential to supply the Muden/Rocky Drift area. The Mooi River WTP and Rosetta WTP can then be decommissioned. The second reservoir is at Nottingham Road which will then supply Balgowan, Lidgetton and Lions River. There is also a link pipeline to Mount West. The scheme is to be built in phases to gradually increase the supply area (Figure 7.65)
Key information on this project is summarised in Table 7.56.
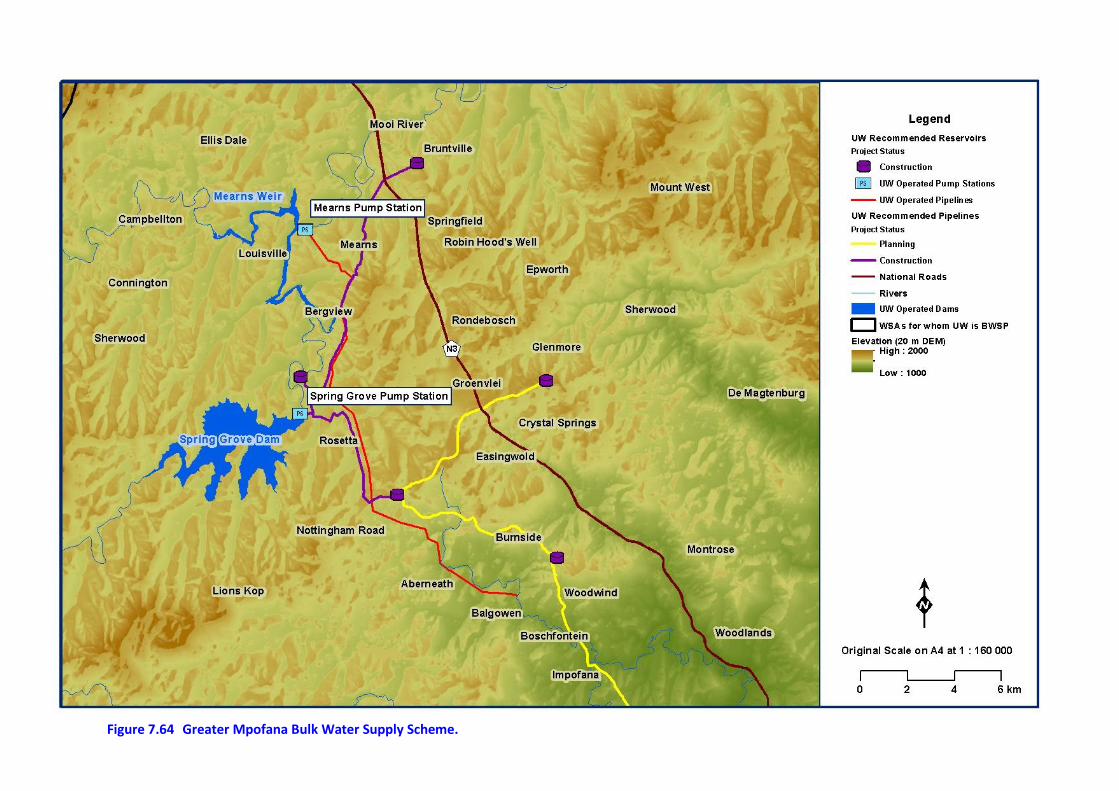
124
Figure 7.64 Greater Mpofana Bulk Water Supply Scheme.
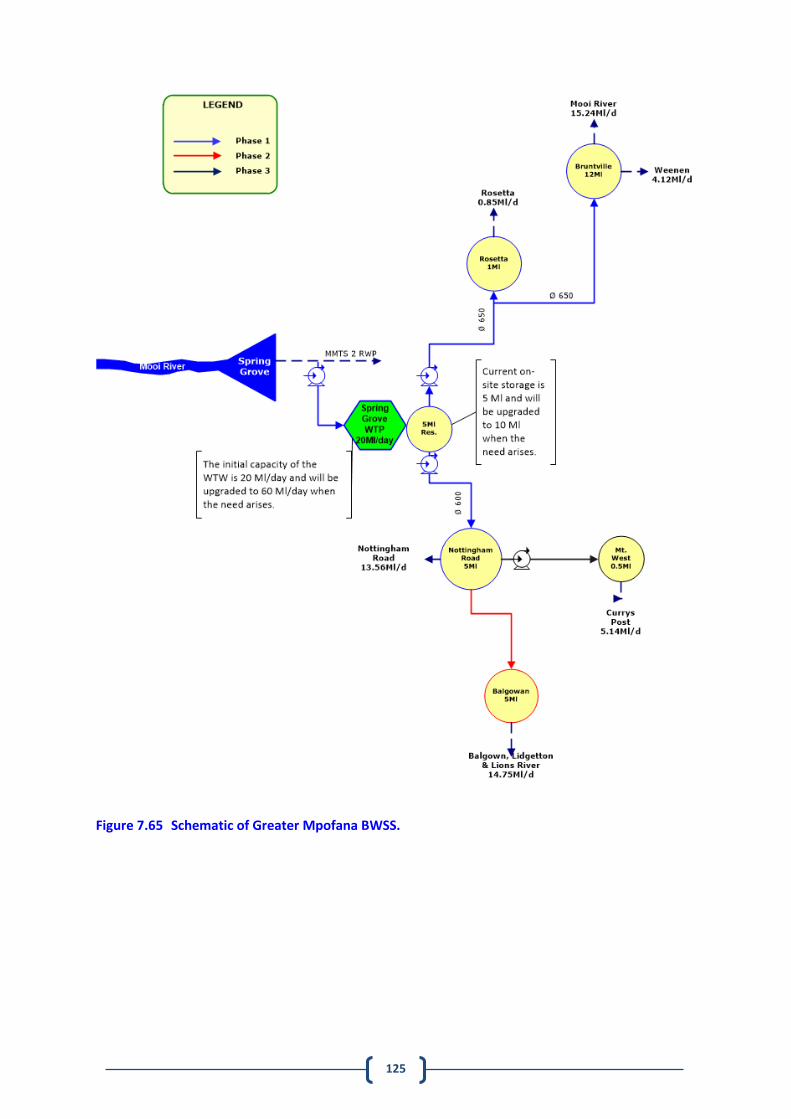
125
Figure 7.65 Schematic of Greater Mpofana BWSS.
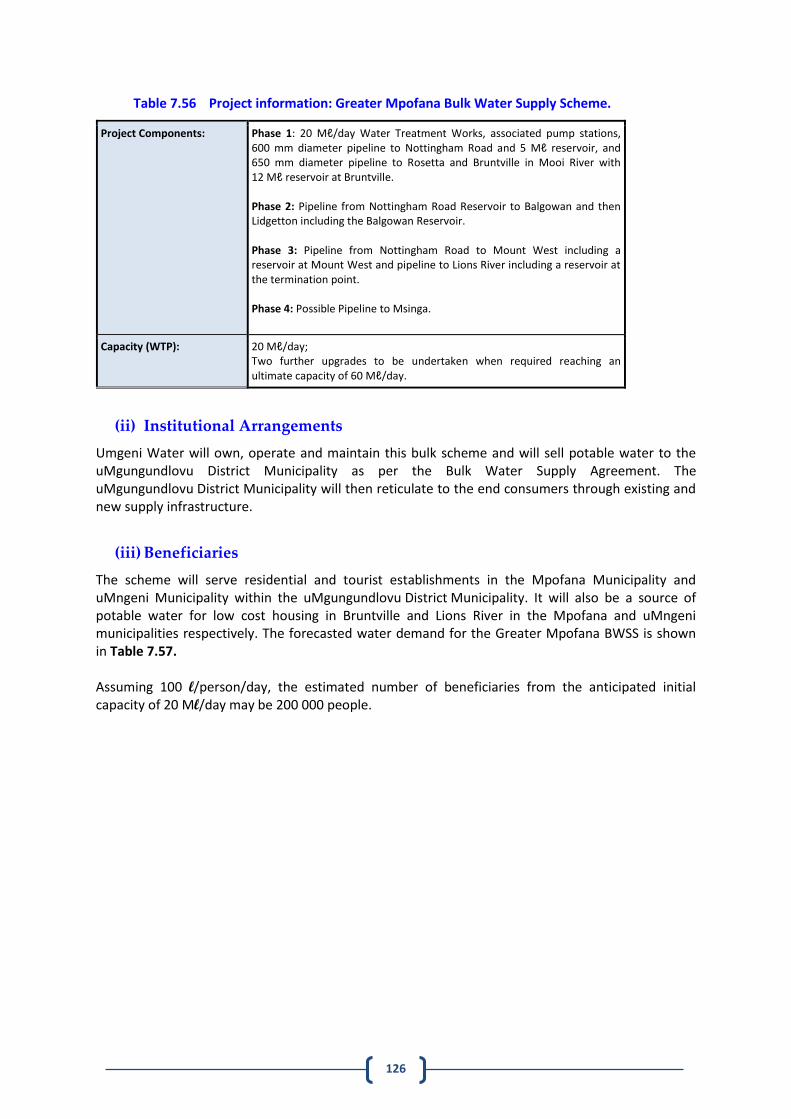
126
Table 7.56 Project information: Greater Mpofana Bulk Water Supply Scheme.
Project Components: Phase 1: 20 Mℓ/day Water Treatment Works, associated pump stations, 600 mm diameter pipeline to Nottingham Road and 5 Mℓ reservoir, and 650 mm diameter pipeline to Rosetta and Bruntville in Mooi River with 12 Mℓ reservoir at Bruntville. Phase 2: Pipeline from Nottingham Road Reservoir to Balgowan and then Lidgetton including the Balgowan Reservoir. Phase 3: Pipeline from Nottingham Road to Mount West including a reservoir at Mount West and pipeline to Lions River including a reservoir at the termination point. Phase 4: Possible Pipeline to Msinga.
Capacity (WTP): 20 Mℓ/day; Two further upgrades to be undertaken when required reaching an ultimate capacity of 60 Mℓ/day.
(ii) Institutional Arrangements
Umgeni Water will own, operate and maintain this bulk scheme and will sell potable water to the uMgungundlovu District Municipality as per the Bulk Water Supply Agreement. The uMgungundlovu District Municipality will then reticulate to the end consumers through existing and new supply infrastructure.
(iii) Beneficiaries
The scheme will serve residential and tourist establishments in the Mpofana Municipality and uMngeni Municipality within the uMgungundlovu District Municipality. It will also be a source of potable water for low cost housing in Bruntville and Lions River in the Mpofana and uMngeni municipalities respectively. The forecasted water demand for the Greater Mpofana BWSS is shown in Table 7.57. Assuming 100 l/person/day, the estimated number of beneficiaries from the anticipated initial capacity of 20 Ml/day may be 200 000 people.
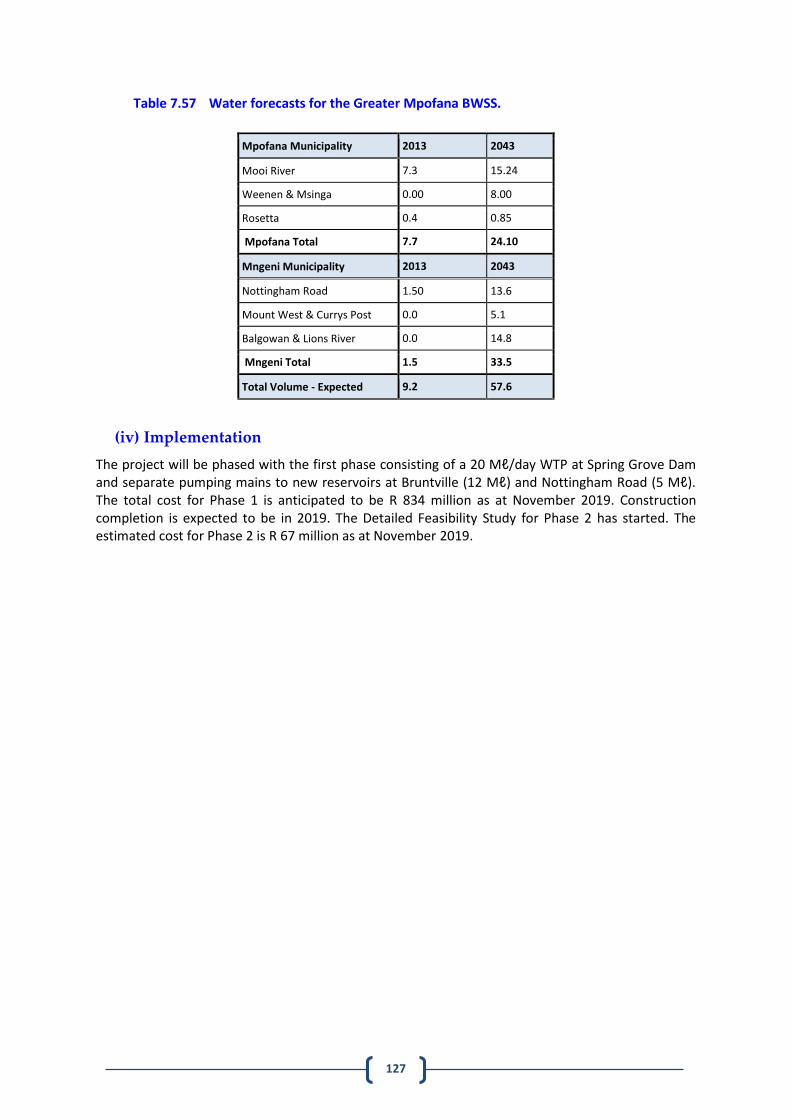
127
Table 7.57 Water forecasts for the Greater Mpofana BWSS.
Mpofana Municipality 2013 2043
Mooi River 7.3 15.24
Weenen & Msinga 0.00 8.00
Rosetta 0.4 0.85
Mpofana Total 7.7 24.10
Mngeni Municipality 2013 2043
Nottingham Road 1.50 13.6
Mount West & Currys Post 0.0 5.1
Balgowan & Lions River 0.0 14.8
Mngeni Total 1.5 33.5
Total Volume - Expected 9.2 57.6
(iv) Implementation
The project will be phased with the first phase consisting of a 20 Mℓ/day WTP at Spring Grove Dam and separate pumping mains to new reservoirs at Bruntville (12 Mℓ) and Nottingham Road (5 Mℓ). The total cost for Phase 1 is anticipated to be R 834 million as at November 2019. Construction completion is expected to be in 2019. The Detailed Feasibility Study for Phase 2 has started. The estimated cost for Phase 2 is R 67 million as at November 2019.
128
(d) Howick-West Reservoir Upgrade
Planning No. 105.03
Project No. UI0613A/CI.00024
Project Status Construction
(i) Project Description
Potable water is supplied to the Howick-West Reservoir Complex from Midmar WTP via the Mills Falls Pump Station along a 700 mm NB diameter steel pipeline. The current total storage capacity at the Howick-West Reservoir Complex is 16.5 Mℓ and serves as the distribution node for the supply area (Figure 7.67). Water is then pumped from the Howick-West Reservoir Complex to Mpophomeni and Groenekloof Reservoirs via the Howick-West Pump Station along a 250 mm and a 600 mm diameter steel pipeline respectively. The Groenekloof Reservoir Complex, with a current total storage capacity of 17.27 Mℓ, serves as a further distribution node from where the water is pumped to the Greater Vulindlela area and gravity-fed to the Sweetwaters and Blackridge terminal reservoirs. The uMngeni Local Municipality is in the process of implementing a low-cost housing development in the Mpophomeni supply area and middle to high-income residential development in the Garlington area. These proposed developments, combined with the natural growth of the Howick-West Supply System, will place undue stress on the Howick-West Reservoir Complex to sustain the projected demand. To sustain the current and future demand off the Howick-West Reservoir Complex, it is necessary to augment the existing storage capacity at the Howick West Reservoir Complex. The storage requirement is based on the following reservoir sizing parameters:
Storage for reticulation supply: 36 hours.
Storage for Mpophomeni Reservoir supply: 15 hours.
Storage for Groenekloof Reservoir supply: 8 hours. Groenekloof Reservoir is in itself a balancing reservoir therefore, to avoid “double accounting” of storage required for the Groenekloof demand, this balancing demand will be shared between the reservoirs.
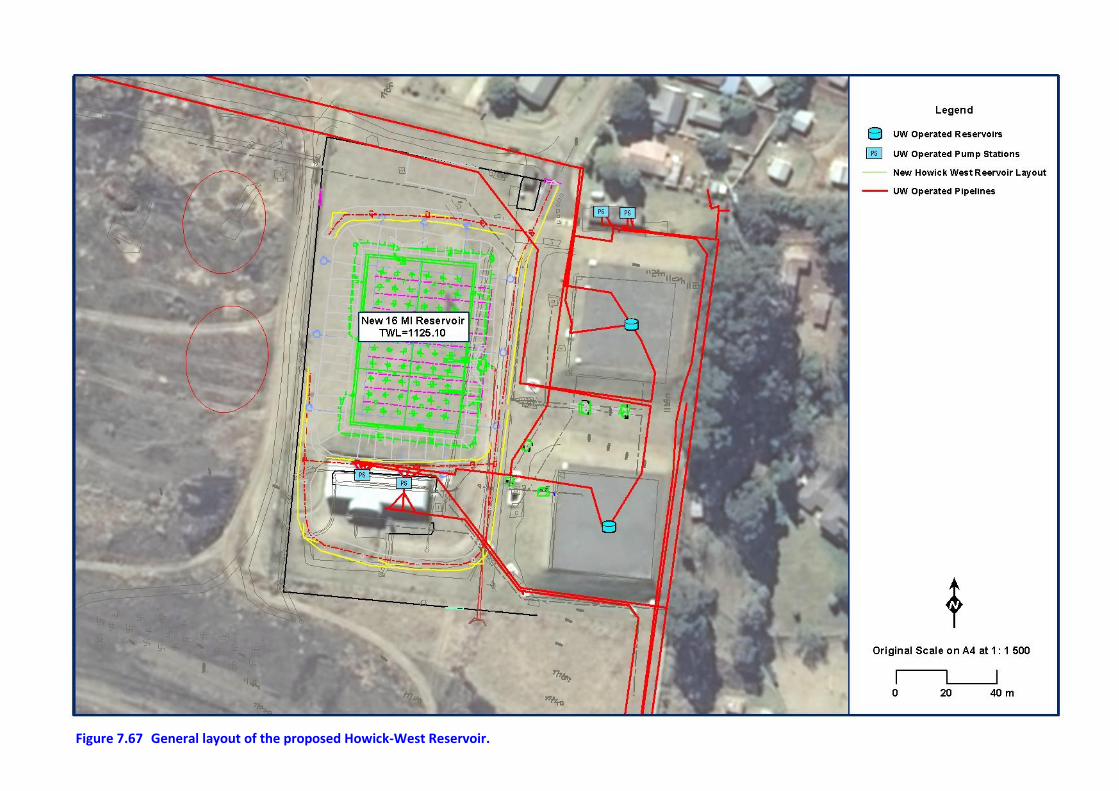
129
Figure 7.67 General layout of the proposed Howick-West Reservoir.
130
Table 7.58 Storage Requirement at Howick-West Reservoir.
Supply Demand in 2028
(Mℓ/day) Time (hours)
Required Storage (Mℓ)
Reticulation 4.5 36 6.8
Mpophomeni 10.6 15 6.6
Groenekloof 48.0 8 16.5
TOTAL STORAGE REQUIREMENT 30.0
The determination of the storage requirement at Howick-West Reservoir is indicated in Table 7.58. Based on storage requirements and the demand projection, the upgrade of storage at Howick West Reservoir was already required in 2015. Reservoirs are sized for a 10 year future demand; hence the upgraded storage requirement is therefore determined on the 2025 demand. The current storage of 16.5 Mℓ is being increased by adding a new 16 Mℓ reservoir. This will bring the total storage up to 32.5 Mℓ. Key information on this project is summarised in Table 7.59.
Table 7.59 Project information: Howick-West Reservoir Upgrade.
Project Components: New reservoir
Capacity: 16.0 Mℓ
(ii) Institutional Arrangements
The new Howick-West Reservoir will be owned, operated and maintained by Umgeni Water.
(iii) Beneficiaries
The upgrade to Howick-West Reservoir serves as a balancing reservoir that will indirectly serve Vulindlela, Blackridge and Sweetwaters in The Msunduzi Municipality and Mpophomeni and Hilton in the uMngeni Municipality. Assuming 200 l/person/day, the estimated number of beneficiaries from the anticipated capacity of 16 Ml/day may be 80 000 people.
(iv) Implementation
The construction duration of this project is anticipated to be one year. The total cost is estimated to be R76 million as at 2019.
131
(e) Umbumbulu Pump Station
Planning No. 105.37
Project No. CI.00011
Project Status Detailed design
(i) Project Description
Supply to Greater Eston and Umbumbulu is via a 450 mm diameter pipeline. The capacity of this pipeline is restricted to 15 Mℓ/day due to the ground level profile along the pipeline route. The flow is restricted to ensure that the hydraulic grade line is at least 20 m above a high point at Stoney Ridge. The current flow in this pipeline is 11 Mℓ/day. uMgungundlovu District Municipality supplies the Greater Eston area with potable water from this pipeline. This, together with the natural growth in Umbumbulu, will mean that the flow in this pipeline could reach capacity by 2017/2018. A booster pump station would increase the capacity of the pipeline to serve future water demands. A static hydraulic analysis indicates that the pump station be situated close to the DN450 off-take to Umbumbulu (Figure 7.68).
Table 7.60 Project information: Umbumbulu.
Project Components: Designed to deliver approximately 23 Mℓ/day at 98 m pumping head. This requires four (4) pumps, three duty and one stand-by.
Capacity: 23 Mℓ/day.
(ii) Institutional Arrangements
Umgeni Water will own, operate and maintain the pump station and will sell potable water from this system to uMgungundlovu District Municipality and eThekwini Municipality as per existing bulk water supply agreements.
(iii) Beneficiaries
The beneficiaries will be the Greater Eston region, including the Umbumbulu and the Adams Mission communities. Assuming 100 l/person/day, the estimated number of beneficiaries from the anticipated capacity of 23 Ml/day may be 230 000 people.
(iv) Implementation
The construction duration of this project is anticipated to be one year. The total cost is anticipated to be R 85 million as at November 2019.
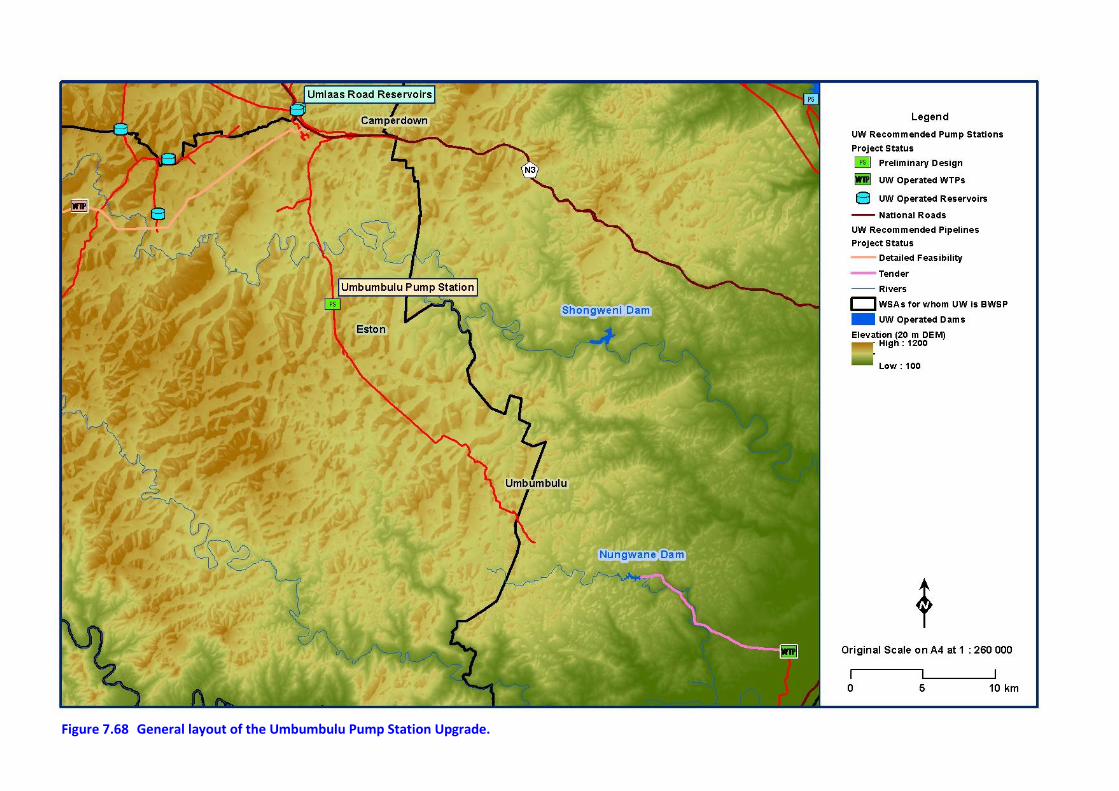
132
Figure 7.68 General layout of the Umbumbulu Pump Station Upgrade.
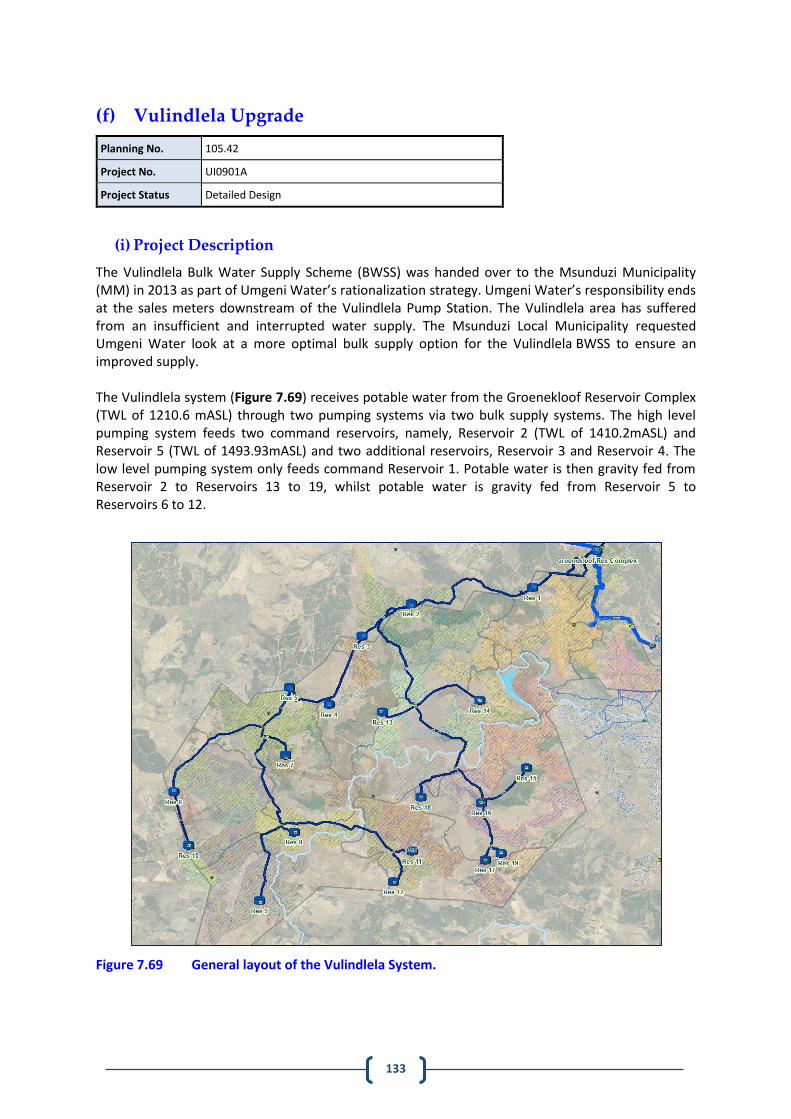
133
(f) Vulindlela Upgrade
Planning No. 105.42
Project No. UI0901A
Project Status Detailed Design
(i) Project Description
The Vulindlela Bulk Water Supply Scheme (BWSS) was handed over to the Msunduzi Municipality (MM) in 2013 as part of Umgeni Water’s rationalization strategy. Umgeni Water’s responsibility ends at the sales meters downstream of the Vulindlela Pump Station. The Vulindlela area has suffered from an insufficient and interrupted water supply. The Msunduzi Local Municipality requested Umgeni Water look at a more optimal bulk supply option for the Vulindlela BWSS to ensure an improved supply. The Vulindlela system (Figure 7.69) receives potable water from the Groenekloof Reservoir Complex (TWL of 1210.6 mASL) through two pumping systems via two bulk supply systems. The high level pumping system feeds two command reservoirs, namely, Reservoir 2 (TWL of 1410.2mASL) and Reservoir 5 (TWL of 1493.93mASL) and two additional reservoirs, Reservoir 3 and Reservoir 4. The low level pumping system only feeds command Reservoir 1. Potable water is then gravity fed from Reservoir 2 to Reservoirs 13 to 19, whilst potable water is gravity fed from Reservoir 5 to Reservoirs 6 to 12.
Figure 7.69 General layout of the Vulindlela System.
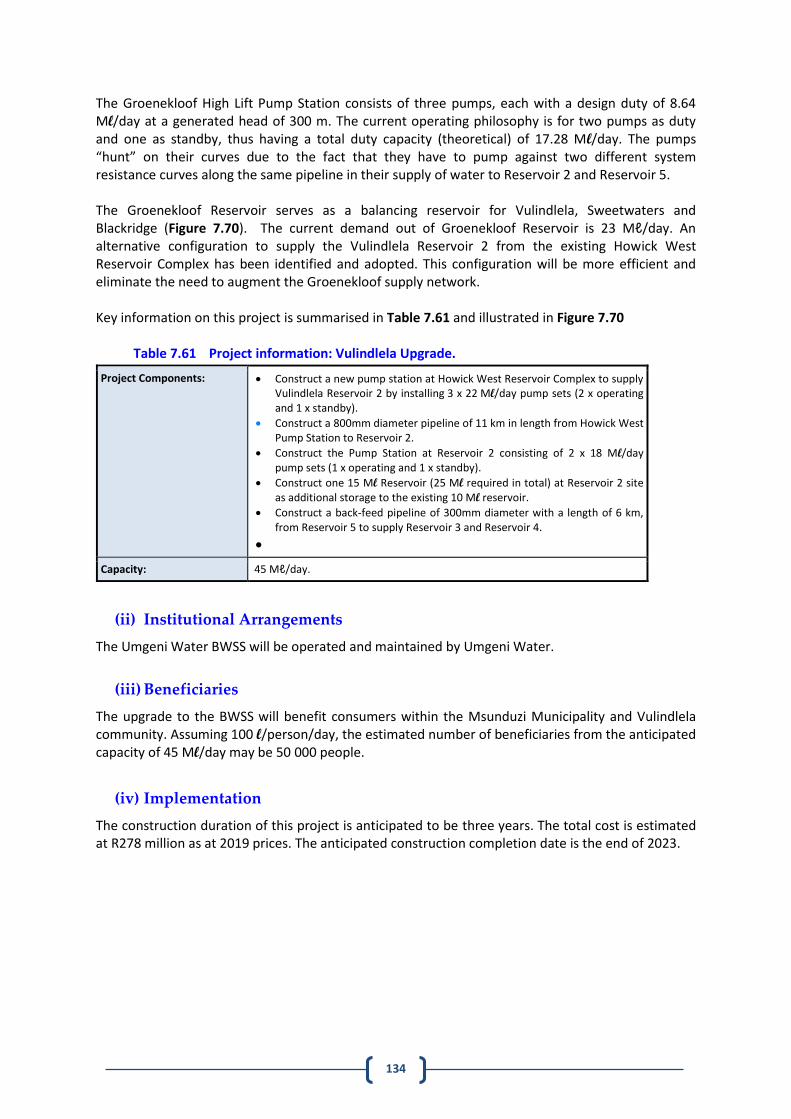
134
The Groenekloof High Lift Pump Station consists of three pumps, each with a design duty of 8.64 Ml/day at a generated head of 300 m. The current operating philosophy is for two pumps as duty and one as standby, thus having a total duty capacity (theoretical) of 17.28 Ml/day. The pumps “hunt” on their curves due to the fact that they have to pump against two different system resistance curves along the same pipeline in their supply of water to Reservoir 2 and Reservoir 5. The Groenekloof Reservoir serves as a balancing reservoir for Vulindlela, Sweetwaters and Blackridge (Figure 7.70). The current demand out of Groenekloof Reservoir is 23 Mℓ/day. An alternative configuration to supply the Vulindlela Reservoir 2 from the existing Howick West Reservoir Complex has been identified and adopted. This configuration will be more efficient and eliminate the need to augment the Groenekloof supply network. Key information on this project is summarised in Table 7.61 and illustrated in Figure 7.70
Table 7.61 Project information: Vulindlela Upgrade.
Project Components: Construct a new pump station at Howick West Reservoir Complex to supply Vulindlela Reservoir 2 by installing 3 x 22 Ml/day pump sets (2 x operating and 1 x standby).
Construct a 800mm diameter pipeline of 11 km in length from Howick West Pump Station to Reservoir 2.
Construct the Pump Station at Reservoir 2 consisting of 2 x 18 Ml/day pump sets (1 x operating and 1 x standby).
Construct one 15 Ml Reservoir (25 Ml required in total) at Reservoir 2 site as additional storage to the existing 10 Ml reservoir.
Construct a back-feed pipeline of 300mm diameter with a length of 6 km, from Reservoir 5 to supply Reservoir 3 and Reservoir 4.
Capacity: 45 Mℓ/day.
(ii) Institutional Arrangements
The Umgeni Water BWSS will be operated and maintained by Umgeni Water.
(iii) Beneficiaries
The upgrade to the BWSS will benefit consumers within the Msunduzi Municipality and Vulindlela community. Assuming 100 l/person/day, the estimated number of beneficiaries from the anticipated capacity of 45 Ml/day may be 50 000 people.
(iv) Implementation
The construction duration of this project is anticipated to be three years. The total cost is estimated at R278 million as at 2019 prices. The anticipated construction completion date is the end of 2023.
135
Figure 7.70 Vulindlela Upgrade.
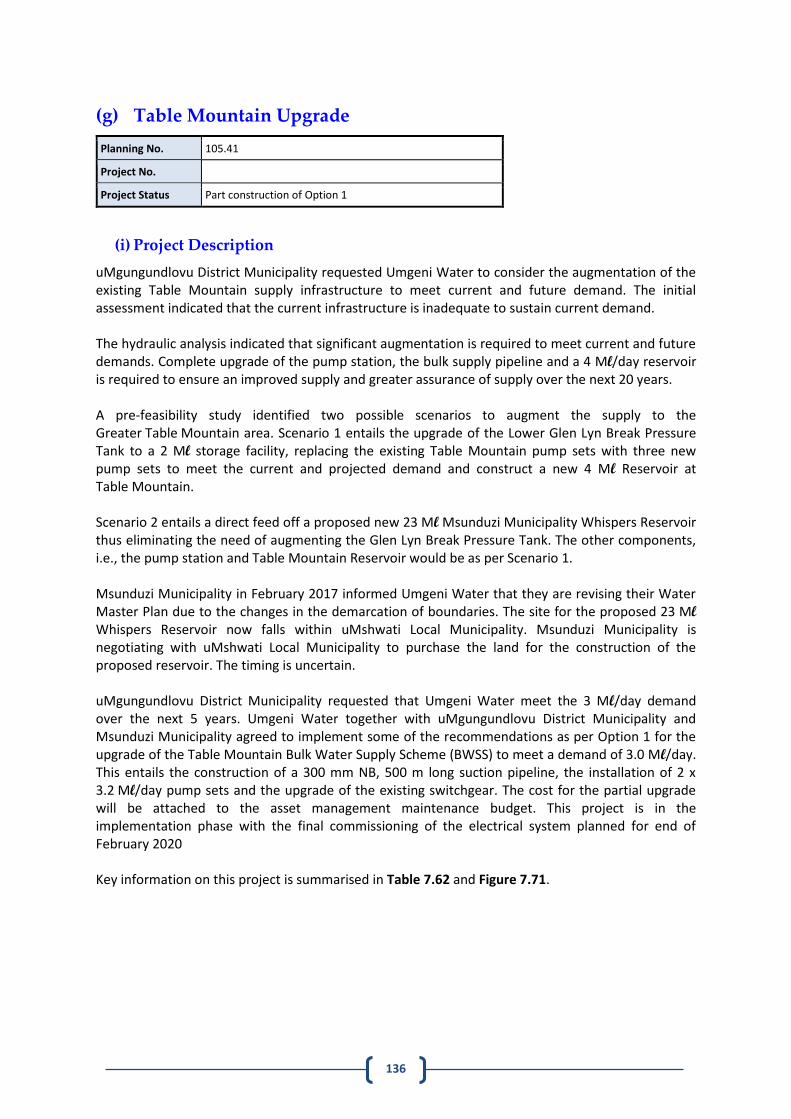
136
(g) Table Mountain Upgrade
Planning No. 105.41
Project No.
Project Status Part construction of Option 1
(i) Project Description
uMgungundlovu District Municipality requested Umgeni Water to consider the augmentation of the existing Table Mountain supply infrastructure to meet current and future demand. The initial assessment indicated that the current infrastructure is inadequate to sustain current demand. The hydraulic analysis indicated that significant augmentation is required to meet current and future demands. Complete upgrade of the pump station, the bulk supply pipeline and a 4 Ml/day reservoir is required to ensure an improved supply and greater assurance of supply over the next 20 years. A pre-feasibility study identified two possible scenarios to augment the supply to the Greater Table Mountain area. Scenario 1 entails the upgrade of the Lower Glen Lyn Break Pressure Tank to a 2 Ml storage facility, replacing the existing Table Mountain pump sets with three new pump sets to meet the current and projected demand and construct a new 4 Ml Reservoir at Table Mountain. Scenario 2 entails a direct feed off a proposed new 23 Ml Msunduzi Municipality Whispers Reservoir thus eliminating the need of augmenting the Glen Lyn Break Pressure Tank. The other components, i.e., the pump station and Table Mountain Reservoir would be as per Scenario 1. Msunduzi Municipality in February 2017 informed Umgeni Water that they are revising their Water Master Plan due to the changes in the demarcation of boundaries. The site for the proposed 23 Ml Whispers Reservoir now falls within uMshwati Local Municipality. Msunduzi Municipality is negotiating with uMshwati Local Municipality to purchase the land for the construction of the proposed reservoir. The timing is uncertain. uMgungundlovu District Municipality requested that Umgeni Water meet the 3 Ml/day demand over the next 5 years. Umgeni Water together with uMgungundlovu District Municipality and Msunduzi Municipality agreed to implement some of the recommendations as per Option 1 for the upgrade of the Table Mountain Bulk Water Supply Scheme (BWSS) to meet a demand of 3.0 Ml/day. This entails the construction of a 300 mm NB, 500 m long suction pipeline, the installation of 2 x 3.2 Ml/day pump sets and the upgrade of the existing switchgear. The cost for the partial upgrade will be attached to the asset management maintenance budget. This project is in the implementation phase with the final commissioning of the electrical system planned for end of February 2020 Key information on this project is summarised in Table 7.62 and Figure 7.71.
137
Figure 7.71 Table Mountain Upgrade.
138
Table 7.62 Project information: Table Mountain Upgrade.
Project Components: 350 mm diameter pipeline, 4.4 km in length. 4 Ml Reservoir.
Capacity: 4 Ml.
(ii) Institutional Arrangements
The infrastructure from the buy-back meter will be owned, operated and maintained by Umgeni Water.
(iii) Beneficiaries
The upgrade to the BWSS will benefit consumers within the Greater Table Mountain area with estimated population of 13 500.
(iv) Implementation
The implementation of this project is dependent on the augmentation of the Msunduzi Municipality Supply network. Msunduzi Municipality estimate that the augmentation of their water supply system will be implemented by 2025. This project is currently on hold until such time as a definite directive is obtained for the implementation of the Msunduzi Municipality Supply Network.
139
(h) Hydropower Unit at the Mpofana Outfall
Planning No. 609.2
Project No.
Project Status Detailed Feasibility
(i) Project Description
A Detailed Feasibility Study (DFS) to assess the viability of a Hydropower Unit on the Mooi-Mgeni Transfer Scheme (MMTS) was initiated in 2013. A cost benefit model was developed to investigate the benefit of installing larger pipe sizes under the second phase of the MMTS in the gravity section of the pipe from the Gowrie Break Pressure Tank to the Mpofana Outfall Site (Figure 7.72). It was identified that a 914 mm diameter steel pipe had the highest Internal Rate of Return (IRR), and therefore is the optimal size for installation. The residual head available for power generation at the outfall site under full flow conditions for a new pipe scenario is 148 m, and under aged pipe conditions is 128 m. The DFS has shown that a dual turbine powerhouse at the Mpofana Outfall Site, with twin turbo type turbines, each capable of discharging 2.25 m3/s at 148 m head, can produce 2.698 MW each (5.396 MW total). Electrical transmission of the power generated will be fed back into the National Grid at the Gowrie Substation in Nottingham Road. The recoupment of costs will be offset against the power generated and billed to Umgeni Water, for the MMTS, by Eskom. A hydropower unit on the MMTS will recover between 19.7 and 16.8 GW.hr/annum of power, based on MMTS operation for 6 months of the year at 83% efficiency, and depending on the age of the supply pipelines.
(ii) Institutional Arrangements
The new infrastructure will be owned, operated and maintained by Umgeni Water.
(iii) Beneficiaries
The MMTS Hydropower Project is economically feasible with an expected payback period of 3 years. Thereafter the project will save Umgeni Water and hence consumers an estimated R14 million per annum at the current electricity tariff. This saving in the operating costs can be offset in the tariff, which will benefit all consumers within Umgeni Water’s area of jurisdiction.
(iv) Implementation
The total cost is estimated to be approximately R 129 million as at 2019 prices. Umgeni Water obtained permission from the Department of Water and Sanitation for access to their infrastructure and is now in the process of appointing a PSP to undertake the Detailed Design of the hydropower unit.
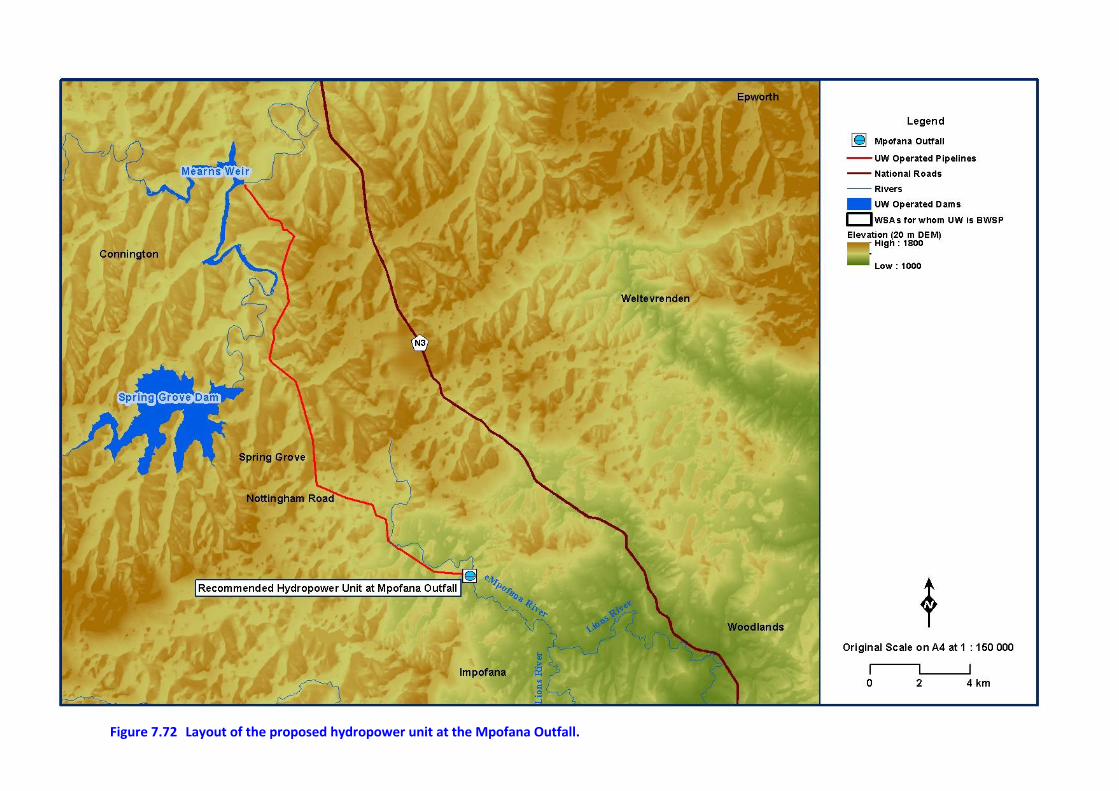
140
Figure 7.72 Layout of the proposed hydropower unit at the Mpofana Outfall.
141
7.6 Management and Operation of uMgungundlovu
Water Treatment Plants (WTPs) In 2016, uMgungundlovu District Municipality requested that Umgeni Water manage and operate four WTPs under their jurisdiction. Umgeni Water agreed to the request under a Memorandum of Understanding (MOU). The four WTP’s (Figure 7.73) are:
Lidgetton WTP;
Rosetta WTP;
Mpofana WTP; and
Appelsbosch WTP
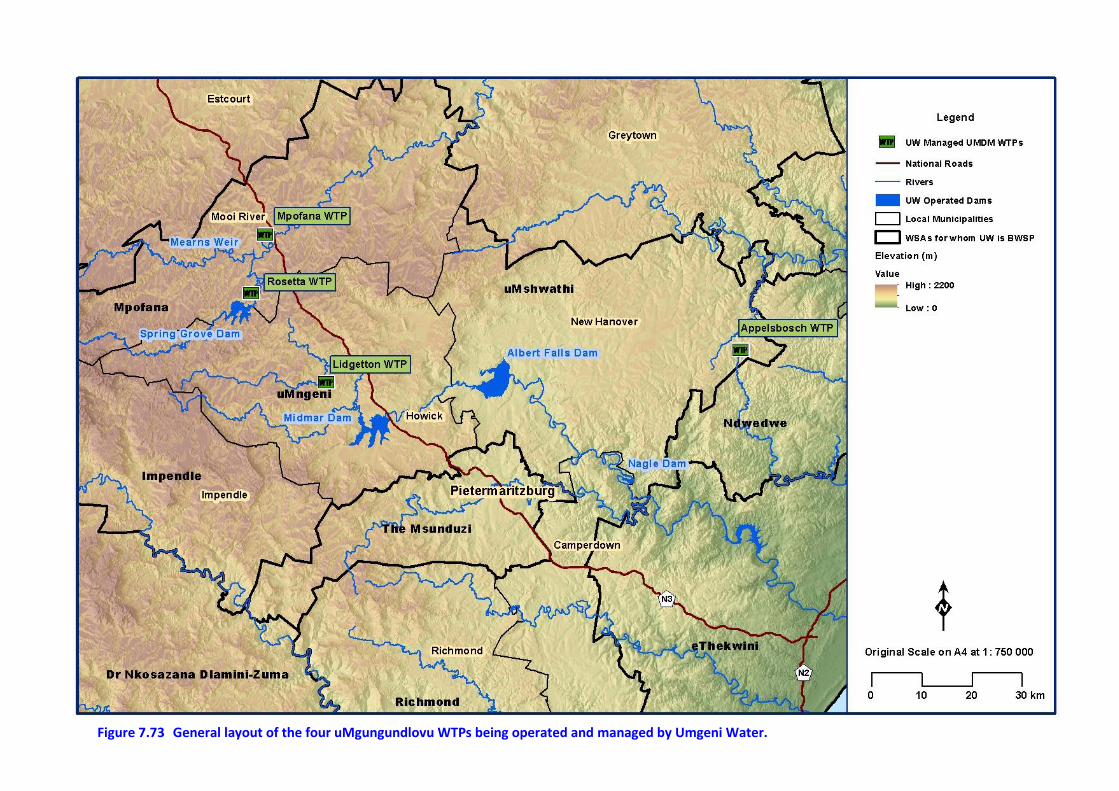
142
Figure 7.73 General layout of the four uMgungundlovu WTPs being operated and managed by Umgeni Water.
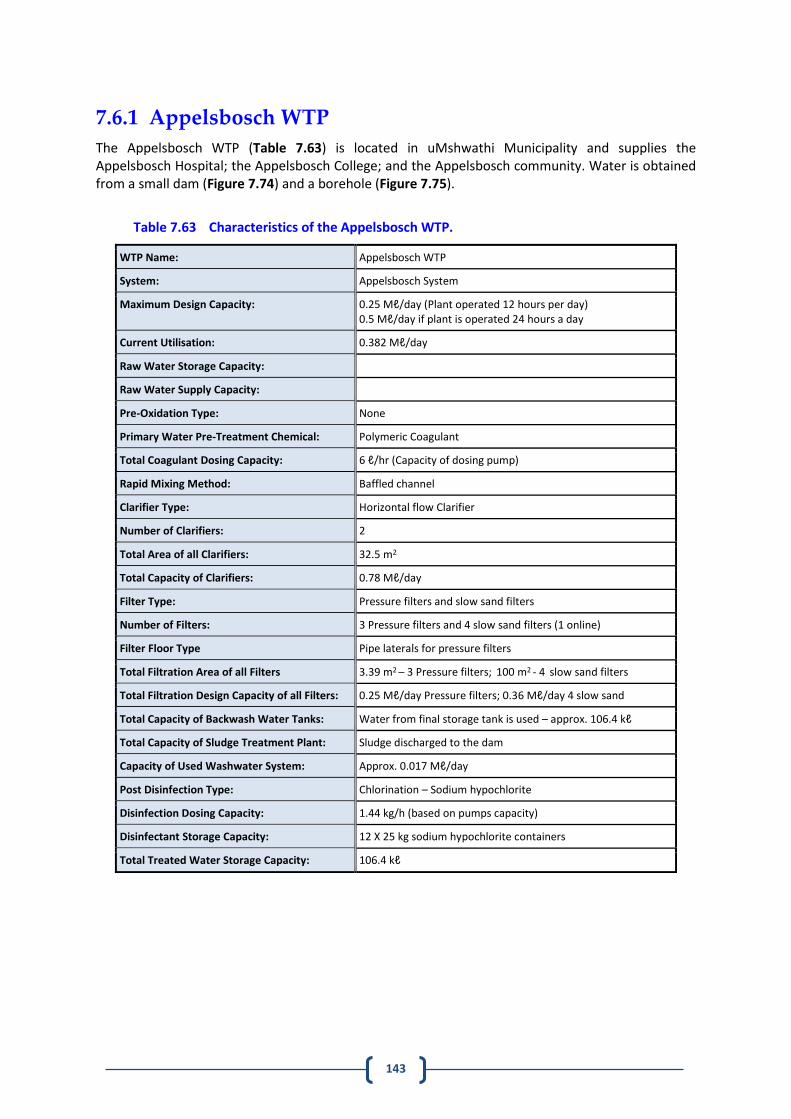
143
7.6.1 Appelsbosch WTP
The Appelsbosch WTP (Table 7.63) is located in uMshwathi Municipality and supplies the Appelsbosch Hospital; the Appelsbosch College; and the Appelsbosch community. Water is obtained from a small dam (Figure 7.74) and a borehole (Figure 7.75).
Table 7.63 Characteristics of the Appelsbosch WTP.
WTP Name: Appelsbosch WTP
System: Appelsbosch System
Maximum Design Capacity: 0.25 Mℓ/day (Plant operated 12 hours per day) 0.5 Mℓ/day if plant is operated 24 hours a day
Current Utilisation: 0.382 Mℓ/day
Raw Water Storage Capacity:
Raw Water Supply Capacity:
Pre-Oxidation Type: None
Primary Water Pre-Treatment Chemical: Polymeric Coagulant
Total Coagulant Dosing Capacity: 6 ℓ/hr (Capacity of dosing pump)
Rapid Mixing Method: Baffled channel
Clarifier Type: Horizontal flow Clarifier
Number of Clarifiers: 2
Total Area of all Clarifiers: 32.5 m2
Total Capacity of Clarifiers: 0.78 Mℓ/day
Filter Type: Pressure filters and slow sand filters
Number of Filters: 3 Pressure filters and 4 slow sand filters (1 online)
Filter Floor Type Pipe laterals for pressure filters
Total Filtration Area of all Filters 3.39 m2 – 3 Pressure filters; 100 m2 - 4 slow sand filters
Total Filtration Design Capacity of all Filters: 0.25 Mℓ/day Pressure filters; 0.36 Mℓ/day 4 slow sand
Total Capacity of Backwash Water Tanks: Water from final storage tank is used – approx. 106.4 kℓ
Total Capacity of Sludge Treatment Plant: Sludge discharged to the dam
Capacity of Used Washwater System: Approx. 0.017 Mℓ/day
Post Disinfection Type: Chlorination – Sodium hypochlorite
Disinfection Dosing Capacity: 1.44 kg/h (based on pumps capacity)
Disinfectant Storage Capacity: 12 X 25 kg sodium hypochlorite containers
Total Treated Water Storage Capacity: 106.4 kℓ
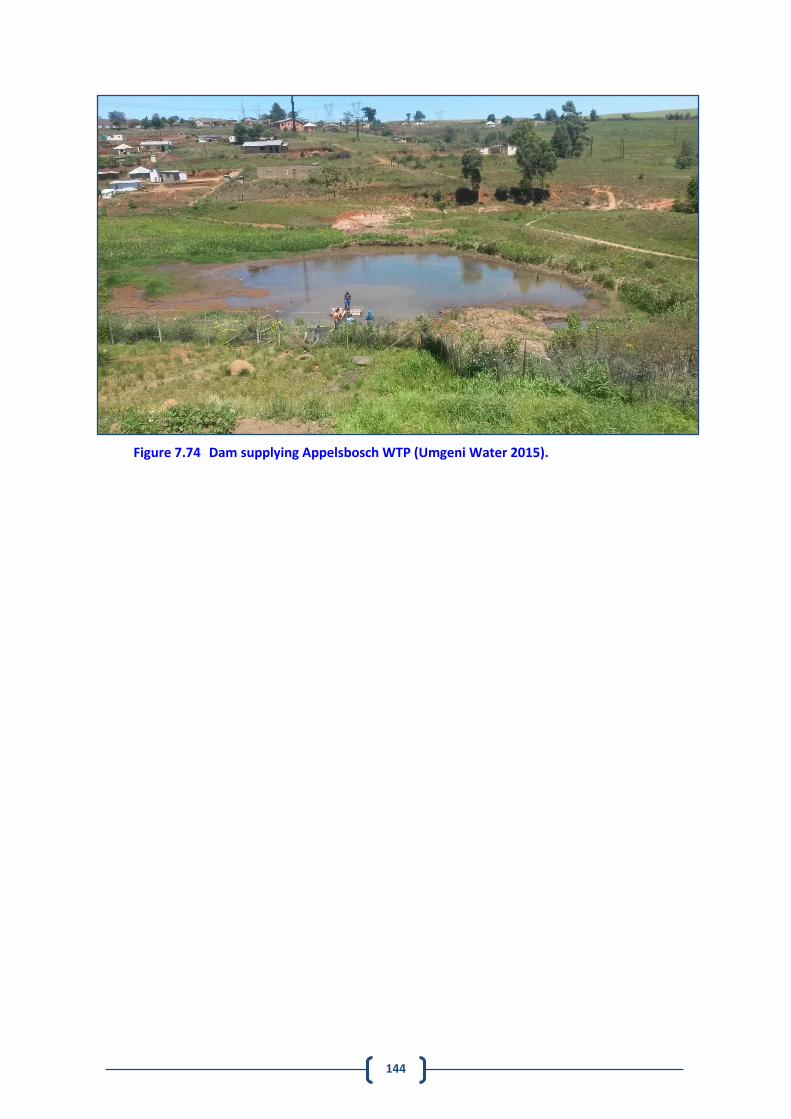
144
Figure 7.74 Dam supplying Appelsbosch WTP (Umgeni Water 2015).
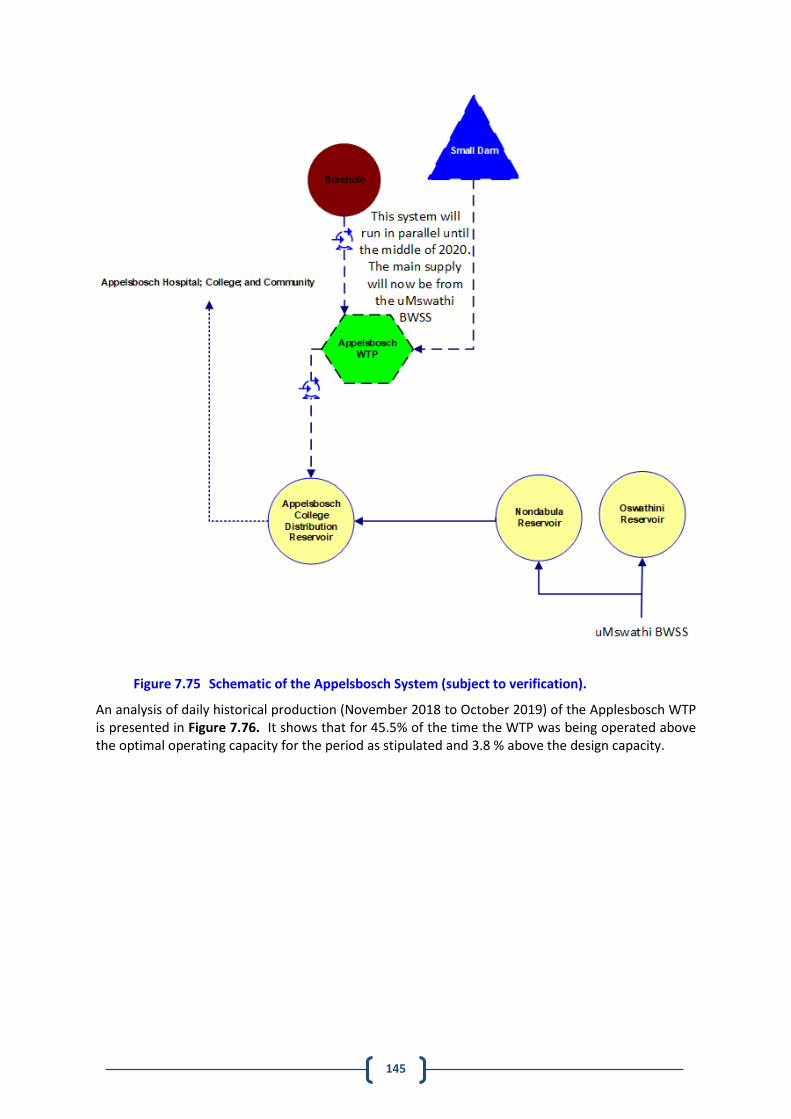
145
Figure 7.75 Schematic of the Appelsbosch System (subject to verification).
An analysis of daily historical production (November 2018 to October 2019) of the Applesbosch WTP is presented in Figure 7.76. It shows that for 45.5% of the time the WTP was being operated above the optimal operating capacity for the period as stipulated and 3.8 % above the design capacity.
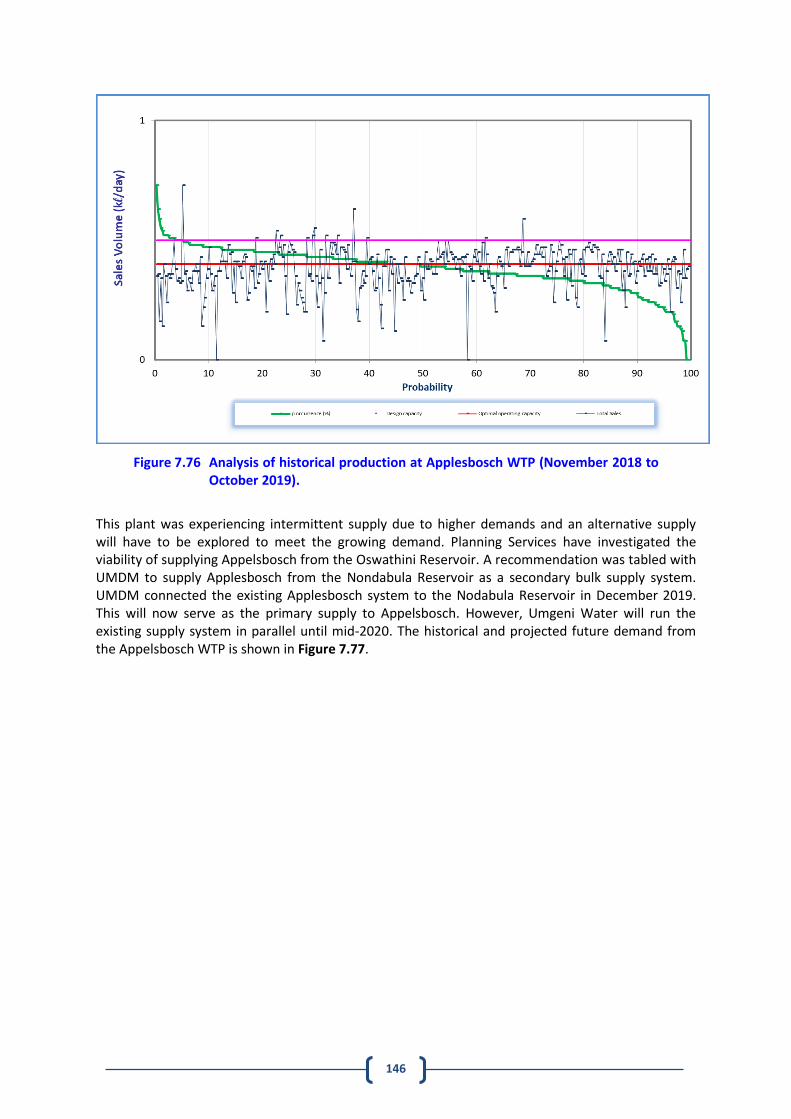
146
Figure 7.76 Analysis of historical production at Applesbosch WTP (November 2018 to October 2019).
This plant was experiencing intermittent supply due to higher demands and an alternative supply will have to be explored to meet the growing demand. Planning Services have investigated the viability of supplying Appelsbosch from the Oswathini Reservoir. A recommendation was tabled with UMDM to supply Applesbosch from the Nondabula Reservoir as a secondary bulk supply system. UMDM connected the existing Applesbosch system to the Nodabula Reservoir in December 2019. This will now serve as the primary supply to Appelsbosch. However, Umgeni Water will run the existing supply system in parallel until mid-2020. The historical and projected future demand from the Appelsbosch WTP is shown in Figure 7.77.
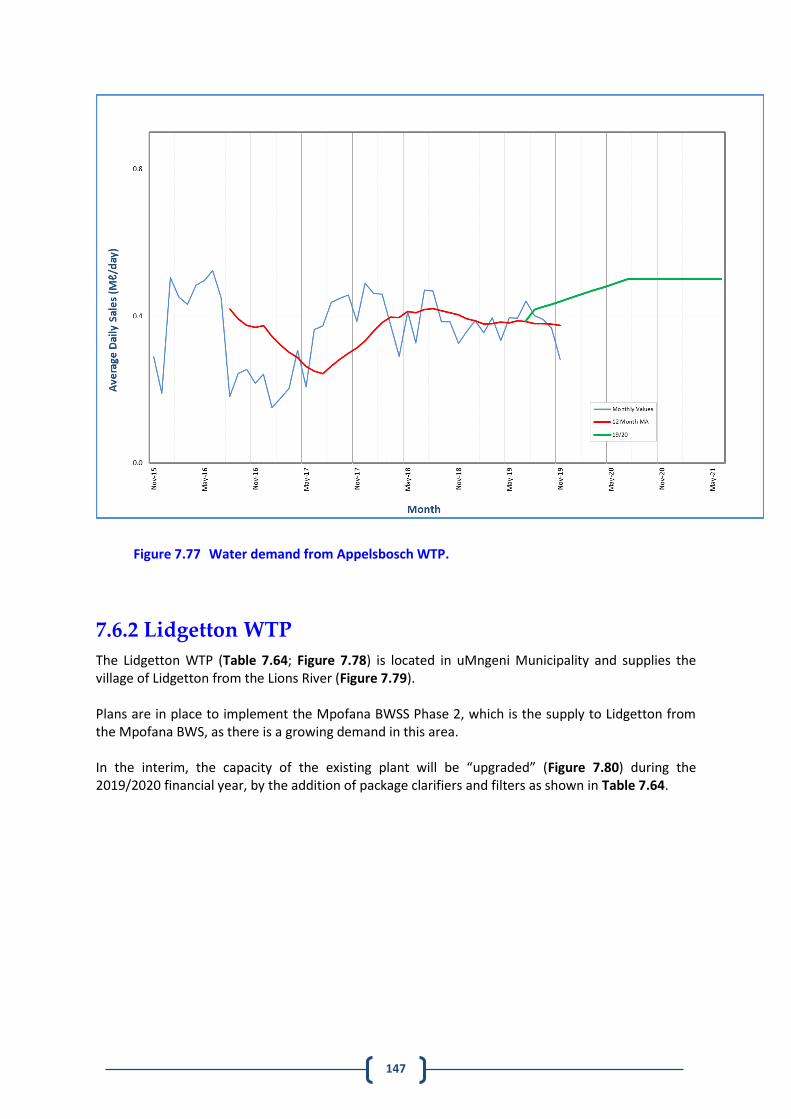
147
Figure 7.77 Water demand from Appelsbosch WTP.
7.6.2 Lidgetton WTP
The Lidgetton WTP (Table 7.64; Figure 7.78) is located in uMngeni Municipality and supplies the village of Lidgetton from the Lions River (Figure 7.79). Plans are in place to implement the Mpofana BWSS Phase 2, which is the supply to Lidgetton from the Mpofana BWS, as there is a growing demand in this area. In the interim, the capacity of the existing plant will be “upgraded” (Figure 7.80) during the 2019/2020 financial year, by the addition of package clarifiers and filters as shown in Table 7.64.
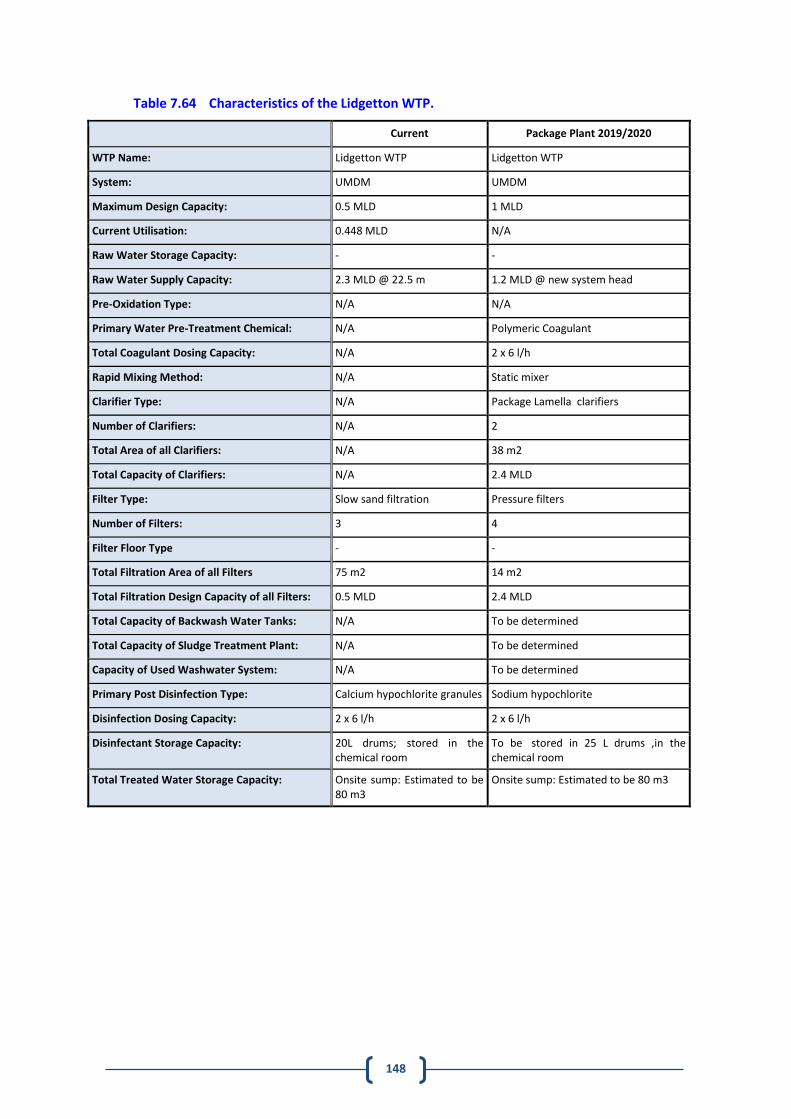
148
Table 7.64 Characteristics of the Lidgetton WTP.
Current Package Plant 2019/2020
WTP Name: Lidgetton WTP Lidgetton WTP
System: UMDM UMDM
Maximum Design Capacity: 0.5 MLD 1 MLD
Current Utilisation: 0.448 MLD N/A
Raw Water Storage Capacity: - -
Raw Water Supply Capacity: 2.3 MLD @ 22.5 m 1.2 MLD @ new system head
Pre-Oxidation Type: N/A N/A
Primary Water Pre-Treatment Chemical: N/A Polymeric Coagulant
Total Coagulant Dosing Capacity: N/A 2 x 6 l/h
Rapid Mixing Method: N/A Static mixer
Clarifier Type: N/A Package Lamella clarifiers
Number of Clarifiers: N/A 2
Total Area of all Clarifiers: N/A 38 m2
Total Capacity of Clarifiers: N/A 2.4 MLD
Filter Type: Slow sand filtration Pressure filters
Number of Filters: 3 4
Filter Floor Type - -
Total Filtration Area of all Filters 75 m2 14 m2
Total Filtration Design Capacity of all Filters: 0.5 MLD 2.4 MLD
Total Capacity of Backwash Water Tanks: N/A To be determined
Total Capacity of Sludge Treatment Plant: N/A To be determined
Capacity of Used Washwater System: N/A To be determined
Primary Post Disinfection Type: Calcium hypochlorite granules Sodium hypochlorite
Disinfection Dosing Capacity: 2 x 6 l/h 2 x 6 l/h
Disinfectant Storage Capacity: 20L drums; stored in the chemical room
To be stored in 25 L drums ,in the chemical room
Total Treated Water Storage Capacity: Onsite sump: Estimated to be 80 m3
Onsite sump: Estimated to be 80 m3
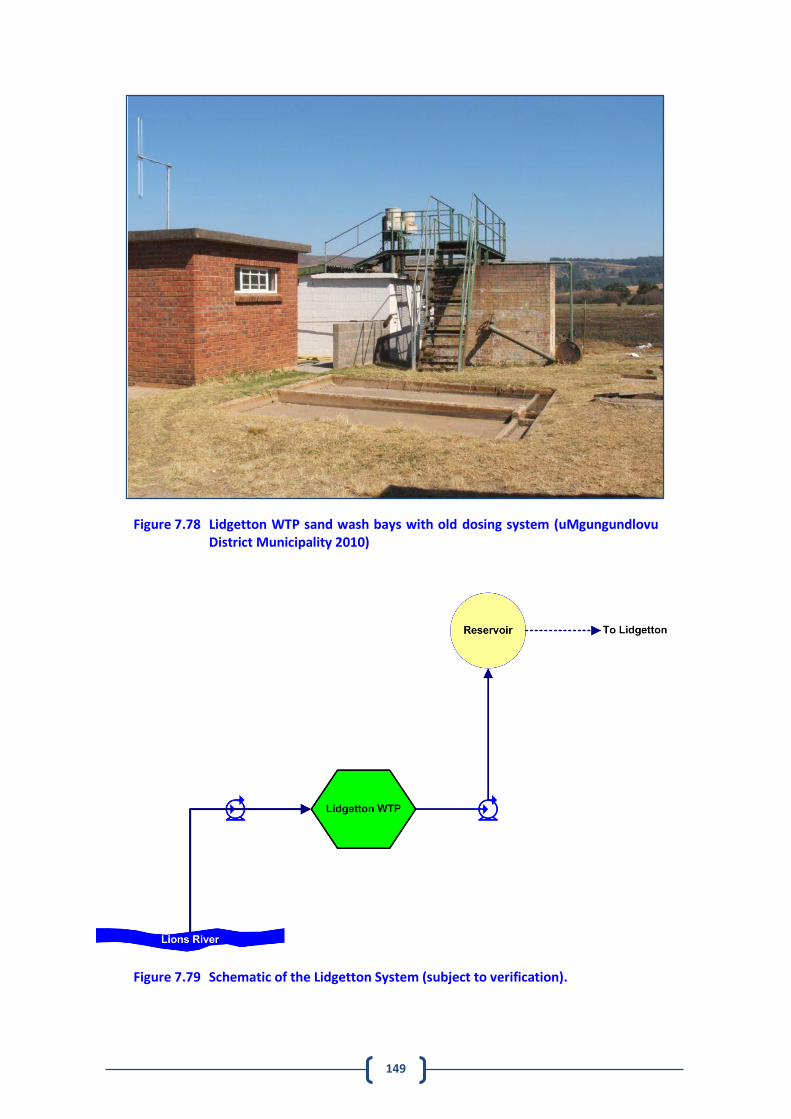
149
Figure 7.78 Lidgetton WTP sand wash bays with old dosing system (uMgungundlovu District Municipality 2010)
Figure 7.79 Schematic of the Lidgetton System (subject to verification).
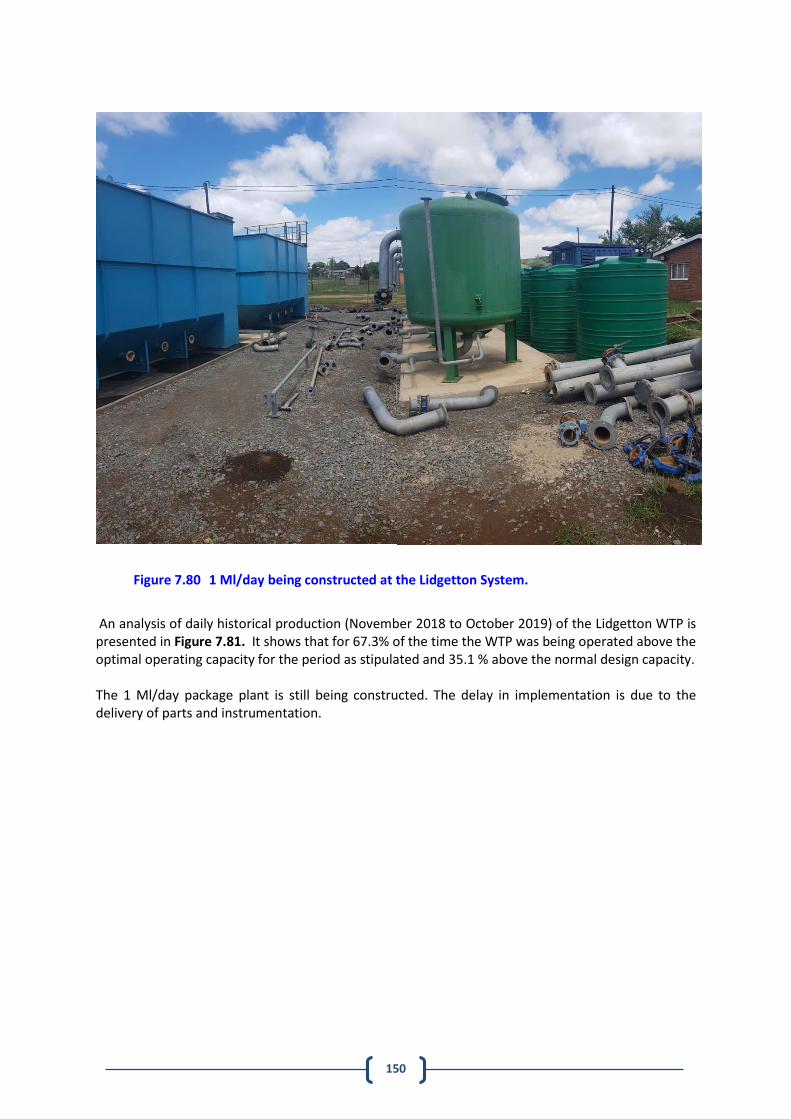
150
Figure 7.80 1 Ml/day being constructed at the Lidgetton System.
An analysis of daily historical production (November 2018 to October 2019) of the Lidgetton WTP is presented in Figure 7.81. It shows that for 67.3% of the time the WTP was being operated above the optimal operating capacity for the period as stipulated and 35.1 % above the normal design capacity. The 1 Ml/day package plant is still being constructed. The delay in implementation is due to the delivery of parts and instrumentation.
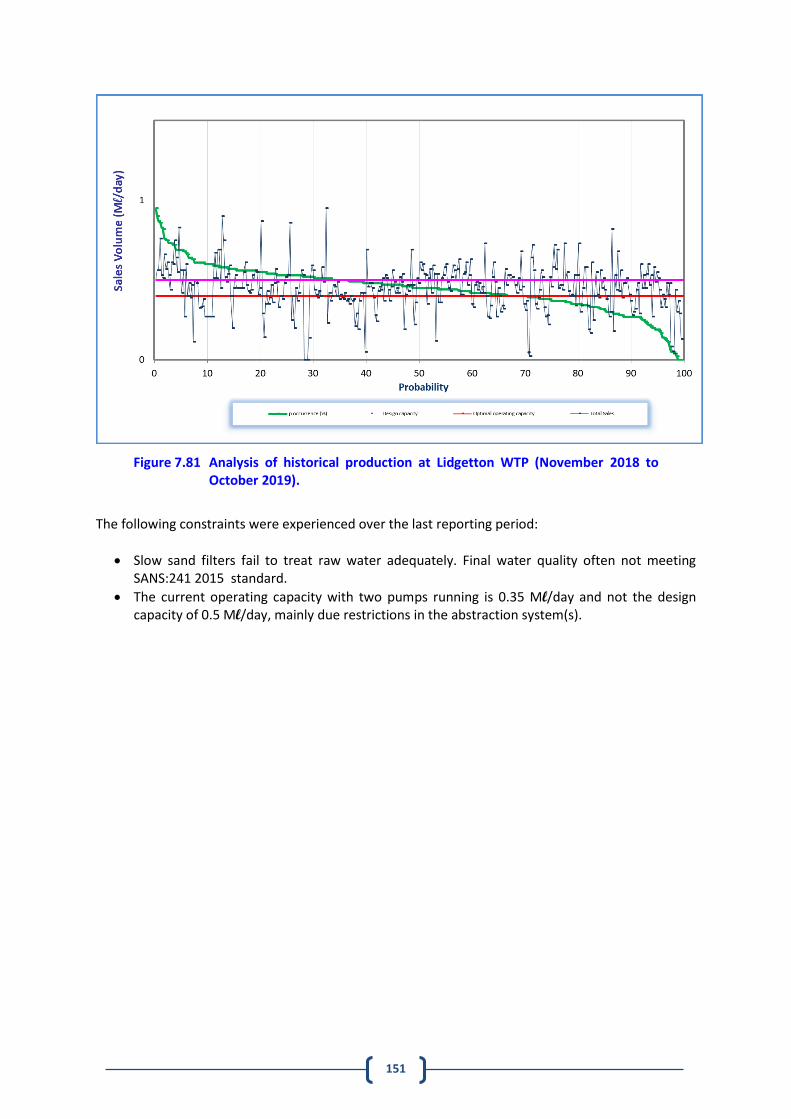
151
Figure 7.81 Analysis of historical production at Lidgetton WTP (November 2018 to October 2019).
The following constraints were experienced over the last reporting period:
Slow sand filters fail to treat raw water adequately. Final water quality often not meeting SANS:241 2015 standard.
The current operating capacity with two pumps running is 0.35 Ml/day and not the design capacity of 0.5 Ml/day, mainly due restrictions in the abstraction system(s).
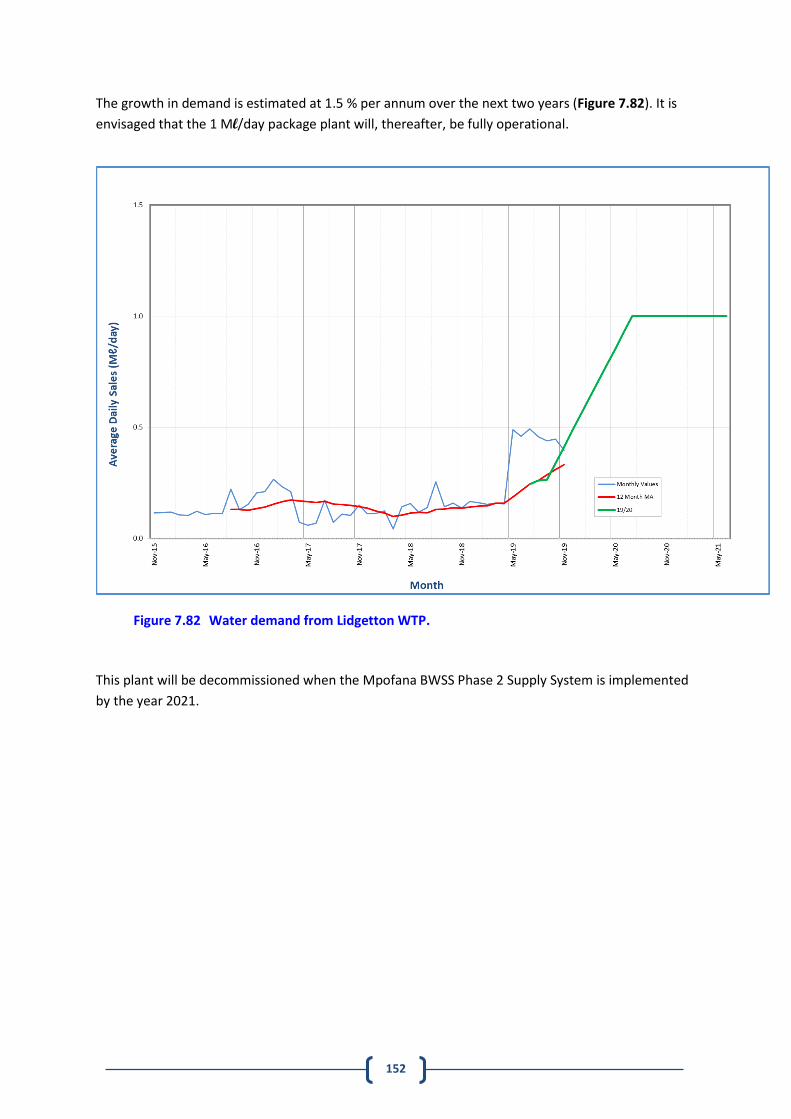
152
The growth in demand is estimated at 1.5 % per annum over the next two years (Figure 7.82). It is
envisaged that the 1 Ml/day package plant will, thereafter, be fully operational.
Figure 7.82 Water demand from Lidgetton WTP.
This plant will be decommissioned when the Mpofana BWSS Phase 2 Supply System is implemented
by the year 2021.
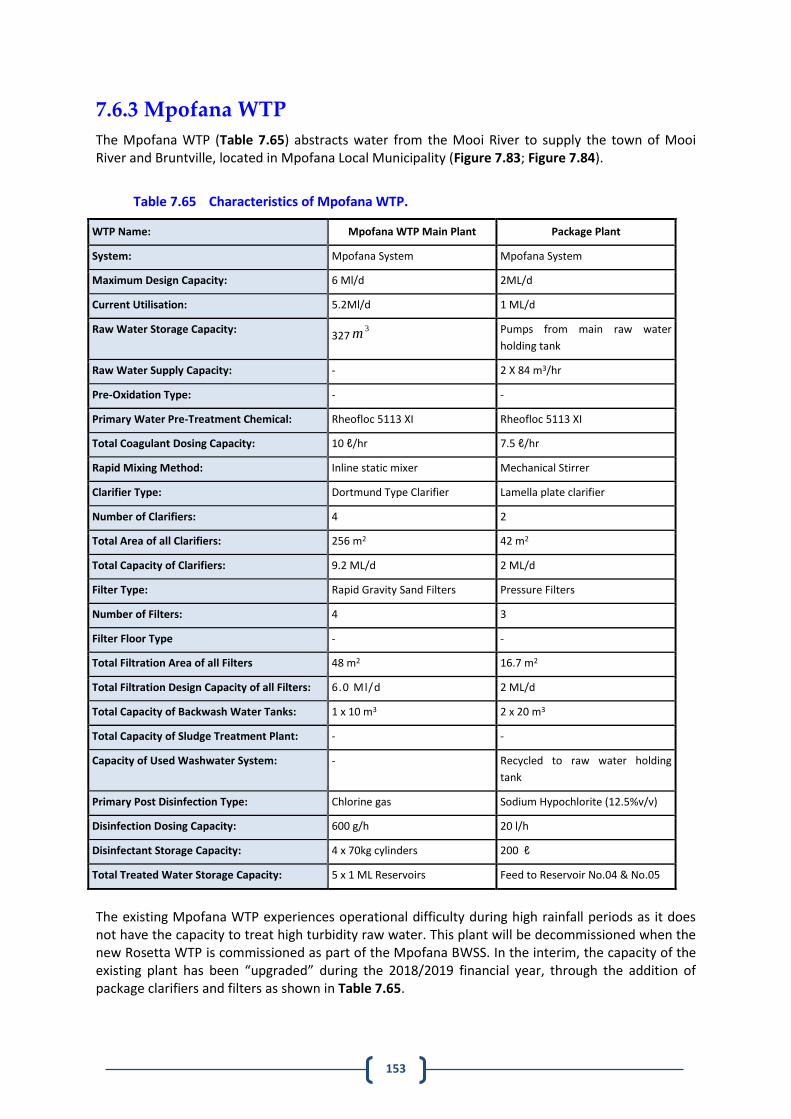
153
7.6.3 Mpofana WTP
The Mpofana WTP (Table 7.65) abstracts water from the Mooi River to supply the town of Mooi River and Bruntville, located in Mpofana Local Municipality (Figure 7.83; Figure 7.84).
Table 7.65 Characteristics of Mpofana WTP.
WTP Name: Mpofana WTP Main Plant Package Plant
System: Mpofana System Mpofana System
Maximum Design Capacity: 6 Ml/d 2ML/d
Current Utilisation: 5.2Ml/d 1 ML/d
Raw Water Storage Capacity: 327
Pumps from main raw water
holding tank
Raw Water Supply Capacity: - 2 X 84 m3/hr
Pre-Oxidation Type: - -
Primary Water Pre-Treatment Chemical: Rheofloc 5113 XI Rheofloc 5113 XI
Total Coagulant Dosing Capacity: 10 ℓ/hr 7.5 ℓ/hr
Rapid Mixing Method: Inline static mixer Mechanical Stirrer
Clarifier Type: Dortmund Type Clarifier Lamella plate clarifier
Number of Clarifiers: 4 2
Total Area of all Clarifiers: 256 m2 42 m2
Total Capacity of Clarifiers: 9.2 ML/d 2 ML/d
Filter Type: Rapid Gravity Sand Filters Pressure Filters
Number of Filters: 4 3
Filter Floor Type - -
Total Filtration Area of all Filters 48 m2 16.7 m2
Total Filtration Design Capacity of all Filters: 6.0 Ml/d 2 ML/d
Total Capacity of Backwash Water Tanks: 1 x 10 m3 2 x 20 m3
Total Capacity of Sludge Treatment Plant: - -
Capacity of Used Washwater System: - Recycled to raw water holding
tank
Primary Post Disinfection Type: Chlorine gas Sodium Hypochlorite (12.5%v/v)
Disinfection Dosing Capacity: 600 g/h 20 l/h
Disinfectant Storage Capacity: 4 x 70kg cylinders 200 ℓ
Total Treated Water Storage Capacity: 5 x 1 ML Reservoirs Feed to Reservoir No.04 & No.05
The existing Mpofana WTP experiences operational difficulty during high rainfall periods as it does not have the capacity to treat high turbidity raw water. This plant will be decommissioned when the new Rosetta WTP is commissioned as part of the Mpofana BWSS. In the interim, the capacity of the existing plant has been “upgraded” during the 2018/2019 financial year, through the addition of package clarifiers and filters as shown in Table 7.65.
3m
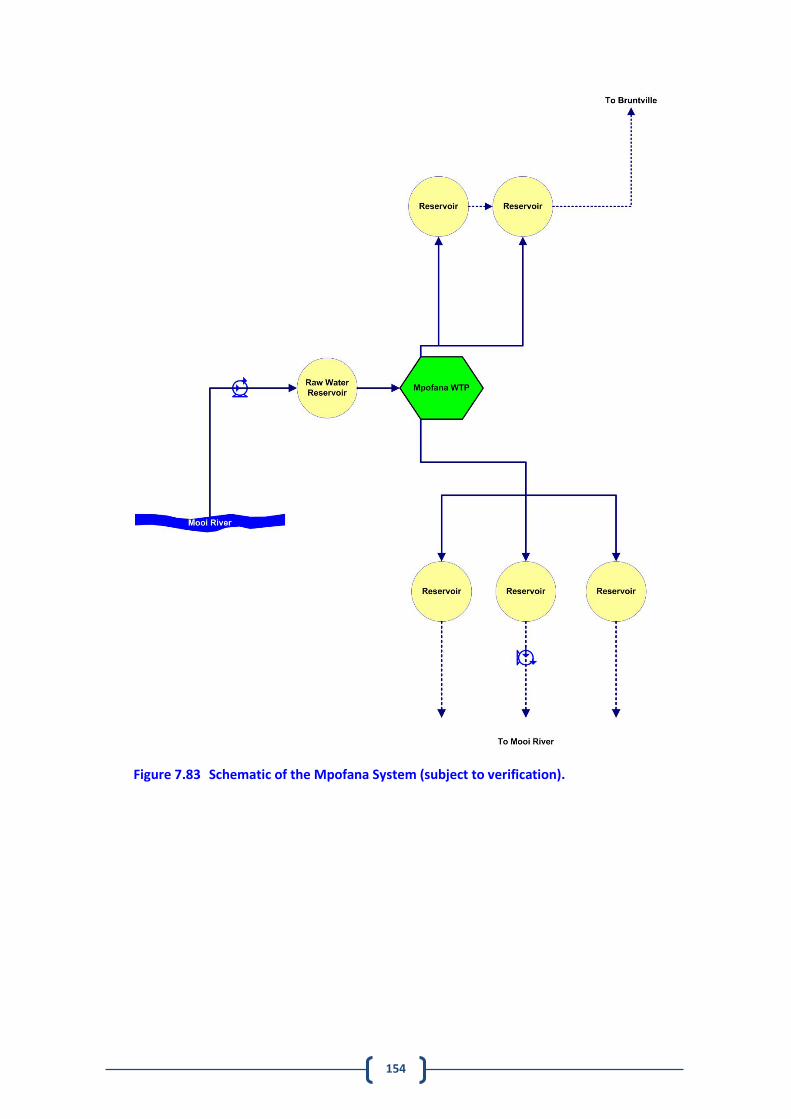
154
Figure 7.83 Schematic of the Mpofana System (subject to verification).
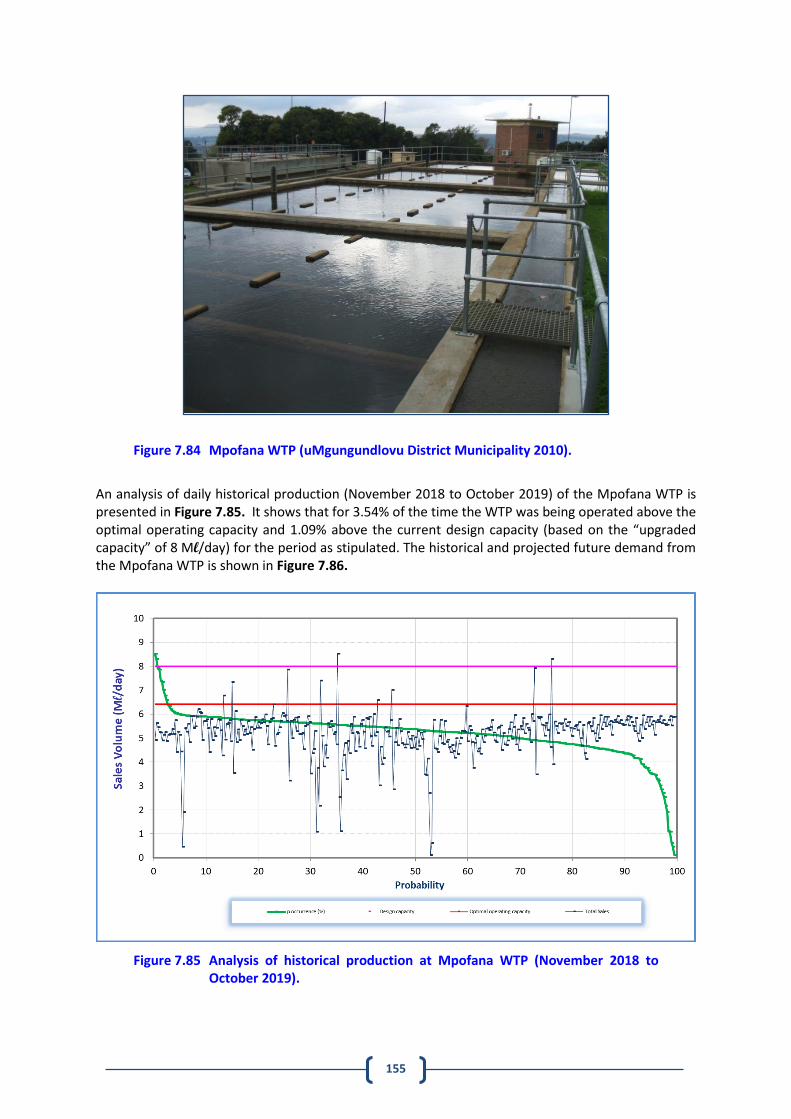
155
Figure 7.84 Mpofana WTP (uMgungundlovu District Municipality 2010).
An analysis of daily historical production (November 2018 to October 2019) of the Mpofana WTP is presented in Figure 7.85. It shows that for 3.54% of the time the WTP was being operated above the optimal operating capacity and 1.09% above the current design capacity (based on the “upgraded capacity” of 8 Ml/day) for the period as stipulated. The historical and projected future demand from the Mpofana WTP is shown in Figure 7.86.
Figure 7.85 Analysis of historical production at Mpofana WTP (November 2018 to October 2019).
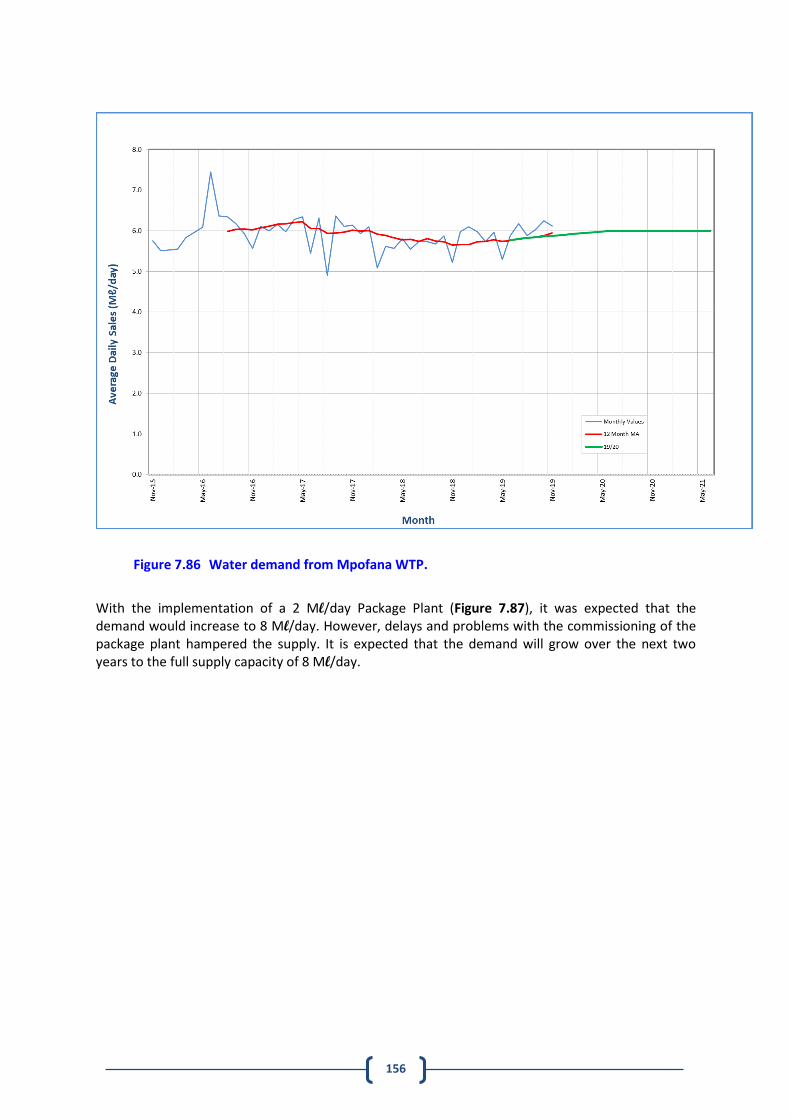
156
Figure 7.86 Water demand from Mpofana WTP.
With the implementation of a 2 Ml/day Package Plant (Figure 7.87), it was expected that the demand would increase to 8 Ml/day. However, delays and problems with the commissioning of the package plant hampered the supply. It is expected that the demand will grow over the next two years to the full supply capacity of 8 Ml/day.
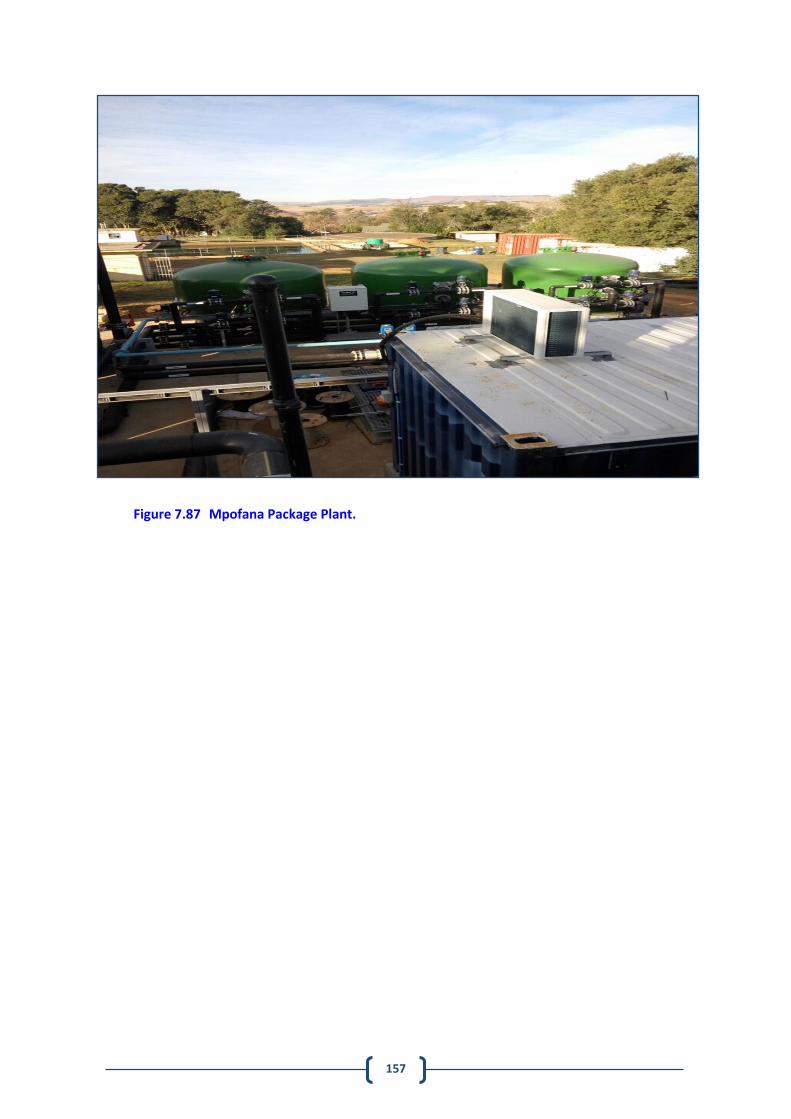
157
Figure 7.87 Mpofana Package Plant.
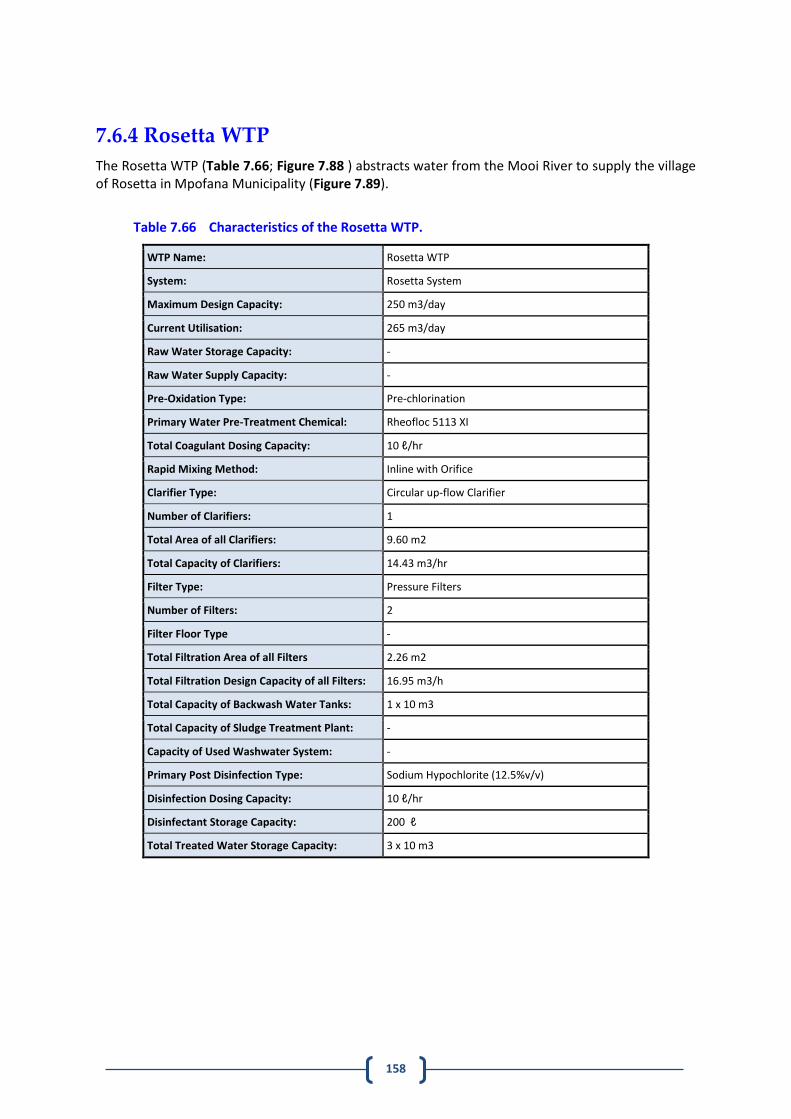
158
7.6.4 Rosetta WTP
The Rosetta WTP (Table 7.66; Figure 7.88 ) abstracts water from the Mooi River to supply the village of Rosetta in Mpofana Municipality (Figure 7.89).
Table 7.66 Characteristics of the Rosetta WTP.
WTP Name: Rosetta WTP
System: Rosetta System
Maximum Design Capacity: 250 m3/day
Current Utilisation: 265 m3/day
Raw Water Storage Capacity: -
Raw Water Supply Capacity: -
Pre-Oxidation Type: Pre-chlorination
Primary Water Pre-Treatment Chemical: Rheofloc 5113 XI
Total Coagulant Dosing Capacity: 10 ℓ/hr
Rapid Mixing Method: Inline with Orifice
Clarifier Type: Circular up-flow Clarifier
Number of Clarifiers: 1
Total Area of all Clarifiers: 9.60 m2
Total Capacity of Clarifiers: 14.43 m3/hr
Filter Type: Pressure Filters
Number of Filters: 2
Filter Floor Type -
Total Filtration Area of all Filters 2.26 m2
Total Filtration Design Capacity of all Filters: 16.95 m3/h
Total Capacity of Backwash Water Tanks: 1 x 10 m3
Total Capacity of Sludge Treatment Plant: -
Capacity of Used Washwater System: -
Primary Post Disinfection Type: Sodium Hypochlorite (12.5%v/v)
Disinfection Dosing Capacity: 10 ℓ/hr
Disinfectant Storage Capacity: 200 ℓ
Total Treated Water Storage Capacity: 3 x 10 m3
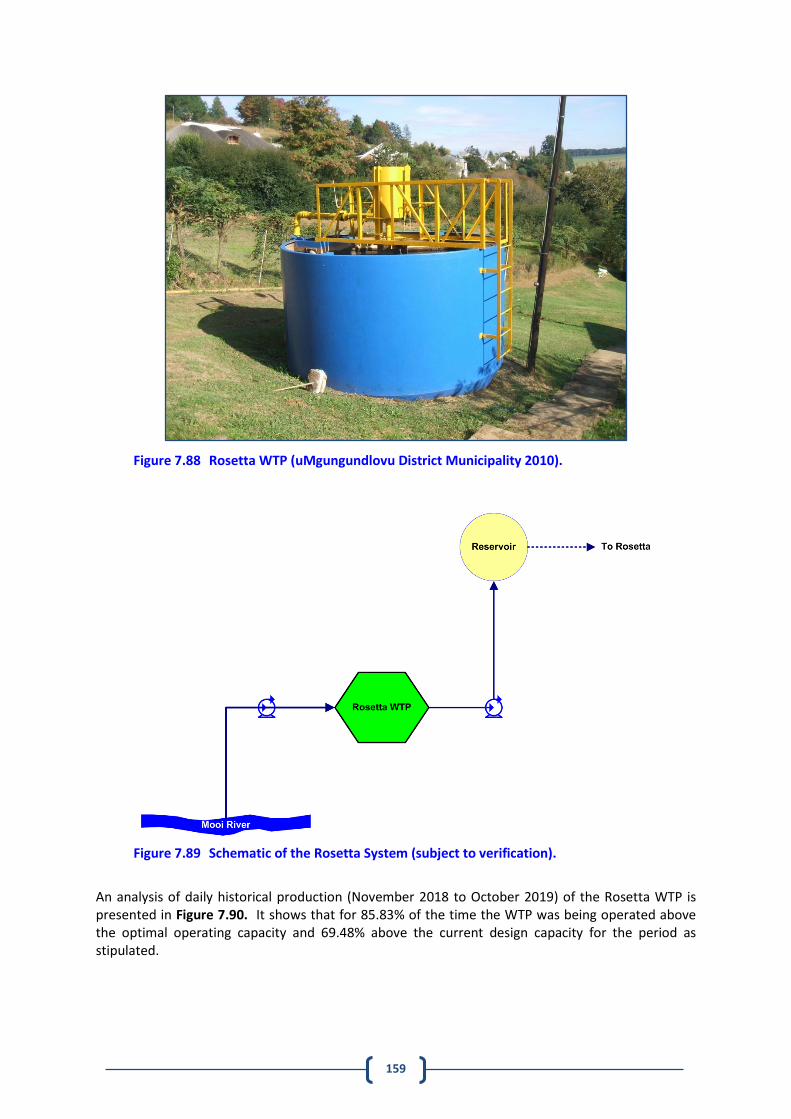
159
Figure 7.88 Rosetta WTP (uMgungundlovu District Municipality 2010).
Figure 7.89 Schematic of the Rosetta System (subject to verification).
An analysis of daily historical production (November 2018 to October 2019) of the Rosetta WTP is presented in Figure 7.90. It shows that for 85.83% of the time the WTP was being operated above the optimal operating capacity and 69.48% above the current design capacity for the period as stipulated.
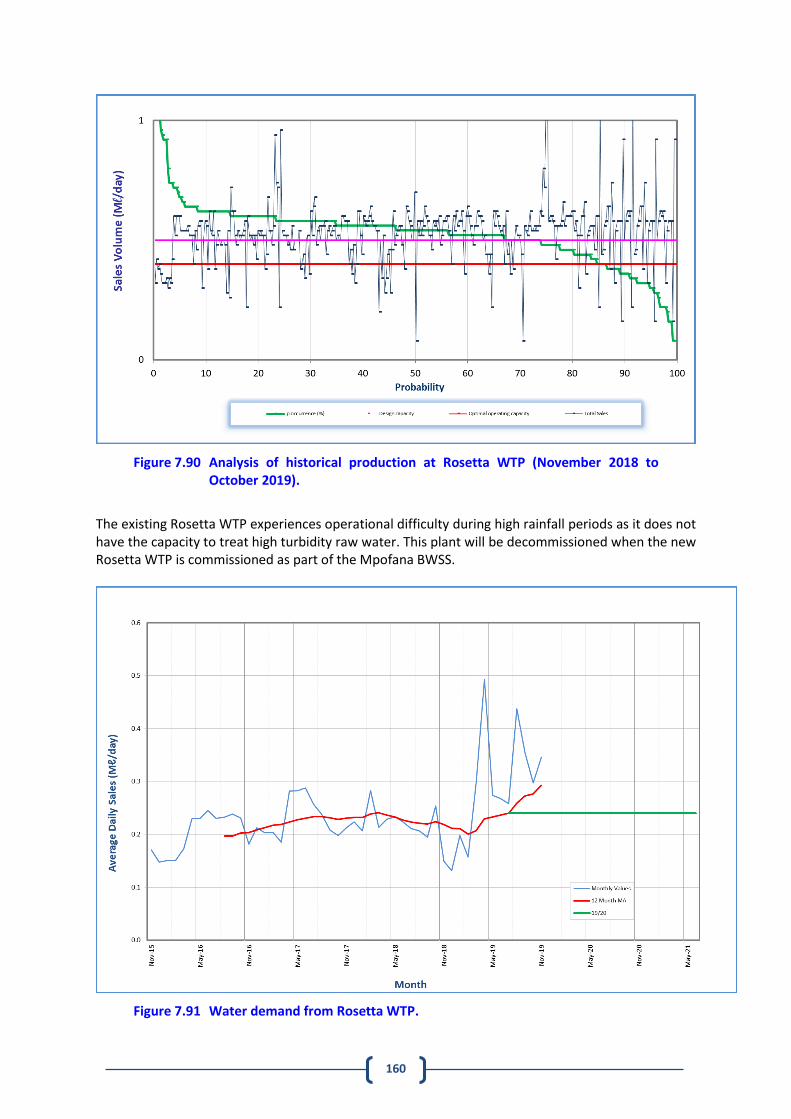
160
Figure 7.90 Analysis of historical production at Rosetta WTP (November 2018 to October 2019).
The existing Rosetta WTP experiences operational difficulty during high rainfall periods as it does not have the capacity to treat high turbidity raw water. This plant will be decommissioned when the new Rosetta WTP is commissioned as part of the Mpofana BWSS.
Figure 7.91 Water demand from Rosetta WTP.
161
7.7 uMzinyathi Water Treatment Plants
7.7.1 Muden WTP and Supply System
(a) Description of the Muden WTP and Supply System
The Muden Water Supply Scheme is located in the lower reaches of the Mooi catchment in the Mvoti Local Municipality (Figure 7.92) and is operated by the uMzinyathi WSA. The scheme is currently supplied from boreholes and abstractions from the Mooi River (Table 7.67). The long-term water demand for the uMzinyathi DM section of the Muden Water Supply Scheme is estimated at 15.78 Ml/day. The Mooi River remains the most viable source of water for the scheme. The MAR at the abstraction point was calculated at 49.85 million m3, according to page 33 of the Muden All Town Recon Strategy (Department of Water and Sanitation. 2011. First Stage Reconciliation Strategy for Muden Water Supply Scheme Area - uMvoti Local Municipality).
Table 7.67 Summary of Muden WTP Supply System existing infrastructure (DWS 2011).
Scheme Area Source Water Treatment Plant Reservoir Capacity (Ml)
Muden Mooi River Muden WTP – 11.00 Ml/day, conventional plant 8
Boreholes Borehole – 1.58 Ml/day
The raw water sources for the Muden Supply System is 1) the Mooi River, which supplies the Muden WTP, and 2) seven boreholes, which supply directly into reticulated networks (Figure 7.93). Abstraction from the Mooi River takes place at several locations, however, the ideal abstraction position for the scheme is at an existing irrigation canal in Muden. The canal’s supply is from a weir constructed on the Mooi River, located approximately 7 km from the existing Muden WTP (Table 7.68 and Figure 7.94). The irrigation canal feeds water to the existing treatment plant via gravity, from where it is distributed to the Muden and Opathe areas. The Craigieburn Dam, which is situated between Mooi River and Greytown, augments the the flow in the Mooi River as and when required. The pump details, reservoir details and pipeline details for the Muden Supply System are listed in Table 7.69, Table 7.70 and Table 7.71 respectively.
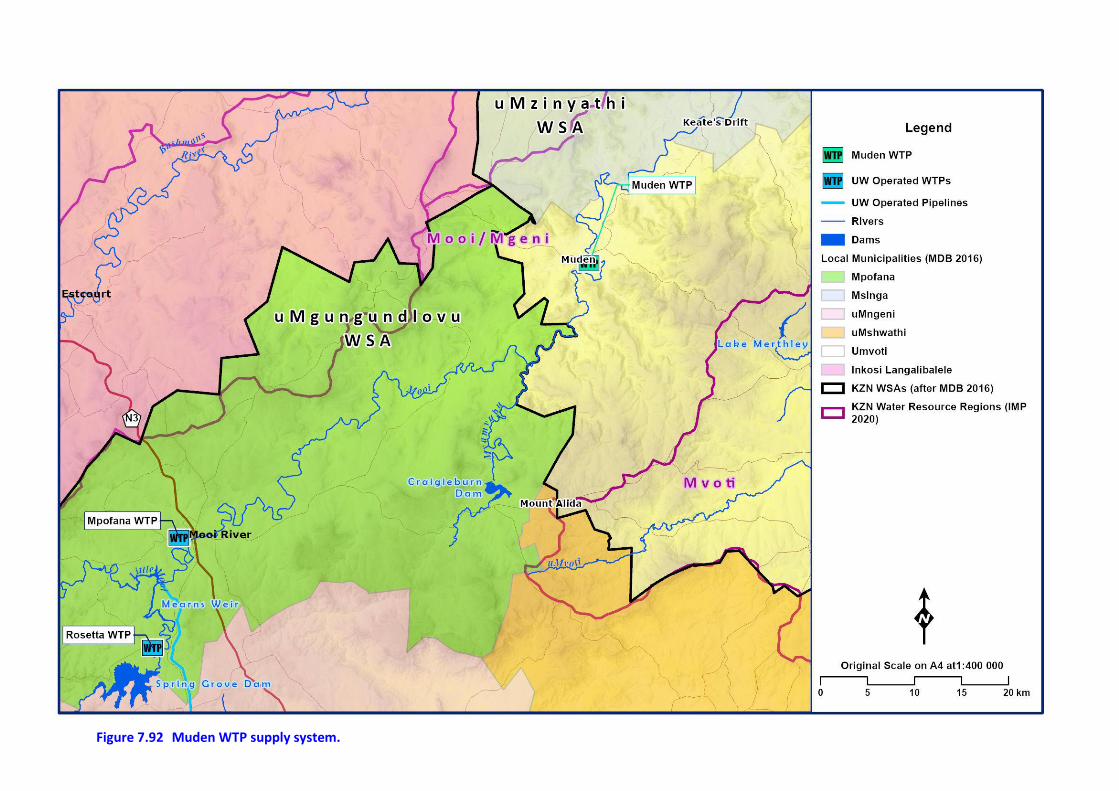
162
Figure 7.92 Muden WTP supply system.
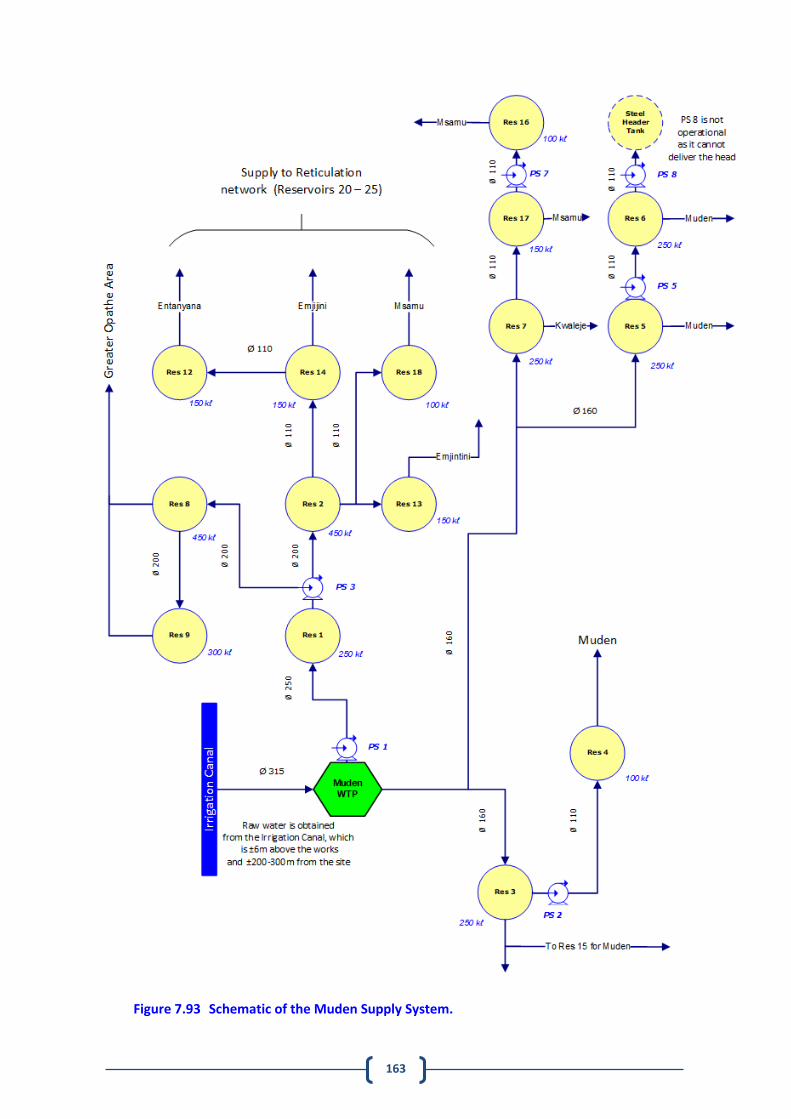
163
Figure 7.93 Schematic of the Muden Supply System.
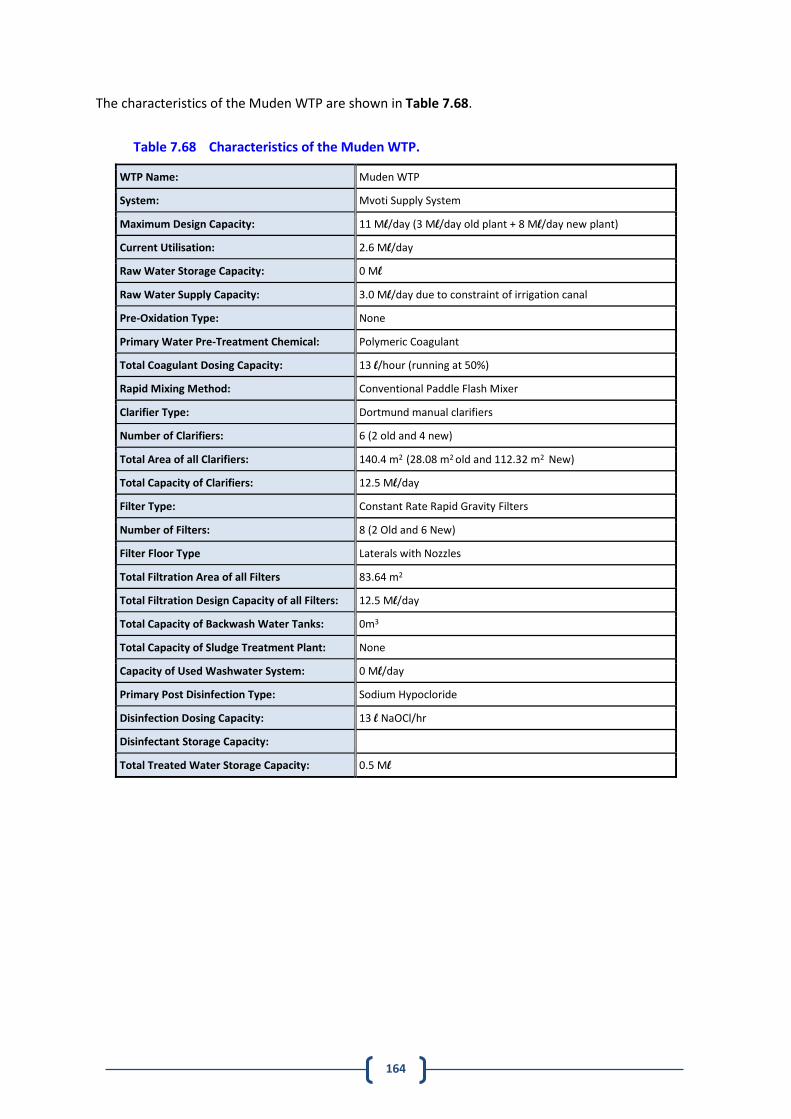
164
The characteristics of the Muden WTP are shown in Table 7.68.
Table 7.68 Characteristics of the Muden WTP.
WTP Name: Muden WTP
System: Mvoti Supply System
Maximum Design Capacity: 11 Ml/day (3 Ml/day old plant + 8 Ml/day new plant)
Current Utilisation: 2.6 Ml/day
Raw Water Storage Capacity: 0 Ml
Raw Water Supply Capacity: 3.0 Ml/day due to constraint of irrigation canal
Pre-Oxidation Type: None
Primary Water Pre-Treatment Chemical: Polymeric Coagulant
Total Coagulant Dosing Capacity: 13 l/hour (running at 50%)
Rapid Mixing Method: Conventional Paddle Flash Mixer
Clarifier Type: Dortmund manual clarifiers
Number of Clarifiers: 6 (2 old and 4 new)
Total Area of all Clarifiers: 140.4 m2 (28.08 m2 old and 112.32 m2 New)
Total Capacity of Clarifiers: 12.5 Ml/day
Filter Type: Constant Rate Rapid Gravity Filters
Number of Filters: 8 (2 Old and 6 New)
Filter Floor Type Laterals with Nozzles
Total Filtration Area of all Filters 83.64 m2
Total Filtration Design Capacity of all Filters: 12.5 Ml/day
Total Capacity of Backwash Water Tanks: 0m3
Total Capacity of Sludge Treatment Plant: None
Capacity of Used Washwater System: 0 Ml/day
Primary Post Disinfection Type: Sodium Hypocloride
Disinfection Dosing Capacity: 13 l NaOCl/hr
Disinfectant Storage Capacity:
Total Treated Water Storage Capacity: 0.5 Ml
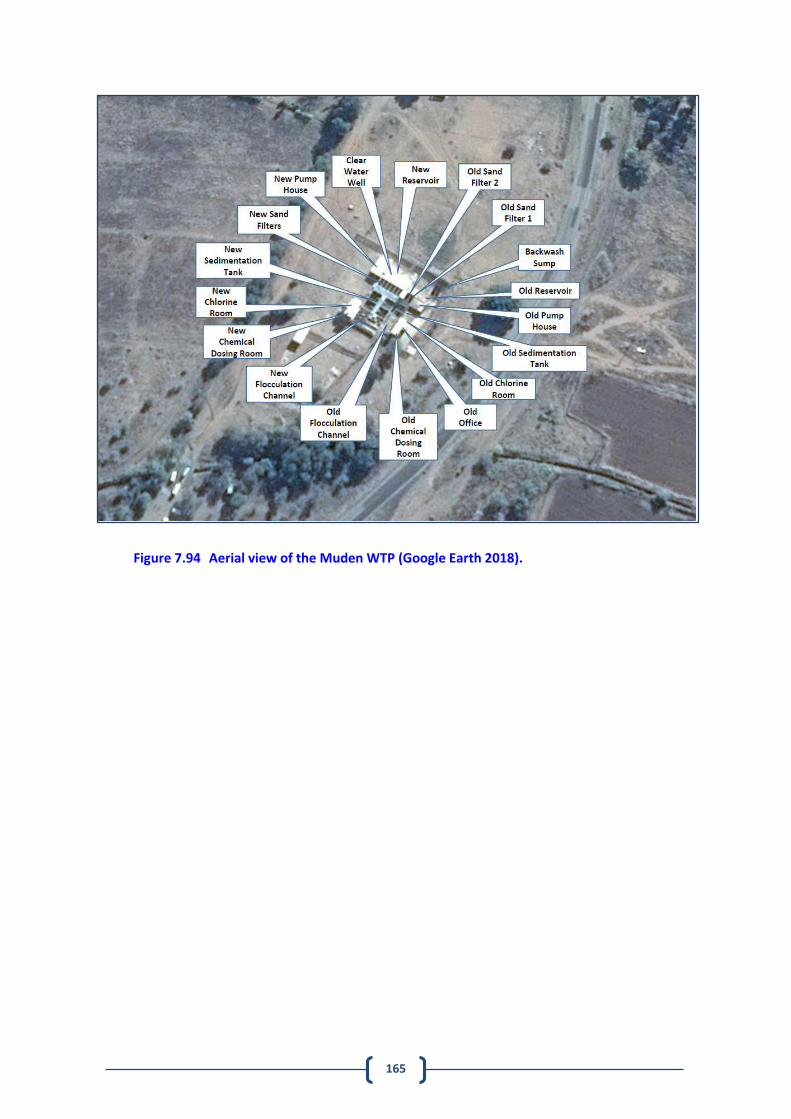
165
Figure 7.94 Aerial view of the Muden WTP (Google Earth 2018).
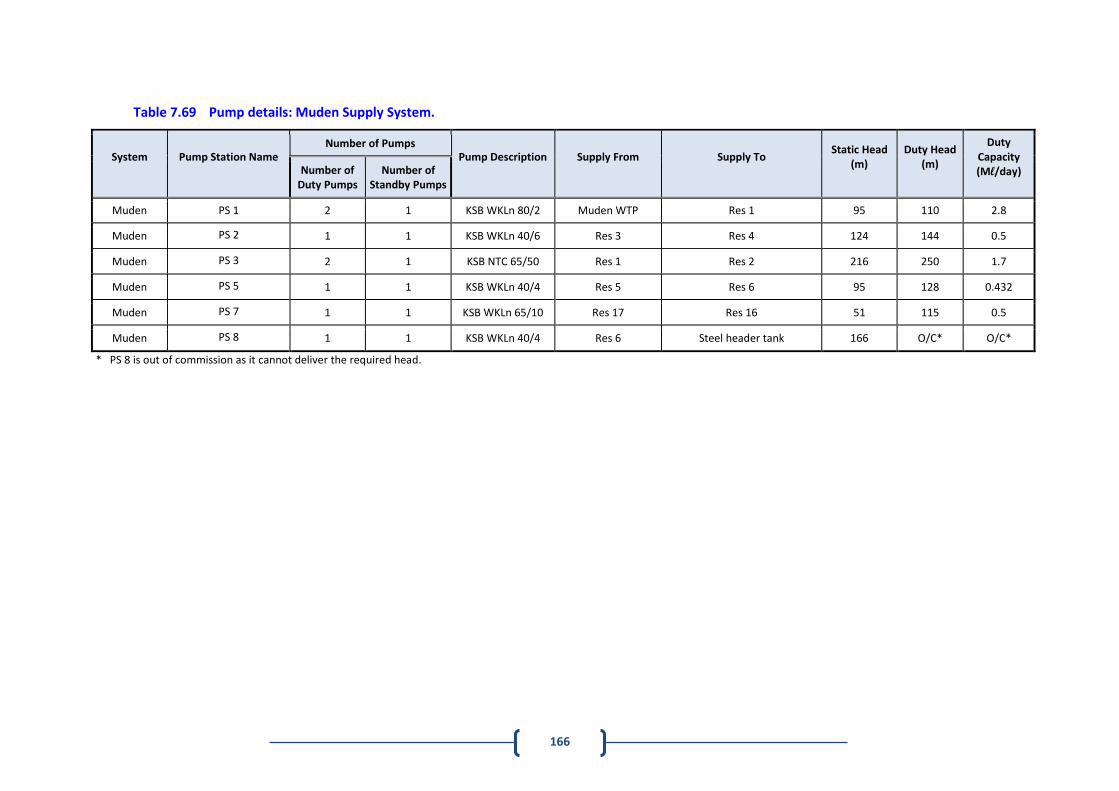
166
Table 7.69 Pump details: Muden Supply System.
System
Pump Station Name
Number of Pumps Pump Description
Supply From
Supply To
Static Head (m)
Duty Head (m)
Duty Capacity (Ml/day)
Number of Duty Pumps
Number of Standby Pumps
Muden PS 1 2 1 KSB WKLn 80/2 Muden WTP Res 1 95 110 2.8
Muden PS 2 1 1 KSB WKLn 40/6 Res 3 Res 4 124 144 0.5
Muden PS 3 2 1 KSB NTC 65/50 Res 1 Res 2 216 250 1.7
Muden PS 5 1 1 KSB WKLn 40/4 Res 5 Res 6 95 128 0.432
Muden PS 7 1 1 KSB WKLn 65/10 Res 17 Res 16 51 115 0.5
Muden PS 8 1 1 KSB WKLn 40/4 Res 6 Steel header tank 166 O/C* O/C*
* PS 8 is out of commission as it cannot deliver the required head.
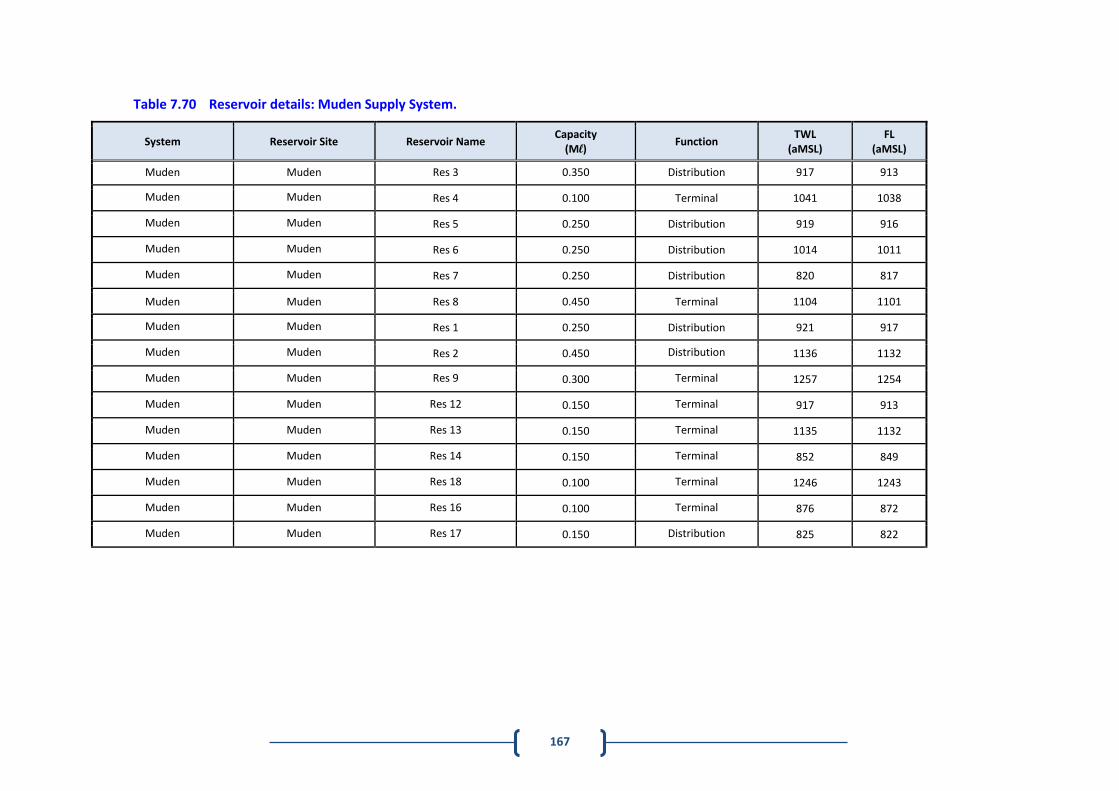
167
Table 7.70 Reservoir details: Muden Supply System.
System Reservoir Site Reservoir Name Capacity
(Ml) Function
TWL (aMSL)
FL (aMSL)
Muden Muden Res 3 0.350 Distribution 917 913
Muden Muden Res 4 0.100 Terminal 1041 1038
Muden Muden Res 5 0.250 Distribution 919 916
Muden Muden Res 6 0.250 Distribution 1014 1011
Muden Muden Res 7 0.250 Distribution 820 817
Muden Muden Res 8 0.450 Terminal 1104 1101
Muden Muden Res 1 0.250 Distribution 921 917
Muden Muden Res 2 0.450 Distribution 1136 1132
Muden Muden Res 9 0.300 Terminal 1257 1254
Muden Muden Res 12 0.150 Terminal 917 913
Muden Muden Res 13 0.150 Terminal 1135 1132
Muden Muden Res 14 0.150 Terminal 852 849
Muden Muden Res 18 0.100 Terminal 1246 1243
Muden Muden Res 16 0.100 Terminal 876 872
Muden Muden Res 17 0.150 Distribution 825 822
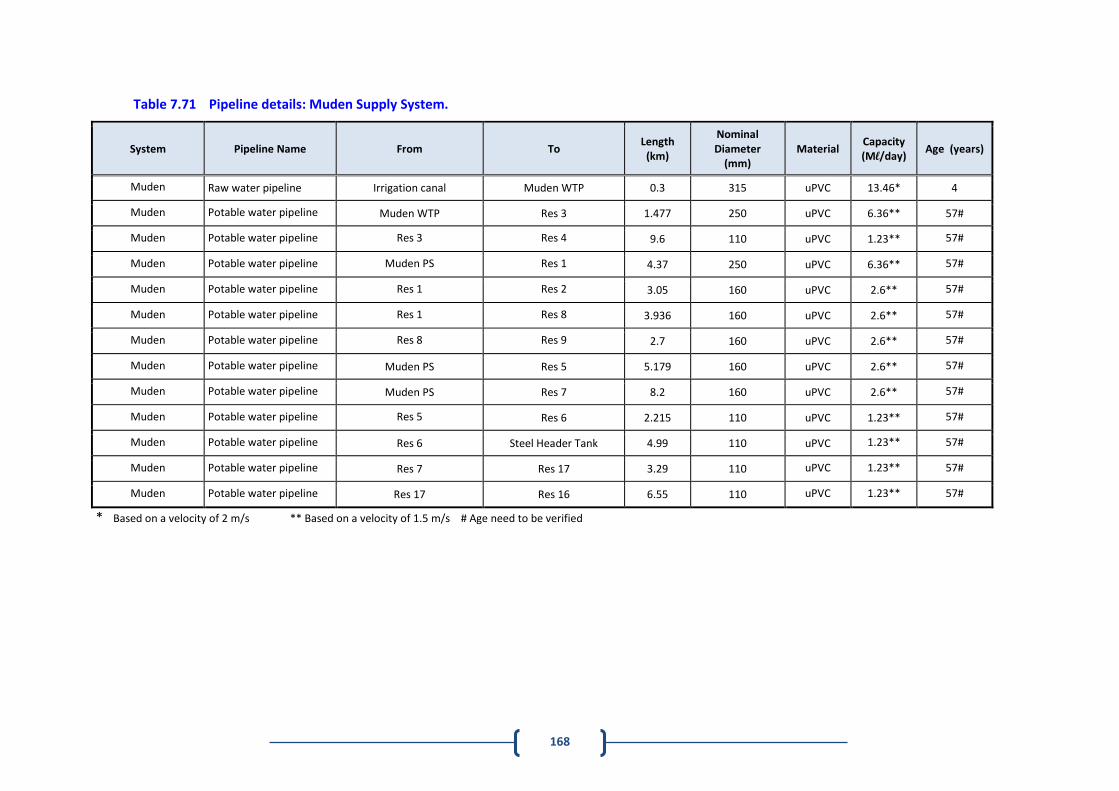
168
Table 7.71 Pipeline details: Muden Supply System.
System Pipeline Name From To Length
(km)
Nominal Diameter
(mm) Material
Capacity (Ml/day)
Age (years)
Muden Raw water pipeline Irrigation canal Muden WTP 0.3 315 uPVC 13.46* 4
Muden Potable water pipeline Muden WTP Res 3 1.477 250 uPVC 6.36** 57#
Muden Potable water pipeline Res 3 Res 4 9.6 110 uPVC 1.23** 57#
Muden Potable water pipeline Muden PS Res 1 4.37 250 uPVC 6.36** 57#
Muden Potable water pipeline Res 1 Res 2 3.05 160 uPVC 2.6** 57#
Muden Potable water pipeline Res 1 Res 8 3.936 160 uPVC 2.6** 57#
Muden Potable water pipeline Res 8 Res 9 2.7 160 uPVC 2.6** 57#
Muden Potable water pipeline Muden PS Res 5 5.179 160 uPVC 2.6** 57#
Muden Potable water pipeline Muden PS Res 7 8.2 160 uPVC 2.6** 57#
Muden Potable water pipeline Res 5 Res 6 2.215 110 uPVC 1.23** 57#
Muden Potable water pipeline Res 6 Steel Header Tank 4.99 110 uPVC 1.23** 57#
Muden Potable water pipeline Res 7 Res 17 3.29 110 uPVC 1.23** 57#
Muden Potable water pipeline Res 17 Res 16 6.55 110 uPVC 1.23** 57#
* Based on a velocity of 2 m/s ** Based on a velocity of 1.5 m/s # Age need to be verified
169
(b) Status Quo and Limitations of the Muden Supply System
The primary water source for the regional scheme is the Mooi River. Abstraction from the Mooi River takes place at several locations, however, the ideal abstraction position is at an existing irrigation canal in Muden. The canal’s supply is from a weir constructed on the Mooi River, located approximately 7km from the existing Muden WTP. The irrigation canal feeds water to the existing treatment plant via gravity and from there it is distributed to the Muden and Opathe areas. The Craigieburn Dam, which is situated between Mooi River and Greytown augments the above mentioned weir as and when required through downstream releases. The irrigation channel is fed from the Mooi River and supplies irrigation water to the farms in the area. The design capacity of the channel is sufficient to supply irrigation and domestic water for Muden, Ophate and Keate’s Drift. The channel is, however, an earthern channel and is prone to silting and damage. The channel was recently cleaned of silt and plant growth and this has increased the capacity of the channel significantly although further rehabilitation would be required to restore the channel to full design capacity. The supply is supported by the Craigieburn Dam which has sufficient capacity according to DWS. The current water sources at Keate’s Drift and Ndaya schemes are inadequate and unsustainable to meet the water demand for the area. The community of Ndaya currently obtains water supplies from streams, rivers and springs in the area for domestic purposes. In most instances these rivers and streams are located more than two kilometres from households and water quality is considered poor. An upgrade has been planned for the Muden WTP to extend the supply to the Keate’s Drift and Ndaya areas. The extension of the supply to these areas is currently in the design/construction stage. The pump stations and pipe lines would have to deliver 5100 kℓ to Keate’s Drift / Ndaya per day. The water would be delivered to a service reservoir from where it will be fed to the distribution networks and/or supply areas.
7.8 Recommendations for the uMzinyathi Water
Treatment Plants The projected total daily demand of 6.9 Ml/day, by 2025, for the Muden BWSS (which includes the daily demand for Muden and Opathe) was discussed with DWS, in order to establish whether the Craigieburn Dam would be a sustainable supplementary source and it was confirmed. To meet current and future demand, the Muden Bulk Water Supply Scheme has been planned and designed by Ilifa Consulting Engineers appointed by uMzinyathi DM and comprises of the following infrastructure:
The expansion of the existing Muden Water Treatment Plant from a capacity of 2.4 Ml/day to a capacity of 6.9 Ml/day.
The relocation of the portable 1 Ml/day Water Treatment Plant, located near Keate’s Drift abstraction works to Muden to augment supply.
The construction of approximately 150 km of bulk water pipelines ranging in diameter from 90 mm to 315 mm.
170
The construction of several bulk water reservoirs totalling approximately 15 Ml of storage, and distribution reservoirs totalling 0.3 Ml of storage.
The construction of six bulk water pump stations and two booster pump stations to carry water to the high lying areas of the project area.
The construction of approximately 77 km of distribution water pipelines (including reticulation), ranging in diameter from 63 mm to 90 mm.
The construction of approximately 410 standpipes to provide water to the entire project area. In order to mitigate the constraints of the water supply to Keate’s Drift, it is recommended to supply this area from Muden WTP and the preferred option is:
A pump station at the plant pumping directly to the service reservoir over a distance of ± 17.3 km. The advantage of this option is that only one pump station at the plant is required. The disadvantage is that the pumping head is such that expensive pipes (ductile iron vs uPVC) or larger pipes (i.e. 400 mm v 315 mm) would be required. The total pumping head at the plant is ± 95 m requiring 75 kW motors for three pumps running in parallel.
The centre line levels vary between 815 m at the purification plant and ± 700 m at the
proposed service reservoir in Keate’s Drift. The proposed Keate’s Drift service reservoir top
water level is slightly higher than the level at the plant. The water supply from the service
reservoir to Keates Drift would require a pressure reducing installation. The supply scheme
capacity up to the service reservoir is 90 ℓ/s and ± 150 ℓ/s downstream of the service
reservoirs.
The aim of the Muden Bulk Water Supply Scheme is to:
Consolidate water supply sources to achieve economies of scale.
Provide a safe and reliable source of potable water to promote health and hygiene and reduce the incidence of waterborne diseases for a population of 59 880 (7485 households) in the project area.
Create employment opportunities for the community for the duration of the construction programme.
Promote community awareness in terms of general health and hygiene issues. In summary, the project is recommended for the following reasons:
It is a cost effective solution.
It makes use of existing infrastructure most effectively.
Operation and Maintenance activities at the Muden Abstraction Works and Water Treatment Plant are already in place, and therefore pose no new challenge to the operating authority.
There is a guaranteed assurance of supply from the Muden irrigation canal which is supplied via the existing Craigieburn Dam.
Eliminates the operation of multiple Water Treatment Works situated at various places within the Municipal boundaries i.e. economy of scale.
(uMzinyathi DM 2015)
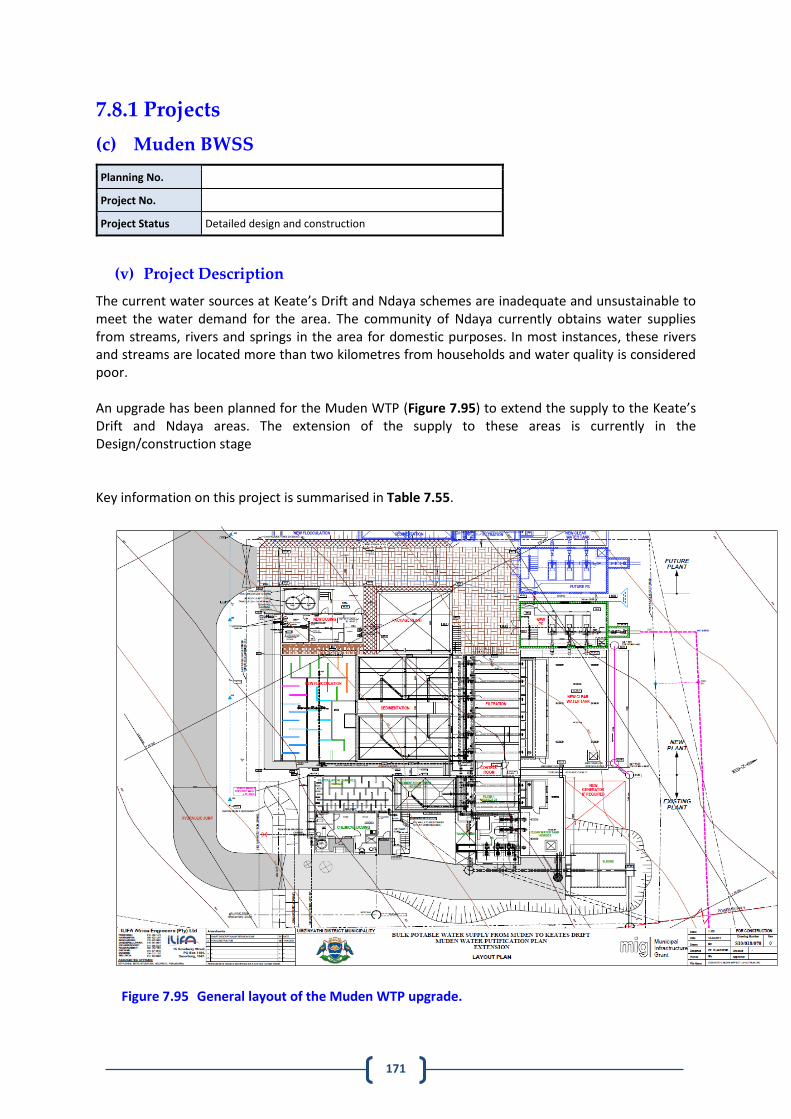
171
7.8.1 Projects
(c) Muden BWSS
Planning No.
Project No.
Project Status Detailed design and construction
(v) Project Description
The current water sources at Keate’s Drift and Ndaya schemes are inadequate and unsustainable to meet the water demand for the area. The community of Ndaya currently obtains water supplies from streams, rivers and springs in the area for domestic purposes. In most instances, these rivers and streams are located more than two kilometres from households and water quality is considered poor. An upgrade has been planned for the Muden WTP (Figure 7.95) to extend the supply to the Keate’s Drift and Ndaya areas. The extension of the supply to these areas is currently in the Design/construction stage Key information on this project is summarised in Table 7.55. Figure 7.95 General layout of the Muden WTP upgrade.
172
Table 7.72 Project information: Muden BWSS.
Project Components: The expansion of the existing Muden Water Treatment Plant from a capacity of 2.4
Ml/day to a capacity of 6.9 Mℓ/day (Complete)
The relocation of the portable 1 Ml/day Water Treatment Plant, located near Keates
Drift abstraction works to Muden to augment supply.
The construction of approximately 150 km of bulk water pipelines ranging in diameter
from 90mm to 315mm diameter pipelines (In construction).
The construction of several bulk water reservoirs totalling approximately 15ML of
storage, and distribution reservoirs totalling 0.3ML of storage.
The construction of six bulk water pumpstations and two booster pumpstations to
carry water to the high lying areas of the project area.
The construction of approximately 77km of distribution water pipelines (including
reticulation), ranging in diameter from 63mm to 90mm.
The construction of approximately 410 standpipes which will provide water to the
entire project area.
Capacity: 6.9 Mℓ/day.
(vi) Beneficiaries
The upgrade to the BWSS will benefit consumers within the Muden, Opathe, Keate’s Drift and Ndaya areas with an estimated population of 59880.
(vii) Implementation
The construction duration of this project is anticipated to be six years. The total cost is estimated to be R142 million at 2020 prices.
173
REFERENCES Department of Water Affairs and Forestry. 2004. Thukela Water Management Area Internal Strategic Perspective (ISP). Pretoria: Department of Water Affairs and Forestry. Department of Water and Sanitation. 2012. Water Resources of South Africa. Pretoria: Department of Water and Sanitation. Department of Water and Sanitation, 2016. Classification of significant water resources and determination of the comprehensive reserve and resource quality objectives in the Mvoti to Umzimkulu Water Management Area. Pretoria: Department of Water and Sanitation. Department of Water Affairs. 2011. Water Reconciliation Project-Reutilisation of Treated Waste Water. PRELIMINARY PHASE-Rapid Determination of the Environmental Water Requirements for the uMngeni Estuary. Pretoria: Department of Water Affairs. Department of Water and Sanitation, 2015. The uMkhomazi Water Project Phase 1: Module 1: Technical Feasibility Study Raw Water. Pretoria: Department of Water and Sanitation. Department of Water and Sanitation, 2017. Reconciliation Strategy of the KwaZulu-Natal Coastal Metropolitan Area. Pretoria: Department of Water and Sanitation. Department of Water Affairs. 2010. Water Reconciliation Strategy Study for the Kwazulu-Natal Coastal Metropolitan Areas; First Stage Strategy Infrastructure. Pretoria: Department of Water Affairs.
I
ACKNOWLEDGEMENTS Umgeni Water’s comprehensive 2019 Infrastructure Master Plan has been updated and improved to produce this 2020 version. The concerted effort of the Planning Services Department as a whole in producing this document is acknowledged and appreciated. This was all achieved under ever trying conditions with many staff working remotely whilst contending with the COVID-19 Lockdowns. Specific contributions by the various team members deserves acknowledgement:
Alka Ramnath (Planner) Project management, Section 2, Spatial information, Research and
input to all volumes
Graham Metcalf (Geohydrologist) Groundwater and Wastewater
Gavin Subramanian (Planning Engineer) Infrastructure on the North Coast and Mhlathuze
Systems
Angus Nicoll (Planning Engineer) Infrastructure on the South Coast and Mgeni Central
Systems
Vernon Perumal (Planning Engineer) Infrastructure on the uMkhomazi, Upper Mzintlava and
Upper Umzimkhulu Systems and compiling the Energy Section
Mark Scott (Planning Engineer) Infrastructure on the Mgeni Inland, uThukela Central and
Umfolozi Systems
Reshina Maharaj (Planning Engineer) Infrastructure on the uMkhuze, uPhongolo and Lake
Sibaya Systems
Nathaniel Padayachee (Planning Engineer) Infrastructure on the Upper uThukela and Buffalo
Systems
Nkosi Cele (Planning Engineer) Infrastructure data acquisition
Ntuthuko Ngcamu (Head – Water Demand Management Unit) with support from Mathews
Nokhanga and Nkukuleko Ndlovu Water Demand Management Section
Sakhile Hlalukane (Hydrologists) Water resources of the North Coast, South Coast and Upper
uThukela Systems
Sandile Sithole (Hydrologist) Water resources of all systems excluding the North coast, South
Coast and Upper uThukela Systems
Sifiso Khathi (Graduate Trainee – Hydrologist) Mapping and hydrology support
Thabani Zondi (Graduate Trainee - Hydrologist) Hydrology Support
Nombuso Dladla (Data Analyst) Spatial information
Hlgeniwe Cele (Administrator) kept the department functioning throughout the project
The 2020 Infrastructure Master Plan was not completed by the abovementioned people without the valued assistance of numerous other persons and parties. Their contributions are gratefully acknowledged. These include Umgeni Water and WSA Operations Staff, Umgeni Water’s Water and Environment Department (water quality), Umgeni Water’s Process Services Department (process and treatment details for UW plants and others) and Umgeni Water’s Catchment Management Department (climate change). Kevin Meier, PLANNING SERVICES MANAGER
Related Documents


