Volume 16, Number 1 ISSN 2150-5063 Allied Academies International Conference New Orleans, Louisiana March 27-30, 2013 Academy of Economics and Economic Education PROCEEDINGS Copyright 2013 by Jordan Whitney Enterprises, Inc, Arden, NC, USA

Welcome message from author
This document is posted to help you gain knowledge. Please leave a comment to let me know what you think about it! Share it to your friends and learn new things together.
Transcript

Volume 16, Number 1 ISSN 2150-5063
Allied Academies International Conference
New Orleans, Louisiana March 27-30, 2013
Academy of Economics and Economic Education
PROCEEDINGS
Copyright 2013 by Jordan Whitney Enterprises, Inc, Arden, NC, USA

page ii Allied Academies International Conference
New Orleans, 2013 Proceedings of the Academy for Economics and Economic Studies, Volume 16, Number 1
All authors execute a publication permission agreement taking sole responsibility for the information in the manuscript. Jordan Whitney Enterprises, Inc is not responsible for the content of any individual manuscripts. Any omissions or errors are the sole responsibility of the individual authors. The Academy of Economics and Economic Education Proceedings is owned and published by Jordan Whitney Enterprises, Inc., PO Box 1314, Arden, NC 28704, U.S.A., (828) 507-9770. Those interested in the Proceedings, or communicating with the Proceedings, should contact the Executive Director of the Allied Academies at [email protected].
Copyright 2013 by Jordan Whitney Enterprises Inc, Arden, NC
Allied Academies International Conference page iii
Proceedings of the Academy for Economics and Economic Education, Volume 16, Number 1, New Orleans, 2013
Table of Contents THE ECONOMETRIC TEST OF COST SUBADDITIVITY IN U.S. ELECTRIC INDUSTRY .................................................................................................................................... 1
Deergha Raj Adhikari, University of Louisiana at Lafayette Kishor Kumar Guru-Gharana, Texas A&M University-Commerce
THE DEBT INDEX AND ITS RELATION TO ECONOMIC ACTIVITY: AN EXTENSION .......................................................................................................................... 5
John J. Bethune, Barton College URBANIZATION ECONOMIES AND TECHNOLOGY OF PRODUCTION .................... 7
Farideh Farazmand, Lynn University IMPACTS OF JA BIZTOWN ON IMPROVING ECONOMIC AND FINANCIAL LITERACY AMONG MIDDLE-SCHOOL STUDENTS ....................................................... 13
Lillian Y. Fok, University of New Orleans Jack G. Brancewicz, President, Junior Achievement of Greater New Orleans Juli Pattison, Junior Achievement of Greater New Orleans
EFFECT OF GOVERNMENT DEFICIT SPENDING ON THE GDP IN THE UNITED STATES ....................................................................................................................... 19
Morsheda Hassan, Wiley College Raja Nassar, Louisiana Tech University Chang Liu, Southern West University of Finance and Economics, China
SIGNALING AND STRATEGIC INTERACTIONS: COMPETITION BETWEEN BIOLOGICS AND BIOSIMILARS DRUGS ........................................................................... 21
Lilia Hyttinen, HANKEN MODELING AFRICA’S ECONOMIC GROWTH ................................................................ 25
Oluremi Ogun, University of Ibadan, Nigeria

Allied Academies International Conference page 1
Proceedings of the Academy for Economics and Economic Education, Volume 16, Number 1, New Orleans, 2013
THE ECONOMETRIC TEST OF COST SUBADDITIVITY IN U.S. ELECTRIC INDUSTRY
Deergha Raj Adhikari, University of Louisiana at Lafayette
Kishor Kumar Guru-Gharana, Texas A&M University-Commerce
ABSTRACT
There have been several studies of market power and existence of cost subadditivity in case of U.S cigarette industry and various utility industries. But there is dearth of similar studies in U.S. electric industry. This study attempts to fill that gap. We apply Evans and Heckman’s test in the case of cost subadditivity in U.S. electric industry because the electric utility industry in the United States is often cited as an example of a less than perfectly competitive industry. The necessary and sufficient conditions of the test require that the firms chosen for the study have the output at least twice the minimum output observed in the sample. We chose 19 firms that met the conditions. The output quantity for each of the firms was split into the minimum observed quantity and the residual quantity as required by the test. Using a Cobb-Douglas production function the total cost of production for both components of total output (i.e. the minimum quantity and the residual quantity) for each firm were computed and compared with the actual cost of production of the entire quantity by each firm. We found that the sum of the cost of production of the minimum quantity and that of the residual quantity was greater than the cost of production of entire quantity for each firm. Thus, all 19 firms in our sample were found to exhibit cost subadditivity and thereby a natural monopoly.
INTRODUCTION
The adherents of deregulation maintain that an increased competition in the markets
invariably enhances efficiency in production and distribution. The underlying logic is that efficiency in allocation is achieved as firms after deregulation tend to attain the output level where marginal cost equals price. In so doing, the firms also tend to achieve production efficiency by choosing the input combination that produces a given level of output with a given level of technology at the least costs. But the opponents of deregulation question whether a competitive market always brings about production and allocative efficiency. A situation where the average cost of producing the total demand quantity by a single firm is lower than the average cost of producing the same quantity by two or more firms creates opportunity for a natural monopoly. If that occurs, the cost of producing the total demand quantity would be minimized by allowing one firm to produce all quantity, that is, by restricting other firms to enter the market.
A firm, operating in the short run, finds it impossible to vary the quantities of all the inputs it uses in the production, due to its inability to constantly adjust its production capacity to match the ever changing demand for its product. If the capacity of production cannot be
page 2 Allied Academies International Conference
New Orleans, 2013 Proceedings of the Academy for Economics and Economic Studies, Volume 16, Number 1
adjusted (changed) according to each incremental unit of production then such a situation gives rise to an average cost curve that slopes downward until the capacity is fully exhausted. This situation persists as long as the firm fails to fully adjust its production capacity to every marginal increment in the production. This phenomenon is also referred to as the “economy of scale
THE DATA AND METHODOLOGY
The data on all the variables (e.g. input costs and output) for the U.S. electric industry
have been obtained from the United Nations Industrial Development Organization (UNIDO) website: http://www.unido.org. Only those firms have been chosen for the study for which the output is at least double of the minimum quantity observed in the sample in order to satisfy the constraints defined in our model. The relevant data set on all the firms is given in Appendix A.
The costs of producing total output have been estimated using the Cobb-Douglas cost function as shown in the appendix-A. To test for cost subadditivity, we need to split each firm’s output into two or more parts. A firm’s output quantity can be split into two parts in infinite number of ways without violating the constraint. However, to economize on time, output in each observation has been split into the minimum observed quantity, which is 0.248 million kilowatt hours, and the residual quantity. Then using the estimated cost function, the cost for each of the two components has been estimated for each firm. Based on the above estimates, the degrees of subadditivity have been estimated for each of the admissible firm using equation (12). Values less than zero, zero, or greater than zero for the variable SUBt imply cost subadditivity, additivity, and super-additivity, respectively.
SUMMARY OF RESULTS
If the average cost of producing the whole demand quantity by a single firm is lower than that of producing the same quantity by two or more firms combined, then such situation gives rise to a natural monopoly. In this situation the cost of producing the whole demand quantity is minimized by allowing one firm to produce all quantity. The electric utility industry in the United States is often cited as an example of a natural monopoly. Our study applies Evans and Heckman’s test for the test of cost subadditivity on U.S. electric industry. The necessary and sufficient conditions of the test require that the firms chosen for the study have the output at least twice the minimum output observed in the sample. We chose 19 firms that met the conditions. Then the output quantity for each of the firms was split into the minimum observed quantity and the residual quantity as required by the test. Using a Cobb-Douglas production function the total cost of production for each of the quantities (i.e. the minimum quantity and the residual quantity) for each of the firms were computed and compared with the actual cost of production of the entire quantity by each firm. We found that the sum of the cost of production of the minimum quantity and that of the residual quantity was greater than the cost of production of entire quantity for each firm. Thus, each of the firms in our sample was found to exhibit cost subadditivity and thereby a natural monopoly.
Allied Academies International Conference page 3
Proceedings of the Academy for Economics and Economic Education, Volume 16, Number 1, New Orleans, 2013
REFERENCES Adhikari, Deergha (2004). Measuring Market Power of U.S. Cigarette Industry. Applied Economics Letters, 11(15),
957-59. Baumol, W. J.; J. C. Panzar and Robert D. Willig (1982). Contestable Markets and
the Theory of Industry Structure, San Diego: Harcourt, Brace, Jovanvich. Becker, Klaus G., Von Ende, Eleanor T. (2006). Sub-Game Perfect Equilibria in Natural Monopoly Markets.
Atlantic Economic Journal, 34(3), 365-366. Berndt, Ernst R. (1991). The Practice of Econometrics: Classic and Contemporary. Addison-Wesley Publishing
Company, Inc. Bitzan, John D. (2003). Railroad Costs and Competition. Journal of Transport Economics & Policy, 37(2), 201-225. Chang, Hsihui, Mashruwala, Raj (2006). Was the bell system a natural monopoly? An application of data
envelopment analysis. Annals of Operations Research, 145(1), 251-263. Cubukcu, K. Mert, Guldmann, Jean-Michel (2008). Geography and the costs of local telephone networks. Annals of
Regional Science, 42(4), 821-842. Currier, Kevin M., Jackson, Brian K (2008). A Pedagogical Note on the Superiority of Price-Cap Regulation to
Rate-of –Return Regulation. Journal of Economic Education, 39(3), 261-268. Evans, David S. and Heckman, James J. (1984). A Test for Subadditivity of the Cost Function with an Application
to the Bell System. American Economic Review, 74, 615-623. Everett, Sophia (2008). Public sector deregulation: a paradigm in conflict. Maritime Policy & Management, 35(4),
341-351. Fung, K. K., Kolar, Sri Harsha, Karnam, Pavan (2007) “ Regulating Natural Monopoly—Flash Animation,” Journal
of Economic Education; 38(2), 255-255. Gordon, D.V., Gunsch, K., Pawluk, C.V. (2003). A natural monopoly in natural gas Transmission. Energy
Economics, 25(5), 473. Gujarati, Damodar N. (1995), Basic Econometrics, McGraw Hill, Inc. Jamasb, Tooraj, Pollitt, Michael (2008). Security of Supply and Regulation of Energy Networks. Energy Policy,
36(12), 4584-4589. Kwoka, John E. (2006) “The Role of Competition in Natural Monopoly: Costs, Public Ownership, and Regulation.
Review of Industrial Organization, 29(1/2), 127-147. Kristin Boose (1991). An Analysis of Subadditivity of Costs as Applied to the Deutsche Bundespost.
(Unpublished). Nicholls, William H. (May 1949). The Tobacco Case of 1946. American Economic Review: Papers and Proc.39(3),
284-296.
page 4 Allied Academies International Conference
New Orleans, 2013 Proceedings of the Academy for Economics and Economic Studies, Volume 16, Number 1
Panzar, John C., 1989. Technological determinants of firm and industry structure. In Handbook of Industrial Organization, R. Schmalensee & R. Willig (ed.), ed. 1, vol.1, ch. 1, 3-59, Elsevier.
Ramos-Real, Francisco Javier (2005). Cost functions and the electric utility industry. A contribution to the debate
on deregulation. Energy Policy, 33(1), 69-87. Sullivan, Daniel (1985). Testing hypothesis About Firm Behavior in the Cigarette Industry. Journal of Political
Economy, 93(1-3), 586-598. Sumner, Daniel A. (1981). Measurement of Monopoly behavior: An Application to the Cigarette Industry.
Journal of Political Economy, 89(4), 1010-1019. Sueyoshi, Toshiyuki (1996). Divestiture of Nippon Telegraph and Telephone. Management Science, 42(9), 1326-
1351. Won, Gu-Hwan (2007). Electric power industry restructuring and ROE: The case of Korea Electric Power
Corporation. Energy Policy, 35(10), 5080-5090. Wills-Johnson, Nick (2008). Separability and Subadditivity in Australian Railways. Economic Record, 84(264), 95-
108. Yudong Qi, Xuexin Liu, Zhili Wang (2008). Governance Model Reform in Natural Monopoly Industries. Chinese
Economy, 4(4), 5-22.

Allied Academies International Conference page 5
Proceedings of the Academy for Economics and Economic Education, Volume 16, Number 1, New Orleans, 2013
THE DEBT INDEX AND ITS RELATION TO ECONOMIC ACTIVITY: AN EXTENSION
John J. Bethune, Barton College
ABSTRACT
During the 1970s and 80s the concept of a “misery index” was used as a proxy to
describe how well, or poorly, the macro economy was performing. In its simplest form the misery index was calculated by adding the rate of inflation to the rate of unemployment, thus a higher index indicated a poorly preforming economy.
In the past two decades, with inflation seemingly under control and, until recently, a modest level of unemployment, the misery index has not been the subject of policy discussions or political discourse. Rather, concern about the national debt and soaring budget deficits seems to be the focus of those who worry about our economic future.
With expanding national indebtedness and seemingly endless deficit spending the world’s economies appear to face different issues that move beyond inflation, unemployment, and sluggish growth rates. While there are clearly empirical relationships for these variables to debt and deficit levels, until recently we did not have an index that shows explicitly how debt affects economic activity.
This paper expands on a previous publication that combines debt to GDP and deficit to federal spending ratios to develop a “debt index” for several national economies. While the earlier effort used measures of the debt index to compare with various macroeconomic variables, this work will compare the movement of the debt indices through time with the movement of macroeconomic variables across 14 countries.

page 6 Allied Academies International Conference
New Orleans, 2013 Proceedings of the Academy for Economics and Economic Studies, Volume 16, Number 1
Allied Academies International Conference page 7
Proceedings of the Academy for Economics and Economic Education, Volume 16, Number 1, New Orleans, 2013
URBANIZATION ECONOMIES AND TECHNOLOGY OF PRODUCTION
Farideh Farazmand, Lynn University
ABSTRACT
This study examines the impact of external economies of urbanization on the elasticity of
substitution. The study covers 19 two digit SIC level industries in 47 SMSAs in the United States. The findings show that the elasticity of substitution is significantly related to the urbanization economies in half of the industries. The results confirm the relationship between economic diversity and growth of urban centers and technological innovation.
INTRODUCTION
Agglomeration economies are external size factors which affect production costs and technology. Urbanization economies are external economies of scale to the firm and industry while localization economies are external economies of scale to the firm. The research investigates the following question: Do external economies of city size affect the production technology of manufacturing industries within the city? It is hypothesized that agglomeration economies significantly affect elasticity of substitution parameter. In this study, urbanization economies have been defined by the extent of industrialization of each city, availability of business services and population of each city.
REVIEW OF THE LITERATURE
Spatial agglomerations or clusters have external economies of same sector businesses and employees for firms within that industry that is called localization economies, while urbanization economies are external economies of total economic and social institutions size of a location which decease production costs of all firms and industries in that location (Harrison, Kelley & Gant, 1996; Hoover, 1971; Isard, 1956; Weber, 1957).
Localization economies, referred by Harrison et al. (1996) as Static Agglomeration, are economies of scale in production resulting in availability of specialized inputs at lower costs (Harrison, et al. 1996).Urbanization or Dynamic Agglomeration Economies refers to spillover of know how and transmission of knowledge in locations with diverse economic activities that not only reduces the cost of general input but also facilitates technological change resulting in higher productivity and lowers average cost (Harrison et al., 1996; Marra, Carlei & Crociata, 2011).
The positive relationship between the degree of urbanity and adaptation of new technology has it’s roots in the higher degree of competition and faster exchange of ideas in

page 8 Allied Academies International Conference
New Orleans, 2013 Proceedings of the Academy for Economics and Economic Studies, Volume 16, Number 1
bigger cities (Beeson, 1987; Glaeser, 1998; Harrison et al., 1996; Marra et al., 2011). Therefore, city size also lowers the cost of production by accelerating the rate of technological progress. Agglomeration economies also change the organization of production of firms and industries by making supply of intermediate products possible through the market. When the firm or industry purchases intermediate products and drop the internal production, the shape of the total average cost of firm or industry changes (Stigler, 1951). This can also be an indication of technological change. In this study the effects of agglomeration economies on the organization and technology of the production will be tested.
Most of the empirical studies of agglomeration economies are based on measuring a production function, or measuring a relationship derived from a production function. Some of these works measure the effects of agglomeration economies on average productivity of labor by estimating a production function which includes the agglomeration economies variable (s) (Greytak & Blackley, 1985; Henderson, 1986; Kawashima, 1975; Moomaw, 1981; Segal, 1978; Tabuchi, 1986).The present study is based on a labor demand equation derived from a constant elasticity of substitution (CES) production function.
Carlino (1978) states that the spatial diffusion of innovation begins in the largest urban areas. Beeson (1987) shows that the rate of technical progress across states is affected by agglomeration economies. Harrison et al. (1996) examine the effects of localization and urbanization economies on the adaptation of new technology by manufacturing establishments. They find the economic diversity of the location is a more important factor “for promotion of adopting innovative firm behavior” than localization economy. Marra et al. (2011) examine the growth of 103 Italian provinces and show the relationship between economic diversity of Italian provinces and their economic growth rate.
Black and Henderson (1999) suggest that the urban re-concentration in the biggest cities could be the result of transformation of the U.S. economy from manufacturing to financial and high-tec service economy. They examine 15 industries in high-tec and capital goods for 1963-1992 period and show that all industries are agglomerated and the bigger cities have the largest share of employment of those industries. They report the high-tec industries as the most agglomerated industries. The current study is concerned with the relationship between urbanization economies and the characteristics of production represented by the elasticity of substitution. Although the sample is the manufacturing industries, but the results could be tested for the service or high-tec sectors in the future.
METHODOLOGY AND DATA
To measure the effects of agglomeration economies on the production characteristics a general form of CES production function has been chosen. To measure the effects of
agglomeration economies on elasticity of substitution the parameters of a labor demand equation derived from the production function have been estimated. The following labor demand equation has been derived from the CES production function:
L = CW Q

Allied Academies International Conference page 9
Proceedings of the Academy for Economics and Economic Education, Volume 16, Number 1, New Orleans, 2013
Where C is collection of constant terms and δ = 1/ (1+B) is elasticity of substitution. The agglomeration economies variables have been incorporated into the production function parameter of the elasticity of substitution. The derived demand equation formulation of the production function with agglomeration variables is as follow:
L = C W / Q / Or,
L = C W ϒQ Q Q (1) At industry level the external size factors are the urbanization economies measured by
total manufacturing employment, number of business service firms and population of each city. Therefore, the labor demand equation in (2) has been estimated at industry level:
lnL = lnC - ϒ lnW + β lnQ + β lnQ lnM + + β lnQ lnBN + β lnQ lnPOP (2)
Where, L is ith industry employment in jth city, W is ith industry wage rate in jth city, Q is ith industry output in jth city, M is total manufacturing employment in jth city, BN is number of business service firms in jth city and POP is population of jth city. Where:
i = 1……………..19 j = 1…………….47 The following hypothesis has been tested: H It is hypothesized the estimated values of β and/or β and/ or β in (2) are significantly different from
zero. If they are, then urbanization economies affect elasticity of substitution. Cross sectional analysis over 47 SMSAs for 19 two digit SIC industries have been
conducted. Data covers 3 separate years of 1972, 1977 and 1982. This study is part of a broader study that will continue to the recent years. The data on labor employment, wage rate, output, number of firms within each industry, industry sales, the total manufacturing employment of each SMSA, the number of business service firms in each SMSA, the population of each SMSA and density of each SMSA have been collected. Data on labor, wages, output and number of firms were at industry level.
RESULTS OF EMPIRICAL INVESTIGATION
Regression analysis was applied to equation (2) to test for non-zero β and/or β and/ or β measuring the effects of city size on the elasticity of substitution parameter of the manufacturing industry. The industry labor demand equation in (2) was estimated for 19

page 10 Allied Academies International Conference
New Orleans, 2013 Proceedings of the Academy for Economics and Economic Studies, Volume 16, Number 1
manufacturing industries across 47 SMSAs for three separate years 1972, 1977 and 1982. The
number of tables containing the results of estimated values of ϒ, β , β , β , β are too long to be listed in this paper. In general, the results were quite good. That is the R s were high and the F-test indicated that the specified relations were significant.
The results of regression analysis of estimating labor demand equation in (2) for 1982 indicated that β , the coefficient of total manufacturing size, was significantly different from zero for five industries, β , the coefficient of business service size was significantly different from zero for two industries and β , coefficient of population in each city, was significantly different from zero for one industry. All together β were significantly different from zero for eight industries in 1982. For 1977, β was significantly different from zero for one industry, β for two industries and β for three industries. Altogether β were significantly different from zero for six industries. Results of regression analysis of estimating demand equation in (2) for 1972 showed that β was significantly different from zero for six industries. β was significantly different from zero for one industry and β for three industries. All together s were significantly different from zero for eight industries.
The above results indicate that urbanization economies affect the elasticity of substitution of labor and capital for some industries. This could be indicative of the relationship between city size and technological change for some industries. Also, the size of total manufacturing of each city was a more significant variable than the size of business services and population of each city in affecting the elasticity of substitution. The later result could be related to the availability of general intermediate products, out sourcing, transmission of new knowledge, adaptation of new technology and the role of inter industry relationship in each industry’s production technology.
SUMMARY AND CONCLUSION
The purpose of this research is to extend the line of research on external economies of city size. The impact of the city size on the elasticity of substitution parameter was measured. The elasticity of substitution was found to be significantly related to one or another of the agglomeration variables in half of the industries in all time periods. In general, the analysis indicates that industry size, business service availability and population were significant factors affecting the elasticity of substitution in more than half of the manufacturing industries.
REFERENCES
Black, D. & V. Henderson (1999). Spatial evaluation of population and industry in The United States. The
American Economic Review. 89.2, 321-327. Beeson, P. (1989). Total factor productivity growth and agglomeration economies in manufacturing, 1959-73.
Journal of Regional Science.27(2) 183-199. Carlino, G. (1978). Economies of scale in manufacturing location, Boston: Martinus Xijhoff Social Science
Division, Leiden Press.
Allied Academies International Conference page 11
Proceedings of the Academy for Economics and Economic Education, Volume 16, Number 1, New Orleans, 2013
Glaeser, E. L. (1998). Are cities dying? The Journal of Economic Perspectives. Spring, 12(2):139-160. Greytak, D. & P. Blackly (1985). Labor productivity and local industry size: further issues in assessing
agglomeration economies. Southern Economic Journal. 51(4):11-21. Harrison, B., M. R. Kelley & J. Grant (1996). Exploring the intersection of agglomeration, firm effects, and
technological change. Economic Geography, 72.(3):233. Henderson, V. (1986). Efficiency of resource usage and city Size. Journal of Urban Economies. 19: 47-70. Hoover, E. (1971). An Introduction to regional economies. New York: Alfred Knoff. Isard, W. (1956). Location and space-economy. New York: John Wiley and Sons, Inc. and The Technology Press of
Massachusetts Institute of Technology. Kawashima, T. (1975). Urban agglomeration economies in manufacturing industries. Papers of the Regional Science
Association. 34(1):157-172. Marra, A., V. Carlei, & A. Crociata, (2011). Economic diversity and employment levels in Italian provinces over the
period 1951-2001; Does a recurrent industrial pattern exist? Modern Economy. 213(July):438-445. Mittelstaedt, J. D., W. A. Ward & E. Nowlin (2006). Location, industrial concentration and the propensity of small
US firms to export: Entrepreneurship in the international marketplace. International Marketing Review. 23(5):486-503.
Moomaw, R.L. (1981). Productive efficiency and region. Southern Economic Journal. 48(2):344-357. Segal, D. (1978). Are there returns-to-scale in city size? The Review of Economics and Statistics. 58(3):339-350. Stigler, G. (1951). The Division of Labor is Limited by the Extent of the Market. The Journal of Political Economy. Tabuchi, T. (1986). Urban agglomeration, capital augmenting technology, and labor market equilibrium. Journal of
Urban Economics. 20(2):211-228. Census of Manufacturers. (1972, 1977, 1982). U.S. Bureau of the Census. Census of Service Industry. (1972, 1977, 1982). U.S. Bureau of the Census. Census of Population. (1972-1982). U.S. Bureau of the Census. Weber, A. (1957). Theory of the location of industries. Chicago: The University of Chicago Press.

page 12 Allied Academies International Conference
New Orleans, 2013 Proceedings of the Academy for Economics and Economic Studies, Volume 16, Number 1

Allied Academies International Conference page 13
Proceedings of the Academy for Economics and Economic Education, Volume 16, Number 1, New Orleans, 2013
IMPACTS OF JA BIZTOWN ON IMPROVING ECONOMIC AND FINANCIAL LITERACY AMONG
MIDDLE-SCHOOL STUDENTS
Lillian Y. Fok, University of New Orleans Jack G. Brancewicz, President, Junior Achievement of Greater New Orleans
Juli Pattison, Junior Achievement of Greater New Orleans
ABSTRACT
There were 1329 students from 22 schools participated in the JA BizTown program and 90 students from two schools were in the control group. Comparisons of the JA BizTown and control group were made in terms of increase in matched paired objective test (30 questions), increase in matched paired students’ attitude, overall pre-test and post-test scores, and overall pre-test and post-test attitudinal scores. The MANOVA results indicated that JA BizTown curriculum can dramatically increase the students’ knowledge in Finance and Economics when comparing the BizTown group and the control group. Furthermore, JA BizTown curriculum can dramatically increase the students’ knowledge in Finance and Economics regardless of their gender and ethnicity.
INTRODUCTION
Low financial literacy among American students causes serious concern among educators and education advocacy groups [ACEC, 2001; ASEC, 1999]. Because of the current economic situation, more schools realize the importance and urgency for students to acquire literacy in economics and finance during their earlier years [American School Board Journal, 2008; Black, 2009; Finkel, 2011; Varcoe et al., 2005]. The Oklahoma legislature signed The Passport to Financial Literacy Act in 2007, requiring all seventh-graders demonstrate proficiency in 14 financial areas [Black, 2009]. Different states around the country and the companies in the private sector have developed similar finance programs for schools. The program used in this study is JA BizTown. JA BizTown is designed to inspire and prepare 5th and 6th grade students for a lifetime of learning and academic achievement through career exploration and financial literacy. Research shows that career development begins in early childhood and peaks at age 10 when students often model their behavior and career aspirations after their parents [Auger, 2005].
Many researchers have studied and documented the financial literacy of students but few have actually evaluated the effectiveness of the programs empirically. Our study will adopt the model proposed by Becker and Walstad [1987]. The model proposes that cognitive achievement, gain in economics and finance knowledge, is affected by students’ demographic characteristics and classroom/environmental influences. Student demographic characteristics will include gender, racial affiliation, family income (participation in subsidized lunch program),

page 14 Allied Academies International Conference
New Orleans, 2013 Proceedings of the Academy for Economics and Economic Studies, Volume 16, Number 1
previous participation in other Junior Achievement programs, and attitude towards education. Classroom/environmental influences will include the number of teachers involved in delivering the JA BizTown curriculum, perception of time spent on lessons, and perception of teacher effectiveness.
The preceding discussion forms the underlying logic of the research question and hypotheses. In this study, the research question is to find out what are the important factors that affect students’ economic understanding. Specifically, the current study will test seven hypotheses. Hypothesis 1: Different gender groups do not have different levels of students’ understanding of economics and financial concepts. Hypothesis 2: Different racial groups do not have different levels of students’ understanding of economics and financial concepts. Hypothesis 3: Previous Junior Achievement participation is not related to students’ understanding of economics and financial concepts. Hypothesis 4: Students’ attitude towards education is not related to their understanding of economics and financial concepts. Hypothesis 5: The number of teachers involved in teaching the JA BizTown lessons is not related to students’ understanding of economics and financial concepts. Hypothesis 6: Students’ perception of time spent on lessons is not related to their understanding of economics and financial concepts. Hypothesis 7: Students’ perception of teacher effectiveness is not related to their understanding of economics and financial concepts.
METHODOLOGY AND ANALYSIS Research Design
This study is quasi-experimental, with pre-post treatment (JA BizTown) design. The sampling of schools into the experimental and control groups will not be randomized due to the intense participation required by the schools. The experimental group is comprised of the schools willing to participate in the JA BizTown program and the control group is comprised of schools with similar student profile but not participate in JA BizTown program. The target population includes 5th-6th grade students enrolled in public and charter schools in Orleans, Jefferson, Plaquemines, St. Bernard, and St. Tammany parishes during the academic year of 2011-2012.
Subjects
To examine the factors influencing the students’ understanding of economics and finance concepts, all students in the (5th and/or 6th grade) class chosen by the participating school were tested before and after the JA BizTown program. There were 1329 students from 22 schools in the JA BizTown group and 90 students from two schools in the control group. In the JA BizTown group, there were 609 students from Orleans Parish, 359 from Jefferson, 262 from St. Tammany, and 99 from Plaquemines with 49% female (502) and 51% male (520). With respect to ethnicity, 41% indicated White or part White, 50% Black, 10% Hispanic, 6% Asian, 11% American Indian/Alaskan Native, and 12% Others. In the control group, there were 38 students
Allied Academies International Conference page 15
Proceedings of the Academy for Economics and Economic Education, Volume 16, Number 1, New Orleans, 2013
from Orleans Parish and 52 from Jefferson, with 45% female (28) and 55% male (34). With respect to ethnicity, 45% indicated White or part White, 40% Black, 24% Hispanic, 7% Asian, 10% American Indian/Alaskan Native, and 18% Others. The findings have indicated that the demographic background of the JA BizTown group and the control group are quite similar.
Instruments and Measurement of Variables
Economics and Financial Literacy Survey: It contains 30 multiple choice items developed based on important economic and financial concepts. This instrument was tested and validated in previous JA programs. This instrument will be used for pre-test and post-test.
Student Pre-Program and Post-Program Surveys: These surveys were created by the evaluator according to the established procedures for developing sound instrument. The Pre-Program Survey contains demographic questions and 11 perceptual questions on students’ attitude and self-image using a 4-point Likert scale with “1” being “Strongly Disagree” and “4” being “Strongly Agree” (Figure 1). It will be given to the students when the pretest is administered. The Post-Program Survey contains the 11 perceptual questions on students’ attitude and self-image in the Pre-Program Survey along with eight perceptual questions on JA BizTown curriculum design and delivery and seven questions on JA BizTown visit. The perceptual questions all use a 4-point Likert scale with “1” being “Strongly Disagree” and “4” being “Strongly Agree.”
RESULTS AND CONCLUSIONS
Analysis of gender
Hypothesis 1 suggested that there would be no difference between male and female students in their understanding of and attitude towards economics and financial concepts. Male and female students were compared in terms of increase in matched paired objective test (30 questions), increase in matched paired students’ attitude, overall pre-test and post-test scores, and overall pre-test and post-test attitudinal scores using MANOVA.
There are 502 female and 509 male students in the JA BizTown group who completed the JA BizTown curriculum. The MANOVA results indicated there is not enough evidence to find statistically significant differences in increase in matched paired objective test (30 questions), increase in matched paired students’ attitude, overall pre-test and post-test scores, and overall pre-test and post-test attitudinal scores. Previous research in education may have suggested that differences in socialization may affect male and female students’ learning. However, the results in this study indicated that the JA BizTown curriculum can improve the students’ knowledge in Finance and Economics for both male (average increase of 4.5) and female (average increase of 4.4) students with no significant difference in score increase between gender groups.
page 16 Allied Academies International Conference
New Orleans, 2013 Proceedings of the Academy for Economics and Economic Studies, Volume 16, Number 1
Analysis of ethnicity
Hypothesis 2 suggested that there would be no difference in students’ understanding of and attitude towards economics and financial concepts between Black and White groups. With respect to ethnicity, students were asked to indicate their race by answering a Yes/No for being in a certain racial group or partly in that group. There are 41% of students who indicated White or part White, 50% Black or part Black, 10% Hispanic or part Hispanic, 6% Asian or part Asian, 11% American Indian/Alaskan Native, and 12% Others. Three comparisons were made focusing on those in the White, Black, and Hispanic groups in terms of increase in matched paired objective test (30 questions) and increase in matched paired students’ attitude. The MANOVA result indicated no statistically significant improvement in objective test scores but significant reduction of attitudinal scores between those who are White or part White and those who are not White at all. When comparing students who are Black/part Black vs. not Black, there is statistically significant higher increase in objective test scores in the not Black group (5.24) than the Black/part Black group (4.1) but significant reduction in attitudinal scores. The same analysis was applied to the Hispanic group but the results were not significant. The findings give support to the hypothesis that different racial groups have different students’ understanding of economics and financial concepts. The reduction in attitudinal scores, however, is not expected.
Analysis of Previous JA Participation
Hypothesis 3 suggested that previous JA participation is related to students’ understanding of economics and financial concepts. Students with previous JA experience vs. those with no JA experience were compared in terms of increase in matched paired objective test (30 questions), increase in matched paired students’ attitude, overall pre-test and post-test scores, and overall pre-test and post-test attitudinal scores using MANOVA. . The results indicated insufficient evidence to find statistically significant differences in increase in matched paired objective test (30 questions) but students’ attitude scores were reduced more in the group with previous JA participation than the one without previous JA participation. 359 students have indicated that they have participated in other JA programs before JA BizTown. The number is much higher than expected which could mean the students may not understand the question completely. Analysis of factors affecting students’ understanding of economics and financial concepts
Hypotheses 4 to 7 suggested students’ understanding of economics and financial concepts could be related students’ attitude towards education, the number of teachers involved in teaching the curriculum, time spent on lessons, and teachers’ effectiveness. Correlations among these variables are examined. With regard to increase in objective test scores, the only factor having significant relationship is students’ perception of teachers’ effectiveness of teaching the JA BizTown lessons. The more positive is a student’s perception of teacher’s effectiveness, the higher the increase of test score is expected. The data did not support relationship between increase in test scores and students’ attitude towards education, the number of teachers involved
Allied Academies International Conference page 17
Proceedings of the Academy for Economics and Economic Education, Volume 16, Number 1, New Orleans, 2013
in JA BizTown lessons, and the time spent on lessons. When analyzing the changes in students’ attitude before and after JA BizTown curriculum, the results indicated significant relationship with students’ attitude towards education, the number of teachers involved in teaching the curriculum, time spent on lessons, and teachers’ effectiveness. As expected, when the students perceived more positively in the amount time spent on lessons and teachers’ teaching effectiveness, the changes in students’ attitude before and after JA BizTown curriculum were more positive. Notable in the pattern of positive relationships we found is a pattern of unexpected negative relationship between increase in attitude scores and students’ attitude towards education and number of teachers involved in JA BizTown lessons. Certainly, the literature leads to the expectation that students attitude towards education and the number of teachers involved would be found with more “positively” related to attitude improvement towards Economics and Finance. Yet these results suggested the contrary. Note that changing students’ attitude is a long term process. Perhaps in the future study, we can track students’ general attitude towards learning and their confidence levels over several years using a program that lasts not just a semester in order to bring deep rooted attitudinal changes.

page 18 Allied Academies International Conference
New Orleans, 2013 Proceedings of the Academy for Economics and Economic Studies, Volume 16, Number 1
Allied Academies International Conference page 19
Proceedings of the Academy for Economics and Economic Education, Volume 16, Number 1, New Orleans, 2013
EFFECT OF GOVERNMENT DEFICIT SPENDING ON THE GDP IN THE UNITED STATES
Morsheda Hassan, Wiley College
Raja Nassar, Louisiana Tech University
Chang Liu, Southern West University of Finance and Economics, China
ABSTRACT
The relationship between government deficit spending and the growth domestic product is of extreme importance for economic policy making, especially in times of economic downturns as has been experienced in the US and around the world in recent years. The literature is mixed on this issue. There are studies arguing that deficit spending has an adverse effect on the GDP by way of increasing the interest rate and hindering business investment. Other studies argue for deficit spending at a time of recession as being beneficial in that it spurs demand and has no effect on interest rate.
It is important to look at data in order to determine if deficit spending has an effect on GDP in the presence of control variables such as interest rate, unemployment, and inflation which may have an effect on the GDP.
In this study, we analyze data from the US and develop a time series model showing the relationship between deficit spending and GDP. Results revealed that government deficit spending had a negative effect on GDP. Inflation rate and interest rate had no effect on the GDP. Only unemployment had a negative effect on the GDP in the presence of deficit spending. It is interesting to note that GDP was cointegrated (having a long-run equilibrium relationship) with unemployment rate, interest rate, and inflation rate.

page 20 Allied Academies International Conference
New Orleans, 2013 Proceedings of the Academy for Economics and Economic Studies, Volume 16, Number 1

Allied Academies International Conference page 21
Proceedings of the Academy for Economics and Economic Education, Volume 16, Number 1, New Orleans, 2013
SIGNALING AND STRATEGIC INTERACTIONS: COMPETITION BETWEEN BIOLOGICS AND
BIOSIMILARS DRUGS
Lilia Hyttinen, HANKEN
ABSTRACT
The pharmaceuticals market is all about an innovation. Each firm must develop new technology and know-how in order to enter and serve the market. Firm’s profit, when it succeeds in development depends on whether it faces a competitor, that is, whether the other firm also succeeds (Tirole, 2006).
The incoming competition from generic biologic drugs is threatening to destroy the profits of brand biologics drugs manufacturers and impede their future operations. To continue to thrive, a firm takes costly actions to prevent mimicking by bad types. A firm’s commitment to behave aggressively in order to deter potential entrants has been examined through the lenses of signaling theories of predation and the profit destruction. The instrument of predation is usually low price, but it could be any strategic choice that hurts the bottom line of a rival. Results validate the hypothesis that brands use predatory strategies such branding and intense advertising to signal high barriers to entry and doing business. The findings suggest that unlike lone brands, the brands that are facing threat of generic entrants, invest massively in the new product developments and reformulations (R&D race theory), as well as invest more heavily in advertising and branding, to signal its products superiority.
The essay examines the competition between brand biologic drugs and biosimilars (generic) drugs, i.e.” within patent” competition. The interest lays not in the firm’s interaction with competitors per se, but rather, on the corporate finance context, specifically, the signaling issue in finance. The scope of this research is limited to biologic drugs. Biologic drugs, also known as therapeutics, are needed to be injected because of their larger (organic) molecules. Biologic drugs are regarded as the step closer to personalized medicine due to the higher efficacy and milder side effects than chemical drugs. Because there aren’t as many biologic drugs on the market yet, to my knowledge, the sample is a comprehensive set of all currently approved biologic drugs at the time of the research.
MOTIVATION I view brands’ massive R&D spending and intense advertising as the instruments of predation that signal high costs of entry and superior quality of their products. Riley, (2001) suggests that high introductory price can alone be a signal of product quality. Also, Harrington (1986) shows that if costs are correlated (entrant and incumbent), the optimal strategy of the firm is to choose the price higher than the monopoly price.
page 22 Allied Academies International Conference
New Orleans, 2013 Proceedings of the Academy for Economics and Economic Studies, Volume 16, Number 1
The idea of using capital structure as a signaling device was first advocated by Ross (1977) and Leland and Pyle (1977). Following their logic, I posit that a firm uses investments in R&D and intense advertising to signal product quality and for branding. The asymmetric information is costly for a “good types”, thus, they have an incentive to reduce informational gap. One alternative for the “good types” to overcome information asymmetry is to engage in signaling. Good type (a brand/innovator) proves itself by undertaking an action that is costly enough to deter mimicking by bad types (generics/imitators). Research Question
Credibility of signaling is examined in the framework of corporate finance theories of predation and the profit destruction: a firm’s commitment to be tough, to behave aggressively in order to deter potential entrants.
EMPIRICAL METHODOLOGY
The general framework of the corporate finance decisions’ impact on product markets is
described in Phillips (1995). The signaling theory suggests that action has to be costly enough to be credible, so that not everyone take it. At the core of principal-agent conflict is the theory of predation where the cash-rich firm can prey upon cash-poor rivals. The standard definition of predation is the predator voluntarily loses money in the short run so as to kick rival out of market. Tirole (2006) points out that the instrument of predation is usually low price, but it could be any strategic choice that hurts the bottom line and prospects of a rival: intense advertising, R&D race, selective price cuts, close positioning or clever versioning. For instance, in the pharmaceutical field, it could be new formulations of old versions of a drug.
I posit that a firm’s (a brand) commitment to be thought (Brander and Levis, 1986) signaled through costly actions: R&D spending and intense advertising. In addition, I have tested the profit destruction hypothesis; the entry of generics is predicted to negatively affect brands profit.
Unlike brands that do not facing generic competition, the brands that face generic competition are committed to engage in predatory behavior in order to avoid profit destruction. The sample has been divided in two sub-groups: lone brands and the brands that are facing generic competition. The estimates have been compared side-by-side to pinpoint aggressive strategies’ impact on the revenues of both groups. To test both hypotheses, the pooled cross-section regressions are estimated using a system of supply and demand equations, and instrumental variables techniques.
MAIN RESULTS
The results give support to the prediction that a brand uses intense advertisement to signal
product’s quality and high costs of entry and doing business (theory of predation), and thereby discourage entry. Similarly, the profit destruction hypothesis is also validated. These brands that

Allied Academies International Conference page 23
Proceedings of the Academy for Economics and Economic Education, Volume 16, Number 1, New Orleans, 2013
are facing generics substitutes are more vulnerable to profits destruction, and are motivated to take costly actions. The results suggest that the brands that facing generic entrants invest heavily in the new product developments and reformulations (R&D race theory), as well as employ aggressive branding strategy to signal its products superiority.
CONTRIBUTION
The essay contributes to several corporate finance literatures. Bagwell and Ramey
(1988); (Tirole, 2006) have studied the theories of predation and signaling. Also, Riley (2001) suggested that the optimal strategy of the firm is to choose a price higher than the monopoly price, thus, signaling that his cost is high; and, thereby relying on the information asymmetry. Fudenberg and Tirole (1986) offer their explanation of predation by an incumbent firm. In their model, the entrant is uncertain about how costly it will be to operate in the market, and does not observe the choice of incumbent. Or, (Riley, 2001) it could be the quantity sold or the secret discount on the listed price offered to “loyal” customers. That gives an incumbent the incentive to lower price (limit pricing theory). This essay offers empirical evidence to support the predation theory, while the instruments of predation are: an intense advertising and branding, as well as the R&D race to signal a firm’s intent to compete aggressively (Brander and Lewis, 1986).
Phillips (1995) tested the interaction of firms’ production and pricing decisions with the capital structure; capital structure can affect industry product markets because financial instruments alter the ownership of residual cash flow and the ability of firm to invest. Chevalier (1995) examined how a supermarket industry firm’s capital structure affects its ability to compete; also, Chevalier and Scharfstein, (1996) study links between balance sheet strength and product-market behavior in the supermarket industry. They measure the strength (weakness) of balance sheet by leverage, i.e. highly indebted has a weak balance sheet. Matsa (2005) has studied capital structure as a tool to influence a collective bargaining with labor unions. Alternatively, I have examined how pharmaceutical firms use corporate finance decisions, such as investments in R&D and advertisement to signal superior quality of products and high cost of doing business.
Rizzo and Zeckhauser (2005) analyzed the relationship between generic (chemical drugs/tablets) prescriptions share and brand prices and have found that the average price paid by consumers for a brand name drug falls substantially when a corresponding generics prescriptions’ share rises. They presume that consumers are more likely to switch to generics when the price gap is great. “This effect is substantial: a 10% increase in the consumer’s generic scrip share is associated with a 15.6% decline in the average he pays for brand-name drugs” (Rizzo, Zeckhauser, 2005, p.2) Yet, they have analyzed the pharmaceuticals (small molecule) drugs data that might not be applicable to the biologic drugs universe due to the substantial complexity in the characterization and manufacturing process of biologic drugs, as well as the costs associated with it. To my knowledge, the issue has not been examined empirically in the biologics drugs framework.
page 24 Allied Academies International Conference
New Orleans, 2013 Proceedings of the Academy for Economics and Economic Studies, Volume 16, Number 1
Earlier, the bargaining over conditions of trade theory (committing via customers and suppliers) that studied by Spulber (1989), Spiegel and Spulber (1994), Spiegel (1996) and Tirole (2006). The 3rd party is a regulator (customer), from which the firm (utility) tries to extract high regulated retail prices. Also Matsa (2005) has studied bargaining over conditions of trade with the 3rd party (labor union). Big Pharma has bargaining power because of existing relationship (the government is major customer due to Medicare, Medicaid program); and, arguably, has been able to bargain over conditions of trade with the regulator, such as to achieve the passage of rules that are favorable to brands. The Health Care Reform and “Biologics Competition and Innovation Act” has extended the brands biologics exclusivity to 12 years, as well as required the generics drugs manufacturers to conduct clinical trials prior to approval.
REFERENCES
Bagwell, K., and G. Ramey (1988) “Advertising and Limit Pricing”, RAND Journal of Economics, 19:1,p.59-71 Brander , J., and Lewis, T., (1986) “Oligopoly and Financial Structure: The Limited Liability Effect”. The American
Economic Review, Vol.76 (5). Chevalier, J., (1995) “Capital Structure and Product-Market Competition: Empirical Evidence from the Supermarket
Industry”, The American Economic Review, Vol.85 (3).p.415- Chevalier, J., and D. Scharfstein, (1996) “Capital- Market Imperfections and Countercyclical Markups: Theory and
Evidence,” American Economic Review, 86(4) p.703-25 Fudenberg, D, and J. Tirole (1986), “A Signal-jamming’ Theory of Predation”, RAND Journal of Economics, 17:3,
p366-76. Harrington, J., (1986), “Limit Pricing When Potential Entrant Is Uncertain,” Econometrica, 54:2,p.429-37. Leland, H., and D. Pyle (1977), “Informational Asymmetries, Financial Structure and Financial Intermediation,”
Journal of Finance, 32:2, p.371-87 Matsa, D.A.,(2006), “Capital Structure as a Strategic Variable: Evidence from Collective Bargaining”, Journal of
Finance, forthcoming. Phillips G.M., (1995) “Increased Debt and Industry Product Market. An Empirical Analysis”, Journal of Financial
Economics, Vol. 37, 189-238. Riley, J., (2001) “Silver Signals: Twenty-Five Years of Screening and Signaling” Journal of Economic Literature.
Vol.39.432-478. Rizzo J., R. Zeckhauser, (2005), “Generic Scrip Share and the Price of Brand-Name Drugs: The Role of Consumer
Choice”, NBER, 11431. Ross, S., (1977), “”The Determination of Financial Structure,” Bell Journal of Economics, 8:1,p.23-40 Spulber, D., (1989), “Product Variety and Competitive Discounts,” Journal of Economic Theory, Elsevier, 48(2),
p.510-525. Spiegel, Y. and D. Spulber (1994), “The Capital Structure of Regulated Firm”, RAND Journal of Economics, 25(3),
p.424. Tirole, J., (2006), “The Theory of Corporate Finance”, Princeton U
Allied Academies International Conference page 25
Proceedings of the Academy for Economics and Economic Education, Volume 16, Number 1, New Orleans, 2013
MODELING AFRICA’S ECONOMIC GROWTH
Oluremi Ogun, University of Ibadan, Nigeria
ABSTRACT
This study investigated Africa’s economic growth over the period 1996 to 2010, deriving its motivation from the theoretical and empirical literature on the subject. Factors peculiar to the continent such as conflicts, policy distortions, weak institutions, export reliance and low productivity growth were accommodated. Departure from the conventional model specification occurred in the areas of exclusion of some traditional factors and the emergence of new entries. The methodology consisted of both a static and a dynamic panel data analyses of fifteen countries distributed across the different regions of the continent. Some remarkable results were obtained.
INTRODUCTION AND THE LITERATURE
Various factors have been identified as accounting for the disappointing growth performance of Africa. These factors include, bad policies, poor education, political instability, inadequate infrastructure and low productivity growth (see e.g. Ndulu and O’Connell, 1999; Ndulu and O’Connell, 2009, Berthelemy and Söderling, 2001; Hoeffler, 2002 and Fosu, 2002). The mass of the studies devoted to the investigation of Africa’s growth issues straddles six major categories identified here by authors: Easterly and Levine (1997); Radelet, Sachs and Lee (1997); Sachs and Warner (1997); Calamitsis, Basu and Ghura (1999); Fosu (1999) and Easterly (1999).
The present study contributes to the growing literature on the line of enquiry by stressing the relative importance and otherwise of some factors in the growth model.
THE MODEL AND METHODOLOGY
The basic model analyzed in the study is of the form: 1. , , , , , , , , , , , ,
(+) (+) (+) (-) (-) (+) (+/-) (+/-) (-) (+) (+) (+) (+) Where, GDP is gross domestic product, K is capital input, L is labor input, CNFL is conflicts, PMERP is parallel market exchange rate premium, RIR is real interest rate, INFL is inflation rate, DEBT is overall debt exposure, POPG is population growth, TOT is external terms of trade, reflecting both domestic and foreign demands, TFPG is total factor productivity growth and GDPt is trend GDP. The signs underneath the variables denote a priori expectations.
TFPG absorbs directly most of the governmental efforts in the real sector as it is directly influenced by the national system of innovations (NSI) and other policies raising factor productivity. Such other policies include relative prices like exchange rate and interest rate
page 26 Allied Academies International Conference
New Orleans, 2013 Proceedings of the Academy for Economics and Economic Studies, Volume 16, Number 1
whose independent inclusion rests on also being distortions’ eliminator in their different markets. Schooling at all levels and other training and health programs are subsumed in TFGP. The effect of corrupt practices is via its impact on factor productivity and thus fell in similarly with the aforementioned factors (see e.g. Ogun 2012a). However, trend GDP was entered exogenously to reflect technological innovation as the sole driver of consumers’ surplus (see e.g. Ogun 2012b). Institutions were proxy by two indices: government effectiveness (goveff) and regulatory quality (regqu) while, conflict was represented by an index of political stability (polstab) reflecting adverse developments on the political scene. Equation (1) is analyzed in the alternative for inflation and real money balances. The methodology consisted of a static and a dynamic panel data techniques. The static model produced results for both level specification and an ‘only’ dependent variable differenced equation. Differenced generalized method of moments (DIF-GMM) and system GMM (SYS-GMM) constitute the dynamic models. The period of coverage was 1996 to 2010. World Development Indicators (2011) and the World Government Indicators (2010) supplied all data.
THE RESULTS AND THEIR INTERPRETATIONS
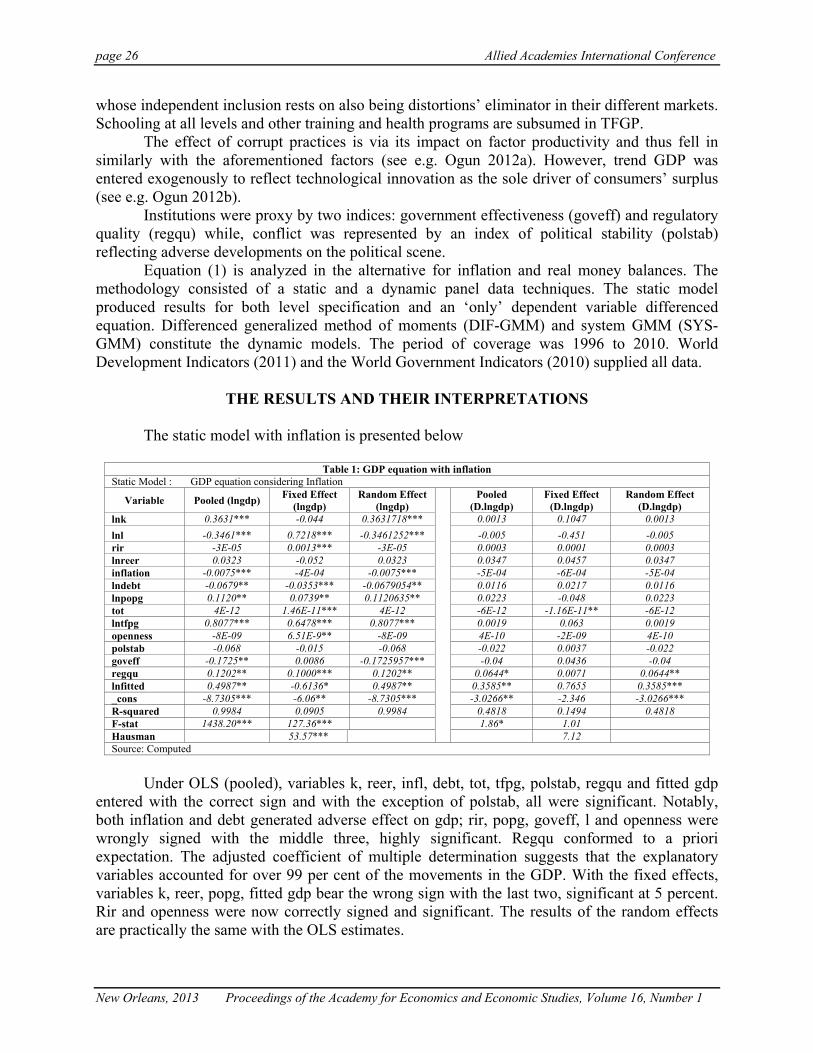
The static model with inflation is presented below
Table 1: GDP equation with inflation Static Model : GDP equation considering Inflation
Variable Pooled (lngdp) Fixed Effect (lngdp)
Random Effect (lngdp)
Pooled (D.lngdp)
Fixed Effect (D.lngdp)
Random Effect (D.lngdp)
lnk 0.3631*** -0.044 0.3631718*** 0.0013 0.1047 0.0013 lnl -0.3461*** 0.7218*** -0.3461252*** -0.005 -0.451 -0.005 rir -3E-05 0.0013*** -3E-05 0.0003 0.0001 0.0003 lnreer 0.0323 -0.052 0.0323 0.0347 0.0457 0.0347 inflation -0.0075*** -4E-04 -0.0075*** -5E-04 -6E-04 -5E-04 lndebt -0.0679** -0.0353*** -0.0679054** 0.0116 0.0217 0.0116 lnpopg 0.1120** 0.0739** 0.1120635** 0.0223 -0.048 0.0223 tot 4E-12 1.46E-11*** 4E-12 -6E-12 -1.16E-11** -6E-12 lntfpg 0.8077*** 0.6478*** 0.8077*** 0.0019 0.063 0.0019 openness -8E-09 6.51E-9** -8E-09 4E-10 -2E-09 4E-10 polstab -0.068 -0.015 -0.068 -0.022 0.0037 -0.022 goveff -0.1725** 0.0086 -0.1725957*** -0.04 0.0436 -0.04 regqu 0.1202** 0.1000*** 0.1202** 0.0644* 0.0071 0.0644** lnfitted 0.4987** -0.6136* 0.4987** 0.3585** 0.7655 0.3585*** _cons -8.7305*** -6.06** -8.7305*** -3.0266** -2.346 -3.0266*** R-squared 0.9984 0.0905 0.9984 0.4818 0.1494 0.4818 F-stat 1438.20*** 127.36*** 1.86* 1.01 Hausman 53.57*** 7.12 Source: Computed
Under OLS (pooled), variables k, reer, infl, debt, tot, tfpg, polstab, regqu and fitted gdp
entered with the correct sign and with the exception of polstab, all were significant. Notably, both inflation and debt generated adverse effect on gdp; rir, popg, goveff, l and openness were wrongly signed with the middle three, highly significant. Regqu conformed to a priori expectation. The adjusted coefficient of multiple determination suggests that the explanatory variables accounted for over 99 per cent of the movements in the GDP. With the fixed effects, variables k, reer, popg, fitted gdp bear the wrong sign with the last two, significant at 5 percent. Rir and openness were now correctly signed and significant. The results of the random effects are practically the same with the OLS estimates.

Allied Academies International Conference page 27
Proceedings of the Academy for Economics and Economic Education, Volume 16, Number 1, New Orleans, 2013
Comparatively, the case of the static model with differenced dependent variable while the independent variables remained in level was generally poor. The static model results involving real balances are as follows.
Table 2: GDP equation with M2/CPIStatic Model : GDP equation considering m2/cpi
Variable Pooled (lngdp) Fixed Effect (lngdp)
Random Effect (lngdp)
Pooled (D.lngdp)
Fixed Effect (D.lngdp)
Random Effect
(D.lngdp)
lnk 0.2893*** -0.035 0.2893859*** -3E-04 0.0944 -3E-04 lnl -0.4184*** 0.4725226* -0.4184*** -0.001 -0.208 -0.001 rir 0.0002 0.00115*** 0.0002 0.0003 0.0004 0.0003 lnreer 0.1280* -0.024 0.1280* 0.041 0.0227 0.041 m2cpi 8.43E-12*** 2.36E-12** 8.43E12*** 4E-14 -2E-12 4E-14 lndebt 0.0333* -0.018 0.0333* 0.0122 0.0078 0.0122 lnpopg -0.1460016*** 0.046 -0.1460*** 0.018 -0.02 0.018 Tot -4E-12 1.19E-11*** -4E-12 -6E-12 -0.1E-11** -6E-12 lntfpg 0.6824697*** 0.6558965*** 0.6824697*** 0.0029 0.0317 0.0029 openness -9.51*** 3E-09 -9.51E-11*** 2E-11 2E-10 2E-11 polstab 0.0141 -0.01 0.0141 -0.02 0.0068 -0.02 goveff 0.0361 -0.002 0.0361 -0.04 0.0356 -0.04 regqu 0.046 0.1056*** 0.046 0.0627* 0.0193 0.0627* lnfitted 0.102 -0.361 0.102 0.3472** 0.5664 0.3472** _cons -3.5212** -4.7741** -3.5212*** -3.0058** -3.674 -3.0058** R-squared 0.9993 0.1713 0.9995 0.4803 F-stat 4472.40*** 155.57*** 1.85** Hausman 128.65*** 9.12 Note: ***, **, and, * denote significance at 1%, 5% and 10% respectively Source: Computed
Under the pooled, the disappointing cases were labor force, terms of trade openness and
political stability. In all the level based estimations, real balances and total factor productivity growth posted superior performances. The case of the differenced dependent variable was generally poor.
The inflation related results under the dynamic panel are as follows.
Table 3: Dynamic Panel – With InflationVariable Infa(lngpd) Infb(Ingdp) infa(D.lngpd) Infb(D.Ingdp) lngdp(-1) 0.1937 0.4326*** -0.531 -0.102 lnk 0.0148 0.2078*** 0.2238 0.0265 lnl 0.4097 -0.2391*** -3.3592*** -0.042 rir 0.0002 0.0014 0.0001 -0.002 lnreer -0.044 0.0118 -0.007 0.0461 inflation 0.0002 0.0002 0.0012 0.0002 lndebt -0.017 0.002 0.0095 0.0232 lnpopg 0.0544 0.0576 0.021 0.0863 tot 7E-12 -6E-12 -0.337E-10*** -7E-12 lntfpg 0.5140*** 0.4078*** 0.5228** -0.045 openness 5E-09 -1E-09 -7E-09 2E-09 polstab -0.01 0.0003 -0.009 -0.014 goveff 0.0451 -0.002 -0.055 0.0594 regqu 0.0055 -0.016 -0.01 -0.067 lnfitted -0.275 0.3244 4.668907*** 0.1844 _cons -5.075 -4.7144** 6.004 -1.436 Wald 243.86*** 15505.81*** 19.41 9.71 Sargan Test 9.405856 10.0644 9.6471 11.0271 Sargan Prob > chi2 0.6679 0.9857 0.6469 0.9623 Source: Computed
page 28 Allied Academies International Conference
New Orleans, 2013 Proceedings of the Academy for Economics and Economic Studies, Volume 16, Number 1
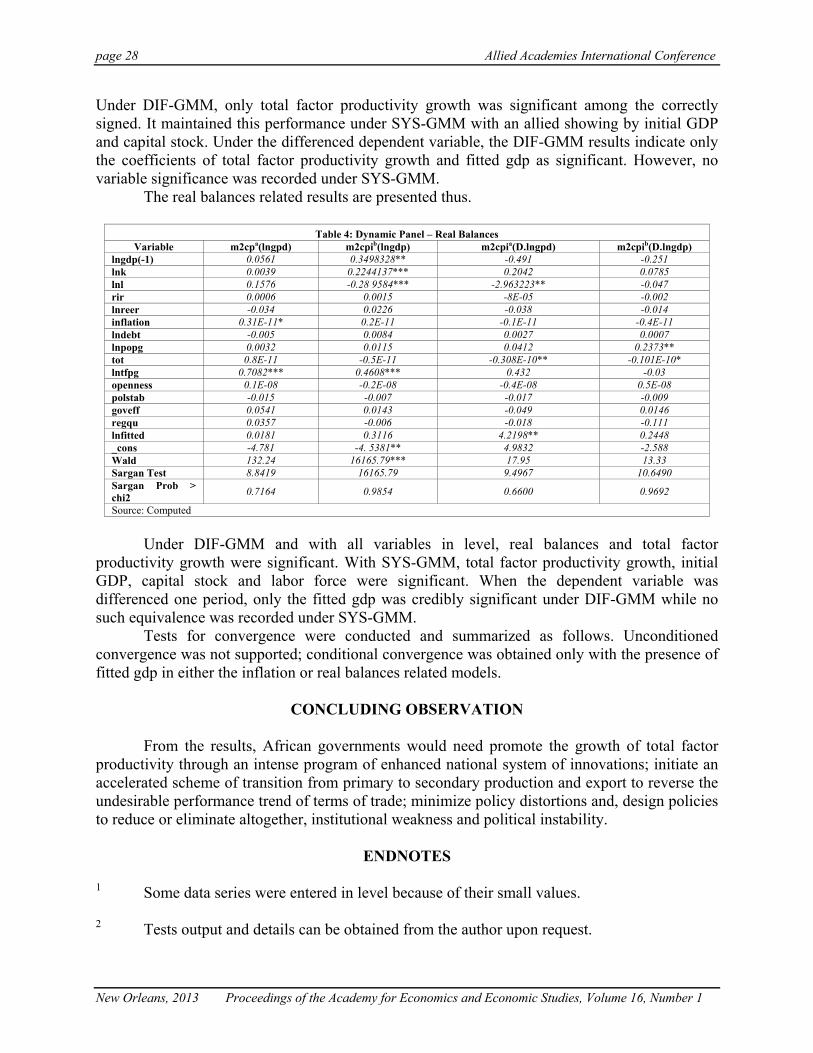
Under DIF-GMM, only total factor productivity growth was significant among the correctly signed. It maintained this performance under SYS-GMM with an allied showing by initial GDP and capital stock. Under the differenced dependent variable, the DIF-GMM results indicate only the coefficients of total factor productivity growth and fitted gdp as significant. However, no variable significance was recorded under SYS-GMM. The real balances related results are presented thus.
Table 4: Dynamic Panel – Real Balances Variable m2cpa(lngpd) m2cpib(lngdp) m2cpia(D.lngpd) m2cpib(D.lngdp)
lngdp(-1) 0.0561 0.3498328** -0.491 -0.251 lnk 0.0039 0.2244137*** 0.2042 0.0785 lnl 0.1576 -0.28 9584*** -2.963223** -0.047 rir 0.0006 0.0015 -8E-05 -0.002 lnreer -0.034 0.0226 -0.038 -0.014 inflation 0.31E-11* 0.2E-11 -0.1E-11 -0.4E-11 lndebt -0.005 0.0084 0.0027 0.0007 lnpopg 0.0032 0.0115 0.0412 0.2373** tot 0.8E-11 -0.5E-11 -0.308E-10** -0.101E-10* lntfpg 0.7082*** 0.4608*** 0.432 -0.03 openness 0.1E-08 -0.2E-08 -0.4E-08 0.5E-08 polstab -0.015 -0.007 -0.017 -0.009 goveff 0.0541 0.0143 -0.049 0.0146 regqu 0.0357 -0.006 -0.018 -0.111 lnfitted 0.0181 0.3116 4.2198** 0.2448 _cons -4.781 -4. 5381** 4.9832 -2.588 Wald 132.24 16165.79*** 17.95 13.33 Sargan Test 8.8419 16165.79 9.4967 10.6490 Sargan Prob > chi2 0.7164 0.9854 0.6600 0.9692
Source: Computed Under DIF-GMM and with all variables in level, real balances and total factor productivity growth were significant. With SYS-GMM, total factor productivity growth, initial GDP, capital stock and labor force were significant. When the dependent variable was differenced one period, only the fitted gdp was credibly significant under DIF-GMM while no such equivalence was recorded under SYS-GMM. Tests for convergence were conducted and summarized as follows. Unconditioned convergence was not supported; conditional convergence was obtained only with the presence of fitted gdp in either the inflation or real balances related models.
CONCLUDING OBSERVATION
From the results, African governments would need promote the growth of total factor productivity through an intense program of enhanced national system of innovations; initiate an accelerated scheme of transition from primary to secondary production and export to reverse the undesirable performance trend of terms of trade; minimize policy distortions and, design policies to reduce or eliminate altogether, institutional weakness and political instability.
ENDNOTES
1 Some data series were entered in level because of their small values. 2 Tests output and details can be obtained from the author upon request.
Allied Academies International Conference page 29
Proceedings of the Academy for Economics and Economic Education, Volume 16, Number 1, New Orleans, 2013
REFERENCES Berthelemy, J.-C. and Söderling, L. 2001, The role of the capital accumulation, adjustment and structural change for
economic take-off : Empirical evidence from African growth episodes, World Development 29, 323–343. Calamitsis E. A., Basu, A. and Ghura, D. 1999. “Adjustment and Growth in Sub-Saharan Africa” IMF Working
Paper WP/99/31, April. Easterly, W. and Levine, R. 1997, Africa’s growth tragedy: Policies and ethnic divisions, The Quarterly Journal of
Economics 112(4), 1203–1250. Easterly, W. 1999. The Lost Decades: Explaining Developing Countries’ Stagnation 1980-1998. Draft Policy
Research Group, World Bank, November. Fosu, A. K. 2002. Political instability and economic growth: Implications of coup events in Sub-Saharan Africa,
American Journal of Economics and Sociology 61(1), 329–348. Hoeffler, A. E.: 2002. The augmented Solow model and the African growth debate, Oxford Bulletin of Economics
and Statistics 64(2), 135–158. Ndulu, B. J. and O’Connell, S. A.: 1999, Governance and growth in Sub-Saharan Africa, Journal of Economic
Perspectives 13(3), 41–66. Ndulu, B. J. and O’Connell, S. A. 2009, Policy plus: African growth performance 1960-2000, in B. J. Ndulu, S. A.
O’Connell, R. H. Bates, P. Collier and C. C. Soludo (eds), The Political Economy of Economic Growth in Africa, 1960-2000, Vol. 1 of Cambridge Books, Cambridge University Press.
Ogun, O.D. 2012a, Corruption and Long-run Growth: An Analytical Framework, Unpublished. Ogun, O.D. 2012b, Money, Finance and Growth: A Critical Review, Department of Economics, University of
Ibadan. Radelet, S.C., Sachs, J.D. and J-W Lee.1997. Economic Growth in Asia. Draft, Harvard Institute for International
Development, Cambridge Sachs, J. D. and Warner, A. M. 1997, Sources of slow growth in African economies, Journal of African Economies
6(3), 335–76.

page 30 Allied Academies International Conference
New Orleans, 2013 Proceedings of the Academy for Economics and Economic Studies, Volume 16, Number 1
Related Documents

![ISSN: 2150-4091 (Print), 2150-4105 (Online) Volume 2 ... Vol2 No.4-02-04-20100507025310.pdfthe Chinese recognized in literature as early as 100 AD [10] and called ‘Hsian’ for .](https://static.cupdf.com/doc/110x72/6067010f29a36d010a39fc18/issn-2150-4091-print-2150-4105-online-volume-2-vol2-no4-02-04-the-chinese.jpg)