Welcome message from author
This document is posted to help you gain knowledge. Please leave a comment to let me know what you think about it! Share it to your friends and learn new things together.
Transcript
Volume 11, Number 9, September 2014 (Serial Number 107)
Journal of US-China
Public Administration
David Publishing Company
www.davidpublishing.com
PublishingDavid
Publication Information: Journal of US-China Public Administration is published every month in print (ISSN 1548-6591) and online (ISSN 1935-9691) by David Publishing Company located at 240 Nagle Avenue #15C, New York, NY 10034, USA. Aims and Scope: Journal of US-China Public Administration, a professional academic journal, commits itself to promoting the academic communication about analysis of developments in the organizational, administrative and policy sciences, covers all sorts of researches on social security, public management, educational economy and management, national political and economical affairs, social work, management theory and practice etc. and tries to provide a platform for experts and scholars worldwide to exchange their latest researches and findings. Editorial Board Members: Andrew Ikeh Emmanuel Ewoh (Kennesaw State University, USA) Beatriz Junquera (University of Oviedo, Spain) Lipi Mukhopadhyay (Indian Institute of Public Administration, India) Ludmila Cobzari (Academy of Economic Studies from Moldova, Republic of Moldova) Manfred Fredrick Meine (Troy University, USA) Maria Bordas (Corvinus University of Budapest, Hungary) Massimo Franco (University of Molise, Italy) Patrycja Joanna Suwaj (Stanislaw Staszic School of Public Administration, Poland) Paulo Vicente dos Santos Alves (Fundação Dom Cabral—FDC, Brazil) Robert Henry Cox (University of Oklahoma, USA) Sema Kalaycioglu (Istanbul University, Turkey) Manuscripts and correspondence are invited for publication. You can submit your papers via Web Submission, or E-mail to [email protected]. Submission guidelines and Web Submission system are available at http://www.davidpublishing.com Editorial Office: 240 Nagle Avenue #15C, New York, NY 10034 Tel: 1-323-984-7526; 323-410-1082 Fax: 1-323-984-7374; 323-908-0457 E-mail: [email protected]; [email protected] Copyright©2014 by David Publishing Company and individual contributors. All rights reserved. David Publishing Company holds the exclusive copyright of all the contents of this journal. In accordance with the international convention, no part of this journal may be reproduced or transmitted by any media or publishing organs (including various websites) without the written permission of the copyright holder. Otherwise, any conduct would be considered as the violation of the copyright. The contents of this journal are available for any citation, however, all the citations should be clearly indicated with the title of this journal, serial number and the name of the author. Abstracted / Indexed in: Chinese Database of CEPS, Airiti Inc. & OCLC Chinese Scientific Journals Database, VIP Corporation, Chongqing, P.R.China Database of EBSCO, Massachusetts, USA Google Scholar Index Copernicus, Poland Norwegian Social Science Data Services (NSD), Norway ProQuest/CSA Social Science Collection, Public Affairs Information Service (PAIS), USA Summon Serials Solutions Subscription Information: Print $560 Online $360 Print and Online $680 (per year) For past issues, please contact: [email protected], [email protected] David Publishing Company 240 Nagle Avenue #15C, New York, NY 10034 Tel: 1-323-984-7526; 323-410-1082. Fax: 1-323-984-7374; 323-908-0457 E-mail: [email protected]
David Publishing Company
www.davidpublishing.com
DAVID PUBLISHING
D
Journal of US-China Public Administration
Volume 11, Number 9, September 2014 (Serial Number 107)
Contents
Regional Policy and Political Analysis
China’s Political Stability and Comprehensive National Power: A Case Study of the Conflict in Xinjiang 721
Wuttikorn Chuwattananurak
Cluster Policy and Smart Specialisation—The Case of Bulgaria 742
Paskal Zhelev
Local Economic Development and Financial Management
Management of Megaproject During the Turbulent Period of Economic and Political Transformation in Slovakia 750
Daniela Spirkova
Determinants of FDI Into Turkey: A Componentwise Analysis 763
Burçak Polat
Educational Administration and General Cooperation Research
Educational Leadership: What Can China Teach the West About Inclusive Decision-Making Practices 773
Christine Cunningham
The Development of Good Practices in Cooperation With the Use of Educational Offer of Academic Centers for Employees of an International Corporation 790
Rafał Doniec

Journal of US-China Public Administration, September 2014, Vol. 11, No. 9, 721-741 doi: 10.17265/1548-6591/2014.09.001
China’s Political Stability and Comprehensive National Power:
A Case Study of the Conflict in Xinjiang
Wuttikorn Chuwattananurak
Naresuan University, Phitsanulok, Thailand
The concept of comprehensive national power (CNP) is proposed and developed by several Chinese scholars and
academic institutions. Many material capabilities, for example, economic growth and military might, are
incorporated into the concept to measure China’s national power vis-à-vis other major powers, especially the U.S.
This paper, however, contends that understanding China’s CNP through material capabilities is only part of the
story. Yet, China’s political stability is by no means assured and fully incorporated into the concept. China has
undoubtedly faced many threats and challenges to its political stability. Apart from the Two Ts’ problem (Taiwan
and Tibet), the conflict in Xinjiang not only threatens China’s political stability since the establishment of the
People’s Republic of China (PRC) in 1949, but also affects its CNP as a whole. This paper concludes that
measuring the genuine CNP should be based on the factors from which a country would earn or benefit, and also on
those of which it would have to pay a price. Needless to say, the conflict and political instability in Xinjiang are an
example of the price which China has to pay.
Keywords: China, political stability, comprehensive national power (CNP), conflict, Xinjiang
Since initiating the open door policy and economic reforms in 1978, China has shifted from a centrally
planned to a market-based economy, and experienced rapid economic growth and remarkable social
development. China’s economy has grown about 10% a year for over three decades. Life expectancy of its
population increases from 69.7 years old in 1991 to 73.3 in 2010 (The World Bank, 2011). Military expenditure
has been growing year by year from USD 16,600 million in 1989 to USD 129,272 million in 2011, ranked
second in the world’s top military spenders (Stockholm International Peace Research Institute, 2011). China is
home to the world’s largest population of nearly 1.4 billion (Population Reference Bureau, 2012), covering the
total area of over nine million square kilometers, ranked third after Russia and Canada. China also enjoys its
international status as one of the permanent members of the United Nations Security Council (UNSC) and one
of the five nuclear weapon states under the Non-Proliferation Treaty (NPT). Currently, it is the world’s second
largest economy by size of Gross Domestic Product (GDP) after the U.S.
With the remarkable success in economic growth and considerable political and diplomatic influences on
the world stage, “China’s rise” becomes one of the most significant international relations narratives in the 21st
Parts of this paper are based on the research project supported by Naresuan University grant R2556C008. The earlier version of this paper was presented at the 23rd World Congress of Political Science, July 19-24, 2014, Montreal, Canada.
Corresponding author: Wuttikorn Chuwattananurak, Ph.D., lecturer, Department of Political Science and Public Administration, Faculty of Social Sciences, Naresuan University; research fields: Chinese politics and foreign policy, international relations theory, Southeast Asian security affairs, terrorism, and nuclear strategy. E-mail: [email protected].
DAVID PUBLISHING
D
A CASE STUDY OF THE CONFLICT IN XINJIANG
722
century. While most Western scholarly literatures have focused on the questions of whether China’s rise will be
peaceful or violent, or how the U.S., other great powers and its neighboring countries should accommodate or
interact with the rising power (Choo, 2009; Johnston & Ross, 1999; Kang, 2007; Kirshner, 2010; Li, 2009;
Ross & Feng, 2008; Shiraishi, 2012; Tammen & Kugler, 2006; Zhu, 2005), several Chinese scholars have
instead tried to attain a deeper understanding of such phenomenon and China itself through the concept of
comprehensive national power (CNP) in order to measure China’s national power vis-à-vis other major powers,
especially the U.S.
However, this paper contends that understanding China’s CNP through material capabilities, for example,
economic growth and military might, is only part of the story. Yet, China’s political stability is by no means
assured and fully incorporated into the concept. China has undoubtedly faced many threats and challenges to
political stability. Apart from Taiwan’s controversial status and Tibet’s sovereignty debate or the so-called
“Two Ts’ Problem”, the conflict in Xinjiang also represents a major headache for China. Not only does it
threaten China’s political stability, but it also affects China’s CNP as a whole.
The first part of this paper will explore the concept of the CNP developed by Chinese scholars and
academic institutions, while the significance and the need for incorporating China’s political stability into the
concept will be elaborated in the second part. The third part will examine the conflict in Xinjiang as a case
study to show how seriously China’s political stability has been threatened. Implications of the Xinjiang case
for China’s CNP will be discussed in the final part and the conclusions.
The Concept of the CNP: A Need to Revisit
The concept of the CNP or zonghe guoli was first introduced in China in 1984 after Deng Xiaoping had
called some Chinese scholars to explore the future security environment as part of the study of China’s strategic
defense for the year 2000 (Pillsbury, 2000, p. 225). The CNP is the comprehensive national strength in various
aspects. It includes territory, population, natural resources, military power, economic wealth, political power,
social conditions, domestic politics, foreign policy, cultural influence, education, etc. (Pillsbury, 2000, p. 203;
Qiu, 1998, p. 16; Mori, 2007, p. 27). According to Hu Angang and Men Honghua of Tsinghua University, the
CNP is defined as the quantity of the nation’s total power or strength in terms of economy, military might,
science and technology, resources, and influences (Hu & Men, 2004, p. 2). It is thus the aggregate of all these
factors, as Deng Xiaoping stated: “In measuring a country’s national power, one must look at it
comprehensively and from all sides” (Pillsbury, 2000, p. 204). From the Chinese perspective, measuring the
CNP has two main objectives: calculating the capabilities of great powers as to who would win or lose if there
is a war; and evaluating the potential of its strategic partners as well as adversaries.
The concept of the CNP has been proposed and developed by several Chinese scholars from various
academic think tanks and institutions, including the Academy of Military Science of the People’s Liberation
Army (AMS PLA). Huang Shuofeng of the AMS PLA rejects the equation of national power developed by
Western scholars (Pillsbury, 2000, p. 225). To him, the national power index developed by Ray Cline, a former
high-ranking U.S. Central Intelligence Agency (CIA) official, lacks dynamics since the component of science
and technology is overemphasized (Nye, 2011, p. 4). Wilhelm Fucks’s proposal, which heavily focused on
material or hard power, also disregarded spirit or soft power (Tellis, Bially, Layne, & McPherson, 2000, p. 29).
Developed by Huang, his CNP Index System comprises four major index subsystems: (1) material or hard
power index subsystem, e.g., natural resources, economic wealth, science and technology, and national defense;
A CASE STUDY OF THE CONFLICT IN XINJIANG
723
(2) spirit or soft power index subsystem, e.g., political power, foreign affairs, culture, and education; (3)
coordinated power index subsystem, e.g., the line of command, administration, leadership in policy
decision-making; and (4) the environmental index subsystem, e.g., international environment. Moreover, each
of the components of the major subindexes is a sub-subindex in itself, and together, they all form what Huang
refers to as a CNP appraisal index system. Political power subsystem, for instance, includes national strategy
goals, political stability, nation’s leadership, decision-making capability, etc. (Golden, 2011, p. 98; Pillsbury,
2000, pp. 222-224). According to Huang, the U.S. still ranks first in 2020, followed by China, Germany, and
Japan, respectively (Ghosh, 2009, pp. 44-45; Golden, 2011, p. 104), but if China’s economy grows higher than
5.8% a year, China is likely to overtake the U.S. as the world’s superpower.
China Academy of Social Sciences (CASS) also developed its own CNP concept. There are eight
components with 64 indicators (Pillsbury, 1999, p. 111; Pillsbury, 2000, p. 229):
(1) Natural resources, including human resources (total population, life expectancy, etc.), land resources
(total land area, forest area, etc.), energy resources (coals, crude oil, natural gas, etc.);
(2) Economic activities, including economic strength (GDP per capita, etc.), economic structure
(proportion of tertiary sector as a percentage of GDP);
(3) Foreign economic activities, including international reserves, gold reserves, etc.;
(4) Science and technology, including proportion of research and development in the GDP, number of
scientists and engineers, etc.;
(5) Social development level, including education (expenditure in education per capita, etc.), culture
(literacy, etc.), health care [expenditure in health care per capita, number of physicians (per 1,000 population)],
communications [number of mobile phone users (per 100 population)], and urbanization;
(6) Military capability, including military manpower, military expenditure, number of nuclear warheads,
etc.;
(7) Government regulation and control capability, including proportion of government expenditure as a
percentage of GDP, etc.;
(8) Foreign affairs capability.
The researchers also determined the weighted coefficients for the different components. With the total
weighted coefficient of 1.00, for instance, the component of natural resources has the weighted coefficient of
0.08; and that of economic activities 0.28. Additionally, the different indexes within each of the major factors
are assigned weights. For example, within the science and technology factor, both the index for proportion of
research and development in the GDP and that for technology personnel have the weighted coefficients of 0.30.
Unlike Huang, the CNP ranking by the CASS made projections that Japan will rank first in 2020, while China
ranks seventh (Golden, 2011, p. 104). However, both Huang and the CASS share a common view. They refuted
the unipolarity led by the U.S. and attempted to show that America is in decline.
Similar to the study of the CASS, the CNP proposed by Hu Angang and Men Honghua of Tsinghua
University comprises eight types of resources with 23 indicators:
(1) Economic resources, e.g., GDP and Purchasing Power Parity (PPP);
(2) Human capital, e.g., total population and total workforce;
(3) Natural resources, e.g., total cultivation area, total use of fresh water by volume, electric power
consumption, etc.;
(4) Capital, e.g., foreign direct investment (FDI), market capitalization, etc.;
A CASE STUDY OF THE CONFLICT IN XINJIANG
724
(5) Knowledge and technology, e.g., number of patents, number of personal computers, number of internet
host, government expenditure in R&D (research and development), etc.;
(6) Government resources, e.g., central government expenditure;
(7) Military resources, e.g., military expenditure, military manpower;
(8) Foreign relations, e.g., total imports and exports, total number of receipt of royalty and license fee, etc.
By measuring the CNP, each type of resources has different weighted average. For example, both natural
resources and human capital have the weighted average of 0.1, while economic resources and knowledge and
technology have 0.2 (Hu & Men, 2004, pp. 20-21). The weighted average of Hu and Men is quite similar to the
weighted coefficients developed by the CASS. However, according to Hu and Men, the U.S. remained the
world’s superpower from 1980 to 1998 (Hu & Men, 2004, pp. 23-24), and has now remained so.
Apart from the AMS PLA by Huang, the CASS, and Hu and Men, China Institute of Contemporary
International Relations (CICIR) and Yan Xuetong of Tsinghua University adopted a relatively simple approach
to measure the CNP. The CICIR scores the CNP with six major factors: manpower, natural resources, economy,
politics, military, history, and culture. It was found that by the 2020s, China’s CNP will be behind only the U.S.
CNP (Ghosh, 2009, pp. 46-47). Yan Xuetong, however, calculated the CNP by incorporating distinct types of
power. The military expenditure, the number of nuclear warheads, and total military manpower represent the
military power. Political power is epitomized by the status as a permanent member of the UNSC, and the
economic power can be measured through the GDP. In Yan’s view, despite the fact that China’s CNP still
follows the U.S. CNP, its comprehensive power is relatively strong in all aspects. Moreover, with the different
political systems of the two countries, China has a stronger political mobilization capability than the U.S., since
it possesses more administrative mechanisms to mobilize its people. Yet, in the realm of international affairs,
China’s political mobilization capability is weaker than that of the U.S. (Yan, 2006, pp. 18-21).
Although there is no consensus among Chinese scholars about the components, indicators, and factors in
their CNP concept, material capabilities such as military might and economic wealth remain the predominant
factors for the CNP assessment. However, non-material capabilities such as culture, historical background,
natural disasters, environmental degradation, and political stability need to be incorporated into the concept as
well. While some were successfully encompassed, “political stability” still falls short of an ideal.
Despite political stability not fully incorporated into the CNP concept, Zheng Shiping (2012) attempted to
assess China’s political stability and place China on the global scale of comparisons with other countries, both
advanced and developing in the world, including the so-called BRICS (Brazil, Russia, India, China, and South
Africa). With the analysis based on 12 sets of fragility and instability indexes, including Political Instability
Index (PII) of The Economist Intelligence Unit, Failed States Index (FSI) of Foreign Policy and the Fund for
Peace, Global Political Risk Index (GPRI) of Eurasia Group, he found that China has faced many threats or
challenges to political stability. However, with China being no longer more politically unstable or fragile than
Russia and India, he finally concluded that China has no reasons for celebration and, at the same time, for
paranoia. If so, what prevents China from celebrating its political stability?
The Chinese Communist Party (CCP) faced several major crises and political instability since the
establishment of the People’s Republic of China (PRC) in 1949. The failure of the Great Leap Forward led to
the tragic consequences, causing over 36 million people to die because of famine and torture for those who
were against the policy (Yang, 2013, p. 13). Over a million people were killed during the Cultural Revolution,
and more than three million suffered imprisonment, seizure of property, torture or general humiliation (Ebrey,
A CASE STUDY OF THE CONFLICT IN XINJIANG
725
Walthall, & Palais, 2009, p. 472). The CCP was widely condemned and the economic sanctions were imposed
by international community after the 1989 massacre in Beijing’s Tiananmen Square. Even a highly centralized
unitary state under the rule of the CCP was challenged after the dissolution of Yugoslavia in 1989 and the fall
of the Soviet Union in 1991 (Lam, 2006). However, despite the fact that the CCP went through such unpleasant
experiences and succeeded in stabilizing its ultimate power by maintaining the economic growth, the issues
pertaining territorial integrity have not yet been assured.
The principle of territorial integrity is one of the cornerstones in the UN (United Nations) system as well
as the post-Second World War international order. Apart from the references to the territorial integrity in the
context of the prohibition of the use of force, and the limitation on the right of self-determination appeared in
the UN Charter and its declarations (Zacher, 2001, p. 221; Vidmar, 2012, pp. 707-709), the territorial integrity
relates to the right of existence of the state. It enables the state to exert its sovereignty, ensure its own survival,
represent its people, and preserve the unity or completeness of its territory (Ouali, 2006, p. 635).
The territorial integrity is then inseparable from the principle of state sovereignty. The state always claims
its authority and legitimacy to have relations with other states and, at the same time, claims its authority and
control over territory and its citizens. As Stephen D. Krasner asserts, there are four forms of state sovereignty:
(1) international legal sovereignty, which relates to the matters of the recognition of a state, e.g., political
independence, state capacity to preserve territorial integrity, the existence of the government and its population;
(2) Westphalian sovereignty, which concerns the autonomy of the state, e.g., the respect of the principle of
non-interference; (3) domestic sovereignty, which is referred to as the exertion of authority of the state and its
capabilities to control its domestic affairs; and (4) interdependence sovereignty, which pertains to the state
control over the flow of information, thoughts, people, pollution, or even the capital (Krasner, 2009, pp.
179-180). The territorial integrity, therefore, involves not only the relations between states in the realm of
international affairs, but also the role and responsibility of state to exert and preserve its authority in the realm
of domestic ones.
How is the territorial integrity related to political stability, particularly in the case of China? When the
state is politically unstable, it is unable to fully exert its full authority and sovereignty, represent its citizens,
and maintain unity or completeness of its territory. Political instability, in addition, provides room for the
intervention from outside (Fravel, 2007, p. 715). Political stability is thus the prerequisite for the state to be
immune from the threats from outside and the challenges within, particularly the problematic territory which is
not fully incorporated or perfectly integrated. For China, as noted earlier, the issue of territorial integrity
directly affects and relates to its political stability. First, apart from human rights, corruption, or
democratization, the territorial integrity has become one of the major concerns for the Chinese regime. Second,
analyzing the territorial integrity through state-society relations could demonstrate the grievance and tension
among ethnic groups as well as political vulnerabilities which pose a threat to China’s political stability,
particularly in terms of authority and legitimacy of the state. Third, pursuing the stability by maintaining
China’s territorial integrity is one of the main objectives for the Chinese communist regime. Failure to do so
will beg a question of its existence and survival. Last, the territorial integrity is viewed as one of the core goals
to be achieved in a nation’s foreign policy, especially the great powers. It would be difficult for the rising
power to play a leading role in the world stage as long as its territorial integrity is still under threat.
The first task for the CCP after its establishmemt in 1949 was to incorporate and unite all separate
territories into one. The CCP put a lot of efforts into controlling Mongolia and intended to integrate it as a part
A CASE STUDY OF THE CONFLICT IN XINJIANG
726
of Republican China. However, after being under intense pressure from the Soviet Union, Mongolia as the
Soviet sattelite achieved independence and was recognized by China in 1950. To prevent Mongolia from being
an independent state or being incorporated as a part of its neighboring countries, the CCP had mobilized its
capabilities to take control over the rest. Inner Mongolia had been under control before gaining independence
or becoming a part of newly independent Mongolia. The Uygur movements for establishing Eastern Turkestan
Republic (ETR) were deterred and rebellions in Xinjiang were suppressed. The aim of the Tibetan spiritual
leader Dalai Lama to achieve independence was not successful. The nationalist forces in Taiwan were attacked
but not completely defeated due to the Korean War and the containment policy led by the U.S. (Rossabi, 2014,
pp. 371-376). Although Hong Kong and Macau were successfully incorporated as an integral part of the PRC in
1997 and 1999, respectively, China’s territorial integrity remains unfulfilled. Apart from the Two Ts’ (Taiwan
and Tibet) problem, the conflict in Xinjiang is not only threatening China’s political stability and territorial
integrity, but also affecting its CNP as a whole.
China and the Conflict in Xinjiang: Incorporation Without Integration
Even though Xinjiang was incorporated as a part of China like other regions, it has never been fully
integrated. The conflict and the resistance in Xinjiang are unique and violent. The sense of ethnic identity and
nationalism among Uygur people remains strong and powerful. The resentment and discontent are widespread,
and the hatred and hostility among ethnic groups are deep and outright. The conflict in Xinjiang is viewed as a
major headache for the CCP and the most serious threat to China’s political stability and territorial integrity.
Xinjiang in 1949-1990: Han Rule and the Uygurs Resist
The incorporation of Xinjiang as an integral part of China was well established after the peaceful
liberation of the People’s Liberation Army (PLA) in Xinjiang had completed in 1949. The PRC under the
leadership of the CCP continued to integrate Xinjiang by completing the Qing government’s unfinished
mission—the sinicization of Xinjiang—to ensure the region’s territorial integrity. In March 1950, the policy of
cultural assimilation was implemented when the CCP encouraged the immigration of a large number of Han
Chinese to Xinjiang. Counter-revolutionaries such as landlords, Muslim ulama in sedentary agricultural areas,
nomadic peoples who have feudal and traditionalist elements are primarily targeted for suppression from 1950
to 1952, followed by the land reforms from 1952 to 1953 (Forbes, 2010, p. 227). However, the first major
incident of resistance to the CCP control over Xinjiang was the Hotan uprising of December 1954 in Southern
Xinjiang by the Amin group. They were against the CCP policies, particularly the Han immigration and
declared their intention of establishing the Islamic state. Over 140 rebels were arrested but later were released
while the core rebels remained in custody (Dillon, 2004, pp. 52-55).
To ensure the consolidation of CCP power in Xinjiang, the Xinjiang Production and Construction Corps
(XPCC) or the bingtuan, and the Xinjiang Uygur Autonomous Region (XUAR) were established in 1954 and
1955, respectively. For the XPCC, it has its own administration, equivalent of the province and under the direct
control of Beijing, not the XUAR. The main objective of XPCC is twofold: to open cultivation areas and to
guard the frontier. As a result, the XPCC has dual responsibilities of development and defense. In peacetime,
the XPCC has a mandate to develop the cultivation areas for agriculture, farming, and animal husbandary, but if
there is a conflict or tension, the XPCC will turn itself to restore order and stability (Kerr & Swinton, 2008, p.
120). In 2005, the XPCC employed more than 2.5 million under the command of 14 divisions with 179
A CASE STUDY OF THE CONFLICT IN XINJIANG
727
regiment-level farms and ranches. It has its own 1,339 enterprises and companies, including a number of
schools, universities, hospitals, and research institutes (People’s Daily, 2007) together with courts, prisons, and
more than 120,000 police forces and militaty troops. The economic proportion of the XPCC is about one-sixth
of the total GDP in Xinjiang (The Economist, 2013). The XPCC is thus one of the most powerful government
agencies in Xinjiang, apart from the CCP party organization and the XUAR as one of the XPCC senior
executives said, “Once you step on the land of Xinjiang, you have to come to our company… We are
everywhere here” (Fenby, 2012, p. 110). However, only a few Uygurs are employed. In one view, the XPCC is
the so-called another branch of the CCP party organization to ensure the order and stability in Xinjiang (The
Economist, 2013).
Apart from the XPCC, there was also restructuring of the region’s administration. Xinjiang Province was
transformed into XUAR in order to administer the regions with ethnic differences. Although the idea of
“nationality” was influenced by the Soviet model, the autonomous region in the Chinese sense is another story.
For the Soviet model, non-Russian ethnic groups are allowed to establish their own republic, but for the PRC,
all non-Han ethnic groups are under the leadership of the CCP and have the autonomy only at the provincial
and local levels (Millward & Tursan, 2004, p. 91). This CCP action was definitely contrary to its policy in the
1930s as appeared in the Article 14 of its 1931 Constitution mentioning that “The party recognized the right of
self-determination of the national minorities in China, their right to complete separation from China, and to the
formation of an independent state for each minority” (Saich, 1996, p. 555). Despite the fact that the Uygurs
have been appointed to the important positions, e.g., the chairperson of People’s Council or the XUAR
governor, the ultimate power is still in the hands of the CCP party secretary in Xinjiang, who have already been
Han Chinese. In the Chinese view, the autonomous region is not the region with autonomy as generally
understood. It is just a region with ethnic groups as the majority of the population.
Apart from a sense of frustration among the Uygur population living in the autonomous region without
genuine autonomy, the discontent among the Uygurs increased and was widespread due to the Hundred
Flowers Campaign, the Great Leap Forward Policy, and the Cultural Revolution. During the Hundred Flowers
Campaign, the leaders of the CCP encouraged intellectuals and non-party members to criticize the government
and offer advice. In Xinjiang, there was the storm of criticisms which followed the campaign such as the
environment degradation done by the XPCC, the demand for genuine autonomy and authority for non-Han
population, the demand for the expulsion of Han Chinese from Xinjiang, and the declaration of a newly
independent state. However, when Mao Zedong perceived it as a threat to his regime and halted it in 1957, he
began an “Anti-Rightist” campaign and silenced any opposition. A number of local nationalists were arrested
and suppressed for fear that the opposition view in Xinjiang, especially from the Uygurs, might threaten its
stability and territorial unity. Muslim political leaders were purged from their power, including Seypidin Ezizi,
the chairperson of People’s Council in Xinjiang. It is believed that there were 1,613 local nationalists arrested
and sent to the labor camp for thought reform (Millward & Tursan, 2004, p. 93). Furthermore, the
implementation and repercussion of the Great Leap Forward Policy exacerbated the situation in Xinjiang. The
unfair grain rationing system, the immigration of over millions of Han Chinese to Xinjiang resulting from
famine in their home province, and the competition between the XPCC and the local ethnic minorities for
cultivation areas, water supplies and aninal husbandry, caused a major disturbance in 1962 when the protesters
set fire to the government and communist party buildings in Yining (Chang, 1997, p. 406). The disturbance also
created fear which caused more than 60,000 Uygurs and Kazaks to flee to the Soviet-satellite Kazakstan. For
A CASE STUDY OF THE CONFLICT IN XINJIANG
728
Xinjiang, the situation became more complicated as a result of the Sino-Soviet split. The immigration of
Uygurs and Kazaks aroused suspicions among the CCP leaders toward Soviet intention and ethnic
minorities, the Uygurs in particular, after the Soviet silently approved of the Uygur movements and
organizations in its territory such as Turkestan People’s Liberation Committee to destabilize the CCP. The
Soviet support for such movements, in one view, did shape the Uygur identity, which later has become one of
the major motives for the resistance and anti-Chinese movements since the 1990s (Clarke, 2013, pp. 119-120;
Dillon, 2004, p. 56).
The Cultural Revolution was regarded as one of tragedies in Chinese history. Not only did Han Chinese
fight and destroy each other, but the Uygurs were also threatened and their culture and identity were humiliated
by the leftists and the Red Guards. A number of copies of the Quran were burned. Muslim imams were
intimidated. Muslim mosques were destroyed. Ethnic minority intellectuals were humiliated. Pigs were penned
in the mosques. Uygur Muslim girls were forced to cut their long hair, and the ethnic minorities were prohibited
from wearing their traditional dress. All these came from the xenophobic reactions of Jiang Qing, a leader of
the so-called Gang of Four (Clarke, 2013, p. 120; Millward & Tursan, 2004, p. 97). However, the political
turmoil in China gave a group of the Uygurs the opportunity to establish Eastern Turkestan People’s
Revolutionary Party (ETPRP) between 1967 and 1968. It rejected the Chinese rule in Xinjiang and called for
reestablishment of the ETR, which had collapsed earlier. It is believed that the party received tremendous
support from the Soviet Union and had around 300 members. There were party branches in many cities in
Xinjiang, e.g., Urumqi, Yining, Aksu, and Tacheng. However, after the new CCP leaders had regained its
power, the ETPRP was later suppressed by the PLA (Dillon, 2004, p. 58). The Cultural Revolution also
exacerbated the social and economic situation which led to the ethnic tension between the Han Chinese and the
Uygurs, for example, workers in Shihezi and oil-field workers in Karamay went on strike in 1974, or the unrest
in 1975, when there was an order that all workers, including the Muslim, had to work on Fridays (Chang, 1997;
Clarke, 2003, p. 210).
Under the leadership of Deng Xiaoping, economic development and modernization instead of the ideology
of class struggle have become the key to solving the ethnic conflict and tension. The government policy toward
ethnic and religious groups was relaxed. Muslim mosques were reopened. Islamic religious seminars were
allowed. Copies of the Quran were reprinted. The proportion of non-Han Chinese government officials
increased, and the ethnic minorities were given a greater role in the party organization. Despite the approval of
liberal and reformist CCP Secretary General Hu Yaobang, the appointment of ethnic minorities as the First
Secretary of Party Committee at every level, after the compromise among conservatives and liberals in the CCP,
the position of the First Secretary of Regional Party Committee was still monopolized by the Han Chinese
(Clarke, 2013, p. 121; Rodriguez, 2013, p. 136; Bovingdon, 2010, pp. 347-348). Despite the reform, the
monopoly of the ultimate political power in the hands of the Han Chinese upset the Uygurs with the feeling that
the XUAR is not for the Uygurs. It is not genuinely autonomous either (Bovingdon, 2010, p. 342). With the
upset and frustration of the Chinese monopoly of political power in Xinjiang, and the government relaxing
policy toward ethnic and religious groups, there were the underground movements in Xinjiang. Many Islamic
schools were secretly opened, including one run by Abdul Hakeem, the leader of Islamic Party of Turkestan or
Turkestan Islamic Movement in the 1940s. Among his most significant students was Hasan Mahsum, who
studied at a school in Kargilik or Yecheng and later became the founder of Eastern Turkestan Islamic
Movement (ETIM) in 1997.
A CASE STUDY OF THE CONFLICT IN XINJIANG
729
Deep discontent and widespread resentment among the Uygurs erupted again when the CCP continued the
immigration of Han Chinese to Xinjiang for the sake of economic development and cultural assimilation. The
conflict and tension between the Han Chinese and the Uygurs led to the disturbances in Aksu in 1980, Kashkar
in 1980 and 1981, and the rebellion seeking independence in Payzawat or Jiashi county in 1982. The 1981
violent disturbance in Kashgar was the most violent incident in Xinjiang since 1949 as a result of a criminal
trial in which a young Han man was accused of killing a Uygur youth during a fight. Serious riots spread
throughout the whole part of Kashgar city. People were armed with knives, cudgels, and whips. They were
shouting “Down with the Han”, “Down with the Heidaye (Chinese) government”, and “Long Live the Republic
of Uyguristan”. Over 600 people were attacked, over 200 injured, and two people dead. The continued
immigration policy came in the hope that the majority of immigrant Han Chinese would help maintain order
and stability in Xinjiang like its success story in the case of Inner Mongolia which the Mongol population
recently accounts for only 14% of total population in the region. It is estimated that between 1940 and 1982, the
proportion of Han Chinese and Hui Muslim immigrants to Xinjiang increased over 2,500% and 520%,
respectively. From 1990 to 2000, the number of immigrant Han Chinese to Xinjiang increased from 5.69
million people in 1990 to 7.49 million people in 2000, accounting for 40% of the total population in Xinjiang
(Clarke, 2013, p. 124; Dillon, 2006, p. 103; Gladney, 2004, pp. 112-113; Dillon, 2004, pp. 59-60). In addition,
the ethnic nationalism among the young Uygurs also increased. In 1985, Uygur students in Beijing protested
against the use of Xinjiang as a base for nuclear testing. A month later, over 2,000 students from seven
universities in Urumqi demonstrated that during the local elections, when the regional governor was replaced
by Tomur Dawamat, an Uygur but a protégé of the Han CCP Secretary Wang Enmao. They chanted slogans
such as “Han out of Xinjiang”, “Independence, Freedom, and Sovereignty for Xinjiang”, and “Long Live
Xinjiang’s Independence” (Dillon, 2004, p. 60). However, after the fall of the Soviet Union, the ethnic
nationalism among the Uygurs became stronger and more powerful and that led to the new episode of political
instability in Xinjiang in the 1990s.
Xinjiang in 1990-2001: The Uygurs’s New Hope and the CCP Strikes Hard
The victory of the mujahedeen in Afghanistan over the Soviet Union, the unrests in Baren of Kizilsu
Kyrgyz Autonomous Prefecture or Yili in 1990, and the fall of the Soviet Union in 1991, which led to the
emergence of the newly independent states in Central Asia such as Kazakstan, Kyrgyzstan, and Uzbekistan lit
the candle of hope among the Uygurs that China would not be invincible. There were several movements and
organizations for achieving independence such as Uyghur Liberation Organization (ULO) and International
Uyghur Union (IUU) in Kazakstan. In Xinjiang, apart from street protests, the attack of the government and
party buildings, and the confrontation with the police forces, there were around 80 violent unrests and
bombings between March and May 1992 in Urumqi, Kashgar, Yining, Hotan, Kuchar, Korla, Chochek, and
Bortala with total damage of several millions of Chinese yuan.
The violent incidents in Xinjiang continued from 1993 to 1996. The government building in Kashgar was
bombed in 1993. It was followed by the confrontation between Chinese police forces and the Kazakhs in
Yining, who demanded the establishment of their own republic as a part of the Commonwealth of Independent
States (CIS), and a wave of bombings in many cities along the Tarim Basin or Altishahr in Southern Xinjiang.
In 1995, there were major disturbances in Yining when over 50,000 people protested against the Chinese rule
over Xinjiang, followed by the strike of over 100,000 teachers, workers, and shop owners calling the end of
A CASE STUDY OF THE CONFLICT IN XINJIANG
730
Chinese rule in Xinjiang and incorporating Xinjiang as a part of Kazakstan. In Zhaosu and Gongliu, Chinese
government officials and police stations were surrounded by more than 3,000 people. Some guns and police
vehicles were stolen. It is believed that only in Zhaosu, over 220 people were killed and injured. Over 8,500
rounds of ammunition were fired, and more than 20,000 troops were called from in both Xinjiang and Gansu
Province. In addition, there was a protest in Hotan in July 1995 after a Muslim imam was arrested, as well as
the disturbances by separatist groups between February and April 1996 in Aksu (Dillon, 2004, pp. 66-70;
Dillon, 2006, pp. 107-108).
To restore order and stability in Xinjiang, the CCP issued the CCP Central Committee Document No. 7
(Document No. 7) in March 1996. It viewed that national separatism and illegal religious activities are the main
threats to the stability of Xinjiang. And the “Strike Hard” campaign was lauched after that (Wang, 2010, p. 54;
Jones-Leaning & Pratt, 2012, p. 331). More than 18,000 troops were sent to 18 problematic counties. A mass of
20,000 people at every local level distributed over 1.547 million propaganda leaflets and more than 120,000
local activists worked together with party members and militia to maintain order in the local areas (Tong, 2010a,
p. 7). However, the insurrection led by the ETIM erupted again in February 1997 and was considered to be the
most violent confrontation between the Uygurs and the Chinese forces. It is estimated that over 400 people
were killed (300 of them were Uygurs), but the CCP Secretary in Xinjiang—Wang Lequan denied the figure
(Dillon, 2006, pp. 109-110). He only mentioned that apart from the damage of properties, buildings, and
vehicles, 198 people were injured, 50 people seriously injured, and seven “bystanders” were killed (Tong,
2010b, p. 4).
Although the members of the ETIM were suppressed or killed, and a number of weapons and thousand
rounds of ammunition were seized, stability and order in Xinjiang were not yet restored. Between February and
April 1998, there were 14 bomb explosions in Kargilik or Yecheng, causing eight people to die. The total
damage was worth USD 120,000, including the government buildings such as Public Security Bureau. Between
July and September 1999, the government offcials and buildings and Han Chinese were attacked, while the
cotton warehouses in Hotan were burned. One person was killed (probably the terrorist leader) and 21 people
were arrested (Millward & Tursan, 2004, pp. 18-19).
However, apart from the “Strike Hard” campaign, one of the most instrumental and significant factors for
China to suppress terrorist and separatist movements in Xinjiang is to cooperate with its Central Asian
neighbors. Shanghai Five (China, Russia, Kazakstan, Kyrgyzstan, and Tajikistan) was established in 1996. It
was later renamed Shanghai Cooperation Organization (SCO) in 2001 after the inclusion of Uzbekistan. It can
be argued that among all disputes and conflict between China and its neighboring countries, such as the civil
war in Tajikistan, the conflict in Kashmir and Afghanistan, the unstable situation in Ferghana Valley bordering
Kazakstan, Uzbekistan, and Tajikistan, the conflict and tension in the countries bordering Xinjiang are what the
Chinese authorities were mostly concerned about (Clarke, 2003, p. 215). China’s leading role in the SCO has
been considerably successful. Since its establishment, the Uygur movements in its Central Asian neighbors
have been limited. The exiled Uygurs in Kazakstan were deported to China. Uygur terrorists in Kyrgyzstan
were detained (Rodriguez, 2013, p. 140). Only a few Uygur newspapers were allowed to publish. Institute of
Uyghur Studies in Almalty was closed and merged into Institute of Oriental Studies, which focuses on the
promotion of Uygur culture (Berlie, 2004, pp. 129-130).
However, even though the hope among the Uygurs for their independence has not yet been fulfilled, their
discontent and resentment against the Chinese rule and its assimilation policy remain deep and strong. China’s
A CASE STUDY OF THE CONFLICT IN XINJIANG
731
ethnic discrimination against the Uygurs after 9/11 not only exacerbates the chronic conflict in Xinjiang and the
tension between ethnic groups, particularly between Han Chinese and the Uygurs, but also brings a new
episode of resistance and instability not only to Xinjiang, but also to the rest of China.
Xinjiang in the Post-9/11 Era: Three Evils Are Everything
In the post-9/11 era, which saw the U.S.-led anti-terrorist wars throughout the world, U.S. declared the
terrorist groups, particularly Al Qaeda and those involved or genetically related to Al Qaeda, as the major
threats to the U.S. benefits and security. After the arrest of the ETIM members with the severe charge of
plotting against the attack of the U.S. Embassy in Kyrgyzstan in 2002, U.S. included the ETIM in the Terrorist
Exclusion List, which made it possible for the U.S. to seize property and freeze any financial transactions (U.S.
Department of State, 2004). The ETIM to the U.S. was closely related to the Al Qaeda and the Taliban in
Afghanistan (U.S. Department of the Treasury, 2002), although Hasan Mahsum, a group leader who was later
killed by the Pakistani force in October 2003, rejected the close ties (Davis, 2008, p. 22).
The inclusion of the ETIM in the aforementioned list is therefore related to China’s interest, which issued
the document concerning Eastern Turkestan terrorism in 2002 entitled “Eastern Turkistan Terrorist Forces
Cannot Get Away With Impunity”. The objective was to pressure and discredit any Uygur-led groups or
movements which had weakened China’s authority and legitimacy over Xinjiang throughout the 1990s
(Information Office of the State Council of the People’s Republic of China, 2002). Besides the ETIM, China
included East Turkistan Liberation Organization (ETLO), World Uyghur Youth Congress (WUYC), Eastern
Turkistan Information Center (ETIC), United Revolutionary Front of East Turkistan (URFET), Uyghur
Liberation Organization and other groups such as East Turkistan Islamic Party of Allah and Eastern Turkistan
Islamic Party (Millward, 2004, pp. 23-27). However, U.S. rejected the inclusion of ETLO in the list as well as
the deportation of an Uygur native who had been arrested in Afghanistan as requested by China (Davis, 2008, p.
22). The WUYC, according to the understanding of the press outside China, organizes political activities such
as a regular meeting of World Uyghur Leader and Youth Congress, while the ETIC, whose office is in Munich,
is generally known as the unit which reports news and issues related to Uygur people and Xinjiang on the
website. Therefore, both the WUYC and the ETIC denied all the allegations of terrorism made against them
(Millward, 2004, pp. 27-28).
What can be clearly noticed about the reaction of the CCP to the conflict in Xinjiang after the 9/11 attack
is the CCP’s frequent use of “Eastern Turkestan” to relate with any movement of organizations and groups for
terrorism, separatism, or extremism, which are considered to be the “Three Evils”. This is to distinguish it from
“Xinjiang” and display the reaction of the majority of Uygur people to be attached with China. The CCP also
uses the word “terrorism” extensively to label organizations or groups suspected of masterminding the attacks
or riots despite the fact that they were previously perceived as being organized by the criminals or being
categorized as criminal activities (Shichor, 2006, p. 101). Labelling them as “terrorists” may justify China’s
more violent suppression, but that cannot restore stability in Xinjiang.
While riots may be associated with terrorism, they are sometimes a criminal act with no clear political or
separatist goals. In the case of Xinjiang, Islam and Jihad are used by some groups to achieve political goals or
establish the identity of the Uygur people rather than to act in the name of God since most Uygurs are not
radical or possess extreme religious ideas, which is well noted, even by Chinese local officers (Shichor, 2006, p.
105).
A CASE STUDY OF THE CONFLICT IN XINJIANG
732
Although several violent incidents erupted in the early 1990s, thanks to the effective suppression policy
and the close relations with other neighboring countries in Central Asia, the situation in Xinjiang became less
aggravated and could not be labeled as “terrorism” (Millward, 2009, p. 348). However, China’s hosting the
2008 Olympic Games became a major condition for some Uygurs to weaken China’s authority and legitimacy,
for example:
(1) The attempted hijack and attack of the plane from Urumqi to Beijing in March 2008 by two passengers,
one of whom was a 19-year-old Uygur girl who later confessed to hijacking and attacking the plane;
(2) The attack of 70 members of People’s Armed Police Forces (PAPF) during the morning military
exercise on August 4, 2008, in Kashgar, only four days prior to the Olympic opening ceremony, killing 17 and
injuring 15 police officers. Two attackers, a truck driver and a vegetable vendor, were sentenced to death by a
local court five days later and were executed on that same day;
(3) At least 12 bomb explosions in several spots including supermarkets, hotels, and the government office
in Kuqa County on August 10, 2008, killing eight people, seven of whom were suspected of being assailants
and one of whom was a security officer. Ten more people were killed during the attack with the police officers,
while two of them were arrested and three of them made their escape.
The Chinese authority identified that the three incidents above could be part of the ETIM’s terrorist plan to
disrupt the Olympic Games, while some Western analysts doubted that the ETIM was behind it, particularly the
incident in Kashgar. However, the ETIM did not claim responsibility for the incidents (Gunaratna, Acharya, &
Pengxin, 2010, pp. 75-77). The irony is that prior to this, the ETIM claimed responsibility for several incidents
which occurred outside Xinjiang such as the explosion in Shanghai on May 5, 2008, the attack of the police
booth in Wenzhou, Zhejiang on July 17, 2008, the bomb attack of the plastic factory in Guangzhou on the same
day, and the explosion on three buses in Kunming on July 21, 2008. The explosion in Kunming gave a warning
signal to the Chinese Government that attacks of the Olympic venues might be possible, but the Chinese
authority denied those claims and viewed that those incidents were no more than crime, accidents, or attempts
of some Han people to call for attention (Gunaratna et al., 2010, pp. 78-79). Not only do those discriminatory
views fail to establish stability in Xinjiang and win the hearts of the Uygur people, but they also widen the ethic
and hatred gaps between Han and Uygur people, as evidenced by the unrest in Urumqi in July 2009. The unrest
was not only a consequence of the incident at Xuri Toy Factory in Shaoguan, Guangdong on June 26, 2009
after the news (whether it was true or a rumor) about at least two Han women who were raped by the Uygurs
was spread (Watts, 2009), but it was the most violent conflict in Xinjiang since the Baren unrest in 1990. Both
incidents in Shaoguan and Urumqi mark several significant points as follows:
First, the policy implementation of China still reflects discrimination and double standards against ethnic
minorities, particularly the Uygurs. While the protest staged by Uygur people on July 5, 2009, in order to
demand that the Chinese Government accounts for the incident at Xuri Toy Factory was suppressed by the
Chinese Government, with 197 people being killed, 1,700 injured, and 331 shops and 1,325 cars destroyed and
burned down, several hundreds of Han Chinese who staged a protest to seek revenge by beating an Uygur
vendor on the pavement two days later were not prosecuted. Moreover, while images of the bodies of Han
Chinese covered with blood were presented, images of violence depicted through Uygur people who were
attacked by Han Chinese have been banned from being broadcast (Millward, 2009, pp. 352, 354; Watts, 2009).
Second, the internationalization of the Xinjiang problem is a double-edged sword for the CCP. The CCP
has always reiterated that the Xinjiang problem is China’s internal affairs. When the violent incident occured,
A CASE STUDY OF THE CONFLICT IN XINJIANG
733
the CCP put their efforts into terminating all internet connections and telephone lines throughout Xinjiang. The
Chinese authorities surprisingly invited the foreign press and media to visit Xinjiang on July 6, 2009, and made
a news report to the world community. On the one hand, the Chinese Government was praised by the foreign
media for its transparency and opening of Xinjiang. On the other hand, the incident regarding unarmed
protestors beaten with a cudgel and punched by local police and over 200 Uygur women demanding that the
Chinese authorities release their male relatives who had been arrested earlier were broadcasted worldwide
(Bovingdon, 2010, pp. 349-350).
Third, the 2009 Urumqi conflict is not only the Uygur problem, but also the Han problem in Xinjiang. For
the Han Chinese in Xinjiang, they have portrayed themselves as the major actors who support the
nation-building exercise in an ethnic region or a special region which is remote and both culturally and
physically barren. Therefore, it is the responsibility of the central government to support and improve their
livelihood (Cliff, 2012). Stability in Xinjiang is what the central government has to pay for the service as long
as the stability and the development are the core interest of the CCP for their ultimate power and survival. The
purge of Wang Lequan from the position of Party Secretary in Xinjiang by Han demand illustrates not only the
failure of Wang Lequan to guarantee the safety and livelihood of the Han settlers, but also the bargaining power
among the Han Chinese in Xinjiang as a partnership of stability in Xinjiang.
Fourth, both incidents in Shaoguan and Urumqi show deep hatred and hostility among ethnic groups,
particularly between the Uygurs and the Han Chinese. A local Han man in Shaoguan who participated in the
assault as he was angered by the rapes having gone unpunished said,
I just wanted to beat them. I hate Xinjiang people. Seven or eight of us beat a person together. Some Xinjiang people hid under their beds. We used iron bars to batter them to death and then dragged them out and put the bodies together.
Another Han man who was furious when the government was lying about the death toll said, “When I see
the news and they say only two people died, I am so angry”. Because he claimed that he helped to kill seven or
eight Uygurs, battering them until they stopped screaming. He thought the death toll is more than 30 (Watts,
2009). During the unrest in Urumqi, the Uygurs kept shouting “Kill the Han, smash the Hui, drive the Mongol
out!”. Although there was the switch between the ethnic group and the verb, the cause “Kill the Han” always
came first (Palmer, 2013). However, if the CCP continues showing disregard for this concern, and keeps
waiting until Xinjiang is stabilized after the majority of Han Chinese, the 2009 unrest in Urumqi will not
definitely be the last violent one. Compared with other ethnic minorities including the Tibetans, the sense of
ethnic identity and nationalism among the Uygurs remains strong and powerful (Wang & Shakya, 2009, p.
135).
Lastly, the 2009 Urumqi unrest clearly demonstrates the deep tension between the Uygurs and the Han
Chinese without any signs of separatist sentiment, jihadism, or even Islamic terrorism which have always been
perceived by the Chinese authorities. Uygur protestors’ waving the Chinese flag signaled that they wished to
cooperate rather than separate from China. The view that the 2009 Urumqi unrest was terrorism and separatism
is a big mistake. The allegation by the Chinese authorities that Rebiya Kadeer, the chairperson of World
Uyghur Congress (WUC) and WUC members, was a terrorist and separatist served to raise her international
profile. On July 5, 2009, she became more famous and attracted more attention from the public than she was on
July 4. This is thanks not to the unrest but to statements from the PRC and the Chinese press (Millward, 2009,
pp. 335-336; Xinhuanet, 2013a).
A CASE STUDY OF THE CONFLICT IN XINJIANG
734
However, the “Three Evils” remained a political rhetoric and instrument for the CCP to suppress the riots
in Xinjiang or conducted by the Uygurs. On the contrary, there were several violent incidents conducted by the
Han Chinese but not perceived or viewed by the Chinese authority as the “Three Evils”. On July 10, 2013, there
was a bomb explosion at Beijing Airport detonated by the wheelchair-bound Ji Zhongxing, who demanded
justice after his petition for the punishment of security guard had been ignored. After the Beijing court had
sentenced him to six years’ imprisonment, he received a lot of sympathy from the public. His act was not
viewed by the Chinese or even the Chinese authorities as extremism (Boehler, 2013; Ding, 2013).
Since Xi Jinping’s ascension to power in late 2012, the rhetoric of “Three Evils” has become more
obvious and the hardline suppression policy has been adopted as the key to ensuring China’s stability and
development (Buckley, 2013; Xinhuanet, 2013b). The attack in Lukqun township, Turpan on June 26, 2013,
marked the most serious riot since the 2009 Urumqi unrest, when the religious extremists led by Ahmatniyaz
Sidiq and 17 members attacked the police station, government building, private shop, and beauty salon. Many
cars and motorcycles were burned and destroyed, and several government officials and innocent people were
killed. After the attack, 24 people were killed (16 Uygurs and eight Han Chinese), and five of them were
decapitated. Twenty-one people were injured and at least four attackers were arrested (Xinhuanet, 2013c). It
was followed by the attack on the police station in Kargilik or Yecheng on August 20, 2013, killing 16 people
(15 Uygurs and one Han police officer) (Hoshur, 2013).
The most deadly incident which challenged China’s stability and legitimacy as well as the images of the
CCP was that the Mercedes-Benz SUV car attack in Beijing’s Tiananmen Square on October 28, 2013,
killing five people and injuring 42 people. Meng Jianzhu, a member of Standing Committee of Political
Bureau, claimed that the attack was premediated and masterminded by the ETIM, while that allegation
remained in doubt among experts. A former classmate of the driver, Usmen Hasan, believed that the attacker
might have been motivated by vengeance for a brother killed in a mysterious traffic accident several years
earlier (Rajagopalan, 2013; Jacobs, 2013). If the assumption of Hasan’s former classmate is correct, it may
prove that the CCP’s assumption is wrong. The CCP believes that the improved livelihood under the scheme of
economic development is the major determinant of achieving ethnic unity and stability. Moreover, General
Peng Yong, Commander-in-Chief of PLA in Xinjiang was removed from his position six days later (Jacobs,
2013).
After the attack in October in Beijing, there were many violent incidents in Xinjiang and other major cities
in China. There was a bomb explosion near the CCP building in Taiyuan, Shanxi on November 6, 2013, killing
one people and injuring eight people. Over 20 vehicles were damaged (Beech, 2013). There was also an attack
on the railway station in Kunming, Yunnan, in March 2014, killing 29 people and injuring 130 people (China
Daily, 2014a). It was followed by the explosion at Urumqi railway station on April 30, 2014, killing two people
and injuring 79 people (China Daily, 2014b), and the attack on Guangzhou railway station on May 6, 2014,
injuring six people. All the three attacks were viewed by the CCP as the “Three Evils”, particularly as terrorism
premediated by the Uygur extremists and the ETIM.
The Conflict in Xinjiang and Its Implications for China’s CNP: An Analysis
The conflict in Xinjiang is not only a crucial case study which indicates China’s political stability in
connection with territory integrity, but it also affects and correlates with China’s CNP in various components
and indicators. The components which will be taken into consideration are population and human resources,
A CASE STUDY OF THE CONFLICT IN XINJIANG
735
economic development and growth, education and culture, science and technology, and military capability and
government expenditure.
As regards population and human resources, the ethnic conflict and tension in Xinjiang have made a
profound impact on population and human resources as evidenced by several riots which claim many lives and
cause a number of injuries, for example, the Kashgar riot in 1981, where 600 people were attacked, causing 200
injuries and two deaths, the riot in Zhaosu, Ili in 1995, which produced an estimated number of 220 deaths and
injuries, the Yining riot in 1997, where 198 people were injured, 50 of them seriously injured, and two were
killed (according to some sources, there were as many as 400 deaths, 300 of whom were Uygur people), and the
riot in July 2009, where 197 people were killed and over 1,700 people were injured. Although the Xinjiang
riots have caused from time to time the number of deaths and injuries which seem small when compared with
those numbers caused by crimes or natural disasters such as the major earthquake in Sichuan in 2008, those
people (including those of the Uygurs) as an indispensable factor in considering CNP should not have died or
been injured for no reason if Xinjiang were to achieve sustainable stability. In addition, even though there is no
systematic collection of statistical data regarding the age of people killed and injured in the riots, those affected
by the riots are likely to belong to the working-age population and somewhat crucial to China’s economic
development and growth.
The conflict in Xinjiang also mirrors certain consequences of China’s economic development and growth.
The GDP per capita of Xinjiang people has multiplied since China had initiated the open door policy and
economic reforms in 1978, and Xinjiang is not the region with some of the lowest GDP per capita as evidenced
by its GDP per capita of USD 5,372, which despite lower than that of the Chinese population of USD 6,091, is
much higher than the GDP per capita of the people in Guizhou of only USD 3,100. However, the massive
income gap and the unequal development rate among cities in Xinjiang have led to the ethnic tension and
conflict. While Xinjiang is a region rich in natural resources and energy resources such as coals, oil, and natural
gas, as well as one of the world’s five largest coal producers by volume (Collins & Erickson, 2012) and China’s
largest oil and natural gas producers (Yuan, 2014), wealth is solely attributed to cities in the north of Xinjiang
i.e., Karamay, Shihezi, Urumqi, and other areas ruled by the XPCC, whose population is mostly Han Chinese.
Karamay has an average GDP per capita of USD 21,389, which is even higher than that of the people in Tianjin,
Beijing, and Shanghai, whereas cities in the south of Xinjiang, where 80% of the population is Uygur, lag
behind those in the north in terms of an average GDP per capita. Kashgar, Kizilsu Kyrgyz or Yili, and Hotan in
particular have an average GDP per capita of only USD 2,030, 1,725, and 1,111, respectively (Lee, 2014, p. 11),
which means that even though Karamay and Hotan are in the same region, their GDP per capita are 20 times
different.
Moreover, when urbanization that is one indicator used to measure the CNP is taken into consideration, it
was found that in the year 2000, Xinjiang was ranked 17th in terms of an urbanization rate at the percentage of
33.82, while Tibet was the bottommost with the percentage of only 18.93. Regarding the ratio of city and rural
incomes, Xinjiang had a level of 3.60, which was the fourth most critical after Tibet, Yunnan, and Guizhou.
Despite the fact that Xinjiang has a rather high urbanization rate, such development is likely to distribute wealth
to the Han people in the northern city areas, while people in the southern rural areas who are predominantly
ethnic minorities, particularly the Uygurs, do not benefit from such economic wealth and are still impoverished.
Although Uygur people account for 47% of the total population in Xinjiang, only 19.76% live in the city areas.
More importantly, the economic system in the south relies heavily on agriculture, making most employment
A CASE STUDY OF THE CONFLICT IN XINJIANG
736
mainly at the primary sector (Cao, 2010, pp. 971-972; Cheng, 2011), but in the industrial and service sectors,
the ethnic minorities are employed at a minimal rate. The arson of cotton stocks from July to September 1999 is
a good reflection of frustration. As cotton is a significant cash crop of Xinjiang and employment is mostly
offered to Han immigrants from other neighboring regions, the sustainable CNP has to be derived from equal
economic development which is not solely granted to any particular group of people or city.
Unequal development also corresponds with the level of education which is one of the CNP’s components.
According to the study of Timothy A. Grose (2010), although the number of Uygur people who received
primary education increased from 37% in 1982 to 43% in 1990 and those who received tertiary education from
0.1% to 2.1%, education among the Uygurs still lag behind that of Han people, particular at the high school and
tertiary levels. In 2006, only 6.9% of Uygur people over 15 years of age finished high school and only 3.1%
graduated from universities. The reason behind a small increase in the proportion of people who receive
education is not only the financial restrictions, but also the fact that the government attempts to integrate culture
by making knowledge of the Chinese language an important requirement for all ethnic minorities who want to
study at the tertiary level, which instead erects educational barriers. It was found that 82% of Uygur people
over 15 years of age are illiterate and approximately 10.8% have difficulty reading Chinese. Some Uygur
people view such requirement as unfair as stated by one Uygur graduate from a university in Beijing who is
currently working for a government newspaper in Urumqi: “There are nearly 10 million Uygurs in Xinjiang,
but we cannot use our own language… We are all nationalities, but only in China are we a minority”. Besides,
the government’s Xinjiang Class Project in 2000, which granted students in Xinjiang who are mostly the
Uygurs an educational opportunity to further their studies at the high school level at schools in the eastern cities
of China, such as Beijing and Shanghai, in order to promote unity between the Han and the Uygurs, produced a
contrary effect. Most Uygur students were opposed to such cultural integration by maintaining their use of the
Uygur dialect for communication outside of the classroom and in their daily lives. Meanwhile, some of the
students who finished their high school were willing to return to their hometown with a determination to
develop Xinjiang for Xinjiang, not Xinjiang for China (Grose, 2010, pp. 99-101, 104-105). It is evident that not
only did the government’s cultural integration through education have an impact on the educational level and
the literacy rate amongst the Uygur population, it had laso become a factor promoting resistance and ethnic
tension which ultimately led to the conflict which destroyed Xinjiang’s stability.
Xinjiang riots have caused an impact on the components in science and technology which play a part in
measuring the CNP. During the riots in July 2009, apart from a considerable number of death tolls and injuries,
the government disabled the internet connection and shut down all the telephone systems in Xinjiang,
particularly in Urumqi, where the internet connection was disabled for almost a year and prevented all the
websites with Xinjiang-based domain and web servers from accessing information. Not only did such an
internet cut-off directly affect the development of economy, education, and tourism in Xinjiang, but it also
decreased the number of internet and telephone users, which is one of the components for measuring the CNP.
Military capability, particularly in terms of military expenditure, has also been affected by the conflict and
political instability in Xinjiang. While Xinjiang is the region bordering other neighboring countries in Central
Asia which are already prone to unstable political situations and require more military and police forces for
territorial defences than other regions (Fravel, 2007, p. 724), with an estimated number of PLA and PAPF in
Xinjiang around 250,000 to 500,000 (Bachman, 2004, p. 180), the conflict and political instability in Xinjiang
emphasize the need for that. Therefore, China’s military expenditure as part of measuring the CNP is not fully
A CASE STUDY OF THE CONFLICT IN XINJIANG
737
allocated for developing military capability as it needs to be partly allocated for maintaining the stability and
suppressing the conflict in Xinjiang. This can be supported by the Yining riot in 1995, which costed more than
20,000 military forces and 8,500 rounds of ammunition in the suppression, the 1996 government policy of
sending 18,000 military forces to 18 problematic counties in five regions, and the recruitment of 120,000 local
activists to cooperate with party members and militia to maintain order and stability. Meanwhile, the great
military exercise of the PLA in Xinjiang with 50,000 military forces displaying military capability through
powerful weapons in the heart of Kashgar for almost a month in 2001 (Davis, 2008, p. 18) seemed to be a
budget-consuming mission. Although it is common for the amount of money to be spent on such a military
exercise, the conflict, and the political stability which arise in Xinjiang might motivate the government to
demonstrate its military capability to the opposition groups as Kashgar is not only the center of Southern
Xinjiang, whose people are predominantly the Uygurs, but it used to be meaningul to the Uygur people as a
Turkish Islamic Republic of Eastern Turkestan in 1933. One major reason why the central government has to
maintain its budget allocation in support of the existence of XPCC or the bingtuan, which comprises 120,000
military forces, is the political instability in Xinjiang, and it is the instability that is regarded as a guarantee that
XPCC will definitely receive continuous budget supports from the government.
The conflict in Xinjiang which clearly correlates with and affects the components for measuring the CNP
is the government regulation and control capability as considered from the central and local government
expenditure. In lieu of allocating budget for developing the country as a whole, the government has to
overspend the budget on compensation of loss and disaster relief, for example, the recruitment, development
and training of government staff to serve the demand for the lost number of forces, the restoration of basic
infrastructure, facilities, and government offices which were destroyed such as the offices of the government
and the Communist Party, the police stations and the railway stations, or even the construction and restoration
of the mosques which were ruined or destroyed as a result of the change in the government policy or the
instability in China, particularly during the Cultural Revolution. In addition, the budget has to be allocated for
XPCC, as evidenced by the Yining incident in 1962, where government buildings and those of the Communist
Party were burned down, 80 explosions in several cities in Xinjiang from March to May 1992, which cost
several million Chinese yuan in loss, 14 bombings in Kargilik or Yecheng, which cost more than USD 120,000
including government buildings, or the attack on the PAPF in August, for example.
Conclusions
This paper explored the case of the conflict in Xinjiang to show that “political stability” is an essential
component and should be incorporated into the concept of CNP for the CNP assessment. Although economic
growth, military might, natural resources, etc., become predominant factors that play a crucial role in the
assessment of China’s CNP, it is just a part of the story.
For China, political instability in Xinjiang has become a major concern challenging the authority and
legitimacy of the CCP since its establishment in 1949. Lack of genuine autonomy and the policy of assimilation
adopted by the CCP have brought about discontent and resentment that finally led to numerous violent
incidents. Moreover, the suppression campaign in the 1990s and labeling most Uygur-related movements and
incidents as “Three Evils” since the 9/11 incident has worsened the stability not just in Xinjiang, but also the
rest of China.
With the current CNP assessment and components proposed by Chinese scholars and academic institutions
A CASE STUDY OF THE CONFLICT IN XINJIANG
738
as noted earlier, the conflict in Xinjiang also affects the China’s CNP. Apart from a profound impact on
population and human resources as evidenced by several riots which claim many lives and cause a number of
injuries, the conflict in Xinjiang also mirrors repercussions of China’s economic growth and social
development such as the massive income gap and the unequal education. Violent incidents, for example, the
July 2009 riot that led to the internet cut-off for almost a year have caused an impact on China’s CNP in terms
of science and technology. Furthermore, China’s military expenditure has not fully been allocated for
increasing its military capability since a part of its needs to be allocated for managing politically unstable
Xinjiang. The genuine CNP assessment should rely not only on the factors from which a country would earn or
benefit, but also on those of which it would have to pay a price. Needless to say, the conflict and political
instability in Xinjiang are an example of the price which China has to pay. It is hoped that this paper will
trigger discussion and debate amongst Chinese academics and think tanks about the significance of
incorporating “political stability” into the concept of CNP in order to understand and assess the genuine
China’s CNP vis-a-vis other major powers.
References Bachman, D. (2004). Making Xinjiang safe for the Han: Contradictions and ironies of Chinese governance in China’s northwest.
In M. Rossabi (Ed.), Governing China’s multiethnic frontiers. Seattle: University of Washington Press. Beech, H. (2013, November 6). Suspected bomb blasts hit Northern Chinese city. Time. Retrieved from
http://world.time.com/2013/11/05/suspected-bomb-blasts-hit-northern-chinese-city/ Berlie, J. A. (2004). Islam in China: Hui and Uyghurs between modernization and sinicization. Bangkok: White Lotus
Press. Boehler, P. (2013, October 15). Wheelchair-bound Beijing Airport bomber Ji Zhongxing jailed for six years. South China
Morning Post. Retrieved from http://www.scmp.com/news/china-insider/article/1332042/wheelchair-bound-beijing-airport- bomber-ji-zhongxing-jailed-six
Bovingdon, G. (2010). Xinjiang. In W. A. Joseph (Ed.), Politics in China: An introduction. New York: Oxford University Press. Buckley, C. (2013, June 29). Violence in restive Chinese region prompts crackdown. The New York Times. Retrieved from
http://www.nytimes.com/2013/06/30/world/asia/china-orders-security-crackdown-after-riots-in-restive-region.html?_r=0 Cao, H. H. (2010). Urban-rural income disparity and urbanization: What is the role of spatial distribution of ethnic groups? A case
study of Xinjiang Uyghur Autonomous Region in Western China. Regional Studies, 44(8), 965-982. Chang, F. K. (1997). China’s Central Asian power and problems. Orbis, 41(3), 401-425. Cheng, C. (2011). Poverty alleviation and development in Xinjiang. Chinese Law and Government, 44(6), 3-9. China Daily. (2014a, March 2). At least 29 dead, 130 injured in Kunming violence. China Daily. Retrieved from
http://www.chinadaily.com.cn/china/2014-03/02/content_17315179.htm China Daily. (2014b, May 1). Xi urges “decisive actions” against terrorism after Xinjiang blast. China Daily. Retrieved from
http://www.chinadaily.com.cn/china/2014-05/01/content_17478085.htm Choo, J. (2009). Ideas matter: China’s peaceful rise. Asia Europe Journal, 7(3-4), 389-404. Clarke, M. (2003). Xinjiang and China’s relations with Central Asia, 1991-2001: Across the “domestic-foreign frontier”? Asian
Ethnicity, 4(2), 207-224. Clarke, M. (2013). Ethnic separatism in the People’s Republic of China: History, causes and contemporary challenges. European
Journal of East Asian Studies, 12, 109-133. Cliff, T. (2012). The partnership of stability in Xinjiang: State-society interactions following the July 2009 unrest. The China
Journal, 68, 79-105. Collins, G., & Erickson, A. (2012, September 21). Xinjiang poised to become China’s largest coal producer: Will move global
coal, natural gas, and crude oil markets. China Signpost. Retrieved from http://www.chinasignpost.com/2012/ 09/21/xinjiang-poised-to-become-chinas-largest-coal-producer-will-move-global-coal-natural-gas-and-crude-oil-markets/
Davis, E. V. W. (2008). Uyghur Muslim ethnic separatism in Xinjiang, China. Asian Affairs: An American Review, 35(1), 15-29. Dillon, M. (2004). Xinjiang—China’s Muslim far northwest. London: Routledge.
A CASE STUDY OF THE CONFLICT IN XINJIANG
739
Dillon, M. (2006). Uyghur separatism and nationalism in Xinjiang. In B. Cole (Ed.), Conflict, terrorism and the media in Asia. London: Routledge.
Ding, G. (2013, August 10). Sympathy for the Beijing Airport bomber. VICE United States. Retrieved from http://www.vice. com/read/sympathy-for-the-bomber
Ebrey, P., Walthall, A., & Palais, J. (2009). East Asia: A cultural, social, and political history (2nd ed.). Belmont, C.A.: Wadsworth, Cengage Learning.
Fenby, J. (2012). Tiger head, snake tails: China today, how it got there and why it has to change. London: Simon & Schuster.
Forbes, A. D. W. (2010). Warlords and Muslims in Chinese Central Asia: A political history of republican Sinkiang 1911-1949. Bangkok: White Lotus.
Fravel, M. T. (2007). Securing borders: China’s doctrine and force structure for frontier defense. The Journal of Strategic Studies, 30(4-5), 705-737.
Ghosh, P. K. (2009). The Chinese concept of comprehensive national power: An overview. Air Power Journal, 4(4), 17-54. Gladney, D. C. (2004). The Chinese program of development and control, 1978-2001. In S. F. Starr (Ed.), Xinjiang: China’s
Muslim borderland. New York: M.E. Sharpe. Golden, S. (2011). China’s perception of risk and the concept of comprehensive national power. The Copenhagen Journal of
Asian Studies, 29(2), 79-109. Grose, T. A. (2010). The Xinjiang class: Education, integration, and the Uyghurs. Journal of Muslim Minority Affairs, 30(1),
97-109. Gunaratna, R., Acharya, A., & Pengxin, W. (2010). Ethnic identity and national conflict in China. New York: Palgrave Macmillan. Hoshur, S. (2013, August 25). At least 15 Uyghurs killed in police shootout in Xinjiang. Radio Free Asia. Retrieved from
http://www.rfa.org/english/news/uyghur/shootout-08252013134303.html Hu, A. G., & Men, H. H. (2004). The rising of modern China: Comprehensive national power and grand strategy. Proceedings
from “Rising China and the East Asian Economy” International Conference by Korea Institute for International Economic Policy. March 19-20, Seoul, Republic of Korea.
Information Office of the State Council of the People’s Republic of China. (2002, January 21). “East Turkistan” terrorist forces cannot get away with impunity. Information Office of the State Council of the People’s Republic of China. Retrieved from http://www.china.org.cn/english/2002/Jan/25582.htm
Jacobs, A. (2013, November 3). China strips army official of position after attack. The New York Times. Retrieved from http://www.nytimes.com/2013/11/04/world/asia/china-demotes-a-military-commander-after-attack-in-beijing.html?_r=0
Johnston, A. I., & Ross, R. S. (1999). Engaging China: The management of an emerging power. London: Routledge. Jones-Leaning, M., & Pratt, D. (2012). Islam in China: From silk road to separatism. Muslim World, 102(2), 308-334. Kang, D. C. (2007). China rising: Peace, power, and order in East Asia. New York: Columbia University Press. Kerr, D., & Swinton, L. C. (2008). China, Xinjiang, and the transnational security of Central Asia. Critical Asian Studies, 40(1),
113-142. Kirshner, J. (2010). The tragedy of offensive realism: Classical realism and the rise of China. European Journal of International
Relations, 18(1), 53-75. Krasner, S. D. (2009). Power, state, and sovereignty: Essays on international relations. London: Routledge. Lam, T. (2006). The federalist possibility? Breaking the Chinese exceptionalism. In J. H. Chung (Ed.), Charting China’s future:
Political, social, and international dimensions. Lanham, M.D.: Rowman & Littlefield Publishers. Lee, R. (2014, Febuary 9). Unrest in Xinjiang, Uyghur province in China. Al Jazeera Center for Studies. Retrieved from
http://studies.aljazeera.net/en/reports/2014/02/201421281846110687.htm Li, R. (2009). A rising China and security in East Asia: Identity construction and security discourse. London: Routledge. Millward, J. (2004). Violent separatism in Xinjiang: A critical assessment. Policy Studies, 6. Retrieved from
http://www.eastwestcenter.org/fileadmin/stored/pdfs/PS006.pdf Millward, J. A. (2009). Introduction: Does the 2009 Urumchi violence mark a turning point? Central Asian Survey, 28(4),
347-360. Millward, J. A., & Tursan, N. (2004). Political history and strategies of control, 1884-1978. In S. F. Starr (Ed.), Xinjiang: China’s
Muslim borderland. New York: M.E. Sharpe. Mori, A. (2007). Rich country, strong armed forces? The sources of China’s comprehensive national power. Center for Asia
Pacific Area Studies Newsletter (Academica Sinica), 38, 19-48.
A CASE STUDY OF THE CONFLICT IN XINJIANG
740
Nye, J. S. (2011). The future of power. New York: Public Affairs. Ouali, A. E. (2006). Territorial integrity: Rethinking the territorial sovereign right of the existence of the states. Geopolitics, 11(4),
630-650. Palmer, J. (2013, September 27). The strangers: Blood and fear in Xinjiang. South China Morning Post. Retrieved from
http://www.scmp.com/news/china-insider/article/1318900/strangers-blood-and-fear-xinjiang People’s Daily. (2007, October 12). Overview of Xinjiang Production and Construction Corps. People’s Daily Online. Retrieved
from http://english.people.com.cn/90002/92362/92396/6281903.html Pillsbury, M. (1999). PLA capabilities in the 21st century: How does China assess its future security needs? In L. W. Wortzel
(Ed.), The Chinese armed forces in the 21st century. Carlisle, P.A.: Strategic Studies Institute, U.S. Army College. Pillsbury, M. (2000). China debates the future security environment. Washington, D.C.: National Defense University Press. Population Reference Bureau. (2012). 2012 world population data sheet. Population Reference Bureau. Retrieved from
http://www.prb.org/pdf12/2012-population-data-sheet_eng.pdf Qiu, M. Z. (1998). On cultural development and comprehensive national power. Mao Zedong and Deng Xiaoping Theory
research. Retrieved from http://www.sass.stc.sh.cn/eWebEditor/UploadFile/00n/ull/20080828104029466.pdf Rajagopalan, M. (2013, November 1). China security chief blames Uighur Islamists for Tiananmen attack. Reuters. Retrieved
from http://www.reuters.com/article/2013/11/01/us-china-tiananmen-idUSBRE9A003L20131101 Rodriguez, P. A. (2013). Violent resistance in Xinjiang (China): Tracking militancy, ethnic riots and “knife-wielding” terrorists
(1978-2012). Historia Actual Online, 30, 135-149. Ross, R. S., & Feng, Z. (2008). China’s ascent: Power, security, and the future of international politics. New York: Cornell
University Press. Rossabi, M. (2014). A history of China. Chichester, West Sussex: Wiley-Blackwell. Saich, T. (Ed.). (1996). The rise to power of the Chinese Communist Party: Documents and analysis. New York: M.E. Sharpe. Shichor, Y. (2006). Fact and fiction: A Chinese documentary on Eastern Turkestan terrorism. China and Eurasia Forum
Quarterly, 4(2), 89-108. Shiraishi, T. (2012). The rise of China and its implications for East Asia. In P. J. Katzenstein (Ed.), Sinicization and the rise of
China: Civilizational processes beyond East and West. London: Routledge. Stockholm International Peace Research Institute. (2011). Military expenditure of China. The SIPRI Military Expenditure
Database. Retrieved from http://milexdata.sipri.org/result.php4 Tammen, R. L., & Kugler, J. (2006). Power transition and China-US conflicts. Chinese Journal of International Politics, 1, 35-55. Tellis, A. J., Bially, J., Layne, C., & McPherson, M. (2000). Measuring national power in the postindustrial age. Santa Monica,
C.A.: RAND Corporation. The Economist. (2013, May 25). Settlers in Xinjiang: Circling the wagons. The Economist. Retrieved from http://www.
economist.com/news/china/21578433-region-plagued-ethnic-strife-growth-immigrant-dominated-settlements-adding The World Bank. (2011). China. World development indicators and global development finance. Retrieved from
http://databank.worldbank.org/Data/Views/Reports/TableView.aspx Tong, J. (2010a). The Xinjiang problem (I): Stabilization and rectification policies, 1996-98. Chinese Law and Government, 43(1),
3-8. Tong, J. (2010b). The Xinjiang problem (II): Violent disturbances and religious policy, 1995-98. Chinese Law and Government,
43(2), 3-9. U.S. Department of State. (2004). Terrorist exclusion list. U.S. Department of State. Retrieved from http://www.state.gov/
j/ct/rls/other/des/123086.htm U.S. Department of the Treasury. (2002). Press statement on the UN designation of the Eastern Turkistan Islamic Movement. U.S.
Department of the Treasury. Retrieved from http://www.treasury.gov/press-center/press-releases/Pages/po3415.aspx Vidmar, J. (2012). Territorial integrity and the law of statehood. George Washington International Law Review, 44(4), 697-747. Wang, L. Q. (2010). Get a clear understanding of the situation, strengthen confidence, work together with one heart to safeguard
Xinjiang’s stability (abridged). Chinese Law and Government, 43(2), 53-65. Wang, L. X., & Shakya, T. (2009). The struggle for Tibet. New York: Verso. Watts, J. (2009, July 10). Old suspicions magnified mistrust into ethnic riots in Urumqi. The Guardian. Retrieved from
http://www.theguardian.com/world/2009/jul/10/china-riots-uighurs-han-urumqi Xinhuanet. (2013a, July 5). China firmly opposes separatism, terrorism: FM spokeswoman. Xinhuanet. Retrieved from
http://news.xinhuanet.com/english/china/2013-07/05/c_124966146.htm

A CASE STUDY OF THE CONFLICT IN XINJIANG
741
Xinhuanet. (2013b, July 2). CPC paper urges efforts to safeguard social stability in Xinjiang. Xinhuanet. Retrieved from http://news.xinhuanet.com/english/indepth/2013-07/02/c_132504942.htm
Xinhuanet. (2013c, June 30). Xinhua insight: Investigations reveal details of Xinjiang terror attack. Xinhuanet. Retrieved from http://news.xinhuanet.com/english/indepth/2013-07/06/c_124966189.htm
Yan, X. T. (2006). The rise of China and its power status. Chinese Journal of International Politics, 1(1), 5-33. Yang, J. S. (2013). Tombstone: The great Chinese famine, 1958-1962. (S. Mosher and J. Guo, Trans.). New York: Farrar, Straus
& Giroux. Yuan, L. (2014, February 11). Xinjiang oil production hits record high in 2013. China Daily. Retrieved from
http://www.chinadaily.com.cn/m/xinjiang/karamay/2014-02/11/content_17276395.htm Zacher, M. W. (2001). The territorial integrity norm: International boundaries and the use of force. International Organization,
55(2), 215-250. Zheng, S. P. (2012). China’s political stability: Global comparison. Journal of Chinese Political Science, 17(1), 1-13. Zhu, Z. Q. (2005). Power transition and U.S.-China relations: Is war inevitable? Journal of International and Area Studies, 12(1),
1-24.
Journal of US-China Public Administration, September 2014, Vol. 11, No. 9, 742-749 doi: 10.17265/1548-6591/2014.09.002
Cluster Policy and Smart Specialisation—The Case of Bulgaria
Paskal Zhelev
University of National and World Economy, Sofia, Bulgaria
Smart specialisation is an innovative policy concept which emphasizes the principle of prioritisation in a vertical
logic and has attracted a wide interest in recent years, being implemented in many national technology and
innovation strategies. Clusters are considered to be a major driver of innovation and competitiveness and for years,
have been assigned a key role in various economic development strategies around the world. The paper looks at the
interrelationship between clusters and smart specialisation. While clusters are an important building block of Smart
Specialisation Strategies (S3), cluster policies are also influenced by the concept of smart specialisation as they
have increasingly started to target specific industries. The principal objective of the paper is to provide an overview
and evaluation of the cluster policy pursued in Bulgaria during the last decade. The extent to which the country has
used the principle of smart specialisation in its cluster initiatives is assessed. It has been argued that namely due to
the lack of clear focus and prioritisation, Bulgaria’s cluster policy proved to be highly inefficient. Finally, some
policy recommendations for its improvement are put forward.
Keywords: cluster policy, competitiveness, industrial clusters, smart specialisation
After its popularization by Porter in 1990, the concept of clusters has gained a growing importance,
reflected in the proliferation of policies and initiatives in support of clusters all around the world. Empirical
evidence clearly shows that clusters are significantly related to innovation and prosperity (European
Commission, 2013a). They are thus increasingly seen as catalysts for accelerating industrial transformation and
for developing new regional competitive advantages, speeding up the creation of firms and jobs, increasing
their productivity, and driving innovation, thereby contributing to competitiveness and growth. Therefore,
clusters have become important instruments for the implementation of almost any modern economic
development strategy. They have been assigned a prominent role in the European Union (EU)’s Europe 2020
strategy as well. The flagship initiatives “Innovation Union” and “An Integrated Industrial Policy for the
Globalisation Era” specifically refer to clusters and networks as critical tools.
According to Porter (2007), a significant merit of cluster-based policies is that unlike traditional industrial
policies, they do not distort competition by favouring particular type of activity, as there is no need of “picking
winners”. As the existence of any cluster is good for the economy, governments should not choose among
clusters, but have to create policies that support upgrading in every cluster present in a location.
However, not all clusters can have the same impact on competitiveness and industrial development of a
nation. Porter (2003) himself recognizes that export-oriented clusters register higher wages, productivity, and
innovation than the non-tradable ones. Moreover, the scarcity of public resources available for support dictates
Corresponding author: Paskal Zhelev, Ph.D., chief assistant professor, Department of International Economic Relations and
Business, University of National and World Economy; research fields: industrial policy, international competitiveness, and European integration. E-mail: [email protected].
DAVID PUBLISHING
D
CLUSTER POLICY AND SMART SPECIALISATION
743
a pursuit of their most efficient utilization. This in line with the concept of smart specialisation, necessitates
setting priorities, i.e., targeting those clusters whose development will be purposefully stimulated. As Velev
(2007) states, in practice, countries and regions with several identified clusters develop their cluster portfolio,
ranking clusters by their importance for the economic development and competitiveness. Thereby, the priorities
for the realisation of the cluster approach are determined.
In this context, the main objective of the paper is after presenting the concept of smart specialisation and
its interaction with that of clusters, to provide an overview and evaluation of the cluster policy pursued in
Bulgaria during the last decade. The extent to which the country has used the principle of smart specialisation
in its cluster initiatives will be assessed, and finally, some policy recommendations for its improvement are
going to be formulated.
Clusters and Smart Specialisation—Concepts and Relationship
There are many definitions of clusters in the literature which are context specific. The original definition
for clusters provided by Porter (1990) is: “Clusters are geographic concentrations of interconnected companies,
specialized suppliers and service providers, firms in related industries, and associated institutions (for example,
universities, standards agencies, and trade associations) in particular fields that compete but also co-operate”.
Industrial clusters can increase productivity through linkages, spill-overs, and synergies across firms and
associated institutions and through efficient access to public goods, specialised knowledge, workers and
suppliers, better coordination, and the diffusion of best practices. Therefore, they are largely considered to be
drivers of economic growth, innovation, and competitiveness.
Industrial clusters are mostly a market-driven phenomenon evolving spontaneously over decades as a
result of natural competitive advantages. However, well-designed and implemented cluster policies can
accelerate the process and provide a much-needed initial platform on which to grow in output and maturity.
Cluster policy can be defined as deliberate actions taken by the government in order to create or support the
growth and competitiveness of clusters. The rationale for public intervention to foster clusters through various
types of support measures such as infrastructure and knowledge-based investments as well as networking
activities and training, is an increase in knowledge spill-overs (positive externalities) among key actors in
clusters. Nowadays, cluster policies take different forms and are very often included as basic instruments and
integral part of industrial and small and medium-sized enterprises (SMEs) policies or research and innovation
policies.
Under the conditions of rising globalization, increased competition in technology intensive spheres by new
global players as China and India, fiscal austerity and quests for savings in public spending in developed
economies, as well as a resurrection in the interest of industrial policy, the concept of smart specialisation has
received much attention during the past three years.
Smart specialisation is a strategic approach to economic development through targeted support to research
and innovation. It is an evidence-based policy framework which uses indicators, technology foresight, and
other priority-setting tools to help entrepreneurs and firms strengthen existing scientific, technological, and
industrial specialisation patterns while identifying and encouraging the emergence of new domains of economic
and technological activity.
Smart Specialisation Strategies (S3) are conditionality for accessing EU Structural Funds investments in
research and innovation, as part of the Cohesion Policy’s contribution to the Europe 2020 jobs and growth
CLUSTER POLICY AND SMART SPECIALISATION
744
agenda during the period 2014-2020. More generally, smart specialisation involves a process of developing a
vision, identifying competitive advantages, setting strategic priorities, and making use of smart policies to
maximise the knowledge-based development potential of any region, strong or weak, high-tech or low-tech
(European Commission, S3 Platform, 2014).
By elaborating S3, governments are attempting to enhance the competitiveness of firms and clusters. The
underlying rationale behind the S3 concept is that even in the information age, the logic of specialisation is
intact—it clearly pays to focus on areas of real potential and strength rather than spreading investments thinly
over unrelated areas.
According to the European Commission (2013b), clusters and S3 are closely related concepts as they share
many similarities in their rationale: (1) a focus on productivity and innovation as key drivers of competitiveness;
and (2) an accent on fostering regional embeddedness with a view to capitalising on the advantages of
proximity. However, the two concepts are not equivalent as there are important differences. S3 focuses on
specific innovation intensive sectors while clusters apply to a broader set of sectors in the economy. S3 aims to
exploit emerging linkages between economic activities that can cut across traditional cluster boundaries. And,
probably most importantly, the explicit goal of S3—the transformation of regional economies around new
knowledge-based activity domains—while the goal of cluster policies is often to enhance the performance of
existing clusters (European Commission, 2013b).
S3 are thus wider policies which go beyond cluster policies, using priority-setting tools to help
entrepreneurs and firms strengthen existing scientific, technological, and industrial specialisation patterns while
identifying and encouraging the emergence of new domains of economic and technological activity. By aiming
to create new capacities, S3 try to accelerate the transformation and modernisation of economic activities in
clusters.
Overall, clusters are important building blocks of S3—they are among the most important policy tools in a
S3 policy mix. According to the Research and Innovation Strategy for Smart Specialisation (RIS3) Guide
(European Commission, 2012), R&D (research and development), innovation and technology policy should
target sectors with the potential to generate clusters of firms as opposed to simply promoting scattered
innovation.
Cluster policies could be especially useful in the process of prioritization in S3. Methods to identify
priority intervention domains can benefit from quantitative and qualitative approaches used in cluster selection
(taking into account their limits, notably to identify new domains shaped by knowledge crossing traditional
industry boundaries) and roadmaps defined by clusters can be used as inputs into the prioritization process
(European Commission, 2013b).
The concept of smart specialisation also exerts a significant impact on the way which cluster policies are
designed. Cluster policies in many ways aim to achieve a strategy for industrial specialisation. For example,
cluster policies in many countries from France to the United States explicitly target specific sectors/industries
in their national innovation strategies or plans instead of providing horizontal type of support.
Cluster Initiatives in Bulgaria During the Last Decade
According to Török, Csuka, Kovacs, and Veres (2013), at present, there is no well-defined cluster policy
in Bulgaria. However, the notion of clusters is well integrated in other related policies such as the promotion of
SMEs, national innovation policy, and regional policy. Furthermore, it is present in almost all strategic
CLUSTER POLICY AND SMART SPECIALISATION
745
economic, R&D, and other policy documents and all regional plans for development. Thus, it is officially
recognized that clusters are a major instrument for achieving sustained economic development.
In 2001 and 2002, several projects with foreign financial assistance were carried out in Bulgaria with the
aim of introducing the concept of clusters and exploring the possibilities for cluster development. The first
cluster organization—Bulgarian Cluster for Information and Communication Technologies was
institutionalized at the end of 2004 as a non-profit legal entity. The implementation in 2005 of the Project
“Introduction of cluster approach and establishment of a pilot cluster model” under the Poland and Hungary:
Assistance for Restructuring Their Economies (PHARE) Programme resulted in the elaboration of a National
Strategy and an Action Plan for Cluster Development. On the basis of a detailed regional economy analysis,
potential cluster structures were identified as well as 15 priority sectors, eligible for support from the EU
Structural Funds for the development of clusters were outlined: processing of fruits and vegetables, information
and communication technologies, clothing and textiles, wine production, general mechanical engineering,
energy, dairying, tourism, woodworking and furniture production, non-ferrous metal and ores, auto parts and
electronics, high technology/science, transport and logistics, perfumery and cosmetics, and creative industries
(Vulov, 2006). However, the succeeding cluster policy proved to disregard these priorities.
After the finalization of the pre-accession PHARE Programme, cluster policy in Bulgaria is carried out
through the Operational Programme “Development of the Competitiveness of the Bulgarian Economy
2007-2013” with the financial aid of the European Regional Development Fund. One of the objectives of
Priority 2 “Increasing efficiency of enterprises and promoting supportive business environment” is “promotion
of productive capacity and access to markets through the use of clustering and business networks”.
The scheme “Support for Cluster Development in Bulgaria” with a budget of 15 million euros supports the
build-up of clusters’ administrative and managerial capacity, the expansion of market positions, as well as
investments in new technologies and equipment for carrying-out common cluster-related activities.
Beneficiaries under this priority axis are: Bulgarian enterprises, from both the manufacturing and service
sectors; public bodies and non-governmental organisations, providing business support services and/or
operating business incubators; public bodies and institutions, educational and/or research organizations, NGOs
(non-governmental organizations), and other entities included in cluster networks. The main priority of the
measure is the establishment of clusters in Bulgaria. It does not target any specific sectors and has no specific
thematic focus.
The support scheme provides grants to both existing and potential clusters, however, without
differentiation among them. Unlike the other EU countries, where more than 60% of the cluster programmes
and initiatives follow a vertical approach, the Bulgarian cluster policy lacks prioritization. The cluster
initiatives exist in isolation from support schemes for technology parks; no link has been established with key
stakeholders—the regions. Furthermore, there is no succession in the policy, each project represents an isolated
over time effort. A major flaw of the Bulgarian cluster policy is that the selection of projects for support is not
based on clear and objective criteria.
All of the abovementioned weaknesses led to the following paradoxical results during the last session of
the scheme “Support for Cluster Development in Bulgaria” with a budget of about 10 million euros, held in
2013, according to the Association of Business Clusters:
(1) Over 80% of the successful applicant clusters were registered in the period (March-April, 2013)—right
before the deadline for project proposals submission, i.e., most of the supported clusters are designed with the
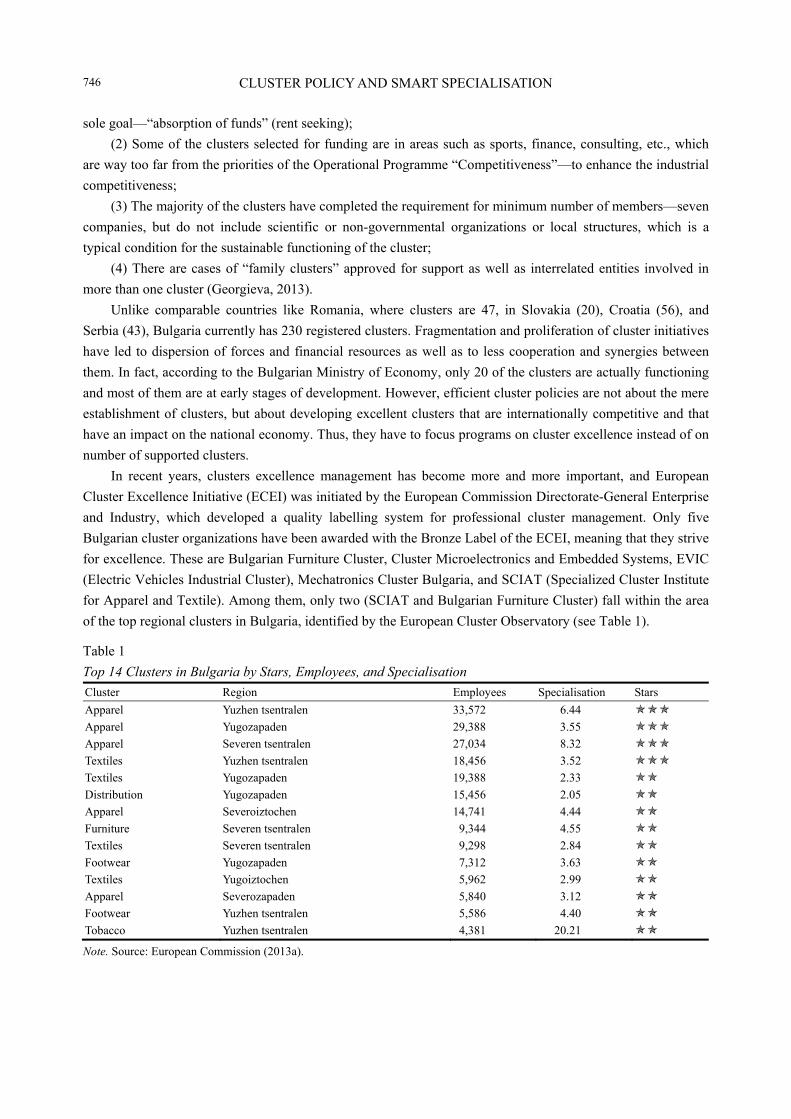
CLUSTER POLICY AND SMART SPECIALISATION
746
sole goal—“absorption of funds” (rent seeking);
(2) Some of the clusters selected for funding are in areas such as sports, finance, consulting, etc., which
are way too far from the priorities of the Operational Programme “Competitiveness”—to enhance the industrial
competitiveness;
(3) The majority of the clusters have completed the requirement for minimum number of members—seven
companies, but do not include scientific or non-governmental organizations or local structures, which is a
typical condition for the sustainable functioning of the cluster;
(4) There are cases of “family clusters” approved for support as well as interrelated entities involved in
more than one cluster (Georgieva, 2013).
Unlike comparable countries like Romania, where clusters are 47, in Slovakia (20), Croatia (56), and
Serbia (43), Bulgaria currently has 230 registered clusters. Fragmentation and proliferation of cluster initiatives
have led to dispersion of forces and financial resources as well as to less cooperation and synergies between
them. In fact, according to the Bulgarian Ministry of Economy, only 20 of the clusters are actually functioning
and most of them are at early stages of development. However, efficient cluster policies are not about the mere
establishment of clusters, but about developing excellent clusters that are internationally competitive and that
have an impact on the national economy. Thus, they have to focus programs on cluster excellence instead of on
number of supported clusters.
In recent years, clusters excellence management has become more and more important, and European
Cluster Excellence Initiative (ECEI) was initiated by the European Commission Directorate-General Enterprise
and Industry, which developed a quality labelling system for professional cluster management. Only five
Bulgarian cluster organizations have been awarded with the Bronze Label of the ECEI, meaning that they strive
for excellence. These are Bulgarian Furniture Cluster, Cluster Microelectronics and Embedded Systems, EVIC
(Electric Vehicles Industrial Cluster), Mechatronics Cluster Bulgaria, and SCIAT (Specialized Cluster Institute
for Apparel and Textile). Among them, only two (SCIAT and Bulgarian Furniture Cluster) fall within the area
of the top regional clusters in Bulgaria, identified by the European Cluster Observatory (see Table 1).
Table 1
Top 14 Clusters in Bulgaria by Stars, Employees, and Specialisation
Cluster Region Employees Specialisation Stars
Apparel Yuzhen tsentralen 33,572 6.44
Apparel Yugozapaden 29,388 3.55
Apparel Severen tsentralen 27,034 8.32
Textiles Yuzhen tsentralen 18,456 3.52
Textiles Yugozapaden 19,388 2.33
Distribution Yugozapaden 15,456 2.05
Apparel Severoiztochen 14,741 4.44
Furniture Severen tsentralen 9,344 4.55
Textiles Severen tsentralen 9,298 2.84
Footwear Yugozapaden 7,312 3.63
Textiles Yugoiztochen 5,962 2.99
Apparel Severozapaden 5,840 3.12
Footwear Yuzhen tsentralen 5,586 4.40
Tobacco Yuzhen tsentralen 4,381 20.21
Note. Source: European Commission (2013a).
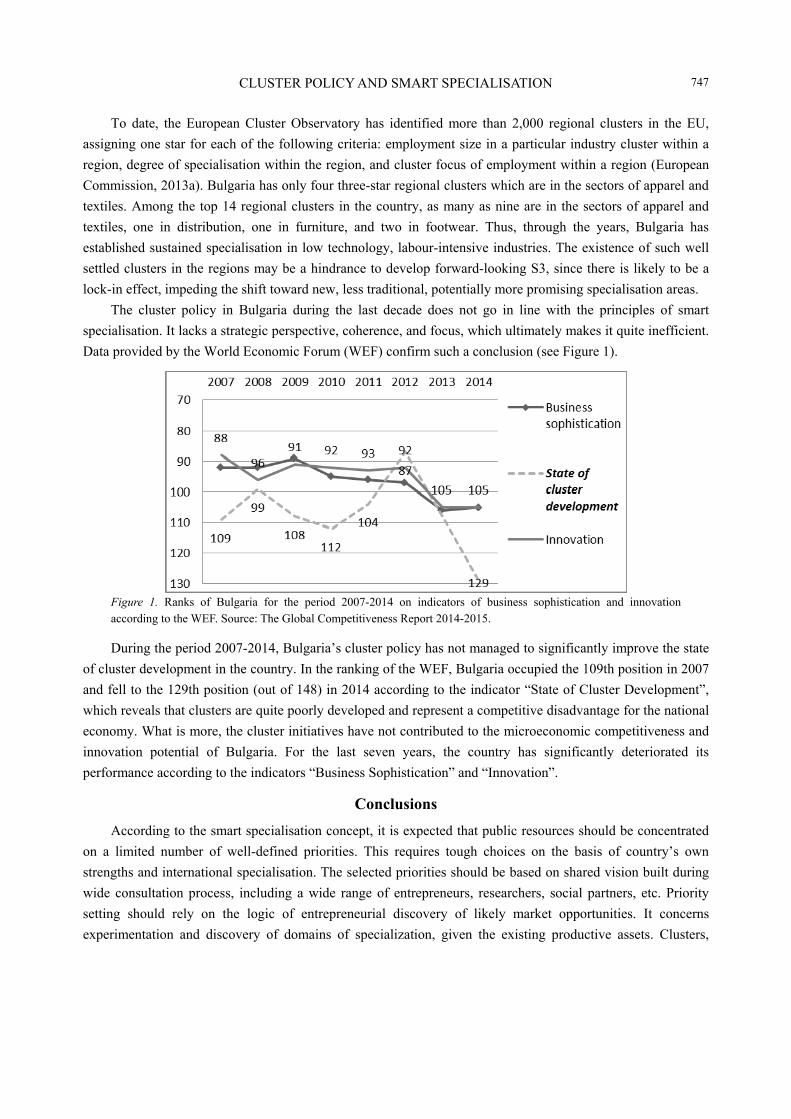
CLUSTER POLICY AND SMART SPECIALISATION
747
To date, the European Cluster Observatory has identified more than 2,000 regional clusters in the EU,
assigning one star for each of the following criteria: employment size in a particular industry cluster within a
region, degree of specialisation within the region, and cluster focus of employment within a region (European
Commission, 2013a). Bulgaria has only four three-star regional clusters which are in the sectors of apparel and
textiles. Among the top 14 regional clusters in the country, as many as nine are in the sectors of apparel and
textiles, one in distribution, one in furniture, and two in footwear. Thus, through the years, Bulgaria has
established sustained specialisation in low technology, labour-intensive industries. The existence of such well
settled clusters in the regions may be a hindrance to develop forward-looking S3, since there is likely to be a
lock-in effect, impeding the shift toward new, less traditional, potentially more promising specialisation areas.
The cluster policy in Bulgaria during the last decade does not go in line with the principles of smart
specialisation. It lacks a strategic perspective, coherence, and focus, which ultimately makes it quite inefficient.
Data provided by the World Economic Forum (WEF) confirm such a conclusion (see Figure 1).
Figure 1. Ranks of Bulgaria for the period 2007-2014 on indicators of business sophistication and innovation according to the WEF. Source: The Global Competitiveness Report 2014-2015.
During the period 2007-2014, Bulgaria’s cluster policy has not managed to significantly improve the state
of cluster development in the country. In the ranking of the WEF, Bulgaria occupied the 109th position in 2007
and fell to the 129th position (out of 148) in 2014 according to the indicator “State of Cluster Development”,
which reveals that clusters are quite poorly developed and represent a competitive disadvantage for the national
economy. What is more, the cluster initiatives have not contributed to the microeconomic competitiveness and
innovation potential of Bulgaria. For the last seven years, the country has significantly deteriorated its
performance according to the indicators “Business Sophistication” and “Innovation”.
Conclusions
According to the smart specialisation concept, it is expected that public resources should be concentrated
on a limited number of well-defined priorities. This requires tough choices on the basis of country’s own
strengths and international specialisation. The selected priorities should be based on shared vision built during
wide consultation process, including a wide range of entrepreneurs, researchers, social partners, etc. Priority
setting should rely on the logic of entrepreneurial discovery of likely market opportunities. It concerns
experimentation and discovery of domains of specialization, given the existing productive assets. Clusters,
CLUSTER POLICY AND SMART SPECIALISATION
748
accordingly cluster policy is assigned a major role in S3 necessarily involving prioritising “sectoral cluster”,
“sectoral strategic plans”, or “cluster strategy”.
During the last decade, Bulgarian cluster policy proved to be of extremely low efficiency. It showed a lack
of focus and strategic prioritising, scattering the resources which did not allow achieving of critical mass effects.
The resulting poor state of cluster development, with regional clusters concentrated extremely in traditional
sectors, implied very weak microeconomic competitiveness and deteriorating innovation performance of the
national economy.
What policy recommendations could be extended in order to increase the effectiveness and efficiency of
Bulgarian cluster policy?
The cluster program should be embedded in a national cluster policy respectively economic development
strategy. It has to complement and be closely interconnected with other policies and measures designed to
foster the technological modernization and innovation potential of the economy.
The proliferation of cluster initiatives with little chance of long-term success has to be avoided, thus
concrete targets and priorities should be set for funded cluster networking activities. Successful cluster policy
cannot be elaborated in a pure “top-down” way, but industry and service providers have to be actively involved
in the process of prioritisation within a “bottom-up” approach. New cluster initiatives should be carefully
designed and underpinned by a very clear rationale based on precisely identified business interests, regional
strengths, specific competences, knowledge hubs of international excellence, and market foresight.
As cluster development is a long-term process, cluster support should be provided on a long-term basis of
(at least) five to 10 years. This also means that continuous evaluation and monitoring of cluster activities are
necessary. Only clusters with a high potential of development and high performance should be supported. The
Hungarian Program provides a good example in this regard: Although it commits grants for a certain period of
years, funding is provided by a series of instalments (stage-funding). Prior to instalments, beneficiaries have to
prove through an evaluation that they perform according to the grant agreement. Furthermore, there is a system
of accreditation which provides an easier access to clusters which have produced evident results. Thus, the
cluster policy consolidates the well-managed and the most promising clusters in order to facilitate them to
become internationally competitive ones.
Clusters have different characteristics depending on their context (e.g., history of origin, emerging vs.
traditional industries, mature vs. immature clusters). This requires different support mechanisms depending on
the development stage of the cluster. The example of Romania has to be followed, which has two cluster
programs each of which specifically dedicates its effort to either the development of new cluster organizations
or the further support of the already existing cluster management organizations.
It is essential for firms to take part in the global exchange of knowledge and be highly export oriented;
therefore, the cluster policy should support the internationalisation of cluster organisations and cluster activities.
This has to be reflected by program guidelines and evaluation criteria for project proposals.
The Bulgarian cluster policy has to be integrated in FDI (foreign direct investment) promotion policy,
aiming to target foreign investors in order to fill in gaps or strengthen the missing links in the priority clusters.
References European Commission, S3 Platform. (2014). Retrieved from http://s3platform.jrc.ec.europa.eu European Commission. (2012). Guide to research and innovation strategies for smart specialisation (RIS 3). Brussels.

CLUSTER POLICY AND SMART SPECIALISATION
749
European Commission. (2013a). Innovation clusters in Europe: A statistical analysis and overview of current policy support. Retrieved from http://www.central2013.eu/fileadmin/user_upload/Downloads/Tools_Resources/Cluster.pdf
European Commission. (2013b). The role of clusters in smart specialisation strategies. Brussels. Georgieva, M. (2013, September 18). Klasteri se obyaviha protiv otsenka za evroproekti (Clusters opposed evaluation of EU
projects). Kapital Daily. Retrieved from http://www.capital.bg Porter, M. (1990). The competitive advantage of nations. New York: Free Press. Porter, M. (2003). The economic performance of regions. Regional Studies, 37(6-7), 549-578. Porter, M. (2007). Clusters and economic policy: Aligning public policy with the new economics of competition. ISC White Paper.
Retrieved from http://otrans.3cdn.net/9ee4efe9869dbefd4b_wzm6bsoie.pdf Török, A., Csuka, G., Kovacs, B., & Veres, A. (2013). The “resurrection” of industrial policy in the European Union and its
impact on industrial policy in the new member countries. MS69 “research paper on a new industrial policy for catch-up economies” Working Paper No. 26. Retrieved from http://www.foreurope.eu
Velev, M. (2007). Klasteren podhod za povishavane na konkurentosposobnostta (Cluster approach for fostering competitiveness). Sofia: Softtrade.
Vulov, G. (2006). Pomosht ot ES za 15 novi klastera (EU support for 15 new clusters). Retrieved from http://www.capital.bg/ biznes/predpriemach/2006/07/21/273368_pomosht_ot_es_za_15_novi_klustura/
Journal of US-China Public Administration, September 2014, Vol. 11, No. 9, 750-762 doi: 10.17265/1548-6591/2014.09.003
Management of Megaproject During the Turbulent Period of
Economic and Political Transformation in Slovakia
Daniela Spirkova
Slovak University of Technology in Bratislava, Bratislava, Slovakia
Megaprojects have distinctive characters when compared with smaller construction projects. Cost overruns and
time delays are quite common. Risk management of such projects is quite complex, and many risks are not evident
at the beginning. We deal in detail with serious political risks that are quite strong especially in Central and Eastern
Europe. At the end, the author outlines the economic impact of the project as well as possible lessons that were
acquired during its realization. In the present paper, the author analyzes the process of completion of Units 3 and 4
of the nuclear power plant (NPP) in Mochovce—the largest megaproject ever realized in Slovakia. Large and
complex projects, especially highways, bridges, and NPPs are unique in that their construction ventures into the
jurisdictions of many other utilities and disciplines, and they tend to affect large industrial or commercial areas. As
such, they influence and get influenced by many stakeholders. Project managers who are not attentively interacting
the project environment are likely to face difficulties during planning and execution of their projects. Stakeholder
management is a major activity in projects. This is further emphasized when projects are large and complex by
nature.
Keywords: nuclear megaprojects, political environment, sustainability
Projects that can be characterized as “megaprojects” are large-scale investment projects, which costs are
worth more than 0.5 billion euros. The common denominator of megaprojects is an extreme difficulty of
technical, technological, financial, and social sphere as well as their long-term nature. Megaprojects bind
most of the government and private spending on infrastructure creation and successful implementation are
reflected in the income area of public finances, and at the same time, significantly affect the society as a
whole. During the past decade, megaprojects have had an enormous impact on the global economy and
the advancement of transition and developing countries. Research of megaprojects tends to focus on their
failures in terms of cost overruns, delays, and endemic stakeholder conflicts. However, there are also great
benefits that are associated with project development and implementation processes that are rarely discussed
(Greiman, 2013).
Other projects that cost less than 0.5 billion euros are sometimes also called megaprojects. In this case, it
depends on the location of the project. For example, a project in the amount of 0.3 billion euros in
The paper was prepared in the framework of COST Action TUD 1003—Megaproject: The Effective Design and Delivery of Megaprojects in the European Union.
Corresponding author: Daniela Spirkova, M.Sc., Ph.D., associate professor, Department of Real Estate Engineering, Institute of Management, Slovak University of Technology in Bratislava; research fields: real estate market, real estate financing, banking, corporate financing, and project management. E-mail: [email protected].
DAVID PUBLISHING
D
MANAGEMENT OF MEGAPROJECT DURING THE TURBULENT PERIOD
751
medium-sized city can also be considered as “mega”. Management of megaprojects with the specific
requirements for their construction and subsequent operation is very difficult. It means work for specialists,
who are led by project manager. Mitchell, Agle, and Wood (1997) suggest that power, legitimacy, and
urgency are key stakeholder characteristics. As such, a project manager is required to develop sufficient
understanding of such characteristics, which are in fact changing variables within the various stakeholders in
a project environment. The number and nature of stakeholders will vary with the life of the project
(Moodley, 2002).
Risk factors are significant. This is such a cost overrun—excess in the amount of 50% is normal, but an
excess of 100% is not uncommon.
One of the major determinants of large construction projects is determining the right area. It means for
example, the reconciliation of the investment plan and land use plan of the site, taking into account the tectonic
and seismic activity area, extreme meteorological conditions in the field, or if it is not a flood zone, a major
requirement may also be the presence of water source and other factors that could significantly affect total
value of future investments. In the following sections, the author will focus primarily on seismic risk factors,
floods, and extreme weather conditions (Spirkova, Ivanicka, & Urbanovsky, 2012). The construction of nuclear
power plants (NPPs) represents a lengthy process, which is very cost intensive. Non-stable economic and
political environment, the technological progress, the governmental decisions, and the activity of stakeholders
may be the source of serious uncertainties that can result in considerable delays and overruns of the project
costs of construction of the NPPs that by their scope represent the megaprojects. The growing requirements for
safety of the nuclear power station, the transformation of country to market economy, privatization, the
stakeholder attitudes, and transformation of the financial markets had impacted the project development of the
nuclear power blocks in the important way. While this situation is typical for majority of the countries which
build the NPPs in the world, the situation in the Central and Eastern Europe has its specifics because of the
realized economic transformation.
The project of completion of the third and fourth NPP in Mochovce, Slovakia is typical large-scale
investment megaproject costing more than 0.5 billion euros. As other megaprojects in Europe, it is extremely
complex and it has the long record of late delivery, frequent changes, and substantial cost overruns financed in
the large part from the public funds.
At the same time, the project has significant implications for society in Slovakia and Central Europe. The
completion of NPP enables to achieve the higher level of the self-sufficiency of power generation in Slovakia.
Successful project delivery will have major implication for new owner ENEL S.p.A. (Ente Nazionale per
l'energia ELettrica, Italy) and government finances as well. This completion is one of three NPPs currently
being built in EU (European Union):
(1) The third unit and fourth unit will be put into operation in 2015 and 2016, individually;
(2) Each unit output of 440 MWe;
(3) Non-nuclear part contractor: ENEL Ingenerate & Innovazione;
(4) Contractor of control and management system: Areva-Siemens;
(5) Up to 2/3 of work was carried by Slovak (local) companies;
(6) Communication strategy of the completion is based on transparency, and therefore more than 2/3 of
Slovak population and more than 87% of the population in the 10km zone around the plant support the
completion.
MANAGEMENT OF MEGAPROJECT DURING THE TURBULENT PERIOD
752
History of NPPs Construction as Important Megaprojects in Slovakia
The construction of the NPP started more than 50 years ago in Slovakia when the project of the first
research development pilot NPP named A1 was launched in 1958 and commissioned in Slovak village
Jaslovske Bohunice in 1972. A1 unit has been in operation from October 1972 to February 1977, since then, it
is in the process of decommissioning .
Later, another four nuclear power reactors of Voronezh type (V1 and V2) were built in the close distance
to A1 unit. Construction of V1 was launched in April 1972. The first unit of V1 was put into trial operation in
December 1978 and the second unit V1 in March 1980. On the basis of Government Resolution No. 801/1999
in accordance with the Treaty of Accession to the EU, the first unit V1 NPP was shut down on December 31,
2006, and the second unit was shut down on December 31 , 2008. V1 Nuclear Power Unit is currently in the I.
stage of decommissioning. Due to the expected deficit in the electric energy, it was decided to build two more
units of improved Voronezh type reactor VVER 440 Model 213 (V2). The construction of the third reactor V2
started in 19761.
The last one—a total of four units, is localized in Mochovce—in the South of Slovakia between towns
Nitra and Levice.
The Slovak Republic has decided to build a new NPP in the area of Jaslovske Bohunice in future, for
which new strategic construction partner will be Czech company CEZ. The value of investments should get
from four to six billion euros. Historical ties of Czech and Slovak nuclear energy and industry of both
countries are ones of the tightest among the whole Europe. Both building partners, JAVYS Company and
energy group CEZ are connected with a rich common past. Nuclear energy in Slovakia and the Czech
Republic has been built on a single nuclear program in the former Czechoslovakia. By that, Slovakia and
Czech Republic had a common energy system since 1993. Both countries built together a water pressurized
nuclear reactors (Jaslovske Bohunice, Dukovany, Temelin, and Mochovce) in their territories. Both countries
still have a similar mix of energy resources, legislative and regulatory environment, as well as ongoing
business and personal ties, which are attributes that can fully capitalize on the upcoming project of building a
new NPP.
Completion of NPP Mochovce—Units 3 and 4
Completion of the third and fourth unit of NPP Mochovce was planned in 2012 and 2013. This would be
the largest private investment in the history of Slovak Republic. Output of each unit will be 440 MWe.
Slovenske Elektrarne, a.s. (SE Inc.) began with the completion of Units 3 and 4 by formal opening of
construction works on November 3, 2008. The German, Italian, French, and Russian companies take part in this
process. Thus, the complex network of relations among stakeholders for completion of the NPP Mochovce was
established as shown on the following scheme (see Figure 1).
Cost Management Processes
The construction of NPP Mochovce was funded by state resources until 1991. By the end of 1991, about
19 billion euros of Czechoslovak crowns were invested into the project. In the early 90s, lack of resources
greatly influenced the construction of NPP Mochovce. The third and fourth units were reported to be only 40%
1 Materials of Slovak Nuclear Power Company.
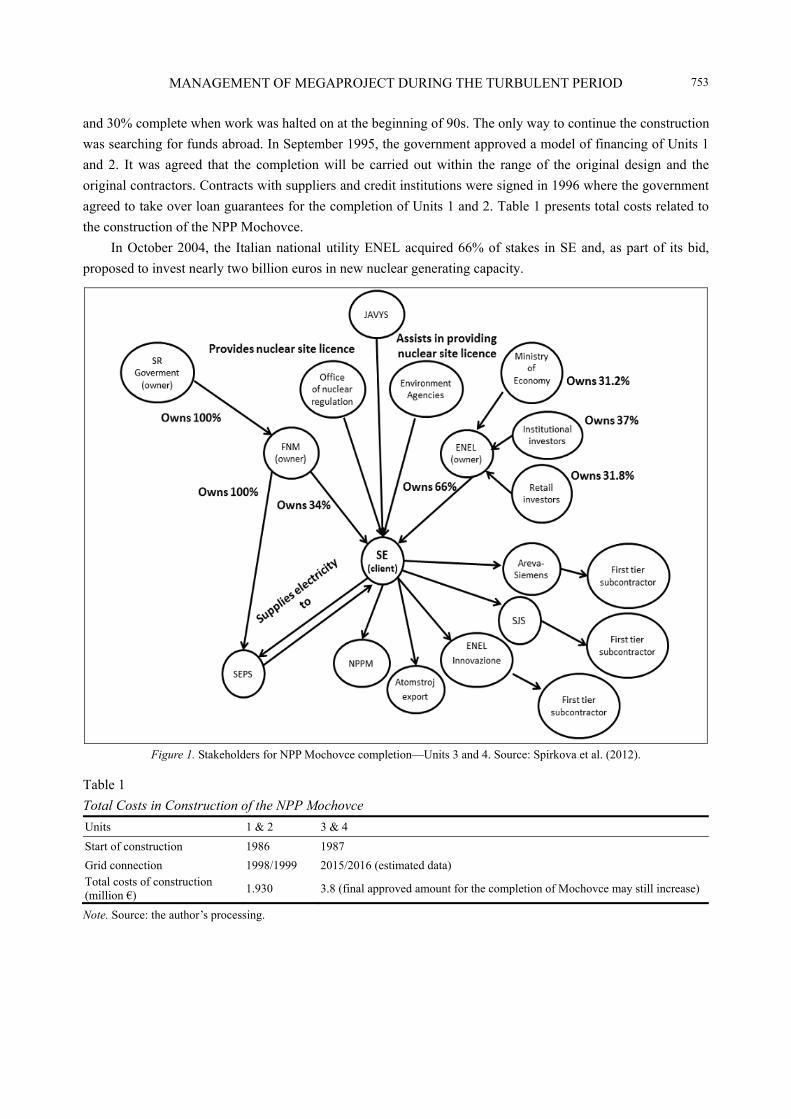
MANAGEMENT OF MEGAPROJECT DURING THE TURBULENT PERIOD
753
and 30% complete when work was halted on at the beginning of 90s. The only way to continue the construction
was searching for funds abroad. In September 1995, the government approved a model of financing of Units 1
and 2. It was agreed that the completion will be carried out within the range of the original design and the
original contractors. Contracts with suppliers and credit institutions were signed in 1996 where the government
agreed to take over loan guarantees for the completion of Units 1 and 2. Table 1 presents total costs related to
the construction of the NPP Mochovce.
In October 2004, the Italian national utility ENEL acquired 66% of stakes in SE and, as part of its bid,
proposed to invest nearly two billion euros in new nuclear generating capacity.
Figure 1. Stakeholders for NPP Mochovce completion—Units 3 and 4. Source: Spirkova et al. (2012).
Table 1
Total Costs in Construction of the NPP Mochovce
Units 1 & 2 3 & 4
Start of construction 1986 1987
Grid connection 1998/1999 2015/2016 (estimated data) Total costs of construction (million €)
1.930 3.8 (final approved amount for the completion of Mochovce may still increase)
Note. Source: the author’s processing.
MANAGEMENT OF MEGAPROJECT DURING THE TURBULENT PERIOD
754
In 2007, the feasibility study has been completed. The result was positive but the timescale to complete
NPP Mochovce 3 and 4 slipped. By 2007, the expected completion date was 2012 when the contracts
for completion were expected to be signed in mid-2008. Obtaining of finances became a problem. In 2007,
a consortium of nine banks agreed to provide ENEL/SE with 800 million euros “revolving credit” facility o
ver seven years. However, in 2008, under pressure from Greenpeace, three banks—ING Bank N.V., Banca
Intesa, and Erste Bank, refused to allow the credit facility to be used for the completion of Mochovce and
then projected of cost 1.7 billion euros. ENEL/SE was forced to make a statement that it would finance
completion of the plants from internally generated cash. The process was further delayed in September 2008
by a Slovak Government decision to require ENEL/SE to complete a new Environmental Impact
Assessment (EIA). As the consequence of the delays, some of the contractors have augmented their prices. The
European Commission also became concerned in May 2008 that the designs were not adequately safe. The
commission has expressed the concerns that the facility is not meeting the objectives of the Euratom Treaty,
“provided that the utility bring(s) the design in line with the existing best practices” including the
protection against external attack. Based on such opinion, the new safety measures were implemented. Not
long ago, Nuclear and Decommissioning Company of Slovakia (JAVYS) proposed to build another NPP unit
at Bohunice site, expected to come on line in 2020. As a result of that, a surplus of base-load power might
be available and this could force down the price ENEL/SE would receive for the output of NPP Mochovce
3 and 4. Such situation would mean the reduced profits or even losses for ENEL/SE. In 80s, the planned
cost of construction of Units 3 and 4 represented 1.3 billion euros. In 1992, construction works on the
completion of Units 3 and 4 were stopped. One reason was the lack of funds. The construction work of
Units 3 and 4 were recommenced in 2007, which raised the costs to 3.4 billion euros. At that time, it was
expected that the completion of Mochovce NPP—Units 3 and 4 will cost three billion euros, where the
equity financing would represent 2.2 billion euros and 500 million euros will come from foreign sources. Since
the financial performance of the SE was at that time positive, the equity financing seemed to be a good
option. When ENEL took over SE, the forecast completion date for the reactors was 2011-2012. ENEL was
expected to finalize a feasibility study in April 2007 and then to take a final decision whether it would invest in
the units.
Impact of Fukushima Accident on the Completion of Mochovce Power Plant
The challenges which nuclear safety and its governance face were highlighted in the accident at the
Fukushima reactors in Japan which happened because of the earthquake and the tsunami in March 2011.
Fukushima accident on March 2011 was a series of equipment failures, nuclear meltdowns, and release of
radioactive materials at the Fukushima NPP. The results from the accident have shown that nuclear
reactors must be protected even against accidents, which have been assessed as highly improbable. The most
important reasons of the Fukushima accident were the faulty design, insufficient backup systems, human
factor failure, inadequate contingency plans, and poor communications. The EU reacted on Fukushima
accident by ordering the comprehensive and transparent risk and safety assessment (“stress tests”) and proposed
any improvements by the end of 2011 that may be necessary. Although based on the stress tests, national
regulators concluded that there are no technical reasons requiring the shutdown of any NPP in Europe,
nevertheless, practically all NPPs are expected to undergo safety improvements, as hundreds of technical
upgrade measures have been identified. These measures include additional mobile equipment to prevent or
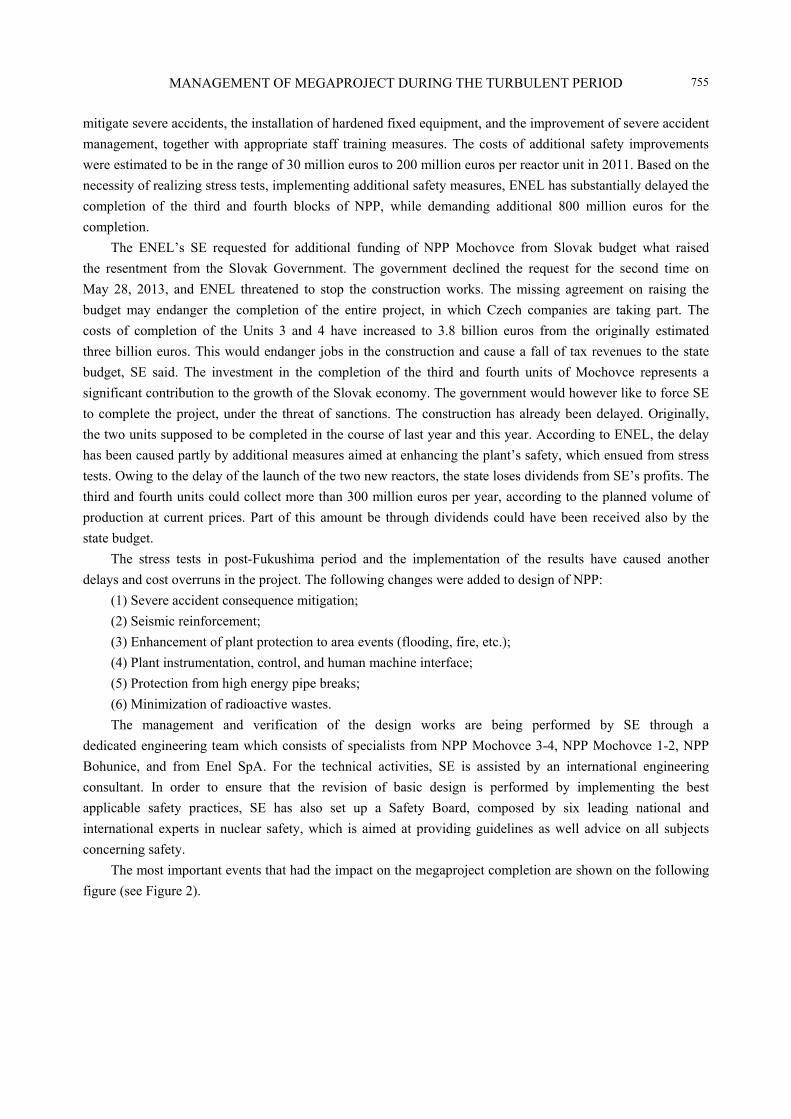
MANAGEMENT OF MEGAPROJECT DURING THE TURBULENT PERIOD
755
mitigate severe accidents, the installation of hardened fixed equipment, and the improvement of severe accident
management, together with appropriate staff training measures. The costs of additional safety improvements
were estimated to be in the range of 30 million euros to 200 million euros per reactor unit in 2011. Based on the
necessity of realizing stress tests, implementing additional safety measures, ENEL has substantially delayed the
completion of the third and fourth blocks of NPP, while demanding additional 800 million euros for the
completion.
The ENEL’s SE requested for additional funding of NPP Mochovce from Slovak budget what raised
the resentment from the Slovak Government. The government declined the request for the second time on
May 28, 2013, and ENEL threatened to stop the construction works. The missing agreement on raising the
budget may endanger the completion of the entire project, in which Czech companies are taking part. The
costs of completion of the Units 3 and 4 have increased to 3.8 billion euros from the originally estimated
three billion euros. This would endanger jobs in the construction and cause a fall of tax revenues to the state
budget, SE said. The investment in the completion of the third and fourth units of Mochovce represents a
significant contribution to the growth of the Slovak economy. The government would however like to force SE
to complete the project, under the threat of sanctions. The construction has already been delayed. Originally,
the two units supposed to be completed in the course of last year and this year. According to ENEL, the delay
has been caused partly by additional measures aimed at enhancing the plant’s safety, which ensued from stress
tests. Owing to the delay of the launch of the two new reactors, the state loses dividends from SE’s profits. The
third and fourth units could collect more than 300 million euros per year, according to the planned volume of
production at current prices. Part of this amount be through dividends could have been received also by the
state budget.
The stress tests in post-Fukushima period and the implementation of the results have caused another
delays and cost overruns in the project. The following changes were added to design of NPP:
(1) Severe accident consequence mitigation;
(2) Seismic reinforcement;
(3) Enhancement of plant protection to area events (flooding, fire, etc.);
(4) Plant instrumentation, control, and human machine interface;
(5) Protection from high energy pipe breaks;
(6) Minimization of radioactive wastes.
The management and verification of the design works are being performed by SE through a
dedicated engineering team which consists of specialists from NPP Mochovce 3-4, NPP Mochovce 1-2, NPP
Bohunice, and from Enel SpA. For the technical activities, SE is assisted by an international engineering
consultant. In order to ensure that the revision of basic design is performed by implementing the best
applicable safety practices, SE has also set up a Safety Board, composed by six leading national and
international experts in nuclear safety, which is aimed at providing guidelines as well advice on all subjects
concerning safety.
The most important events that had the impact on the megaproject completion are shown on the following
figure (see Figure 2).
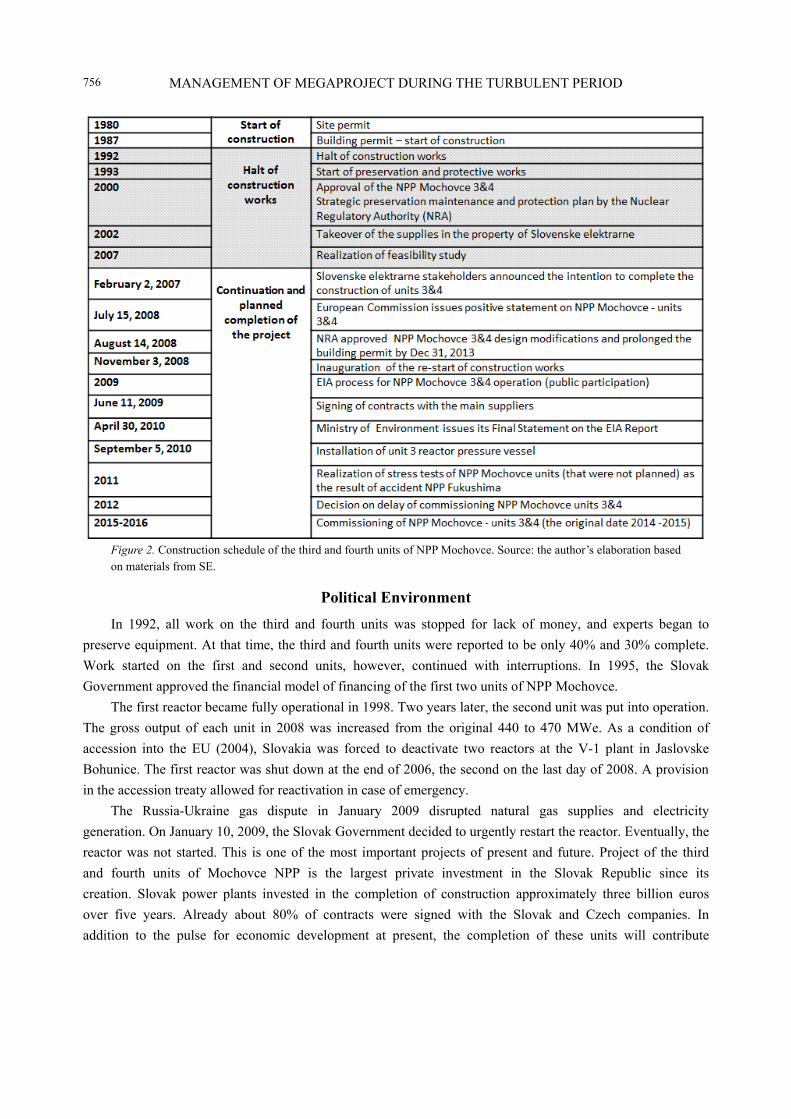
MANAGEMENT OF MEGAPROJECT DURING THE TURBULENT PERIOD
756
Figure 2. Construction schedule of the third and fourth units of NPP Mochovce. Source: the author’s elaboration based on materials from SE.
Political Environment
In 1992, all work on the third and fourth units was stopped for lack of money, and experts began to
preserve equipment. At that time, the third and fourth units were reported to be only 40% and 30% complete.
Work started on the first and second units, however, continued with interruptions. In 1995, the Slovak
Government approved the financial model of financing of the first two units of NPP Mochovce.
The first reactor became fully operational in 1998. Two years later, the second unit was put into operation.
The gross output of each unit in 2008 was increased from the original 440 to 470 MWe. As a condition of
accession into the EU (2004), Slovakia was forced to deactivate two reactors at the V-1 plant in Jaslovske
Bohunice. The first reactor was shut down at the end of 2006, the second on the last day of 2008. A provision
in the accession treaty allowed for reactivation in case of emergency.
The Russia-Ukraine gas dispute in January 2009 disrupted natural gas supplies and electricity
generation. On January 10, 2009, the Slovak Government decided to urgently restart the reactor. Eventually, the
reactor was not started. This is one of the most important projects of present and future. Project of the third
and fourth units of Mochovce NPP is the largest private investment in the Slovak Republic since its
creation. Slovak power plants invested in the completion of construction approximately three billion euros
over five years. Already about 80% of contracts were signed with the Slovak and Czech companies. In
addition to the pulse for economic development at present, the completion of these units will contribute
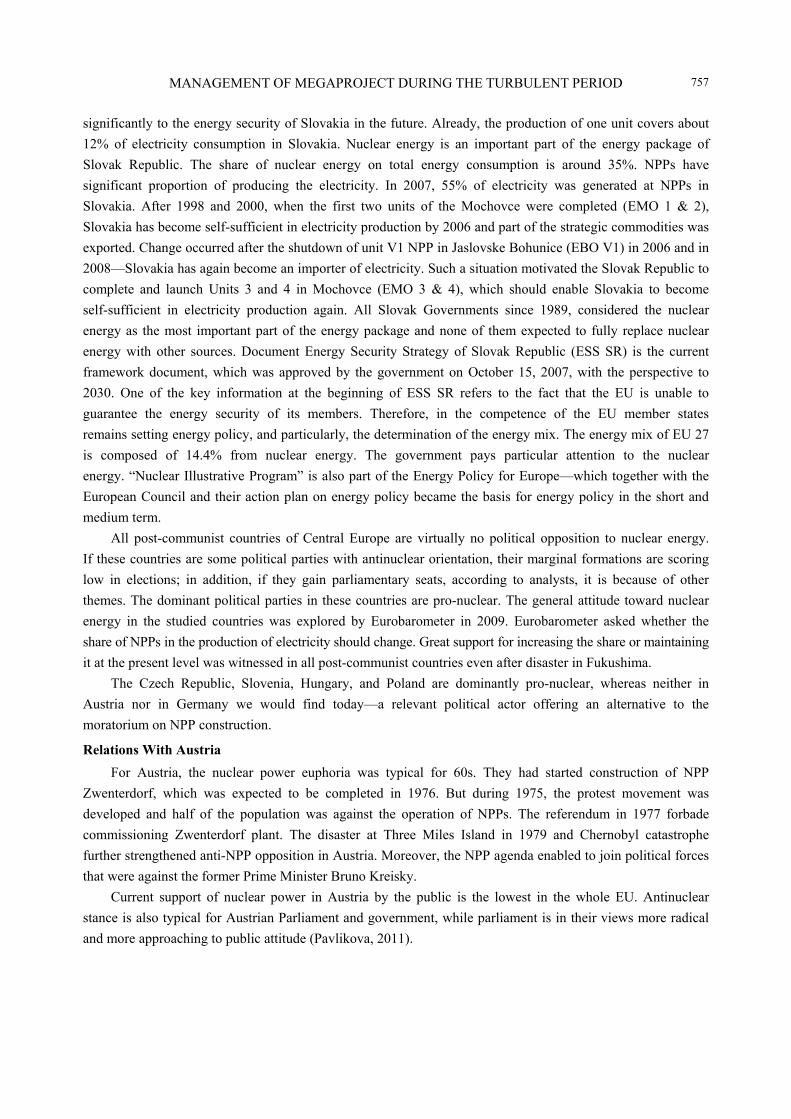
MANAGEMENT OF MEGAPROJECT DURING THE TURBULENT PERIOD
757
significantly to the energy security of Slovakia in the future. Already, the production of one unit covers about
12% of electricity consumption in Slovakia. Nuclear energy is an important part of the energy package of
Slovak Republic. The share of nuclear energy on total energy consumption is around 35%. NPPs have
significant proportion of producing the electricity. In 2007, 55% of electricity was generated at NPPs in
Slovakia. After 1998 and 2000, when the first two units of the Mochovce were completed (EMO 1 & 2),
Slovakia has become self-sufficient in electricity production by 2006 and part of the strategic commodities was
exported. Change occurred after the shutdown of unit V1 NPP in Jaslovske Bohunice (EBO V1) in 2006 and in
2008—Slovakia has again become an importer of electricity. Such a situation motivated the Slovak Republic to
complete and launch Units 3 and 4 in Mochovce (EMO 3 & 4), which should enable Slovakia to become
self-sufficient in electricity production again. All Slovak Governments since 1989, considered the nuclear
energy as the most important part of the energy package and none of them expected to fully replace nuclear
energy with other sources. Document Energy Security Strategy of Slovak Republic (ESS SR) is the current
framework document, which was approved by the government on October 15, 2007, with the perspective to
2030. One of the key information at the beginning of ESS SR refers to the fact that the EU is unable to
guarantee the energy security of its members. Therefore, in the competence of the EU member states
remains setting energy policy, and particularly, the determination of the energy mix. The energy mix of EU 27
is composed of 14.4% from nuclear energy. The government pays particular attention to the nuclear
energy. “Nuclear Illustrative Program” is also part of the Energy Policy for Europe—which together with the
European Council and their action plan on energy policy became the basis for energy policy in the short and
medium term.
All post-communist countries of Central Europe are virtually no political opposition to nuclear energy.
If these countries are some political parties with antinuclear orientation, their marginal formations are scoring
low in elections; in addition, if they gain parliamentary seats, according to analysts, it is because of other
themes. The dominant political parties in these countries are pro-nuclear. The general attitude toward nuclear
energy in the studied countries was explored by Eurobarometer in 2009. Eurobarometer asked whether the
share of NPPs in the production of electricity should change. Great support for increasing the share or maintaining
it at the present level was witnessed in all post-communist countries even after disaster in Fukushima.
The Czech Republic, Slovenia, Hungary, and Poland are dominantly pro-nuclear, whereas neither in
Austria nor in Germany we would find today—a relevant political actor offering an alternative to the
moratorium on NPP construction.
Relations With Austria
For Austria, the nuclear power euphoria was typical for 60s. They had started construction of NPP
Zwenterdorf, which was expected to be completed in 1976. But during 1975, the protest movement was
developed and half of the population was against the operation of NPPs. The referendum in 1977 forbade
commissioning Zwenterdorf plant. The disaster at Three Miles Island in 1979 and Chernobyl catastrophe
further strengthened anti-NPP opposition in Austria. Moreover, the NPP agenda enabled to join political forces
that were against the former Prime Minister Bruno Kreisky.
Current support of nuclear power in Austria by the public is the lowest in the whole EU. Antinuclear
stance is also typical for Austrian Parliament and government, while parliament is in their views more radical
and more approaching to public attitude (Pavlikova, 2011).
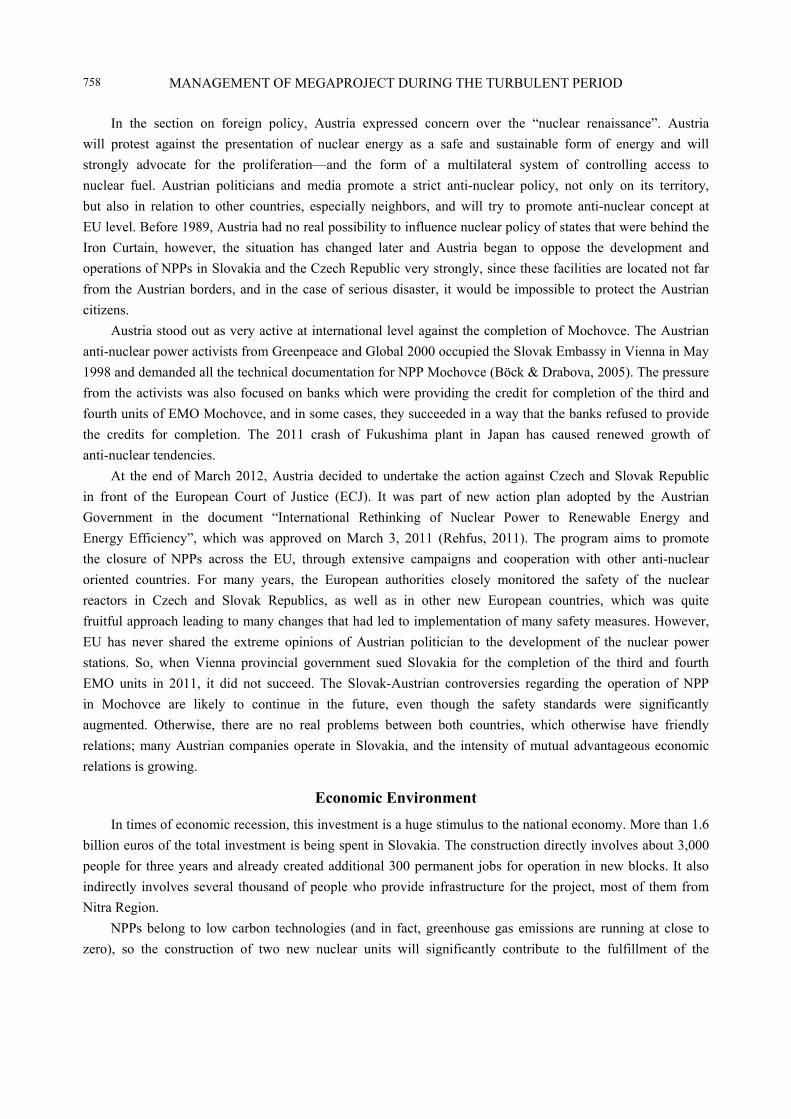
MANAGEMENT OF MEGAPROJECT DURING THE TURBULENT PERIOD
758
In the section on foreign policy, Austria expressed concern over the “nuclear renaissance”. Austria
will protest against the presentation of nuclear energy as a safe and sustainable form of energy and will
strongly advocate for the proliferation—and the form of a multilateral system of controlling access to
nuclear fuel. Austrian politicians and media promote a strict anti-nuclear policy, not only on its territory,
but also in relation to other countries, especially neighbors, and will try to promote anti-nuclear concept at
EU level. Before 1989, Austria had no real possibility to influence nuclear policy of states that were behind the
Iron Curtain, however, the situation has changed later and Austria began to oppose the development and
operations of NPPs in Slovakia and the Czech Republic very strongly, since these facilities are located not far
from the Austrian borders, and in the case of serious disaster, it would be impossible to protect the Austrian
citizens.
Austria stood out as very active at international level against the completion of Mochovce. The Austrian
anti-nuclear power activists from Greenpeace and Global 2000 occupied the Slovak Embassy in Vienna in May
1998 and demanded all the technical documentation for NPP Mochovce (Böck & Drabova, 2005). The pressure
from the activists was also focused on banks which were providing the credit for completion of the third and
fourth units of EMO Mochovce, and in some cases, they succeeded in a way that the banks refused to provide
the credits for completion. The 2011 crash of Fukushima plant in Japan has caused renewed growth of
anti-nuclear tendencies.
At the end of March 2012, Austria decided to undertake the action against Czech and Slovak Republic
in front of the European Court of Justice (ECJ). It was part of new action plan adopted by the Austrian
Government in the document “International Rethinking of Nuclear Power to Renewable Energy and
Energy Efficiency”, which was approved on March 3, 2011 (Rehfus, 2011). The program aims to promote
the closure of NPPs across the EU, through extensive campaigns and cooperation with other anti-nuclear
oriented countries. For many years, the European authorities closely monitored the safety of the nuclear
reactors in Czech and Slovak Republics, as well as in other new European countries, which was quite
fruitful approach leading to many changes that had led to implementation of many safety measures. However,
EU has never shared the extreme opinions of Austrian politician to the development of the nuclear power
stations. So, when Vienna provincial government sued Slovakia for the completion of the third and fourth
EMO units in 2011, it did not succeed. The Slovak-Austrian controversies regarding the operation of NPP
in Mochovce are likely to continue in the future, even though the safety standards were significantly
augmented. Otherwise, there are no real problems between both countries, which otherwise have friendly
relations; many Austrian companies operate in Slovakia, and the intensity of mutual advantageous economic
relations is growing.
Economic Environment
In times of economic recession, this investment is a huge stimulus to the national economy. More than 1.6
billion euros of the total investment is being spent in Slovakia. The construction directly involves about 3,000
people for three years and already created additional 300 permanent jobs for operation in new blocks. It also
indirectly involves several thousand of people who provide infrastructure for the project, most of them from
Nitra Region.
NPPs belong to low carbon technologies (and in fact, greenhouse gas emissions are running at close to
zero), so the construction of two new nuclear units will significantly contribute to the fulfillment of the
MANAGEMENT OF MEGAPROJECT DURING THE TURBULENT PERIOD
759
commitment of Slovakia to reduce CO2 emissions by 2020. Each reactor VVER 440 will save about 3.7 million
tons of CO2 each year. Otherwise, this greenhouse gas will flow to air from coal-fired power plants.
Based on the document ESS SR, the final consumption of electricity represents about 20.7% share of total
energy consumption and until 2030 is expected to rise to 22.8%. This increase is consistent with the expected
growth of the economy, while reducing the energy consumption. In connection with this fact, it is quite a
significant factor in the expected increase in energy prices. Production costs of nuclear energy in comparison
with coal and gas resources are less sensitive to price changes. This is mainly because of the sufficient number
of world’s uranium deposits and it is possible to diversify the vendors.
From an economic point of view, it is important to know that equivalent amount of heat contained in coal
is seven to eight times more expensive than nuclear fuel. Price of brown coal is 11 times more expensive and
price of natural gas is 20 times more expensive than the nuclear energy. The operation of NPP is therefore at
least in economic terms more favorable than production of electricity from brown coal or fossil fuels, although
the initial investment is much higher. The strategy also keeps in mind the possibility that the price of uranium
will grow dynamically in the future and the privileged position will be given to countries that have this
material.
In this case, the government of Slovak Republic does not exclude the possibility of restart of mining
uranium in Jahodna localities, Novoveska Huta, Kluknava, and Kalnica-Selec. This policy is also linked the
necessity of amending the relevant laws and strategic documents, allowing for maximum protection of the
environment. Another rather significant fact is that the uranium is not imported from politically unstable
countries, and it is possible to buy and maintain stocks for a longer period than in case of oil or gas. All these
factors speak in favor of using more nuclear energy and to plan and build additional NPPs from economic and
political point of view.
A major factor for the regional development is completion of the first and second blocks of nuclear plant
Mochovce, which meant influx of young people—nuclear experts—in this region, which was initially strongly
agricultural. Construction of Mochovce brought directly or indirectly induced investments (e.g., new hospital in
Levice, construction of new flats, as well as all related services and infrastructure). Construction of the third
and fourth blocks also means new job opportunities for people from the region, as well as from more distant
parts of Slovakia or abroad.
Due to the closure of two old nuclear units at Bohunice (V1) between 2006 and 2008 (due to the political
decision taken during the pre-accession negotiations with the EU Treaty), Slovakia stopped to export the
electricity and has become the importer of electricity. The total production capacity of NPP in Slovakia
decreased by 880 MWe. Such conditions will continue to run until an adequate additional capacity is put into
operation. Considering the current state and potential viability of new investments, Mochovce 3 and 4 will be
probably the only equivalent for replacing closed plants. Based on the current construction schedule of
Mochovce 3 and 4, Slovakia will be dependent on importing electricity until at least 2015. Electricity which
will come from Mochovce 3 and 4 would be sufficient for Slovakia to be a minor exporter in the period from
2015 to 2019. It is expected that in the medium term some additional new project will be implemented which
will have capacity of about 400 MWe and with this output, the export capacity of Slovakia will increase.
Sustainability
The new production capacity in Mochovce will become the next great stabilizing element in
MANAGEMENT OF MEGAPROJECT DURING THE TURBULENT PERIOD
760
Slovak energy system and it guarantees stable and secure supply of electricity. Placing the third and fourth
blocks of Mochovce into operation in 2013 will replace fossil fuel burning in the central region of Slovakia. It
is expected that this would reduce the volatility of electricity prices for households and industry in the Slovak
market.
SE invests more than 3.8 billion euros in the construction of Mochovce NPP Units 3 and 4.
Further investments were concluded with the modernization and power up-rate of existing units in
Jaslovske Bohunice NPP (EUR 0.5 billion) and Mochovce NPP power up-rate. The strategic plan involves also
full hydro power plant automation and modernization of the existing hydro units, introduction of biomass in the
fleet of thermal power plants (Vojany and Novaky), and development of renewable—mainly photovoltaic and
small hydro power plants.
Conclusions
It is expected that the completion of NPP Mochovce would have the significant local and global economic
impact on:
(1) Stabilizing economy and economic growth;
(2) New working opportunities and indirect impact on community development;
(3) Increase of tax revenues for municipalities;
(4) Reduction of negative environmental impact and efficiency increase;
(5) Company SE EMO 3 and 4 as independent power producer (IPP) can be successfully designed and
financed as sole project;
(6) The preliminary calculates internal rate of return (IRR) of the project which was around 18.61% for the
whole life cycle of the project/40 years.
The new production capacity in NPP Mochovce will become the next great stabilizing element in Slovak
energy system and it guarantees stable and secure supply of electricity.
The expected benefits are high enough. The paper also shows the difficulties of completion of the
nuclear power megaproject in the Central Europe during the period of technological changes, political shifts,
economic transition, and economic cycles. Such events as the shifts from public to private financing, the
establishment of the sovereign state of Slovakia, development of the Slovak Government, EU accession and
frequently changing power relations could hardly be without any consequences on the cost and project
completion schedule.
Several lessons could be learnt from following:
Such megaprojects need very strong and intelligent political support during the turbulent times. This is not
easy to achieve in the situation when the political and public servants elites frequently change.
The NPP Mochovce megaproject represents certain form of private-public partnership in which the risk
should be distributed among the partners by using legal, economic, managerial, and other instruments. These
instruments are often not very well known in public sector in Central European transition countries and
megaprojects of this size and purpose have to face with some of the risks such as the impact of Fukushima
accident or referendum on construction of NPPs in Italy on the completion of Mochovce. Power plants in
Slovakia are not easy to be predicted and they can hardly be eliminated without substantial cost and time
overruns. Moreover, it is quite difficult to deal with the environmentalist groups, such as Greenpeace or the
groups representing anti-nuclear power stance in the adjacent countries. In fact, these groups have been able to
MANAGEMENT OF MEGAPROJECT DURING THE TURBULENT PERIOD
761
undermine the credit agreement with the consortia of foreign banks that would help to accelerate the
completion. Also, the understanding of the motivation (real and hidden) of the engaged stakeholders is the
necessity for the progress of the project.
Even though the realized feasibility study (in 2007) for the completion of the NPP Mochovce revealed the
substantial positive economic effect for Slovakia including the self-sufficiency of Slovakia in the energy
production, yet the real outcomes will be lower than predicted because of the realization of many unpredicted
events.
Project management of megaproject in the future would probably require to realize the scenario analysis
which might help to some extent forecast the possible positive as well as negative features in the future
that can help to prepare the alternative strategies for the finishing of the project. In practice, it is
difficult to achieve, since there is the tendency to show the positive events, which support the acceptance
of the project, while negative scenarios may undermine the starting of the project, throwing it into
serious doubt concerning its feasibility. Such exercise might be useful for the preparation of better contracts, it
can be helpful in negotiations with stakeholder, and finally, it may enable the more efficient sharing of the
risks.
References 50 years of nuclear power plants in Slovakia. (2007). JAVYS and SE, Inc., Slovakia.
Areva and Siemens will supply the systems for Mochovce. (2010). Retrieved from http://ekonomika/areva-a-siemens-
dodaju-systemy-pre-moc/121881-clanok.html
Atoms in Slovakia. (2006). Slovak Nuclear Society (SNUS).
BBC News Business 18. (2011). Siemens to quit nuclear industry. Retrieved from http://www.bbc.co.uk/news/business
-14963575
Böck, H., & Drabova, D. (2005). Transboundary risks: The Temelin case. Retrieved from http://www.csvts.cz/cns/news05/
temcas05.htm
ENEL Annual Report 2011. (2012). SE, Inc.
ENEL Annual Report 2012. (2013). SE, Inc.
Freeman, R. E. (1984). Strategic management: A stakeholder approach (p. 46). Boston, M.A.: Pitman Press.
Greiman, V. A. (2013). Megaproject management: Lessons on risk and project management from the Big Dig. New Jersey, USA:
John Wiley & Sons, Inc.
History of project. (2012). SE, Inc. Retrieved from http://www.seas.sk/sk/elektrarne/projekty/mochovce-3-4/mochovce34-historia
Mitchell, R. K., Agle, B. R., & Wood, D. J. (1997). Toward a theory of stakeholder identification and salience: Defining the
principle of who and what really counts. Academy of Management Review, 22(4), 853-886.
Mohammed, B. A. A. (2007). Risk and stakeholder management in mega projects. Retrieved from http://www.works.gov.bh
Moodley, K. (2002). Project stakeholders, engineering project management (2nd ed., pp. 127-136). N. J. Smith, (Ed.). UK:
Blackwell Publishers Ltd.
Nucleus in the energy mix. Nuclear power plant Mochovce. (2010). SE, Inc. Infocenter NPP Mochovce, Slovakia.
Pavlikova, M. (2011). Politics of nuclear energetics of Czech and Slovak Republics and its influence on mutual relationships with
Austria. Faculty of Economics and Administration, Masaryk University, Czech Republic.
Rehfus, H. (2011). UN-resolution “climate change by radioactivity” urgent call for global action. Retrieved from
http://solarpeace.ch/solarpeace/E/20090807_ClimateChangeByRadioactivity.htm#Austria
Report on environmental impact for units 3 and 4 of NPP Mochovce. (2009). SE, Inc.
Savage, G. T., Whitehead, C. J., Nix, T. W., & Blair, J. D. (1991). Strategies for assessing and managing organizational
stakeholders. New York: Publisher Academy of Management.
Slovak Nuclear Power Company. (2009-2014). History of nuclear power plants in Slovak Republic and Czech
Republic.

MANAGEMENT OF MEGAPROJECT DURING THE TURBULENT PERIOD
762
Spirkova, D., Ivanicka, K., & Urbanovsky, T. (2012). Management of megaprojects—Impact of selected risk factors on construction and operation. Terra Spectra—Central European Journal of Spatial and Landscape Planning, 4(2), 38-42.
Study of environmental impact of Mochovce units 3 and 4. (2007). Golder Associates. The history of Siemens—From workshop to global player. Retrieved from http://www.siemens.com/about/en/history.htm The National Property Fund of the Slovak Republic. (2011). The annual report of the National Property Fund of the Slovak
Republic 2010. Bratislava, Slovakia.
Journal of US-China Public Administration, September 2014, Vol. 11, No. 9, 763-772 doi: 10.17265/1548-6591/2014.09.004
Determinants of FDI Into Turkey: A Componentwise Analysis
Burçak Polat
Eastern Mediterranean University, Famagusta, Turkish Republic of Northern Cyprus (TRNC)
For two decades, the questions of what really motivates foreign investors to invest in a certain country remain
unanswered and a controversial issue. Moreover, previous studies have overwhelmingly treated FDI (foreign direct
investment) as unidimensional rather than multidimensional. In reality, FDI is rather multidimensional in that it is
composed of components (equity capital, reinvested earnings, and other capital), each with its intrinsic
characteristics in response to the same economic fundamentals, such as growth, institutional quality, exchange rate,
taxes, market size, skill abundance, etc. Therefore, the main objective of this study was to seek the major
determinants of the total FDI inflows in Turkey by treating total FDI as multidimensional to avoid a distorted
empirical prediction concerning the total FDI, which is greatly neglected in the FDI literature. Accordingly, the
author employed the panel corrected standard error (PCSE) model for annual data between 2003 and 2012, he
found that FDIs are responsive to the country risk (CR) indices of both Turkey and EU (European Union) and to the
tax measures of 2006.
Keywords: FDI (foreign direct investment), reinvested earnings, other capital, equity capital
International trade and foreign direct investment (FDI) flows stand out as the fastest-growing economic
activities in the global environment in the last two decades. A critical analysis of global FDI flows data issued
by UNCTAD (United Nations Conference on Trade and Development) (2008) announced that global FDI
inflows have increased gradually over the years and reached a peak level of $1,833 billion in 2007, with a 30%
increase. Despite the growing interest in FDI inflows, the major reasons behind foreign investors seeking a
country in which to invest and the uneven spatial distribution of FDI across countries are still an unanswered
question in both the theoretical and the empirical international business (IB) literature. An apparent consensus
in the extant literature reveals that previous studies have primarily focused their attention on the independent
explanatory variables rather than questioning the nature of FDI. Hence, as Oseghale and Nwachukwu (2010)
noted, “It is not surprising that FDI has been operationalized in prior literature as a monolithic variable rather
than a multidimensional one”. However, FDI consists of three main components (new equity, reinvested
earnings, and inter-company debt flows), each component has its own determining factor so that the
components may react differently to the same macroeconomic variables. This argument has been also justified
greatly by the study by Lundan (2006) on the determinants of reinvested earnings as sub-components of FDI.
She noted that “Reinvested earnings are the only major component of foreign investment position that
originates in the host country, rather than being transferred from the home country”. It means that while the
other components of FDI involve a cross-border transfer of funds, reinvested earnings are the only
Corresponding author: Burçak Polat, Ph.D. candidate, Department of Economics, Faculty of Business and Economics,
Eastern Mediterranean University; research fields: international economics, micro-economics, and macro-economics. E-mail: [email protected].
DAVID PUBLISHING
D
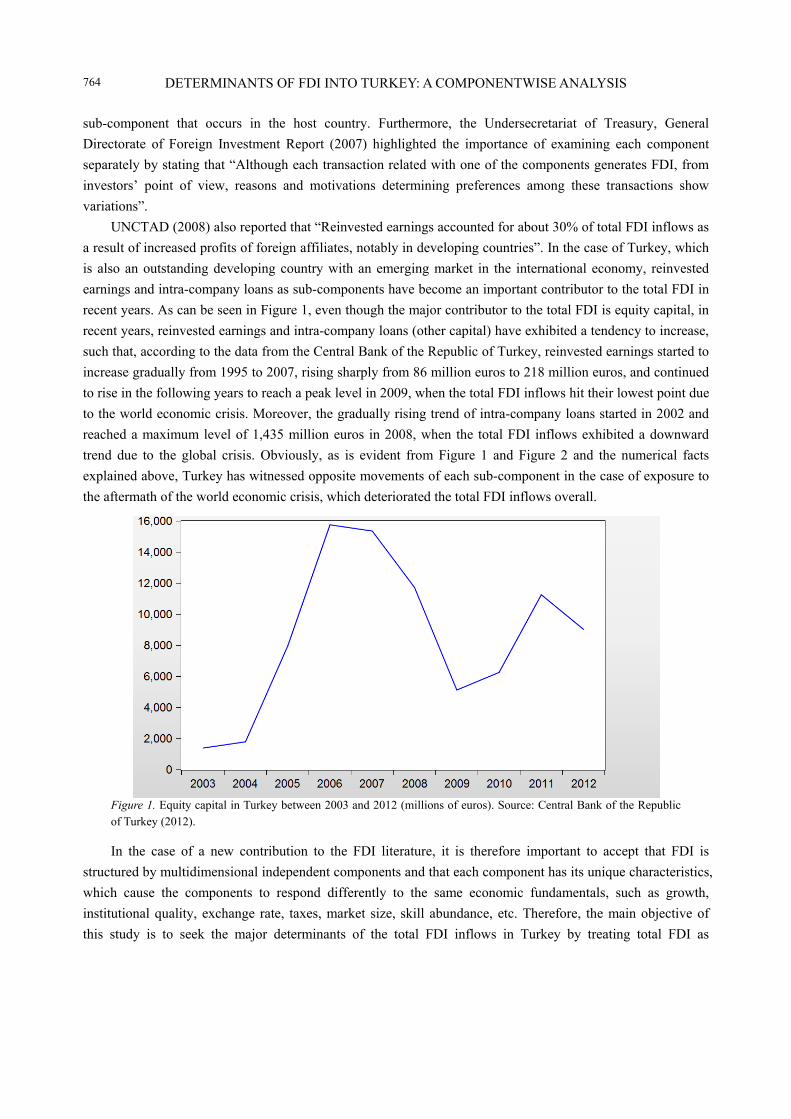
DETERMINANTS OF FDI INTO TURKEY: A COMPONENTWISE ANALYSIS
764
sub-component that occurs in the host country. Furthermore, the Undersecretariat of Treasury, General
Directorate of Foreign Investment Report (2007) highlighted the importance of examining each component
separately by stating that “Although each transaction related with one of the components generates FDI, from
investors’ point of view, reasons and motivations determining preferences among these transactions show
variations”.
UNCTAD (2008) also reported that “Reinvested earnings accounted for about 30% of total FDI inflows as
a result of increased profits of foreign affiliates, notably in developing countries”. In the case of Turkey, which
is also an outstanding developing country with an emerging market in the international economy, reinvested
earnings and intra-company loans as sub-components have become an important contributor to the total FDI in
recent years. As can be seen in Figure 1, even though the major contributor to the total FDI is equity capital, in
recent years, reinvested earnings and intra-company loans (other capital) have exhibited a tendency to increase,
such that, according to the data from the Central Bank of the Republic of Turkey, reinvested earnings started to
increase gradually from 1995 to 2007, rising sharply from 86 million euros to 218 million euros, and continued
to rise in the following years to reach a peak level in 2009, when the total FDI inflows hit their lowest point due
to the world economic crisis. Moreover, the gradually rising trend of intra-company loans started in 2002 and
reached a maximum level of 1,435 million euros in 2008, when the total FDI inflows exhibited a downward
trend due to the global crisis. Obviously, as is evident from Figure 1 and Figure 2 and the numerical facts
explained above, Turkey has witnessed opposite movements of each sub-component in the case of exposure to
the aftermath of the world economic crisis, which deteriorated the total FDI inflows overall.
Figure 1. Equity capital in Turkey between 2003 and 2012 (millions of euros). Source: Central Bank of the Republic of Turkey (2012).
In the case of a new contribution to the FDI literature, it is therefore important to accept that FDI is
structured by multidimensional independent components and that each component has its unique characteristics,
which cause the components to respond differently to the same economic fundamentals, such as growth,
institutional quality, exchange rate, taxes, market size, skill abundance, etc. Therefore, the main objective of
this study is to seek the major determinants of the total FDI inflows in Turkey by treating total FDI as
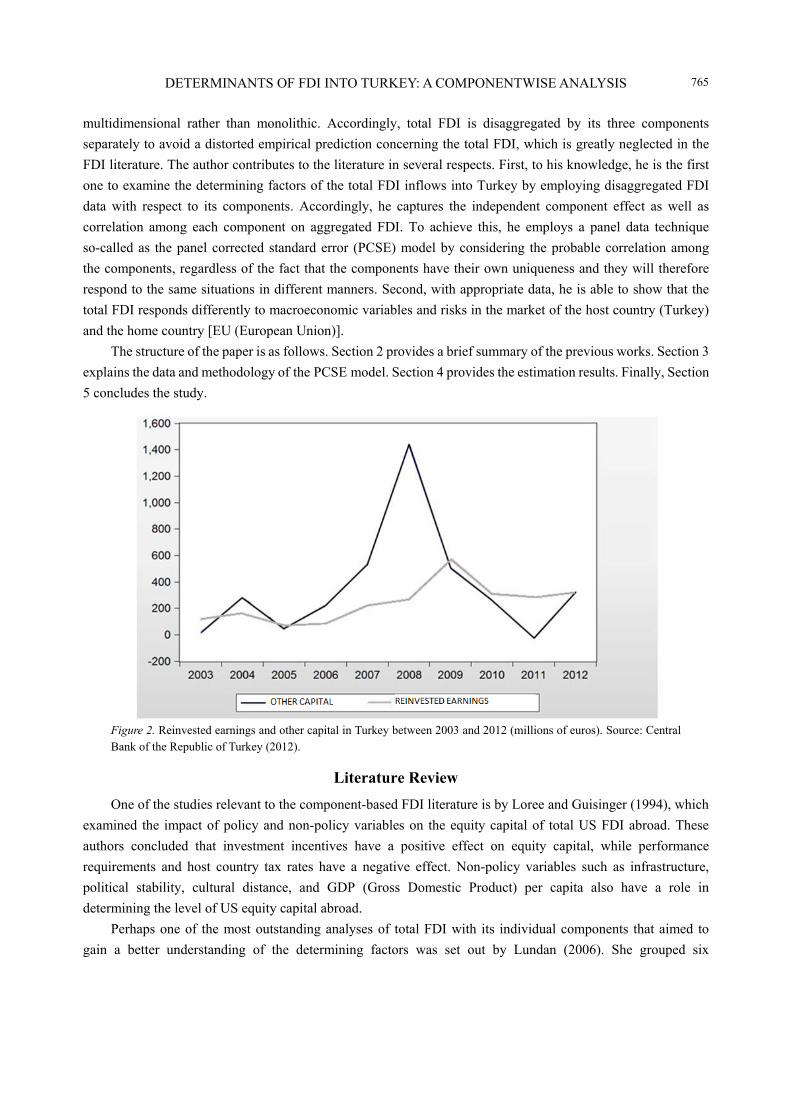
DETERMINANTS OF FDI INTO TURKEY: A COMPONENTWISE ANALYSIS
765
multidimensional rather than monolithic. Accordingly, total FDI is disaggregated by its three components
separately to avoid a distorted empirical prediction concerning the total FDI, which is greatly neglected in the
FDI literature. The author contributes to the literature in several respects. First, to his knowledge, he is the first
one to examine the determining factors of the total FDI inflows into Turkey by employing disaggregated FDI
data with respect to its components. Accordingly, he captures the independent component effect as well as
correlation among each component on aggregated FDI. To achieve this, he employs a panel data technique
so-called as the panel corrected standard error (PCSE) model by considering the probable correlation among
the components, regardless of the fact that the components have their own uniqueness and they will therefore
respond to the same situations in different manners. Second, with appropriate data, he is able to show that the
total FDI responds differently to macroeconomic variables and risks in the market of the host country (Turkey)
and the home country [EU (European Union)].
The structure of the paper is as follows. Section 2 provides a brief summary of the previous works. Section 3
explains the data and methodology of the PCSE model. Section 4 provides the estimation results. Finally, Section
5 concludes the study.
Figure 2. Reinvested earnings and other capital in Turkey between 2003 and 2012 (millions of euros). Source: Central Bank of the Republic of Turkey (2012).
Literature Review
One of the studies relevant to the component-based FDI literature is by Loree and Guisinger (1994), which
examined the impact of policy and non-policy variables on the equity capital of total US FDI abroad. These
authors concluded that investment incentives have a positive effect on equity capital, while performance
requirements and host country tax rates have a negative effect. Non-policy variables such as infrastructure,
political stability, cultural distance, and GDP (Gross Domestic Product) per capita also have a role in
determining the level of US equity capital abroad.
Perhaps one of the most outstanding analyses of total FDI with its individual components that aimed to
gain a better understanding of the determining factors was set out by Lundan (2006). She grouped six
DETERMINANTS OF FDI INTO TURKEY: A COMPONENTWISE ANALYSIS
766
explanatory factors of reinvested earnings into three categories:
(1) Those encouraging reinvestment: These factors related to possible good investment opportunities have
a positive effect on the decisions of foreign investors to hold their earnings in the host country. For example,
the growth rate of the host country market and the income level in a given industry may be signals of good
investment opportunities in the host market;
(2) Those encouraging repatriation: Movements in the exchange rate are supposed to have an effect
through repatriation such that the depreciation of the host currency tends to discourage repatriation. Moreover,
a high corporate tax rate in the host country is assumed to have a negative effect on reinvested earnings and to
cause profit repatriation;
(3) Agency consideration: Factors affecting the decision of a multinational corporation (MNC) on the
amount of dividend payments may also cause repatriation. For example, countries that have high market risk or
political risk or that are culturally or institutionally different from the home country of the MNC would cause
high levels of repatriation.
On the contrary, the study of Wolff (2007) is also unique in terms of estimating the effect of the corporate
tax rate of both the home and the host country on four bilateral FDI measures (total FDI, reinvested earnings,
equity capital, and intra-company loans). He concluded that each component responds differently to the top
statutory corporate tax rate of both the source and the host country. While the tax effect on the equity earnings
and other capital component is complicated and ambiguous, the effect of taxes on reinvested earnings is more
guided. This means that home country taxes on reinvested earnings have a direct effect, leading them to be held
abroad rather than repatriated, while the host country tax rate has a negative effect and causes a fall in
reinvested earnings.
Furthermore, the studies by Oseghale and Nwachukwu (2010), Chakravarty and Xiang (2011), and Taylor,
Mahabir, Jagessar, and Cotton (2013) have also contributed to the literature by analysing FDI with its
individual components separately. Oseghale and Nwachukwu (2010) empirically proved that good governance,
market size, market growth rate, exchange rate, quality of labour, and profitability of existing operations are
positively correlated with reinvested earnings. Similarly, Chakravarty and Xiang (2011) concluded that access
to external financing, property rights, extent of private ownership, and relative competitive advantage has a
significant effect on the decision of foreign investors, concerning the level of retained earnings in the host
country. In a recent paper, Taylor et al. (2013) argued that as the economic growth of the host country and
profitability of foreign firms increase, foreign investors tend to hold reinvested earnings in the country, while
the depreciation of the host currency and an increase in the host country government consumption seem to
decrease the volume of reinvestments.
Data and Methodology
Data
The sub-components of the total FDI are dependent variables, which account for equity capital, reinvested
earnings, and intra-company loans (other capital) in Turkey acquired from the Research Center International
Economics (For Schungs Schwerpunkt Internationale Wirtschaft) Database Retrieval Tool1. The author
identified the following as explanatory variables: the exports to imports ratio as an indicator of the openness of
1 Retrieved from http://data.fiw.ac.at/FiwDat/FiwDatServlet.
DETERMINANTS OF FDI INTO TURKEY: A COMPONENTWISE ANALYSIS
767
the host country, the country risk (CR) index for Turkey and the EU area, the real effective exchange rate
(REX), and lastly, a dummy variable to account for the new corporate tax system introduced in June 2006 to
stimulate more FDI in the country. The author obtained both exports and imports in goods values from the
Organisation for Economic Co-operation and Development (OECD) data dissemination server2. Moreover,
while the CR indexes for Turkey and the EU area came from the PRS (Political Risk Service) Group,
International Country Risk Guide (ICRG) 20123, REX data were attained from the Central Bank of the
Republic of Turkey data dissemination server4. Furthermore, the author specified annual data between 2003 and
2012 as the time span of the study due to the missing observations encountered in reinvested earnings and other
capital data for some years and the acceptance of the Eurocentric monetary unit after 1999. In addition, the
definitions of the variables and expected signs of the coefficients are explained below.
Equity capital. Equity capital is the purchase of the shares of a foreign affiliate in a foreign market rather
than in a domestic market. The IMF (international monetary fund) states that equity capital,
Covers equity in branches, shares (whether voting or non-voting) in subsidiaries and associates, and other capital contributions (such as the provision of machinery by a direct investor to a direct investment enterprise) that constitute part of the capital of the direct investment enterprise. Equity capital also covers the acquisition by a direct investment enterprise of shares in its direct investor. However, nonparticipating preference shares are not part of equity capital but are treated as debt securities and classified as other direct investment capital. Purchases and sales of land and buildings by nonresidents are also included in the equity capital component.
Reinvested earnings. Reinvested earnings simply represent the shares of foreign investors in the profits of
MNFs (multinational firms) that are not distributed. The IMF also defines reinvested earnings as,
The direct investors’ shares (in proportion to equity held) of the undistributed earnings of the direct investment enterprises. Reinvested earnings are considered to be additional capital of the direct investment enterprises. They are recorded as direct investment income, with an offsetting capital transaction.
Other capital (intra-company loans). Other capital consists of long-term and short-term
intra-company loan transactions between foreign investors and their foreign affiliates. The IMF states that other
capital,
Covers the borrowing and lending of funds, including debt securities and trade credits, between direct investors and direct investment enterprises, and between two direct investment enterprises resident in different countries that share the same direct investor. Debt claims on the direct investor by the direct investment enterprise are also included as direct investment other capital. As indicated above, nonparticipating preference shares are treated as debt securities and are therefore classified as other capital.
Export to import ratio. The export to import ratio can be defined as the coverage ratio of imports by
exports. As a matter of course, we assume that a rise in the export to import ratio demonstrates the extent of a
country’s openness to international trade. Hence, this ratio is included in the model with the intention of
determining the effects of host country openness on each sub-component of the total FDI in Turkey.
Real effective exchange rate. The real exchange rate is calculated simply as the nominal exchange rate—
,i de , multiplied by the ratio of the domestic price level— dPPI , to the foreign price level— fPPI . On the other
2 Retrieved from http://www.oecd.org. 3 Retrieved from http://www.prsgroup.com/. 4 Retrieved from http://www.tcmb.gov.tr/.
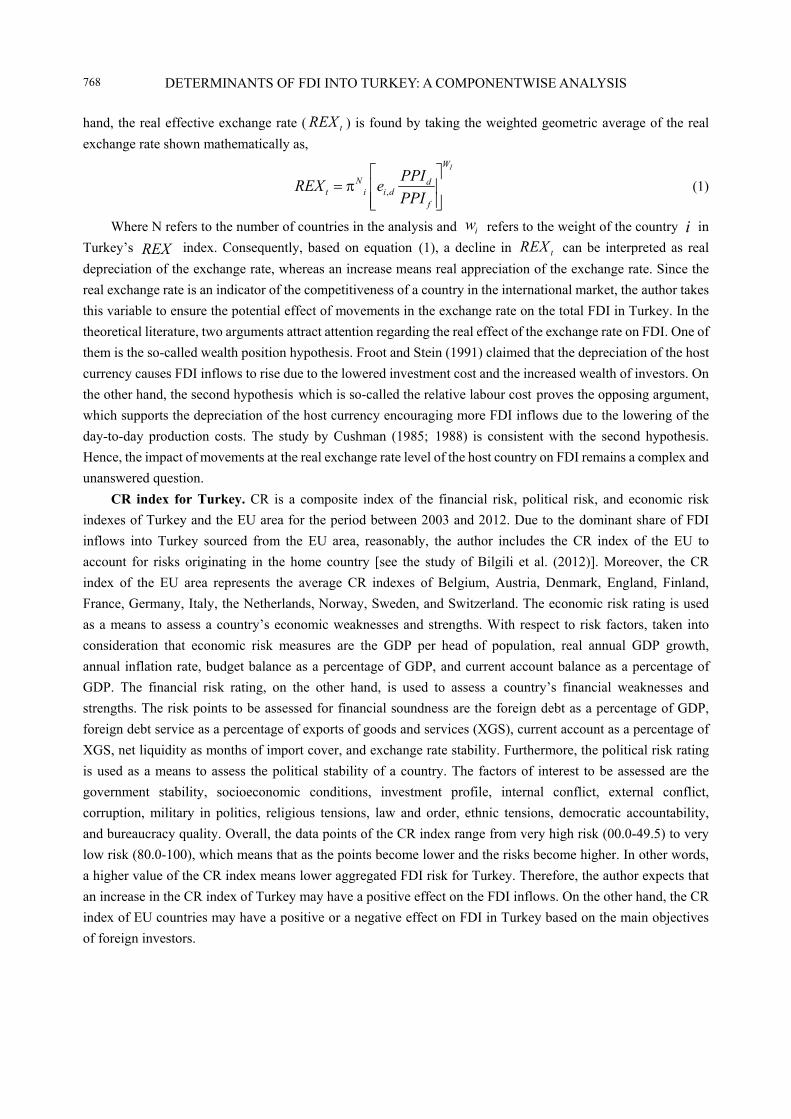
DETERMINANTS OF FDI INTO TURKEY: A COMPONENTWISE ANALYSIS
768
hand, the real effective exchange rate ( tREX ) is found by taking the weighted geometric average of the real
exchange rate shown mathematically as,
,
İW
N dt i i d
f
PPIREX e
PPI
(1)
Where N refers to the number of countries in the analysis and iw refers to the weight of the country i in
Turkey’s REX index. Consequently, based on equation (1), a decline in tREX can be interpreted as real
depreciation of the exchange rate, whereas an increase means real appreciation of the exchange rate. Since the
real exchange rate is an indicator of the competitiveness of a country in the international market, the author takes
this variable to ensure the potential effect of movements in the exchange rate on the total FDI in Turkey. In the
theoretical literature, two arguments attract attention regarding the real effect of the exchange rate on FDI. One of
them is the so-called wealth position hypothesis. Froot and Stein (1991) claimed that the depreciation of the host
currency causes FDI inflows to rise due to the lowered investment cost and the increased wealth of investors. On
the other hand, the second hypothesis which is so-called the relative labour cost proves the opposing argument,
which supports the depreciation of the host currency encouraging more FDI inflows due to the lowering of the
day-to-day production costs. The study by Cushman (1985; 1988) is consistent with the second hypothesis.
Hence, the impact of movements at the real exchange rate level of the host country on FDI remains a complex and
unanswered question.
CR index for Turkey. CR is a composite index of the financial risk, political risk, and economic risk
indexes of Turkey and the EU area for the period between 2003 and 2012. Due to the dominant share of FDI
inflows into Turkey sourced from the EU area, reasonably, the author includes the CR index of the EU to
account for risks originating in the home country [see the study of Bilgili et al. (2012)]. Moreover, the CR
index of the EU area represents the average CR indexes of Belgium, Austria, Denmark, England, Finland,
France, Germany, Italy, the Netherlands, Norway, Sweden, and Switzerland. The economic risk rating is used
as a means to assess a country’s economic weaknesses and strengths. With respect to risk factors, taken into
consideration that economic risk measures are the GDP per head of population, real annual GDP growth,
annual inflation rate, budget balance as a percentage of GDP, and current account balance as a percentage of
GDP. The financial risk rating, on the other hand, is used to assess a country’s financial weaknesses and
strengths. The risk points to be assessed for financial soundness are the foreign debt as a percentage of GDP,
foreign debt service as a percentage of exports of goods and services (XGS), current account as a percentage of
XGS, net liquidity as months of import cover, and exchange rate stability. Furthermore, the political risk rating
is used as a means to assess the political stability of a country. The factors of interest to be assessed are the
government stability, socioeconomic conditions, investment profile, internal conflict, external conflict,
corruption, military in politics, religious tensions, law and order, ethnic tensions, democratic accountability,
and bureaucracy quality. Overall, the data points of the CR index range from very high risk (00.0-49.5) to very
low risk (80.0-100), which means that as the points become lower and the risks become higher. In other words,
a higher value of the CR index means lower aggregated FDI risk for Turkey. Therefore, the author expects that
an increase in the CR index of Turkey may have a positive effect on the FDI inflows. On the other hand, the CR
index of EU countries may have a positive or a negative effect on FDI in Turkey based on the main objectives
of foreign investors.
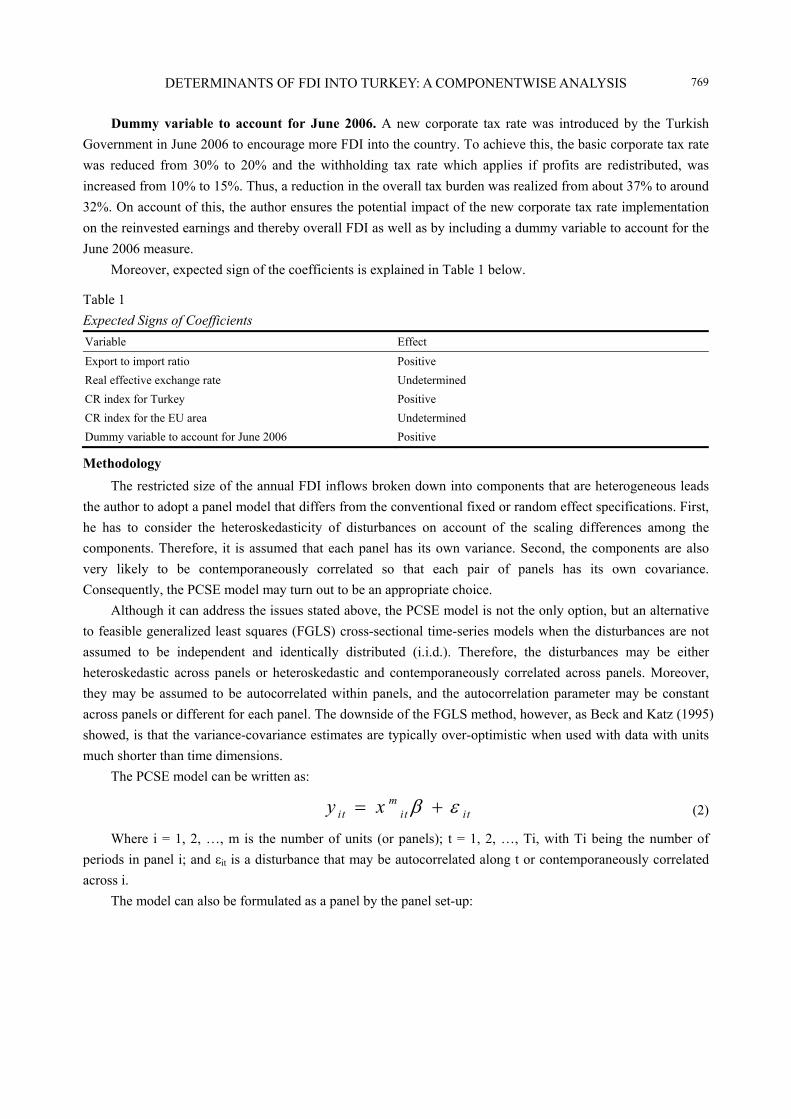
DETERMINANTS OF FDI INTO TURKEY: A COMPONENTWISE ANALYSIS
769
Dummy variable to account for June 2006. A new corporate tax rate was introduced by the Turkish
Government in June 2006 to encourage more FDI into the country. To achieve this, the basic corporate tax rate
was reduced from 30% to 20% and the withholding tax rate which applies if profits are redistributed, was
increased from 10% to 15%. Thus, a reduction in the overall tax burden was realized from about 37% to around
32%. On account of this, the author ensures the potential impact of the new corporate tax rate implementation
on the reinvested earnings and thereby overall FDI as well as by including a dummy variable to account for the
June 2006 measure.
Moreover, expected sign of the coefficients is explained in Table 1 below.
Table 1
Expected Signs of Coefficients
Variable Effect
Export to import ratio Positive
Real effective exchange rate Undetermined
CR index for Turkey Positive
CR index for the EU area Undetermined
Dummy variable to account for June 2006 Positive
Methodology
The restricted size of the annual FDI inflows broken down into components that are heterogeneous leads
the author to adopt a panel model that differs from the conventional fixed or random effect specifications. First,
he has to consider the heteroskedasticity of disturbances on account of the scaling differences among the
components. Therefore, it is assumed that each panel has its own variance. Second, the components are also
very likely to be contemporaneously correlated so that each pair of panels has its own covariance.
Consequently, the PCSE model may turn out to be an appropriate choice.
Although it can address the issues stated above, the PCSE model is not the only option, but an alternative
to feasible generalized least squares (FGLS) cross-sectional time-series models when the disturbances are not
assumed to be independent and identically distributed (i.i.d.). Therefore, the disturbances may be either
heteroskedastic across panels or heteroskedastic and contemporaneously correlated across panels. Moreover,
they may be assumed to be autocorrelated within panels, and the autocorrelation parameter may be constant
across panels or different for each panel. The downside of the FGLS method, however, as Beck and Katz (1995)
showed, is that the variance-covariance estimates are typically over-optimistic when used with data with units
much shorter than time dimensions.
The PCSE model can be written as:
mit it ity x (2)
Where i = 1, 2, …, m is the number of units (or panels); t = 1, 2, …, Ti, with Ti being the number of
periods in panel i; and εit is a disturbance that may be autocorrelated along t or contemporaneously correlated
across i.
The model can also be formulated as a panel by the panel set-up:
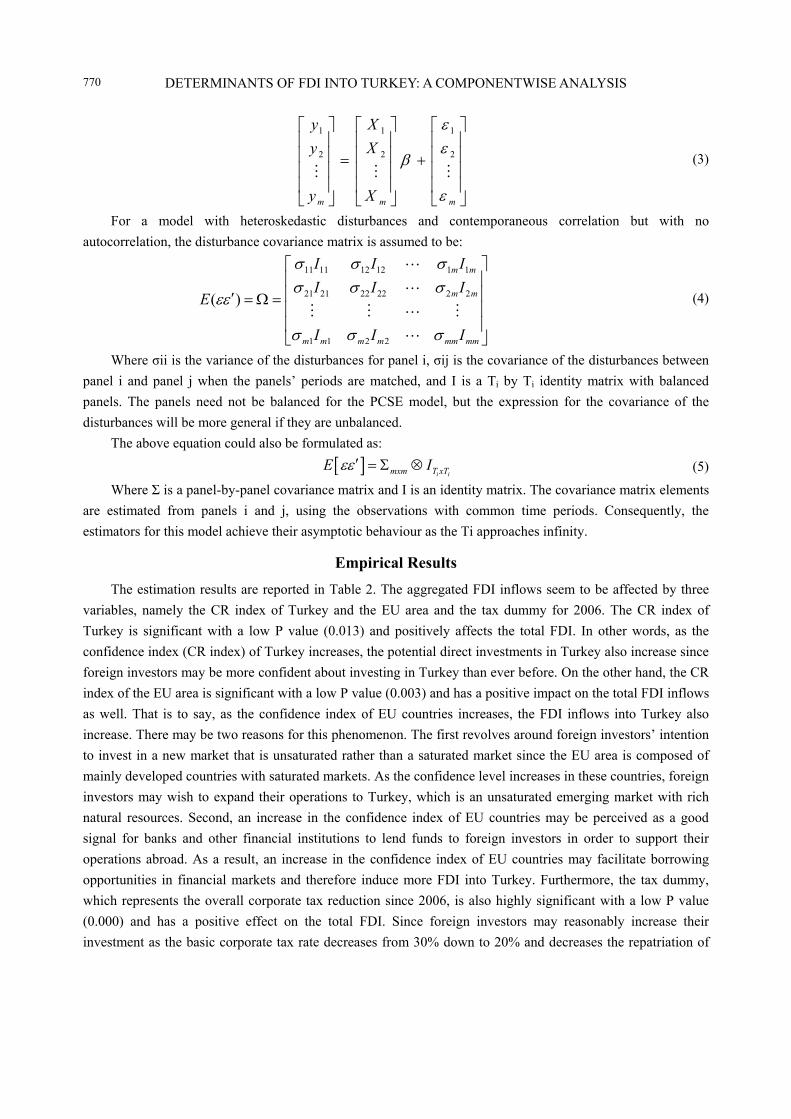
DETERMINANTS OF FDI INTO TURKEY: A COMPONENTWISE ANALYSIS
770
1 1 1
2 2 2
m m m
y X
y X
y X
(3)
For a model with heteroskedastic disturbances and contemporaneous correlation but with no
autocorrelation, the disturbance covariance matrix is assumed to be:
11 11 12 12 1 1
21 21 22 22 2 2
1 1 2 2
( )
m m
m m
m m m m mm mm
I I I
I I IE
I I I
(4)
Where σii is the variance of the disturbances for panel i, σij is the covariance of the disturbances between
panel i and panel j when the panels’ periods are matched, and I is a Ti by Ti identity matrix with balanced
panels. The panels need not be balanced for the PCSE model, but the expression for the covariance of the
disturbances will be more general if they are unbalanced.
The above equation could also be formulated as:
i imxm T xTE I (5)
Where Σ is a panel-by-panel covariance matrix and I is an identity matrix. The covariance matrix elements
are estimated from panels i and j, using the observations with common time periods. Consequently, the
estimators for this model achieve their asymptotic behaviour as the Ti approaches infinity.
Empirical Results
The estimation results are reported in Table 2. The aggregated FDI inflows seem to be affected by three
variables, namely the CR index of Turkey and the EU area and the tax dummy for 2006. The CR index of
Turkey is significant with a low P value (0.013) and positively affects the total FDI. In other words, as the
confidence index (CR index) of Turkey increases, the potential direct investments in Turkey also increase since
foreign investors may be more confident about investing in Turkey than ever before. On the other hand, the CR
index of the EU area is significant with a low P value (0.003) and has a positive impact on the total FDI inflows
as well. That is to say, as the confidence index of EU countries increases, the FDI inflows into Turkey also
increase. There may be two reasons for this phenomenon. The first revolves around foreign investors’ intention
to invest in a new market that is unsaturated rather than a saturated market since the EU area is composed of
mainly developed countries with saturated markets. As the confidence level increases in these countries, foreign
investors may wish to expand their operations to Turkey, which is an unsaturated emerging market with rich
natural resources. Second, an increase in the confidence index of EU countries may be perceived as a good
signal for banks and other financial institutions to lend funds to foreign investors in order to support their
operations abroad. As a result, an increase in the confidence index of EU countries may facilitate borrowing
opportunities in financial markets and therefore induce more FDI into Turkey. Furthermore, the tax dummy,
which represents the overall corporate tax reduction since 2006, is also highly significant with a low P value
(0.000) and has a positive effect on the total FDI. Since foreign investors may reasonably increase their
investment as the basic corporate tax rate decreases from 30% down to 20% and decreases the repatriation of
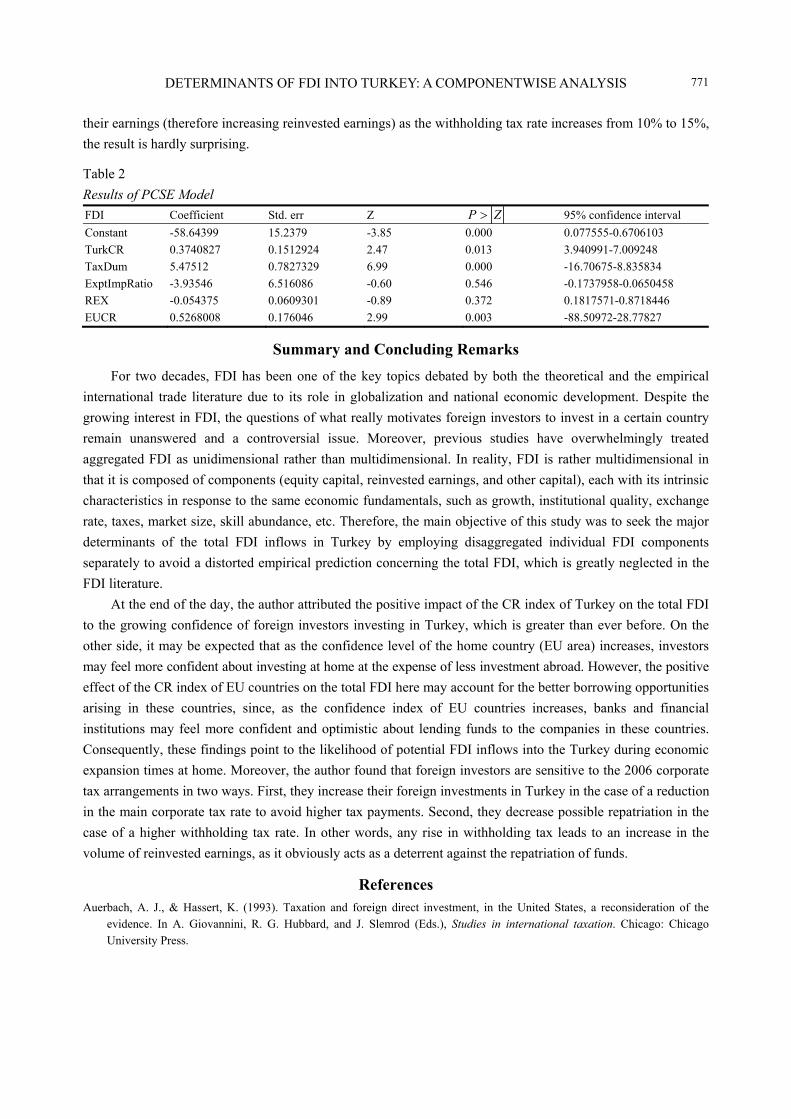
DETERMINANTS OF FDI INTO TURKEY: A COMPONENTWISE ANALYSIS
771
their earnings (therefore increasing reinvested earnings) as the withholding tax rate increases from 10% to 15%,
the result is hardly surprising.
Table 2
Results of PCSE Model
FDI Coefficient Std. err Z P Z 95% confidence interval
Constant -58.64399 15.2379 -3.85 0.000 0.077555-0.6706103
TurkCR 0.3740827 0.1512924 2.47 0.013 3.940991-7.009248
TaxDum 5.47512 0.7827329 6.99 0.000 -16.70675-8.835834
ExptImpRatio -3.93546 6.516086 -0.60 0.546 -0.1737958-0.0650458
REX -0.054375 0.0609301 -0.89 0.372 0.1817571-0.8718446
EUCR 0.5268008 0.176046 2.99 0.003 -88.50972-28.77827
Summary and Concluding Remarks
For two decades, FDI has been one of the key topics debated by both the theoretical and the empirical
international trade literature due to its role in globalization and national economic development. Despite the
growing interest in FDI, the questions of what really motivates foreign investors to invest in a certain country
remain unanswered and a controversial issue. Moreover, previous studies have overwhelmingly treated
aggregated FDI as unidimensional rather than multidimensional. In reality, FDI is rather multidimensional in
that it is composed of components (equity capital, reinvested earnings, and other capital), each with its intrinsic
characteristics in response to the same economic fundamentals, such as growth, institutional quality, exchange
rate, taxes, market size, skill abundance, etc. Therefore, the main objective of this study was to seek the major
determinants of the total FDI inflows in Turkey by employing disaggregated individual FDI components
separately to avoid a distorted empirical prediction concerning the total FDI, which is greatly neglected in the
FDI literature.
At the end of the day, the author attributed the positive impact of the CR index of Turkey on the total FDI
to the growing confidence of foreign investors investing in Turkey, which is greater than ever before. On the
other side, it may be expected that as the confidence level of the home country (EU area) increases, investors
may feel more confident about investing at home at the expense of less investment abroad. However, the positive
effect of the CR index of EU countries on the total FDI here may account for the better borrowing opportunities
arising in these countries, since, as the confidence index of EU countries increases, banks and financial
institutions may feel more confident and optimistic about lending funds to the companies in these countries.
Consequently, these findings point to the likelihood of potential FDI inflows into the Turkey during economic
expansion times at home. Moreover, the author found that foreign investors are sensitive to the 2006 corporate
tax arrangements in two ways. First, they increase their foreign investments in Turkey in the case of a reduction
in the main corporate tax rate to avoid higher tax payments. Second, they decrease possible repatriation in the
case of a higher withholding tax rate. In other words, any rise in withholding tax leads to an increase in the
volume of reinvested earnings, as it obviously acts as a deterrent against the repatriation of funds.
References Auerbach, A. J., & Hassert, K. (1993). Taxation and foreign direct investment, in the United States, a reconsideration of the
evidence. In A. Giovannini, R. G. Hubbard, and J. Slemrod (Eds.), Studies in international taxation. Chicago: Chicago University Press.
DETERMINANTS OF FDI INTO TURKEY: A COMPONENTWISE ANALYSIS
772
Beck, N. L., & Katz, J. N. (1995). What to do (and not to do) with time-series cross-section data. American Political Science Review, 89, 634-647.
Brewer, T. L. (1993). Government policies, market imperfections and foreign direct investment. Journal of International Business Studies, 24(1), 101-120.
Chakravarty, S., & Xiang, M. (2011). Determinants of profit reinvestment by small business in emerging economies. Financial Management, 40(3), 553-590.
Cushman, D. (1985). Real exchange rate risk, expectations and the level of direct investment. The Review of Economics and Statistics, 67(2), 297-308.
Cushman, D. (1988). Exchange rate uncertainty and foreign direct investments in the United States. Review of World Economics, 124(2), 322-336.
Froot, K. A., & Stein, J. C. (1991). Exchange rates and foreign direct investment: An imperfect capital market approach. The Quarterly Journal of Economics, 106(4), 1191-1217.
Loree, D. W., & Guisinger, S. E. (1994). Policy and non-policy determinants of U.S. equity foreign direct investment. Journal of International Business Studies, 26(2), 281-299.
Lundan, S. M. (2006). Reinvested earnings as a component of FDI: An analytical review of the determinants of reinvestment. UN Transnational Corporations, 15(3), 33-64.
Oseghale, B. D., & Nwachukwu, O. C. (2010). Effect of the quality of host country institutions on reinvestment by United States multinationals: A panel data analysis. International Journal of Management, 27(3), 497-510.
Taylor, T., Mahabir, R., Jagessar, V., & Cotton, J. (2013). Examining reinvestment in Trinidad and Tobago. Retrieved from http://www.central-bank.org.tt/sites/default/files/Examining%20Reinvestment%20in%20Trinidad%20and%20Tobago%20-% 20Taylor%20Mahabir%20Jagessar%20Cotton%20-%20Jan%202013.pdf
The Undersecretariat of Treasury, General Directorate of Foreign Investment Report. (2007). Foreign direct investments in Turkey 2006. Ankara.
UNCTAD (United Nations Conference on Trade and Development). (2008). World Investment Report 2008. United Nations, New York and Geneva.
Wolff, G. B. (2007). Foreign direct investment in the enlarged EU: Do taxes matter and to what extent? Open Economies Review, 18(3), 327-346.
Journal of US-China Public Administration, September 2014, Vol. 11, No. 9, 773-789 doi: 10.17265/1548-6591/2014.09.005
Educational Leadership: What Can China Teach the West About
Inclusive Decision-Making Practices
Christine Cunningham
Edith Cowan University, Perth, Western Australia
This paper focuses on educational decision-making in a Chinese context, but starts from a critique of distributed
leadership educational theory as an instrumentalist and Western device of analysis. It is based upon a 2012 research
project which reports on the academic insights of 51 Chinese school leaders who were also students studying
“Masters of Educational Leadership” at an Australian university. The project explored these Chinese school leaders’
perceptions of decision-making in education settings. It considered who would make decisions and how those
decisions would be made in various hypothetical education scenarios. A unique feature of this research is the
significant number of female school leaders from China who were in the participant cohort, so this study offers a
rare insight into their thinking. Overall, this research offers an important first step in broadening out the theoretical
discussions on leadership decision-making into a non-Western education environment. It also shows how
educational research in the 21st century is shifting away from Western—only analysis and instead broadening out
to explore what the unique and important trends are in an Asian nation that is a global powerhouse.
Keywords: decision-making, leadership, Chinese education organisations
This is a paper about educational leadership and power and how China may have lessons to teach the West
about 21st century education organisations. It is framed within a critical perspective, underpinned by an
iterative methodological approach, and the data presented offer some perceptions of leadership from 51
Chinese leaders in Zhejiang and Beijing educational organisations1. Its focus on a Chinese case study is
important, because so little has been written in English language, peer-reviewed academic journals about Asian
nations’ school leaders and how they enact leadership; especially when compared with the tomes dedicated to
Western schooling and leadership.
The first section of the paper traces the recent history of academics calling for a transfer of emphasis in
leadership theory to an East Asian rather than a Western context. This follows with an explanation of the case
study which underpins this paper and the hybrid leadership decision-making continuum survey used to explore
decision-making processes in schools. The third and final sections of the paper discuss the findings of the
research and offer an important first step in broadening theoretical discussions on leadership decision-making
into a non-Western education environment.
Corresponding author: Christine Cunningham, B.A., B.Ed. (Hons), Grad. Dip. Ed., and Ph.D., Faculty of Arts and Education,
Edith Cowan University; research fields: leadership, assessment, and education research philosophy. E-mail: [email protected]. 1 For the rest of this paper, the author will mainly use the term “school” as shorthand for “educational organisations” encompassing all other-named centres of learning across the education sector from early childhood through to tertiary.
DAVID PUBLISHING
D
EDUCATIONAL LEADERSHIP: WHAT CAN CHINA TEACH THE WEST
774
The Move Away From a Western Focus on Education Leadership Research
There have been repeated calls in research literature (Wong, 1998; Hofstede, 2001; Wang & Chee, 2011)
to address cross-cultural understandings of leadership. Certainly, leadership theory conceived in the West is
underpinned by principles of liberal democracy (Woods, 2004; Woods & Gronn, 2009; Bolden, 2011), and this
has led to the argument that this shared democratic societal underpinning may skew researchers’ understanding
of leadership concepts. Wong (1998), Oplatka (2006), and Canchu (2008) argue that there is a perceptual bias
and overbalancing of research literature and theories for leadership that have been developed from
investigations that have only taken place in Western nations such as the UK, USA, Canada, New Zealand, and
Australia, e.g., in the field of distributed leadership (Crowther, Ferguson, & Hann, 2009; Crowther, 2010;
Fullan, 2006a; Fullan, 2006b; Fullan, 2007; Fullan, 2009; Hargreaves & Fink, 2008; Harris, 2008; Harris,
2013).
In response to their calls for more non-Western research to be conducted, this research project was
developed to explore whether one area of leadership theory can resonate in non-democratic societies. Mainland
China does not practice liberal democracy, and its patriarchal, Confucian, collectivist, and Communist cultural
traditions offer a contrasting society quite suitable for a comparative study in leadership (Bush & Qiang, 2000;
Wong, 2001; Walker & Dimmock, 2012).
What has been termed as “distributed” leadership theory in the West is arguably an analysis of the levels
of exclusive or inclusive power used in the leadership’s decision-making practices. It is a theory that:
In recent years, the Western discourse on distributed leadership has attracted increased attention in Chinese societies… have traditionally relied on highly centralized administrative systems in which power is located in the person of the school principal or other unit leader. (Ho & Tikly, 2012, p. 401)
Thus, it is timely to consider whether this “increased attention” is a suitable focus for research.
Distributing leadership means sharing power with more than one person, and power is ultimately expressed
through the enactment of decision-making, the way to examine this leadership idea is by considering whether
“decisions should be taken using an inclusive procedure, so as to be encapsulate that society’s consensus”
(Emerson, 2011, p. 46).
Who makes decision in schools is a tangible concept that can be asked and answered in various contexts.
If we assume that in a complex structural organisation, such as a school, power is wielded every time that a
final decision is made then power may be “measured” by learning who makes the final decisions. A final
decision can be defined as one that cannot easily be un-decided by others with either formal or informal powers
in that school community. Power can also be examined by analysing how deciders (leaders) make those final
decisions. How those decisions are made can teach us about the coercive or collaborative nature of the school’s
leadership processes. Therefore, the combined knowledge of “whom and how” decisions are made in schools
can offer a quite vivid analysis of school leadership.
Linear Leadership Behaviour Continuums
In an attempt to examine whether great power is concentrated on the position of a principal (and other
named leaders of educational organisations), what is needed is a mechanism that can articulate decision-making
options in a school organisation. One such device is leadership behaviour continuums which have been
influential in Western educational leadership theory and which implicitly focus on decision-making by
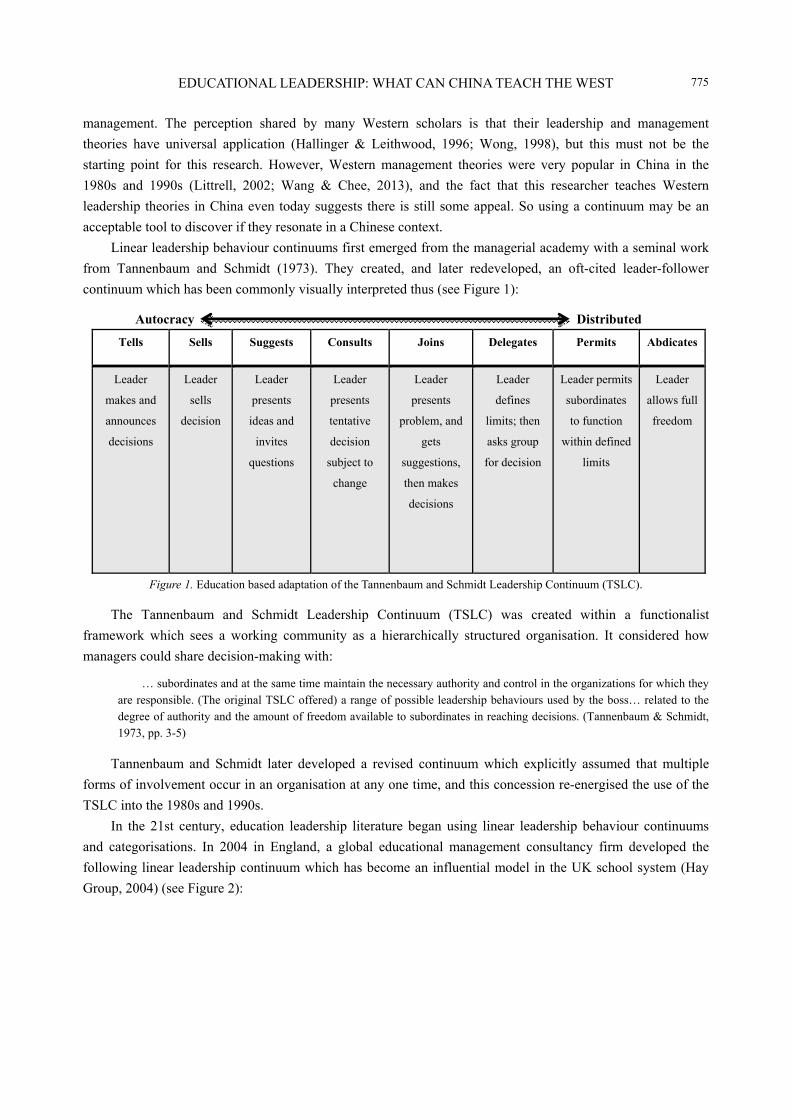
EDUCATIONAL LEADERSHIP: WHAT CAN CHINA TEACH THE WEST
775
management. The perception shared by many Western scholars is that their leadership and management
theories have universal application (Hallinger & Leithwood, 1996; Wong, 1998), but this must not be the
starting point for this research. However, Western management theories were very popular in China in the
1980s and 1990s (Littrell, 2002; Wang & Chee, 2013), and the fact that this researcher teaches Western
leadership theories in China even today suggests there is still some appeal. So using a continuum may be an
acceptable tool to discover if they resonate in a Chinese context.
Linear leadership behaviour continuums first emerged from the managerial academy with a seminal work
from Tannenbaum and Schmidt (1973). They created, and later redeveloped, an oft-cited leader-follower
continuum which has been commonly visually interpreted thus (see Figure 1):
Autocracy Distributed
Tells Sells Suggests Consults Joins Delegates Permits Abdicates
Leader
makes and
announces
decisions
Leader
sells
decision
Leader
presents
ideas and
invites
questions
Leader
presents
tentative
decision
subject to
change
Leader
presents
problem, and
gets
suggestions,
then makes
decisions
Leader
defines
limits; then
asks group
for decision
Leader permits
subordinates
to function
within defined
limits
Leader
allows full
freedom
Figure 1. Education based adaptation of the Tannenbaum and Schmidt Leadership Continuum (TSLC).
The Tannenbaum and Schmidt Leadership Continuum (TSLC) was created within a functionalist
framework which sees a working community as a hierarchically structured organisation. It considered how
managers could share decision-making with:
… subordinates and at the same time maintain the necessary authority and control in the organizations for which they are responsible. (The original TSLC offered) a range of possible leadership behaviours used by the boss… related to the degree of authority and the amount of freedom available to subordinates in reaching decisions. (Tannenbaum & Schmidt, 1973, pp. 3-5)
Tannenbaum and Schmidt later developed a revised continuum which explicitly assumed that multiple
forms of involvement occur in an organisation at any one time, and this concession re-energised the use of the
TSLC into the 1980s and 1990s.
In the 21st century, education leadership literature began using linear leadership behaviour continuums
and categorisations. In 2004 in England, a global educational management consultancy firm developed the
following linear leadership continuum which has become an influential model in the UK school system (Hay
Group, 2004) (see Figure 2):
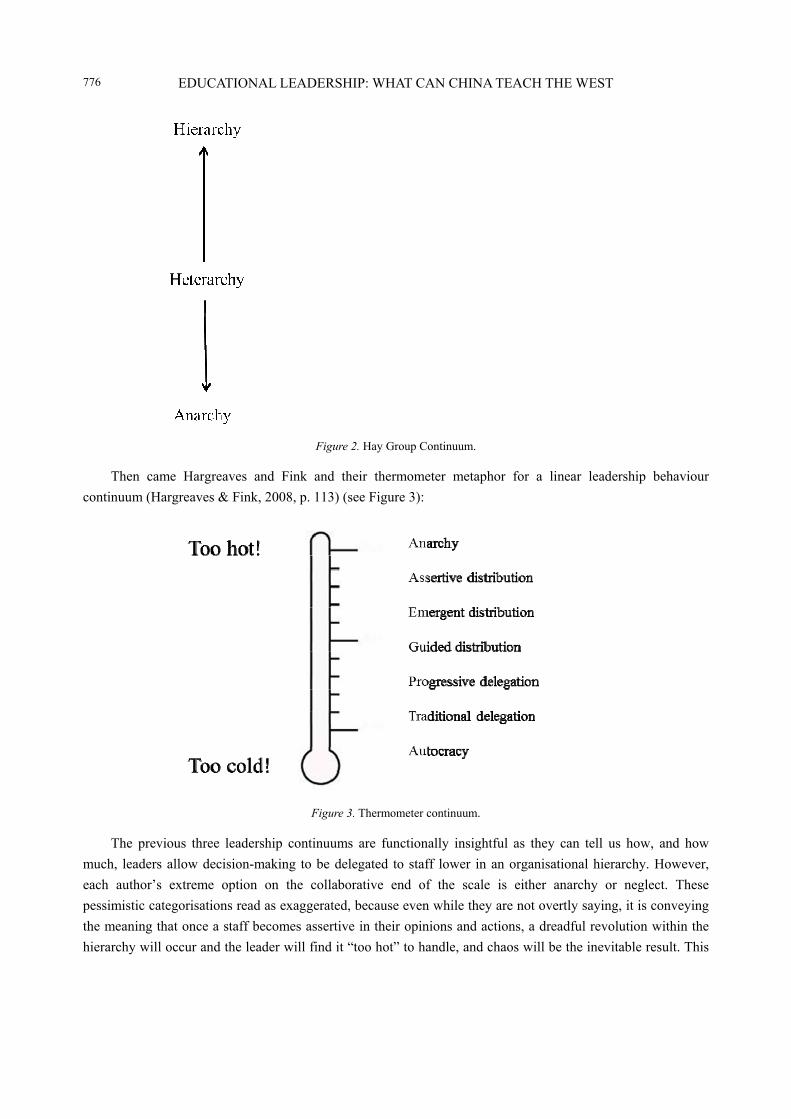
EDUCATIONAL LEADERSHIP: WHAT CAN CHINA TEACH THE WEST
776
Figure 2. Hay Group Continuum.
Then came Hargreaves and Fink and their thermometer metaphor for a linear leadership behaviour
continuum (Hargreaves & Fink, 2008, p. 113) (see Figure 3):
Figure 3. Thermometer continuum.
The previous three leadership continuums are functionally insightful as they can tell us how, and how
much, leaders allow decision-making to be delegated to staff lower in an organisational hierarchy. However,
each author’s extreme option on the collaborative end of the scale is either anarchy or neglect. These
pessimistic categorisations read as exaggerated, because even while they are not overtly saying, it is conveying
the meaning that once a staff becomes assertive in their opinions and actions, a dreadful revolution within the
hierarchy will occur and the leader will find it “too hot” to handle, and chaos will be the inevitable result. This
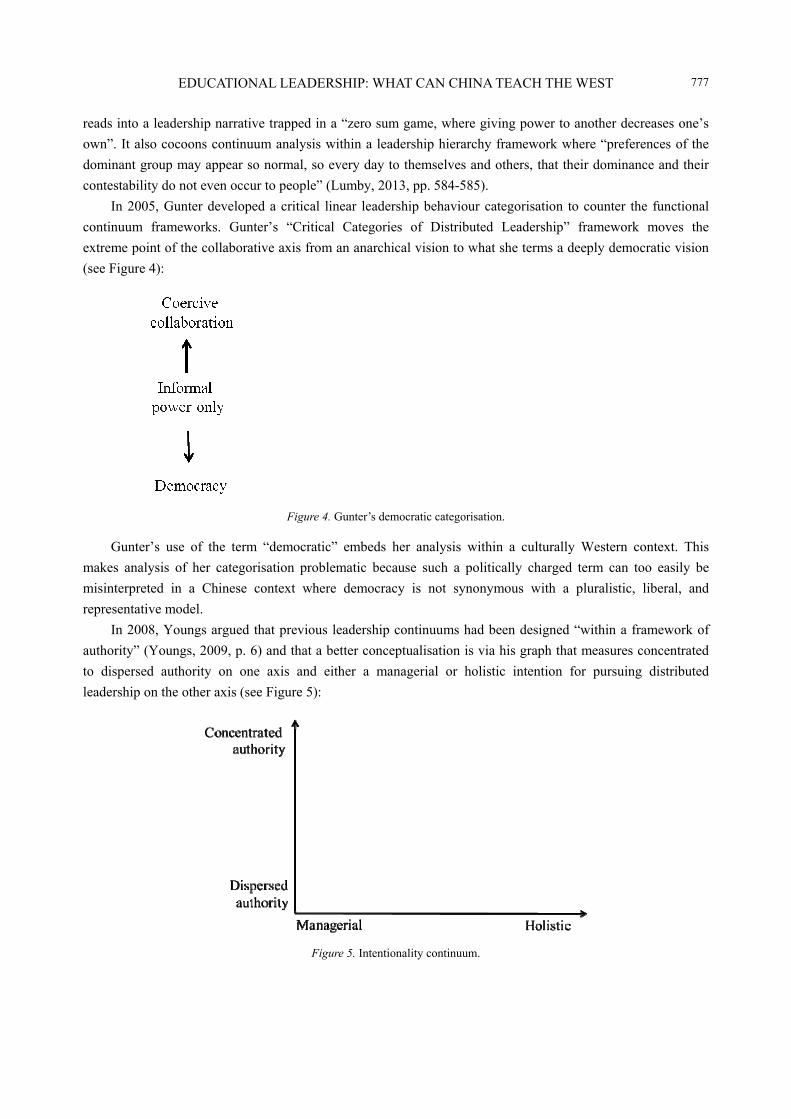
EDUCATIONAL LEADERSHIP: WHAT CAN CHINA TEACH THE WEST
777
reads into a leadership narrative trapped in a “zero sum game, where giving power to another decreases one’s
own”. It also cocoons continuum analysis within a leadership hierarchy framework where “preferences of the
dominant group may appear so normal, so every day to themselves and others, that their dominance and their
contestability do not even occur to people” (Lumby, 2013, pp. 584-585).
In 2005, Gunter developed a critical linear leadership behaviour categorisation to counter the functional
continuum frameworks. Gunter’s “Critical Categories of Distributed Leadership” framework moves the
extreme point of the collaborative axis from an anarchical vision to what she terms a deeply democratic vision
(see Figure 4):
Figure 4. Gunter’s democratic categorisation.
Gunter’s use of the term “democratic” embeds her analysis within a culturally Western context. This
makes analysis of her categorisation problematic because such a politically charged term can too easily be
misinterpreted in a Chinese context where democracy is not synonymous with a pluralistic, liberal, and
representative model.
In 2008, Youngs argued that previous leadership continuums had been designed “within a framework of
authority” (Youngs, 2009, p. 6) and that a better conceptualisation is via his graph that measures concentrated
to dispersed authority on one axis and either a managerial or holistic intention for pursuing distributed
leadership on the other axis (see Figure 5):
Figure 5. Intentionality continuum.
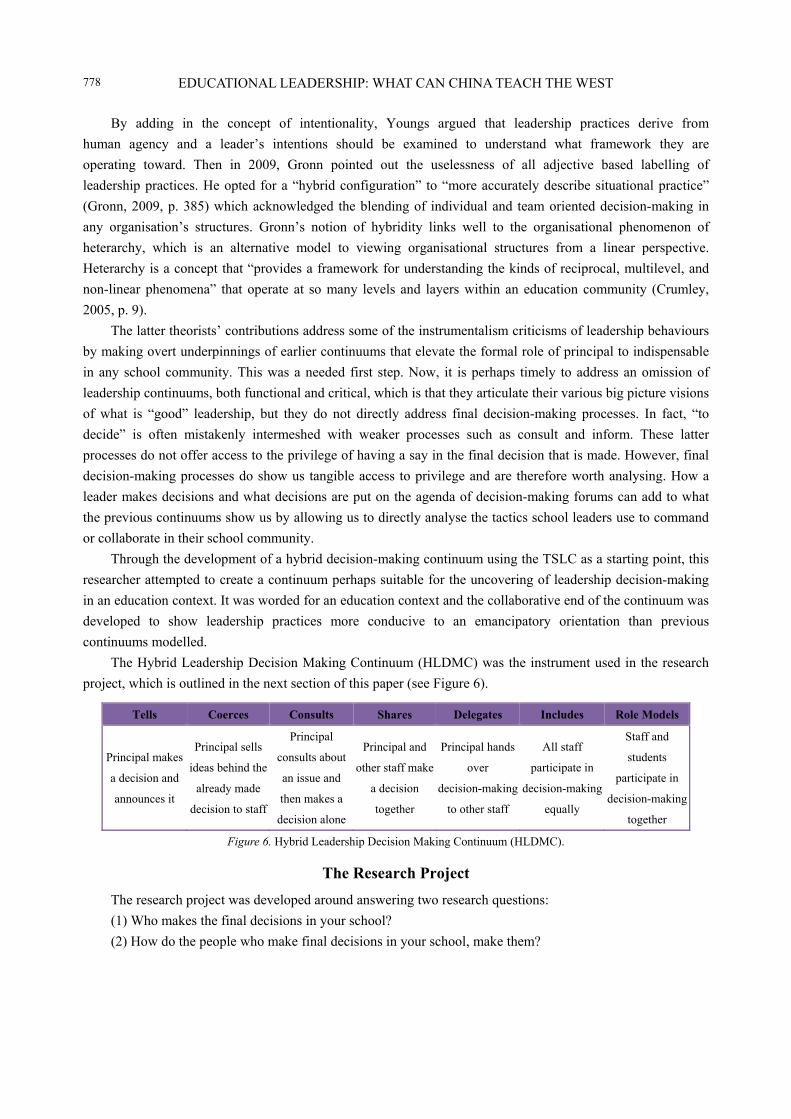
EDUCATIONAL LEADERSHIP: WHAT CAN CHINA TEACH THE WEST
778
By adding in the concept of intentionality, Youngs argued that leadership practices derive from
human agency and a leader’s intentions should be examined to understand what framework they are
operating toward. Then in 2009, Gronn pointed out the uselessness of all adjective based labelling of
leadership practices. He opted for a “hybrid configuration” to “more accurately describe situational practice”
(Gronn, 2009, p. 385) which acknowledged the blending of individual and team oriented decision-making in
any organisation’s structures. Gronn’s notion of hybridity links well to the organisational phenomenon of
heterarchy, which is an alternative model to viewing organisational structures from a linear perspective.
Heterarchy is a concept that “provides a framework for understanding the kinds of reciprocal, multilevel, and
non-linear phenomena” that operate at so many levels and layers within an education community (Crumley,
2005, p. 9).
The latter theorists’ contributions address some of the instrumentalism criticisms of leadership behaviours
by making overt underpinnings of earlier continuums that elevate the formal role of principal to indispensable
in any school community. This was a needed first step. Now, it is perhaps timely to address an omission of
leadership continuums, both functional and critical, which is that they articulate their various big picture visions
of what is “good” leadership, but they do not directly address final decision-making processes. In fact, “to
decide” is often mistakenly intermeshed with weaker processes such as consult and inform. These latter
processes do not offer access to the privilege of having a say in the final decision that is made. However, final
decision-making processes do show us tangible access to privilege and are therefore worth analysing. How a
leader makes decisions and what decisions are put on the agenda of decision-making forums can add to what
the previous continuums show us by allowing us to directly analyse the tactics school leaders use to command
or collaborate in their school community.
Through the development of a hybrid decision-making continuum using the TSLC as a starting point, this
researcher attempted to create a continuum perhaps suitable for the uncovering of leadership decision-making
in an education context. It was worded for an education context and the collaborative end of the continuum was
developed to show leadership practices more conducive to an emancipatory orientation than previous
continuums modelled.
The Hybrid Leadership Decision Making Continuum (HLDMC) was the instrument used in the research
project, which is outlined in the next section of this paper (see Figure 6).
Tells Coerces Consults Shares Delegates Includes Role Models
Principal makes
a decision and
announces it
Principal sells
ideas behind the
already made
decision to staff
Principal
consults about
an issue and
then makes a
decision alone
Principal and
other staff make
a decision
together
Principal hands
over
decision-making
to other staff
All staff
participate in
decision-making
equally
Staff and
students
participate in
decision-making
together
Figure 6. Hybrid Leadership Decision Making Continuum (HLDMC).
The Research Project
The research project was developed around answering two research questions:
(1) Who makes the final decisions in your school?
(2) How do the people who make final decisions in your school, make them?
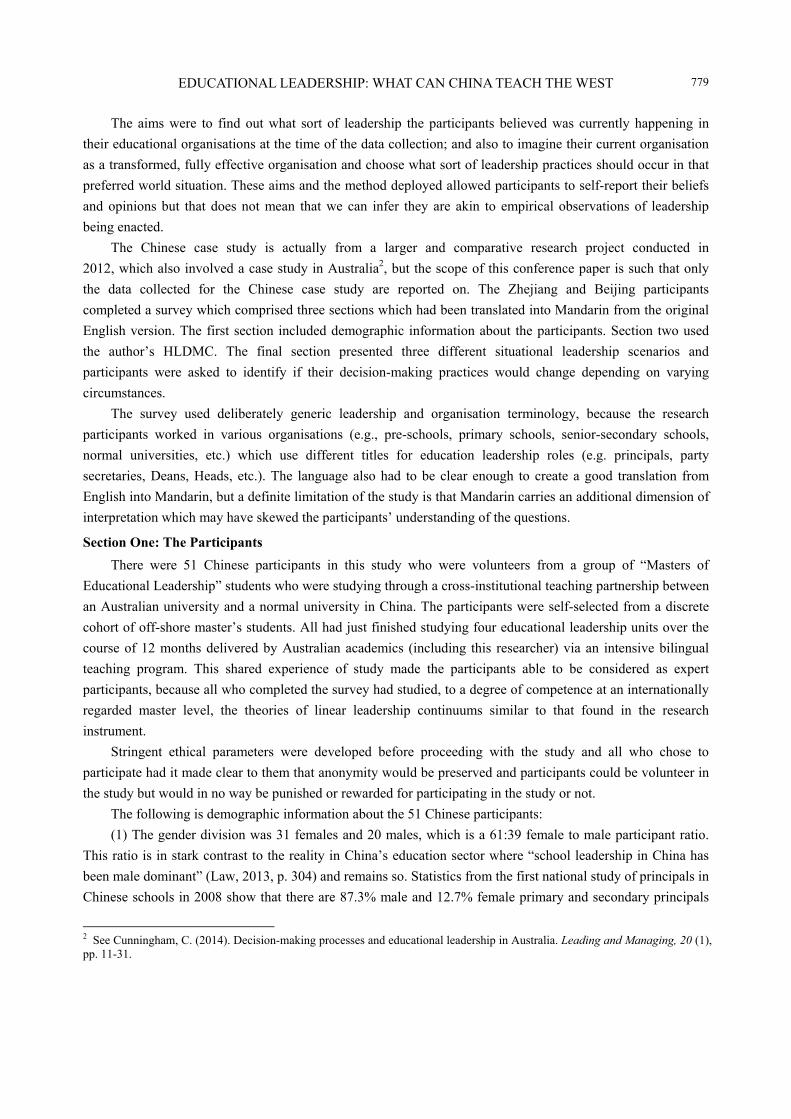
EDUCATIONAL LEADERSHIP: WHAT CAN CHINA TEACH THE WEST
779
The aims were to find out what sort of leadership the participants believed was currently happening in
their educational organisations at the time of the data collection; and also to imagine their current organisation
as a transformed, fully effective organisation and choose what sort of leadership practices should occur in that
preferred world situation. These aims and the method deployed allowed participants to self-report their beliefs
and opinions but that does not mean that we can infer they are akin to empirical observations of leadership
being enacted.
The Chinese case study is actually from a larger and comparative research project conducted in
2012, which also involved a case study in Australia2, but the scope of this conference paper is such that only
the data collected for the Chinese case study are reported on. The Zhejiang and Beijing participants
completed a survey which comprised three sections which had been translated into Mandarin from the original
English version. The first section included demographic information about the participants. Section two used
the author’s HLDMC. The final section presented three different situational leadership scenarios and
participants were asked to identify if their decision-making practices would change depending on varying
circumstances.
The survey used deliberately generic leadership and organisation terminology, because the research
participants worked in various organisations (e.g., pre-schools, primary schools, senior-secondary schools,
normal universities, etc.) which use different titles for education leadership roles (e.g. principals, party
secretaries, Deans, Heads, etc.). The language also had to be clear enough to create a good translation from
English into Mandarin, but a definite limitation of the study is that Mandarin carries an additional dimension of
interpretation which may have skewed the participants’ understanding of the questions.
Section One: The Participants
There were 51 Chinese participants in this study who were volunteers from a group of “Masters of
Educational Leadership” students who were studying through a cross-institutional teaching partnership between
an Australian university and a normal university in China. The participants were self-selected from a discrete
cohort of off-shore master’s students. All had just finished studying four educational leadership units over the
course of 12 months delivered by Australian academics (including this researcher) via an intensive bilingual
teaching program. This shared experience of study made the participants able to be considered as expert
participants, because all who completed the survey had studied, to a degree of competence at an internationally
regarded master level, the theories of linear leadership continuums similar to that found in the research
instrument.
Stringent ethical parameters were developed before proceeding with the study and all who chose to
participate had it made clear to them that anonymity would be preserved and participants could be volunteer in
the study but would in no way be punished or rewarded for participating in the study or not.
The following is demographic information about the 51 Chinese participants:
(1) The gender division was 31 females and 20 males, which is a 61:39 female to male participant ratio.
This ratio is in stark contrast to the reality in China’s education sector where “school leadership in China has
been male dominant” (Law, 2013, p. 304) and remains so. Statistics from the first national study of principals in
Chinese schools in 2008 show that there are 87.3% male and 12.7% female primary and secondary principals
2 See Cunningham, C. (2014). Decision-making processes and educational leadership in Australia. Leading and Managing, 20 (1), pp. 11-31.
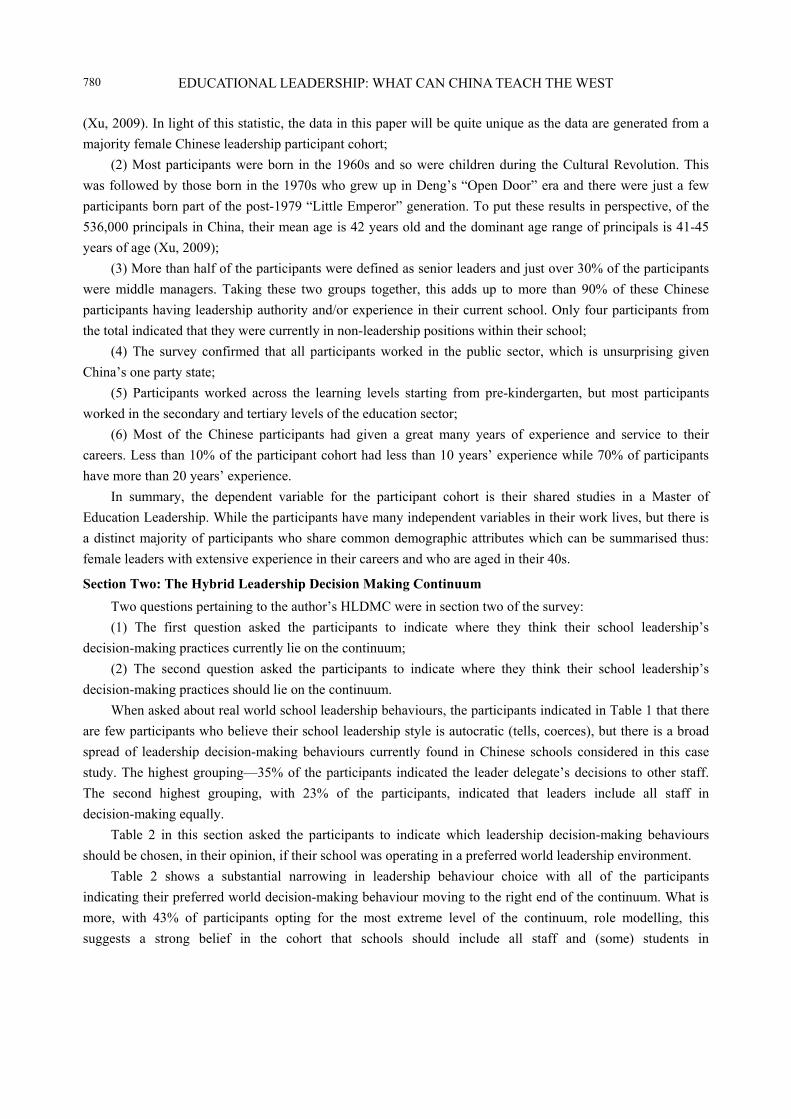
EDUCATIONAL LEADERSHIP: WHAT CAN CHINA TEACH THE WEST
780
(Xu, 2009). In light of this statistic, the data in this paper will be quite unique as the data are generated from a
majority female Chinese leadership participant cohort;
(2) Most participants were born in the 1960s and so were children during the Cultural Revolution. This
was followed by those born in the 1970s who grew up in Deng’s “Open Door” era and there were just a few
participants born part of the post-1979 “Little Emperor” generation. To put these results in perspective, of the
536,000 principals in China, their mean age is 42 years old and the dominant age range of principals is 41-45
years of age (Xu, 2009);
(3) More than half of the participants were defined as senior leaders and just over 30% of the participants
were middle managers. Taking these two groups together, this adds up to more than 90% of these Chinese
participants having leadership authority and/or experience in their current school. Only four participants from
the total indicated that they were currently in non-leadership positions within their school;
(4) The survey confirmed that all participants worked in the public sector, which is unsurprising given
China’s one party state;
(5) Participants worked across the learning levels starting from pre-kindergarten, but most participants
worked in the secondary and tertiary levels of the education sector;
(6) Most of the Chinese participants had given a great many years of experience and service to their
careers. Less than 10% of the participant cohort had less than 10 years’ experience while 70% of participants
have more than 20 years’ experience.
In summary, the dependent variable for the participant cohort is their shared studies in a Master of
Education Leadership. While the participants have many independent variables in their work lives, but there is
a distinct majority of participants who share common demographic attributes which can be summarised thus:
female leaders with extensive experience in their careers and who are aged in their 40s.
Section Two: The Hybrid Leadership Decision Making Continuum
Two questions pertaining to the author’s HLDMC were in section two of the survey:
(1) The first question asked the participants to indicate where they think their school leadership’s
decision-making practices currently lie on the continuum;
(2) The second question asked the participants to indicate where they think their school leadership’s
decision-making practices should lie on the continuum.
When asked about real world school leadership behaviours, the participants indicated in Table 1 that there
are few participants who believe their school leadership style is autocratic (tells, coerces), but there is a broad
spread of leadership decision-making behaviours currently found in Chinese schools considered in this case
study. The highest grouping—35% of the participants indicated the leader delegate’s decisions to other staff.
The second highest grouping, with 23% of the participants, indicated that leaders include all staff in
decision-making equally.
Table 2 in this section asked the participants to indicate which leadership decision-making behaviours
should be chosen, in their opinion, if their school was operating in a preferred world leadership environment.
Table 2 shows a substantial narrowing in leadership behaviour choice with all of the participants
indicating their preferred world decision-making behaviour moving to the right end of the continuum. What is
more, with 43% of participants opting for the most extreme level of the continuum, role modelling, this
suggests a strong belief in the cohort that schools should include all staff and (some) students in
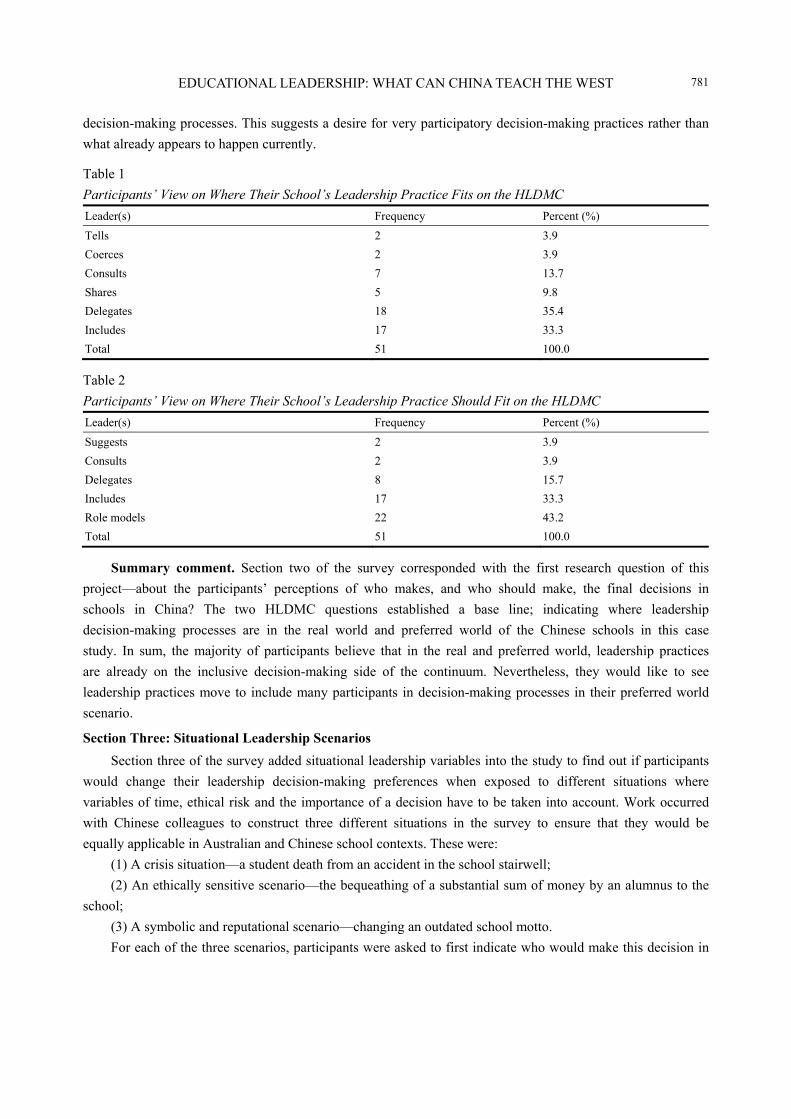
EDUCATIONAL LEADERSHIP: WHAT CAN CHINA TEACH THE WEST
781
decision-making processes. This suggests a desire for very participatory decision-making practices rather than
what already appears to happen currently.
Table 1
Participants’ View on Where Their School’s Leadership Practice Fits on the HLDMC
Leader(s) Frequency Percent (%)
Tells 2 3.9
Coerces 2 3.9
Consults 7 13.7
Shares 5 9.8
Delegates 18 35.4
Includes 17 33.3
Total 51 100.0
Table 2
Participants’ View on Where Their School’s Leadership Practice Should Fit on the HLDMC
Leader(s) Frequency Percent (%)
Suggests 2 3.9
Consults 2 3.9
Delegates 8 15.7
Includes 17 33.3
Role models 22 43.2
Total 51 100.0
Summary comment. Section two of the survey corresponded with the first research question of this
project—about the participants’ perceptions of who makes, and who should make, the final decisions in
schools in China? The two HLDMC questions established a base line; indicating where leadership
decision-making processes are in the real world and preferred world of the Chinese schools in this case
study. In sum, the majority of participants believe that in the real and preferred world, leadership practices
are already on the inclusive decision-making side of the continuum. Nevertheless, they would like to see
leadership practices move to include many participants in decision-making processes in their preferred world
scenario.
Section Three: Situational Leadership Scenarios
Section three of the survey added situational leadership variables into the study to find out if participants
would change their leadership decision-making preferences when exposed to different situations where
variables of time, ethical risk and the importance of a decision have to be taken into account. Work occurred
with Chinese colleagues to construct three different situations in the survey to ensure that they would be
equally applicable in Australian and Chinese school contexts. These were:
(1) A crisis situation—a student death from an accident in the school stairwell;
(2) An ethically sensitive scenario—the bequeathing of a substantial sum of money by an alumnus to the
school;
(3) A symbolic and reputational scenario—changing an outdated school motto.
For each of the three scenarios, participants were asked to first indicate who would make this decision in
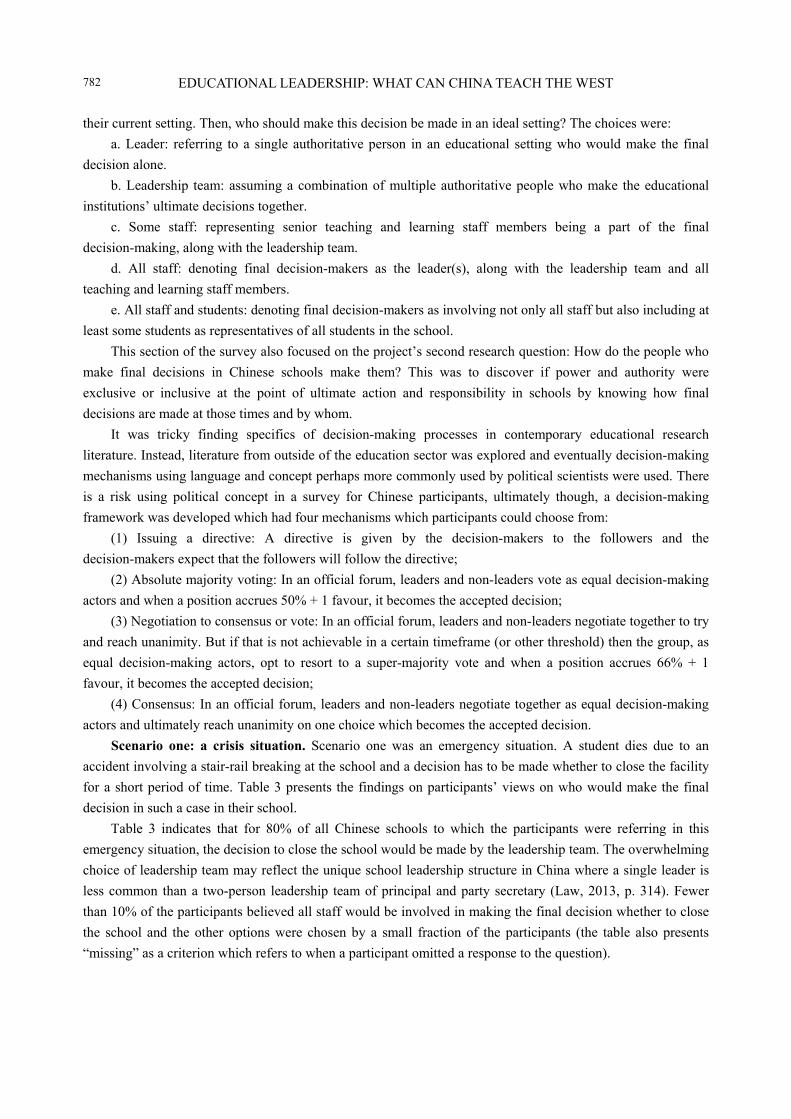
EDUCATIONAL LEADERSHIP: WHAT CAN CHINA TEACH THE WEST
782
their current setting. Then, who should make this decision be made in an ideal setting? The choices were:
a. Leader: referring to a single authoritative person in an educational setting who would make the final
decision alone.
b. Leadership team: assuming a combination of multiple authoritative people who make the educational
institutions’ ultimate decisions together.
c. Some staff: representing senior teaching and learning staff members being a part of the final
decision-making, along with the leadership team.
d. All staff: denoting final decision-makers as the leader(s), along with the leadership team and all
teaching and learning staff members.
e. All staff and students: denoting final decision-makers as involving not only all staff but also including at
least some students as representatives of all students in the school.
This section of the survey also focused on the project’s second research question: How do the people who
make final decisions in Chinese schools make them? This was to discover if power and authority were
exclusive or inclusive at the point of ultimate action and responsibility in schools by knowing how final
decisions are made at those times and by whom.
It was tricky finding specifics of decision-making processes in contemporary educational research
literature. Instead, literature from outside of the education sector was explored and eventually decision-making
mechanisms using language and concept perhaps more commonly used by political scientists were used. There
is a risk using political concept in a survey for Chinese participants, ultimately though, a decision-making
framework was developed which had four mechanisms which participants could choose from:
(1) Issuing a directive: A directive is given by the decision-makers to the followers and the
decision-makers expect that the followers will follow the directive;
(2) Absolute majority voting: In an official forum, leaders and non-leaders vote as equal decision-making
actors and when a position accrues 50% + 1 favour, it becomes the accepted decision;
(3) Negotiation to consensus or vote: In an official forum, leaders and non-leaders negotiate together to try
and reach unanimity. But if that is not achievable in a certain timeframe (or other threshold) then the group, as
equal decision-making actors, opt to resort to a super-majority vote and when a position accrues 66% + 1
favour, it becomes the accepted decision;
(4) Consensus: In an official forum, leaders and non-leaders negotiate together as equal decision-making
actors and ultimately reach unanimity on one choice which becomes the accepted decision.
Scenario one: a crisis situation. Scenario one was an emergency situation. A student dies due to an
accident involving a stair-rail breaking at the school and a decision has to be made whether to close the facility
for a short period of time. Table 3 presents the findings on participants’ views on who would make the final
decision in such a case in their school.
Table 3 indicates that for 80% of all Chinese schools to which the participants were referring in this
emergency situation, the decision to close the school would be made by the leadership team. The overwhelming
choice of leadership team may reflect the unique school leadership structure in China where a single leader is
less common than a two-person leadership team of principal and party secretary (Law, 2013, p. 314). Fewer
than 10% of the participants believed all staff would be involved in making the final decision whether to close
the school and the other options were chosen by a small fraction of the participants (the table also presents
“missing” as a criterion which refers to when a participant omitted a response to the question).
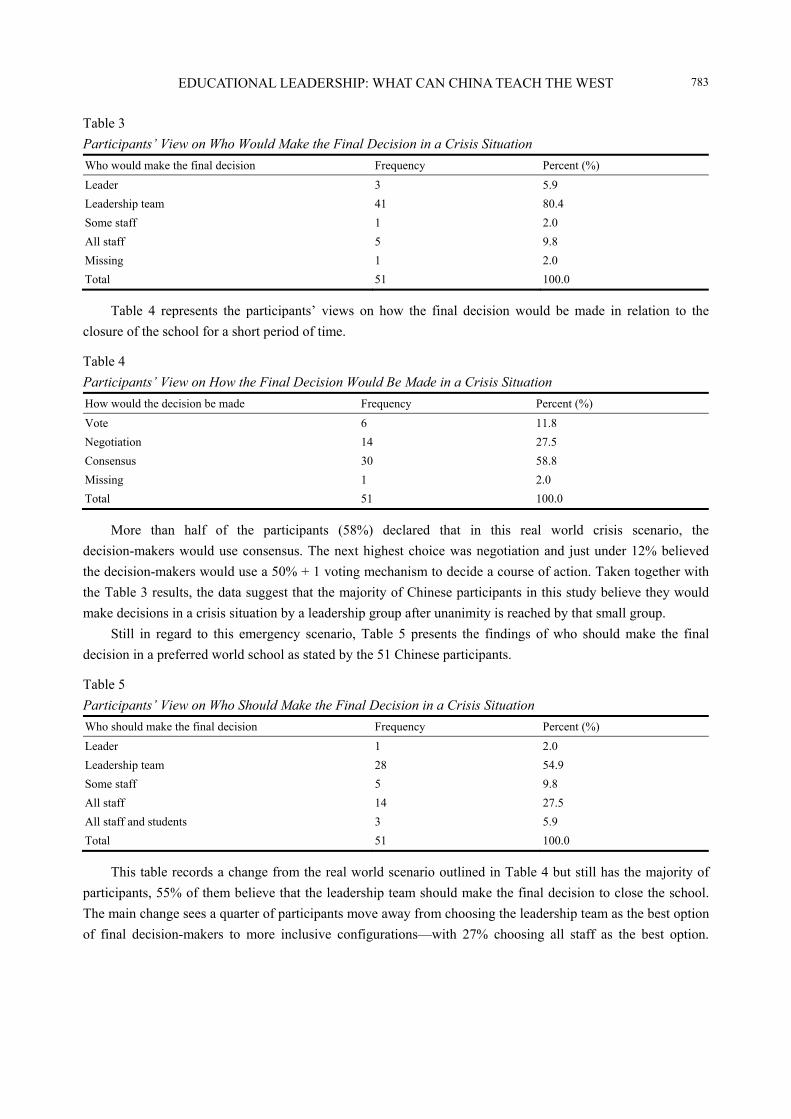
EDUCATIONAL LEADERSHIP: WHAT CAN CHINA TEACH THE WEST
783
Table 3
Participants’ View on Who Would Make the Final Decision in a Crisis Situation
Who would make the final decision Frequency Percent (%)
Leader 3 5.9
Leadership team 41 80.4
Some staff 1 2.0
All staff 5 9.8
Missing 1 2.0
Total 51 100.0
Table 4 represents the participants’ views on how the final decision would be made in relation to the
closure of the school for a short period of time.
Table 4
Participants’ View on How the Final Decision Would Be Made in a Crisis Situation
How would the decision be made Frequency Percent (%)
Vote 6 11.8
Negotiation 14 27.5
Consensus 30 58.8
Missing 1 2.0
Total 51 100.0
More than half of the participants (58%) declared that in this real world crisis scenario, the
decision-makers would use consensus. The next highest choice was negotiation and just under 12% believed
the decision-makers would use a 50% + 1 voting mechanism to decide a course of action. Taken together with
the Table 3 results, the data suggest that the majority of Chinese participants in this study believe they would
make decisions in a crisis situation by a leadership group after unanimity is reached by that small group.
Still in regard to this emergency scenario, Table 5 presents the findings of who should make the final
decision in a preferred world school as stated by the 51 Chinese participants.
Table 5
Participants’ View on Who Should Make the Final Decision in a Crisis Situation
Who should make the final decision Frequency Percent (%)
Leader 1 2.0
Leadership team 28 54.9
Some staff 5 9.8
All staff 14 27.5
All staff and students 3 5.9
Total 51 100.0
This table records a change from the real world scenario outlined in Table 4 but still has the majority of
participants, 55% of them believe that the leadership team should make the final decision to close the school.
The main change sees a quarter of participants move away from choosing the leadership team as the best option
of final decision-makers to more inclusive configurations—with 27% choosing all staff as the best option.
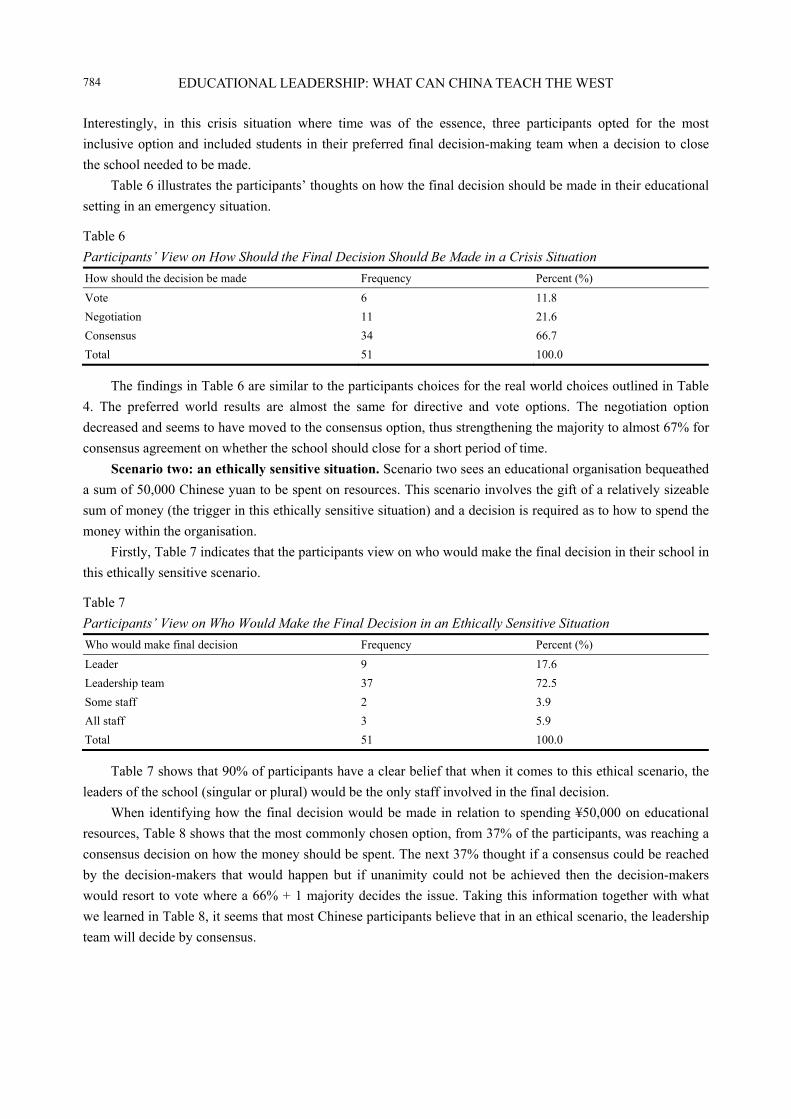
EDUCATIONAL LEADERSHIP: WHAT CAN CHINA TEACH THE WEST
784
Interestingly, in this crisis situation where time was of the essence, three participants opted for the most
inclusive option and included students in their preferred final decision-making team when a decision to close
the school needed to be made.
Table 6 illustrates the participants’ thoughts on how the final decision should be made in their educational
setting in an emergency situation.
Table 6
Participants’ View on How Should the Final Decision Should Be Made in a Crisis Situation
How should the decision be made Frequency Percent (%)
Vote 6 11.8
Negotiation 11 21.6
Consensus 34 66.7
Total 51 100.0
The findings in Table 6 are similar to the participants choices for the real world choices outlined in Table
4. The preferred world results are almost the same for directive and vote options. The negotiation option
decreased and seems to have moved to the consensus option, thus strengthening the majority to almost 67% for
consensus agreement on whether the school should close for a short period of time.
Scenario two: an ethically sensitive situation. Scenario two sees an educational organisation bequeathed
a sum of 50,000 Chinese yuan to be spent on resources. This scenario involves the gift of a relatively sizeable
sum of money (the trigger in this ethically sensitive situation) and a decision is required as to how to spend the
money within the organisation.
Firstly, Table 7 indicates that the participants view on who would make the final decision in their school in
this ethically sensitive scenario.
Table 7
Participants’ View on Who Would Make the Final Decision in an Ethically Sensitive Situation
Who would make final decision Frequency Percent (%)
Leader 9 17.6
Leadership team 37 72.5
Some staff 2 3.9
All staff 3 5.9
Total 51 100.0
Table 7 shows that 90% of participants have a clear belief that when it comes to this ethical scenario, the
leaders of the school (singular or plural) would be the only staff involved in the final decision.
When identifying how the final decision would be made in relation to spending ¥50,000 on educational
resources, Table 8 shows that the most commonly chosen option, from 37% of the participants, was reaching a
consensus decision on how the money should be spent. The next 37% thought if a consensus could be reached
by the decision-makers that would happen but if unanimity could not be achieved then the decision-makers
would resort to vote where a 66% + 1 majority decides the issue. Taking this information together with what
we learned in Table 8, it seems that most Chinese participants believe that in an ethical scenario, the leadership
team will decide by consensus.
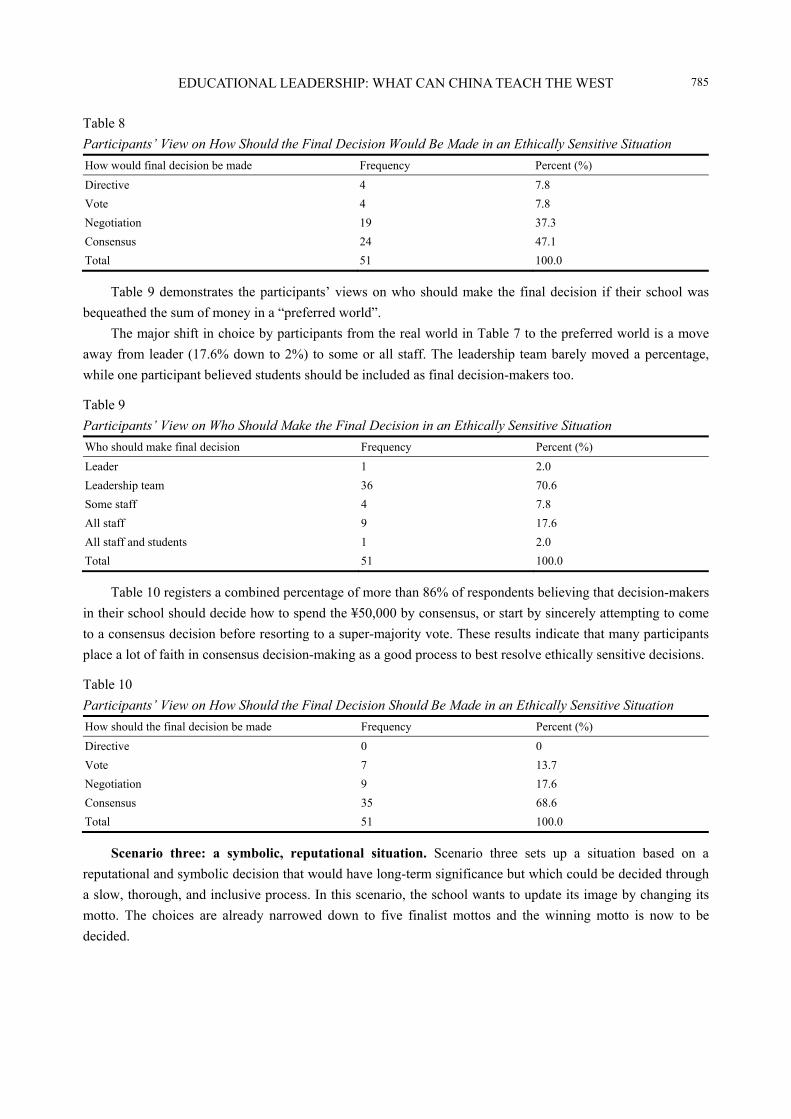
EDUCATIONAL LEADERSHIP: WHAT CAN CHINA TEACH THE WEST
785
Table 8
Participants’ View on How Should the Final Decision Would Be Made in an Ethically Sensitive Situation
How would final decision be made Frequency Percent (%)
Directive 4 7.8
Vote 4 7.8
Negotiation 19 37.3
Consensus 24 47.1
Total 51 100.0
Table 9 demonstrates the participants’ views on who should make the final decision if their school was
bequeathed the sum of money in a “preferred world”.
The major shift in choice by participants from the real world in Table 7 to the preferred world is a move
away from leader (17.6% down to 2%) to some or all staff. The leadership team barely moved a percentage,
while one participant believed students should be included as final decision-makers too.
Table 9
Participants’ View on Who Should Make the Final Decision in an Ethically Sensitive Situation
Who should make final decision Frequency Percent (%)
Leader 1 2.0
Leadership team 36 70.6
Some staff 4 7.8
All staff 9 17.6
All staff and students 1 2.0
Total 51 100.0
Table 10 registers a combined percentage of more than 86% of respondents believing that decision-makers
in their school should decide how to spend the ¥50,000 by consensus, or start by sincerely attempting to come
to a consensus decision before resorting to a super-majority vote. These results indicate that many participants
place a lot of faith in consensus decision-making as a good process to best resolve ethically sensitive decisions.
Table 10
Participants’ View on How Should the Final Decision Should Be Made in an Ethically Sensitive Situation
How should the final decision be made Frequency Percent (%)
Directive 0 0
Vote 7 13.7
Negotiation 9 17.6
Consensus 35 68.6
Total 51 100.0
Scenario three: a symbolic, reputational situation. Scenario three sets up a situation based on a
reputational and symbolic decision that would have long-term significance but which could be decided through
a slow, thorough, and inclusive process. In this scenario, the school wants to update its image by changing its
motto. The choices are already narrowed down to five finalist mottos and the winning motto is now to be
decided.
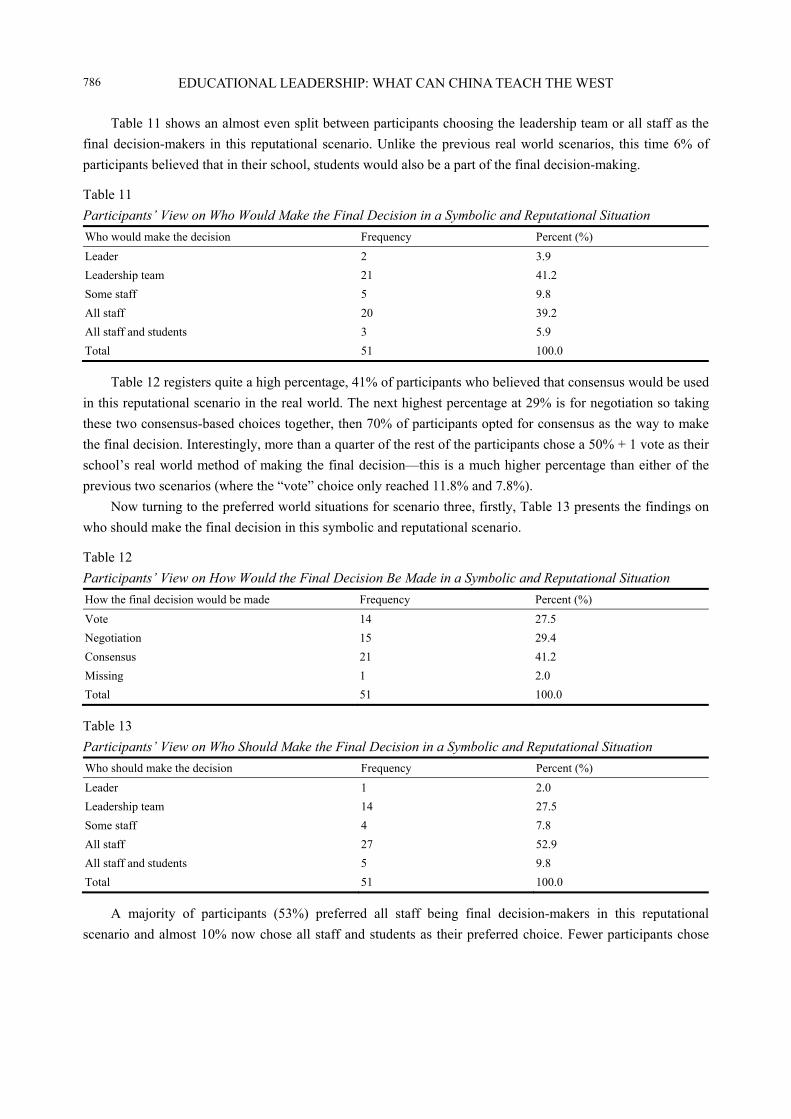
EDUCATIONAL LEADERSHIP: WHAT CAN CHINA TEACH THE WEST
786
Table 11 shows an almost even split between participants choosing the leadership team or all staff as the
final decision-makers in this reputational scenario. Unlike the previous real world scenarios, this time 6% of
participants believed that in their school, students would also be a part of the final decision-making.
Table 11
Participants’ View on Who Would Make the Final Decision in a Symbolic and Reputational Situation
Who would make the decision Frequency Percent (%)
Leader 2 3.9
Leadership team 21 41.2
Some staff 5 9.8
All staff 20 39.2
All staff and students 3 5.9
Total 51 100.0
Table 12 registers quite a high percentage, 41% of participants who believed that consensus would be used
in this reputational scenario in the real world. The next highest percentage at 29% is for negotiation so taking
these two consensus-based choices together, then 70% of participants opted for consensus as the way to make
the final decision. Interestingly, more than a quarter of the rest of the participants chose a 50% + 1 vote as their
school’s real world method of making the final decision—this is a much higher percentage than either of the
previous two scenarios (where the “vote” choice only reached 11.8% and 7.8%).
Now turning to the preferred world situations for scenario three, firstly, Table 13 presents the findings on
who should make the final decision in this symbolic and reputational scenario.
Table 12
Participants’ View on How Would the Final Decision Be Made in a Symbolic and Reputational Situation
How the final decision would be made Frequency Percent (%)
Vote 14 27.5
Negotiation 15 29.4
Consensus 21 41.2
Missing 1 2.0
Total 51 100.0
Table 13
Participants’ View on Who Should Make the Final Decision in a Symbolic and Reputational Situation
Who should make the decision Frequency Percent (%)
Leader 1 2.0
Leadership team 14 27.5
Some staff 4 7.8
All staff 27 52.9
All staff and students 5 9.8
Total 51 100.0
A majority of participants (53%) preferred all staff being final decision-makers in this reputational
scenario and almost 10% now chose all staff and students as their preferred choice. Fewer participants chose
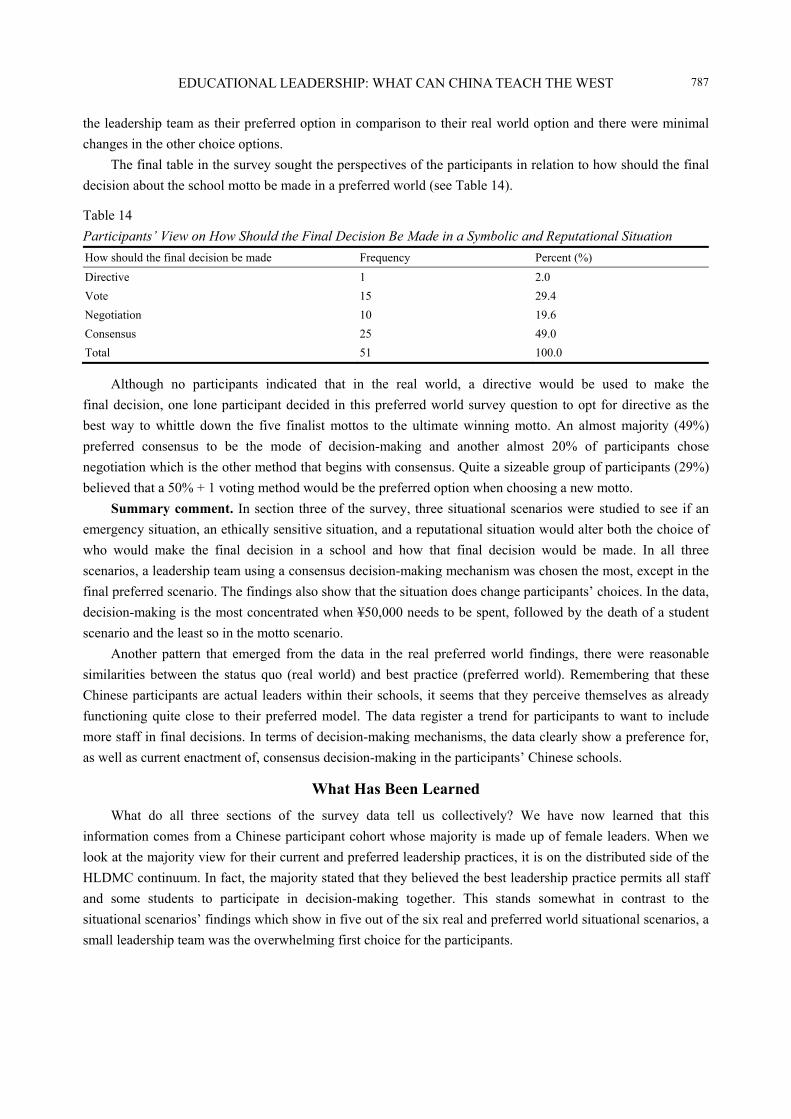
EDUCATIONAL LEADERSHIP: WHAT CAN CHINA TEACH THE WEST
787
the leadership team as their preferred option in comparison to their real world option and there were minimal
changes in the other choice options.
The final table in the survey sought the perspectives of the participants in relation to how should the final
decision about the school motto be made in a preferred world (see Table 14).
Table 14
Participants’ View on How Should the Final Decision Be Made in a Symbolic and Reputational Situation
How should the final decision be made Frequency Percent (%)
Directive 1 2.0
Vote 15 29.4
Negotiation 10 19.6
Consensus 25 49.0
Total 51 100.0
Although no participants indicated that in the real world, a directive would be used to make the
final decision, one lone participant decided in this preferred world survey question to opt for directive as the
best way to whittle down the five finalist mottos to the ultimate winning motto. An almost majority (49%)
preferred consensus to be the mode of decision-making and another almost 20% of participants chose
negotiation which is the other method that begins with consensus. Quite a sizeable group of participants (29%)
believed that a 50% + 1 voting method would be the preferred option when choosing a new motto.
Summary comment. In section three of the survey, three situational scenarios were studied to see if an
emergency situation, an ethically sensitive situation, and a reputational situation would alter both the choice of
who would make the final decision in a school and how that final decision would be made. In all three
scenarios, a leadership team using a consensus decision-making mechanism was chosen the most, except in the
final preferred scenario. The findings also show that the situation does change participants’ choices. In the data,
decision-making is the most concentrated when ¥50,000 needs to be spent, followed by the death of a student
scenario and the least so in the motto scenario.
Another pattern that emerged from the data in the real preferred world findings, there were reasonable
similarities between the status quo (real world) and best practice (preferred world). Remembering that these
Chinese participants are actual leaders within their schools, it seems that they perceive themselves as already
functioning quite close to their preferred model. The data register a trend for participants to want to include
more staff in final decisions. In terms of decision-making mechanisms, the data clearly show a preference for,
as well as current enactment of, consensus decision-making in the participants’ Chinese schools.
What Has Been Learned
What do all three sections of the survey data tell us collectively? We have now learned that this
information comes from a Chinese participant cohort whose majority is made up of female leaders. When we
look at the majority view for their current and preferred leadership practices, it is on the distributed side of the
HLDMC continuum. In fact, the majority stated that they believed the best leadership practice permits all staff
and some students to participate in decision-making together. This stands somewhat in contrast to the
situational scenarios’ findings which show in five out of the six real and preferred world situational scenarios, a
small leadership team was the overwhelming first choice for the participants.
EDUCATIONAL LEADERSHIP: WHAT CAN CHINA TEACH THE WEST
788
So, can a Chinese school have both a small group of leaders making final decisions and at the same time
role model very inclusive decision-making? The results are uncertain as we cannot be sure whether these
seemingly contrary stances have emerged because of instrument design fault; human beings capacity to hold
two conflicting viewpoints at once; or that the Chinese participants were trying to answer in a way that they
believed would please the researcher. Whatever the reason, further study is needed to consider these
uncertainties and limitations.
What is far more certain from the data is the overwhelming preference for consensus decision-making as
the mechanism for making final decision in all three scenarios. It is not simply the preferred choice, there is
strong belief from the participants that consensus is also already the most common form of final
decision-making in their Chinese schools. The obvious and tempering factors about these finding are: (1) it may
be reasonably easy to reach consensus between a small leadership team; and (2) the data tell us nothing about
the informal powers and relationships which might be influencing the consensus. Again, further study is needed
if we are to know more about the enactment of Chinese consensus decision-making practices that the
participants believe are happening. This would be very useful, because if it is found that Chinese schools are
practicing consensus decision-making effectively, this is a specific area from which Western schools could
really learn a great deal.
The intention of this paper was to find out if leadership decision-making theory resonates when transferred
into a contemporary Chinese education sector and if there are lessons the West can learn from the findings. The
data suggest that there is an appetite for using inclusive decision-making practices in the Chinese schools from
which the participants came and this therefore infers that the concepts can be transferred across cultures. If this
inference proves to be sound, perhaps in the next decade, we will see a growth in studies of “decision-making
leadership with Chinese characteristics” and this can only be a good thing if the ultimate goal of education in
all societies is to empower and engage students to be active and informed citizens in a globally connected
planet.
As a final thought, a fascinating area to further study might be whether female Chinese leaders, rather than
their male leadership colleagues, are more likely to absorb and enact the ideas underpinning distributed
leadership theory. The Athena Doctrine (Gerzema & D’Antonio, 2013) argues that women will rule the future
because so-called feminine qualities, such as openness, sharing, flexibility, and empathy are essential qualities
in an inter-connected and socially networked world. Can inclusive decision-making leadership theory grow and
be effective in such a future? This author believes so.
References Bolden, R. (2011). Distributed leadership in organizations: A review of theory and research. International Journal of Management
Reviews, 13(3), 251-269. Bush, T., & Qiang, H. (2000). Leadership and culture in Chinese education. Asia Pacific Journal of Education, 20(2),
58-67. Canchu, L. (2008). Demystifying the chameleonic nature of Chinese leadership. Journal of Leadership & Organizational Studies,
14(4), 303-321. Crowther, F. (2010). Parallel leadership: The key to successful school capacity-building. Leading and Managing, 16(1), 16-39. Crowther, F., Ferguson, M., & Hann, L. (2009). Developing teacher leaders: How teacher leadership enhances school success
(pp. 20-46). Thousand Oaks, C.A.: Corwin Press. Crumley, C. L. (2005). Remember how to organize: Heterarchy across disciplines. In C. S. Beekman and W. S. Baden(Eds.),
Nonlinear models for archaeology and anthropology (pp. 35-50). Aldershot, Hampshire, UK: Ashgate Press.
EDUCATIONAL LEADERSHIP: WHAT CAN CHINA TEACH THE WEST
789
Cunningham, C. L. (2014). Decision-making processes and educational leadership in Australia. Leading and Managing, 20(1), 11-31.
Emerson, P. (2011). Defining democracy (2nd ed.). Dordrecht: Springer. Fullan, M. (2006a). Turnaround leadership. San Francisco, C.A.: Jossey-Bass. Fullan, M. (2006b). Change theory: A force for school improvement. Seminar Series Paper, 157, 8-9. Fullan, M. (2007). Leading in a culture of change. San Francisco, C.A.: Jossey-Bass. Fullan, M. (2009). The challenge of change: Start school improvement now. Thousand Oaks, C.A.: Corwin Press. Gerzema, J., & D’Antonio, M. (2013). The Athena Doctrine: How women (and the men who think like them) will rule the future.
San Francisco, C.A.: Jossey-Bass. Gronn, P. (2009). Leadership configurations. Leadership, 5(3), 381-395. Gunter, H. (2005). Leading teachers. London: Continuum International Publishing Group. Hallinger, P., & Leithwood, K. (1996). Culture and educational administration: A case of finding out what you don’t know you
don’t know. Journal of Educational Administration, 34(5), 98-116. Hargreaves, A., & Fink, D. (2008). Distributed leadership: Democracy or delivery? Journal of Educational Administration, 46(2),
229-240. Harris, A. (2008). Distributed school leadership: Developing tomorrow’s leaders. Abingdon: Routledge. Harris, A. (2013). Distributed school leadership: Developing tomorrow’s leaders. Hoboken: Taylor and Francis. Hay Group. (2004). The five pillars of distributed leadership in schools. A study carried out for the National College of School
Leadership. Nottingham: NCSL. Ho, D. & Tikly, P. (2012). Conceptualizing teacher leadership in a Chinese, policy-driven context: A research agenda. School
Effectiveness and School Improvement: An International Journal of Research, Policy and Practice, 23(4), 401-416. Hofstede, G. (2001). Culture’s consequences: Comparing values, behaviors, institutions and organizations across nations (2nd
ed.). Thousand Oaks, C.A.: Sage. Law, W. (2013). Culture, gender and school leadership: School leaders’ self-perceptions in China. Compare: A Journal of
Comparative and International Education, 43(3), 295-322. Littrell, R. (2002). Desirable leadership behaviours of multi-cultural managers in China. Journal of Management and
Development, 21, 5-74. Lumby, J. (2013). Distributed leadership: The uses and abuses of power. Educational Management Administration & Leadership,
41(5), 581-597. Oplatka, I. (2006). Women in educational administration within developing countries: Towards a new international research
agenda. Journal of Educational Administration, 44(6), 604-624. Tannenbaum, R., & Schmidt, W. (1973). How to choose a leadership pattern. Harvard Business Review, May-June, 3-12
(originally published in March-April, 1958). Walker, A., & Dimmock, C. (2012). School leadership and administration: The cultural context. Hoboken: Taylor and Francis. Wang, X. Y. B., & Chee, H. (2011). Chinese leadership. New York: Palgrave Macmillan Ltd. Wong, K. (1998). Culture and moral leadership in education. Peabody Journal of Education, 73(2), 106-125. Wong, K. (2001). Chinese culture and leadership. International Journal of Leadership in Education: Theory and Practice, 4(4),
309-319. Woods, P. A. (2004). Democratic leadership: Drawing distinctions with distributed leadership. International Journal of
Leadership in Education, 7(1), 3-26. Woods, P. A., & Gronn, P. (2009). Nurturing democracy: The contribution of distributed leadership to a democratic organisational
landscape. Educational Management Administration & Leadership, 37(4), 430-451. Xu, X. (2009). China’s first national survey on principals of primary and secondary schools: Nearly 90% are males (translation).
Retrieved from http://www.jyb.cn/basc/xw/200904/t20090424_266942.html Youngs, H. (2009). (Un)Critical times? Situating distributed leadership in the field. Journal of Educational Administration and
History, 41(4), 377-389. Zheng, X., Zhu, W., Yu, H., Zhang, X., & Zhang, L. (2011). Ethical leadership in Chinese organizations: Developing a scale.
Frontiers of Business Research in China, 5(2), 179-198.
Journal of US-China Public Administration, September 2014, Vol. 11, No. 9, 790-796 doi: 10.17265/1548-6591/2014.09.006
The Development of Good Practices in Cooperation With the
Use of Educational Offer of Academic Centers for
Employees of an International Corporation
Rafał Doniec
University of Economics in Katowice, Katowice, Poland
The paper describes the genesis of the industry’s needs for training employees whose main purpose is to stimulate
ones to be more innovative. Responded to this demand, academic centers helped in the development of training
strategies and concepts. The paper brought the closer concepts of training in range and effect that they have brought.
An attempt was made to approximations, summary, and evaluation of programs that have been implemented in the
framework of academic consortia, among governments founds, academic development, and companies competing
in the regional and international telecommunication markets. Analyzed cases of such cooperation, for programs in
which several people were involved, as well as beneficiaries of the projects in which were several thousand
employees. Efforts made in these programs indicate good practice for those who would like to emulate or improve
programs. Experiences that were collected and described in this paper are the ideal start for similar initiatives that
may be taken without regard to the scale and location of economic participants.
Keywords: international corporation human resources standards, the highest rate of employment of university
graduates, leaders of innovation, students in labour market
Creativity, contests on innovation, and common research projects of companies and universities can not
only enrich educational offer and actively support students, but also motivate employees to achieve
professional success, which nowadays is more important than education, graduation, or any training. The
employers and universities who want to gain an intellectual, innovative, and creative advantage are interested in
creating such standards of recruiting, motivating, and finding leaders of innovation that would not only give
them an edge over competition, but also enable them to maintain top position in the market for a longer period
of time (Marszałek, 2008).
The idea of the cooperation is anything but new; companies, local governments, and people in general
have been always interested in it. Ways to make education effective have been sought for ever since the term
of education was established. That knowledge is better absorbed via an experiment, practice, or a case study, it
has been obvious for a long time as well. A teacher cannot only base on theory and a practitioner just on
experience. Therefore, there have been different ways of stimulating by both government institutions and
local authorities. One of the examples is a long-term project initiated by the Ontario Ministry of Environment
Corresponding author: Rafał Doniec, Ph.D., assistant professor, University of Economics in Katowice; research fields:
education standard and business managements for industry needs and e-learning, e-health, and telecommunication and telemedicine. E-mail: [email protected].
DAVID PUBLISHING
D
DEVELOPMENT OF PRACTICES FOR EMPLOYEES OF INTERNATIONAL CORPORATION
791
(OME) which obliged teachers of technical subjects to foster the involvement of local business and industry in
their curricula.
The table below presents a comparison between a typical curriculum in an academic institution and a
training session for corporate workers (Barnett, Parry, & Coate, 2001) (see Table 1).
Table 1
Curricula Comparison Source: R. Barnett, G. Parry, and K. Coate Conceptualising Curriculum Change
Traditional curriculum Modern curriculum
Focused on: Focused on:
General knowledge Utility knowledge (how to exactly do something)
Written communication Oral communication
Personal education Interpersonal education
Internal education External education
Gaining basic skills Gaining expert skills
Cognitive activity Problem-solving activity
Understanding Gaining information
Explaining concepts Defining problems
Transmission of theoretical knowledge Exchange of experience and transmission of working knowledge
Statement-based learning Experiment-based learning
The Polish Telecommunications (TP) Equity Group has increased employee engagement in the innovation
and production processes by introducing certain aspects of cooperation with academic centers. An additional
advantage has been the acquisition of the best students and positive corporate image.
The main goal of this paper is to analyse the outcomes of introducing solutions from the innovative
contests held from year 2002 to 2012 within the TP Equity Group. The work compares four subsequent editions
of an innovative contest at the TP Equity Group with four examples of projects devoted to cooperation with
academic centers, which are the following:
(1) “Your Perspective” program for students from the biggest universities in Poland;
(2) “The Land of the Rising Innovation” project prepared with the help of lecturers from the Institute of
Psychology at the Jagiellonian University in Cracow, and in the years 2009-2011 processed from the IT
(Information Technology) perspective by the CL S.A. company, which has so far provided TP with IT
workshop systems;
(3) “Become an Engineer of the Future” project based on workshops, training programs, and industrial
projects which involves cooperation between an academic mentor appointed by the Silesian University of
Technology and an industrial one being a TP Equity Group employee;
(4) Mentor-like supervision over a TP Equity Group brand ambassador for the Silesian University of
Technology.
Results of the research which are aimed to start a discussion about advantages and disadvantages of a
contest as a motivation tool for students and employees are presented at the end of the paper.
Research Materials The “Your Perspective” program is a number of initiatives undertaken by the TP Equity Group in the
DEVELOPMENT OF PRACTICES FOR EMPLOYEES OF INTERNATIONAL CORPORATION
792
years 2008-2013 in cooperation with the 16 biggest universities in Poland which resulted in:
(1) 103 trainee positions at the TP Equity Group;
(2) 122 workshops at universities in Poland;
(3) 141 TP Equity Group ambassadors (specially selected groups of students whose role is to inform their
fellow students about the program, workshops, and job opportunities);
(4) 500 participants of the 11 Student Orange Club meetings;
(5) 2,320 workshop participants at the universities;
(6) 6,410 participants of the “Your Perspective” contest.
One of the results of the “Your Perspective” program was the development of new initiatives, such as
“Innovations Farm”1 or “Open Middleware 2.0 Community”2, which enabled students and academics to
exchange ideas about the latest trends on the IT and telecommunications markets during a series of
workshops.
The “Land of Rising Innovation” is the name of the project which was carried out from April 2009 to
January 2011 for the TP Equity Group (Doniec, 2012). Its curriculum had been developed on a basis of an
innovative education method which constitutes an integrated system of several co-existing teaching forms, i.e.,
e-learning, virtual classes, and workshop lessons. The Creative Problem Solving (CPS) (West, 1997) was
discussed as a heuristic method [i.e., experience-based techniques with a set of tips, but not an algorithm
(Weber, 1984)] of a complex problem-solving approach which increases chances of finding effective and
innovative solutions to a problem as well as of subsequent implementation of innovations (Amabile, 1996;
Roffe, 1999). Workshops prepared by lecturers from the Jagiellonian University in Cracow were held with the
use of the “blended-learning” method as two one-day stationary workshops and three six-hour e-learning
sessions (Matusiak, 2008; Niecka, Orzechowski, Słabosz, & Szymura, 2005).
The project was financed from the Human Capital Operational Program which includes a contribution of
85% from the European Union (EU). The total budget provided for the project is 973,000 PLN. Thanks to the
money, 408 people from 30,000 TP Equity Group employees were trained.
The “Become an Engineer of the Future” project has been carried out from October 2012 to the end of
year 2015 and financed form the EU-funded Operational Program entitled “Human Capital. Higher education
and science, strengthening and improving qualifications of the academic staff as well as increasing the number
of graduates corresponding to the requirements of knowledge economy”3. Each workshop consisted of five
six-hour sessions whose subject matter had been prepared together by the academic mentor and the industrial
mentor. Until the end of 2015, about 224 full-time BSc-level IT students from the Faculty of Automatic Control,
Electronics, and Computer Science of the Silesian University of Technology are supposed to take part in the
workshops. The workshop initiatives have followed directly from the industry and included the implementation
of IT instruments in the industrial manufacture of automatic equipment, automotive industry, IT,
telecommunications, and other areas.
The table below shows the course of the initiatives undertaken by the TP Equity Group (see Table 2).
1 Retrieved from http://twojaperspektywa.pl. 2 Retrieved from http://www.tu.rd.tp.pl/portal/. 3 Retrieved from http://www.zip.aei.polsl.pl/index.php/o-projekcie.
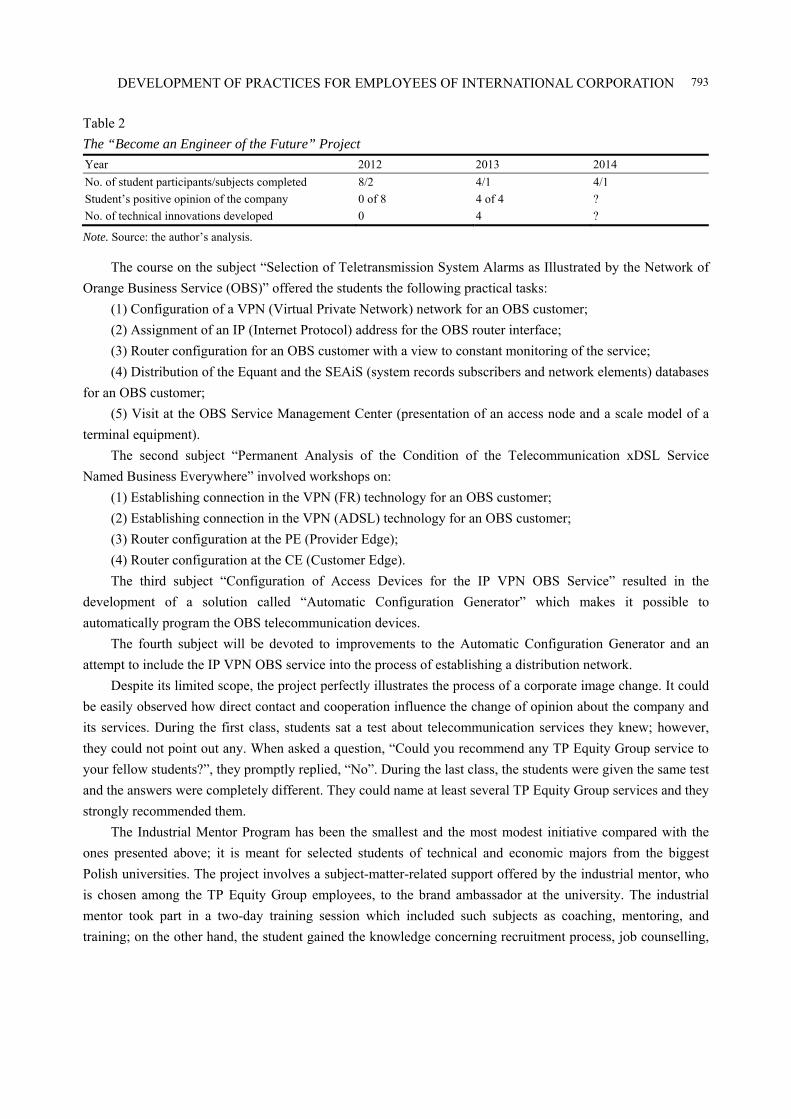
DEVELOPMENT OF PRACTICES FOR EMPLOYEES OF INTERNATIONAL CORPORATION
793
Table 2
The “Become an Engineer of the Future” Project Year 2012 2013 2014
No. of student participants/subjects completed 8/2 4/1 4/1
Student’s positive opinion of the company 0 of 8 4 of 4 ?
No. of technical innovations developed 0 4 ?
Note. Source: the author’s analysis.
The course on the subject “Selection of Teletransmission System Alarms as Illustrated by the Network of
Orange Business Service (OBS)” offered the students the following practical tasks:
(1) Configuration of a VPN (Virtual Private Network) network for an OBS customer;
(2) Assignment of an IP (Internet Protocol) address for the OBS router interface;
(3) Router configuration for an OBS customer with a view to constant monitoring of the service;
(4) Distribution of the Equant and the SEAiS (system records subscribers and network elements) databases
for an OBS customer;
(5) Visit at the OBS Service Management Center (presentation of an access node and a scale model of a
terminal equipment).
The second subject “Permanent Analysis of the Condition of the Telecommunication xDSL Service
Named Business Everywhere” involved workshops on:
(1) Establishing connection in the VPN (FR) technology for an OBS customer;
(2) Establishing connection in the VPN (ADSL) technology for an OBS customer;
(3) Router configuration at the PE (Provider Edge);
(4) Router configuration at the CE (Customer Edge).
The third subject “Configuration of Access Devices for the IP VPN OBS Service” resulted in the
development of a solution called “Automatic Configuration Generator” which makes it possible to
automatically program the OBS telecommunication devices.
The fourth subject will be devoted to improvements to the Automatic Configuration Generator and an
attempt to include the IP VPN OBS service into the process of establishing a distribution network.
Despite its limited scope, the project perfectly illustrates the process of a corporate image change. It could
be easily observed how direct contact and cooperation influence the change of opinion about the company and
its services. During the first class, students sat a test about telecommunication services they knew; however,
they could not point out any. When asked a question, “Could you recommend any TP Equity Group service to
your fellow students?”, they promptly replied, “No”. During the last class, the students were given the same test
and the answers were completely different. They could name at least several TP Equity Group services and they
strongly recommended them.
The Industrial Mentor Program has been the smallest and the most modest initiative compared with the
ones presented above; it is meant for selected students of technical and economic majors from the biggest
Polish universities. The project involves a subject-matter-related support offered by the industrial mentor, who
is chosen among the TP Equity Group employees, to the brand ambassador at the university. The industrial
mentor took part in a two-day training session which included such subjects as coaching, mentoring, and
training; on the other hand, the student gained the knowledge concerning recruitment process, job counselling,
DEVELOPMENT OF PRACTICES FOR EMPLOYEES OF INTERNATIONAL CORPORATION
794
and self-presentation. Next, the mentor and the student together created a program for university open days
which covered lectures, equipment presentations, and contests for the academic community.
Comparison Generally speaking, the mode of learning theory through practice is widely appreciated. The development
of modern forms of communication, such as teleconferencing, remote presentations, and problem-solving
focused learning materials on the Internet, has obviously strengthened the relations between education and
business (Alavi, Wheeler, & Valacich, 1995).
Many business-education cooperation programs of supporting and financing the education field have been
successful within the EU. One of the oldest ones, carried out since late 1980s as a part of the Da Vinci project
by the EUROPEA Association, has dealt with the revitalization of rural areas; its new edition is named “Coping
with Challenges on Vocational Education and Training. Good Practices in Cooperation School-Business and in
Entrepreneurial Competences Learning” (COPCHAVET)4, and is aimed at agricultural and business schools, as
well as at farms and farm-tourism companies.
In North America, the concept of “business-education partnerships” can probably boast the biggest
number of scientific studies5. There have been attempts to classify and define areas of cooperation, law
regulations, and strategies.
In case of Asia and Australia, scholars have proposed more radical terms of cooperation, scholarships, or
trainings for students; they suggested that these aspects become a part of company’s strategy and be carried out
statutorily6.
Not all scientists support the view that the business-education partnership is always successful,
especially when taking ethical aspects into consideration. Companies manipulate their image only to gain
measurable financial profits. The question of success is sometimes exaggerated and is mostly the only
motivation that discriminates the terms of cooperation between business and education (Matten & Moon,
2004).
Results Table 3 summarises the most important initiatives aimed at motivating employees of the TP Equity Group
in terms of their undertaking and proposing innovative solutions.
All the projects and initiatives undertaken at the TP Equity Group are in close connection with the annual
performance review as for every proposed and accepted initiative an employee gets points in the course of the
evaluation process; authors of the best projects can even receive an additional bonus.
The supplemented TP Equity Group workshop offer resulted in improvement to the submitted innovative
projects, which at first sight are not obvious when looking at Table 3. This is the quality of developed
innovations. There are two parameters for each category in the years 2004-2006. For instance, in the category 1
(organizational improvements), in the year 2004, the number of submitted projects was 51 with 35 of these
implemented next year, which means 68% effectiveness of the proposed solutions. In 2006, the comparison
looks similar as there were 161 proposed projects and 107 accepted (66%), but only 15 projects among the
4 Retrieved from http://europea.org/projects/copchavet/. 5 Retrieved from http://en.wikipedia.org/wiki/Business-education_partnerships. 6 Retrieved from http://www.asiaeducation.edu.au/aust_curr_strategy_landing_page.html.
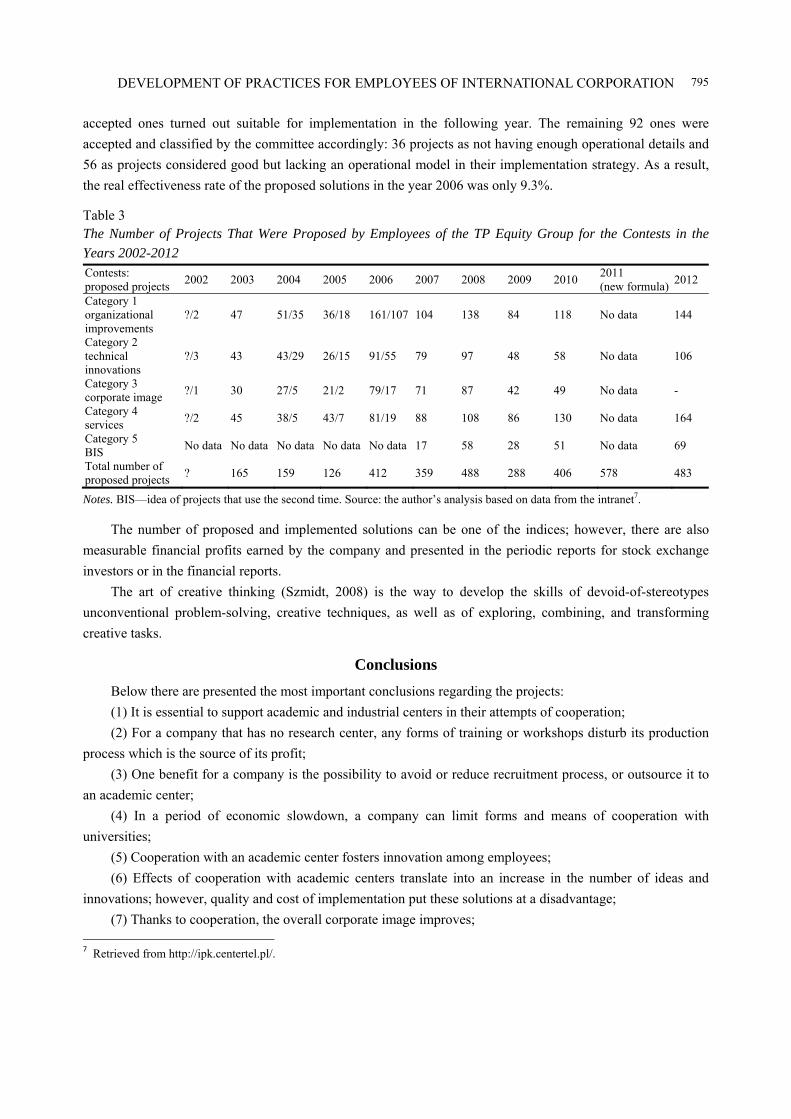
DEVELOPMENT OF PRACTICES FOR EMPLOYEES OF INTERNATIONAL CORPORATION
795
accepted ones turned out suitable for implementation in the following year. The remaining 92 ones were
accepted and classified by the committee accordingly: 36 projects as not having enough operational details and
56 as projects considered good but lacking an operational model in their implementation strategy. As a result,
the real effectiveness rate of the proposed solutions in the year 2006 was only 9.3%.
Table 3 The Number of Projects That Were Proposed by Employees of the TP Equity Group for the Contests in the Years 2002-2012 Contests: proposed projects
2002 2003 2004 2005 2006 2007 2008 2009 2010 2011 (new formula)
2012
Category 1 organizational improvements
?/2 47 51/35 36/18 161/107 104 138 84 118 No data 144
Category 2 technical innovations
?/3 43 43/29 26/15 91/55 79 97 48 58 No data 106
Category 3 corporate image
?/1 30 27/5 21/2 79/17 71 87 42 49 No data -
Category 4 services
?/2 45 38/5 43/7 81/19 88 108 86 130 No data 164
Category 5 BIS
No data No data No data No data No data 17 58 28 51 No data 69
Total number of proposed projects
? 165 159 126 412 359 488 288 406 578 483
Notes. BIS—idea of projects that use the second time. Source: the author’s analysis based on data from the intranet7.
The number of proposed and implemented solutions can be one of the indices; however, there are also
measurable financial profits earned by the company and presented in the periodic reports for stock exchange
investors or in the financial reports.
The art of creative thinking (Szmidt, 2008) is the way to develop the skills of devoid-of-stereotypes
unconventional problem-solving, creative techniques, as well as of exploring, combining, and transforming
creative tasks.
Conclusions Below there are presented the most important conclusions regarding the projects:
(1) It is essential to support academic and industrial centers in their attempts of cooperation;
(2) For a company that has no research center, any forms of training or workshops disturb its production
process which is the source of its profit;
(3) One benefit for a company is the possibility to avoid or reduce recruitment process, or outsource it to
an academic center;
(4) In a period of economic slowdown, a company can limit forms and means of cooperation with
universities;
(5) Cooperation with an academic center fosters innovation among employees;
(6) Effects of cooperation with academic centers translate into an increase in the number of ideas and
innovations; however, quality and cost of implementation put these solutions at a disadvantage;
(7) Thanks to cooperation, the overall corporate image improves; 7 Retrieved from http://ipk.centertel.pl/.
DEVELOPMENT OF PRACTICES FOR EMPLOYEES OF INTERNATIONAL CORPORATION
796
(8) Education as a non-profit activity requires subsidizing; thus, every form of well prepared, carried out,
and eventually, summarized support is beneficial for both a school and a company.
References Alavi, M., Wheeler, B. C., & Valacich, J. S. (1995). Using IT to reengineer business education: An exploratory investigation of
collaborative telelearning. MIS Quarterly, 19(3), 293-312. Amabile, T. (1996). Creativity in context. Boulder: Westview Press. Barnett, R., Parry, G., & Coate, K. (2001). Conceptualising curriculum change. Teaching in Higher Education, 6(4), 435-449. Doniec, R. (2012). The land of rising innovation: Active e-learning as an individual career path with the support of the European
Community Funds. Proceedings from the Second International Conference on Local and Regional Projects Involving Cooperation of Education, Business, and Local Government Sectors. May 8, Katowice.
Marszałek, A. (2008). Building education and research consortia and cooperation between academia. E-mentor, 4(26), 4-9. Matten, D., & Moon, J. (2004). Corporate social responsibility education in Europe. Journal of Business Ethics, 54(4), 323-337. Matusiak, K. B. (2008). Innovation and technology transfer (expanded 2nd ed.). Warsaw. Niecka, E., Orzechowski, J., Słabosz, A., & Szymura, B. (2005). Creativity training. Gdańsk: GWP. Roffe, I. (1999). Innovation and creativity in organisations: A review of the implications for training and development. Journal of
European Industrial Training, 23(4/5), 224-241. Szmidt, K. (2008). Innovation training. Gliwice: Helion. Weber, R. A. (1984). Management: Basic elements of managing organizations. New York: McGraw-Hill Inc. West, M. A. (1997). Developing creativity in organizations. Hoboken: Wiley.

Related Documents